Embed Size (px)
Citation preview

2014 Delaware Comprehensive
Assessment System (DCAS)
State Summaries of the Reading,
Mathematics, Science, and Social
Studies Assessments
2014 Administration
Grades 3 through 10
July 2014
Prepared by:
Delaware Department of Education
Office of Assessment
401 Federal Street, Suite 2
Dover, DE 19901

State Board of Education
Teri Quinn Gray, Ph.D., President
Jorge L. Melendez, Vice President
Gregory B. Coverdale, Jr.
G. Patrick Heffernan
Randall L. Hughes, II
Barbara Rutt, J.D.
Terry M. Whittaker, Ed.D.
Donna Johnson, Executive Director
Mark T. Murphy, Executive Secretary
Officers of the Department of Education
Mark T. Murphy
Secretary of Education
David J. Blowman
Deputy Secretary of Education
Susan Keene Haberstroh
Associate Secretary of Education
Education Supports & Innovative Practices Branch
Karen Field Rogers
Associate Secretary of Education/Chief Financial Officer
Financial Reform and Resource Management
Christopher Ruszkowski
Chief Officer
Teacher & Leader Effectiveness Unit
Penny Schwinn
Chief Accountability & Assessment Officer
Accountability and Performance Management
Michael Watson
Chief Academic Officer
Teaching and Learning
The Department of Education is an equal opportunity employer. It does not discriminate on the
basis of race, color, religion, national origin, sex, sexual orientation, gender identity, marital
status, disability, age, genetic information, or veteran’s status in employment or its programs and
activities. Inquiries should be directed to the Department’s Human Resource Officer, 401
Federal Street, Suite 2, Dover, Delaware 19901. Telephone Number: (302) 735-4030.

Office of Assessment
Page | i
2014 Delaware Comprehensive Assessment System
State Summaries
Table of Contents
(Please click in the title area to navigate to the section you need.)
I. GENERAL OVERVIEW .............................................................................................. 1
DCAS Overview ................................................................................................................. 1
DCAS-Alt1 Overview ......................................................................................................... 3
II. 2014 DCAS PARTICIPATION RATE ........................................................................ 5
Participation Rate – Definitions and Calculations .............................................................. 5
Reading Participation Rate ................................................................................................. 6
Graph 1 – Counts of Nonstandard Accommodations .................................................................. 7
Mathematics Participation Rate .......................................................................................... 7
Science Participation Rate .................................................................................................. 8
Social Studies Participation Rate ........................................................................................ 8
Nonstandard DCAS Scores ................................................................................................. 9
III. 2014 DCAS-ALT1 PARTICIPATION RATE ............................................................ 10
Reading Participation Rate ............................................................................................... 10
Mathematics Participation Rate ........................................................................................ 11
Science Participation Rate ................................................................................................ 11
Social Studies Participation Rate ...................................................................................... 11
IV. 2014 DCAS RESULTS ............................................................................................ 12
Reading Summary – Spring 2014 ..................................................................................... 12
Reading Results – 2012-2013 School Year to the 2013-2014 School Year ..................... 12
Mathematics Summary – Spring 2014 .............................................................................. 13
Mathematics Results – 2012-2013 School Year to 2013-2014 School Year .................... 13
Science Summary – Spring 2014 ...................................................................................... 13
Social Studies Summary – Spring 2014............................................................................ 13
V. 2014 DCAS-ALT1 RESULTS .................................................................................. 14
Reading: State-Level Results – Spring 2014 ................................................................... 14
Mathematics: State-Level Results – Spring 2014 ............................................................ 15
Science: State-Level Results – Spring 2014 .................................................................... 15
Social Studies: State-Level Results – Spring 2014 .......................................................... 15

Office of Assessment
Page | ii
VI. DCAS PERFORMANCE RESULTS .......................................................................... 17
Reading Performance Graphs ........................................................................................... 17
Graph 2 – DCAS Reading Performance Levels, 2014 .............................................................. 17
Graph 3 – Mean Scale Scores DCAS Reading .......................................................................... 18
Graph 4 – Percentage of Students Proficient in Reading ........................................................... 19
Mathematics Performance Graphs .................................................................................... 20
Graph 5 – DCAS Mathematics Performance Levels, 2014 ....................................................... 20
Graph 6 – Mean Scale Scores DCAS Mathematics ................................................................... 21
Graph 7 – Percentage of Students Proficient in Mathematics ................................................... 22
Science Performance Graphs ............................................................................................ 23
Graph 8 – DCAS Science Performance Levels, 2014 ............................................................... 23
Graph 9 – Mean Scale Scores DCAS Science ........................................................................... 24
Graph 10 – Percentage of Students Proficient in Science.......................................................... 25
Social Studies Performance Graphs .................................................................................. 26
Graph 11 – DCAS Social Studies Performance Levels, 2014 ................................................... 26
Graph 12 – Mean Scale Scores DCAS Social Studies ............................................................... 27
Graph 13 – Percentage of Students Proficient in Social Studies ............................................... 28
VII. DCAS-ALT1 PERFORMANCE RESULTS ................................................................ 29
Reading Performance Graphs ........................................................................................... 29
Graph 14 – DCAS-Alt1 Reading Performance Levels, 2014 .................................................... 29
Graph 15 – Mean Scale Scores DCAS-Alt1 Reading ................................................................ 30
Graph 16 – Percentage of Students Proficient in Reading ......................................................... 31
Mathematics Performance Graphs .................................................................................... 32
Graph 17 – DCAS-Alt1 Mathematics Performance Levels, 2014 ............................................. 32
Graph 18 – Mean Scale Scores DCAS-Alt1 Mathematics ........................................................ 33
Graph 19 – Percentage of Students Proficient in Mathematics ................................................. 34
Science Performance Graphs ............................................................................................ 35
Graph 20 – DCAS-Alt1 Science Performance Levels, 2014 ..................................................... 35
Graph 21 – Mean Scale Scores DCAS-Alt1 Science................................................................. 36
Graph 22 – Percentage of Students Proficient in Science.......................................................... 37
Social Studies Performance Graphs .................................................................................. 38
Graph 23 – DCAS-Alt1 Social Studies Performance Levels, 2014 ........................................... 38
Graph 24 – Mean Scale Scores DCAS-Alt1 Social Studies ...................................................... 39
Graph 25 – Percentage of Students Proficient in Social Studies ............................................... 40

Office of Assessment
Page | iii
LIST OF APPENDICES
APPENDIX A – DCAS TABLES
APPENDIX B – DCAS-ALT1 TABLES
LIST OF ATTACHMENTS
Attachment 1: 2014 DCAS State Summary – Statewide Performance and Participation Summary
Attachment 2: 2014 DCAS State Summary – District Performance
Attachment 3: 2014 DCAS State Summary – School Performance
Attachment 4: 2014 DCAS-Alt1 State Summary

Office of Assessment
2014 Delaware Comprehensive Assessment System State Summary Page | 1
I. GENERAL OVERVIEW
Delaware’s student assessment system includes two primary assessments—the Delaware
Comprehensive Assessment System (DCAS) and the Delaware Comprehensive Assessment
System – Alternate 1 (DCAS-Alt1). This report summarizes the results of the 2014 DCAS and
the DCAS-Alt1 in reading, mathematics, science, and social studies.
The DCAS is a series of assessments designed to measure the progress of Delaware students in
prioritized content standards in reading and mathematics in grades 3–10; science in grades 5, 8,
and 10; and social studies in grades 4 and 7.
The DCAS-Alt1 is an assessment designed to measure what students with the most significant
cognitive disabilities know and are able to do in reading and mathematics in grades 3–10;
science in grades 5, 8, and 10; and social studies in grades 4, 7, and 9 as they progress toward
meeting the standards.
The DCAS and the DCAS-Alt1 satisfy the assessment requirements of Title I of the United
States Elementary and Secondary Education Act.
DCAS Overview
The DCAS reading and mathematics assessments were administered during a fall test window
and a spring test window during the 2013–2014 school year for grades 3–10— please refer to
Appendix A, Table A-1 – DCAS Assessment Window Dates. Each test was administered once
during the fall window and up to two times during the spring window. The purpose of the
second testing opportunity in the spring window was to allow students an additional opportunity
to demonstrate what they have learned. This report includes only the higher spring score for
each student who took a reading or mathematics assessment twice during the spring window.
The administration of the DCAS for science in grades 5, 8, and 10 and social studies in grades 4
and 7 occurred during the spring 2014.
Grade 2 took DCAS practice assessments in reading and mathematics with one opportunity for
each student during the spring window.
The DCAS scores reported in this summary are based on the accountability scores and the
performance levels for the state, the districts, and the schools. The accountability scores for
DCAS reading and mathematics are reported on a developmental scale for grades 3–10, ranging
from approximately 200 to 1200. Student achievement for DCAS is reported in four
performance levels:
Well below standard
Below standard
Meets standard
Advanced
The performance level, or proficiency level, is reported as the percentage of students who are
proficient, that is, the percentage of students in meets standard and advanced performance levels
combined.

Office of Assessment
2014 Delaware Comprehensive Assessment System State Summary Page | 2
It is important to note that the participation rate and the percent proficient are generated
differently in this report than those for the Adequate Yearly Progress (AYP) and School
Accountability reports.
Located in Appendix A, Tables A-3 to A-6 show the DCAS cut scores and performance levels
for all grades and contents.
The preliminary standard setting for the DCAS took place in August 2010 using the Bookmark
Method. Panelists were representative of Delaware educators in terms of gender, ethnicity, and
geographic location. Community members and parents were also represented among the
panelists. More information about the standard setting can be found in the Standard Setting
Technical Report: Setting Performance Standards for the Computer-Adaptive Delaware
Comprehensive Assessment System (DCAS).1
A confirmatory standard setting for the DCAS was performed in June 2011. The purpose of the
confirmatory standard setting was to review the performance standards set in August 2010 in
light of the first year of operational data. Following the panel review of the 2010–2011 DCAS
operational results, panelists recommended that the interim performance standards be confirmed.
The Delaware State Board of Education approved this recommendation at its July 2011 public
meeting.
Information about the testing conditions under which the DCAS was administered is available in
the test administration manuals that are available on the DCAS Portal
(http://de.portal.airast.org/).
All students with disabilities (SWDs) and English language learners (ELLs) are required to be
included in the statewide assessment program. The DCAS Guidelines for Inclusion of Students
with Disabilities and English Language Learners, available on the DCAS Portal, describes the
conditions under which such students are included in the DCAS, including descriptions of
permissible test accommodations. There are a small number of accommodations that may
change the construct of the test, for example, reading the passages of a reading test to a student.
Such accommodations cause a student’s score to be considered “nonstandard,” meaning that the
scores do not have the same meaning as scores obtained under standard conditions and,
therefore, cannot be compared meaningfully with standard scores. Nonstandard scores are only
included in tables of participation rates and the summary of performance.
To preserve student confidentiality, any group reported in this document that has an count of
less than 15 has been suppressed. Due to Delaware’s small size, some state-level subgroup
performance data are suppressed. Suppressed data is represented by a “–”. Percentages that are
greater than 95% and less than 5% are also suppressed. In tables that show change from spring
2013 to spring 2014, the change is suppressed if statistics from either spring 2013 or spring 2014,
or both, are suppressed.
The Achievement Gap Analysis in Attachment 5 consists of charts, tables, and graphs displaying
data about the differences in average DCAS performance between the majority, or historically
dominant group, and the minority, or historically non-dominant group. Achievement gap
1 American Institutes for Research. (2010) “Standard Setting Technical Report: Setting Performance Standards for
the Computer-Adaptive Delaware Comprehensive Assessment System (DCAS).” Washington, D.C.

Office of Assessment
2014 Delaware Comprehensive Assessment System State Summary Page | 3
analysis for the state, district, and school helps educators and the public to evaluate the degree to
which these efforts are succeeding.
Four sections are provided within Attachment 5:
Section 1 – Statewide Achievement Gap by Grade and Content Area
Section 2 – Two-Year Comparison by District, Grade, Content Area, and Subgroup
Section 3 – Two-Year Comparison by Charter Schools, Grade, Content Area, and Subgroup
Section 4 – Statewide Changes in the Achievement Gap From 2013 to 2014 by Grade and
Content Area
DCAS-Alt1 Overview
The DCAS-Alt1 reading and mathematics assessments were administered one time each in the
fall and spring of the 2013–2014 school year in grades 3–10—refer to Appendix B,
Table B-1 – DCAS-Alt1 Assessment Window Dates. There was one opportunity for the DCAS-
Alt1 during the spring 2014 administration for science in grades 5, 8, and 10 and social studies in
grades 4, 7, and 9. Grade 2 students also took short practice assessments in reading and
mathematics one time in the spring window.
The DCAS-Alt1 scores reported in this summary are the accountability scores and the
performance levels (percent proficient) for the state and the districts. DCAS-Alt1 scores are not
summarized at the school level due to prohibitively small counts. The accountability scores
for DCAS-Alt1 reading and mathematics are reported on a developmental scale for grade 2
through grade 10, ranging from approximately 100 to 1000. Student achievement for
DCAS-Alt1 is also reported in performance levels. There are four DCAS performance levels:
Well below standard
Below standard
Meets standard
Advanced
The preliminary standard setting for the DCAS-Alt1 reading and mathematics took place in July
2011. There were 47 panelists working with data from the reading and mathematics DCAS-Alt1
field test of spring 2011. The panelists were selected by DOE and represented a broad cross-
section of special education and general education teachers, parents, and higher education
leaders. Gender and race/ethnicity were also considered to ensure a representative selection
within the panel.
A confirmatory standard setting took place July 9–11, 2012. More information about the
standard setting can be found in the Standard Setting Technical Report: Setting Performance
Standards for the Delaware Comprehensive Assessment System – Alternate Assessment (DCAS-
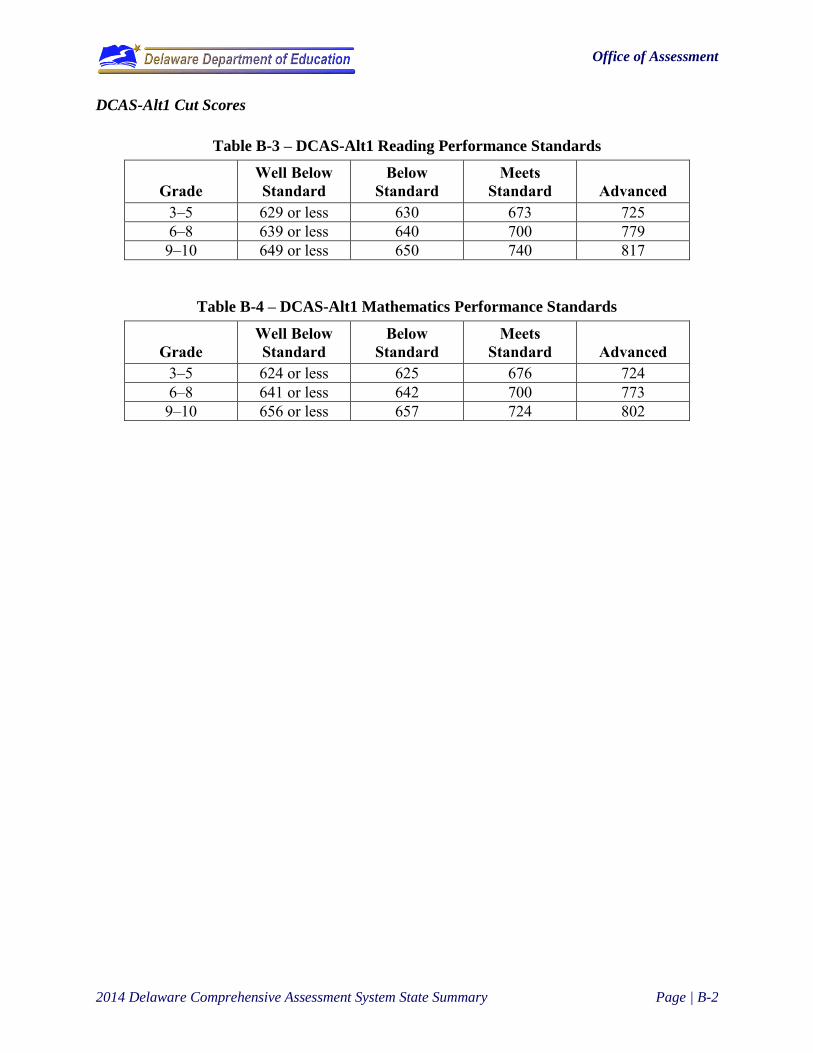
Alt1).2 The reading and mathematics cut scores developed from the DCAS-Alt1 standard setting
are located in Appendix B, Tables B-3 and B-4.
2 American Institutes for Research. (2011) “Standard Setting Technical Report: Setting Performance Standards for
the Computer-Adaptive Delaware Comprehensive Assessment System-Alternate Assessment (DCAS-ALT1).”
Washington, D.C.

Office of Assessment
2014 Delaware Comprehensive Assessment System State Summary Page | 4
Information about the typical conditions under which the DCAS-Alt1 is administered is available
in the test administration manuals located on the DCAS Portal (http://de.portal.airast.org/).
All SWDs and ELLs are required to be included in the statewide assessment program, to the
extent possible. The DCAS Guidelines for Inclusion of Students with Disabilities and English
Language Learners, available on the DCAS Portal, describes the participation criteria for
students who are included in the DCAS-Alt1. The Individualized Education Program (IEP) team
signs off on the participation criteria and identifies each student in a DOE database. There are no
accommodations permitted on the DCAS-Alt1 that would violate the construct and cause a
student’s score to be classified as nonstandard.
To preserve student confidentiality, any group reported in this document that has an count of
less than 15 has been suppressed. Due to Delaware’s small size, there are some state-level data
regarding subgroup performance that are suppressed. Suppressed data is represented by a “–”.
Percentages that are greater than 95% and less than 5% are also suppressed. In tables that show
change from fall to spring, the change is suppressed if either or both of the fall and spring
statistics are suppressed.

Office of Assessment
2014 Delaware Comprehensive Assessment System State Summary Page | 5
II. 2014 DCAS PARTICIPATION RATE
In this section, the participation rate is reported by content area and grade level for DCAS. The
participation rate is also reported by subgroups.
Participation Rate – Definitions and Calculations
Because of the aggregation rules, the following definitions are used in the participation tables of
this report. The rates calculated in this report may not be calculated in the same way as rates that
will be reported later for State Accountability purposes.
Eligible N – Referred to as “Eligible N”, this is the denominator of the participation rate
calculation for a particular content area and is equal to the sum of Tested N and Invalid.
All students enrolled in a public school for ten days or more during the spring 2014 test
window are counted as eligible to take the DCAS reading unless they (1) participated in
the DCAS-Alt1 for these content areas, (2) were granted a Special Exemption, or (3)
were granted an ELL Exemption.
All students enrolled in a public school for ten days or more during the spring 2014 test
window were counted as eligible to take the DCAS mathematics, science, and social
studies unless they (1) participated in the DCAS-Alt1 for these content areas, or (2) were
granted a Special Exemption.
Tested N – “Tested N” (referred to as “Number of Participants”) is the numerator of the
participation calculation. It is the number of students who received a valid test score on the
DCAS in a particular content area. A small number of student scores may have been forced
to a Performance Level 1 without a valid test score due to submission of an incomplete test.
See below for more information about invalid scores.
Nonstandard Accommodations – A nonstandard accommodation is a test accommodation
that may change the construct of the test. For example, if the reading passages on the DCAS
reading test are read aloud to the student, the test score is no longer considered a measure of
the intended construct of reading. The U.S. Department of Education (USED) guidance
indicates that scores obtained under such conditions must be counted as invalid scores.
Invalid Scores – Students with invalid scores are counted as nonparticipants in the
calculation of participation rates. The following reasons result in invalid scores:
A student received a nonstandard test accommodation in a given content area. A
nonstandard accommodation changes the construct of the test, making the student’s score
not comparable to scores obtained under standard testing conditions; or
A student attempted to test but did not complete the entire test; or
Improper departures from testing procedure took place during the administration of a
student’s test.
Not Tested – Students were counted in this column if they met the requirements to be
counted as “eligible” to take the DCAS but failed to test at any time during the spring test
window in a given content area. Students counted in this column are counted as
nonparticipants in the calculation of participation rates.
Exempt N (Special Exemption and ELL Exemptions) – Students who received a special
exemption from any content area test or who received an ELL exemption from the reading

Office of Assessment
2014 Delaware Comprehensive Assessment System State Summary Page | 6
test are counted in the Exempt N column for the relevant content area. An exemption causes
the student scores to be excluded from performance calculations and from participation rate
calculations.
Special Exemption – Some students were granted a “special” exemption from the DCAS
due to physical or mental conditions or due to other circumstances that were beyond the
control of the student and school staff.
ELL Reading Exemption – ELLs who were enrolled in United States schools less than
one year and who met the criteria set forth in the 2013–2014 DCAS Guidelines for
Inclusion are not required to participate in the reading assessment, per guidance from the
USED.
% Tested – The percent tested is calculated by dividing “Tested N” by “Eligible N”.
% Not Tested – The percent not tested is calculated by dividing the sum of (“Not Tested N”
+ the count of “Invalid Scores”) by the “Eligible N”.
Participation rates were calculated for all grade levels and content areas, and can be reviewed in
Attachment 1. The DCAS subgroup participation rates for all grade levels and content areas
were calculated based on the following subgroups:
English language learners (ELLs)
Students with disabilities (SWDs)
Low-socioeconomic status (SES)
African Americans
Hispanics
Whites
Other minorities
Reading Participation Rate
All grade levels met the goal of 95% participation at the statewide level in reading. Grades 3–8
well exceeded the goal with 98% or above in reading. Grades 9 and 10 also met the goal with
96% and 95% respectively, which is an improvement from the 2012–2013 administration when
they did not—both were slightly above 94%.
Participation Rate by Subgroup
At grade levels 3–8, students in all subgroups met the participation rate. At grade levels 9 and
10, five subgroups failed to meet the participation rate goal in reading. They are:
SWDs – 91% for grade 9 and 90% for grade 10
ELLs – 88% for grade 9 and 89% for grade 10
Low-SES – 93% for grade 9 and 92% for grade 10
Hispanics – 94% for grade 9 and 93% for grade 10
African Americans – 94% for grade 9 and 93% for grade 10

Office of Assessment
2014 Delaware Comprehensive Assessment System State Summary Page | 7
There were 270 individual test administrations for SWDs and ELLs with a nonstandard read-
aloud accommodation in reading. As a result, these students are considered nonparticipants.
The number of students receiving this nonstandard accommodation on DCAS in reading has
declined from a high of 765 students in spring 2011 to a low of 270 students for spring 2014. In
the spring 2014, 54 SWDs and 20 ELLs were read reading passages by a human reader. Text-to-
speech accommodations for reading passages were provided for 142 SWDs and 28 ELLs, and 26
SWDs had passages signed. This decline is the result of districts working with DOE to gain a
better understanding of accommodation guidelines. Nonstandard accommodations only impact
the reading participation rates. There are other factors, such as truancy, that also negatively
impact participation rates.
Graph 1 – Counts of Nonstandard Accommodations
Mathematics Participation Rate
All grade levels met the goal of 95% participation at the statewide level in mathematics. Grades
3 through 8 well exceeded the goal of 99% or above in mathematics. Both grades 9 and 10 also
exceeded the goal of 96%.

Office of Assessment
2014 Delaware Comprehensive Assessment System State Summary Page | 8
Participation Rates by Subgroup
At grade levels 3–8, students in all subgroups met the participation rate goal of 95% in
mathematics. At grade levels 9 and 10, five subgroups failed to meet the participation rate goal
in mathematics. They are:
SWDs – 93% for grade 9 and 92% for grade 10
ELLs – 92% for grade 9 and 91% for grade 10
Low-SESs – 93% for grades 9 and 10
Hispanics – 94% for grade 9 and 93% for grade 10
African Americans – 94% for grade 9 and 93% for grade 10
Science Participation Rate
Participation rates were calculated for 24 grade level/content area/subgroups in science. Of
these, 9 do not meet the 95% target. The subgroup participation rates that are lower than the
target ranged from 88% to 94%.
The subgroup grade levels that had the lowest participation rates are grades 8 and 10.
The subgroups in grade 8 with the greatest number of low participation rates are SWDs at
93%, ELLs at 93%, low-SES at 94%, and African Americans at 94%.
The subgroups in grade 10 with the greatest number of low participation rates are SWDs at
88%, ELLs at 88%, low-SES at 89%, African Americans at 90%, and Hispanics at 92%.
Social Studies Participation Rate
Of all the subgroup participation rates that were calculated for the assessments, only 2 do not
meet the 95% target. Subgroup participation rates in social studies range from nearly 100% to
93%. The subgroup grade level that has the lowest overall participation rate is in grade 7. All
subgroups met the 95% goal in grade 4, while the ELL subgroup at 93% does not meet the goal
in grade 7.

Office of Assessment
2014 Delaware Comprehensive Assessment System State Summary Page | 9
Nonstandard DCAS Scores
Below is a summary of the DCAS scores that are flagged as nonstandard. Nonstandard scores
are excluded from calculations of percent meets the standard and average scale scores but are
included in calculations of participation rates as nonparticipants (they lower the participation
rate).
Nonstandard scores are the scores of students whose highest score on a test in a given test
window is an incomplete attempt at a reading, math, science, or social studies test or scores of
students who took the reading test with nonstandard accommodations. Students whose attempt
on a test was incomplete do not receive a scale score, are marked as nonparticipants, and do not
contribute to the percent proficient reported for a subgroup, school, district, charter, or the state.
The nonstandard score summary table is one way that DOE reporting can be transparent
regarding the numbers of students who receive nonstandard scores.
Table 1 – Nonstandard Score Summary – Spring 2014
Number
Tested
Scale
Score
Mean
Percent
Meet
Standard
Mathematics 71 0 0
Grade 3 2 - -
Grade 4 2 - -
Grade 5 1 - -
Grade 6 10 - -
Grade 7 8 - -
Grade 8 8 - -
Grade 9 26 - -
Grade 10 14 - -
Reading 337 518.6 10.7
Grade 3 40 620.2 25.0
Grade 4 39 635.2 15.4
Grade 5 33 652.5 15.2
Grade 6 39 529.2 15.4
Grade 7 34 392.0 2.9
Grade 8 30 370.3 3.3
Grade 9 73 433.0 1.4
Grade 10 49 550.1 12.2
Science 175 - -
Grade 5 2 - -
Grade 8 141 - -
Grade 10 32 - -
Social Studies 84 - -
Grade 4 11 - -
Grade 7 73 - -

Office of Assessment
2014 Delaware Comprehensive Assessment System State Summary Page | 10
III. 2014 DCAS-ALT1 PARTICIPATION RATE
In this section, the participation rate is reported by content area and grade level for DCAS-Alt1.
The participation rate is also reported by subgroups. Please refer to the Participation Rates –
Definitions and Calculations on page 4 for clarification of the participation information.
The DCAS-Alt1 subgroup participation rates for all grade levels and content areas were
calculated for the following subgroups:
English language learners (ELLs)
Low-socioeconomic status (SES)
African American
Hispanic
White
Other minorities
Reading Participation Rate
All grade levels except for grades 3 and 10 met the goal of 95% participation at the statewide
level in reading. Grade 7, at 99%, well exceeded the reading goal.
Subgroup Participation Rates – Reading
Statistics for DCAS-Alt1 reading include:
Grade 3 – five subgroups failed to meet the participation goal in reading, low-SES at 89%,
white at 94%, Hispanic at 93%, African American at 91%, and Other Minorities at 92%.
Grade 4 – two subgroups failed to meet the participation goal in reading, Hispanics at 94%
and other minorities at 75%.
Grade 5 – three subgroups failed to meet the participation rate goal in reading, ELL at 85%,
low-SES at 94%, and Hispanics at 92%.
Grade 6 – one subgroup failed to meet the participation rate goal in reading, Hispanics at
92%.
Grade 7 – met the participation rate goal of 95% in reading for all subgroups.
Grade 8 – two subgroups failed to meet the participation goal in reading, low-SES at 94%
and whites at 92%.
Grade 9 – one subgroup failed to meet the participation rate goal in reading, African
Americans at 94%.
Grade 10 – three subgroups failed to meet the participation goal in reading, ELLs at 83%,
whites at 94%, and Hispanics at 90%.

Office of Assessment
2014 Delaware Comprehensive Assessment System State Summary Page | 11
Mathematics Participation Rate
All grade levels except grades 3 and 10 met the goal of 95% participation at the statewide level
in mathematics. Grade 7 well exceeded the goal (99%) in mathematics.
Subgroup Participation Rate – Mathematics
Statistics for DCAS-Alt1 mathematics include:
Grade 3 – three subgroups failed to meet the participation rate goal in mathematics, low-SES
at 90%, Hispanic 93%, and African American at 93%.
Grade 4 – one subgroup failed to meet the participation rate goal in mathematics, Hispanic at
94%.
Grade 5 – one subgroup failed to meet the participation rate goal in mathematics, ELLs at
92%.
Grade 6 – one subgroup failed to meet the participation rate goal in mathematics, Hispanic
92%.
Grade 7 – met the participation rate goal of 95% in mathematics for all subgroups.
Grade 8 – two subgroups failed to meet the participation rate goal in mathematics, low-SES
and white at 94% and 92% respectively.
Grade 9 – two subgroups failed to meet the participation rate goal in mathematics, low-SES
and African American, 93% and 92% respectively.
Grade 10 – all subgroups failed to meet the participation rate goal in mathematics, ELLs at
83%, low-SES at 95%, white at 94%, Hispanic at 90%, and African American at 95%.
Science Participation Rate
Only grade 5 met 95% participation, and in grades 8 and 10 were under 95%. The following
subgroups did not meet the participation rate of 95%:
Grade 5 – one subgroup, ELL at 92%
Grade 8 – one subgroup, low-SES at 92%
Grade 10 – four subgroups, ELL at 92%, low-SES at 93%, white at 93%, and Hispanic at
85%
Social Studies Participation Rate
In social studies, the participation rates for grades 4 and 7 were 99% and 97% respectively. The
following subgroups did not meet the participation rate of 95%:
Grade 4 – two subgroups, ELL at 88% and Hispanic at 81%

Office of Assessment
2014 Delaware Comprehensive Assessment System State Summary Page | 12
IV. 2014 DCAS RESULTS
The statewide DCAS summary data, with subgroups, is presented in Attachment 1.
In this section, the 2014 DCAS results are summarized at the state level with the number of
students tested, the mean score, and the percent proficient by content and grade. The state-level
results are also summarized by subgroups. The results of the 2014 DCAS are also compared
with the 2013 results in terms of mean scores and percent proficient for each content area.
To examine the difference between the mean scores across two years, DCAS reading and
mathematics, a t-test is applied. A brief interpretation is provided for the result of t-test with
cautions. A brief description about statistical procedure for the t-test is below.
The t-test referenced below is a statistical procedure that is commonly used in education to
examine the difference of the mean scores on two occasions. In this report, the t-test is applied
based on two non-matched samples (or populations) from the 2013 and the 2014 assessments
with unequal variances in reading and mathematics by grade. The statistical significance level is
set as α = 0.01 for a two-tailed test (positive or negative difference) of the hypothesis of no
difference between the two means. If the result of the t-test shows statistically significant (p <
0.01), it indicates, if the assessment is repeated 100 times under the same conditions, only 1 time
would show no difference between the two means; if the result of the t-test is not significant (p >
0.01), there is no sufficient statistical evidence to support the difference between the two means.
It is important to note that the results of the statistical analysis must be interpreted with caution.
Additional evidence is needed to supplement the statistical results to support the significant
increase of average student scores from year to year.
Reading Summary – Spring 2014
The average reading scores by grade for spring 2014 can be found in Graphs 3 and 4. The
percent of proficiency ranges from 70% to 76% at grades 3–5; from 71% to 73% at grades 6–8;
and from 66% to 75% at grades 9–10.
Reading Results – 2012-2013 School Year to the 2013-2014 School Year
In spring 2014, the average reading score shows statistically significantly higher by 3 score
points (t = 2.7619, p < .01) than in 2013 at grade 3 and by 4 score points (t = 3.8193, p < .0001)
at grade 10, while there is a slight increase of the average score found at grade 9. For grades 5–
7, the average scores remain nearly the same between 2013 and 2014; whereas, the average score
drops in 2013 from 835 vs. 833 in 2014. (T-Test chart is located at Table 1, page 40)
The percent proficient remains stable across grades in 2014 without significant changes when
comparing the results from the previous year, except in grade 10. The percent proficient
increases nearly 2%, from 73% in 2013 to 75% in 2014 for grade 10 reading. Across grades, it is
observed that the percent proficient in grade 9 is consistently lower than the rest of the grades
over time. In 2014, the percentage in grade 9 is lower by 4%–10% when compared to the other
grades.

Office of Assessment
2014 Delaware Comprehensive Assessment System State Summary Page | 13
Mathematics Summary – Spring 2014
The average mathematics scores by grade for spring 2014 can be found in Graphs 6 and 7. The
percent of proficiency ranges from 71% to 74% at grades 3–5, from 66% to 69% at grades 6–8,
and from 67% to 68% at grades 9–10.
Mathematics Results – 2012-2013 School Year to 2013-2014 School Year
In spring 2014, the average mathematics score shows statistically significantly higher by 3 score
points (t = 3.3489, p < .001) than in 2013 at grade 4 and by more than 1 score point (t = 1.4352,
p < .01) at grade 10. For grades 3, 5, and 6, a slight variation in average score is found in 2014
from the previous year (704 vs. 705 for grade 3; 772 vs. 771 for grade 5; 792 vs. 791 for grade
6). A statistically significantly lower average score is observed at grade 8 (t = –2.8341, p < .000)
and grade 9 (t = –2.6834, p < .000) than in 2013 (834 vs. 837 for grade 8 and 843 vs. 846 for
grade 9). (T-Test chart is located at Table 1, page 40)
The percent proficient remains nearly the same at grades 4–6 in 2014 when compared with
results in 2013. However, the percentage drops by 1% at grades 3, 7, and 10 as well as by 3% at
grades 8 and 9.
Science Summary – Spring 2014
In spring 2014, the average science score on the within-grade scale shows 400 at grades 5 and 8,
and 394 at grade 10, which are slightly lower than the previous year.
The percent proficient, however, shows a small increase of 1% for grade 8 and 4% for grade 10.
Social Studies Summary – Spring 2014
In spring 2014, the average social studies score on the within-grade scale shows 411 at grade 4,
which dropped by 3 score points from 2013, and 415 at grade 7, which remains the same as in
the previous year. Similarly, the percent proficient decreased by 4% and 1%, respectively, for
both tested grades in 2014.

Office of Assessment
2014 Delaware Comprehensive Assessment System State Summary Page | 14
V. 2014 DCAS-ALT1 RESULTS
The 2013–2014 school year was the third year for the DCAS-Alt1. Students were selected to
participate in the DCAS-Alt1 according to the participation criteria in the DCAS Guidelines for
Inclusion of Students with Disabilities and English Language Learners. The participation rate in
the DCAS-Alt1 assessments includes:
1,102 students participated in the DCAS-Alt1 reading
1,065 students participated in the DCAS-Alt1 mathematics
412 students participated in the DCAS-Alt1 science
407 students participated in the DCAS-Alt1 social studies
Reading: State-Level Results – Spring 2014
In the spring 2014 window, the percent proficient in reading ranges from a low of 51% proficient
in grades 3 and 6 to a high of 67% proficient in grade 5. There is an incremental increase from
grades 3 to 5—51%, 60%, and 67% respectively—and an incremental decline from grades 7 to
10—66%, 64%, 61%, and 55% respectively.
Contrary to expectation with a vertical scale, the mean scale scores in the spring 2014 window
does not reflect increases across the grade levels. While the lowest mean score is 668 at grade 3,
the highest is 749 at grade 9. In addition, there are dips at grades 6 and 8 of 3 and 4 scale score
points respectively, with an increase at grade 10 of 4 scale score points.
Reading Results: Spring 2012–2013 to Spring 2013–2014
The mean scale score at each grade level show changes from spring 2013 to spring 2014. Grades
7, 9, and 10 show increases of 19, 13, and 5 scale score points respectively. Grades 4, 6, and 8
show decreases of 6, 3, and 4 scale score points respectively. Grades 3 and 5 show no change.
The percentage of students proficient in reading show an increase in most grades, with a range of
2% at grade 4 and 7% at grade 10, from spring 2013 to spring 2014. Grade 3, 4, 7, and 9 show
increases of 4%, 2%, 4%, and 5% respectively. Grades 6 and 9 show decreases of 9% and 4%
respectively. Grade 5 shows no change.
It is important to be cautious in the interpretation of cross-year comparisons due to small sample
size and the differences in proportions of subtypes from year to year.

Office of Assessment
2014 Delaware Comprehensive Assessment System State Summary Page | 15
Mathematics: State-Level Results – Spring 2014
In the spring 2014, grades 4–10 had a 50% or more proficiency level, 50%, 58%, 50%, 67%,
67%, 59%, and 52% respectively.
Grades 3 had a proficiency level under 50%. At 43%, this showed an increase in proficiency of
10% from spring 2013.
Mathematics Results: Spring 2012–2013 to Spring 2013–2014
The mean scale scores for grades 4 and 5 were relatively flat. However, grades 6, 7, and 10 had
a noticeable change in their scale scores from spring 2013.
Grade 6 showed a gain of 8 scale score points
Grade 7 showed a large increase with a gain of 33 scale score points
Grade 10 showed a decrease of 9 scale score points
In spring 2014, the percent of students proficient in mathematics show increases in most grades
with a range of almost 3% (grade 10) to 10% (grade 9).
Grade 3 had an increase of 10% from spring 2013
Grade 4 had an increase of 3% from spring 2013
Grade 5 had an increase of 5% from spring 2013
Grade 7 had an increase of 6% from spring 2013
Grade 9 had an increase of 10% from spring 2013
Grade 10 had an increase of 3% from spring 2013
There were two grades, 6 and 8, that had a decrease in their proficiency levels.
Grade 6 had a decrease of 3% from spring 2013
Grade 8 had a slight decrease of 1% from spring 2013
Science: State-Level Results – Spring 2014
The spring DCAS-Alt1 science scale scores show increases of 13 scale score points for grade 5
and 4 scale score points for grade 10. The scores range from 384 in grade 10 to 406 in grade 5.
The fall DCAS-Alt1 science percent proficient has no apparent trend and range from 50 in grade
10 to 57 in grade 8.
Spring 2012–2013 to Spring 2013–2014. The spring-to-spring change in DCAS-Alt1 science
scale scores show increases in grades 5 and 10. The spring-to-spring change in DCAS-Alt1
science percent proficient range from a 10% gain in grade 10 to a 13% gain in grade 5.
Social Studies: State-Level Results – Spring 2014
The spring DCAS-Alt1 social studies scale scores fluctuate with grade level. The scores range
from 386 in grade 7 to 415 in grade 9. The spring DCAS-Alt1 social studies percent proficient
range from 42% in grade 7 to 64% in grade 9.

Office of Assessment
2014 Delaware Comprehensive Assessment System State Summary Page | 16
Spring 2012–2013 to Spring 2013–2014. The spring-to-spring change in DCAS-Alt1 social
studies scale scores show an increase of 10 points in grade 7 to an increase of 7 points in grade 9.
The spring-to-spring change in DCAS-Alt1 social studies percent proficient range from 2% in
grade 7 to 7% in grade 9.

Office of Assessment
2014 Delaware Comprehensive Assessment System State Summary Page | 17
VI. DCAS PERFORMANCE RESULTS
In this section, student achievement on DCAS is summarized by each performance level and
demonstrated with graphs by content area and grade levels. Please note that, due to rounding for
percentage, the total may be above or below 100%.
Longitudinal comparison from spring 2011 through spring 2014 is provided using graphs
depicting the mean scale scores and percentage proficient by content area and grade levels.
Reading Performance Graphs
Graph 2 – DCAS Reading Performance Levels, 2014
This graph shows the percentage of students in each performance level for reading, by grade, for
the spring 2014 DCAS administration.
At 37%, grade 6 has the highest percentage of students who are in the meets performance level,
while grade 9 has the lowest at 24%. Grade 10 has the highest percentage of students in the
advanced performance level, 51%, while grade 6 has the lowest at 36%. Overall, the percent of
students proficient (combined meets and advanced levels) range from a low of 66% proficient in
grade 9 to a high of 76% proficient in grade 5 with the remaining grades in the 70% to 73%
range—the exception being grade 10 with 75% proficient.
Grade 9 has the highest percentage of students in both the well below and below proficient
performance levels, 17% and 18% respectively. Grade 5 has the lowest percentage of students in
both the well below and below proficient performance levels, 11% and 13% respectively.

Office of Assessment
2014 Delaware Comprehensive Assessment System State Summary Page | 18
Graph 3 – Mean Scale Scores DCAS Reading
This graph shows the statewide mean scale score for DCAS reading by grade from spring 2011
through spring 2014. The mean scale score for students in all grades in spring 2014 is above the
baseline established in spring 2011. Grades 3, 9, and 10 show an increase in the mean scale
score from spring 2013 to spring 2014—3, 2, and 4 scale score points respectively. Two grades,
9 and 10, attained the highest mean scale score over the four years of DCAS administration in
spring 2014—837 and 856 scale score points respectively.

Office of Assessment
2014 Delaware Comprehensive Assessment System State Summary Page | 19
Graph 4 – Percentage of Students Proficient in DCAS Reading
The percentage of proficient students in all grades in spring 2014 is above the baseline
established in spring 2011; however, with the exception of grade 10 with a 2% increase, all grade
levels experienced a slight dip—except for grade 8 where the percent proficient dropped 2%
from spring 2013. Overall, in grades 3–10, there has been an 11% increase in the percent
proficient students from the spring 2011 baseline but a drop of 1% from its highest percent
proficient in spring 2012.

Office of Assessment
2014 Delaware Comprehensive Assessment System State Summary Page | 20
Mathematics Performance Graphs
Graph 5 – DCAS Mathematics Performance Levels, 2014
This graph shows the percentage of students in each performance level for math, by grade, for
the spring 2014 DCAS administration.
The graph shows that for each grade, the largest proportion of students in each grade performed
at meets standard, with a range from 36% for grade 9 to 49% for grade 4. The proportion of
students performing at the advanced level had a range of 22% in grade 7 to 31% in grade 9.
The percentage of students performing at well below standard has a range from 8% in grade 3 to
16% in grade 9. At below standard, the smallest percentage is seen at grade 4 with 16%, and the
largest is seen at grades 7 and 10 with 21%.

Office of Assessment
2014 Delaware Comprehensive Assessment System State Summary Page | 21
Graph 6 – Mean Scale Scores DCAS Mathematics
Average scale scores, statewide, for the spring DCAS mathematics test, by grade, are displayed
in the graph above. As with reading, these average scale scores increase with grade level,
consistent with expectations for a developmental scale.
In grades 4, 5, 6, and 10, the increase is from spring 2013 to spring 2014 is 3, 1,1, and 1 scale
score points respectively. Grades 3, 7, 8, and 9 show a decrease of 1 to 3 scale score points from
spring 2013 to spring 2014.

Office of Assessment
2014 Delaware Comprehensive Assessment System State Summary Page | 22
Graph 7 – Percentage of Students Proficient in DCAS Mathematics
The percent proficient remain the same from spring 2013 to spring 2014 for grades 4, 5, and 6,
while grades 3, 7, 8, 9, and 10 show a decrease of up to 2%.
Some analysis would be necessary to determine the reasons for these stagnant results. This
year’s inclusion of new items could be considered but may not necessarily explain the
phenomena.

Office of Assessment
2014 Delaware Comprehensive Assessment System State Summary Page | 23
Science Performance Graphs
Graph 8 – DCAS Science Performance Levels, 2014
The above graph shows the percentage of students in each performance level on the spring 2014
DCAS science test in grades 5, 8, and 10.
The proportion of students performing at meets standard and advanced is similar from grade to
grade. The proportion of students at well below standard is larger in grade 10 than in grades 8
and 5. In contrast, a greater proportion of students performed at below standard in grades 5 and
8 than in grade 10.

Office of Assessment
2014 Delaware Comprehensive Assessment System State Summary Page | 24
Graph 9 – Mean Scale Scores DCAS Science
As seen in the graph above, average scale scores for the spring 2014 DCAS science test are
lower in grade 10 than in grades 8 and 5, which are nearly the same. Mean scale scores dropped
3 scale score points in grade 5 and 1 scale score point in grade 8 and grade 10 compared with last
year’s scores. As the science scale is not a developmental scale but a horizontal scale, there is no
reason to expect mean scores to increase with increasing grade level.

Office of Assessment
2014 Delaware Comprehensive Assessment System State Summary Page | 25
Graph 10 – Percentage of Students Proficient in DCAS Science
The percentage of students at proficiency (meets standard and advanced performance levels
combined) for the spring 2014 DCAS science assessment show a similar but less dramatic
pattern to the scale scores for this test.
Grade 10 scores show the most profound change with an increase of more than 4% of students
meeting or exceeding the standard. While proficiency shows an increase of 1% in grade 8, grade
5 scores show a 1% drop of students meeting proficiency.

Office of Assessment
2014 Delaware Comprehensive Assessment System State Summary Page | 26
Social Studies Performance Graphs
Graph 11 – DCAS Social Studies Performance Levels, 2014
The above graph shows the percentage of students in each performance level on the spring 2014
DCAS social studies test in grades 4 and 7. Grade 4 has a higher percentage of students
performing at meets standard, 44%, than at advanced, 21%, while grade 7 has a higher
percentage of students performed at the advanced level, 34%, than at the meets standard, 25%.
In both tested grades, the percentage of students at the well below and below performance levels
is about the same.

Office of Assessment
2014 Delaware Comprehensive Assessment System State Summary Page | 27
Graph 12 – Mean Scale Scores DCAS Social Studies
The above graph shows mean scale scores for the spring 2011–2014 DCAS social studies test.
From spring 2013 to spring 2014, grade 7 mean scale scores remain the same, while grade 4
scores show a decrease of 3 scale score points. As the social studies scale is not a developmental
scale but a horizontal scale, there is no reason to expect scores to increase with increasing grade
level.

Office of Assessment
2014 Delaware Comprehensive Assessment System State Summary Page | 28
Graph 13 – Percentage of Students Proficient in DCAS Social Studies
The above graph shows the statewide percentage of students meeting the standard for the
2011–2014 DCAS social studies assessment. Grade 4 shows consistently higher performance
than grade 7. However, from spring 2013 to spring 2014 both show a decrease in percent
proficient of up to 4%.

Office of Assessment
2014 Delaware Comprehensive Assessment System State Summary Page | 29
VII. DCAS-ALT1 PERFORMANCE RESULTS
In this section, student achievement on DCAS-Alt1 is summarized by each performance level
and demonstrated with graphs by content area and grade levels. Please note that, due to rounding
for percentage, the total may be above or below 100%.
Longitudinal comparison from spring 2012 through spring 2014 is provided using graphs
depicting the mean scale scores and percentage proficient by content area and grade levels.
Reading Performance Graphs
Graph 14 – DCAS-Alt1 Reading Performance Levels, 2014
This graph shows the percentage of students in each performance level for reading, by grade, for
the spring, 2014 DCAS-Alt1 administration.
Grade 5 has the highest percentage of students who are in the advanced performance level in
reading at 42%, while grade 3 has the lowest at 17%. This is consistent with the proficiency
rates (meets and advanced levels combined), with grade 5 having the highest percentage of
students who are proficient in reading at 67% and grade 3 having the lowest percentage of
students who are proficient in reading at 51%.
Grade 3 has the highest percentage of students in the well below and below proficient
performance level at 24% each, with a similar pattern at grade 10—at 23% each. Grade 5 has the
lowest percentage of students in well below proficient performance level as well as the lowest
combined scores for well below and below proficient performance levels for reading at 8% and
33% respectively.

Office of Assessment
2014 Delaware Comprehensive Assessment System State Summary Page | 30
Graph 15 – Mean Scale Scores DCAS-Alt1 Reading
This graph shows the statewide mean scale score for DCAS-Alt1 reading by grade from spring
2012 through spring 2014.
Grades, 3, 5, 7, 8, and 9, show an increase in the mean scale score from the baseline in spring
2012—7, 9, 12, 18, and 36 scale score points respectively.
Grade 4 and grade 10 show a decline in mean scale scores from the baseline with a decrease
of 6 and 16 scale score points respectively.
Grade 6 shows the same mean scale score as the baseline.
Grades 7 and 9 attained the highest mean scale score over the three years of DCAS-Alt1
administration in spring 2014 at 740 and 749 respectively.
Grades 3, 7, 9, and 10 show an increase in the mean scale score from spring 2013—1, 19, 13,
and 5 scale score points respectively.
Mean scale scores show a decrease in grades 4, 6, and 8 from spring by 6, 3, and 4 scale
score points respectively.
Mean scale score for grade 5 remains the same as spring 2013.

Office of Assessment
2014 Delaware Comprehensive Assessment System State Summary Page | 31
Graph 16 – Percentage of Students Proficient in DCAS-Alt1 Reading
The percent proficient in all grades in spring 2014 is above the baseline established in spring
2011 with one exception, grade 6 which dipped 9%. The range of increase varies dramatically
from grade 4 with 2% to grade 10 with a gain of 8%.
From spring 2013 to spring 2014, the percent proficient in reading shows an increase in most
grades, with a range of 2% at grade 4 and 7% at grade 10. Grades 3, 4, 7, and 9 show increases
of 4%, 2%, 4%, and 5% respectively. Grades 6 and 9 show decreases of 9% and 4%
respectively, while grade 5 shows no change.

Office of Assessment
2014 Delaware Comprehensive Assessment System State Summary Page | 32
Mathematics Performance Graphs
Graph 17 – DCAS-Alt1 Mathematics Performance Levels, 2014
This graph displays the percentage of students in each performance level, by grade, for the spring
2014 DCAS-Alt1 mathematics.
The proportion of students performing at meets standard has a range of 27% at grades 5 and 8 to
41% at grade 9. The proportion of students performing at advanced level has a range of 11% in
grade 10 to 39% in grade 8.
The percentage of students performing at well below standard has a range of 15% in grade 7 to
26% in grade 3. At below standard, the smallest percentage is seen at grade 8 with 16%, and the
largest is seen at grade 6 with 32%.

Office of Assessment
2014 Delaware Comprehensive Assessment System State Summary Page | 33
Graph 18 – Mean Scale Scores DCAS-Alt1 Mathematics
Overall, there is a continued increase in spring 2014 DCAS-Alt1 mathematics scale scores over
the years for grades 3 through 7. These grades show an increase from spring 2013 with a range
of 642 to 729 scale score points.
There is an increase in mean scale score points for grades 6 and 7.
Grade 6 – 8 scale score points
Grade 7 – 33 scale score points
However, there is a decrease in scale scores for grades 8, 9, and 10 from spring 2013, ranging
from 5 scale score points for grades 8 and 9 to 9 scale score points for grade 10. These scale
scores are still much higher than spring 2012 scores.

Office of Assessment
2014 Delaware Comprehensive Assessment System State Summary Page | 34
Graph 19 – Percentage of Students Proficient in DCAS-Alt1 Mathematics
Overall, DCAS-Alt1 mathematics percentages for proficiency show an increase from spring
2013 to spring 2014 for all grade levels except for grades 6 and 8, each with a dip of 3% and 1%
respectively. The percent proficient ranges from 43% in grade 3 to 67% in grade 7. It is worth
noting that grade 3 shows an increase of 10%. Grades 5 and 7 also show an increase of 4% and
6% respectively.

Office of Assessment
2014 Delaware Comprehensive Assessment System State Summary Page | 35
Science Performance Graphs
Graph 20 – DCAS-Alt1 Science Performance Levels, 2014
The above graph shows the percentage of students in each performance level in the spring 2014
DCAS-Alt1 science test in grades 5, 8, and 10.
The proportion of students performing at meets standard is greatest at grade 10, 39%, and least at
grade 5 at 21%. A greater proportion of students performed at advanced in grade 5 at 32%, than
in grade 10 at 12%, and in grade 8 at 22%.
The proportion of students at well below standard is larger in grade 10 than in grades 8 and 5. In
contrast, a greater proportion of students performed at below standard in grades 5 and 8 than in
grade 10.
Office of Assessment
2014 Delaware Comprehensive Assessment System State Summary Page | 36
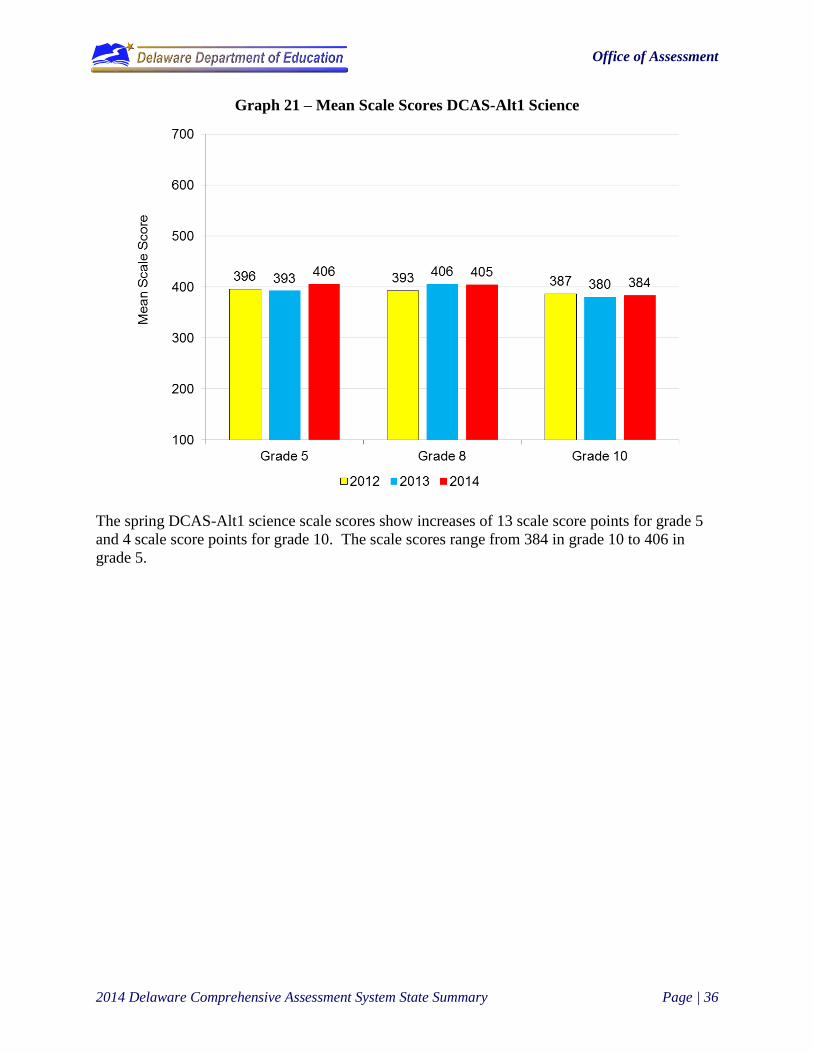
Graph 21 – Mean Scale Scores DCAS-Alt1 Science
The spring DCAS-Alt1 science scale scores show increases of 13 scale score points for grade 5
and 4 scale score points for grade 10. The scale scores range from 384 in grade 10 to 406 in
grade 5.

Office of Assessment
2014 Delaware Comprehensive Assessment System State Summary Page | 37
Graph 22 – Percentage of Students Proficient in DCAS-Alt1 Science
The spring 2014 DCAS-Alt1 science percent proficient shows an increase from spring 2014 of
14% in grade 5 and 10% in grade 10, while grade 8 shows a decrease of 7%.

Office of Assessment
2014 Delaware Comprehensive Assessment System State Summary Page | 38
Social Studies Performance Graphs
Graph 23 – DCAS-Alt1 Social Studies Performance Levels, 2014
The graph above shows that, statewide, in grade 9, fairly equal proportions of students performed
at well below and below, while the greatest proportion of grade 9 students performed at
advanced, 35%.
In grade 4, the greatest proportion of students performed well above standard, 28%, and the
smallest proportion of students performed at well below, 21%. Grade 7 students were as likely
to perform at well below as at advanced, while a greater proportion of students were below
standard than meets standard.

Office of Assessment
2014 Delaware Comprehensive Assessment System State Summary Page | 39
Graph 24 – Mean Scale Scores DCAS-Alt1 Social Studies
The spring 2014 DCAS-Alt1 social studies scale scores change with grade level. The scores
range from 386 in grade 7 to 415 in grade 9. From spring 2013 to spring 2014, grade 4 shows a
decrease of 9 scale score points, while grades 7 and 9 show an increase of 18 and 7 scale score
points respectively.

Office of Assessment
2014 Delaware Comprehensive Assessment System State Summary Page | 40
Graph 25 – Percentage of Students Proficient in DCAS-Alt1 Social Studies
The spring 2014 DCAS-Alt1 social studies percent proficient ranges from 42% in grade 7 to
64% in grade 9. All grades levels show slight increases over 2013.

Office of Assessment
2014 Delaware Comprehensive Assessment System State Summary Page | 41
Table 1 – Results of t-test
N Mean S.D. N Mean S.D.
Grade
3 10092 728.3088 77.5584 9935 725.3754 72.6985 2.7619 0.01
4 9994 758.0164 64.6671 10031 757.8819 63.6118 0.1484 0.88
5 10184 783.3158 66.8118 9842 782.8245 66.1125 0.5230 0.60
6 9858 795.0752 65.4507 9800 795.1798 65.0002 -0.1125 0.91
7 9909 809.3285 77.5558 9898 808.6065 64.7013 0.7114 0.43
8 9905 833.2609 67.7121 9664 835.0984 66.1822 -1.9198 0.06
9 10937 836.7397 71.4221 10535 835.0287 65.2138 1.8343 0.07
10 9070 855.7880 63.4693 9160 852.169 64.4685 3.8193 0.00
N Mean S.D. N Mean S.D.
Grade
3 10158 703.4799 79.3949 10009 704.7965 74.1663 -1.2171 0.26
4 9965 748.1442 78.3996 10088 744.6241 70.1704 3.3489 0.00
5 10219 771.8380 74.3734 9908 771.1335 69.1546 0.6962 0.48
6 9812 791.7485 76.5201 9863 790.5944 72.3321 1.0870 0.30
7 9955 805.8925 79.3164 9938 807.85 63.8392 -1.9176 0.03
8 9997 834.4153 68.1788 9729 837.0667 63.1775 -2.8341 0.00
9 11093 843.3867 71.2810 10644 845.8587 64.4805 -2.6834 0.00
10 9148 859.7915 60.6418 9223 858.5647 55.0637 1.4352 0.00
p-value
*p<0.01
2014 DCASReading
Math
2013 DCASt-value p-value
2014 DCAS 2013 DCASt-value

Office of Assessment
2014 Delaware Comprehensive Assessment System State Summary
Appendix A
DCAS Tables

Office of Assessment
2014 Delaware Comprehensive Assessment System State Summary Page | A-1
Table A-1 – DCAS Assessment Window Dates
Dates of Window Tests Administered
Fall Window:
August 19–October 18, 2013
Reading/Mathematics
Grades 3–10
Spring Window:
January 20–June 6, 2014
April 14–June 6, 2014
May 19–June 6, 2014
Reading/Mathematics
Grades 2–10
Science
Grades 5, 8, and 10
Social Studies
Grades 4 and 7
Table A-2 – DCAS Subject Areas Test Administrations by Grade Level
Content Grades
Number of Times in Window
Test May Be Administered
Fall Spring
Reading 3–10 1 Up to 2
Mathematics 3–10 1 Up to 2
Reading and
Mathematics 2 0 1
Science 5, 8, and 10 0 1
Social Studies 4 and 7 0 1

Office of Assessment
2014 Delaware Comprehensive Assessment System State Summary Page | A-2
DCAS Cut Scores
Table A-3 – Reading Performance Standards
Grade
Well Below
Standard
Below
Standard
Meets
Standard Advanced
3 650 or less 651-689 690-736 737 or more
4 681 or less 682-720 721-771 772 or more
5 699 or less 700-738 739-797 798 or more
6 724 or less 725-757 758-817 818 or more
7 743 or less 744-775 776-826 827 or more
8 763 or less 764-799 800-843 844 or more
9 766 or less 767-810 811-852 853 or more
10 774 or less 775-819 820-858 859 or more
Table A-4 – Mathematics Performance Standards
Grade
Well Below
Standard
Below
Standard
Meets
Standard Advanced
3 592 or less 593-658 659-749 750 or more
4 648 or less 649-699 700-792 793 or more
5 689 or less 690-731 732-810 811 or more
6 715 or less 716-756 757-835 836 or more
7 739 or less 740-778 779-849 850 or more
8 766 or less 767-799 800-861 862 or more
9 774 or less 775-811 812-871 872 or more
10 791 or less 792-829 830-896 897 or more
Table A-5 – Performance Standards
Grade
Well Below
Standard
Below
Standard
Meets
Standard Advanced
5 351 or less 352-399 400-434 435 or more
8 359 or less 360-399 400-434 435 or more
10 380 or less 381-399 400-434 435 or more
Table A-6 – Performance Standards
Grade
Well Below
Standard
Below
Standard
Meets
Standard Advanced
4 382 or less 383-399 400-434 435 or more
7 370 or less 371-399 400-434 435 or more

Office of Assessment
2014 Delaware Comprehensive Assessment System State Summary
Appendix B
DCAS-Alt1 Tables

Office of Assessment
2014 Delaware Comprehensive Assessment System State Summary Page | B-1
Table B-1 – DCAS-Alt1 Assessment Window Dates
Dates of Window Tests Administered
Fall Window:
September 23–November 7, 2013
Reading/Mathematics
Grades 3–10
Spring Window:
March 31–June 6, 2014
Reading/Mathematics
Grades 3–10
Science
Grades 5, 8, and 10
Social Studies
Grades 4, 7, and 9
Table B-2 – DCAS-Alt1 Subject Areas Test Administrations by Grade Level
Content Grades
Number of Times in Window
Test is Administered
Fall Spring
Reading 3–10 1 1
Mathematics 3–10 1 1
Science 5, 8, and 10 0 1
Social Studies 4, 7, and 9 0 1
Office of Assessment
2014 Delaware Comprehensive Assessment System State Summary Page | B-2
DCAS-Alt1 Cut Scores
Table B-3 – DCAS-Alt1 Reading Performance Standards
Grade
Well Below
Standard
Below
Standard
Meets
Standard Advanced
3–5 629 or less 630 673 725
6–8 639 or less 640 700 779
9–10 649 or less 650 740 817
Table B-4 – DCAS-Alt1 Mathematics Performance Standards
Grade
Well Below
Standard
Below
Standard
Meets
Standard Advanced
3–5 624 or less 625 676 724
6–8 641 or less 642 700 773
9–10 656 or less 657 724 802