Embed Size (px)
Citation preview

2014 Day of Vision Evaluation Summary Report
December 4, 2014 Institutional Research and Assessment
Tulsa Community College

T C C I n s t i t u t i o n a l R e s e a r c h a n d A s s e s s m e n t , D e c e m b e r 2 0 1 4
P a g e | 2
Fall 2014 Day of Vision Evaluation
Executive Summary Results of the November 1, 2014, Day of Vision evaluations are presented below. The evaluation
instrument consisted of one survey with three sections—first section for all to complete, second section
for students to complete, and third section for parents to complete. The survey included three
demographic questions, two yes/no items, four event evaluation items, using a four-point Likert-type
scale, and one open-ended question to allow for comments. Additionally, respondents were provided a
list of sessions for session attendance identification with a blank line to record the session they found
most useful (copy of survey attached in Appendix). Responses include 219 students and 174 parents.
Findings indicated the following:
Respondents were highly satisfied with the overall experience. More than 90% of respondents
(91% students, 99% parents) reported they either “Liked it” (55% students, 65% parents) or
“Loved it” (36% students, 34% parents). Of those who provided a response to each question,
98% of student respondents and 100% of parent respondents indicated that they would
recommend the program to others, while 97% of students and 99% of parents indicated that the
program met their expectations.
A majority of respondents indicated satisfaction with the break-out sessions. The student
sessions were well-regarded, with 83% of student respondents indicating they either liked (57%)
or loved (26%) these sessions. Parents were very pleased with their sessions, with 97%
indicating they either liked (64%) or loved (33%) the session offerings. Parents rated the
financial aid information at 97%, with respondents indicating they either liked (67%) or loved
(30%) this session.
With regard to the Tables of Interest, 71% of students either liked (54%) or loved (17%) the
information provided. Parents responded slightly higher with 73% indicating they liked (59%) or
loved (14%) the information provided.
Students made up 56% of the combined respondent pool. Among students, attendance was
primarily older students with the following breakdown: 9th graders (12%), 10th graders (16%),
11th graders (34%), and 12th graders (35%), with another 4% that selected “other.” These
included a 7th grader, five 8th graders, and one in college.

T C C I n s t i t u t i o n a l R e s e a r c h a n d A s s e s s m e n t , D e c e m b e r 2 0 1 4
P a g e | 3
A majority of student respondents were female (55%). Males made up 45% of the respondent
pool. The parent group was comprised of 69% female respondents compared to 30% for males.
One percent elected not to respond.
Two sessions were repeatedly listed by student respondents as the most useful: Show Me the
Money – Scholarship Essay and ACT – Test Preparation. The parent respondents selected Tulsa
Achieves as the most useful session, followed by Preparing Your Child for College. A number of
students and parents indicated that they enjoyed both sessions that they attended.
As to suggestions for improvement, several student respondents gave some variation of “It
great how it is,” “It was a wonderful learning experience,” or “Nothing, honestly, really
enjoyable” as a response. The word “more” appeared in a number of responses: as in, “More
sessions,” “More time in class,” “More tables of interest” and other responses generally
indicating a desire for more exposure to the Day of Vision material. Student respondents also
expressed an interest in financial advice. Some participants suggested interactive or hands-on
activities, better navigation on campus, and having counselors to talk to.
Parent respondents made comments such as, “Very informative, I learned a lot,” “Everything is
perfect” and “Nothing, very well organized.” The word “more” appeared in the parent section as
well, as in “More tables of interest,” “Would like to attend more sessions,” and “More time in
break-out sessions.” Some participants suggested information on concurrent enrollment for
students, handouts with bullet points, and one-on-one Q&A time.
Results of the student and parent Day of Vision surveys are depicted in the following tables and graphs.

T C C I n s t i t u t i o n a l R e s e a r c h a n d A s s e s s m e n t , D e c e m b e r 2 0 1 4
P a g e | 4
Student Results
Results of Fall 2014 Day of Vision Evaluation Total STUDENT Respondents (N=219)
Rating Item Didn’t Attend
Didn’t Like It
So-So Liked It Loved
It No
Response
Student Break-out Sessions 15% 0% 14% 47% 22% 2%
Tables of Interest 19% 4% 18% 40% 13% 6%
Financial Aid Information 40% 0% 12% 32% 13% 3%
Overall Experience 3% 1% 8% 53% 34% 1%
NOTE: Rows may not sum to 100% due to rounding.
Results of Fall 2014 Day of Vision STUDENT Evaluation - Adjusted Results*
Rating Item Didn’t Like It
So-So Liked It Loved
It
Student Break-out Sessions 0% 17% 57% 26%
Tables of Interest 5% 24% 54% 17%
Financial Aid Information 0% 21% 57% 22%
Overall Experience 1% 9% 55% 36%
NOTE: Rows may not sum to 100% due to rounding. * Adjusted results exclude “No Response” and “Didn’t Attend.”
NOTE: Numbers may not sum to 100% due to rounding.
Yes 95%
No 3%
No Response
2%
My expectations for the program were met (students)
Yes 95%
No 2%
No Response
3%
I would recommend TCC's Day of Vision to others (students)

T C C I n s t i t u t i o n a l R e s e a r c h a n d A s s e s s m e n t , D e c e m b e r 2 0 1 4
P a g e | 5
Student Demographics
Student Year in High School (self-reported)
NOTE: Columns may not sum to 100% due to rounding.
Student Gender
Number Percent
Male 99 45%
Female 120 55%
Total Respondents 219 100% NOTE: Columns may not sum to 100% due to rounding.
Number Percent
9th Grade 26 12%
10th Grade 35 16%
11th Grade 74 34%
12th Grade 76 35%
Other 8 4%
Total Respondents 219 100%
9th Grade 10thGrade
11thGrade
12thGrade
Other
12%
16%
34% 35%
4%
Male 45%
Female 55%
T C C I n s t i t u t i o n a l R e s e a r c h a n d A s s e s s m e n t , D e c e m b e r 2 0 1 4
P a g e | 6
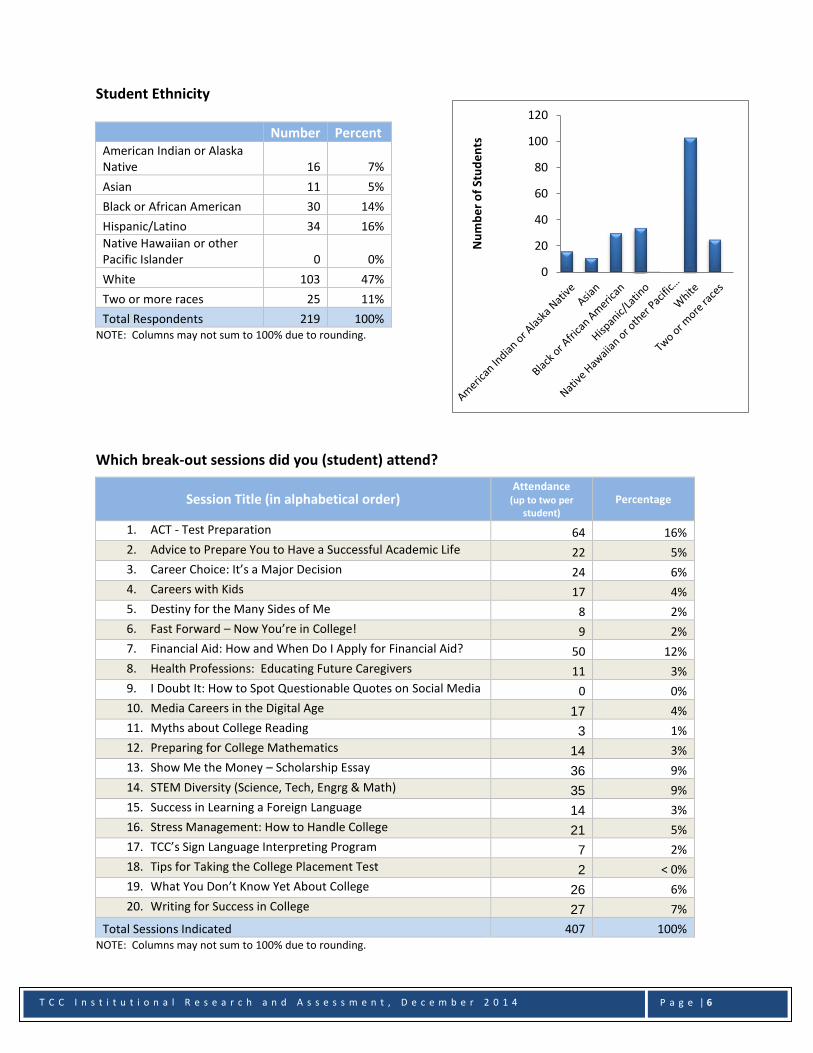
Student Ethnicity
Number Percent American Indian or Alaska Native 16 7%
Asian 11 5%
Black or African American 30 14%
Hispanic/Latino 34 16%
Native Hawaiian or other Pacific Islander 0 0%
White 103 47%
Two or more races 25 11%
Total Respondents 219 100% NOTE: Columns may not sum to 100% due to rounding.
Which break-out sessions did you (student) attend?
Session Title (in alphabetical order) Attendance
(up to two per student)
Percentage
1. ACT - Test Preparation 64 16%
2. Advice to Prepare You to Have a Successful Academic Life 22 5%
3. Career Choice: It’s a Major Decision 24 6%
4. Careers with Kids 17 4%
5. Destiny for the Many Sides of Me 8 2%
6. Fast Forward – Now You’re in College! 9 2%
7. Financial Aid: How and When Do I Apply for Financial Aid? 50 12%
8. Health Professions: Educating Future Caregivers 11 3%
9. I Doubt It: How to Spot Questionable Quotes on Social Media 0 0%
10. Media Careers in the Digital Age 17 4%
11. Myths about College Reading 3 1%
12. Preparing for College Mathematics 14 3%
13. Show Me the Money – Scholarship Essay 36 9%
14. STEM Diversity (Science, Tech, Engrg & Math) 35 9%
15. Success in Learning a Foreign Language 14 3%
16. Stress Management: How to Handle College 21 5%
17. TCC’s Sign Language Interpreting Program 7 2%
18. Tips for Taking the College Placement Test 2 < 0%
19. What You Don’t Know Yet About College 26 6%
20. Writing for Success in College 27 7%
Total Sessions Indicated 407 100% NOTE: Columns may not sum to 100% due to rounding.
0
20
40
60
80
100
120
Nu
mb
er
of
Stu
de
nts

T C C I n s t i t u t i o n a l R e s e a r c h a n d A s s e s s m e n t , D e c e m b e r 2 0 1 4
P a g e | 7
Which sessions did you (student) find most useful?
Show Me the Money – Scholarship Essay (20)
ACT - Test Preparation (19)
STEM Diversity (Science, Tech, Engrg & Math) (9)
What You Don’t Know Yet About College (8)
Writing for Success in College (8)
Success in Learning a Foreign Language (7)
Career Choice: It’s a Major Decision (6)
Advice to Prepare You to Have a Successful Academic Life (5)
Financial Aid: How and When Do I Apply for Financial Aid? (5)
Careers with Kids (4)
Stress Management: How to Handle College (4)
Preparing for College Mathematics (3)
Health Professions: Educating Future Caregivers (2)
TCC’s Sign Language Interpreting Program (2)
Destiny for the Many Sides of Me (1)
Fast Forward – Now You’re in College! (1)
Media Careers in the Digital Age (1)
Myths about College Reading (1)
Tips for Taking the College Placement Test (1)
I Doubt It: How to Spot Questionable Quotes on Social Media

T C C I n s t i t u t i o n a l R e s e a r c h a n d A s s e s s m e n t , D e c e m b e r 2 0 1 4
P a g e | 8
What would improve this event? (student perspective)
A bit longer sessions ACT Study Guides and more detailed course descriptions-I wanted Digital Media, I got
journalism
Added more sessions
Be able to attend 3 or 4 sessions
Being able to attend more than two sessions
Consider adding programs showing student what classes offer arts or broaden selection.
Directions during the STEM session, have the speaker talk more of the technology side of it (ex.
Computer Science)
Enthusiastic, awesome teachers like [name removed] who made her session easy and fun!
Everything was great!
Explaining
Explaining scholarships for careers
Fine the way it is now
Food
Getting to know the people who attended
Having more and enough room for everybody in every class or session.
Having more counselors to talk to
Having say first or second year TCC students give insight on how the first year is
helping us sign up for financial aid
I believe that everyone did a good job! I wish I could've seen more presentations
I did understand but it was a little hard
I didn't arrive with any expectations, so I was not disappointed. :) It was fun.
I don't know
I think kids need a bigger variety of places to go
I thought it was all great.
I would make sure to have a volunteer for each program
If they catered more to the top of the class and not the bottom
It was a wonderful learning experience
It was amazing? Nothing
It's great how it is
Later in the day (2)
Learning more about what we need to do to be college ready
Less talking more showing
Longer sessions Make break-out sessions more hands on. There needs to be less lecturing and more
interaction
Maybe a practice ACT for the ACT prep
Maybe the tables of interest they weren't really that interesting
More / [?] teachers about engineering
More food (2)
More fun
More information (3) More or just hands on activity. I am very hands on therefore I was very fidgety throughout
the lecture.
More people allowed to come and enjoy the experience
More resources about financial aid and after college life.
More session opportunities
More sessions (2)

T C C I n s t i t u t i o n a l R e s e a r c h a n d A s s e s s m e n t , D e c e m b e r 2 0 1 4
P a g e | 9
More sessions to choose from
More specialized classes; numbers permitting
More specialized information on STEM areas
More summarized info in physical form (paper)
More supervisors per event
More tables of interest (3)
More talking less joking around. More important topics
more time in class / smaller classes
More time in each session
More time in the classes
More time in the sessions
More variations of the "tables of interest"
n/a
None (2)
Nothing (3)
Nothing :)
Nothing everything is great! :)
Nothing honestly; really enjoyable
Nothing really
Nothing that I have seen so far needs improving
Nothing, I enjoyed everything each class had to say
Presenters should interact more with students
Psychology, neuroscience, etc.
Shorter breakouts with the opportunity to take 3 sessions for only 20-30 minutes
Signs on how to get to the next section
Sorry I don't know
Start it later in the day. Otherwise the information is pretty good.
Talk more about scholarships
Talk to people to figure out your future field
Telling student about what frat houses there are.
That it is a learning experience for everyone
The only thing is less of a scare of trying to find places.
The start you didn't have anything to do
Three break-out sessions instead of 2.
Timing
Tour of facilities
Websites with more information or helpful tools pertaining to the class

T C C I n s t i t u t i o n a l R e s e a r c h a n d A s s e s s m e n t , D e c e m b e r 2 0 1 4
P a g e | 10
Parent Results
Results of Fall 2014 Day of Vision Evaluation Total PARENT Respondents (N=174)
Rating Item Didn’t Attend
Didn’t Like It
So-So Liked
It Loved
It No
Response
Parent Break-out Sessions 6% 0% 2% 56% 29% 6%
Financial Aid Information 36% 0% 2% 41% 18% 3%
Tables of Interest 20% 1% 19% 43% 10% 8%
Overall Experience 0% 0% 1% 62% 32% 5%
NOTE: Rows may not sum to 100% due to rounding.
Results of Fall 2014 Day of Vision PARENT Evaluation - Adjusted Results*
Rating Item Didn’t Like it
So-So Liked
It Loved
It
Parent Break-out Sessions 0% 3% 64% 33%
Financial Aid Information 0% 3% 67% 30%
Tables of Interest 1% 26% 59% 14%
Overall Experience 0% 1% 65% 34%
NOTE: Rows may not sum to 100% due to rounding. * Adjusted results exclude “No Response” and “Didn’t Attend”
NOTE: Numbers may not sum to 100% due to rounding.
Yes 95%
No 1%
No Response
5%
My expectations for the program were met (parents)
Yes 92%
No Response
8%
I would recommend TCC's Day of Vision to others (parents)

T C C I n s t i t u t i o n a l R e s e a r c h a n d A s s e s s m e n t , D e c e m b e r 2 0 1 4
P a g e | 11
Parent Demographics
Person Attending with Student
Number Percent
Parent 167 96%
Other (aunt, grandma, grandpa, guardian, sister) 7 4%
No Response 0 0%
Total Respondents 174 100% NOTE: Columns may not sum to 100% due to rounding.
Parent/Other Adult Gender
Number Percent
Male 52 30%
Female 120 69%
No Response 2 1%
Total Respondents 174 100% NOTE: Columns may not sum to 100% due to rounding.
Parent/Other Adult Ethnicity
Number Percent
American Indian or Alaska Native 11 6%
Asian 7 4%
Black or African American 11 6%
Hispanic/Latino 9 5%
Native Hawaiian or other Pacific Islander 0 0%
White 117 67%
Two or more races 14 8%
No Response 5 3%
Total Respondents 174 100% NOTE: Columns may not sum to 100% due to rounding.
0
25
50
75
100
125
150
Nu
mb
er
of
Par
en
ts
Male 30%
Female 69%
No Response
1%
96%
4%
Parent Other

T C C I n s t i t u t i o n a l R e s e a r c h a n d A s s e s s m e n t , D e c e m b e r 2 0 1 4
P a g e | 12
Which break-out sessions did you (parent) attend?
Session Title (in alphabetical order) Attendance (up to two per
person)
Percentage
Financial Aid – Understanding the Basics 51 16%
Financial Aid – I’ve Completed the FAFSA, Now what? 24 8%
Dear Mom & Dad, You Can Go to College, too! 2 1%
Getting Ready to Learn at the College Level 17 5%
Health Professionals: Family Support of Future Caregivers 11 3%
Navigating the Enrollment Process 22 7%
New Role for Parent of College Students with Disabilities 12 4%
Orientacion en Espanol - Parts 1 and 2 0 0%
Preparing Your Child for College 97 30%
Tulsa Achieves 84 26%
Total Sessions Indicated 320 100% NOTE: Columns may not sum to 100% due to rounding.
Which sessions did you (parent) find most useful?
1. Tulsa Achieves (34)
2. “Both” (30)
3. Preparing Your Child for College (19)
4. Financial Aid – Understanding the Basics (5)
5. New Role for Parent of College Students with Disabilities (4)
6. Financial Aid – I’ve Completed the FAFSA, Now what? (3)
7. Navigating the Enrollment Process (3)
8. Getting Ready to Learn at the College Level (1)
9. Health Professionals: Family Support of Future Caregivers (1)
What would improve this event? (parent perspective)
Ability to attend more than 2 classes for students
Allow more time for questions and answers
Breakfast :)-<
Encouraging
Everything done well
Everything is perfect!!!
Financial Aid should be a general session!
Go to college and learn more
Great job
If session is full open a second session
Information on concurrent enrollment for current has students

T C C I n s t i t u t i o n a l R e s e a r c h a n d A s s e s s m e n t , D e c e m b e r 2 0 1 4
P a g e | 13
Little more time in break out session
Make it a full day-I would have liked to attend more sessions.
More interest tables
Move areas of interest My ethnicity is not my daughter's perhaps another question in child's ethnicity would be important for
diversity?
n/a
None (2)
Nothing Nothing very well organized. Loved that it was just 1/2 day. My daughter tried it even though I had to
drag her out of bed.
Offer more session for parents to attend like 4 instead of only 2
One-on-one Q&A time
Possibly a longer day for parent and student to attend more sessions
Preparing Your Child for College needed better structure
Seat cushions :)
Shorter time in between sessions; handouts outlining (bullet points) of session information
Some classes with parent and student
Spanish info more specific
Tables of interest very lacking. All interest should be as big as Nursing. Science wasn't there
Talk more about what's available for student out of country that can't do Tulsa Achieves There should be sign posted throughout the hallways, as well as people directing parents and student
the travel time was chaotic and confusing. It should also start on time. The 2nd session didn't start on time.
Very informative I learned a lot! I am so glad we attended. [Name removed] was awesome. I did not know about FERPA so glad she explained and re-explained that!
Would have much rather chosen Financial Aid for second session. Would love to have that knowledge
Would like to be able to attend more sessions Would like to get the hand out for "Preparing Your Child for College" before the session instead of after.
Instructor can ask at beginning if everyone has one.
Would like to have seen a table for the drama department
T C C I n s t i t u t i o n a l R e s e a r c h a n d A s s e s s m e n t , D e c e m b e r 2 0 1 4
P a g e | 14
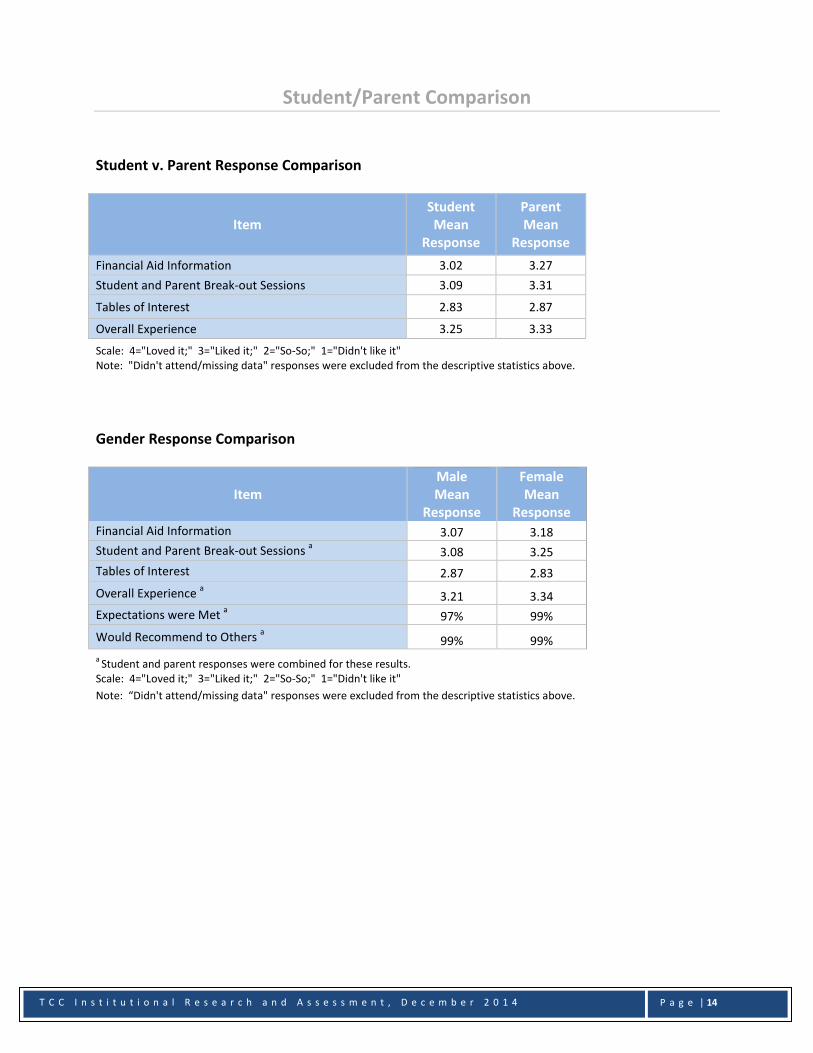
Student/Parent Comparison
Student v. Parent Response Comparison
Item Student Mean
Response
Parent Mean
Response
Financial Aid Information 3.02 3.27
Student and Parent Break-out Sessions 3.09 3.31
Tables of Interest 2.83 2.87
Overall Experience 3.25 3.33
Scale: 4="Loved it;" 3="Liked it;" 2="So-So;" 1="Didn't like it" Note: "Didn't attend/missing data" responses were excluded from the descriptive statistics above.
Gender Response Comparison
Item Male Mean
Response
Female Mean
Response Financial Aid Information 3.07 3.18
Student and Parent Break-out Sessions a 3.08 3.25
Tables of Interest 2.87 2.83
Overall Experience a 3.21 3.34
Expectations were Met a 97% 99%
Would Recommend to Others a 99% 99%
a Student and parent responses were combined for these results.
Scale: 4="Loved it;" 3="Liked it;" 2="So-So;" 1="Didn't like it"
Note: “Didn't attend/missing data" responses were excluded from the descriptive statistics above.

T C C I n s t i t u t i o n a l R e s e a r c h a n d A s s e s s m e n t , D e c e m b e r 2 0 1 4
P a g e | 15
0
200
400
600
2010 2011 2012 2013 2014
Attendance Trendline
Students Parents
Student Year Response Comparison
Item
Mean Response
9th Grade 10th Grade 11th Grade 12th Grade
Financial Aid Information 3.04 2.97 3.15 3.21
Student Break-out Sessions 3.22 3.14 3.14 3.24
Tables of Interest 2.91 2.381 2.80 2.86
Overall Experience 3.26 3.24 3.24 3.35
Expectations were Met 96% 97% 99% 95%
Would Recommend to Others 100% 100% 97% 97%
Scale: 4="Loved it;" 3="Liked it;" 2="So-So;" 1="Didn't like it;" Note: "Didn't attend/missing data" responses were excluded from the descriptive statistics above.
Ethnicity Response Comparison
Item
Mean Response American Indian or
Alaska Native
Asian Black or African
American
Hispanic /Latino
White Two or
more races
Financial Aid 2.94 3.38 2.92 3.07 3.20 3.17
Student/Parent Break-out Sessions
a 3.04 3.07 3.13 3.10 3.25 3.19
Tables of Interest 2.55 3.14 2.92 2.97 2.86 2.62
Overall Experience a 3.42 3.50 3.33 3.18 3.29 3.16
Expectations were Met a 100% 100% 97% 95% 99% 92%
Would Recommend to Others a 100% 100% 100% 100% 99% 95%
a Student and parent responses were combined for these results. Scale: 4="Loved it;" 3="Liked it;" 2="So-So;" 1="Didn't like it;"” Note: Didn't attend/missing data" responses were excluded from the descriptive statistics above.
Survey Respondent Trend
2010 2011 2012 2013 2014
Students 262 359 323 143 219
Parents 164 214 255 158 174
Total Survey Respondents
426 573 578 301 393
Total estimated participants per Office of Diversity and Civic Engagement
900+ (MC)
900+ (SEC)
800+ (WC)
700+ (NEC)
700+ (MC)

T C C I n s t i t u t i o n a l R e s e a r c h a n d A s s e s s m e n t , D e c e m b e r 2 0 1 4
P a g e | 16
Appendix