Embed Size (px)
Citation preview
CITY OF TACOMA, WASHINGTONFOR THE FISCAL YEAR ENDEDDECEMBER 31, 2014
2014COMPREHENSIVEANNUAL FINANCIAL
REPORT

2014 Comprehensive Annual Financial Report
of the City of Tacoma, Washington for the Year Ending December 31, 2014
Prepared by Department of Finance Andrew Cherullo, Finance Director
City of Tacoma, Washington Finance Department 747 Market Street, Room 132 Tacoma, WA 98402-3773 www.cityoftacoma.org/finance
The City of Tacoma does not discriminate on the basis of disability in any of its programs, activities, or services. To request this information in an alternative format or to request a reasonable accommodation, please contact the City Clerk’s Office at (253) 591-5505. TTY or speech to speech users please dial 711 to connect to Washington Relay Services.
2014 Comprehensive Annual Financial Report City of Tacoma, Washington
TABLE OF CONTENTS INTRODUCTORY SECTION ........................................................................................................... PAGE
Letter of Transmittal ....................................................................................................................... 1-1 GFOA Certificate of Achievement .................................................................................................. 1-5 Organizational Chart ...................................................................................................................... 1-7 Elected Officials ............................................................................................................................. 1-8 City Officials ................................................................................................................................... 1-9
FINANCIAL SECTION
Independent Auditor’s Report ....................................................................................................... 2-1 Management Discussion and Analysis ......................................................................................... 2-5
BASIC FINANCIAL STATEMENTS Government-Wide Financial Statements: Statement of Net Position ........................................................................................................... 3-2 Statement of Activities ................................................................................................................ 3-4 Fund Financial Statements: Balance Sheet—Governmental Funds ........................................................................................ 3-6
Reconciliation of Governmental Balance Sheet to the Statement of Net Position ...................... 3-7 Statement of Revenues, Expenditures and Changes in Fund Balance— Governmental Funds .............................................................................................................. 3-8 Reconciliation of the Statement of Revenues, Expenditures and Changes in Fund Balances of Governmental Funds to the Statement of Activities .................................... 3-9 Statement of Net Position—Proprietary Funds ......................................................................... 3-10 Reconciliation of Enterprise Net Position to Government-wide Statement of Net Position ....... 3-14 Statement of Revenues, Expenses and Changes in Fund Net Position—Proprietary Funds ..................................................................................................................................... 3-15 Reconciliation of the Statement of Revenues, Expenditures and Changes in Net Position to Enterprise Funds Statement of Activities ....................................................... 3-17 Statement of Cash Flows—Proprietary Funds .......................................................................... 3-18 Statement of Net Position—Fiduciary Funds ............................................................................ 3-22 Statement of Changes in Net Position—Fiduciary Funds ......................................................... 3-23 Notes to the Financial Statements ............................................................................................ 3-24
REQUIRED SUPPLEMENTAL INFORMATION
Schedule of Funding Progress—Tacoma Employee’s Retirement System (TERS) ................... 4-1 Schedule of Funding Progress—Other Post Employment Benefit Plan (OPEB) ......................... 4-2 Notes to Required Supplementary Information ........................................................................... 4-3 Schedule of Revenues, Expenditures and Changes in Fund Balance—Budget and Actual—General Fund ...................................................................................................... 4-5
COMBINING STATEMENTS – NON-MAJOR FUNDS Combining Balance Sheet—Non-Major Governmental Funds ................................................... 5-1 Combining Statement of Revenues, Expenditures and Changes in Fund Balance — Non-Major Governmental Funds ..................................................................................... 5-10 Schedule of Revenues, Expenditures, and Changes in Fund Balances—Budget And Actual— Non-Major Special Revenue Funds .............................................................. 5-19 Schedule of Revenues, Expenditures, and Changes in Fund Balances—Budget And Actual— Non-Major Debt Service Funds ...................................................................... 5-40 Schedule of Revenues, Expenditures, and Changes in Fund Balances—Budget And Actual— Non-Major Capital Projects Funds .................................................................. 5-48 Combining Statement of Net Position— Non-Major Enterprise Funds ..................................... 5-56 Combining Statement of Revenues, Expenses, and Changes in Fund Net Position— Non-Major Enterprise Funds ................................................................................................. 5-64 Combining Statement of Cash Flows—Non-Major Enterprise Funds ...................................... 5-68 Combining Statement of Net Position—Internal Service Funds ............................................... 5-76 Combining Statement of Revenues, Expenses and Changes in Fund Net Position— Internal Service Funds .......................................................................................................... 5-86 Combining Statement of Cash Flows—Internal Service Funds ............................................... 5-92 Combining Statement of Net Position—Pension and Employee Trust Funds ........................ 5-102
Table of Contents, 1 of 2
2014 Comprehensive Annual Financial Report City of Tacoma, Washington
Combining Statement of Changes in Net Position—Pension and Employee Trust Funds .................................................................................................................................. 5-103 Combining Statement of Net Position – Agency Funds .......................................................... 5-108 Combining Statement of Changes in Assets and Liabilities – Agency Funds ......................... 5-109 OTHER SUPPLEMENTARY INFORMATION: Schedule of Capital Assets Used in the Operation of Governmental Funds ........................... 5-112 Schedule of Capital Assets Used in the Operation of Internal Service Funds ......................... 5-112 Schedule of Capital Assets Used in the Operation of Governmental Funds and Internal Service Funds ......................................................................................................... 5-112 Schedule of Changes in Capital Assets Used in the Operation of Governmental Funds ........ 5-113 Schedule of Capital Assets Used in the Operation of Governmental Funds by Function and Activity ............................................................................................................ 5-113 Special Assessment Billings and Collections .......................................................................... 5-114 STATISTICAL SECTION:
Net Position by Component ........................................................................................................... 6-2 Changes in Net Position ................................................................................................................ 6-4 Fund Balances of Governmental Funds......................................................................................... 6-8 Changes in Fund Balances of Governmental Funds ................................................................... 6-10 Governmental Activities Tax Revenue by Source ........................................................................ 6-12 Assessed and Estimated Actual Value of Taxable Property ........................................................ 6-13 Property Tax Rates – Direct and Overlapping Governments ....................................................... 6-14 Property Tax Levies and Collections .......................................................................................... 6-15 Principal Taxpayers ..................................................................................................................... 6-16 Ratios of Outstanding Debt by Type ............................................................................................ 6-18 Ratios of General Bonded Debt Outstanding ............................................................................... 6-20 Computation of Direct and Overlapping Debt .............................................................................. 6-21 Legal Debt Margin Information ..................................................................................................... 6-22 Computation of Constitutional Limit of Indebtedness ................................................................... 6-24 Pledged-Revenue Coverage ........................................................................................................ 6-26 Demographic and Economic Statistics......................................................................................... 6-28 Principal Employers ..................................................................................................................... 6-29 Full-time Equivalent City Government Employees by Employees by Function ............................ 6-30 Operating Indicators by Function ................................................................................................. 6-32 Capital Asset Statistics by Function ............................................................................................. 6-34 Contributing Staff ......................................................................................................................... 6-36
Table of Contents, 2 of 2
SECTION 1
INTRODUCTORY SECTION LETTER OF TRANSMITTAL
GFOA CERTIFICATE OF ACHIEVEMENT ORGANIZATIONAL CHART
ELECTED OFFICIALS LIST OF CITY OFFICIALS

THIS PAGE LEFT INTENTIONALLY BLANK
2014 Comprehensive Annual Financial Report City of Tacoma, Washington
City of Tacoma Finance Department
May 22, 2015 Honorable Mayor, Members of the City Council, City Manager and Citizens of the City of Tacoma: The comprehensive annual financial report of the City of Tacoma, Washington (the City), for the year ended December 31, 2014, is hereby submitted in accordance with City Charter and state statutes. Both the City Charter and state statutes require that the City issue annually a report on its financial position and activity. Responsibility for both the accuracy of the data, and the completeness and fairness of the presentation, including all disclosures, rests with the City’s management based upon a comprehensive framework of internal control that it has established to provide assurance that the financial statements are free of any material misstatements. To the best of our knowledge and belief, the enclosed data are accurate in all material respects and are reported in a manner that presents fairly the financial position and results of operations of the various funds and component units of the City. Generally Accepted Accounting Principles (GAAP) in the United States of America requires that management provide a narrative introduction, overview, and analysis to accompany the basic financial statements in the form of Management’s Discussion and Analysis (MD&A). This letter of transmittal is designed to complement the MD&A and should be read in conjunction with it. The City’s MD&A can be found immediately following the Independent Auditor’s Report. The City is required to undergo an independent, annual single audit in conformity with the provisions of the Single Audit Act of 1996 and the U.S. Office of Management and Budget Circular A-133, Audits of States, Local Governments, and Non-Profit Organizations. Information related to this independent, single audit, including a schedule of expenditures of federal awards, the State Auditor’s Office reports on the internal control structure and compliance with applicable laws and regulations, and a schedule of findings and questioned costs, if any, are included in a separately issued report. CITY OF TACOMA PROFILE The City was incorporated on January 7, 1884. The City Charter, under which it is now governed, was adopted in 1952. The City operates under a council-manager form of government. The City Council is comprised of nine members: a Mayor, five district representatives and three at-large representatives. The City Council appoints a City Manager to carry out Council policies and administer the day-to-day operations of the City. Various departments provide a full range of services including police and fire protection, electrical generation and distribution, water distribution, wastewater and surface water services, solid waste services and many others. The name Tacoma stems from the Indian name for Mt. Rainier, “Tacobet,” which means Mother of the Waters. “City of Destiny” became Tacoma’s moniker when it was designated as the Northern Pacific Railroad’s western terminus for its transcontinental railroad in 1873.
Introductory Section, 1-1
2014 Comprehensive Annual Financial Report City of Tacoma, Washington Tacoma is located in Pierce County in Washington State on the Puget Sound. Its boundaries encompass approximately 50.1 square miles of land and 12.5 miles of waterfront. Lying between sea level and 440 feet above sea level, Tacoma averages 37 inches of rainfall each year with an average low temperature in January of 35.9 degrees Fahrenheit and an average high temperature in August of 75.6 degrees Fahrenheit. The 2013 population was 203,446, an increase of 2.5% since the 2010 count of 198,397. The Tacoma Community Redevelopment Authority, the Foss Waterway Development Authority, and the Greater Tacoma Regional Convention Center Public Facilities District are included as component units and are discretely presented within the City's annual financial statements. The Tacoma City Council adopts a biennial budget for all funds types. The biennial budget process begins in March of even numbered years using the City Council’s long-term strategic plan, goals, and priorities as a starting point. In April, the Office of Management & Budget begins the revenue forecasting process. Once the revenue forecast is completed, city departments begin budget preparations in May. Community budget engagement begins in June and occurs regularly for the duration of the budget process. After a period of review and update, a preliminary budget is presented to the City Council. By Washington State law, the City Council must receive a balanced preliminary budget by November 1st. Formal Public budget hearings are conducted by the City Council in October/November. Any changes the Council decides to make to the preliminary budget are made after the public hearings and before the reading of the budget ordinance in December. Washington State law requires the City Council adopt a balanced budget on or before December 31.
Washington State law requires that a mid biennial review and modification be conducted between September 1 and December 31 of the first year of the biennium. All budgets are controlled at the fund level, and the legal level of budgetary control is at the fund level. FACTORS AFFECTING THE CITY’S FINANCIAL CONDITION Economic Overview Pierce County enjoys a diverse economy influenced by its ideal location in the central Puget Sound region. Important industry sectors include the military, education, healthcare, manufacturing (aerospace, plastics, machinery, food products, and electronics) and wholesale distribution.
Tacoma shares in this good fortune in that it has one of the few ports on the West Coast with a large inventory of waterfront land available for development. Created by Pierce County citizens in 1918, the Port of Tacoma (Port) has 2,700 acres that are used for shipping terminal activity and warehouse, distributing, and manufacturing. The Port is a leading North American seaport, handling more than $52.4 billion in international trade and an estimated $21.9 billion in trade to China/Hong Kong in 2014. The Port is one of the top container ports in North America and a major gateway for trade with Asia and Alaska.
Government is the largest regional employment sector with the area’s major U.S. Military installations (Joint Base Lewis-McChord and Madigan Army Medical Center) heavily contributing to the workforce. Other large government employers include local public schools, Washington State, Pierce County, and higher education institutions.
Another large regional employment sector is the healthcare industry. Two of the largest employers in the Tacoma area are Franciscan Health System and the Multicare Health System. Multicare Health System, which operates Tacoma General, Allenmore, Auburn Medical Center, Good Samaritan Hospital and Mary Bridge Children's Hospitals, is the county's largest private employer.
The Puget Sound area was not immune from the impacts of the “Great Recession”. However, the diversity of the region’s economic base has served it well in the past and has helped it recover from the effects of the recession, taxable retail sales, as measured by sales tax receipts, are up 2.6% for the first three months of 2015
Introductory Section, 1-2
2014 Comprehensive Annual Financial Report City of Tacoma, Washington compared to the same period in 2014. The average year-to-date unemployment rate for the Tacoma metropolitan area was 7.8% as of February 2015 compared to 8.4% and 9.7% for February 2014 and 2013, respectively.
Relevant Financial Policies Financial and Budget Policy Statements are presented on pages 27-32 of the 2013-14 Biennial Budget and can be found on the City’s website at www.cityoftacoma.org. Revenue Limitation State law allows the City to levy a regular property tax rate of up to $3.60 per $1,000 of assessed property value annually. No matter what the assessed value is, however, the growth rate of property tax collections is limited to 1% per year, plus growth. In no event may the annual levy exceed the $3.60 per $1,000 of assessed value rate limit. During 2014, the City levied at the statutory limitation of $3.23 per $1,000 of assessed value. MAJOR INITIATIVES Tacoma Avenue South Bridge Project The purpose of the Tacoma Avenue South Bridge project will be to rehabilitate it with a new bridge deck, streetlights, guardrails and the entire bridge will be painted. These improvements will make the bridge look like new once completed. The traffic lanes will be re-configured from the current four vehicular lanes to three vehicular lanes and two bicycle lanes and wider sidewalks. The $11.5 million project will be funded from a combination of state, federal and local sources. A construction contract was awarded in 2014 and completion of the project is expected to end in December 2015. Prairie Line Trail Phase 1 This project will complete an important link in Tacoma’s non-motorized transportation system, connecting the water front to downtown with multiple city and regional trails. Traversing the steep hills of Tacoma is a challenge-the gentle grade of this former rail corridor provides an easier walking and cycling alternative. Construction of this multiuse path includes wayfinding, lighting, stormwater improvements, landscaping, public art and amenities. The first phase of the project is located along the former BNSF rail line running between South 15th Street and Dock Street. The $4.0 million project will be funded from a combination of state and local sources. The design phase was completed in 2014 and construction is scheduled to being in July 2015. Tacoma Police Department’s “IF Project” The “IF-Project” reached out to runaways and juvenile offenders by helping them visualize the paths they might take if they had some level of stability and support. The project was awarded a $43,344 U.S. Department of Justice Community Policing Development Micro Grant. Four “IF Project” Youth and Parent workshops were held by the Tacoma Police Department in partnership with Common Voice, along with two community youth summits which were hosted by the Tacoma Police Department and the Neighborhood and Community Services Department. Green River Water Filtration Plant Construction on the Green River Filtration Facility continued through the year, and reached the point of substantial completion when filtered water entered the system on December 16, 2014. This project began construction in May 2012, and is expected to be in service in May 2015. In addition to satisfying regulatory requirements, the project will substantially improve the quality and reliability of Tacoma’s primary water supply, and that of Tacoma Water’s Regional Water Supply System Partners, who are funding approximately one-third of the project costs. Total project costs as of 12/31/2014 were $187 million. The project budget, originally estimated at $211.0 million, has been lowered to $190 million due to a favorable competitive bidding climate and high quality project management.
Introductory Section, 1-3

THIS PAGE LEFT INTENTIONALLY BLANK
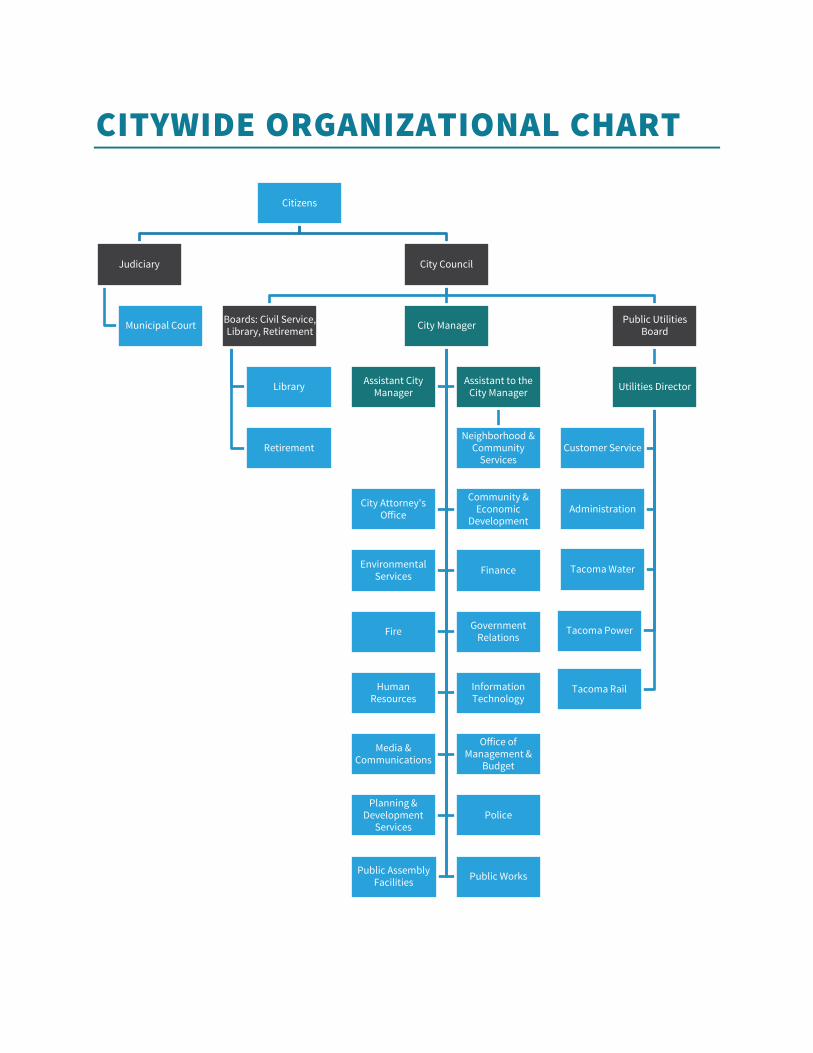
CITYWIDE ORGANIZATIONAL CHART
Citizens
Judiciary
Municipal Court
City Council
Boards: Civil Service, Library, Retirement
Library
Retirement
City Manager
Assistant City Manager
Assistant to the City Manager
Neighborhood & Community
Services
City Attorney's Office
Community & Economic
Development
Environmental Services Finance
Fire Government Relations
Human Resources
Information Technology
Media & Communications
Office of Management &
Budget
Planning & Development
Services Police
Public Assembly Facilities Public Works
Public Utilities Board
Utilities Director
Customer Service
Tacoma Power
Tacoma Water
Tacoma Rail
Administration
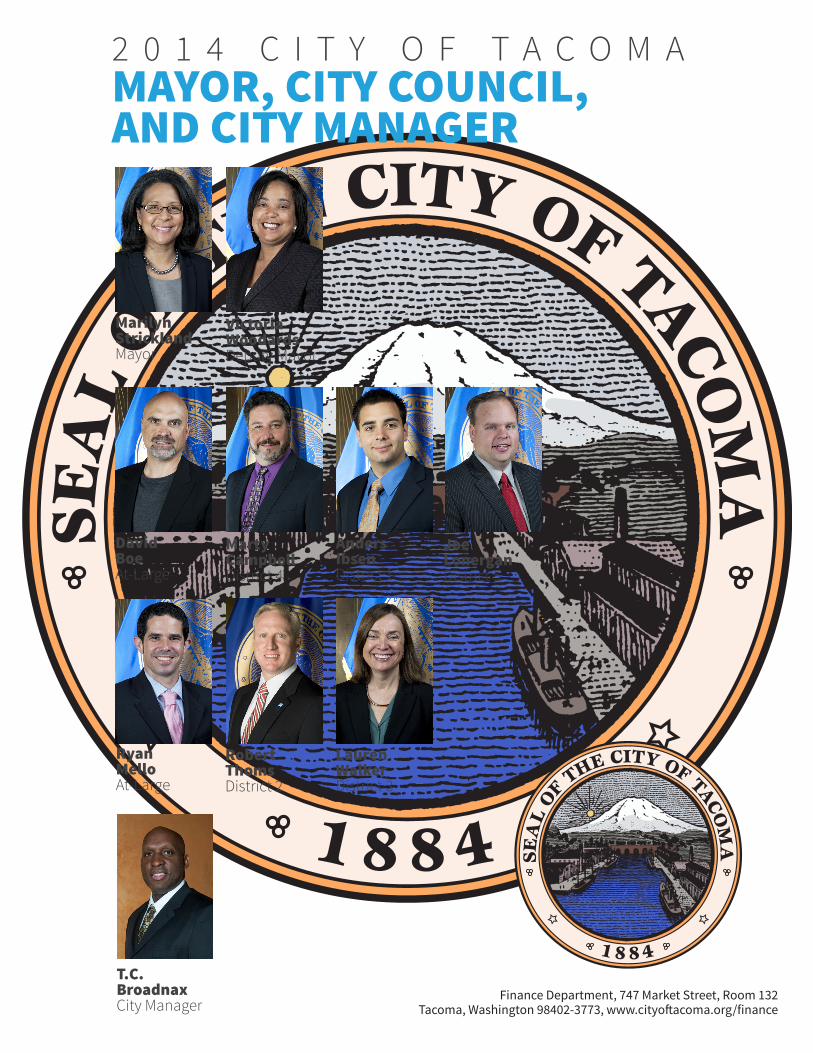
Marilyn StricklandMayor
Victoria WoodardsDeputy Mayor
2 0 1 4 C I T Y O F T A C O M AMAYOR, CITY COUNCIL,AND CITY MANAGER
T.C. BroadnaxCity Manager
David Boe At-Large
MartyCampbellDistrict 4
Anders Ibsen District 1
JoeLonerganDistrict 5
RyanMelloAt-Large
Robert ThomsDistrict 2
Lauren Walker District 3
Finance Department, 747 Market Street, Room 132Tacoma, Washington 98402-3773, www.cityoftacoma.org/finance
2014 Comprehensive Annual Financial Report City of Tacoma, Washington
Introductory Section, 1-9
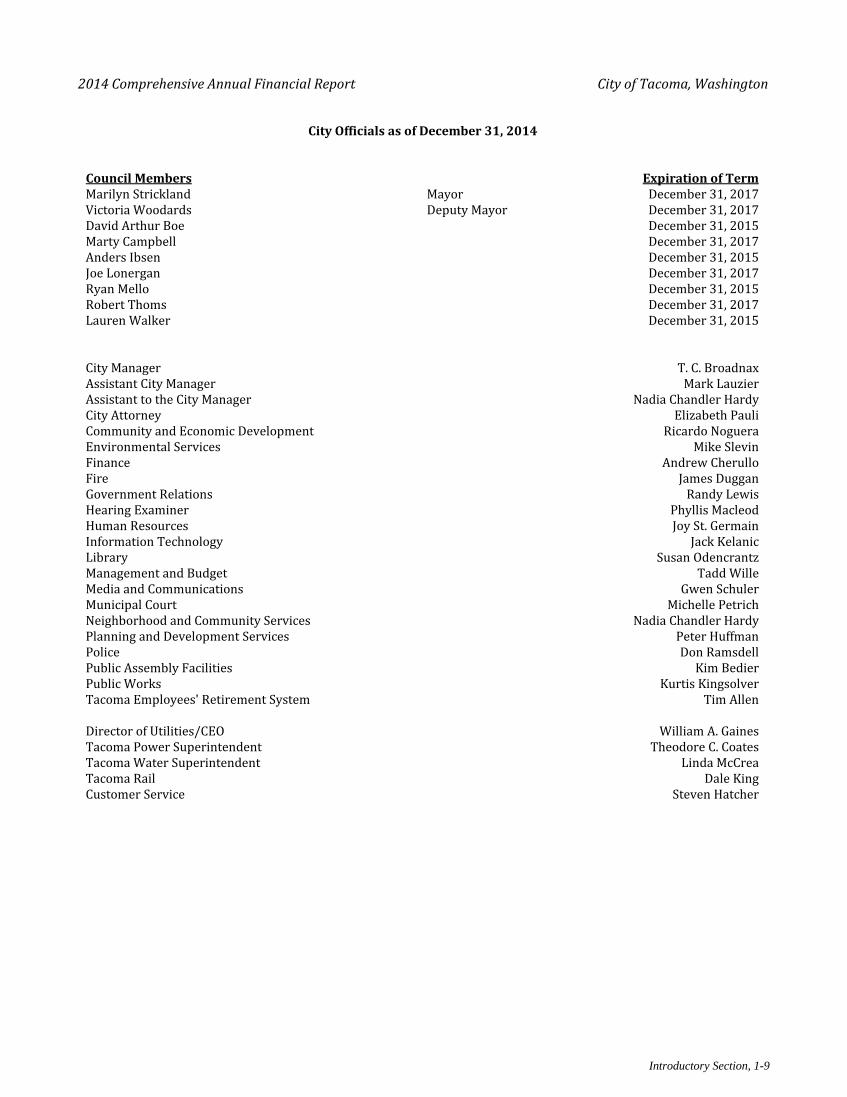
Council Members Expiration of TermMarilyn Strickland Mayor December 31, 2017Victoria Woodards Deputy Mayor December 31, 2017David Arthur Boe December 31, 2015Marty Campbell December 31, 2017Anders Ibsen December 31, 2015Joe Lonergan December 31, 2017Ryan Mello December 31, 2015Robert Thoms December 31, 2017Lauren Walker December 31, 2015
City Manager T. C. BroadnaxAssistant City Manager Mark LauzierAssistant to the City Manager Nadia Chandler HardyCity Attorney Elizabeth PauliCommunity and Economic Development Ricardo NogueraEnvironmental Services Mike SlevinFinance Andrew CherulloFire James DugganGovernment Relations Randy LewisHearing Examiner Phyllis MacleodHuman Resources Joy St. GermainInformation Technology Jack KelanicLibrary Susan OdencrantzManagement and Budget Tadd WilleMedia and Communications Gwen SchulerMunicipal Court Michelle PetrichNeighborhood and Community Services Nadia Chandler HardyPlanning and Development Services Peter HuffmanPolice Don RamsdellPublic Assembly Facilities Kim BedierPublic Works Kurtis KingsolverTacoma Employees' Retirement System Tim Allen
Director of Utilities/CEO William A. GainesTacoma Power Superintendent Theodore C. CoatesTacoma Water Superintendent Linda McCreaTacoma Rail Dale KingCustomer Service Steven Hatcher
City Officials as of December 31, 2014

THIS PAGE LEFT INTENTIONALLY BLANK
SECTION 2
FINANCIAL SECTION INDEPENDENT AUDITOR’S REPORT
MANAGEMENT’S DISCUSSION AND ANALYSIS BASIC FINANCIAL STATEMENTS
REQUIRED SUPPLEMENTARY INFORMATION COMBINING STATEMENTS—NON-MAJOR FUNDS

THIS PAGE LEFT INTENTIONALLY BLANK
THIS PAGE LEFT INTENTIONALLY BLANK
2014 Comprehensive Annual Financial Report City of Tacoma, Washington
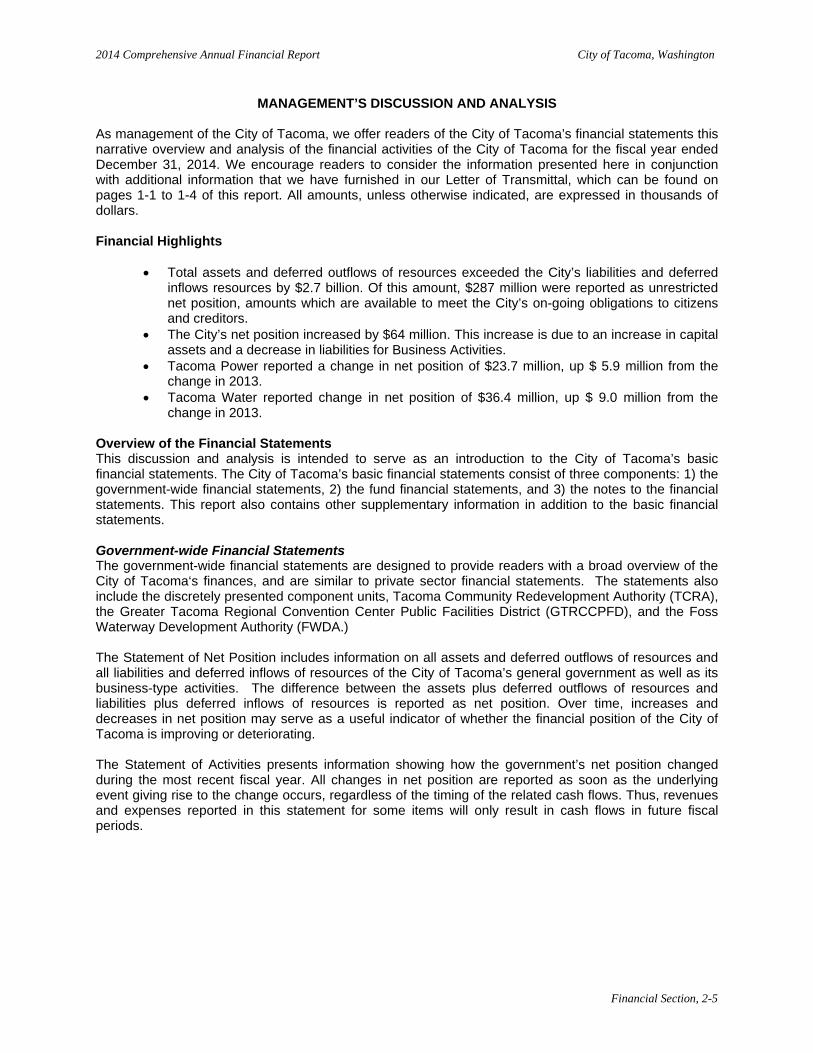
MANAGEMENT’S DISCUSSION AND ANALYSIS As management of the City of Tacoma, we offer readers of the City of Tacoma’s financial statements this narrative overview and analysis of the financial activities of the City of Tacoma for the fiscal year ended December 31, 2014. We encourage readers to consider the information presented here in conjunction with additional information that we have furnished in our Letter of Transmittal, which can be found on pages 1-1 to 1-4 of this report. All amounts, unless otherwise indicated, are expressed in thousands of dollars. Financial Highlights
• Total assets and deferred outflows of resources exceeded the City’s liabilities and deferred inflows resources by $2.7 billion. Of this amount, $287 million were reported as unrestricted net position, amounts which are available to meet the City’s on-going obligations to citizens and creditors.
• The City’s net position increased by $64 million. This increase is due to an increase in capital assets and a decrease in liabilities for Business Activities.
• Tacoma Power reported a change in net position of $23.7 million, up $ 5.9 million from the change in 2013.
• Tacoma Water reported change in net position of $36.4 million, up $ 9.0 million from the change in 2013.
Overview of the Financial Statements This discussion and analysis is intended to serve as an introduction to the City of Tacoma’s basic financial statements. The City of Tacoma’s basic financial statements consist of three components: 1) the government-wide financial statements, 2) the fund financial statements, and 3) the notes to the financial statements. This report also contains other supplementary information in addition to the basic financial statements. Government-wide Financial Statements The government-wide financial statements are designed to provide readers with a broad overview of the City of Tacoma‘s finances, and are similar to private sector financial statements. The statements also include the discretely presented component units, Tacoma Community Redevelopment Authority (TCRA), the Greater Tacoma Regional Convention Center Public Facilities District (GTRCCPFD), and the Foss Waterway Development Authority (FWDA.) The Statement of Net Position includes information on all assets and deferred outflows of resources and all liabilities and deferred inflows of resources of the City of Tacoma’s general government as well as its business-type activities. The difference between the assets plus deferred outflows of resources and liabilities plus deferred inflows of resources is reported as net position. Over time, increases and decreases in net position may serve as a useful indicator of whether the financial position of the City of Tacoma is improving or deteriorating. The Statement of Activities presents information showing how the government’s net position changed during the most recent fiscal year. All changes in net position are reported as soon as the underlying event giving rise to the change occurs, regardless of the timing of the related cash flows. Thus, revenues and expenses reported in this statement for some items will only result in cash flows in future fiscal periods.
Financial Section, 2-5
2014 Comprehensive Annual Financial Report City of Tacoma, Washington
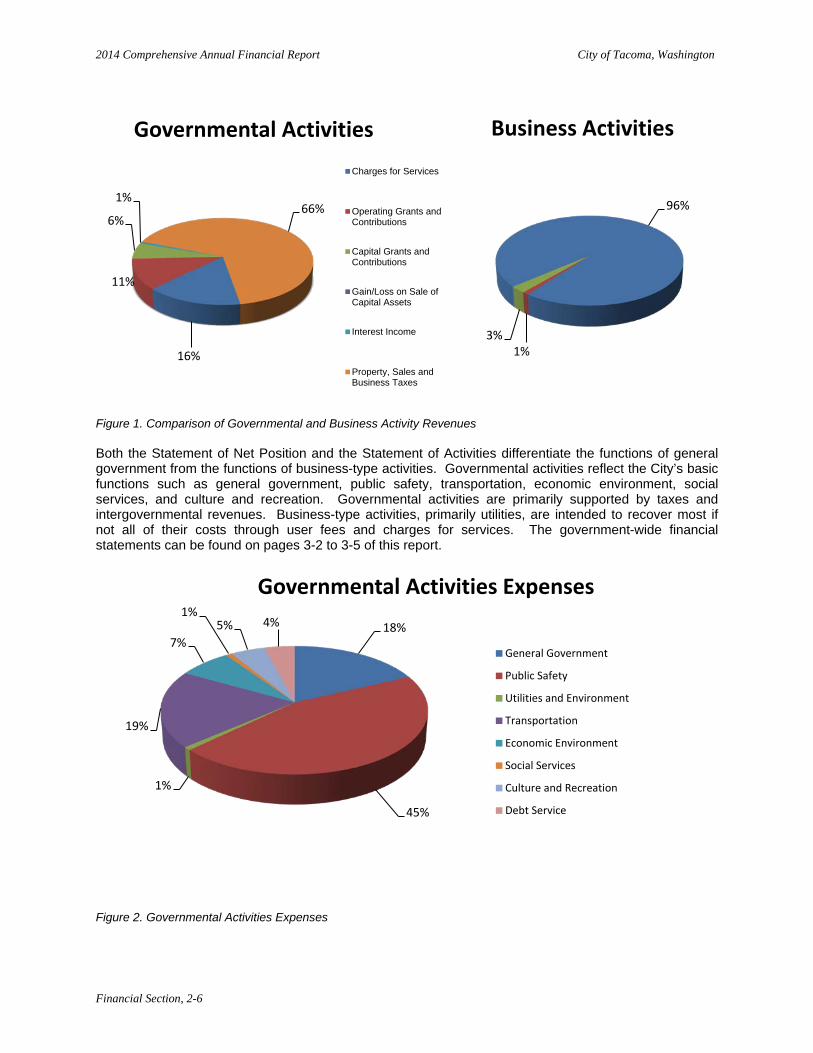
Figure 1. Comparison of Governmental and Business Activity Revenues Both the Statement of Net Position and the Statement of Activities differentiate the functions of general government from the functions of business-type activities. Governmental activities reflect the City’s basic functions such as general government, public safety, transportation, economic environment, social services, and culture and recreation. Governmental activities are primarily supported by taxes and intergovernmental revenues. Business-type activities, primarily utilities, are intended to recover most if not all of their costs through user fees and charges for services. The government-wide financial statements can be found on pages 3-2 to 3-5 of this report.
Figure 2. Governmental Activities Expenses
16%
11%
6%
1% 66%
Governmental Activities Charges for Services
Operating Grants andContributions
Capital Grants andContributions
Gain/Loss on Sale ofCapital Assets
Interest Income
Property, Sales andBusiness Taxes
96%
1% 3%
Business Activities
18%
45%
1%
19%
7%
1% 5% 4%
Governmental Activities Expenses
General Government
Public Safety
Utilities and Environment
Transportation
Economic Environment
Social Services
Culture and Recreation
Debt Service
Financial Section, 2-6
2014 Comprehensive Annual Financial Report City of Tacoma, Washington
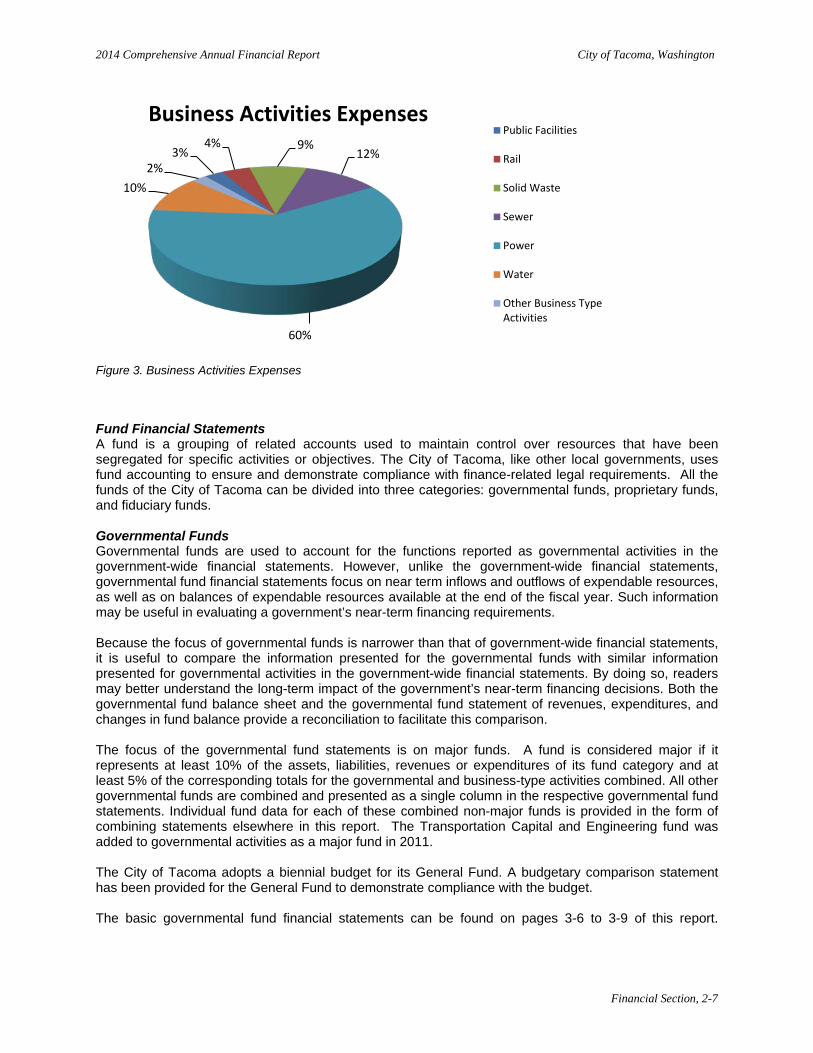
Figure 3. Business Activities Expenses
Fund Financial Statements A fund is a grouping of related accounts used to maintain control over resources that have been segregated for specific activities or objectives. The City of Tacoma, like other local governments, uses fund accounting to ensure and demonstrate compliance with finance-related legal requirements. All the funds of the City of Tacoma can be divided into three categories: governmental funds, proprietary funds, and fiduciary funds. Governmental Funds Governmental funds are used to account for the functions reported as governmental activities in the government-wide financial statements. However, unlike the government-wide financial statements, governmental fund financial statements focus on near term inflows and outflows of expendable resources, as well as on balances of expendable resources available at the end of the fiscal year. Such information may be useful in evaluating a government’s near-term financing requirements. Because the focus of governmental funds is narrower than that of government-wide financial statements, it is useful to compare the information presented for the governmental funds with similar information presented for governmental activities in the government-wide financial statements. By doing so, readers may better understand the long-term impact of the government’s near-term financing decisions. Both the governmental fund balance sheet and the governmental fund statement of revenues, expenditures, and changes in fund balance provide a reconciliation to facilitate this comparison. The focus of the governmental fund statements is on major funds. A fund is considered major if it represents at least 10% of the assets, liabilities, revenues or expenditures of its fund category and at least 5% of the corresponding totals for the governmental and business-type activities combined. All other governmental funds are combined and presented as a single column in the respective governmental fund statements. Individual fund data for each of these combined non-major funds is provided in the form of combining statements elsewhere in this report. The Transportation Capital and Engineering fund was added to governmental activities as a major fund in 2011. The City of Tacoma adopts a biennial budget for its General Fund. A budgetary comparison statement has been provided for the General Fund to demonstrate compliance with the budget. The basic governmental fund financial statements can be found on pages 3-6 to 3-9 of this report.
3% 4% 9%
12%
60%
10% 2%
Business Activities Expenses Public Facilities
Rail
Solid Waste
Sewer
Power
Water
Other Business TypeActivities
Financial Section, 2-7
2014 Comprehensive Annual Financial Report City of Tacoma, Washington
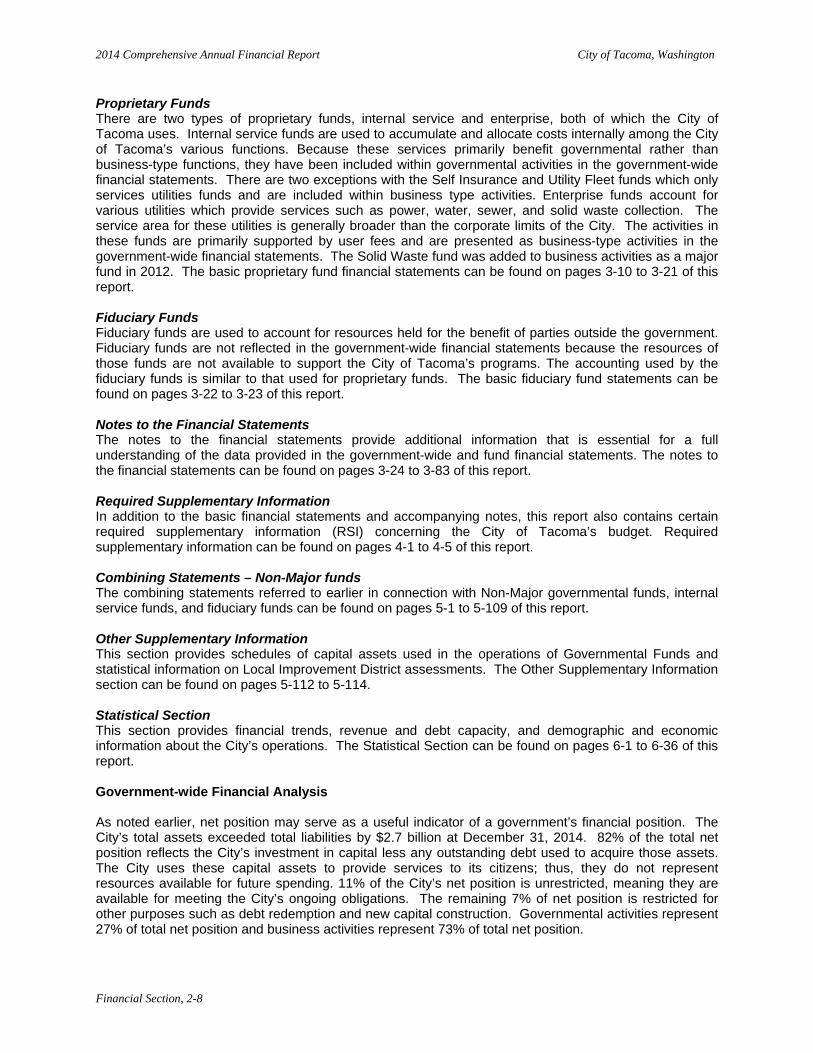
Proprietary Funds There are two types of proprietary funds, internal service and enterprise, both of which the City of Tacoma uses. Internal service funds are used to accumulate and allocate costs internally among the City of Tacoma’s various functions. Because these services primarily benefit governmental rather than business-type functions, they have been included within governmental activities in the government-wide financial statements. There are two exceptions with the Self Insurance and Utility Fleet funds which only services utilities funds and are included within business type activities. Enterprise funds account for various utilities which provide services such as power, water, sewer, and solid waste collection. The service area for these utilities is generally broader than the corporate limits of the City. The activities in these funds are primarily supported by user fees and are presented as business-type activities in the government-wide financial statements. The Solid Waste fund was added to business activities as a major fund in 2012. The basic proprietary fund financial statements can be found on pages 3-10 to 3-21 of this report. Fiduciary Funds Fiduciary funds are used to account for resources held for the benefit of parties outside the government. Fiduciary funds are not reflected in the government-wide financial statements because the resources of those funds are not available to support the City of Tacoma’s programs. The accounting used by the fiduciary funds is similar to that used for proprietary funds. The basic fiduciary fund statements can be found on pages 3-22 to 3-23 of this report. Notes to the Financial Statements The notes to the financial statements provide additional information that is essential for a full understanding of the data provided in the government-wide and fund financial statements. The notes to the financial statements can be found on pages 3-24 to 3-83 of this report. Required Supplementary Information In addition to the basic financial statements and accompanying notes, this report also contains certain required supplementary information (RSI) concerning the City of Tacoma’s budget. Required supplementary information can be found on pages 4-1 to 4-5 of this report. Combining Statements – Non-Major funds The combining statements referred to earlier in connection with Non-Major governmental funds, internal service funds, and fiduciary funds can be found on pages 5-1 to 5-109 of this report. Other Supplementary Information This section provides schedules of capital assets used in the operations of Governmental Funds and statistical information on Local Improvement District assessments. The Other Supplementary Information section can be found on pages 5-112 to 5-114. Statistical Section This section provides financial trends, revenue and debt capacity, and demographic and economic information about the City’s operations. The Statistical Section can be found on pages 6-1 to 6-36 of this report. Government-wide Financial Analysis As noted earlier, net position may serve as a useful indicator of a government’s financial position. The City’s total assets exceeded total liabilities by $2.7 billion at December 31, 2014. 82% of the total net position reflects the City’s investment in capital less any outstanding debt used to acquire those assets. The City uses these capital assets to provide services to its citizens; thus, they do not represent resources available for future spending. 11% of the City’s net position is unrestricted, meaning they are available for meeting the City’s ongoing obligations. The remaining 7% of net position is restricted for other purposes such as debt redemption and new capital construction. Governmental activities represent 27% of total net position and business activities represent 73% of total net position.
Financial Section, 2-8
2014 Comprehensive Annual Financial Report City of Tacoma, Washington
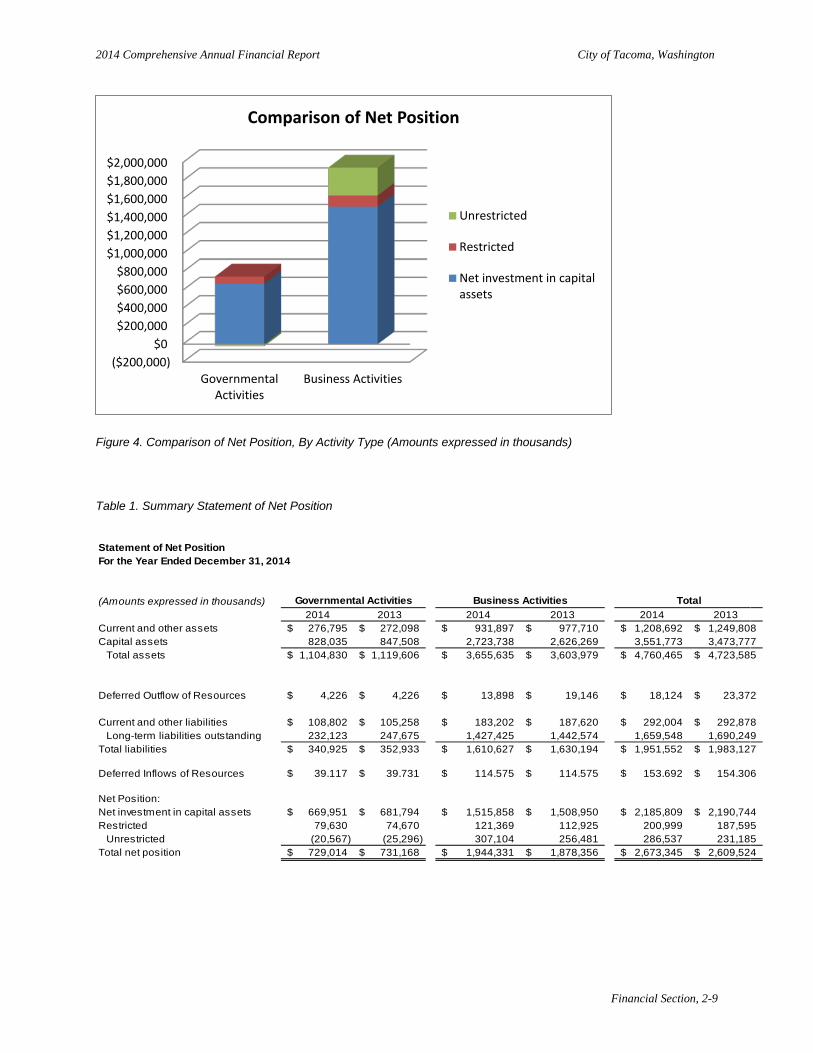
Figure 4. Comparison of Net Position, By Activity Type (Amounts expressed in thousands)
Table 1. Summary Statement of Net Position Statement of Net PositionFor the Year Ended December 31, 2014
(Amounts expressed in thousands)2014 2013 2014 2013 2014 2013
Current and other assets 276,795$ 272,098$ 931,897$ 977,710$ 1,208,692$ 1,249,808$ Capital assets 828,035 847,508 2,723,738 2,626,269 3,551,773 3,473,777
Total assets 1,104,830$ 1,119,606$ 3,655,635$ 3,603,979$ 4,760,465$ 4,723,585$
Deferred Outflow of Resources 4,226$ 4,226$ 13,898$ 19,146$ 18,124$ 23,372$
Current and other liabilities 108,802$ 105,258$ 183,202$ 187,620$ 292,004$ 292,878$ Long-term liabilities outstanding 232,123 247,675 1,427,425 1,442,574 1,659,548 1,690,249
Total liabilities 340,925$ 352,933$ 1,610,627$ 1,630,194$ 1,951,552$ 1,983,127$
Deferred Inflows of Resources 39,117$ 39,731$ 114,575$ 114,575$ 153,692$ 154,306$
Net Position:Net investment in capital assets 669,951$ 681,794$ 1,515,858$ 1,508,950$ 2,185,809$ 2,190,744$ Restricted 79,630 74,670 121,369 112,925 200,999 187,595
Unrestricted (20,567) (25,296) 307,104 256,481 286,537 231,185 Total net position 729,014$ 731,168$ 1,944,331$ 1,878,356$ 2,673,345$ 2,609,524$
Governmental Activities Business Activities Total
($200,000)$0
$200,000$400,000$600,000$800,000
$1,000,000$1,200,000$1,400,000$1,600,000$1,800,000$2,000,000
GovernmentalActivities
Business Activities
Comparison of Net Position
Unrestricted
Restricted
Net investment in capitalassets
Financial Section, 2-9
2014 Comprehensive Annual Financial Report City of Tacoma, Washington
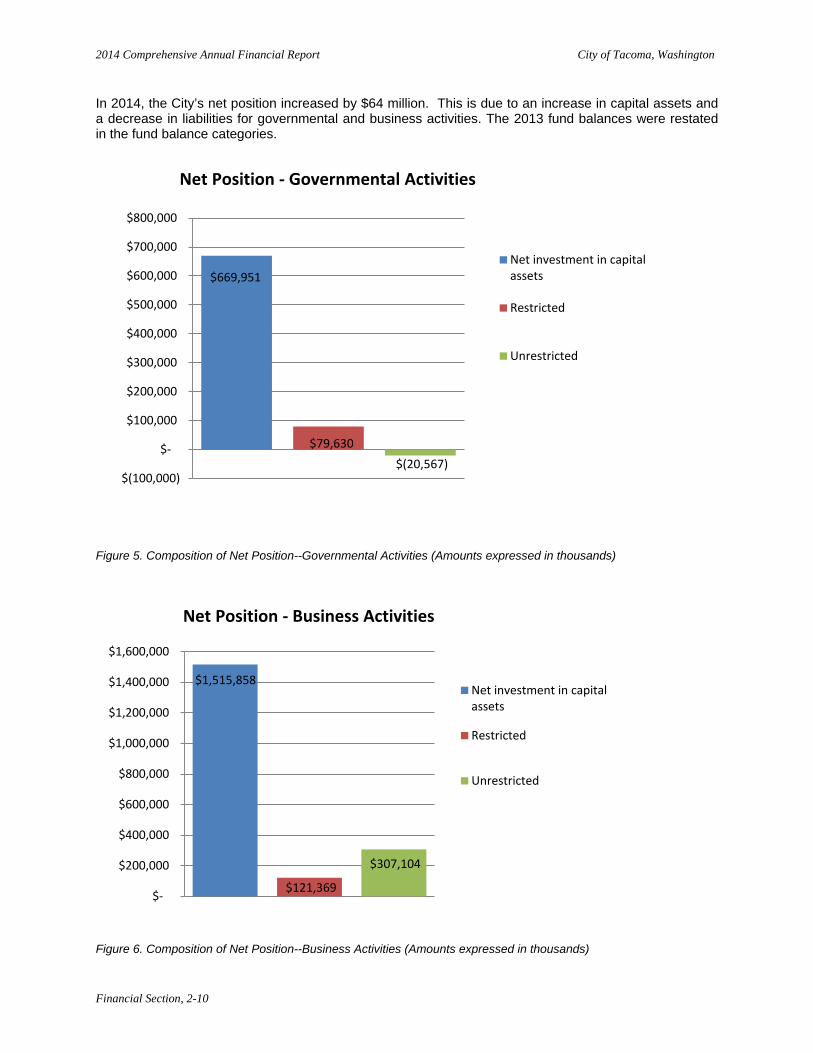
In 2014, the City’s net position increased by $64 million. This is due to an increase in capital assets and a decrease in liabilities for governmental and business activities. The 2013 fund balances were restated in the fund balance categories.
Figure 5. Composition of Net Position--Governmental Activities (Amounts expressed in thousands)
Figure 6. Composition of Net Position--Business Activities (Amounts expressed in thousands)
$669,951
$79,630 $(20,567)
$(100,000)
$-
$100,000
$200,000
$300,000
$400,000
$500,000
$600,000
$700,000
$800,000
Net investment in capitalassets
Restricted
Unrestricted
Net Position - Governmental Activities
$1,515,858
$121,369
$307,104
$-
$200,000
$400,000
$600,000
$800,000
$1,000,000
$1,200,000
$1,400,000
$1,600,000
Net investment in capitalassets
Restricted
Unrestricted
Net Position - Business Activities
Financial Section, 2-10
2014 Comprehensive Annual Financial Report City of Tacoma, Washington
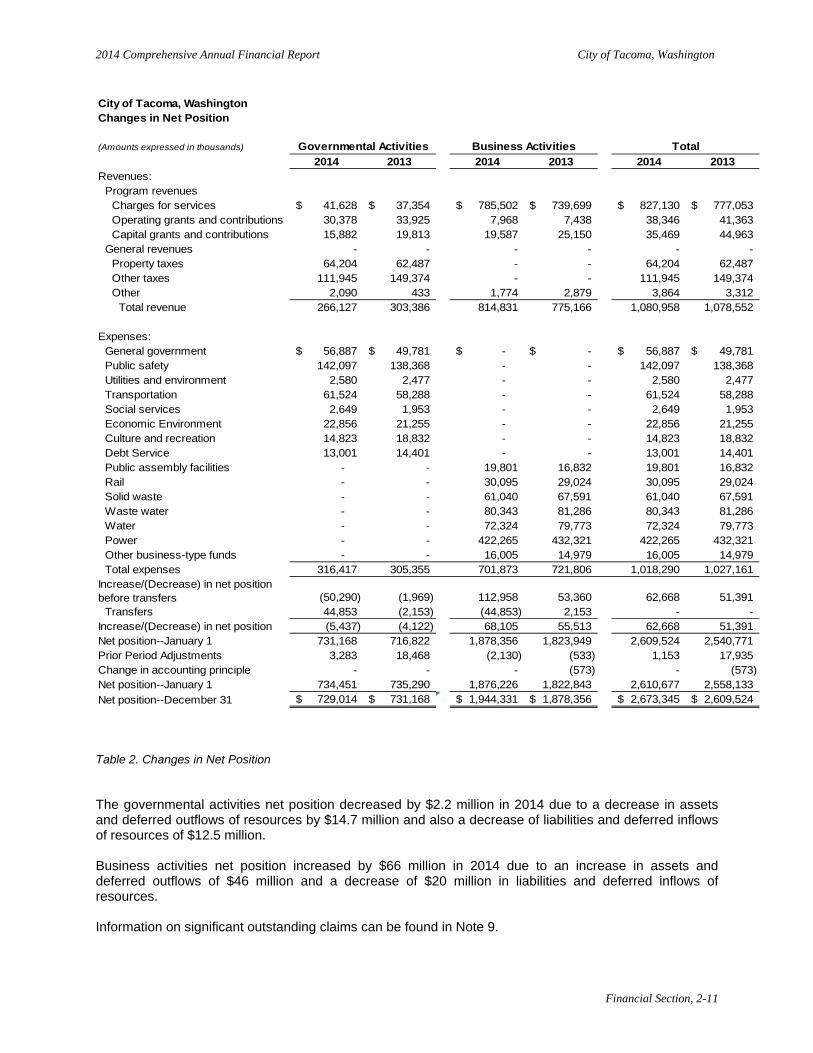
City of Tacoma, WashingtonChanges in Net Position
(Amounts expressed in thousands)
2014 2013 2014 2013 2014 2013Revenues:
Program revenuesCharges for services 41,628$ 37,354$ 785,502$ 739,699$ 827,130$ 777,053$ Operating grants and contributions 30,378 33,925 7,968 7,438 38,346 41,363 Capital grants and contributions 15,882 19,813 19,587 25,150 35,469 44,963
General revenues - - - - - - Property taxes 64,204 62,487 - - 64,204 62,487 Other taxes 111,945 149,374 - - 111,945 149,374 Other 2,090 433 1,774 2,879 3,864 3,312
Total revenue 266,127 303,386 814,831 775,166 1,080,958 1,078,552
Expenses:General government 56,887$ 49,781$ -$ -$ 56,887$ 49,781$ Public safety 142,097 138,368 - - 142,097 138,368 Utilities and environment 2,580 2,477 - - 2,580 2,477 Transportation 61,524 58,288 - - 61,524 58,288 Social services 2,649 1,953 - - 2,649 1,953 Economic Environment 22,856 21,255 - - 22,856 21,255 Culture and recreation 14,823 18,832 - - 14,823 18,832 Debt Service 13,001 14,401 - - 13,001 14,401 Public assembly facilities - - 19,801 16,832 19,801 16,832 Rail - - 30,095 29,024 30,095 29,024 Solid waste - - 61,040 67,591 61,040 67,591 Waste water - - 80,343 81,286 80,343 81,286 Water - - 72,324 79,773 72,324 79,773 Power - - 422,265 432,321 422,265 432,321 Other business-type funds - - 16,005 14,979 16,005 14,979 Total expenses 316,417 305,355 701,873 721,806 1,018,290 1,027,161
Increase/(Decrease) in net position before transfers (50,290) (1,969) 112,958 53,360 62,668 51,391
Transfers 44,853 (2,153) (44,853) 2,153 - - Increase/(Decrease) in net position (5,437) (4,122) 68,105 55,513 62,668 51,391 Net position--January 1 731,168 716,822 1,878,356 1,823,949 2,609,524 2,540,771 Prior Period Adjustments 3,283 18,468 (2,130) (533) 1,153 17,935 Change in accounting principle - - - (573) - (573) Net position--January 1 734,451 735,290 1,876,226 1,822,843 2,610,677 2,558,133 Net position--December 31 729,014$ 731,168$ 1,944,331$ 1,878,356$ 2,673,345$ 2,609,524$
Governmental Activities Business Activities Total
Table 2. Changes in Net Position The governmental activities net position decreased by $2.2 million in 2014 due to a decrease in assets and deferred outflows of resources by $14.7 million and also a decrease of liabilities and deferred inflows of resources of $12.5 million. Business activities net position increased by $66 million in 2014 due to an increase in assets and deferred outflows of $46 million and a decrease of $20 million in liabilities and deferred inflows of resources. Information on significant outstanding claims can be found in Note 9.
Financial Section, 2-11
2014 Comprehensive Annual Financial Report City of Tacoma, Washington
Financial Analysis of the City’s Fund Statements The City prepares fund statements for governmental funds and for proprietary funds. Governmental Fund Statements Fund balance for the City’s General Fund had no significant change. Fund balance for the Transportation Capital and Engineering fund increased by $7.9 million in 2014 from a decrease in liabilities. Fund balance for the Non-Major governmental funds, which include debt service funds, capital projects funds, and special revenue funds, decreased by $4.7 million from an increase in liabilities. Fund Balances At December 31, 2014, the City’s governmental funds reported combined ending fund balances of $164 million. Of this amount, $16.9 million is nonspendable, either due to its form or legal constraints. $79.6 million is restricted for specific programs by external constraints. $1.2 million is committed for specific purposes as approved by City Council. $23.7 million is assigned to specific purposes by management and the remaining $42.6 million is unassigned. Proprietary Fund Statements Total net position for the enterprise funds increased by $64.9 million in 2014. The Power, Water, Solid Waste and Sewer utilities make up the majority of the proprietary funds. Activity in these utilities was the primary driver for the change in the net position. The Power fund had an increase in net position of $23.7 million from a decrease in liabilities. The Water fund had a significant increase in their net position of $36.4 million due to an increase in capital construction. The Sewer fund had an increase in net position of $10 million from an increase in revenues. The Solid Waste fund had no significant change in net position. The non-major Enterprise funds had a decrease in net position of $4.9 million from a decrease in revenues and slight increase in increase liabilities. The total net position for internal service funds’ increased by $2.8 million in 2014. This is the result of an increase of $3.4 million in assets while also having an increase of liabilities of about $500 thousand. General Fund Budgetary Highlights In 2014, the City made budgetary adjustments as part of the 2013-2014 Mid-Biennium Budget Amendment. Budget revisions included a $4.1 million reduction in the General Fund to move appropriations to the Transportation Benefit District Fund in 2013. At mid biennium, a $2.1 million increase to the General Fund was made for various expenditures and an additional increase of $2.1 million was made in 2014 for various grants and contributions. At biennium-end 2014, the General Fund revenues came in under budget by $39.7 million and expenditures came in under budget by $19.9 million. $42 million in transfers were made into the General Fund along with $1.3 million in other financing sources which made the net change in fund balance increase by $23.5 million. Transfers increased due to the re-classification of Gross Earnings Taxes from Taxes to Transfers in 2014. The City’s budget is a two year biennium budget which begins every odd year. Capital Assets, Infrastructure, Bond Debt Administration Capital Assets The City of Tacoma’s capital assets net of accumulated depreciation for its governmental and business type activities as of December 31, 2014 is $3.6 billion. This investment in capital assets includes land, construction in process, property, plant and equipment, and infrastructure. The vast majority of this amount represents assets held by the City’s various utilities and infrastructure.
Financial Section, 2-12
2014 Comprehensive Annual Financial Report City of Tacoma, Washington
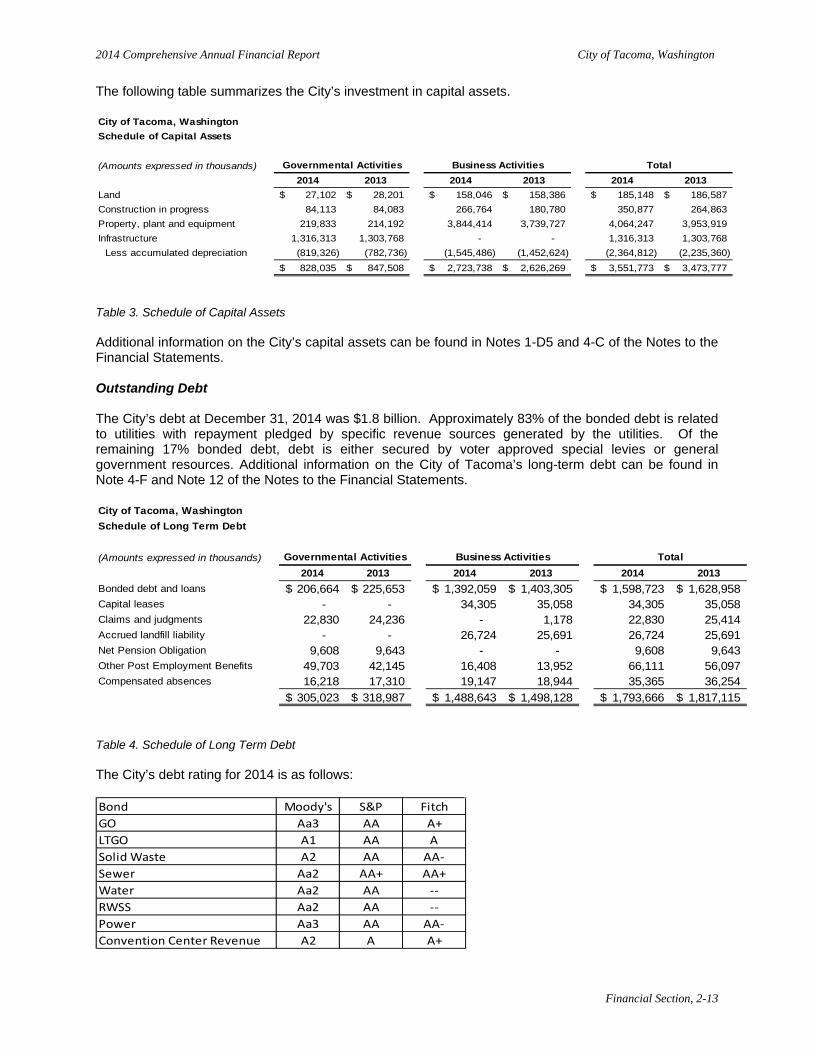
The following table summarizes the City’s investment in capital assets. City of Tacoma, WashingtonSchedule of Capital Assets
(Amounts expressed in thousands)2014 2013 2014 2013 2014 2013
Land 27,102$ 28,201$ 158,046$ 158,386$ 185,148$ 186,587$ Construction in progress 84,113 84,083 266,764 180,780 350,877 264,863 Property, plant and equipment 219,833 214,192 3,844,414 3,739,727 4,064,247 3,953,919 Infrastructure 1,316,313 1,303,768 - - 1,316,313 1,303,768
Less accumulated depreciation (819,326) (782,736) (1,545,486) (1,452,624) (2,364,812) (2,235,360) 828,035$ 847,508$ 2,723,738$ 2,626,269$ 3,551,773$ 3,473,777$
Governmental Activities Business Activities Total
Table 3. Schedule of Capital Assets Additional information on the City’s capital assets can be found in Notes 1-D5 and 4-C of the Notes to the Financial Statements. Outstanding Debt The City’s debt at December 31, 2014 was $1.8 billion. Approximately 83% of the bonded debt is related to utilities with repayment pledged by specific revenue sources generated by the utilities. Of the remaining 17% bonded debt, debt is either secured by voter approved special levies or general government resources. Additional information on the City of Tacoma’s long-term debt can be found in Note 4-F and Note 12 of the Notes to the Financial Statements. City of Tacoma, WashingtonSchedule of Long Term Debt
(Amounts expressed in thousands)2014 2013 2014 2013 2014 2013
Bonded debt and loans 206,664$ 225,653$ 1,392,059$ 1,403,305$ 1,598,723$ 1,628,958$ Capital leases - - 34,305 35,058 34,305 35,058 Claims and judgments 22,830 24,236 - 1,178 22,830 25,414 Accrued landfill liability - - 26,724 25,691 26,724 25,691 Net Pension Obligation 9,608 9,643 - - 9,608 9,643 Other Post Employment Benefits 49,703 42,145 16,408 13,952 66,111 56,097 Compensated absences 16,218 17,310 19,147 18,944 35,365 36,254
305,023$ 318,987$ 1,488,643$ 1,498,128$ 1,793,666$ 1,817,115$
Governmental Activities Business Activities Total
Table 4. Schedule of Long Term Debt The City’s debt rating for 2014 is as follows: Bond Moody's S&P FitchGO Aa3 AA A+LTGO A1 AA ASolid Waste A2 AA AA-Sewer Aa2 AA+ AA+Water Aa2 AA --RWSS Aa2 AA --Power Aa3 AA AA-Convention Center Revenue A2 A A+
Financial Section, 2-13
2014 Comprehensive Annual Financial Report City of Tacoma, Washington
Economic Factors The following economic factors currently affect the City of Tacoma:
• The unemployment rate for the City of Tacoma is currently 6.1% which is a decrease of 1.3% from 2013.
• Taxable property value has increased by $1.3 billion over 2013, which is a 7.8% increase. • Housing prices and sales have continued to improve and show gains over the prior year. • The Transportation Benefit District, which was created in 2012 to collect motor vehicle license
fees, has been collecting revenues as projected. The 2015-2016 biennium budget is $4.1 million. During the current fiscal year, the unassigned fund balance in the general fund was $48.3 million, up $5.2 million from 2013. There is still a projected deficit of $6 million for the 2015-2016 biennium. The City will continue to evaluate revenues and expenditures during the 2015-2016 budget preparation to produce a balanced budget. Other Considerations In response to the slow economic recovery, the City has taken steps to reduce discretionary spending. General government activities took significant expenditure reductions to bring levels of service to those that are affordable and sustainable. Revenue growth is limited by several citizen initiatives that limit the growth of property tax collections. Requests for Information This financial report is designed to provide a general overview of the City’s finances for all those with an interest in the government’s finances. Questions concerning any of the information provided in this report or requests for additional financial information should be addressed to the City of Tacoma Finance Department, 747 Market Street Room 132, Tacoma, Washington 98402.
Financial Section, 2-14

THIS PAGE LEFT INTENTIONALLY BLANK
2014 Comprehensive Annual Financial Report City of Tacoma, Washington
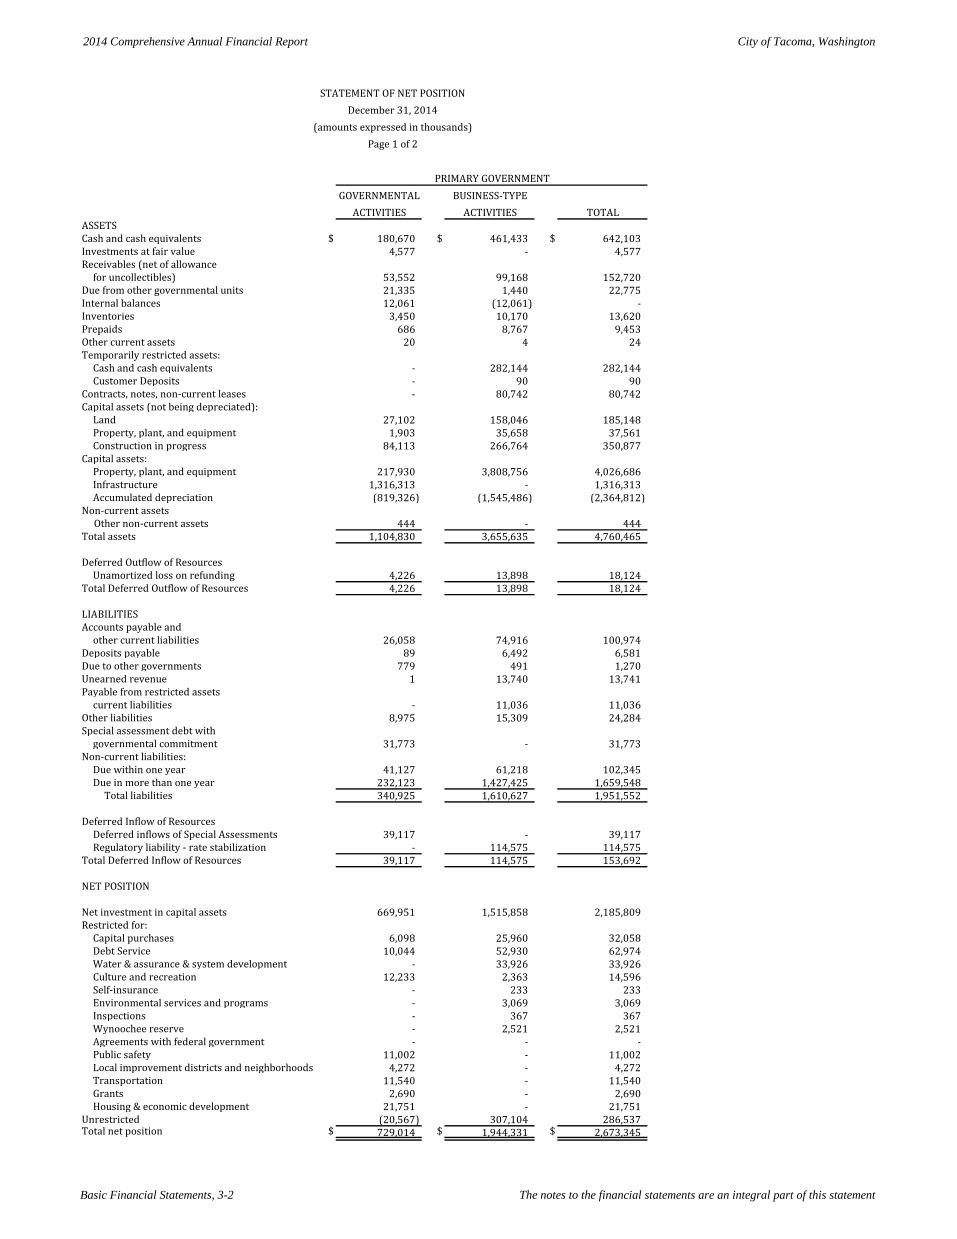
Basic Financial Statements, 3-2 The notes to the financial statements are an integral part of this statement
GOVERNMENTAL BUSINESS-TYPEACTIVITIES ACTIVITIES TOTAL
ASSETSCash and cash equivalents $ 180,670 $ 461,433 $ 642,103 Investments at fair value 4,577 - 4,577 Receivables (net of allowance
for uncollectibles) 53,552 99,168 152,720 Due from other governmental units 21,335 1,440 22,775 Internal balances 12,061 (12,061) - Inventories 3,450 10,170 13,620 Prepaids 686 8,767 9,453 Other current assets 20 4 24 Temporarily restricted assets:
Cash and cash equivalents - 282,144 282,144 Customer Deposits - 90 90
Contracts, notes, non-current leases - 80,742 80,742 Capital assets (not being depreciated):
Land 27,102 158,046 185,148 Property, plant, and equipment 1,903 35,658 37,561 Construction in progress 84,113 266,764 350,877
Capital assets:Property, plant, and equipment 217,930 3,808,756 4,026,686 Infrastructure 1,316,313 - 1,316,313 Accumulated depreciation (819,326) (1,545,486) (2,364,812)
Non-current assets Other non-current assets 444 - 444 Total assets 1,104,830 3,655,635 4,760,465
Deferred Outflow of ResourcesUnamortized loss on refunding 4,226 13,898 18,124
Total Deferred Outflow of Resources 4,226 13,898 18,124
LIABILITIESAccounts payable and
other current liabilities 26,058 74,916 100,974 Deposits payable 89 6,492 6,581 Due to other governments 779 491 1,270 Unearned revenue 1 13,740 13,741 Payable from restricted assets
current liabilities - 11,036 11,036 Other liabilities 8,975 15,309 24,284 Special assessment debt with
governmental commitment 31,773 - 31,773 Non-current liabilities:
Due within one year 41,127 61,218 102,345 Due in more than one year 232,123 1,427,425 1,659,548
Total liabilities 340,925 1,610,627 1,951,552
Deferred Inflow of ResourcesDeferred inflows of Special Assessments 39,117 - 39,117 Regulatory liability - rate stabilization - 114,575 114,575
Total Deferred Inflow of Resources 39,117 114,575 153,692
NET POSITION
Net investment in capital assets 669,951 1,515,858 2,185,809 Restricted for:
Capital purchases 6,098 25,960 32,058 Debt Service 10,044 52,930 62,974 Water & assurance & system development - 33,926 33,926 Culture and recreation 12,233 2,363 14,596 Self-insurance - 233 233 Environmental services and programs - 3,069 3,069 Inspections - 367 367 Wynoochee reserve - 2,521 2,521 Agreements with federal government - - - Public safety 11,002 - 11,002 Local improvement districts and neighborhoods 4,272 - 4,272 Transportation 11,540 - 11,540 Grants 2,690 - 2,690 Housing & economic development 21,751 - 21,751
Unrestricted (20,567) 307,104 286,537 Total net position $ 729,014 $ 1,944,331 $ 2,673,345
PRIMARY GOVERNMENT
STATEMENT OF NET POSITIONDecember 31, 2014
(amounts expressed in thousands)Page 1 of 2
2014 Comprehensive Annual Financial Report City of Tacoma, Washington
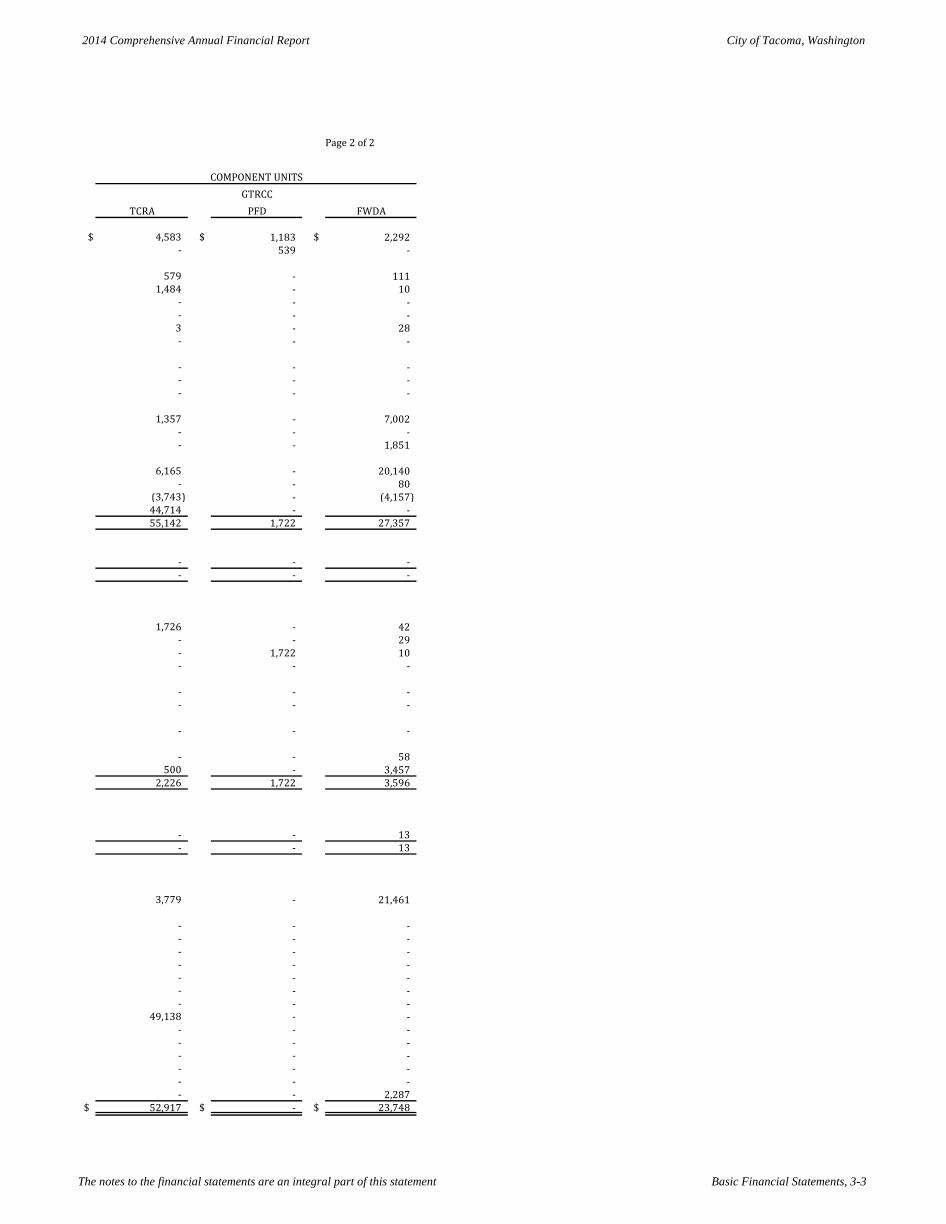
The notes to the financial statements are an integral part of this statement Basic Financial Statements, 3-3
GTRCCTCRA PFD FWDA
$ 4,583 $ 1,183 $ 2,292 - 539 -
579 - 111 1,484 - 10
- - - - - -
3 - 28 - - -
- - - - - - - - -
1,357 - 7,002 - - - - - 1,851
6,165 - 20,140 - - 80
(3,743) - (4,157) 44,714 - - 55,142 1,722 27,357
- - - - - -
1,726 - 42 - - 29 - 1,722 10 - - -
- - - - - -
- - -
- - 58 500 - 3,457
2,226 1,722 3,596
- - 13 - - 13
3,779 - 21,461
- - - - - - - - - - - - - - - - - - - - -
49,138 - - - - - - - - - - - - - - - - - - - 2,287
$ 52,917 $ - $ 23,748
COMPONENT UNITS
Page 2 of 2
2014 Comprehensive Annual Financial Report City of Tacoma, Washington
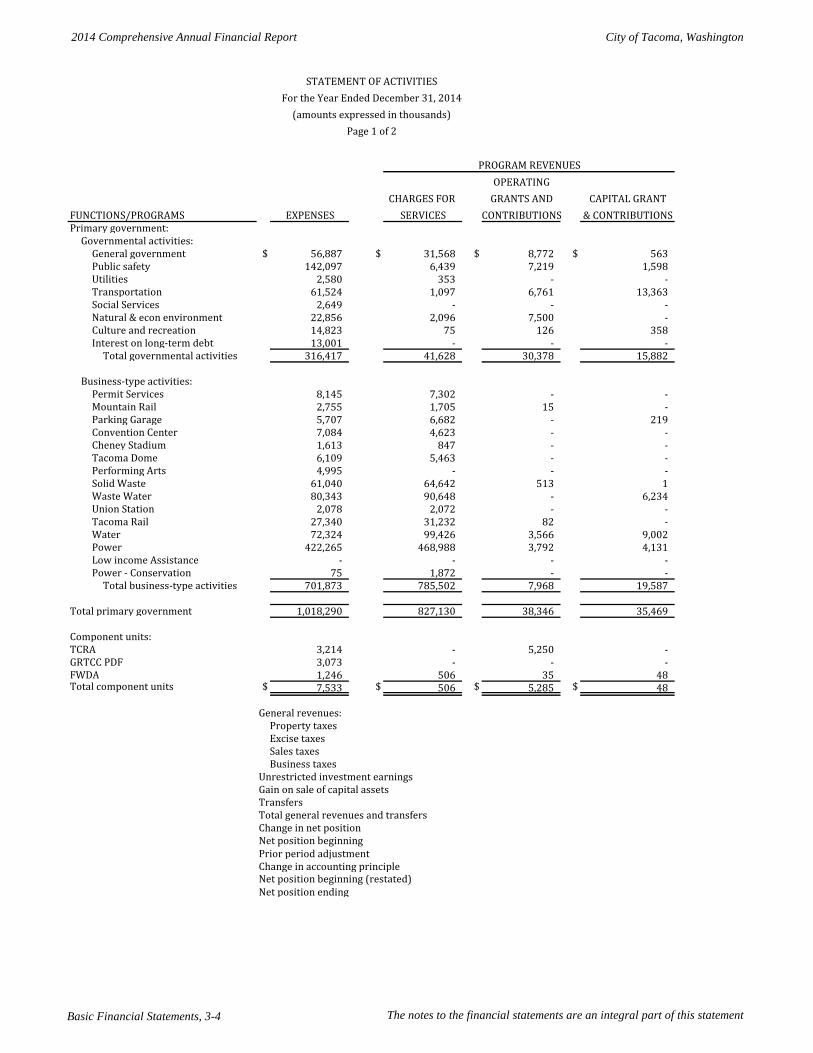
Basic Financial Statements, 3-4 The notes to the financial statements are an integral part of this statement
OPERATINGCHARGES FOR GRANTS AND CAPITAL GRANT
FUNCTIONS/PROGRAMS EXPENSES SERVICES CONTRIBUTIONS & CONTRIBUTIONSPrimary government:
Governmental activities:General government $ 56,887 $ 31,568 $ 8,772 $ 563 Public safety 142,097 6,439 7,219 1,598 Utilities 2,580 353 - - Transportation 61,524 1,097 6,761 13,363 Social Services 2,649 - - - Natural & econ environment 22,856 2,096 7,500 - Culture and recreation 14,823 75 126 358 Interest on long-term debt 13,001 - - -
Total governmental activities 316,417 41,628 30,378 15,882
Business-type activities:Permit Services 8,145 7,302 - - Mountain Rail 2,755 1,705 15 - Parking Garage 5,707 6,682 - 219 Convention Center 7,084 4,623 - - Cheney Stadium 1,613 847 - - Tacoma Dome 6,109 5,463 - - Performing Arts 4,995 - - - Solid Waste 61,040 64,642 513 1 Waste Water 80,343 90,648 - 6,234 Union Station 2,078 2,072 - - Tacoma Rail 27,340 31,232 82 - Water 72,324 99,426 3,566 9,002 Power 422,265 468,988 3,792 4,131 Low income Assistance - - - - Power - Conservation 75 1,872 - -
Total business-type activities 701,873 785,502 7,968 19,587
Total primary government 1,018,290 827,130 38,346 35,469
Component units:TCRA 3,214 - 5,250 - GRTCC PDF 3,073 - - - FWDA 1,246 506 35 48 Total component units $ 7,533 $ 506 $ 5,285 $ 48
Prior period adjustmentChange in accounting principle
Net position ending
Total general revenues and transfers
Property taxes
(amounts expressed in thousands)
PROGRAM REVENUES
Transfers
Sales taxesExcise taxes
Business taxes
STATEMENT OF ACTIVITIES
Unrestricted investment earnings
Page 1 of 2
Gain on sale of capital assets
General revenues:
For the Year Ended December 31, 2014
Change in net positionNet position beginning
Net position beginning (restated)
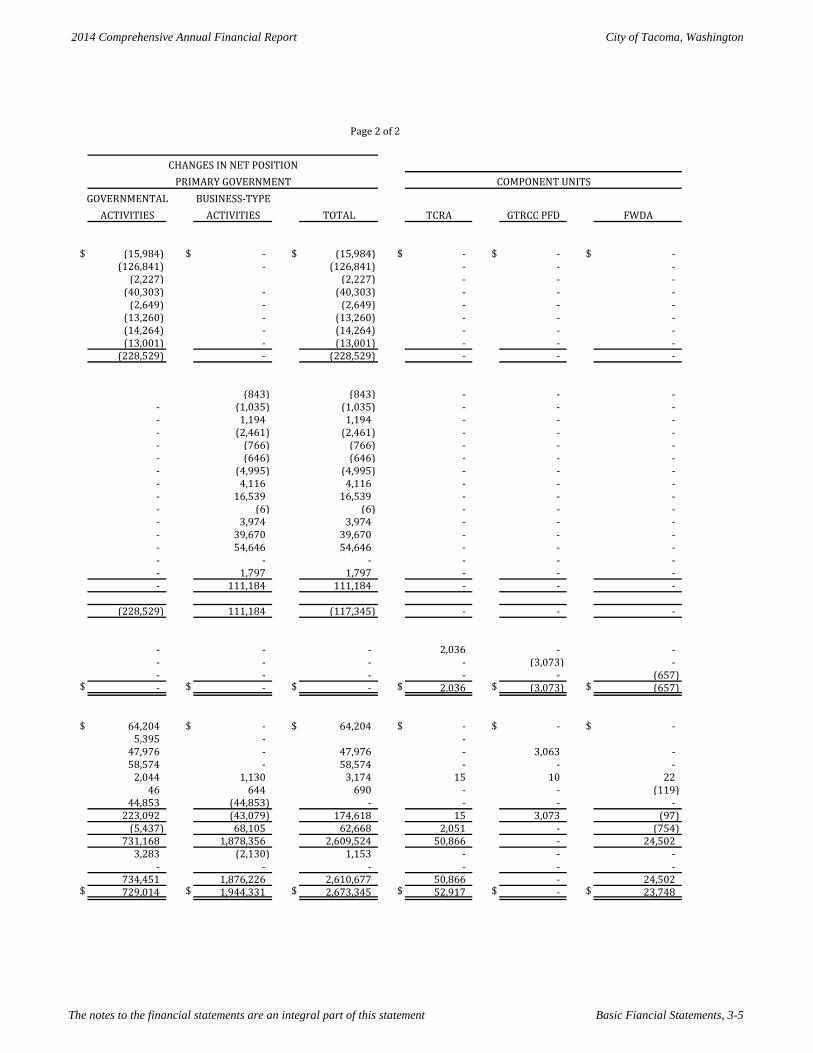
2014 Comprehensive Annual Financial Report City of Tacoma, Washington
The notes to the financial statements are an integral part of this statement Basic Fiancial Statements, 3-5
GOVERNMENTAL BUSINESS-TYPEACTIVITIES ACTIVITIES TOTAL TCRA GTRCC PFD FWDA
$ (15,984) $ - $ (15,984) $ - $ - $ - (126,841) - (126,841) - - -
(2,227) (2,227) - - - (40,303) - (40,303) - - -
(2,649) - (2,649) - - - (13,260) - (13,260) - - - (14,264) - (14,264) - - - (13,001) - (13,001) - - -
(228,529) - (228,529) - - -
(843) (843) - - - - (1,035) (1,035) - - - - 1,194 1,194 - - - - (2,461) (2,461) - - - - (766) (766) - - - - (646) (646) - - - - (4,995) (4,995) - - - - 4,116 4,116 - - - - 16,539 16,539 - - - - (6) (6) - - - - 3,974 3,974 - - - - 39,670 39,670 - - - - 54,646 54,646 - - - - - - - - - - 1,797 1,797 - - - - 111,184 111,184 - - -
(228,529) 111,184 (117,345) - - -
- - - 2,036 - - - - - - (3,073) - - - - - - (657)
$ - $ - $ - $ 2,036 $ (3,073) $ (657)
$ 64,204 $ - $ 64,204 $ - $ - $ - 5,395 - -
47,976 - 47,976 - 3,063 - 58,574 - 58,574 - - -
2,044 1,130 3,174 15 10 22 46 644 690 - - (119)
44,853 (44,853) - - - - 223,092 (43,079) 174,618 15 3,073 (97)
(5,437) 68,105 62,668 2,051 - (754) 731,168 1,878,356 2,609,524 50,866 - 24,502
3,283 (2,130) 1,153 - - - - - - - - -
734,451 1,876,226 2,610,677 50,866 - 24,502 $ 729,014 $ 1,944,331 $ 2,673,345 $ 52,917 $ - $ 23,748
COMPONENT UNITS
Page 2 of 2
CHANGES IN NET POSITIONPRIMARY GOVERNMENT
2014 Comprehensive Annual Financial Report City of Tacoma, Washington
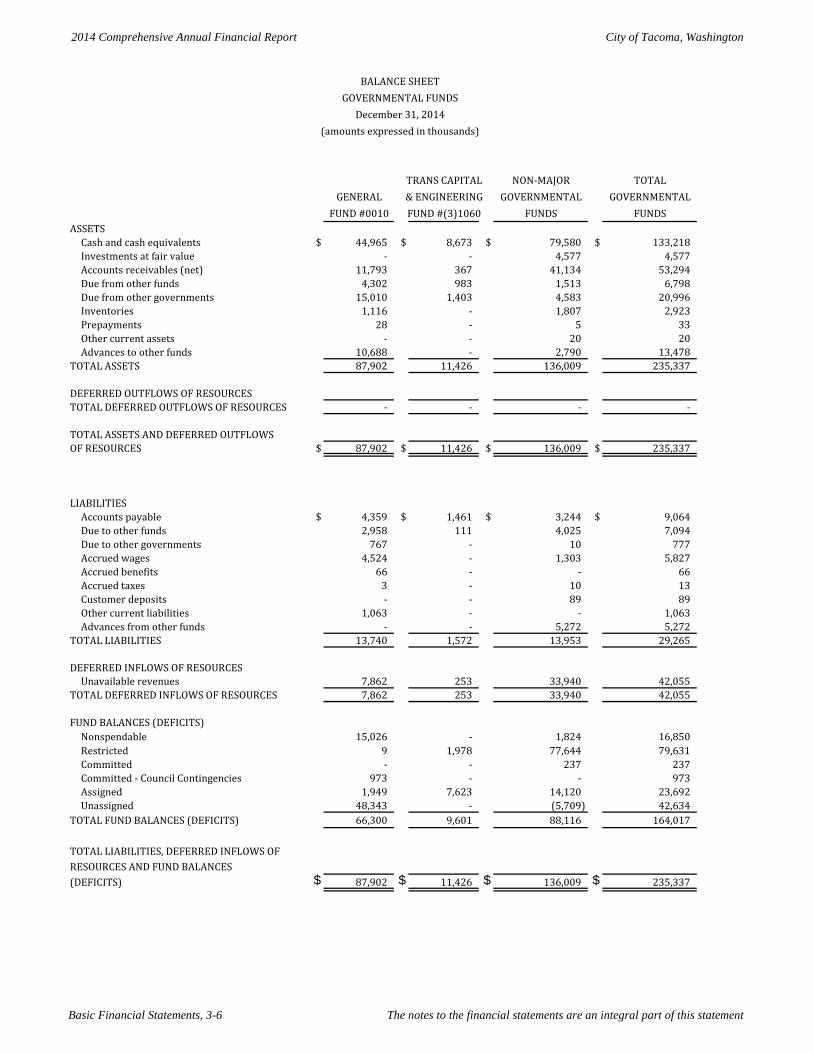
Basic Financial Statements, 3-6 The notes to the financial statements are an integral part of this statement
TRANS CAPITAL NON-MAJOR TOTALGENERAL & ENGINEERING GOVERNMENTAL GOVERNMENTAL
FUND #0010 FUND #(3)1060 FUNDS FUNDSASSETS
Cash and cash equivalents $ 44,965 $ 8,673 $ 79,580 $ 133,218 Investments at fair value - - 4,577 4,577 Accounts receivables (net) 11,793 367 41,134 53,294 Due from other funds 4,302 983 1,513 6,798 Due from other governments 15,010 1,403 4,583 20,996 Inventories 1,116 - 1,807 2,923 Prepayments 28 - 5 33 Other current assets - - 20 20 Advances to other funds 10,688 - 2,790 13,478
TOTAL ASSETS 87,902 11,426 136,009 235,337
DEFERRED OUTFLOWS OF RESOURCESTOTAL DEFERRED OUTFLOWS OF RESOURCES - - - - TOTAL ASSETS AND DEFERRED OUTFLOWSOF RESOURCES $ 87,902 $ 11,426 $ 136,009 $ 235,337
LIABILITIESAccounts payable $ 4,359 $ 1,461 $ 3,244 $ 9,064 Due to other funds 2,958 111 4,025 7,094 Due to other governments 767 - 10 777 Accrued wages 4,524 - 1,303 5,827 Accrued benefits 66 - - 66 Accrued taxes 3 - 10 13 Customer deposits - - 89 89 Other current liabilities 1,063 - - 1,063 Advances from other funds - - 5,272 5,272
TOTAL LIABILITIES 13,740 1,572 13,953 29,265
DEFERRED INFLOWS OF RESOURCESUnavailable revenues 7,862 253 33,940 42,055
TOTAL DEFERRED INFLOWS OF RESOURCES 7,862 253 33,940 42,055
FUND BALANCES (DEFICITS)Nonspendable 15,026 - 1,824 16,850 Restricted 9 1,978 77,644 79,631 Committed - - 237 237 Committed - Council Contingencies 973 - - 973 Assigned 1,949 7,623 14,120 23,692 Unassigned 48,343 - (5,709) 42,634
TOTAL FUND BALANCES (DEFICITS) 66,300 9,601 88,116 164,017
TOTAL LIABILITIES, DEFERRED INFLOWS OF RESOURCES AND FUND BALANCES(DEFICITS) $ 87,902 $ 11,426 $ 136,009 $ 235,337
BALANCE SHEETGOVERNMENTAL FUNDS
December 31, 2014(amounts expressed in thousands)
2014 Comprehensive Annual Financial Report City of Tacoma, Washington
The notes to the financial statements are an integral part of this statement Basic Financial Statements, 3-7
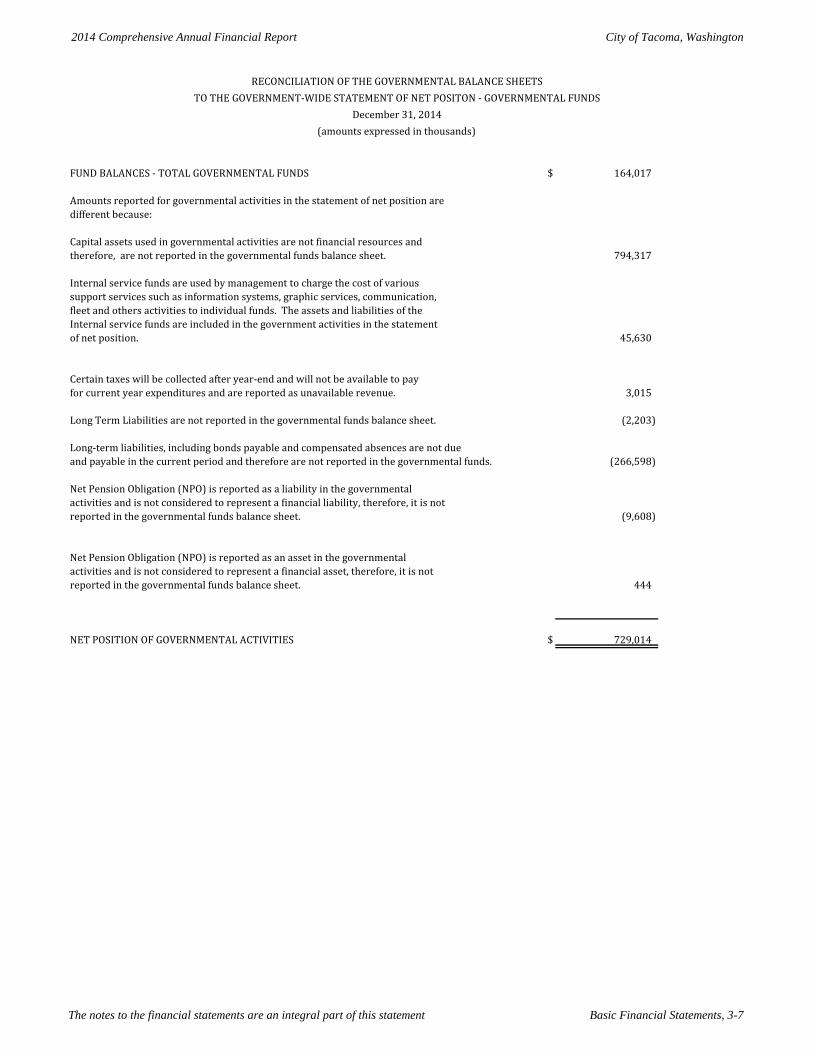
FUND BALANCES - TOTAL GOVERNMENTAL FUNDS $ 164,017
Amounts reported for governmental activities in the statement of net position aredifferent because:
Capital assets used in governmental activities are not financial resources andtherefore, are not reported in the governmental funds balance sheet. 794,317
Internal service funds are used by management to charge the cost of varioussupport services such as information systems, graphic services, communication, fleet and others activities to individual funds. The assets and liabilities of the Internal service funds are included in the government activities in the statementof net position. 45,630
Certain taxes will be collected after year-end and will not be available to payfor current year expenditures and are reported as unavailable revenue. 3,015
Long Term Liabilities are not reported in the governmental funds balance sheet. (2,203)
Long-term liabilities, including bonds payable and compensated absences are not dueand payable in the current period and therefore are not reported in the governmental funds. (266,598)
Net Pension Obligation (NPO) is reported as a liability in the governmentalactivities and is not considered to represent a financial liability, therefore, it is notreported in the governmental funds balance sheet. (9,608)
Net Pension Obligation (NPO) is reported as an asset in the governmentalactivities and is not considered to represent a financial asset, therefore, it is notreported in the governmental funds balance sheet. 444
NET POSITION OF GOVERNMENTAL ACTIVITIES $ 729,014
RECONCILIATION OF THE GOVERNMENTAL BALANCE SHEETSTO THE GOVERNMENT-WIDE STATEMENT OF NET POSITON - GOVERNMENTAL FUNDS
December 31, 2014(amounts expressed in thousands)
2014 Comprehensive Annual Financial Report City of Tacoma, Washington
Basic Financial Statements, 3-8 The notes to the financial statements are an integral part of this statement
TRANS CAPITAL NON-MAJOR TOTALGENERAL & ENGINEERING GOVERNMENTAL GOVERNMENTAL
FUND #0010 FUND #(3)1060 FUNDS FUNDSREVENUES
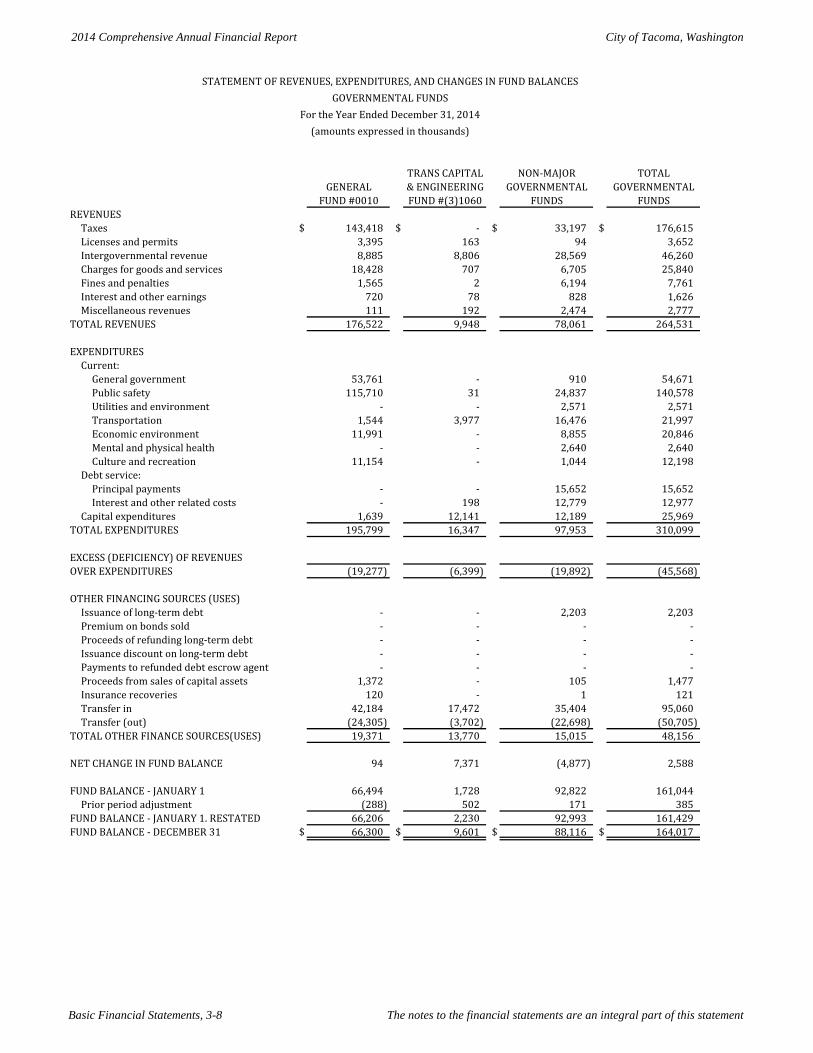
Taxes $ 143,418 $ - $ 33,197 $ 176,615 Licenses and permits 3,395 163 94 3,652 Intergovernmental revenue 8,885 8,806 28,569 46,260 Charges for goods and services 18,428 707 6,705 25,840 Fines and penalties 1,565 2 6,194 7,761 Interest and other earnings 720 78 828 1,626 Miscellaneous revenues 111 192 2,474 2,777
TOTAL REVENUES 176,522 9,948 78,061 264,531
EXPENDITURESCurrent:
General government 53,761 - 910 54,671 Public safety 115,710 31 24,837 140,578 Utilities and environment - - 2,571 2,571 Transportation 1,544 3,977 16,476 21,997 Economic environment 11,991 - 8,855 20,846 Mental and physical health - - 2,640 2,640 Culture and recreation 11,154 - 1,044 12,198
Debt service:Principal payments - - 15,652 15,652 Interest and other related costs - 198 12,779 12,977
Capital expenditures 1,639 12,141 12,189 25,969 TOTAL EXPENDITURES 195,799 16,347 97,953 310,099
EXCESS (DEFICIENCY) OF REVENUESOVER EXPENDITURES (19,277) (6,399) (19,892) (45,568)
OTHER FINANCING SOURCES (USES)Issuance of long-term debt - - 2,203 2,203 Premium on bonds sold - - - - Proceeds of refunding long-term debt - - - - Issuance discount on long-term debt - - - - Payments to refunded debt escrow agent - - - - Proceeds from sales of capital assets 1,372 - 105 1,477 Insurance recoveries 120 - 1 121 Transfer in 42,184 17,472 35,404 95,060 Transfer (out) (24,305) (3,702) (22,698) (50,705)
TOTAL OTHER FINANCE SOURCES(USES) 19,371 13,770 15,015 48,156
NET CHANGE IN FUND BALANCE 94 7,371 (4,877) 2,588
FUND BALANCE - JANUARY 1 66,494 1,728 92,822 161,044 Prior period adjustment (288) 502 171 385
FUND BALANCE - JANUARY 1. RESTATED 66,206 2,230 92,993 161,429 FUND BALANCE - DECEMBER 31 $ 66,300 $ 9,601 $ 88,116 $ 164,017
STATEMENT OF REVENUES, EXPENDITURES, AND CHANGES IN FUND BALANCESGOVERNMENTAL FUNDS
For the Year Ended December 31, 2014(amounts expressed in thousands)
2014 Comprehensive Annual Financial Report City of Tacoma, Washington
The notes to the financial statements are an integral part of this statement Basic Financial Statements, 3-9
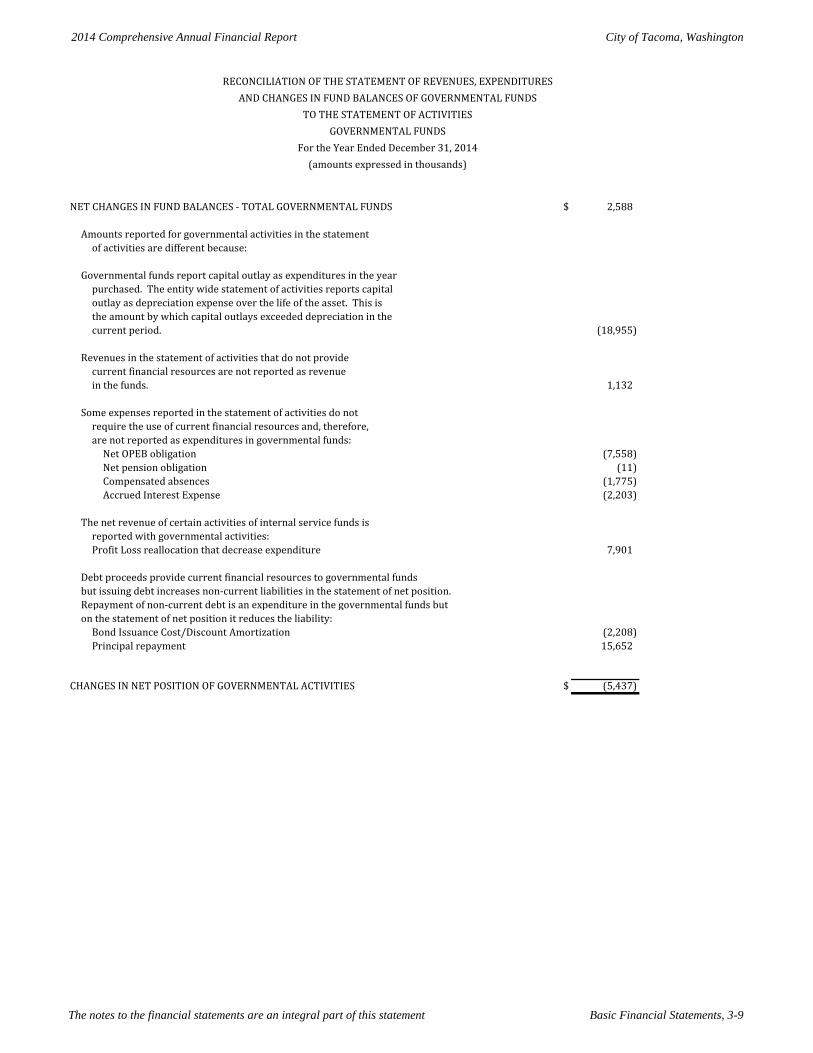
NET CHANGES IN FUND BALANCES - TOTAL GOVERNMENTAL FUNDS $ 2,588
Amounts reported for governmental activities in the statement of activities are different because:
Governmental funds report capital outlay as expenditures in the yearpurchased. The entity wide statement of activities reports capitaloutlay as depreciation expense over the life of the asset. This isthe amount by which capital outlays exceeded depreciation in thecurrent period. (18,955)
Revenues in the statement of activities that do not providecurrent financial resources are not reported as revenue in the funds. 1,132
Some expenses reported in the statement of activities do notrequire the use of current financial resources and, therefore, are not reported as expenditures in governmental funds:
Net OPEB obligation (7,558) Net pension obligation (11) Compensated absences (1,775) Accrued Interest Expense (2,203)
The net revenue of certain activities of internal service funds isreported with governmental activities:Profit Loss reallocation that decrease expenditure 7,901
Debt proceeds provide current financial resources to governmental fundsbut issuing debt increases non-current liabilities in the statement of net position.Repayment of non-current debt is an expenditure in the governmental funds buton the statement of net position it reduces the liability:
Bond Issuance Cost/Discount Amortization (2,208) Principal repayment 15,652
CHANGES IN NET POSITION OF GOVERNMENTAL ACTIVITIES $ (5,437)
For the Year Ended December 31, 2014(amounts expressed in thousands)
RECONCILIATION OF THE STATEMENT OF REVENUES, EXPENDITURESAND CHANGES IN FUND BALANCES OF GOVERNMENTAL FUNDS
TO THE STATEMENT OF ACTIVITIESGOVERNMENTAL FUNDS
2014 Comprehensive Annual Financial Report City of Tacoma, Washington
Basic Financial Statements, 3-10 The notes to the financial statements are an integral part of this statement
SOLID WASTEWATER TACOMA TACOMAWASTE & SURFACE WATER WATER POWER
FUND #4200 FUND #4300-01 FUND #4600 FUND #4700ASSETS
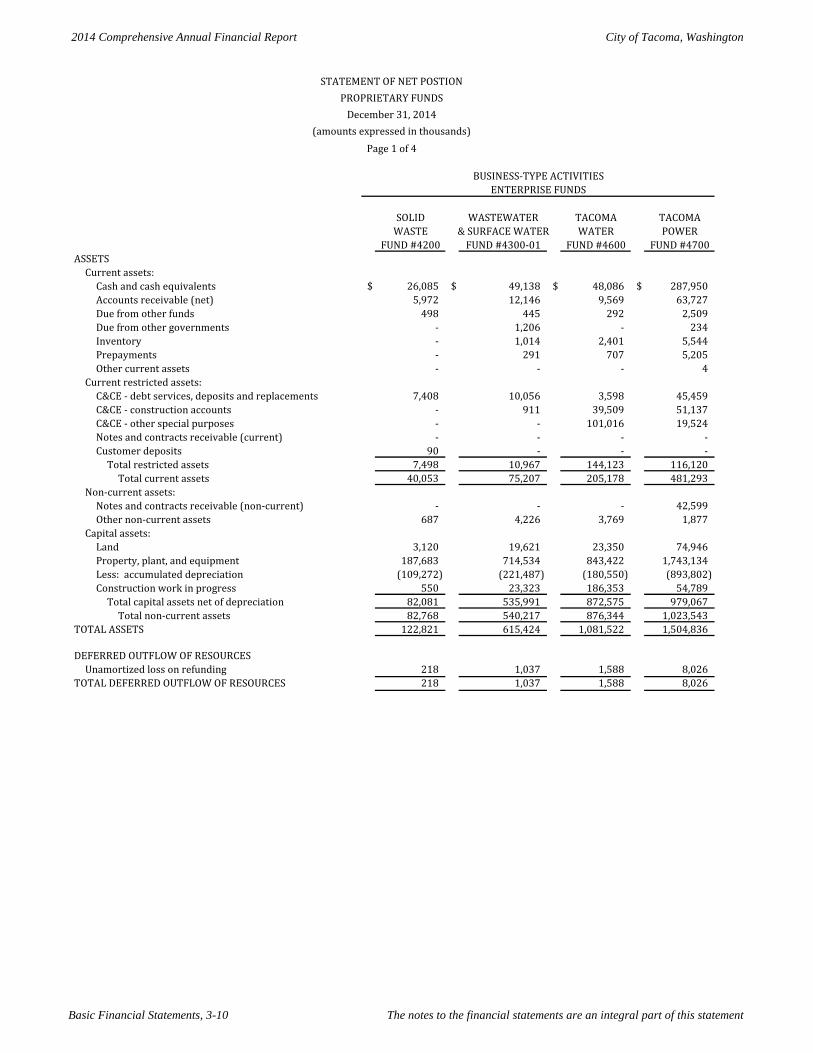
Current assets:Cash and cash equivalents $ 26,085 $ 49,138 $ 48,086 $ 287,950 Accounts receivable (net) 5,972 12,146 9,569 63,727 Due from other funds 498 445 292 2,509 Due from other governments - 1,206 - 234 Inventory - 1,014 2,401 5,544 Prepayments - 291 707 5,205 Other current assets - - - 4
Current restricted assets:C&CE - debt services, deposits and replacements 7,408 10,056 3,598 45,459 C&CE - construction accounts - 911 39,509 51,137 C&CE - other special purposes - - 101,016 19,524 Notes and contracts receivable (current) - - - - Customer deposits 90 - - -
Total restricted assets 7,498 10,967 144,123 116,120 Total current assets 40,053 75,207 205,178 481,293
Non-current assets:Notes and contracts receivable (non-current) - - - 42,599 Other non-current assets 687 4,226 3,769 1,877
Capital assets:Land 3,120 19,621 23,350 74,946 Property, plant, and equipment 187,683 714,534 843,422 1,743,134 Less: accumulated depreciation (109,272) (221,487) (180,550) (893,802) Construction work in progress 550 23,323 186,353 54,789
Total capital assets net of depreciation 82,081 535,991 872,575 979,067 Total non-current assets 82,768 540,217 876,344 1,023,543
TOTAL ASSETS 122,821 615,424 1,081,522 1,504,836
DEFERRED OUTFLOW OF RESOURCESUnamortized loss on refunding 218 1,037 1,588 8,026
TOTAL DEFERRED OUTFLOW OF RESOURCES 218 1,037 1,588 8,026
(amounts expressed in thousands)Page 1 of 4
ENTERPRISE FUNDSBUSINESS-TYPE ACTIVITIES
STATEMENT OF NET POSTIONPROPRIETARY FUNDS
December 31, 2014
2014 Comprehensive Annual Financial Report City of Tacoma, Washington
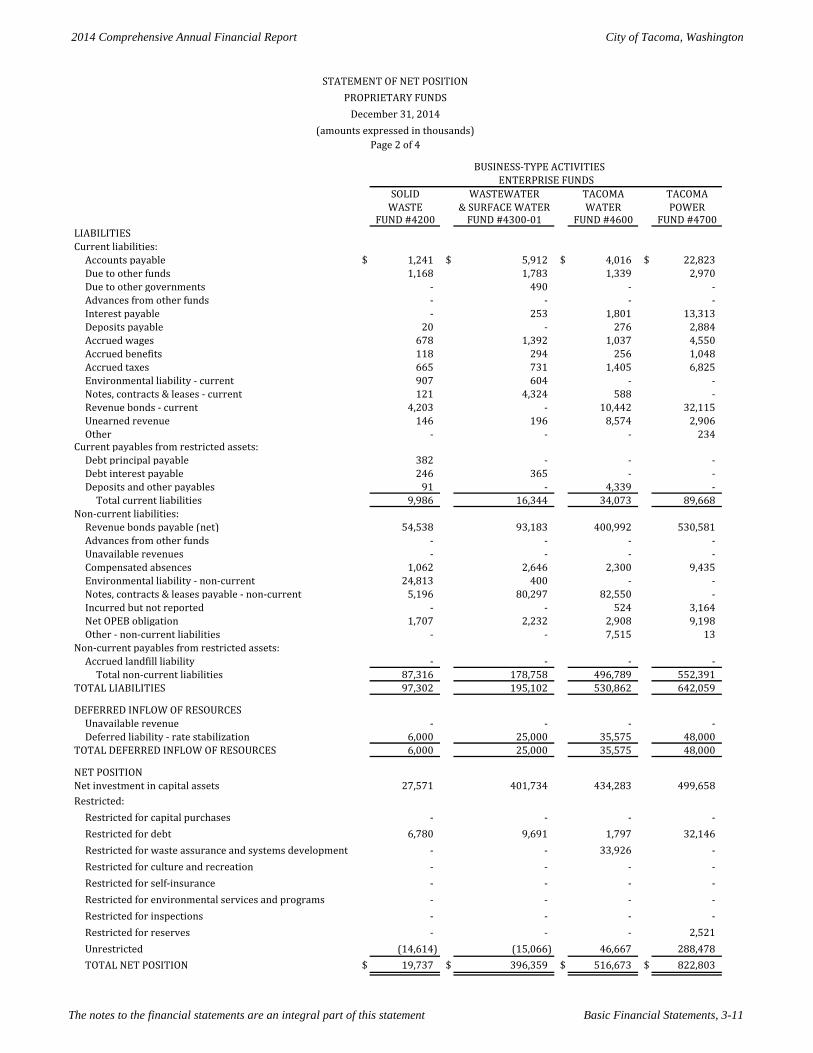
The notes to the financial statements are an integral part of this statement Basic Financial Statements, 3-11
SOLID WASTEWATER TACOMA TACOMAWASTE & SURFACE WATER WATER POWER
FUND #4200 FUND #4300-01 FUND #4600 FUND #4700LIABILITIESCurrent liabilities:
Accounts payable $ 1,241 $ 5,912 $ 4,016 $ 22,823 Due to other funds 1,168 1,783 1,339 2,970 Due to other governments - 490 - - Advances from other funds - - - - Interest payable - 253 1,801 13,313 Deposits payable 20 - 276 2,884 Accrued wages 678 1,392 1,037 4,550 Accrued benefits 118 294 256 1,048 Accrued taxes 665 731 1,405 6,825 Environmental liability - current 907 604 - - Notes, contracts & leases - current 121 4,324 588 - Revenue bonds - current 4,203 - 10,442 32,115 Unearned revenue 146 196 8,574 2,906 Other - - - 234
Current payables from restricted assets:Debt principal payable 382 - - - Debt interest payable 246 365 - - Deposits and other payables 91 - 4,339 -
Total current liabilities 9,986 16,344 34,073 89,668 Non-current liabilities:
Revenue bonds payable (net) 54,538 93,183 400,992 530,581 Advances from other funds - - - - Unavailable revenues - - - - Compensated absences 1,062 2,646 2,300 9,435 Environmental liability - non-current 24,813 400 - - Notes, contracts & leases payable - non-current 5,196 80,297 82,550 - Incurred but not reported - - 524 3,164 Net OPEB obligation 1,707 2,232 2,908 9,198 Other - non-current liabilities - - 7,515 13
Non-current payables from restricted assets:Accrued landfill liability - - - -
Total non-current liabilities 87,316 178,758 496,789 552,391 TOTAL LIABILITIES 97,302 195,102 530,862 642,059
DEFERRED INFLOW OF RESOURCESUnavailable revenue - - - - Deferred liability - rate stabilization 6,000 25,000 35,575 48,000
TOTAL DEFERRED INFLOW OF RESOURCES 6,000 25,000 35,575 48,000
NET POSITIONNet investment in capital assets 27,571 401,734 434,283 499,658 Restricted:
Restricted for capital purchases - - - - Restricted for debt 6,780 9,691 1,797 32,146 Restricted for waste assurance and systems development - - 33,926 - Restricted for culture and recreation - - - - Restricted for self-insurance - - - - Restricted for environmental services and programs - - - - Restricted for inspections - - - - Restricted for reserves - - - 2,521 Unrestricted (14,614) (15,066) 46,667 288,478 TOTAL NET POSITION $ 19,737 $ 396,359 $ 516,673 $ 822,803
ENTERPRISE FUNDS
(amounts expressed in thousands)Page 2 of 4
STATEMENT OF NET POSITIONPROPRIETARY FUNDS
December 31, 2014
BUSINESS-TYPE ACTIVITIES
2014 Comprehensive Annual Financial Report City of Tacoma, Washington
Basic Financial Statements, 3-12 The notes to the financial statements are an integral part of this statement
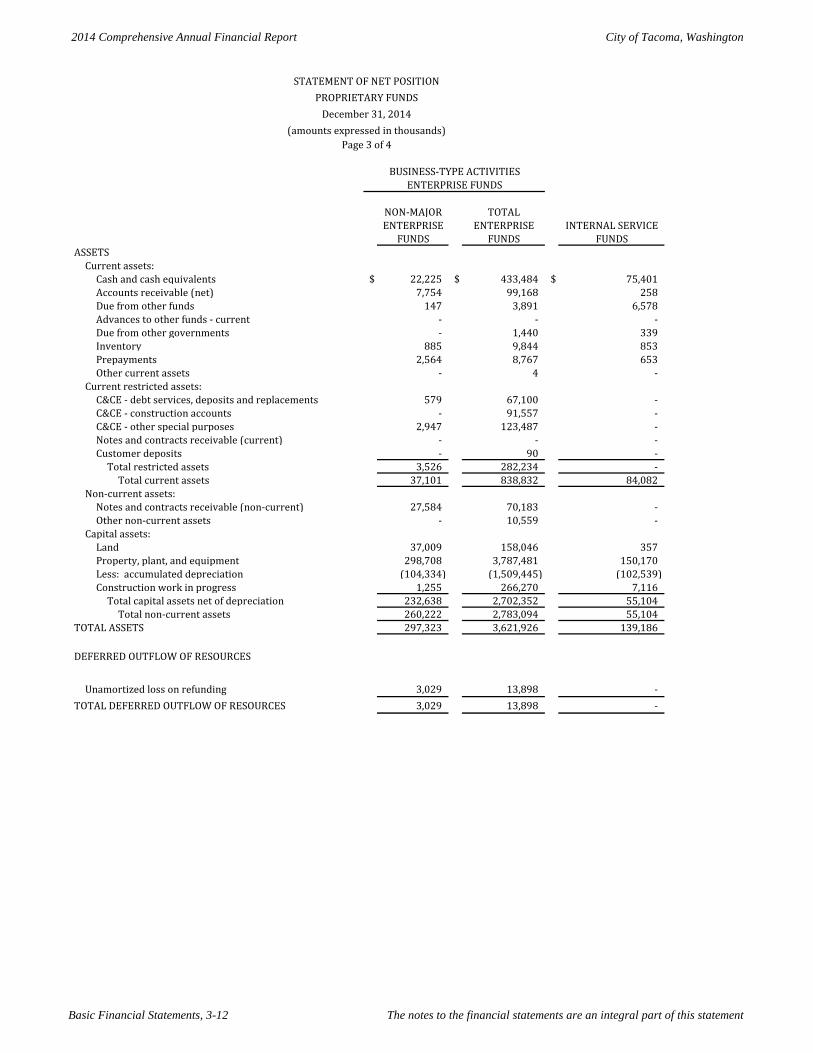
NON-MAJOR TOTALENTERPRISE ENTERPRISE INTERNAL SERVICE
FUNDS FUNDS FUNDSASSETS
Current assets:Cash and cash equivalents $ 22,225 $ 433,484 $ 75,401 Accounts receivable (net) 7,754 99,168 258 Due from other funds 147 3,891 6,578 Advances to other funds - current - - - Due from other governments - 1,440 339 Inventory 885 9,844 853 Prepayments 2,564 8,767 653 Other current assets - 4 -
Current restricted assets:C&CE - debt services, deposits and replacements 579 67,100 - C&CE - construction accounts - 91,557 - C&CE - other special purposes 2,947 123,487 - Notes and contracts receivable (current) - - - Customer deposits - 90 -
Total restricted assets 3,526 282,234 - Total current assets 37,101 838,832 84,082
Non-current assets:Notes and contracts receivable (non-current) 27,584 70,183 - Other non-current assets - 10,559 -
Capital assets:Land 37,009 158,046 357 Property, plant, and equipment 298,708 3,787,481 150,170 Less: accumulated depreciation (104,334) (1,509,445) (102,539) Construction work in progress 1,255 266,270 7,116
Total capital assets net of depreciation 232,638 2,702,352 55,104 Total non-current assets 260,222 2,783,094 55,104
TOTAL ASSETS 297,323 3,621,926 139,186
DEFERRED OUTFLOW OF RESOURCES
Unamortized loss on refunding 3,029 13,898 - TOTAL DEFERRED OUTFLOW OF RESOURCES 3,029 13,898 -
BUSINESS-TYPE ACTIVITIESENTERPRISE FUNDS
(amounts expressed in thousands)Page 3 of 4
STATEMENT OF NET POSITIONPROPRIETARY FUNDS
December 31, 2014
2014 Comprehensive Annual Financial Report City of Tacoma, Washington
The notes to the financial statements are an integral part of this statement Basic Financial Statements, 3-13
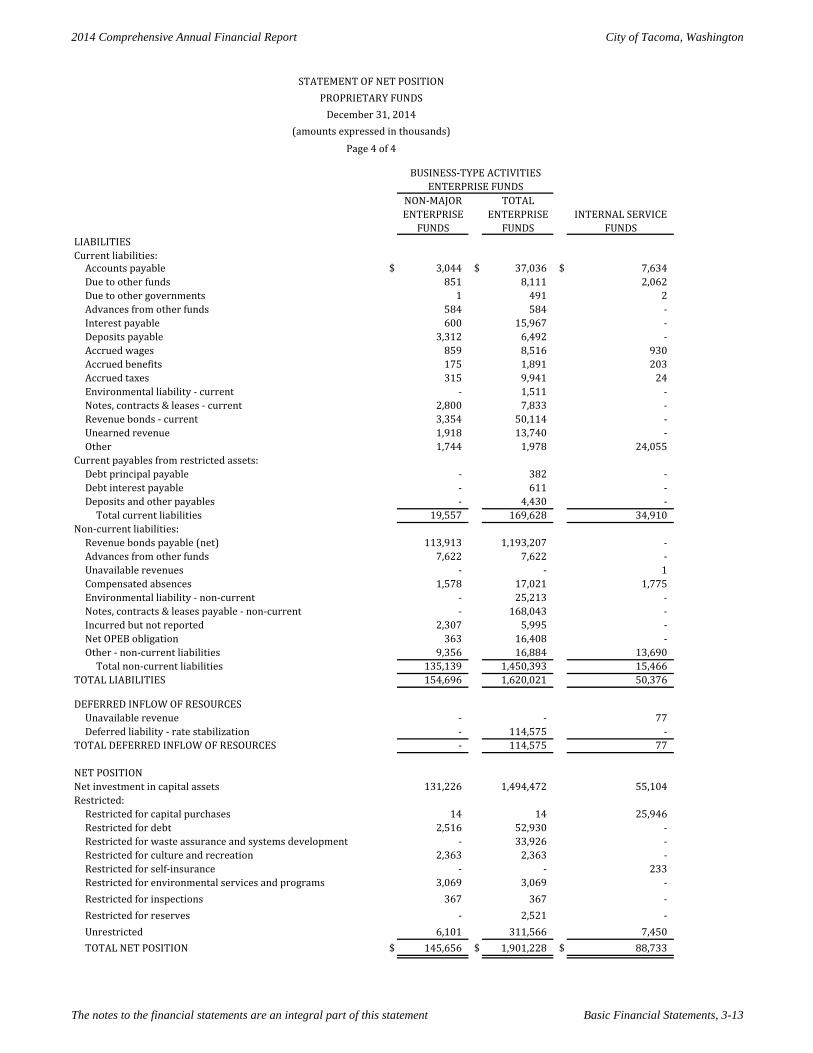
NON-MAJOR TOTALENTERPRISE ENTERPRISE INTERNAL SERVICE
FUNDS FUNDS FUNDSLIABILITIESCurrent liabilities:
Accounts payable $ 3,044 $ 37,036 $ 7,634 Due to other funds 851 8,111 2,062 Due to other governments 1 491 2 Advances from other funds 584 584 - Interest payable 600 15,967 - Deposits payable 3,312 6,492 - Accrued wages 859 8,516 930 Accrued benefits 175 1,891 203 Accrued taxes 315 9,941 24 Environmental liability - current - 1,511 - Notes, contracts & leases - current 2,800 7,833 - Revenue bonds - current 3,354 50,114 - Unearned revenue 1,918 13,740 - Other 1,744 1,978 24,055
Current payables from restricted assets:Debt principal payable - 382 - Debt interest payable - 611 - Deposits and other payables - 4,430 -
Total current liabilities 19,557 169,628 34,910 Non-current liabilities:
Revenue bonds payable (net) 113,913 1,193,207 - Advances from other funds 7,622 7,622 - Unavailable revenues - - 1 Compensated absences 1,578 17,021 1,775 Environmental liability - non-current - 25,213 - Notes, contracts & leases payable - non-current - 168,043 - Incurred but not reported 2,307 5,995 - Net OPEB obligation 363 16,408 - Other - non-current liabilities 9,356 16,884 13,690
Total non-current liabilities 135,139 1,450,393 15,466 TOTAL LIABILITIES 154,696 1,620,021 50,376
DEFERRED INFLOW OF RESOURCESUnavailable revenue - - 77 Deferred liability - rate stabilization - 114,575 -
TOTAL DEFERRED INFLOW OF RESOURCES - 114,575 77
NET POSITIONNet investment in capital assets 131,226 1,494,472 55,104 Restricted:
Restricted for capital purchases 14 14 25,946 Restricted for debt 2,516 52,930 - Restricted for waste assurance and systems development - 33,926 - Restricted for culture and recreation 2,363 2,363 - Restricted for self-insurance - - 233 Restricted for environmental services and programs 3,069 3,069 - Restricted for inspections 367 367 - Restricted for reserves - 2,521 - Unrestricted 6,101 311,566 7,450 TOTAL NET POSITION $ 145,656 $ 1,901,228 $ 88,733
BUSINESS-TYPE ACTIVITIESENTERPRISE FUNDS
(amounts expressed in thousands)Page 4 of 4
STATEMENT OF NET POSITIONPROPRIETARY FUNDS
December 31, 2014
2014 Comprehensive Annual Financial Report City of Tacoma, Washington
Basic Financial Statements, 3-14 The notes to the financial statements are an integral part of this statement
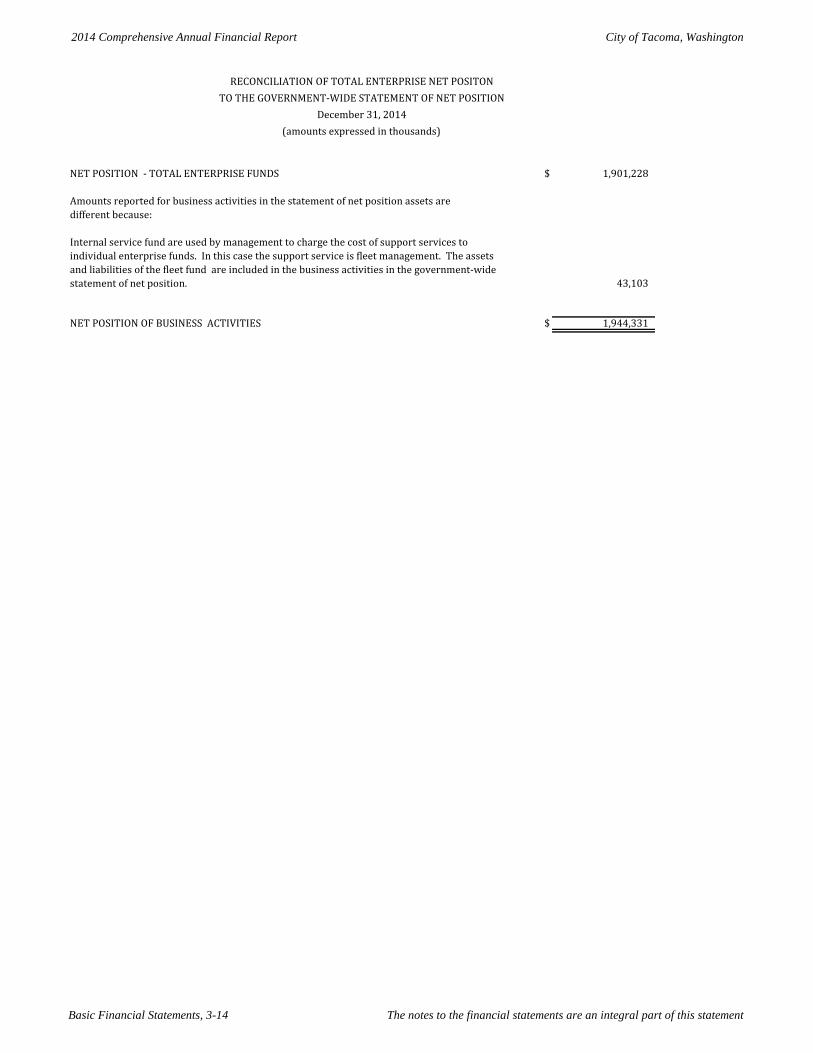
NET POSITION - TOTAL ENTERPRISE FUNDS $ 1,901,228
Amounts reported for business activities in the statement of net position assets aredifferent because:
Internal service fund are used by management to charge the cost of support services to individual enterprise funds. In this case the support service is fleet management. The assets and liabilities of the fleet fund are included in the business activities in the government-wide statement of net position. 43,103
NET POSITION OF BUSINESS ACTIVITIES $ 1,944,331
RECONCILIATION OF TOTAL ENTERPRISE NET POSITONTO THE GOVERNMENT-WIDE STATEMENT OF NET POSITION
December 31, 2014(amounts expressed in thousands)
2014 Comprehensive Annual Financial Report City of Tacoma, Washington
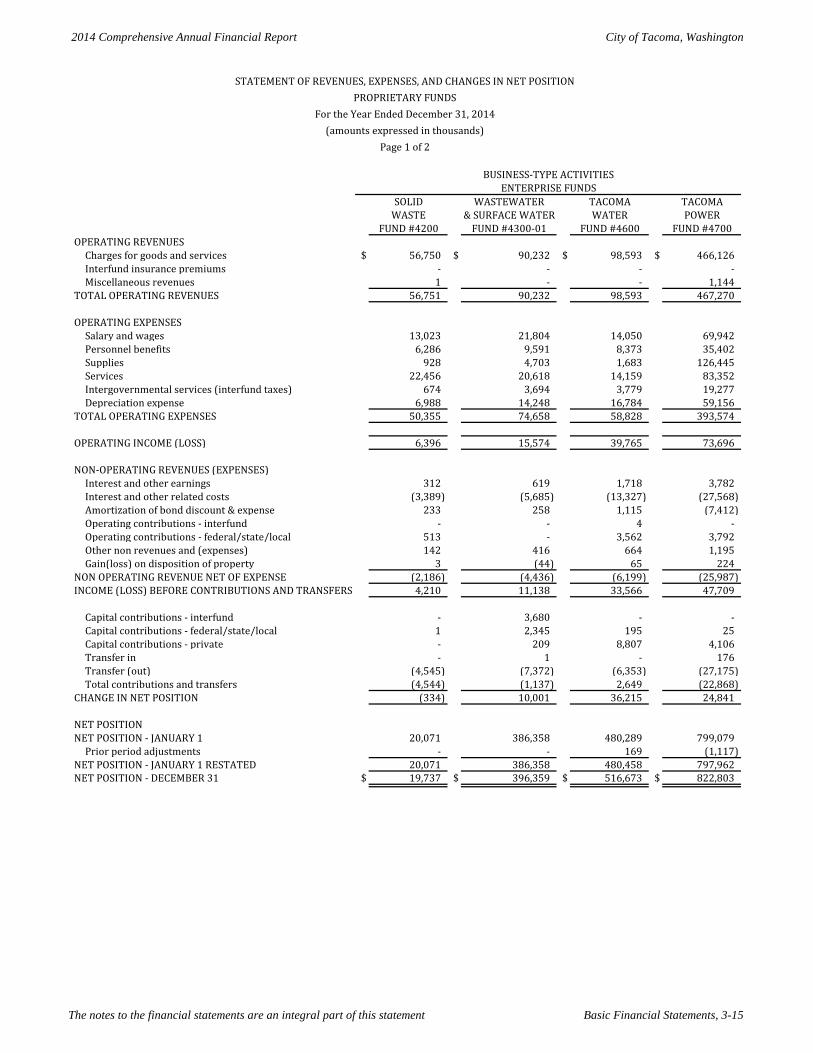
The notes to the financial statements are an integral part of this statement Basic Financial Statements, 3-15
SOLID WASTEWATER TACOMA TACOMAWASTE & SURFACE WATER WATER POWER
FUND #4200 FUND #4300-01 FUND #4600 FUND #4700OPERATING REVENUES
Charges for goods and services $ 56,750 $ 90,232 $ 98,593 $ 466,126 Interfund insurance premiums - - - - Miscellaneous revenues 1 - - 1,144
TOTAL OPERATING REVENUES 56,751 90,232 98,593 467,270
OPERATING EXPENSESSalary and wages 13,023 21,804 14,050 69,942 Personnel benefits 6,286 9,591 8,373 35,402 Supplies 928 4,703 1,683 126,445 Services 22,456 20,618 14,159 83,352 Intergovernmental services (interfund taxes) 674 3,694 3,779 19,277 Depreciation expense 6,988 14,248 16,784 59,156
TOTAL OPERATING EXPENSES 50,355 74,658 58,828 393,574
OPERATING INCOME (LOSS) 6,396 15,574 39,765 73,696
NON-OPERATING REVENUES (EXPENSES)Interest and other earnings 312 619 1,718 3,782 Interest and other related costs (3,389) (5,685) (13,327) (27,568) Amortization of bond discount & expense 233 258 1,115 (7,412) Operating contributions - interfund - - 4 - Operating contributions - federal/state/local 513 - 3,562 3,792 Other non revenues and (expenses) 142 416 664 1,195 Gain(loss) on disposition of property 3 (44) 65 224
NON OPERATING REVENUE NET OF EXPENSE (2,186) (4,436) (6,199) (25,987) INCOME (LOSS) BEFORE CONTRIBUTIONS AND TRANSFERS 4,210 11,138 33,566 47,709
Capital contributions - interfund - 3,680 - - Capital contributions - federal/state/local 1 2,345 195 25 Capital contributions - private - 209 8,807 4,106 Transfer in - 1 - 176 Transfer (out) (4,545) (7,372) (6,353) (27,175) Total contributions and transfers (4,544) (1,137) 2,649 (22,868)
CHANGE IN NET POSITION (334) 10,001 36,215 24,841
NET POSITIONNET POSITION - JANUARY 1 20,071 386,358 480,289 799,079
Prior period adjustments - - 169 (1,117) NET POSITION - JANUARY 1 RESTATED 20,071 386,358 480,458 797,962 NET POSITION - DECEMBER 31 $ 19,737 $ 396,359 $ 516,673 $ 822,803
ENTERPRISE FUNDS
(amounts expressed in thousands)Page 1 of 2
STATEMENT OF REVENUES, EXPENSES, AND CHANGES IN NET POSITIONPROPRIETARY FUNDS
For the Year Ended December 31, 2014
BUSINESS-TYPE ACTIVITIES
2014 Comprehensive Annual Financial Report City of Tacoma, Washington
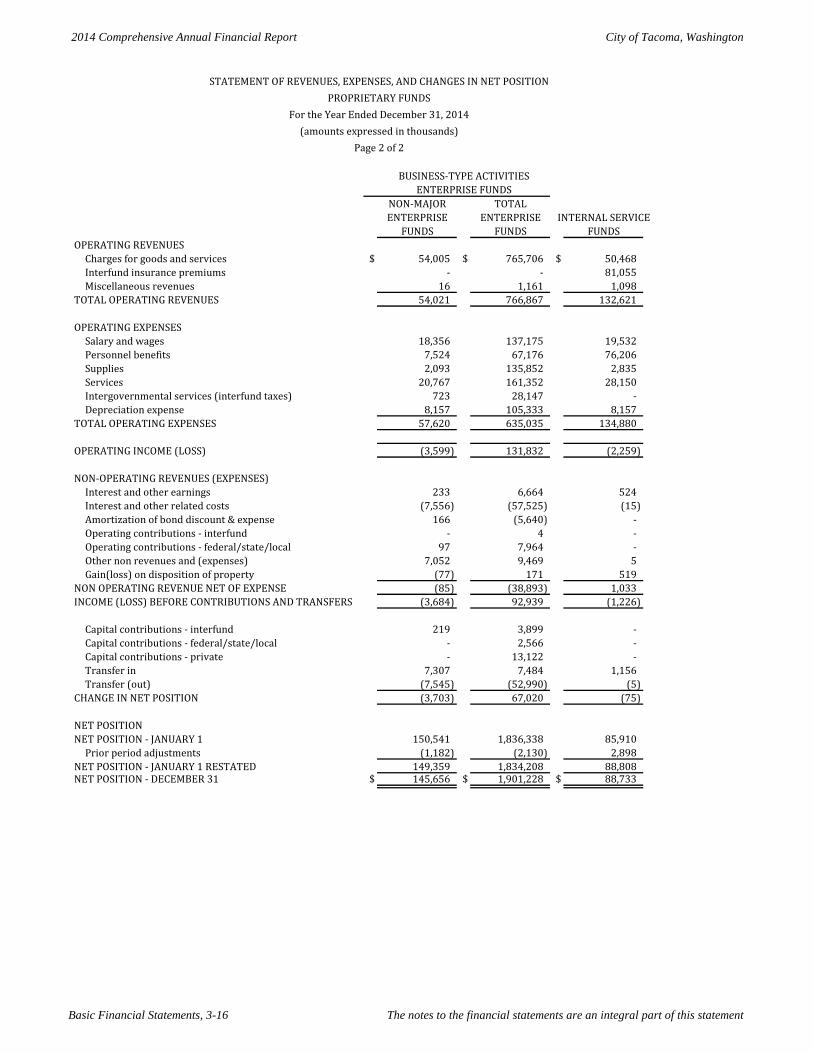
Basic Financial Statements, 3-16 The notes to the financial statements are an integral part of this statement
NON-MAJOR TOTALENTERPRISE ENTERPRISE INTERNAL SERVICE
FUNDS FUNDS FUNDSOPERATING REVENUES
Charges for goods and services $ 54,005 $ 765,706 $ 50,468 Interfund insurance premiums - - 81,055 Miscellaneous revenues 16 1,161 1,098
TOTAL OPERATING REVENUES 54,021 766,867 132,621
OPERATING EXPENSESSalary and wages 18,356 137,175 19,532 Personnel benefits 7,524 67,176 76,206 Supplies 2,093 135,852 2,835 Services 20,767 161,352 28,150 Intergovernmental services (interfund taxes) 723 28,147 - Depreciation expense 8,157 105,333 8,157
TOTAL OPERATING EXPENSES 57,620 635,035 134,880
OPERATING INCOME (LOSS) (3,599) 131,832 (2,259)
NON-OPERATING REVENUES (EXPENSES)Interest and other earnings 233 6,664 524 Interest and other related costs (7,556) (57,525) (15) Amortization of bond discount & expense 166 (5,640) - Operating contributions - interfund - 4 - Operating contributions - federal/state/local 97 7,964 - Other non revenues and (expenses) 7,052 9,469 5 Gain(loss) on disposition of property (77) 171 519
NON OPERATING REVENUE NET OF EXPENSE (85) (38,893) 1,033 INCOME (LOSS) BEFORE CONTRIBUTIONS AND TRANSFERS (3,684) 92,939 (1,226)
Capital contributions - interfund 219 3,899 - Capital contributions - federal/state/local - 2,566 - Capital contributions - private - 13,122 - Transfer in 7,307 7,484 1,156 Transfer (out) (7,545) (52,990) (5)
CHANGE IN NET POSITION (3,703) 67,020 (75)
NET POSITIONNET POSITION - JANUARY 1 150,541 1,836,338 85,910
Prior period adjustments (1,182) (2,130) 2,898 NET POSITION - JANUARY 1 RESTATED 149,359 1,834,208 88,808 NET POSITION - DECEMBER 31 $ 145,656 $ 1,901,228 $ 88,733
(amounts expressed in thousands)Page 2 of 2
BUSINESS-TYPE ACTIVITIESENTERPRISE FUNDS
STATEMENT OF REVENUES, EXPENSES, AND CHANGES IN NET POSITIONPROPRIETARY FUNDS
For the Year Ended December 31, 2014
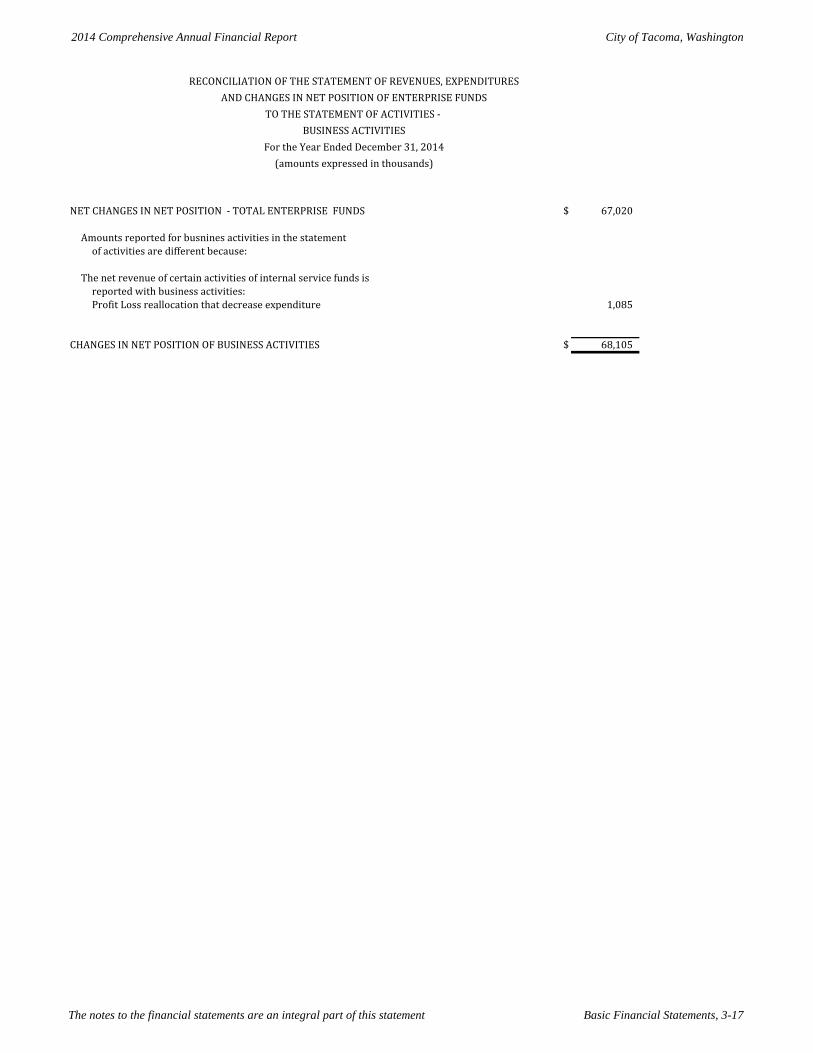
2014 Comprehensive Annual Financial Report City of Tacoma, Washington
The notes to the financial statements are an integral part of this statement Basic Financial Statements, 3-17
NET CHANGES IN NET POSITION - TOTAL ENTERPRISE FUNDS $ 67,020
Amounts reported for busnines activities in the statement of activities are different because:
The net revenue of certain activities of internal service funds isreported with business activities:Profit Loss reallocation that decrease expenditure 1,085
CHANGES IN NET POSITION OF BUSINESS ACTIVITIES $ 68,105
RECONCILIATION OF THE STATEMENT OF REVENUES, EXPENDITURESAND CHANGES IN NET POSITION OF ENTERPRISE FUNDS
TO THE STATEMENT OF ACTIVITIES - BUSINESS ACTIVITIES
For the Year Ended December 31, 2014(amounts expressed in thousands)
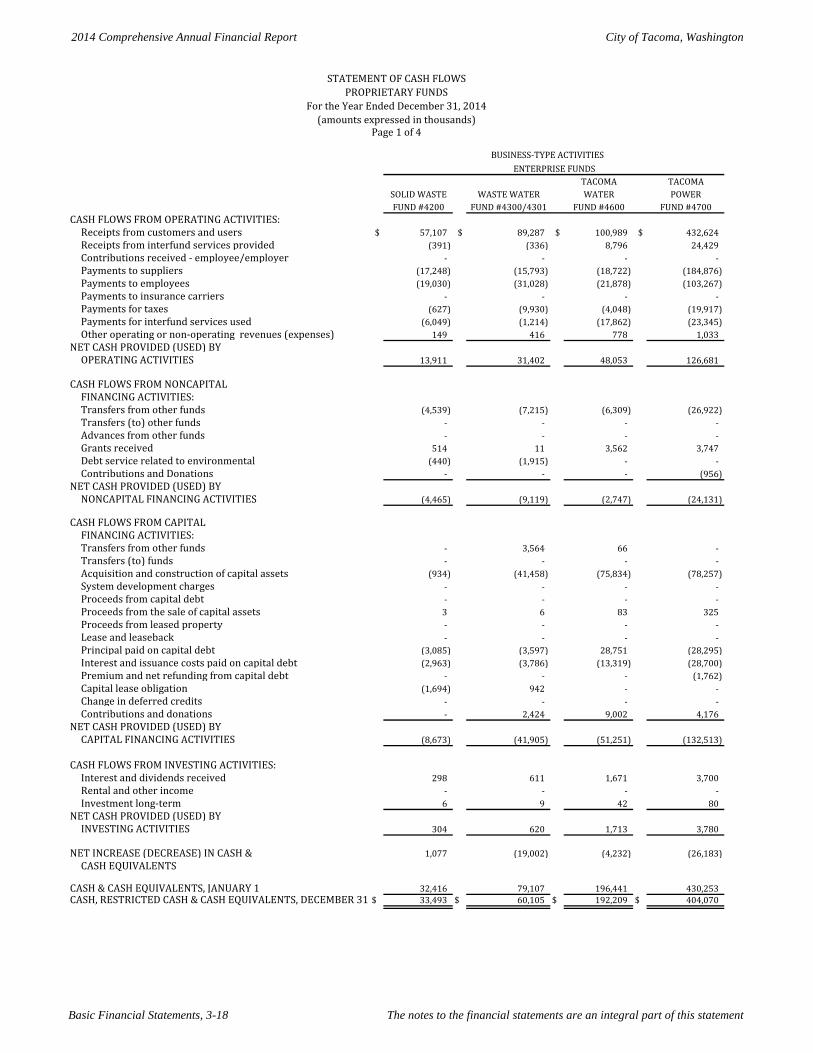
2014 Comprehensive Annual Financial Report City of Tacoma, Washington
Basic Financial Statements, 3-18 The notes to the financial statements are an integral part of this statement
TACOMA TACOMASOLID WASTE WASTE WATER WATER POWER
FUND #4200 FUND #4300/4301 FUND #4600 FUND #4700CASH FLOWS FROM OPERATING ACTIVITIES:
Receipts from customers and users $ 57,107 $ 89,287 $ 100,989 $ 432,624 Receipts from interfund services provided (391) (336) 8,796 24,429 Contributions received - employee/employer - - - - Payments to suppliers (17,248) (15,793) (18,722) (184,876) Payments to employees (19,030) (31,028) (21,878) (103,267) Payments to insurance carriers - - - - Payments for taxes (627) (9,930) (4,048) (19,917) Payments for interfund services used (6,049) (1,214) (17,862) (23,345) Other operating or non-operating revenues (expenses) 149 416 778 1,033
NET CASH PROVIDED (USED) BY OPERATING ACTIVITIES 13,911 31,402 48,053 126,681
CASH FLOWS FROM NONCAPITAL FINANCING ACTIVITIES:Transfers from other funds (4,539) (7,215) (6,309) (26,922) Transfers (to) other funds - - - - Advances from other funds - - - - Grants received 514 11 3,562 3,747 Debt service related to environmental (440) (1,915) - - Contributions and Donations - - - (956)
NET CASH PROVIDED (USED) BY NONCAPITAL FINANCING ACTIVITIES (4,465) (9,119) (2,747) (24,131)
CASH FLOWS FROM CAPITAL FINANCING ACTIVITIES:Transfers from other funds - 3,564 66 - Transfers (to) funds - - - - Acquisition and construction of capital assets (934) (41,458) (75,834) (78,257) System development charges - - - - Proceeds from capital debt - - - - Proceeds from the sale of capital assets 3 6 83 325 Proceeds from leased property - - - - Lease and leaseback - - - - Principal paid on capital debt (3,085) (3,597) 28,751 (28,295) Interest and issuance costs paid on capital debt (2,963) (3,786) (13,319) (28,700) Premium and net refunding from capital debt - - - (1,762) Capital lease obligation (1,694) 942 - - Change in deferred credits - - - - Contributions and donations - 2,424 9,002 4,176
NET CASH PROVIDED (USED) BY CAPITAL FINANCING ACTIVITIES (8,673) (41,905) (51,251) (132,513)
CASH FLOWS FROM INVESTING ACTIVITIES:Interest and dividends received 298 611 1,671 3,700 Rental and other income - - - - Investment long-term 6 9 42 80
NET CASH PROVIDED (USED) BY INVESTING ACTIVITIES 304 620 1,713 3,780
NET INCREASE (DECREASE) IN CASH & 1,077 (19,002) (4,232) (26,183) CASH EQUIVALENTS
CASH & CASH EQUIVALENTS, JANUARY 1 32,416 79,107 196,441 430,253 CASH, RESTRICTED CASH & CASH EQUIVALENTS, DECEMBER 31 $ 33,493 $ 60,105 $ 192,209 $ 404,070
(amounts expressed in thousands)Page 1 of 4
ENTERPRISE FUNDSBUSINESS-TYPE ACTIVITIES
STATEMENT OF CASH FLOWSPROPRIETARY FUNDS
For the Year Ended December 31, 2014
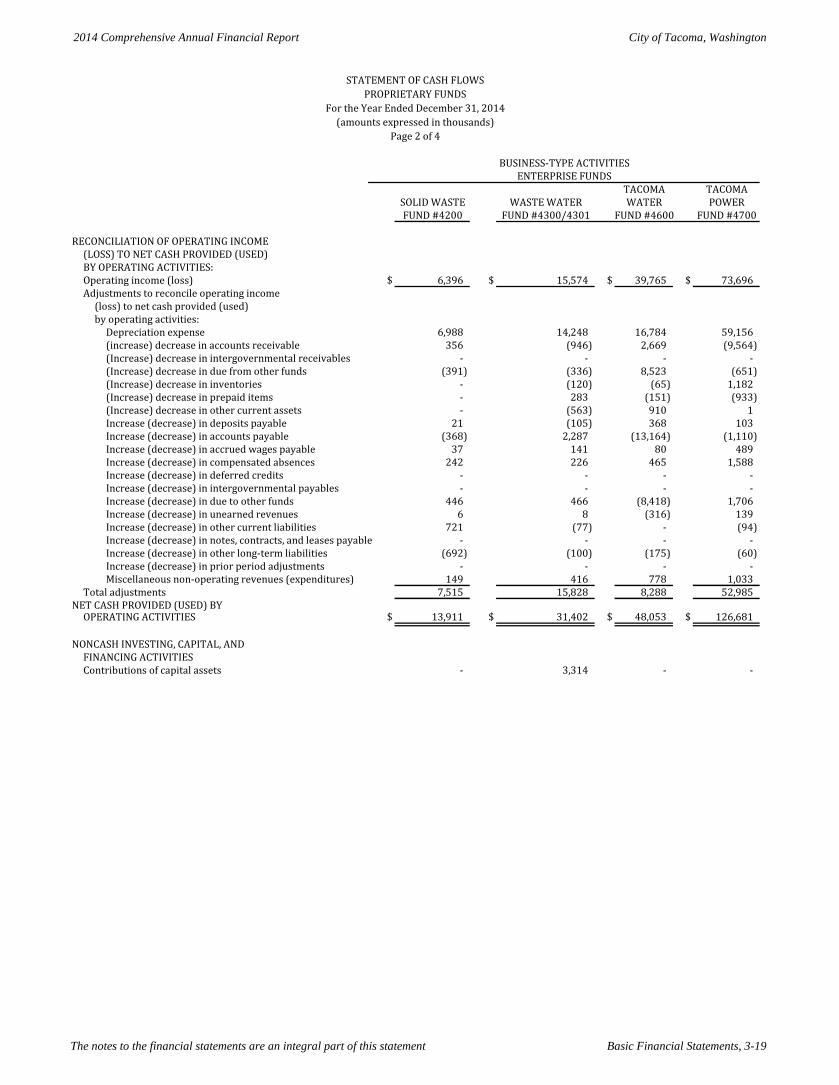
2014 Comprehensive Annual Financial Report City of Tacoma, Washington
The notes to the financial statements are an integral part of this statement Basic Financial Statements, 3-19
TACOMA TACOMASOLID WASTE WASTE WATER WATER POWERFUND #4200 FUND #4300/4301 FUND #4600 FUND #4700
RECONCILIATION OF OPERATING INCOME(LOSS) TO NET CASH PROVIDED (USED)BY OPERATING ACTIVITIES:Operating income (loss) $ 6,396 $ 15,574 $ 39,765 $ 73,696 Adjustments to reconcile operating income
(loss) to net cash provided (used)by operating activities:
Depreciation expense 6,988 14,248 16,784 59,156 (increase) decrease in accounts receivable 356 (946) 2,669 (9,564) (Increase) decrease in intergovernmental receivables - - - - (Increase) decrease in due from other funds (391) (336) 8,523 (651) (Increase) decrease in inventories - (120) (65) 1,182 (Increase) decrease in prepaid items - 283 (151) (933) (Increase) decrease in other current assets - (563) 910 1 Increase (decrease) in deposits payable 21 (105) 368 103 Increase (decrease) in accounts payable (368) 2,287 (13,164) (1,110) Increase (decrease) in accrued wages payable 37 141 80 489 Increase (decrease) in compensated absences 242 226 465 1,588 Increase (decrease) in deferred credits - - - - Increase (decrease) in intergovernmental payables - - - - Increase (decrease) in due to other funds 446 466 (8,418) 1,706 Increase (decrease) in unearned revenues 6 8 (316) 139 Increase (decrease) in other current liabilities 721 (77) - (94) Increase (decrease) in notes, contracts, and leases payable - - - - Increase (decrease) in other long-term liabilities (692) (100) (175) (60) Increase (decrease) in prior period adjustments - - - - Miscellaneous non-operating revenues (expenditures) 149 416 778 1,033
Total adjustments 7,515 15,828 8,288 52,985 NET CASH PROVIDED (USED) BY
OPERATING ACTIVITIES $ 13,911 $ 31,402 $ 48,053 $ 126,681
NONCASH INVESTING, CAPITAL, ANDFINANCING ACTIVITIESContributions of capital assets - 3,314 - -
(amounts expressed in thousands)Page 2 of 4
BUSINESS-TYPE ACTIVITIESENTERPRISE FUNDS
STATEMENT OF CASH FLOWSPROPRIETARY FUNDS
For the Year Ended December 31, 2014
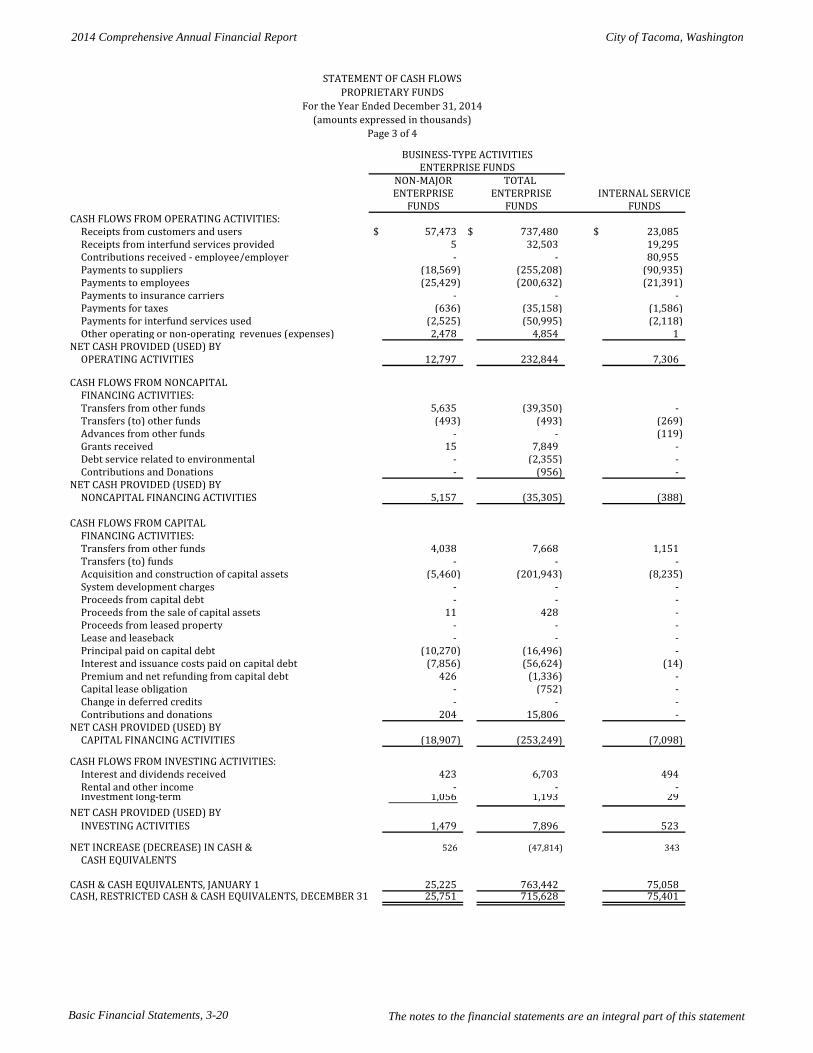
2014 Comprehensive Annual Financial Report City of Tacoma, Washington
Basic Financial Statements, 3-20
The notes to the financial statements are an integral part of this statement
NON-MAJOR TOTAL ENTERPRISE ENTERPRISE INTERNAL SERVICE
FUNDS FUNDS FUNDSCASH FLOWS FROM OPERATING ACTIVITIES:
Receipts from customers and users $ 57,473 $ 737,480 $ 23,085 Receipts from interfund services provided 5 32,503 19,295 Contributions received - employee/employer - - 80,955 Payments to suppliers (18,569) (255,208) (90,935) Payments to employees (25,429) (200,632) (21,391) Payments to insurance carriers - - - Payments for taxes (636) (35,158) (1,586) Payments for interfund services used (2,525) (50,995) (2,118) Other operating or non-operating revenues (expenses) 2,478 4,854 1
NET CASH PROVIDED (USED) BY OPERATING ACTIVITIES 12,797 232,844 7,306
CASH FLOWS FROM NONCAPITAL FINANCING ACTIVITIES:Transfers from other funds 5,635 (39,350) - Transfers (to) other funds (493) (493) (269) Advances from other funds - - (119) Grants received 15 7,849 - Debt service related to environmental - (2,355) - Contributions and Donations - (956) -
NET CASH PROVIDED (USED) BY NONCAPITAL FINANCING ACTIVITIES 5,157 (35,305) (388)
CASH FLOWS FROM CAPITAL FINANCING ACTIVITIES:Transfers from other funds 4,038 7,668 1,151 Transfers (to) funds - - - Acquisition and construction of capital assets (5,460) (201,943) (8,235) System development charges - - - Proceeds from capital debt - - - Proceeds from the sale of capital assets 11 428 - Proceeds from leased property - - - Lease and leaseback - - - Principal paid on capital debt (10,270) (16,496) - Interest and issuance costs paid on capital debt (7,856) (56,624) (14) Premium and net refunding from capital debt 426 (1,336) - Capital lease obligation - (752) - Change in deferred credits - - - Contributions and donations 204 15,806 -
NET CASH PROVIDED (USED) BY CAPITAL FINANCING ACTIVITIES (18,907) (253,249) (7,098)
CASH FLOWS FROM INVESTING ACTIVITIES:Interest and dividends received 423 6,703 494 Rental and other income - - - Investment long-term 1,056 1,193 29
NET CASH PROVIDED (USED) BY INVESTING ACTIVITIES 1,479 7,896 523
NET INCREASE (DECREASE) IN CASH & 526 (47,814) 343 CASH EQUIVALENTS
CASH & CASH EQUIVALENTS, JANUARY 1 25,225 763,442 75,058 CASH, RESTRICTED CASH & CASH EQUIVALENTS, DECEMBER 31 25,751 715,628 75,401
Page 3 of 4
BUSINESS-TYPE ACTIVITIESENTERPRISE FUNDS
(amounts expressed in thousands)
STATEMENT OF CASH FLOWSPROPRIETARY FUNDS
For the Year Ended December 31, 2014
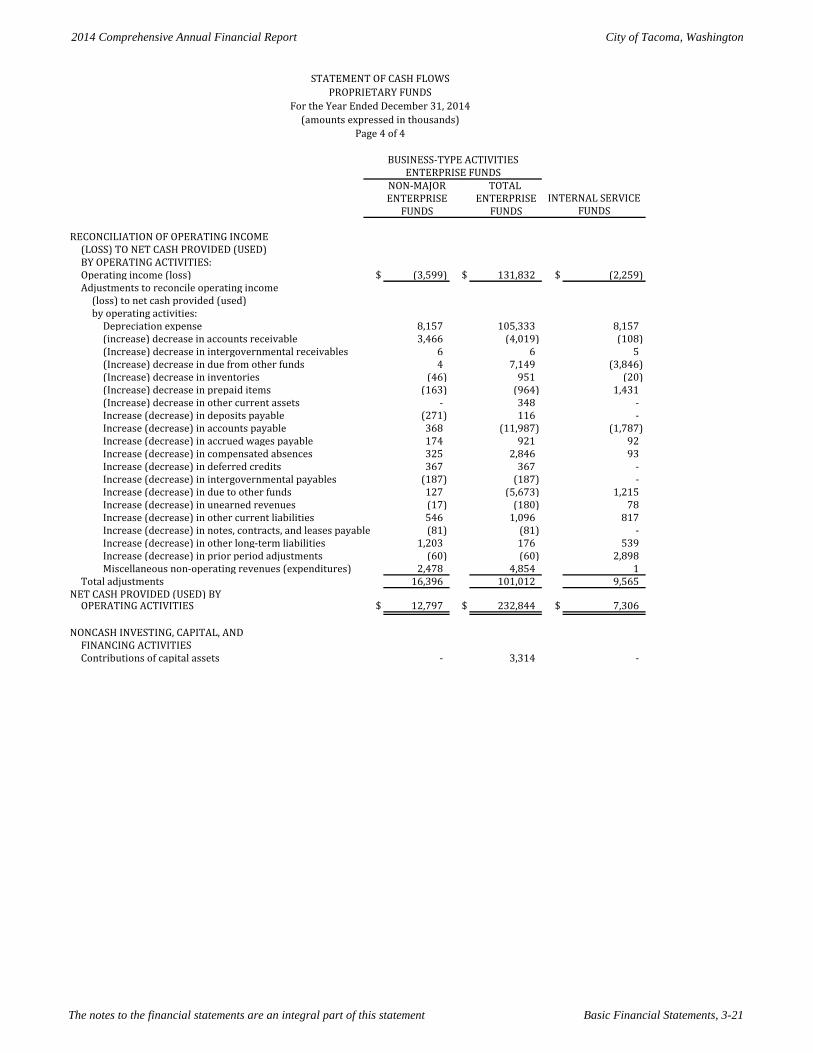
2014 Comprehensive Annual Financial Report City of Tacoma, Washington
The notes to the financial statements are an integral part of this statement Basic Financial Statements, 3-21
NON-MAJOR TOTAL ENTERPRISE ENTERPRISE
FUNDS FUNDS
RECONCILIATION OF OPERATING INCOME(LOSS) TO NET CASH PROVIDED (USED)BY OPERATING ACTIVITIES:Operating income (loss) $ (3,599) $ 131,832 $ (2,259) Adjustments to reconcile operating income
(loss) to net cash provided (used)by operating activities:
Depreciation expense 8,157 105,333 8,157 (increase) decrease in accounts receivable 3,466 (4,019) (108) (Increase) decrease in intergovernmental receivables 6 6 5 (Increase) decrease in due from other funds 4 7,149 (3,846) (Increase) decrease in inventories (46) 951 (20) (Increase) decrease in prepaid items (163) (964) 1,431 (Increase) decrease in other current assets - 348 - Increase (decrease) in deposits payable (271) 116 - Increase (decrease) in accounts payable 368 (11,987) (1,787) Increase (decrease) in accrued wages payable 174 921 92 Increase (decrease) in compensated absences 325 2,846 93 Increase (decrease) in deferred credits 367 367 - Increase (decrease) in intergovernmental payables (187) (187) - Increase (decrease) in due to other funds 127 (5,673) 1,215 Increase (decrease) in unearned revenues (17) (180) 78 Increase (decrease) in other current liabilities 546 1,096 817 Increase (decrease) in notes, contracts, and leases payable (81) (81) - Increase (decrease) in other long-term liabilities 1,203 176 539 Increase (decrease) in prior period adjustments (60) (60) 2,898 Miscellaneous non-operating revenues (expenditures) 2,478 4,854 1
Total adjustments 16,396 101,012 9,565 NET CASH PROVIDED (USED) BY
OPERATING ACTIVITIES $ 12,797 $ 232,844 $ 7,306
NONCASH INVESTING, CAPITAL, ANDFINANCING ACTIVITIESContributions of capital assets - 3,314 -
FUNDS
BUSINESS-TYPE ACTIVITIESENTERPRISE FUNDS
STATEMENT OF CASH FLOWSPROPRIETARY FUNDS
For the Year Ended December 31, 2014(amounts expressed in thousands)
Page 4 of 4
INTERNAL SERVICE
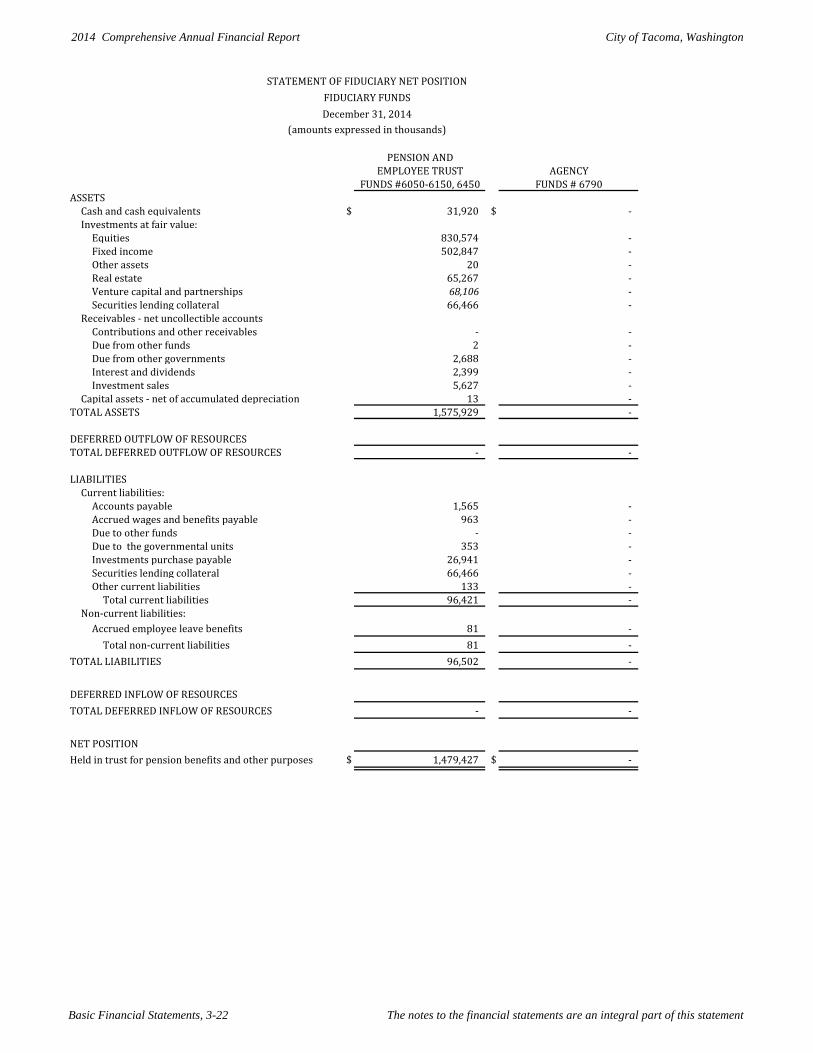
2014 Comprehensive Annual Financial Report City of Tacoma, Washington
Basic Financial Statements, 3-22 The notes to the financial statements are an integral part of this statement
PENSION ANDEMPLOYEE TRUST AGENCY
FUNDS #6050-6150, 6450 FUNDS # 6790ASSETS
Cash and cash equivalents $ 31,920 $ - Investments at fair value:
Equities 830,574 - Fixed income 502,847 - Other assets 20 - Real estate 65,267 - Venture capital and partnerships 68,106 - Securities lending collateral 66,466 -
Receivables - net uncollectible accountsContributions and other receivables - - Due from other funds 2 - Due from other governments 2,688 - Interest and dividends 2,399 - Investment sales 5,627 -
Capital assets - net of accumulated depreciation 13 - TOTAL ASSETS 1,575,929 -
DEFERRED OUTFLOW OF RESOURCESTOTAL DEFERRED OUTFLOW OF RESOURCES - -
LIABILITIESCurrent liabilities:
Accounts payable 1,565 - Accrued wages and benefits payable 963 - Due to other funds - - Due to the governmental units 353 - Investments purchase payable 26,941 - Securities lending collateral 66,466 - Other current liabilities 133 -
Total current liabilities 96,421 - Non-current liabilities:
Accrued employee leave benefits 81 - Total non-current liabilities 81 -
TOTAL LIABILITIES 96,502 -
DEFERRED INFLOW OF RESOURCESTOTAL DEFERRED INFLOW OF RESOURCES - -
NET POSITIONHeld in trust for pension benefits and other purposes $ 1,479,427 $ -
STATEMENT OF FIDUCIARY NET POSITIONFIDUCIARY FUNDSDecember 31, 2014
(amounts expressed in thousands)
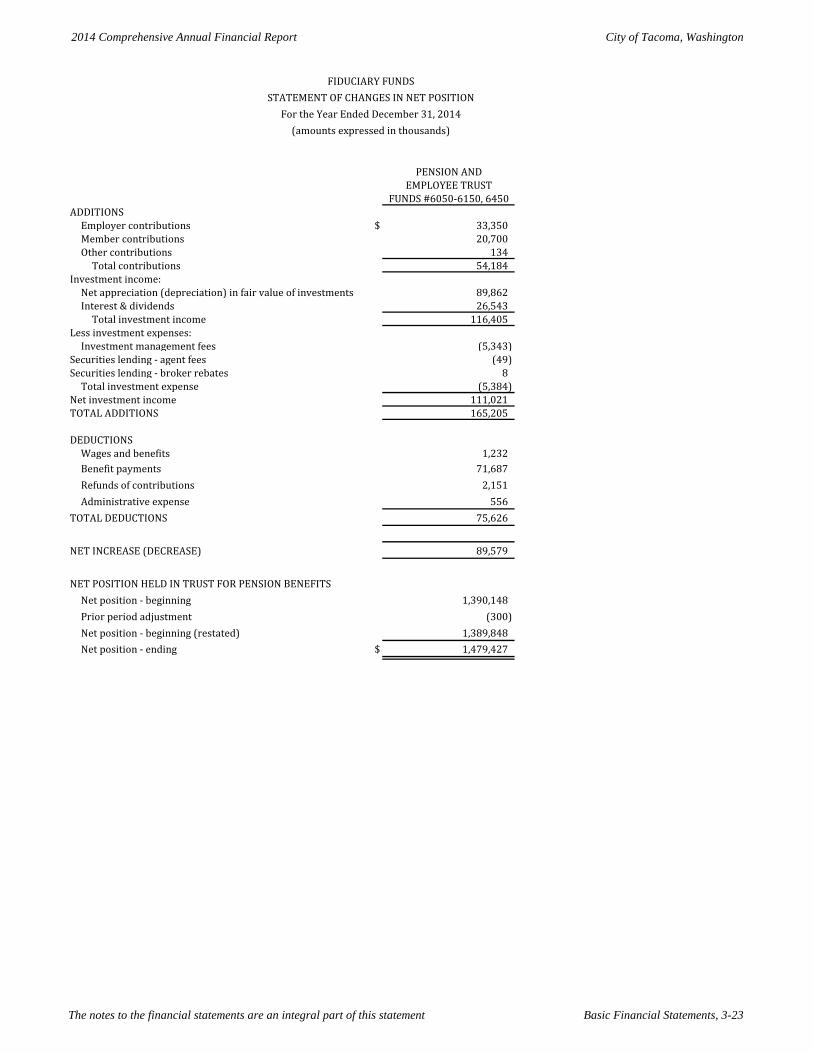
2014 Comprehensive Annual Financial Report City of Tacoma, Washington
The notes to the financial statements are an integral part of this statement Basic Financial Statements, 3-23
PENSION ANDEMPLOYEE TRUST
FUNDS #6050-6150, 6450ADDITIONS
Employer contributions $ 33,350 Member contributions 20,700 Other contributions 134
Total contributions 54,184 Investment income:
Net appreciation (depreciation) in fair value of investments 89,862 Interest & dividends 26,543
Total investment income 116,405 Less investment expenses:
Investment management fees (5,343) Securities lending - agent fees (49) Securities lending - broker rebates 8
Total investment expense (5,384) Net investment income 111,021 TOTAL ADDITIONS 165,205
DEDUCTIONSWages and benefits 1,232 Benefit payments 71,687 Refunds of contributions 2,151 Administrative expense 556
TOTAL DEDUCTIONS 75,626
NET INCREASE (DECREASE) 89,579
NET POSITION HELD IN TRUST FOR PENSION BENEFITSNet position - beginning 1,390,148 Prior period adjustment (300) Net position - beginning (restated) 1,389,848 Net position - ending $ 1,479,427
FIDUCIARY FUNDSSTATEMENT OF CHANGES IN NET POSITION
For the Year Ended December 31, 2014(amounts expressed in thousands)
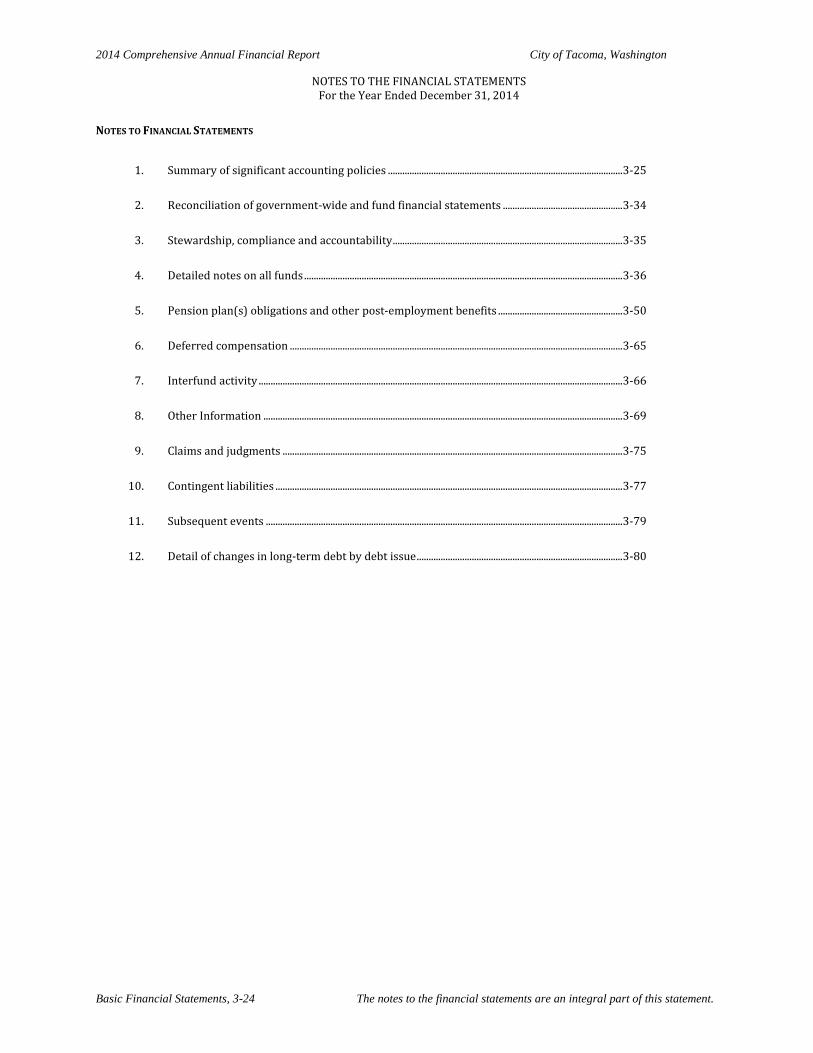
2014 Comprehensive Annual Financial Report City of Tacoma, Washington
NOTES TO THE FINANCIAL STATEMENTS For the Year Ended December 31, 2014
Basic Financial Statements, 3-24 The notes to the financial statements are an integral part of this statement.
NOTES TO FINANCIAL STATEMENTS
1. Summary of significant accounting policies .................................................................................................. 3-25
2. Reconciliation of government-wide and fund financial statements .................................................. 3-34
3. Stewardship, compliance and accountability ................................................................................................ 3-35
4. Detailed notes on all funds ..................................................................................................................................... 3-36
5. Pension plan(s) obligations and other post-employment benefits .................................................... 3-50
6. Deferred compensation ........................................................................................................................................... 3-65
7. Interfund activity ........................................................................................................................................................ 3-66
8. Other Information ...................................................................................................................................................... 3-69
9. Claims and judgments .............................................................................................................................................. 3-75
10. Contingent liabilities ................................................................................................................................................. 3-77
11. Subsequent events ..................................................................................................................................................... 3-79
12. Detail of changes in long-term debt by debt issue ...................................................................................... 3-80
2014 Comprehensive Annual Financial Report City of Tacoma, Washington
NOTES TO THE FINANCIAL STATEMENTS
For the Year Ended December 31, 2014
The notes to the financial statements are an integral part of this statement. Basic Financial Statements, 3-25
Note 1 Summary of significant accounting policies A. The reporting entity The City of Tacoma is a municipal corporation incorporated January 7, 1884. The City operates under a Council-Manager form of government, and under its charter has all powers granted by the constitution and laws of the State of Washington. The City provides the full range of services contemplated by statute or charter. Areas under City Council include:
1. City Manager functions: City Attorney, Community & Economic Development, Environmental Policy & Sustainability, Environmental Services, Finance, Fire, Governmental Relations, Hearing Examiner, Human Services, Information Technology, Library, Media & Communications, Neighborhood & Community Services, Planning & Development Services, Police, Public Assembly Facilities, and Public Works; and,
2. Utility functions: Power, Rail, and Water.
The accompanying financial statements present the City and its component units. Component units are required to be blended if: Management of the City has operational responsibility; or, Services are provided almost entirely to the City; or, Debts are expected to be paid almost entirely by resources of the City. Discretely presented component units are separate legal entities for which the City is financially accountable and there is a financial benefit/burden relationship with the City. Exclusion of these entities would cause the City’s financial statements to be misleading or incomplete. For related party transactions refer to Note 4 Section H. Blended Component Units: Tacoma Transportation Benefit District (TBD) is a blended component unit and is reported with the City’s reporting entity as a Special Revenue Fund. The authority to form a TBD is granted under Washington State RCW 35.21.225 and RCW 36.73.020. During 2011 City Council created the TBD, by ordinance No. 28099, for the purpose of acquiring, constructing, improving, providing, and funding transportation improvements consistent with state, regional, and local plans. City management has operational responsibility and services are provided entirely to the City. RCW 82.80.140 gives the TBD the authority to impose taxes, fees, charges, and tolls. The TBD approved Resolution No. TBD001 imposing a $20 vehicle registration fee within the district’s boundaries, effective for 2012. Financial statements for the TPD can be found in the Combining Statements located in the Financial Section of this report. Discretely presented Component Units: Tacoma Community Redevelopment Authority (TCRA) is a separate public development authority established through City ordinances and the laws of the State of Washington. TCRA was created to administer Housing and Urban Development (HUD) and Economic Development Administration (EDA) funds assisting the City in housing rehabilitation and business economic development projects. Separate financial statements for TCRA can be obtained from: TCRA, 747 Market Street, Room 1036, Tacoma, Washington 98402-3701. The Greater Tacoma Regional Convention Center Public Facilities District (the District) is a public corporation organized under the Laws of Washington, Chapter 165, 1999 Regular Session, Sections 1 through 23 and pursuant to an interlocal agreement between the Cities of Tacoma, Fife, University Place, Lakewood and Pierce County. Liability of the District is limited to the District’s assets with no recourse to the City of Tacoma assets or property. The District entered into an interlocal agreement with the City of Tacoma to assist finance, and otherwise facilitate the construction and operation of a Convention Center. The District imposed the 0.033 percent sales and use tax authorized by RCW 82.08 and 82.12. The District pays these revenues to the City of Tacoma primarily for the debt service on bonds issued by the City for the construction of the Convention Center. The District assigned the title to the Convention Center inclusive of real property, buildings, fixtures, furnishings, appurtenances and improvements to the City of Tacoma. Separate financial statements for the District can be obtained from: GTRCC PFD, c/o the City of Tacoma Finance Department, 747 Market Street, Room 132, Tacoma, Washington 98402-3773. The Foss Waterway Development Authority (FWDA or Authority), is a separate legal entity and presented as a discretely presented component unit in the City’s financial statements. The Authority was created on October 1, 1996 by Resolution No. 33513. Under the terms of an agreement between the City and the Authority, the Authority manages the redevelopment of property within and along the Thea Foss Waterway. The Authority serves to improve the environment, and along with the City, is taking steps to enhance the Waterway. Separate financial statements for the
2014 Comprehensive Annual Financial Report City of Tacoma, Washington
NOTES TO THE FINANCIAL STATEMENTS For the Year Ended December 31, 2014
Basic Financial Statements, 3-26 The notes to the financial statements are an integral part of this statement.
Authority can be obtained from: Foss Waterway Development Authority, c/o the City of Tacoma Finance Department, 747 Market Street, Room 132, Tacoma, Washington 98402-3773. Joint Ventures: The City participates in two joint ventures: the South Sound 911 and the Tacoma-Pierce County Health Department.
South Sound 911 On November 8, 2011, voters in Pierce County approved a county-wide one-tenth of one percent local sales and use tax to fund costs associated with regional 911 system and facility improvements. Development of the regional system is being managed by South Sound 911, an interlocal agency created by Pierce County, the City of Tacoma, the City of Lakewood, the City of Fife and West Pierce Fire and Rescue pursuant to RCW 39.34. All services previously provided by the Law Enforcement Support Agency (LESA) are now being provided by South Sound 911. On December 17, 2012, all LESA employees were transitioned to the new agency. All assets and liabilities were transferred to South Sound 911 on the official transition date of January 1, 2013. During the next few years, Public Safety Answering Points (PSAP’s) managed by the City of Tacoma, City of Fife and West Pierce Fire and Rescue will transition to South Sound 911. In 2012, South Sound 911 established its first Policy Board consisting of nine voting members. Members of the Policy Board include:
One member of the Pierce County Council; The Pierce County Executive; The Mayor of Tacoma; One member of the Tacoma City Council; The Mayor or one member of the Lakewood City Council; The Pierce County Sheriff; The Mayor or one member of the Fife City Council; One Fire Commissioner of West Pierce Fire & Rescue; One Mayor or Councilmember of a city or town within Pierce County with a population under (50,000) fifty-thousand
residents, provided that such city or town contracts with South Sound 911 or a Member Agency. Such position shall be filled for a two-year term by appointment through a vote of the Policy Board.
South Sound 911 also established an Operations Board under the authority of the Policy Board. The members of the Operations Board are the members of the Law Enforcement Services and Fire Services Committees. Each committee will have (1) one vote. If the Operations Board cannot reach consensus, the deciding vote will be cast by the Policy Board.
Tacoma-Pierce County Health Department The Health Department is a joint venture of the City and County providing personal and environmental health services throughout the County. The Department provides community leadership in protecting the public’s health, preventing health problems, and promoting healthy and safe living. The Health Department was created pursuant to the provisions of Chapter 70.08 of the Revised Code of Washington (RCW) to serve the needs of the constituents of the City of Tacoma, Pierce County, and other cities and towns within the County. The operations of the Health Department are governed by an agreement, dated May 23, 2006, between the City of Tacoma and Pierce County. The Health Department is managed by the Board of Health, which consists of the Pierce County Executive or a duly designated representative, three members of the County Council, Mayor of the City of Tacoma or a duly designated representative, one member of the City Council, one member representing Pierce County Cities and Towns Association, and one member-at-large appointed by the first six representatives. The City of Tacoma and Pierce County are responsible for its debts and are entitled to the surplus.
Financial information for both entities is included in Note 8 Section G. The City of Tacoma however, does not report an equity interest in the Government-wide financial statements. B. Government-wide and fund financial statements Basic financial statements are presented at both the government-wide and fund financial level. Both levels of statements categorize primary activities as either governmental or business type. Governmental activities, which are normally supported by taxes and intergovernmental revenues, are reported separately from business-type activities, which rely to a significant extent on fees and charges for support. Likewise, the primary government is reported separately from certain legally separate component units for which the primary government is financially accountable.
2014 Comprehensive Annual Financial Report City of Tacoma, Washington
NOTES TO THE FINANCIAL STATEMENTS
For the Year Ended December 31, 2014
The notes to the financial statements are an integral part of this statement. Basic Financial Statements, 3-27
Government-wide financial statements, the Statement of Net Position and the Statement of Activities, report information on all non-fiduciary activities of the primary government and its component units. For the most part, the effect of interfund activity has been removed from these statements. Exceptions to this general rule are payments-in-lieu of taxes, charges between the City’s utilities and various other functions of the government, and some indirect cost allocations between the general fund and other funds of the City. Eliminations of these charges would distort the direct costs and program revenues reported for the various functions concerned. The Statement of Activities demonstrates the degree to which the direct expenses of a given governmental function or business segment are offset by program revenues. Direct expenses are those that are clearly identifiable with a specific function or segment. Program revenues include 1) charges to customers or applicants who purchase, use, or directly benefit from goods, services, or privileges provided by a given function or segment and 2) grants and contributions that are restricted to meeting the operational or capital requirements of a given function or segment. Taxes, transfers between funds, and other items not properly included among program revenues are reported instead as general revenues.
Separate financial statements are provided for governmental funds, proprietary funds, and fiduciary funds, even though the latter are excluded from the government-wide financial statements. Major individual governmental funds and major individual enterprise funds are reported as separate columns in the fund financial statements. C. Measurement focus, basis of accounting and financial statement presentation The government-wide financial statements are reported using the economic resources measurement focus and the accrual basis of accounting, as are the proprietary fund and fiduciary fund financial statements. Revenues are recorded when earned and expenses are recorded when a liability is incurred, regardless of the timing of related cash flows. Property taxes are recognized as revenues in the year for which they are levied. Grants and similar items are recognized as revenue as soon as all eligibility requirements imposed by the provider have been met. GASB issued and the City implemented, in 2014 (as applicable), the following:
Statement No. 67, issued in June 2012, Financial Reporting for Pension Plans; an amendment for GASB Statement No 25, effective for financial statements for periods beginning after June 15, 2013.
Statement No. 69, issued in January 2013, Government Combinations and Disposals of Government Operations, effective for financial statements beginning after December 15, 2013; and,
Statement No. 70, issued in April 2013, Accounting and Financial Reporting for Nonexchange Financial Guarantees, effective for financial statements beginning after June 15, 2013.
The City uses encumbrance accounting. Purchase orders, contracts and other commitments are recorded as encumbrances. Encumbrances at year-end are no longer specifically reported as reservations of fund balances for governmental type funds. They are included in the restricted, committed, or assigned fund balance as defined by GASB Statement No. 54. Encumbrances outstanding at the end of the biennium are reappropriated at the beginning of the next biennium. The amount of encumbrances, expressed in thousands, needed to pay commitments related to purchase orders and contracts that remain unperformed at year-end are as follows:
General Fund
Transportation
Capital &
Engineering Non-major Funds
1,949$ 16,870$ 23,515$
Governmental fund financial statements are reported using the current financial resources measurement focus and the modified accrual basis of accounting. Revenues are recognized as soon as they are both measurable and available. Revenues are considered available when they are collectible within the current period or soon enough thereafter to pay liabilities of the current period. For this purpose, the City considers revenues to generally be available if they are collected within sixty (60) days of the end of the current fiscal period. Expenditures are generally recorded when a
2014 Comprehensive Annual Financial Report City of Tacoma, Washington
NOTES TO THE FINANCIAL STATEMENTS For the Year Ended December 31, 2014
Basic Financial Statements, 3-28 The notes to the financial statements are an integral part of this statement.
liability is incurred and when goods and services are received, as under accrual accounting. However, debt services expenditures, as well as expenditures related to compensated absences and claims and judgments, are recorded only when payment is due. Franchise fees, licenses, and interest associated with the current fiscal period are all considered to be susceptible to accrual and so have been recognized as revenues of the current fiscal period. Only the portion of special assessments receivable due within the current fiscal period is considered to be susceptible to accrual as revenue of the current period. Deferred Inflows of Resources includes property taxes that were not available to finance expenditures of the current period and grant revenues received in advance. Detailed information on property taxes is contained in the Statistical Section, Table 8. All other revenue items are considered to be measurable and available only when cash is received by the government.
Since the governmental fund statements are presented on a different measurement focus and basis of accounting than the government-wide statements governmental column, a reconciliation is necessary to explain the adjustments needed to transform the fund based financial statements into the governmental column of the government-wide presentation. In addition, the City has two Internal Service Funds that provides 100% support to Business-type Activities only. A reconciliation is provided to explain the adjustment needed to transform the fund based financial statements into the business-type column of the government-wide presentation. These reconciliations are included as part of the basic financial statements. Proprietary funds distinguish operating revenues and expenses from non-operating items. Operating revenues and expenses generally result from providing services and producing and delivering goods in connection with a proprietary fund’s principal ongoing operations. The principal operating revenues of the City’s various utilities and internal service funds are charges to customers for sales and services. The City enterprise funds also recognize as operating revenue the portion of tap fees intended to recover the cost of connecting new customers to the system. Operating expenses for enterprise and internal service funds include the cost of sales and services, administrative expenses and depreciation on capital assets. All revenues and expenses not meeting this definition are reported as non-operating revenues and expenses. The City reports the following major governmental funds:
The General fund (#0010) is the government’s primary operating fund. It accounts for all financial resources of the general government, except those required to be accounted for in another fund.
The Transportation Capital and Engineering fund (#3-1060) accounts for maintenance, engineering, and
construction of city streets. The City reports the following major proprietary funds:
The Solid Waste fund (#4200) provides solid waste collection and disposal services for residential and commercial customers. Services include recycling, long-haul to an outside landfill, and disposal in the City owned landfill.
The Wastewater and Surface Water (Sewer) fund (#4300-01) accounts for the planning, design, construction,
operation, and maintenance of the Wastewater and Surface water facilities owned by the City.
The Tacoma Water fund (#4600) accounts for the activities of the City’s water distribution system.
The Tacoma Power fund (#4700) accounts for the activities of the City’s electric production and distribution operations.
Additionally, the City reports the following non-major fund types: Special Revenue Funds:
Courts Special Revenue fund (#1020) accounts for costs associated with the Court system. Council Contingency fund (#1030) establishes reserves for Council contingencies. This fund is reported within
the General fund. Public Works Street fund (#1065) accounts for street engineering and administration services.
2014 Comprehensive Annual Financial Report City of Tacoma, Washington
NOTES TO THE FINANCIAL STATEMENTS
For the Year Ended December 31, 2014
The notes to the financial statements are an integral part of this statement. Basic Financial Statements, 3-29
Transportation Benefit District (#1070) accounts for revenues and disbursement to the City of funds collected within the Transportation Benefit District. These funds are transferred to the Transportation Capital and Engineering fund for the maintenance of City streets.
2% Gross Earnings Tax Fund (#1080) accounts for the street maintenance funded through gross earnings taxes. Fire Department fund (#1090) accounts for expenditures related to the specific revenues or grants for fire
services. Property Management/Street Vacation fund (#1100) accounts for costs associated with Public Works Facilities
and Street Right-of-ways. Local Improvement Guarantee fund (#1110) provides for the guarantee of Local Improvement Bond
obligations. Public Works Paths and Trails fund (#1140) was created for the purpose of creating and maintaining paths and
trails within the City of Tacoma. Building and Land Use Services fund (#1145) was created for the purpose of managing code violations and
preserving historical buildings. Fire Department EMS fund (#1155) accounts for costs associated with the emergency management. Tourism fund (#1180) was created to promote use of the convention center and to promote tourism for the
City. Neighborhood and Community Services fund (#1185) accounts for neighborhood and community services to
protect human rights and provide services to improve neighborhoods and households. Community and Economic Development fund (#1195) was created to promote economic development for the
City. Library fund (#1200) accounts for costs associated with the operation of the Library system. Finance Historically Underutilized Business (HUB) fund (#1236) accounts for activities which provide
opportunities to qualified small businesses doing business with the City. Police fund (#1267) accounts for cost related to specific special revenues or grants for police services. Municipal Cable fund (#1431) supports the accounting for TV Tacoma, the City’s television station. Human Resources Special Revenue fund (#1500) accounts for activities within the human resources
department. Traffic Enforcement, Engineering and Education fund (#1650) manages the “red light” traffic camera program. Unclaimed Property fund (#1-6330) accounts for assets held by the City (primarily uncashed checks) until
owners can be located. Debt Service Funds:
Voted Bonds fund (#2010) accounts for the debt service of unlimited general obligation bonds issued by the City of Tacoma.
Non-voted Bonds fund (#2035) accounts for the debt service of limited general obligation bonds issued by the City of Tacoma.
CED PWTF Loans fund (#2038) accounts for the debt service of obtaining public works trust fund loans. 2001 LTGO Refunding fund (#2039) accounts for the debt service of the 2001 LTGO refunding bonds. 2009 LTGO Bonds Series A-F fund (#2040) accounts for the debt service of the 2009 LTGO bonds. 2010 LTGO Bonds fund (#2041) accounts for the debt service of the 2010 LTGO bonds. 2013 LTGO Bonds (#2042) accounts for the debt service of the 2013 LTGO Bonds. Consolidated LID Bond Redemption fund (#2-7999) accounts for the debt service related to LID No. 54.
Capital Project Funds:
1997 Bond Issue fund (#3209) accounts for the capital expenditures associated with the proceeds obtained from the 1997 Bond Issue.
Capital Project funds (#3211) accounts for the various capital expenditures. 2002 Police Facility fund (#3216) accounts for the construction costs associated with the construction of the
police facility. Parking Garage fund (#3217) accounts for construction costs associated with the parking garage. 2009 LTGO Capital Projects fund (#3118) accounts for the capital expenditures associated with the proceeds
obtained from the 2009 LTGO Bond Issue. 2010 LTGO Capital Projects fund (#3220) accounts for various capital expenditures funded by the 2010 LTGO
bond issue. LID Interim Financing fund (#3-7070) is used to provide interim financing during the formation and
construction of local improvement district projects.
2014 Comprehensive Annual Financial Report City of Tacoma, Washington
NOTES TO THE FINANCIAL STATEMENTS For the Year Ended December 31, 2014
Basic Financial Statements, 3-30 The notes to the financial statements are an integral part of this statement.
Enterprise Funds:
Permit Services fund (#4110) was created to track the revenues generated from permits and expenditures incurred directly related to the permitting process.
Tacoma Rail Mountain Division fund (#4120) accounts for operation costs of the rail system. Parking Operating fund (#4140) accounts for the City’s parking facilities. Convention Center fund (#4165) accounts for activities associated with operating the Convention Center. Cheney Stadium fund (#4170) accounts for activities associated with operating Cheney Stadium. Tacoma Dome fund (#4180) accounts for activities associated with operating the Tacoma Dome. Performing Arts fund (#4190) was created to track costs associated with the Performing Arts Center, Rialto
Theater, Broadway Theater District and Pantages. Union Station fund (#4450) accounts for the thirty year lease with the Federal Government who uses Union
Station as a Federal Courthouse. Tacoma Rail Belt Line Division fund (#4500) accounts for costs for the operations of the rail system between
Tacoma and the Olympia area. Low Income Assistance fund (#4805) was created to accept voluntary donations to help low income customers
pay utility bills. Power Conservation fund (#4850) was created to account for power conservation projects and payment of debt
issued. Internal Service Funds:
Finance Department fund (#5007) accounts for the operation of the Finance Division. Budget and Research fund (#5016) accounts for the operations of the Budget Division. BSIP Project fund (#5027) accounts for the Business Systems Improvement Project. Graphics Services fund (#5042) accounts for the general government leased copiers. TPU Fleet Services fund (#5050) accounts for costs of maintaining and replacing City vehicles for Business-type
activities. Youth Build Tacoma fund (#5086) accounts for program costs to assist residents of the City ages 18-24 gain the
necessary work ethics for sustainable employment. Public Works Equipment Rental fund (#5400) accounts for costs of maintaining and replacing City vehicles for
General Government activities. Asphalt Plant fund (5453) accounts for the manufacturing of asphalt sold to other funds within the City of
Tacoma. Communications Equipment – Replacement Reserves fund (#5540) accounts for radio communication
equipment. Third Party Liability Claims fund (#5550) was created to track costs related to our self-insurance program. Unemployment Compensation fund (#5560) accounts for the City’s self-insurance unemployment
compensation costs. Worker’s Compensation fund (#5570) accounts for the City’s self-insurance worker’s compensation costs. Facilities Operations and Telecommunications fund (#5700) accounts for maintenance and operation cost
associated with all City of Tacoma buildings. Information Systems fund (#5800) provides computer and system support for all City departments. Health Benefits Trust fund (#5-64xx) provides accounting for self-insurance to all City’s cost for healthcare. Self-Insurance Claims fund (#5-4800) provides accounting for self-insurance to Business-type Activities of the
City of Tacoma departments including provisions for losses on property, liability, workers compensation, unemployment compensation.
Trust Funds:
Deferred Compensation fund (#6450) accounts for activities related to mandatory and optional payroll deductions.
Tacoma Employee Retirement Systems fund (#6100) accounts for the activities of the City’s retirement system, which accumulates resources for pension benefit payments to qualified City employees
Relief & Pension Police fund (#6120) accounts for the activities related to the police LEOFF pension system. Relief & Pension Firefighters fund (#6150) accounts for the activities related to the fire LEOFF pension system. Payroll Clearing fund (#6450) accounts for monies held by the City but not yet disbursed related to various
payroll deductions.
2014 Comprehensive Annual Financial Report City of Tacoma, Washington
NOTES TO THE FINANCIAL STATEMENTS
For the Year Ended December 31, 2014
The notes to the financial statements are an integral part of this statement. Basic Financial Statements, 3-31
Agency Fund:
Tacoma Urban Network fund (#6790) an agency fund for Tacoma Urban Network provides social services for children and youth.
The City has no private purpose trust funds or permanent funds. D. Assets, liabilities and net position or fund balances 1. Cash and investments The City’s cash and cash equivalents include cash on hand, cash working fund, restricted cash, short term investments with original or remaining maturities of three months or less when purchased, and cash and investments in the City-wide investment pool. Investments, including equity in pooled cash and investments are stated at fair value, except for the Pension trust fund which is reported on a trade date basis, at fair value. No direct investments restricted or otherwise, are considered to be cash equivalents. The City uses a pooled investment portfolio. Each fund receives interest based on a pro-rata share of its cash balance to the total cash invested. Portfolio earnings are distributed monthly based on average daily cash balances of the participating funds. 2. Receivables and payables Activity between funds that are representative of lending/borrowing arrangements outstanding at year-end are referred to as either “due to/from other funds,” if current, or “advances to/from other funds,” if long-term. All other outstanding balances between funds are reported as “due to/from other funds.” Any residual balances outstanding between the governmental activities and the business-type activities are reported in the government-wide financial statements as “internal balances.”
Advances between funds, as reported in the governmental fund financial statements, are included in the nonspendable classification in fund balance unless the proceeds from collection are restricted, committed, or assigned. Property taxes are levied in November and become a property lien as of January 1. The first half is due April 30 and the second half on October 31. If the first half is not paid by April 30, the total annual tax becomes delinquent. Property taxes are collected by Pierce County and remitted to the City monthly. An allowance for uncollectible accounts is deemed unnecessary as delinquent taxes become an enforceable lien on the property. Property taxes collected within 60 days after year-end are considered measurable and available and are recognized as revenues in the fund statements. The total levy is recognized as revenue in the government-wide financial statements, regardless of when collected. Utility receivables are shown net of an allowance for uncollectables. The uncollectible amount is established based on an analysis of historical experience. Allowances for other receivables are not utilized because the amounts are not material.
Notes and contracts receivable signed between the City and/or the Tacoma Community Redevelopment Authority (TCRA) and various parties represent economic development efforts of either a business nature or with homeowners. A large majority of the Power utility notes and contracts receivable represent energy conservation efforts between the City and homeowners or businesses. 3. Inventories and prepaid items Inventories for proprietary funds are valued at first-in/first out, moving average cost method, or lower of cost or market, depending on the fund. Inventories of governmental funds are recorded as expenditures when consumed rather than when purchased. Certain payments to vendors reflect costs applicable to future accounting periods and are recorded as prepaid items in both government-wide and fund financial statements. Prepaid items accounted for under the consumption method and are expensed over the period the services are provided rather than when purchased. 4. Restricted assets Restricted assets in the enterprise funds are monies which are restricted by legal or contractual requirements. These assets are generally intended for either construction of capital assets or for the repayment of debt. See Note 4-G for further information.
2014 Comprehensive Annual Financial Report City of Tacoma, Washington
NOTES TO THE FINANCIAL STATEMENTS For the Year Ended December 31, 2014
Basic Financial Statements, 3-32 The notes to the financial statements are an integral part of this statement.
5. Capital assets Capital assets; which include land, property, plant, equipment, and work in progress, are reported in the applicable governmental or business-type activities columns in the government-wide financial statements. Capital assets are defined by the City as assets with an initial, individual cost of $5,000 or more and an estimated life in excess of one year except for land, easements, rights of way, infrastructure and buildings and improvements. Land is capitalized regardless of cost. Easements and rights of way are capitalized if their size is at least 750 square feet. Infrastructure capitalization threshold is $50,000 or more. Building and infrastructure improvements are capitalized when the cost is greater than 25% of the asset’s original value and increases its useful life or service capacity. Such assets are recorded at historical cost or estimated historical cost when purchased or constructed. Donated capital assets are recorded at estimated fair market value at the date of donation. The costs of normal maintenance and repairs that do not add to the value or the life of the asset are expensed. The interest on bond proceeds for constructed capital assets in the utility funds are capitalized during the construction phase.
Depreciation on all capital assets is recorded as an allocated expense in the government-wide Statement of Activities and in the proprietary fund statements. Capital assets are reported net of depreciation. The City uses a combination of group depreciation and straight-line depreciation over the life of the assets. The estimated useful lives for all City funds are:
Property, plant, and equipment 3-100 years
Water Plant 200 years
Parks 33 years
Library materials 5 years
Intangibles 3-25 years
Infrastructure 5-60 years 6. Compensated absences The City has two different policies for compensated absences. The City’s original policy allows employees to accrue vacation based on the number of years worked with a maximum accrual equal to the amount earned in a two-year period. These employees also accrue one day of sick leave per month without any ceiling on the maximum accrued. An employee is entitled to 100% of the value of the vacation leave; 25% of the value of the sick leave at retirement or death, or 10% of the value of the sick leave upon termination for any other reason. Under a revised City policy, employees earn Personal Time off (PTO) without distinction between vacation and sick leave with a maximum accrual of 960 hours. Employees who worked for the City prior to the change, or are covered by a collective bargaining agreement that provides only for vacation and sick leave could choose to stay with the original policy or may opt to convert to the new policy. The amount of leave earned is based on years of service. The Tacoma Public Library has slightly different rules governing sick leave and vacation leave, but these differences are not considered material to the City’s financial statements. 7. Long-term obligations In the government-wide financial statements and the proprietary fund financial statements, long-term debt and other long-term obligations are reported as liabilities in the applicable governmental activities, business-type activities, or proprietary fund type statement of net position. Bond premiums and discounts are deferred and amortized over the life of the bonds using the straight line method or weighted average of the bonds outstanding. Bonds payable are reported net of the applicable bond premium or discount. In governmental fund financial statements, bond premiums and discounts and bond issuance costs are treated as expenditures of the current period. The face amount of debt issued is reported as other financing sources while discounts and issuance costs are reported as debt service expenditures.
2014 Comprehensive Annual Financial Report City of Tacoma, Washington
NOTES TO THE FINANCIAL STATEMENTS
For the Year Ended December 31, 2014
The notes to the financial statements are an integral part of this statement. Basic Financial Statements, 3-33
8. Fund equity Fund balance The City of Tacoma implemented Governmental Accounting Standards Board (GASB) Statement No. 54 in 2011. For governmental fund financial statements fund balances are reported in five classifications.
1. Nonspendable: Includes amounts that are not in a spendable form, such as inventories, prepaid items, long-term interfund receivables, and amounts that are legally or contractually required to be maintained intact or required to be retained in perpetuity, such as the principal of an endowment fund.
2. Restricted: Includes amounts that can be spent only for the specific purposes stipulated by external resource providers. Amounts should be reported as restricted when constraints placed on use of resources are either (1) externally imposed by creditors (such as through debt covenants), grantors, contributors, or laws or regulations of other governments; or (2) imposed by law through constitutional provisions or enabling legislation.
3. Committed: Fund Balance can only be used for specific purposes as determined by formal action by the City Council. The City Council is the highest level of decision-making authority for the government that can, by adoption of an ordinance prior to the end of the fiscal year, commit fund balance. Once adopted, the limitation imposed by the ordinance remains in place until a similar action is taken to remove or revise the limitation. The amount committed in the General Fund was adopted by City Council, Ordinance #19315, on March 30. 1971 and revised by Ordinance #22569, on November 24, 1981. The amount committed in the 2% Gross Earnings Tax Fund was adopted by City Council, Ordinance #28173 on September 24, 2013.
4. Assigned: Includes amounts that have been allocated by the General Fund through the encumbrance process, previously classified as unassigned. The authority to assign funds is delegated to City Management through the adoption of the biennium budget by the City Council. Fund balances of special revenue funds, debt service funds, capital project funds, that are not classified as nonspendable, restricted, or committed will be classified as assigned for the purpose of the fund. The authority to create funds is determined by formal action by the City Council, by adoption of an ordinance, or by state statue.
5. Unassigned: Includes amounts that do not fall into one of the above four categories. The General Fund is the only fund that should report this category as a positive fund balance. In other governmental funds, if the expenditures incurred for specific purposes exceeds the amounts, restricted, committed, or assigned to those purposes, it may be necessary to report a negative unassigned fund balance.
It is the policy of the City of Tacoma to spend funds in the following order:
1. Restricted 2. Committed 3. Assigned 4. Unassigned
Use of resources will be spent in the following hierarchy:
1. Bond Proceeds 2. Federal Funds 3. State Funds 4. Local Non-city Funds 5. City Funds
For detailed information on fund balances of governmental funds, please refer to Note 4 J. Net position Proprietary fund financial statements report reservations of net position amounts that are not available for appropriation or are legally restricted by outside parties for use for specific purposes. Restricted net position is subject to restrictions by creditors, grantors, contributors, or laws or regulations of other governments or imposed by law through constitutional provisions or enabling legislation.
2014 Comprehensive Annual Financial Report City of Tacoma, Washington
NOTES TO THE FINANCIAL STATEMENTS For the Year Ended December 31, 2014
Basic Financial Statements, 3-34 The notes to the financial statements are an integral part of this statement.
Note 2 Reconciliation of government-wide and fund financial statements A. Explanation of certain differences between the governmental fund balance sheet and the government-wide statement of net position The governmental fund balance sheet includes reconciliation between fund balances—total governmental funds and net position —governmental activities as reported in the government-wide statement of net position. As explained in Note 1 C, this reconciliation is necessary because of the differences in accounting basis, most significantly the differences in accounting for capital assets and debt. One element of the reconciliation explains: “Long-term liabilities, including bonds payable, are not due and payable in the current period and therefore are not reported in the funds.” The details of these dollar differences are as follows: (amounts expressed in thousands)
Bonds and leases payable (198,852)$
Discount on bond issuance 68
Premium on bond issuance (1,893)
Net other post employment benefits obligation (49,703)
Compensated absences (16,218)
Sub-total (266,598)
Net pension obligation (9,608)
Net adjustment to reduce fund balance
for total governmental funds to arrive at
net position for governmental activities (276,206)$
B. Explanation of certain differences between the governmental fund statement of revenues, expenditures, and changes in fund balances and the government-wide statement of activities The governmental fund statement of revenues, expenditures and changes in fund balances includes reconciliation between net changes in fund balances—total governmental funds and changes in net position of governmental activities as reported in the government-wide statement of activities. One element of the reconciliation explains: “Governmental funds report capital outlays as expenditures. However, in the statement of activities the cost of those assets is allocated over their estimated useful lives and reported as depreciation expense.” The details of these dollar differences are as follows: (amounts expressed in thousands)
Capital Outlay $ 25,969
Depreciation Expense (44,924)
Net adjustment to increase net changes
in fund balances - total governmental
funds to arrive at changes in net position
of governmental activities $ (18,955)
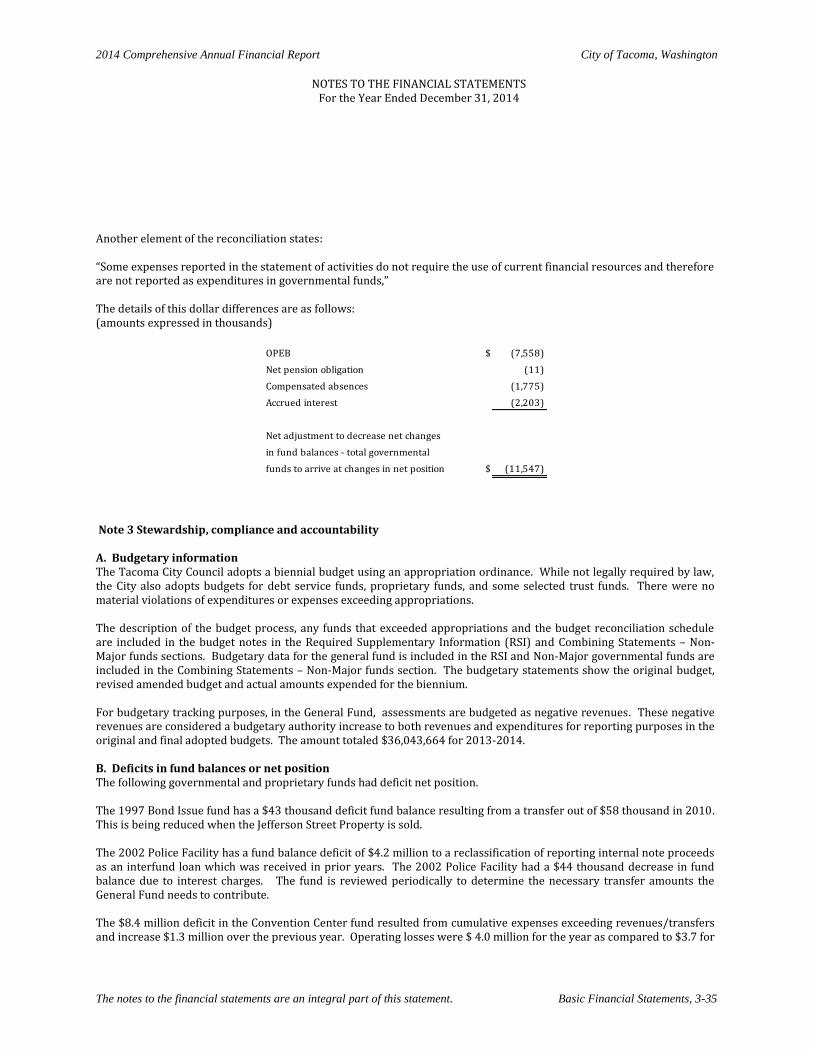
2014 Comprehensive Annual Financial Report City of Tacoma, Washington
NOTES TO THE FINANCIAL STATEMENTS
For the Year Ended December 31, 2014
The notes to the financial statements are an integral part of this statement. Basic Financial Statements, 3-35
Another element of the reconciliation states: “Some expenses reported in the statement of activities do not require the use of current financial resources and therefore are not reported as expenditures in governmental funds,” The details of this dollar differences are as follows: (amounts expressed in thousands)
OPEB $ (7,558)
Net pension obligation (11)
Compensated absences (1,775)
Accrued interest (2,203)
Net adjustment to decrease net changes
in fund balances - total governmental
funds to arrive at changes in net position $ (11,547)
Note 3 Stewardship, compliance and accountability A. Budgetary information The Tacoma City Council adopts a biennial budget using an appropriation ordinance. While not legally required by law, the City also adopts budgets for debt service funds, proprietary funds, and some selected trust funds. There were no material violations of expenditures or expenses exceeding appropriations. The description of the budget process, any funds that exceeded appropriations and the budget reconciliation schedule are included in the budget notes in the Required Supplementary Information (RSI) and Combining Statements – Non-Major funds sections. Budgetary data for the general fund is included in the RSI and Non-Major governmental funds are included in the Combining Statements – Non-Major funds section. The budgetary statements show the original budget, revised amended budget and actual amounts expended for the biennium. For budgetary tracking purposes, in the General Fund, assessments are budgeted as negative revenues. These negative revenues are considered a budgetary authority increase to both revenues and expenditures for reporting purposes in the original and final adopted budgets. The amount totaled $36,043,664 for 2013-2014. B. Deficits in fund balances or net position The following governmental and proprietary funds had deficit net position. The 1997 Bond Issue fund has a $43 thousand deficit fund balance resulting from a transfer out of $58 thousand in 2010. This is being reduced when the Jefferson Street Property is sold. The 2002 Police Facility has a fund balance deficit of $4.2 million to a reclassification of reporting internal note proceeds as an interfund loan which was received in prior years. The 2002 Police Facility had a $44 thousand decrease in fund balance due to interest charges. The fund is reviewed periodically to determine the necessary transfer amounts the General Fund needs to contribute. The $8.4 million deficit in the Convention Center fund resulted from cumulative expenses exceeding revenues/transfers and increase $1.3 million over the previous year. Operating losses were $ 4.0 million for the year as compared to $3.7 for
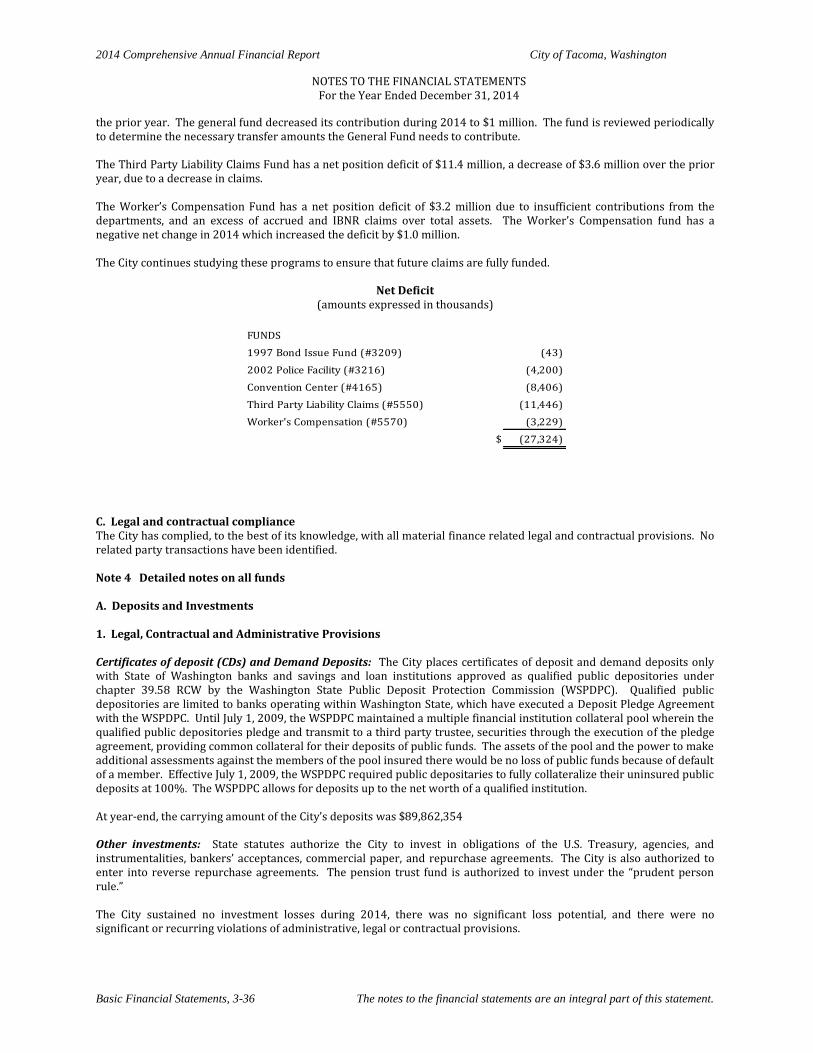
2014 Comprehensive Annual Financial Report City of Tacoma, Washington
NOTES TO THE FINANCIAL STATEMENTS For the Year Ended December 31, 2014
Basic Financial Statements, 3-36 The notes to the financial statements are an integral part of this statement.
the prior year. The general fund decreased its contribution during 2014 to $1 million. The fund is reviewed periodically to determine the necessary transfer amounts the General Fund needs to contribute. The Third Party Liability Claims Fund has a net position deficit of $11.4 million, a decrease of $3.6 million over the prior year, due to a decrease in claims. The Worker’s Compensation Fund has a net position deficit of $3.2 million due to insufficient contributions from the departments, and an excess of accrued and IBNR claims over total assets. The Worker’s Compensation fund has a negative net change in 2014 which increased the deficit by $1.0 million. The City continues studying these programs to ensure that future claims are fully funded.
Net Deficit (amounts expressed in thousands)
FUNDS
1997 Bond Issue Fund (#3209) (43)
2002 Police Facility (#3216) (4,200)
Convention Center (#4165) (8,406)
Third Party Liability Claims (#5550) (11,446)
Worker's Compensation (#5570) (3,229)
$ (27,324)
C. Legal and contractual compliance The City has complied, to the best of its knowledge, with all material finance related legal and contractual provisions. No related party transactions have been identified. Note 4 Detailed notes on all funds A. Deposits and Investments 1. Legal, Contractual and Administrative Provisions Certificates of deposit (CDs) and Demand Deposits: The City places certificates of deposit and demand deposits only with State of Washington banks and savings and loan institutions approved as qualified public depositories under chapter 39.58 RCW by the Washington State Public Deposit Protection Commission (WSPDPC). Qualified public depositories are limited to banks operating within Washington State, which have executed a Deposit Pledge Agreement with the WSPDPC. Until July 1, 2009, the WSPDPC maintained a multiple financial institution collateral pool wherein the qualified public depositories pledge and transmit to a third party trustee, securities through the execution of the pledge agreement, providing common collateral for their deposits of public funds. The assets of the pool and the power to make additional assessments against the members of the pool insured there would be no loss of public funds because of default of a member. Effective July 1, 2009, the WSPDPC required public depositaries to fully collateralize their uninsured public deposits at 100%. The WSPDPC allows for deposits up to the net worth of a qualified institution. At year-end, the carrying amount of the City’s deposits was $89,862,354 Other investments: State statutes authorize the City to invest in obligations of the U.S. Treasury, agencies, and instrumentalities, bankers’ acceptances, commercial paper, and repurchase agreements. The City is also authorized to enter into reverse repurchase agreements. The pension trust fund is authorized to invest under the “prudent person rule.” The City sustained no investment losses during 2014, there was no significant loss potential, and there were no significant or recurring violations of administrative, legal or contractual provisions.
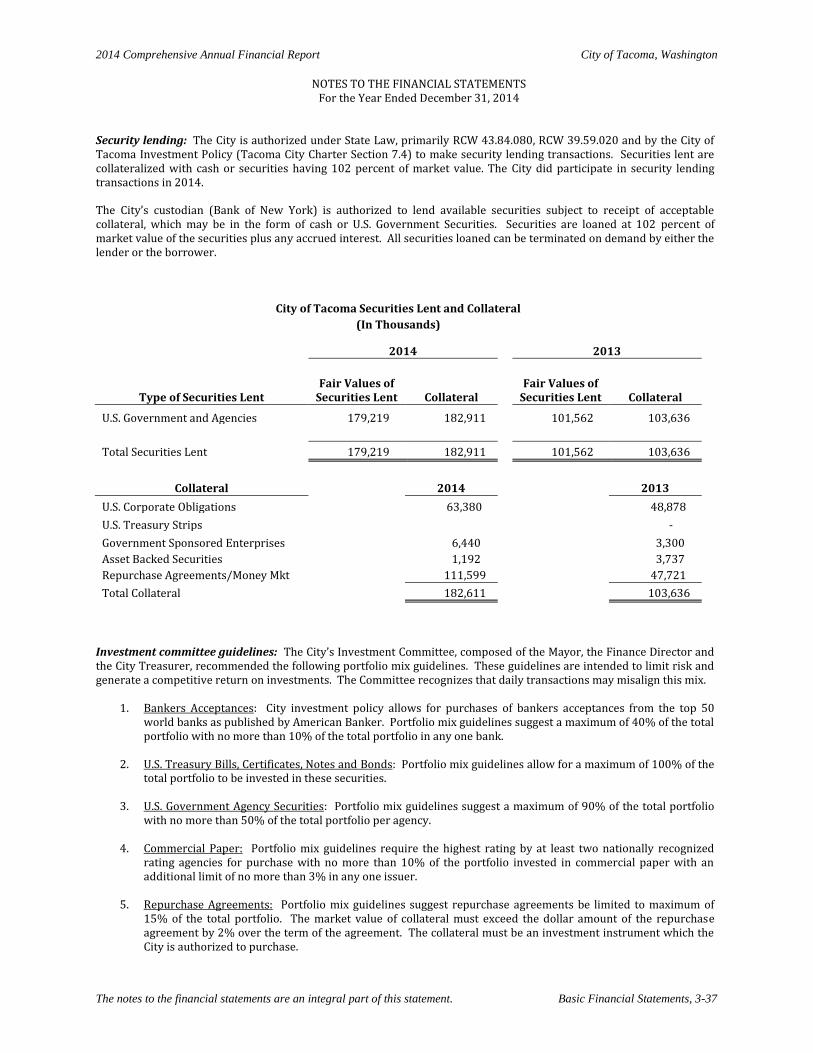
2014 Comprehensive Annual Financial Report City of Tacoma, Washington
NOTES TO THE FINANCIAL STATEMENTS
For the Year Ended December 31, 2014
The notes to the financial statements are an integral part of this statement. Basic Financial Statements, 3-37
Security lending: The City is authorized under State Law, primarily RCW 43.84.080, RCW 39.59.020 and by the City of Tacoma Investment Policy (Tacoma City Charter Section 7.4) to make security lending transactions. Securities lent are collateralized with cash or securities having 102 percent of market value. The City did participate in security lending transactions in 2014. The City’s custodian (Bank of New York) is authorized to lend available securities subject to receipt of acceptable collateral, which may be in the form of cash or U.S. Government Securities. Securities are loaned at 102 percent of market value of the securities plus any accrued interest. All securities loaned can be terminated on demand by either the lender or the borrower.
City of Tacoma Securities Lent and Collateral
(In Thousands)
2014
2013
Type of Securities Lent Fair Values of
Securities Lent Collateral
Fair Values of Securities Lent Collateral
U.S. Government and Agencies 179,219 182,911
101,562 103,636
Total Securities Lent 179,219 182,911
101,562 103,636
Collateral
2014
2013
U.S. Corporate Obligations
63,380
48,878
U.S. Treasury Strips
-
Government Sponsored Enterprises
6,440
3,300
Asset Backed Securities
1,192
3,737
Repurchase Agreements/Money Mkt
111,599
47,721
Total Collateral
182,611
103,636
Investment committee guidelines: The City’s Investment Committee, composed of the Mayor, the Finance Director and the City Treasurer, recommended the following portfolio mix guidelines. These guidelines are intended to limit risk and generate a competitive return on investments. The Committee recognizes that daily transactions may misalign this mix.
1. Bankers Acceptances: City investment policy allows for purchases of bankers acceptances from the top 50 world banks as published by American Banker. Portfolio mix guidelines suggest a maximum of 40% of the total portfolio with no more than 10% of the total portfolio in any one bank.
2. U.S. Treasury Bills, Certificates, Notes and Bonds: Portfolio mix guidelines allow for a maximum of 100% of the
total portfolio to be invested in these securities.
3. U.S. Government Agency Securities: Portfolio mix guidelines suggest a maximum of 90% of the total portfolio with no more than 50% of the total portfolio per agency.
4. Commercial Paper: Portfolio mix guidelines require the highest rating by at least two nationally recognized
rating agencies for purchase with no more than 10% of the portfolio invested in commercial paper with an additional limit of no more than 3% in any one issuer.
5. Repurchase Agreements: Portfolio mix guidelines suggest repurchase agreements be limited to maximum of
15% of the total portfolio. The market value of collateral must exceed the dollar amount of the repurchase agreement by 2% over the term of the agreement. The collateral must be an investment instrument which the City is authorized to purchase.
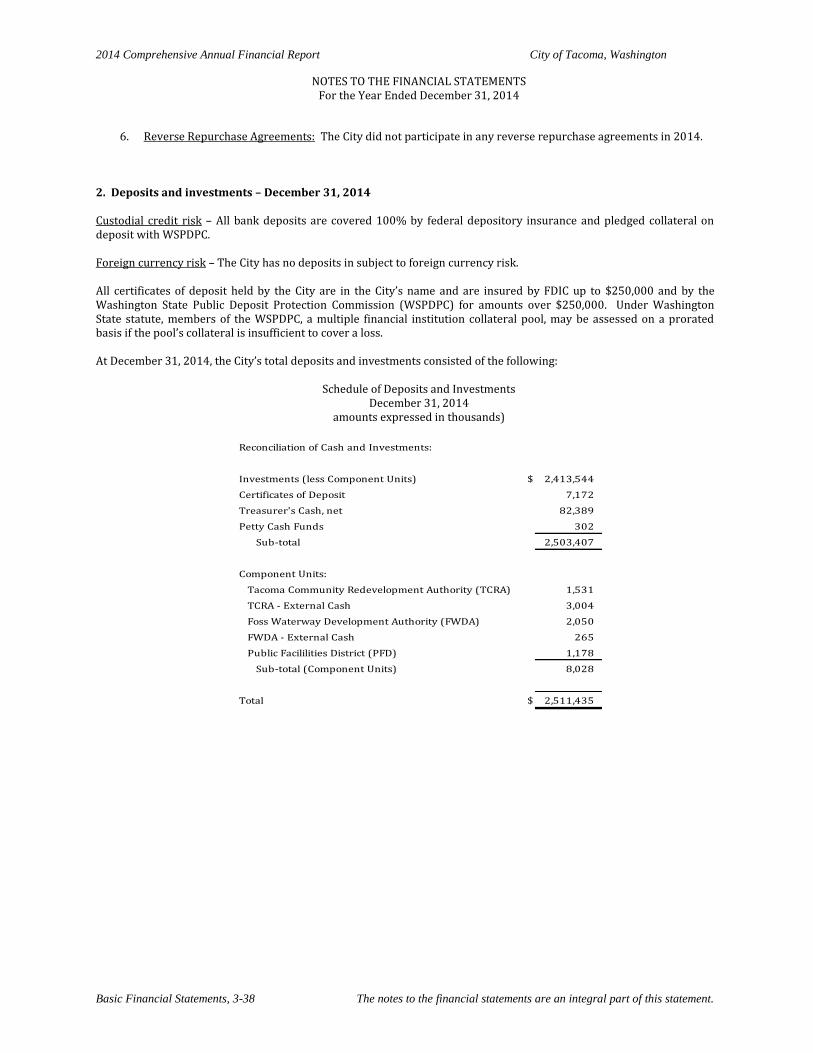
2014 Comprehensive Annual Financial Report City of Tacoma, Washington
NOTES TO THE FINANCIAL STATEMENTS For the Year Ended December 31, 2014
Basic Financial Statements, 3-38 The notes to the financial statements are an integral part of this statement.
6. Reverse Repurchase Agreements: The City did not participate in any reverse repurchase agreements in 2014.
2. Deposits and investments – December 31, 2014 Custodial credit risk – All bank deposits are covered 100% by federal depository insurance and pledged collateral on deposit with WSPDPC. Foreign currency risk – The City has no deposits in subject to foreign currency risk. All certificates of deposit held by the City are in the City’s name and are insured by FDIC up to $250,000 and by the Washington State Public Deposit Protection Commission (WSPDPC) for amounts over $250,000. Under Washington State statute, members of the WSPDPC, a multiple financial institution collateral pool, may be assessed on a prorated basis if the pool’s collateral is insufficient to cover a loss. At December 31, 2014, the City’s total deposits and investments consisted of the following:
Schedule of Deposits and Investments December 31, 2014
amounts expressed in thousands)
Reconciliation of Cash and Investments:
Investments (less Component Units) $ 2,413,544
Certificates of Deposit 7,172
Treasurer's Cash, net 82,389
Petty Cash Funds 302
Sub-total 2,503,407
Component Units:
Tacoma Community Redevelopment Authority (TCRA) 1,531
TCRA - External Cash 3,004
Foss Waterway Development Authority (FWDA) 2,050
FWDA - External Cash 265
Public Facililities District (PFD) 1,178
Sub-total (Component Units) 8,028
Total $ 2,511,435
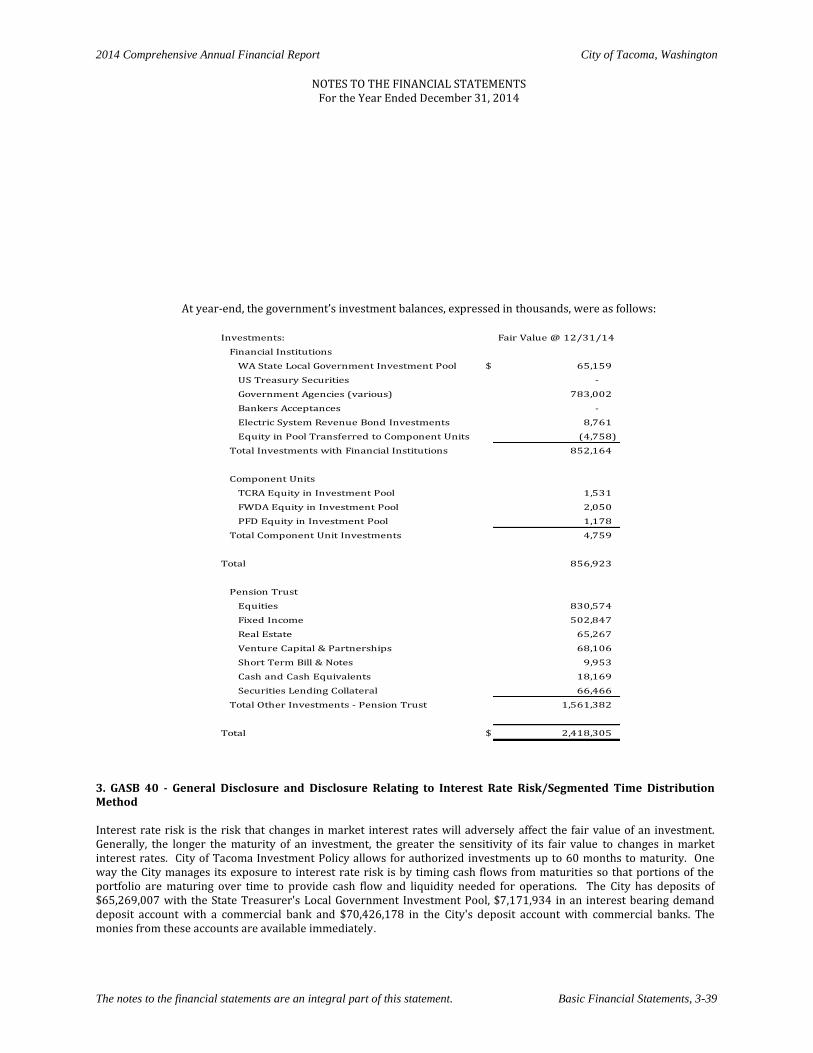
2014 Comprehensive Annual Financial Report City of Tacoma, Washington
NOTES TO THE FINANCIAL STATEMENTS
For the Year Ended December 31, 2014
The notes to the financial statements are an integral part of this statement. Basic Financial Statements, 3-39
At year-end, the government’s investment balances, expressed in thousands, were as follows:
Investments: Fair Value @ 12/31/14
Financial Institutions
WA State Local Government Investment Pool $ 65,159
US Treasury Securities -
Government Agencies (various) 783,002
Bankers Acceptances -
Electric System Revenue Bond Investments 8,761
Equity in Pool Transferred to Component Units (4,758)
Total Investments with Financial Institutions 852,164
Component Units
TCRA Equity in Investment Pool 1,531
FWDA Equity in Investment Pool 2,050
PFD Equity in Investment Pool 1,178
Total Component Unit Investments 4,759
Total 856,923
Pension Trust
Equities 830,574
Fixed Income 502,847
Real Estate 65,267
Venture Capital & Partnerships 68,106
Short Term Bill & Notes 9,953
Cash and Cash Equivalents 18,169
Securities Lending Collateral 66,466
Total Other Investments - Pension Trust 1,561,382
Total $ 2,418,305
3. GASB 40 - General Disclosure and Disclosure Relating to Interest Rate Risk/Segmented Time Distribution Method Interest rate risk is the risk that changes in market interest rates will adversely affect the fair value of an investment. Generally, the longer the maturity of an investment, the greater the sensitivity of its fair value to changes in market interest rates. City of Tacoma Investment Policy allows for authorized investments up to 60 months to maturity. One way the City manages its exposure to interest rate risk is by timing cash flows from maturities so that portions of the portfolio are maturing over time to provide cash flow and liquidity needed for operations. The City has deposits of $65,269,007 with the State Treasurer's Local Government Investment Pool, $7,171,934 in an interest bearing demand deposit account with a commercial bank and $70,426,178 in the City's deposit account with commercial banks. The monies from these accounts are available immediately.
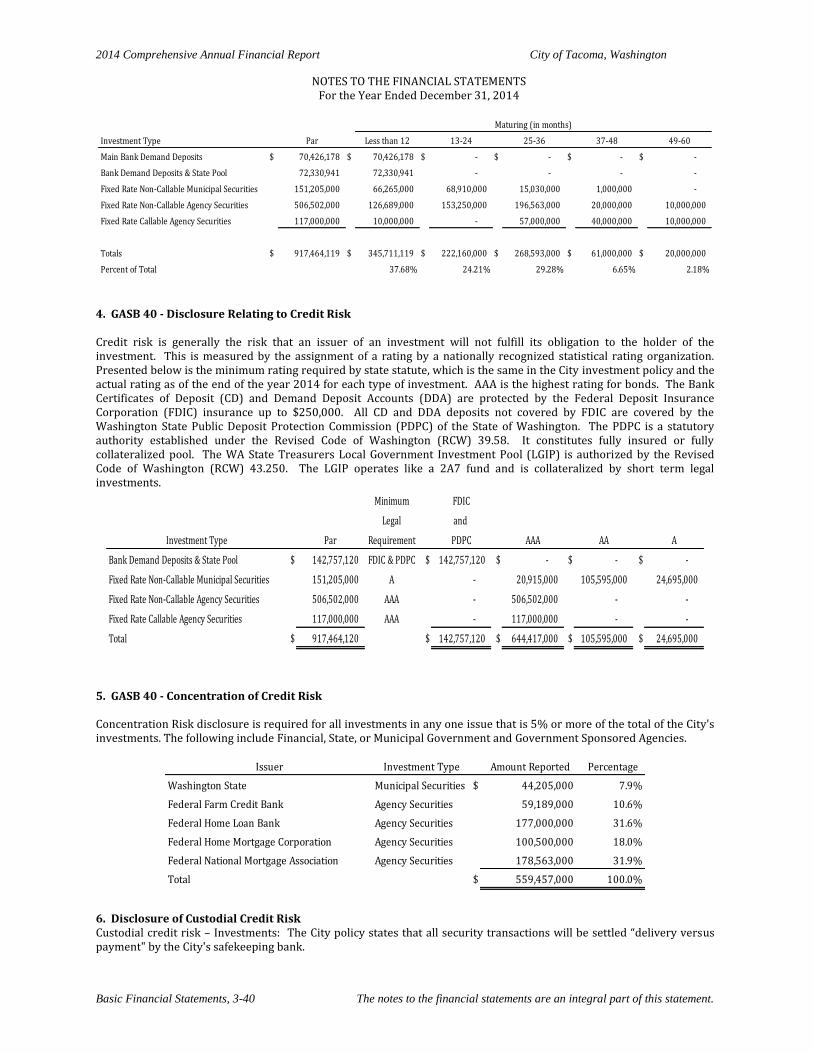
2014 Comprehensive Annual Financial Report City of Tacoma, Washington
NOTES TO THE FINANCIAL STATEMENTS For the Year Ended December 31, 2014
Basic Financial Statements, 3-40 The notes to the financial statements are an integral part of this statement.
Investment Type Par Less than 12 13-24 25-36 37-48 49-60
Main Bank Demand Deposits $ 70,426,178 $ 70,426,178 $ - $ - $ - $ -
Bank Demand Deposits & State Pool 72,330,941 72,330,941 - - - -
Fixed Rate Non-Callable Municipal Securities 151,205,000 66,265,000 68,910,000 15,030,000 1,000,000 -
Fixed Rate Non-Callable Agency Securities 506,502,000 126,689,000 153,250,000 196,563,000 20,000,000 10,000,000
Fixed Rate Callable Agency Securities 117,000,000 10,000,000 - 57,000,000 40,000,000 10,000,000
Totals $ 917,464,119 $ 345,711,119 $ 222,160,000 $ 268,593,000 $ 61,000,000 $ 20,000,000
Percent of Total 37.68% 24.21% 29.28% 6.65% 2.18%
Maturing (in months)
4. GASB 40 - Disclosure Relating to Credit Risk Credit risk is generally the risk that an issuer of an investment will not fulfill its obligation to the holder of the investment. This is measured by the assignment of a rating by a nationally recognized statistical rating organization. Presented below is the minimum rating required by state statute, which is the same in the City investment policy and the actual rating as of the end of the year 2014 for each type of investment. AAA is the highest rating for bonds. The Bank Certificates of Deposit (CD) and Demand Deposit Accounts (DDA) are protected by the Federal Deposit Insurance Corporation (FDIC) insurance up to $250,000. All CD and DDA deposits not covered by FDIC are covered by the Washington State Public Deposit Protection Commission (PDPC) of the State of Washington. The PDPC is a statutory authority established under the Revised Code of Washington (RCW) 39.58. It constitutes fully insured or fully collateralized pool. The WA State Treasurers Local Government Investment Pool (LGIP) is authorized by the Revised Code of Washington (RCW) 43.250. The LGIP operates like a 2A7 fund and is collateralized by short term legal investments.
Minimum FDIC
Legal and
Investment Type Par Requirement PDPC AAA AA A
Bank Demand Deposits & State Pool $ 142,757,120 FDIC & PDPC $ 142,757,120 $ - $ - $ -
Fixed Rate Non-Callable Municipal Securities 151,205,000 A - 20,915,000 105,595,000 24,695,000
Fixed Rate Non-Callable Agency Securities 506,502,000 AAA - 506,502,000 - -
Fixed Rate Callable Agency Securities 117,000,000 AAA - 117,000,000 - -
Total $ 917,464,120 $ 142,757,120 $ 644,417,000 $ 105,595,000 $ 24,695,000
5. GASB 40 - Concentration of Credit Risk Concentration Risk disclosure is required for all investments in any one issue that is 5% or more of the total of the City's investments. The following include Financial, State, or Municipal Government and Government Sponsored Agencies.
Issuer Investment Type Amount Reported Percentage
Washington State Municipal Securities $ 44,205,000 7.9%
Federal Farm Credit Bank Agency Securities 59,189,000 10.6%
Federal Home Loan Bank Agency Securities 177,000,000 31.6%
Federal Home Mortgage Corporation Agency Securities 100,500,000 18.0%
Federal National Mortgage Association Agency Securities 178,563,000 31.9%
Total $ 559,457,000 100.0%
6. Disclosure of Custodial Credit Risk Custodial credit risk – Investments: The City policy states that all security transactions will be settled “delivery versus payment" by the City's safekeeping bank.
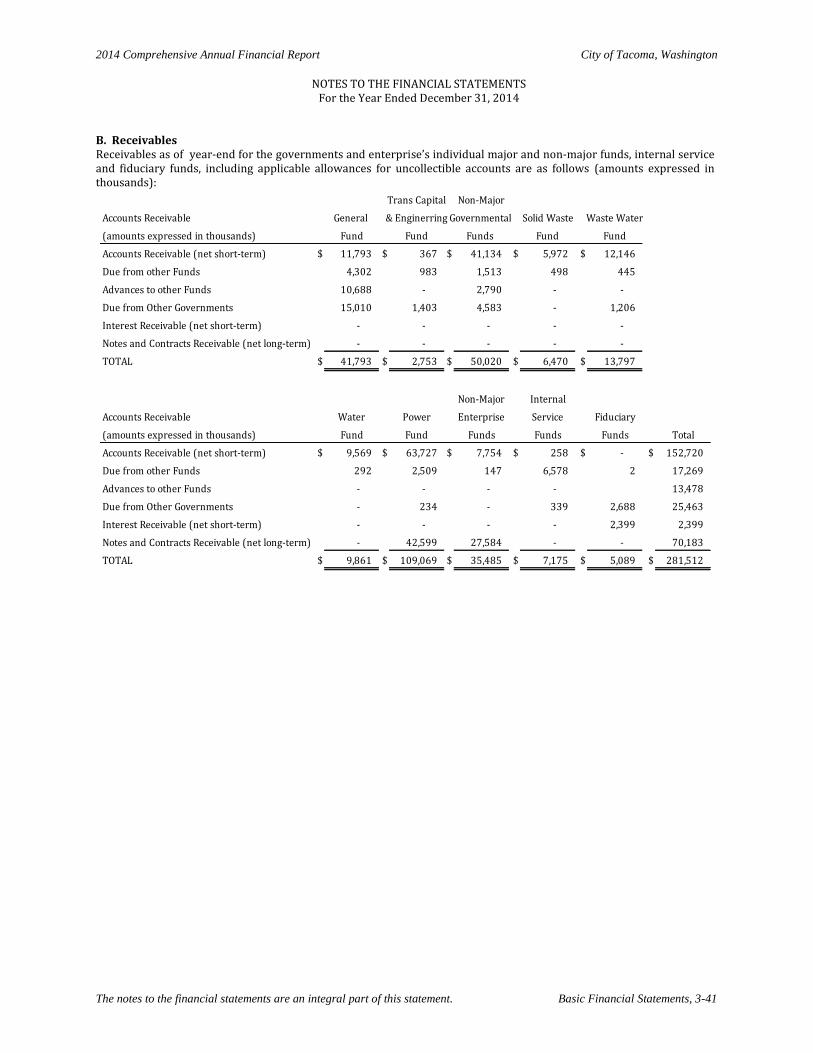
2014 Comprehensive Annual Financial Report City of Tacoma, Washington
NOTES TO THE FINANCIAL STATEMENTS
For the Year Ended December 31, 2014
The notes to the financial statements are an integral part of this statement. Basic Financial Statements, 3-41
B. Receivables Receivables as of year-end for the governments and enterprise’s individual major and non-major funds, internal service and fiduciary funds, including applicable allowances for uncollectible accounts are as follows (amounts expressed in thousands):
Trans Capital Non-Major
Accounts Receivable General & Enginerring Governmental Solid Waste Waste Water
(amounts expressed in thousands) Fund Fund Funds Fund Fund
Accounts Receivable (net short-term) $ 11,793 $ 367 $ 41,134 $ 5,972 $ 12,146
Due from other Funds 4,302 983 1,513 498 445
Advances to other Funds 10,688 - 2,790 - -
Due from Other Governments 15,010 1,403 4,583 - 1,206
Interest Receivable (net short-term) - - - - -
Notes and Contracts Receivable (net long-term) - - - - -
TOTAL $ 41,793 $ 2,753 $ 50,020 $ 6,470 $ 13,797
Non-Major Internal
Accounts Receivable Water Power Enterprise Service Fiduciary
(amounts expressed in thousands) Fund Fund Funds Funds Funds Total
Accounts Receivable (net short-term) $ 9,569 $ 63,727 $ 7,754 $ 258 $ - $ 152,720
Due from other Funds 292 2,509 147 6,578 2 17,269
Advances to other Funds - - - - 13,478
Due from Other Governments - 234 - 339 2,688 25,463
Interest Receivable (net short-term) - - - - 2,399 2,399
Notes and Contracts Receivable (net long-term) - 42,599 27,584 - - 70,183
TOTAL $ 9,861 $ 109,069 $ 35,485 $ 7,175 $ 5,089 $ 281,512
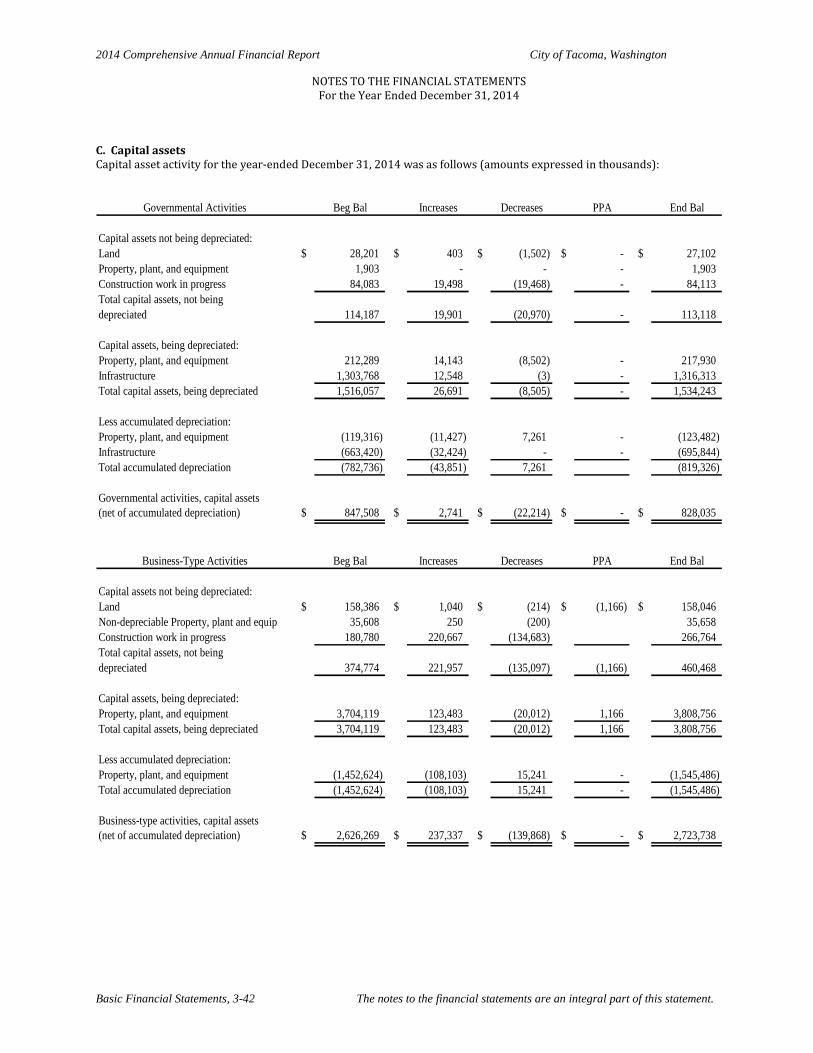
2014 Comprehensive Annual Financial Report City of Tacoma, Washington
NOTES TO THE FINANCIAL STATEMENTS For the Year Ended December 31, 2014
Basic Financial Statements, 3-42 The notes to the financial statements are an integral part of this statement.
C. Capital assets Capital asset activity for the year-ended December 31, 2014 was as follows (amounts expressed in thousands):
Governmental Activities Beg Bal Increases Decreases PPA End Bal
Capital assets not being depreciated:
Land $ 28,201 $ 403 $ (1,502) $ - $ 27,102
Property, plant, and equipment 1,903 - - - 1,903
Construction work in progress 84,083 19,498 (19,468) - 84,113
Total capital assets, not being
depreciated 114,187 19,901 (20,970) - 113,118
Capital assets, being depreciated:
Property, plant, and equipment 212,289 14,143 (8,502) - 217,930
Infrastructure 1,303,768 12,548 (3) - 1,316,313
Total capital assets, being depreciated 1,516,057 26,691 (8,505) - 1,534,243
Less accumulated depreciation:
Property, plant, and equipment (119,316) (11,427) 7,261 - (123,482)
Infrastructure (663,420) (32,424) - - (695,844)
Total accumulated depreciation (782,736) (43,851) 7,261 (819,326)
Governmental activities, capital assets
(net of accumulated depreciation) $ 847,508 $ 2,741 $ (22,214) $ - $ 828,035
Business-Type Activities Beg Bal Increases Decreases PPA End Bal
Capital assets not being depreciated:
Land $ 158,386 $ 1,040 $ (214) $ (1,166) $ 158,046
Non-depreciable Property, plant and equip 35,608 250 (200) 35,658
Construction work in progress 180,780 220,667 (134,683) 266,764
Total capital assets, not being
depreciated 374,774 221,957 (135,097) (1,166) 460,468
Capital assets, being depreciated:
Property, plant, and equipment 3,704,119 123,483 (20,012) 1,166 3,808,756
Total capital assets, being depreciated 3,704,119 123,483 (20,012) 1,166 3,808,756
Less accumulated depreciation:
Property, plant, and equipment (1,452,624) (108,103) 15,241 - (1,545,486)
Total accumulated depreciation (1,452,624) (108,103) 15,241 - (1,545,486)
Business-type activities, capital assets
(net of accumulated depreciation) $ 2,626,269 $ 237,337 $ (139,868) $ - $ 2,723,738
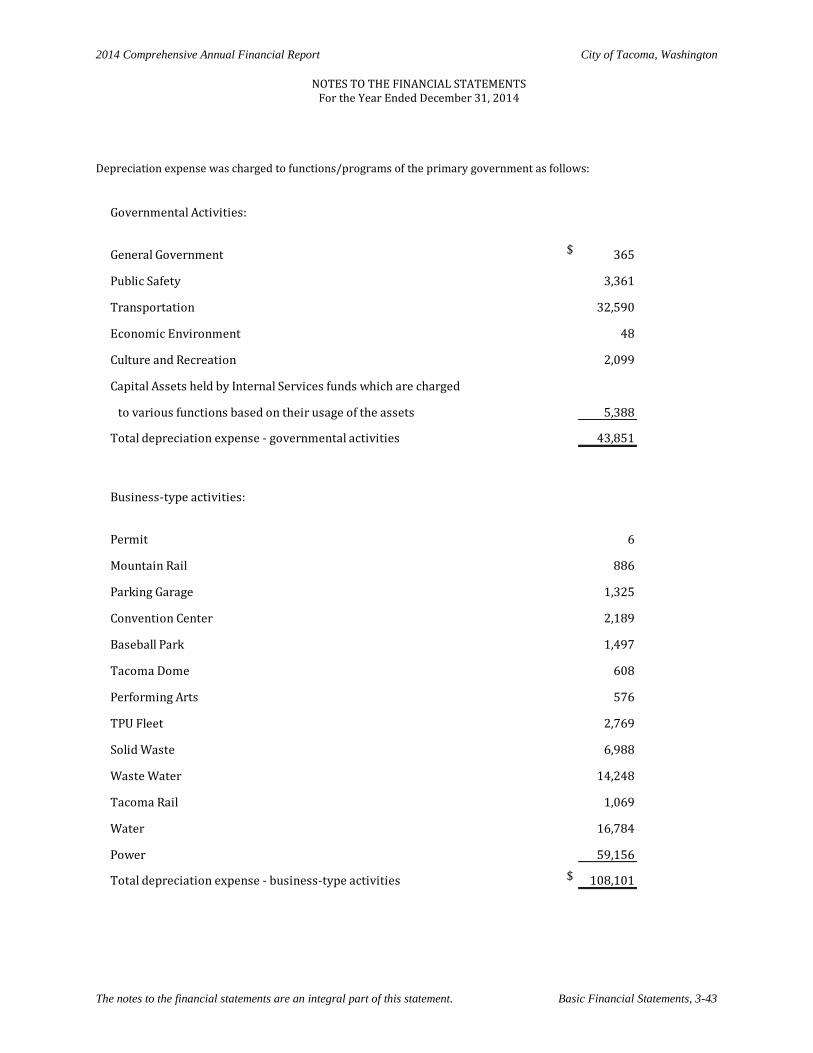
2014 Comprehensive Annual Financial Report City of Tacoma, Washington
NOTES TO THE FINANCIAL STATEMENTS
For the Year Ended December 31, 2014
The notes to the financial statements are an integral part of this statement. Basic Financial Statements, 3-43
Depreciation expense was charged to functions/programs of the primary government as follows:
Governmental Activities:
General Government $ 365
Public Safety 3,361
Transportation 32,590
Economic Environment 48
Culture and Recreation 2,099
Capital Assets held by Internal Services funds which are charged
to various functions based on their usage of the assets 5,388
Total depreciation expense - governmental activities 43,851
Business-type activities:
Permit 6
Mountain Rail 886
Parking Garage 1,325
Convention Center 2,189
Baseball Park 1,497
Tacoma Dome 608
Performing Arts 576
TPU Fleet 2,769
Solid Waste 6,988
Waste Water 14,248
Tacoma Rail 1,069
Water 16,784
Power 59,156
Total depreciation expense - business-type activities $ 108,101
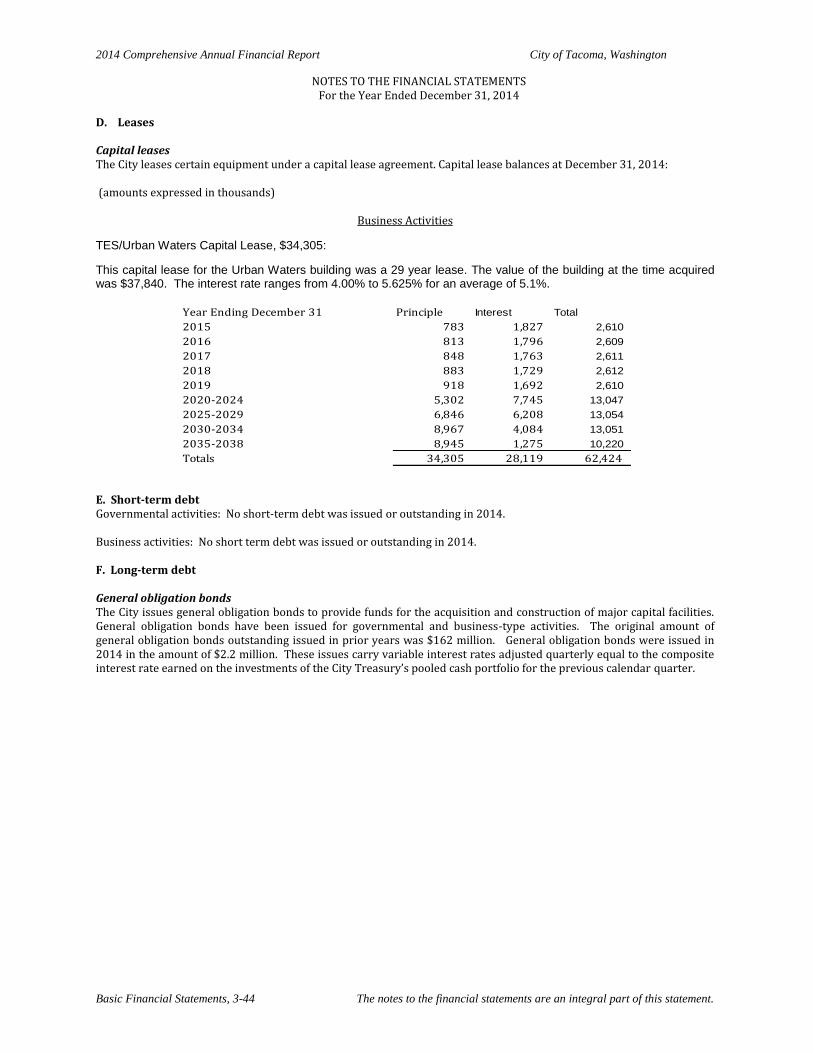
2014 Comprehensive Annual Financial Report City of Tacoma, Washington
NOTES TO THE FINANCIAL STATEMENTS For the Year Ended December 31, 2014
Basic Financial Statements, 3-44 The notes to the financial statements are an integral part of this statement.
D. Leases Capital leases The City leases certain equipment under a capital lease agreement. Capital lease balances at December 31, 2014: (amounts expressed in thousands)
Business Activities TES/Urban Waters Capital Lease, $34,305:
This capital lease for the Urban Waters building was a 29 year lease. The value of the building at the time acquired was $37,840. The interest rate ranges from 4.00% to 5.625% for an average of 5.1%.
Year Ending December 31 Principle Interest Total
2015 783 1,827 2,610
2016 813 1,796 2,609
2017 848 1,763 2,611
2018 883 1,729 2,612
2019 918 1,692 2,610
2020-2024 5,302 7,745 13,047
2025-2029 6,846 6,208 13,054
2030-2034 8,967 4,084 13,051
2035-2038 8,945 1,275 10,220
Totals 34,305 28,119 62,424
E. Short-term debt Governmental activities: No short-term debt was issued or outstanding in 2014. Business activities: No short term debt was issued or outstanding in 2014. F. Long-term debt General obligation bonds The City issues general obligation bonds to provide funds for the acquisition and construction of major capital facilities. General obligation bonds have been issued for governmental and business-type activities. The original amount of general obligation bonds outstanding issued in prior years was $162 million. General obligation bonds were issued in 2014 in the amount of $2.2 million. These issues carry variable interest rates adjusted quarterly equal to the composite interest rate earned on the investments of the City Treasury’s pooled cash portfolio for the previous calendar quarter.
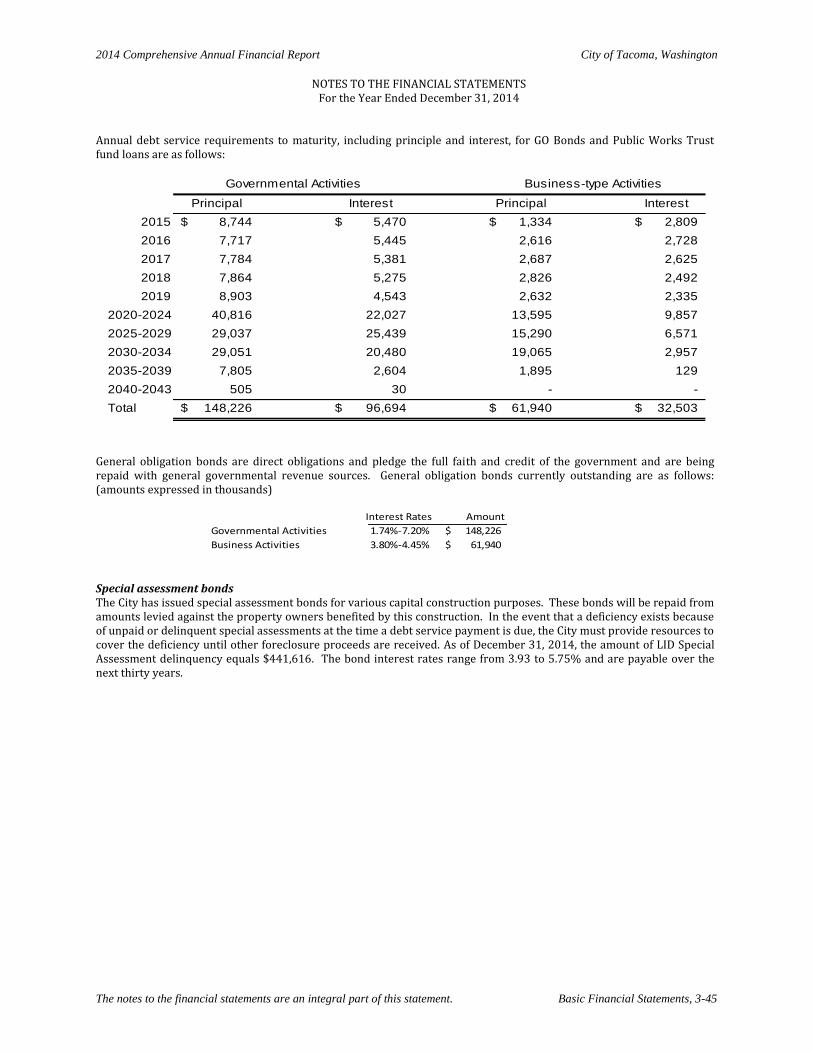
2014 Comprehensive Annual Financial Report City of Tacoma, Washington
NOTES TO THE FINANCIAL STATEMENTS
For the Year Ended December 31, 2014
The notes to the financial statements are an integral part of this statement. Basic Financial Statements, 3-45
Annual debt service requirements to maturity, including principle and interest, for GO Bonds and Public Works Trust fund loans are as follows:
Principal Interest Principal Interest
2015 8,744$ 5,470$ 1,334$ 2,809$
2016 7,717 5,445 2,616 2,728
2017 7,784 5,381 2,687 2,625
2018 7,864 5,275 2,826 2,492
2019 8,903 4,543 2,632 2,335
2020-2024 40,816 22,027 13,595 9,857
2025-2029 29,037 25,439 15,290 6,571
2030-2034 29,051 20,480 19,065 2,957
2035-2039 7,805 2,604 1,895 129
2040-2043 505 30 - -
Total 148,226$ 96,694$ 61,940$ 32,503$
Governmental Activities Business-type Activities
General obligation bonds are direct obligations and pledge the full faith and credit of the government and are being repaid with general governmental revenue sources. General obligation bonds currently outstanding are as follows: (amounts expressed in thousands)
Interest Rates Amount
Governmental Activities 1.74%-7.20% 148,226$
Business Activities 3.80%-4.45% 61,940$
Special assessment bonds The City has issued special assessment bonds for various capital construction purposes. These bonds will be repaid from amounts levied against the property owners benefited by this construction. In the event that a deficiency exists because of unpaid or delinquent special assessments at the time a debt service payment is due, the City must provide resources to cover the deficiency until other foreclosure proceeds are received. As of December 31, 2014, the amount of LID Special Assessment delinquency equals $441,616. The bond interest rates range from 3.93 to 5.75% and are payable over the next thirty years.
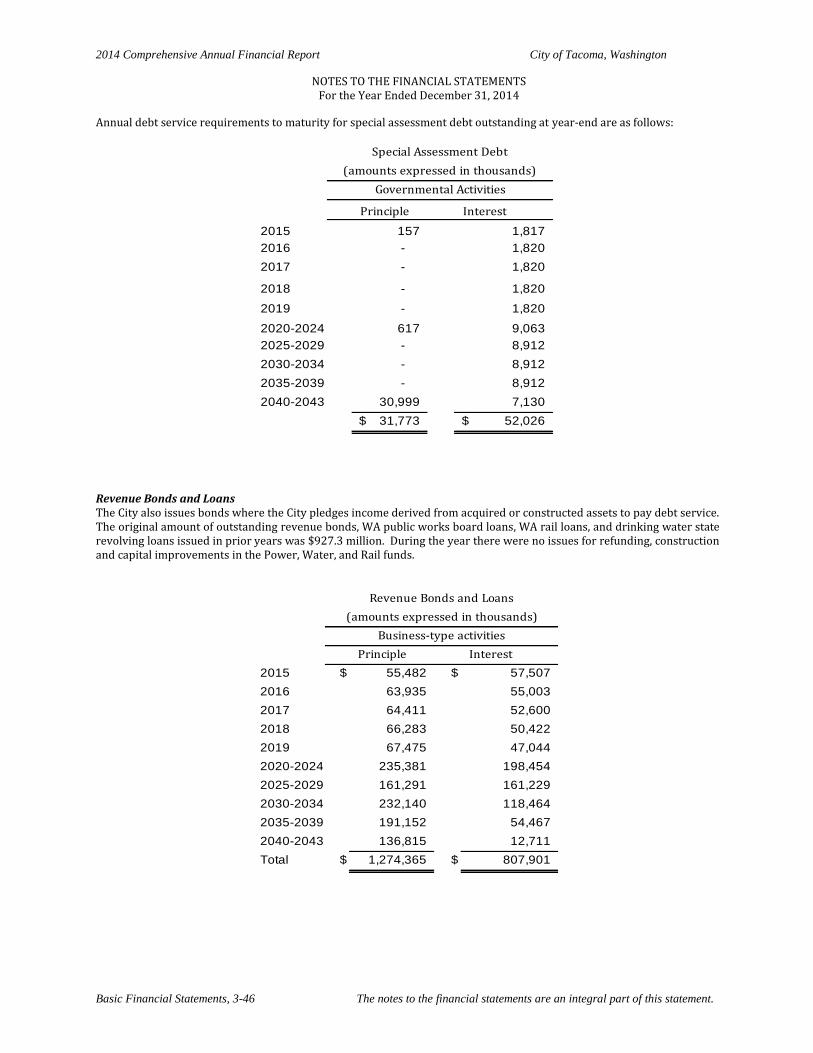
2014 Comprehensive Annual Financial Report City of Tacoma, Washington
NOTES TO THE FINANCIAL STATEMENTS For the Year Ended December 31, 2014
Basic Financial Statements, 3-46 The notes to the financial statements are an integral part of this statement.
Annual debt service requirements to maturity for special assessment debt outstanding at year-end are as follows:
Principle Interest
2015 157 1,817
2016 - 1,820
2017 - 1,820
2018 - 1,820
2019 - 1,820
2020-2024 617 9,063
2025-2029 - 8,912
2030-2034 - 8,912
2035-2039 - 8,912
2040-2043 30,999 7,130
31,773$ 52,026$
Special Assessment Debt
Governmental Activities
(amounts expressed in thousands)
Revenue Bonds and Loans The City also issues bonds where the City pledges income derived from acquired or constructed assets to pay debt service. The original amount of outstanding revenue bonds, WA public works board loans, WA rail loans, and drinking water state revolving loans issued in prior years was $927.3 million. During the year there were no issues for refunding, construction and capital improvements in the Power, Water, and Rail funds.
Principle Interest
2015 $ 55,482 $ 57,507
2016 63,935 55,003
2017 64,411 52,600
2018 66,283 50,422
2019 67,475 47,044
2020-2024 235,381 198,454
2025-2029 161,291 161,229
2030-2034 232,140 118,464
2035-2039 191,152 54,467
2040-2043 136,815 12,711
Total $ 1,274,365 $ 807,901
Revenue Bonds and Loans
Business-type activities
(amounts expressed in thousands)
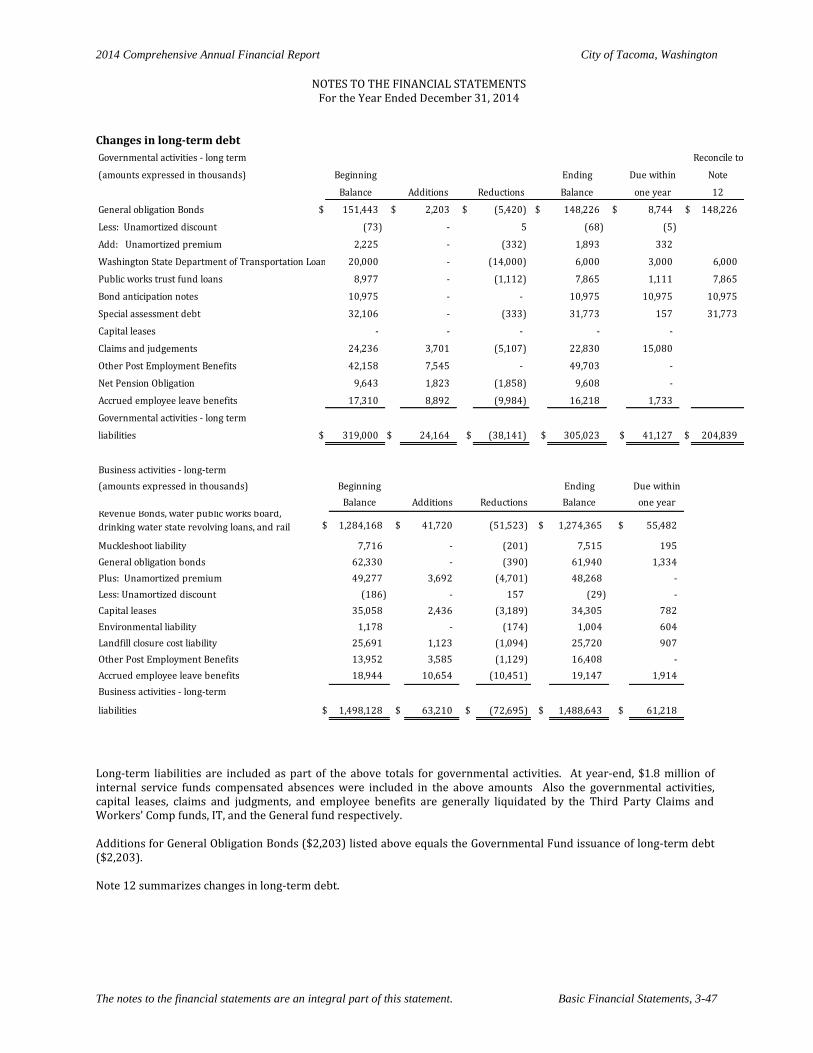
2014 Comprehensive Annual Financial Report City of Tacoma, Washington
NOTES TO THE FINANCIAL STATEMENTS
For the Year Ended December 31, 2014
The notes to the financial statements are an integral part of this statement. Basic Financial Statements, 3-47
Changes in long-term debt
Governmental activities - long term Reconcile to
(amounts expressed in thousands) Beginning Ending Due within Note
Balance Additions Reductions Balance one year 12
General obligation Bonds $ 151,443 $ 2,203 $ (5,420) $ 148,226 $ 8,744 $ 148,226
Less: Unamortized discount (73) - 5 (68) (5)
Add: Unamortized premium 2,225 - (332) 1,893 332
Washington State Department of Transportation Loan 20,000 - (14,000) 6,000 3,000 6,000
Public works trust fund loans 8,977 - (1,112) 7,865 1,111 7,865
Bond anticipation notes 10,975 - - 10,975 10,975 10,975
Special assessment debt 32,106 - (333) 31,773 157 31,773
Capital leases - - - - -
Claims and judgements 24,236 3,701 (5,107) 22,830 15,080
Other Post Employment Benefits 42,158 7,545 - 49,703 -
Net Pension Obligation 9,643 1,823 (1,858) 9,608 -
Accrued employee leave benefits 17,310 8,892 (9,984) 16,218 1,733
Governmental activities - long term
liabilities $ 319,000 $ 24,164 $ (38,141) $ 305,023 $ 41,127 $ 204,839
Business activities - long-term
(amounts expressed in thousands) Beginning Ending Due within
Balance Additions Reductions Balance one yearRevenue Bonds, water public works board,
drinking water state revolving loans, and rail $ 1,284,168 $ 41,720 (51,523) $ 1,274,365 $ 55,482
Muckleshoot liability 7,716 - (201) 7,515 195
General obligation bonds 62,330 - (390) 61,940 1,334
Plus: Unamortized premium 49,277 3,692 (4,701) 48,268 -
Less: Unamortized discount (186) - 157 (29) -
Capital leases 35,058 2,436 (3,189) 34,305 782
Environmental liability 1,178 - (174) 1,004 604
Landfill closure cost liability 25,691 1,123 (1,094) 25,720 907
Other Post Employment Benefits 13,952 3,585 (1,129) 16,408 -
Accrued employee leave benefits 18,944 10,654 (10,451) 19,147 1,914
Business activities - long-term
liabilities $ 1,498,128 $ 63,210 $ (72,695) $ 1,488,643 $ 61,218
Long-term liabilities are included as part of the above totals for governmental activities. At year-end, $1.8 million of internal service funds compensated absences were included in the above amounts Also the governmental activities, capital leases, claims and judgments, and employee benefits are generally liquidated by the Third Party Claims and Workers’ Comp funds, IT, and the General fund respectively. Additions for General Obligation Bonds ($2,203) listed above equals the Governmental Fund issuance of long-term debt ($2,203). Note 12 summarizes changes in long-term debt.
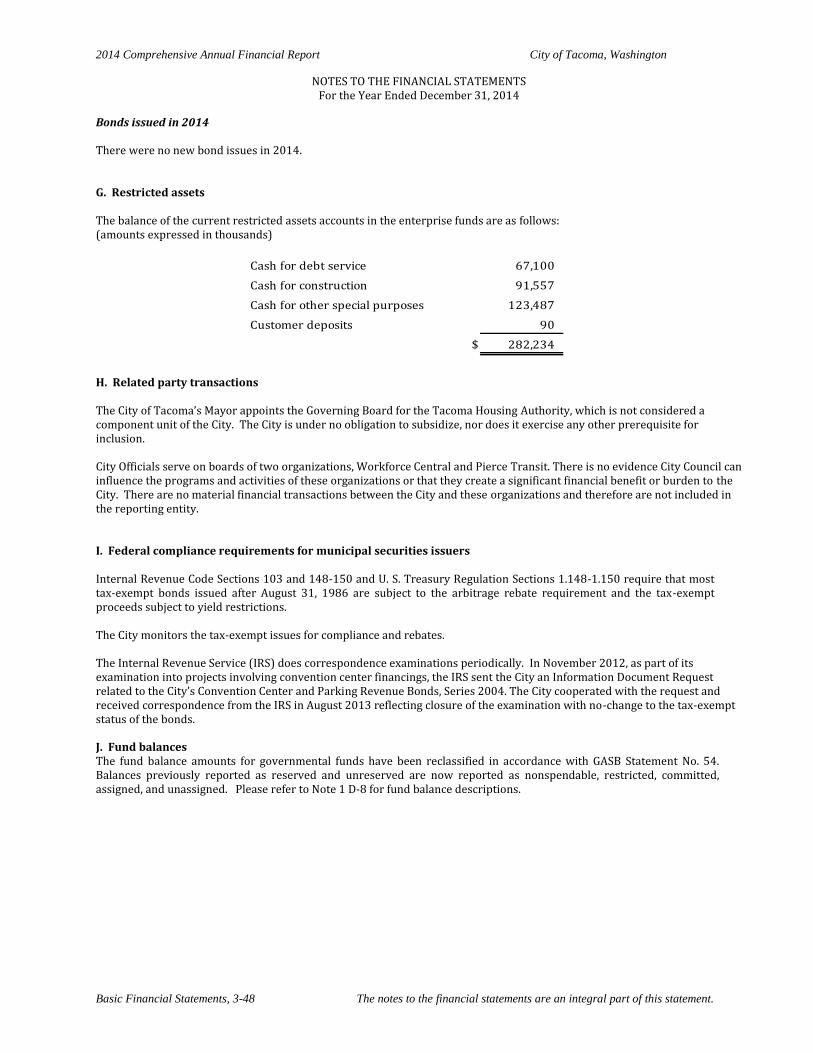
2014 Comprehensive Annual Financial Report City of Tacoma, Washington
NOTES TO THE FINANCIAL STATEMENTS For the Year Ended December 31, 2014
Basic Financial Statements, 3-48 The notes to the financial statements are an integral part of this statement.
Bonds issued in 2014 There were no new bond issues in 2014. G. Restricted assets The balance of the current restricted assets accounts in the enterprise funds are as follows: (amounts expressed in thousands)
Cash for debt service 67,100
Cash for construction 91,557
Cash for other special purposes 123,487
Customer deposits 90
$ 282,234
H. Related party transactions The City of Tacoma’s Mayor appoints the Governing Board for the Tacoma Housing Authority, which is not considered a component unit of the City. The City is under no obligation to subsidize, nor does it exercise any other prerequisite for inclusion. City Officials serve on boards of two organizations, Workforce Central and Pierce Transit. There is no evidence City Council can influence the programs and activities of these organizations or that they create a significant financial benefit or burden to the City. There are no material financial transactions between the City and these organizations and therefore are not included in the reporting entity. I. Federal compliance requirements for municipal securities issuers Internal Revenue Code Sections 103 and 148-150 and U. S. Treasury Regulation Sections 1.148-1.150 require that most tax-exempt bonds issued after August 31, 1986 are subject to the arbitrage rebate requirement and the tax-exempt proceeds subject to yield restrictions. The City monitors the tax-exempt issues for compliance and rebates. The Internal Revenue Service (IRS) does correspondence examinations periodically. In November 2012, as part of its examination into projects involving convention center financings, the IRS sent the City an Information Document Request related to the City’s Convention Center and Parking Revenue Bonds, Series 2004. The City cooperated with the request and received correspondence from the IRS in August 2013 reflecting closure of the examination with no-change to the tax-exempt status of the bonds.
J. Fund balances The fund balance amounts for governmental funds have been reclassified in accordance with GASB Statement No. 54. Balances previously reported as reserved and unreserved are now reported as nonspendable, restricted, committed, assigned, and unassigned. Please refer to Note 1 D-8 for fund balance descriptions.
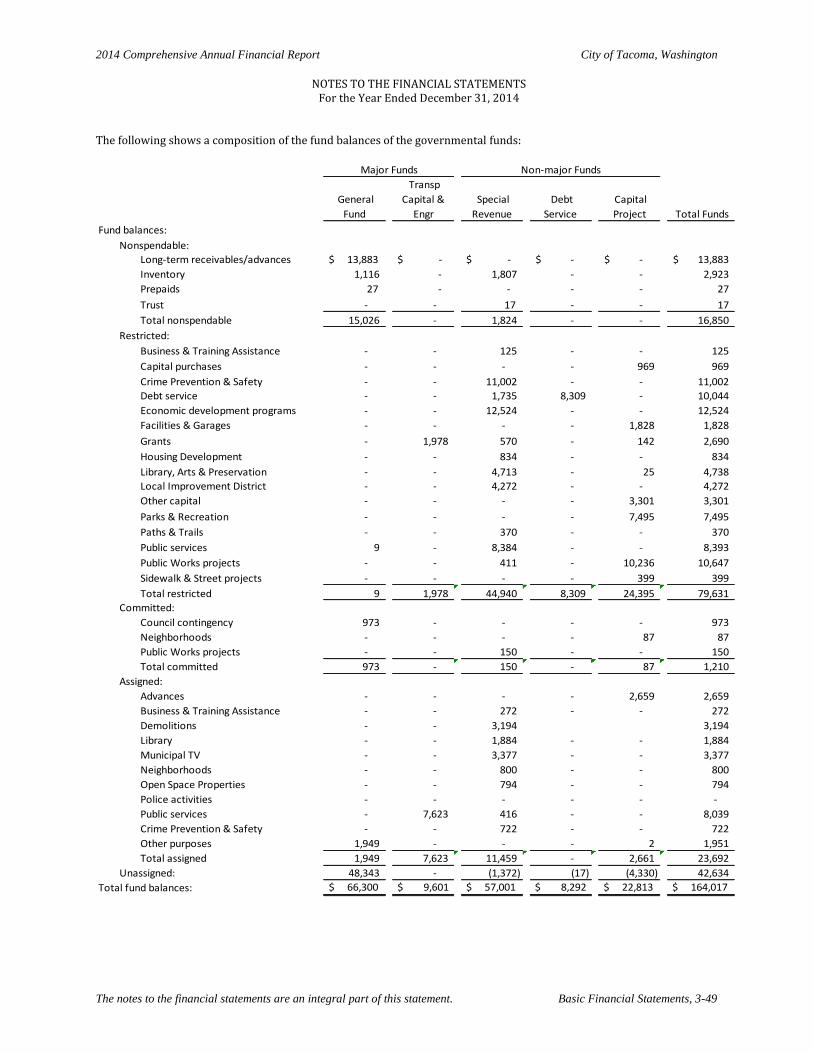
2014 Comprehensive Annual Financial Report City of Tacoma, Washington
NOTES TO THE FINANCIAL STATEMENTS
For the Year Ended December 31, 2014
The notes to the financial statements are an integral part of this statement. Basic Financial Statements, 3-49
The following shows a composition of the fund balances of the governmental funds:
General
Fund
Transp
Capital &
Engr
Special
Revenue
Debt
Service
Capital
Project Total Funds
Fund balances:
Nonspendable:
Long-term receivables/advances $ 13,883 $ - $ - -$ -$ 13,883$
Inventory 1,116 - 1,807 - - 2,923
Prepaids 27 - - - - 27
Trust - - 17 - - 17
Total nonspendable 15,026 - 1,824 - - 16,850
Restricted:
Business & Training Assistance - - 125 - - 125
Capital purchases - - - - 969 969
Crime Prevention & Safety - - 11,002 - - 11,002
Debt service - - 1,735 8,309 - 10,044
Economic development programs - - 12,524 - - 12,524
Facilities & Garages - - - - 1,828 1,828
Grants - 1,978 570 - 142 2,690
Housing Development - - 834 - - 834
Library, Arts & Preservation - - 4,713 - 25 4,738
Local Improvement District - - 4,272 - - 4,272
Other capital - - - - 3,301 3,301
Parks & Recreation - - - - 7,495 7,495
Paths & Trails - - 370 - - 370
Public services 9 - 8,384 - - 8,393
Public Works projects - - 411 - 10,236 10,647
Sidewalk & Street projects - - - - 399 399
Total restricted 9 1,978 44,940 8,309 24,395 79,631
Committed:
Council contingency 973 - - - - 973
Neighborhoods - - - - 87 87
Public Works projects - - 150 - - 150
Total committed 973 - 150 - 87 1,210
Assigned:
Advances - - - - 2,659 2,659
Business & Training Assistance - - 272 - - 272
Demolitions - - 3,194 3,194
Library - - 1,884 - - 1,884
Municipal TV - - 3,377 - - 3,377
Neighborhoods - - 800 - - 800
Open Space Properties - - 794 - - 794
Police activities - - - - - -
Public services - 7,623 416 - - 8,039
Crime Prevention & Safety - - 722 - - 722
Other purposes 1,949 - - - 2 1,951
Total assigned 1,949 7,623 11,459 - 2,661 23,692
Unassigned: 48,343 - (1,372) (17) (4,330) 42,634
Total fund balances: $ 66,300 $ 9,601 $ 57,001 $ 8,292 $ 22,813 $ 164,017
Major Funds Non-major Funds
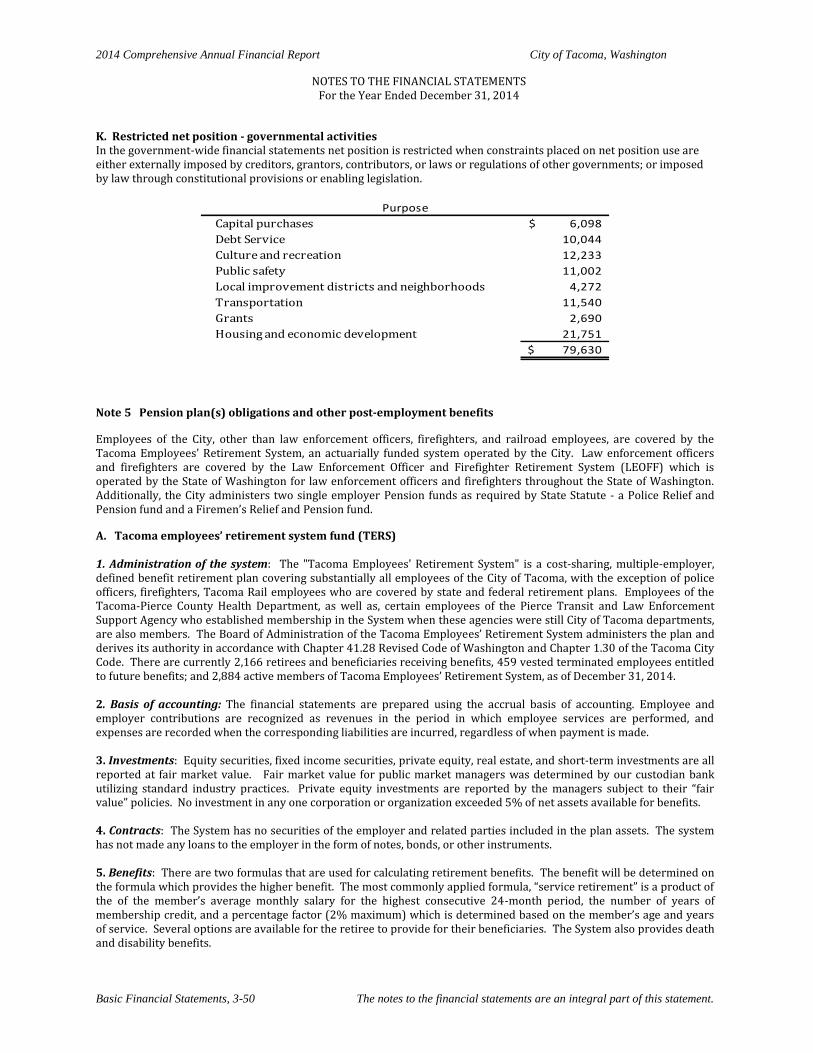
2014 Comprehensive Annual Financial Report City of Tacoma, Washington
NOTES TO THE FINANCIAL STATEMENTS For the Year Ended December 31, 2014
Basic Financial Statements, 3-50 The notes to the financial statements are an integral part of this statement.
K. Restricted net position - governmental activities In the government-wide financial statements net position is restricted when constraints placed on net position use are either externally imposed by creditors, grantors, contributors, or laws or regulations of other governments; or imposed by law through constitutional provisions or enabling legislation.
Capital purchases 6,098$
Debt Service 10,044
Culture and recreation 12,233
Public safety 11,002
Local improvement districts and neighborhoods 4,272
Transportation 11,540
Grants 2,690
Housing and economic development 21,751
79,630$
Purpose
Note 5 Pension plan(s) obligations and other post-employment benefits
Employees of the City, other than law enforcement officers, firefighters, and railroad employees, are covered by the Tacoma Employees' Retirement System, an actuarially funded system operated by the City. Law enforcement officers and firefighters are covered by the Law Enforcement Officer and Firefighter Retirement System (LEOFF) which is operated by the State of Washington for law enforcement officers and firefighters throughout the State of Washington. Additionally, the City administers two single employer Pension funds as required by State Statute - a Police Relief and Pension fund and a Firemen’s Relief and Pension fund.
A. Tacoma employees’ retirement system fund (TERS) 1. Administration of the system: The "Tacoma Employees' Retirement System" is a cost-sharing, multiple-employer, defined benefit retirement plan covering substantially all employees of the City of Tacoma, with the exception of police officers, firefighters, Tacoma Rail employees who are covered by state and federal retirement plans. Employees of the Tacoma-Pierce County Health Department, as well as, certain employees of the Pierce Transit and Law Enforcement Support Agency who established membership in the System when these agencies were still City of Tacoma departments, are also members. The Board of Administration of the Tacoma Employees’ Retirement System administers the plan and derives its authority in accordance with Chapter 41.28 Revised Code of Washington and Chapter 1.30 of the Tacoma City Code. There are currently 2,166 retirees and beneficiaries receiving benefits, 459 vested terminated employees entitled to future benefits; and 2,884 active members of Tacoma Employees’ Retirement System, as of December 31, 2014. 2. Basis of accounting: The financial statements are prepared using the accrual basis of accounting. Employee and employer contributions are recognized as revenues in the period in which employee services are performed, and expenses are recorded when the corresponding liabilities are incurred, regardless of when payment is made. 3. Investments: Equity securities, fixed income securities, private equity, real estate, and short-term investments are all reported at fair market value. Fair market value for public market managers was determined by our custodian bank utilizing standard industry practices. Private equity investments are reported by the managers subject to their “fair value” policies. No investment in any one corporation or organization exceeded 5% of net assets available for benefits. 4. Contracts: The System has no securities of the employer and related parties included in the plan assets. The system has not made any loans to the employer in the form of notes, bonds, or other instruments. 5. Benefits: There are two formulas that are used for calculating retirement benefits. The benefit will be determined on the formula which provides the higher benefit. The most commonly applied formula, “service retirement” is a product of the of the member’s average monthly salary for the highest consecutive 24-month period, the number of years of membership credit, and a percentage factor (2% maximum) which is determined based on the member’s age and years of service. Several options are available for the retiree to provide for their beneficiaries. The System also provides death and disability benefits.
2014 Comprehensive Annual Financial Report City of Tacoma, Washington
NOTES TO THE FINANCIAL STATEMENTS
For the Year Ended December 31, 2014
The notes to the financial statements are an integral part of this statement. Basic Financial Statements, 3-51
6. Contribution rates: Covered employees are required by Chapter 1.30 of the Tacoma City Code to contribute based on the rates provided in the following table:
Applicable Period City Rate Member Rate Total Rate
1/1/2001 to 02/01/2009 7.56% 6.44% 14.00%
2/2/2009 to 12/31/2009 8.64% 7.36% 16.00%
1/1/2010 to 12/31/2010 9.72% 8.28% 18.00%
1/1/2011 to 12/31/2011 10.26% 8.74% 19.00%
1/1/2012 to forward 10.80% 9.20% 20.00% 7. GASB Statement 50: The note disclosures above emphasize the employer disclosures with additional detailed information presented in an independent annual report issued by the Retirement System. Further detailed information regarding these disclosures can be found in that report which may be obtained by writing to Tacoma Employees’ Retirement System, 3628 S 35th St, Tacoma, WA 98409. 8. Funding status and progress: Historical trend information about TERS is presented with supplementary information and can be found in the required supplementary information section of the TERS annual report. This information is based on the most recent actuarial valuation performed, dated January 1, 2014, and is intended to help assess TERS funding status on a going-concern basis, and assess progress made in accumulating assets to pay benefits when due, and make comparisons with other public employee retirement systems.
Schedule of Funding Progress ($ in millions):
Actuarial UAAL as of
Actuarial Actuarial Accrued Unfunded Percentage
Valuation Value of Liabililty AAL Funded Covered of Covered
Date Assets (AAL) (UAAL) Ratio Payroll Payroll
1/1/2012 $ 1,068.3 $ 1,185.5 $ 117.2 90.1% $ 219.4 53.4%
1/1/2013 1,187.1 1,306.6 119.5 90.9% 210.6 56.7%
1/1/2014 1,297.0 1,400.0 103.0 92.6% 213.8 48.2%
Both the City and employees made the required contributions. The City’s required contributions for the years ended December 31st were:
2012 20,919,787
2013 21,188,984
2014 22,149,246
2014 Comprehensive Annual Financial Report City of Tacoma, Washington
NOTES TO THE FINANCIAL STATEMENTS For the Year Ended December 31, 2014
Basic Financial Statements, 3-52 The notes to the financial statements are an integral part of this statement.
9. Actuarial Methods and Significant Actuarial Assumptions:
Valuation Date: January 1, 2014
Actuarial Cost Method: Entry Age
Amortization Method: Level Percentage of the Systems Projected Payroll
Remaining Amortization Period: 30 years (Open), unless fixed rate amortized less than 30 years
Asset Valuation Method: Assets are valued at market value, with a four year smoothing
of all market value gains and losses
Actuarial Assumptions:
Investment Rate of Return 7.25%
Project Salary Increases 4.00%
Includes Inflation at 3.00%
Cost of Living Adjustments 2.125%
B. Law Enforcement Officers’ and Fire Fighters’ Retirement System (LEOFF) Plans 1 and 2 1. Administration of the System The City of Tacoma participates in the LEOFF system administered by the Washington State Department of Retirement Systems, under cost-sharing multiple-employer public employee defined benefit and defined retirement plans. The Department of Retirement Systems (DRS), a department within the primary government of the State of Washington, issues a publicly available comprehensive annual financial report (CAFR) that includes financial statements and required supplementary information for each plan. The DRS CAFR may be obtained by writing to: Department of Retirement Systems, Communications Unit, P.O. Box 48380, Olympia, WA 98504-8380; or it may be downloaded from the DRS website at www.drs.wa.gov. The following disclosures are made pursuant to GASB Statement No. 27, Accounting for Pension by State and Local Government Employers and No. 50, Pension Disclosures, an Amendment of GASB Statements No. 25 and No 27. 2. Plan description: LEOFF was established in 1970 by the Legislature. Membership includes all full-time, fully compensated, local law enforcement commissioned officers, firefighters and, as of July 24, 2005, emergency medical technicians. LEOFF membership is comprised primarily of non-state employees, with Department of Fish and Wildlife enforcement officers, who were first included effective July 27, 2003, being an exception. LEOFF retirement benefit provisions are established in Chapter 41.26 RCW and may be amended only by the State Legislature. LEOFF is a cost-sharing multiple-employer retirement system comprised of two separate defined benefit plans. LEOFF members who joined the system by September 30, 1977 are Plan 1 members. Those who joined on or after October 1, 1977 are Plan 2 members. Effective July 1, 2003, the LEOFF Plan 2 Retirement Board was established by Initiative 790 to provide governance of LEOFF Plan 2. The Board’s duties include adopting contribution rates and recommending policy changes to the Legislature. LEOFF retirement benefits are financed from a combination of investment earnings, employer and employee contributions, and a special funding situation in which the state pays through legislative appropriations. Employee contributions to the LEOFF Plan 1 and Plan 2 defined benefit plans accrue interest at a rate specified by the Director of DRS. During DRS’ fiscal year 2013, the rate was five and one-half percent compounded quarterly. Members in LEOFF Plan 1 and 2 can elect to withdraw total employee contributions and interest earnings upon separation from LEOFF-covered employment.
2014 Comprehensive Annual Financial Report City of Tacoma, Washington
NOTES TO THE FINANCIAL STATEMENTS
For the Year Ended December 31, 2014
The notes to the financial statements are an integral part of this statement. Basic Financial Statements, 3-53
LEOFF Plan 1 members are vested after the completion of five years of eligible service. Plan 1 members are eligible for retirement with five years of service at the age of 50. The benefit per year of service calculated as a percent of final average salary (FAS) is as follows:
Term of Service Percent of Final Average Salary
20 or more years 2.0%
10 but less than 20 years 1.5%
5 but less than 10 years 1.0% The FAS is the basic monthly salary received at the time of retirement, provided a member has held the same position or rank for 12 months preceding the date of retirement. Otherwise, it is the average of the highest consecutive 24 months’ salary within the last 10 years of service. A cost-of living allowance is granted (based on the Consumer Price Index). LEOFF Plan 1 provides death and disability benefits. Death benefits for survivors of Plan 1 members on active duty consist of the following: (1) If eligible spouse, 50 percent of the FAS, plus 5 percent of FAS for each eligible surviving child, with a limitation on the combined benefit of 60 percent of the FAS; or (2) If no eligible spouse, eligible children receive 30 percent of FAS for the first child plus 10 percent for each additional child, subject to a 60 percent limitation of FAS, divided equally. A one-time duty-related death benefit is provide to the beneficiary of the estate of a LEOFF Plan 1 member who dies as a result of injuries or illness sustained in the course of employment, or if the death resulted from an occupational disease or infection that arouse naturally and proximately out of the member’s covered employment, if found eligible by the Department of Labor and Industries. The LEOFF Plan 1 disability benefit is 50 percent of the FAS plus 5 percent for each child up to a maximum of 60 percent. Upon recovery from disability before the age of 50, a member is restored to service with full credit for service while disabled. Upon recovery after the age of 50, the benefit continues as the greater of the member’s disability benefit or service retirement benefit. LEOFF Plan 2 members are vested after the completion of five years of eligible service. Plan 2 members are eligible for retirement at the age of 53 with five years of service, or at age 50 with 20 years of service. Plan 2 members receive a benefit of 2 percent of the FAS per year of service (the FAS is based on the highest consecutive 60 months), actuarially reduced to reflect the choice of a survivor option. Members who retire prior to the age of 53 receive reduced benefits. If the member has at least 20 years of service and is age 50, the reduction is 3 percent for each year prior to age 53. Otherwise, the benefits are actuarially reduced for each year prior to age 53. A cost-of-living allowance is granted (based on the Consumer Price Index), capped at 3 percent annually. LEOFF Plan 2 provides disability benefits. There is no minimum amount of service credit required for eligibility. The Plan 2 benefit amount is 2 percent of the FAS for each year of service. Benefits are reduced to reflect the choice of a survivor option and for each year that the member’s age is less than 53, unless the disability is duty-related. If the member has at least 20 years of service and is age 50, the reduction is three percent for each year prior to age 53. A disability benefit equal to 70 percent of their FAS, subject to offsets for workers’ compensation and Social Security disability benefits received, is also available to those LEOFF 2 members who are catastrophically disabled in the line of duty and incapable of future substantial gainful employment in any capacity. Effective June 2010, benefits to LEOFF Plan 2 members who are catastrophically disabled include payment of eligible health care insurance premiums. Members of LEOFF Plan 2 who leave service because of a line of duty disability are allowed to withdraw 150 percent of accumulated member contributions. This withdrawal benefit is not subject to federal income tax. Alternately, members of LEOFF Plan 2 who leave service because of a line of duty disability may be eligible to receive a retirement benefit of at least 10 percent of FAS and 2 percent per year of service beyond five years. The first 10 percent of the FAS is not subject to federal income tax.
2014 Comprehensive Annual Financial Report City of Tacoma, Washington
NOTES TO THE FINANCIAL STATEMENTS For the Year Ended December 31, 2014
Basic Financial Statements, 3-54 The notes to the financial statements are an integral part of this statement.
LEOFF Plan 2 retirees may return to work in an eligible position covered by another retirement system, choose membership in that system and suspend their pension benefits, or not choose membership and continue receiving pension benefits without interruption. A one-time duty-related death benefit is provided to the beneficiary or estate of a LEOFF Plan 2 member who dies as a result of injuries or illness sustained in the course of employment, or if the death resulted from an occupational disease or infection that arose naturally and proximately out of the member’s covered employment, if found eligible by the Department of Labor and Industries. Benefits to eligible surviving spouses and dependent children of LEOFF Plan 2 members killed in the course of employment include the payment of eligible health care insurance premiums. Legislation passed in 2009 provides to the Washington-state-registered domestic partners of LEOFF Plan 2 members the same treatment as married spouses, to the extent that the treatment is not in conflict with federal laws. LEOFF members meeting specific eligibility requirements have options available to enhance their retirement benefits. Some of these options are available to their survivors. There are 374 participating employers in LEOFF. Membership in LEOFF consisted of the following as of the latest actuarial valuation date for the plans as of June 30, 2013:
Retirees and Beneficiaries Receiving Benefits 10,511
Terminated Plan Members Entitled to But Not Yet Receiving Benefits 699
Active Plan Members Vested 16,830
Active Plan Members Nonvested 1,600
Total 29,640 3. Funding Policy Employer and employee contribution rates are developed by the Office of the State Actuary to fully fund the plans. Starting on July 1, 2000, Plan 1 employers and employees contribute zero percent as long as the plan remains fully funded. Plan 2 employers and employees are required to pay at the level adopted by the LEOFF Plan 2 Retirement Board. The Legislature, by means of a special funding arrangement, appropriated money from the state General Fund to supplement the current service liability and fund the prior service costs of Plan 2 in accordance with the recommendations of the Pension Funding Council and the LEOFF Plan 2 Retirement Board. This special funding situation is not mandated by the state constitution and could be changed by statute. For DRS’ fiscal year 2014, the state contributed $55.6 million to LEOFF Plan 2. The methods used to determine the contribution requirements are established under state statute in accordance with Chapters 41.26 and 41.45 RCW. The required contribution rates expressed as a percentage of current-year covered payroll, as of December 31, 2014, are as follows:
LEOFF Plan 1 LEOFF Plan 2
Employer* 0.18% 5.23% **
Employee 0.00% 8.41%
State N/A 3.36%
* The employer rates include the employer administrative expense fee currently set at .18%.
** The employee rate for ports and universities is 8.59%.
2014 Comprehensive Annual Financial Report City of Tacoma, Washington
NOTES TO THE FINANCIAL STATEMENTS
For the Year Ended December 31, 2014
The notes to the financial statements are an integral part of this statement. Basic Financial Statements, 3-55
Both the City of Tacoma and the employees made the required contributions. The City of Tacoma required contributions for the years ended December 31 were as follows:
LEOFF Plan 1 LEOFF Plan 2 Total
2014 n/a n/a 3.80$
2013 n/a n/a 3.58$
2012 n/a n/a 3.61$
(expressed in millions)
C. Police and Firefighter’s Relief and Pension Funds 1. Plan description: The Police Relief and Pension Fund (PRP) and the Fire Relief and Pension Fund (FRP) are single-employer, defined benefit pension funds established and administered by the City in accordance with the requirements of the RCW. Since the effective date of the LEOFF on March 1, 1970, no payroll deductions for active employees have been taken under these pension plans. These plans also provide post-employment healthcare benefits to members of the plans and certain excess pension benefits to LEOFF members hired prior to October 1, 1977. No new employees have been covered by either of these plans since March 1, 1970. Pension obligations for all firefighters and law enforcement officers retired since March 1, 1970, whether hired before or since that same date, have been assumed by the State of Washington Law Enforcement Officers' and Firefighters' Retirement System (LEOFF), with the exception of certain minimal benefits in excess of the LEOFF benefits. There are 0 active Police Officers and 0 active Firefighters with prior rights covered under these plans as of December 31, 2014. Retirees and beneficiaries of deceased retirees eligible to receive pension benefits currently number 153 for the PRP and 202 for the FRP as of December 31, 2014. There are no terminated employees under either plan who are entitled to benefits but not receiving them. A member of the FRP is eligible for retirement after completion of service for a period of five years or more and attainment of age 50. A member is eligible for disability benefits if disabled for a minimum of six months. An individual becomes vested after five years of service. A member of the PRP is eligible for benefits after completing 25 years of service. An individual becomes vested after five years of service. Since there have been no new employees covered under these systems since 1970, all employees are fully vested. The PRP and FRP make three types of payments: (1) pensions to eligible members retired prior to March 1, 1970, (2) amounts to certain eligible members retired after that date if the amount received from LEOFF does not equal or exceed the amount entitled from the appropriate prior pension fund, and (3) medical services for both active and retired firefighters and law enforcement officers, excluding those hired since October 1, 1977. The medical services are an obligation that may be paid directly from the City's General Fund if so desired. The pension benefits are tied to the current pay rates for the rank the members held at retirement and/or the cost of living index. Benefits are established in accordance with RCWs 41.16, 41.18, 41.20 and 41.26. Benefits are calculated based on length of service (a percentage for each year of service) and on the final average salary (calculated over the last two years of credited service). There were no changes in benefit provisions in the current year. Each police officer or firefighter in service on March 1, 1970 receives the greater of benefit payable under the LEOFF system and the benefits available under the old law. Where benefits under the old law exceed those under LEOFF, the excess benefits are paid by the Pension fund of the City employing him/her on March 1, 1970. Post-employment medical benefits are available to firefighters and law enforcement officers hired before October 1, 1977 only. For retirees before June 8, 1961, only medical expenses that are directly related to their disability retirement are eligible for payment. Those who retired or will retire after June 8, 1961, have medical insurance paid by the City through the City's normal medical insurance carrier. The City will also pay any expense in excess of those covered by the medical insurance carrier. All benefits are funded on a pay-as-you-go basis. At December 31, 2014, there were 202 retired law enforcement officers and 249 retired firefighters who are eligible for medical coverage (this does not include active employees).
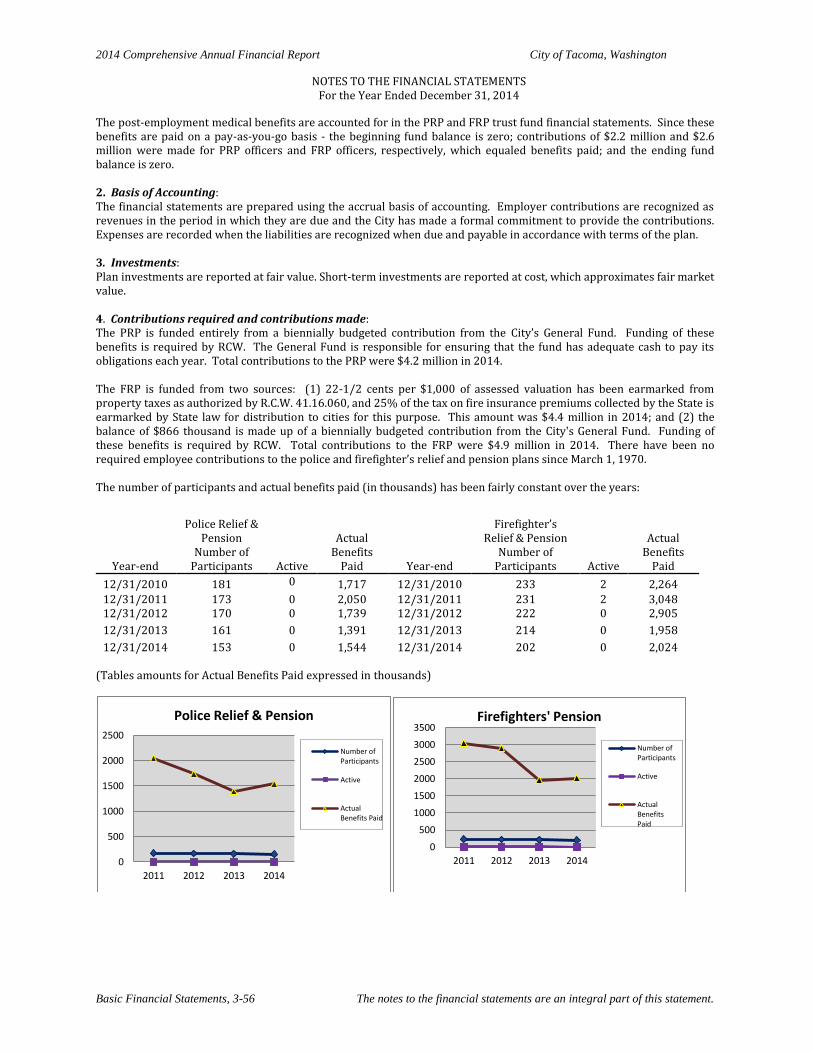
2014 Comprehensive Annual Financial Report City of Tacoma, Washington
NOTES TO THE FINANCIAL STATEMENTS For the Year Ended December 31, 2014
Basic Financial Statements, 3-56 The notes to the financial statements are an integral part of this statement.
The post-employment medical benefits are accounted for in the PRP and FRP trust fund financial statements. Since these benefits are paid on a pay-as-you-go basis - the beginning fund balance is zero; contributions of $2.2 million and $2.6 million were made for PRP officers and FRP officers, respectively, which equaled benefits paid; and the ending fund balance is zero. 2. Basis of Accounting: The financial statements are prepared using the accrual basis of accounting. Employer contributions are recognized as revenues in the period in which they are due and the City has made a formal commitment to provide the contributions. Expenses are recorded when the liabilities are recognized when due and payable in accordance with terms of the plan. 3. Investments: Plan investments are reported at fair value. Short-term investments are reported at cost, which approximates fair market value. 4. Contributions required and contributions made: The PRP is funded entirely from a biennially budgeted contribution from the City’s General Fund. Funding of these benefits is required by RCW. The General Fund is responsible for ensuring that the fund has adequate cash to pay its obligations each year. Total contributions to the PRP were $4.2 million in 2014.
The FRP is funded from two sources: (1) 22-1/2 cents per $1,000 of assessed valuation has been earmarked from property taxes as authorized by R.C.W. 41.16.060, and 25% of the tax on fire insurance premiums collected by the State is earmarked by State law for distribution to cities for this purpose. This amount was $4.4 million in 2014; and (2) the balance of $866 thousand is made up of a biennially budgeted contribution from the City's General Fund. Funding of these benefits is required by RCW. Total contributions to the FRP were $4.9 million in 2014. There have been no required employee contributions to the police and firefighter’s relief and pension plans since March 1, 1970. The number of participants and actual benefits paid (in thousands) has been fairly constant over the years:
Year-end
Police Relief & Pension
Number of Participants Active
Actual Benefits
Paid Year-end
Firefighter’s Relief & Pension
Number of Participants Active
Actual Benefits
Paid
12/31/2010 181 0 1,717 12/31/2010 233 2 2,264
12/31/2011 173 0 2,050 12/31/2011 231 2 3,048 12/31/2012 170 0 1,739 12/31/2012 222 0 2,905
12/31/2013 161 0 1,391 12/31/2013 214 0 1,958
12/31/2014 153 0 1,544 12/31/2014 202 0 2,024 (Tables amounts for Actual Benefits Paid expressed in thousands)
0
500
1000
1500
2000
2500
2011 2012 2013 2014
Police Relief & Pension
Number ofParticipants
Active
ActualBenefits Paid
0
500
1000
1500
2000
2500
3000
3500
2011 2012 2013 2014
Firefighters' Pension
Number ofParticipants
Active
ActualBenefitsPaid
2014 Comprehensive Annual Financial Report City of Tacoma, Washington
NOTES TO THE FINANCIAL STATEMENTS
For the Year Ended December 31, 2014
The notes to the financial statements are an integral part of this statement. Basic Financial Statements, 3-57
5. Annual Pension Cost and Net Pension Obligation: Three-year trend information (in thousands) for the Firefighter’s and Police Relief and Pension Funds as of the December 31, 2013, actuarial valuation are:
Retirement System
Fiscal Year
Ending
December 31
Annual Pension
Cost (APC)
Percentage
of APC
Contributed
Net Pension
Obligation
(NPO)
Firefighter's Relief & Pension 2012 2,676 86 9,145
2013 2,629 81 9,643
2014 1,823 102 9,608
Police Relief & Pension 2012 1,513 102 (496)
2013 1,516 100 (490)
2014 1,318 97 (444) The funded status of the plans at the last valuation date is presented below (in thousands). The Required Supplementary Information section displays multiyear trend information as to the value of the plan assets decreasing or increasing over time relative to the AALs for benefits.
Actuarial
Value of
Assets
Acuarial
Accrued
Liability (AAL)
Entry Age
Unfunded
AAL
(UAAL)
Funded
Ratio
Covered
Payroll
UAAL as
Percentage
of Covered
Payroll
Firefighter's Relief & Pension 452$ 26,275$ 25,823$ 2% 0 n/a
Police Relief and Pension 303 14,947 14,644 2% 0 n/a The AAL as of December 31, 2014, based on the actuarial valuation as of January 1, 2014, was $26.3 million for Firefighters’ Relief and Pension and $14.9 million for Police Relief and Pension. The AAL for the Firefighter’s and Police Relief and Pension are funded on a pay-as-you-go basis. Annual requirement are funded through the City’s adopted budgets, and any budget requirements exceeding the adopted budget are fully covered by supplemental appropriations.
2014 Comprehensive Annual Financial Report City of Tacoma, Washington
NOTES TO THE FINANCIAL STATEMENTS For the Year Ended December 31, 2014
Basic Financial Statements, 3-58 The notes to the financial statements are an integral part of this statement.
2014 2013 2012 2014 2013 2012
Annual Required Contribution (ARC)
Annual Normal Cost - Beginning of Year - 6 6 - - -
Amortization of UAAL - Beginning of Year 2,200 2,896 2,896 1,247 1,437 1,437
Interest to End of Year* 82 116 116 47 58 58
ARC at End of Year 2,282 3,018 3,018 1,294 1,495 1,495
Interest on NPO 362 366 351 (18) (20) (19)
Adjustment to ARC (821) (755) (693) 42 41 37
Annual Pension Cost (APC) 1,823 2,629 2,676 1,318 1,516 1,513
Employer Contribution** 1,858 2,131 2,305 1,272 **** 1,510 1,536
Change in NPO (35) 498 371 46 **** 6 (23)
NPO at Beginning of Year 9,643 9,145 8,774 (490) (496) (473)
NPO at End of Year 9,608 9,643 9,145 (444) **** (490) (496)
F iref ighter's R elief and P ensio n P o lice R elief and P ensio n
ANNUAL PENSION COST AND NET PENSION OBLIGATION
FIREFIGHTER'S POICE RELIEF AND PENSION FUNDS
For the Year Ended December 31, 2014
(In Thousands )
“I” is the assumed interest rate that year: 4.0% in 2012, 4.0% in 2013, and 3.75 in 2014. ** Employer contributions for pensions are total contributions to the Fund net of disbursements from the Fund for medical expenses under RCW 41.26.150 and administrative expenses. ****Assumed amounts replaced at year-end with actual amounts
The net pension obligation of the Firefighter’s Relief and Pension Fund is $ $9.6 million net pension liability at December 31, 2014. The net pension obligation of the Police Relief and Pension Fund is $0.4 million net pension asset at December 31, 2014. 6. Actuarial Method and Assumptions: The information presented above was determined as part of the actuarial valuations at the dates indicated. Additional information as of the latest actuarial valuation follows:
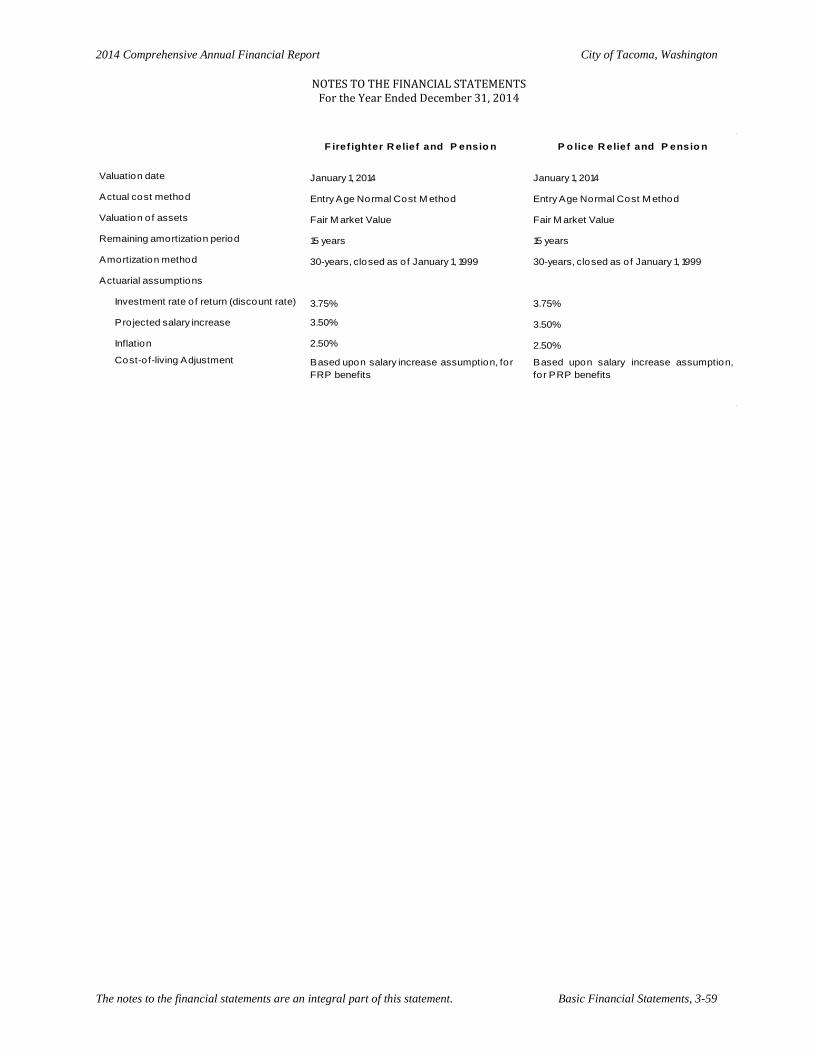
2014 Comprehensive Annual Financial Report City of Tacoma, Washington
NOTES TO THE FINANCIAL STATEMENTS
For the Year Ended December 31, 2014
The notes to the financial statements are an integral part of this statement. Basic Financial Statements, 3-59
F iref ighter R elief and P ensio n P o lice R elief and P ensio n
Valuation date January 1, 2014 January 1, 2014
Actual cost method Entry Age Normal Cost M ethod Entry Age Normal Cost M ethod
Valuation of assets Fair M arket Value Fair M arket Value
Remaining amortization period 15 years 15 years
Amortization method 30-years, closed as of January 1, 1999 30-years, closed as of January 1, 1999
Actuarial assumptions
Investment rate of return (discount rate) 3.75% 3.75%
Pro jected salary increase 3.50% 3.50%
Inflation 2.50% 2.50%
Cost-of-living Adjustment Based upon salary increase assumption, for
FRP benefits
Based upon salary increase assumption,
for PRP benefits
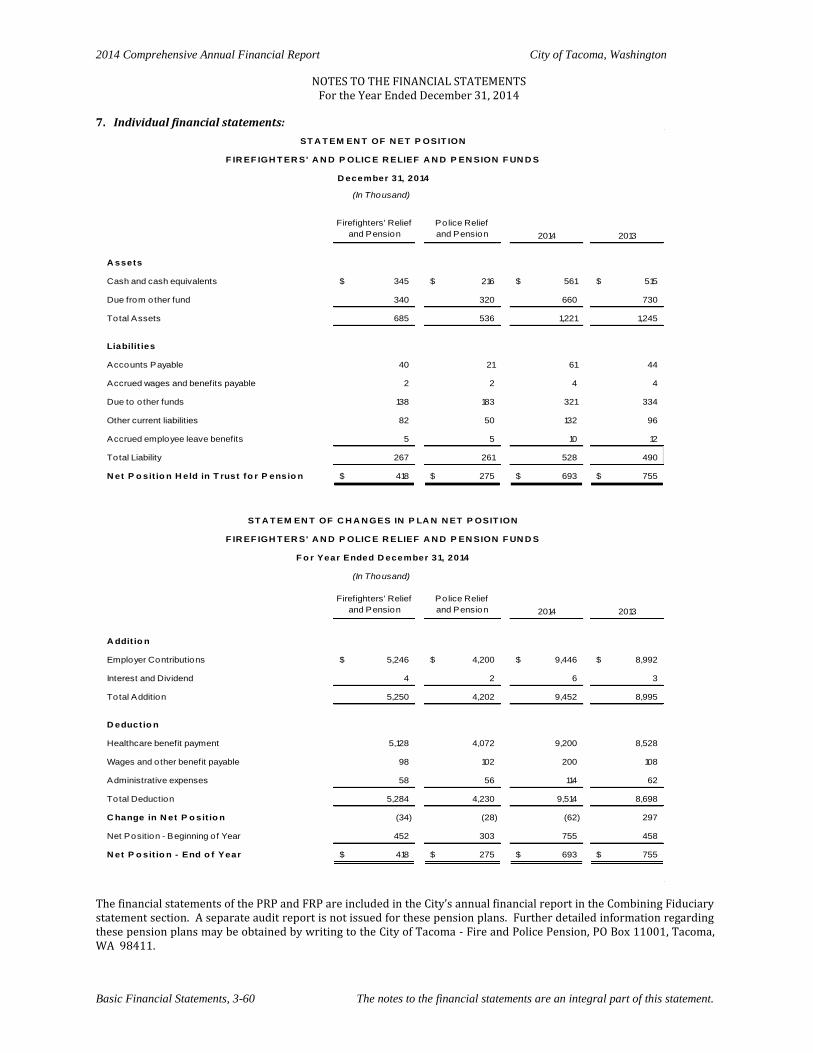
2014 Comprehensive Annual Financial Report City of Tacoma, Washington
NOTES TO THE FINANCIAL STATEMENTS For the Year Ended December 31, 2014
Basic Financial Statements, 3-60 The notes to the financial statements are an integral part of this statement.
7. Individual financial statements:
Firefighters' Relief
and Pension
Police Relief
and Pension 2014 2013
A ssets
Cash and cash equivalents 345$ 216$ 561$ 515$
Due from other fund 340 320 660 730
Total Assets 685 536 1,221 1,245
Liabilit ies
Accounts Payable 40 21 61 44
Accrued wages and benefits payable 2 2 4 4
Due to other funds 138 183 321 334
Other current liabilities 82 50 132 96
Accrued employee leave benefits 5 5 10 12
Total Liability 267 261 528 490
N et P o sit io n H eld in T rust fo r P ensio n 418$ 275$ 693$ 755$
Firefighters' Relief
and Pension
Police Relief
and Pension 2014 2013
A ddit io n
Employer Contributions 5,246$ 4,200$ 9,446$ 8,992$
Interest and Dividend 4 2 6 3
Total Addition 5,250 4,202 9,452 8,995
D eductio n
Healthcare benefit payment 5,128 4,072 9,200 8,528
Wages and other benefit payable 98 102 200 108
Administrative expenses 58 56 114 62
Total Deduction 5,284 4,230 9,514 8,698
C hange in N et P o sit io n (34) (28) (62) 297
Net Position - Beginning of Year 452 303 755 458
N et P o sit io n - End o f Year 418$ 275$ 693$ 755$
F o r Year Ended D ecember 31, 2014
(In Thousand)
ST A T EM EN T OF N ET P OSIT ION
F IR EF IGH T ER S' A N D P OLIC E R ELIEF A N D P EN SION F UN D S
D ecember 31, 2014
(In Thousand)
ST A T EM EN T OF C H A N GES IN P LA N N ET P OSIT ION
F IR EF IGH T ER S' A N D P OLIC E R ELIEF A N D P EN SION F UN D S
The financial statements of the PRP and FRP are included in the City’s annual financial report in the Combining Fiduciary statement section. A separate audit report is not issued for these pension plans. Further detailed information regarding these pension plans may be obtained by writing to the City of Tacoma - Fire and Police Pension, PO Box 11001, Tacoma, WA 98411.
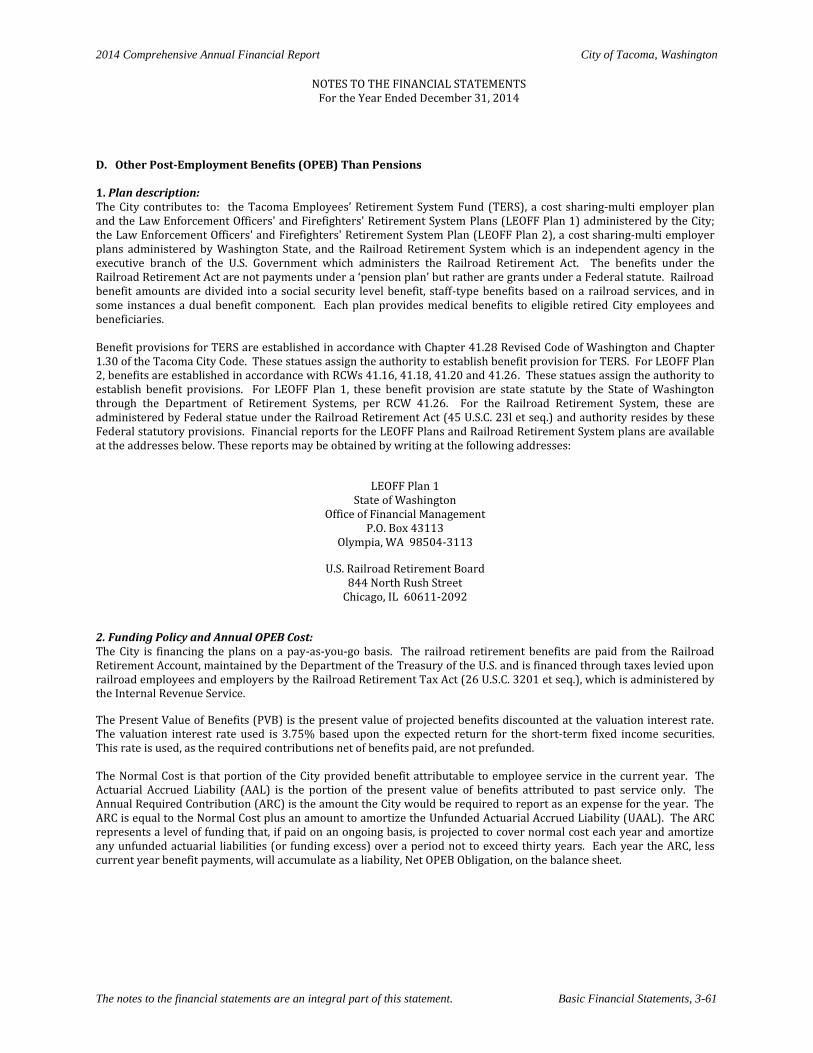
2014 Comprehensive Annual Financial Report City of Tacoma, Washington
NOTES TO THE FINANCIAL STATEMENTS
For the Year Ended December 31, 2014
The notes to the financial statements are an integral part of this statement. Basic Financial Statements, 3-61
D. Other Post-Employment Benefits (OPEB) Than Pensions 1. Plan description: The City contributes to: the Tacoma Employees’ Retirement System Fund (TERS), a cost sharing-multi employer plan and the Law Enforcement Officers' and Firefighters' Retirement System Plans (LEOFF Plan 1) administered by the City; the Law Enforcement Officers' and Firefighters' Retirement System Plan (LEOFF Plan 2), a cost sharing-multi employer plans administered by Washington State, and the Railroad Retirement System which is an independent agency in the executive branch of the U.S. Government which administers the Railroad Retirement Act. The benefits under the Railroad Retirement Act are not payments under a ‘pension plan’ but rather are grants under a Federal statute. Railroad benefit amounts are divided into a social security level benefit, staff-type benefits based on a railroad services, and in some instances a dual benefit component. Each plan provides medical benefits to eligible retired City employees and beneficiaries. Benefit provisions for TERS are established in accordance with Chapter 41.28 Revised Code of Washington and Chapter 1.30 of the Tacoma City Code. These statues assign the authority to establish benefit provision for TERS. For LEOFF Plan 2, benefits are established in accordance with RCWs 41.16, 41.18, 41.20 and 41.26. These statues assign the authority to establish benefit provisions. For LEOFF Plan 1, these benefit provision are state statute by the State of Washington through the Department of Retirement Systems, per RCW 41.26. For the Railroad Retirement System, these are administered by Federal statue under the Railroad Retirement Act (45 U.S.C. 23l et seq.) and authority resides by these Federal statutory provisions. Financial reports for the LEOFF Plans and Railroad Retirement System plans are available at the addresses below. These reports may be obtained by writing at the following addresses:
LEOFF Plan 1
State of Washington Office of Financial Management
P.O. Box 43113 Olympia, WA 98504-3113
U.S. Railroad Retirement Board 844 North Rush Street
Chicago, IL 60611-2092
2. Funding Policy and Annual OPEB Cost: The City is financing the plans on a pay-as-you-go basis. The railroad retirement benefits are paid from the Railroad Retirement Account, maintained by the Department of the Treasury of the U.S. and is financed through taxes levied upon railroad employees and employers by the Railroad Retirement Tax Act (26 U.S.C. 3201 et seq.), which is administered by the Internal Revenue Service.
The Present Value of Benefits (PVB) is the present value of projected benefits discounted at the valuation interest rate. The valuation interest rate used is 3.75% based upon the expected return for the short-term fixed income securities. This rate is used, as the required contributions net of benefits paid, are not prefunded. The Normal Cost is that portion of the City provided benefit attributable to employee service in the current year. The Actuarial Accrued Liability (AAL) is the portion of the present value of benefits attributed to past service only. The Annual Required Contribution (ARC) is the amount the City would be required to report as an expense for the year. The ARC is equal to the Normal Cost plus an amount to amortize the Unfunded Actuarial Accrued Liability (UAAL). The ARC represents a level of funding that, if paid on an ongoing basis, is projected to cover normal cost each year and amortize any unfunded actuarial liabilities (or funding excess) over a period not to exceed thirty years. Each year the ARC, less current year benefit payments, will accumulate as a liability, Net OPEB Obligation, on the balance sheet.
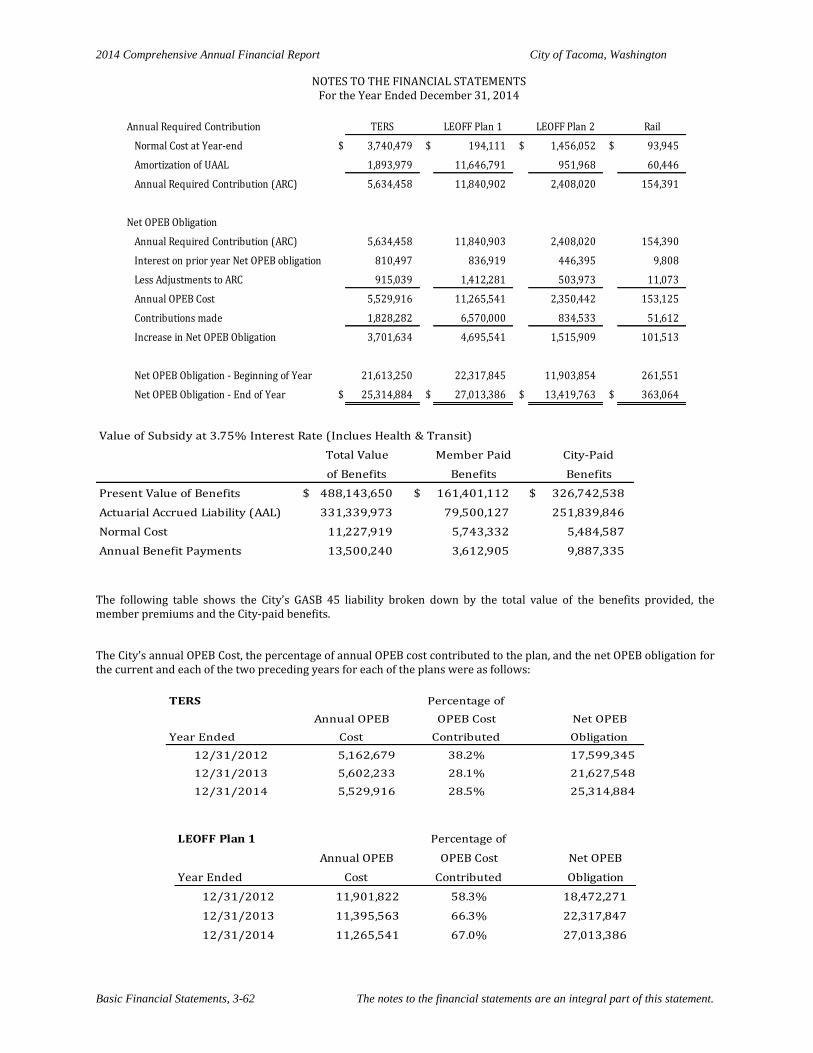
2014 Comprehensive Annual Financial Report City of Tacoma, Washington
NOTES TO THE FINANCIAL STATEMENTS For the Year Ended December 31, 2014
Basic Financial Statements, 3-62 The notes to the financial statements are an integral part of this statement.
Annual Required Contribution TERS LEOFF Plan 1 LEOFF Plan 2 Rail
Normal Cost at Year-end $ 3,740,479 $ 194,111 $ 1,456,052 $ 93,945
Amortization of UAAL 1,893,979 11,646,791 951,968 60,446
Annual Required Contribution (ARC) 5,634,458 11,840,902 2,408,020 154,391
Net OPEB Obligation
Annual Required Contribution (ARC) 5,634,458 11,840,903 2,408,020 154,390
Interest on prior year Net OPEB obligation 810,497 836,919 446,395 9,808
Less Adjustments to ARC 915,039 1,412,281 503,973 11,073
Annual OPEB Cost 5,529,916 11,265,541 2,350,442 153,125
Contributions made 1,828,282 6,570,000 834,533 51,612
Increase in Net OPEB Obligation 3,701,634 4,695,541 1,515,909 101,513
Net OPEB Obligation - Beginning of Year 21,613,250 22,317,845 11,903,854 261,551
Net OPEB Obligation - End of Year $ 25,314,884 $ 27,013,386 $ 13,419,763 $ 363,064
Value of Subsidy at 3.75% Interest Rate (Inclues Health & Transit)
Total Value Member Paid City-Paid
of Benefits Benefits Benefits
Present Value of Benefits $ 488,143,650 $ 161,401,112 $ 326,742,538
Actuarial Accrued Liability (AAL) 331,339,973 79,500,127 251,839,846
Normal Cost 11,227,919 5,743,332 5,484,587
Annual Benefit Payments 13,500,240 3,612,905 9,887,335
The following table shows the City’s GASB 45 liability broken down by the total value of the benefits provided, the member premiums and the City-paid benefits.
The City’s annual OPEB Cost, the percentage of annual OPEB cost contributed to the plan, and the net OPEB obligation for the current and each of the two preceding years for each of the plans were as follows:
TERS Percentage of
Annual OPEB OPEB Cost Net OPEB
Year Ended Cost Contributed Obligation
12/31/2012 5,162,679 38.2% 17,599,345
12/31/2013 5,602,233 28.1% 21,627,548
12/31/2014 5,529,916 28.5% 25,314,884
LEOFF Plan 1 Percentage of
Annual OPEB OPEB Cost Net OPEB
Year Ended Cost Contributed Obligation
12/31/2012 11,901,822 58.3% 18,472,271
12/31/2013 11,395,563 66.3% 22,317,847
12/31/2014 11,265,541 67.0% 27,013,386
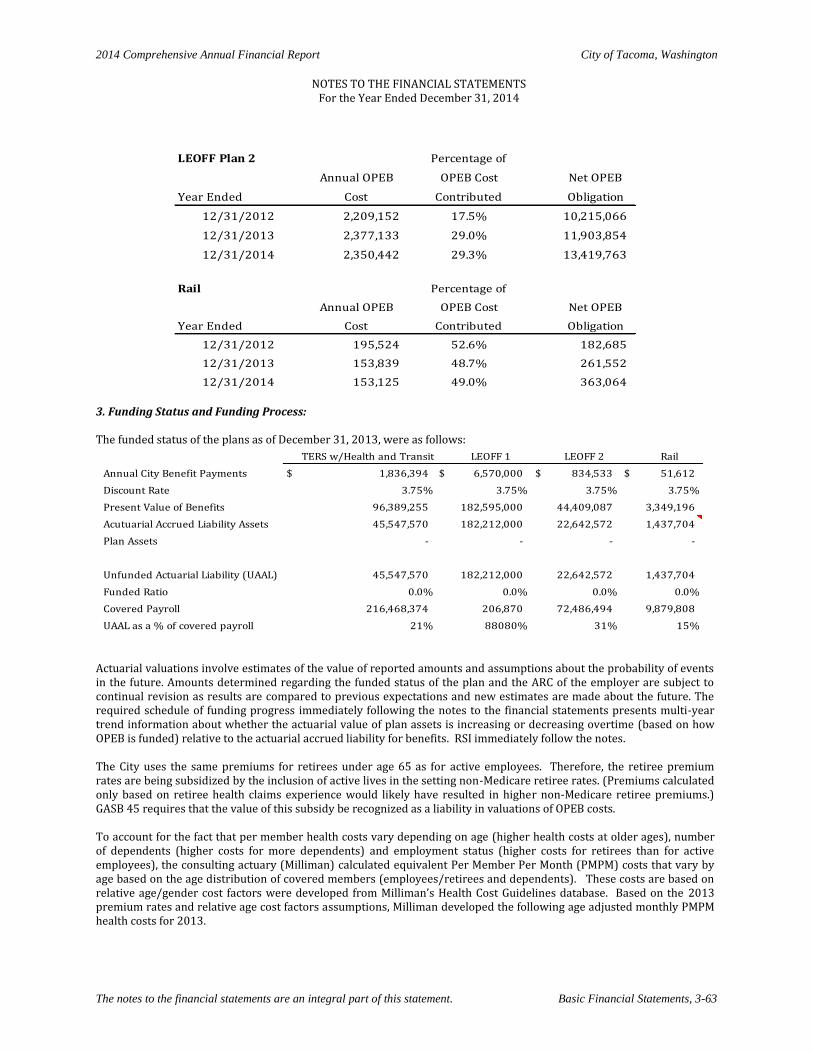
2014 Comprehensive Annual Financial Report City of Tacoma, Washington
NOTES TO THE FINANCIAL STATEMENTS
For the Year Ended December 31, 2014
The notes to the financial statements are an integral part of this statement. Basic Financial Statements, 3-63
LEOFF Plan 2 Percentage of
Annual OPEB OPEB Cost Net OPEB
Year Ended Cost Contributed Obligation
12/31/2012 2,209,152 17.5% 10,215,066
12/31/2013 2,377,133 29.0% 11,903,854
12/31/2014 2,350,442 29.3% 13,419,763
Rail Percentage of
Annual OPEB OPEB Cost Net OPEB
Year Ended Cost Contributed Obligation
12/31/2012 195,524 52.6% 182,685
12/31/2013 153,839 48.7% 261,552
12/31/2014 153,125 49.0% 363,064
3. Funding Status and Funding Process: The funded status of the plans as of December 31, 2013, were as follows:
TERS w/Health and Transit LEOFF 1 LEOFF 2 Rail
Annual City Benefit Payments $ 1,836,394 $ 6,570,000 $ 834,533 $ 51,612
Discount Rate 3.75% 3.75% 3.75% 3.75%
Present Value of Benefits 96,389,255 182,595,000 44,409,087 3,349,196
Acutuarial Accrued Liability Assets 45,547,570 182,212,000 22,642,572 1,437,704
Plan Assets - - - -
Unfunded Actuarial Liability (UAAL) 45,547,570 182,212,000 22,642,572 1,437,704
Funded Ratio 0.0% 0.0% 0.0% 0.0%
Covered Payroll 216,468,374 206,870 72,486,494 9,879,808
UAAL as a % of covered payroll 21% 88080% 31% 15%
Actuarial valuations involve estimates of the value of reported amounts and assumptions about the probability of events in the future. Amounts determined regarding the funded status of the plan and the ARC of the employer are subject to continual revision as results are compared to previous expectations and new estimates are made about the future. The required schedule of funding progress immediately following the notes to the financial statements presents multi-year trend information about whether the actuarial value of plan assets is increasing or decreasing overtime (based on how OPEB is funded) relative to the actuarial accrued liability for benefits. RSI immediately follow the notes. The City uses the same premiums for retirees under age 65 as for active employees. Therefore, the retiree premium rates are being subsidized by the inclusion of active lives in the setting non-Medicare retiree rates. (Premiums calculated only based on retiree health claims experience would likely have resulted in higher non-Medicare retiree premiums.) GASB 45 requires that the value of this subsidy be recognized as a liability in valuations of OPEB costs. To account for the fact that per member health costs vary depending on age (higher health costs at older ages), number of dependents (higher costs for more dependents) and employment status (higher costs for retirees than for active employees), the consulting actuary (Milliman) calculated equivalent Per Member Per Month (PMPM) costs that vary by age based on the age distribution of covered members (employees/retirees and dependents). These costs are based on relative age/gender cost factors were developed from Milliman’s Health Cost Guidelines database. Based on the 2013 premium rates and relative age cost factors assumptions, Milliman developed the following age adjusted monthly PMPM health costs for 2013.
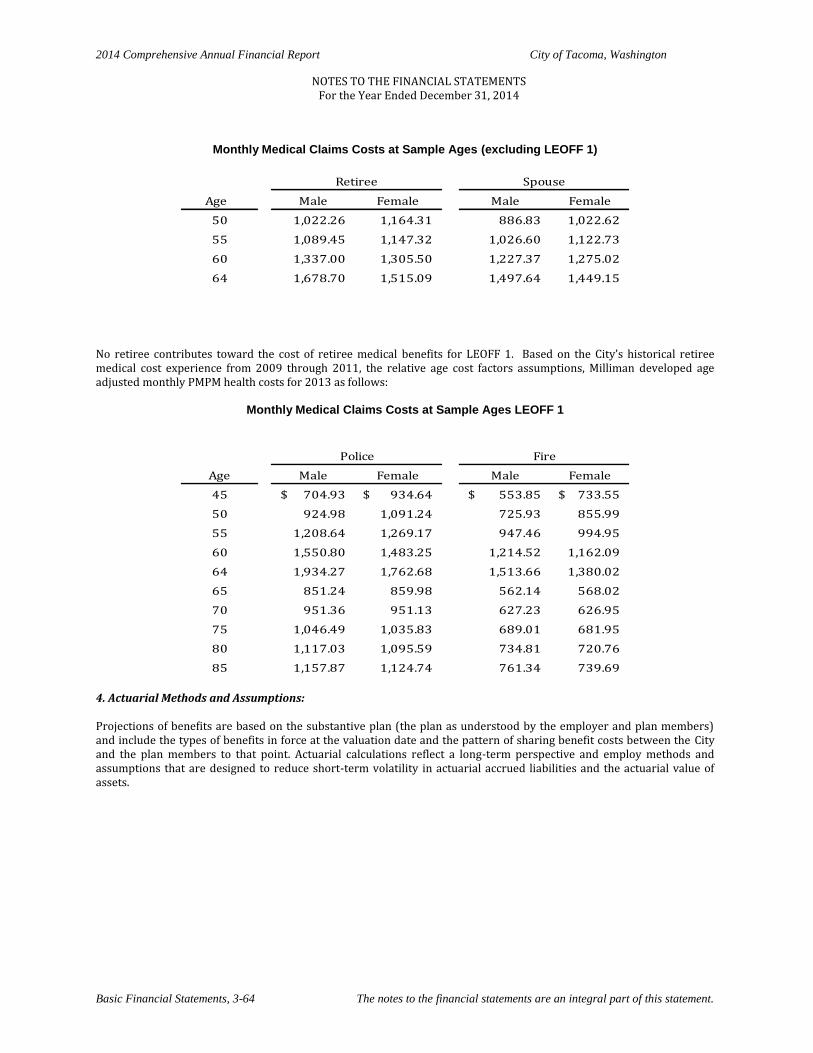
2014 Comprehensive Annual Financial Report City of Tacoma, Washington
NOTES TO THE FINANCIAL STATEMENTS For the Year Ended December 31, 2014
Basic Financial Statements, 3-64 The notes to the financial statements are an integral part of this statement.
Monthly Medical Claims Costs at Sample Ages (excluding LEOFF 1)
Age Male Female Male Female
50 1,022.26 1,164.31 886.83 1,022.62
55 1,089.45 1,147.32 1,026.60 1,122.73
60 1,337.00 1,305.50 1,227.37 1,275.02
64 1,678.70 1,515.09 1,497.64 1,449.15
Retiree Spouse
No retiree contributes toward the cost of retiree medical benefits for LEOFF 1. Based on the City’s historical retiree medical cost experience from 2009 through 2011, the relative age cost factors assumptions, Milliman developed age adjusted monthly PMPM health costs for 2013 as follows:
Monthly Medical Claims Costs at Sample Ages LEOFF 1
Age Male Female Male Female
45 704.93$ 934.64$ 553.85$ 733.55$
50 924.98 1,091.24 725.93 855.99
55 1,208.64 1,269.17 947.46 994.95
60 1,550.80 1,483.25 1,214.52 1,162.09
64 1,934.27 1,762.68 1,513.66 1,380.02
65 851.24 859.98 562.14 568.02
70 951.36 951.13 627.23 626.95
75 1,046.49 1,035.83 689.01 681.95
80 1,117.03 1,095.59 734.81 720.76
85 1,157.87 1,124.74 761.34 739.69
Police Fire
4. Actuarial Methods and Assumptions: Projections of benefits are based on the substantive plan (the plan as understood by the employer and plan members) and include the types of benefits in force at the valuation date and the pattern of sharing benefit costs between the City and the plan members to that point. Actuarial calculations reflect a long-term perspective and employ methods and assumptions that are designed to reduce short-term volatility in actuarial accrued liabilities and the actuarial value of assets.
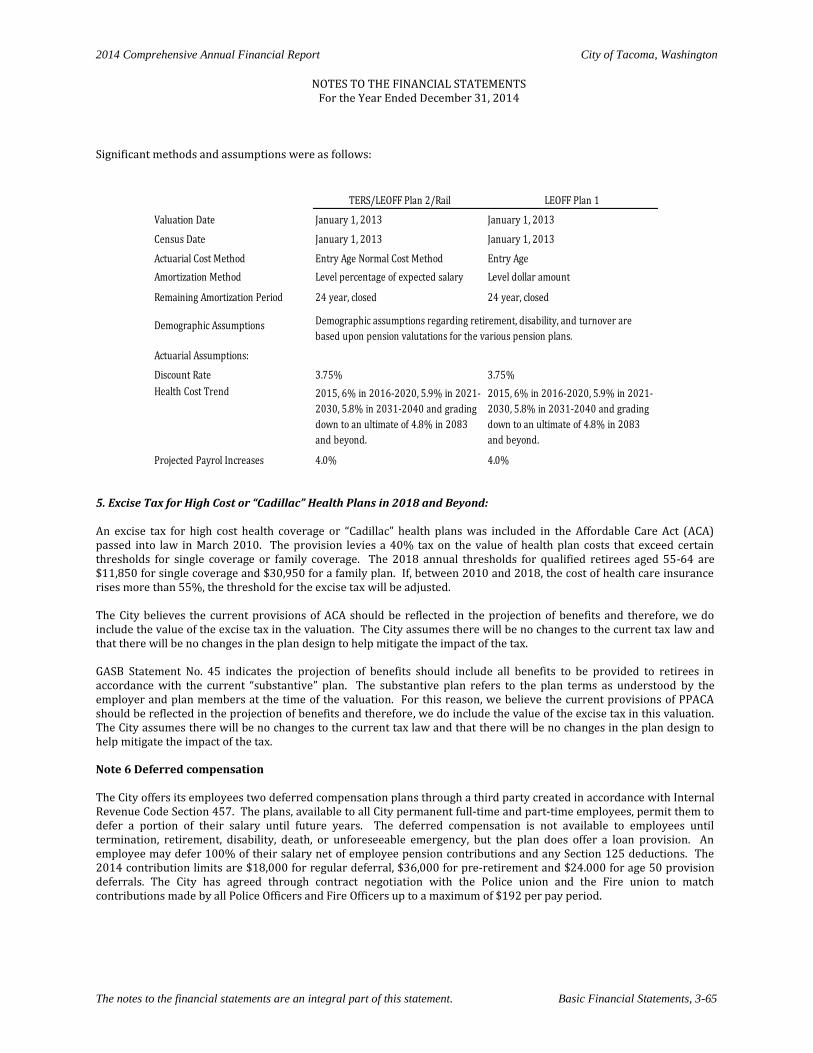
2014 Comprehensive Annual Financial Report City of Tacoma, Washington
NOTES TO THE FINANCIAL STATEMENTS
For the Year Ended December 31, 2014
The notes to the financial statements are an integral part of this statement. Basic Financial Statements, 3-65
Significant methods and assumptions were as follows:
TERS/LEOFF Plan 2/Rail LEOFF Plan 1
Valuation Date January 1, 2013 January 1, 2013
Census Date January 1, 2013 January 1, 2013
Actuarial Cost Method Entry Age Normal Cost Method Entry Age
Amortization Method Level percentage of expected salary Level dollar amount
Remaining Amortization Period 24 year, closed 24 year, closed
Demographic Assumptions
Actuarial Assumptions:
Discount Rate 3.75% 3.75%
Health Cost Trend8.9% in 2013, 6.5% in 2014, 5.8% in
2015, 6% in 2016-2020, 5.9% in 2021-
2030, 5.8% in 2031-2040 and grading
down to an ultimate of 4.8% in 2083
and beyond.
8.9% in 2013, 6.5% in 2014, 5.8% in
2015, 6% in 2016-2020, 5.9% in 2021-
2030, 5.8% in 2031-2040 and grading
down to an ultimate of 4.8% in 2083
and beyond.
Projected Payrol Increases 4.0% 4.0%
Demographic assumptions regarding retirement, disability, and turnover are
based upon pension valutations for the various pension plans.
5. Excise Tax for High Cost or “Cadillac” Health Plans in 2018 and Beyond: An excise tax for high cost health coverage or “Cadillac” health plans was included in the Affordable Care Act (ACA) passed into law in March 2010. The provision levies a 40% tax on the value of health plan costs that exceed certain thresholds for single coverage or family coverage. The 2018 annual thresholds for qualified retirees aged 55-64 are $11,850 for single coverage and $30,950 for a family plan. If, between 2010 and 2018, the cost of health care insurance rises more than 55%, the threshold for the excise tax will be adjusted. The City believes the current provisions of ACA should be reflected in the projection of benefits and therefore, we do include the value of the excise tax in the valuation. The City assumes there will be no changes to the current tax law and that there will be no changes in the plan design to help mitigate the impact of the tax. GASB Statement No. 45 indicates the projection of benefits should include all benefits to be provided to retirees in accordance with the current “substantive” plan. The substantive plan refers to the plan terms as understood by the employer and plan members at the time of the valuation. For this reason, we believe the current provisions of PPACA should be reflected in the projection of benefits and therefore, we do include the value of the excise tax in this valuation. The City assumes there will be no changes to the current tax law and that there will be no changes in the plan design to help mitigate the impact of the tax. Note 6 Deferred compensation The City offers its employees two deferred compensation plans through a third party created in accordance with Internal Revenue Code Section 457. The plans, available to all City permanent full-time and part-time employees, permit them to defer a portion of their salary until future years. The deferred compensation is not available to employees until termination, retirement, disability, death, or unforeseeable emergency, but the plan does offer a loan provision. An employee may defer 100% of their salary net of employee pension contributions and any Section 125 deductions. The 2014 contribution limits are $18,000 for regular deferral, $36,000 for pre-retirement and $24.000 for age 50 provision deferrals. The City has agreed through contract negotiation with the Police union and the Fire union to match contributions made by all Police Officers and Fire Officers up to a maximum of $192 per pay period.
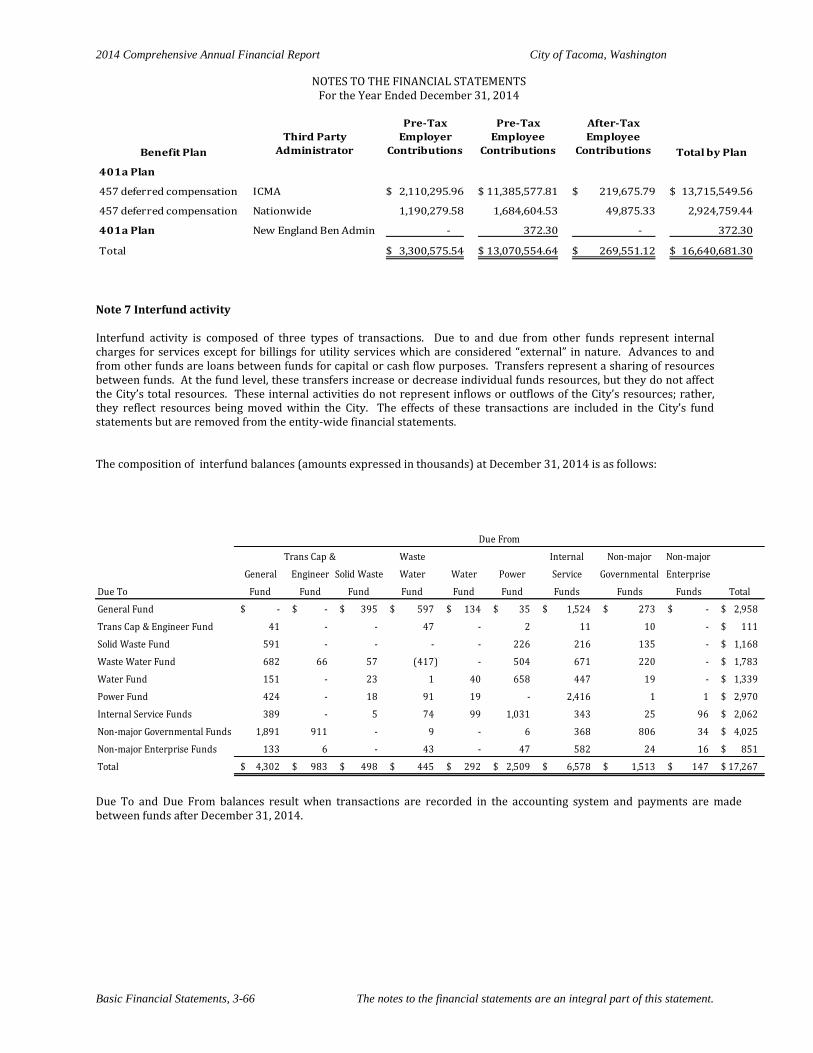
2014 Comprehensive Annual Financial Report City of Tacoma, Washington
NOTES TO THE FINANCIAL STATEMENTS For the Year Ended December 31, 2014
Basic Financial Statements, 3-66 The notes to the financial statements are an integral part of this statement.
Benefit Plan
Third Party
Administrator
Pre-Tax
Employer
Contributions
Pre-Tax
Employee
Contributions
After-Tax
Employee
Contributions Total by Plan
401a Plan
457 deferred compensation ICMA 2,110,295.96$ 11,385,577.81$ 219,675.79$ 13,715,549.56$
457 deferred compensation Nationwide 1,190,279.58 1,684,604.53 49,875.33 2,924,759.44
401a Plan New England Ben Admin - 372.30 - 372.30
Total 3,300,575.54$ 13,070,554.64$ 269,551.12$ 16,640,681.30$
Note 7 Interfund activity Interfund activity is composed of three types of transactions. Due to and due from other funds represent internal charges for services except for billings for utility services which are considered “external” in nature. Advances to and from other funds are loans between funds for capital or cash flow purposes. Transfers represent a sharing of resources between funds. At the fund level, these transfers increase or decrease individual funds resources, but they do not affect the City’s total resources. These internal activities do not represent inflows or outflows of the City’s resources; rather, they reflect resources being moved within the City. The effects of these transactions are included in the City’s fund statements but are removed from the entity-wide financial statements. The composition of interfund balances (amounts expressed in thousands) at December 31, 2014 is as follows:
Due To and Due From balances result when transactions are recorded in the accounting system and payments are made between funds after December 31, 2014.
Trans Cap & Waste Internal Non-major Non-major
General Engineer Solid Waste Water Water Power Service Governmental Enterprise
Due To Fund Fund Fund Fund Fund Fund Funds Funds Funds Total
General Fund -$ -$ 395$ 597$ 134$ 35$ 1,524$ 273$ -$ 2,958$
Trans Cap & Engineer Fund 41 - - 47 - 2 11 10 - 111$
Solid Waste Fund 591 - - - - 226 216 135 - 1,168$
Waste Water Fund 682 66 57 (417) - 504 671 220 - 1,783$
Water Fund 151 - 23 1 40 658 447 19 - 1,339$
Power Fund 424 - 18 91 19 - 2,416 1 1 2,970$
Internal Service Funds 389 - 5 74 99 1,031 343 25 96 2,062$
Non-major Governmental Funds 1,891 911 - 9 - 6 368 806 34 4,025$
Non-major Enterprise Funds 133 6 - 43 - 47 582 24 16 851$
Total 4,302$ 983$ 498$ 445$ 292$ 2,509$ 6,578$ 1,513$ 147$ 17,267$
Due From
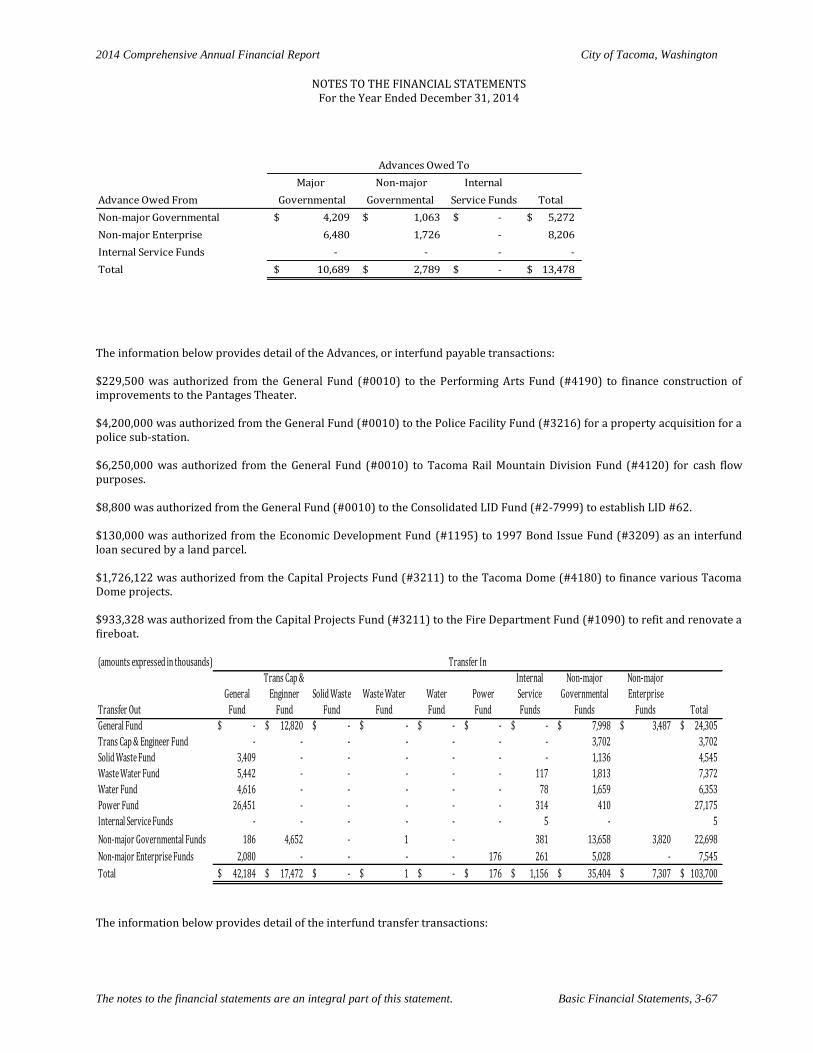
2014 Comprehensive Annual Financial Report City of Tacoma, Washington
NOTES TO THE FINANCIAL STATEMENTS
For the Year Ended December 31, 2014
The notes to the financial statements are an integral part of this statement. Basic Financial Statements, 3-67
Major Non-major Internal
Advance Owed From Governmental Governmental Service Funds Total
Non-major Governmental 4,209$ 1,063$ -$ 5,272$
Non-major Enterprise 6,480 1,726 - 8,206
Internal Service Funds - - - -
Total 10,689$ 2,789$ -$ 13,478$
Advances Owed To
The information below provides detail of the Advances, or interfund payable transactions: $229,500 was authorized from the General Fund (#0010) to the Performing Arts Fund (#4190) to finance construction of improvements to the Pantages Theater. $4,200,000 was authorized from the General Fund (#0010) to the Police Facility Fund (#3216) for a property acquisition for a police sub-station. $6,250,000 was authorized from the General Fund (#0010) to Tacoma Rail Mountain Division Fund (#4120) for cash flow purposes. $8,800 was authorized from the General Fund (#0010) to the Consolidated LID Fund (#2-7999) to establish LID #62. $130,000 was authorized from the Economic Development Fund (#1195) to 1997 Bond Issue Fund (#3209) as an interfund loan secured by a land parcel. $1,726,122 was authorized from the Capital Projects Fund (#3211) to the Tacoma Dome (#4180) to finance various Tacoma Dome projects. $933,328 was authorized from the Capital Projects Fund (#3211) to the Fire Department Fund (#1090) to refit and renovate a fireboat. (amounts expressed in thousands)
Trans Cap & Internal Non-major Non-major
General Enginner Solid Waste Waste Water Water Power Service Governmental Enterprise
Transfer Out Fund Fund Fund Fund Fund Fund Funds Funds Funds Total
General Fund -$ 12,820$ -$ -$ -$ -$ -$ 7,998$ 3,487$ 24,305$
Trans Cap & Engineer Fund - - - - - - - 3,702 3,702
Solid Waste Fund 3,409 - - - - - - 1,136 4,545
Waste Water Fund 5,442 - - - - - 117 1,813 7,372
Water Fund 4,616 - - - - - 78 1,659 6,353
Power Fund 26,451 - - - - - 314 410 27,175
Internal Service Funds - - - - - - 5 - 5
Non-major Governmental Funds 186 4,652 - 1 - 381 13,658 3,820 22,698
Non-major Enterprise Funds 2,080 - - - - 176 261 5,028 - 7,545
Total 42,184$ 17,472$ -$ 1$ -$ 176$ 1,156$ 35,404$ 7,307$ 103,700$
Transfer In
The information below provides detail of the interfund transfer transactions:
2014 Comprehensive Annual Financial Report City of Tacoma, Washington
NOTES TO THE FINANCIAL STATEMENTS For the Year Ended December 31, 2014
Basic Financial Statements, 3-68 The notes to the financial statements are an integral part of this statement.
$12,819,825 was transferred from the General fund to the Street fund for 2014 Street contributions. $7,997,783 was transferred from the General Fund to Non-Major Governmental funds for Traffic contributions and debt service payments. $3,487,928 was transferred from the General fund to Non-Major Enterprise funds to assist the theaters (BCPA) throughout the year, for permit services, for Tacoma Rail, for the Glass Museum, for Cheney Stadium, and for the Tacoma Dome. $3,702,563 was transferred from the Street fund to Non-Major Governmental funds for road capital projects and debt service payments. $3,408,695 was transferred from the Solid Waste Fund to the General Fund for 2014 Gross Earnings Tax. $1,136,232 was transferred from the Solid Waste Fund to Non-Major Government funds for 2014 Gross Earnings Tax. $5,441,748 was transferred from the Waste Water Fund to the General Fund for 2014 Gross Earnings Tax. $117,120 was transferred from the Waste Water Fund to Internal Service funds for 2014 fleet services. $1,813,916 was transferred from the Waste Water Fund to Non-Major Government funds for 2014 Gross Earnings Tax. $4,615,959 was transferred from the Water Fund to the General Fund for 2014 Gross Earnings Tax. $78,067 was transferred from the Water Fund to Internal Service funds for 2014 fleet services. $1,658,535 was transferred from the Water Fund to Non-Major Governmental funds for 2014 Gross Earnings Tax. $26,450,629 was transferred from the Power Fund to the General Fund for 2014 Gross Earnings Tax. $314,105 was transferred from the Power Fund to Internal Service funds for 2014 Fleet Services contribution. $410,020 was transferred from the Power Fund to Non-Major Governmental funds for 2014 Gross Earnings Tax. $5,000 was transferred from Internal Service funds to Internal Service funds for 2014 fleet services. $186,343 was transferred from Non-Major Governmental funds to the General Fund to fund Emergency Medical Services. $4,652,413 was transferred from Non-Major Governmental funds to the Street fund for capital road projects. $750 was transferred from Non-Major Governmental funds to the Waste Water Fund for capital projects. $380,782 was transferred from Non-Major Governmental funds to Internal Service funds for Fleet capital purchases. $13,658,406 was transferred from Non-Major Governmental funds to Non-Major Governmental funds for various capital projects and debt service payments. $3,819,542 was transferred from Non-Major Governmental funds to Non-Major Enterprise funds for capital projects and for debt service. $2,080,473 was transferred from Non-Major Enterprise funds to the General Fund for 2014 Gross Earnings Tax and contributions to a Fire Department study. $176,339 was transferred from Non-Major Enterprise funds to the Power Fund for BPA bond project. $260,529 was transferred from Non-Major Enterprise funds to Internal Service funds for 2014 Fleet Services contribution. $5,027,245 was transferred from Non-Major Enterprise funds to Non-Major Governmental funds for 2014 Gross Earnings Tax and debt service payments.
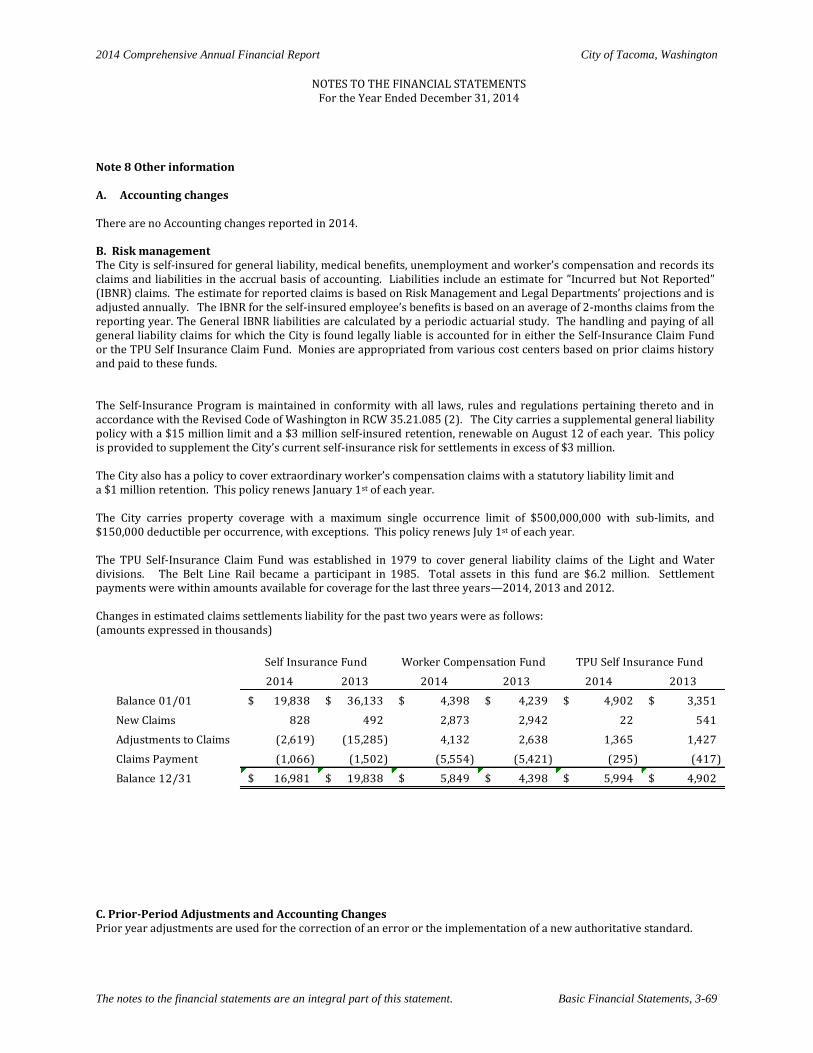
2014 Comprehensive Annual Financial Report City of Tacoma, Washington
NOTES TO THE FINANCIAL STATEMENTS
For the Year Ended December 31, 2014
The notes to the financial statements are an integral part of this statement. Basic Financial Statements, 3-69
Note 8 Other information A. Accounting changes There are no Accounting changes reported in 2014. B. Risk management The City is self-insured for general liability, medical benefits, unemployment and worker’s compensation and records its claims and liabilities in the accrual basis of accounting. Liabilities include an estimate for ”Incurred but Not Reported” (IBNR) claims. The estimate for reported claims is based on Risk Management and Legal Departments’ projections and is adjusted annually. The IBNR for the self-insured employee’s benefits is based on an average of 2-months claims from the reporting year. The General IBNR liabilities are calculated by a periodic actuarial study. The handling and paying of all general liability claims for which the City is found legally liable is accounted for in either the Self-Insurance Claim Fund or the TPU Self Insurance Claim Fund. Monies are appropriated from various cost centers based on prior claims history and paid to these funds. The Self-Insurance Program is maintained in conformity with all laws, rules and regulations pertaining thereto and in accordance with the Revised Code of Washington in RCW 35.21.085 (2). The City carries a supplemental general liability policy with a $15 million limit and a $3 million self-insured retention, renewable on August 12 of each year. This policy is provided to supplement the City’s current self-insurance risk for settlements in excess of $3 million. The City also has a policy to cover extraordinary worker’s compensation claims with a statutory liability limit and a $1 million retention. This policy renews January 1st of each year. The City carries property coverage with a maximum single occurrence limit of $500,000,000 with sub-limits, and $150,000 deductible per occurrence, with exceptions. This policy renews July 1st of each year. The TPU Self-Insurance Claim Fund was established in 1979 to cover general liability claims of the Light and Water divisions. The Belt Line Rail became a participant in 1985. Total assets in this fund are $6.2 million. Settlement payments were within amounts available for coverage for the last three years—2014, 2013 and 2012. Changes in estimated claims settlements liability for the past two years were as follows: (amounts expressed in thousands)
2014 2013 2014 2013 2014 2013
Balance 01/01 19,838$ 36,133$ 4,398$ 4,239$ 4,902$ 3,351$
New Claims 828 492 2,873 2,942 22 541
Adjustments to Claims (2,619) (15,285) 4,132 2,638 1,365 1,427
Claims Payment (1,066) (1,502) (5,554) (5,421) (295) (417)
Balance 12/31 16,981$ 19,838$ 5,849$ 4,398$ 5,994$ 4,902$
Self Insurance Fund Worker Compensation Fund TPU Self Insurance Fund
C. Prior-Period Adjustments and Accounting Changes Prior year adjustments are used for the correction of an error or the implementation of a new authoritative standard.
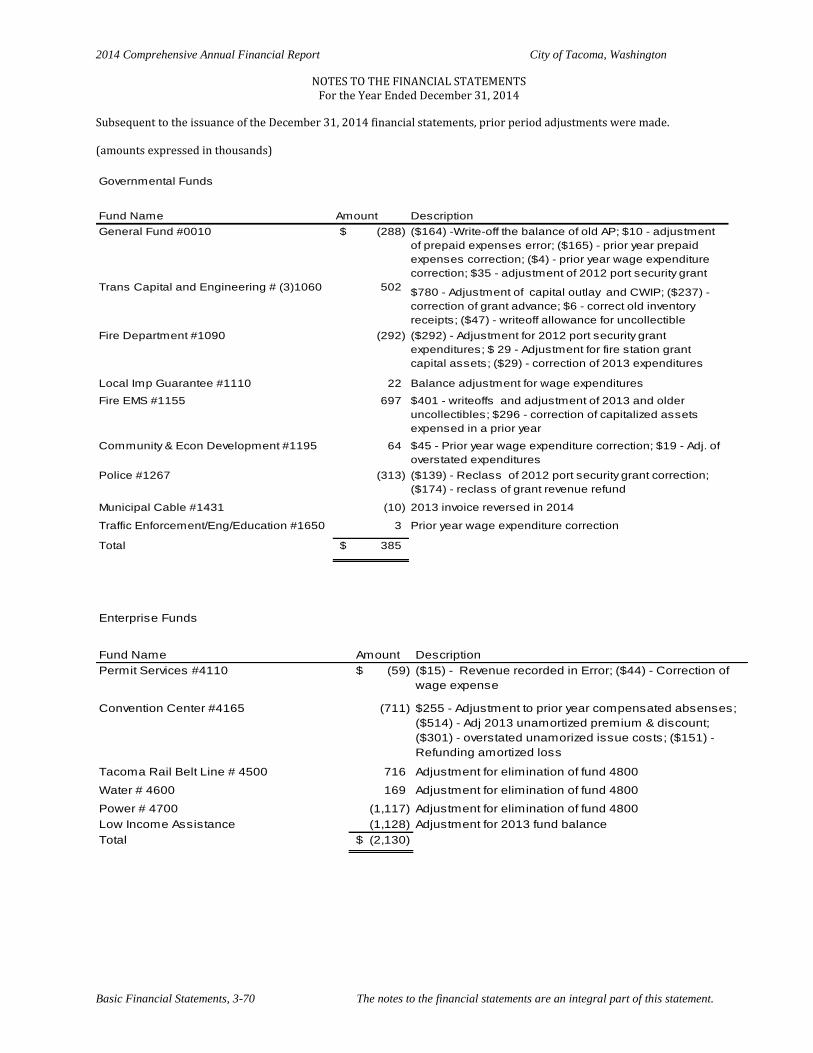
2014 Comprehensive Annual Financial Report City of Tacoma, Washington
NOTES TO THE FINANCIAL STATEMENTS For the Year Ended December 31, 2014
Basic Financial Statements, 3-70 The notes to the financial statements are an integral part of this statement.
Subsequent to the issuance of the December 31, 2014 financial statements, prior period adjustments were made. (amounts expressed in thousands)
Governmental Funds
Fund Name Amount Description
General Fund #0010 (288)$ ($164) -Write-off the balance of old AP; $10 - adjustment
of prepaid expenses error; ($165) - prior year prepaid
expenses correction; ($4) - prior year wage expenditure
correction; $35 - adjustment of 2012 port security grant
Trans Capital and Engineering # (3)1060 502 $780 - Adjustment of capital outlay and CWIP; ($237) -
correction of grant advance; $6 - correct old inventory
receipts; ($47) - writeoff allowance for uncollectible
Fire Department #1090 (292) ($292) - Adjustment for 2012 port security grant
expenditures; $ 29 - Adjustment for fire station grant
capital assets; ($29) - correction of 2013 expenditures
Local Imp Guarantee #1110 22 Balance adjustment for wage expenditures
Fire EMS #1155 697 $401 - writeoffs and adjustment of 2013 and older
uncollectibles; $296 - correction of capitalized assets
expensed in a prior year
Community & Econ Development #1195 64 $45 - Prior year wage expenditure correction; $19 - Adj. of
overstated expenditures
Police #1267 (313) ($139) - Reclass of 2012 port security grant correction;
($174) - reclass of grant revenue refund
Municipal Cable #1431 (10) 2013 invoice reversed in 2014
Traffic Enforcement/Eng/Education #1650 3 Prior year wage expenditure correction
Total 385$
Enterprise Funds
Fund Name Amount Description
Permit Services #4110 (59)$ ($15) - Revenue recorded in Error; ($44) - Correction of
wage expense
Convention Center #4165 (711) $255 - Adjustment to prior year compensated absenses;
($514) - Adj 2013 unamortized premium & discount;
($301) - overstated unamorized issue costs; ($151) -
Refunding amortized loss
Tacoma Rail Belt Line # 4500 716 Adjustment for elimination of fund 4800
Water # 4600 169 Adjustment for elimination of fund 4800
Power # 4700 (1,117) Adjustment for elimination of fund 4800
Low Income Assistance (1,128) Adjustment for 2013 fund balance
Total (2,130)$
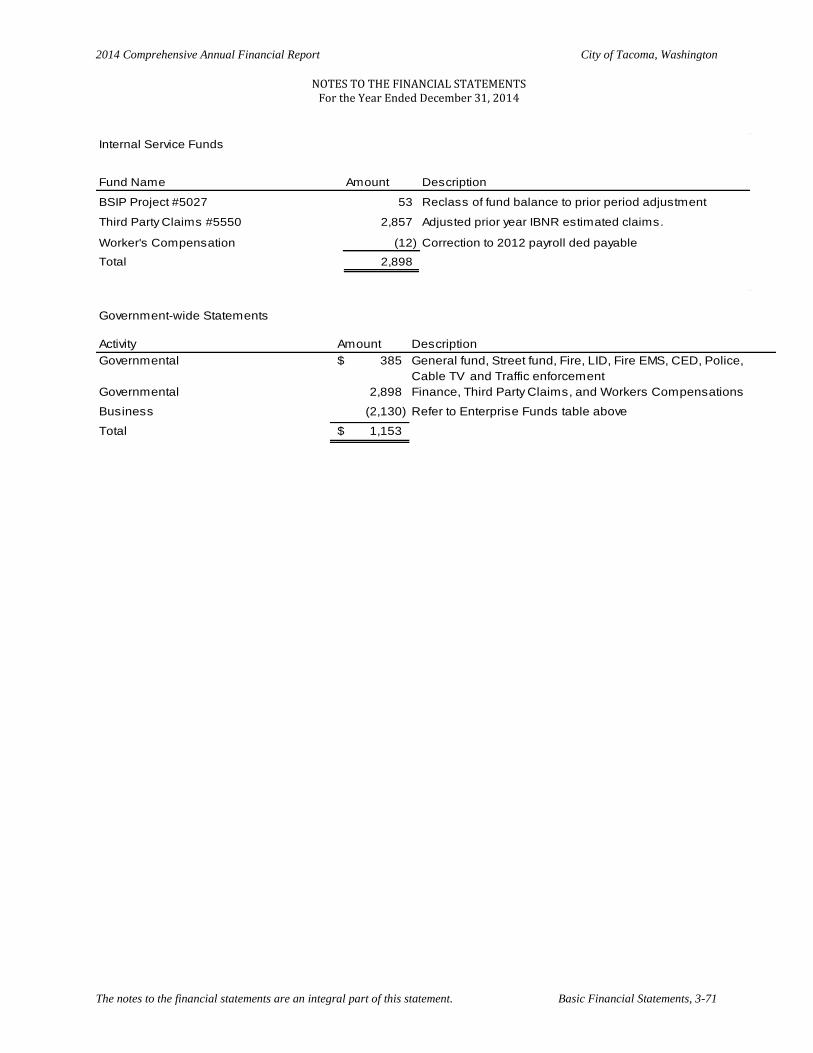
2014 Comprehensive Annual Financial Report City of Tacoma, Washington
NOTES TO THE FINANCIAL STATEMENTS
For the Year Ended December 31, 2014
The notes to the financial statements are an integral part of this statement. Basic Financial Statements, 3-71
Internal Service Funds
Fund Name Amount Description
BSIP Project #5027 53 Reclass of fund balance to prior period adjustment
Third Party Claims #5550 2,857 Adjusted prior year IBNR estimated claims.
Worker's Compensation (12) Correction to 2012 payroll ded payable
Total 2,898
Government-wide Statements
Activity Amount Description
Governmental 385$ General fund, Street fund, Fire, LID, Fire EMS, CED, Police,
Cable TV and Traffic enforcement
Governmental 2,898 Finance, Third Party Claims, and Workers Compensations
Business (2,130) Refer to Enterprise Funds table above
Total 1,153$
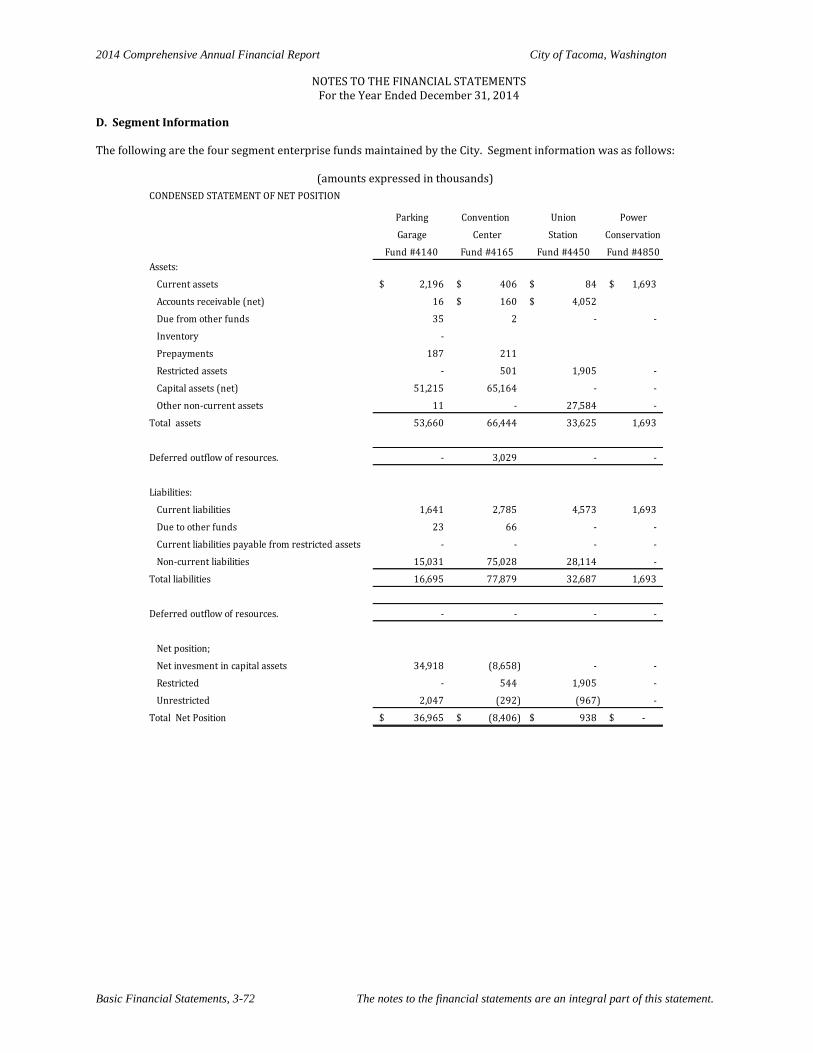
2014 Comprehensive Annual Financial Report City of Tacoma, Washington
NOTES TO THE FINANCIAL STATEMENTS For the Year Ended December 31, 2014
Basic Financial Statements, 3-72 The notes to the financial statements are an integral part of this statement.
D. Segment Information The following are the four segment enterprise funds maintained by the City. Segment information was as follows:
(amounts expressed in thousands)
CONDENSED STATEMENT OF NET POSITION
Parking Convention Union Power
Garage Center Station Conservation
Fund #4140 Fund #4165 Fund #4450 Fund #4850
Assets:
Current assets 2,196$ 406$ 84$ 1,693$
Accounts receivable (net) 16 160$ 4,052$
Due from other funds 35 2 - -
Inventory -
Prepayments 187 211
Restricted assets - 501 1,905 -
Capital assets (net) 51,215 65,164 - -
Other non-current assets 11 - 27,584 -
Total assets 53,660 66,444 33,625 1,693
Deferred outflow of resources. - 3,029 - -
Liabilities:
Current liabilities 1,641 2,785 4,573 1,693
Due to other funds 23 66 - -
Current liabilities payable from restricted assets - - - -
Non-current liabilities 15,031 75,028 28,114 -
Total liabilities 16,695 77,879 32,687 1,693
Deferred outflow of resources. - - - -
Net position;
Net invesment in capital assets 34,918 (8,658) - -
Restricted - 544 1,905 -
Unrestricted 2,047 (292) (967) -
Total Net Position 36,965$ (8,406)$ 938$ -$
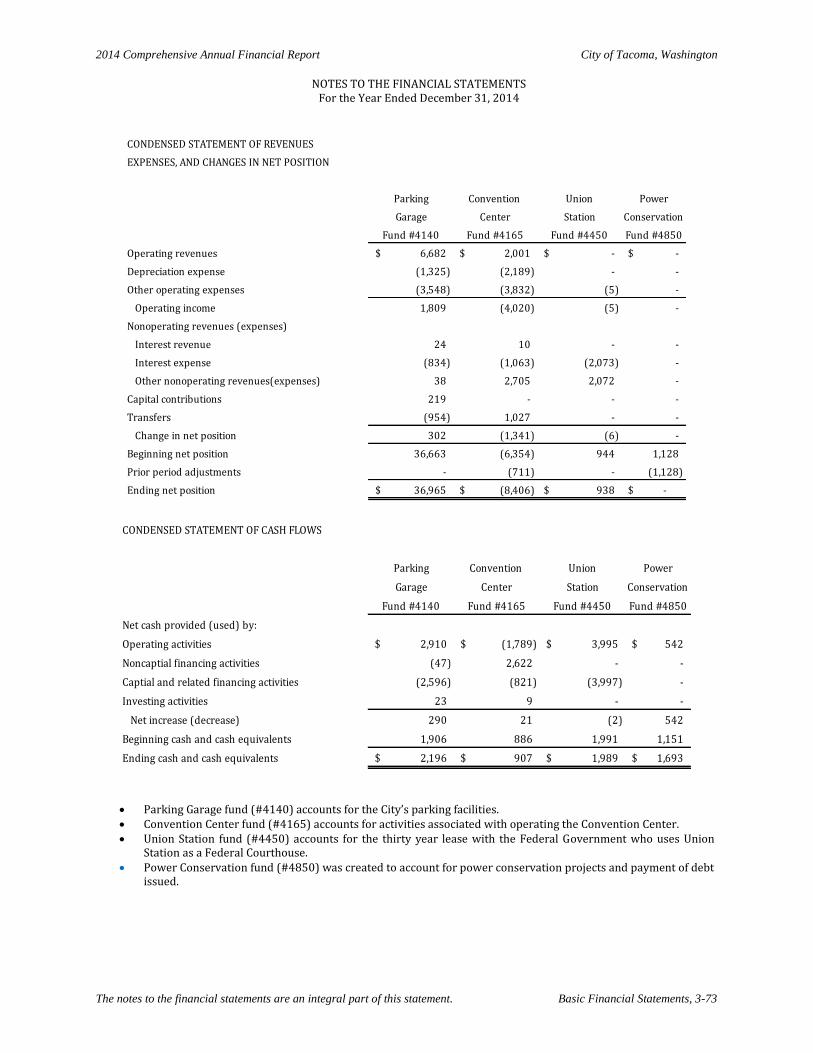
2014 Comprehensive Annual Financial Report City of Tacoma, Washington
NOTES TO THE FINANCIAL STATEMENTS
For the Year Ended December 31, 2014
The notes to the financial statements are an integral part of this statement. Basic Financial Statements, 3-73
CONDENSED STATEMENT OF REVENUES
EXPENSES, AND CHANGES IN NET POSITION
Parking Convention Union Power
Garage Center Station Conservation
Fund #4140 Fund #4165 Fund #4450 Fund #4850
Operating revenues 6,682$ 2,001$ -$ -$
Depreciation expense (1,325) (2,189) - -
Other operating expenses (3,548) (3,832) (5) -
Operating income 1,809 (4,020) (5) -
Nonoperating revenues (expenses)
Interest revenue 24 10 - -
Interest expense (834) (1,063) (2,073) -
Other nonoperating revenues(expenses) 38 2,705 2,072 -
Capital contributions 219 - - -
Transfers (954) 1,027 - -
Change in net position 302 (1,341) (6) -
Beginning net position 36,663 (6,354) 944 1,128
Prior period adjustments - (711) - (1,128)
Ending net position 36,965$ (8,406)$ 938$ -$
CONDENSED STATEMENT OF CASH FLOWS
Parking Convention Union Power
Garage Center Station Conservation
Fund #4140 Fund #4165 Fund #4450 Fund #4850
Net cash provided (used) by:
Operating activities 2,910$ (1,789)$ 3,995$ 542$
Noncaptial financing activities (47) 2,622 - -
Captial and related financing activities (2,596) (821) (3,997) -
Investing activities 23 9 - -
Net increase (decrease) 290 21 (2) 542
Beginning cash and cash equivalents 1,906 886 1,991 1,151
Ending cash and cash equivalents 2,196$ 907$ 1,989$ 1,693$
Parking Garage fund (#4140) accounts for the City’s parking facilities. Convention Center fund (#4165) accounts for activities associated with operating the Convention Center. Union Station fund (#4450) accounts for the thirty year lease with the Federal Government who uses Union
Station as a Federal Courthouse. Power Conservation fund (#4850) was created to account for power conservation projects and payment of debt
issued.
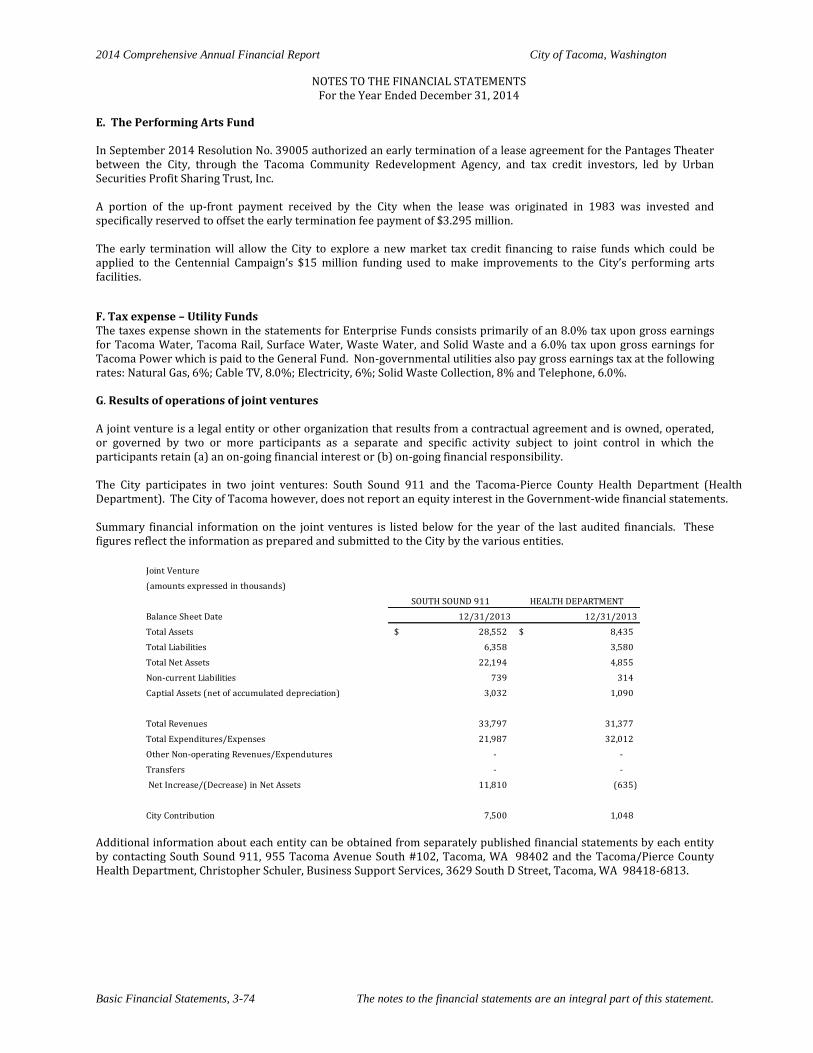
2014 Comprehensive Annual Financial Report City of Tacoma, Washington
NOTES TO THE FINANCIAL STATEMENTS For the Year Ended December 31, 2014
Basic Financial Statements, 3-74 The notes to the financial statements are an integral part of this statement.
E. The Performing Arts Fund In September 2014 Resolution No. 39005 authorized an early termination of a lease agreement for the Pantages Theater between the City, through the Tacoma Community Redevelopment Agency, and tax credit investors, led by Urban Securities Profit Sharing Trust, Inc. A portion of the up-front payment received by the City when the lease was originated in 1983 was invested and specifically reserved to offset the early termination fee payment of $3.295 million. The early termination will allow the City to explore a new market tax credit financing to raise funds which could be applied to the Centennial Campaign’s $15 million funding used to make improvements to the City’s performing arts facilities.
F. Tax expense – Utility Funds The taxes expense shown in the statements for Enterprise Funds consists primarily of an 8.0% tax upon gross earnings for Tacoma Water, Tacoma Rail, Surface Water, Waste Water, and Solid Waste and a 6.0% tax upon gross earnings for Tacoma Power which is paid to the General Fund. Non-governmental utilities also pay gross earnings tax at the following rates: Natural Gas, 6%; Cable TV, 8.0%; Electricity, 6%; Solid Waste Collection, 8% and Telephone, 6.0%.
G. Results of operations of joint ventures A joint venture is a legal entity or other organization that results from a contractual agreement and is owned, operated, or governed by two or more participants as a separate and specific activity subject to joint control in which the participants retain (a) an on-going financial interest or (b) on-going financial responsibility. The City participates in two joint ventures: South Sound 911 and the Tacoma-Pierce County Health Department (Health Department). The City of Tacoma however, does not report an equity interest in the Government-wide financial statements. Summary financial information on the joint ventures is listed below for the year of the last audited financials. These figures reflect the information as prepared and submitted to the City by the various entities.
Joint Venture
(amounts expressed in thousands)
SOUTH SOUND 911 HEALTH DEPARTMENT
Balance Sheet Date 12/31/2013 12/31/2013
Total Assets 28,552$ 8,435$
Total Liabilities 6,358 3,580
Total Net Assets 22,194 4,855
Non-current Liabilities 739 314
Captial Assets (net of accumulated depreciation) 3,032 1,090
Total Revenues 33,797 31,377
Total Expenditures/Expenses 21,987 32,012
Other Non-operating Revenues/Expendutures - -
Transfers - -
Net Increase/(Decrease) in Net Assets 11,810 (635)
City Contribution 7,500 1,048
Additional information about each entity can be obtained from separately published financial statements by each entity by contacting South Sound 911, 955 Tacoma Avenue South #102, Tacoma, WA 98402 and the Tacoma/Pierce County Health Department, Christopher Schuler, Business Support Services, 3629 South D Street, Tacoma, WA 98418-6813.
2014 Comprehensive Annual Financial Report City of Tacoma, Washington
NOTES TO THE FINANCIAL STATEMENTS
For the Year Ended December 31, 2014
The notes to the financial statements are an integral part of this statement. Basic Financial Statements, 3-75
Note 9 Claims and Judgments A. Claims From time to time, claims have been filed against the City involving tort actions for such things as defective sidewalks, automobile accidents, claims of false arrest, etc.; all of which are in a sense routine in nature and common to all local governments. In those instances, when material, where it has been determined that it is probable that a claim will be paid by the City, the expenditure/expense and the related liability are reported in the statements of the appropriate fund in the year when such a determination is made. See Note 8 B for risk management information. The City has entered into interlocal agreements with the Pierce County Health Department. If, in fact, any of this entity were to suffer a catastrophic disaster and their self-insurance funds and resources were to be depleted, the City and other participating jurisdictions would be required to stand behind and make good the excess liability.
Under state law, the City is required to pay for unemployment and industrial insurance and medical aid. The City has chosen to self-insure rather than remit its payments to the state pool. See Note 8 B for risk management information.
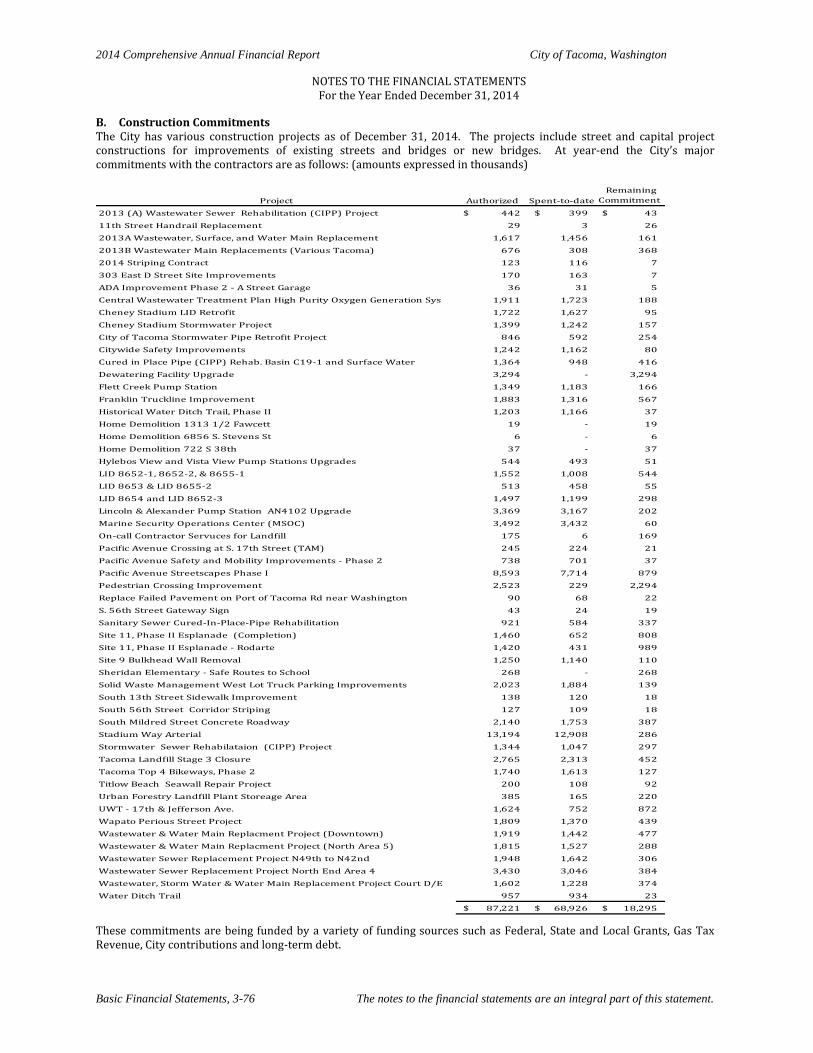
2014 Comprehensive Annual Financial Report City of Tacoma, Washington
NOTES TO THE FINANCIAL STATEMENTS For the Year Ended December 31, 2014
Basic Financial Statements, 3-76 The notes to the financial statements are an integral part of this statement.
B. Construction Commitments The City has various construction projects as of December 31, 2014. The projects include street and capital project constructions for improvements of existing streets and bridges or new bridges. At year-end the City’s major commitments with the contractors are as follows: (amounts expressed in thousands)
Project Authorized Spent-to-date
Remaining
Commitment
2013 (A) Wastewater Sewer Rehabilitation (CIPP) Project 442$ 399$ 43$
11th Street Handrail Replacement 29 3 26
2013A Wastewater, Surface, and Water Main Replacement 1,617 1,456 161
2013B Wastewater Main Replacements (Various Tacoma) 676 308 368
2014 Striping Contract 123 116 7
303 East D Street Site Improvements 170 163 7
ADA Improvement Phase 2 - A Street Garage 36 31 5
Central Wastewater Treatment Plan High Purity Oxygen Generation Sys 1,911 1,723 188
Cheney Stadium LID Retrofit 1,722 1,627 95
Cheney Stadium Stormwater Project 1,399 1,242 157
City of Tacoma Stormwater Pipe Retrofit Project 846 592 254
Citywide Safety Improvements 1,242 1,162 80
Cured in Place Pipe (CIPP) Rehab. Basin C19-1 and Surface Water 1,364 948 416
Dewatering Facility Upgrade 3,294 - 3,294
Flett Creek Pump Station 1,349 1,183 166
Franklin Truckline Improvement 1,883 1,316 567
Historical Water Ditch Trail, Phase II 1,203 1,166 37
Home Demolition 1313 1/2 Fawcett 19 - 19
Home Demolition 6856 S. Stevens St 6 - 6
Home Demolition 722 S 38th 37 - 37
Hylebos View and Vista View Pump Stations Upgrades 544 493 51
LID 8652-1, 8652-2, & 8655-1 1,552 1,008 544
LID 8653 & LID 8655-2 513 458 55
LID 8654 and LID 8652-3 1,497 1,199 298
Lincoln & Alexander Pump Station AN4102 Upgrade 3,369 3,167 202
Marine Security Operations Center (MSOC) 3,492 3,432 60
On-call Contractor Servuces for Landfill 175 6 169
Pacific Avenue Crossing at S. 17th Street (TAM) 245 224 21
Pacific Avenue Safety and Mobility Improvements - Phase 2 738 701 37
Pacific Avenue Streetscapes Phase I 8,593 7,714 879
Pedestrian Crossing Improvement 2,523 229 2,294
Replace Failed Pavement on Port of Tacoma Rd near Washington 90 68 22
S. 56th Street Gateway Sign 43 24 19
Sanitary Sewer Cured-In-Place-Pipe Rehabilitation 921 584 337
Site 11, Phase II Esplanade (Completion) 1,460 652 808
Site 11, Phase II Esplanade - Rodarte 1,420 431 989
Site 9 Bulkhead Wall Removal 1,250 1,140 110
Sheridan Elementary - Safe Routes to School 268 - 268
Solid Waste Management West Lot Truck Parking Improvements 2,023 1,884 139
South 13th Street Sidewalk Improvement 138 120 18
South 56th Street Corridor Striping 127 109 18
South Mildred Street Concrete Roadway 2,140 1,753 387
Stadium Way Arterial 13,194 12,908 286
Stormwater Sewer Rehabilataion (CIPP) Project 1,344 1,047 297
Tacoma Landfill Stage 3 Closure 2,765 2,313 452
Tacoma Top 4 Bikeways, Phase 2 1,740 1,613 127
Titlow Beach Seawall Repair Project 200 108 92
Urban Forestry Landfill Plant Storeage Area 385 165 220
UWT - 17th & Jefferson Ave. 1,624 752 872
Wapato Perious Street Project 1,809 1,370 439
Wastewater & Water Main Replacment Project (Downtown) 1,919 1,442 477
Wastewater & Water Main Replacment Project (North Area 5) 1,815 1,527 288
Wastewater Sewer Replacement Project N49th to N42nd 1,948 1,642 306
Wastewater Sewer Replacement Project North End Area 4 3,430 3,046 384
Wastewater, Storm Water & Water Main Replacement Project Court D/E 1,602 1,228 374
Water Ditch Trail 957 934 23
87,221$ 68,926$ 18,295$
These commitments are being funded by a variety of funding sources such as Federal, State and Local Grants, Gas Tax Revenue, City contributions and long-term debt.
2014 Comprehensive Annual Financial Report City of Tacoma, Washington
NOTES TO THE FINANCIAL STATEMENTS
For the Year Ended December 31, 2014
The notes to the financial statements are an integral part of this statement. Basic Financial Statements, 3-77
C. Solid waste utility—landfill closure and post closure liabilities The Solid Waste Utility (#4200) operates a 235 acre landfill site, which became part of the South Tacoma Channel Superfund Site in 1983. In 1991, the City entered a Consent Decree with the United States Environmental Protection Agency (“EPA”) and the Washington State Department of Ecology (“DOE”), reference United States et al v. City of Tacoma, US District Court Cause No.C-89C583T, to “clean-up the release of hazardous substances at the Landfill. The City completed the majority of the remediation work required by the Consent Decree several years ago. The remaining work mostly involves monitoring the remediation work completed by the City in the 1990s to assure that it continues to protect human health and the environment. The Consent Decree settlement was entered pursuant to the federal Comprehensive Environmental Response, Compensation, and Liability Act (“CERCLA”), 42 U.S.C. §9601 et seq., and the state Model Toxics Control Act (“MTCA”), Chapter 70.105D RCW. The City’s remediation work has included: (1) covering the landfill with a double flexible membrane cap that is impermeable to water; (2) capturing methane gas within and at landfill perimeter to prevent off-site migration; (3) pumping and treating ground water to remove contamination at the point of compliance and beyond property boundaries; and (4) closing the landfill in accordance with the Tacoma Landfill Cleanup Consent Degree. The City also has an obligation under the Consent Decree to monitor the remediation work over the next 20 years, or more years to make sure it continues to be effective at protecting human health and the environment. The costs for ongoing maintenance of the Tacoma Landfill are not expected to require rate increases above those already projected. The City will be responsible for the costs of additional work if migration of pollutants from the site is not completely controlled by current remedial actions. The City’s on-going monitoring efforts indicate the remedial actions undertaken by the City at the Tacoma Landfill are performing as designed. In 2014, following closure of the portions of the Tacoma Landfill as required by the Consent Decree, the remaining recovery and transfer facilities continued to be permitted by the Tacoma Pierce County Health Department (TPCHD) through the same permitting process. All closed portions of the Landfill will also be covered by a TPCHD closure permit, which may be incorporated into the overall facility permit. The closure permit will mirror the requirements implemented as a result of the Landfill remedial action. Long-term plans for the closed capped areas of the Tacoma Landfill include recreational facilities, such as trails and playfields, as well as other governmental facilities, such as greenhouses for grounds maintenance operations. All development of the Tacoma Landfill site must be designed to accommodate differential settlement and allow for continued functioning of the environmental remediation systems. The City Finance Department reports $25,720,100 as landfill closure and post closure liability at December 31, 2014 based on 100% use of total capacity of the landfill. This compares to $25,691,232 at December 31, 2013 based on 100% of capacity. Actual costs may be higher or lower due to inflation, changes in technology, or changes in regulations. The City will be responsible for the costs of additional work if migration of pollutant from the site is not completely controlled by current remedial actions. To meet the previous requirements of State and Federal laws and regulations, contributions were made to a reserve for financing closure costs. D. Potential environmental contamination or utility claims or suits The City is subject to various pending and threatened legal actions, which arise in the ordinary course of business. The City believes, based on information presently known, the ultimate liability for any legal actions, individually or in the aggregate, taking into account established accruals for estimated liabilities, will not be material to the financial position of the City, but could be material to results of operations or cash flows for a particular annual period. No assurance can be given, however, as to the ultimate outcome with respect to any particular claim. Note 10 Contingent liabilities Solid Waste (#4200) Long-term Contract – Land Recovery, Inc. – In February 2000, the Solid Waste fund entered into a 20-year contract with Land Recovery, Inc (LRI) to dispose of all “acceptable waste” collected or handled by Solid Waste (as that term is defined in the agreement), at the 304th Street landfill operated by LRI. Solid Waste entered into this agreement to extend the life of the Tacoma Landfill and to secure a long-term disposal arrangement at a favorable disposal cost. The agreement excludes solid waste that LRI is not authorized by law or permit to receive, or which could
2014 Comprehensive Annual Financial Report City of Tacoma, Washington
NOTES TO THE FINANCIAL STATEMENTS For the Year Ended December 31, 2014
Basic Financial Statements, 3-78 The notes to the financial statements are an integral part of this statement.
create or expose LRI for Solid Waste to potential liability, among other things. Recycling and/or composting waste is not covered by the agreement. The agreement further provides that LRI charge a base rate per to for disposal services, and that said rate shall decrease as the tonnage increases during each contract year. The agreement also provides that the base rate charged by LRI shall increase annually based on the Seattle-Tacoma- Bremerton CPI. The rate per ton is periodically increased by LRI to cover certain increased costs, including the increased cost of landfill closure liabilities. The rates adjustments are part of the existing agreements. Solid Waste (#4200) Long-term Contract – Pierce County Recycling, Composting and Disposal - In October 2004 the Solid Waste fund entered into a ten (10) year agreement with Pierce County Recycling Composting and Disposal (PCRCD) LLC to accept organic material collected by the City curbside or delivered to the City’s landfill for processing into compost. Under the agreement, which has two 5-year renewal options, PCRCD will charge a base rate per ton for the organic waste it receives from the City. This price may be adjusted beginning on the second anniversary of the agreement, and thereafter annually based on the Seattle-Tacoma-Bremerton CPI. The agreement also includes a revenue sharing component. Solid Waste entered into this agreement to extend the life of the Tacoma landfill and secure a long-term composting arrangement at a favorable cost. Wastewater (#4300-01) Commencement Bay Natural Resource Damages – The City has resolved federal, state, and tribal natural resource damage claims associated with municipal storm water discharges in Commencement Bay through a Consent Decree that became effective on December 30, 1997. The stated value of the City’s settlement is approximately $7,700,000. Under the Consent Decree (the NRDA Consent Decree), the City agreed to undertake five restoration projects within the Commencement Bay watershed and make certain cash payments. The construction has been completed on four projects and the City made a payment to the Port of Tacoma of $134,692 to construct the fifth project. The City closed out the Consent Decree in 2014. Ongoing monitoring and maintenance of the various projects will continue through 2014. Included in the financial statements for are liabilities of $198,000 for 2014 and $272,234 for 2013. Although the City resolved its NRDA liability, the City indemnified certain parties when it purchased real property along the Thea Foss Waterway in the late 1980’s and early 1990’s. The City expects that any financial obligation it may have related to these indemnities will be de minimums given the historical uses of the indemnified properties and the limited potential for release from these properties to damage natural resources. The City’s understanding is a Thea Foss Waterway NRDA settlement between non-City parties and the Commencement Bay Natural Resource Trustees could be reached in 2015. Wastewater (#4300-01) Hylebos Waterway Consent Degree – In 2003 the City of Tacoma – General Government entered a Consent Decree settlement with EPA to resolve any liability it may have had for sediment contamination in the Hylebos Waterway. The majority of the City’s potential liability was attributed to municipal storm water discharges. Under the terms of its settlement, the City paid $459,663 to “cash out” its liability. This amount included a 50 percent premium, which obligated the City to pay a small percentage (i.e., 0.4397%) of any cost overruns if the remedial action work exceeded the project estimate of $56,056,407 to complete such work. On January 11, 2012 the City was notified by the Hylebos Performing Party Group that the cost of the Hylebos Waterway remedial action project totaled $110,994,511. This number has since been adjusted downward, setting the City’s share of cost overruns at $224,683. The City also anticipates making an additional payment to the Hylebos Performing Party Group for around $63, 317, which would fully and finally resolve the City’s liability for any post-2013 overruns under its 2003 Hylebos Waterway Consent Decree settlement with EPA. The City reported an expense and liability of $306,346 as of December 31, 2014. Wastewater (#4300-01 Foss Consent Decree – The City has an obligation under the Foss Consent Decree for continued monitoring until at least 2016. The results of this monitoring may result in additional cleanup efforts in the future. Obligations for future monitoring costs of $500,000 in 2014 and $600,000 in 2013 have been recolonized in the financial statements as environmental liabilities. Tacoma Rail (#4500) Link Petroleum Project Customer Deposit and Refund Agreement - A contractual agreement was entered in 2009 between Tacoma Rail and Link Petroleum, Inc. Link Petroleum agreed to advance Tacoma Rail $75,000 for track improvements on Tacoma Rail’s property to efficiently and safely handle shipments leading to customer’s services facility. In return, Tacoma Rail agreed to refund the advance to the customer at a rate of $150 per carload for each of the first 500 carloads handled by the facility, or through December 31, 2015, whichever event first occurs. As of December 31, 2014 the remaining deposit is $45,900. Tacoma Rail (#4500), Department of Public Works, Mountain Division – Public Works own approximately 143 miles of track, called Mountain Division, which connects to Tacoma Rail tracks. Tacoma Rail is under contract with Public Works to perform as its operator through 2016. The agreement states that Public Works would fund Tacoma Rail for any operations on the Mountain Division.
2014 Comprehensive Annual Financial Report City of Tacoma, Washington
NOTES TO THE FINANCIAL STATEMENTS
For the Year Ended December 31, 2014
The notes to the financial statements are an integral part of this statement. Basic Financial Statements, 3-79
Tacoma Water (#4600) Capital Improvements – The financial requirement for Tacoma Water’s 2015-2016 biennial Capital Improvement program is approximately $32.9 million and Tacoma Water has substantial contractual commitments relating the program. At December 31, 2014 the remaining financial requirement for Capital Improvement Programs relating to all prior biennia is approximately $4.5 million. Tacoma Water (#4600) Muckleshoot Indian Tribe Settlement – A mutually beneficial settlement agreement was reached with the Muckleshoot Indian Tribe in 1995. The settlement package has a cost of approximately $30 million and includes five basic elements: 1)building a fish restoration facility and annual operation and maintenance of that facility, or in the alternative, providing $12 million (indexed at 1995 dollars) into a fish restoration fund; 2) providing for enhanced flows in the Green River; 3) transferring certain lands; 4) establishing a trust fund payable over 40 years which is intended to provide for the general welfare, education and other needs of the Tribe, and 5) limited access into the Green River Watershed. The settlement resolved past damage claims by the Tribe for Tacoma Water’s historical operations on the river, gain the Tribes support for the Second Supply Project and provide the basis for a long-term, cooperative working relationship on the Green River. Tacoma Water has been implementing this agreement. Tacoma Power (#4700) Capital Improvements – The financial requirement for Tacoma Power’s biennial Capital Improvement Program is approximately $159.5 million. At December 31, 2014, the remaining financial requirement was approximately $21.9 million. The remaining financial requirement of Capital Improvement Programs relating to prior biennium is approximately $4.2 million. Grants Under the terms of federal and state grants, periodic audits are required, and certain costs may be questioned as not being appropriate expenditures under the terms of the grants. Such audits could lead to reimbursement to the grantor agencies. City management believes disallowances, if any, will be immaterial. Note 11 Subsequent events March 18, 2015 the City issued 30 year 2015 Sewer Revenue Refunding Bonds in the amount of $109.3 million for a true interest cost of approximately 3.54% in order to provide funds necessary to finance a portion of the capital improvement plan and to refund the outstanding 2006 Sewer Revenue and Refunding Bonds of $39.4 million. March 18, 2015 the City issued 10 year 2015 Solid Waste Revenue Bonds in the amount of $21,095,000 due in yearly installments ranging from $1,960,000 to $2,760,000 and interest rates ranging from 2% to 5% for a true interest cost of approximately 2.14%. The bonds maturing in the years 2017 through 2024, inclusive, are not subject to optional redemption prior to maturity. The Bonds maturing on December 1, 2025 are subject to redemption at the option of the City in whole or in part, on any date on or after June 1, 2025. Proceeds were used to fund $2.1 million in bond reserves, pay the cost of issuance, and provide $22 million for a portion of the capital improvement plan. Ordinance No. 28296 was approved in 2015 approving a Supplemental Bond Ordinance; and authorizing Tacoma Power to execute a short-term drawdown direct note purchase agreement with Wells Fargo Bank, in the amount of $100,000,000, to provide funds to finance for refinance costs of capital improvements to the Electrical System. Ordinance No. 28297 was approved in 2015 approving a Supplemental Bond Ordinance; and authorizing Tacoma Power to execute a short-term liquidity note purchase agreement with KeyBank, in an amount not to exceed $50,000,000, to provide general credit, including liquidity, for the Electric System.
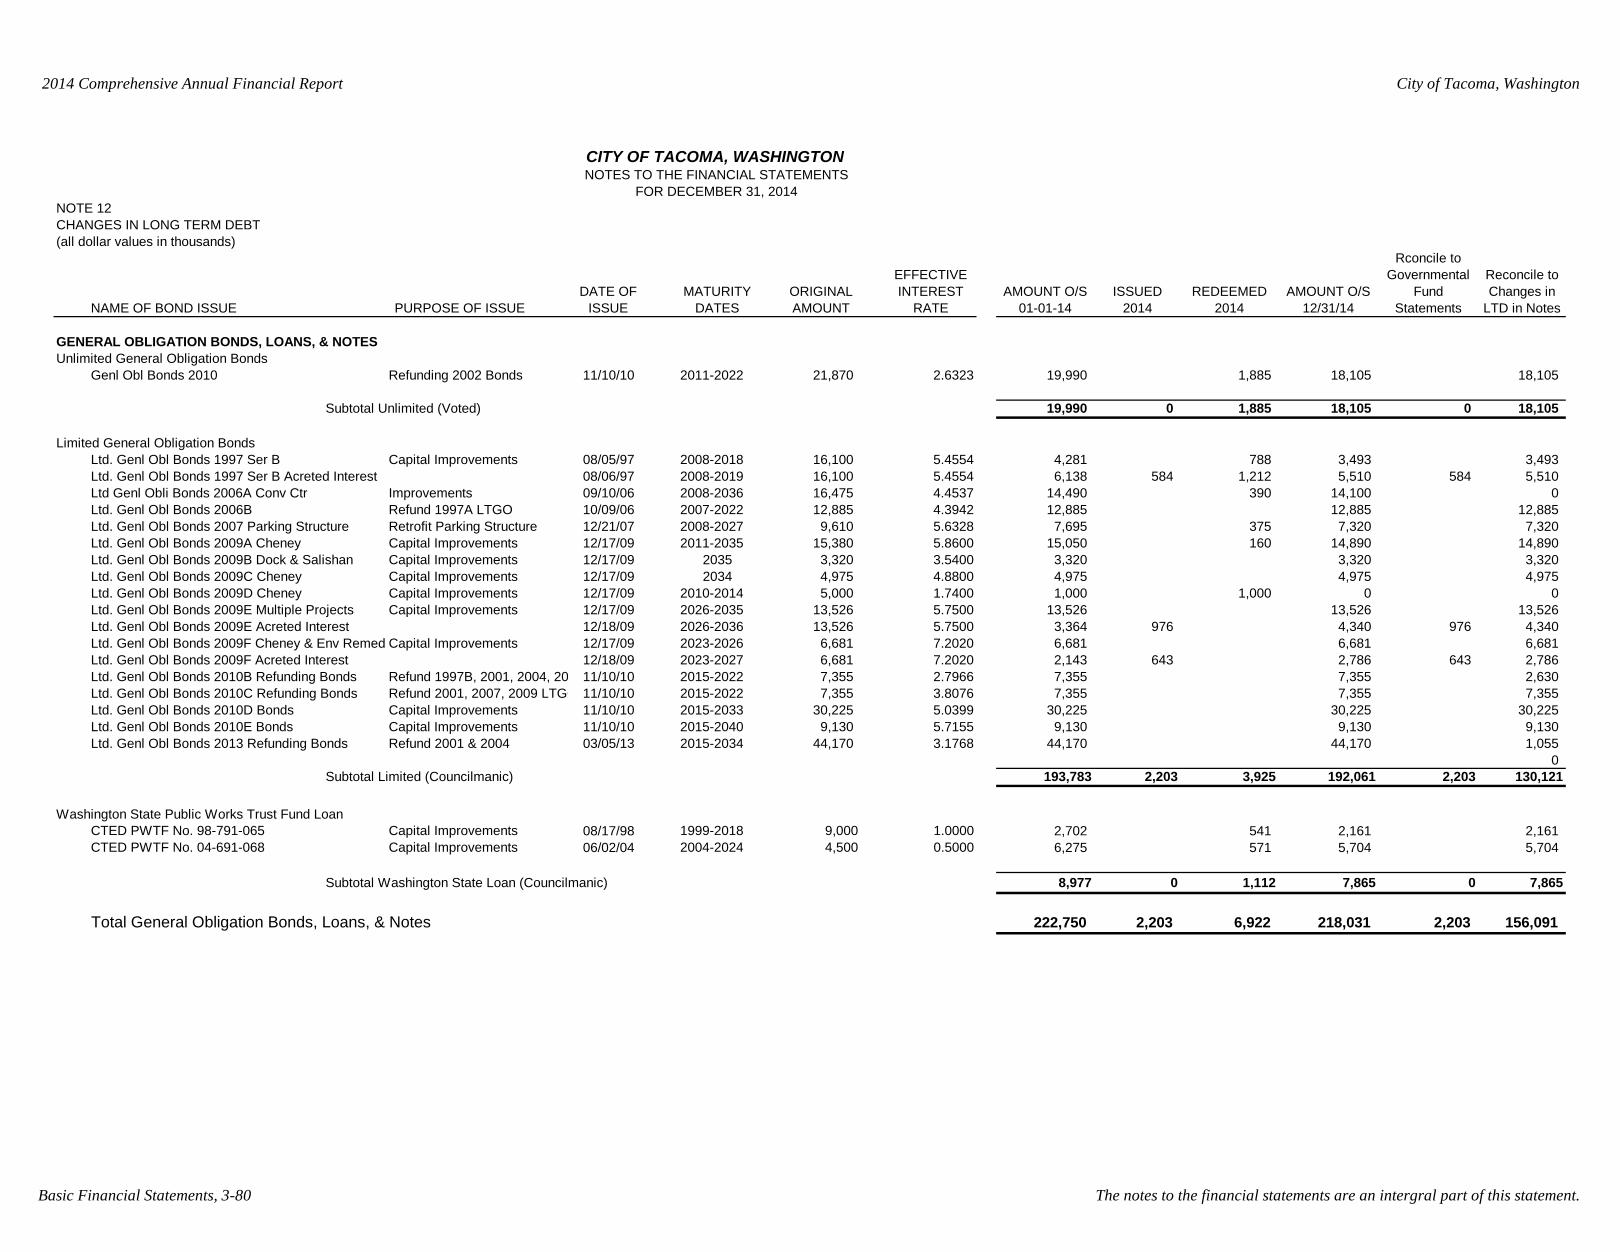
2014 Comprehensive Annual Financial Report City of Tacoma, Washington
Basic Financial Statements, 3-80 The notes to the financial statements are an intergral part of this statement.
NOTE 12CHANGES IN LONG TERM DEBT(all dollar values in thousands)
NAME OF BOND ISSUE PURPOSE OF ISSUEDATE OF
ISSUEMATURITY
DATESORIGINAL AMOUNT
EFFECTIVE INTEREST
RATEAMOUNT O/S
01-01-14ISSUED
2014REDEEMED
2014AMOUNT O/S
12/31/14
Rconcile to Governmental
Fund Statements
Reconcile to Changes in
LTD in Notes
GENERAL OBLIGATION BONDS, LOANS, & NOTESUnlimited General Obligation Bonds
Genl Obl Bonds 2010 Refunding 2002 Bonds 11/10/10 2011-2022 21,870 2.6323 19,990 1,885 18,105 18,105
Subtotal Unlimited (Voted) 19,990 0 1,885 18,105 0 18,105
Limited General Obligation BondsLtd. Genl Obl Bonds 1997 Ser B Capital Improvements 08/05/97 2008-2018 16,100 5.4554 4,281 788 3,493 3,493Ltd. Genl Obl Bonds 1997 Ser B Acreted Interest 08/06/97 2008-2019 16,100 5.4554 6,138 584 1,212 5,510 584 5,510Ltd Genl Obli Bonds 2006A Conv Ctr Improvements 09/10/06 2008-2036 16,475 4.4537 14,490 390 14,100 0Ltd. Genl Obl Bonds 2006B Refund 1997A LTGO 10/09/06 2007-2022 12,885 4.3942 12,885 12,885 12,885Ltd. Genl Obl Bonds 2007 Parking Structure Retrofit Parking Structure 12/21/07 2008-2027 9,610 5.6328 7,695 375 7,320 7,320Ltd. Genl Obl Bonds 2009A Cheney Capital Improvements 12/17/09 2011-2035 15,380 5.8600 15,050 160 14,890 14,890Ltd. Genl Obl Bonds 2009B Dock & Salishan Capital Improvements 12/17/09 2035 3,320 3.5400 3,320 3,320 3,320Ltd. Genl Obl Bonds 2009C Cheney Capital Improvements 12/17/09 2034 4,975 4.8800 4,975 4,975 4,975Ltd. Genl Obl Bonds 2009D Cheney Capital Improvements 12/17/09 2010-2014 5,000 1.7400 1,000 1,000 0 0Ltd. Genl Obl Bonds 2009E Multiple Projects Capital Improvements 12/17/09 2026-2035 13,526 5.7500 13,526 13,526 13,526Ltd. Genl Obl Bonds 2009E Acreted Interest 12/18/09 2026-2036 13,526 5.7500 3,364 976 4,340 976 4,340Ltd. Genl Obl Bonds 2009F Cheney & Env Remed Capital Improvements 12/17/09 2023-2026 6,681 7.2020 6,681 6,681 6,681Ltd. Genl Obl Bonds 2009F Acreted Interest 12/18/09 2023-2027 6,681 7.2020 2,143 643 2,786 643 2,786Ltd. Genl Obl Bonds 2010B Refunding Bonds Refund 1997B, 2001, 2004, 20 11/10/10 2015-2022 7,355 2.7966 7,355 7,355 2,630Ltd. Genl Obl Bonds 2010C Refunding Bonds Refund 2001, 2007, 2009 LTGO 11/10/10 2015-2022 7,355 3.8076 7,355 7,355 7,355Ltd. Genl Obl Bonds 2010D Bonds Capital Improvements 11/10/10 2015-2033 30,225 5.0399 30,225 30,225 30,225Ltd. Genl Obl Bonds 2010E Bonds Capital Improvements 11/10/10 2015-2040 9,130 5.7155 9,130 9,130 9,130Ltd. Genl Obl Bonds 2013 Refunding Bonds Refund 2001 & 2004 03/05/13 2015-2034 44,170 3.1768 44,170 44,170 1,055
0Subtotal Limited (Councilmanic) 193,783 2,203 3,925 192,061 2,203 130,121
Washington State Public Works Trust Fund LoanCTED PWTF No. 98-791-065 Capital Improvements 08/17/98 1999-2018 9,000 1.0000 2,702 541 2,161 2,161CTED PWTF No. 04-691-068 Capital Improvements 06/02/04 2004-2024 4,500 0.5000 6,275 571 5,704 5,704
Subtotal Washington State Loan (Councilmanic) 8,977 0 1,112 7,865 0 7,865
Total General Obligation Bonds, Loans, & Notes 222,750 2,203 6,922 218,031 2,203 156,091
FOR DECEMBER 31, 2014
CITY OF TACOMA, WASHINGTONNOTES TO THE FINANCIAL STATEMENTS
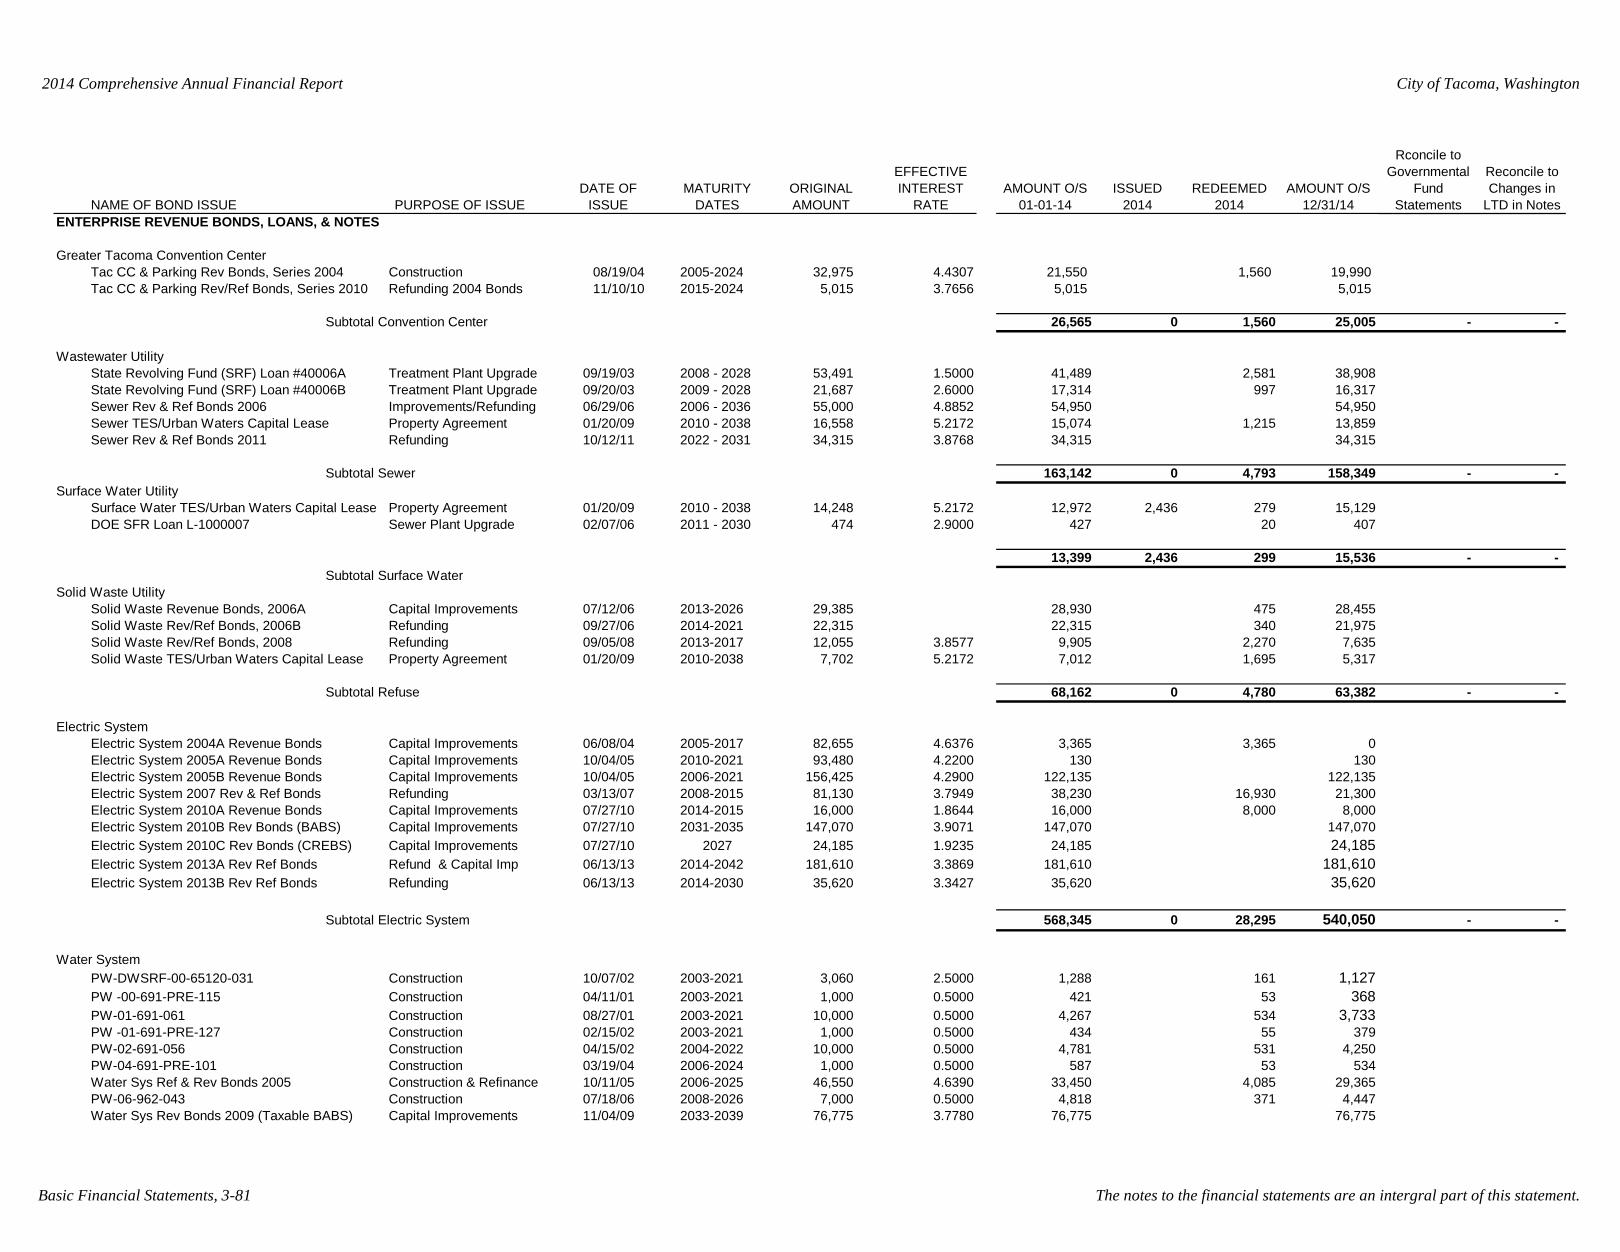
2014 Comprehensive Annual Financial Report City of Tacoma, Washington
Basic Financial Statements, 3-81 The notes to the financial statements are an intergral part of this statement.
NAME OF BOND ISSUE PURPOSE OF ISSUEDATE OF
ISSUEMATURITY
DATESORIGINAL AMOUNT
EFFECTIVE INTEREST
RATEAMOUNT O/S
01-01-14ISSUED
2014REDEEMED
2014AMOUNT O/S
12/31/14
Rconcile to Governmental
Fund Statements
Reconcile to Changes in
LTD in NotesENTERPRISE REVENUE BONDS, LOANS, & NOTES
Greater Tacoma Convention CenterTac CC & Parking Rev Bonds, Series 2004 Construction 08/19/04 2005-2024 32,975 4.4307 21,550 1,560 19,990Tac CC & Parking Rev/Ref Bonds, Series 2010 Refunding 2004 Bonds 11/10/10 2015-2024 5,015 3.7656 5,015 5,015
Subtotal Convention Center 26,565 0 1,560 25,005 - -
Wastewater UtilityState Revolving Fund (SRF) Loan #40006A Treatment Plant Upgrade 09/19/03 2008 - 2028 53,491 1.5000 41,489 2,581 38,908State Revolving Fund (SRF) Loan #40006B Treatment Plant Upgrade 09/20/03 2009 - 2028 21,687 2.6000 17,314 997 16,317Sewer Rev & Ref Bonds 2006 Improvements/Refunding 06/29/06 2006 - 2036 55,000 4.8852 54,950 54,950Sewer TES/Urban Waters Capital Lease Property Agreement 01/20/09 2010 - 2038 16,558 5.2172 15,074 1,215 13,859Sewer Rev & Ref Bonds 2011 Refunding 10/12/11 2022 - 2031 34,315 3.8768 34,315 34,315
Subtotal Sewer 163,142 0 4,793 158,349 - - Surface Water Utility
Surface Water TES/Urban Waters Capital Lease Property Agreement 01/20/09 2010 - 2038 14,248 5.2172 12,972 2,436 279 15,129DOE SFR Loan L-1000007 Sewer Plant Upgrade 02/07/06 2011 - 2030 474 2.9000 427 20 407
13,399 2,436 299 15,536 - - Subtotal Surface Water
Solid Waste UtilitySolid Waste Revenue Bonds, 2006A Capital Improvements 07/12/06 2013-2026 29,385 28,930 475 28,455Solid Waste Rev/Ref Bonds, 2006B Refunding 09/27/06 2014-2021 22,315 22,315 340 21,975Solid Waste Rev/Ref Bonds, 2008 Refunding 09/05/08 2013-2017 12,055 3.8577 9,905 2,270 7,635Solid Waste TES/Urban Waters Capital Lease Property Agreement 01/20/09 2010-2038 7,702 5.2172 7,012 1,695 5,317
Subtotal Refuse 68,162 0 4,780 63,382 - -
Electric SystemElectric System 2004A Revenue Bonds Capital Improvements 06/08/04 2005-2017 82,655 4.6376 3,365 3,365 0Electric System 2005A Revenue Bonds Capital Improvements 10/04/05 2010-2021 93,480 4.2200 130 130Electric System 2005B Revenue Bonds Capital Improvements 10/04/05 2006-2021 156,425 4.2900 122,135 122,135Electric System 2007 Rev & Ref Bonds Refunding 03/13/07 2008-2015 81,130 3.7949 38,230 16,930 21,300Electric System 2010A Revenue Bonds Capital Improvements 07/27/10 2014-2015 16,000 1.8644 16,000 8,000 8,000Electric System 2010B Rev Bonds (BABS) Capital Improvements 07/27/10 2031-2035 147,070 3.9071 147,070 147,070Electric System 2010C Rev Bonds (CREBS) Capital Improvements 07/27/10 2027 24,185 1.9235 24,185 24,185Electric System 2013A Rev Ref Bonds Refund & Capital Imp 06/13/13 2014-2042 181,610 3.3869 181,610 181,610Electric System 2013B Rev Ref Bonds Refunding 06/13/13 2014-2030 35,620 3.3427 35,620 35,620
Subtotal Electric System 568,345 0 28,295 540,050 - -
Water SystemPW-DWSRF-00-65120-031 Construction 10/07/02 2003-2021 3,060 2.5000 1,288 161 1,127PW -00-691-PRE-115 Construction 04/11/01 2003-2021 1,000 0.5000 421 53 368PW-01-691-061 Construction 08/27/01 2003-2021 10,000 0.5000 4,267 534 3,733PW -01-691-PRE-127 Construction 02/15/02 2003-2021 1,000 0.5000 434 55 379PW-02-691-056 Construction 04/15/02 2004-2022 10,000 0.5000 4,781 531 4,250PW-04-691-PRE-101 Construction 03/19/04 2006-2024 1,000 0.5000 587 53 534Water Sys Ref & Rev Bonds 2005 Construction & Refinance 10/11/05 2006-2025 46,550 4.6390 33,450 4,085 29,365PW-06-962-043 Construction 07/18/06 2008-2026 7,000 0.5000 4,818 371 4,447Water Sys Rev Bonds 2009 (Taxable BABS) Capital Improvements 11/04/09 2033-2039 76,775 3.7780 76,775 76,775
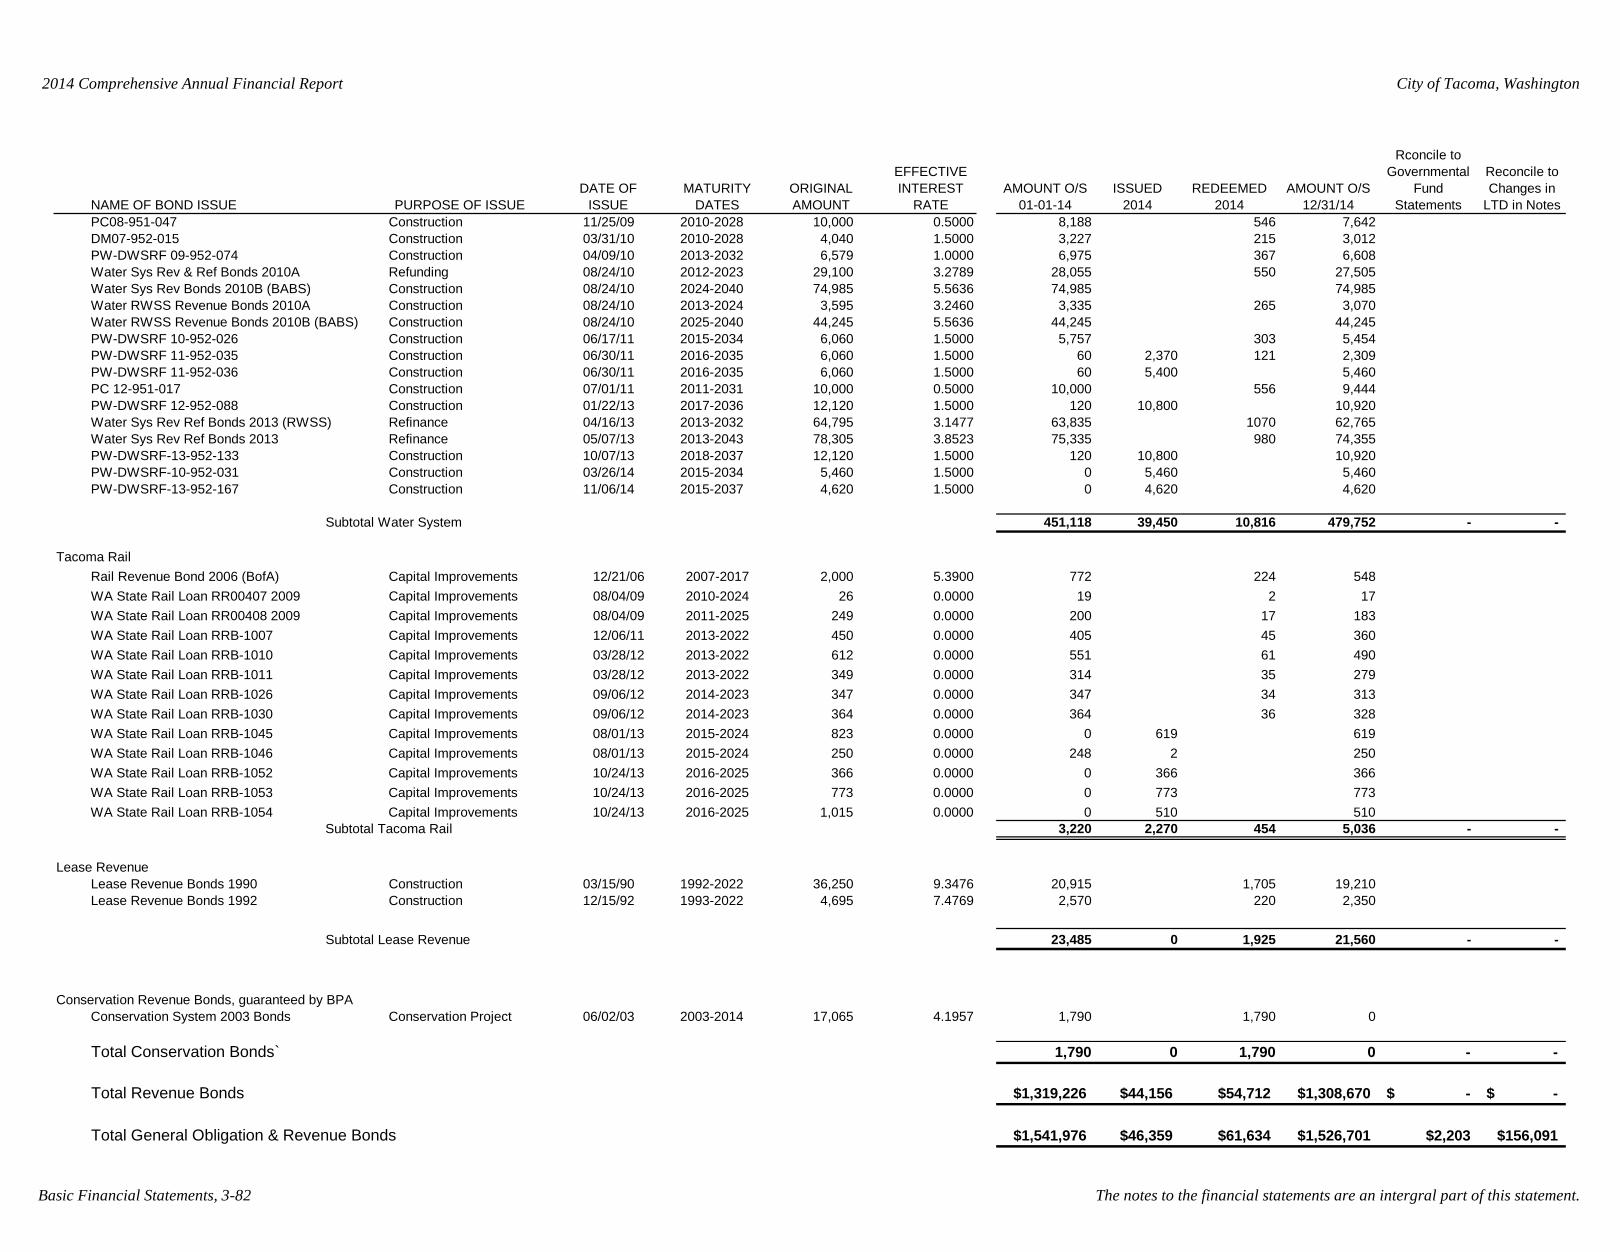
2014 Comprehensive Annual Financial Report City of Tacoma, Washington
Basic Financial Statements, 3-82 The notes to the financial statements are an intergral part of this statement.
NAME OF BOND ISSUE PURPOSE OF ISSUEDATE OF
ISSUEMATURITY
DATESORIGINAL AMOUNT
EFFECTIVE INTEREST
RATEAMOUNT O/S
01-01-14ISSUED
2014REDEEMED
2014AMOUNT O/S
12/31/14
Rconcile to Governmental
Fund Statements
Reconcile to Changes in
LTD in NotesPC08-951-047 Construction 11/25/09 2010-2028 10,000 0.5000 8,188 546 7,642DM07-952-015 Construction 03/31/10 2010-2028 4,040 1.5000 3,227 215 3,012PW-DWSRF 09-952-074 Construction 04/09/10 2013-2032 6,579 1.0000 6,975 367 6,608Water Sys Rev & Ref Bonds 2010A Refunding 08/24/10 2012-2023 29,100 3.2789 28,055 550 27,505Water Sys Rev Bonds 2010B (BABS) Construction 08/24/10 2024-2040 74,985 5.5636 74,985 74,985Water RWSS Revenue Bonds 2010A Construction 08/24/10 2013-2024 3,595 3.2460 3,335 265 3,070Water RWSS Revenue Bonds 2010B (BABS) Construction 08/24/10 2025-2040 44,245 5.5636 44,245 44,245PW-DWSRF 10-952-026 Construction 06/17/11 2015-2034 6,060 1.5000 5,757 303 5,454PW-DWSRF 11-952-035 Construction 06/30/11 2016-2035 6,060 1.5000 60 2,370 121 2,309PW-DWSRF 11-952-036 Construction 06/30/11 2016-2035 6,060 1.5000 60 5,400 5,460PC 12-951-017 Construction 07/01/11 2011-2031 10,000 0.5000 10,000 556 9,444PW-DWSRF 12-952-088 Construction 01/22/13 2017-2036 12,120 1.5000 120 10,800 10,920Water Sys Rev Ref Bonds 2013 (RWSS) Refinance 04/16/13 2013-2032 64,795 3.1477 63,835 1070 62,765Water Sys Rev Ref Bonds 2013 Refinance 05/07/13 2013-2043 78,305 3.8523 75,335 980 74,355PW-DWSRF-13-952-133 Construction 10/07/13 2018-2037 12,120 1.5000 120 10,800 10,920PW-DWSRF-10-952-031 Construction 03/26/14 2015-2034 5,460 1.5000 0 5,460 5,460PW-DWSRF-13-952-167 Construction 11/06/14 2015-2037 4,620 1.5000 0 4,620 4,620
Subtotal Water System 451,118 39,450 10,816 479,752 - -
Tacoma RailRail Revenue Bond 2006 (BofA) Capital Improvements 12/21/06 2007-2017 2,000 5.3900 772 224 548WA State Rail Loan RR00407 2009 Capital Improvements 08/04/09 2010-2024 26 0.0000 19 2 17WA State Rail Loan RR00408 2009 Capital Improvements 08/04/09 2011-2025 249 0.0000 200 17 183WA State Rail Loan RRB-1007 Capital Improvements 12/06/11 2013-2022 450 0.0000 405 45 360WA State Rail Loan RRB-1010 Capital Improvements 03/28/12 2013-2022 612 0.0000 551 61 490WA State Rail Loan RRB-1011 Capital Improvements 03/28/12 2013-2022 349 0.0000 314 35 279WA State Rail Loan RRB-1026 Capital Improvements 09/06/12 2014-2023 347 0.0000 347 34 313WA State Rail Loan RRB-1030 Capital Improvements 09/06/12 2014-2023 364 0.0000 364 36 328WA State Rail Loan RRB-1045 Capital Improvements 08/01/13 2015-2024 823 0.0000 0 619 619WA State Rail Loan RRB-1046 Capital Improvements 08/01/13 2015-2024 250 0.0000 248 2 250WA State Rail Loan RRB-1052 Capital Improvements 10/24/13 2016-2025 366 0.0000 0 366 366WA State Rail Loan RRB-1053 Capital Improvements 10/24/13 2016-2025 773 0.0000 0 773 773WA State Rail Loan RRB-1054 Capital Improvements 10/24/13 2016-2025 1,015 0.0000 0 510 510
Subtotal Tacoma Rail 3,220 2,270 454 5,036 - -
Lease RevenueLease Revenue Bonds 1990 Construction 03/15/90 1992-2022 36,250 9.3476 20,915 1,705 19,210Lease Revenue Bonds 1992 Construction 12/15/92 1993-2022 4,695 7.4769 2,570 220 2,350
Subtotal Lease Revenue 23,485 0 1,925 21,560 - -
Conservation Revenue Bonds, guaranteed by BPAConservation System 2003 Bonds Conservation Project 06/02/03 2003-2014 17,065 4.1957 1,790 1,790 0
Total Conservation Bonds` 1,790 0 1,790 0 - -
Total Revenue Bonds $1,319,226 $44,156 $54,712 $1,308,670 -$ -$
Total General Obligation & Revenue Bonds $1,541,976 $46,359 $61,634 $1,526,701 $2,203 $156,091
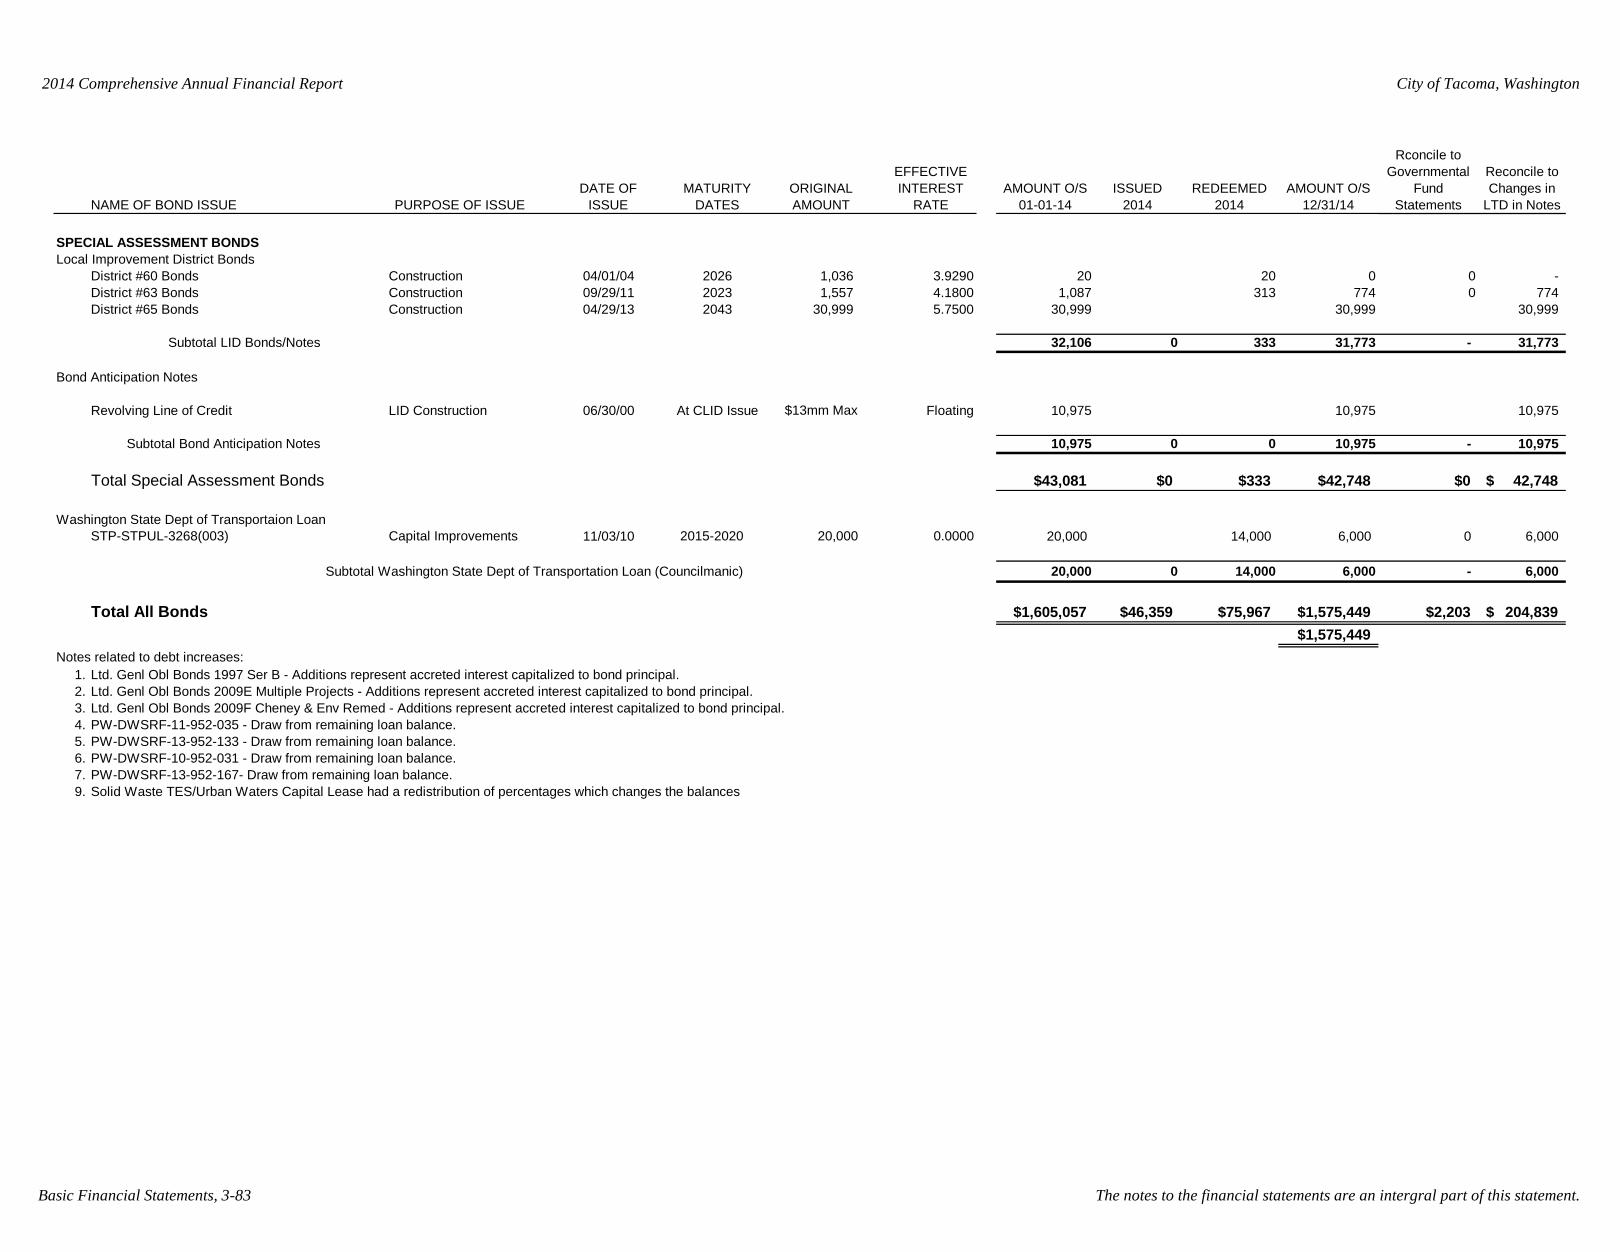
2014 Comprehensive Annual Financial Report City of Tacoma, Washington
Basic Financial Statements, 3-83 The notes to the financial statements are an intergral part of this statement.
NAME OF BOND ISSUE PURPOSE OF ISSUEDATE OF
ISSUEMATURITY
DATESORIGINAL AMOUNT
EFFECTIVE INTEREST
RATEAMOUNT O/S
01-01-14ISSUED
2014REDEEMED
2014AMOUNT O/S
12/31/14
Rconcile to Governmental
Fund Statements
Reconcile to Changes in
LTD in Notes
SPECIAL ASSESSMENT BONDSLocal Improvement District Bonds
District #60 Bonds Construction 04/01/04 2026 1,036 3.9290 20 20 0 0 - District #63 Bonds Construction 09/29/11 2023 1,557 4.1800 1,087 313 774 0 774 District #65 Bonds Construction 04/29/13 2043 30,999 5.7500 30,999 30,999 30,999
Subtotal LID Bonds/Notes 32,106 0 333 31,773 - 31,773
Bond Anticipation Notes
Revolving Line of Credit LID Construction 06/30/00 At CLID Issue $13mm Max Floating 10,975 10,975 10,975
Subtotal Bond Anticipation Notes 10,975 0 0 10,975 - 10,975
Total Special Assessment Bonds $43,081 $0 $333 $42,748 $0 42,748$
Washington State Dept of Transportaion LoanSTP-STPUL-3268(003) Capital Improvements 11/03/10 2015-2020 20,000 0.0000 20,000 14,000 6,000 0 6,000
Subtotal Washington State Dept of Transportation Loan (Councilmanic) 20,000 0 14,000 6,000 - 6,000
Total All Bonds $1,605,057 $46,359 $75,967 $1,575,449 $2,203 204,839$ $1,575,449
Notes related to debt increases: 1. Ltd. Genl Obl Bonds 1997 Ser B - Additions represent accreted interest capitalized to bond principal.2. Ltd. Genl Obl Bonds 2009E Multiple Projects - Additions represent accreted interest capitalized to bond principal.3. Ltd. Genl Obl Bonds 2009F Cheney & Env Remed - Additions represent accreted interest capitalized to bond principal.4. PW-DWSRF-11-952-035 - Draw from remaining loan balance.5. PW-DWSRF-13-952-133 - Draw from remaining loan balance.6. PW-DWSRF-10-952-031 - Draw from remaining loan balance.7. PW-DWSRF-13-952-167- Draw from remaining loan balance.9. Solid Waste TES/Urban Waters Capital Lease had a redistribution of percentages which changes the balances

THIS PAGE LEFT INTENTIONALLY BLANK
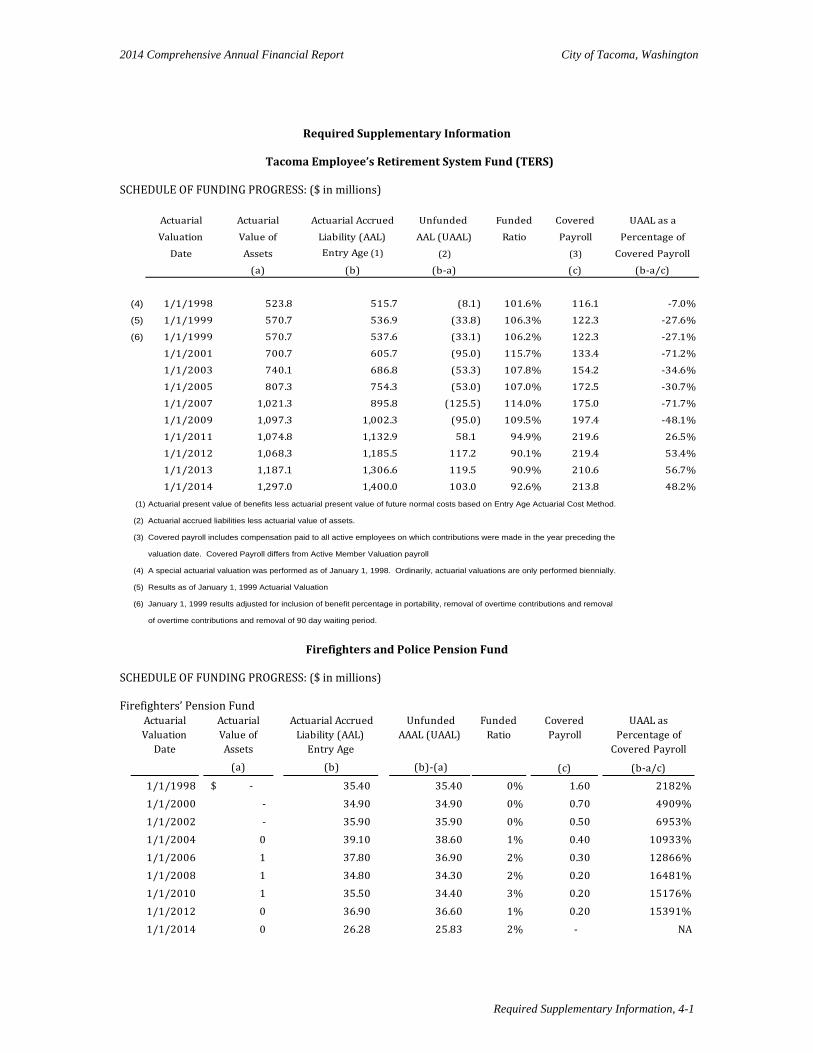
2014 Comprehensive Annual Financial Report City of Tacoma, Washington
Required Supplementary Information
Tacoma Employee’s Retirement System Fund (TERS)
SCHEDULE OF FUNDING PROGRESS: ($ in millions)
Actuarial Actuarial Actuarial Accrued Unfunded Funded Covered UAAL as aValuation Value of Liability (AAL) AAL (UAAL) Ratio Payroll Percentage of
Date Assets Entry Age (1) (2) (3) Covered Payroll(a) (b) (b-a) (c) (b-a/c)
(4) 1/1/1998 523.8 515.7 (8.1) 101.6% 116.1 -7.0%(5) 1/1/1999 570.7 536.9 (33.8) 106.3% 122.3 -27.6%(6) 1/1/1999 570.7 537.6 (33.1) 106.2% 122.3 -27.1%
1/1/2001 700.7 605.7 (95.0) 115.7% 133.4 -71.2%1/1/2003 740.1 686.8 (53.3) 107.8% 154.2 -34.6%1/1/2005 807.3 754.3 (53.0) 107.0% 172.5 -30.7%1/1/2007 1,021.3 895.8 (125.5) 114.0% 175.0 -71.7%1/1/2009 1,097.3 1,002.3 (95.0) 109.5% 197.4 -48.1%1/1/2011 1,074.8 1,132.9 58.1 94.9% 219.6 26.5%1/1/2012 1,068.3 1,185.5 117.2 90.1% 219.4 53.4%1/1/2013 1,187.1 1,306.6 119.5 90.9% 210.6 56.7%1/1/2014 1,297.0 1,400.0 103.0 92.6% 213.8 48.2%
(1) Actuarial present value of benefits less actuarial present value of future normal costs based on Entry Age Actuarial Cost Method.
(2) Actuarial accrued liabilities less actuarial value of assets.
(3) Covered payroll includes compensation paid to all active employees on which contributions were made in the year preceding the
valuation date. Covered Payroll differs from Active Member Valuation payroll
(4) A special actuarial valuation was performed as of January 1, 1998. Ordinarily, actuarial valuations are only performed biennially.
(5) Results as of January 1, 1999 Actuarial Valuation
(6) January 1, 1999 results adjusted for inclusion of benefit percentage in portability, removal of overtime contributions and removal
of overtime contributions and removal of 90 day waiting period.
Firefighters and Police Pension Fund
SCHEDULE OF FUNDING PROGRESS: ($ in millions) Firefighters’ Pension Fund
Actuarial Valuation
Date
Actuarial Value of Assets
Actuarial Accrued Liability (AAL)
Entry Age
Unfunded AAAL (UAAL)
Funded Ratio
Covered Payroll
UAAL as Percentage of
Covered Payroll(a) (b) (b)-(a) (c) (b-a/c)
1/1/1998 -$ 35.40 35.40 0% 1.60 2182%1/1/2000 - 34.90 34.90 0% 0.70 4909%1/1/2002 - 35.90 35.90 0% 0.50 6953%1/1/2004 0 39.10 38.60 1% 0.40 10933%1/1/2006 1 37.80 36.90 2% 0.30 12866%1/1/2008 1 34.80 34.30 2% 0.20 16481%1/1/2010 1 35.50 34.40 3% 0.20 15176%1/1/2012 0 36.90 36.60 1% 0.20 15391%1/1/2014 0 26.28 25.83 2% - NA
Required Supplementary Information, 4-1
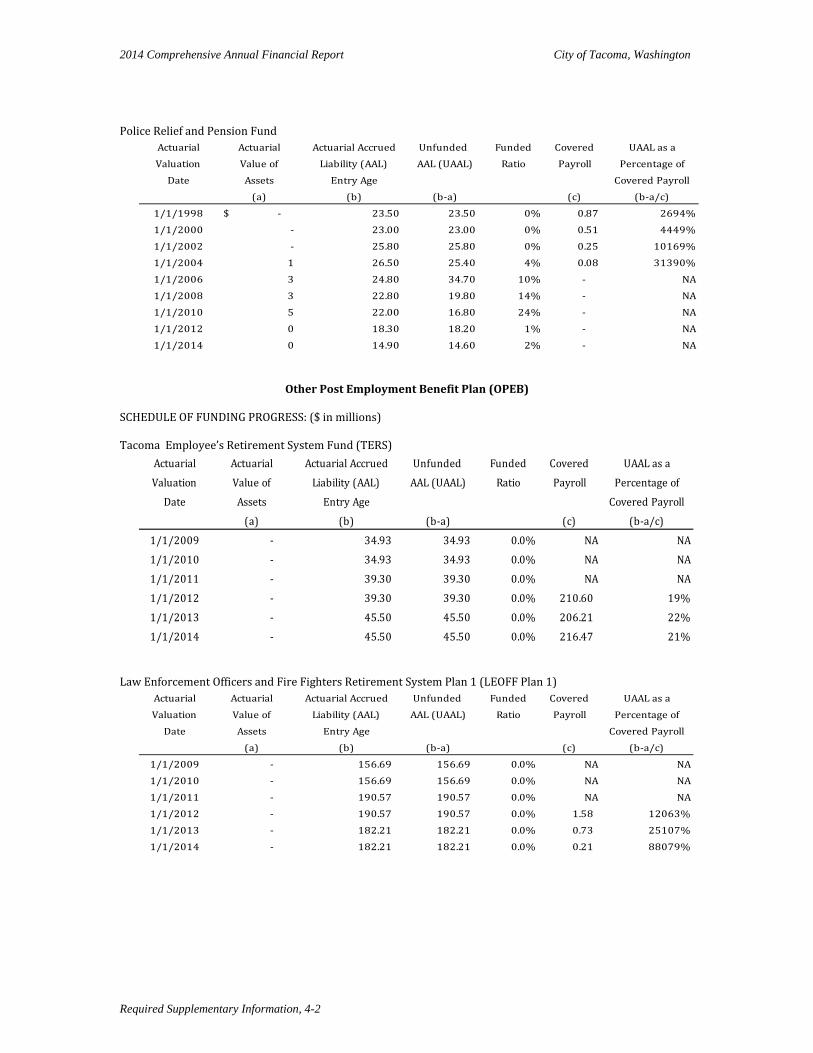
2014 Comprehensive Annual Financial Report City of Tacoma, Washington
Police Relief and Pension Fund
Actuarial Actuarial Actuarial Accrued Unfunded Funded Covered UAAL as aValuation Value of Liability (AAL) AAL (UAAL) Ratio Payroll Percentage of
Date Assets Entry Age Covered Payroll(a) (b) (b-a) (c) (b-a/c)
1/1/1998 -$ 23.50 23.50 0% 0.87 2694%1/1/2000 - 23.00 23.00 0% 0.51 4449%1/1/2002 - 25.80 25.80 0% 0.25 10169%1/1/2004 1 26.50 25.40 4% 0.08 31390%1/1/2006 3 24.80 34.70 10% - NA1/1/2008 3 22.80 19.80 14% - NA1/1/2010 5 22.00 16.80 24% - NA1/1/2012 0 18.30 18.20 1% - NA1/1/2014 0 14.90 14.60 2% - NA
Other Post Employment Benefit Plan (OPEB) SCHEDULE OF FUNDING PROGRESS: ($ in millions) Tacoma Employee’s Retirement System Fund (TERS)
Actuarial Actuarial Actuarial Accrued Unfunded Funded Covered UAAL as aValuation Value of Liability (AAL) AAL (UAAL) Ratio Payroll Percentage of
Date Assets Entry Age Covered Payroll(a) (b) (b-a) (c) (b-a/c)
1/1/2009 - 34.93 34.93 0.0% NA NA1/1/2010 - 34.93 34.93 0.0% NA NA1/1/2011 - 39.30 39.30 0.0% NA NA1/1/2012 - 39.30 39.30 0.0% 210.60 19%1/1/2013 - 45.50 45.50 0.0% 206.21 22%1/1/2014 - 45.50 45.50 0.0% 216.47 21%
Law Enforcement Officers and Fire Fighters Retirement System Plan 1 (LEOFF Plan 1)
Actuarial Actuarial Actuarial Accrued Unfunded Funded Covered UAAL as aValuation Value of Liability (AAL) AAL (UAAL) Ratio Payroll Percentage of
Date Assets Entry Age Covered Payroll(a) (b) (b-a) (c) (b-a/c)
1/1/2009 - 156.69 156.69 0.0% NA NA1/1/2010 - 156.69 156.69 0.0% NA NA1/1/2011 - 190.57 190.57 0.0% NA NA1/1/2012 - 190.57 190.57 0.0% 1.58 12063%1/1/2013 - 182.21 182.21 0.0% 0.73 25107%1/1/2014 - 182.21 182.21 0.0% 0.21 88079%
Required Supplementary Information, 4-2
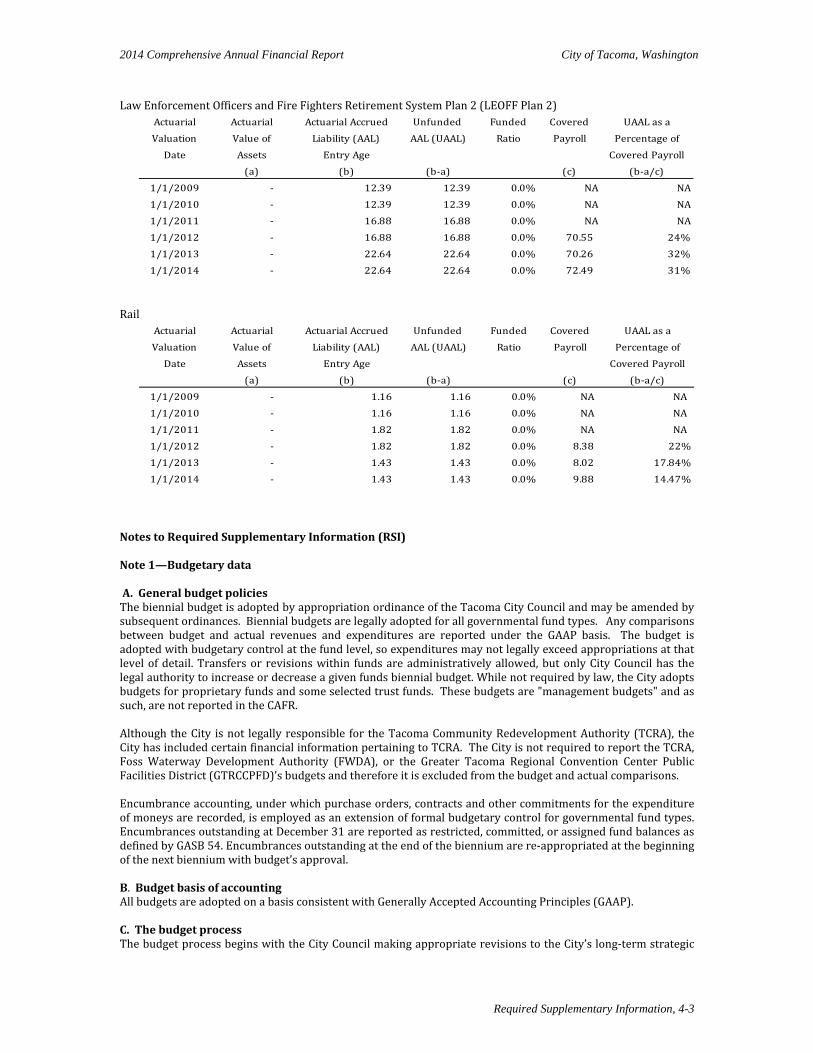
2014 Comprehensive Annual Financial Report City of Tacoma, Washington Law Enforcement Officers and Fire Fighters Retirement System Plan 2 (LEOFF Plan 2)
Actuarial Actuarial Actuarial Accrued Unfunded Funded Covered UAAL as aValuation Value of Liability (AAL) AAL (UAAL) Ratio Payroll Percentage of
Date Assets Entry Age Covered Payroll(a) (b) (b-a) (c) (b-a/c)
1/1/2009 - 12.39 12.39 0.0% NA NA1/1/2010 - 12.39 12.39 0.0% NA NA1/1/2011 - 16.88 16.88 0.0% NA NA1/1/2012 - 16.88 16.88 0.0% 70.55 24%1/1/2013 - 22.64 22.64 0.0% 70.26 32%1/1/2014 - 22.64 22.64 0.0% 72.49 31%
Rail
Actuarial Actuarial Actuarial Accrued Unfunded Funded Covered UAAL as aValuation Value of Liability (AAL) AAL (UAAL) Ratio Payroll Percentage of
Date Assets Entry Age Covered Payroll(a) (b) (b-a) (c) (b-a/c)
1/1/2009 - 1.16 1.16 0.0% NA NA1/1/2010 - 1.16 1.16 0.0% NA NA1/1/2011 - 1.82 1.82 0.0% NA NA1/1/2012 - 1.82 1.82 0.0% 8.38 22%1/1/2013 - 1.43 1.43 0.0% 8.02 17.84%1/1/2014 - 1.43 1.43 0.0% 9.88 14.47%
Notes to Required Supplementary Information (RSI) Note 1—Budgetary data A. General budget policies The biennial budget is adopted by appropriation ordinance of the Tacoma City Council and may be amended by subsequent ordinances. Biennial budgets are legally adopted for all governmental fund types. Any comparisons between budget and actual revenues and expenditures are reported under the GAAP basis. The budget is adopted with budgetary control at the fund level, so expenditures may not legally exceed appropriations at that level of detail. Transfers or revisions within funds are administratively allowed, but only City Council has the legal authority to increase or decrease a given funds biennial budget. While not required by law, the City adopts budgets for proprietary funds and some selected trust funds. These budgets are "management budgets" and as such, are not reported in the CAFR. Although the City is not legally responsible for the Tacoma Community Redevelopment Authority (TCRA), the City has included certain financial information pertaining to TCRA. The City is not required to report the TCRA, Foss Waterway Development Authority (FWDA), or the Greater Tacoma Regional Convention Center Public Facilities District (GTRCCPFD)’s budgets and therefore it is excluded from the budget and actual comparisons. Encumbrance accounting, under which purchase orders, contracts and other commitments for the expenditure of moneys are recorded, is employed as an extension of formal budgetary control for governmental fund types. Encumbrances outstanding at December 31 are reported as restricted, committed, or assigned fund balances as defined by GASB 54. Encumbrances outstanding at the end of the biennium are re-appropriated at the beginning of the next biennium with budget’s approval. B. Budget basis of accounting All budgets are adopted on a basis consistent with Generally Accepted Accounting Principles (GAAP). C. The budget process The budget process begins with the City Council making appropriate revisions to the City’s long-term strategic
Required Supplementary Information, 4-3
2014 Comprehensive Annual Financial Report City of Tacoma, Washington
plan, identifying goals, and setting priorities. In early June, the initial revenue forecast is completed by the Office of Management, Budget and Analysis (OMBA) and City departments and agencies begin budget preparation. Budget requests are due to OMBA in late July. OMBA reviews and revises budget requests in August. The revenue forecast is refined in early September and a preliminary budget is presented to the Executive Forum in early October. The preliminary budget is further refined during the month of October. By Washington State law, the City Council must receive a balanced preliminary budget by November 1st. Public budget hearings are conducted by the City Council in mid-November. Any changes the Council decides to make to the preliminary budget are made after the public hearings and before the reading of the budget ordinance in December. Washington State law requires that the City Council adopt a balanced budget on or before December 31. Washington State law requires that a mid-biennial review and modification be conducted between September 1 and December 31 of the first year of the biennium. Supplemental budget requests are accepted from departments during the month of August. Revenue estimates for the biennium are reviewed and adjusted in early September. The new revenue estimates and the supplemental requests are submitted to the Budget Committee and the Executive Forum in late September. Preliminary modifications are presented to the City Manager for review and changes in October. Modifications are submitted to the City Council in early November. Public hearings are conducted in November. The City Council adopts the amended biennial budget on or before December 31. D. Funds presented Budgetary information is displayed for all funds that are subject to the City’s biennial budget process. The General Fund’s budgetary information is located in the Required Supplementary Information section on page 4-5. All other major funds non-major governmental funds budgetary information are located in the Combining Statements Non-Major Funds section on pages 5-19 to 5-55. Note 2 Combining statements The Non-Major Governmental, Proprietary funds and Internal Service funds are displayed in aggregated columns in the City’s fund statements. This section of the report contains combining statements that display the financial information for these funds. There are separate combining statements for Non-Major Governmental funds, Non-Major Enterprise funds and the Internal Service funds.
Required Supplementary Information, 4-4
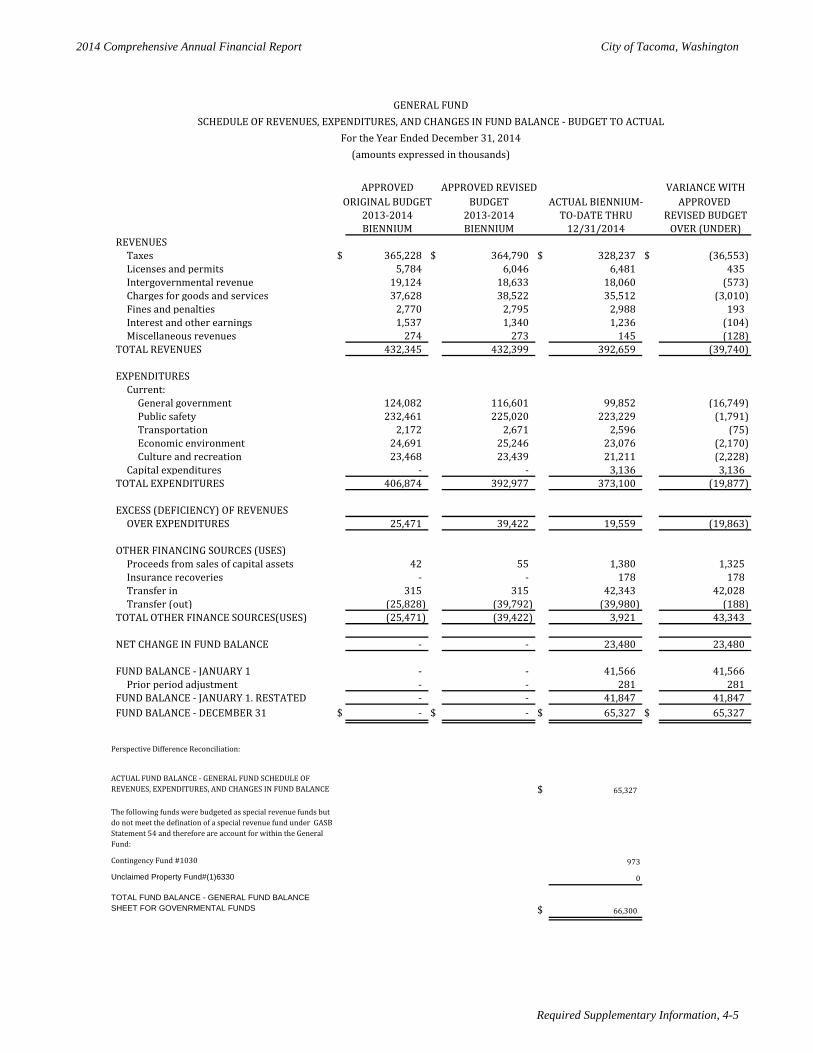
2014 Comprehensive Annual Financial Report City of Tacoma, Washington
Required Supplementary Information, 4-5
APPROVED APPROVED REVISED VARIANCE WITHORIGINAL BUDGET BUDGET ACTUAL BIENNIUM- APPROVED
2013-2014 2013-2014 TO-DATE THRU REVISED BUDGET BIENNIUM BIENNIUM 12/31/2014 OVER (UNDER)
REVENUESTaxes $ 365,228 $ 364,790 $ 328,237 $ (36,553) Licenses and permits 5,784 6,046 6,481 435 Intergovernmental revenue 19,124 18,633 18,060 (573) Charges for goods and services 37,628 38,522 35,512 (3,010) Fines and penalties 2,770 2,795 2,988 193 Interest and other earnings 1,537 1,340 1,236 (104) Miscellaneous revenues 274 273 145 (128)
TOTAL REVENUES 432,345 432,399 392,659 (39,740)
EXPENDITURESCurrent:
General government 124,082 116,601 99,852 (16,749) Public safety 232,461 225,020 223,229 (1,791) Transportation 2,172 2,671 2,596 (75) Economic environment 24,691 25,246 23,076 (2,170) Culture and recreation 23,468 23,439 21,211 (2,228)
Capital expenditures - - 3,136 3,136 TOTAL EXPENDITURES 406,874 392,977 373,100 (19,877)
EXCESS (DEFICIENCY) OF REVENUESOVER EXPENDITURES 25,471 39,422 19,559 (19,863)
OTHER FINANCING SOURCES (USES)Proceeds from sales of capital assets 42 55 1,380 1,325 Insurance recoveries - - 178 178 Transfer in 315 315 42,343 42,028 Transfer (out) (25,828) (39,792) (39,980) (188)
TOTAL OTHER FINANCE SOURCES(USES) (25,471) (39,422) 3,921 43,343
NET CHANGE IN FUND BALANCE - - 23,480 23,480
FUND BALANCE - JANUARY 1 - - 41,566 41,566 Prior period adjustment - - 281 281
FUND BALANCE - JANUARY 1. RESTATED - - 41,847 41,847 FUND BALANCE - DECEMBER 31 $ - $ - $ 65,327 $ 65,327
Perspective Difference Reconciliation:
ACTUAL FUND BALANCE - GENERAL FUND SCHEDULE OF REVENUES, EXPENDITURES, AND CHANGES IN FUND BALANCE $ 65,327
The following funds were budgeted as special revenue funds but do not meet the defination of a special revenue fund under GASB Statement 54 and therefore are account for within the General Fund:
Contingency Fund #1030 973
Unclaimed Property Fund#(1)6330 0
TOTAL FUND BALANCE - GENERAL FUND BALANCE SHEET FOR GOVENRMENTAL FUNDS $ 66,300
GENERAL FUNDSCHEDULE OF REVENUES, EXPENDITURES, AND CHANGES IN FUND BALANCE - BUDGET TO ACTUAL
For the Year Ended December 31, 2014(amounts expressed in thousands)

THIS PAGE LEFT INTENTIONALLY BLANK
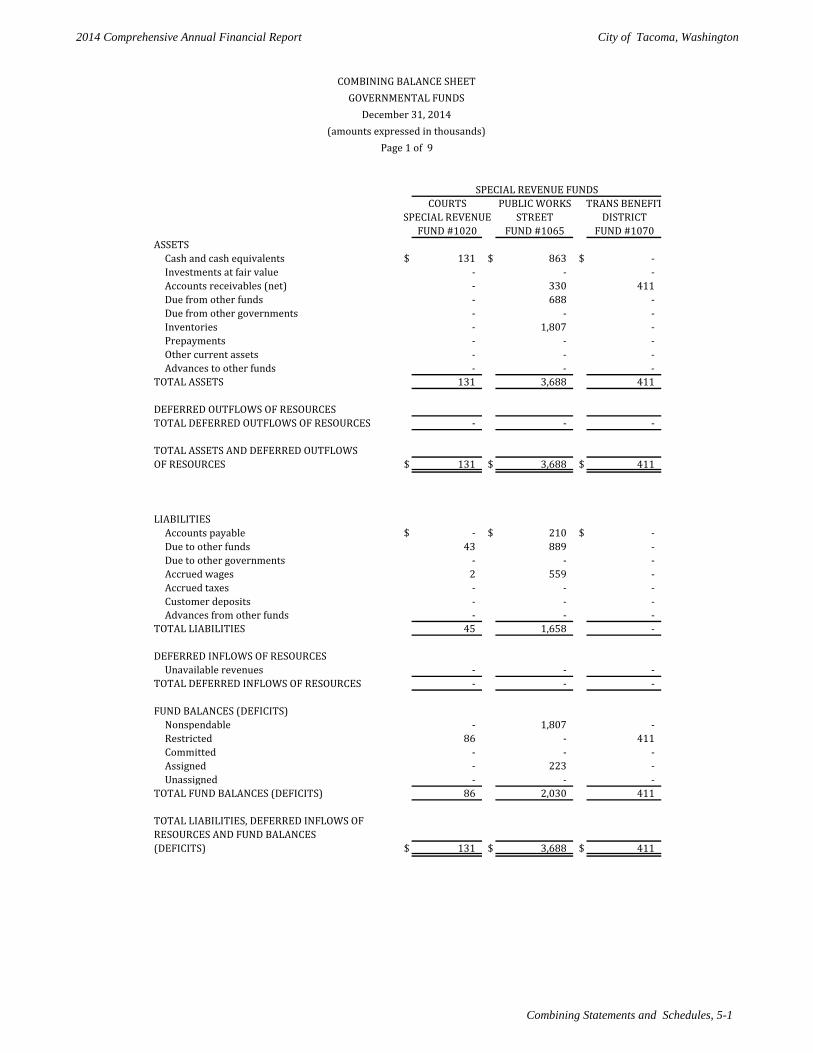
2014 Comprehensive Annual Financial Report City of Tacoma, Washington
Combining Statements and Schedules, 5-1
COURTS PUBLIC WORKS TRANS BENEFITSPECIAL REVENUE STREET DISTRICT
FUND #1020 FUND #1065 FUND #1070ASSETS
Cash and cash equivalents $ 131 $ 863 $ - Investments at fair value - - - Accounts receivables (net) - 330 411 Due from other funds - 688 - Due from other governments - - - Inventories - 1,807 - Prepayments - - - Other current assets - - - Advances to other funds - - -
TOTAL ASSETS 131 3,688 411
DEFERRED OUTFLOWS OF RESOURCESTOTAL DEFERRED OUTFLOWS OF RESOURCES - - - TOTAL ASSETS AND DEFERRED OUTFLOWSOF RESOURCES $ 131 $ 3,688 $ 411
LIABILITIESAccounts payable $ - $ 210 $ - Due to other funds 43 889 - Due to other governments - - - Accrued wages 2 559 - Accrued taxes - - - Customer deposits - - - Advances from other funds - - -
TOTAL LIABILITIES 45 1,658 -
DEFERRED INFLOWS OF RESOURCESUnavailable revenues - - -
TOTAL DEFERRED INFLOWS OF RESOURCES - - -
FUND BALANCES (DEFICITS)Nonspendable - 1,807 - Restricted 86 - 411 Committed - - - Assigned - 223 - Unassigned - - -
TOTAL FUND BALANCES (DEFICITS) 86 2,030 411
TOTAL LIABILITIES, DEFERRED INFLOWS OF RESOURCES AND FUND BALANCES(DEFICITS) $ 131 $ 3,688 $ 411
SPECIAL REVENUE FUNDS
COMBINING BALANCE SHEETGOVERNMENTAL FUNDS
December 31, 2014(amounts expressed in thousands)
Page 1 of 9
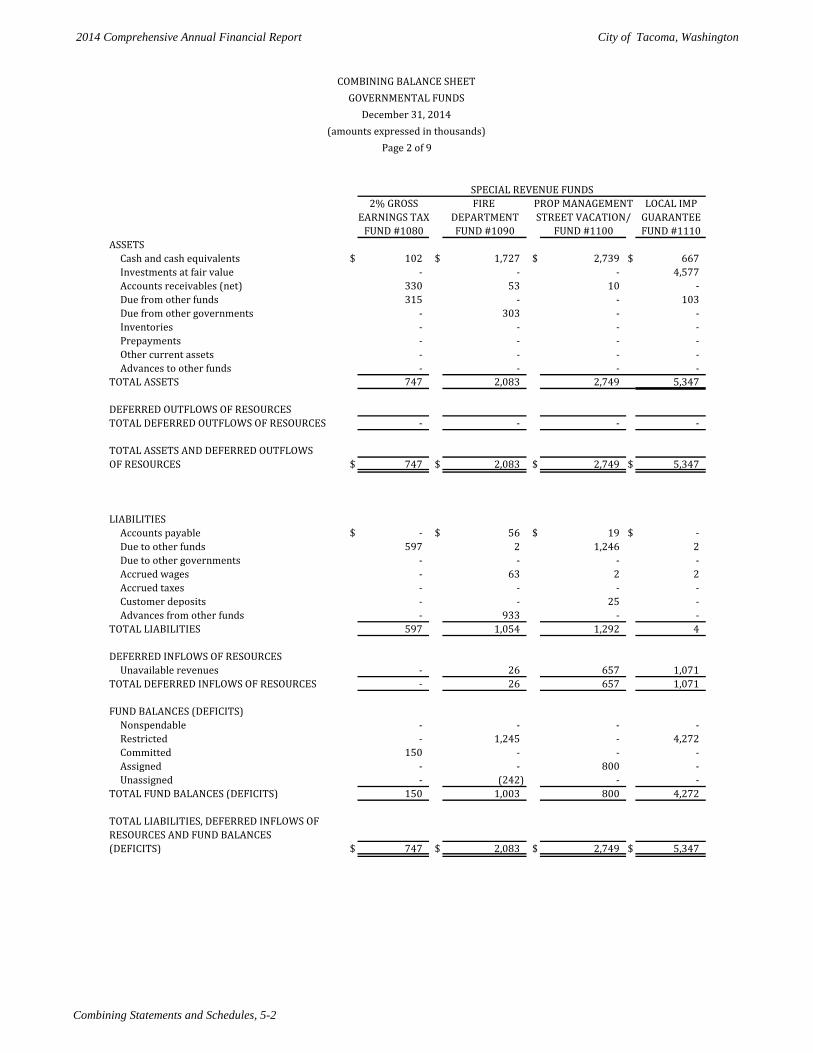
2014 Comprehensive Annual Financial Report City of Tacoma, Washington
Combining Statements and Schedules, 5-2
2% GROSS FIRE PROP MANAGEMENT LOCAL IMPEARNINGS TAX DEPARTMENT STREET VACATION/ GUARANTEE
FUND #1080 FUND #1090 FUND #1100 FUND #1110ASSETS
Cash and cash equivalents $ 102 $ 1,727 $ 2,739 $ 667 Investments at fair value - - - 4,577 Accounts receivables (net) 330 53 10 - Due from other funds 315 - - 103 Due from other governments - 303 - - Inventories - - - - Prepayments - - - - Other current assets - - - - Advances to other funds - - - -
TOTAL ASSETS 747 2,083 2,749 5,347
DEFERRED OUTFLOWS OF RESOURCESTOTAL DEFERRED OUTFLOWS OF RESOURCES - - - - TOTAL ASSETS AND DEFERRED OUTFLOWSOF RESOURCES $ 747 $ 2,083 $ 2,749 $ 5,347
LIABILITIESAccounts payable $ - $ 56 $ 19 $ - Due to other funds 597 2 1,246 2 Due to other governments - - - - Accrued wages - 63 2 2 Accrued taxes - - - - Customer deposits - - 25 - Advances from other funds - 933 - -
TOTAL LIABILITIES 597 1,054 1,292 4
DEFERRED INFLOWS OF RESOURCESUnavailable revenues - 26 657 1,071
TOTAL DEFERRED INFLOWS OF RESOURCES - 26 657 1,071
FUND BALANCES (DEFICITS)Nonspendable - - - - Restricted - 1,245 - 4,272 Committed 150 - - - Assigned - - 800 - Unassigned - (242) - -
TOTAL FUND BALANCES (DEFICITS) 150 1,003 800 4,272
TOTAL LIABILITIES, DEFERRED INFLOWS OF RESOURCES AND FUND BALANCES(DEFICITS) $ 747 $ 2,083 $ 2,749 $ 5,347
SPECIAL REVENUE FUNDS
COMBINING BALANCE SHEETGOVERNMENTAL FUNDS
December 31, 2014(amounts expressed in thousands)
Page 2 of 9
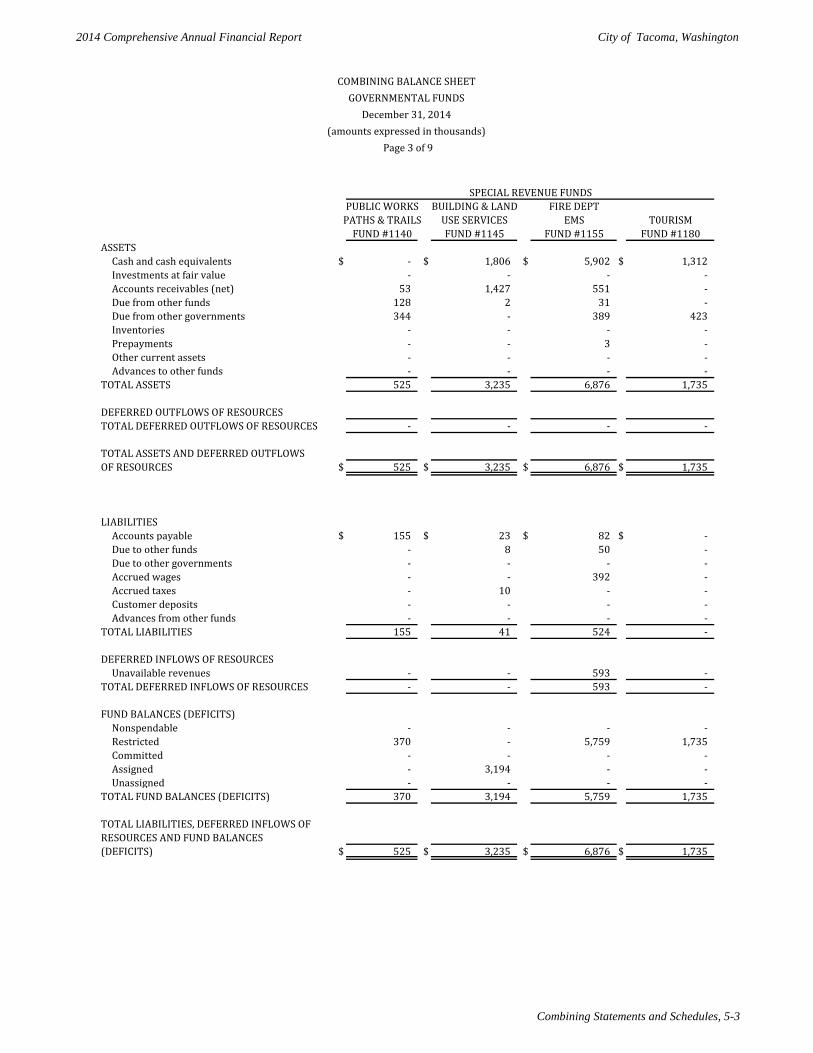
2014 Comprehensive Annual Financial Report City of Tacoma, Washington
Combining Statements and Schedules, 5-3
PUBLIC WORKS BUILDING & LAND FIRE DEPTPATHS & TRAILS USE SERVICES EMS T0URISM
FUND #1140 FUND #1145 FUND #1155 FUND #1180ASSETS
Cash and cash equivalents $ - $ 1,806 $ 5,902 $ 1,312 Investments at fair value - - - - Accounts receivables (net) 53 1,427 551 - Due from other funds 128 2 31 - Due from other governments 344 - 389 423 Inventories - - - - Prepayments - - 3 - Other current assets - - - - Advances to other funds - - - -
TOTAL ASSETS 525 3,235 6,876 1,735
DEFERRED OUTFLOWS OF RESOURCESTOTAL DEFERRED OUTFLOWS OF RESOURCES - - - - TOTAL ASSETS AND DEFERRED OUTFLOWSOF RESOURCES $ 525 $ 3,235 $ 6,876 $ 1,735
LIABILITIESAccounts payable $ 155 $ 23 $ 82 $ - Due to other funds - 8 50 - Due to other governments - - - - Accrued wages - - 392 - Accrued taxes - 10 - - Customer deposits - - - - Advances from other funds - - - -
TOTAL LIABILITIES 155 41 524 -
DEFERRED INFLOWS OF RESOURCESUnavailable revenues - - 593 -
TOTAL DEFERRED INFLOWS OF RESOURCES - - 593 -
FUND BALANCES (DEFICITS)Nonspendable - - - - Restricted 370 - 5,759 1,735 Committed - - - - Assigned - 3,194 - - Unassigned - - - -
TOTAL FUND BALANCES (DEFICITS) 370 3,194 5,759 1,735
TOTAL LIABILITIES, DEFERRED INFLOWS OF RESOURCES AND FUND BALANCES(DEFICITS) $ 525 $ 3,235 $ 6,876 $ 1,735
SPECIAL REVENUE FUNDS
COMBINING BALANCE SHEETGOVERNMENTAL FUNDS
December 31, 2014(amounts expressed in thousands)
Page 3 of 9
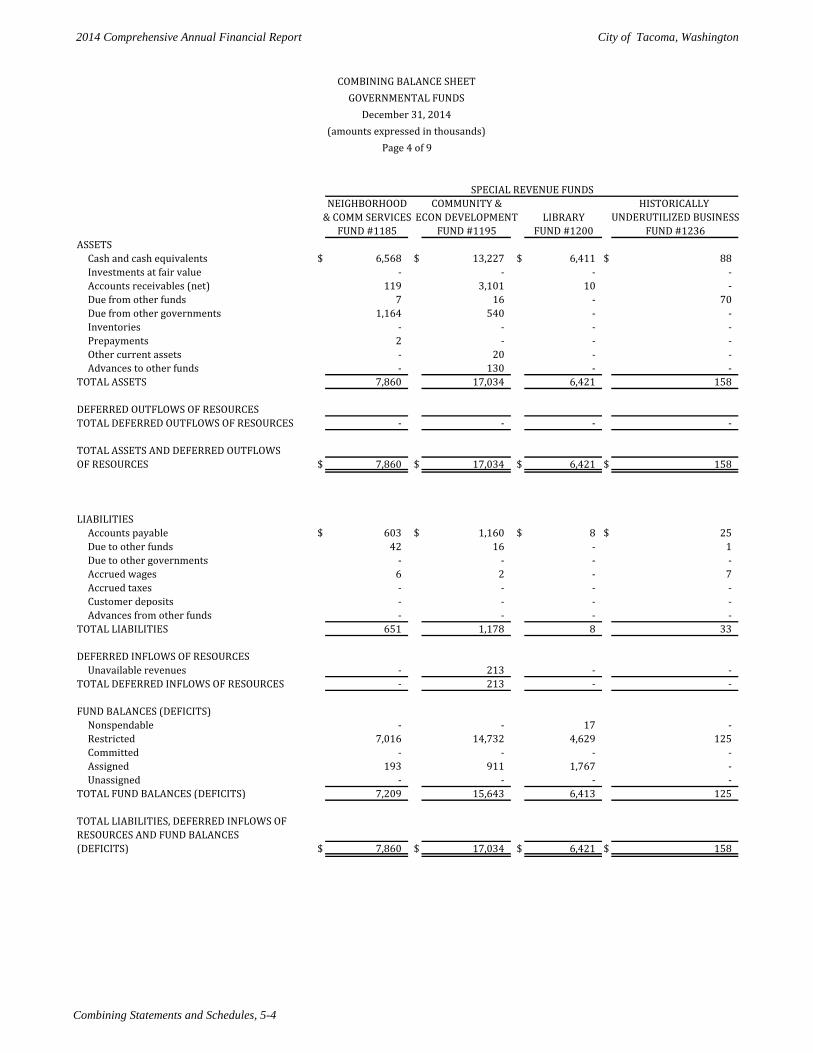
2014 Comprehensive Annual Financial Report City of Tacoma, Washington
Combining Statements and Schedules, 5-4
NEIGHBORHOOD COMMUNITY & HISTORICALLY & COMM SERVICES ECON DEVELOPMENT LIBRARY UNDERUTILIZED BUSINESS
FUND #1185 FUND #1195 FUND #1200 FUND #1236ASSETS
Cash and cash equivalents $ 6,568 $ 13,227 $ 6,411 $ 88 Investments at fair value - - - - Accounts receivables (net) 119 3,101 10 - Due from other funds 7 16 - 70 Due from other governments 1,164 540 - - Inventories - - - - Prepayments 2 - - - Other current assets - 20 - - Advances to other funds - 130 - -
TOTAL ASSETS 7,860 17,034 6,421 158
DEFERRED OUTFLOWS OF RESOURCESTOTAL DEFERRED OUTFLOWS OF RESOURCES - - - - TOTAL ASSETS AND DEFERRED OUTFLOWSOF RESOURCES $ 7,860 $ 17,034 $ 6,421 $ 158
LIABILITIESAccounts payable $ 603 $ 1,160 $ 8 $ 25 Due to other funds 42 16 - 1 Due to other governments - - - - Accrued wages 6 2 - 7 Accrued taxes - - - - Customer deposits - - - - Advances from other funds - - - -
TOTAL LIABILITIES 651 1,178 8 33
DEFERRED INFLOWS OF RESOURCESUnavailable revenues - 213 - -
TOTAL DEFERRED INFLOWS OF RESOURCES - 213 - -
FUND BALANCES (DEFICITS)Nonspendable - - 17 - Restricted 7,016 14,732 4,629 125 Committed - - - - Assigned 193 911 1,767 - Unassigned - - - -
TOTAL FUND BALANCES (DEFICITS) 7,209 15,643 6,413 125
TOTAL LIABILITIES, DEFERRED INFLOWS OF RESOURCES AND FUND BALANCES(DEFICITS) $ 7,860 $ 17,034 $ 6,421 $ 158
SPECIAL REVENUE FUNDS
COMBINING BALANCE SHEETGOVERNMENTAL FUNDS
December 31, 2014(amounts expressed in thousands)
Page 4 of 9
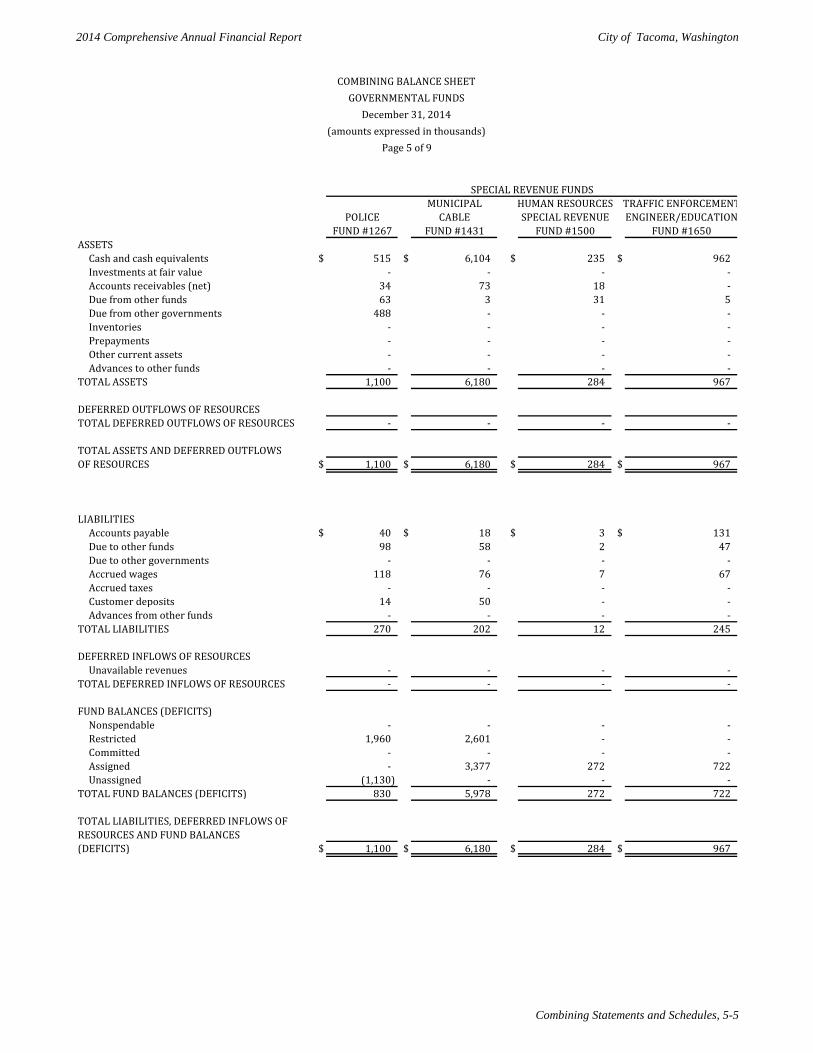
2014 Comprehensive Annual Financial Report City of Tacoma, Washington
Combining Statements and Schedules, 5-5
MUNICIPAL HUMAN RESOURCES TRAFFIC ENFORCEMENTPOLICE CABLE SPECIAL REVENUE ENGINEER/EDUCATION
FUND #1267 FUND #1431 FUND #1500 FUND #1650ASSETS
Cash and cash equivalents $ 515 $ 6,104 $ 235 $ 962 Investments at fair value - - - - Accounts receivables (net) 34 73 18 - Due from other funds 63 3 31 5 Due from other governments 488 - - - Inventories - - - - Prepayments - - - - Other current assets - - - - Advances to other funds - - - -
TOTAL ASSETS 1,100 6,180 284 967
DEFERRED OUTFLOWS OF RESOURCESTOTAL DEFERRED OUTFLOWS OF RESOURCES - - - - TOTAL ASSETS AND DEFERRED OUTFLOWSOF RESOURCES $ 1,100 $ 6,180 $ 284 $ 967
LIABILITIESAccounts payable $ 40 $ 18 $ 3 $ 131 Due to other funds 98 58 2 47 Due to other governments - - - - Accrued wages 118 76 7 67 Accrued taxes - - - - Customer deposits 14 50 - - Advances from other funds - - - -
TOTAL LIABILITIES 270 202 12 245
DEFERRED INFLOWS OF RESOURCESUnavailable revenues - - - -
TOTAL DEFERRED INFLOWS OF RESOURCES - - - -
FUND BALANCES (DEFICITS)Nonspendable - - - - Restricted 1,960 2,601 - - Committed - - - - Assigned - 3,377 272 722 Unassigned (1,130) - - -
TOTAL FUND BALANCES (DEFICITS) 830 5,978 272 722
TOTAL LIABILITIES, DEFERRED INFLOWS OF RESOURCES AND FUND BALANCES(DEFICITS) $ 1,100 $ 6,180 $ 284 $ 967
SPECIAL REVENUE FUNDS
COMBINING BALANCE SHEETGOVERNMENTAL FUNDS
December 31, 2014(amounts expressed in thousands)
Page 5 of 9
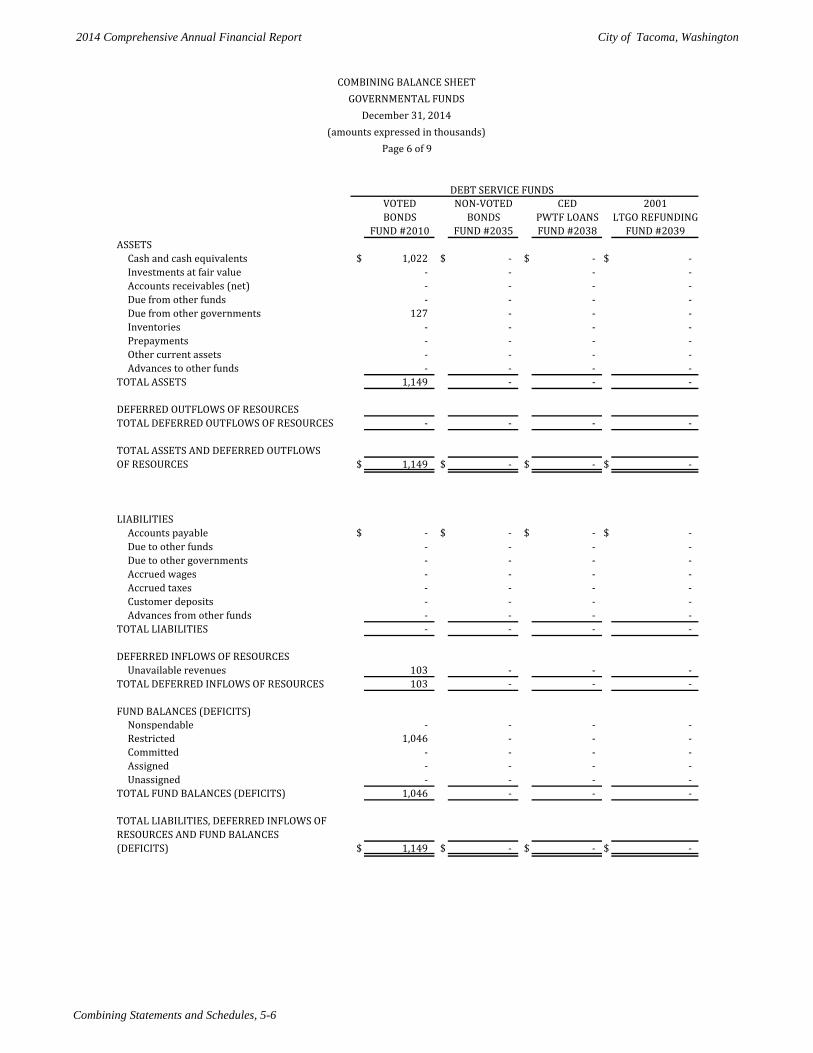
2014 Comprehensive Annual Financial Report City of Tacoma, Washington
Combining Statements and Schedules, 5-6
DEBT SERVICE FUNDSVOTED NON-VOTED CED 2001BONDS BONDS PWTF LOANS LTGO REFUNDING
FUND #2010 FUND #2035 FUND #2038 FUND #2039ASSETS
Cash and cash equivalents $ 1,022 $ - $ - $ - Investments at fair value - - - - Accounts receivables (net) - - - - Due from other funds - - - - Due from other governments 127 - - - Inventories - - - - Prepayments - - - - Other current assets - - - - Advances to other funds - - - -
TOTAL ASSETS 1,149 - - -
DEFERRED OUTFLOWS OF RESOURCESTOTAL DEFERRED OUTFLOWS OF RESOURCES - - - - TOTAL ASSETS AND DEFERRED OUTFLOWSOF RESOURCES $ 1,149 $ - $ - $ -
LIABILITIESAccounts payable $ - $ - $ - $ - Due to other funds - - - - Due to other governments - - - - Accrued wages - - - - Accrued taxes - - - - Customer deposits - - - - Advances from other funds - - - -
TOTAL LIABILITIES - - - -
DEFERRED INFLOWS OF RESOURCESUnavailable revenues 103 - - -
TOTAL DEFERRED INFLOWS OF RESOURCES 103 - - -
FUND BALANCES (DEFICITS)Nonspendable - - - - Restricted 1,046 - - - Committed - - - - Assigned - - - - Unassigned - - - -
TOTAL FUND BALANCES (DEFICITS) 1,046 - - -
TOTAL LIABILITIES, DEFERRED INFLOWS OF RESOURCES AND FUND BALANCES(DEFICITS) $ 1,149 $ - $ - $ -
COMBINING BALANCE SHEETGOVERNMENTAL FUNDS
December 31, 2014(amounts expressed in thousands)
Page 6 of 9
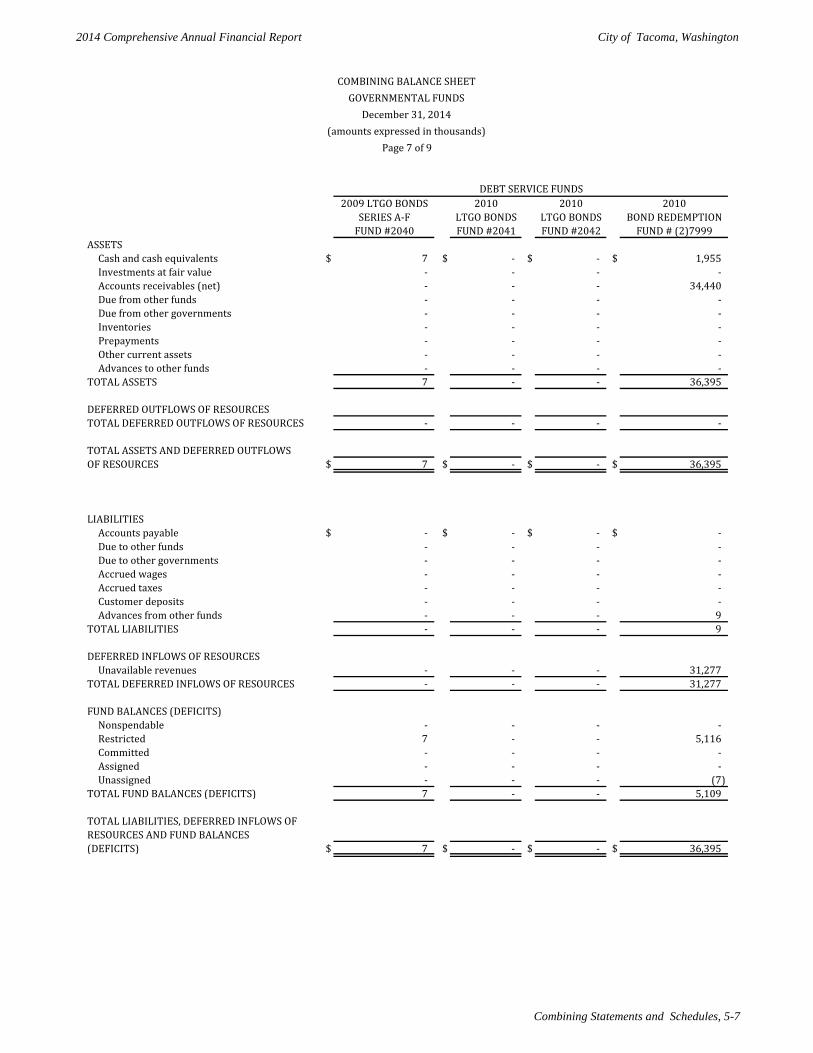
2014 Comprehensive Annual Financial Report City of Tacoma, Washington
Combining Statements and Schedules, 5-7
2009 LTGO BONDS 2010 2010 2010SERIES A-F LTGO BONDS LTGO BONDS BOND REDEMPTION
FUND #2040 FUND #2041 FUND #2042 FUND # (2)7999ASSETS
Cash and cash equivalents $ 7 $ - $ - $ 1,955 Investments at fair value - - - - Accounts receivables (net) - - - 34,440 Due from other funds - - - - Due from other governments - - - - Inventories - - - - Prepayments - - - - Other current assets - - - - Advances to other funds - - - -
TOTAL ASSETS 7 - - 36,395
DEFERRED OUTFLOWS OF RESOURCESTOTAL DEFERRED OUTFLOWS OF RESOURCES - - - - TOTAL ASSETS AND DEFERRED OUTFLOWSOF RESOURCES $ 7 $ - $ - $ 36,395
LIABILITIESAccounts payable $ - $ - $ - $ - Due to other funds - - - - Due to other governments - - - - Accrued wages - - - - Accrued taxes - - - - Customer deposits - - - - Advances from other funds - - - 9
TOTAL LIABILITIES - - - 9
DEFERRED INFLOWS OF RESOURCESUnavailable revenues - - - 31,277
TOTAL DEFERRED INFLOWS OF RESOURCES - - - 31,277
FUND BALANCES (DEFICITS)Nonspendable - - - - Restricted 7 - - 5,116 Committed - - - - Assigned - - - - Unassigned - - - (7)
TOTAL FUND BALANCES (DEFICITS) 7 - - 5,109
TOTAL LIABILITIES, DEFERRED INFLOWS OF RESOURCES AND FUND BALANCES(DEFICITS) $ 7 $ - $ - $ 36,395
DEBT SERVICE FUNDS
COMBINING BALANCE SHEETGOVERNMENTAL FUNDS
December 31, 2014(amounts expressed in thousands)
Page 7 of 9
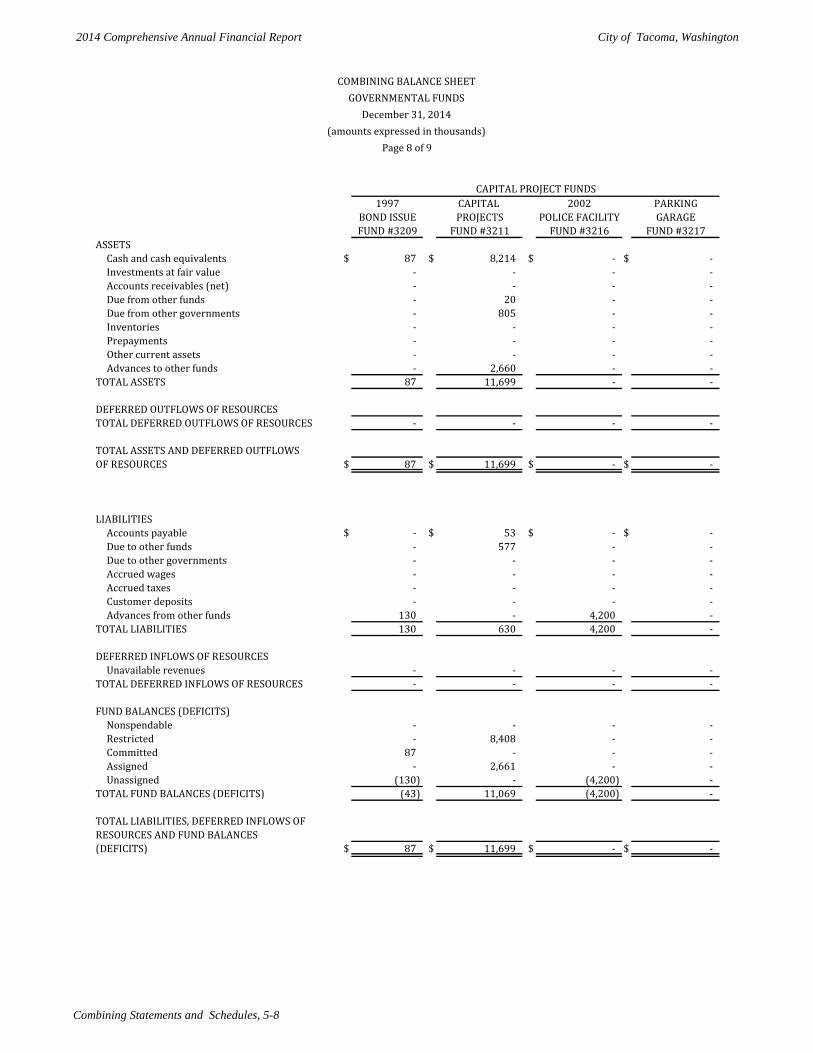
2014 Comprehensive Annual Financial Report City of Tacoma, Washington
Combining Statements and Schedules, 5-8
1997 CAPITAL 2002 PARKINGBOND ISSUE PROJECTS POLICE FACILITY GARAGEFUND #3209 FUND #3211 FUND #3216 FUND #3217
ASSETSCash and cash equivalents $ 87 $ 8,214 $ - $ - Investments at fair value - - - - Accounts receivables (net) - - - - Due from other funds - 20 - - Due from other governments - 805 - - Inventories - - - - Prepayments - - - - Other current assets - - - - Advances to other funds - 2,660 - -
TOTAL ASSETS 87 11,699 - -
DEFERRED OUTFLOWS OF RESOURCESTOTAL DEFERRED OUTFLOWS OF RESOURCES - - - - TOTAL ASSETS AND DEFERRED OUTFLOWSOF RESOURCES $ 87 $ 11,699 $ - $ -
LIABILITIESAccounts payable $ - $ 53 $ - $ - Due to other funds - 577 - - Due to other governments - - - - Accrued wages - - - - Accrued taxes - - - - Customer deposits - - - - Advances from other funds 130 - 4,200 -
TOTAL LIABILITIES 130 630 4,200 -
DEFERRED INFLOWS OF RESOURCESUnavailable revenues - - - -
TOTAL DEFERRED INFLOWS OF RESOURCES - - - -
FUND BALANCES (DEFICITS)Nonspendable - - - - Restricted - 8,408 - - Committed 87 - - - Assigned - 2,661 - - Unassigned (130) - (4,200) -
TOTAL FUND BALANCES (DEFICITS) (43) 11,069 (4,200) -
TOTAL LIABILITIES, DEFERRED INFLOWS OF RESOURCES AND FUND BALANCES(DEFICITS) $ 87 $ 11,699 $ - $ -
CAPITAL PROJECT FUNDS
COMBINING BALANCE SHEETGOVERNMENTAL FUNDS
December 31, 2014(amounts expressed in thousands)
Page 8 of 9
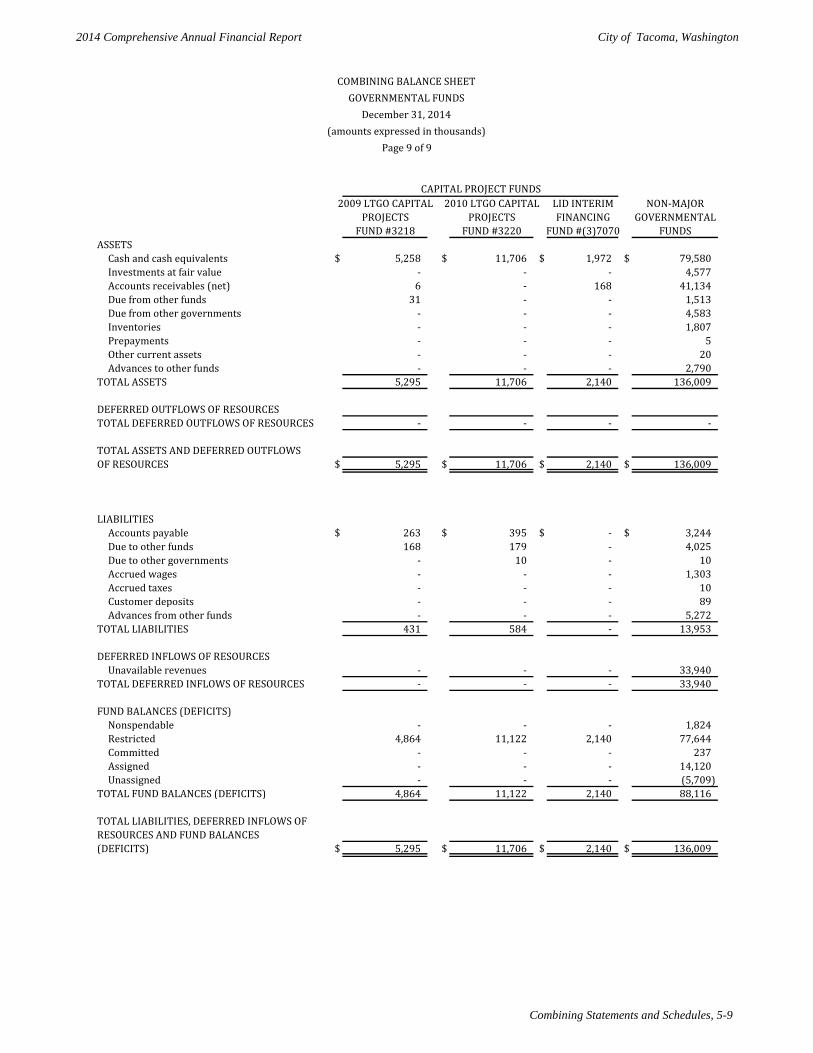
2014 Comprehensive Annual Financial Report City of Tacoma, Washington
Combining Statements and Schedules, 5-9
2009 LTGO CAPITAL 2010 LTGO CAPITAL LID INTERIM NON-MAJORPROJECTS PROJECTS FINANCING GOVERNMENTAL
FUND #3218 FUND #3220 FUND #(3)7070 FUNDSASSETS
Cash and cash equivalents $ 5,258 $ 11,706 $ 1,972 $ 79,580 Investments at fair value - - - 4,577 Accounts receivables (net) 6 - 168 41,134 Due from other funds 31 - - 1,513 Due from other governments - - - 4,583 Inventories - - - 1,807 Prepayments - - - 5 Other current assets - - - 20 Advances to other funds - - - 2,790
TOTAL ASSETS 5,295 11,706 2,140 136,009
DEFERRED OUTFLOWS OF RESOURCESTOTAL DEFERRED OUTFLOWS OF RESOURCES - - - - TOTAL ASSETS AND DEFERRED OUTFLOWSOF RESOURCES $ 5,295 $ 11,706 $ 2,140 $ 136,009
LIABILITIESAccounts payable $ 263 $ 395 $ - $ 3,244 Due to other funds 168 179 - 4,025 Due to other governments - 10 - 10 Accrued wages - - - 1,303 Accrued taxes - - - 10 Customer deposits - - - 89 Advances from other funds - - - 5,272
TOTAL LIABILITIES 431 584 - 13,953
DEFERRED INFLOWS OF RESOURCESUnavailable revenues - - - 33,940
TOTAL DEFERRED INFLOWS OF RESOURCES - - - 33,940
FUND BALANCES (DEFICITS)Nonspendable - - - 1,824 Restricted 4,864 11,122 2,140 77,644 Committed - - - 237 Assigned - - - 14,120 Unassigned - - - (5,709)
TOTAL FUND BALANCES (DEFICITS) 4,864 11,122 2,140 88,116
TOTAL LIABILITIES, DEFERRED INFLOWS OF RESOURCES AND FUND BALANCES(DEFICITS) $ 5,295 $ 11,706 $ 2,140 $ 136,009
CAPITAL PROJECT FUNDS
COMBINING BALANCE SHEETGOVERNMENTAL FUNDS
December 31, 2014(amounts expressed in thousands)
Page 9 of 9
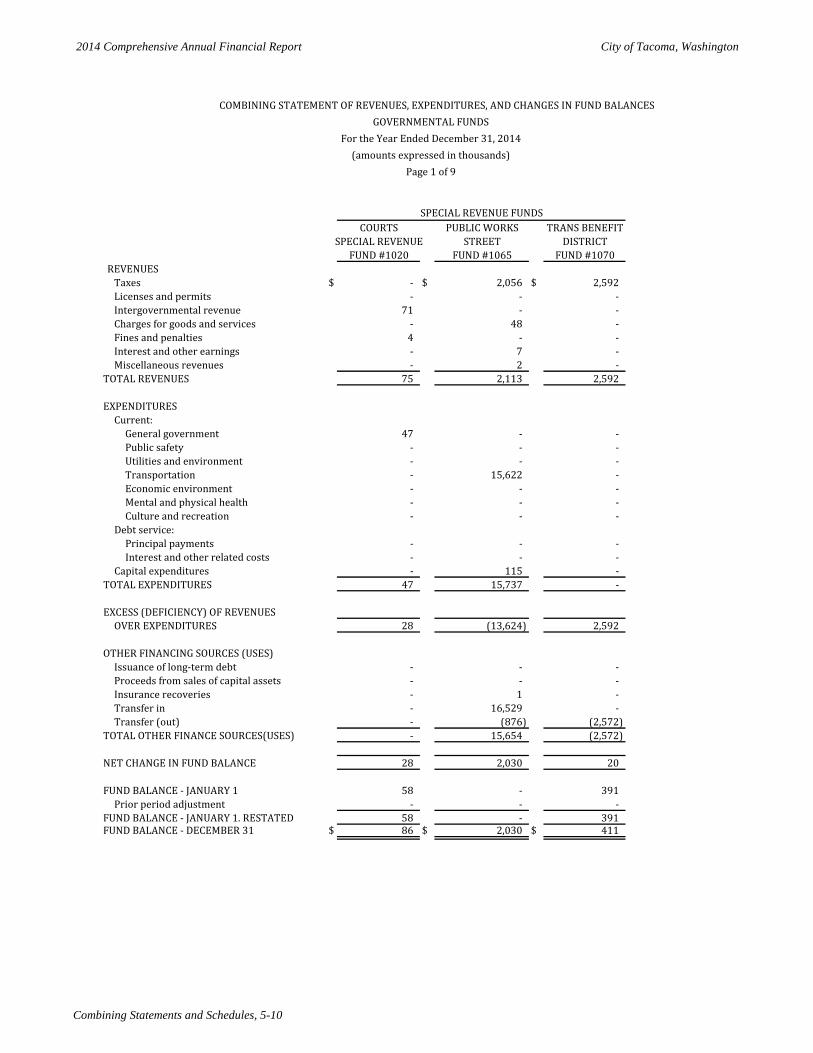
2014 Comprehensive Annual Financial Report City of Tacoma, Washington
Combining Statements and Schedules, 5-10
COURTS PUBLIC WORKS TRANS BENEFITSPECIAL REVENUE STREET DISTRICT
FUND #1020 FUND #1065 FUND #1070REVENUES
Taxes $ - $ 2,056 $ 2,592 Licenses and permits - - - Intergovernmental revenue 71 - - Charges for goods and services - 48 - Fines and penalties 4 - - Interest and other earnings - 7 - Miscellaneous revenues - 2 -
TOTAL REVENUES 75 2,113 2,592
EXPENDITURESCurrent:
General government 47 - - Public safety - - - Utilities and environment - - - Transportation - 15,622 - Economic environment - - - Mental and physical health - - - Culture and recreation - - -
Debt service:Principal payments - - - Interest and other related costs - - -
Capital expenditures - 115 - TOTAL EXPENDITURES 47 15,737 -
EXCESS (DEFICIENCY) OF REVENUESOVER EXPENDITURES 28 (13,624) 2,592
OTHER FINANCING SOURCES (USES)Issuance of long-term debt - - - Proceeds from sales of capital assets - - - Insurance recoveries - 1 - Transfer in - 16,529 - Transfer (out) - (876) (2,572)
TOTAL OTHER FINANCE SOURCES(USES) - 15,654 (2,572)
NET CHANGE IN FUND BALANCE 28 2,030 20
FUND BALANCE - JANUARY 1 58 - 391 Prior period adjustment - - -
FUND BALANCE - JANUARY 1. RESTATED 58 - 391 FUND BALANCE - DECEMBER 31 $ 86 $ 2,030 $ 411
SPECIAL REVENUE FUNDS
COMBINING STATEMENT OF REVENUES, EXPENDITURES, AND CHANGES IN FUND BALANCESGOVERNMENTAL FUNDS
For the Year Ended December 31, 2014(amounts expressed in thousands)
Page 1 of 9
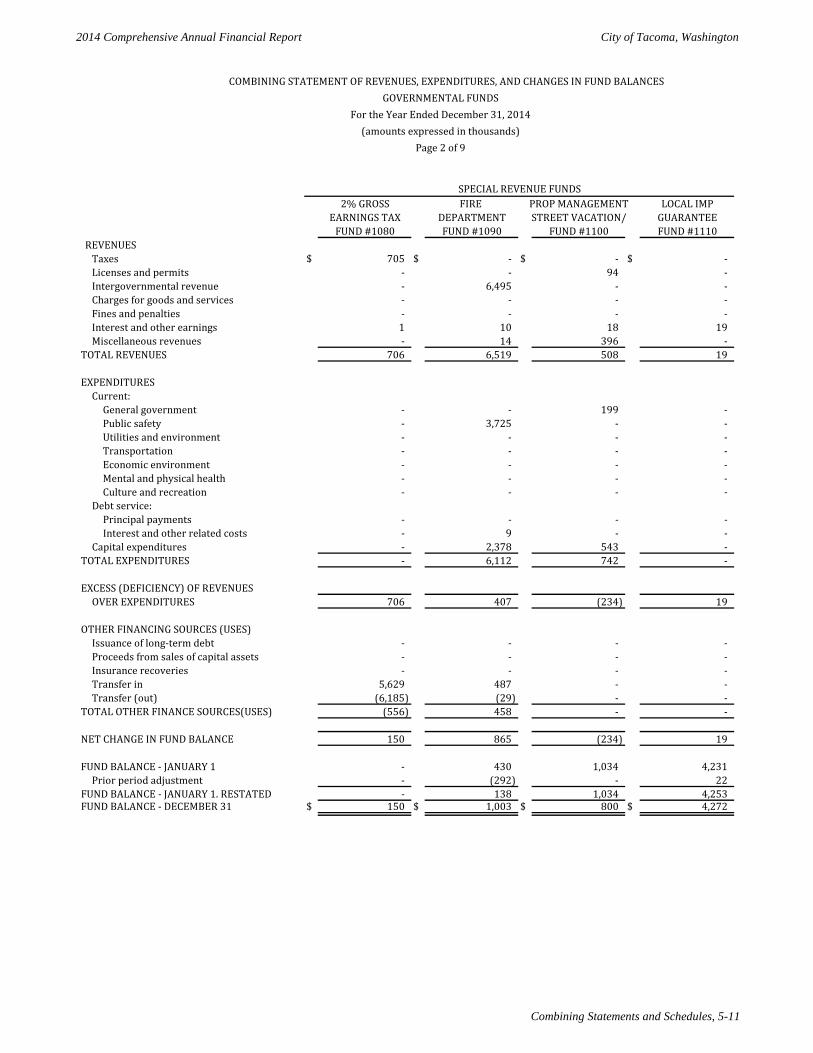
2014 Comprehensive Annual Financial Report City of Tacoma, Washington
Combining Statements and Schedules, 5-11
2% GROSS FIRE PROP MANAGEMENT LOCAL IMPEARNINGS TAX DEPARTMENT STREET VACATION/ GUARANTEE
FUND #1080 FUND #1090 FUND #1100 FUND #1110REVENUES
Taxes $ 705 $ - $ - $ - Licenses and permits - - 94 - Intergovernmental revenue - 6,495 - - Charges for goods and services - - - - Fines and penalties - - - - Interest and other earnings 1 10 18 19 Miscellaneous revenues - 14 396 -
TOTAL REVENUES 706 6,519 508 19
EXPENDITURESCurrent:
General government - - 199 - Public safety - 3,725 - - Utilities and environment - - - - Transportation - - - - Economic environment - - - - Mental and physical health - - - - Culture and recreation - - - -
Debt service:Principal payments - - - - Interest and other related costs - 9 - -
Capital expenditures - 2,378 543 - TOTAL EXPENDITURES - 6,112 742 -
EXCESS (DEFICIENCY) OF REVENUESOVER EXPENDITURES 706 407 (234) 19
OTHER FINANCING SOURCES (USES)Issuance of long-term debt - - - - Proceeds from sales of capital assets - - - - Insurance recoveries - - - - Transfer in 5,629 487 - - Transfer (out) (6,185) (29) - -
TOTAL OTHER FINANCE SOURCES(USES) (556) 458 - -
NET CHANGE IN FUND BALANCE 150 865 (234) 19
FUND BALANCE - JANUARY 1 - 430 1,034 4,231 Prior period adjustment - (292) - 22
FUND BALANCE - JANUARY 1. RESTATED - 138 1,034 4,253 FUND BALANCE - DECEMBER 31 $ 150 $ 1,003 $ 800 $ 4,272
SPECIAL REVENUE FUNDS
COMBINING STATEMENT OF REVENUES, EXPENDITURES, AND CHANGES IN FUND BALANCESGOVERNMENTAL FUNDS
For the Year Ended December 31, 2014(amounts expressed in thousands)
Page 2 of 9
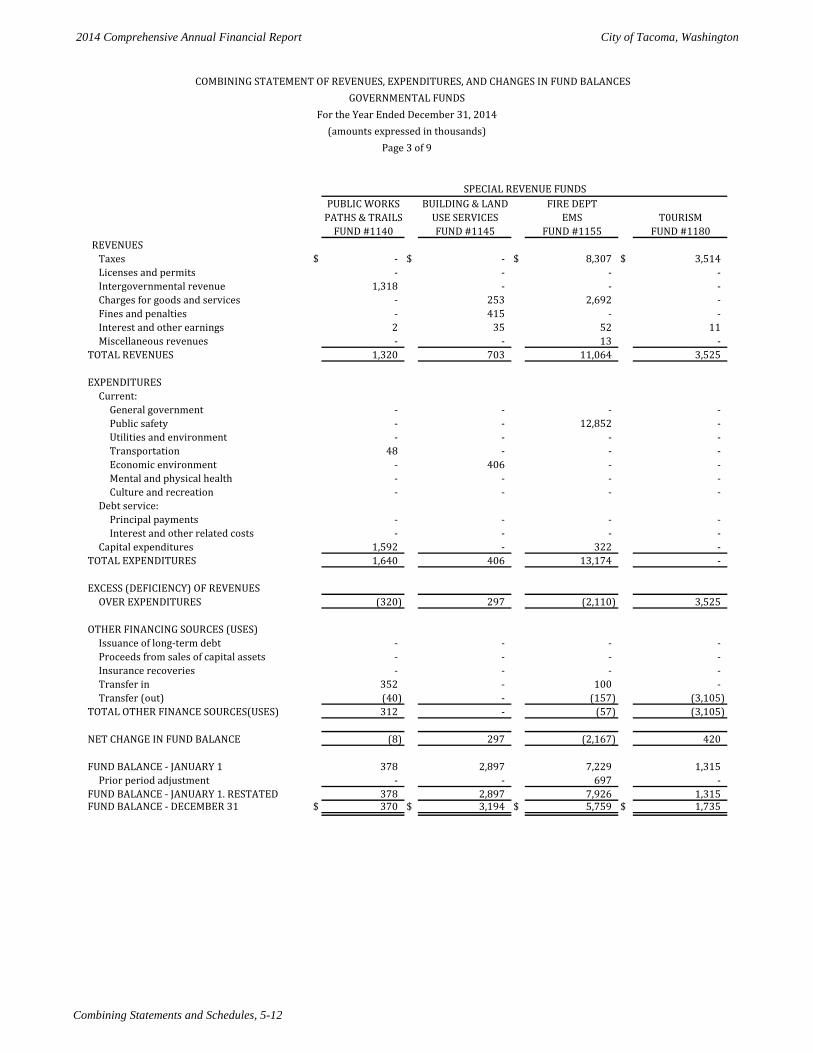
2014 Comprehensive Annual Financial Report City of Tacoma, Washington
Combining Statements and Schedules, 5-12
PUBLIC WORKS BUILDING & LAND FIRE DEPTPATHS & TRAILS USE SERVICES EMS T0URISM
FUND #1140 FUND #1145 FUND #1155 FUND #1180REVENUES
Taxes $ - $ - $ 8,307 $ 3,514 Licenses and permits - - - - Intergovernmental revenue 1,318 - - - Charges for goods and services - 253 2,692 - Fines and penalties - 415 - - Interest and other earnings 2 35 52 11 Miscellaneous revenues - - 13 -
TOTAL REVENUES 1,320 703 11,064 3,525
EXPENDITURESCurrent:
General government - - - - Public safety - - 12,852 - Utilities and environment - - - - Transportation 48 - - - Economic environment - 406 - - Mental and physical health - - - - Culture and recreation - - - -
Debt service:Principal payments - - - - Interest and other related costs - - - -
Capital expenditures 1,592 - 322 - TOTAL EXPENDITURES 1,640 406 13,174 -
EXCESS (DEFICIENCY) OF REVENUESOVER EXPENDITURES (320) 297 (2,110) 3,525
OTHER FINANCING SOURCES (USES)Issuance of long-term debt - - - - Proceeds from sales of capital assets - - - - Insurance recoveries - - - - Transfer in 352 - 100 - Transfer (out) (40) - (157) (3,105)
TOTAL OTHER FINANCE SOURCES(USES) 312 - (57) (3,105)
NET CHANGE IN FUND BALANCE (8) 297 (2,167) 420
FUND BALANCE - JANUARY 1 378 2,897 7,229 1,315 Prior period adjustment - - 697 -
FUND BALANCE - JANUARY 1. RESTATED 378 2,897 7,926 1,315 FUND BALANCE - DECEMBER 31 $ 370 $ 3,194 $ 5,759 $ 1,735
SPECIAL REVENUE FUNDS
Page 3 of 9
COMBINING STATEMENT OF REVENUES, EXPENDITURES, AND CHANGES IN FUND BALANCESGOVERNMENTAL FUNDS
For the Year Ended December 31, 2014(amounts expressed in thousands)
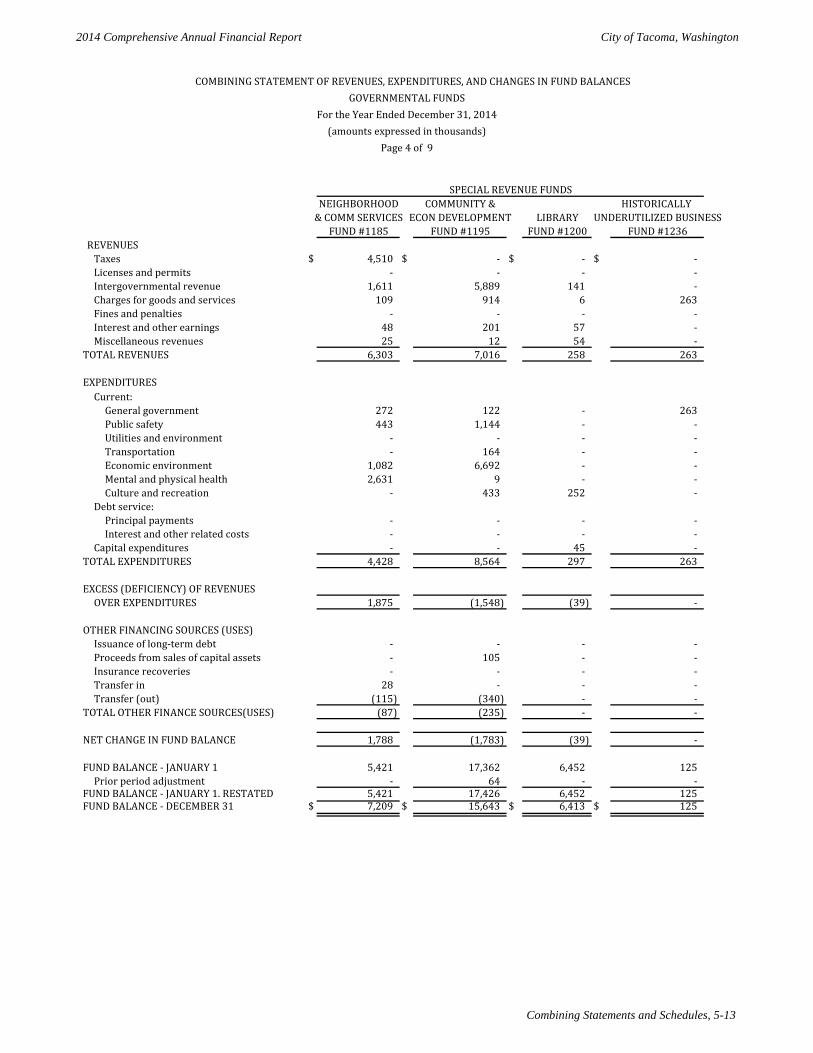
2014 Comprehensive Annual Financial Report City of Tacoma, Washington
Combining Statements and Schedules, 5-13
NEIGHBORHOOD COMMUNITY & HISTORICALLY & COMM SERVICES ECON DEVELOPMENT LIBRARY UNDERUTILIZED BUSINESS
FUND #1185 FUND #1195 FUND #1200 FUND #1236REVENUES
Taxes $ 4,510 $ - $ - $ - Licenses and permits - - - - Intergovernmental revenue 1,611 5,889 141 - Charges for goods and services 109 914 6 263 Fines and penalties - - - - Interest and other earnings 48 201 57 - Miscellaneous revenues 25 12 54 -
TOTAL REVENUES 6,303 7,016 258 263
EXPENDITURESCurrent:
General government 272 122 - 263 Public safety 443 1,144 - - Utilities and environment - - - - Transportation - 164 - - Economic environment 1,082 6,692 - - Mental and physical health 2,631 9 - - Culture and recreation - 433 252 -
Debt service:Principal payments - - - - Interest and other related costs - - - -
Capital expenditures - - 45 - TOTAL EXPENDITURES 4,428 8,564 297 263
EXCESS (DEFICIENCY) OF REVENUESOVER EXPENDITURES 1,875 (1,548) (39) -
OTHER FINANCING SOURCES (USES)Issuance of long-term debt - - - - Proceeds from sales of capital assets - 105 - - Insurance recoveries - - - - Transfer in 28 - - - Transfer (out) (115) (340) - -
TOTAL OTHER FINANCE SOURCES(USES) (87) (235) - -
NET CHANGE IN FUND BALANCE 1,788 (1,783) (39) -
FUND BALANCE - JANUARY 1 5,421 17,362 6,452 125 Prior period adjustment - 64 - -
FUND BALANCE - JANUARY 1. RESTATED 5,421 17,426 6,452 125 FUND BALANCE - DECEMBER 31 $ 7,209 $ 15,643 $ 6,413 $ 125
SPECIAL REVENUE FUNDS
COMBINING STATEMENT OF REVENUES, EXPENDITURES, AND CHANGES IN FUND BALANCESGOVERNMENTAL FUNDS
For the Year Ended December 31, 2014(amounts expressed in thousands)
Page 4 of 9
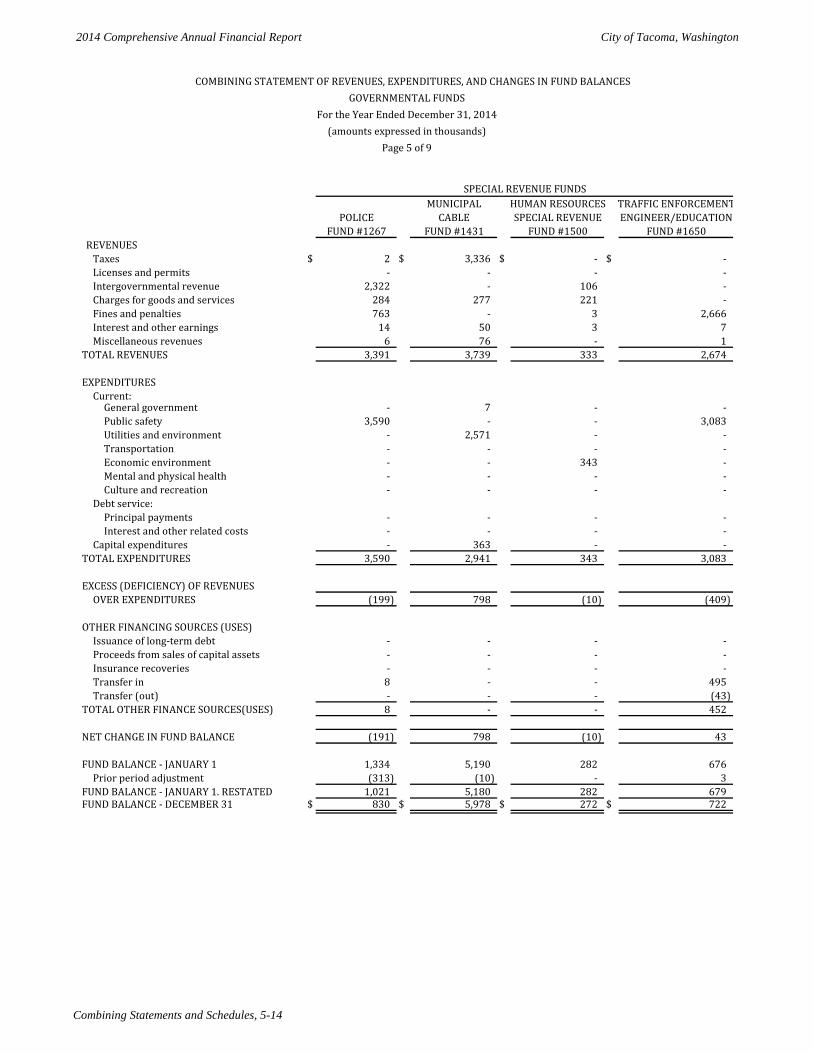
2014 Comprehensive Annual Financial Report City of Tacoma, Washington
Combining Statements and Schedules, 5-14
MUNICIPAL HUMAN RESOURCES TRAFFIC ENFORCEMENTPOLICE CABLE SPECIAL REVENUE ENGINEER/EDUCATION
FUND #1267 FUND #1431 FUND #1500 FUND #1650REVENUES
Taxes $ 2 $ 3,336 $ - $ - Licenses and permits - - - - Intergovernmental revenue 2,322 - 106 - Charges for goods and services 284 277 221 - Fines and penalties 763 - 3 2,666 Interest and other earnings 14 50 3 7 Miscellaneous revenues 6 76 - 1
TOTAL REVENUES 3,391 3,739 333 2,674
EXPENDITURESCurrent:
General government - 7 - - Public safety 3,590 - - 3,083 Utilities and environment - 2,571 - - Transportation - - - - Economic environment - - 343 - Mental and physical health - - - - Culture and recreation - - - -
Debt service:Principal payments - - - - Interest and other related costs - - - -
Capital expenditures - 363 - - TOTAL EXPENDITURES 3,590 2,941 343 3,083
EXCESS (DEFICIENCY) OF REVENUESOVER EXPENDITURES (199) 798 (10) (409)
OTHER FINANCING SOURCES (USES)Issuance of long-term debt - - - - Proceeds from sales of capital assets - - - - Insurance recoveries - - - - Transfer in 8 - - 495 Transfer (out) - - - (43)
TOTAL OTHER FINANCE SOURCES(USES) 8 - - 452
NET CHANGE IN FUND BALANCE (191) 798 (10) 43
FUND BALANCE - JANUARY 1 1,334 5,190 282 676 Prior period adjustment (313) (10) - 3
FUND BALANCE - JANUARY 1. RESTATED 1,021 5,180 282 679 FUND BALANCE - DECEMBER 31 $ 830 $ 5,978 $ 272 $ 722
SPECIAL REVENUE FUNDS
Page 5 of 9
COMBINING STATEMENT OF REVENUES, EXPENDITURES, AND CHANGES IN FUND BALANCESGOVERNMENTAL FUNDS
For the Year Ended December 31, 2014(amounts expressed in thousands)
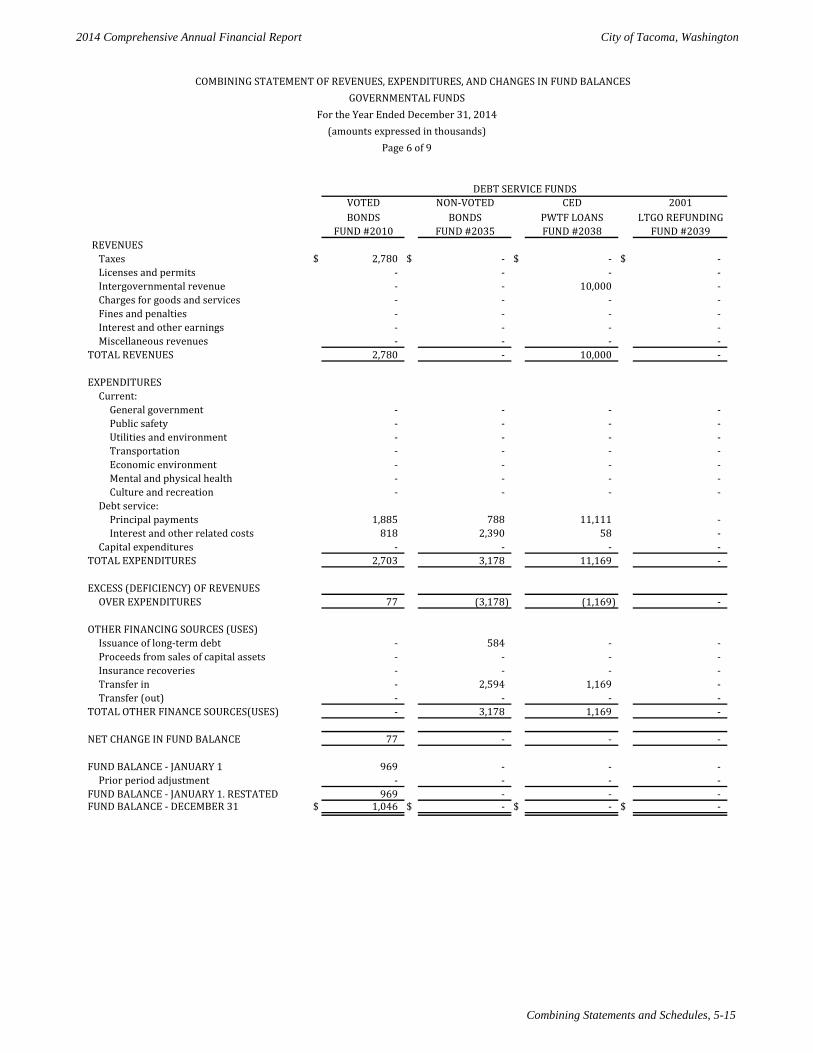
2014 Comprehensive Annual Financial Report City of Tacoma, Washington
Combining Statements and Schedules, 5-15
VOTED NON-VOTED CED 2001BONDS BONDS PWTF LOANS LTGO REFUNDING
FUND #2010 FUND #2035 FUND #2038 FUND #2039REVENUES
Taxes $ 2,780 $ - $ - $ - Licenses and permits - - - - Intergovernmental revenue - - 10,000 - Charges for goods and services - - - - Fines and penalties - - - - Interest and other earnings - - - - Miscellaneous revenues - - - -
TOTAL REVENUES 2,780 - 10,000 -
EXPENDITURESCurrent:
General government - - - - Public safety - - - - Utilities and environment - - - - Transportation - - - - Economic environment - - - - Mental and physical health - - - - Culture and recreation - - - -
Debt service:Principal payments 1,885 788 11,111 - Interest and other related costs 818 2,390 58 -
Capital expenditures - - - - TOTAL EXPENDITURES 2,703 3,178 11,169 -
EXCESS (DEFICIENCY) OF REVENUESOVER EXPENDITURES 77 (3,178) (1,169) -
OTHER FINANCING SOURCES (USES)Issuance of long-term debt - 584 - - Proceeds from sales of capital assets - - - - Insurance recoveries - - - - Transfer in - 2,594 1,169 - Transfer (out) - - - -
TOTAL OTHER FINANCE SOURCES(USES) - 3,178 1,169 -
NET CHANGE IN FUND BALANCE 77 - - -
FUND BALANCE - JANUARY 1 969 - - - Prior period adjustment - - - -
FUND BALANCE - JANUARY 1. RESTATED 969 - - - FUND BALANCE - DECEMBER 31 $ 1,046 $ - $ - $ -
DEBT SERVICE FUNDS
COMBINING STATEMENT OF REVENUES, EXPENDITURES, AND CHANGES IN FUND BALANCESGOVERNMENTAL FUNDS
For the Year Ended December 31, 2014(amounts expressed in thousands)
Page 6 of 9
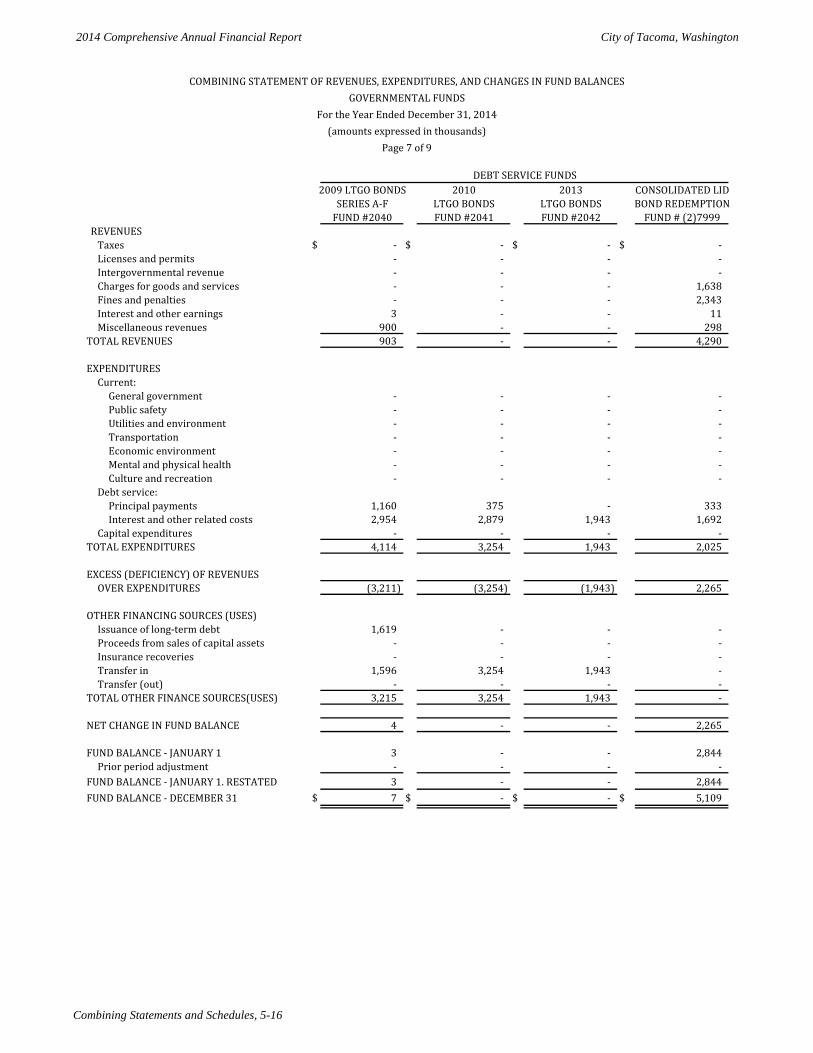
2014 Comprehensive Annual Financial Report City of Tacoma, Washington
Combining Statements and Schedules, 5-16
2009 LTGO BONDS 2010 2013 CONSOLIDATED LIDSERIES A-F LTGO BONDS LTGO BONDS BOND REDEMPTION
FUND #2040 FUND #2041 FUND #2042 FUND # (2)7999REVENUES
Taxes $ - $ - $ - $ - Licenses and permits - - - - Intergovernmental revenue - - - - Charges for goods and services - - - 1,638 Fines and penalties - - - 2,343 Interest and other earnings 3 - - 11 Miscellaneous revenues 900 - - 298
TOTAL REVENUES 903 - - 4,290
EXPENDITURESCurrent:
General government - - - - Public safety - - - - Utilities and environment - - - - Transportation - - - - Economic environment - - - - Mental and physical health - - - - Culture and recreation - - - -
Debt service:Principal payments 1,160 375 - 333 Interest and other related costs 2,954 2,879 1,943 1,692
Capital expenditures - - - - TOTAL EXPENDITURES 4,114 3,254 1,943 2,025
EXCESS (DEFICIENCY) OF REVENUESOVER EXPENDITURES (3,211) (3,254) (1,943) 2,265
OTHER FINANCING SOURCES (USES)Issuance of long-term debt 1,619 - - - Proceeds from sales of capital assets - - - - Insurance recoveries - - - - Transfer in 1,596 3,254 1,943 - Transfer (out) - - - -
TOTAL OTHER FINANCE SOURCES(USES) 3,215 3,254 1,943 -
NET CHANGE IN FUND BALANCE 4 - - 2,265
FUND BALANCE - JANUARY 1 3 - - 2,844 Prior period adjustment - - - -
FUND BALANCE - JANUARY 1. RESTATED 3 - - 2,844 FUND BALANCE - DECEMBER 31 $ 7 $ - $ - $ 5,109
DEBT SERVICE FUNDS
Page 7 of 9
COMBINING STATEMENT OF REVENUES, EXPENDITURES, AND CHANGES IN FUND BALANCESGOVERNMENTAL FUNDS
For the Year Ended December 31, 2014(amounts expressed in thousands)
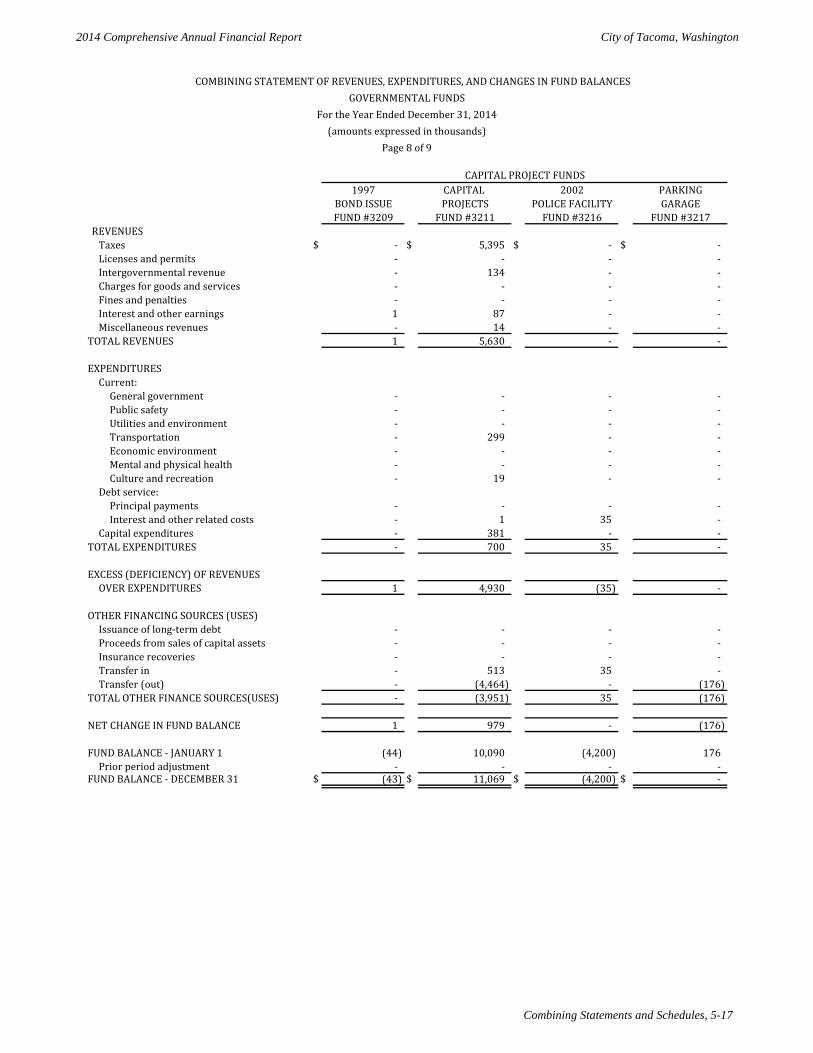
2014 Comprehensive Annual Financial Report City of Tacoma, Washington
Combining Statements and Schedules, 5-17
1997 CAPITAL 2002 PARKINGBOND ISSUE PROJECTS POLICE FACILITY GARAGEFUND #3209 FUND #3211 FUND #3216 FUND #3217
REVENUESTaxes $ - $ 5,395 $ - $ - Licenses and permits - - - - Intergovernmental revenue - 134 - - Charges for goods and services - - - - Fines and penalties - - - - Interest and other earnings 1 87 - - Miscellaneous revenues - 14 - -
TOTAL REVENUES 1 5,630 - -
EXPENDITURESCurrent:
General government - - - - Public safety - - - - Utilities and environment - - - - Transportation - 299 - - Economic environment - - - - Mental and physical health - - - - Culture and recreation - 19 - -
Debt service:Principal payments - - - - Interest and other related costs - 1 35 -
Capital expenditures - 381 - - TOTAL EXPENDITURES - 700 35 -
EXCESS (DEFICIENCY) OF REVENUESOVER EXPENDITURES 1 4,930 (35) -
OTHER FINANCING SOURCES (USES)Issuance of long-term debt - - - - Proceeds from sales of capital assets - - - - Insurance recoveries - - - - Transfer in - 513 35 - Transfer (out) - (4,464) - (176)
TOTAL OTHER FINANCE SOURCES(USES) - (3,951) 35 (176)
NET CHANGE IN FUND BALANCE 1 979 - (176)
FUND BALANCE - JANUARY 1 (44) 10,090 (4,200) 176 Prior period adjustment - - - -
FUND BALANCE - DECEMBER 31 $ (43) $ 11,069 $ (4,200) $ -
CAPITAL PROJECT FUNDS
Page 8 of 9
COMBINING STATEMENT OF REVENUES, EXPENDITURES, AND CHANGES IN FUND BALANCESGOVERNMENTAL FUNDS
For the Year Ended December 31, 2014(amounts expressed in thousands)
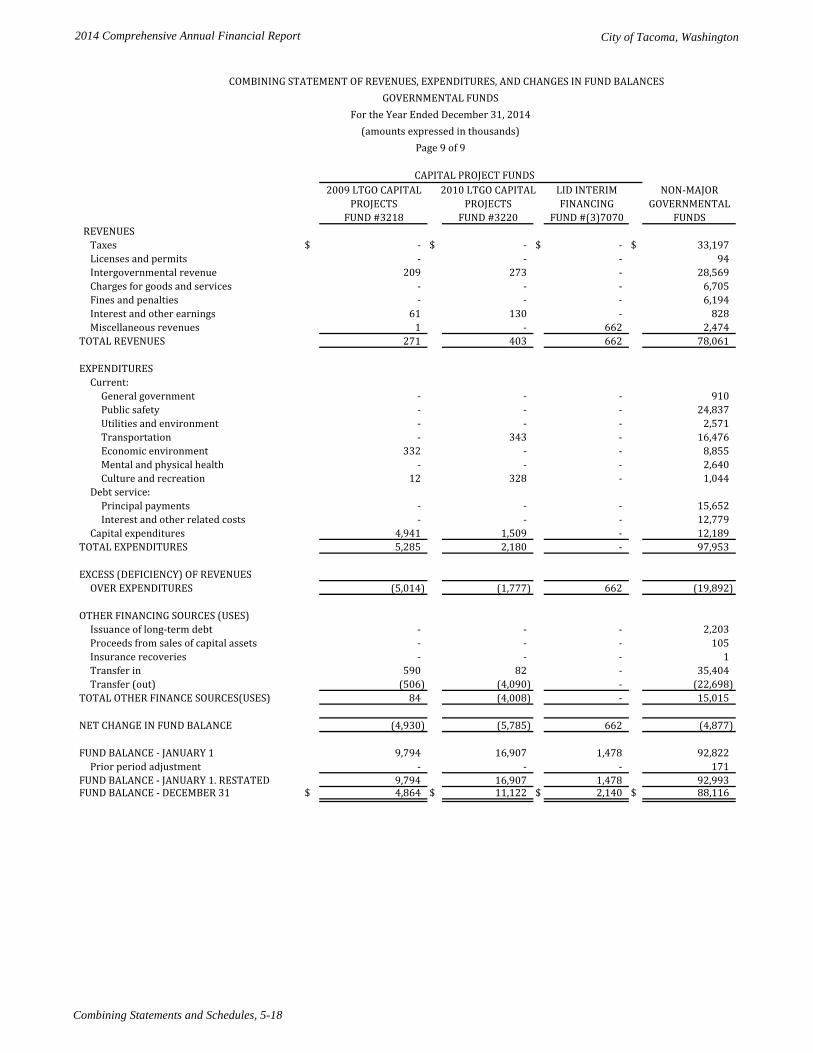
2014 Comprehensive Annual Financial Report City of Tacoma, Washington
Combining Statements and Schedules, 5-18
2009 LTGO CAPITAL 2010 LTGO CAPITAL LID INTERIM NON-MAJORPROJECTS PROJECTS FINANCING GOVERNMENTAL
FUND #3218 FUND #3220 FUND #(3)7070 FUNDSREVENUES
Taxes $ - $ - $ - $ 33,197 Licenses and permits - - - 94 Intergovernmental revenue 209 273 - 28,569 Charges for goods and services - - - 6,705 Fines and penalties - - - 6,194 Interest and other earnings 61 130 - 828 Miscellaneous revenues 1 - 662 2,474
TOTAL REVENUES 271 403 662 78,061
EXPENDITURESCurrent:
General government - - - 910 Public safety - - - 24,837 Utilities and environment - - - 2,571 Transportation - 343 - 16,476 Economic environment 332 - - 8,855 Mental and physical health - - - 2,640 Culture and recreation 12 328 - 1,044
Debt service:Principal payments - - - 15,652 Interest and other related costs - - - 12,779
Capital expenditures 4,941 1,509 - 12,189 TOTAL EXPENDITURES 5,285 2,180 - 97,953
EXCESS (DEFICIENCY) OF REVENUESOVER EXPENDITURES (5,014) (1,777) 662 (19,892)
OTHER FINANCING SOURCES (USES)Issuance of long-term debt - - - 2,203 Proceeds from sales of capital assets - - - 105 Insurance recoveries - - - 1 Transfer in 590 82 - 35,404 Transfer (out) (506) (4,090) - (22,698)
TOTAL OTHER FINANCE SOURCES(USES) 84 (4,008) - 15,015
NET CHANGE IN FUND BALANCE (4,930) (5,785) 662 (4,877)
FUND BALANCE - JANUARY 1 9,794 16,907 1,478 92,822 Prior period adjustment - - - 171
FUND BALANCE - JANUARY 1. RESTATED 9,794 16,907 1,478 92,993 FUND BALANCE - DECEMBER 31 $ 4,864 $ 11,122 $ 2,140 $ 88,116
CAPITAL PROJECT FUNDS
COMBINING STATEMENT OF REVENUES, EXPENDITURES, AND CHANGES IN FUND BALANCESGOVERNMENTAL FUNDS
For the Year Ended December 31, 2014(amounts expressed in thousands)
Page 9 of 9
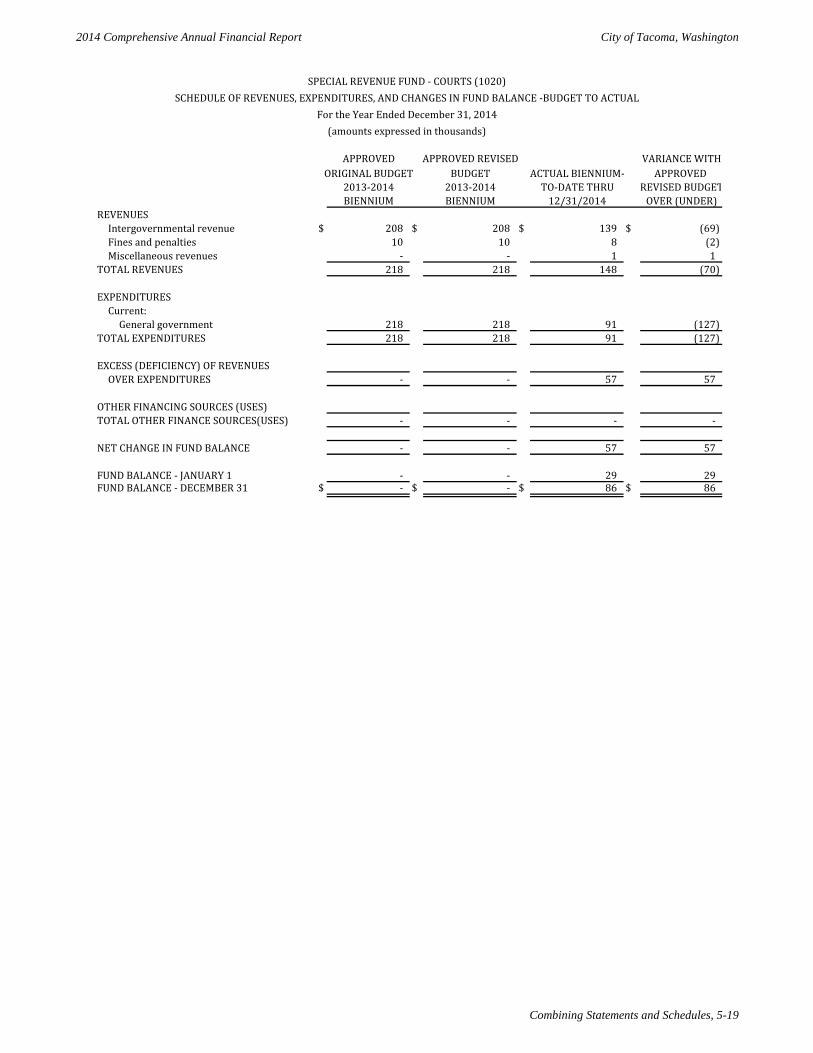
2014 Comprehensive Annual Financial Report City of Tacoma, Washington
Combining Statements and Schedules, 5-19
APPROVED APPROVED REVISED VARIANCE WITHORIGINAL BUDGET BUDGET ACTUAL BIENNIUM- APPROVED
2013-2014 2013-2014 TO-DATE THRU REVISED BUDGET BIENNIUM BIENNIUM 12/31/2014 OVER (UNDER)
REVENUESIntergovernmental revenue $ 208 $ 208 $ 139 $ (69) Fines and penalties 10 10 8 (2) Miscellaneous revenues - - 1 1
TOTAL REVENUES 218 218 148 (70)
EXPENDITURESCurrent:
General government 218 218 91 (127) TOTAL EXPENDITURES 218 218 91 (127)
EXCESS (DEFICIENCY) OF REVENUESOVER EXPENDITURES - - 57 57
OTHER FINANCING SOURCES (USES)TOTAL OTHER FINANCE SOURCES(USES) - - - -
NET CHANGE IN FUND BALANCE - - 57 57
FUND BALANCE - JANUARY 1 - - 29 29 FUND BALANCE - DECEMBER 31 $ - $ - $ 86 $ 86
SPECIAL REVENUE FUND - COURTS (1020)SCHEDULE OF REVENUES, EXPENDITURES, AND CHANGES IN FUND BALANCE -BUDGET TO ACTUAL
For the Year Ended December 31, 2014(amounts expressed in thousands)
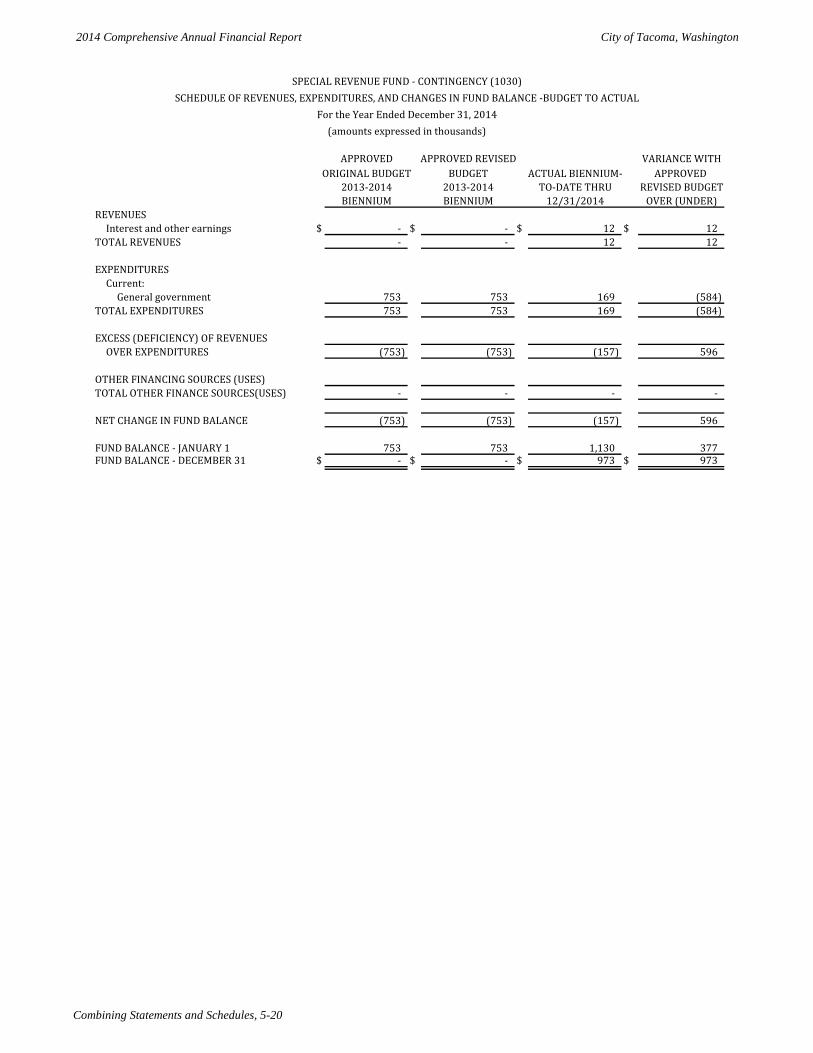
2014 Comprehensive Annual Financial Report City of Tacoma, Washington
Combining Statements and Schedules, 5-20
APPROVED APPROVED REVISED VARIANCE WITHORIGINAL BUDGET BUDGET ACTUAL BIENNIUM- APPROVED
2013-2014 2013-2014 TO-DATE THRU REVISED BUDGET BIENNIUM BIENNIUM 12/31/2014 OVER (UNDER)
REVENUESInterest and other earnings $ - $ - $ 12 $ 12
TOTAL REVENUES - - 12 12
EXPENDITURESCurrent:
General government 753 753 169 (584) TOTAL EXPENDITURES 753 753 169 (584)
EXCESS (DEFICIENCY) OF REVENUESOVER EXPENDITURES (753) (753) (157) 596
OTHER FINANCING SOURCES (USES)TOTAL OTHER FINANCE SOURCES(USES) - - - -
NET CHANGE IN FUND BALANCE (753) (753) (157) 596
FUND BALANCE - JANUARY 1 753 753 1,130 377 FUND BALANCE - DECEMBER 31 $ - $ - $ 973 $ 973
SPECIAL REVENUE FUND - CONTINGENCY (1030)SCHEDULE OF REVENUES, EXPENDITURES, AND CHANGES IN FUND BALANCE -BUDGET TO ACTUAL
For the Year Ended December 31, 2014(amounts expressed in thousands)
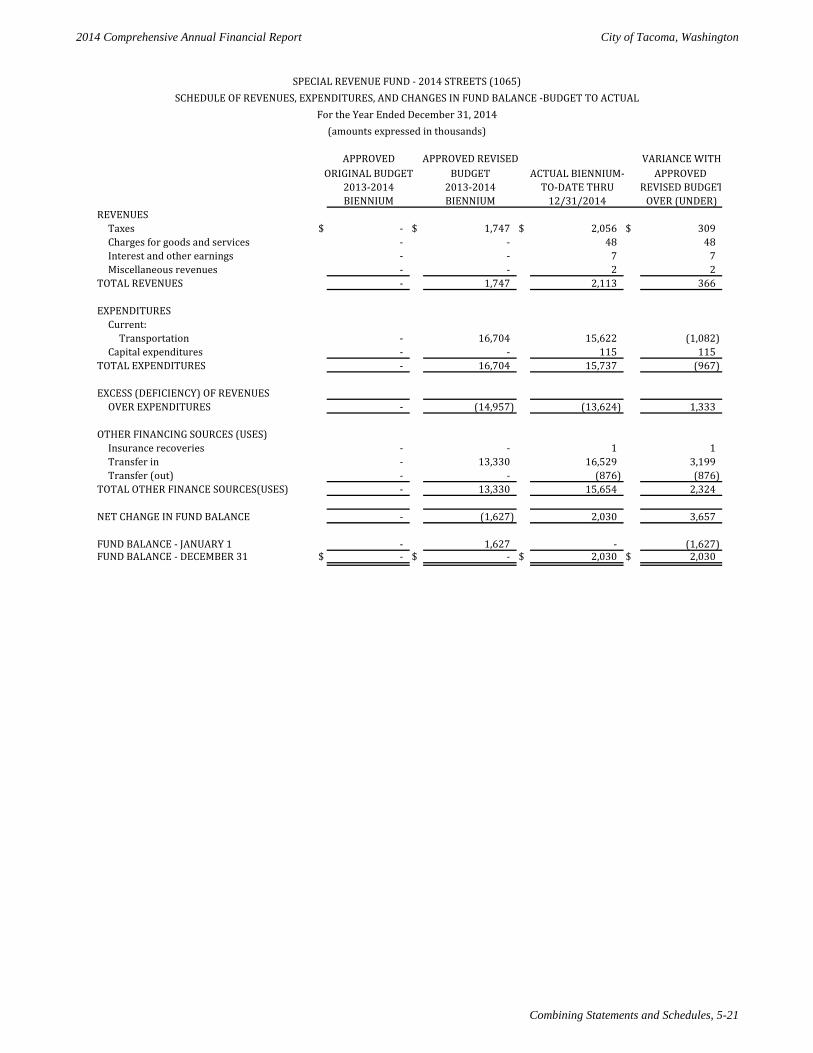
2014 Comprehensive Annual Financial Report City of Tacoma, Washington
Combining Statements and Schedules, 5-21
APPROVED APPROVED REVISED VARIANCE WITHORIGINAL BUDGET BUDGET ACTUAL BIENNIUM- APPROVED
2013-2014 2013-2014 TO-DATE THRU REVISED BUDGET BIENNIUM BIENNIUM 12/31/2014 OVER (UNDER)
REVENUESTaxes $ - $ 1,747 $ 2,056 $ 309 Charges for goods and services - - 48 48 Interest and other earnings - - 7 7 Miscellaneous revenues - - 2 2
TOTAL REVENUES - 1,747 2,113 366
EXPENDITURESCurrent:
Transportation - 16,704 15,622 (1,082) Capital expenditures - - 115 115
TOTAL EXPENDITURES - 16,704 15,737 (967)
EXCESS (DEFICIENCY) OF REVENUESOVER EXPENDITURES - (14,957) (13,624) 1,333
OTHER FINANCING SOURCES (USES)Insurance recoveries - - 1 1 Transfer in - 13,330 16,529 3,199 Transfer (out) - - (876) (876)
TOTAL OTHER FINANCE SOURCES(USES) - 13,330 15,654 2,324
NET CHANGE IN FUND BALANCE - (1,627) 2,030 3,657
FUND BALANCE - JANUARY 1 - 1,627 - (1,627) FUND BALANCE - DECEMBER 31 $ - $ - $ 2,030 $ 2,030
SPECIAL REVENUE FUND - 2014 STREETS (1065)SCHEDULE OF REVENUES, EXPENDITURES, AND CHANGES IN FUND BALANCE -BUDGET TO ACTUAL
For the Year Ended December 31, 2014(amounts expressed in thousands)
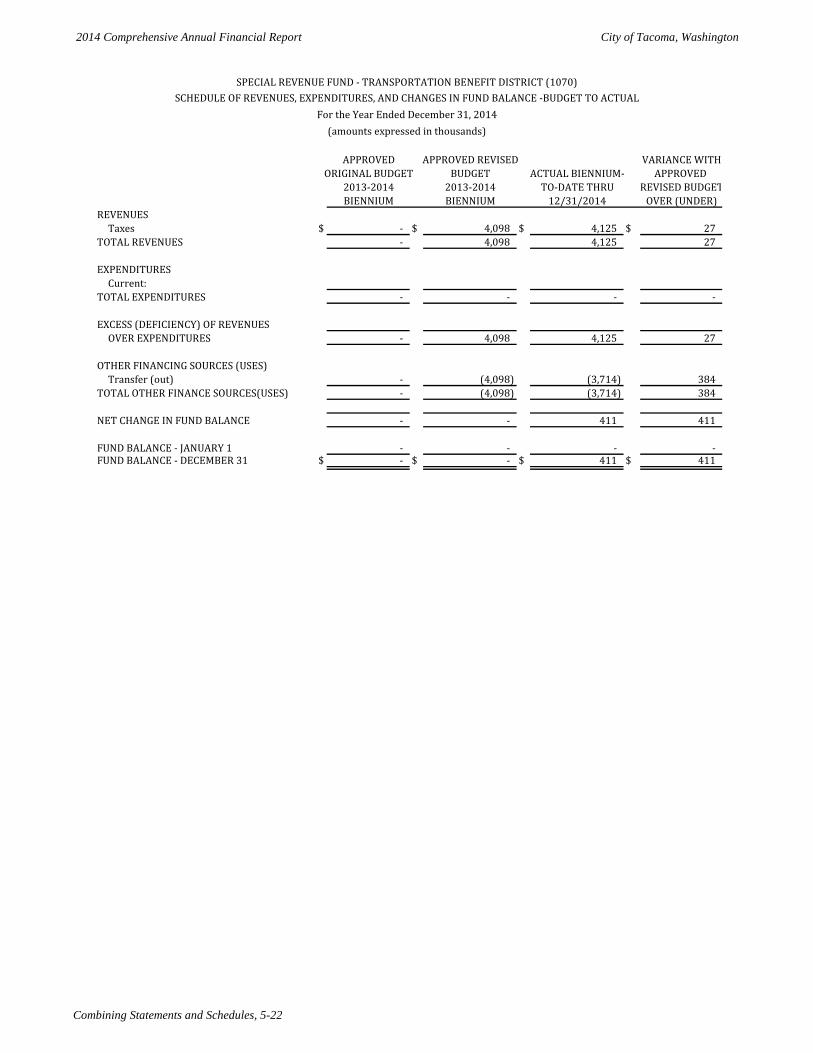
2014 Comprehensive Annual Financial Report City of Tacoma, Washington
Combining Statements and Schedules, 5-22
APPROVED APPROVED REVISED VARIANCE WITHORIGINAL BUDGET BUDGET ACTUAL BIENNIUM- APPROVED
2013-2014 2013-2014 TO-DATE THRU REVISED BUDGET BIENNIUM BIENNIUM 12/31/2014 OVER (UNDER)
REVENUESTaxes $ - $ 4,098 $ 4,125 $ 27
TOTAL REVENUES - 4,098 4,125 27
EXPENDITURESCurrent:
TOTAL EXPENDITURES - - - -
EXCESS (DEFICIENCY) OF REVENUESOVER EXPENDITURES - 4,098 4,125 27
OTHER FINANCING SOURCES (USES)Transfer (out) - (4,098) (3,714) 384
TOTAL OTHER FINANCE SOURCES(USES) - (4,098) (3,714) 384
NET CHANGE IN FUND BALANCE - - 411 411
FUND BALANCE - JANUARY 1 - - - - FUND BALANCE - DECEMBER 31 $ - $ - $ 411 $ 411
SPECIAL REVENUE FUND - TRANSPORTATION BENEFIT DISTRICT (1070)SCHEDULE OF REVENUES, EXPENDITURES, AND CHANGES IN FUND BALANCE -BUDGET TO ACTUAL
For the Year Ended December 31, 2014(amounts expressed in thousands)
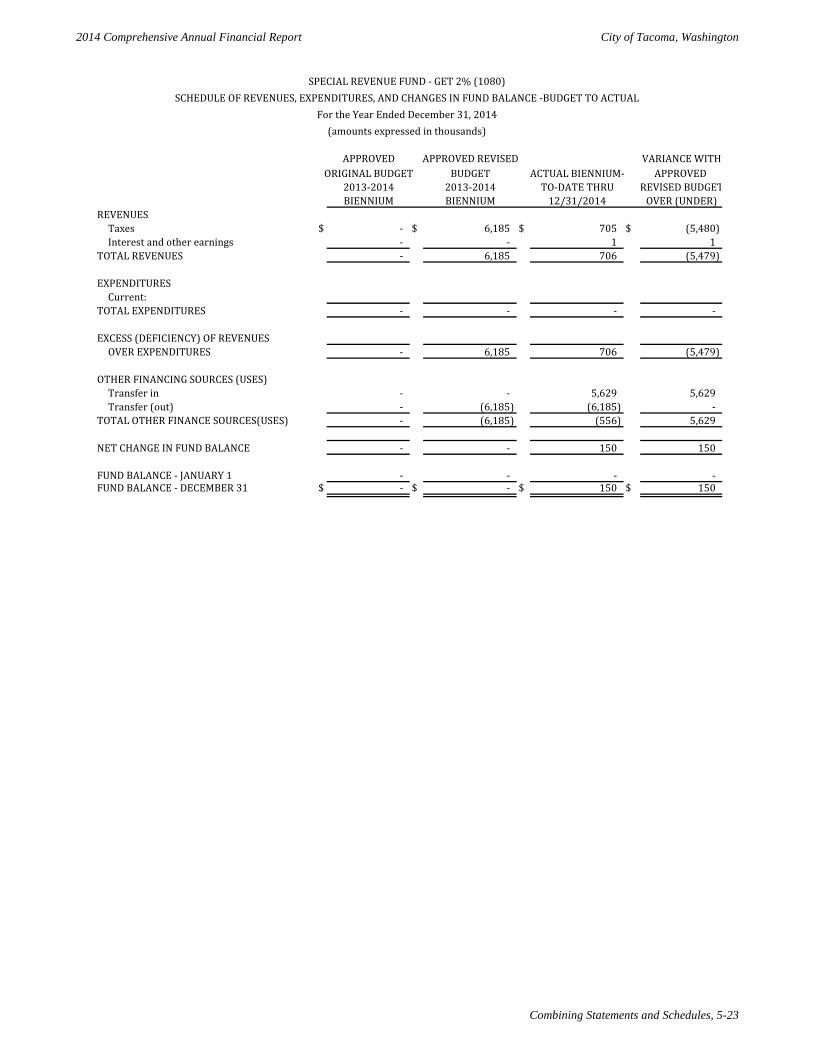
2014 Comprehensive Annual Financial Report City of Tacoma, Washington
Combining Statements and Schedules, 5-23
APPROVED APPROVED REVISED VARIANCE WITHORIGINAL BUDGET BUDGET ACTUAL BIENNIUM- APPROVED
2013-2014 2013-2014 TO-DATE THRU REVISED BUDGET BIENNIUM BIENNIUM 12/31/2014 OVER (UNDER)
REVENUESTaxes $ - $ 6,185 $ 705 $ (5,480) Interest and other earnings - - 1 1
TOTAL REVENUES - 6,185 706 (5,479)
EXPENDITURESCurrent:
TOTAL EXPENDITURES - - - -
EXCESS (DEFICIENCY) OF REVENUESOVER EXPENDITURES - 6,185 706 (5,479)
OTHER FINANCING SOURCES (USES)Transfer in - - 5,629 5,629 Transfer (out) - (6,185) (6,185) -
TOTAL OTHER FINANCE SOURCES(USES) - (6,185) (556) 5,629
NET CHANGE IN FUND BALANCE - - 150 150
FUND BALANCE - JANUARY 1 - - - - FUND BALANCE - DECEMBER 31 $ - $ - $ 150 $ 150
SPECIAL REVENUE FUND - GET 2% (1080)SCHEDULE OF REVENUES, EXPENDITURES, AND CHANGES IN FUND BALANCE -BUDGET TO ACTUAL
For the Year Ended December 31, 2014(amounts expressed in thousands)
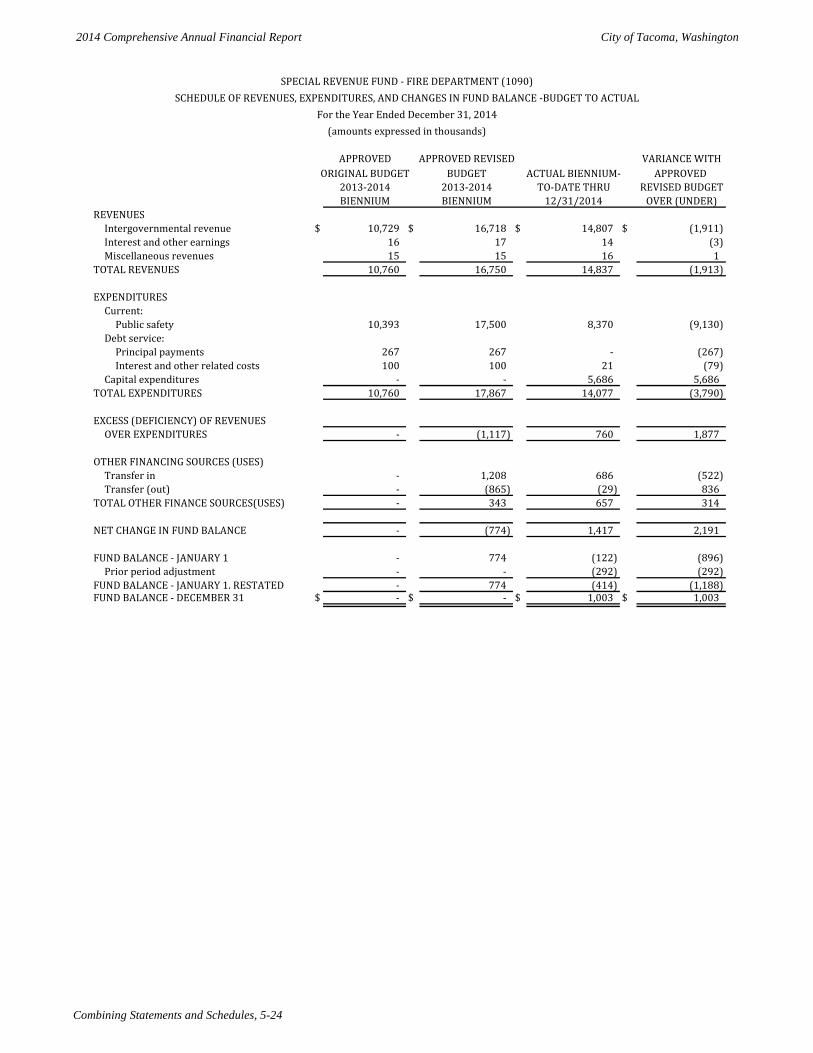
2014 Comprehensive Annual Financial Report City of Tacoma, Washington
Combining Statements and Schedules, 5-24
APPROVED APPROVED REVISED VARIANCE WITHORIGINAL BUDGET BUDGET ACTUAL BIENNIUM- APPROVED
2013-2014 2013-2014 TO-DATE THRU REVISED BUDGET BIENNIUM BIENNIUM 12/31/2014 OVER (UNDER)
REVENUESIntergovernmental revenue $ 10,729 $ 16,718 $ 14,807 $ (1,911) Interest and other earnings 16 17 14 (3) Miscellaneous revenues 15 15 16 1
TOTAL REVENUES 10,760 16,750 14,837 (1,913)
EXPENDITURESCurrent:
Public safety 10,393 17,500 8,370 (9,130) Debt service:
Principal payments 267 267 - (267) Interest and other related costs 100 100 21 (79)
Capital expenditures - - 5,686 5,686 TOTAL EXPENDITURES 10,760 17,867 14,077 (3,790)
EXCESS (DEFICIENCY) OF REVENUESOVER EXPENDITURES - (1,117) 760 1,877
OTHER FINANCING SOURCES (USES)Transfer in - 1,208 686 (522) Transfer (out) - (865) (29) 836
TOTAL OTHER FINANCE SOURCES(USES) - 343 657 314
NET CHANGE IN FUND BALANCE - (774) 1,417 2,191
FUND BALANCE - JANUARY 1 - 774 (122) (896) Prior period adjustment - - (292) (292)
FUND BALANCE - JANUARY 1. RESTATED - 774 (414) (1,188) FUND BALANCE - DECEMBER 31 $ - $ - $ 1,003 $ 1,003
SPECIAL REVENUE FUND - FIRE DEPARTMENT (1090)SCHEDULE OF REVENUES, EXPENDITURES, AND CHANGES IN FUND BALANCE -BUDGET TO ACTUAL
For the Year Ended December 31, 2014(amounts expressed in thousands)
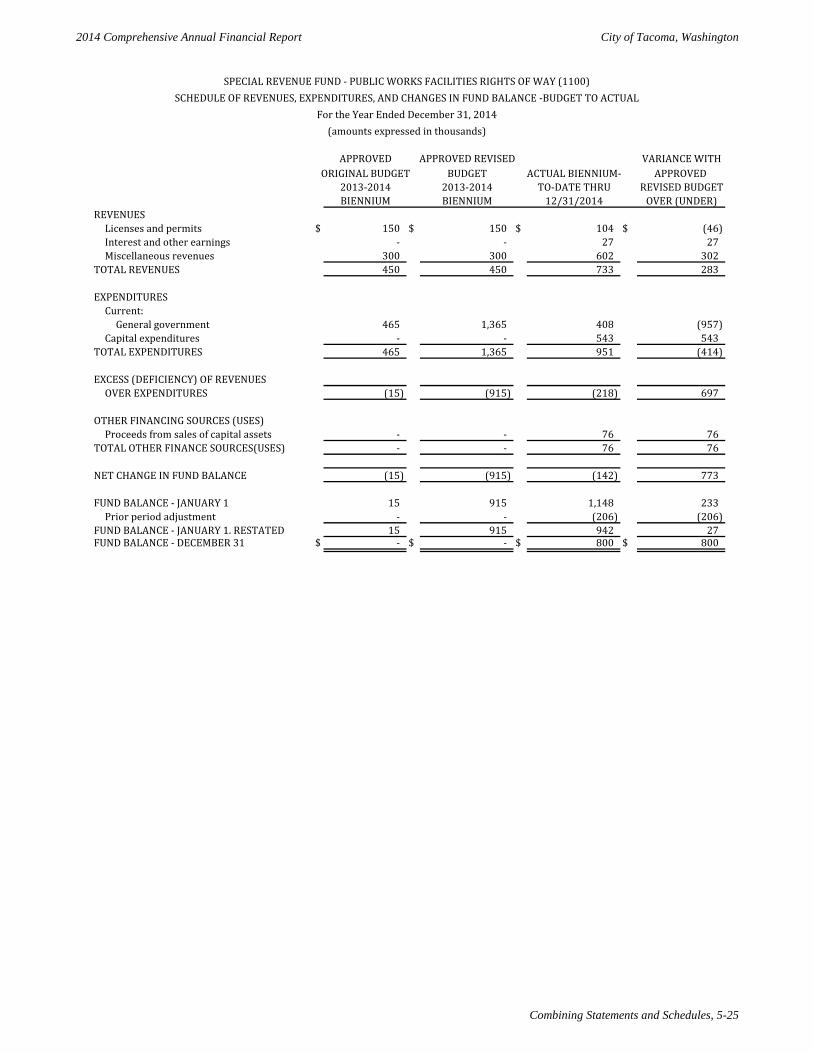
2014 Comprehensive Annual Financial Report City of Tacoma, Washington
Combining Statements and Schedules, 5-25
APPROVED APPROVED REVISED VARIANCE WITHORIGINAL BUDGET BUDGET ACTUAL BIENNIUM- APPROVED
2013-2014 2013-2014 TO-DATE THRU REVISED BUDGET BIENNIUM BIENNIUM 12/31/2014 OVER (UNDER)
REVENUESLicenses and permits $ 150 $ 150 $ 104 $ (46) Interest and other earnings - - 27 27 Miscellaneous revenues 300 300 602 302
TOTAL REVENUES 450 450 733 283
EXPENDITURESCurrent:
General government 465 1,365 408 (957) Capital expenditures - - 543 543
TOTAL EXPENDITURES 465 1,365 951 (414)
EXCESS (DEFICIENCY) OF REVENUESOVER EXPENDITURES (15) (915) (218) 697
OTHER FINANCING SOURCES (USES)Proceeds from sales of capital assets - - 76 76
TOTAL OTHER FINANCE SOURCES(USES) - - 76 76
NET CHANGE IN FUND BALANCE (15) (915) (142) 773
FUND BALANCE - JANUARY 1 15 915 1,148 233 Prior period adjustment - - (206) (206)
FUND BALANCE - JANUARY 1. RESTATED 15 915 942 27 FUND BALANCE - DECEMBER 31 $ - $ - $ 800 $ 800
SPECIAL REVENUE FUND - PUBLIC WORKS FACILITIES RIGHTS OF WAY (1100)SCHEDULE OF REVENUES, EXPENDITURES, AND CHANGES IN FUND BALANCE -BUDGET TO ACTUAL
For the Year Ended December 31, 2014(amounts expressed in thousands)
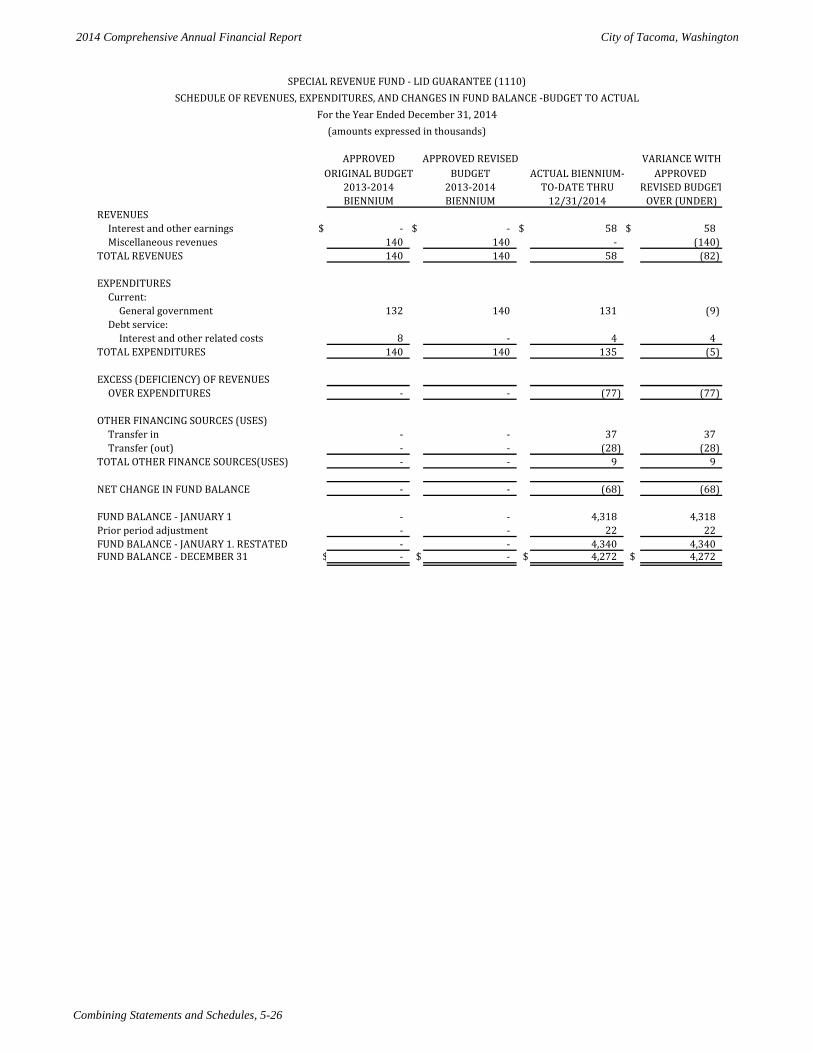
2014 Comprehensive Annual Financial Report City of Tacoma, Washington
Combining Statements and Schedules, 5-26
APPROVED APPROVED REVISED VARIANCE WITHORIGINAL BUDGET BUDGET ACTUAL BIENNIUM- APPROVED
2013-2014 2013-2014 TO-DATE THRU REVISED BUDGET BIENNIUM BIENNIUM 12/31/2014 OVER (UNDER)
REVENUESInterest and other earnings $ - $ - $ 58 $ 58 Miscellaneous revenues 140 140 - (140)
TOTAL REVENUES 140 140 58 (82)
EXPENDITURESCurrent:
General government 132 140 131 (9) Debt service:
Interest and other related costs 8 - 4 4 TOTAL EXPENDITURES 140 140 135 (5)
EXCESS (DEFICIENCY) OF REVENUESOVER EXPENDITURES - - (77) (77)
OTHER FINANCING SOURCES (USES)Transfer in - - 37 37 Transfer (out) - - (28) (28)
TOTAL OTHER FINANCE SOURCES(USES) - - 9 9
NET CHANGE IN FUND BALANCE - - (68) (68)
FUND BALANCE - JANUARY 1 - - 4,318 4,318 Prior period adjustment - - 22 22 FUND BALANCE - JANUARY 1. RESTATED - - 4,340 4,340 FUND BALANCE - DECEMBER 31 $ - $ - $ 4,272 $ 4,272
SPECIAL REVENUE FUND - LID GUARANTEE (1110)SCHEDULE OF REVENUES, EXPENDITURES, AND CHANGES IN FUND BALANCE -BUDGET TO ACTUAL
For the Year Ended December 31, 2014(amounts expressed in thousands)
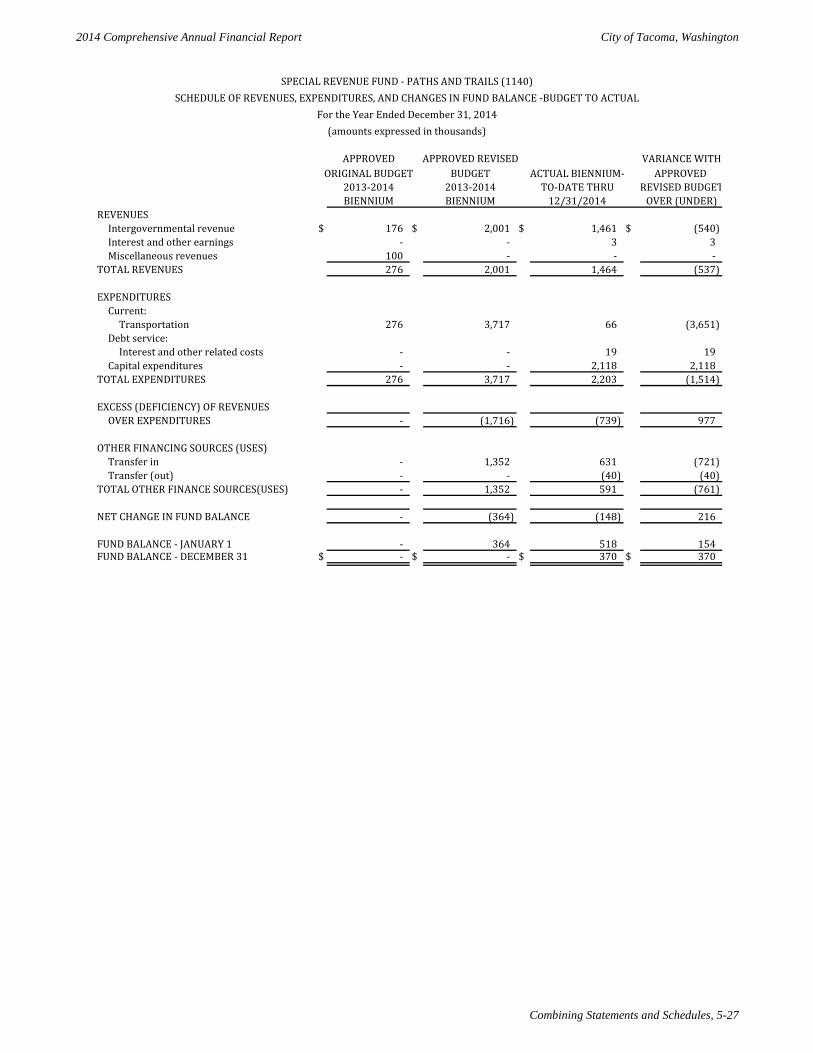
2014 Comprehensive Annual Financial Report City of Tacoma, Washington
Combining Statements and Schedules, 5-27
APPROVED APPROVED REVISED VARIANCE WITHORIGINAL BUDGET BUDGET ACTUAL BIENNIUM- APPROVED
2013-2014 2013-2014 TO-DATE THRU REVISED BUDGET BIENNIUM BIENNIUM 12/31/2014 OVER (UNDER)
REVENUESIntergovernmental revenue $ 176 $ 2,001 $ 1,461 $ (540) Interest and other earnings - - 3 3 Miscellaneous revenues 100 - - -
TOTAL REVENUES 276 2,001 1,464 (537)
EXPENDITURESCurrent:
Transportation 276 3,717 66 (3,651) Debt service:
Interest and other related costs - - 19 19 Capital expenditures - - 2,118 2,118
TOTAL EXPENDITURES 276 3,717 2,203 (1,514)
EXCESS (DEFICIENCY) OF REVENUESOVER EXPENDITURES - (1,716) (739) 977
OTHER FINANCING SOURCES (USES)Transfer in - 1,352 631 (721) Transfer (out) - - (40) (40)
TOTAL OTHER FINANCE SOURCES(USES) - 1,352 591 (761)
NET CHANGE IN FUND BALANCE - (364) (148) 216
FUND BALANCE - JANUARY 1 - 364 518 154 FUND BALANCE - DECEMBER 31 $ - $ - $ 370 $ 370
SPECIAL REVENUE FUND - PATHS AND TRAILS (1140)SCHEDULE OF REVENUES, EXPENDITURES, AND CHANGES IN FUND BALANCE -BUDGET TO ACTUAL
For the Year Ended December 31, 2014(amounts expressed in thousands)
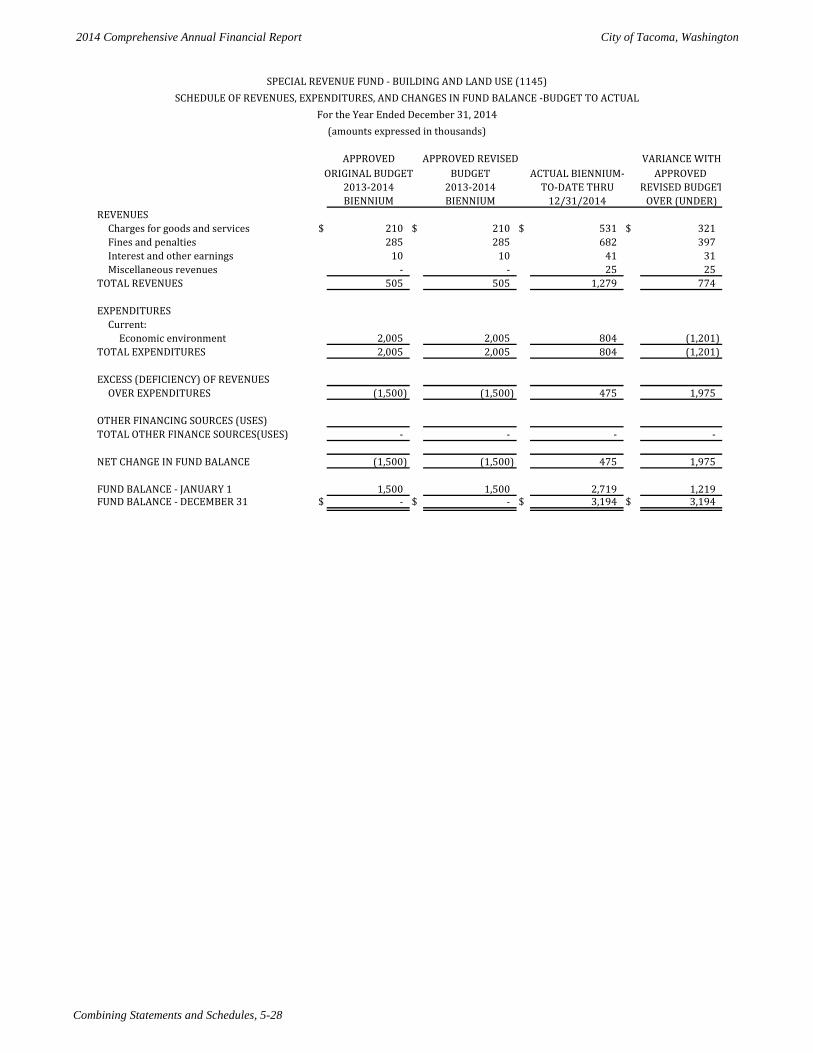
2014 Comprehensive Annual Financial Report City of Tacoma, Washington
Combining Statements and Schedules, 5-28
APPROVED APPROVED REVISED VARIANCE WITHORIGINAL BUDGET BUDGET ACTUAL BIENNIUM- APPROVED
2013-2014 2013-2014 TO-DATE THRU REVISED BUDGET BIENNIUM BIENNIUM 12/31/2014 OVER (UNDER)
REVENUESCharges for goods and services $ 210 $ 210 $ 531 $ 321 Fines and penalties 285 285 682 397 Interest and other earnings 10 10 41 31 Miscellaneous revenues - - 25 25
TOTAL REVENUES 505 505 1,279 774
EXPENDITURESCurrent:
Economic environment 2,005 2,005 804 (1,201) TOTAL EXPENDITURES 2,005 2,005 804 (1,201)
EXCESS (DEFICIENCY) OF REVENUESOVER EXPENDITURES (1,500) (1,500) 475 1,975
OTHER FINANCING SOURCES (USES)TOTAL OTHER FINANCE SOURCES(USES) - - - -
NET CHANGE IN FUND BALANCE (1,500) (1,500) 475 1,975
FUND BALANCE - JANUARY 1 1,500 1,500 2,719 1,219 FUND BALANCE - DECEMBER 31 $ - $ - $ 3,194 $ 3,194
SPECIAL REVENUE FUND - BUILDING AND LAND USE (1145)SCHEDULE OF REVENUES, EXPENDITURES, AND CHANGES IN FUND BALANCE -BUDGET TO ACTUAL
For the Year Ended December 31, 2014(amounts expressed in thousands)
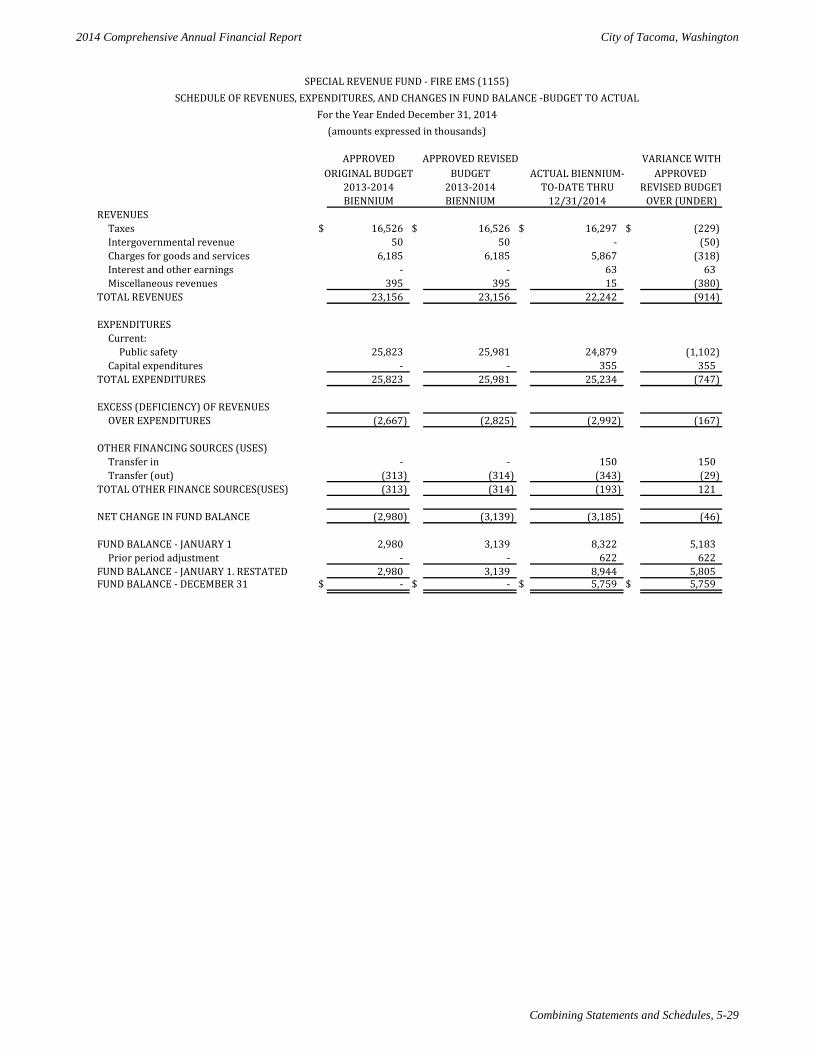
2014 Comprehensive Annual Financial Report City of Tacoma, Washington
Combining Statements and Schedules, 5-29
APPROVED APPROVED REVISED VARIANCE WITHORIGINAL BUDGET BUDGET ACTUAL BIENNIUM- APPROVED
2013-2014 2013-2014 TO-DATE THRU REVISED BUDGET BIENNIUM BIENNIUM 12/31/2014 OVER (UNDER)
REVENUESTaxes $ 16,526 $ 16,526 $ 16,297 $ (229) Intergovernmental revenue 50 50 - (50) Charges for goods and services 6,185 6,185 5,867 (318) Interest and other earnings - - 63 63 Miscellaneous revenues 395 395 15 (380)
TOTAL REVENUES 23,156 23,156 22,242 (914)
EXPENDITURESCurrent:
Public safety 25,823 25,981 24,879 (1,102) Capital expenditures - - 355 355
TOTAL EXPENDITURES 25,823 25,981 25,234 (747)
EXCESS (DEFICIENCY) OF REVENUESOVER EXPENDITURES (2,667) (2,825) (2,992) (167)
OTHER FINANCING SOURCES (USES)Transfer in - - 150 150 Transfer (out) (313) (314) (343) (29)
TOTAL OTHER FINANCE SOURCES(USES) (313) (314) (193) 121
NET CHANGE IN FUND BALANCE (2,980) (3,139) (3,185) (46)
FUND BALANCE - JANUARY 1 2,980 3,139 8,322 5,183 Prior period adjustment - - 622 622
FUND BALANCE - JANUARY 1. RESTATED 2,980 3,139 8,944 5,805 FUND BALANCE - DECEMBER 31 $ - $ - $ 5,759 $ 5,759
SPECIAL REVENUE FUND - FIRE EMS (1155)SCHEDULE OF REVENUES, EXPENDITURES, AND CHANGES IN FUND BALANCE -BUDGET TO ACTUAL
For the Year Ended December 31, 2014(amounts expressed in thousands)
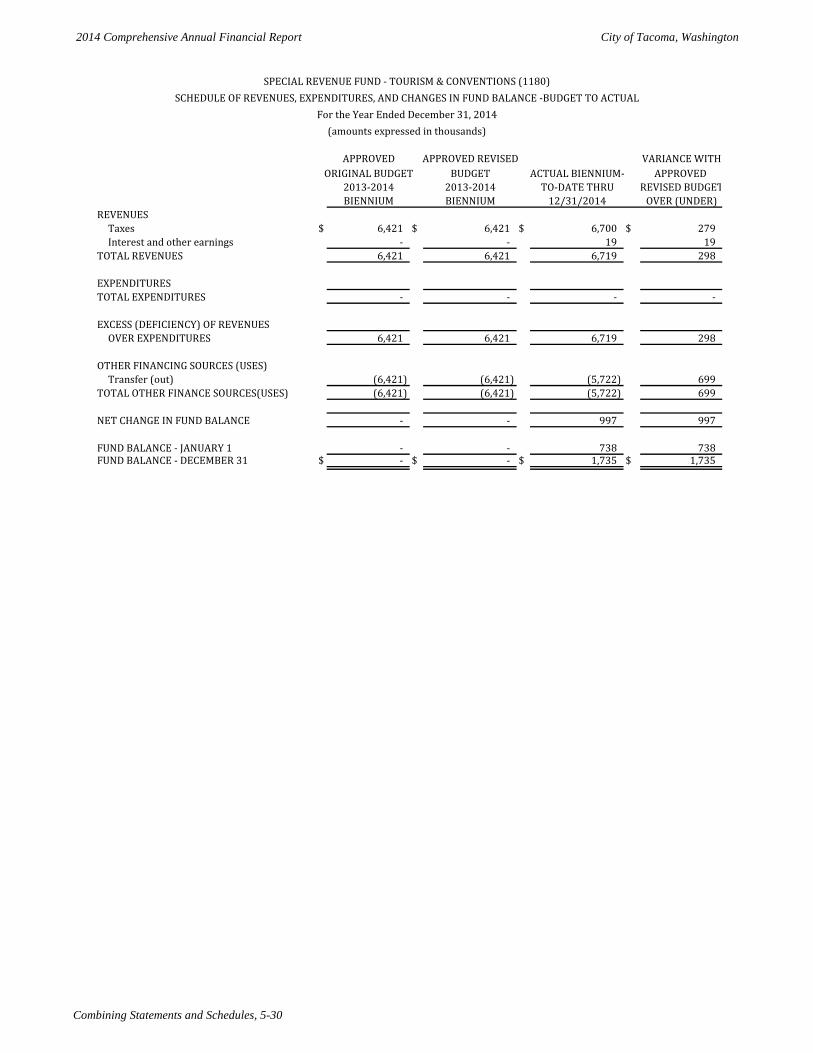
2014 Comprehensive Annual Financial Report City of Tacoma, Washington
Combining Statements and Schedules, 5-30
APPROVED APPROVED REVISED VARIANCE WITHORIGINAL BUDGET BUDGET ACTUAL BIENNIUM- APPROVED
2013-2014 2013-2014 TO-DATE THRU REVISED BUDGET BIENNIUM BIENNIUM 12/31/2014 OVER (UNDER)
REVENUESTaxes $ 6,421 $ 6,421 $ 6,700 $ 279 Interest and other earnings - - 19 19
TOTAL REVENUES 6,421 6,421 6,719 298
EXPENDITURESTOTAL EXPENDITURES - - - -
EXCESS (DEFICIENCY) OF REVENUESOVER EXPENDITURES 6,421 6,421 6,719 298
OTHER FINANCING SOURCES (USES)Transfer (out) (6,421) (6,421) (5,722) 699
TOTAL OTHER FINANCE SOURCES(USES) (6,421) (6,421) (5,722) 699
NET CHANGE IN FUND BALANCE - - 997 997
FUND BALANCE - JANUARY 1 - - 738 738 FUND BALANCE - DECEMBER 31 $ - $ - $ 1,735 $ 1,735
SPECIAL REVENUE FUND - TOURISM & CONVENTIONS (1180)SCHEDULE OF REVENUES, EXPENDITURES, AND CHANGES IN FUND BALANCE -BUDGET TO ACTUAL
For the Year Ended December 31, 2014(amounts expressed in thousands)
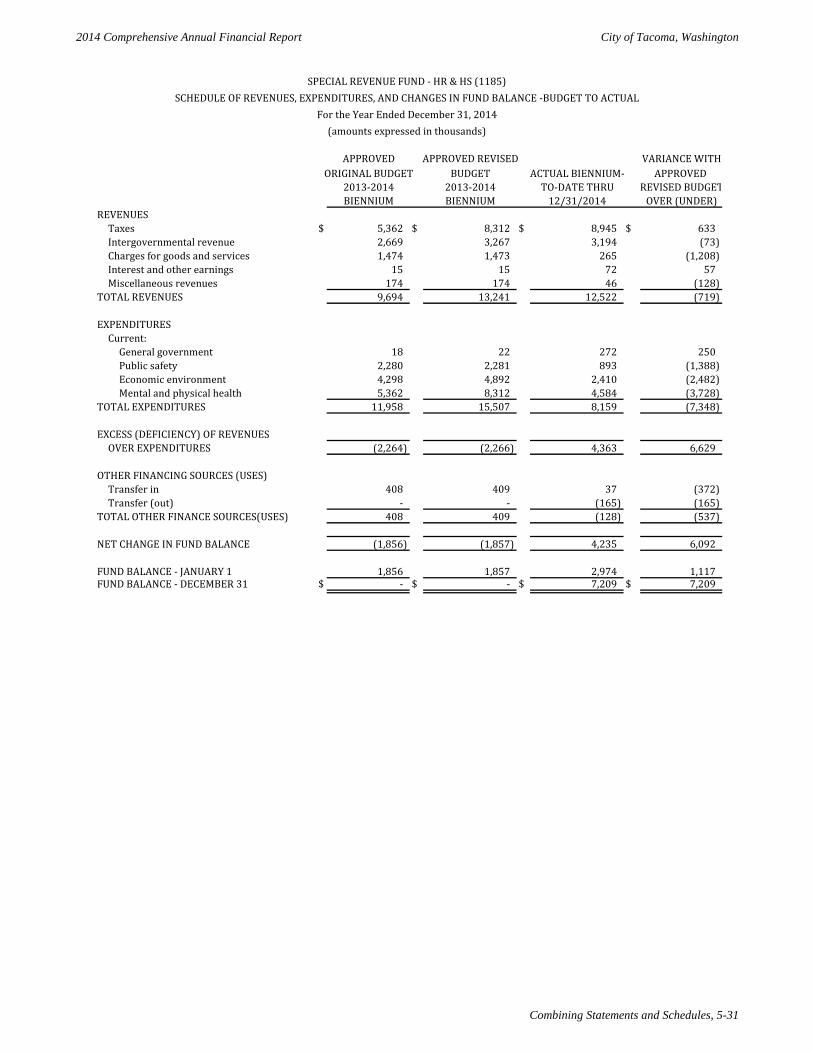
2014 Comprehensive Annual Financial Report City of Tacoma, Washington
Combining Statements and Schedules, 5-31
APPROVED APPROVED REVISED VARIANCE WITHORIGINAL BUDGET BUDGET ACTUAL BIENNIUM- APPROVED
2013-2014 2013-2014 TO-DATE THRU REVISED BUDGET BIENNIUM BIENNIUM 12/31/2014 OVER (UNDER)
REVENUESTaxes $ 5,362 $ 8,312 $ 8,945 $ 633 Intergovernmental revenue 2,669 3,267 3,194 (73) Charges for goods and services 1,474 1,473 265 (1,208) Interest and other earnings 15 15 72 57 Miscellaneous revenues 174 174 46 (128)
TOTAL REVENUES 9,694 13,241 12,522 (719)
EXPENDITURESCurrent:
General government 18 22 272 250 Public safety 2,280 2,281 893 (1,388) Economic environment 4,298 4,892 2,410 (2,482) Mental and physical health 5,362 8,312 4,584 (3,728)
TOTAL EXPENDITURES 11,958 15,507 8,159 (7,348)
EXCESS (DEFICIENCY) OF REVENUESOVER EXPENDITURES (2,264) (2,266) 4,363 6,629
OTHER FINANCING SOURCES (USES)Transfer in 408 409 37 (372) Transfer (out) - - (165) (165)
TOTAL OTHER FINANCE SOURCES(USES) 408 409 (128) (537)
NET CHANGE IN FUND BALANCE (1,856) (1,857) 4,235 6,092
FUND BALANCE - JANUARY 1 1,856 1,857 2,974 1,117 FUND BALANCE - DECEMBER 31 $ - $ - $ 7,209 $ 7,209
SPECIAL REVENUE FUND - HR & HS (1185)SCHEDULE OF REVENUES, EXPENDITURES, AND CHANGES IN FUND BALANCE -BUDGET TO ACTUAL
For the Year Ended December 31, 2014(amounts expressed in thousands)
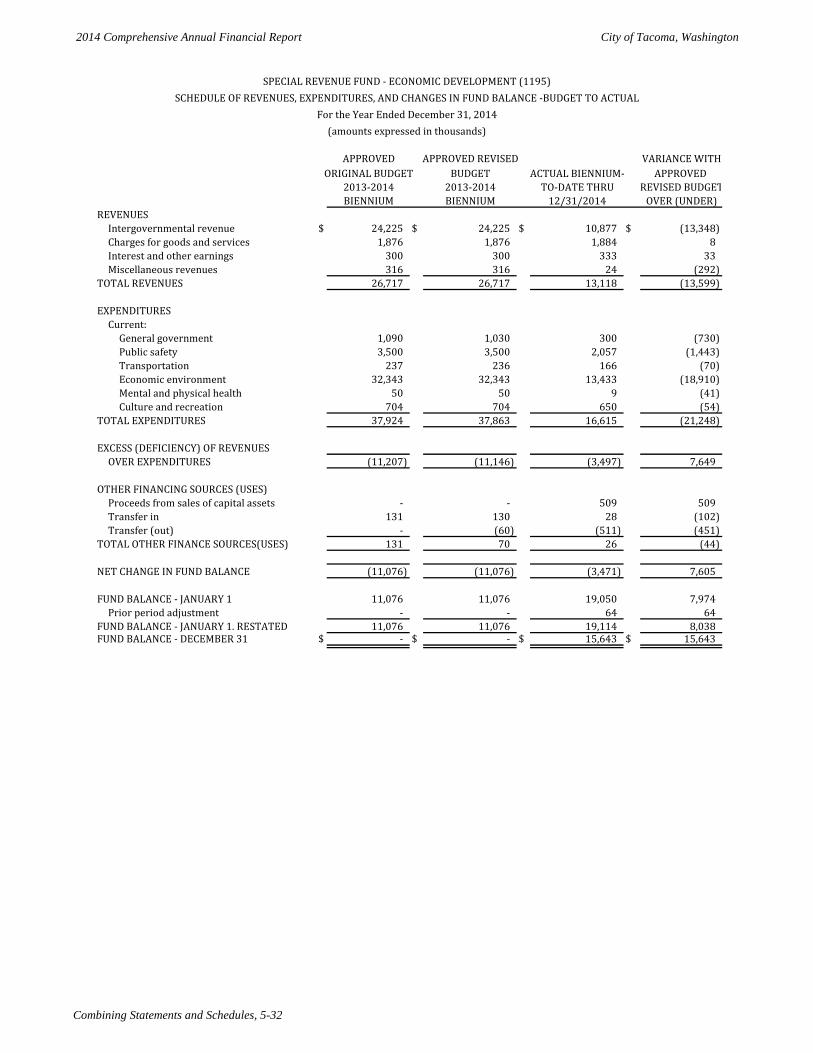
2014 Comprehensive Annual Financial Report City of Tacoma, Washington
Combining Statements and Schedules, 5-32
APPROVED APPROVED REVISED VARIANCE WITHORIGINAL BUDGET BUDGET ACTUAL BIENNIUM- APPROVED
2013-2014 2013-2014 TO-DATE THRU REVISED BUDGET BIENNIUM BIENNIUM 12/31/2014 OVER (UNDER)
REVENUESIntergovernmental revenue $ 24,225 $ 24,225 $ 10,877 $ (13,348) Charges for goods and services 1,876 1,876 1,884 8 Interest and other earnings 300 300 333 33 Miscellaneous revenues 316 316 24 (292)
TOTAL REVENUES 26,717 26,717 13,118 (13,599)
EXPENDITURESCurrent:
General government 1,090 1,030 300 (730) Public safety 3,500 3,500 2,057 (1,443) Transportation 237 236 166 (70) Economic environment 32,343 32,343 13,433 (18,910) Mental and physical health 50 50 9 (41) Culture and recreation 704 704 650 (54)
TOTAL EXPENDITURES 37,924 37,863 16,615 (21,248)
EXCESS (DEFICIENCY) OF REVENUESOVER EXPENDITURES (11,207) (11,146) (3,497) 7,649
OTHER FINANCING SOURCES (USES)Proceeds from sales of capital assets - - 509 509 Transfer in 131 130 28 (102) Transfer (out) - (60) (511) (451)
TOTAL OTHER FINANCE SOURCES(USES) 131 70 26 (44)
NET CHANGE IN FUND BALANCE (11,076) (11,076) (3,471) 7,605
FUND BALANCE - JANUARY 1 11,076 11,076 19,050 7,974 Prior period adjustment - - 64 64
FUND BALANCE - JANUARY 1. RESTATED 11,076 11,076 19,114 8,038 FUND BALANCE - DECEMBER 31 $ - $ - $ 15,643 $ 15,643
SPECIAL REVENUE FUND - ECONOMIC DEVELOPMENT (1195)SCHEDULE OF REVENUES, EXPENDITURES, AND CHANGES IN FUND BALANCE -BUDGET TO ACTUAL
For the Year Ended December 31, 2014(amounts expressed in thousands)
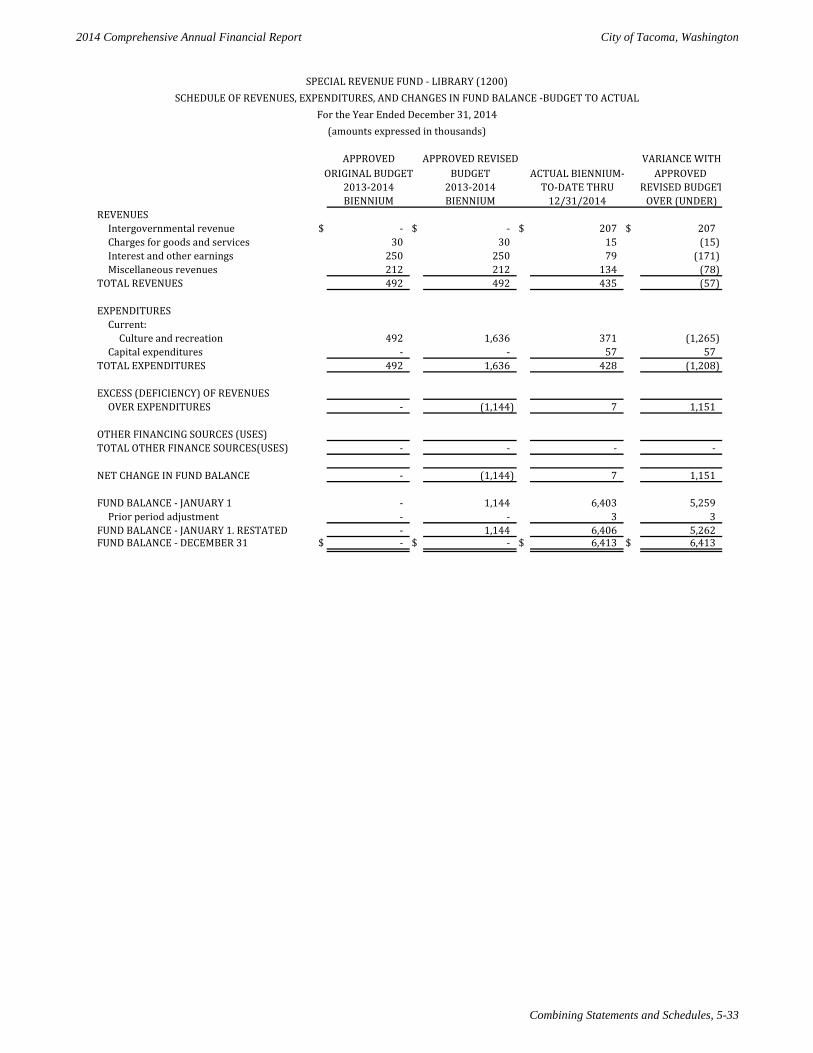
2014 Comprehensive Annual Financial Report City of Tacoma, Washington
Combining Statements and Schedules, 5-33
APPROVED APPROVED REVISED VARIANCE WITHORIGINAL BUDGET BUDGET ACTUAL BIENNIUM- APPROVED
2013-2014 2013-2014 TO-DATE THRU REVISED BUDGET BIENNIUM BIENNIUM 12/31/2014 OVER (UNDER)
REVENUESIntergovernmental revenue $ - $ - $ 207 $ 207 Charges for goods and services 30 30 15 (15) Interest and other earnings 250 250 79 (171) Miscellaneous revenues 212 212 134 (78)
TOTAL REVENUES 492 492 435 (57)
EXPENDITURESCurrent:
Culture and recreation 492 1,636 371 (1,265) Capital expenditures - - 57 57
TOTAL EXPENDITURES 492 1,636 428 (1,208)
EXCESS (DEFICIENCY) OF REVENUESOVER EXPENDITURES - (1,144) 7 1,151
OTHER FINANCING SOURCES (USES)TOTAL OTHER FINANCE SOURCES(USES) - - - -
NET CHANGE IN FUND BALANCE - (1,144) 7 1,151
FUND BALANCE - JANUARY 1 - 1,144 6,403 5,259 Prior period adjustment - - 3 3
FUND BALANCE - JANUARY 1. RESTATED - 1,144 6,406 5,262 FUND BALANCE - DECEMBER 31 $ - $ - $ 6,413 $ 6,413
SPECIAL REVENUE FUND - LIBRARY (1200)SCHEDULE OF REVENUES, EXPENDITURES, AND CHANGES IN FUND BALANCE -BUDGET TO ACTUAL
For the Year Ended December 31, 2014(amounts expressed in thousands)
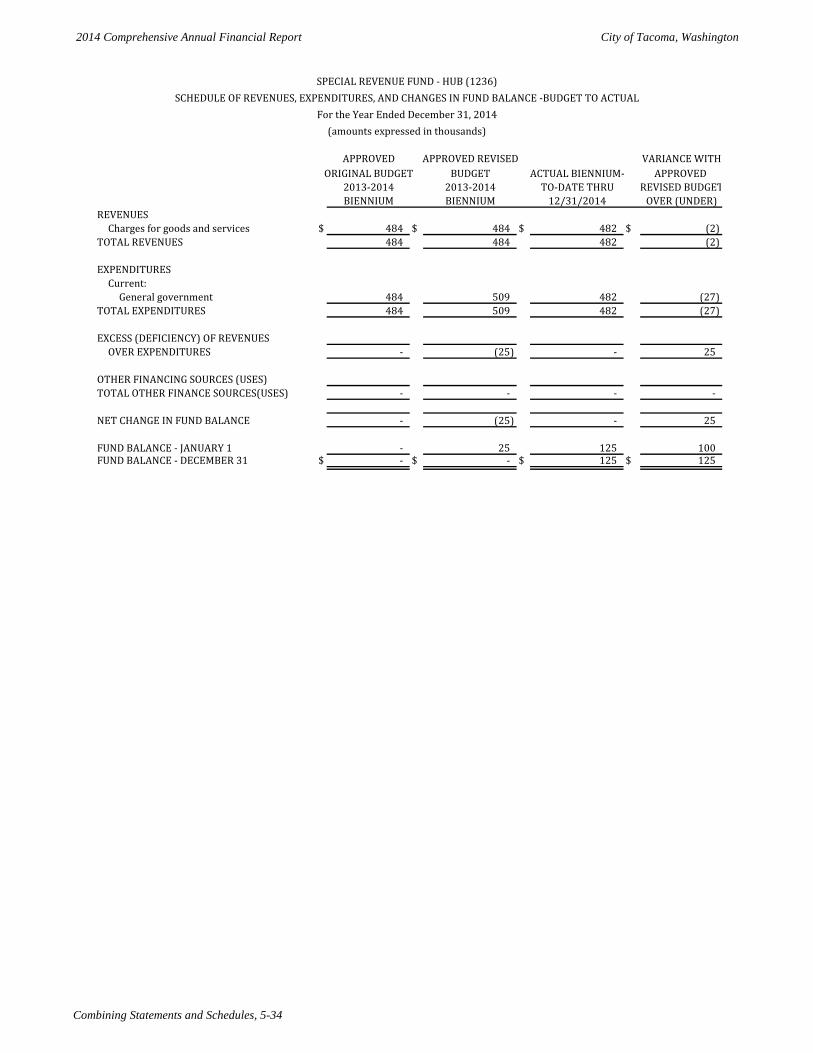
2014 Comprehensive Annual Financial Report City of Tacoma, Washington
Combining Statements and Schedules, 5-34
APPROVED APPROVED REVISED VARIANCE WITHORIGINAL BUDGET BUDGET ACTUAL BIENNIUM- APPROVED
2013-2014 2013-2014 TO-DATE THRU REVISED BUDGET BIENNIUM BIENNIUM 12/31/2014 OVER (UNDER)
REVENUESCharges for goods and services $ 484 $ 484 $ 482 $ (2)
TOTAL REVENUES 484 484 482 (2)
EXPENDITURESCurrent:
General government 484 509 482 (27) TOTAL EXPENDITURES 484 509 482 (27)
EXCESS (DEFICIENCY) OF REVENUESOVER EXPENDITURES - (25) - 25
OTHER FINANCING SOURCES (USES)TOTAL OTHER FINANCE SOURCES(USES) - - - -
NET CHANGE IN FUND BALANCE - (25) - 25
FUND BALANCE - JANUARY 1 - 25 125 100 FUND BALANCE - DECEMBER 31 $ - $ - $ 125 $ 125
SPECIAL REVENUE FUND - HUB (1236)SCHEDULE OF REVENUES, EXPENDITURES, AND CHANGES IN FUND BALANCE -BUDGET TO ACTUAL
For the Year Ended December 31, 2014(amounts expressed in thousands)
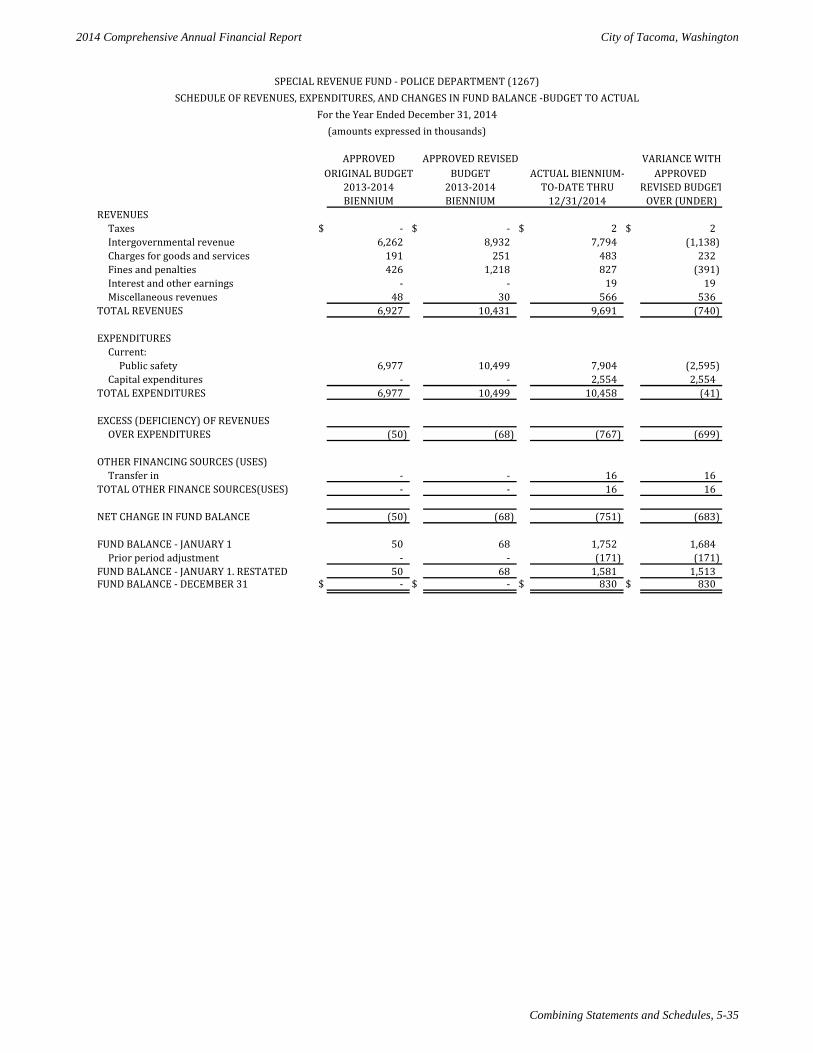
2014 Comprehensive Annual Financial Report City of Tacoma, Washington
Combining Statements and Schedules, 5-35
APPROVED APPROVED REVISED VARIANCE WITHORIGINAL BUDGET BUDGET ACTUAL BIENNIUM- APPROVED
2013-2014 2013-2014 TO-DATE THRU REVISED BUDGET BIENNIUM BIENNIUM 12/31/2014 OVER (UNDER)
REVENUESTaxes $ - $ - $ 2 $ 2 Intergovernmental revenue 6,262 8,932 7,794 (1,138) Charges for goods and services 191 251 483 232 Fines and penalties 426 1,218 827 (391) Interest and other earnings - - 19 19 Miscellaneous revenues 48 30 566 536
TOTAL REVENUES 6,927 10,431 9,691 (740)
EXPENDITURESCurrent:
Public safety 6,977 10,499 7,904 (2,595) Capital expenditures - - 2,554 2,554
TOTAL EXPENDITURES 6,977 10,499 10,458 (41)
EXCESS (DEFICIENCY) OF REVENUESOVER EXPENDITURES (50) (68) (767) (699)
OTHER FINANCING SOURCES (USES)Transfer in - - 16 16
TOTAL OTHER FINANCE SOURCES(USES) - - 16 16
NET CHANGE IN FUND BALANCE (50) (68) (751) (683)
FUND BALANCE - JANUARY 1 50 68 1,752 1,684 Prior period adjustment - - (171) (171)
FUND BALANCE - JANUARY 1. RESTATED 50 68 1,581 1,513 FUND BALANCE - DECEMBER 31 $ - $ - $ 830 $ 830
SPECIAL REVENUE FUND - POLICE DEPARTMENT (1267)SCHEDULE OF REVENUES, EXPENDITURES, AND CHANGES IN FUND BALANCE -BUDGET TO ACTUAL
For the Year Ended December 31, 2014(amounts expressed in thousands)
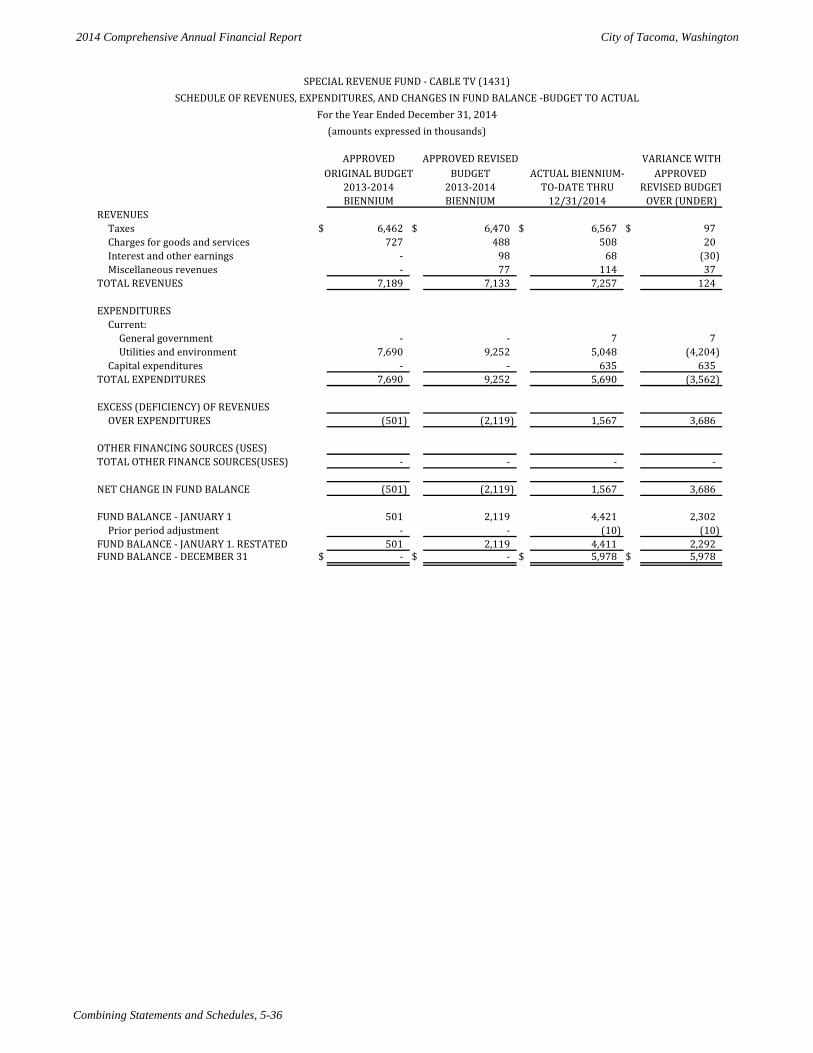
2014 Comprehensive Annual Financial Report City of Tacoma, Washington
Combining Statements and Schedules, 5-36
APPROVED APPROVED REVISED VARIANCE WITHORIGINAL BUDGET BUDGET ACTUAL BIENNIUM- APPROVED
2013-2014 2013-2014 TO-DATE THRU REVISED BUDGET BIENNIUM BIENNIUM 12/31/2014 OVER (UNDER)
REVENUESTaxes $ 6,462 $ 6,470 $ 6,567 $ 97 Charges for goods and services 727 488 508 20 Interest and other earnings - 98 68 (30) Miscellaneous revenues - 77 114 37
TOTAL REVENUES 7,189 7,133 7,257 124
EXPENDITURESCurrent:
General government - - 7 7 Utilities and environment 7,690 9,252 5,048 (4,204)
Capital expenditures - - 635 635 TOTAL EXPENDITURES 7,690 9,252 5,690 (3,562)
EXCESS (DEFICIENCY) OF REVENUESOVER EXPENDITURES (501) (2,119) 1,567 3,686
OTHER FINANCING SOURCES (USES)TOTAL OTHER FINANCE SOURCES(USES) - - - -
NET CHANGE IN FUND BALANCE (501) (2,119) 1,567 3,686
FUND BALANCE - JANUARY 1 501 2,119 4,421 2,302 Prior period adjustment - - (10) (10)
FUND BALANCE - JANUARY 1. RESTATED 501 2,119 4,411 2,292 FUND BALANCE - DECEMBER 31 $ - $ - $ 5,978 $ 5,978
SPECIAL REVENUE FUND - CABLE TV (1431)SCHEDULE OF REVENUES, EXPENDITURES, AND CHANGES IN FUND BALANCE -BUDGET TO ACTUAL
For the Year Ended December 31, 2014(amounts expressed in thousands)
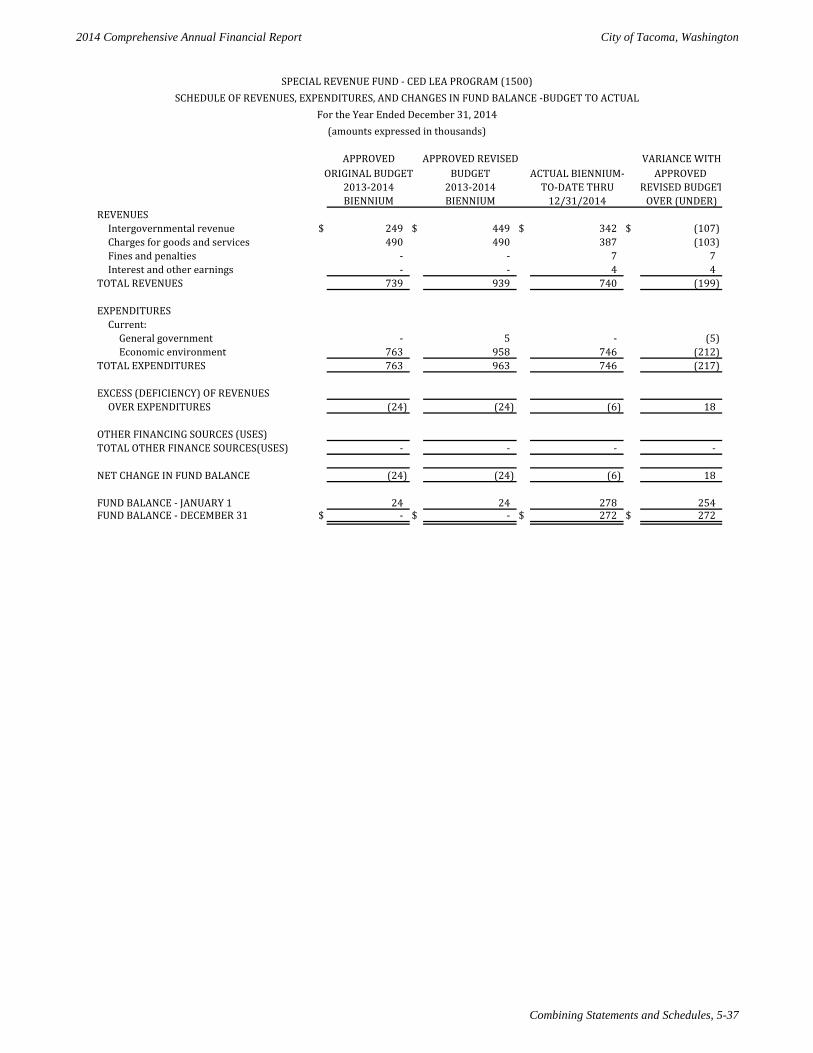
2014 Comprehensive Annual Financial Report City of Tacoma, Washington
Combining Statements and Schedules, 5-37
APPROVED APPROVED REVISED VARIANCE WITHORIGINAL BUDGET BUDGET ACTUAL BIENNIUM- APPROVED
2013-2014 2013-2014 TO-DATE THRU REVISED BUDGET BIENNIUM BIENNIUM 12/31/2014 OVER (UNDER)
REVENUESIntergovernmental revenue $ 249 $ 449 $ 342 $ (107) Charges for goods and services 490 490 387 (103) Fines and penalties - - 7 7 Interest and other earnings - - 4 4
TOTAL REVENUES 739 939 740 (199)
EXPENDITURESCurrent:
General government - 5 - (5) Economic environment 763 958 746 (212)
TOTAL EXPENDITURES 763 963 746 (217)
EXCESS (DEFICIENCY) OF REVENUESOVER EXPENDITURES (24) (24) (6) 18
OTHER FINANCING SOURCES (USES)TOTAL OTHER FINANCE SOURCES(USES) - - - -
NET CHANGE IN FUND BALANCE (24) (24) (6) 18
FUND BALANCE - JANUARY 1 24 24 278 254 FUND BALANCE - DECEMBER 31 $ - $ - $ 272 $ 272
SPECIAL REVENUE FUND - CED LEA PROGRAM (1500)SCHEDULE OF REVENUES, EXPENDITURES, AND CHANGES IN FUND BALANCE -BUDGET TO ACTUAL
For the Year Ended December 31, 2014(amounts expressed in thousands)
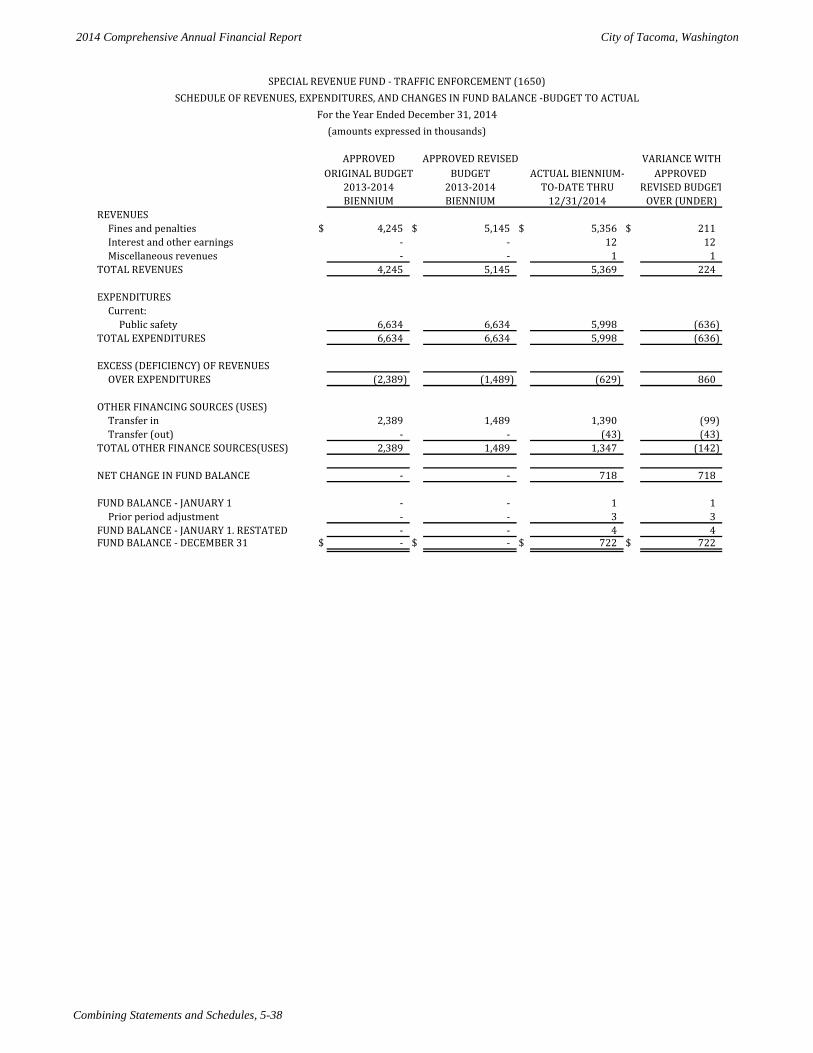
2014 Comprehensive Annual Financial Report City of Tacoma, Washington
Combining Statements and Schedules, 5-38
APPROVED APPROVED REVISED VARIANCE WITHORIGINAL BUDGET BUDGET ACTUAL BIENNIUM- APPROVED
2013-2014 2013-2014 TO-DATE THRU REVISED BUDGET BIENNIUM BIENNIUM 12/31/2014 OVER (UNDER)
REVENUESFines and penalties $ 4,245 $ 5,145 $ 5,356 $ 211 Interest and other earnings - - 12 12 Miscellaneous revenues - - 1 1
TOTAL REVENUES 4,245 5,145 5,369 224
EXPENDITURESCurrent:
Public safety 6,634 6,634 5,998 (636) TOTAL EXPENDITURES 6,634 6,634 5,998 (636)
EXCESS (DEFICIENCY) OF REVENUESOVER EXPENDITURES (2,389) (1,489) (629) 860
OTHER FINANCING SOURCES (USES)Transfer in 2,389 1,489 1,390 (99) Transfer (out) - - (43) (43)
TOTAL OTHER FINANCE SOURCES(USES) 2,389 1,489 1,347 (142)
NET CHANGE IN FUND BALANCE - - 718 718
FUND BALANCE - JANUARY 1 - - 1 1 Prior period adjustment - - 3 3
FUND BALANCE - JANUARY 1. RESTATED - - 4 4 FUND BALANCE - DECEMBER 31 $ - $ - $ 722 $ 722
SPECIAL REVENUE FUND - TRAFFIC ENFORCEMENT (1650)SCHEDULE OF REVENUES, EXPENDITURES, AND CHANGES IN FUND BALANCE -BUDGET TO ACTUAL
For the Year Ended December 31, 2014(amounts expressed in thousands)
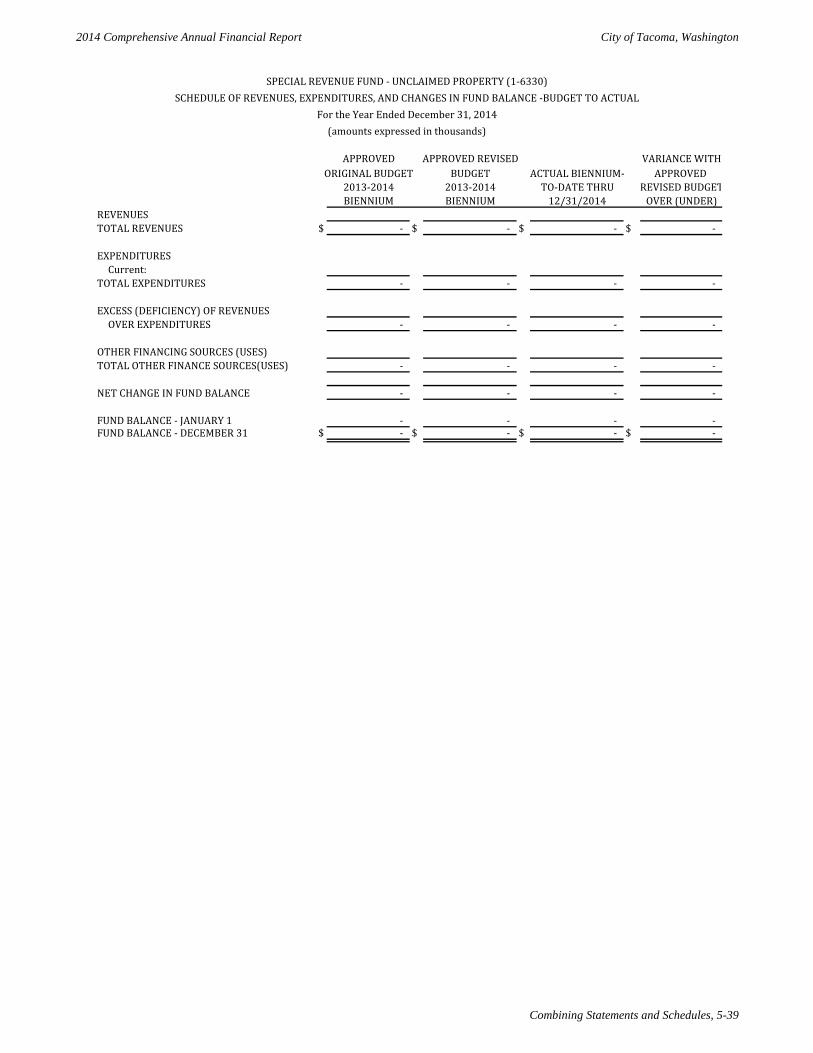
2014 Comprehensive Annual Financial Report City of Tacoma, Washington
Combining Statements and Schedules, 5-39
APPROVED APPROVED REVISED VARIANCE WITHORIGINAL BUDGET BUDGET ACTUAL BIENNIUM- APPROVED
2013-2014 2013-2014 TO-DATE THRU REVISED BUDGET BIENNIUM BIENNIUM 12/31/2014 OVER (UNDER)
REVENUESTOTAL REVENUES $ - $ - $ - $ -
EXPENDITURESCurrent:
TOTAL EXPENDITURES - - - -
EXCESS (DEFICIENCY) OF REVENUESOVER EXPENDITURES - - - -
OTHER FINANCING SOURCES (USES)TOTAL OTHER FINANCE SOURCES(USES) - - - -
NET CHANGE IN FUND BALANCE - - - -
FUND BALANCE - JANUARY 1 - - - - FUND BALANCE - DECEMBER 31 $ - $ - $ - $ -
SPECIAL REVENUE FUND - UNCLAIMED PROPERTY (1-6330)SCHEDULE OF REVENUES, EXPENDITURES, AND CHANGES IN FUND BALANCE -BUDGET TO ACTUAL
For the Year Ended December 31, 2014(amounts expressed in thousands)
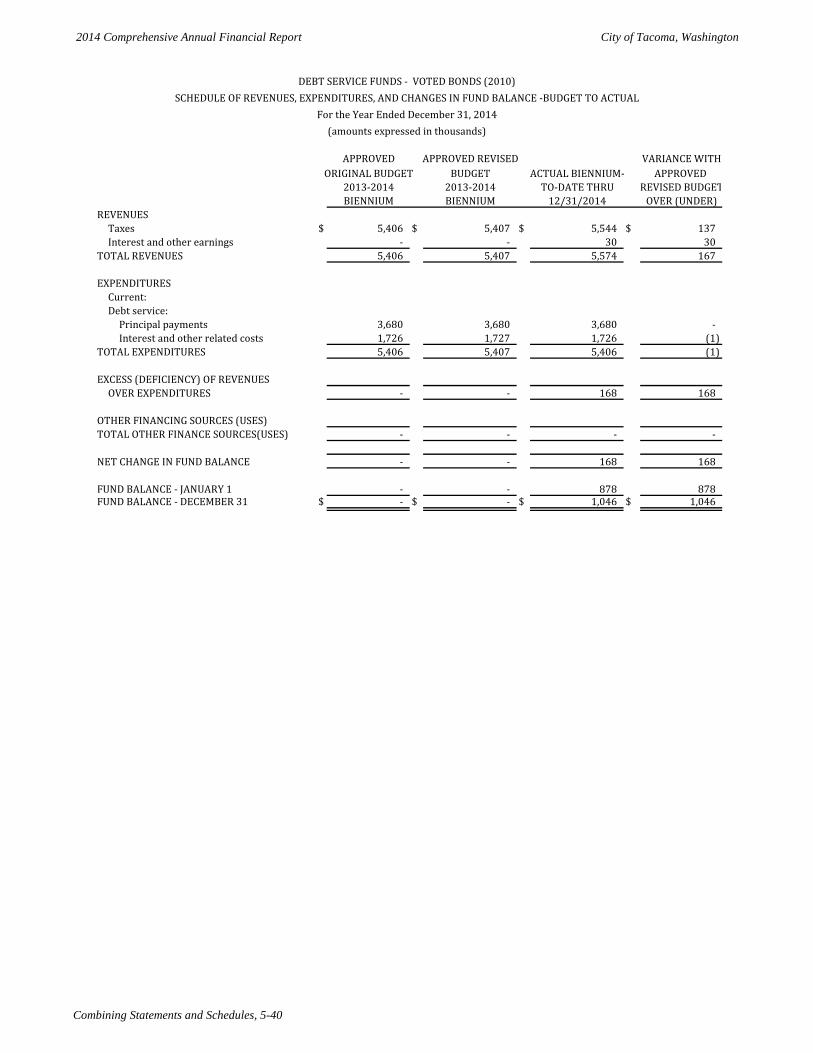
2014 Comprehensive Annual Financial Report City of Tacoma, Washington
Combining Statements and Schedules, 5-40
APPROVED APPROVED REVISED VARIANCE WITHORIGINAL BUDGET BUDGET ACTUAL BIENNIUM- APPROVED
2013-2014 2013-2014 TO-DATE THRU REVISED BUDGET BIENNIUM BIENNIUM 12/31/2014 OVER (UNDER)
REVENUESTaxes $ 5,406 $ 5,407 $ 5,544 $ 137 Interest and other earnings - - 30 30
TOTAL REVENUES 5,406 5,407 5,574 167
EXPENDITURESCurrent:Debt service:
Principal payments 3,680 3,680 3,680 - Interest and other related costs 1,726 1,727 1,726 (1)
TOTAL EXPENDITURES 5,406 5,407 5,406 (1)
EXCESS (DEFICIENCY) OF REVENUESOVER EXPENDITURES - - 168 168
OTHER FINANCING SOURCES (USES)TOTAL OTHER FINANCE SOURCES(USES) - - - -
NET CHANGE IN FUND BALANCE - - 168 168
FUND BALANCE - JANUARY 1 - - 878 878 FUND BALANCE - DECEMBER 31 $ - $ - $ 1,046 $ 1,046
DEBT SERVICE FUNDS - VOTED BONDS (2010)SCHEDULE OF REVENUES, EXPENDITURES, AND CHANGES IN FUND BALANCE -BUDGET TO ACTUAL
For the Year Ended December 31, 2014(amounts expressed in thousands)
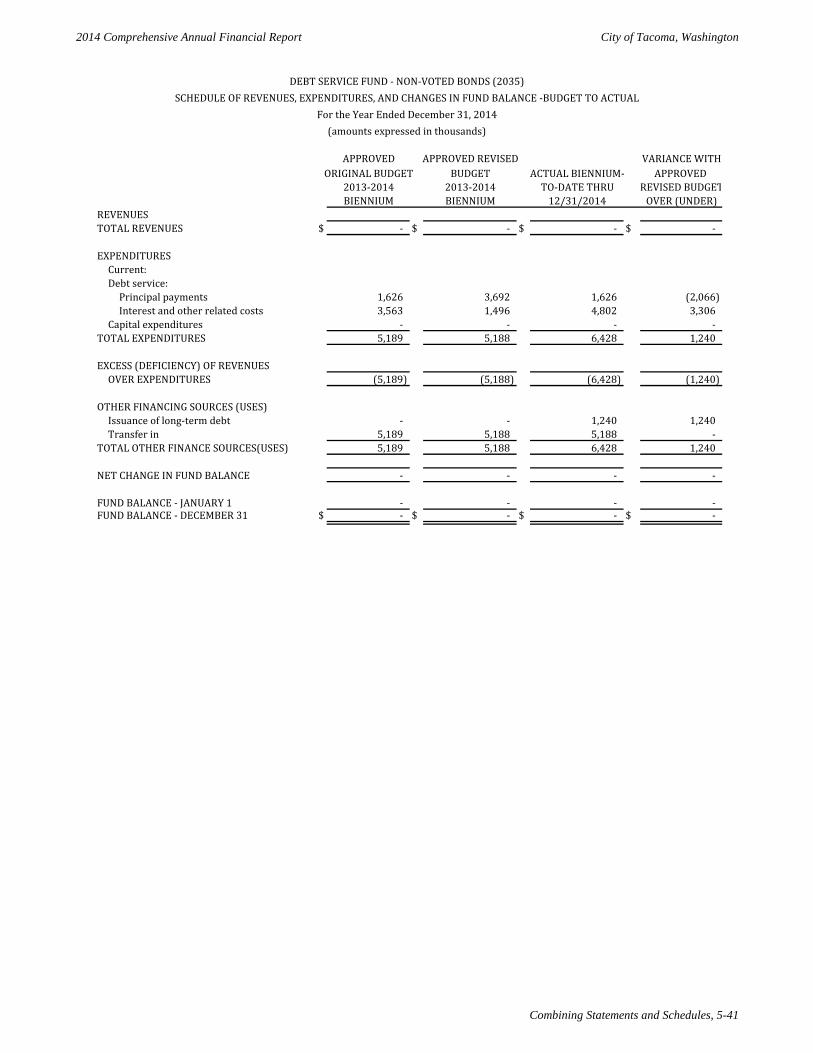
2014 Comprehensive Annual Financial Report City of Tacoma, Washington
Combining Statements and Schedules, 5-41
APPROVED APPROVED REVISED VARIANCE WITHORIGINAL BUDGET BUDGET ACTUAL BIENNIUM- APPROVED
2013-2014 2013-2014 TO-DATE THRU REVISED BUDGET BIENNIUM BIENNIUM 12/31/2014 OVER (UNDER)
REVENUESTOTAL REVENUES $ - $ - $ - $ -
EXPENDITURESCurrent:Debt service:
Principal payments 1,626 3,692 1,626 (2,066) Interest and other related costs 3,563 1,496 4,802 3,306
Capital expenditures - - - - TOTAL EXPENDITURES 5,189 5,188 6,428 1,240
EXCESS (DEFICIENCY) OF REVENUESOVER EXPENDITURES (5,189) (5,188) (6,428) (1,240)
OTHER FINANCING SOURCES (USES)Issuance of long-term debt - - 1,240 1,240 Transfer in 5,189 5,188 5,188 -
TOTAL OTHER FINANCE SOURCES(USES) 5,189 5,188 6,428 1,240
NET CHANGE IN FUND BALANCE - - - -
FUND BALANCE - JANUARY 1 - - - - FUND BALANCE - DECEMBER 31 $ - $ - $ - $ -
DEBT SERVICE FUND - NON-VOTED BONDS (2035)SCHEDULE OF REVENUES, EXPENDITURES, AND CHANGES IN FUND BALANCE -BUDGET TO ACTUAL
For the Year Ended December 31, 2014(amounts expressed in thousands)
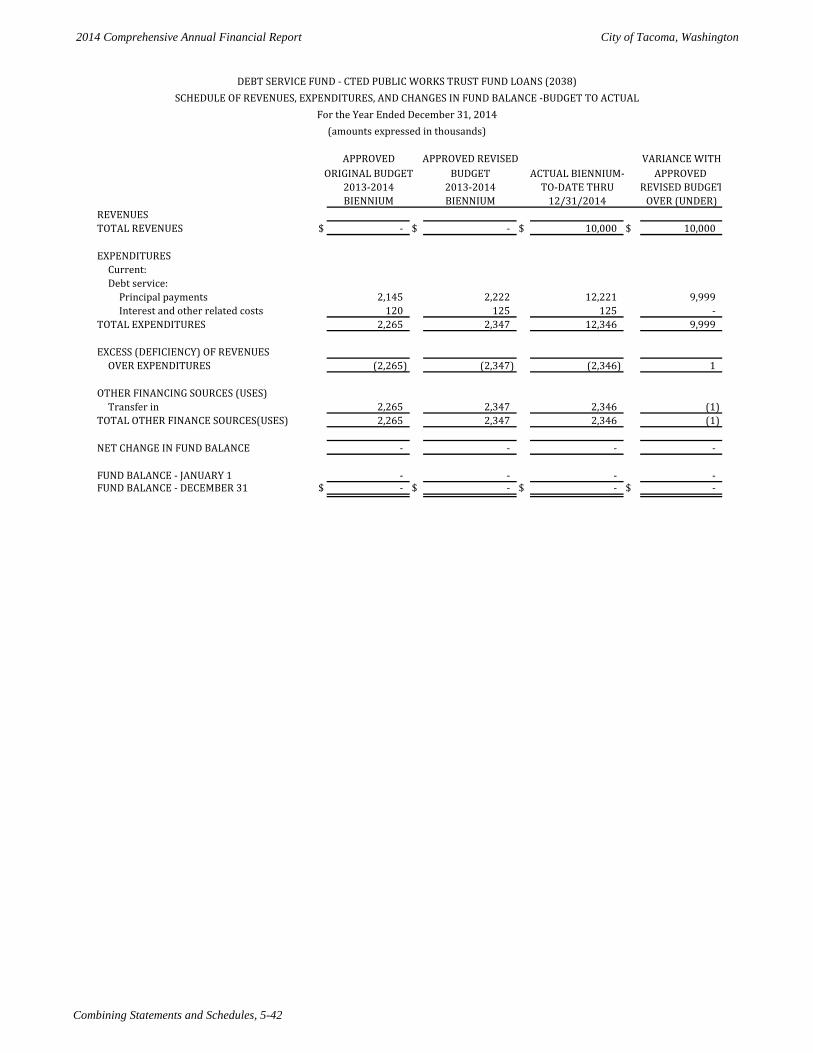
2014 Comprehensive Annual Financial Report City of Tacoma, Washington
Combining Statements and Schedules, 5-42
APPROVED APPROVED REVISED VARIANCE WITHORIGINAL BUDGET BUDGET ACTUAL BIENNIUM- APPROVED
2013-2014 2013-2014 TO-DATE THRU REVISED BUDGET BIENNIUM BIENNIUM 12/31/2014 OVER (UNDER)
REVENUESTOTAL REVENUES $ - $ - $ 10,000 $ 10,000
EXPENDITURESCurrent:Debt service:
Principal payments 2,145 2,222 12,221 9,999 Interest and other related costs 120 125 125 -
TOTAL EXPENDITURES 2,265 2,347 12,346 9,999
EXCESS (DEFICIENCY) OF REVENUESOVER EXPENDITURES (2,265) (2,347) (2,346) 1
OTHER FINANCING SOURCES (USES)Transfer in 2,265 2,347 2,346 (1)
TOTAL OTHER FINANCE SOURCES(USES) 2,265 2,347 2,346 (1)
NET CHANGE IN FUND BALANCE - - - -
FUND BALANCE - JANUARY 1 - - - - FUND BALANCE - DECEMBER 31 $ - $ - $ - $ -
DEBT SERVICE FUND - CTED PUBLIC WORKS TRUST FUND LOANS (2038)SCHEDULE OF REVENUES, EXPENDITURES, AND CHANGES IN FUND BALANCE -BUDGET TO ACTUAL
For the Year Ended December 31, 2014(amounts expressed in thousands)
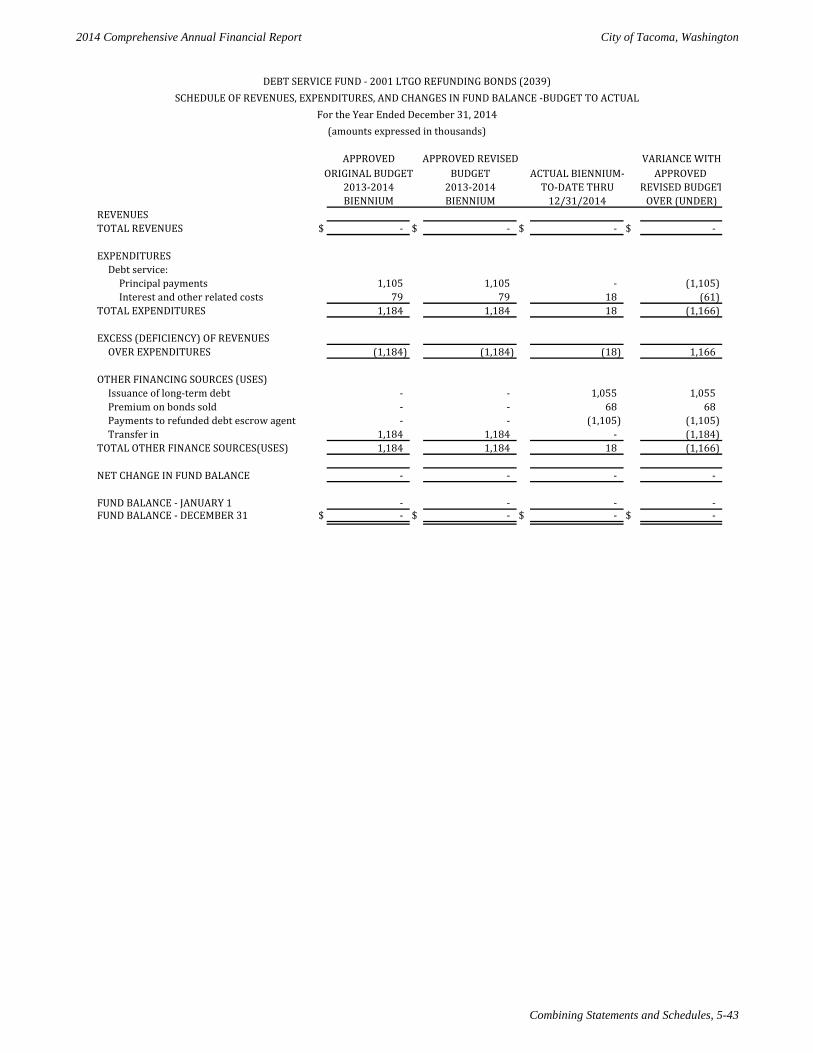
2014 Comprehensive Annual Financial Report City of Tacoma, Washington
Combining Statements and Schedules, 5-43
APPROVED APPROVED REVISED VARIANCE WITHORIGINAL BUDGET BUDGET ACTUAL BIENNIUM- APPROVED
2013-2014 2013-2014 TO-DATE THRU REVISED BUDGET BIENNIUM BIENNIUM 12/31/2014 OVER (UNDER)
REVENUESTOTAL REVENUES $ - $ - $ - $ -
EXPENDITURESDebt service:
Principal payments 1,105 1,105 - (1,105) Interest and other related costs 79 79 18 (61)
TOTAL EXPENDITURES 1,184 1,184 18 (1,166)
EXCESS (DEFICIENCY) OF REVENUESOVER EXPENDITURES (1,184) (1,184) (18) 1,166
OTHER FINANCING SOURCES (USES)Issuance of long-term debt - - 1,055 1,055 Premium on bonds sold - - 68 68 Payments to refunded debt escrow agent - - (1,105) (1,105) Transfer in 1,184 1,184 - (1,184)
TOTAL OTHER FINANCE SOURCES(USES) 1,184 1,184 18 (1,166)
NET CHANGE IN FUND BALANCE - - - -
FUND BALANCE - JANUARY 1 - - - - FUND BALANCE - DECEMBER 31 $ - $ - $ - $ -
DEBT SERVICE FUND - 2001 LTGO REFUNDING BONDS (2039)SCHEDULE OF REVENUES, EXPENDITURES, AND CHANGES IN FUND BALANCE -BUDGET TO ACTUAL
For the Year Ended December 31, 2014(amounts expressed in thousands)
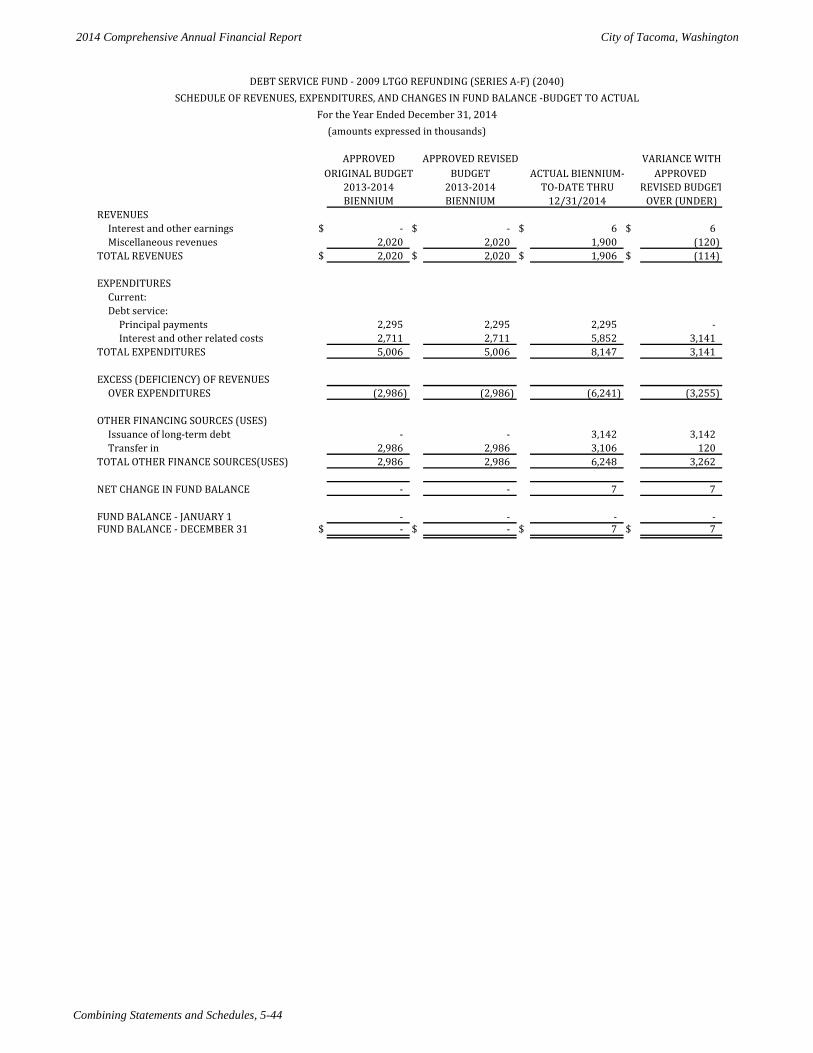
2014 Comprehensive Annual Financial Report City of Tacoma, Washington
Combining Statements and Schedules, 5-44
APPROVED APPROVED REVISED VARIANCE WITHORIGINAL BUDGET BUDGET ACTUAL BIENNIUM- APPROVED
2013-2014 2013-2014 TO-DATE THRU REVISED BUDGET BIENNIUM BIENNIUM 12/31/2014 OVER (UNDER)
REVENUESInterest and other earnings $ - $ - $ 6 $ 6 Miscellaneous revenues 2,020 2,020 1,900 (120)
TOTAL REVENUES $ 2,020 $ 2,020 $ 1,906 $ (114)
EXPENDITURESCurrent:Debt service:
Principal payments 2,295 2,295 2,295 - Interest and other related costs 2,711 2,711 5,852 3,141
TOTAL EXPENDITURES 5,006 5,006 8,147 3,141
EXCESS (DEFICIENCY) OF REVENUESOVER EXPENDITURES (2,986) (2,986) (6,241) (3,255)
OTHER FINANCING SOURCES (USES)Issuance of long-term debt - - 3,142 3,142 Transfer in 2,986 2,986 3,106 120
TOTAL OTHER FINANCE SOURCES(USES) 2,986 2,986 6,248 3,262
NET CHANGE IN FUND BALANCE - - 7 7
FUND BALANCE - JANUARY 1 - - - - FUND BALANCE - DECEMBER 31 $ - $ - $ 7 $ 7
DEBT SERVICE FUND - 2009 LTGO REFUNDING (SERIES A-F) (2040)SCHEDULE OF REVENUES, EXPENDITURES, AND CHANGES IN FUND BALANCE -BUDGET TO ACTUAL
For the Year Ended December 31, 2014(amounts expressed in thousands)
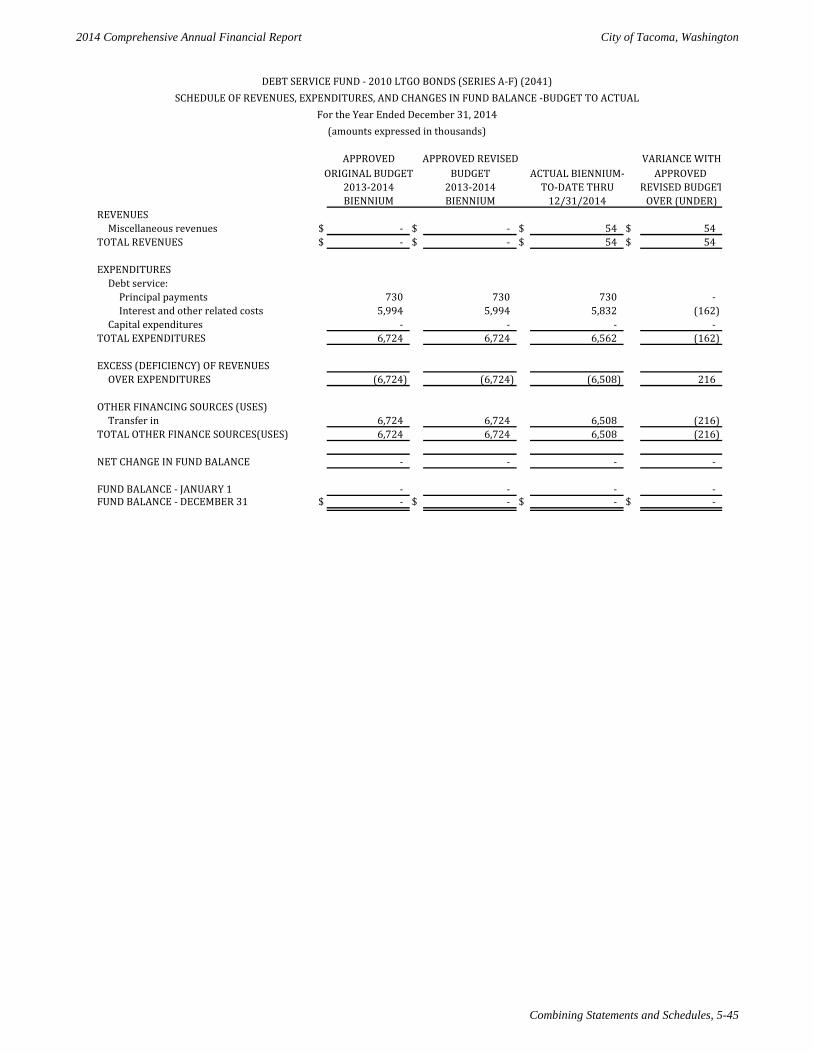
2014 Comprehensive Annual Financial Report City of Tacoma, Washington
Combining Statements and Schedules, 5-45
APPROVED APPROVED REVISED VARIANCE WITHORIGINAL BUDGET BUDGET ACTUAL BIENNIUM- APPROVED
2013-2014 2013-2014 TO-DATE THRU REVISED BUDGET BIENNIUM BIENNIUM 12/31/2014 OVER (UNDER)
REVENUESMiscellaneous revenues $ - $ - $ 54 $ 54
TOTAL REVENUES $ - $ - $ 54 $ 54
EXPENDITURESDebt service:
Principal payments 730 730 730 - Interest and other related costs 5,994 5,994 5,832 (162)
Capital expenditures - - - - TOTAL EXPENDITURES 6,724 6,724 6,562 (162)
EXCESS (DEFICIENCY) OF REVENUESOVER EXPENDITURES (6,724) (6,724) (6,508) 216
OTHER FINANCING SOURCES (USES)Transfer in 6,724 6,724 6,508 (216)
TOTAL OTHER FINANCE SOURCES(USES) 6,724 6,724 6,508 (216)
NET CHANGE IN FUND BALANCE - - - -
FUND BALANCE - JANUARY 1 - - - - FUND BALANCE - DECEMBER 31 $ - $ - $ - $ -
DEBT SERVICE FUND - 2010 LTGO BONDS (SERIES A-F) (2041)SCHEDULE OF REVENUES, EXPENDITURES, AND CHANGES IN FUND BALANCE -BUDGET TO ACTUAL
For the Year Ended December 31, 2014(amounts expressed in thousands)
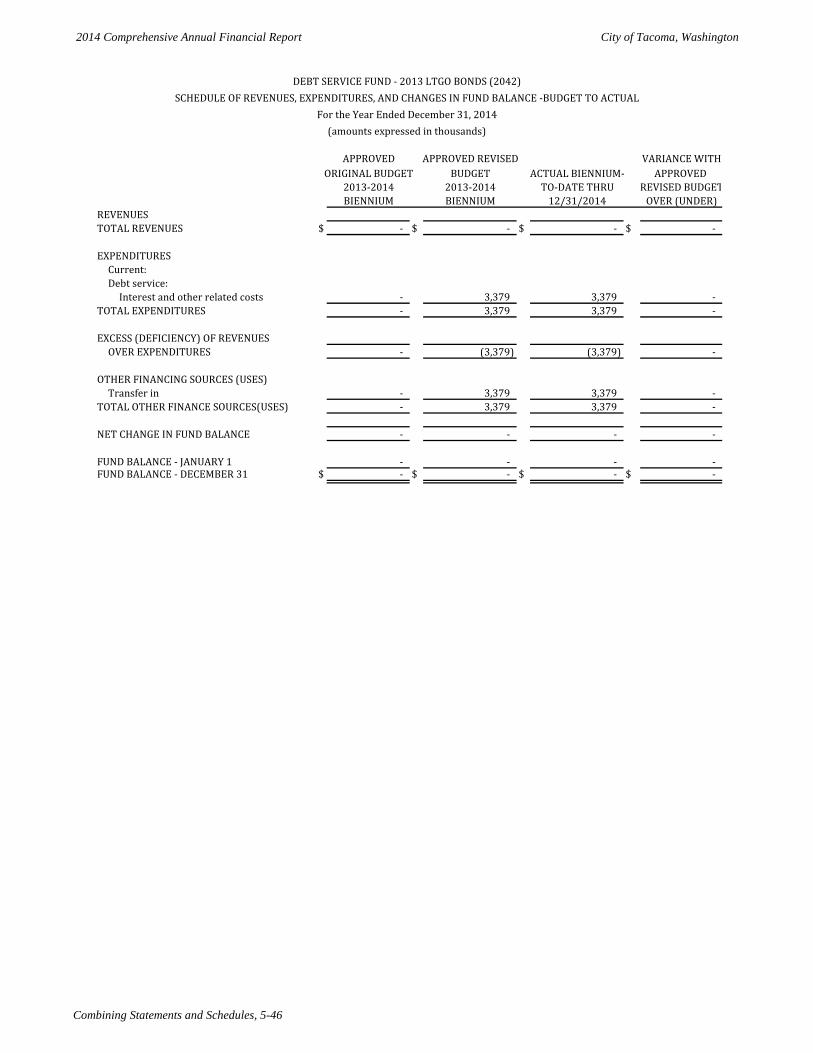
2014 Comprehensive Annual Financial Report City of Tacoma, Washington
Combining Statements and Schedules, 5-46
APPROVED APPROVED REVISED VARIANCE WITHORIGINAL BUDGET BUDGET ACTUAL BIENNIUM- APPROVED
2013-2014 2013-2014 TO-DATE THRU REVISED BUDGET BIENNIUM BIENNIUM 12/31/2014 OVER (UNDER)
REVENUESTOTAL REVENUES $ - $ - $ - $ -
EXPENDITURESCurrent:Debt service:
Interest and other related costs - 3,379 3,379 - TOTAL EXPENDITURES - 3,379 3,379 -
EXCESS (DEFICIENCY) OF REVENUESOVER EXPENDITURES - (3,379) (3,379) -
OTHER FINANCING SOURCES (USES)Transfer in - 3,379 3,379 -
TOTAL OTHER FINANCE SOURCES(USES) - 3,379 3,379 -
NET CHANGE IN FUND BALANCE - - - -
FUND BALANCE - JANUARY 1 - - - - FUND BALANCE - DECEMBER 31 $ - $ - $ - $ -
DEBT SERVICE FUND - 2013 LTGO BONDS (2042)SCHEDULE OF REVENUES, EXPENDITURES, AND CHANGES IN FUND BALANCE -BUDGET TO ACTUAL
For the Year Ended December 31, 2014(amounts expressed in thousands)
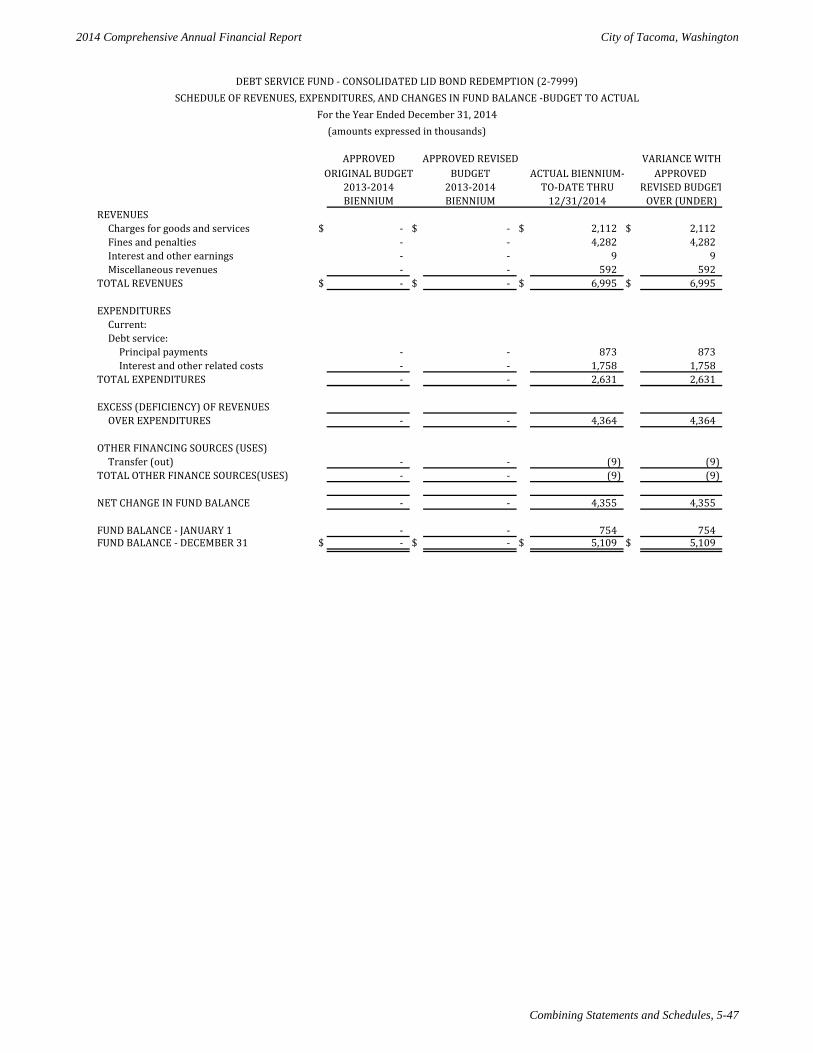
2014 Comprehensive Annual Financial Report City of Tacoma, Washington
Combining Statements and Schedules, 5-47
APPROVED APPROVED REVISED VARIANCE WITHORIGINAL BUDGET BUDGET ACTUAL BIENNIUM- APPROVED
2013-2014 2013-2014 TO-DATE THRU REVISED BUDGET BIENNIUM BIENNIUM 12/31/2014 OVER (UNDER)
REVENUESCharges for goods and services $ - $ - $ 2,112 $ 2,112 Fines and penalties - - 4,282 4,282 Interest and other earnings - - 9 9 Miscellaneous revenues - - 592 592
TOTAL REVENUES $ - $ - $ 6,995 $ 6,995
EXPENDITURESCurrent:Debt service:
Principal payments - - 873 873 Interest and other related costs - - 1,758 1,758
TOTAL EXPENDITURES - - 2,631 2,631
EXCESS (DEFICIENCY) OF REVENUESOVER EXPENDITURES - - 4,364 4,364
OTHER FINANCING SOURCES (USES)Transfer (out) - - (9) (9)
TOTAL OTHER FINANCE SOURCES(USES) - - (9) (9)
NET CHANGE IN FUND BALANCE - - 4,355 4,355
FUND BALANCE - JANUARY 1 - - 754 754 FUND BALANCE - DECEMBER 31 $ - $ - $ 5,109 $ 5,109
DEBT SERVICE FUND - CONSOLIDATED LID BOND REDEMPTION (2-7999)SCHEDULE OF REVENUES, EXPENDITURES, AND CHANGES IN FUND BALANCE -BUDGET TO ACTUAL
For the Year Ended December 31, 2014(amounts expressed in thousands)
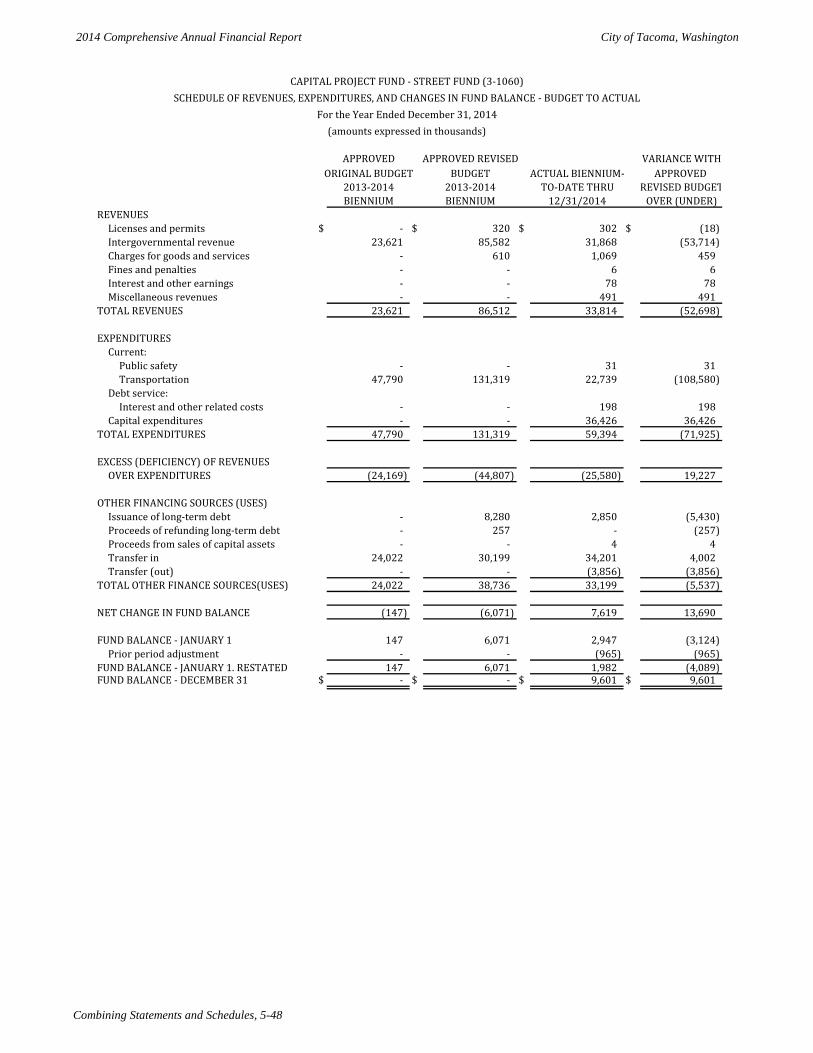
2014 Comprehensive Annual Financial Report City of Tacoma, Washington
Combining Statements and Schedules, 5-48
APPROVED APPROVED REVISED VARIANCE WITHORIGINAL BUDGET BUDGET ACTUAL BIENNIUM- APPROVED
2013-2014 2013-2014 TO-DATE THRU REVISED BUDGET BIENNIUM BIENNIUM 12/31/2014 OVER (UNDER)
REVENUESLicenses and permits $ - $ 320 $ 302 $ (18) Intergovernmental revenue 23,621 85,582 31,868 (53,714) Charges for goods and services - 610 1,069 459 Fines and penalties - - 6 6 Interest and other earnings - - 78 78 Miscellaneous revenues - - 491 491
TOTAL REVENUES 23,621 86,512 33,814 (52,698)
EXPENDITURESCurrent:
Public safety - - 31 31 Transportation 47,790 131,319 22,739 (108,580)
Debt service:Interest and other related costs - - 198 198
Capital expenditures - - 36,426 36,426 TOTAL EXPENDITURES 47,790 131,319 59,394 (71,925)
EXCESS (DEFICIENCY) OF REVENUESOVER EXPENDITURES (24,169) (44,807) (25,580) 19,227
OTHER FINANCING SOURCES (USES)Issuance of long-term debt - 8,280 2,850 (5,430) Proceeds of refunding long-term debt - 257 - (257) Proceeds from sales of capital assets - - 4 4 Transfer in 24,022 30,199 34,201 4,002 Transfer (out) - - (3,856) (3,856)
TOTAL OTHER FINANCE SOURCES(USES) 24,022 38,736 33,199 (5,537)
NET CHANGE IN FUND BALANCE (147) (6,071) 7,619 13,690
FUND BALANCE - JANUARY 1 147 6,071 2,947 (3,124) Prior period adjustment - - (965) (965)
FUND BALANCE - JANUARY 1. RESTATED 147 6,071 1,982 (4,089) FUND BALANCE - DECEMBER 31 $ - $ - $ 9,601 $ 9,601
CAPITAL PROJECT FUND - STREET FUND (3-1060)SCHEDULE OF REVENUES, EXPENDITURES, AND CHANGES IN FUND BALANCE - BUDGET TO ACTUAL
For the Year Ended December 31, 2014(amounts expressed in thousands)
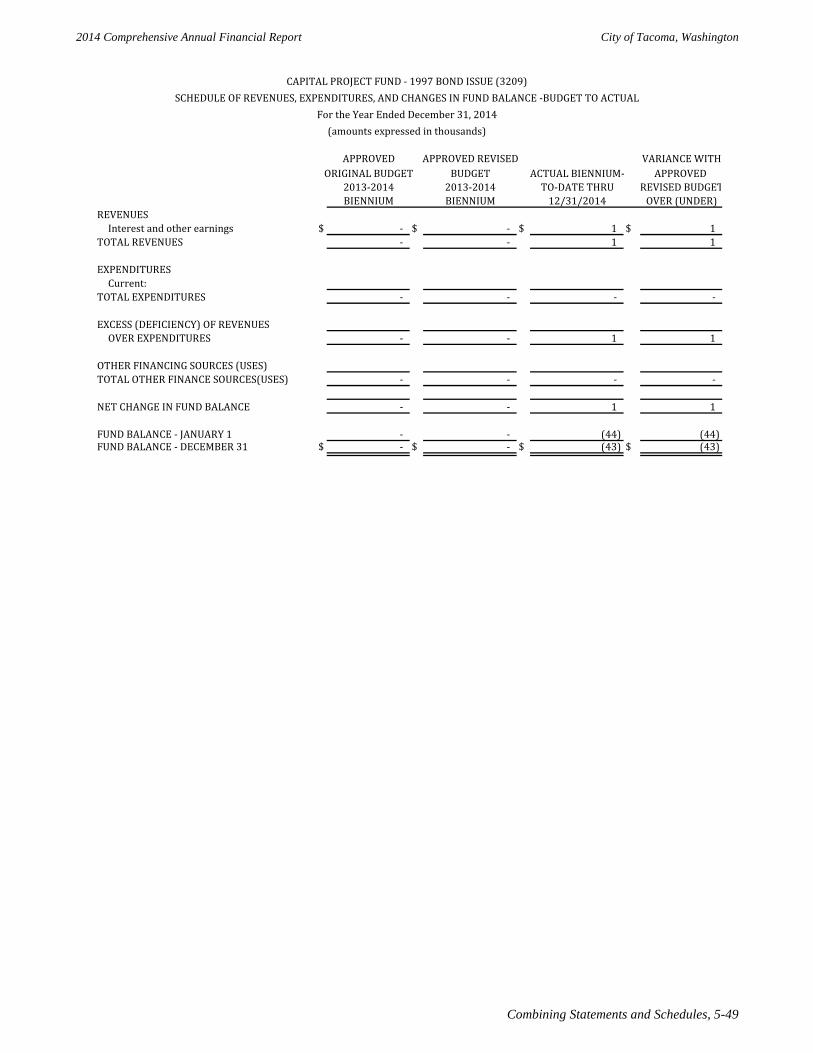
2014 Comprehensive Annual Financial Report City of Tacoma, Washington
Combining Statements and Schedules, 5-49
APPROVED APPROVED REVISED VARIANCE WITHORIGINAL BUDGET BUDGET ACTUAL BIENNIUM- APPROVED
2013-2014 2013-2014 TO-DATE THRU REVISED BUDGET BIENNIUM BIENNIUM 12/31/2014 OVER (UNDER)
REVENUESInterest and other earnings $ - $ - $ 1 $ 1
TOTAL REVENUES - - 1 1
EXPENDITURESCurrent:
TOTAL EXPENDITURES - - - -
EXCESS (DEFICIENCY) OF REVENUESOVER EXPENDITURES - - 1 1
OTHER FINANCING SOURCES (USES)TOTAL OTHER FINANCE SOURCES(USES) - - - -
NET CHANGE IN FUND BALANCE - - 1 1
FUND BALANCE - JANUARY 1 - - (44) (44) FUND BALANCE - DECEMBER 31 $ - $ - $ (43) $ (43)
CAPITAL PROJECT FUND - 1997 BOND ISSUE (3209)SCHEDULE OF REVENUES, EXPENDITURES, AND CHANGES IN FUND BALANCE -BUDGET TO ACTUAL
For the Year Ended December 31, 2014(amounts expressed in thousands)
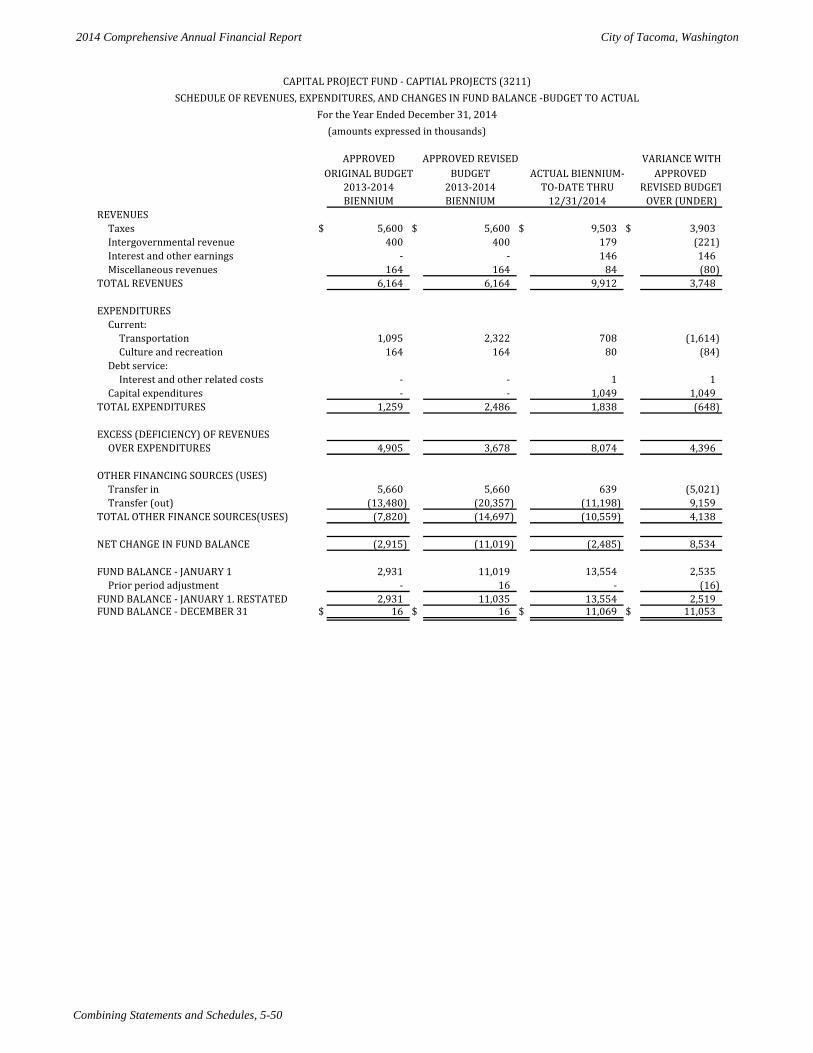
2014 Comprehensive Annual Financial Report City of Tacoma, Washington
Combining Statements and Schedules, 5-50
APPROVED APPROVED REVISED VARIANCE WITHORIGINAL BUDGET BUDGET ACTUAL BIENNIUM- APPROVED
2013-2014 2013-2014 TO-DATE THRU REVISED BUDGET BIENNIUM BIENNIUM 12/31/2014 OVER (UNDER)
REVENUESTaxes $ 5,600 $ 5,600 $ 9,503 $ 3,903 Intergovernmental revenue 400 400 179 (221) Interest and other earnings - - 146 146 Miscellaneous revenues 164 164 84 (80)
TOTAL REVENUES 6,164 6,164 9,912 3,748
EXPENDITURESCurrent:
Transportation 1,095 2,322 708 (1,614) Culture and recreation 164 164 80 (84)
Debt service:Interest and other related costs - - 1 1
Capital expenditures - - 1,049 1,049 TOTAL EXPENDITURES 1,259 2,486 1,838 (648)
EXCESS (DEFICIENCY) OF REVENUESOVER EXPENDITURES 4,905 3,678 8,074 4,396
OTHER FINANCING SOURCES (USES)Transfer in 5,660 5,660 639 (5,021) Transfer (out) (13,480) (20,357) (11,198) 9,159
TOTAL OTHER FINANCE SOURCES(USES) (7,820) (14,697) (10,559) 4,138
NET CHANGE IN FUND BALANCE (2,915) (11,019) (2,485) 8,534
FUND BALANCE - JANUARY 1 2,931 11,019 13,554 2,535 Prior period adjustment - 16 - (16)
FUND BALANCE - JANUARY 1. RESTATED 2,931 11,035 13,554 2,519 FUND BALANCE - DECEMBER 31 $ 16 $ 16 $ 11,069 $ 11,053
CAPITAL PROJECT FUND - CAPTIAL PROJECTS (3211)SCHEDULE OF REVENUES, EXPENDITURES, AND CHANGES IN FUND BALANCE -BUDGET TO ACTUAL
For the Year Ended December 31, 2014(amounts expressed in thousands)
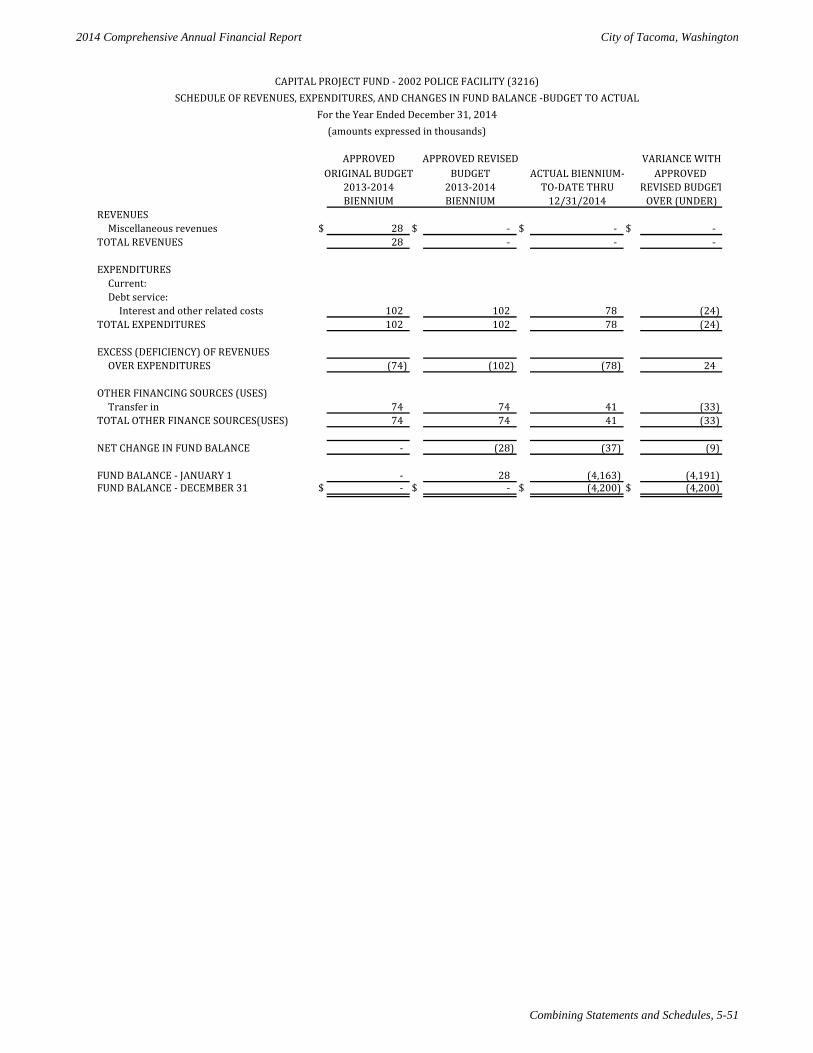
2014 Comprehensive Annual Financial Report City of Tacoma, Washington
Combining Statements and Schedules, 5-51
APPROVED APPROVED REVISED VARIANCE WITHORIGINAL BUDGET BUDGET ACTUAL BIENNIUM- APPROVED
2013-2014 2013-2014 TO-DATE THRU REVISED BUDGET BIENNIUM BIENNIUM 12/31/2014 OVER (UNDER)
REVENUESMiscellaneous revenues $ 28 $ - $ - $ -
TOTAL REVENUES 28 - - -
EXPENDITURESCurrent:Debt service:
Interest and other related costs 102 102 78 (24) TOTAL EXPENDITURES 102 102 78 (24)
EXCESS (DEFICIENCY) OF REVENUESOVER EXPENDITURES (74) (102) (78) 24
OTHER FINANCING SOURCES (USES)Transfer in 74 74 41 (33)
TOTAL OTHER FINANCE SOURCES(USES) 74 74 41 (33)
NET CHANGE IN FUND BALANCE - (28) (37) (9)
FUND BALANCE - JANUARY 1 - 28 (4,163) (4,191) FUND BALANCE - DECEMBER 31 $ - $ - $ (4,200) $ (4,200)
CAPITAL PROJECT FUND - 2002 POLICE FACILITY (3216)SCHEDULE OF REVENUES, EXPENDITURES, AND CHANGES IN FUND BALANCE -BUDGET TO ACTUAL
For the Year Ended December 31, 2014(amounts expressed in thousands)
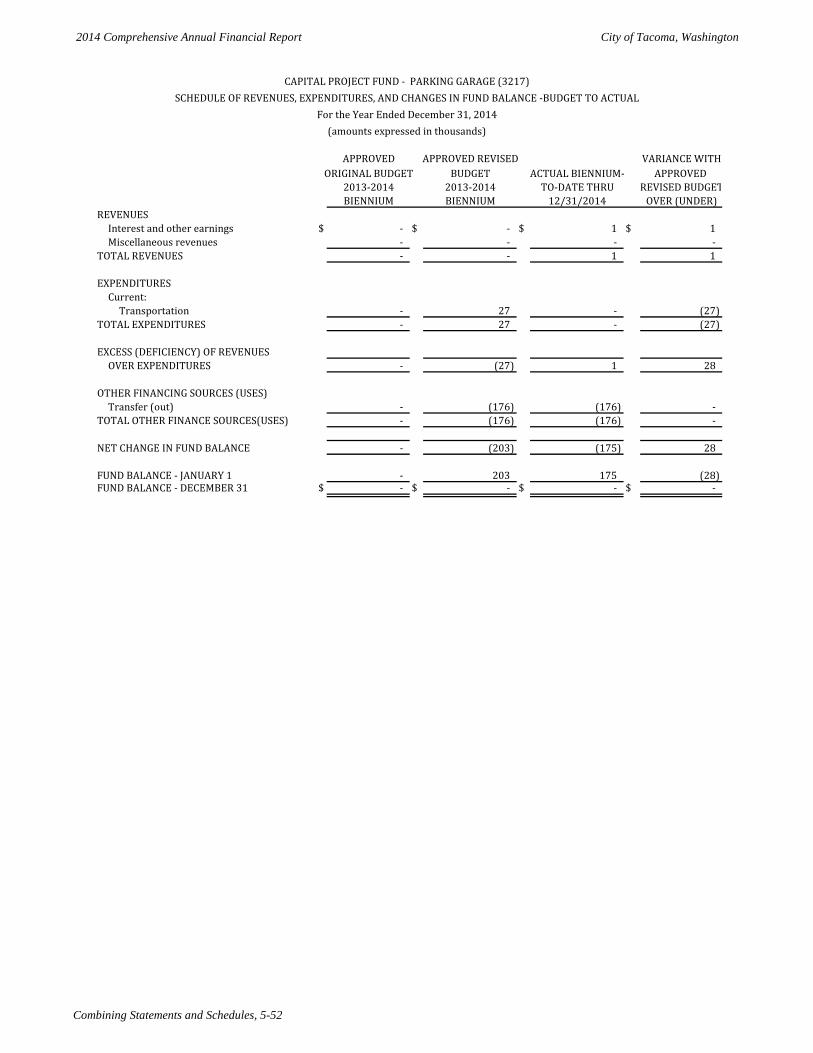
2014 Comprehensive Annual Financial Report City of Tacoma, Washington
Combining Statements and Schedules, 5-52
APPROVED APPROVED REVISED VARIANCE WITHORIGINAL BUDGET BUDGET ACTUAL BIENNIUM- APPROVED
2013-2014 2013-2014 TO-DATE THRU REVISED BUDGET BIENNIUM BIENNIUM 12/31/2014 OVER (UNDER)
REVENUESInterest and other earnings $ - $ - $ 1 $ 1 Miscellaneous revenues - - - -
TOTAL REVENUES - - 1 1
EXPENDITURESCurrent:
Transportation - 27 - (27) TOTAL EXPENDITURES - 27 - (27)
EXCESS (DEFICIENCY) OF REVENUESOVER EXPENDITURES - (27) 1 28
OTHER FINANCING SOURCES (USES)Transfer (out) - (176) (176) -
TOTAL OTHER FINANCE SOURCES(USES) - (176) (176) -
NET CHANGE IN FUND BALANCE - (203) (175) 28
FUND BALANCE - JANUARY 1 - 203 175 (28) FUND BALANCE - DECEMBER 31 $ - $ - $ - $ -
CAPITAL PROJECT FUND - PARKING GARAGE (3217)SCHEDULE OF REVENUES, EXPENDITURES, AND CHANGES IN FUND BALANCE -BUDGET TO ACTUAL
For the Year Ended December 31, 2014(amounts expressed in thousands)
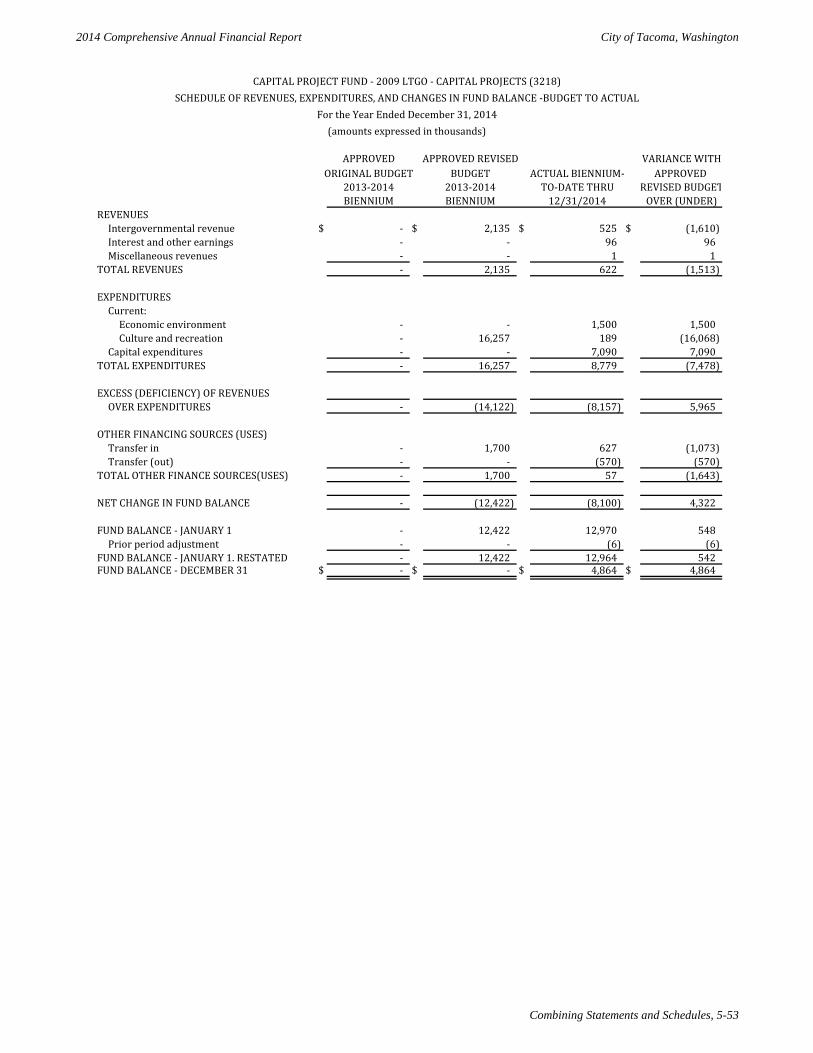
2014 Comprehensive Annual Financial Report City of Tacoma, Washington
Combining Statements and Schedules, 5-53
APPROVED APPROVED REVISED VARIANCE WITHORIGINAL BUDGET BUDGET ACTUAL BIENNIUM- APPROVED
2013-2014 2013-2014 TO-DATE THRU REVISED BUDGET BIENNIUM BIENNIUM 12/31/2014 OVER (UNDER)
REVENUESIntergovernmental revenue $ - $ 2,135 $ 525 $ (1,610) Interest and other earnings - - 96 96 Miscellaneous revenues - - 1 1
TOTAL REVENUES - 2,135 622 (1,513)
EXPENDITURESCurrent:
Economic environment - - 1,500 1,500 Culture and recreation - 16,257 189 (16,068)
Capital expenditures - - 7,090 7,090 TOTAL EXPENDITURES - 16,257 8,779 (7,478)
EXCESS (DEFICIENCY) OF REVENUESOVER EXPENDITURES - (14,122) (8,157) 5,965
OTHER FINANCING SOURCES (USES)Transfer in - 1,700 627 (1,073) Transfer (out) - - (570) (570)
TOTAL OTHER FINANCE SOURCES(USES) - 1,700 57 (1,643)
NET CHANGE IN FUND BALANCE - (12,422) (8,100) 4,322
FUND BALANCE - JANUARY 1 - 12,422 12,970 548 Prior period adjustment - - (6) (6)
FUND BALANCE - JANUARY 1. RESTATED - 12,422 12,964 542 FUND BALANCE - DECEMBER 31 $ - $ - $ 4,864 $ 4,864
CAPITAL PROJECT FUND - 2009 LTGO - CAPITAL PROJECTS (3218)SCHEDULE OF REVENUES, EXPENDITURES, AND CHANGES IN FUND BALANCE -BUDGET TO ACTUAL
For the Year Ended December 31, 2014(amounts expressed in thousands)
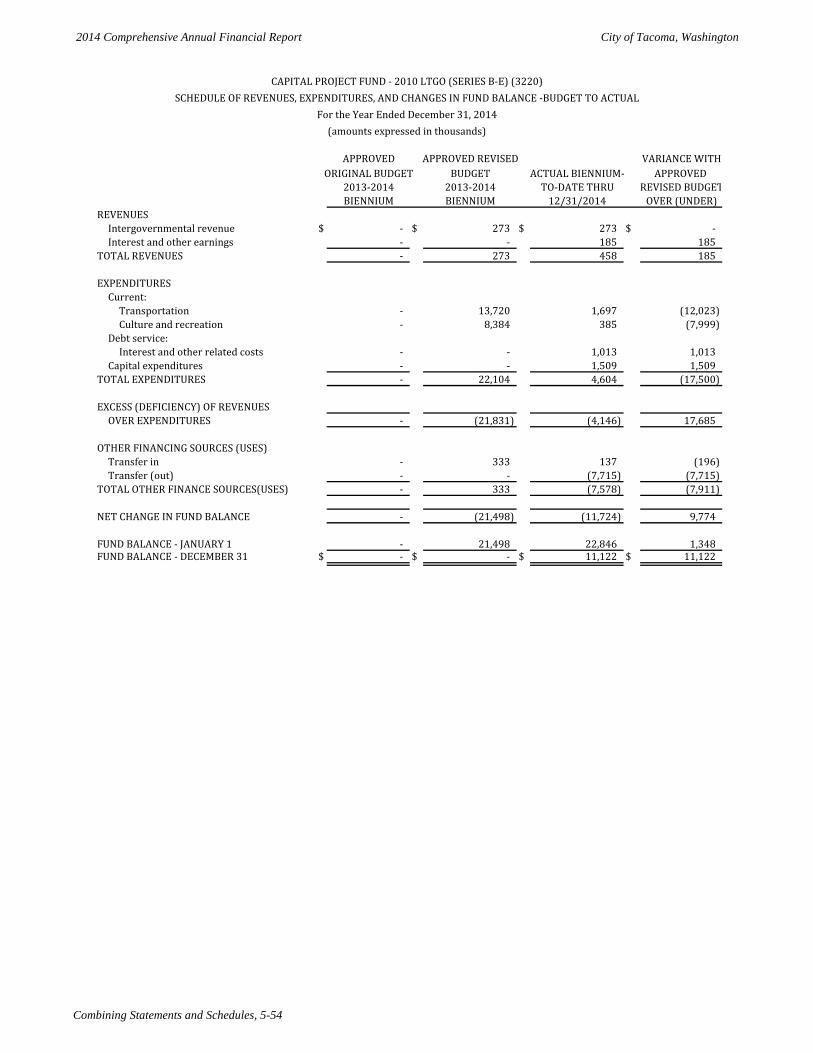
2014 Comprehensive Annual Financial Report City of Tacoma, Washington
Combining Statements and Schedules, 5-54
APPROVED APPROVED REVISED VARIANCE WITHORIGINAL BUDGET BUDGET ACTUAL BIENNIUM- APPROVED
2013-2014 2013-2014 TO-DATE THRU REVISED BUDGET BIENNIUM BIENNIUM 12/31/2014 OVER (UNDER)
REVENUESIntergovernmental revenue $ - $ 273 $ 273 $ - Interest and other earnings - - 185 185
TOTAL REVENUES - 273 458 185
EXPENDITURESCurrent:
Transportation - 13,720 1,697 (12,023) Culture and recreation - 8,384 385 (7,999)
Debt service:Interest and other related costs - - 1,013 1,013
Capital expenditures - - 1,509 1,509 TOTAL EXPENDITURES - 22,104 4,604 (17,500)
EXCESS (DEFICIENCY) OF REVENUESOVER EXPENDITURES - (21,831) (4,146) 17,685
OTHER FINANCING SOURCES (USES)Transfer in - 333 137 (196) Transfer (out) - - (7,715) (7,715)
TOTAL OTHER FINANCE SOURCES(USES) - 333 (7,578) (7,911)
NET CHANGE IN FUND BALANCE - (21,498) (11,724) 9,774
FUND BALANCE - JANUARY 1 - 21,498 22,846 1,348 FUND BALANCE - DECEMBER 31 $ - $ - $ 11,122 $ 11,122
CAPITAL PROJECT FUND - 2010 LTGO (SERIES B-E) (3220)SCHEDULE OF REVENUES, EXPENDITURES, AND CHANGES IN FUND BALANCE -BUDGET TO ACTUAL
For the Year Ended December 31, 2014(amounts expressed in thousands)
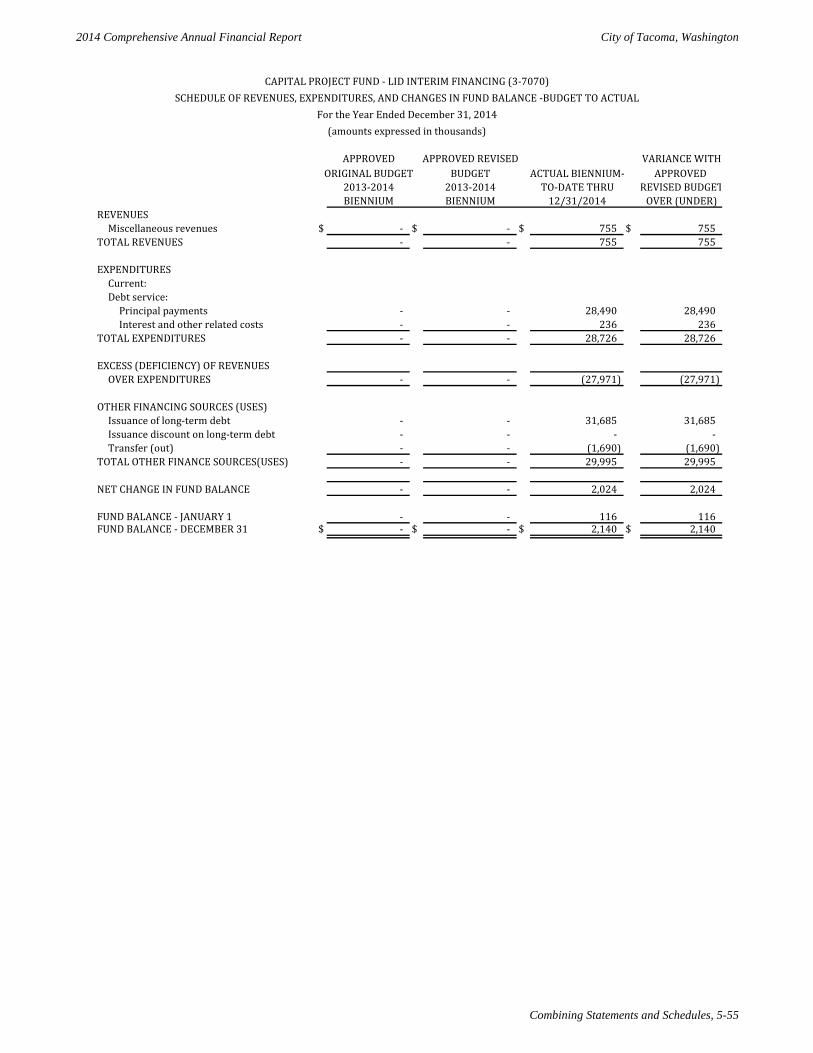
2014 Comprehensive Annual Financial Report City of Tacoma, Washington
Combining Statements and Schedules, 5-55
APPROVED APPROVED REVISED VARIANCE WITHORIGINAL BUDGET BUDGET ACTUAL BIENNIUM- APPROVED
2013-2014 2013-2014 TO-DATE THRU REVISED BUDGET BIENNIUM BIENNIUM 12/31/2014 OVER (UNDER)
REVENUESMiscellaneous revenues $ - $ - $ 755 $ 755
TOTAL REVENUES - - 755 755
EXPENDITURESCurrent:Debt service:
Principal payments - - 28,490 28,490 Interest and other related costs - - 236 236
TOTAL EXPENDITURES - - 28,726 28,726
EXCESS (DEFICIENCY) OF REVENUESOVER EXPENDITURES - - (27,971) (27,971)
OTHER FINANCING SOURCES (USES)Issuance of long-term debt - - 31,685 31,685 Issuance discount on long-term debt - - - - Transfer (out) - - (1,690) (1,690)
TOTAL OTHER FINANCE SOURCES(USES) - - 29,995 29,995
NET CHANGE IN FUND BALANCE - - 2,024 2,024
FUND BALANCE - JANUARY 1 - - 116 116 FUND BALANCE - DECEMBER 31 $ - $ - $ 2,140 $ 2,140
CAPITAL PROJECT FUND - LID INTERIM FINANCING (3-7070)SCHEDULE OF REVENUES, EXPENDITURES, AND CHANGES IN FUND BALANCE -BUDGET TO ACTUAL
For the Year Ended December 31, 2014(amounts expressed in thousands)

2014 Comprehensive Annual Financial Report City of Tacoma, Washington
Combining Statements and Schedules, 5-56
PERMIT TACOMA RAIL PARKINGSERVICES MOUNTAIN DIV OPERATING
FUND #4110 FUND #4120 FUND #4140ASSETS
Current assets:Cash and cash equivalents $ 3,863 $ 860 $ 2,196 Accounts receivable (net) 35 357 16 Due from other funds 7 - 35 Inventory - - - Prepayments 96 - 187
Current restricted assets:C&CE - debt services, deposits and replacements - 13 - C&CE - other special purposes - - -
Total restricted assets - 13 - Total current assets 4,001 1,230 2,434
Non-current assets:Notes and contracts receivable (non-current) - - -
Capital assets:Land - 1,361 11,806 Property, plant, and equipment 268 28,499 51,538 Less: accumulated depreciation (63) (7,322) (12,129) Construction work in progress - 244 11
Total capital assets net of depreciation 205 22,782 51,226 Total non-current assets 205 22,782 51,226
TOTAL ASSETS 4,206 24,012 53,660
DEFERRED OUTFLOW OF RESOURCESUnamortized loss on refunding - - -
TOTAL DEFERRED OUTFLOW OF RESOURCES $ - $ - $ -
COMBINING STATEMENT OF NET POSITIONNON-MAJOR ENTERPRISE FUNDS
December 31, 2014(amounts expressed in thousands)
Page 1 of 8
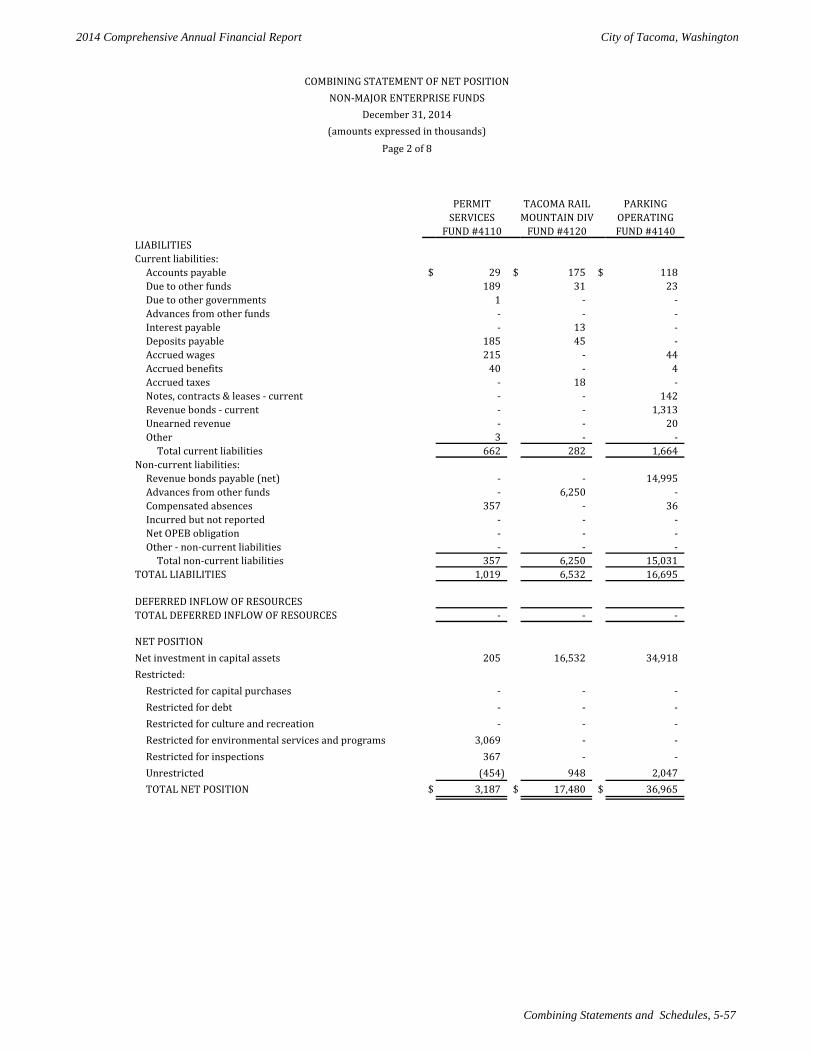
2014 Comprehensive Annual Financial Report City of Tacoma, Washington
Combining Statements and Schedules, 5-57
PERMIT TACOMA RAIL PARKINGSERVICES MOUNTAIN DIV OPERATING
FUND #4110 FUND #4120 FUND #4140LIABILITIESCurrent liabilities:
Accounts payable $ 29 $ 175 $ 118 Due to other funds 189 31 23 Due to other governments 1 - - Advances from other funds - - - Interest payable - 13 - Deposits payable 185 45 - Accrued wages 215 - 44 Accrued benefits 40 - 4 Accrued taxes - 18 - Notes, contracts & leases - current - - 142 Revenue bonds - current - - 1,313 Unearned revenue - - 20 Other 3 - -
Total current liabilities 662 282 1,664 Non-current liabilities:
Revenue bonds payable (net) - - 14,995 Advances from other funds - 6,250 - Compensated absences 357 - 36 Incurred but not reported - - - Net OPEB obligation - - - Other - non-current liabilities - - -
Total non-current liabilities 357 6,250 15,031 TOTAL LIABILITIES 1,019 6,532 16,695
DEFERRED INFLOW OF RESOURCESTOTAL DEFERRED INFLOW OF RESOURCES - - -
NET POSITIONNet investment in capital assets 205 16,532 34,918 Restricted:
Restricted for capital purchases - - - Restricted for debt - - - Restricted for culture and recreation - - - Restricted for environmental services and programs 3,069 - - Restricted for inspections 367 - - Unrestricted (454) 948 2,047 TOTAL NET POSITION $ 3,187 $ 17,480 $ 36,965
COMBINING STATEMENT OF NET POSITIONNON-MAJOR ENTERPRISE FUNDS
December 31, 2014(amounts expressed in thousands)
Page 2 of 8
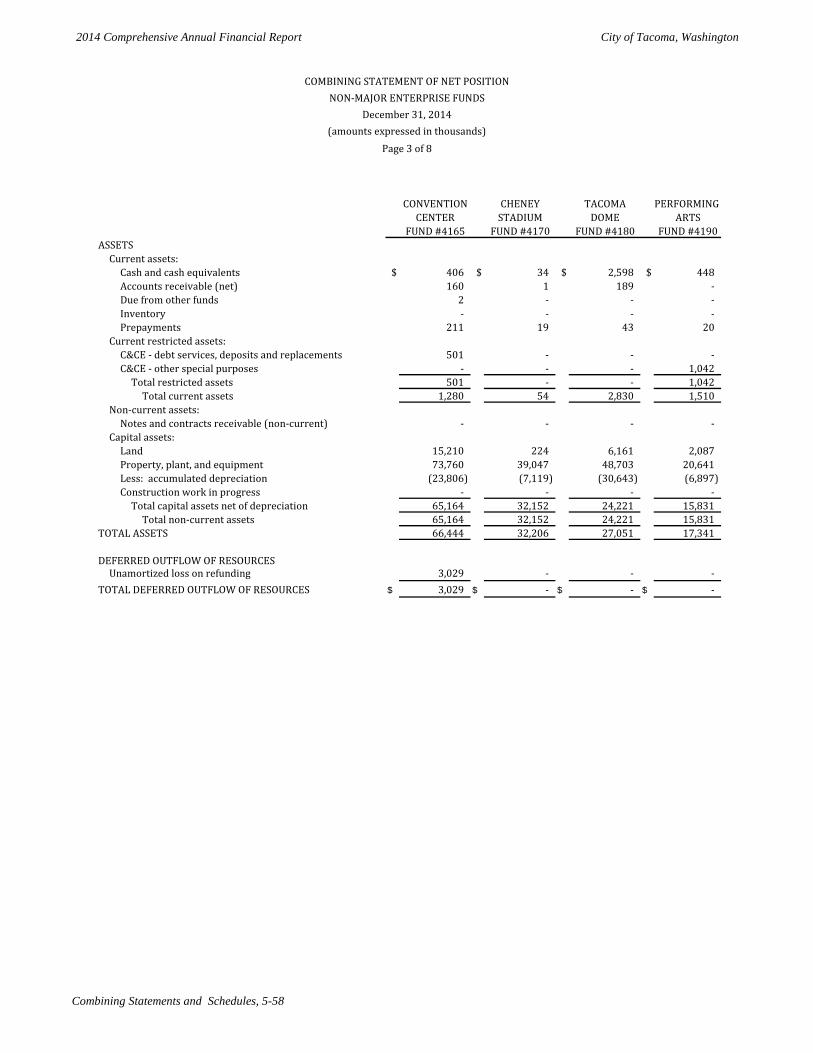
2014 Comprehensive Annual Financial Report City of Tacoma, Washington
Combining Statements and Schedules, 5-58
CONVENTION CHENEY TACOMA PERFORMING CENTER STADIUM DOME ARTS
FUND #4165 FUND #4170 FUND #4180 FUND #4190ASSETS
Current assets:Cash and cash equivalents $ 406 $ 34 $ 2,598 $ 448 Accounts receivable (net) 160 1 189 - Due from other funds 2 - - - Inventory - - - - Prepayments 211 19 43 20
Current restricted assets:C&CE - debt services, deposits and replacements 501 - - - C&CE - other special purposes - - - 1,042
Total restricted assets 501 - - 1,042 Total current assets 1,280 54 2,830 1,510
Non-current assets:Notes and contracts receivable (non-current) - - - -
Capital assets:Land 15,210 224 6,161 2,087 Property, plant, and equipment 73,760 39,047 48,703 20,641 Less: accumulated depreciation (23,806) (7,119) (30,643) (6,897) Construction work in progress - - - -
Total capital assets net of depreciation 65,164 32,152 24,221 15,831 Total non-current assets 65,164 32,152 24,221 15,831
TOTAL ASSETS 66,444 32,206 27,051 17,341
DEFERRED OUTFLOW OF RESOURCESUnamortized loss on refunding 3,029 - - -
TOTAL DEFERRED OUTFLOW OF RESOURCES $ 3,029 $ - $ - $ -
COMBINING STATEMENT OF NET POSITIONNON-MAJOR ENTERPRISE FUNDS
December 31, 2014(amounts expressed in thousands)
Page 3 of 8
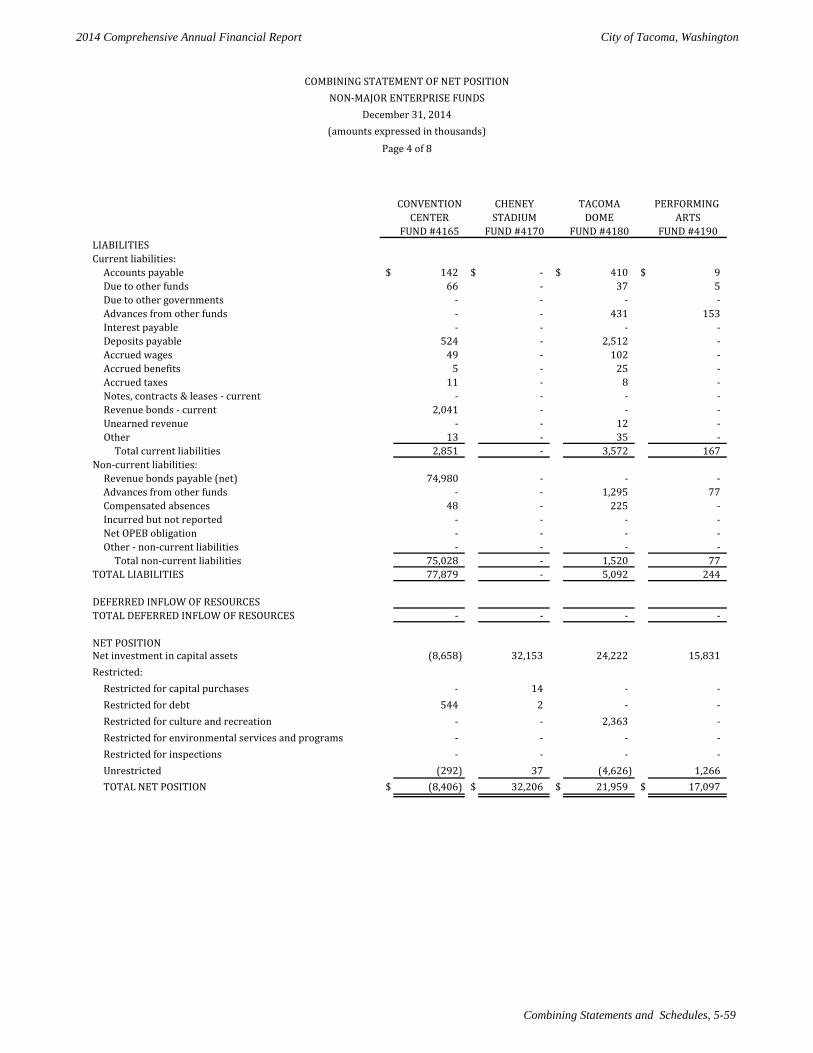
2014 Comprehensive Annual Financial Report City of Tacoma, Washington
Combining Statements and Schedules, 5-59
CONVENTION CHENEY TACOMA PERFORMING CENTER STADIUM DOME ARTS
FUND #4165 FUND #4170 FUND #4180 FUND #4190LIABILITIESCurrent liabilities:
Accounts payable $ 142 $ - $ 410 $ 9 Due to other funds 66 - 37 5 Due to other governments - - - - Advances from other funds - - 431 153 Interest payable - - - - Deposits payable 524 - 2,512 - Accrued wages 49 - 102 - Accrued benefits 5 - 25 - Accrued taxes 11 - 8 - Notes, contracts & leases - current - - - - Revenue bonds - current 2,041 - - - Unearned revenue - - 12 - Other 13 - 35 -
Total current liabilities 2,851 - 3,572 167 Non-current liabilities:
Revenue bonds payable (net) 74,980 - - - Advances from other funds - - 1,295 77 Compensated absences 48 - 225 - Incurred but not reported - - - - Net OPEB obligation - - - - Other - non-current liabilities - - - -
Total non-current liabilities 75,028 - 1,520 77 TOTAL LIABILITIES 77,879 - 5,092 244
DEFERRED INFLOW OF RESOURCESTOTAL DEFERRED INFLOW OF RESOURCES - - - -
NET POSITIONNet investment in capital assets (8,658) 32,153 24,222 15,831 Restricted:
Restricted for capital purchases - 14 - - Restricted for debt 544 2 - - Restricted for culture and recreation - - 2,363 - Restricted for environmental services and programs - - - - Restricted for inspections - - - - Unrestricted (292) 37 (4,626) 1,266 TOTAL NET POSITION $ (8,406) $ 32,206 $ 21,959 $ 17,097
COMBINING STATEMENT OF NET POSITIONNON-MAJOR ENTERPRISE FUNDS
December 31, 2014(amounts expressed in thousands)
Page 4 of 8
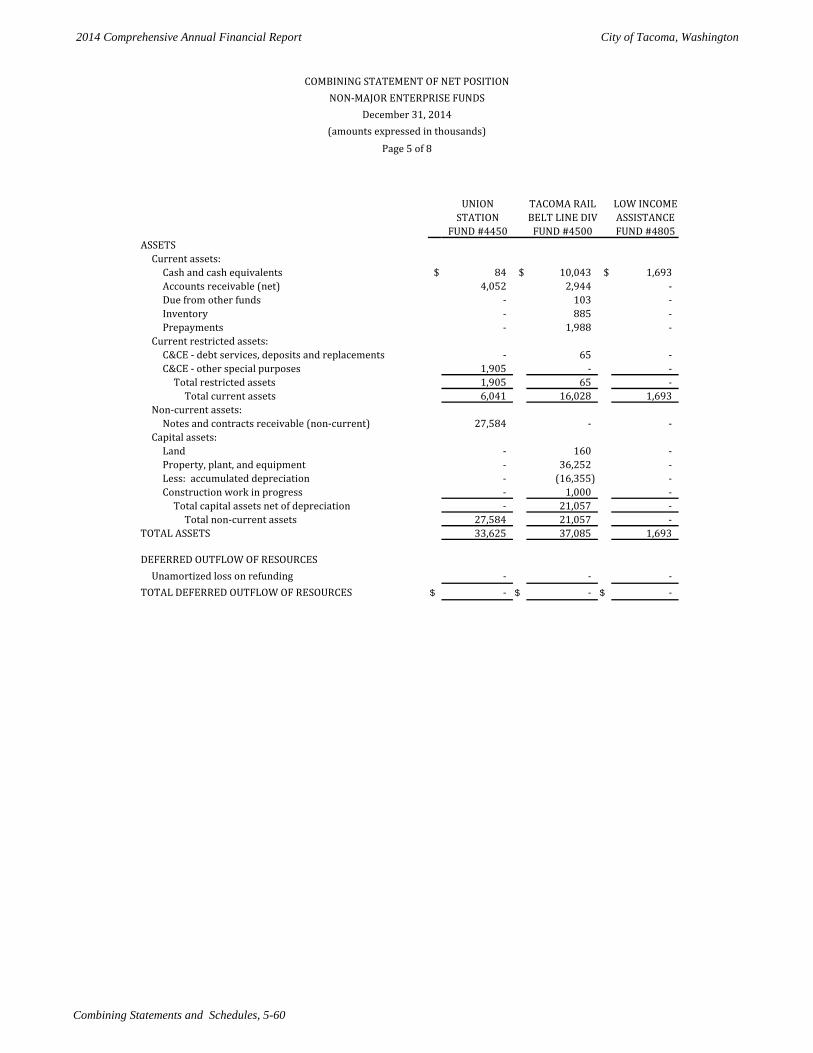
2014 Comprehensive Annual Financial Report City of Tacoma, Washington
Combining Statements and Schedules, 5-60
UNION TACOMA RAIL LOW INCOMESTATION BELT LINE DIV ASSISTANCE
FUND #4450 FUND #4500 FUND #4805ASSETS
Current assets:Cash and cash equivalents $ 84 $ 10,043 $ 1,693 Accounts receivable (net) 4,052 2,944 - Due from other funds - 103 - Inventory - 885 - Prepayments - 1,988 -
Current restricted assets:C&CE - debt services, deposits and replacements - 65 - C&CE - other special purposes 1,905 - -
Total restricted assets 1,905 65 - Total current assets 6,041 16,028 1,693
Non-current assets:Notes and contracts receivable (non-current) 27,584 - -
Capital assets:Land - 160 - Property, plant, and equipment - 36,252 - Less: accumulated depreciation - (16,355) - Construction work in progress - 1,000 -
Total capital assets net of depreciation - 21,057 - Total non-current assets 27,584 21,057 -
TOTAL ASSETS 33,625 37,085 1,693
DEFERRED OUTFLOW OF RESOURCESUnamortized loss on refunding - - -
TOTAL DEFERRED OUTFLOW OF RESOURCES $ - $ - $ -
COMBINING STATEMENT OF NET POSITIONNON-MAJOR ENTERPRISE FUNDS
December 31, 2014(amounts expressed in thousands)
Page 5 of 8
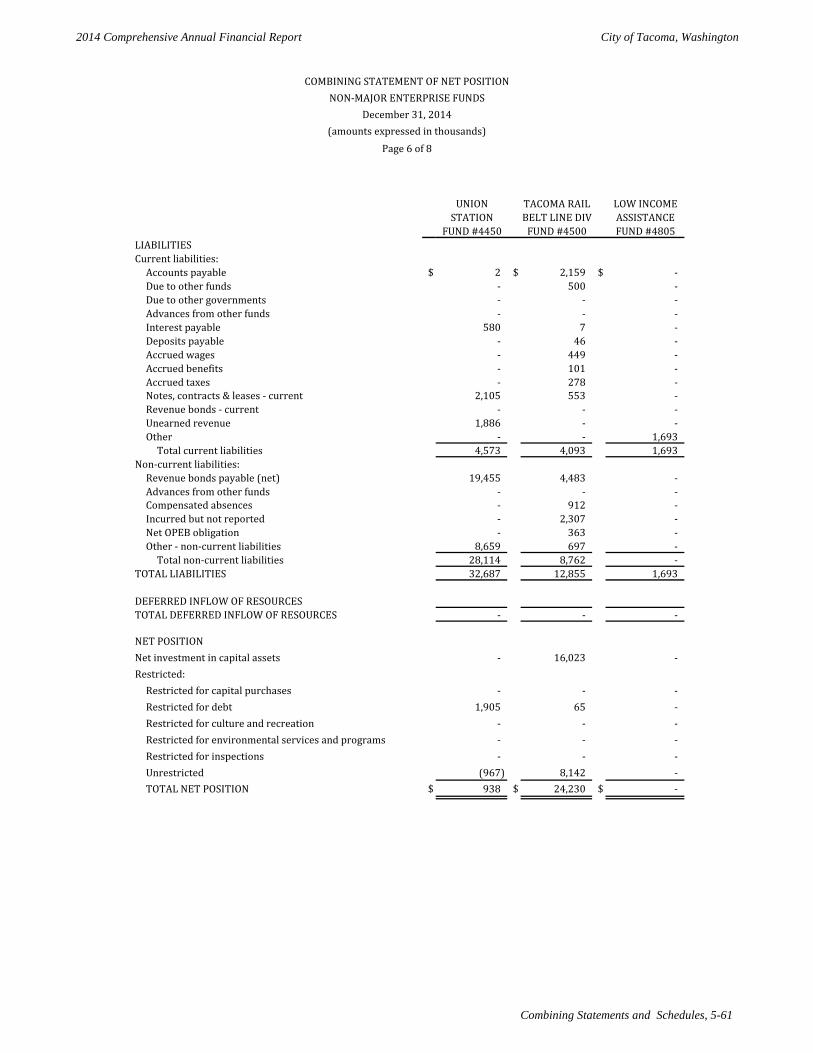
2014 Comprehensive Annual Financial Report City of Tacoma, Washington
Combining Statements and Schedules, 5-61
UNION TACOMA RAIL LOW INCOMESTATION BELT LINE DIV ASSISTANCE
FUND #4450 FUND #4500 FUND #4805LIABILITIESCurrent liabilities:
Accounts payable $ 2 $ 2,159 $ - Due to other funds - 500 - Due to other governments - - - Advances from other funds - - - Interest payable 580 7 - Deposits payable - 46 - Accrued wages - 449 - Accrued benefits - 101 - Accrued taxes - 278 - Notes, contracts & leases - current 2,105 553 - Revenue bonds - current - - - Unearned revenue 1,886 - - Other - - 1,693
Total current liabilities 4,573 4,093 1,693 Non-current liabilities:
Revenue bonds payable (net) 19,455 4,483 - Advances from other funds - - - Compensated absences - 912 - Incurred but not reported - 2,307 - Net OPEB obligation - 363 - Other - non-current liabilities 8,659 697 -
Total non-current liabilities 28,114 8,762 - TOTAL LIABILITIES 32,687 12,855 1,693
DEFERRED INFLOW OF RESOURCESTOTAL DEFERRED INFLOW OF RESOURCES - - -
NET POSITIONNet investment in capital assets - 16,023 - Restricted:
Restricted for capital purchases - - - Restricted for debt 1,905 65 - Restricted for culture and recreation - - - Restricted for environmental services and programs - - - Restricted for inspections - - - Unrestricted (967) 8,142 - TOTAL NET POSITION $ 938 $ 24,230 $ -
COMBINING STATEMENT OF NET POSITIONNON-MAJOR ENTERPRISE FUNDS
December 31, 2014(amounts expressed in thousands)
Page 6 of 8
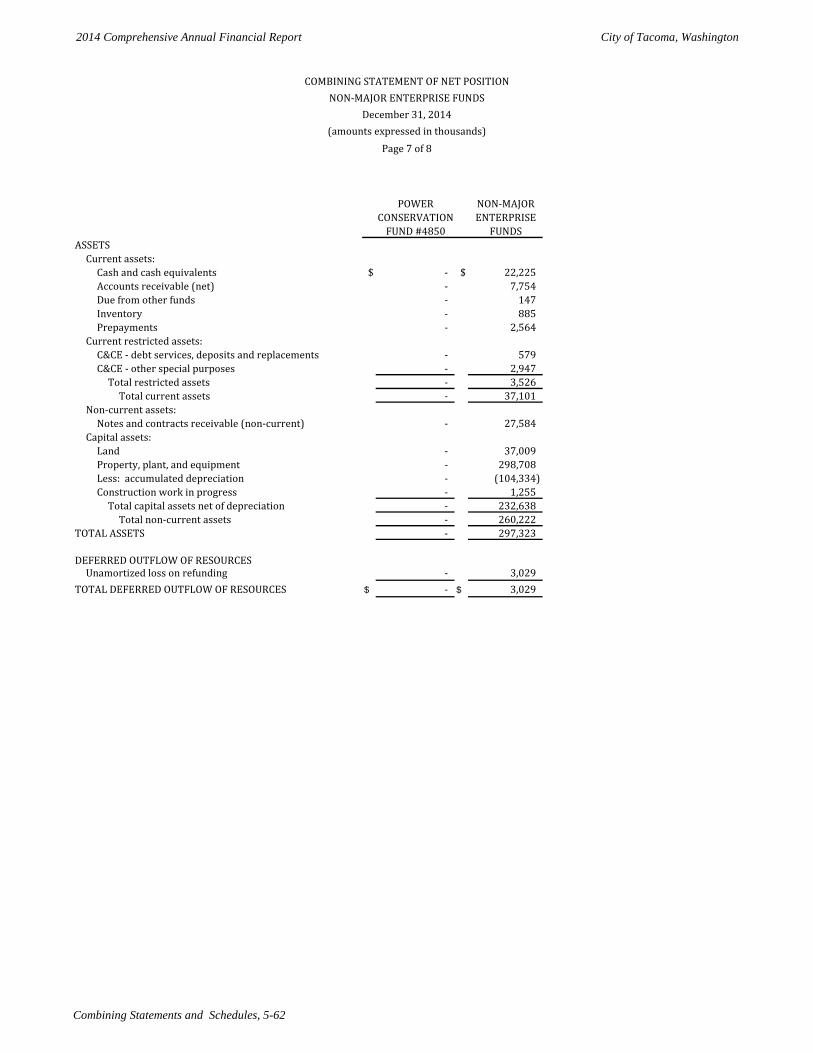
2014 Comprehensive Annual Financial Report City of Tacoma, Washington
Combining Statements and Schedules, 5-62
POWER NON-MAJORCONSERVATION ENTERPRISE
FUND #4850 FUNDSASSETS
Current assets:Cash and cash equivalents $ - $ 22,225 Accounts receivable (net) - 7,754 Due from other funds - 147 Inventory - 885 Prepayments - 2,564
Current restricted assets:C&CE - debt services, deposits and replacements - 579 C&CE - other special purposes - 2,947
Total restricted assets - 3,526 Total current assets - 37,101
Non-current assets:Notes and contracts receivable (non-current) - 27,584
Capital assets:Land - 37,009 Property, plant, and equipment - 298,708 Less: accumulated depreciation - (104,334) Construction work in progress - 1,255
Total capital assets net of depreciation - 232,638 Total non-current assets - 260,222
TOTAL ASSETS - 297,323
DEFERRED OUTFLOW OF RESOURCESUnamortized loss on refunding - 3,029
TOTAL DEFERRED OUTFLOW OF RESOURCES $ - $ 3,029
COMBINING STATEMENT OF NET POSITIONNON-MAJOR ENTERPRISE FUNDS
December 31, 2014(amounts expressed in thousands)
Page 7 of 8
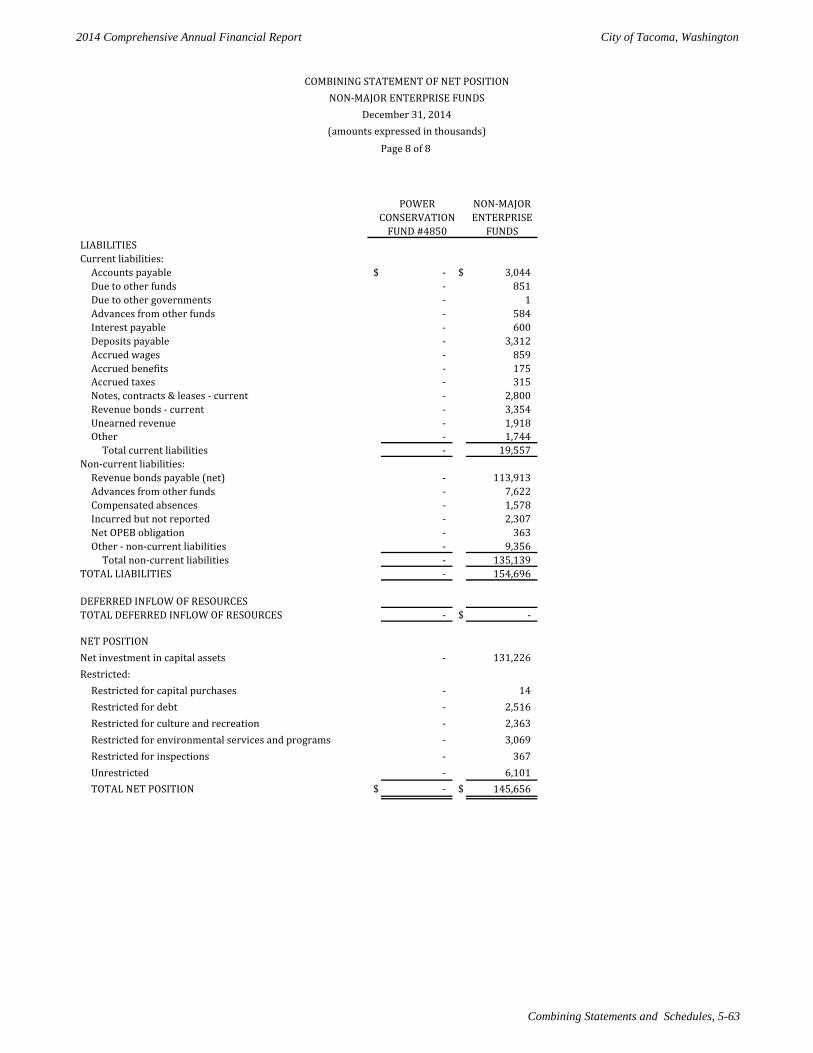
2014 Comprehensive Annual Financial Report City of Tacoma, Washington
Combining Statements and Schedules, 5-63
POWER NON-MAJORCONSERVATION ENTERPRISE
FUND #4850 FUNDSLIABILITIESCurrent liabilities:
Accounts payable $ - $ 3,044 Due to other funds - 851 Due to other governments - 1 Advances from other funds - 584 Interest payable - 600 Deposits payable - 3,312 Accrued wages - 859 Accrued benefits - 175 Accrued taxes - 315 Notes, contracts & leases - current - 2,800 Revenue bonds - current - 3,354 Unearned revenue - 1,918 Other - 1,744
Total current liabilities - 19,557 Non-current liabilities:
Revenue bonds payable (net) - 113,913 Advances from other funds - 7,622 Compensated absences - 1,578 Incurred but not reported - 2,307 Net OPEB obligation - 363 Other - non-current liabilities - 9,356
Total non-current liabilities - 135,139 TOTAL LIABILITIES - 154,696
DEFERRED INFLOW OF RESOURCESTOTAL DEFERRED INFLOW OF RESOURCES - $ -
NET POSITIONNet investment in capital assets - 131,226 Restricted:
Restricted for capital purchases - 14 Restricted for debt - 2,516 Restricted for culture and recreation - 2,363 Restricted for environmental services and programs - 3,069 Restricted for inspections - 367 Unrestricted - 6,101 TOTAL NET POSITION $ - $ 145,656
COMBINING STATEMENT OF NET POSITIONNON-MAJOR ENTERPRISE FUNDS
December 31, 2014(amounts expressed in thousands)
Page 8 of 8
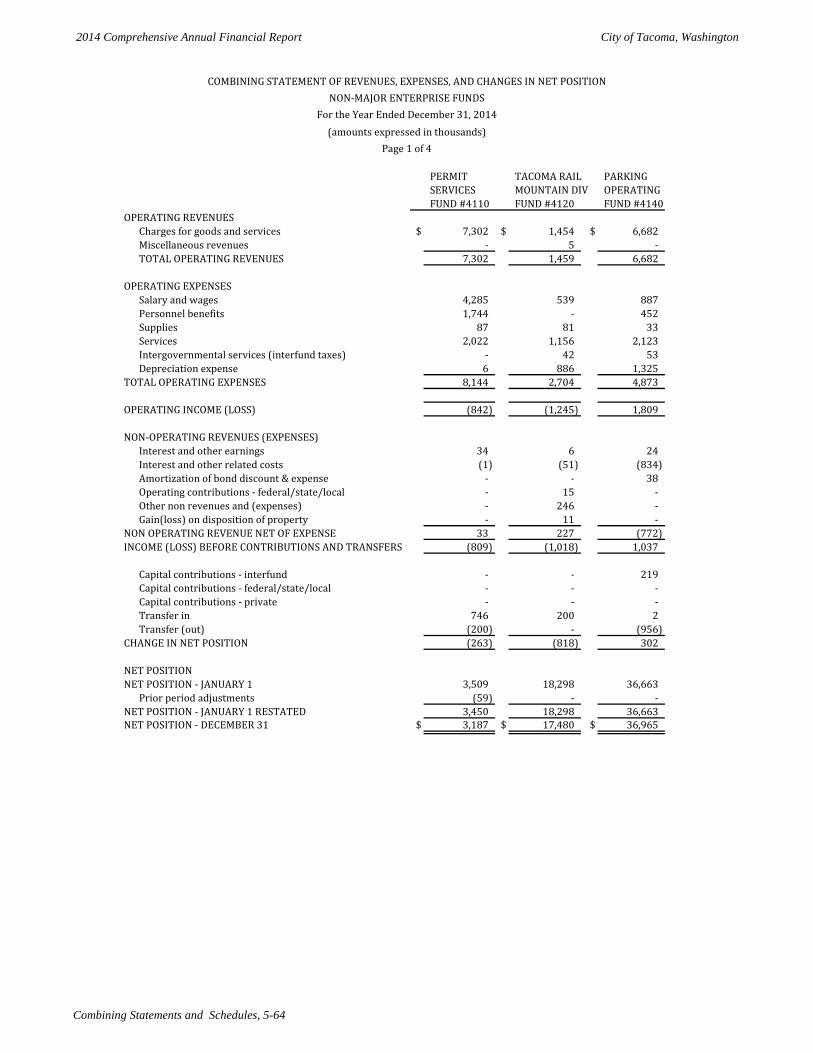
2014 Comprehensive Annual Financial Report City of Tacoma, Washington
Combining Statements and Schedules, 5-64
PERMIT TACOMA RAIL PARKINGSERVICES MOUNTAIN DIV OPERATING
FUND #4110 FUND #4120 FUND #4140OPERATING REVENUES
Charges for goods and services $ 7,302 $ 1,454 $ 6,682 Miscellaneous revenues - 5 - TOTAL OPERATING REVENUES 7,302 1,459 6,682
OPERATING EXPENSESSalary and wages 4,285 539 887 Personnel benefits 1,744 - 452 Supplies 87 81 33 Services 2,022 1,156 2,123 Intergovernmental services (interfund taxes) - 42 53 Depreciation expense 6 886 1,325
TOTAL OPERATING EXPENSES 8,144 2,704 4,873
OPERATING INCOME (LOSS) (842) (1,245) 1,809
NON-OPERATING REVENUES (EXPENSES)Interest and other earnings 34 6 24 Interest and other related costs (1) (51) (834) Amortization of bond discount & expense - - 38 Operating contributions - federal/state/local - 15 - Other non revenues and (expenses) - 246 - Gain(loss) on disposition of property - 11 -
NON OPERATING REVENUE NET OF EXPENSE 33 227 (772) INCOME (LOSS) BEFORE CONTRIBUTIONS AND TRANSFERS (809) (1,018) 1,037
Capital contributions - interfund - - 219 Capital contributions - federal/state/local - - - Capital contributions - private - - - Transfer in 746 200 2 Transfer (out) (200) - (956)
CHANGE IN NET POSITION (263) (818) 302
NET POSITIONNET POSITION - JANUARY 1 3,509 18,298 36,663
Prior period adjustments (59) - - NET POSITION - JANUARY 1 RESTATED 3,450 18,298 36,663 NET POSITION - DECEMBER 31 $ 3,187 $ 17,480 $ 36,965
COMBINING STATEMENT OF REVENUES, EXPENSES, AND CHANGES IN NET POSITIONNON-MAJOR ENTERPRISE FUNDS
For the Year Ended December 31, 2014(amounts expressed in thousands)
Page 1 of 4
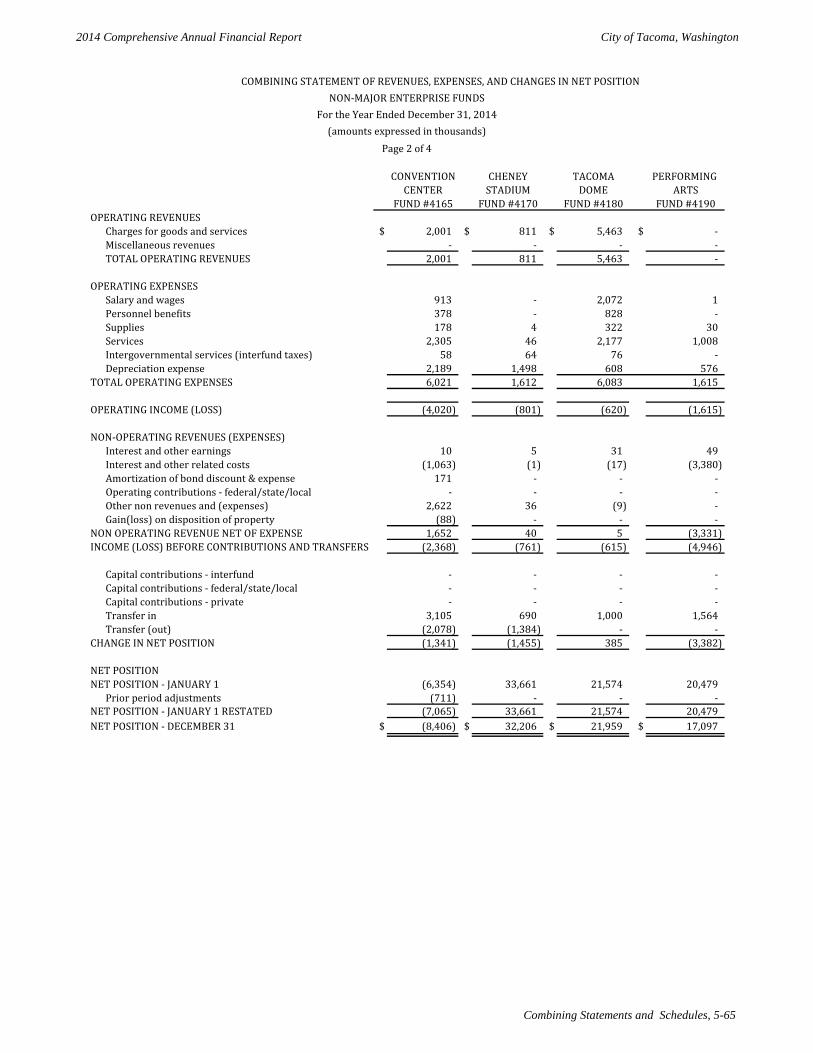
2014 Comprehensive Annual Financial Report City of Tacoma, Washington
Combining Statements and Schedules, 5-65
CONVENTION CHENEY TACOMA PERFORMING CENTER STADIUM DOME ARTS
FUND #4165 FUND #4170 FUND #4180 FUND #4190OPERATING REVENUES
Charges for goods and services $ 2,001 $ 811 $ 5,463 $ - Miscellaneous revenues - - - - TOTAL OPERATING REVENUES 2,001 811 5,463 -
OPERATING EXPENSESSalary and wages 913 - 2,072 1 Personnel benefits 378 - 828 - Supplies 178 4 322 30 Services 2,305 46 2,177 1,008 Intergovernmental services (interfund taxes) 58 64 76 - Depreciation expense 2,189 1,498 608 576
TOTAL OPERATING EXPENSES 6,021 1,612 6,083 1,615
OPERATING INCOME (LOSS) (4,020) (801) (620) (1,615)
NON-OPERATING REVENUES (EXPENSES)Interest and other earnings 10 5 31 49 Interest and other related costs (1,063) (1) (17) (3,380) Amortization of bond discount & expense 171 - - - Operating contributions - federal/state/local - - - - Other non revenues and (expenses) 2,622 36 (9) - Gain(loss) on disposition of property (88) - - -
NON OPERATING REVENUE NET OF EXPENSE 1,652 40 5 (3,331) INCOME (LOSS) BEFORE CONTRIBUTIONS AND TRANSFERS (2,368) (761) (615) (4,946)
Capital contributions - interfund - - - - Capital contributions - federal/state/local - - - - Capital contributions - private - - - - Transfer in 3,105 690 1,000 1,564 Transfer (out) (2,078) (1,384) - -
CHANGE IN NET POSITION (1,341) (1,455) 385 (3,382)
NET POSITIONNET POSITION - JANUARY 1 (6,354) 33,661 21,574 20,479
Prior period adjustments (711) - - - NET POSITION - JANUARY 1 RESTATED (7,065) 33,661 21,574 20,479 NET POSITION - DECEMBER 31 $ (8,406) $ 32,206 $ 21,959 $ 17,097
COMBINING STATEMENT OF REVENUES, EXPENSES, AND CHANGES IN NET POSITIONNON-MAJOR ENTERPRISE FUNDS
For the Year Ended December 31, 2014(amounts expressed in thousands)
Page 2 of 4
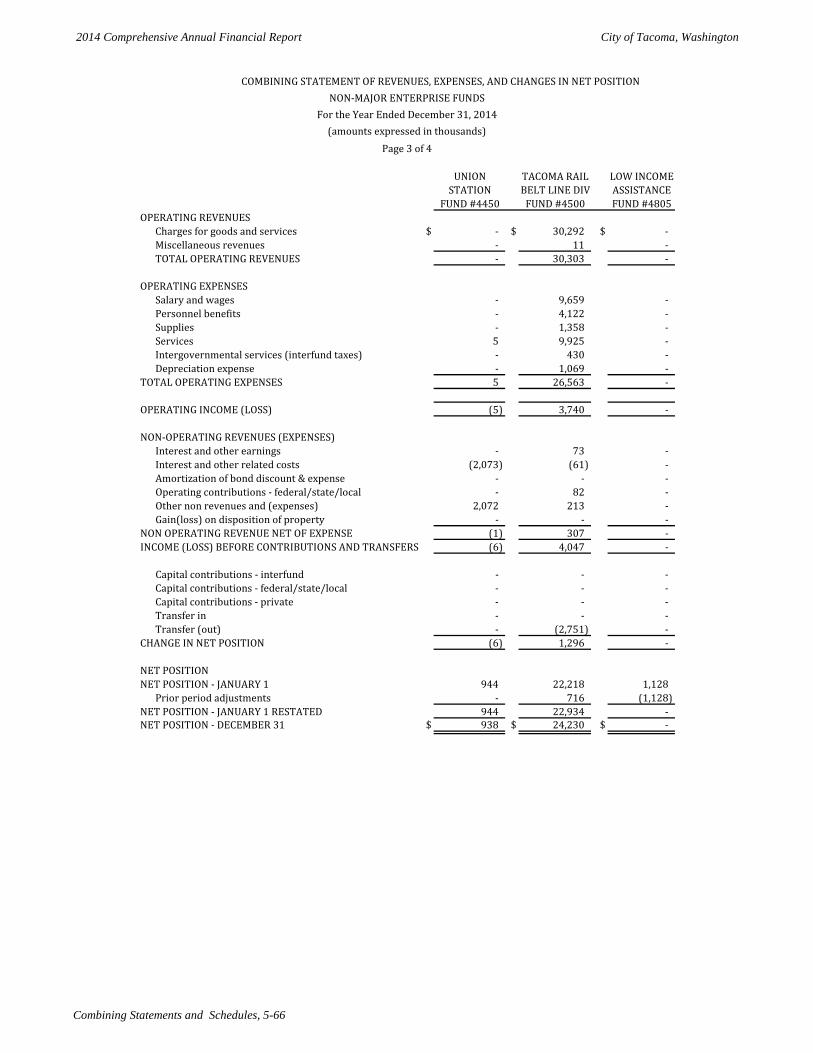
2014 Comprehensive Annual Financial Report City of Tacoma, Washington
Combining Statements and Schedules, 5-66
UNION TACOMA RAIL LOW INCOMESTATION BELT LINE DIV ASSISTANCE
FUND #4450 FUND #4500 FUND #4805OPERATING REVENUES
Charges for goods and services $ - $ 30,292 $ - Miscellaneous revenues - 11 - TOTAL OPERATING REVENUES - 30,303 -
OPERATING EXPENSESSalary and wages - 9,659 - Personnel benefits - 4,122 - Supplies - 1,358 - Services 5 9,925 - Intergovernmental services (interfund taxes) - 430 - Depreciation expense - 1,069 -
TOTAL OPERATING EXPENSES 5 26,563 -
OPERATING INCOME (LOSS) (5) 3,740 -
NON-OPERATING REVENUES (EXPENSES)Interest and other earnings - 73 - Interest and other related costs (2,073) (61) - Amortization of bond discount & expense - - - Operating contributions - federal/state/local - 82 - Other non revenues and (expenses) 2,072 213 - Gain(loss) on disposition of property - - -
NON OPERATING REVENUE NET OF EXPENSE (1) 307 - INCOME (LOSS) BEFORE CONTRIBUTIONS AND TRANSFERS (6) 4,047 -
Capital contributions - interfund - - - Capital contributions - federal/state/local - - - Capital contributions - private - - - Transfer in - - - Transfer (out) - (2,751) -
CHANGE IN NET POSITION (6) 1,296 -
NET POSITIONNET POSITION - JANUARY 1 944 22,218 1,128
Prior period adjustments - 716 (1,128) NET POSITION - JANUARY 1 RESTATED 944 22,934 - NET POSITION - DECEMBER 31 $ 938 $ 24,230 $ -
COMBINING STATEMENT OF REVENUES, EXPENSES, AND CHANGES IN NET POSITIONNON-MAJOR ENTERPRISE FUNDS
For the Year Ended December 31, 2014(amounts expressed in thousands)
Page 3 of 4
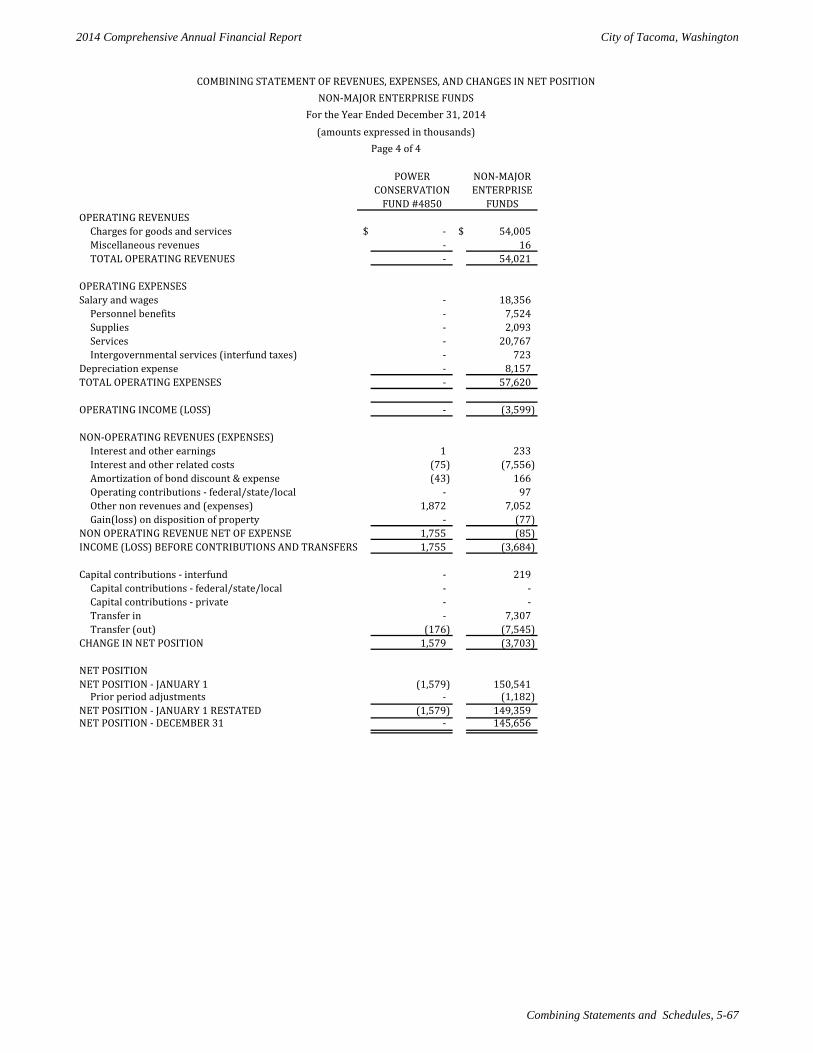
2014 Comprehensive Annual Financial Report City of Tacoma, Washington
Combining Statements and Schedules, 5-67
POWER NON-MAJORCONSERVATION ENTERPRISE
FUND #4850 FUNDSOPERATING REVENUES
Charges for goods and services $ - $ 54,005 Miscellaneous revenues - 16 TOTAL OPERATING REVENUES - 54,021
OPERATING EXPENSESSalary and wages - 18,356
Personnel benefits - 7,524 Supplies - 2,093 Services - 20,767 Intergovernmental services (interfund taxes) - 723
Depreciation expense - 8,157 TOTAL OPERATING EXPENSES - 57,620
OPERATING INCOME (LOSS) - (3,599)
NON-OPERATING REVENUES (EXPENSES)Interest and other earnings 1 233 Interest and other related costs (75) (7,556) Amortization of bond discount & expense (43) 166 Operating contributions - federal/state/local - 97 Other non revenues and (expenses) 1,872 7,052 Gain(loss) on disposition of property - (77)
NON OPERATING REVENUE NET OF EXPENSE 1,755 (85) INCOME (LOSS) BEFORE CONTRIBUTIONS AND TRANSFERS 1,755 (3,684)
Capital contributions - interfund - 219 Capital contributions - federal/state/local - - Capital contributions - private - - Transfer in - 7,307 Transfer (out) (176) (7,545)
CHANGE IN NET POSITION 1,579 (3,703)
NET POSITIONNET POSITION - JANUARY 1 (1,579) 150,541
Prior period adjustments - (1,182) NET POSITION - JANUARY 1 RESTATED (1,579) 149,359 NET POSITION - DECEMBER 31 - 145,656
COMBINING STATEMENT OF REVENUES, EXPENSES, AND CHANGES IN NET POSITIONNON-MAJOR ENTERPRISE FUNDS
For the Year Ended December 31, 2014(amounts expressed in thousands)
Page 4 of 4
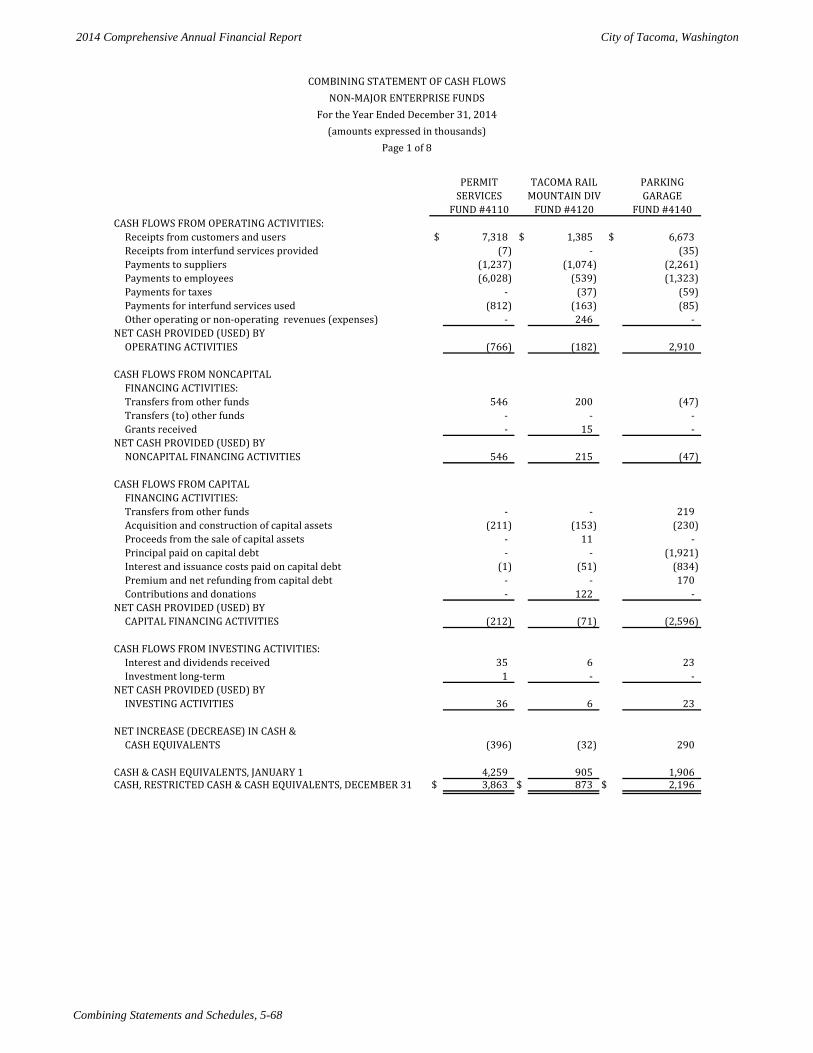
2014 Comprehensive Annual Financial Report City of Tacoma, Washington
Combining Statements and Schedules, 5-68
PERMIT TACOMA RAIL PARKINGSERVICES MOUNTAIN DIV GARAGE
FUND #4110 FUND #4120 FUND #4140CASH FLOWS FROM OPERATING ACTIVITIES:
Receipts from customers and users $ 7,318 $ 1,385 $ 6,673 Receipts from interfund services provided (7) - (35) Payments to suppliers (1,237) (1,074) (2,261) Payments to employees (6,028) (539) (1,323) Payments for taxes - (37) (59) Payments for interfund services used (812) (163) (85) Other operating or non-operating revenues (expenses) - 246 -
NET CASH PROVIDED (USED) BY OPERATING ACTIVITIES (766) (182) 2,910
CASH FLOWS FROM NONCAPITAL FINANCING ACTIVITIES:Transfers from other funds 546 200 (47) Transfers (to) other funds - - - Grants received - 15 -
NET CASH PROVIDED (USED) BY NONCAPITAL FINANCING ACTIVITIES 546 215 (47)
CASH FLOWS FROM CAPITAL FINANCING ACTIVITIES:Transfers from other funds - - 219 Acquisition and construction of capital assets (211) (153) (230) Proceeds from the sale of capital assets - 11 - Principal paid on capital debt - - (1,921) Interest and issuance costs paid on capital debt (1) (51) (834) Premium and net refunding from capital debt - - 170 Contributions and donations - 122 -
NET CASH PROVIDED (USED) BY CAPITAL FINANCING ACTIVITIES (212) (71) (2,596)
CASH FLOWS FROM INVESTING ACTIVITIES:Interest and dividends received 35 6 23 Investment long-term 1 - -
NET CASH PROVIDED (USED) BY INVESTING ACTIVITIES 36 6 23
NET INCREASE (DECREASE) IN CASH & CASH EQUIVALENTS (396) (32) 290
CASH & CASH EQUIVALENTS, JANUARY 1 4,259 905 1,906 CASH, RESTRICTED CASH & CASH EQUIVALENTS, DECEMBER 31 $ 3,863 $ 873 $ 2,196
COMBINING STATEMENT OF CASH FLOWSNON-MAJOR ENTERPRISE FUNDS
For the Year Ended December 31, 2014(amounts expressed in thousands)
Page 1 of 8
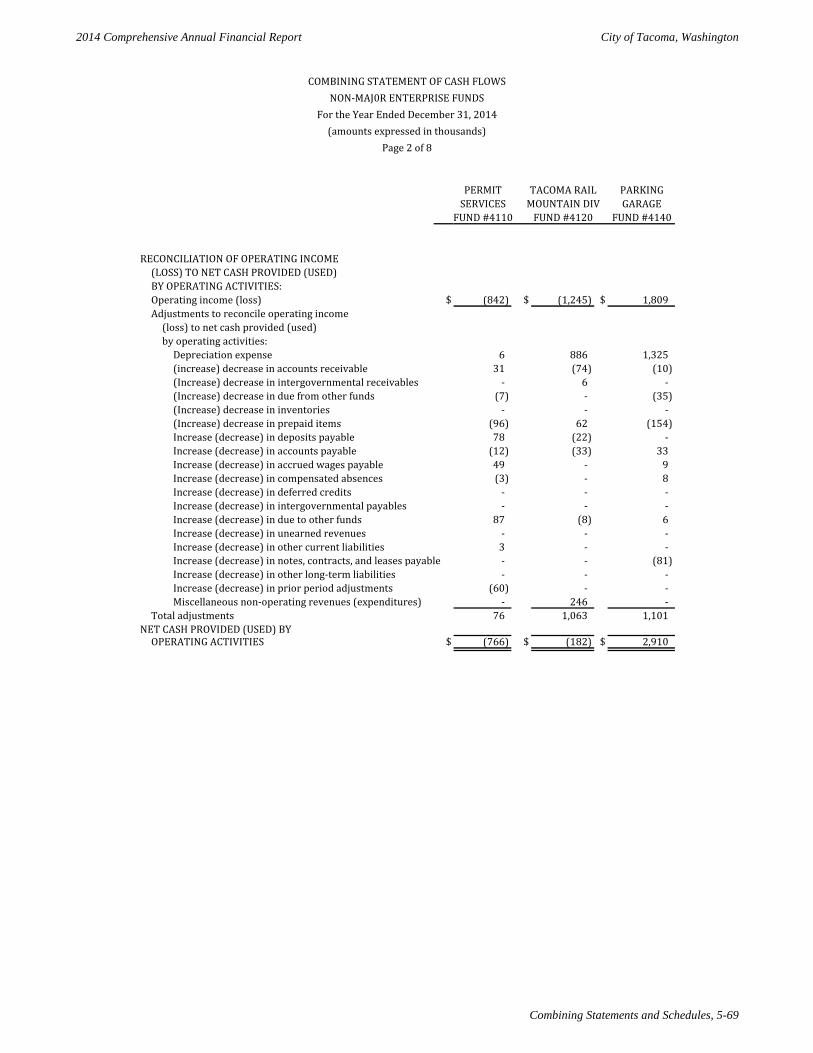
2014 Comprehensive Annual Financial Report City of Tacoma, Washington
Combining Statements and Schedules, 5-69
PERMIT TACOMA RAIL PARKINGSERVICES MOUNTAIN DIV GARAGE
FUND #4110 FUND #4120 FUND #4140
RECONCILIATION OF OPERATING INCOME(LOSS) TO NET CASH PROVIDED (USED)BY OPERATING ACTIVITIES:Operating income (loss) $ (842) $ (1,245) $ 1,809 Adjustments to reconcile operating income
(loss) to net cash provided (used)by operating activities:
Depreciation expense 6 886 1,325 (increase) decrease in accounts receivable 31 (74) (10) (Increase) decrease in intergovernmental receivables - 6 - (Increase) decrease in due from other funds (7) - (35) (Increase) decrease in inventories - - - (Increase) decrease in prepaid items (96) 62 (154) Increase (decrease) in deposits payable 78 (22) - Increase (decrease) in accounts payable (12) (33) 33 Increase (decrease) in accrued wages payable 49 - 9 Increase (decrease) in compensated absences (3) - 8 Increase (decrease) in deferred credits - - - Increase (decrease) in intergovernmental payables - - - Increase (decrease) in due to other funds 87 (8) 6 Increase (decrease) in unearned revenues - - - Increase (decrease) in other current liabilities 3 - - Increase (decrease) in notes, contracts, and leases payable - - (81) Increase (decrease) in other long-term liabilities - - - Increase (decrease) in prior period adjustments (60) - - Miscellaneous non-operating revenues (expenditures) - 246 -
Total adjustments 76 1,063 1,101 NET CASH PROVIDED (USED) BY
OPERATING ACTIVITIES $ (766) $ (182) $ 2,910
COMBINING STATEMENT OF CASH FLOWSNON-MAJ0R ENTERPRISE FUNDS
For the Year Ended December 31, 2014(amounts expressed in thousands)
Page 2 of 8
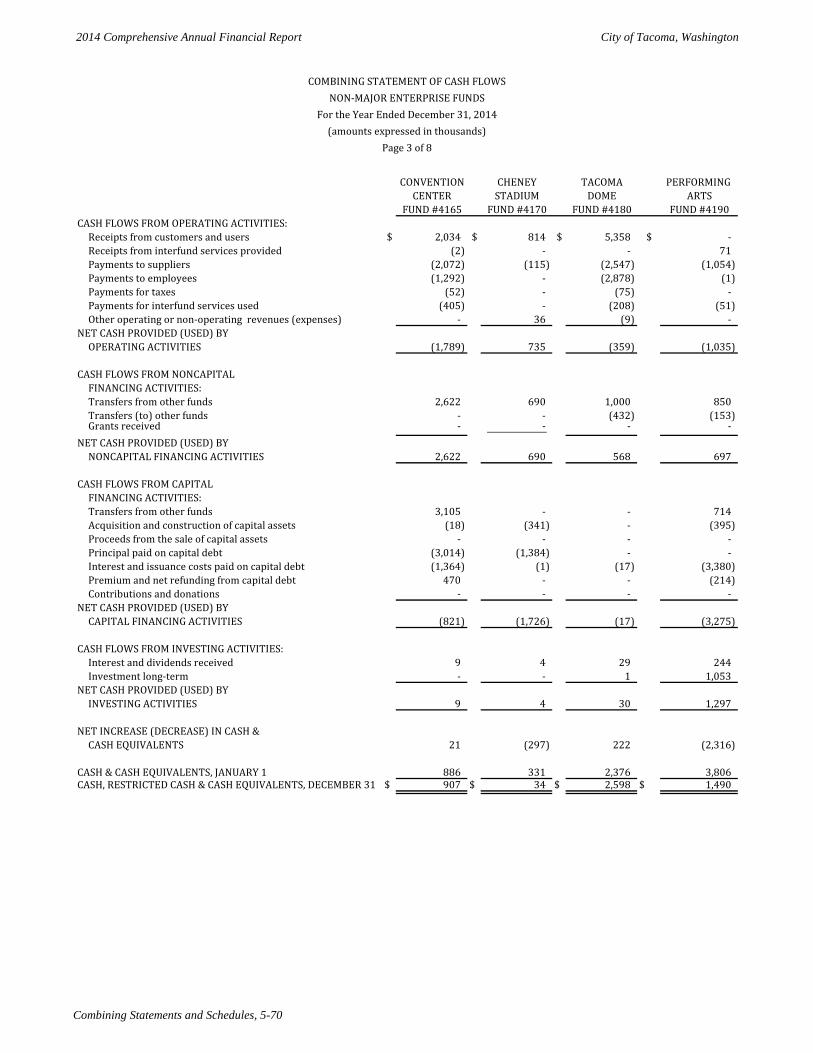
2014 Comprehensive Annual Financial Report City of Tacoma, Washington
Combining Statements and Schedules, 5-70
CONVENTION CHENEY TACOMA PERFORMING CENTER STADIUM DOME ARTS
FUND #4165 FUND #4170 FUND #4180 FUND #4190CASH FLOWS FROM OPERATING ACTIVITIES:
Receipts from customers and users $ 2,034 $ 814 $ 5,358 $ - Receipts from interfund services provided (2) - - 71 Payments to suppliers (2,072) (115) (2,547) (1,054) Payments to employees (1,292) - (2,878) (1) Payments for taxes (52) - (75) - Payments for interfund services used (405) - (208) (51) Other operating or non-operating revenues (expenses) - 36 (9) -
NET CASH PROVIDED (USED) BY OPERATING ACTIVITIES (1,789) 735 (359) (1,035)
CASH FLOWS FROM NONCAPITAL FINANCING ACTIVITIES:Transfers from other funds 2,622 690 1,000 850 Transfers (to) other funds - - (432) (153) Grants received - - - -
NET CASH PROVIDED (USED) BY NONCAPITAL FINANCING ACTIVITIES 2,622 690 568 697
CASH FLOWS FROM CAPITAL FINANCING ACTIVITIES:Transfers from other funds 3,105 - - 714 Acquisition and construction of capital assets (18) (341) - (395) Proceeds from the sale of capital assets - - - - Principal paid on capital debt (3,014) (1,384) - - Interest and issuance costs paid on capital debt (1,364) (1) (17) (3,380) Premium and net refunding from capital debt 470 - - (214) Contributions and donations - - - -
NET CASH PROVIDED (USED) BY CAPITAL FINANCING ACTIVITIES (821) (1,726) (17) (3,275)
CASH FLOWS FROM INVESTING ACTIVITIES:Interest and dividends received 9 4 29 244 Investment long-term - - 1 1,053
NET CASH PROVIDED (USED) BY INVESTING ACTIVITIES 9 4 30 1,297
NET INCREASE (DECREASE) IN CASH & CASH EQUIVALENTS 21 (297) 222 (2,316)
CASH & CASH EQUIVALENTS, JANUARY 1 886 331 2,376 3,806 CASH, RESTRICTED CASH & CASH EQUIVALENTS, DECEMBER 31 $ 907 $ 34 $ 2,598 $ 1,490
(amounts expressed in thousands)
COMBINING STATEMENT OF CASH FLOWSNON-MAJOR ENTERPRISE FUNDS
For the Year Ended December 31, 2014
Page 3 of 8
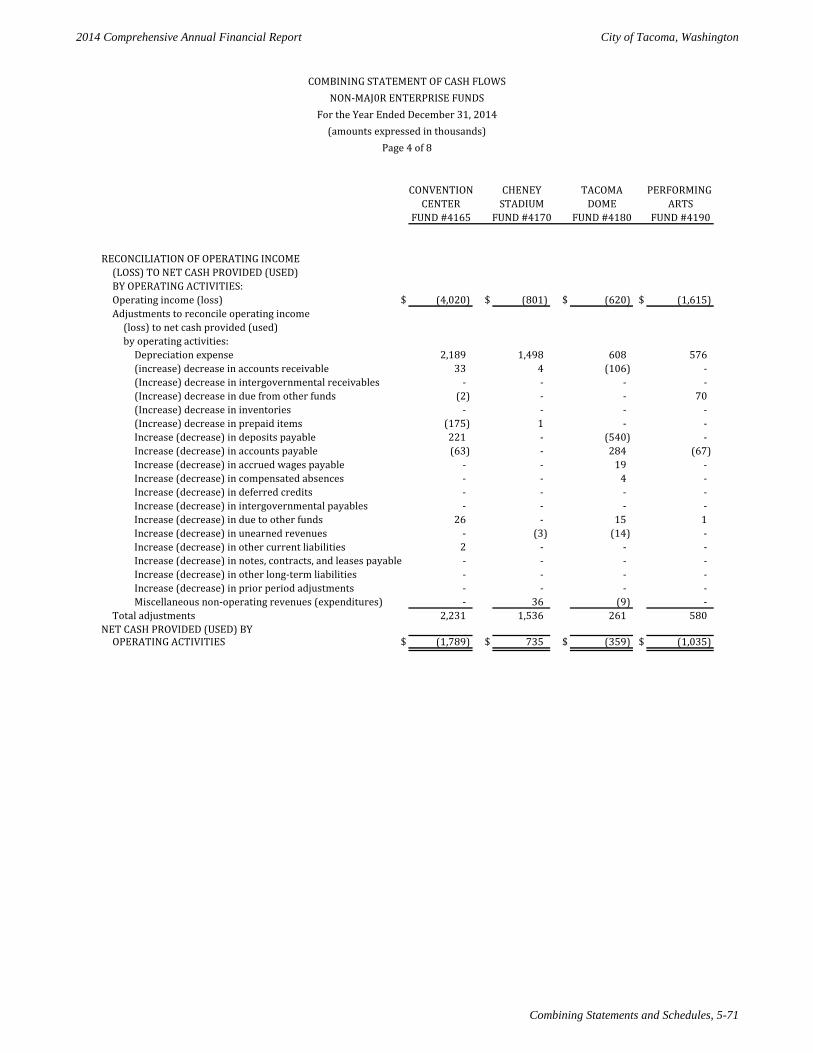
2014 Comprehensive Annual Financial Report City of Tacoma, Washington
Combining Statements and Schedules, 5-71
CONVENTION CHENEY TACOMA PERFORMING CENTER STADIUM DOME ARTS
FUND #4165 FUND #4170 FUND #4180 FUND #4190
RECONCILIATION OF OPERATING INCOME(LOSS) TO NET CASH PROVIDED (USED)BY OPERATING ACTIVITIES:Operating income (loss) $ (4,020) $ (801) $ (620) $ (1,615) Adjustments to reconcile operating income
(loss) to net cash provided (used)by operating activities:
Depreciation expense 2,189 1,498 608 576 (increase) decrease in accounts receivable 33 4 (106) - (Increase) decrease in intergovernmental receivables - - - - (Increase) decrease in due from other funds (2) - - 70 (Increase) decrease in inventories - - - - (Increase) decrease in prepaid items (175) 1 - - Increase (decrease) in deposits payable 221 - (540) - Increase (decrease) in accounts payable (63) - 284 (67) Increase (decrease) in accrued wages payable - - 19 - Increase (decrease) in compensated absences - - 4 - Increase (decrease) in deferred credits - - - - Increase (decrease) in intergovernmental payables - - - - Increase (decrease) in due to other funds 26 - 15 1 Increase (decrease) in unearned revenues - (3) (14) - Increase (decrease) in other current liabilities 2 - - - Increase (decrease) in notes, contracts, and leases payable - - - - Increase (decrease) in other long-term liabilities - - - - Increase (decrease) in prior period adjustments - - - - Miscellaneous non-operating revenues (expenditures) - 36 (9) -
Total adjustments 2,231 1,536 261 580 NET CASH PROVIDED (USED) BY
OPERATING ACTIVITIES $ (1,789) $ 735 $ (359) $ (1,035)
Page 4 of 8(amounts expressed in thousands)
COMBINING STATEMENT OF CASH FLOWSNON-MAJ0R ENTERPRISE FUNDS
For the Year Ended December 31, 2014
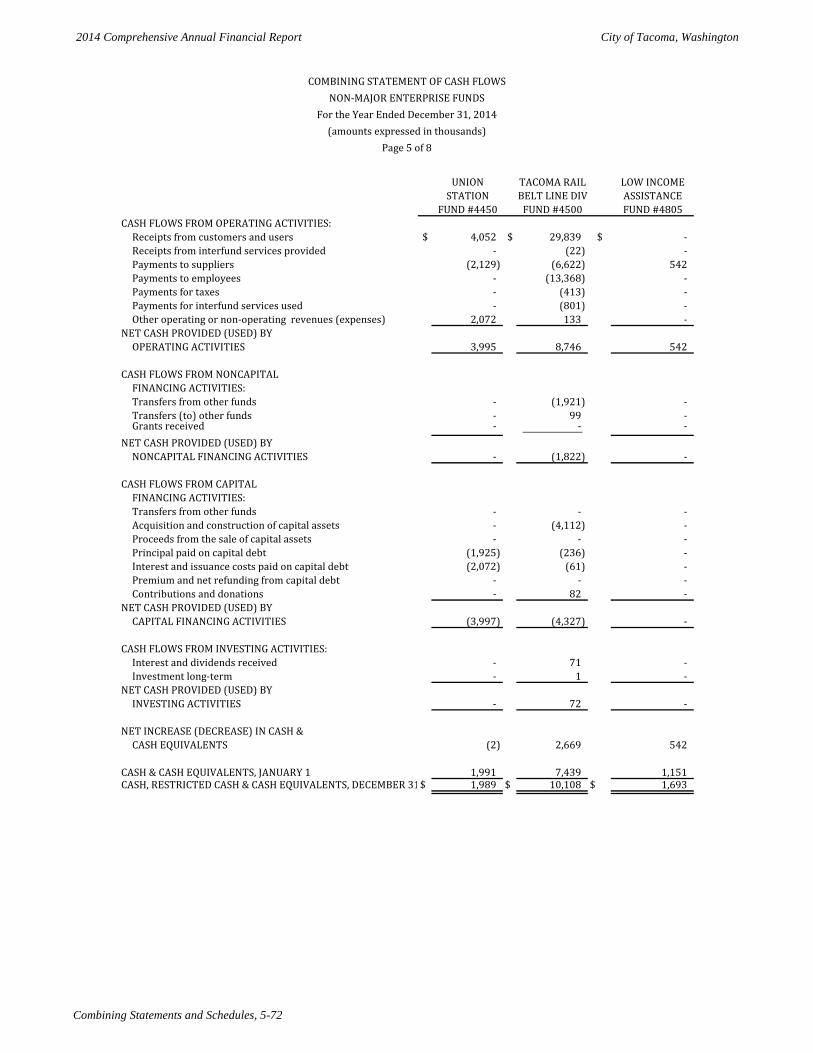
2014 Comprehensive Annual Financial Report City of Tacoma, Washington
Combining Statements and Schedules, 5-72
UNION TACOMA RAIL LOW INCOMESTATION BELT LINE DIV ASSISTANCE
FUND #4450 FUND #4500 FUND #4805CASH FLOWS FROM OPERATING ACTIVITIES:
Receipts from customers and users $ 4,052 $ 29,839 $ - Receipts from interfund services provided - (22) - Payments to suppliers (2,129) (6,622) 542 Payments to employees - (13,368) - Payments for taxes - (413) - Payments for interfund services used - (801) - Other operating or non-operating revenues (expenses) 2,072 133 -
NET CASH PROVIDED (USED) BY OPERATING ACTIVITIES 3,995 8,746 542
CASH FLOWS FROM NONCAPITAL FINANCING ACTIVITIES:Transfers from other funds - (1,921) - Transfers (to) other funds - 99 - Grants received - - -
NET CASH PROVIDED (USED) BY NONCAPITAL FINANCING ACTIVITIES - (1,822) -
CASH FLOWS FROM CAPITAL FINANCING ACTIVITIES:Transfers from other funds - - - Acquisition and construction of capital assets - (4,112) - Proceeds from the sale of capital assets - - - Principal paid on capital debt (1,925) (236) - Interest and issuance costs paid on capital debt (2,072) (61) - Premium and net refunding from capital debt - - - Contributions and donations - 82 -
NET CASH PROVIDED (USED) BY CAPITAL FINANCING ACTIVITIES (3,997) (4,327) -
CASH FLOWS FROM INVESTING ACTIVITIES:Interest and dividends received - 71 - Investment long-term - 1 -
NET CASH PROVIDED (USED) BY INVESTING ACTIVITIES - 72 -
NET INCREASE (DECREASE) IN CASH & CASH EQUIVALENTS (2) 2,669 542
CASH & CASH EQUIVALENTS, JANUARY 1 1,991 7,439 1,151 CASH, RESTRICTED CASH & CASH EQUIVALENTS, DECEMBER 31$ 1,989 $ 10,108 $ 1,693
(amounts expressed in thousands)
COMBINING STATEMENT OF CASH FLOWSNON-MAJOR ENTERPRISE FUNDS
For the Year Ended December 31, 2014
Page 5 of 8
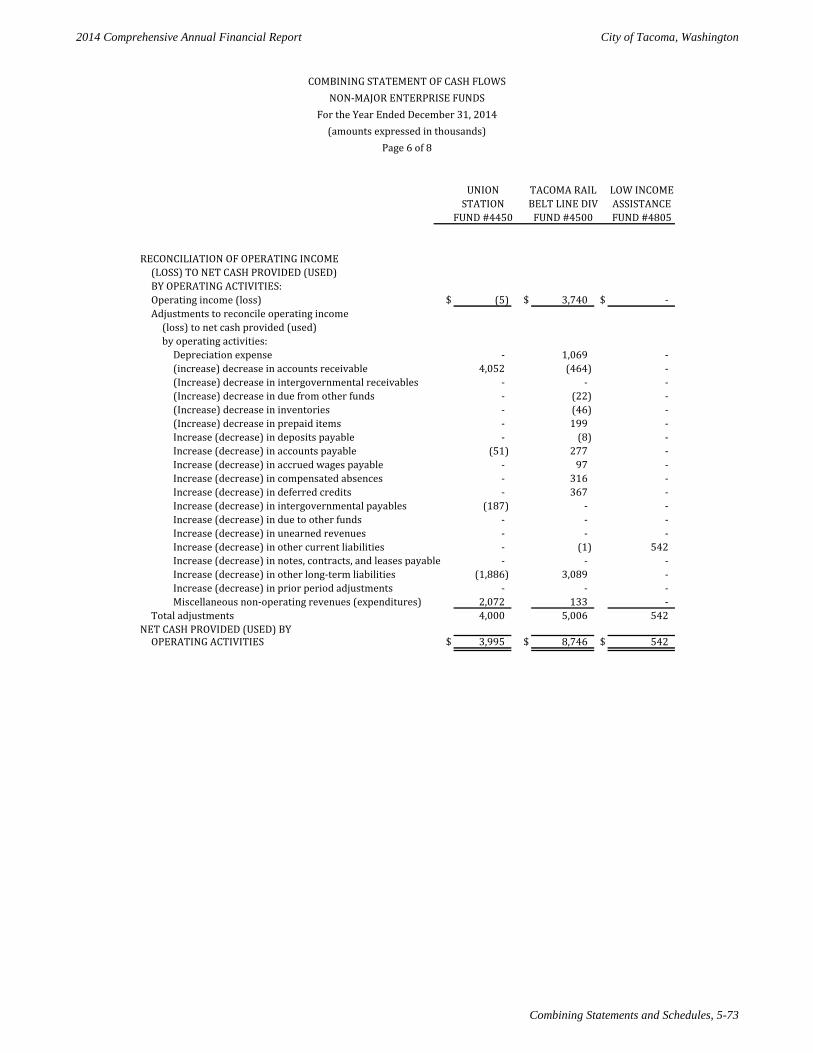
2014 Comprehensive Annual Financial Report City of Tacoma, Washington
Combining Statements and Schedules, 5-73
UNION TACOMA RAIL LOW INCOMESTATION BELT LINE DIV ASSISTANCE
FUND #4450 FUND #4500 FUND #4805
RECONCILIATION OF OPERATING INCOME(LOSS) TO NET CASH PROVIDED (USED)BY OPERATING ACTIVITIES:Operating income (loss) $ (5) $ 3,740 $ - Adjustments to reconcile operating income
(loss) to net cash provided (used)by operating activities:
Depreciation expense - 1,069 - (increase) decrease in accounts receivable 4,052 (464) - (Increase) decrease in intergovernmental receivables - - - (Increase) decrease in due from other funds - (22) - (Increase) decrease in inventories - (46) - (Increase) decrease in prepaid items - 199 - Increase (decrease) in deposits payable - (8) - Increase (decrease) in accounts payable (51) 277 - Increase (decrease) in accrued wages payable - 97 - Increase (decrease) in compensated absences - 316 - Increase (decrease) in deferred credits - 367 - Increase (decrease) in intergovernmental payables (187) - - Increase (decrease) in due to other funds - - - Increase (decrease) in unearned revenues - - - Increase (decrease) in other current liabilities - (1) 542 Increase (decrease) in notes, contracts, and leases payable - - - Increase (decrease) in other long-term liabilities (1,886) 3,089 - Increase (decrease) in prior period adjustments - - - Miscellaneous non-operating revenues (expenditures) 2,072 133 -
Total adjustments 4,000 5,006 542 NET CASH PROVIDED (USED) BY
OPERATING ACTIVITIES $ 3,995 $ 8,746 $ 542
(amounts expressed in thousands)Page 6 of 8
COMBINING STATEMENT OF CASH FLOWSNON-MAJOR ENTERPRISE FUNDS
For the Year Ended December 31, 2014
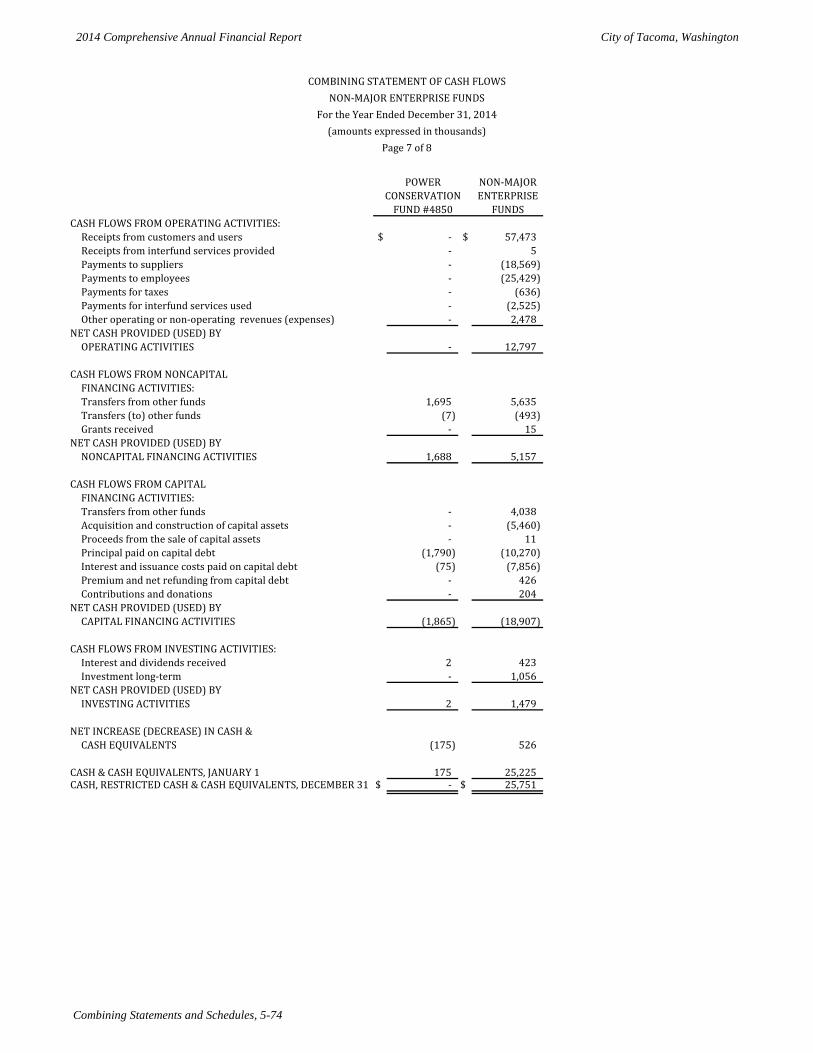
2014 Comprehensive Annual Financial Report City of Tacoma, Washington
Combining Statements and Schedules, 5-74
POWER NON-MAJORCONSERVATION ENTERPRISE
FUND #4850 FUNDSCASH FLOWS FROM OPERATING ACTIVITIES:
Receipts from customers and users $ - $ 57,473 Receipts from interfund services provided - 5 Payments to suppliers - (18,569) Payments to employees - (25,429) Payments for taxes - (636) Payments for interfund services used - (2,525) Other operating or non-operating revenues (expenses) - 2,478
NET CASH PROVIDED (USED) BY OPERATING ACTIVITIES - 12,797
CASH FLOWS FROM NONCAPITAL FINANCING ACTIVITIES:Transfers from other funds 1,695 5,635 Transfers (to) other funds (7) (493) Grants received - 15
NET CASH PROVIDED (USED) BY NONCAPITAL FINANCING ACTIVITIES 1,688 5,157
CASH FLOWS FROM CAPITAL FINANCING ACTIVITIES:Transfers from other funds - 4,038 Acquisition and construction of capital assets - (5,460) Proceeds from the sale of capital assets - 11 Principal paid on capital debt (1,790) (10,270) Interest and issuance costs paid on capital debt (75) (7,856) Premium and net refunding from capital debt - 426 Contributions and donations - 204
NET CASH PROVIDED (USED) BY CAPITAL FINANCING ACTIVITIES (1,865) (18,907)
CASH FLOWS FROM INVESTING ACTIVITIES:Interest and dividends received 2 423 Investment long-term - 1,056
NET CASH PROVIDED (USED) BY INVESTING ACTIVITIES 2 1,479
NET INCREASE (DECREASE) IN CASH & CASH EQUIVALENTS (175) 526
CASH & CASH EQUIVALENTS, JANUARY 1 175 25,225 CASH, RESTRICTED CASH & CASH EQUIVALENTS, DECEMBER 31 $ - $ 25,751
COMBINING STATEMENT OF CASH FLOWSNON-MAJOR ENTERPRISE FUNDS
For the Year Ended December 31, 2014(amounts expressed in thousands)
Page 7 of 8
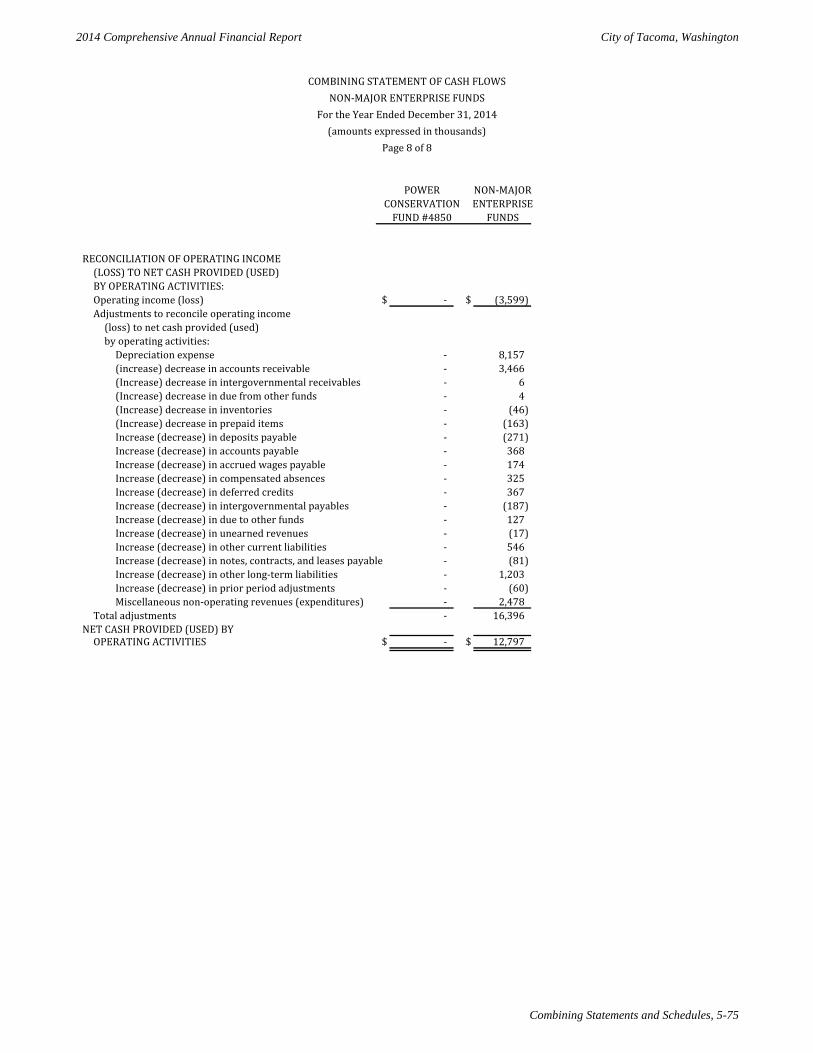
2014 Comprehensive Annual Financial Report City of Tacoma, Washington
Combining Statements and Schedules, 5-75
POWER NON-MAJORCONSERVATION ENTERPRISE
FUND #4850 FUNDS
RECONCILIATION OF OPERATING INCOME(LOSS) TO NET CASH PROVIDED (USED)BY OPERATING ACTIVITIES:Operating income (loss) $ - $ (3,599) Adjustments to reconcile operating income
(loss) to net cash provided (used)by operating activities:
Depreciation expense - 8,157 (increase) decrease in accounts receivable - 3,466 (Increase) decrease in intergovernmental receivables - 6 (Increase) decrease in due from other funds - 4 (Increase) decrease in inventories - (46) (Increase) decrease in prepaid items - (163) Increase (decrease) in deposits payable - (271) Increase (decrease) in accounts payable - 368 Increase (decrease) in accrued wages payable - 174 Increase (decrease) in compensated absences - 325 Increase (decrease) in deferred credits - 367 Increase (decrease) in intergovernmental payables - (187) Increase (decrease) in due to other funds - 127 Increase (decrease) in unearned revenues - (17) Increase (decrease) in other current liabilities - 546 Increase (decrease) in notes, contracts, and leases payable - (81) Increase (decrease) in other long-term liabilities - 1,203 Increase (decrease) in prior period adjustments - (60) Miscellaneous non-operating revenues (expenditures) - 2,478
Total adjustments - 16,396 NET CASH PROVIDED (USED) BY
OPERATING ACTIVITIES $ - $ 12,797
COMBINING STATEMENT OF CASH FLOWSNON-MAJOR ENTERPRISE FUNDS
For the Year Ended December 31, 2014(amounts expressed in thousands)
Page 8 of 8
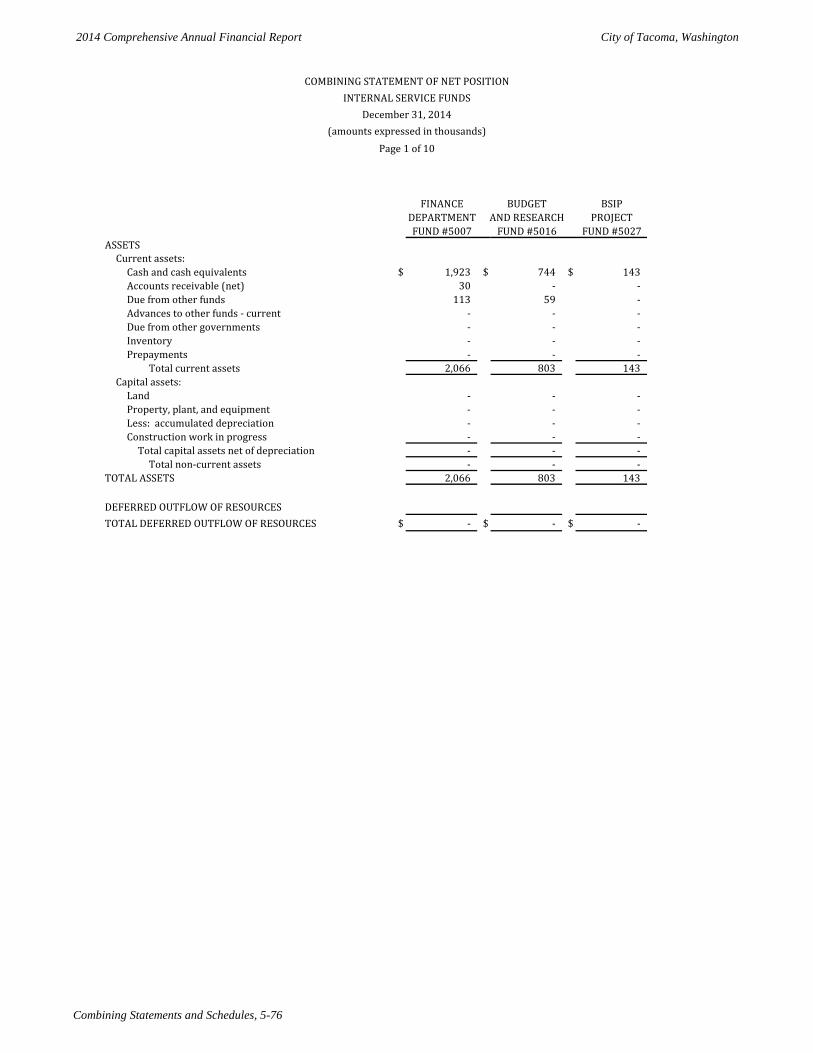
2014 Comprehensive Annual Financial Report City of Tacoma, Washington
Combining Statements and Schedules, 5-76
FINANCE BUDGET BSIPDEPARTMENT AND RESEARCH PROJECT
FUND #5007 FUND #5016 FUND #5027ASSETS
Current assets:Cash and cash equivalents $ 1,923 $ 744 $ 143 Accounts receivable (net) 30 - - Due from other funds 113 59 - Advances to other funds - current - - - Due from other governments - - - Inventory - - - Prepayments - - -
Total current assets 2,066 803 143 Capital assets:
Land - - - Property, plant, and equipment - - - Less: accumulated depreciation - - - Construction work in progress - - -
Total capital assets net of depreciation - - - Total non-current assets - - -
TOTAL ASSETS 2,066 803 143
DEFERRED OUTFLOW OF RESOURCESTOTAL DEFERRED OUTFLOW OF RESOURCES $ - $ - $ -
COMBINING STATEMENT OF NET POSITIONINTERNAL SERVICE FUNDS
December 31, 2014(amounts expressed in thousands)
Page 1 of 10
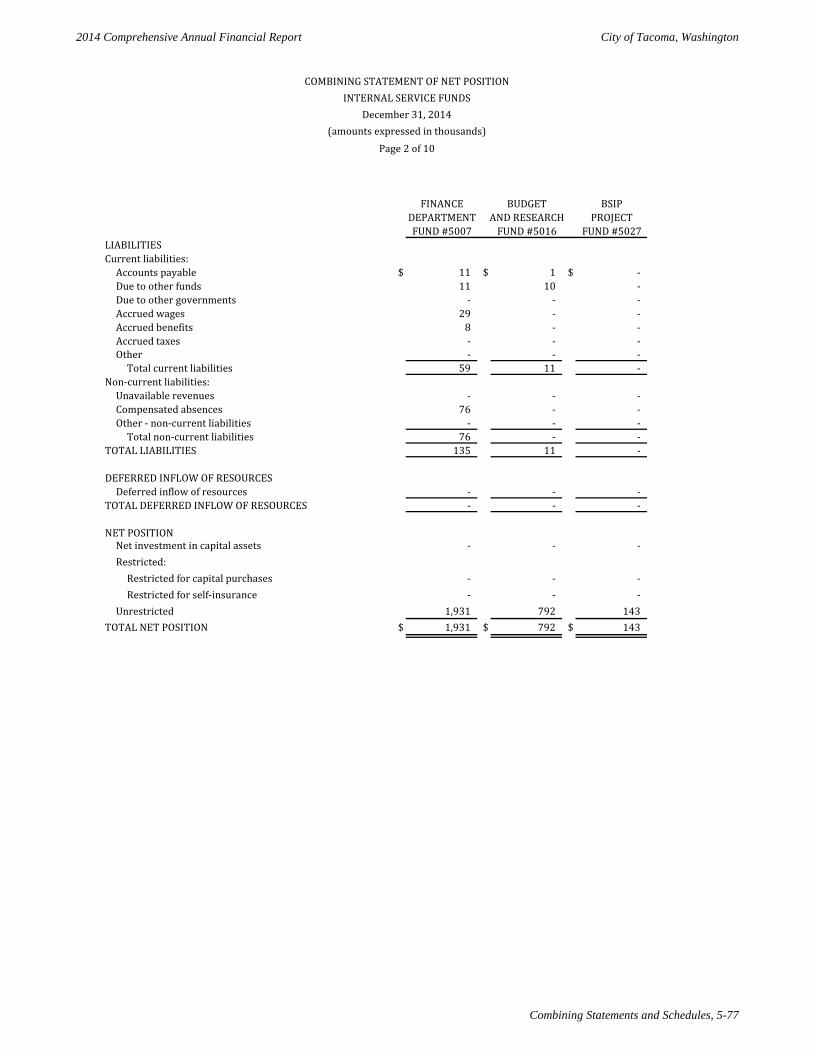
2014 Comprehensive Annual Financial Report City of Tacoma, Washington
Combining Statements and Schedules, 5-77
FINANCE BUDGET BSIPDEPARTMENT AND RESEARCH PROJECT
FUND #5007 FUND #5016 FUND #5027LIABILITIESCurrent liabilities:
Accounts payable $ 11 $ 1 $ - Due to other funds 11 10 - Due to other governments - - - Accrued wages 29 - - Accrued benefits 8 - - Accrued taxes - - - Other - - -
Total current liabilities 59 11 - Non-current liabilities:
Unavailable revenues - - - Compensated absences 76 - - Other - non-current liabilities - - -
Total non-current liabilities 76 - - TOTAL LIABILITIES 135 11 -
DEFERRED INFLOW OF RESOURCESDeferred inflow of resources - - -
TOTAL DEFERRED INFLOW OF RESOURCES - - -
NET POSITIONNet investment in capital assets - - - Restricted:
Restricted for capital purchases - - - Restricted for self-insurance - - -
Unrestricted 1,931 792 143 TOTAL NET POSITION $ 1,931 $ 792 $ 143
COMBINING STATEMENT OF NET POSITIONINTERNAL SERVICE FUNDS
December 31, 2014(amounts expressed in thousands)
Page 2 of 10
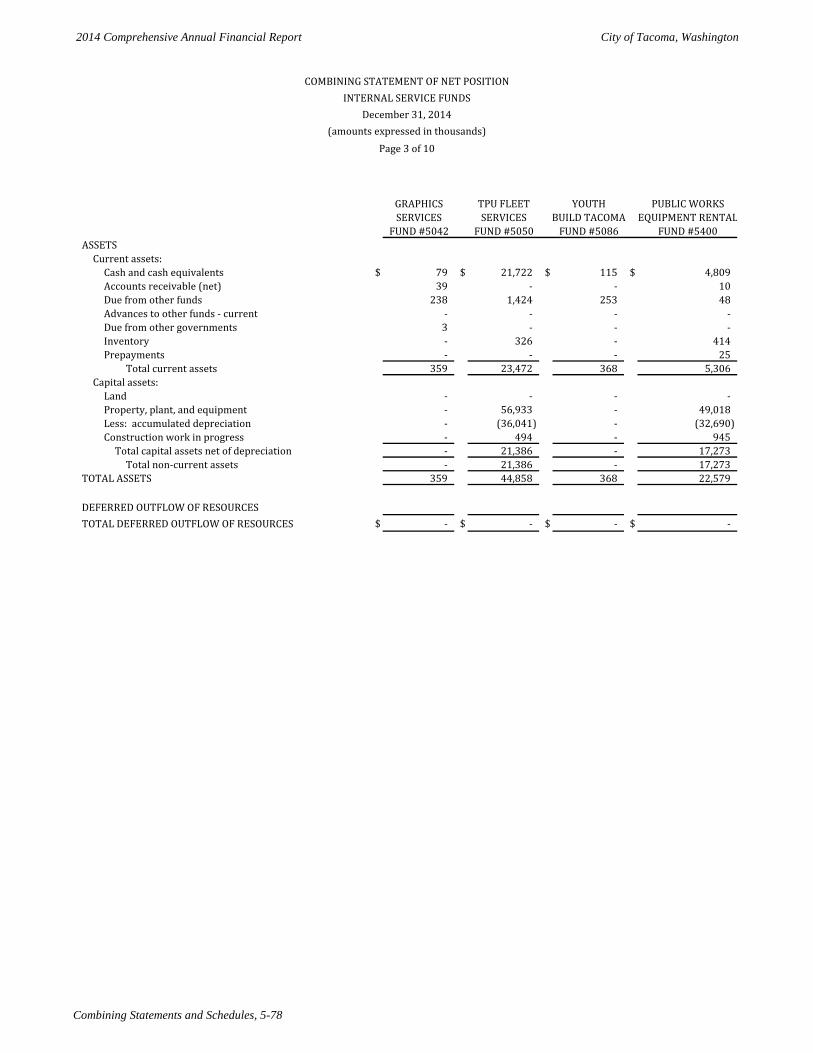
2014 Comprehensive Annual Financial Report City of Tacoma, Washington
Combining Statements and Schedules, 5-78
GRAPHICS TPU FLEET YOUTH PUBLIC WORKSSERVICES SERVICES BUILD TACOMA EQUIPMENT RENTAL
FUND #5042 FUND #5050 FUND #5086 FUND #5400ASSETS
Current assets:Cash and cash equivalents $ 79 $ 21,722 $ 115 $ 4,809 Accounts receivable (net) 39 - - 10 Due from other funds 238 1,424 253 48 Advances to other funds - current - - - - Due from other governments 3 - - - Inventory - 326 - 414 Prepayments - - - 25
Total current assets 359 23,472 368 5,306 Capital assets:
Land - - - - Property, plant, and equipment - 56,933 - 49,018 Less: accumulated depreciation - (36,041) - (32,690) Construction work in progress - 494 - 945
Total capital assets net of depreciation - 21,386 - 17,273 Total non-current assets - 21,386 - 17,273
TOTAL ASSETS 359 44,858 368 22,579
DEFERRED OUTFLOW OF RESOURCESTOTAL DEFERRED OUTFLOW OF RESOURCES $ - $ - $ - $ -
COMBINING STATEMENT OF NET POSITIONINTERNAL SERVICE FUNDS
December 31, 2014(amounts expressed in thousands)
Page 3 of 10
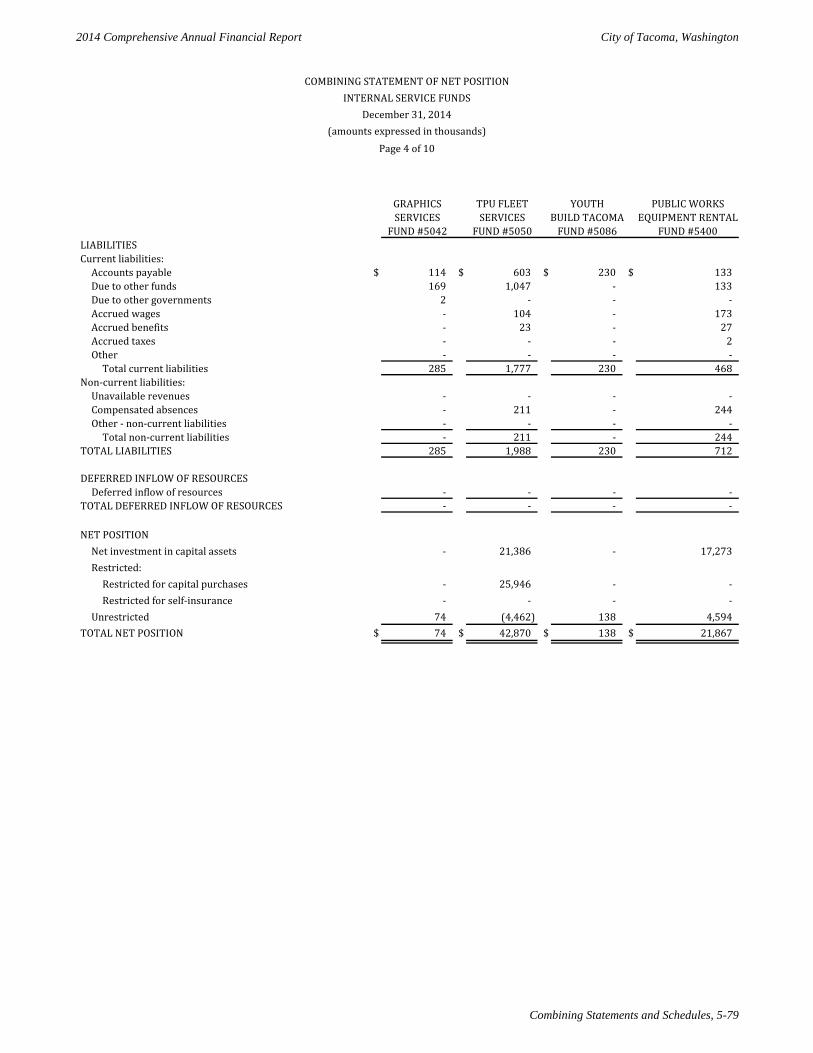
2014 Comprehensive Annual Financial Report City of Tacoma, Washington
Combining Statements and Schedules, 5-79
GRAPHICS TPU FLEET YOUTH PUBLIC WORKSSERVICES SERVICES BUILD TACOMA EQUIPMENT RENTAL
FUND #5042 FUND #5050 FUND #5086 FUND #5400LIABILITIESCurrent liabilities:
Accounts payable $ 114 $ 603 $ 230 $ 133 Due to other funds 169 1,047 - 133 Due to other governments 2 - - - Accrued wages - 104 - 173 Accrued benefits - 23 - 27 Accrued taxes - - - 2 Other - - - -
Total current liabilities 285 1,777 230 468 Non-current liabilities:
Unavailable revenues - - - - Compensated absences - 211 - 244 Other - non-current liabilities - - - -
Total non-current liabilities - 211 - 244 TOTAL LIABILITIES 285 1,988 230 712
DEFERRED INFLOW OF RESOURCESDeferred inflow of resources - - - -
TOTAL DEFERRED INFLOW OF RESOURCES - - - -
NET POSITIONNet investment in capital assets - 21,386 - 17,273 Restricted:
Restricted for capital purchases - 25,946 - - Restricted for self-insurance - - - -
Unrestricted 74 (4,462) 138 4,594 TOTAL NET POSITION $ 74 $ 42,870 $ 138 $ 21,867
COMBINING STATEMENT OF NET POSITIONINTERNAL SERVICE FUNDS
December 31, 2014(amounts expressed in thousands)
Page 4 of 10
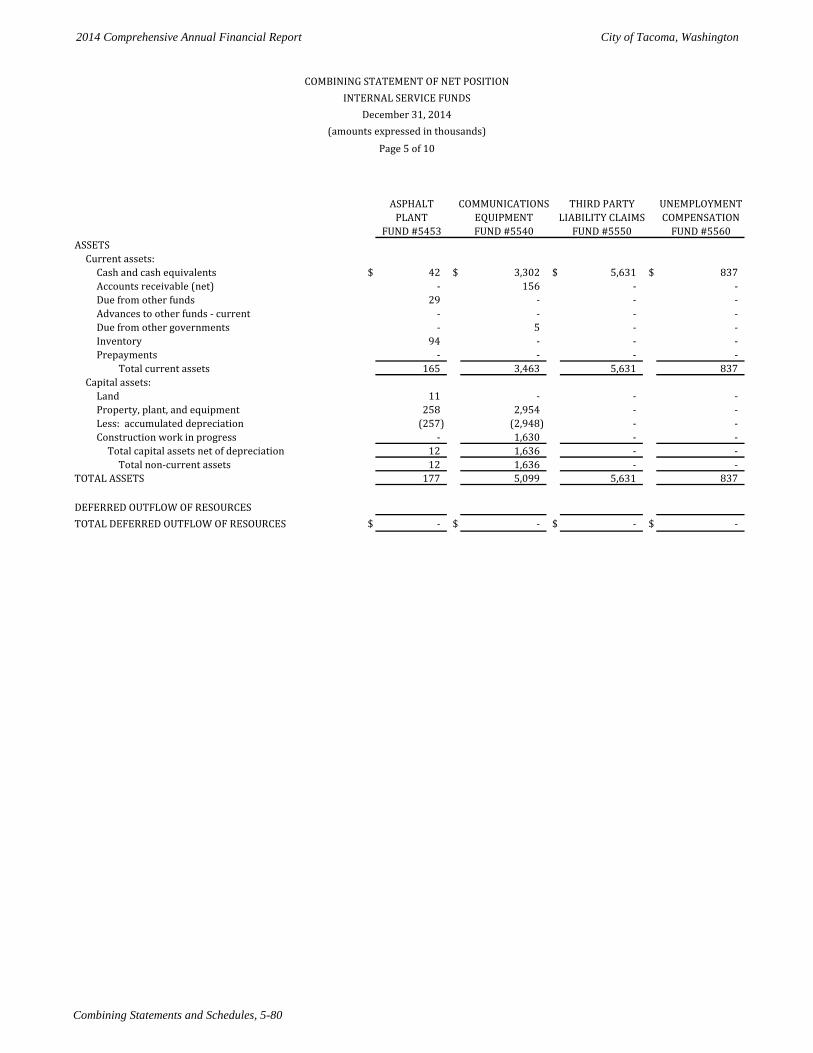
2014 Comprehensive Annual Financial Report City of Tacoma, Washington
Combining Statements and Schedules, 5-80
ASPHALT COMMUNICATIONS THIRD PARTY UNEMPLOYMENTPLANT EQUIPMENT LIABILITY CLAIMS COMPENSATION
FUND #5453 FUND #5540 FUND #5550 FUND #5560ASSETS
Current assets:Cash and cash equivalents $ 42 $ 3,302 $ 5,631 $ 837 Accounts receivable (net) - 156 - - Due from other funds 29 - - - Advances to other funds - current - - - - Due from other governments - 5 - - Inventory 94 - - - Prepayments - - - -
Total current assets 165 3,463 5,631 837 Capital assets:
Land 11 - - - Property, plant, and equipment 258 2,954 - - Less: accumulated depreciation (257) (2,948) - - Construction work in progress - 1,630 - -
Total capital assets net of depreciation 12 1,636 - - Total non-current assets 12 1,636 - -
TOTAL ASSETS 177 5,099 5,631 837
DEFERRED OUTFLOW OF RESOURCESTOTAL DEFERRED OUTFLOW OF RESOURCES $ - $ - $ - $ -
COMBINING STATEMENT OF NET POSITIONINTERNAL SERVICE FUNDS
December 31, 2014(amounts expressed in thousands)
Page 5 of 10
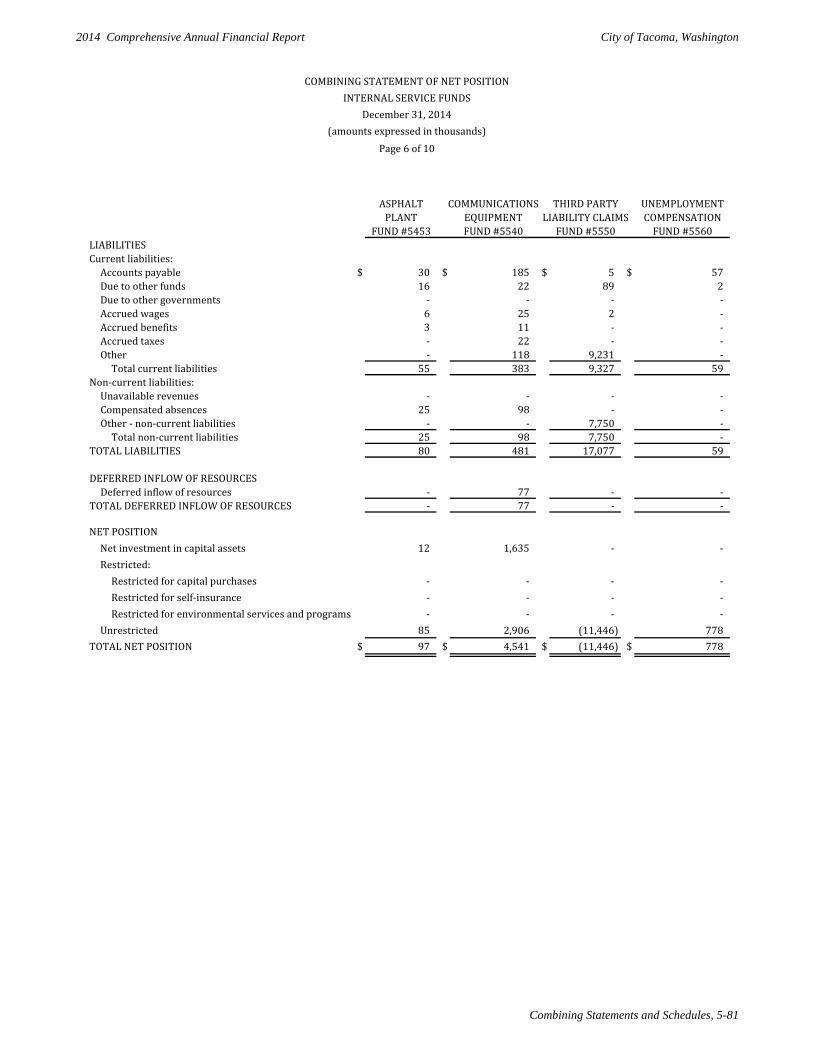
2014 Comprehensive Annual Financial Report City of Tacoma, Washington
Combining Statements and Schedules, 5-81
ASPHALT COMMUNICATIONS THIRD PARTY UNEMPLOYMENTPLANT EQUIPMENT LIABILITY CLAIMS COMPENSATION
FUND #5453 FUND #5540 FUND #5550 FUND #5560LIABILITIESCurrent liabilities:
Accounts payable $ 30 $ 185 $ 5 $ 57 Due to other funds 16 22 89 2 Due to other governments - - - - Accrued wages 6 25 2 - Accrued benefits 3 11 - - Accrued taxes - 22 - - Other - 118 9,231 -
Total current liabilities 55 383 9,327 59 Non-current liabilities:
Unavailable revenues - - - - Compensated absences 25 98 - - Other - non-current liabilities - - 7,750 -
Total non-current liabilities 25 98 7,750 - TOTAL LIABILITIES 80 481 17,077 59
DEFERRED INFLOW OF RESOURCESDeferred inflow of resources - 77 - -
TOTAL DEFERRED INFLOW OF RESOURCES - 77 - -
NET POSITIONNet investment in capital assets 12 1,635 - - Restricted:
Restricted for capital purchases - - - - Restricted for self-insurance - - - - Restricted for environmental services and programs - - - -
Unrestricted 85 2,906 (11,446) 778 TOTAL NET POSITION $ 97 $ 4,541 $ (11,446) $ 778
COMBINING STATEMENT OF NET POSITIONINTERNAL SERVICE FUNDS
December 31, 2014(amounts expressed in thousands)
Page 6 of 10
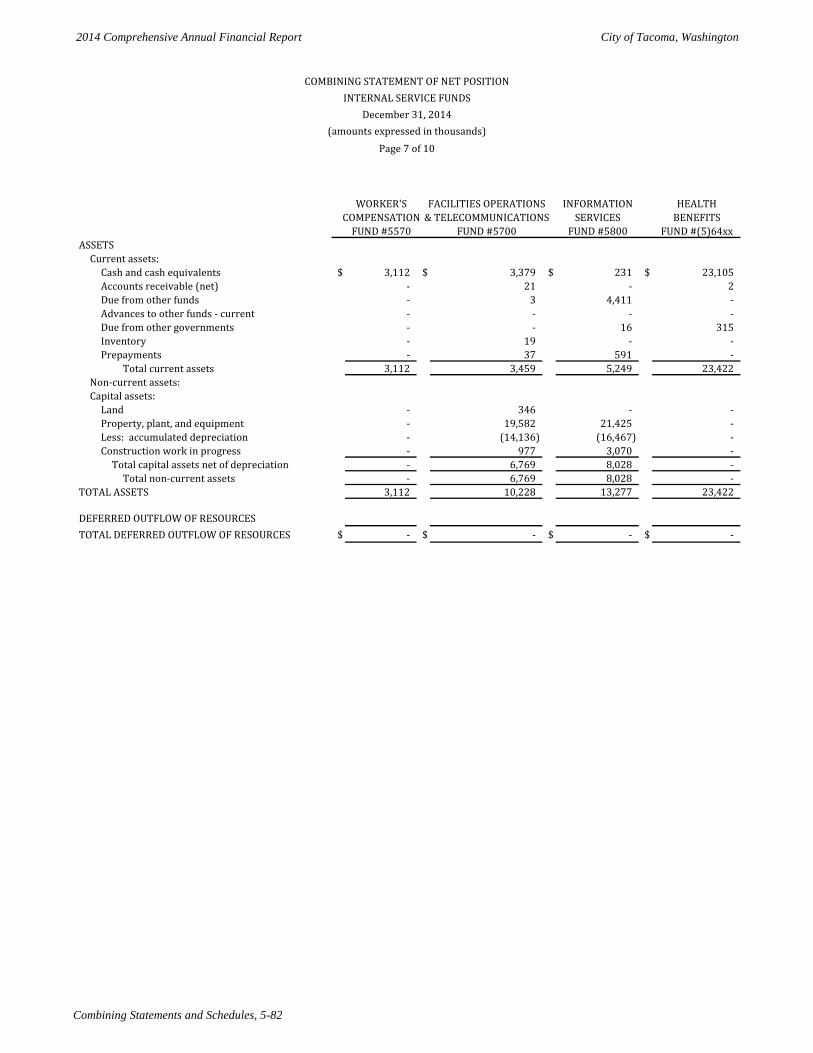
2014 Comprehensive Annual Financial Report City of Tacoma, Washington
Combining Statements and Schedules, 5-82
WORKER'S FACILITIES OPERATIONS INFORMATION HEALTHCOMPENSATION & TELECOMMUNICATIONS SERVICES BENEFITS
FUND #5570 FUND #5700 FUND #5800 FUND #(5)64xxASSETS
Current assets:Cash and cash equivalents $ 3,112 $ 3,379 $ 231 $ 23,105 Accounts receivable (net) - 21 - 2 Due from other funds - 3 4,411 - Advances to other funds - current - - - - Due from other governments - - 16 315 Inventory - 19 - - Prepayments - 37 591 -
Total current assets 3,112 3,459 5,249 23,422 Non-current assets:Capital assets:
Land - 346 - - Property, plant, and equipment - 19,582 21,425 - Less: accumulated depreciation - (14,136) (16,467) - Construction work in progress - 977 3,070 -
Total capital assets net of depreciation - 6,769 8,028 - Total non-current assets - 6,769 8,028 -
TOTAL ASSETS 3,112 10,228 13,277 23,422
DEFERRED OUTFLOW OF RESOURCESTOTAL DEFERRED OUTFLOW OF RESOURCES $ - $ - $ - $ -
COMBINING STATEMENT OF NET POSITIONINTERNAL SERVICE FUNDS
December 31, 2014(amounts expressed in thousands)
Page 7 of 10
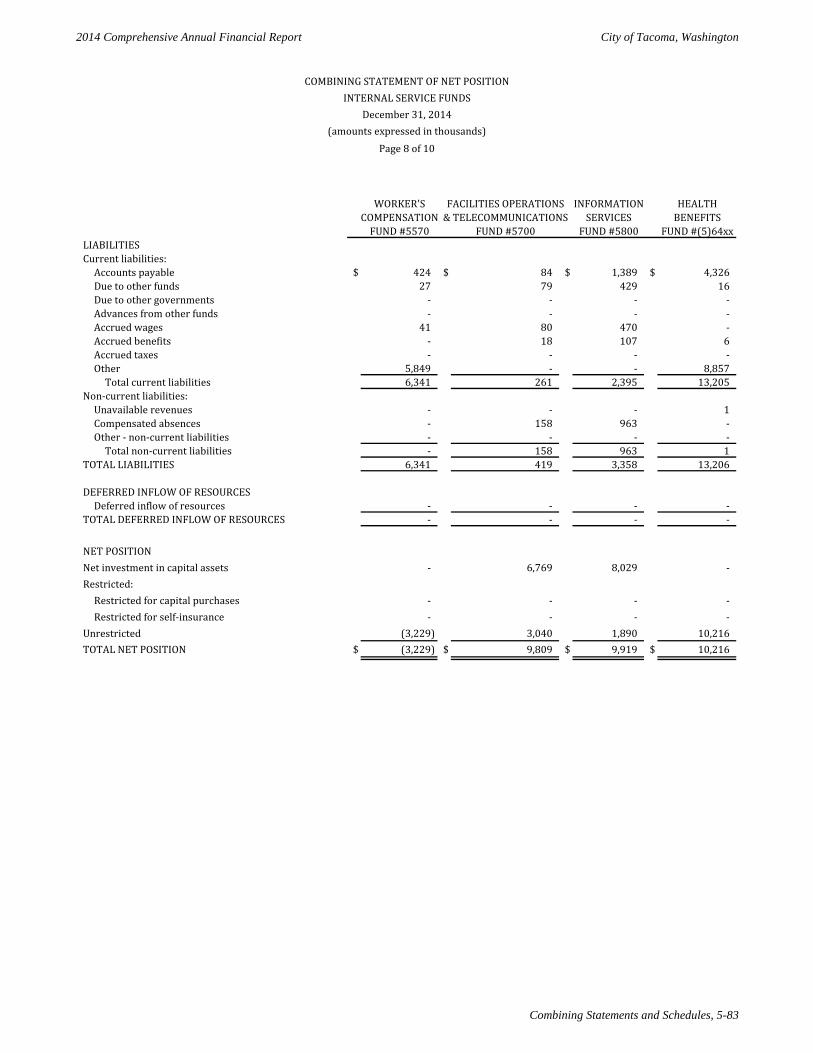
2014 Comprehensive Annual Financial Report City of Tacoma, Washington
Combining Statements and Schedules, 5-83
WORKER'S FACILITIES OPERATIONS INFORMATION HEALTHCOMPENSATION & TELECOMMUNICATIONS SERVICES BENEFITS
FUND #5570 FUND #5700 FUND #5800 FUND #(5)64xxLIABILITIESCurrent liabilities:
Accounts payable $ 424 $ 84 $ 1,389 $ 4,326 Due to other funds 27 79 429 16 Due to other governments - - - - Advances from other funds - - - - Accrued wages 41 80 470 - Accrued benefits - 18 107 6 Accrued taxes - - - - Other 5,849 - - 8,857
Total current liabilities 6,341 261 2,395 13,205 Non-current liabilities:
Unavailable revenues - - - 1 Compensated absences - 158 963 - Other - non-current liabilities - - - -
Total non-current liabilities - 158 963 1 TOTAL LIABILITIES 6,341 419 3,358 13,206
DEFERRED INFLOW OF RESOURCESDeferred inflow of resources - - - -
TOTAL DEFERRED INFLOW OF RESOURCES - - - -
NET POSITIONNet investment in capital assets - 6,769 8,029 - Restricted:
Restricted for capital purchases - - - - Restricted for self-insurance - - - -
Unrestricted (3,229) 3,040 1,890 10,216 TOTAL NET POSITION $ (3,229) $ 9,809 $ 9,919 $ 10,216
COMBINING STATEMENT OF NET POSITIONINTERNAL SERVICE FUNDS
December 31, 2014(amounts expressed in thousands)
Page 8 of 10
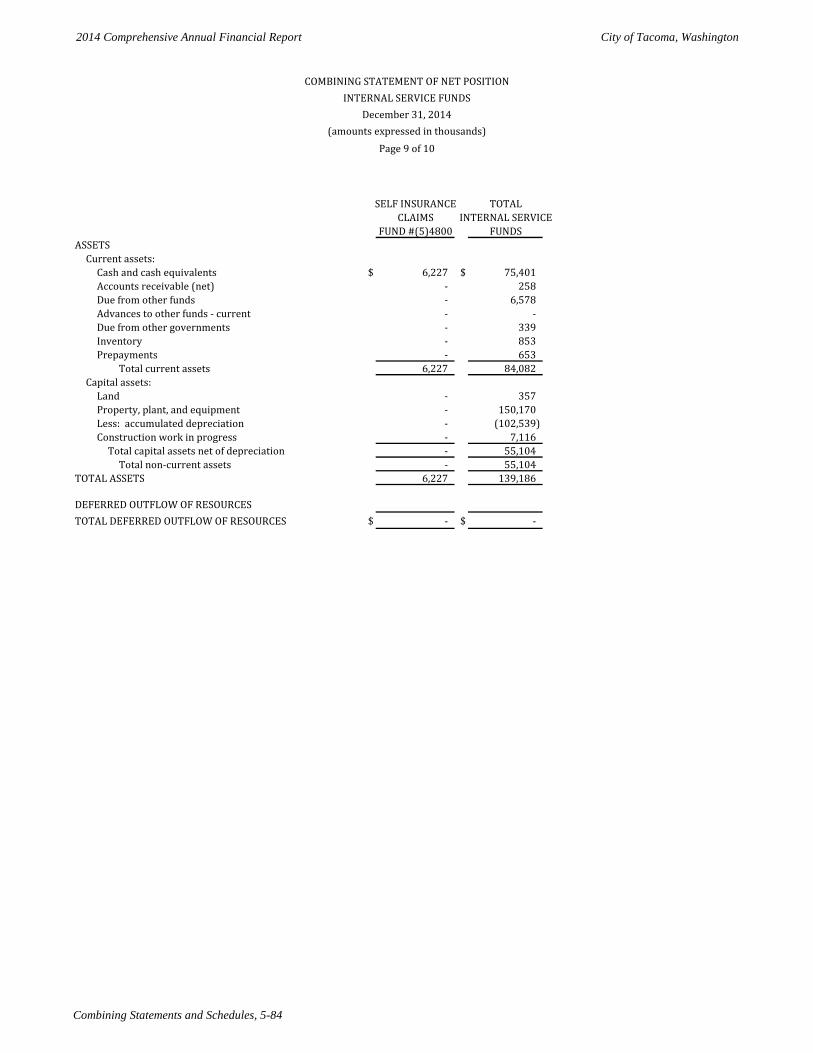
2014 Comprehensive Annual Financial Report City of Tacoma, Washington
Combining Statements and Schedules, 5-84
SELF INSURANCE TOTALCLAIMS INTERNAL SERVICE
FUND #(5)4800 FUNDSASSETS
Current assets:Cash and cash equivalents $ 6,227 $ 75,401 Accounts receivable (net) - 258 Due from other funds - 6,578 Advances to other funds - current - - Due from other governments - 339 Inventory - 853 Prepayments - 653
Total current assets 6,227 84,082 Capital assets:
Land - 357 Property, plant, and equipment - 150,170 Less: accumulated depreciation - (102,539) Construction work in progress - 7,116
Total capital assets net of depreciation - 55,104 Total non-current assets - 55,104
TOTAL ASSETS 6,227 139,186
DEFERRED OUTFLOW OF RESOURCESTOTAL DEFERRED OUTFLOW OF RESOURCES $ - $ -
COMBINING STATEMENT OF NET POSITIONINTERNAL SERVICE FUNDS
December 31, 2014(amounts expressed in thousands)
Page 9 of 10
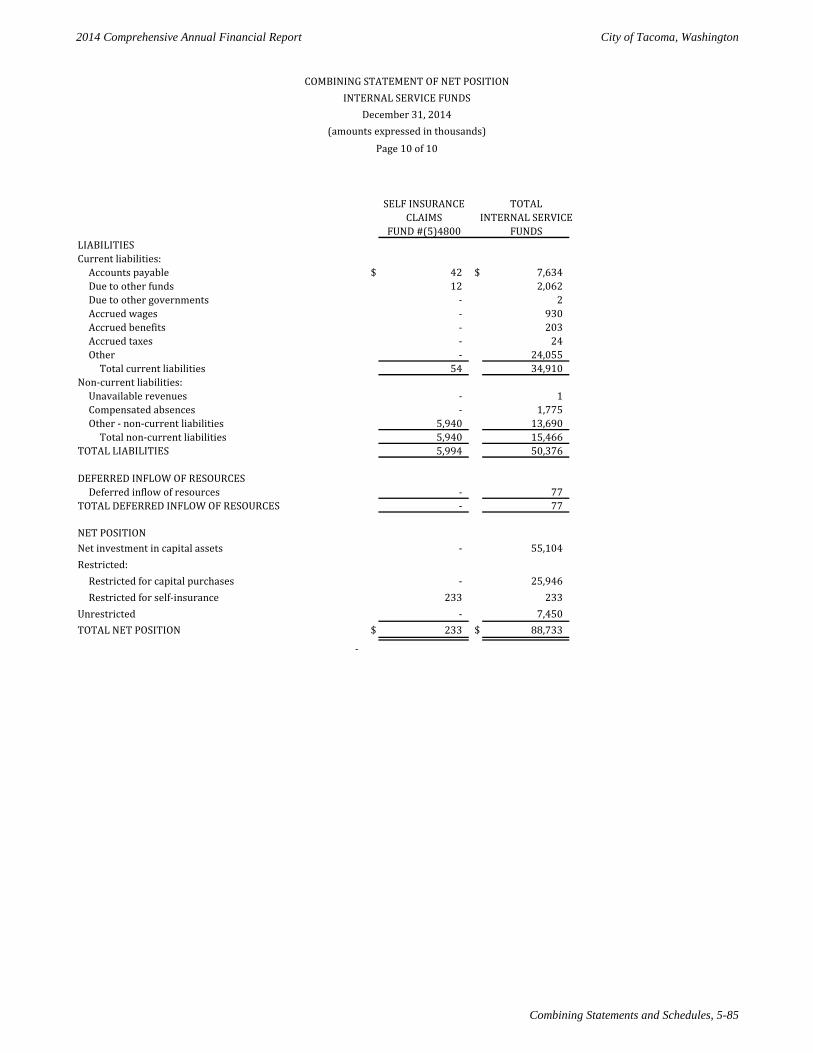
2014 Comprehensive Annual Financial Report City of Tacoma, Washington
Combining Statements and Schedules, 5-85
SELF INSURANCE TOTALCLAIMS INTERNAL SERVICE
FUND #(5)4800 FUNDSLIABILITIESCurrent liabilities:
Accounts payable $ 42 $ 7,634 Due to other funds 12 2,062 Due to other governments - 2 Accrued wages - 930 Accrued benefits - 203 Accrued taxes - 24 Other - 24,055
Total current liabilities 54 34,910 Non-current liabilities:
Unavailable revenues - 1 Compensated absences - 1,775 Other - non-current liabilities 5,940 13,690
Total non-current liabilities 5,940 15,466 TOTAL LIABILITIES 5,994 50,376
DEFERRED INFLOW OF RESOURCESDeferred inflow of resources - 77
TOTAL DEFERRED INFLOW OF RESOURCES - 77
NET POSITIONNet investment in capital assets - 55,104 Restricted:
Restricted for capital purchases - 25,946 Restricted for self-insurance 233 233
Unrestricted - 7,450 TOTAL NET POSITION $ 233 $ 88,733
-
COMBINING STATEMENT OF NET POSITIONINTERNAL SERVICE FUNDS
December 31, 2014(amounts expressed in thousands)
Page 10 of 10
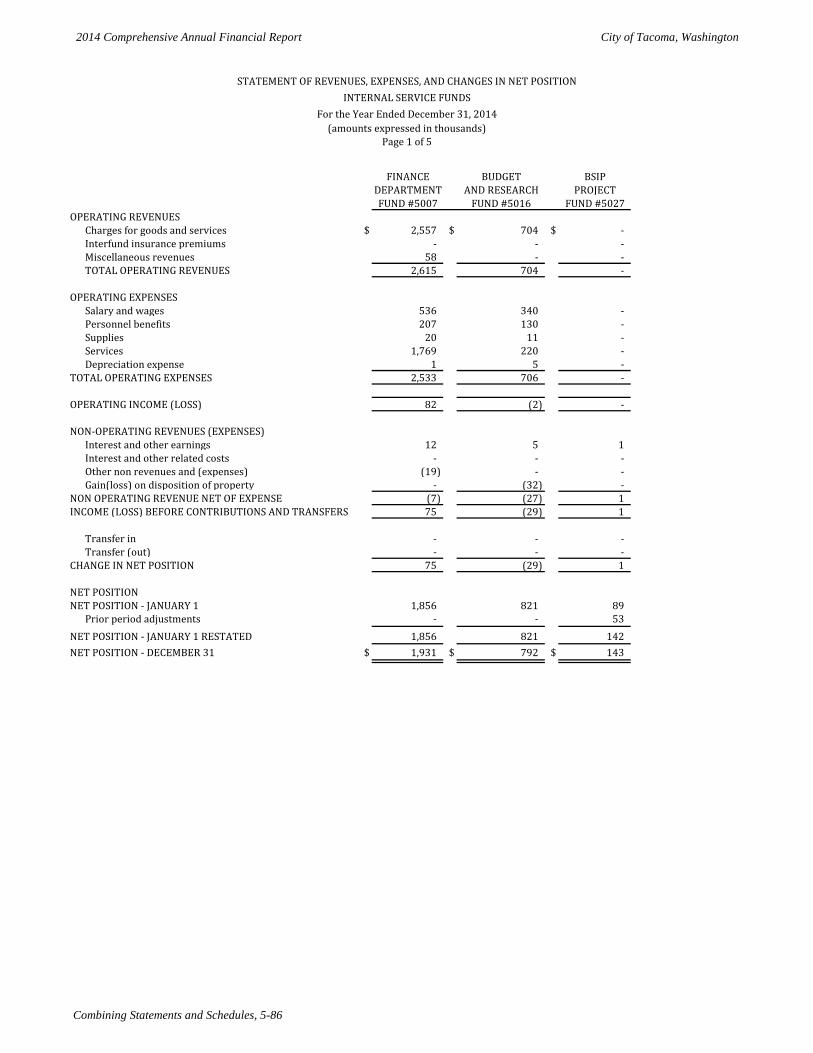
2014 Comprehensive Annual Financial Report City of Tacoma, Washington
Combining Statements and Schedules, 5-86
FINANCE BUDGET BSIPDEPARTMENT AND RESEARCH PROJECT
FUND #5007 FUND #5016 FUND #5027OPERATING REVENUES
Charges for goods and services $ 2,557 $ 704 $ - Interfund insurance premiums - - - Miscellaneous revenues 58 - - TOTAL OPERATING REVENUES 2,615 704 -
OPERATING EXPENSESSalary and wages 536 340 - Personnel benefits 207 130 - Supplies 20 11 - Services 1,769 220 - Depreciation expense 1 5 -
TOTAL OPERATING EXPENSES 2,533 706 -
OPERATING INCOME (LOSS) 82 (2) -
NON-OPERATING REVENUES (EXPENSES)Interest and other earnings 12 5 1 Interest and other related costs - - - Other non revenues and (expenses) (19) - - Gain(loss) on disposition of property - (32) -
NON OPERATING REVENUE NET OF EXPENSE (7) (27) 1 INCOME (LOSS) BEFORE CONTRIBUTIONS AND TRANSFERS 75 (29) 1
Transfer in - - - Transfer (out) - - -
CHANGE IN NET POSITION 75 (29) 1
NET POSITIONNET POSITION - JANUARY 1 1,856 821 89
Prior period adjustments - - 53 NET POSITION - JANUARY 1 RESTATED 1,856 821 142 NET POSITION - DECEMBER 31 $ 1,931 $ 792 $ 143
STATEMENT OF REVENUES, EXPENSES, AND CHANGES IN NET POSITIONINTERNAL SERVICE FUNDS
For the Year Ended December 31, 2014(amounts expressed in thousands)
Page 1 of 5
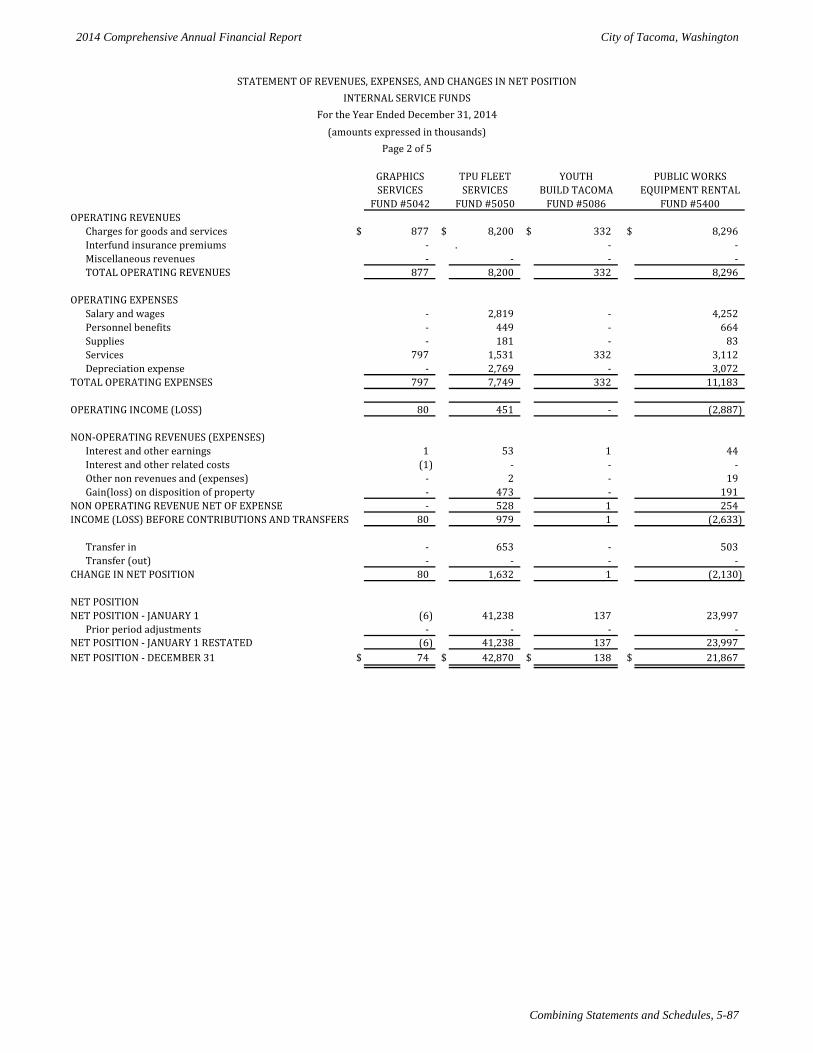
2014 Comprehensive Annual Financial Report City of Tacoma, Washington
Combining Statements and Schedules, 5-87
GRAPHICS TPU FLEET YOUTH PUBLIC WORKSSERVICES SERVICES BUILD TACOMA EQUIPMENT RENTAL
FUND #5042 FUND #5050 FUND #5086 FUND #5400OPERATING REVENUES
Charges for goods and services $ 877 $ 8,200 $ 332 $ 8,296 Interfund insurance premiums - . - - Miscellaneous revenues - - - - TOTAL OPERATING REVENUES 877 8,200 332 8,296
OPERATING EXPENSESSalary and wages - 2,819 - 4,252 Personnel benefits - 449 - 664 Supplies - 181 - 83 Services 797 1,531 332 3,112 Depreciation expense - 2,769 - 3,072
TOTAL OPERATING EXPENSES 797 7,749 332 11,183
OPERATING INCOME (LOSS) 80 451 - (2,887)
NON-OPERATING REVENUES (EXPENSES)Interest and other earnings 1 53 1 44 Interest and other related costs (1) - - - Other non revenues and (expenses) - 2 - 19 Gain(loss) on disposition of property - 473 - 191
NON OPERATING REVENUE NET OF EXPENSE - 528 1 254 INCOME (LOSS) BEFORE CONTRIBUTIONS AND TRANSFERS 80 979 1 (2,633)
Transfer in - 653 - 503 Transfer (out) - - - -
CHANGE IN NET POSITION 80 1,632 1 (2,130)
NET POSITIONNET POSITION - JANUARY 1 (6) 41,238 137 23,997
Prior period adjustments - - - - NET POSITION - JANUARY 1 RESTATED (6) 41,238 137 23,997 NET POSITION - DECEMBER 31 $ 74 $ 42,870 $ 138 $ 21,867
STATEMENT OF REVENUES, EXPENSES, AND CHANGES IN NET POSITIONINTERNAL SERVICE FUNDS
For the Year Ended December 31, 2014(amounts expressed in thousands)
Page 2 of 5
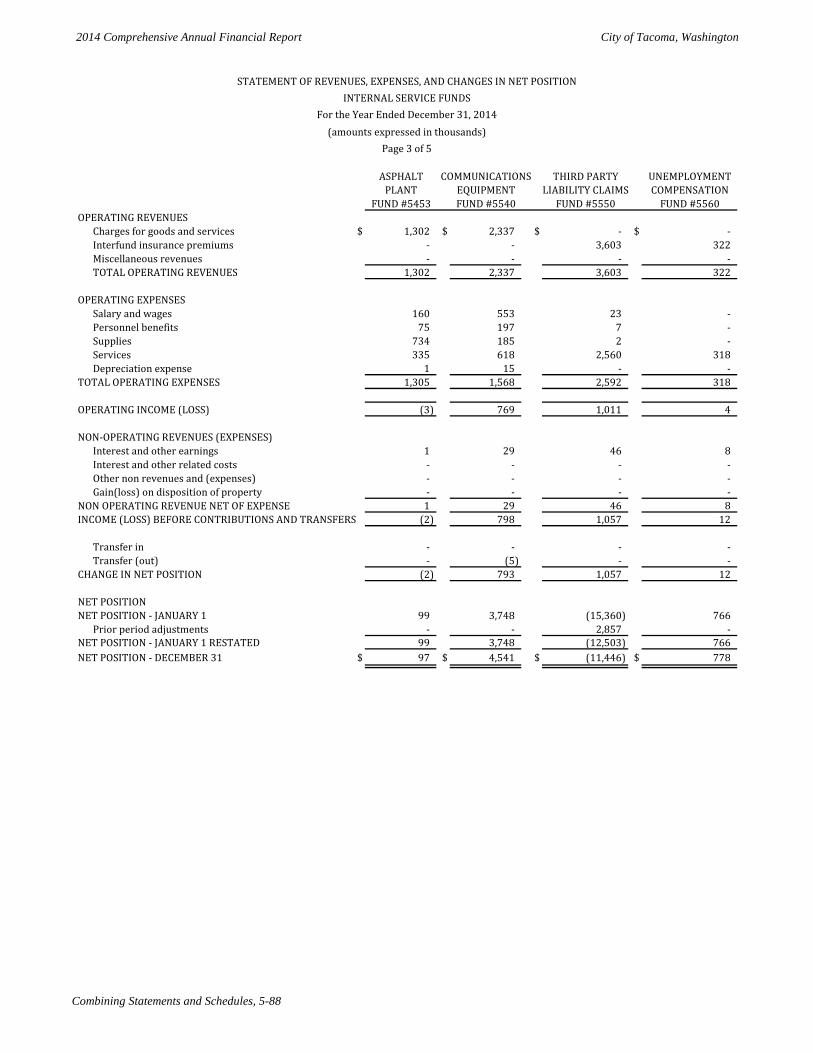
2014 Comprehensive Annual Financial Report City of Tacoma, Washington
Combining Statements and Schedules, 5-88
ASPHALT COMMUNICATIONS THIRD PARTY UNEMPLOYMENTPLANT EQUIPMENT LIABILITY CLAIMS COMPENSATION
FUND #5453 FUND #5540 FUND #5550 FUND #5560OPERATING REVENUES
Charges for goods and services $ 1,302 $ 2,337 $ - $ - Interfund insurance premiums - - 3,603 322 Miscellaneous revenues - - - - TOTAL OPERATING REVENUES 1,302 2,337 3,603 322
OPERATING EXPENSESSalary and wages 160 553 23 - Personnel benefits 75 197 7 - Supplies 734 185 2 - Services 335 618 2,560 318 Depreciation expense 1 15 - -
TOTAL OPERATING EXPENSES 1,305 1,568 2,592 318
OPERATING INCOME (LOSS) (3) 769 1,011 4
NON-OPERATING REVENUES (EXPENSES)Interest and other earnings 1 29 46 8 Interest and other related costs - - - - Other non revenues and (expenses) - - - - Gain(loss) on disposition of property - - - -
NON OPERATING REVENUE NET OF EXPENSE 1 29 46 8 INCOME (LOSS) BEFORE CONTRIBUTIONS AND TRANSFERS (2) 798 1,057 12
Transfer in - - - - Transfer (out) - (5) - -
CHANGE IN NET POSITION (2) 793 1,057 12
NET POSITIONNET POSITION - JANUARY 1 99 3,748 (15,360) 766
Prior period adjustments - - 2,857 - NET POSITION - JANUARY 1 RESTATED 99 3,748 (12,503) 766 NET POSITION - DECEMBER 31 $ 97 $ 4,541 $ (11,446) $ 778
STATEMENT OF REVENUES, EXPENSES, AND CHANGES IN NET POSITIONINTERNAL SERVICE FUNDS
For the Year Ended December 31, 2014(amounts expressed in thousands)
Page 3 of 5
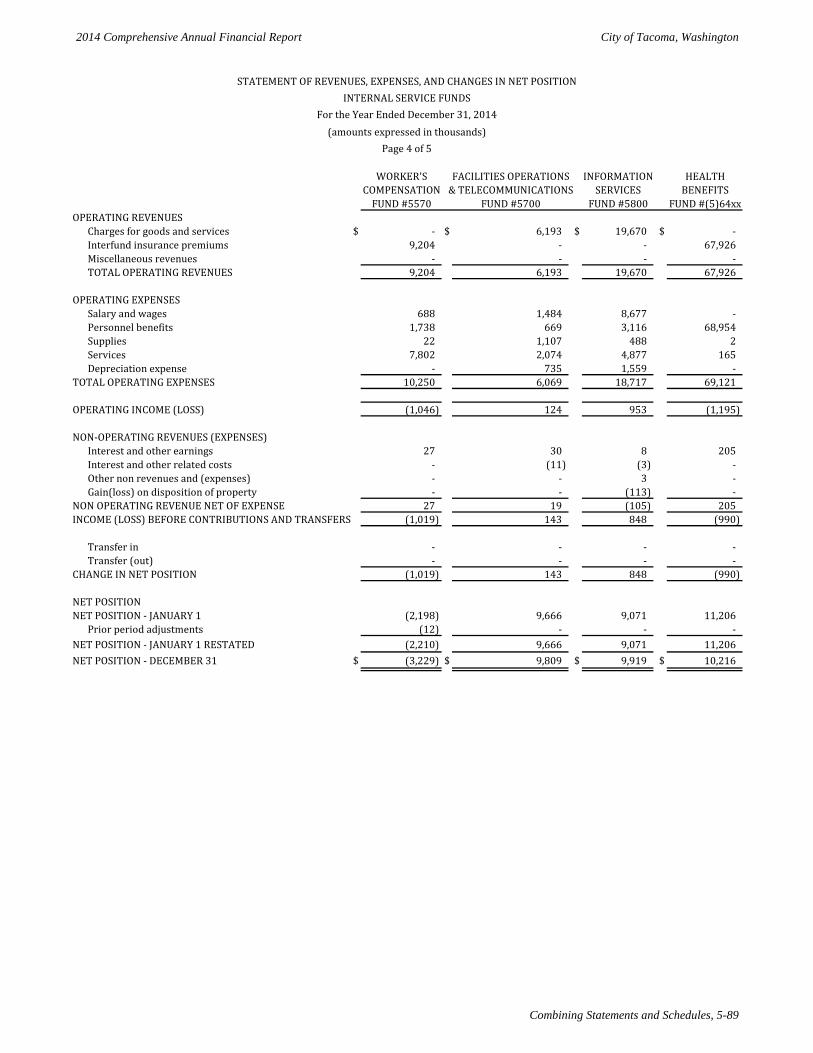
2014 Comprehensive Annual Financial Report City of Tacoma, Washington
Combining Statements and Schedules, 5-89
WORKER'S FACILITIES OPERATIONS INFORMATION HEALTHCOMPENSATION & TELECOMMUNICATIONS SERVICES BENEFITS
FUND #5570 FUND #5700 FUND #5800 FUND #(5)64xxOPERATING REVENUES
Charges for goods and services $ - $ 6,193 $ 19,670 $ - Interfund insurance premiums 9,204 - - 67,926 Miscellaneous revenues - - - - TOTAL OPERATING REVENUES 9,204 6,193 19,670 67,926
OPERATING EXPENSESSalary and wages 688 1,484 8,677 - Personnel benefits 1,738 669 3,116 68,954 Supplies 22 1,107 488 2 Services 7,802 2,074 4,877 165 Depreciation expense - 735 1,559 -
TOTAL OPERATING EXPENSES 10,250 6,069 18,717 69,121
OPERATING INCOME (LOSS) (1,046) 124 953 (1,195)
NON-OPERATING REVENUES (EXPENSES)Interest and other earnings 27 30 8 205 Interest and other related costs - (11) (3) - Other non revenues and (expenses) - - 3 - Gain(loss) on disposition of property - - (113) -
NON OPERATING REVENUE NET OF EXPENSE 27 19 (105) 205 INCOME (LOSS) BEFORE CONTRIBUTIONS AND TRANSFERS (1,019) 143 848 (990)
Transfer in - - - - Transfer (out) - - - -
CHANGE IN NET POSITION (1,019) 143 848 (990)
NET POSITIONNET POSITION - JANUARY 1 (2,198) 9,666 9,071 11,206
Prior period adjustments (12) - - - NET POSITION - JANUARY 1 RESTATED (2,210) 9,666 9,071 11,206 NET POSITION - DECEMBER 31 $ (3,229) $ 9,809 $ 9,919 $ 10,216
STATEMENT OF REVENUES, EXPENSES, AND CHANGES IN NET POSITIONINTERNAL SERVICE FUNDS
For the Year Ended December 31, 2014(amounts expressed in thousands)
Page 4 of 5
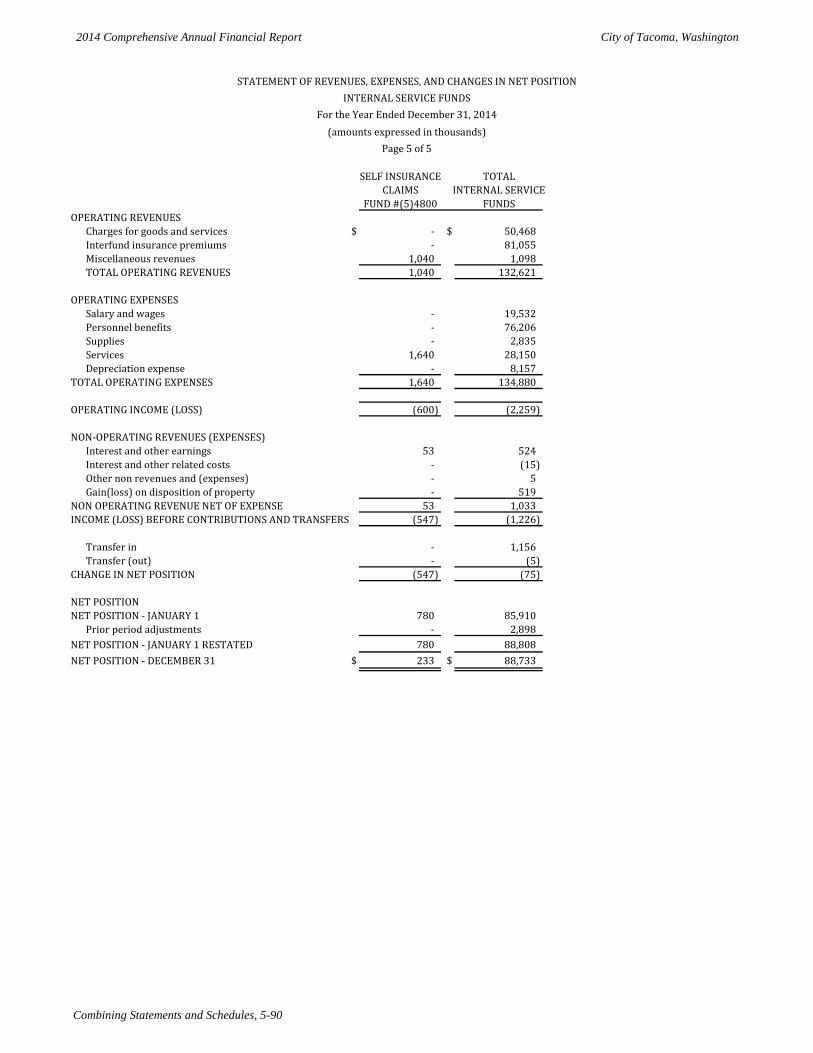
2014 Comprehensive Annual Financial Report City of Tacoma, Washington
Combining Statements and Schedules, 5-90
SELF INSURANCE TOTALCLAIMS INTERNAL SERVICE
FUND #(5)4800 FUNDSOPERATING REVENUES
Charges for goods and services $ - $ 50,468 Interfund insurance premiums - 81,055 Miscellaneous revenues 1,040 1,098 TOTAL OPERATING REVENUES 1,040 132,621
OPERATING EXPENSESSalary and wages - 19,532 Personnel benefits - 76,206 Supplies - 2,835 Services 1,640 28,150 Depreciation expense - 8,157
TOTAL OPERATING EXPENSES 1,640 134,880
OPERATING INCOME (LOSS) (600) (2,259)
NON-OPERATING REVENUES (EXPENSES)Interest and other earnings 53 524 Interest and other related costs - (15) Other non revenues and (expenses) - 5 Gain(loss) on disposition of property - 519
NON OPERATING REVENUE NET OF EXPENSE 53 1,033 INCOME (LOSS) BEFORE CONTRIBUTIONS AND TRANSFERS (547) (1,226)
Transfer in - 1,156 Transfer (out) - (5)
CHANGE IN NET POSITION (547) (75)
NET POSITIONNET POSITION - JANUARY 1 780 85,910
Prior period adjustments - 2,898 NET POSITION - JANUARY 1 RESTATED 780 88,808 NET POSITION - DECEMBER 31 $ 233 $ 88,733
STATEMENT OF REVENUES, EXPENSES, AND CHANGES IN NET POSITIONINTERNAL SERVICE FUNDS
For the Year Ended December 31, 2014(amounts expressed in thousands)
Page 5 of 5

THIS PAGE LEFT INTENTIONALLY BLANK
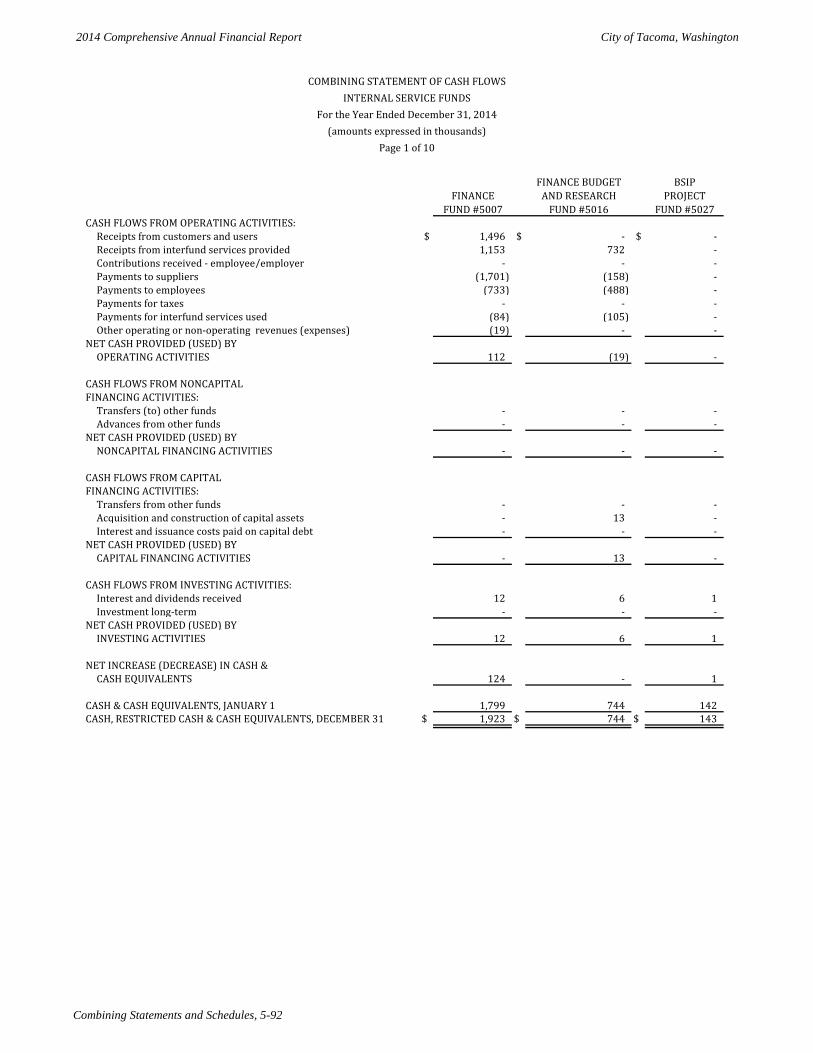
2014 Comprehensive Annual Financial Report City of Tacoma, Washington
Combining Statements and Schedules, 5-92
FINANCE BUDGET BSIPFINANCE AND RESEARCH PROJECT
FUND #5007 FUND #5016 FUND #5027CASH FLOWS FROM OPERATING ACTIVITIES:
Receipts from customers and users $ 1,496 $ - $ - Receipts from interfund services provided 1,153 732 - Contributions received - employee/employer - - - Payments to suppliers (1,701) (158) - Payments to employees (733) (488) - Payments for taxes - - - Payments for interfund services used (84) (105) - Other operating or non-operating revenues (expenses) (19) - -
NET CASH PROVIDED (USED) BY OPERATING ACTIVITIES 112 (19) -
CASH FLOWS FROM NONCAPITAL FINANCING ACTIVITIES:
Transfers (to) other funds - - - Advances from other funds - - -
NET CASH PROVIDED (USED) BY NONCAPITAL FINANCING ACTIVITIES - - -
CASH FLOWS FROM CAPITAL FINANCING ACTIVITIES:
Transfers from other funds - - - Acquisition and construction of capital assets - 13 - Interest and issuance costs paid on capital debt - - -
NET CASH PROVIDED (USED) BY CAPITAL FINANCING ACTIVITIES - 13 -
CASH FLOWS FROM INVESTING ACTIVITIES:Interest and dividends received 12 6 1 Investment long-term - - -
NET CASH PROVIDED (USED) BY INVESTING ACTIVITIES 12 6 1
NET INCREASE (DECREASE) IN CASH & CASH EQUIVALENTS 124 - 1
CASH & CASH EQUIVALENTS, JANUARY 1 1,799 744 142 CASH, RESTRICTED CASH & CASH EQUIVALENTS, DECEMBER 31 $ 1,923 $ 744 $ 143
COMBINING STATEMENT OF CASH FLOWSINTERNAL SERVICE FUNDS
For the Year Ended December 31, 2014(amounts expressed in thousands)
Page 1 of 10
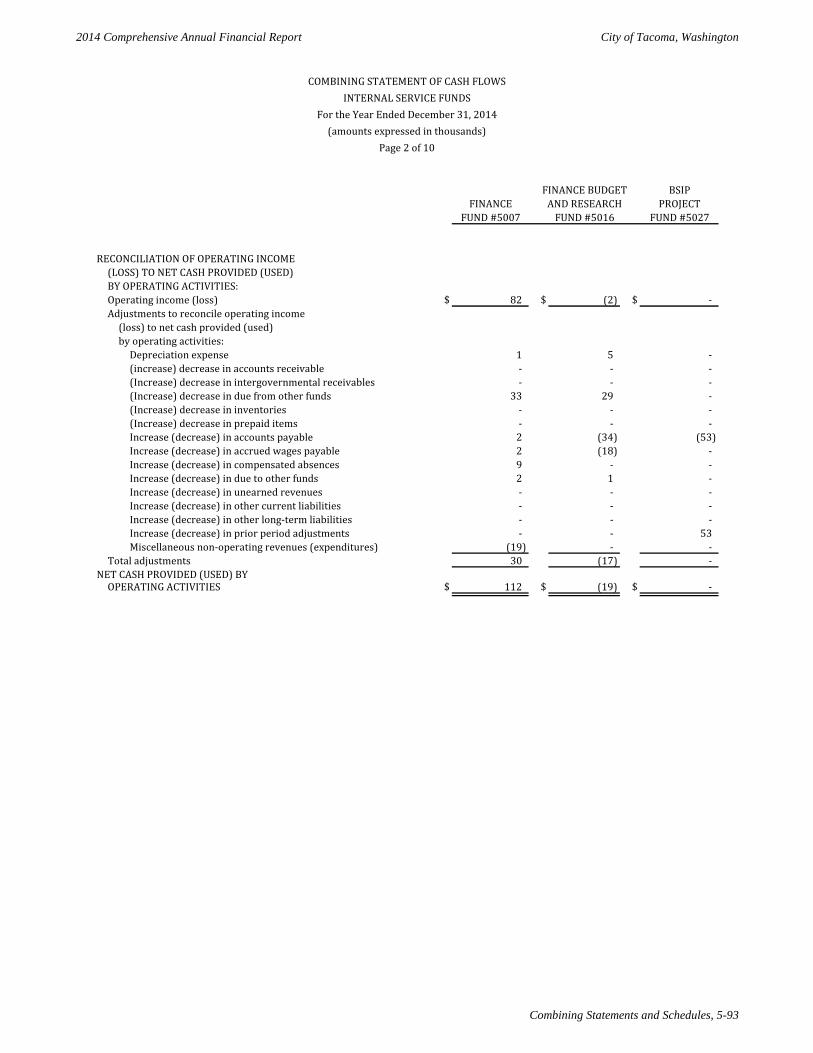
2014 Comprehensive Annual Financial Report City of Tacoma, Washington
Combining Statements and Schedules, 5-93
FINANCE BUDGET BSIPFINANCE AND RESEARCH PROJECT
FUND #5007 FUND #5016 FUND #5027
RECONCILIATION OF OPERATING INCOME(LOSS) TO NET CASH PROVIDED (USED)BY OPERATING ACTIVITIES:Operating income (loss) $ 82 $ (2) $ - Adjustments to reconcile operating income
(loss) to net cash provided (used)by operating activities:
Depreciation expense 1 5 - (increase) decrease in accounts receivable - - - (Increase) decrease in intergovernmental receivables - - - (Increase) decrease in due from other funds 33 29 - (Increase) decrease in inventories - - - (Increase) decrease in prepaid items - - - Increase (decrease) in accounts payable 2 (34) (53) Increase (decrease) in accrued wages payable 2 (18) - Increase (decrease) in compensated absences 9 - - Increase (decrease) in due to other funds 2 1 - Increase (decrease) in unearned revenues - - - Increase (decrease) in other current liabilities - - - Increase (decrease) in other long-term liabilities - - - Increase (decrease) in prior period adjustments - - 53 Miscellaneous non-operating revenues (expenditures) (19) - -
Total adjustments 30 (17) - NET CASH PROVIDED (USED) BY
OPERATING ACTIVITIES $ 112 $ (19) $ -
COMBINING STATEMENT OF CASH FLOWSINTERNAL SERVICE FUNDS
For the Year Ended December 31, 2014(amounts expressed in thousands)
Page 2 of 10
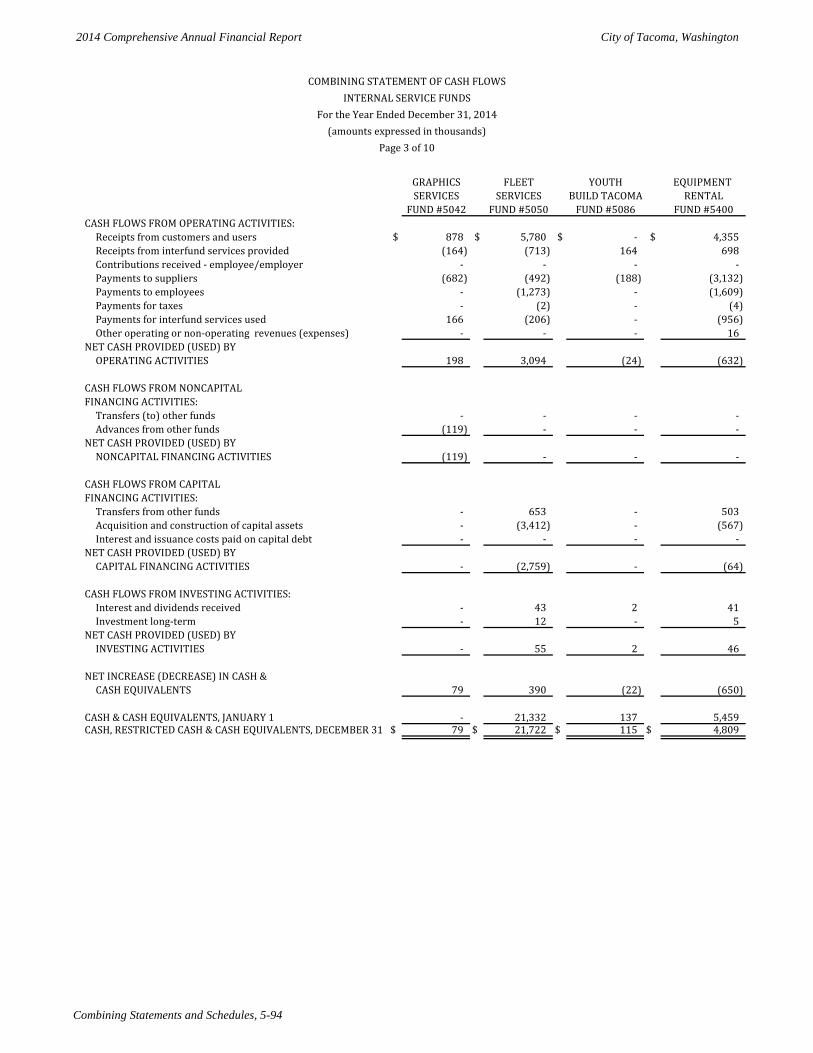
2014 Comprehensive Annual Financial Report City of Tacoma, Washington
Combining Statements and Schedules, 5-94
GRAPHICS FLEET YOUTH EQUIPMENT SERVICES SERVICES BUILD TACOMA RENTAL
FUND #5042 FUND #5050 FUND #5086 FUND #5400CASH FLOWS FROM OPERATING ACTIVITIES:
Receipts from customers and users $ 878 $ 5,780 $ - $ 4,355 Receipts from interfund services provided (164) (713) 164 698 Contributions received - employee/employer - - - - Payments to suppliers (682) (492) (188) (3,132) Payments to employees - (1,273) - (1,609) Payments for taxes - (2) - (4) Payments for interfund services used 166 (206) - (956) Other operating or non-operating revenues (expenses) - - - 16
NET CASH PROVIDED (USED) BY OPERATING ACTIVITIES 198 3,094 (24) (632)
CASH FLOWS FROM NONCAPITAL FINANCING ACTIVITIES:
Transfers (to) other funds - - - - Advances from other funds (119) - - -
NET CASH PROVIDED (USED) BY NONCAPITAL FINANCING ACTIVITIES (119) - - -
CASH FLOWS FROM CAPITAL FINANCING ACTIVITIES:
Transfers from other funds - 653 - 503 Acquisition and construction of capital assets - (3,412) - (567) Interest and issuance costs paid on capital debt - - - -
NET CASH PROVIDED (USED) BY CAPITAL FINANCING ACTIVITIES - (2,759) - (64)
CASH FLOWS FROM INVESTING ACTIVITIES:Interest and dividends received - 43 2 41 Investment long-term - 12 - 5
NET CASH PROVIDED (USED) BY INVESTING ACTIVITIES - 55 2 46
NET INCREASE (DECREASE) IN CASH & CASH EQUIVALENTS 79 390 (22) (650)
CASH & CASH EQUIVALENTS, JANUARY 1 - 21,332 137 5,459 CASH, RESTRICTED CASH & CASH EQUIVALENTS, DECEMBER 31 $ 79 $ 21,722 $ 115 $ 4,809
(amounts expressed in thousands)
COMBINING STATEMENT OF CASH FLOWSINTERNAL SERVICE FUNDS
For the Year Ended December 31, 2014
Page 3 of 10
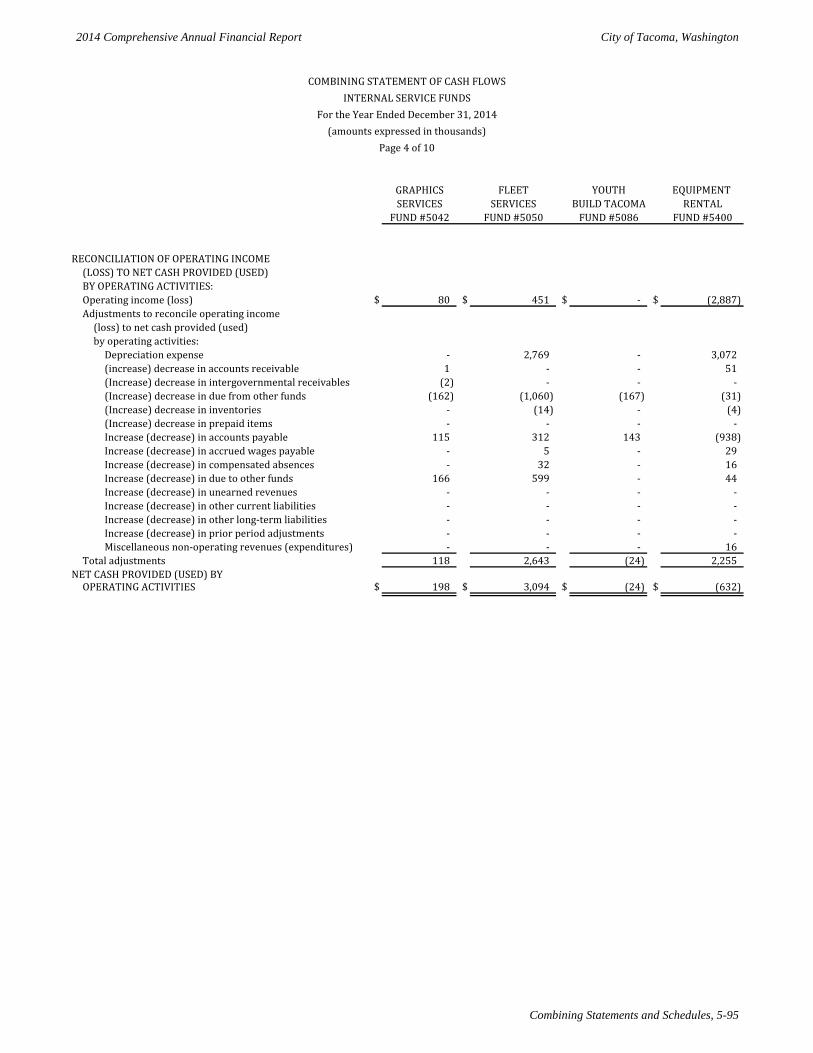
2014 Comprehensive Annual Financial Report City of Tacoma, Washington
Combining Statements and Schedules, 5-95
GRAPHICS FLEET YOUTH EQUIPMENT SERVICES SERVICES BUILD TACOMA RENTAL
FUND #5042 FUND #5050 FUND #5086 FUND #5400
RECONCILIATION OF OPERATING INCOME(LOSS) TO NET CASH PROVIDED (USED)BY OPERATING ACTIVITIES:Operating income (loss) $ 80 $ 451 $ - $ (2,887) Adjustments to reconcile operating income
(loss) to net cash provided (used)by operating activities:
Depreciation expense - 2,769 - 3,072 (increase) decrease in accounts receivable 1 - - 51 (Increase) decrease in intergovernmental receivables (2) - - - (Increase) decrease in due from other funds (162) (1,060) (167) (31) (Increase) decrease in inventories - (14) - (4) (Increase) decrease in prepaid items - - - - Increase (decrease) in accounts payable 115 312 143 (938) Increase (decrease) in accrued wages payable - 5 - 29 Increase (decrease) in compensated absences - 32 - 16 Increase (decrease) in due to other funds 166 599 - 44 Increase (decrease) in unearned revenues - - - - Increase (decrease) in other current liabilities - - - - Increase (decrease) in other long-term liabilities - - - - Increase (decrease) in prior period adjustments - - - - Miscellaneous non-operating revenues (expenditures) - - - 16
Total adjustments 118 2,643 (24) 2,255 NET CASH PROVIDED (USED) BY
OPERATING ACTIVITIES $ 198 $ 3,094 $ (24) $ (632)
Page 4 of 10(amounts expressed in thousands)
COMBINING STATEMENT OF CASH FLOWSINTERNAL SERVICE FUNDS
For the Year Ended December 31, 2014
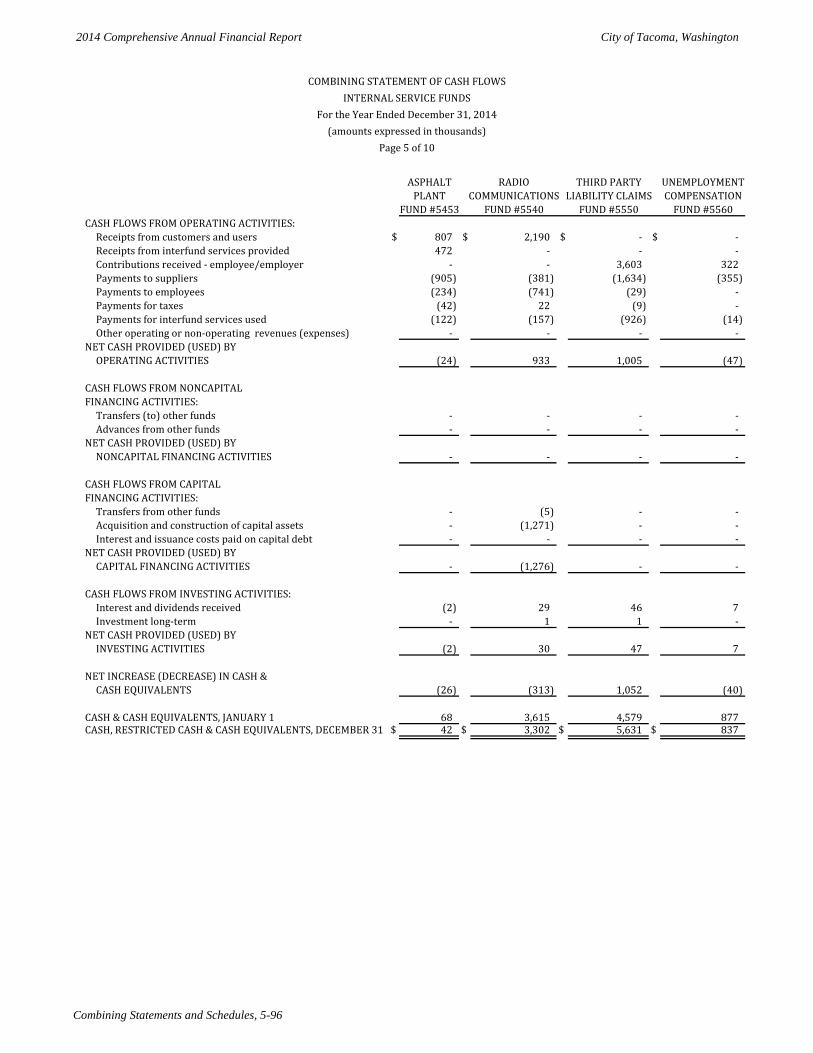
2014 Comprehensive Annual Financial Report City of Tacoma, Washington
Combining Statements and Schedules, 5-96
ASPHALT RADIO THIRD PARTY UNEMPLOYMENTPLANT COMMUNICATIONS LIABILITY CLAIMS COMPENSATION
FUND #5453 FUND #5540 FUND #5550 FUND #5560CASH FLOWS FROM OPERATING ACTIVITIES:
Receipts from customers and users $ 807 $ 2,190 $ - $ - Receipts from interfund services provided 472 - - - Contributions received - employee/employer - - 3,603 322 Payments to suppliers (905) (381) (1,634) (355) Payments to employees (234) (741) (29) - Payments for taxes (42) 22 (9) - Payments for interfund services used (122) (157) (926) (14) Other operating or non-operating revenues (expenses) - - - -
NET CASH PROVIDED (USED) BY OPERATING ACTIVITIES (24) 933 1,005 (47)
CASH FLOWS FROM NONCAPITAL FINANCING ACTIVITIES:
Transfers (to) other funds - - - - Advances from other funds - - - -
NET CASH PROVIDED (USED) BY NONCAPITAL FINANCING ACTIVITIES - - - -
CASH FLOWS FROM CAPITAL FINANCING ACTIVITIES:
Transfers from other funds - (5) - - Acquisition and construction of capital assets - (1,271) - - Interest and issuance costs paid on capital debt - - - -
NET CASH PROVIDED (USED) BY CAPITAL FINANCING ACTIVITIES - (1,276) - -
CASH FLOWS FROM INVESTING ACTIVITIES:Interest and dividends received (2) 29 46 7 Investment long-term - 1 1 -
NET CASH PROVIDED (USED) BY INVESTING ACTIVITIES (2) 30 47 7
NET INCREASE (DECREASE) IN CASH & CASH EQUIVALENTS (26) (313) 1,052 (40)
CASH & CASH EQUIVALENTS, JANUARY 1 68 3,615 4,579 877 CASH, RESTRICTED CASH & CASH EQUIVALENTS, DECEMBER 31 $ 42 $ 3,302 $ 5,631 $ 837
(amounts expressed in thousands)
COMBINING STATEMENT OF CASH FLOWSINTERNAL SERVICE FUNDS
For the Year Ended December 31, 2014
Page 5 of 10

2014 Comprehensive Annual Financial Report City of Tacoma, Washington
Combining Statements and Schedules, 5-97
ASPHALT RADIO THIRD PARTY UNEMPLOYMENTPLANT COMMUNICATIONS LIABILITY CLAIMS COMPENSATION
FUND #5453 FUND #5540 FUND #5550 FUND #5560
RECONCILIATION OF OPERATING INCOME(LOSS) TO NET CASH PROVIDED (USED)BY OPERATING ACTIVITIES:Operating income (loss) $ (3) $ 769 $ 1,011 $ 4 Adjustments to reconcile operating income
(loss) to net cash provided (used)by operating activities:
Depreciation expense 1 15 - - (increase) decrease in accounts receivable - (146) - - (Increase) decrease in intergovernmental receivables - - - - (Increase) decrease in due from other funds (24) - - - (Increase) decrease in inventories (3) - - - (Increase) decrease in prepaid items - - - - Increase (decrease) in accounts payable (1) 198 (2,329) (51) Increase (decrease) in accrued wages payable - 2 - - Increase (decrease) in compensated absences 2 6 - - Increase (decrease) in due to other funds 4 12 7 - Increase (decrease) in unearned revenues - 77 - - Increase (decrease) in other current liabilities - - - - Increase (decrease) in other long-term liabilities - - (541) - Increase (decrease) in prior period adjustments - - 2,857 - Miscellaneous non-operating revenues (expenditures) - - - -
Total adjustments (21) 164 (6) (51) NET CASH PROVIDED (USED) BY
OPERATING ACTIVITIES $ (24) $ 933 $ 1,005 $ (47)
(amounts expressed in thousands)Page 6 of 10
COMBINING STATEMENT OF CASH FLOWSINTERNAL SERVICE FUNDS
For the Year Ended December 31, 2014
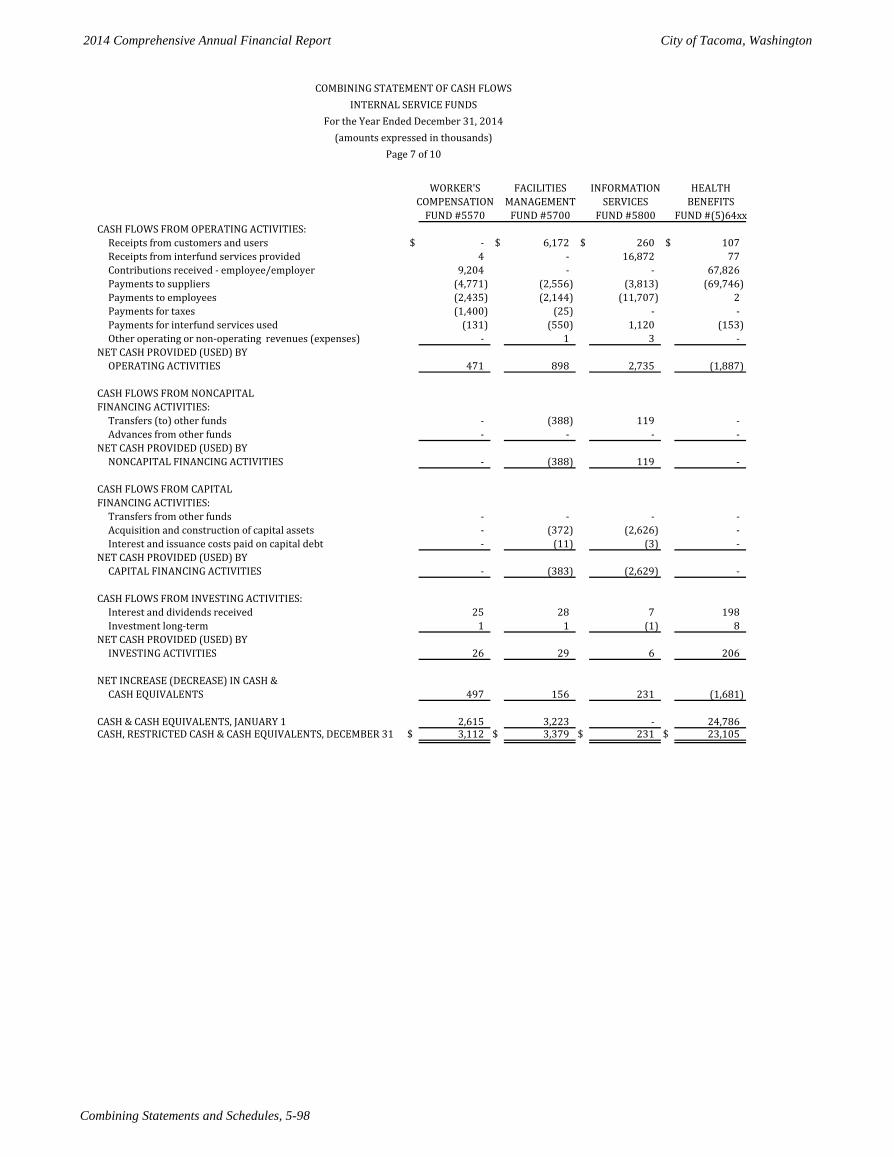
2014 Comprehensive Annual Financial Report City of Tacoma, Washington
Combining Statements and Schedules, 5-98
WORKER'S FACILITIES INFORMATION HEALTHCOMPENSATION MANAGEMENT SERVICES BENEFITS
FUND #5570 FUND #5700 FUND #5800 FUND #(5)64xxCASH FLOWS FROM OPERATING ACTIVITIES:
Receipts from customers and users $ - $ 6,172 $ 260 $ 107 Receipts from interfund services provided 4 - 16,872 77 Contributions received - employee/employer 9,204 - - 67,826 Payments to suppliers (4,771) (2,556) (3,813) (69,746) Payments to employees (2,435) (2,144) (11,707) 2 Payments for taxes (1,400) (25) - - Payments for interfund services used (131) (550) 1,120 (153) Other operating or non-operating revenues (expenses) - 1 3 -
NET CASH PROVIDED (USED) BY OPERATING ACTIVITIES 471 898 2,735 (1,887)
CASH FLOWS FROM NONCAPITAL FINANCING ACTIVITIES:
Transfers (to) other funds - (388) 119 - Advances from other funds - - - -
NET CASH PROVIDED (USED) BY NONCAPITAL FINANCING ACTIVITIES - (388) 119 -
CASH FLOWS FROM CAPITAL FINANCING ACTIVITIES:
Transfers from other funds - - - - Acquisition and construction of capital assets - (372) (2,626) - Interest and issuance costs paid on capital debt - (11) (3) -
NET CASH PROVIDED (USED) BY CAPITAL FINANCING ACTIVITIES - (383) (2,629) -
CASH FLOWS FROM INVESTING ACTIVITIES:Interest and dividends received 25 28 7 198 Investment long-term 1 1 (1) 8
NET CASH PROVIDED (USED) BY INVESTING ACTIVITIES 26 29 6 206
NET INCREASE (DECREASE) IN CASH & CASH EQUIVALENTS 497 156 231 (1,681)
CASH & CASH EQUIVALENTS, JANUARY 1 2,615 3,223 - 24,786 CASH, RESTRICTED CASH & CASH EQUIVALENTS, DECEMBER 31 $ 3,112 $ 3,379 $ 231 $ 23,105
(amounts expressed in thousands)
COMBINING STATEMENT OF CASH FLOWSINTERNAL SERVICE FUNDS
For the Year Ended December 31, 2014
Page 7 of 10
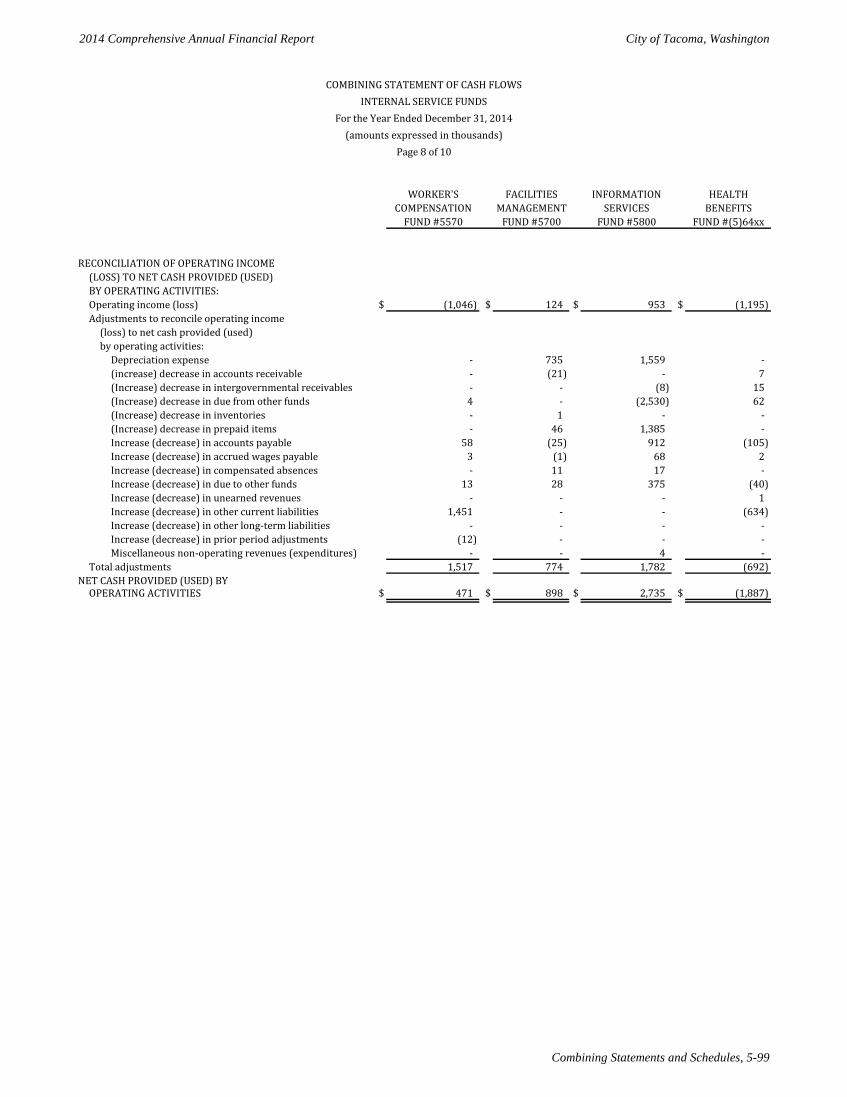
2014 Comprehensive Annual Financial Report City of Tacoma, Washington
Combining Statements and Schedules, 5-99
WORKER'S FACILITIES INFORMATION HEALTHCOMPENSATION MANAGEMENT SERVICES BENEFITS
FUND #5570 FUND #5700 FUND #5800 FUND #(5)64xx
RECONCILIATION OF OPERATING INCOME(LOSS) TO NET CASH PROVIDED (USED)BY OPERATING ACTIVITIES:Operating income (loss) $ (1,046) $ 124 $ 953 $ (1,195) Adjustments to reconcile operating income
(loss) to net cash provided (used)by operating activities:
Depreciation expense - 735 1,559 - (increase) decrease in accounts receivable - (21) - 7 (Increase) decrease in intergovernmental receivables - - (8) 15 (Increase) decrease in due from other funds 4 - (2,530) 62 (Increase) decrease in inventories - 1 - - (Increase) decrease in prepaid items - 46 1,385 - Increase (decrease) in accounts payable 58 (25) 912 (105) Increase (decrease) in accrued wages payable 3 (1) 68 2 Increase (decrease) in compensated absences - 11 17 - Increase (decrease) in due to other funds 13 28 375 (40) Increase (decrease) in unearned revenues - - - 1 Increase (decrease) in other current liabilities 1,451 - - (634) Increase (decrease) in other long-term liabilities - - - - Increase (decrease) in prior period adjustments (12) - - - Miscellaneous non-operating revenues (expenditures) - - 4 -
Total adjustments 1,517 774 1,782 (692) NET CASH PROVIDED (USED) BY
OPERATING ACTIVITIES $ 471 $ 898 $ 2,735 $ (1,887)
Page 8 of 10(amounts expressed in thousands)
COMBINING STATEMENT OF CASH FLOWSINTERNAL SERVICE FUNDS
For the Year Ended December 31, 2014
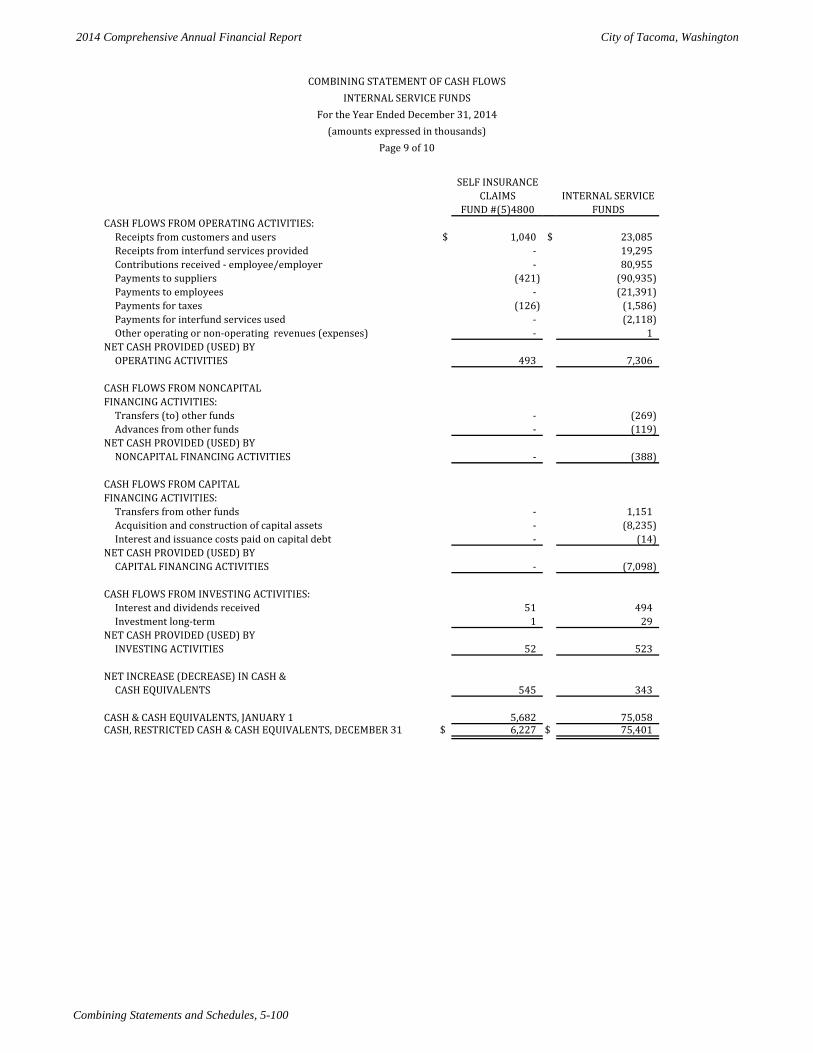
2014 Comprehensive Annual Financial Report City of Tacoma, Washington
Combining Statements and Schedules, 5-100
SELF INSURANCECLAIMS INTERNAL SERVICE
FUND #(5)4800 FUNDSCASH FLOWS FROM OPERATING ACTIVITIES:
Receipts from customers and users $ 1,040 $ 23,085 Receipts from interfund services provided - 19,295 Contributions received - employee/employer - 80,955 Payments to suppliers (421) (90,935) Payments to employees - (21,391) Payments for taxes (126) (1,586) Payments for interfund services used - (2,118) Other operating or non-operating revenues (expenses) - 1
NET CASH PROVIDED (USED) BY OPERATING ACTIVITIES 493 7,306
CASH FLOWS FROM NONCAPITAL FINANCING ACTIVITIES:
Transfers (to) other funds - (269) Advances from other funds - (119)
NET CASH PROVIDED (USED) BY NONCAPITAL FINANCING ACTIVITIES - (388)
CASH FLOWS FROM CAPITAL FINANCING ACTIVITIES:
Transfers from other funds - 1,151 Acquisition and construction of capital assets - (8,235) Interest and issuance costs paid on capital debt - (14)
NET CASH PROVIDED (USED) BY CAPITAL FINANCING ACTIVITIES - (7,098)
CASH FLOWS FROM INVESTING ACTIVITIES:Interest and dividends received 51 494 Investment long-term 1 29
NET CASH PROVIDED (USED) BY INVESTING ACTIVITIES 52 523
NET INCREASE (DECREASE) IN CASH & CASH EQUIVALENTS 545 343
CASH & CASH EQUIVALENTS, JANUARY 1 5,682 75,058 CASH, RESTRICTED CASH & CASH EQUIVALENTS, DECEMBER 31 $ 6,227 $ 75,401
COMBINING STATEMENT OF CASH FLOWSINTERNAL SERVICE FUNDS
For the Year Ended December 31, 2014(amounts expressed in thousands)
Page 9 of 10
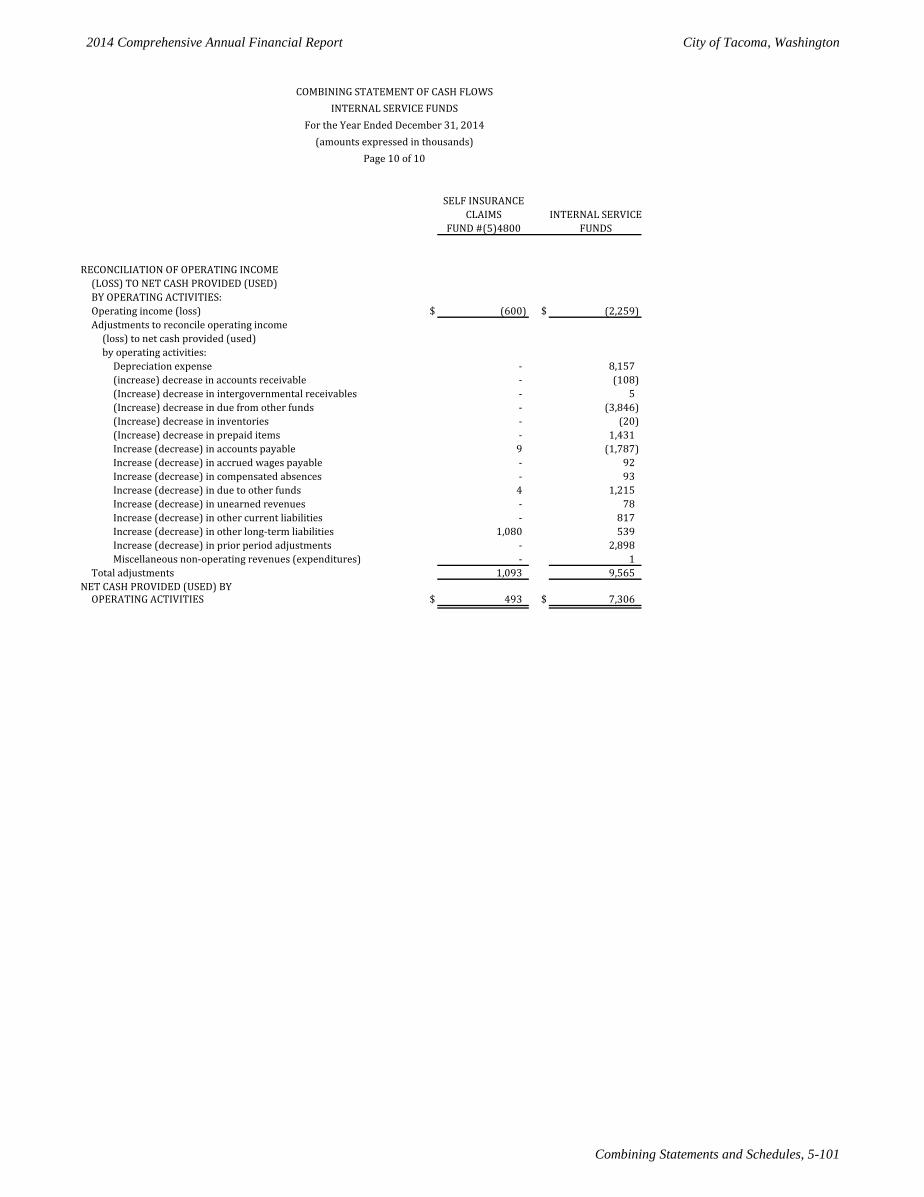
2014 Comprehensive Annual Financial Report City of Tacoma, Washington
Combining Statements and Schedules, 5-101
SELF INSURANCECLAIMS INTERNAL SERVICE
FUND #(5)4800 FUNDS
RECONCILIATION OF OPERATING INCOME(LOSS) TO NET CASH PROVIDED (USED)BY OPERATING ACTIVITIES:Operating income (loss) $ (600) $ (2,259) Adjustments to reconcile operating income
(loss) to net cash provided (used)by operating activities:
Depreciation expense - 8,157 (increase) decrease in accounts receivable - (108) (Increase) decrease in intergovernmental receivables - 5 (Increase) decrease in due from other funds - (3,846) (Increase) decrease in inventories - (20) (Increase) decrease in prepaid items - 1,431 Increase (decrease) in accounts payable 9 (1,787) Increase (decrease) in accrued wages payable - 92 Increase (decrease) in compensated absences - 93 Increase (decrease) in due to other funds 4 1,215 Increase (decrease) in unearned revenues - 78 Increase (decrease) in other current liabilities - 817 Increase (decrease) in other long-term liabilities 1,080 539 Increase (decrease) in prior period adjustments - 2,898 Miscellaneous non-operating revenues (expenditures) - 1
Total adjustments 1,093 9,565 NET CASH PROVIDED (USED) BY
OPERATING ACTIVITIES $ 493 $ 7,306
COMBINING STATEMENT OF CASH FLOWSINTERNAL SERVICE FUNDS
For the Year Ended December 31, 2014(amounts expressed in thousands)
Page 10 of 10
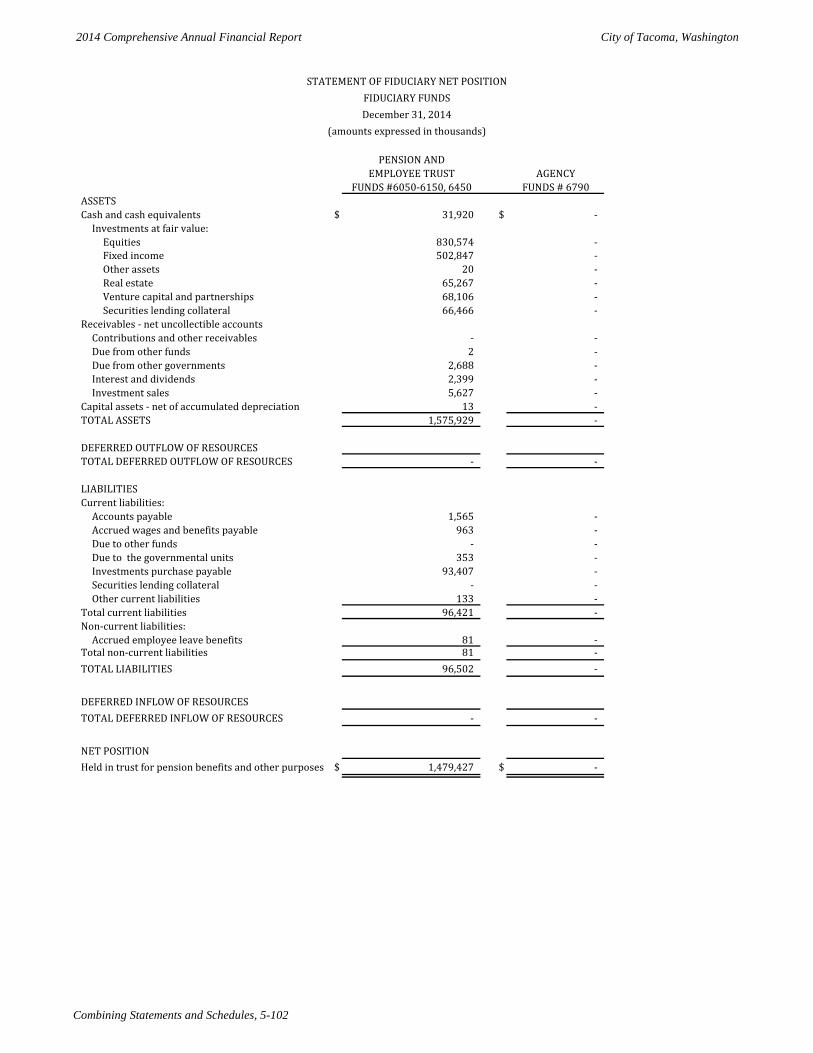
2014 Comprehensive Annual Financial Report City of Tacoma, Washington
Combining Statements and Schedules, 5-102
PENSION ANDEMPLOYEE TRUST AGENCY
FUNDS #6050-6150, 6450 FUNDS # 6790ASSETSCash and cash equivalents $ 31,920 $ -
Investments at fair value:Equities 830,574 - Fixed income 502,847 - Other assets 20 - Real estate 65,267 - Venture capital and partnerships 68,106 - Securities lending collateral 66,466 -
Receivables - net uncollectible accountsContributions and other receivables - - Due from other funds 2 - Due from other governments 2,688 - Interest and dividends 2,399 - Investment sales 5,627 -
Capital assets - net of accumulated depreciation 13 - TOTAL ASSETS 1,575,929 -
DEFERRED OUTFLOW OF RESOURCESTOTAL DEFERRED OUTFLOW OF RESOURCES - -
LIABILITIESCurrent liabilities:
Accounts payable 1,565 - Accrued wages and benefits payable 963 - Due to other funds - - Due to the governmental units 353 - Investments purchase payable 93,407 - Securities lending collateral - - Other current liabilities 133 -
Total current liabilities 96,421 - Non-current liabilities:
Accrued employee leave benefits 81 - Total non-current liabilities 81 - TOTAL LIABILITIES 96,502 -
DEFERRED INFLOW OF RESOURCESTOTAL DEFERRED INFLOW OF RESOURCES - -
NET POSITIONHeld in trust for pension benefits and other purposes $ 1,479,427 $ -
STATEMENT OF FIDUCIARY NET POSITIONFIDUCIARY FUNDSDecember 31, 2014
(amounts expressed in thousands)
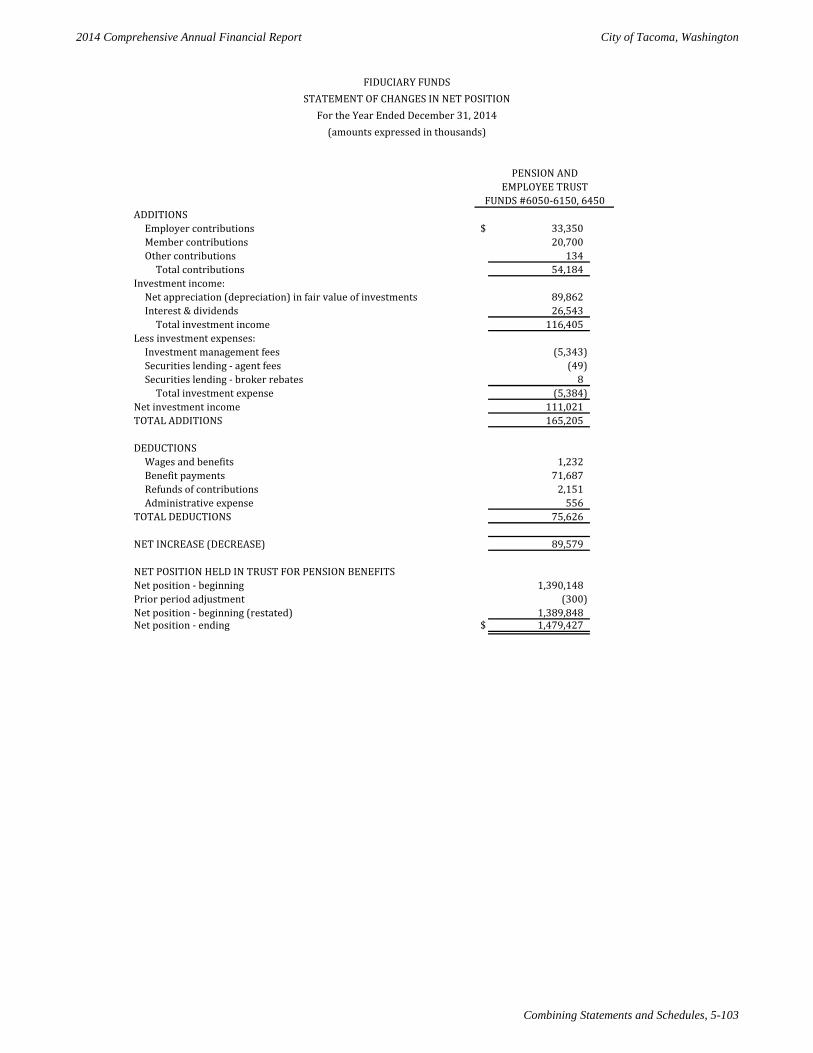
2014 Comprehensive Annual Financial Report City of Tacoma, Washington
Combining Statements and Schedules, 5-103
ADDITIONS
Employer contributions $ 33,350 Member contributions 20,700 Other contributions 134
Total contributions 54,184 Investment income:
Net appreciation (depreciation) in fair value of investments 89,862 Interest & dividends 26,543
Total investment income 116,405 Less investment expenses:
Investment management fees (5,343) Securities lending - agent fees (49) Securities lending - broker rebates 8
Total investment expense (5,384) Net investment income 111,021 TOTAL ADDITIONS 165,205
DEDUCTIONSWages and benefits 1,232 Benefit payments 71,687 Refunds of contributions 2,151 Administrative expense 556
TOTAL DEDUCTIONS 75,626
NET INCREASE (DECREASE) 89,579
NET POSITION HELD IN TRUST FOR PENSION BENEFITSNet position - beginning 1,390,148 Prior period adjustment (300) Net position - beginning (restated) 1,389,848 Net position - ending $ 1,479,427
EMPLOYEE TRUSTFUNDS #6050-6150, 6450
FIDUCIARY FUNDS
For the Year Ended December 31, 2014(amounts expressed in thousands)
STATEMENT OF CHANGES IN NET POSITION
PENSION AND
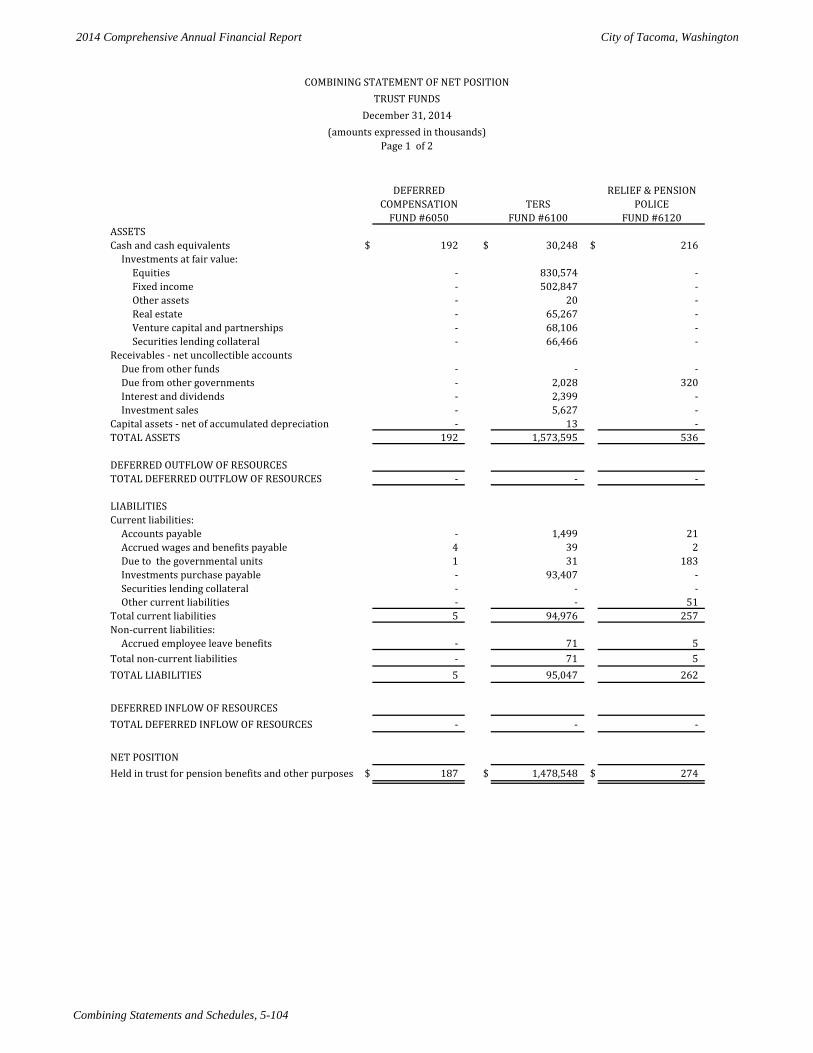
2014 Comprehensive Annual Financial Report City of Tacoma, Washington
Combining Statements and Schedules, 5-104
DEFERRED RELIEF & PENSIONCOMPENSATION TERS POLICE
FUND #6050 FUND #6100 FUND #6120ASSETSCash and cash equivalents $ 192 $ 30,248 $ 216
Investments at fair value:Equities - 830,574 - Fixed income - 502,847 - Other assets - 20 - Real estate - 65,267 - Venture capital and partnerships - 68,106 - Securities lending collateral - 66,466 -
Receivables - net uncollectible accountsDue from other funds - - - Due from other governments - 2,028 320 Interest and dividends - 2,399 - Investment sales - 5,627 -
Capital assets - net of accumulated depreciation - 13 - TOTAL ASSETS 192 1,573,595 536
DEFERRED OUTFLOW OF RESOURCESTOTAL DEFERRED OUTFLOW OF RESOURCES - - -
LIABILITIESCurrent liabilities:
Accounts payable - 1,499 21 Accrued wages and benefits payable 4 39 2 Due to the governmental units 1 31 183 Investments purchase payable - 93,407 - Securities lending collateral - - - Other current liabilities - - 51
Total current liabilities 5 94,976 257 Non-current liabilities:
Accrued employee leave benefits - 71 5 Total non-current liabilities - 71 5 TOTAL LIABILITIES 5 95,047 262
DEFERRED INFLOW OF RESOURCESTOTAL DEFERRED INFLOW OF RESOURCES - - -
NET POSITIONHeld in trust for pension benefits and other purposes $ 187 $ 1,478,548 $ 274
Page 1 of 2
COMBINING STATEMENT OF NET POSITIONTRUST FUNDS
December 31, 2014(amounts expressed in thousands)
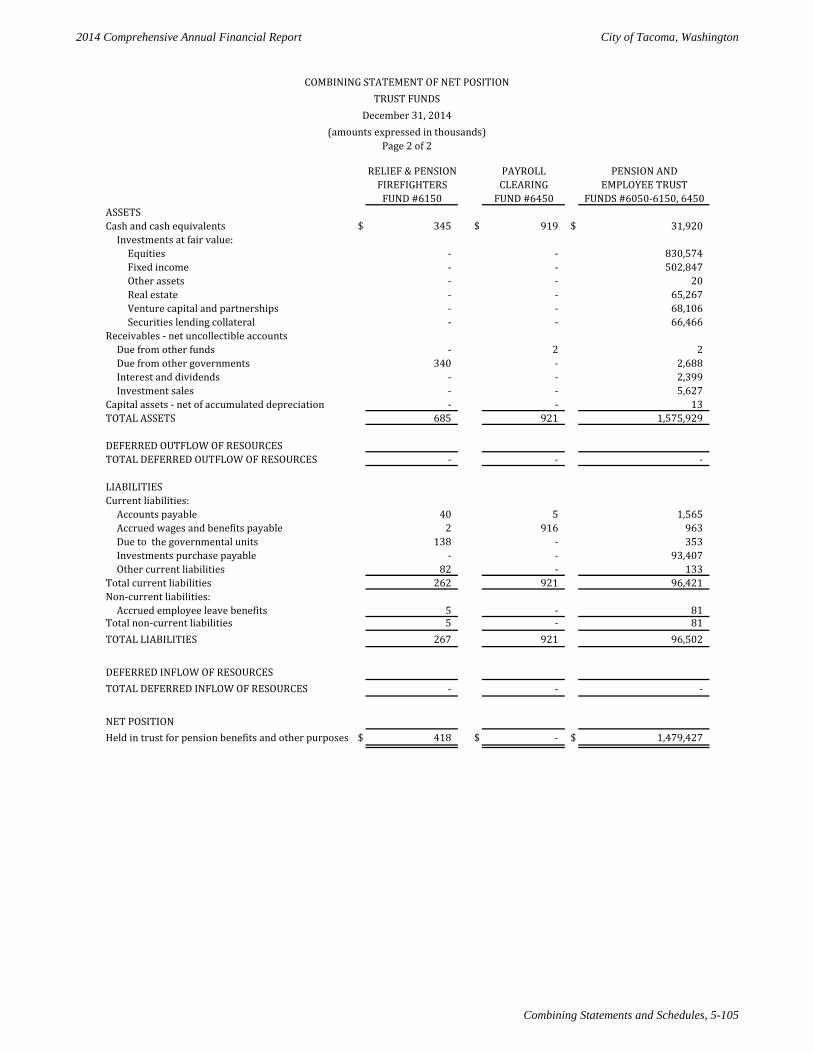
2014 Comprehensive Annual Financial Report City of Tacoma, Washington
Combining Statements and Schedules, 5-105
RELIEF & PENSION PAYROLL PENSION ANDFIREFIGHTERS CLEARING EMPLOYEE TRUST
FUND #6150 FUND #6450 FUNDS #6050-6150, 6450ASSETSCash and cash equivalents $ 345 $ 919 $ 31,920
Investments at fair value:Equities - - 830,574 Fixed income - - 502,847 Other assets - - 20 Real estate - - 65,267 Venture capital and partnerships - - 68,106 Securities lending collateral - - 66,466
Receivables - net uncollectible accountsDue from other funds - 2 2 Due from other governments 340 - 2,688 Interest and dividends - - 2,399 Investment sales - - 5,627
Capital assets - net of accumulated depreciation - - 13 TOTAL ASSETS 685 921 1,575,929
DEFERRED OUTFLOW OF RESOURCESTOTAL DEFERRED OUTFLOW OF RESOURCES - - -
LIABILITIESCurrent liabilities:
Accounts payable 40 5 1,565 Accrued wages and benefits payable 2 916 963 Due to the governmental units 138 - 353 Investments purchase payable - - 93,407 Other current liabilities 82 - 133
Total current liabilities 262 921 96,421 Non-current liabilities:
Accrued employee leave benefits 5 - 81 Total non-current liabilities 5 - 81 TOTAL LIABILITIES 267 921 96,502
DEFERRED INFLOW OF RESOURCESTOTAL DEFERRED INFLOW OF RESOURCES - - -
NET POSITIONHeld in trust for pension benefits and other purposes $ 418 $ - $ 1,479,427
COMBINING STATEMENT OF NET POSITIONTRUST FUNDS
December 31, 2014(amounts expressed in thousands)
Page 2 of 2
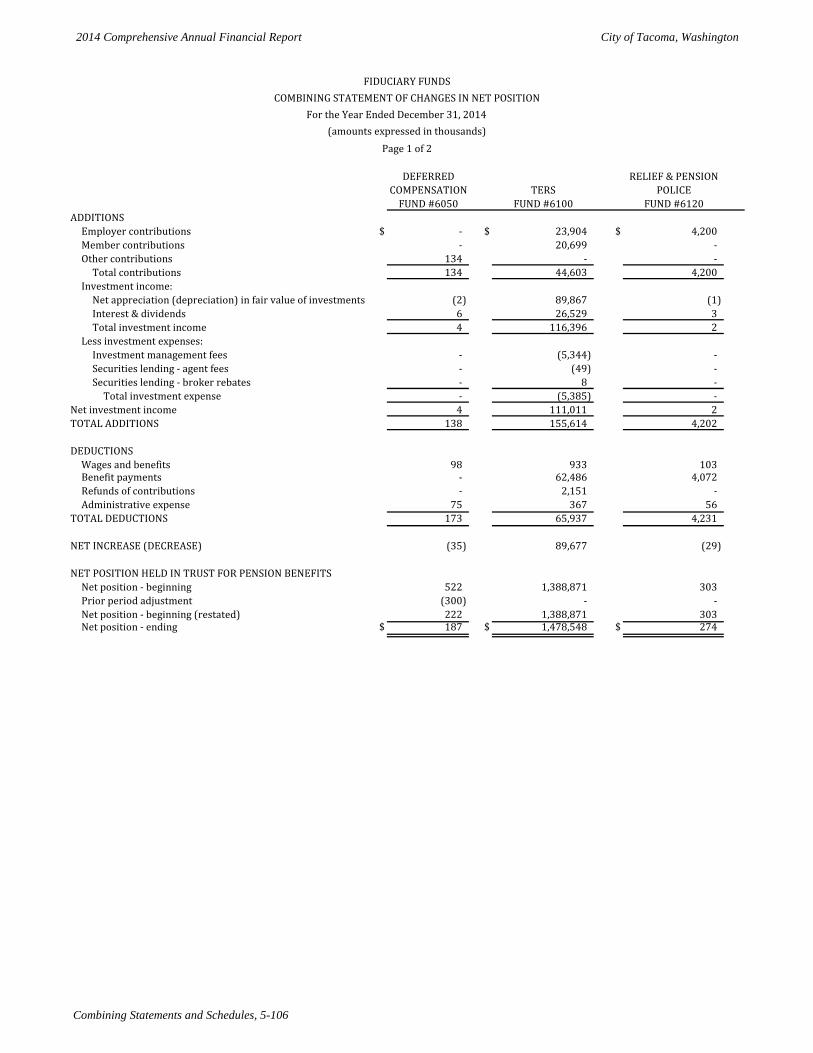
2014 Comprehensive Annual Financial Report City of Tacoma, Washington
Combining Statements and Schedules, 5-106
DEFERRED RELIEF & PENSIONCOMPENSATION TERS POLICE
FUND #6050 FUND #6100 FUND #6120ADDITIONS
Employer contributions $ - $ 23,904 $ 4,200 Member contributions - 20,699 - Other contributions 134 - -
Total contributions 134 44,603 4,200 Investment income:
Net appreciation (depreciation) in fair value of investments (2) 89,867 (1) Interest & dividends 6 26,529 3 Total investment income 4 116,396 2
Less investment expenses:Investment management fees - (5,344) - Securities lending - agent fees - (49) - Securities lending - broker rebates - 8 -
Total investment expense - (5,385) - Net investment income 4 111,011 2 TOTAL ADDITIONS 138 155,614 4,202
DEDUCTIONSWages and benefits 98 933 103 Benefit payments - 62,486 4,072 Refunds of contributions - 2,151 - Administrative expense 75 367 56
TOTAL DEDUCTIONS 173 65,937 4,231
NET INCREASE (DECREASE) (35) 89,677 (29)
NET POSITION HELD IN TRUST FOR PENSION BENEFITSNet position - beginning 522 1,388,871 303 Prior period adjustment (300) - - Net position - beginning (restated) 222 1,388,871 303 Net position - ending $ 187 $ 1,478,548 $ 274
FIDUCIARY FUNDSCOMBINING STATEMENT OF CHANGES IN NET POSITION
(amounts expressed in thousands)Page 1 of 2
For the Year Ended December 31, 2014
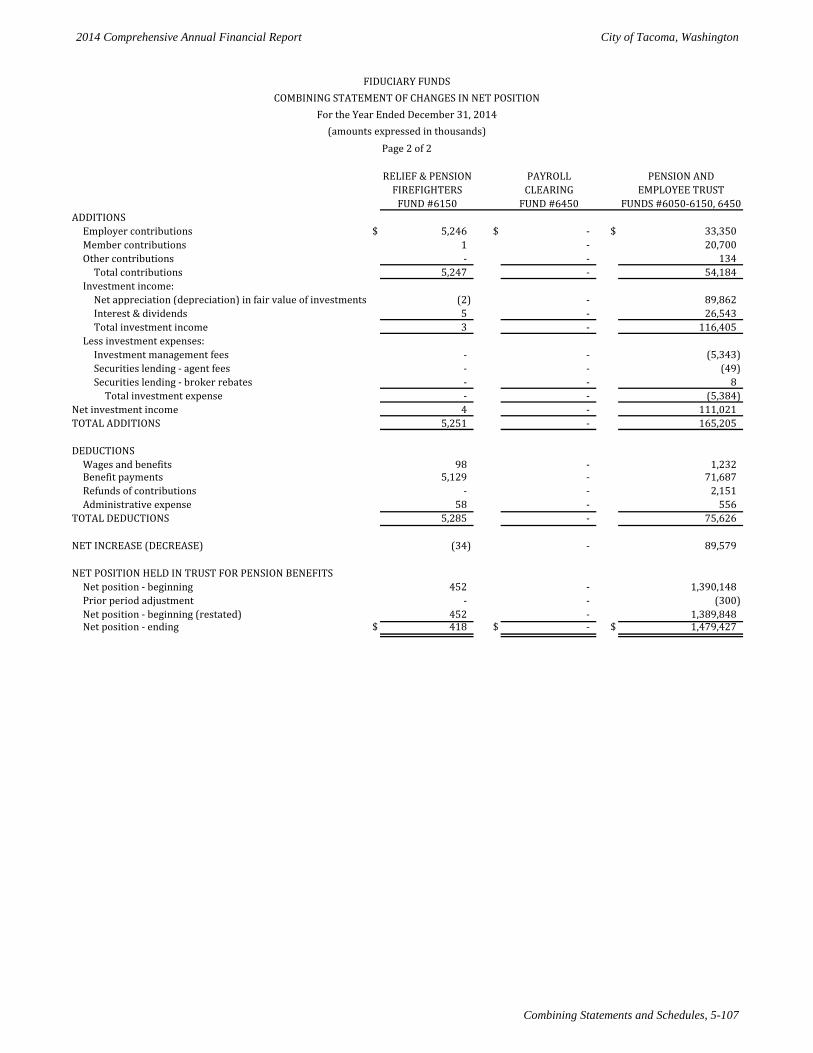
2014 Comprehensive Annual Financial Report City of Tacoma, Washington
Combining Statements and Schedules, 5-107
RELIEF & PENSION PAYROLL PENSION ANDFIREFIGHTERS CLEARING EMPLOYEE TRUST
FUND #6150 FUND #6450 FUNDS #6050-6150, 6450ADDITIONS
Employer contributions $ 5,246 $ - $ 33,350 Member contributions 1 - 20,700 Other contributions - - 134
Total contributions 5,247 - 54,184 Investment income:
Net appreciation (depreciation) in fair value of investments (2) - 89,862 Interest & dividends 5 - 26,543 Total investment income 3 - 116,405
Less investment expenses:Investment management fees - - (5,343) Securities lending - agent fees - - (49) Securities lending - broker rebates - - 8
Total investment expense - - (5,384) Net investment income 4 - 111,021 TOTAL ADDITIONS 5,251 - 165,205
DEDUCTIONSWages and benefits 98 - 1,232 Benefit payments 5,129 - 71,687 Refunds of contributions - - 2,151 Administrative expense 58 - 556
TOTAL DEDUCTIONS 5,285 - 75,626
NET INCREASE (DECREASE) (34) - 89,579
NET POSITION HELD IN TRUST FOR PENSION BENEFITSNet position - beginning 452 - 1,390,148 Prior period adjustment - - (300) Net position - beginning (restated) 452 - 1,389,848 Net position - ending $ 418 $ - $ 1,479,427
FIDUCIARY FUNDSCOMBINING STATEMENT OF CHANGES IN NET POSITION
For the Year Ended December 31, 2014(amounts expressed in thousands)
Page 2 of 2
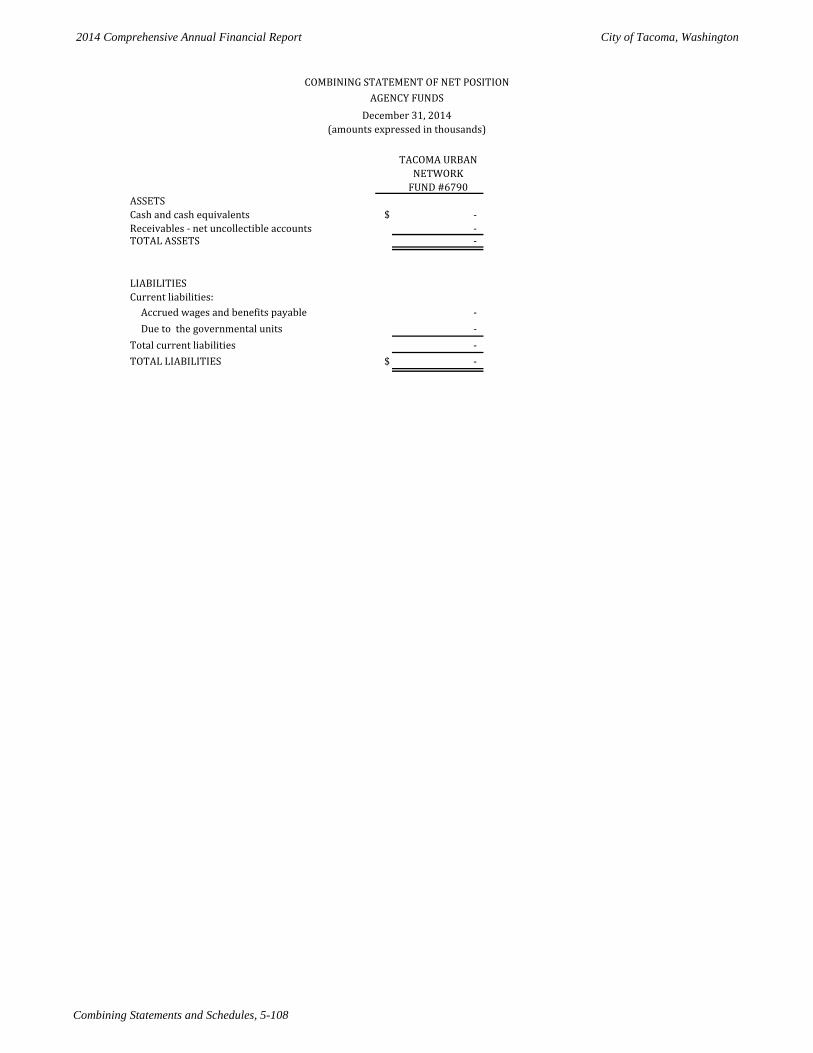
2014 Comprehensive Annual Financial Report City of Tacoma, Washington
Combining Statements and Schedules, 5-108
TACOMA URBANNETWORK
FUND #6790ASSETSCash and cash equivalents $ - Receivables - net uncollectible accounts - TOTAL ASSETS -
LIABILITIESCurrent liabilities:
Accrued wages and benefits payable - Due to the governmental units -
Total current liabilities - TOTAL LIABILITIES $ -
AGENCY FUNDSCOMBINING STATEMENT OF NET POSITION
December 31, 2014(amounts expressed in thousands)
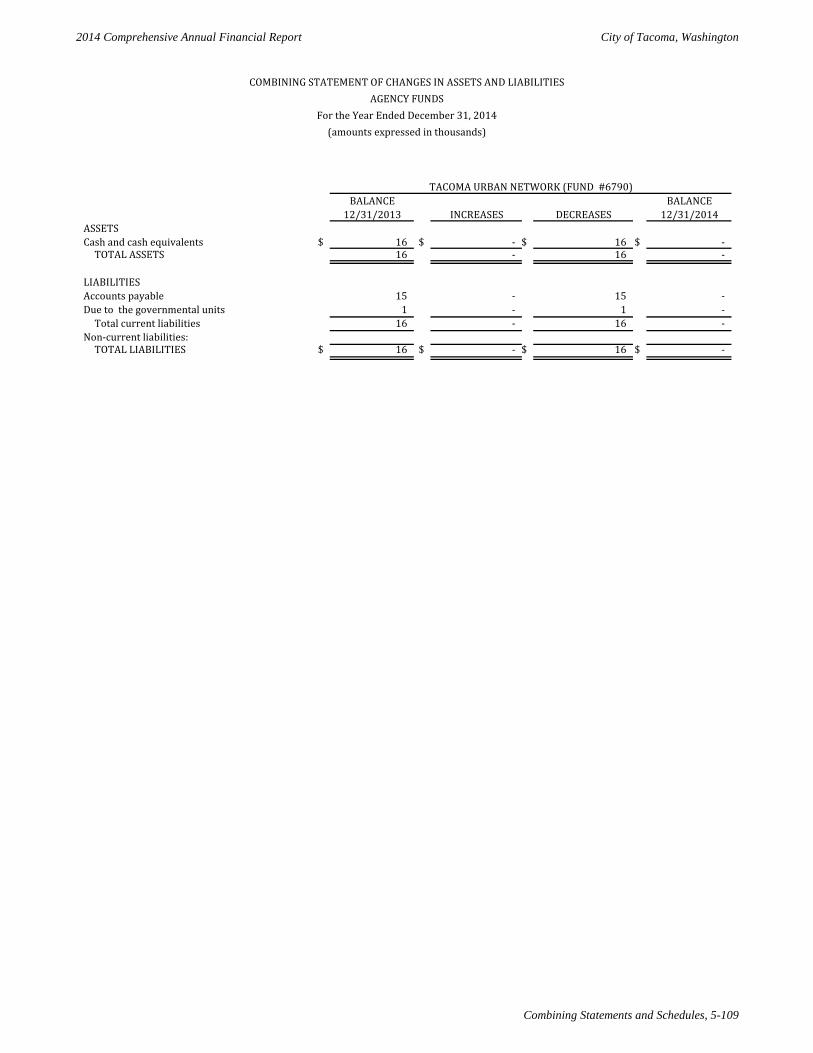
2014 Comprehensive Annual Financial Report City of Tacoma, Washington
Combining Statements and Schedules, 5-109
BALANCE BALANCE 12/31/2013 INCREASES DECREASES 12/31/2014
ASSETSCash and cash equivalents $ 16 $ - $ 16 $ -
TOTAL ASSETS 16 - 16 -
LIABILITIESAccounts payable 15 - 15 - Due to the governmental units 1 - 1 -
Total current liabilities 16 - 16 - Non-current liabilities:
TOTAL LIABILITIES $ 16 $ - $ 16 $ -
COMBINING STATEMENT OF CHANGES IN ASSETS AND LIABILITIESAGENCY FUNDS
For the Year Ended December 31, 2014(amounts expressed in thousands)
TACOMA URBAN NETWORK (FUND #6790)

THIS PAGE LEFT INTENTIONALLY BLANK

THIS PAGE LEFT INTENTIONALLY BLANK
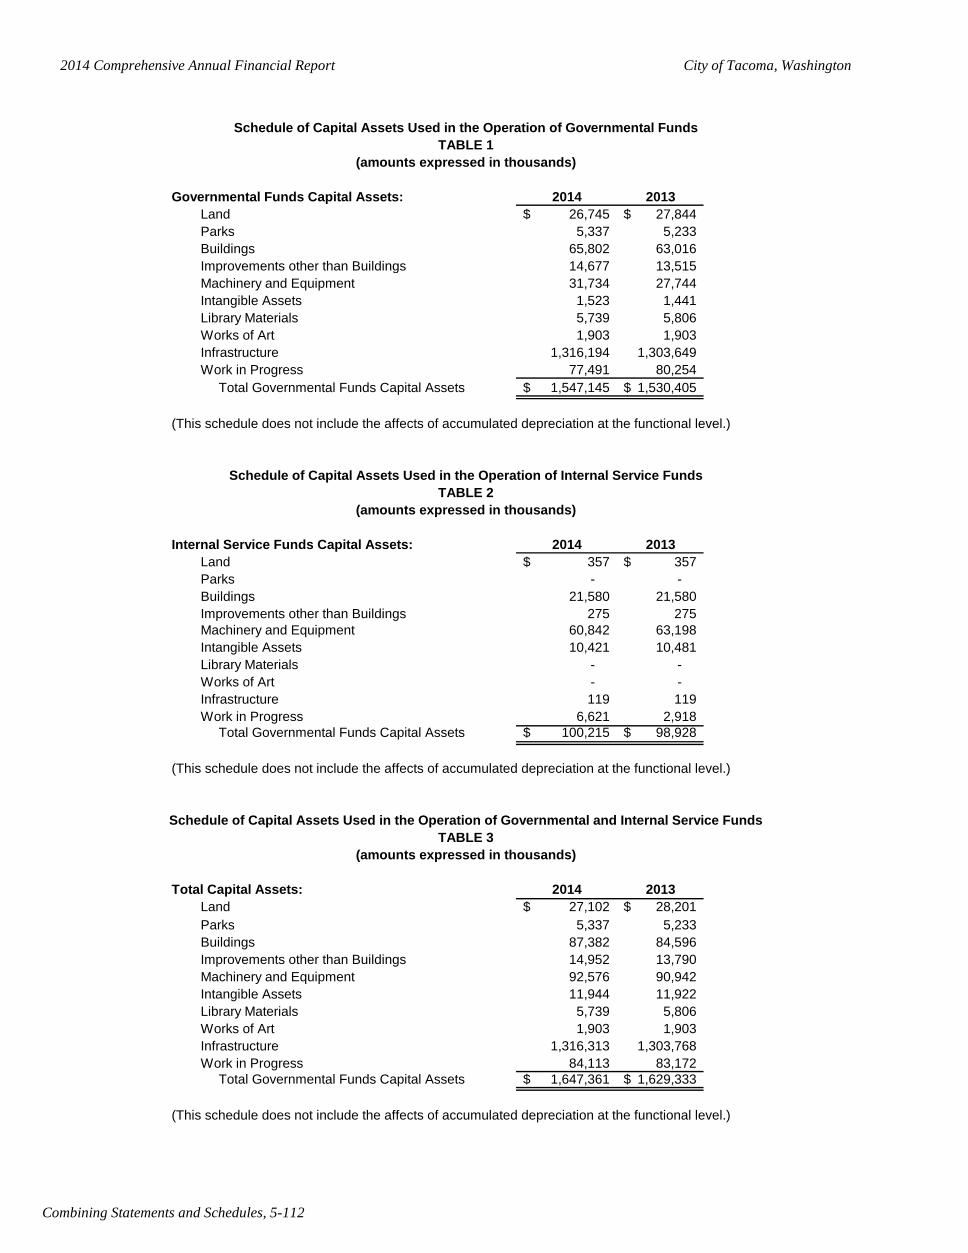
2014 Comprehensive Annual Financial Report City of Tacoma, Washington
Combining Statements and Schedules, 5-112
Governmental Funds Capital Assets: 2014 2013Land 26,745$ 27,844$ Parks 5,337 5,233 Buildings 65,802 63,016 Improvements other than Buildings 14,677 13,515 Machinery and Equipment 31,734 27,744 Intangible Assets 1,523 1,441 Library Materials 5,739 5,806 Works of Art 1,903 1,903 Infrastructure 1,316,194 1,303,649 Work in Progress 77,491 80,254 Total Governmental Funds Capital Assets 1,547,145$ 1,530,405$
(This schedule does not include the affects of accumulated depreciation at the functional level.)
Internal Service Funds Capital Assets: 2014 2013Land 357$ 357$ Parks - - Buildings 21,580 21,580 Improvements other than Buildings 275 275 Machinery and Equipment 60,842 63,198 Intangible Assets 10,421 10,481 Library Materials - - Works of Art - - Infrastructure 119 119 Work in Progress 6,621 2,918 Total Governmental Funds Capital Assets 100,215$ 98,928$
(This schedule does not include the affects of accumulated depreciation at the functional level.)
Total Capital Assets: 2014 2013Land 27,102$ 28,201$ Parks 5,337 5,233Buildings 87,382 84,596Improvements other than Buildings 14,952 13,790Machinery and Equipment 92,576 90,942Intangible Assets 11,944 11,922Library Materials 5,739 5,806Works of Art 1,903 1,903Infrastructure 1,316,313 1,303,768Work in Progress 84,113 83,172 Total Governmental Funds Capital Assets 1,647,361$ 1,629,333$
(This schedule does not include the affects of accumulated depreciation at the functional level.)
(amounts expressed in thousands)
Schedule of Capital Assets Used in the Operation of Governmental and Internal Service FundsTABLE 3
(amounts expressed in thousands)
Schedule of Capital Assets Used in the Operation of Governmental FundsTABLE 1
(amounts expressed in thousands)
Schedule of Capital Assets Used in the Operation of Internal Service FundsTABLE 2
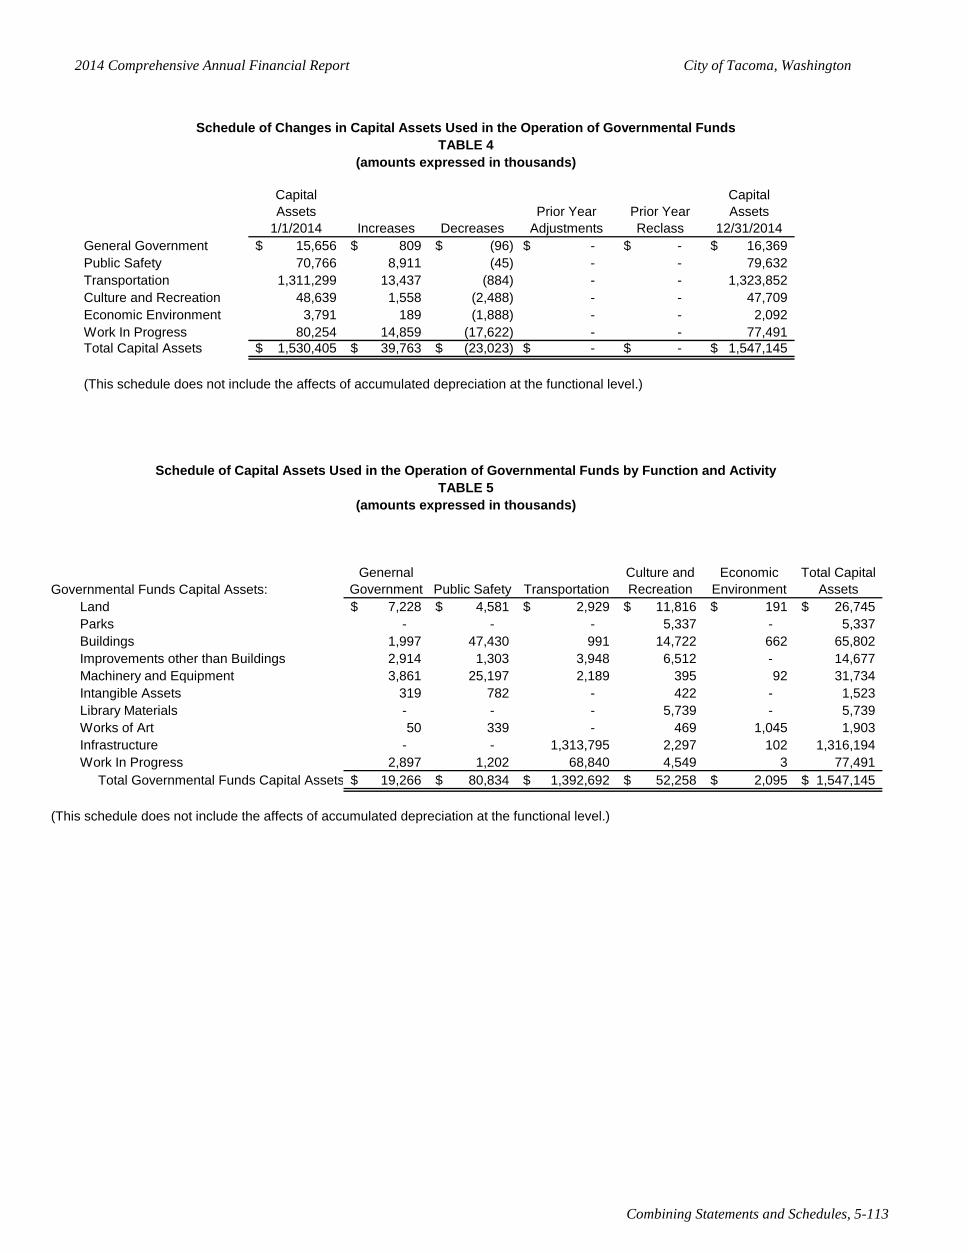
2014 Comprehensive Annual Financial Report City of Tacoma, Washington
Combining Statements and Schedules, 5-113
CapitalAssets
1/1/2014 Increases DecreasesPrior Year
AdjustmentsPrior YearReclass
CapitalAssets
12/31/2014General Government 15,656$ 809$ (96)$ -$ -$ 16,369$ Public Safety 70,766 8,911 (45) - - 79,632Transportation 1,311,299 13,437 (884) - - 1,323,852Culture and Recreation 48,639 1,558 (2,488) - - 47,709Economic Environment 3,791 189 (1,888) - - 2,092Work In Progress 80,254 14,859 (17,622) - - 77,491Total Capital Assets 1,530,405$ 39,763$ (23,023)$ -$ -$ 1,547,145$
(This schedule does not include the affects of accumulated depreciation at the functional level.)
Governmental Funds Capital Assets:Genernal
Government Public Safety TransportationCulture and Recreation
Economic Environment
Total Capital Assets
Land 7,228$ 4,581$ 2,929$ 11,816$ 191$ 26,745$ Parks - - - 5,337 - 5,337Buildings 1,997 47,430 991 14,722 662 65,802Improvements other than Buildings 2,914 1,303 3,948 6,512 - 14,677Machinery and Equipment 3,861 25,197 2,189 395 92 31,734Intangible Assets 319 782 - 422 - 1,523Library Materials - - - 5,739 - 5,739Works of Art 50 339 - 469 1,045 1,903Infrastructure - - 1,313,795 2,297 102 1,316,194Work In Progress 2,897 1,202 68,840 4,549 3 77,491 Total Governmental Funds Capital Assets 19,266$ 80,834$ 1,392,692$ 52,258$ 2,095$ 1,547,145$
(This schedule does not include the affects of accumulated depreciation at the functional level.)
TABLE 5(amounts expressed in thousands)
Schedule of Changes in Capital Assets Used in the Operation of Governmental FundsTABLE 4
(amounts expressed in thousands)
Schedule of Capital Assets Used in the Operation of Governmental Funds by Function and Activity
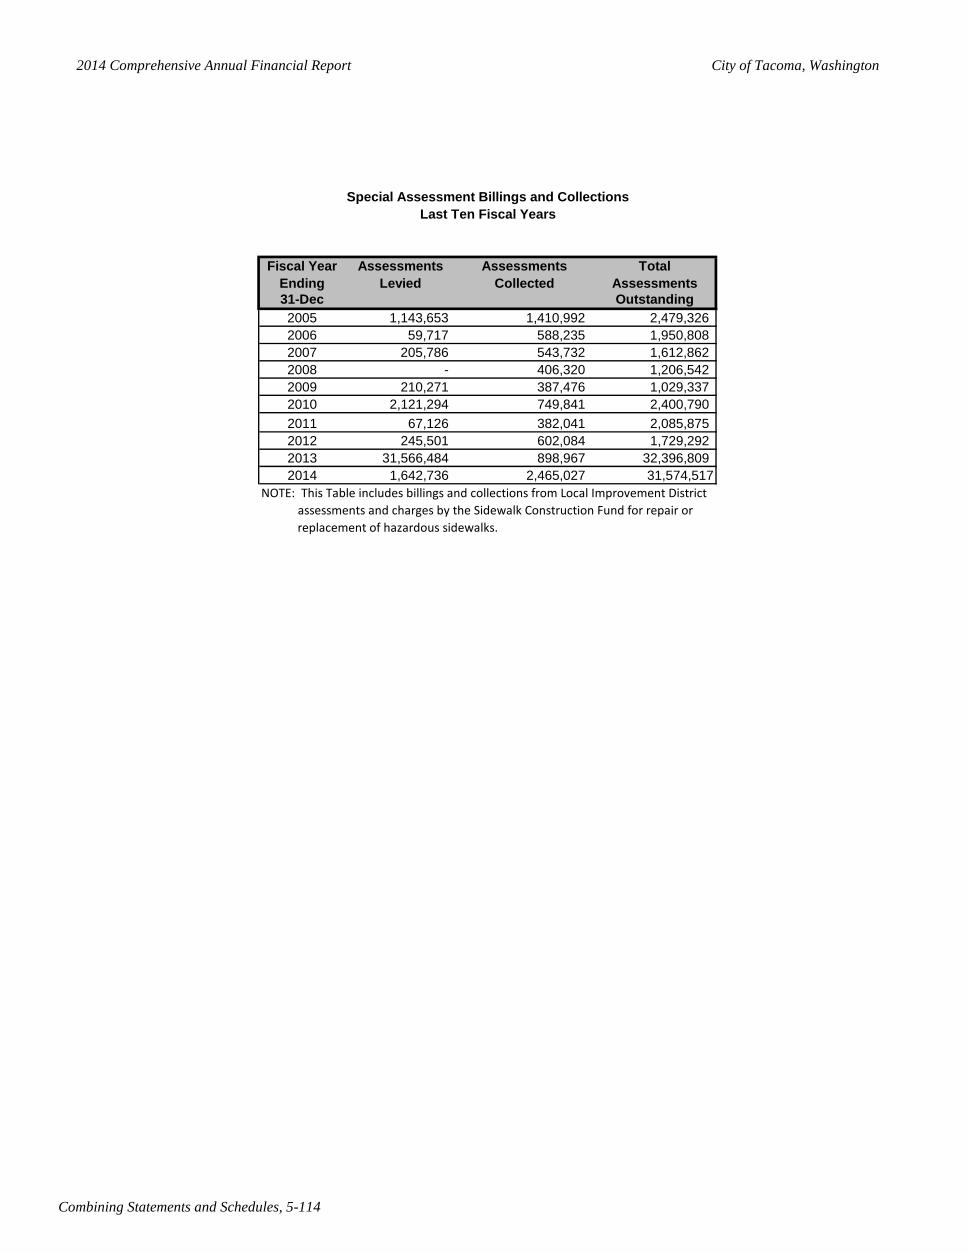
2014 Comprehensive Annual Financial Report City of Tacoma, Washington
Combining Statements and Schedules, 5-114
Special Assessment Billings and CollectionsLast Ten Fiscal Years
Fiscal Year Assessments Assessments TotalEnding Levied Collected Assessments31-Dec Outstanding2005 1,143,653 1,410,992 2,479,326 2006 59,717 588,235 1,950,808 2007 205,786 543,732 1,612,862 2008 - 406,320 1,206,542 2009 210,271 387,476 1,029,337 2010 2,121,294 749,841 2,400,790 2011 67,126 382,041 2,085,875 2012 245,501 602,084 1,729,292 2013 31,566,484 898,967 32,396,809 2014 1,642,736 2,465,027 31,574,517
NOTE: This Table includes billings and collections from Local Improvement District assessments and charges by the Sidewalk Construction Fund for repair or replacement of hazardous sidewalks.
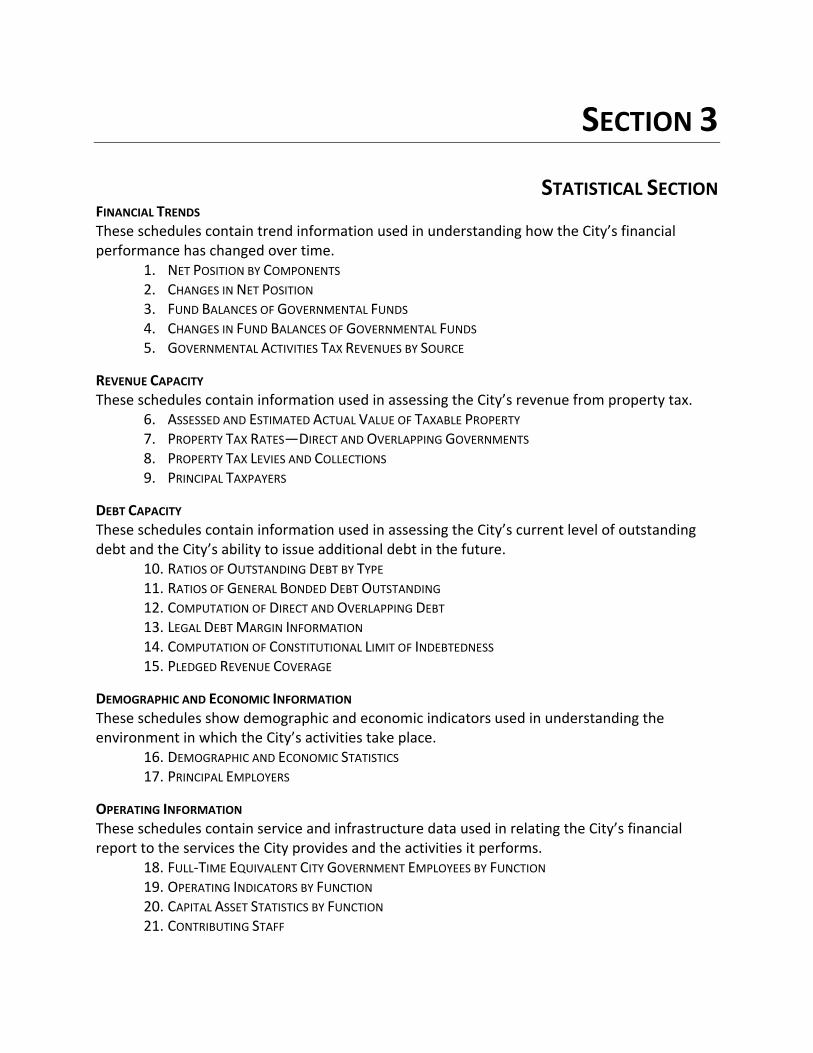
SECTION 3
STATISTICAL SECTION FINANCIAL TRENDS These schedules contain trend information used in understanding how the City’s financial performance has changed over time.
1. NET POSITION BY COMPONENTS 2. CHANGES IN NET POSITION 3. FUND BALANCES OF GOVERNMENTAL FUNDS 4. CHANGES IN FUND BALANCES OF GOVERNMENTAL FUNDS 5. GOVERNMENTAL ACTIVITIES TAX REVENUES BY SOURCE
REVENUE CAPACITY These schedules contain information used in assessing the City’s revenue from property tax.
6. ASSESSED AND ESTIMATED ACTUAL VALUE OF TAXABLE PROPERTY 7. PROPERTY TAX RATES—DIRECT AND OVERLAPPING GOVERNMENTS 8. PROPERTY TAX LEVIES AND COLLECTIONS 9. PRINCIPAL TAXPAYERS
DEBT CAPACITY These schedules contain information used in assessing the City’s current level of outstanding debt and the City’s ability to issue additional debt in the future.
10. RATIOS OF OUTSTANDING DEBT BY TYPE 11. RATIOS OF GENERAL BONDED DEBT OUTSTANDING 12. COMPUTATION OF DIRECT AND OVERLAPPING DEBT 13. LEGAL DEBT MARGIN INFORMATION 14. COMPUTATION OF CONSTITUTIONAL LIMIT OF INDEBTEDNESS 15. PLEDGED REVENUE COVERAGE
DEMOGRAPHIC AND ECONOMIC INFORMATION These schedules show demographic and economic indicators used in understanding the environment in which the City’s activities take place.
16. DEMOGRAPHIC AND ECONOMIC STATISTICS 17. PRINCIPAL EMPLOYERS
OPERATING INFORMATION These schedules contain service and infrastructure data used in relating the City’s financial report to the services the City provides and the activities it performs.
18. FULL-TIME EQUIVALENT CITY GOVERNMENT EMPLOYEES BY FUNCTION 19. OPERATING INDICATORS BY FUNCTION 20. CAPITAL ASSET STATISTICS BY FUNCTION 21. CONTRIBUTING STAFF
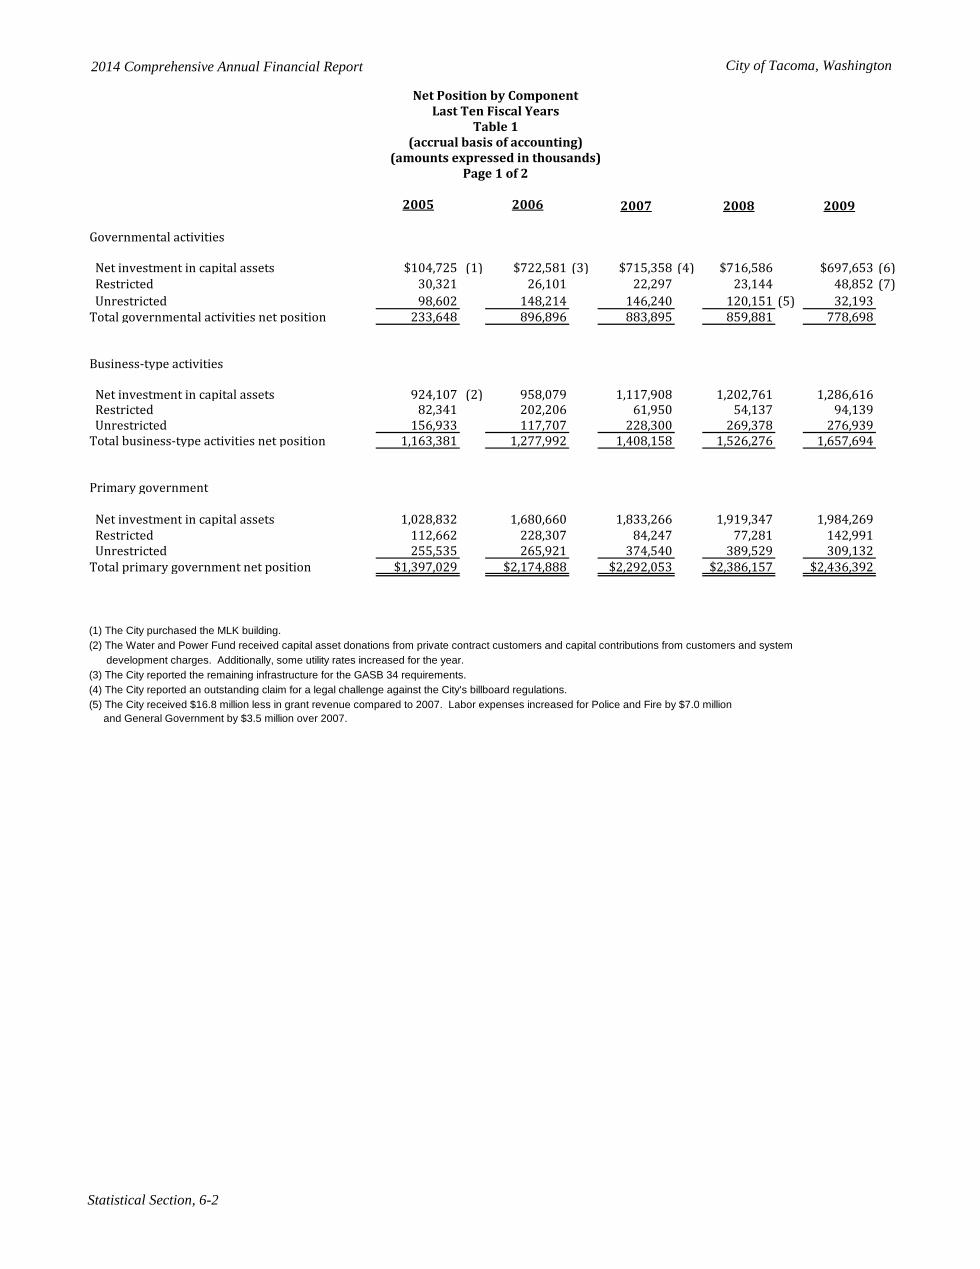
2014 Comprehensive Annual Financial Report City of Tacoma, Washington
Statistical Section, 6-2
2005 2006 2007 2008 2009
Governmental activities
Net investment in capital assets $104,725 (1) $722,581 (3) $715,358 (4) $716,586 $697,653 (6) Restricted 30,321 26,101 22,297 23,144 48,852 (7) Unrestricted 98,602 148,214 146,240 120,151 (5) 32,193 Total governmental activities net position 233,648 896,896 883,895 859,881 778,698
Business-type activities
Net investment in capital assets 924,107 (2) 958,079 1,117,908 1,202,761 1,286,616 Restricted 82,341 202,206 61,950 54,137 94,139 Unrestricted 156,933 117,707 228,300 269,378 276,939 Total business-type activities net position 1,163,381 1,277,992 1,408,158 1,526,276 1,657,694
Primary government
Net investment in capital assets 1,028,832 1,680,660 1,833,266 1,919,347 1,984,269 Restricted 112,662 228,307 84,247 77,281 142,991 Unrestricted 255,535 265,921 374,540 389,529 309,132 Total primary government net position $1,397,029 $2,174,888 $2,292,053 $2,386,157 $2,436,392
(1) The City purchased the MLK building.(2) The Water and Power Fund received capital asset donations from private contract customers and capital contributions from customers and system development charges. Additionally, some utility rates increased for the year.(3) The City reported the remaining infrastructure for the GASB 34 requirements.(4) The City reported an outstanding claim for a legal challenge against the City's billboard regulations.(5) The City received $16.8 million less in grant revenue compared to 2007. Labor expenses increased for Police and Fire by $7.0 million and General Government by $3.5 million over 2007.
(amounts expressed in thousands)Page 1 of 2
(accrual basis of accounting)
Net Position by ComponentLast Ten Fiscal Years
Table 1
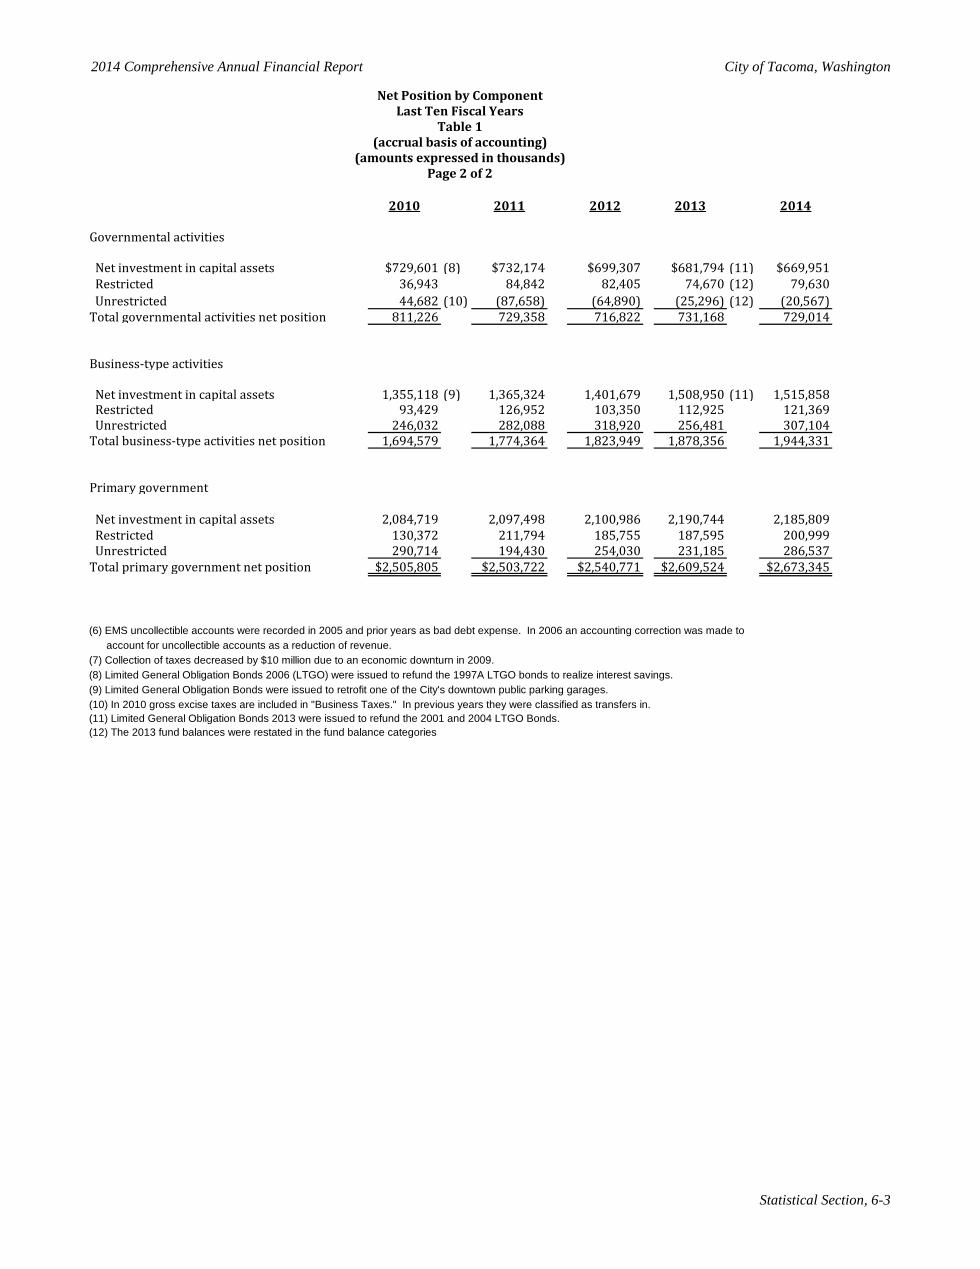
2014 Comprehensive Annual Financial Report City of Tacoma, Washington
Statistical Section, 6-3
2010 2011 2012 2013 2014
Governmental activities
Net investment in capital assets $729,601 (8) $732,174 $699,307 $681,794 (11) $669,951 Restricted 36,943 84,842 82,405 74,670 (12) 79,630 Unrestricted 44,682 (10) (87,658) (64,890) (25,296) (12) (20,567)Total governmental activities net position 811,226 729,358 716,822 731,168 729,014
Business-type activities
Net investment in capital assets 1,355,118 (9) 1,365,324 1,401,679 1,508,950 (11) 1,515,858 Restricted 93,429 126,952 103,350 112,925 121,369 Unrestricted 246,032 282,088 318,920 256,481 307,104 Total business-type activities net position 1,694,579 1,774,364 1,823,949 1,878,356 1,944,331
Primary government
Net investment in capital assets 2,084,719 2,097,498 2,100,986 2,190,744 2,185,809 Restricted 130,372 211,794 185,755 187,595 200,999 Unrestricted 290,714 194,430 254,030 231,185 286,537 Total primary government net position $2,505,805 $2,503,722 $2,540,771 $2,609,524 $2,673,345
(6) EMS uncollectible accounts were recorded in 2005 and prior years as bad debt expense. In 2006 an accounting correction was made to account for uncollectible accounts as a reduction of revenue.(7) Collection of taxes decreased by $10 million due to an economic downturn in 2009.(8) Limited General Obligation Bonds 2006 (LTGO) were issued to refund the 1997A LTGO bonds to realize interest savings.(9) Limited General Obligation Bonds were issued to retrofit one of the City's downtown public parking garages.(10) In 2010 gross excise taxes are included in "Business Taxes." In previous years they were classified as transfers in.(11) Limited General Obligation Bonds 2013 were issued to refund the 2001 and 2004 LTGO Bonds.(12) The 2013 fund balances were restated in the fund balance categories
(accrual basis of accounting)(amounts expressed in thousands)
Page 2 of 2
Net Position by ComponentLast Ten Fiscal Years
Table 1
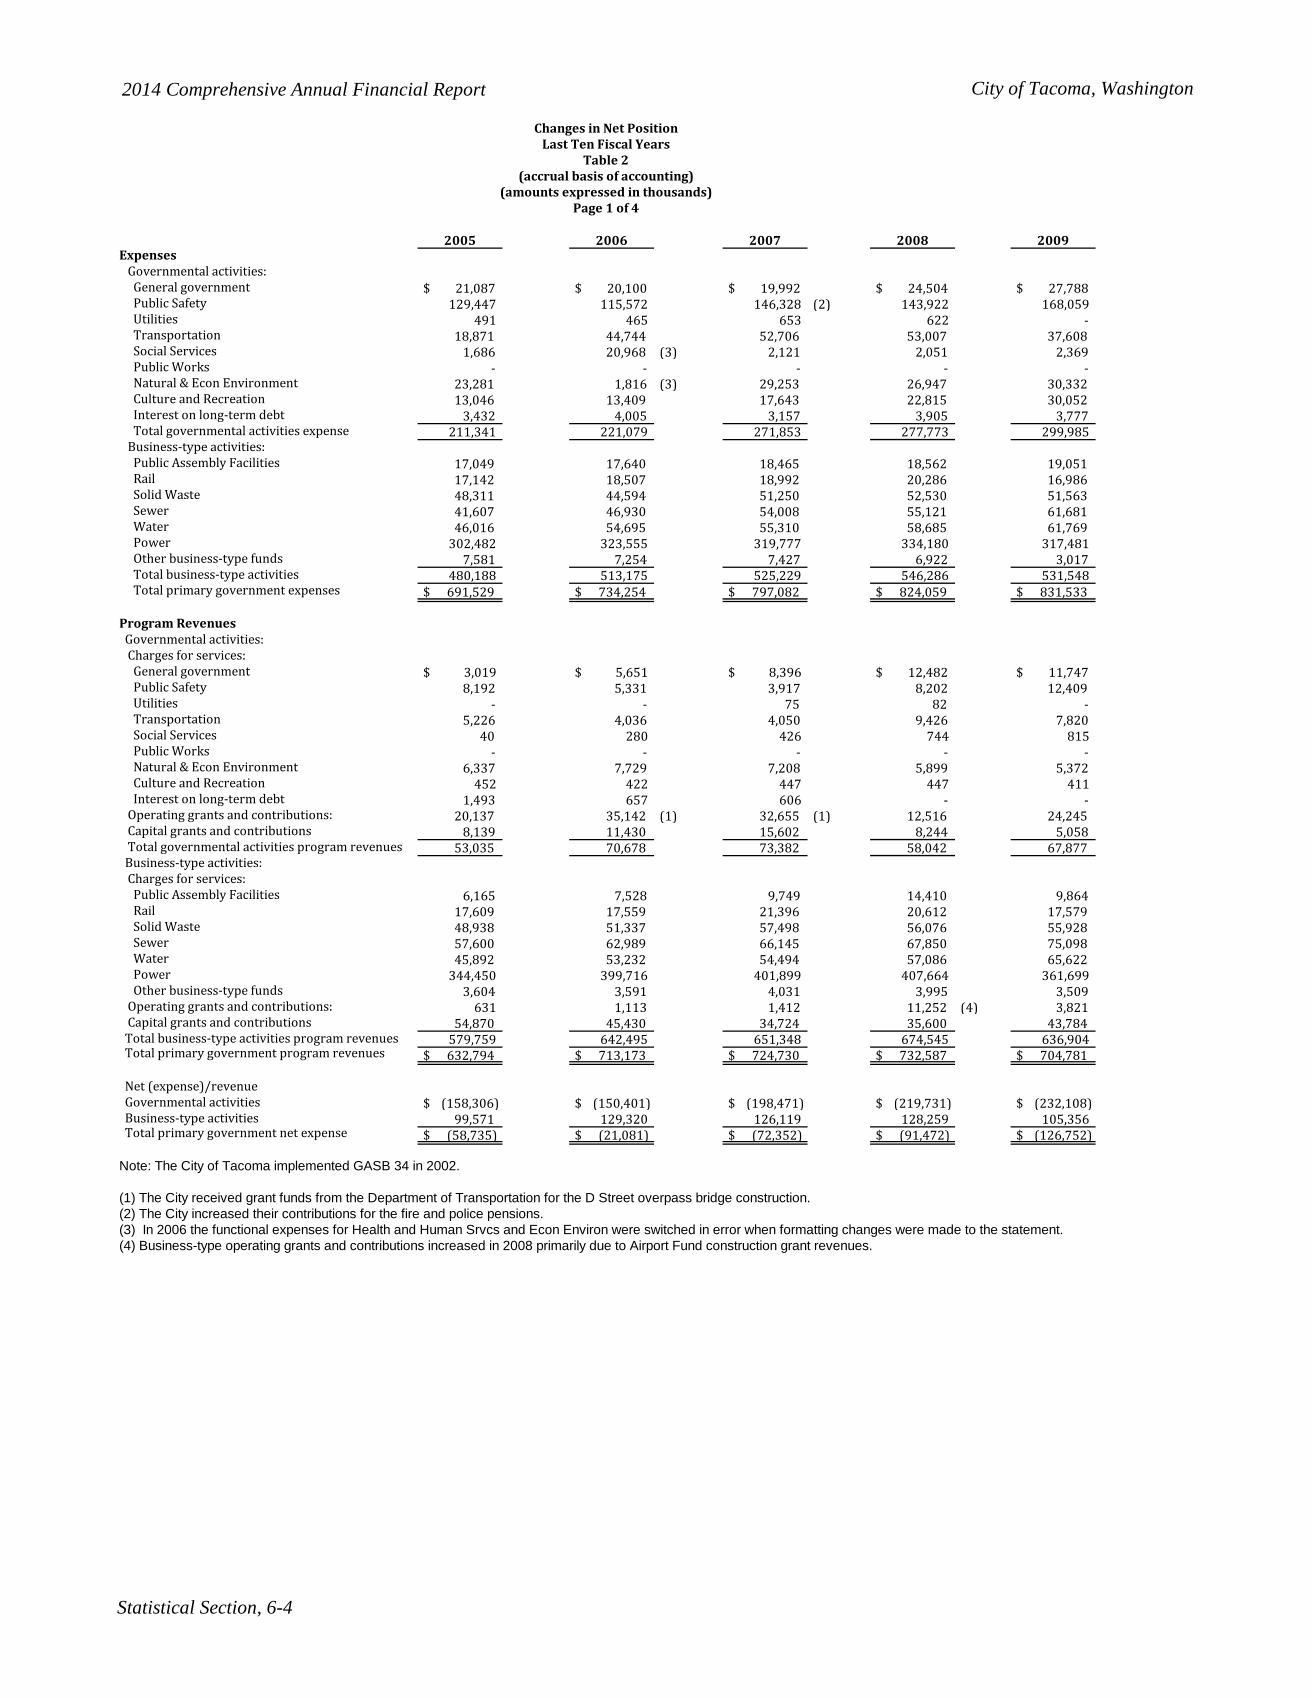
2014 Comprehensive Annual Financial Report City of Tacoma, Washington
Statistical Section, 6-4
2005 2006 2007 2008 2009Expenses Governmental activities: General government $ 21,087 $ 20,100 $ 19,992 $ 24,504 $ 27,788 Public Safety 129,447 115,572 146,328 (2) 143,922 168,059 Utilities 491 465 653 622 - Transportation 18,871 44,744 52,706 53,007 37,608 Social Services 1,686 20,968 (3) 2,121 2,051 2,369 Public Works - - - - - Natural & Econ Environment 23,281 1,816 (3) 29,253 26,947 30,332 Culture and Recreation 13,046 13,409 17,643 22,815 30,052 Interest on long-term debt 3,432 4,005 3,157 3,905 3,777 Total governmental activities expense 211,341 221,079 271,853 277,773 299,985 Business-type activities: Public Assembly Facilities 17,049 17,640 18,465 18,562 19,051 Rail 17,142 18,507 18,992 20,286 16,986 Solid Waste 48,311 44,594 51,250 52,530 51,563 Sewer 41,607 46,930 54,008 55,121 61,681 Water 46,016 54,695 55,310 58,685 61,769 Power 302,482 323,555 319,777 334,180 317,481 Other business-type funds 7,581 7,254 7,427 6,922 3,017 Total business-type activities 480,188 513,175 525,229 546,286 531,548 Total primary government expenses $ 691,529 $ 734,254 $ 797,082 $ 824,059 $ 831,533
Program Revenues Governmental activities: Charges for services: General government $ 3,019 $ 5,651 $ 8,396 $ 12,482 $ 11,747 Public Safety 8,192 5,331 3,917 8,202 12,409 Utilities - - 75 82 - Transportation 5,226 4,036 4,050 9,426 7,820 Social Services 40 280 426 744 815 Public Works - - - - - Natural & Econ Environment 6,337 7,729 7,208 5,899 5,372 Culture and Recreation 452 422 447 447 411 Interest on long-term debt 1,493 657 606 - - Operating grants and contributions: 20,137 35,142 (1) 32,655 (1) 12,516 24,245 Capital grants and contributions 8,139 11,430 15,602 8,244 5,058 Total governmental activities program revenues 53,035 70,678 73,382 58,042 67,877 Business-type activities: Charges for services: Public Assembly Facilities 6,165 7,528 9,749 14,410 9,864 Rail 17,609 17,559 21,396 20,612 17,579 Solid Waste 48,938 51,337 57,498 56,076 55,928 Sewer 57,600 62,989 66,145 67,850 75,098 Water 45,892 53,232 54,494 57,086 65,622 Power 344,450 399,716 401,899 407,664 361,699 Other business-type funds 3,604 3,591 4,031 3,995 3,509 Operating grants and contributions: 631 1,113 1,412 11,252 (4) 3,821 Capital grants and contributions 54,870 45,430 34,724 35,600 43,784 Total business-type activities program revenues 579,759 642,495 651,348 674,545 636,904 Total primary government program revenues $ 632,794 $ 713,173 $ 724,730 $ 732,587 $ 704,781
Net (expense)/revenue Governmental activities $ (158,306) $ (150,401) $ (198,471) $ (219,731) $ (232,108) Business-type activities 99,571 129,320 126,119 128,259 105,356 Total primary government net expense $ (58,735) $ (21,081) $ (72,352) $ (91,472) $ (126,752)
Note: The City of Tacoma implemented GASB 34 in 2002.
(1) The City received grant funds from the Department of Transportation for the D Street overpass bridge construction.(2) The City increased their contributions for the fire and police pensions.(3) In 2006 the functional expenses for Health and Human Srvcs and Econ Environ were switched in error when formatting changes were made to the statement.(4) Business-type operating grants and contributions increased in 2008 primarily due to Airport Fund construction grant revenues.
Changes in Net PositionLast Ten Fiscal Years
Table 2(accrual basis of accounting)
(amounts expressed in thousands)Page 1 of 4
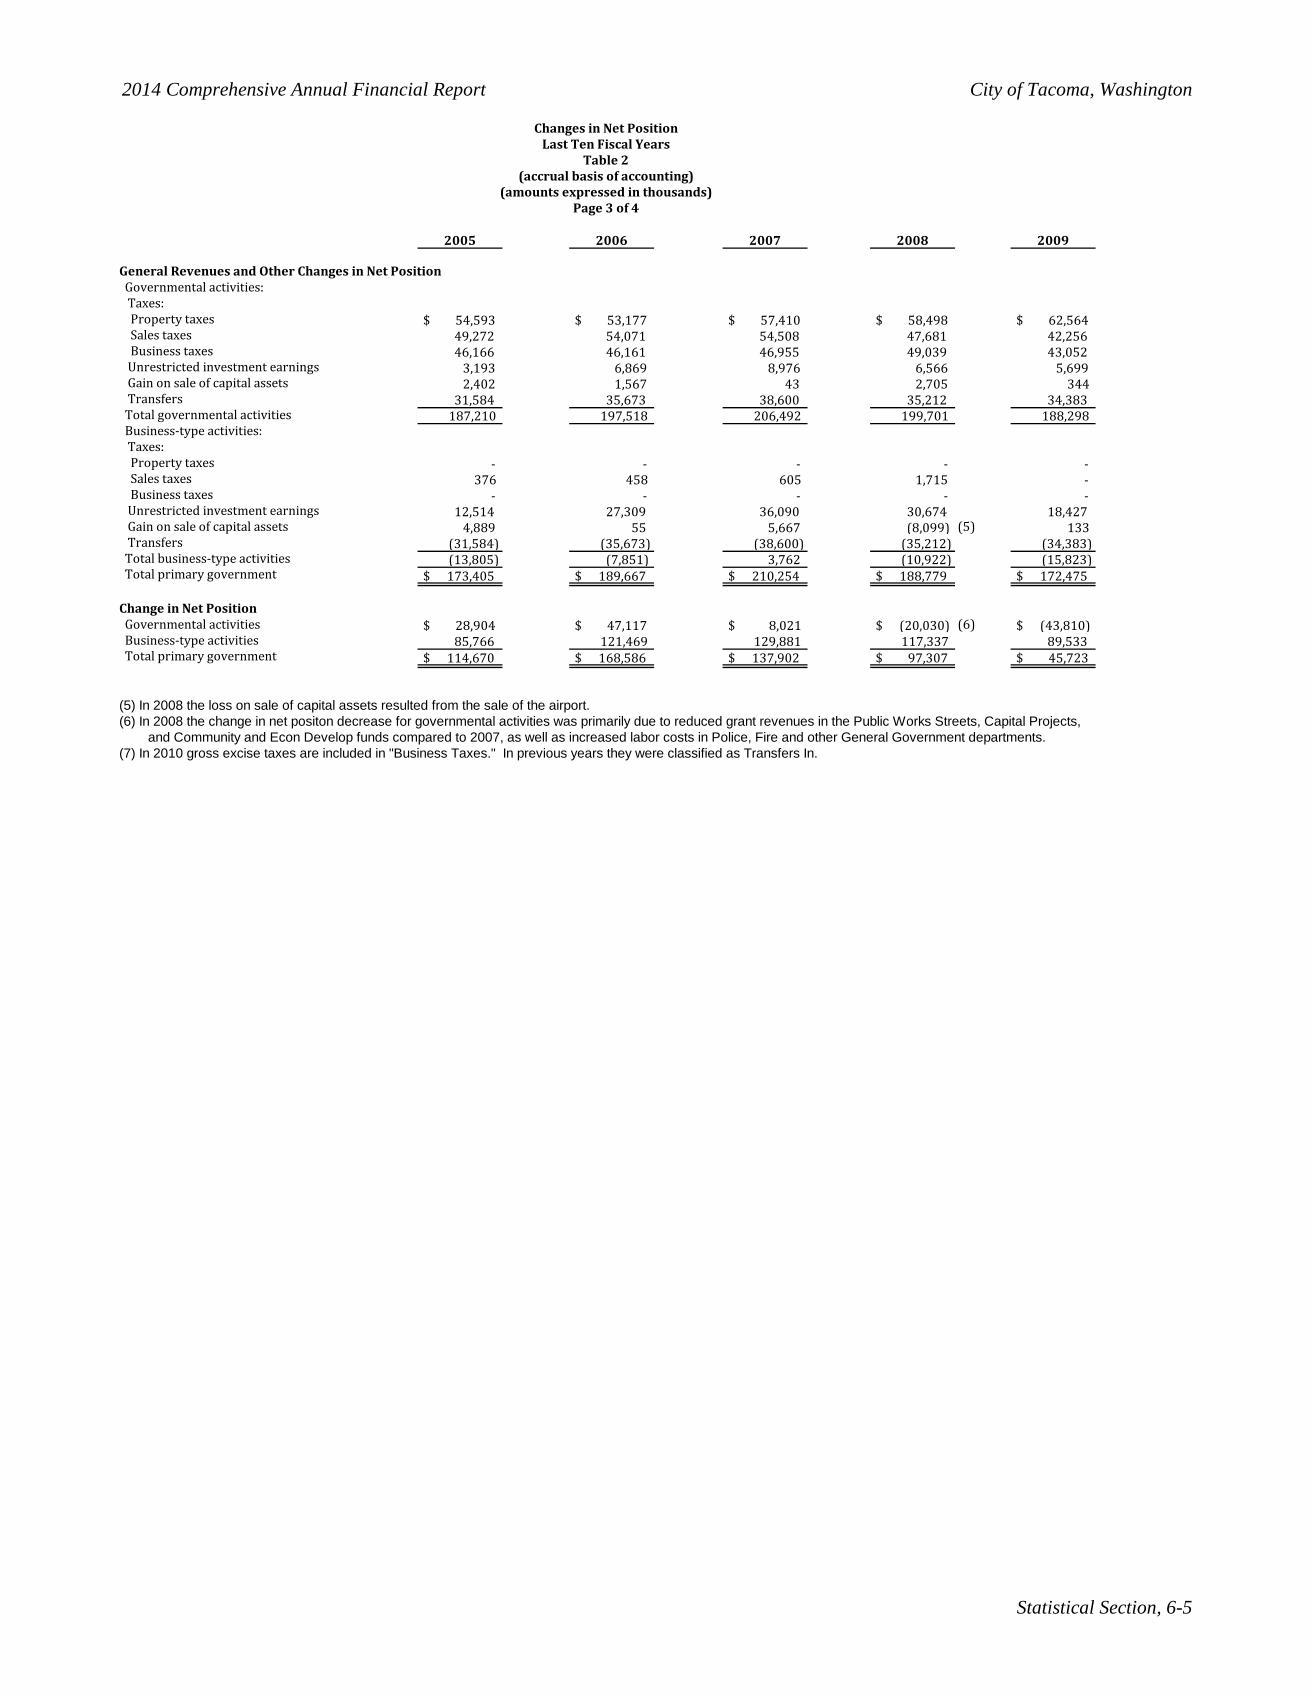
2014 Comprehensive Annual Financial Report City of Tacoma, Washington
Statistical Section, 6-5
Changes in Net PositionLast Ten Fiscal Years
Table 2(accrual basis of accounting)
(amounts expressed in thousands)
2005 2006 2007 2008 2009
General Revenues and Other Changes in Net Position Governmental activities: Taxes: Property taxes $ 54,593 $ 53,177 $ 57,410 $ 58,498 $ 62,564 Sales taxes 49,272 54,071 54,508 47,681 42,256 Business taxes 46,166 46,161 46,955 49,039 43,052 Unrestricted investment earnings 3,193 6,869 8,976 6,566 5,699 Gain on sale of capital assets 2,402 1,567 43 2,705 344 Transfers 31,584 35,673 38,600 35,212 34,383 Total governmental activities 187,210 197,518 206,492 199,701 188,298 Business-type activities: Taxes: Property taxes - - - - - Sales taxes 376 458 605 1,715 - Business taxes - - - - - Unrestricted investment earnings 12,514 27,309 36,090 30,674 18,427 Gain on sale of capital assets 4,889 55 5,667 (8,099) (5) 133 Transfers (31,584) (35,673) (38,600) (35,212) (34,383) Total business-type activities (13,805) (7,851) 3,762 (10,922) (15,823) Total primary government $ 173,405 $ 189,667 $ 210,254 $ 188,779 $ 172,475
Change in Net Position Governmental activities $ 28,904 $ 47,117 $ 8,021 $ (20,030) (6) $ (43,810) Business-type activities 85,766 121,469 129,881 117,337 89,533 Total primary government $ 114,670 $ 168,586 $ 137,902 $ 97,307 $ 45,723
(5) In 2008 the loss on sale of capital assets resulted from the sale of the airport.(6) In 2008 the change in net positon decrease for governmental activities was primarily due to reduced grant revenues in the Public Works Streets, Capital Projects, and Community and Econ Develop funds compared to 2007, as well as increased labor costs in Police, Fire and other General Government departments.(7) In 2010 gross excise taxes are included in "Business Taxes." In previous years they were classified as Transfers In.
Page 3 of 4
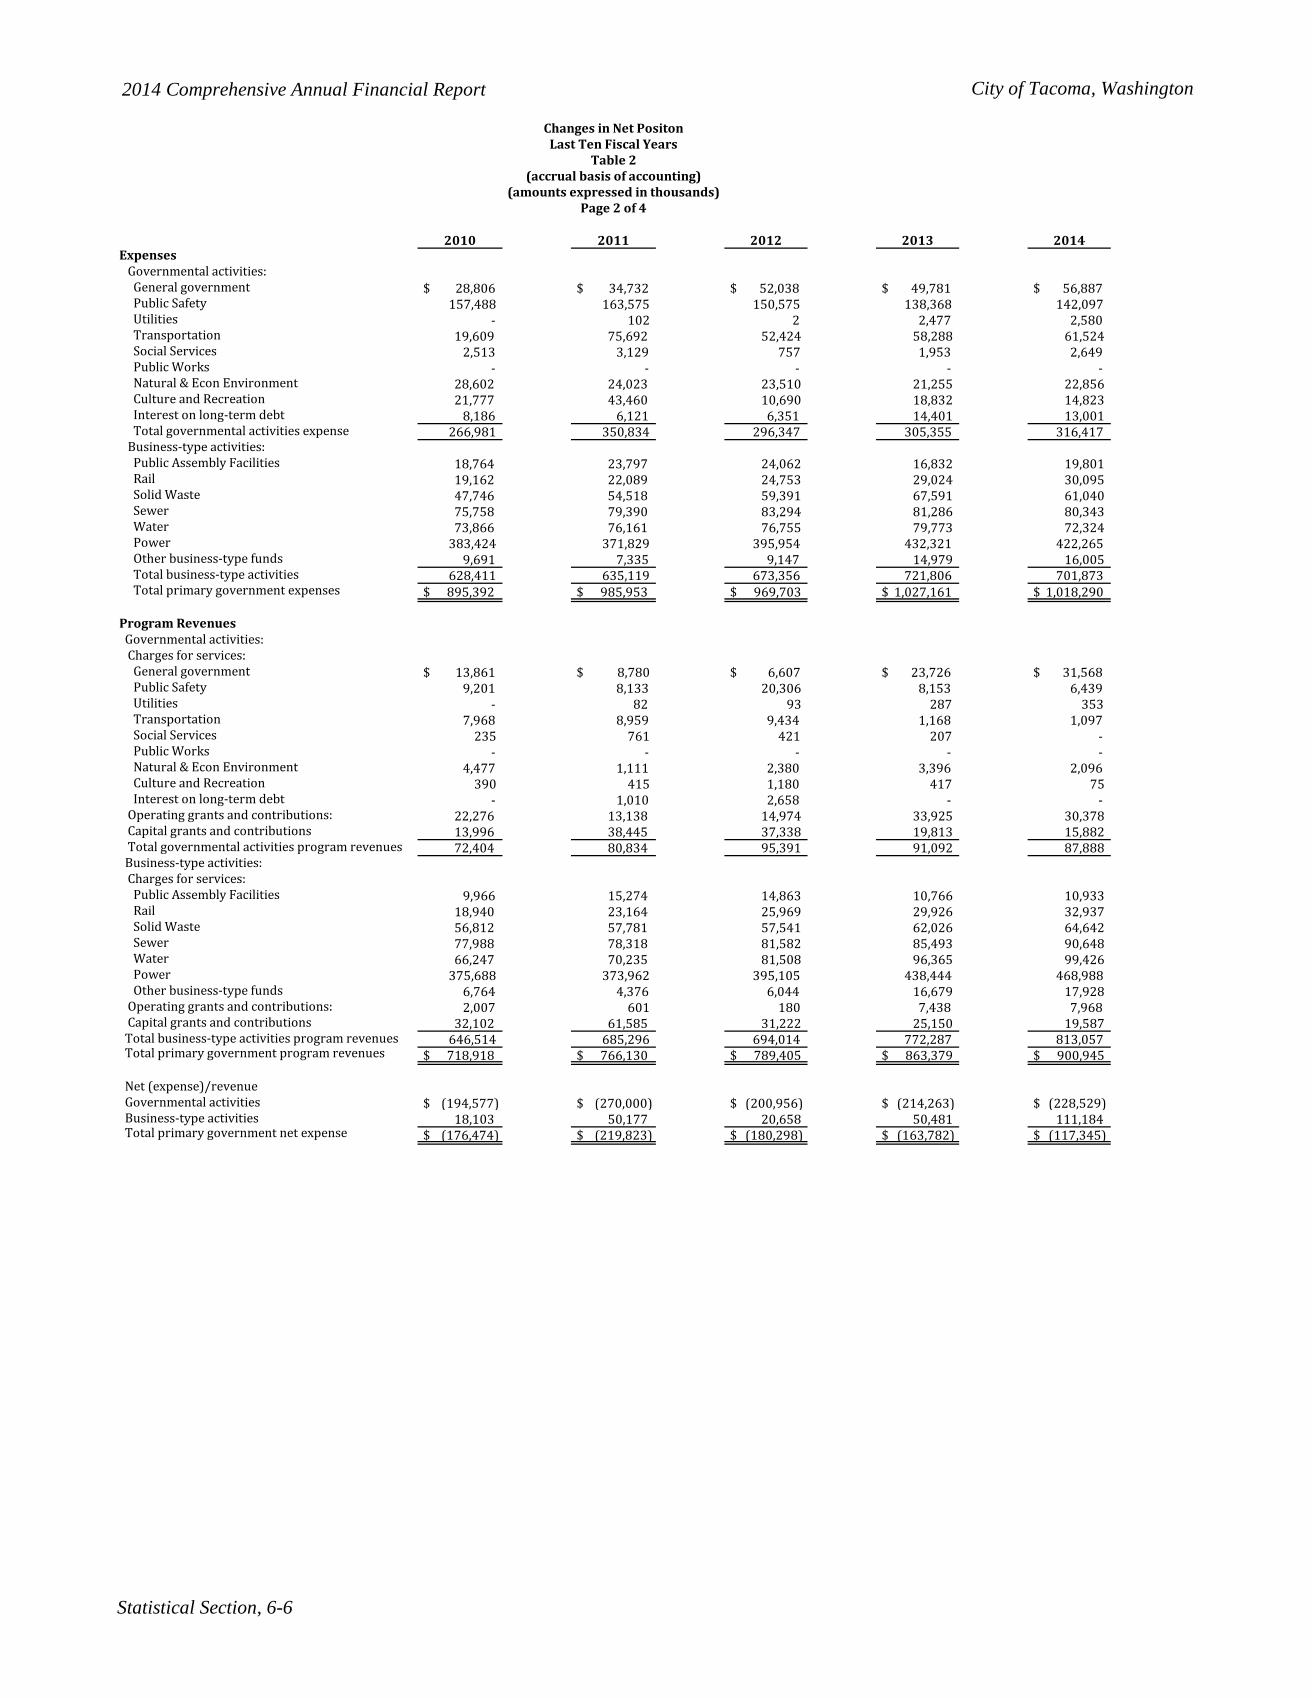
2014 Comprehensive Annual Financial Report City of Tacoma, Washington
Statistical Section, 6-6
2010 2011 2012 2013 2014Expenses Governmental activities: General government $ 28,806 $ 34,732 $ 52,038 $ 49,781 $ 56,887 Public Safety 157,488 163,575 150,575 138,368 142,097 Utilities - 102 2 2,477 2,580 Transportation 19,609 75,692 52,424 58,288 61,524 Social Services 2,513 3,129 757 1,953 2,649 Public Works - - - - - Natural & Econ Environment 28,602 24,023 23,510 21,255 22,856 Culture and Recreation 21,777 43,460 10,690 18,832 14,823 Interest on long-term debt 8,186 6,121 6,351 14,401 13,001 Total governmental activities expense 266,981 350,834 296,347 305,355 316,417 Business-type activities: Public Assembly Facilities 18,764 23,797 24,062 16,832 19,801 Rail 19,162 22,089 24,753 29,024 30,095 Solid Waste 47,746 54,518 59,391 67,591 61,040 Sewer 75,758 79,390 83,294 81,286 80,343 Water 73,866 76,161 76,755 79,773 72,324 Power 383,424 371,829 395,954 432,321 422,265 Other business-type funds 9,691 7,335 9,147 14,979 16,005 Total business-type activities 628,411 635,119 673,356 721,806 701,873 Total primary government expenses $ 895,392 $ 985,953 $ 969,703 $ 1,027,161 $ 1,018,290
Program Revenues Governmental activities: Charges for services: General government $ 13,861 $ 8,780 $ 6,607 $ 23,726 $ 31,568 Public Safety 9,201 8,133 20,306 8,153 6,439 Utilities - 82 93 287 353 Transportation 7,968 8,959 9,434 1,168 1,097 Social Services 235 761 421 207 - Public Works - - - - - Natural & Econ Environment 4,477 1,111 2,380 3,396 2,096 Culture and Recreation 390 415 1,180 417 75 Interest on long-term debt - 1,010 2,658 - - Operating grants and contributions: 22,276 13,138 14,974 33,925 30,378 Capital grants and contributions 13,996 38,445 37,338 19,813 15,882 Total governmental activities program revenues 72,404 80,834 95,391 91,092 87,888 Business-type activities: Charges for services: Public Assembly Facilities 9,966 15,274 14,863 10,766 10,933 Rail 18,940 23,164 25,969 29,926 32,937 Solid Waste 56,812 57,781 57,541 62,026 64,642 Sewer 77,988 78,318 81,582 85,493 90,648 Water 66,247 70,235 81,508 96,365 99,426 Power 375,688 373,962 395,105 438,444 468,988 Other business-type funds 6,764 4,376 6,044 16,679 17,928 Operating grants and contributions: 2,007 601 180 7,438 7,968 Capital grants and contributions 32,102 61,585 31,222 25,150 19,587 Total business-type activities program revenues 646,514 685,296 694,014 772,287 813,057 Total primary government program revenues $ 718,918 $ 766,130 $ 789,405 $ 863,379 $ 900,945
Net (expense)/revenue Governmental activities $ (194,577) $ (270,000) $ (200,956) $ (214,263) $ (228,529) Business-type activities 18,103 50,177 20,658 50,481 111,184 Total primary government net expense $ (176,474) $ (219,823) $ (180,298) $ (163,782) $ (117,345)
(amounts expressed in thousands)Page 2 of 4
Changes in Net PositonLast Ten Fiscal Years
Table 2(accrual basis of accounting)
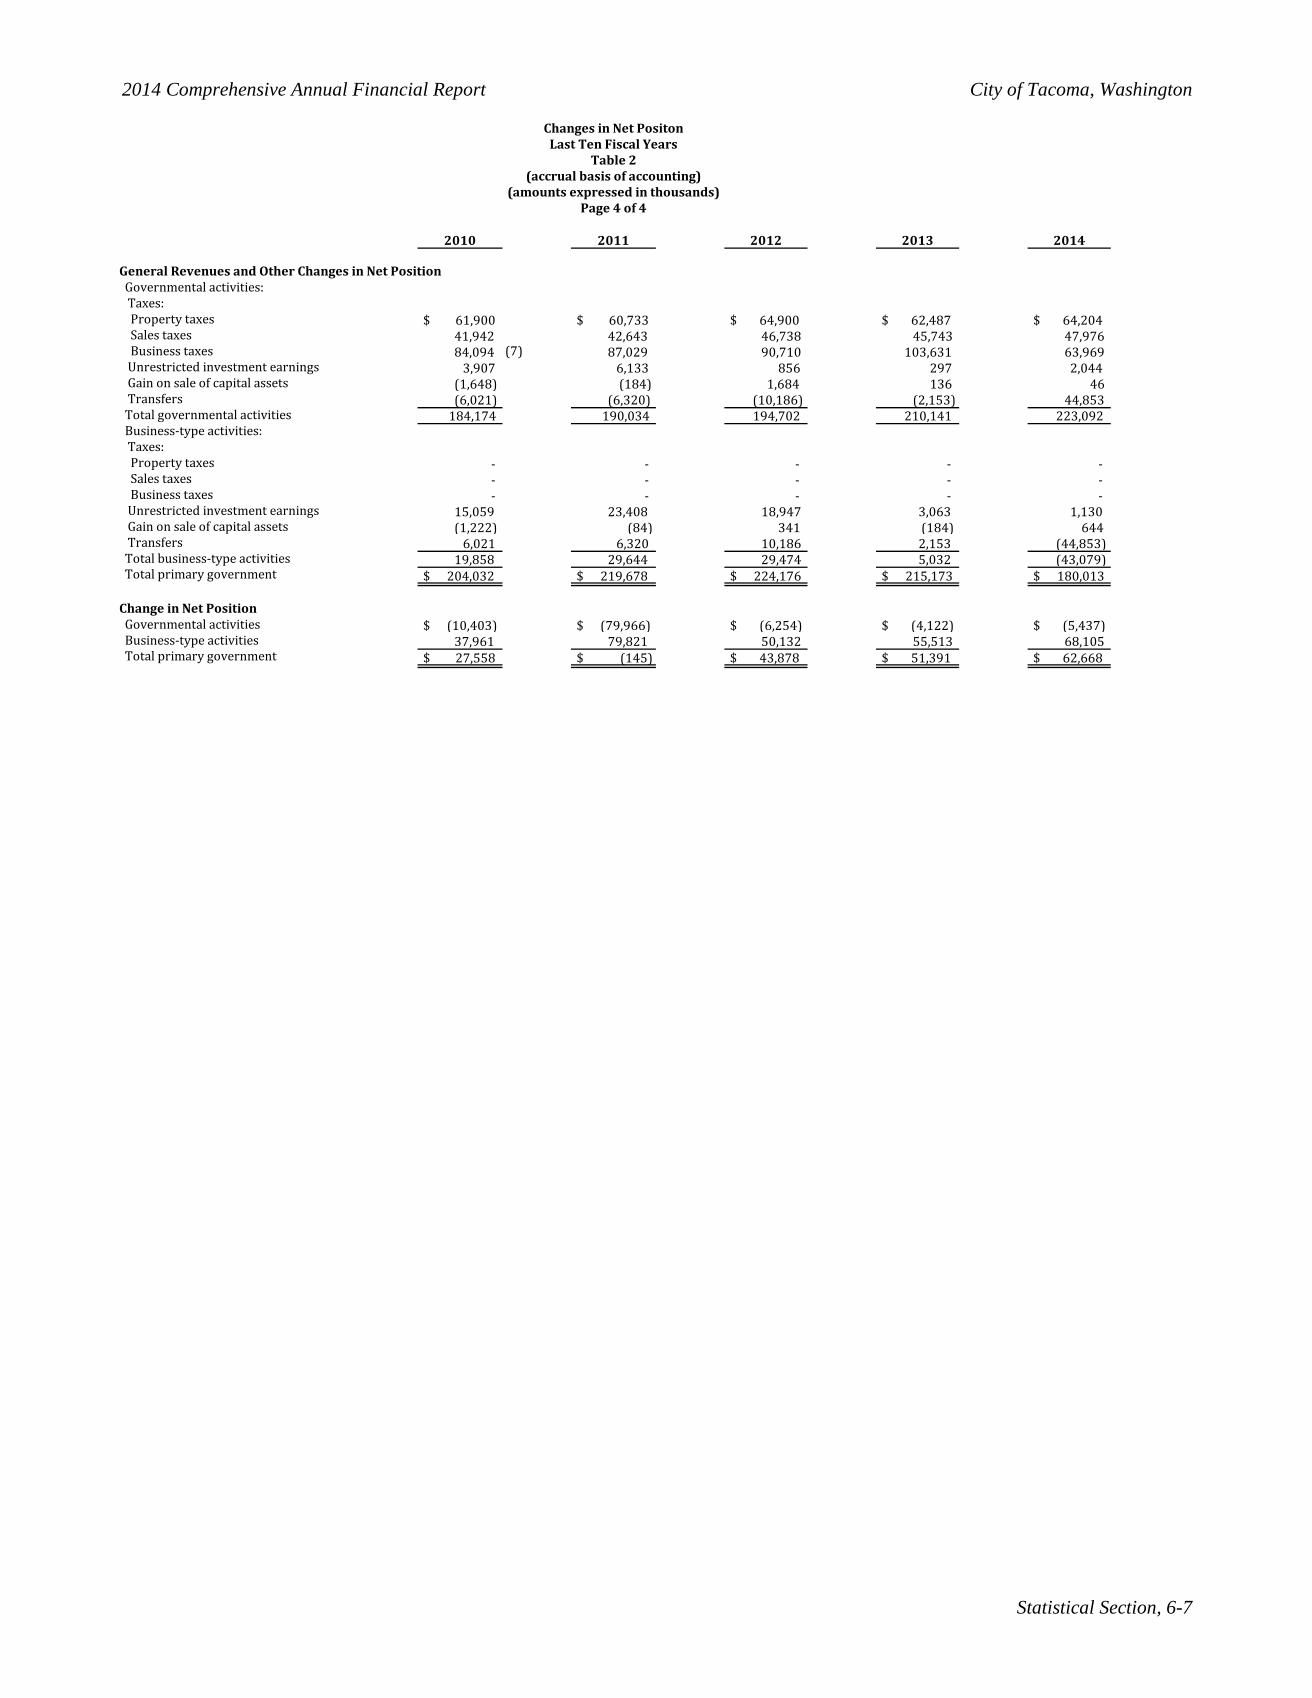
2014 Comprehensive Annual Financial Report City of Tacoma, Washington
Statistical Section, 6-7
(amounts expressed in thousands)
Changes in Net PositonLast Ten Fiscal Years
Table 2(accrual basis of accounting)
2010 2011 2012 2013 2014
General Revenues and Other Changes in Net Position Governmental activities: Taxes: Property taxes $ 61,900 $ 60,733 $ 64,900 $ 62,487 $ 64,204 Sales taxes 41,942 42,643 46,738 45,743 47,976 Business taxes 84,094 (7) 87,029 90,710 103,631 63,969 Unrestricted investment earnings 3,907 6,133 856 297 2,044 Gain on sale of capital assets (1,648) (184) 1,684 136 46 Transfers (6,021) (6,320) (10,186) (2,153) 44,853 Total governmental activities 184,174 190,034 194,702 210,141 223,092 Business-type activities: Taxes: Property taxes - - - - - Sales taxes - - - - - Business taxes - - - - - Unrestricted investment earnings 15,059 23,408 18,947 3,063 1,130 Gain on sale of capital assets (1,222) (84) 341 (184) 644 Transfers 6,021 6,320 10,186 2,153 (44,853) Total business-type activities 19,858 29,644 29,474 5,032 (43,079) Total primary government $ 204,032 $ 219,678 $ 224,176 $ 215,173 $ 180,013
Change in Net Position Governmental activities $ (10,403) $ (79,966) $ (6,254) $ (4,122) $ (5,437) Business-type activities 37,961 79,821 50,132 55,513 68,105 Total primary government $ 27,558 $ (145) $ 43,878 $ 51,391 $ 62,668
Page 4 of 4
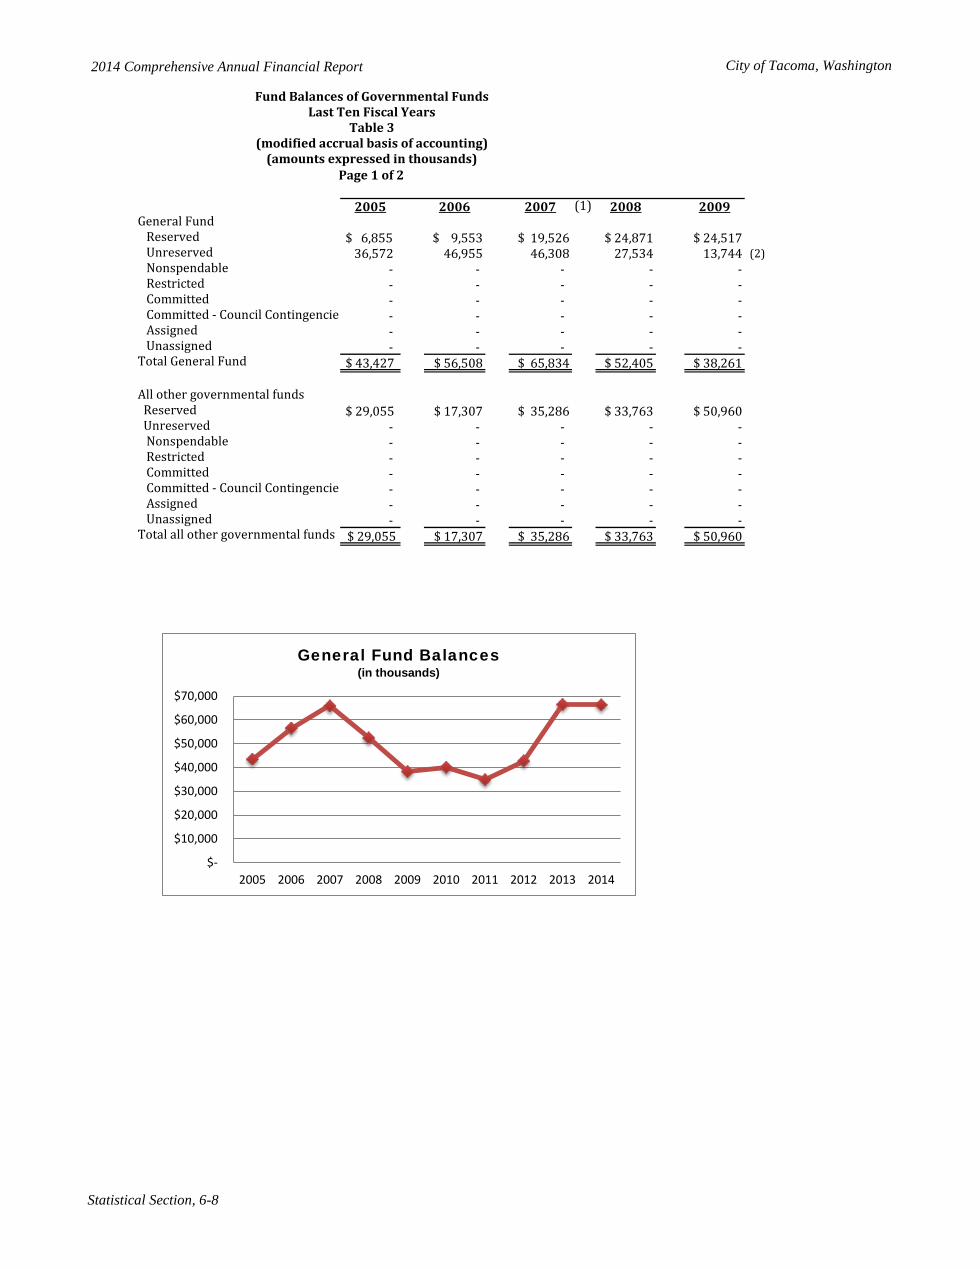
2014 Comprehensive Annual Financial Report City of Tacoma, Washington
Statistical Section, 6-8
2005 2006 2007 (1) 2008 2009General Fund Reserved $ 6,855 $ 9,553 $ 19,526 $ 24,871 $ 24,517 Unreserved 36,572 46,955 46,308 27,534 13,744 (2) Nonspendable - - - - - Restricted - - - - - Committed - - - - - Committed - Council Contingencies - - - - - Assigned - - - - - Unassigned - - - - - Total General Fund $ 43,427 $ 56,508 $ 65,834 $ 52,405 $ 38,261
All other governmental funds Reserved $ 29,055 $ 17,307 $ 35,286 $ 33,763 $ 50,960 Unreserved - - - - - Nonspendable - - - - - Restricted - - - - - Committed - - - - - Committed - Council Contingencies - - - - - Assigned - - - - - Unassigned - - - - - Total all other governmental funds $ 29,055 $ 17,307 $ 35,286 $ 33,763 $ 50,960
(amounts expressed in thousands)Page 1 of 2
Fund Balances of Governmental FundsLast Ten Fiscal Years
Table 3(modified accrual basis of accounting)
$-
$10,000
$20,000
$30,000
$40,000
$50,000
$60,000
$70,000
2005 2006 2007 2008 2009 2010 2011 2012 2013 2014
General Fund Balances (in thousands)
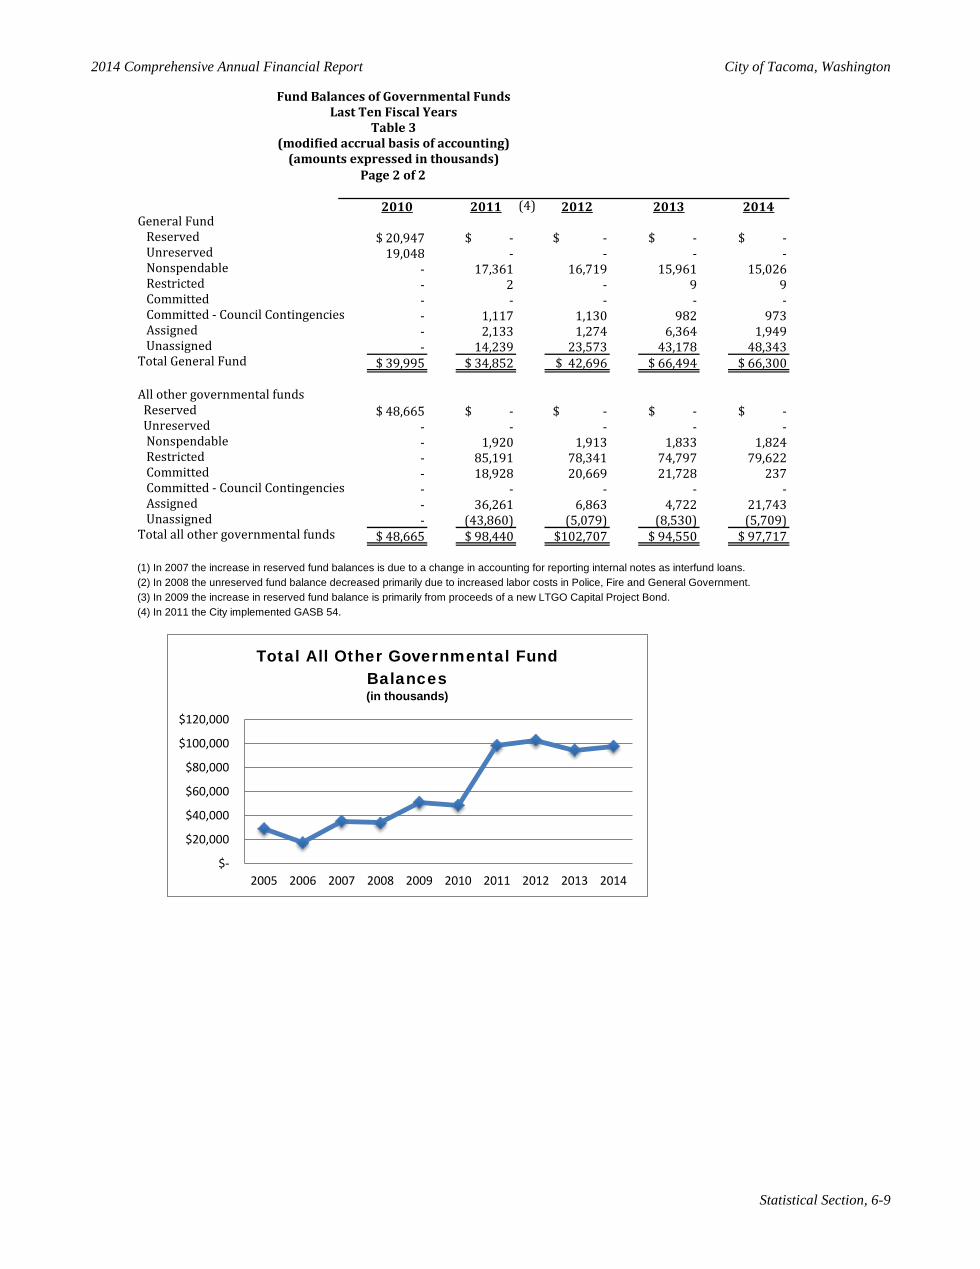
2014 Comprehensive Annual Financial Report City of Tacoma, Washington
Statistical Section, 6-9
2010 2011 (4) 2012 2013 2014General Fund Reserved $ 20,947 $ - $ - $ - $ - Unreserved 19,048 - - - - Nonspendable - 17,361 16,719 15,961 15,026 Restricted - 2 - 9 9 Committed - - - - - Committed - Council Contingencies - 1,117 1,130 982 973 Assigned - 2,133 1,274 6,364 1,949 Unassigned - 14,239 23,573 43,178 48,343 Total General Fund $ 39,995 $ 34,852 $ 42,696 $ 66,494 $ 66,300
All other governmental funds Reserved $ 48,665 $ - $ - $ - $ - Unreserved - - - - - Nonspendable - 1,920 1,913 1,833 1,824 Restricted - 85,191 78,341 74,797 79,622 Committed - 18,928 20,669 21,728 237 Committed - Council Contingencies - - - - - Assigned - 36,261 6,863 4,722 21,743 Unassigned - (43,860) (5,079) (8,530) (5,709)Total all other governmental funds $ 48,665 $ 98,440 $102,707 $ 94,550 $ 97,717
(1) In 2007 the increase in reserved fund balances is due to a change in accounting for reporting internal notes as interfund loans.(2) In 2008 the unreserved fund balance decreased primarily due to increased labor costs in Police, Fire and General Government.(3) In 2009 the increase in reserved fund balance is primarily from proceeds of a new LTGO Capital Project Bond.(4) In 2011 the City implemented GASB 54.
Fund Balances of Governmental FundsLast Ten Fiscal Years
Table 3(modified accrual basis of accounting)
(amounts expressed in thousands)Page 2 of 2
$-
$20,000
$40,000
$60,000
$80,000
$100,000
$120,000
2005 2006 2007 2008 2009 2010 2011 2012 2013 2014
Total All Other Governmental Fund Balances (in thousands)
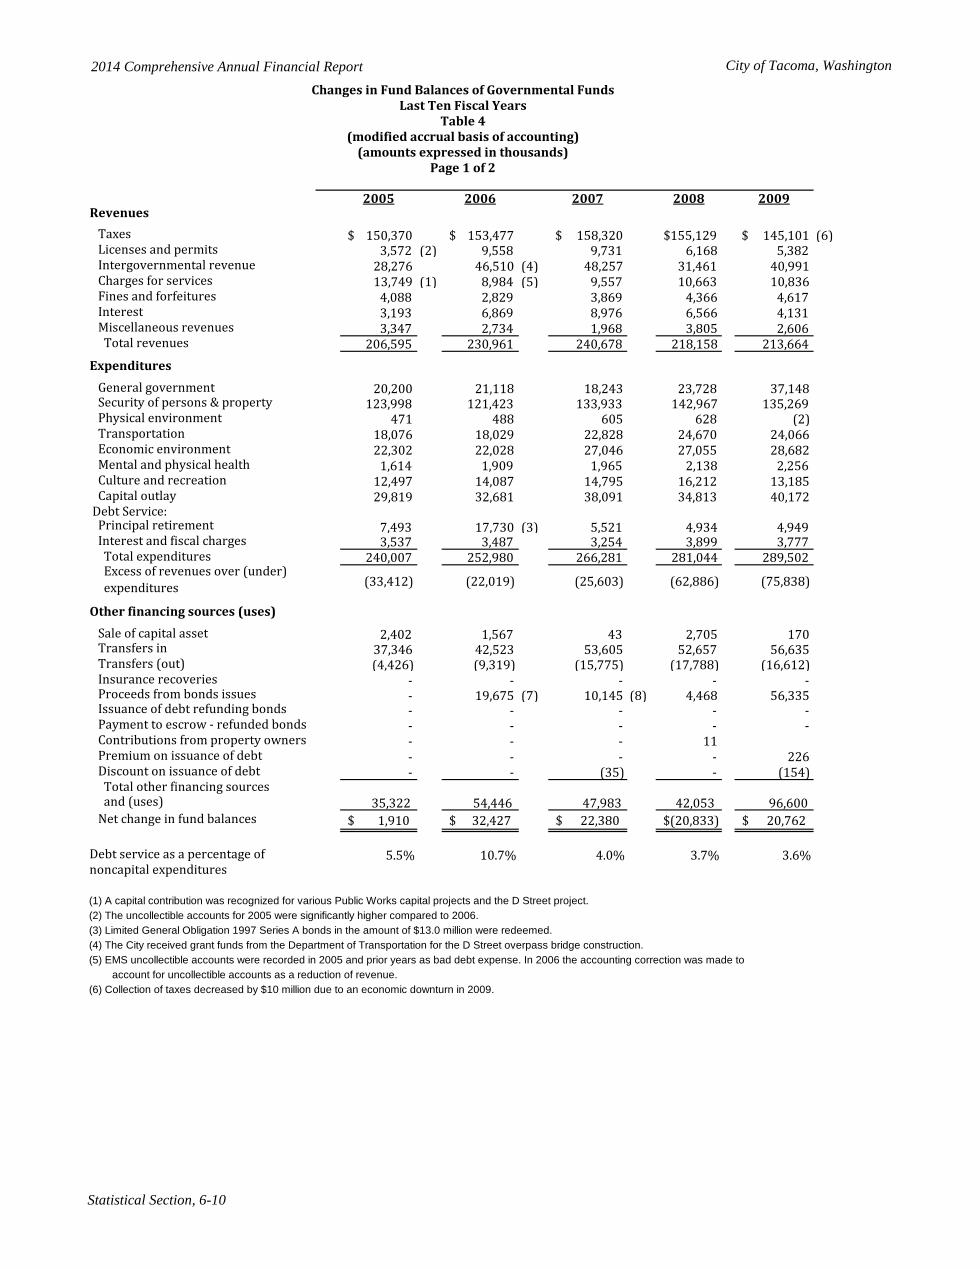
2014 Comprehensive Annual Financial Report City of Tacoma, Washington
Statistical Section, 6-10
2005 2006 2007 2008 2009Revenues Taxes $ 150,370 $ 153,477 $ 158,320 $155,129 $ 145,101 (6) Licenses and permits 3,572 (2) 9,558 9,731 6,168 5,382 Intergovernmental revenue 28,276 46,510 (4) 48,257 31,461 40,991 Charges for services 13,749 (1) 8,984 (5) 9,557 10,663 10,836 Fines and forfeitures 4,088 2,829 3,869 4,366 4,617 Interest 3,193 6,869 8,976 6,566 4,131 Miscellaneous revenues 3,347 2,734 1,968 3,805 2,606 Total revenues 206,595 230,961 240,678 218,158 213,664 Expenditures General government 20,200 21,118 18,243 23,728 37,148 Security of persons & property 123,998 121,423 133,933 142,967 135,269 Physical environment 471 488 605 628 (2) Transportation 18,076 18,029 22,828 24,670 24,066 Economic environment 22,302 22,028 27,046 27,055 28,682 Mental and physical health 1,614 1,909 1,965 2,138 2,256 Culture and recreation 12,497 14,087 14,795 16,212 13,185 Capital outlay 29,819 32,681 38,091 34,813 40,172 Debt Service: Principal retirement 7,493 17,730 (3) 5,521 4,934 4,949 Interest and fiscal charges 3,537 3,487 3,254 3,899 3,777 Total expenditures 240,007 252,980 266,281 281,044 289,502 Excess of revenues over (under) expenditures (33,412) (22,019) (25,603) (62,886) (75,838)
Other financing sources (uses) Sale of capital asset 2,402 1,567 43 2,705 170 Transfers in 37,346 42,523 53,605 52,657 56,635 Transfers (out) (4,426) (9,319) (15,775) (17,788) (16,612) Insurance recoveries - - - - - Proceeds from bonds issues - 19,675 (7) 10,145 (8) 4,468 56,335 Issuance of debt refunding bonds - - - - - Payment to escrow - refunded bonds - - - - - Contributions from property owners - - - 11 Premium on issuance of debt - - - - 226 Discount on issuance of debt - - (35) - (154) Total other financing sources and (uses) 35,322 54,446 47,983 42,053 96,600 Net change in fund balances 1,910$ 32,427$ 22,380$ (20,833)$ 20,762$
Debt service as a percentage of 5.5% 10.7% 4.0% 3.7% 3.6%noncapital expenditures
(1) A capital contribution was recognized for various Public Works capital projects and the D Street project. (2) The uncollectible accounts for 2005 were significantly higher compared to 2006.(3) Limited General Obligation 1997 Series A bonds in the amount of $13.0 million were redeemed. (4) The City received grant funds from the Department of Transportation for the D Street overpass bridge construction.(5) EMS uncollectible accounts were recorded in 2005 and prior years as bad debt expense. In 2006 the accounting correction was made to account for uncollectible accounts as a reduction of revenue.(6) Collection of taxes decreased by $10 million due to an economic downturn in 2009.
(amounts expressed in thousands)Page 1 of 2
Changes in Fund Balances of Governmental FundsLast Ten Fiscal Years
Table 4(modified accrual basis of accounting)
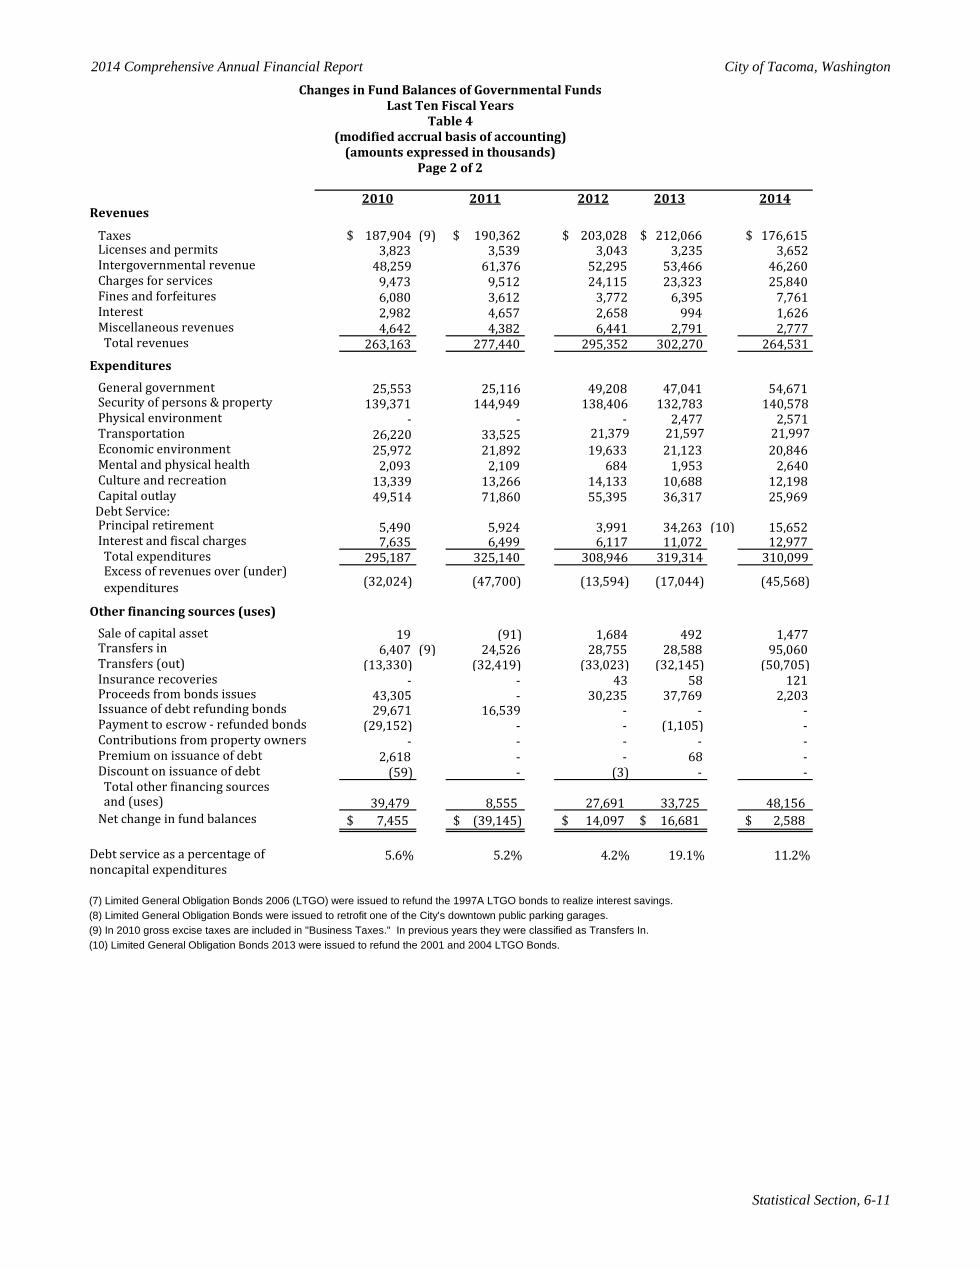
2014 Comprehensive Annual Financial Report City of Tacoma, Washington
Statistical Section, 6-11
2010 2011 2012 2013 2014Revenues
Taxes $ 187,904 (9) $ 190,362 $ 203,028 $ 212,066 $ 176,615 Licenses and permits 3,823 3,539 3,043 3,235 3,652 Intergovernmental revenue 48,259 61,376 52,295 53,466 46,260 Charges for services 9,473 9,512 24,115 23,323 25,840 Fines and forfeitures 6,080 3,612 3,772 6,395 7,761 Interest 2,982 4,657 2,658 994 1,626 Miscellaneous revenues 4,642 4,382 6,441 2,791 2,777 Total revenues 263,163 277,440 295,352 302,270 264,531 Expenditures General government 25,553 25,116 49,208 47,041 54,671 Security of persons & property 139,371 144,949 138,406 132,783 140,578 Physical environment - - - 2,477 2,571 Transportation 26,220 33,525 21,379 21,597 21,997 Economic environment 25,972 21,892 19,633 21,123 20,846 Mental and physical health 2,093 2,109 684 1,953 2,640 Culture and recreation 13,339 13,266 14,133 10,688 12,198 Capital outlay 49,514 71,860 55,395 36,317 25,969 Debt Service: Principal retirement 5,490 5,924 3,991 34,263 (10) 15,652 Interest and fiscal charges 7,635 6,499 6,117 11,072 12,977 Total expenditures 295,187 325,140 308,946 319,314 310,099 Excess of revenues over (under) expenditures (32,024) (47,700) (13,594) (17,044) (45,568)
Other financing sources (uses) Sale of capital asset 19 (91) 1,684 492 1,477 Transfers in 6,407 (9) 24,526 28,755 28,588 95,060 Transfers (out) (13,330) (32,419) (33,023) (32,145) (50,705) Insurance recoveries - - 43 58 121 Proceeds from bonds issues 43,305 - 30,235 37,769 2,203 Issuance of debt refunding bonds 29,671 16,539 - - - Payment to escrow - refunded bonds (29,152) - - (1,105) - Contributions from property owners - - - - - Premium on issuance of debt 2,618 - - 68 - Discount on issuance of debt (59) - (3) - - Total other financing sources and (uses) 39,479 8,555 27,691 33,725 48,156 Net change in fund balances 7,455$ (39,145)$ 14,097$ 16,681$ 2,588$
Debt service as a percentage of 5.6% 5.2% 4.2% 19.1% 11.2%noncapital expenditures
(7) Limited General Obligation Bonds 2006 (LTGO) were issued to refund the 1997A LTGO bonds to realize interest savings.(8) Limited General Obligation Bonds were issued to retrofit one of the City's downtown public parking garages.(9) In 2010 gross excise taxes are included in "Business Taxes." In previous years they were classified as Transfers In.(10) Limited General Obligation Bonds 2013 were issued to refund the 2001 and 2004 LTGO Bonds.
Changes in Fund Balances of Governmental FundsLast Ten Fiscal Years
Table 4(modified accrual basis of accounting)
(amounts expressed in thousands)Page 2 of 2
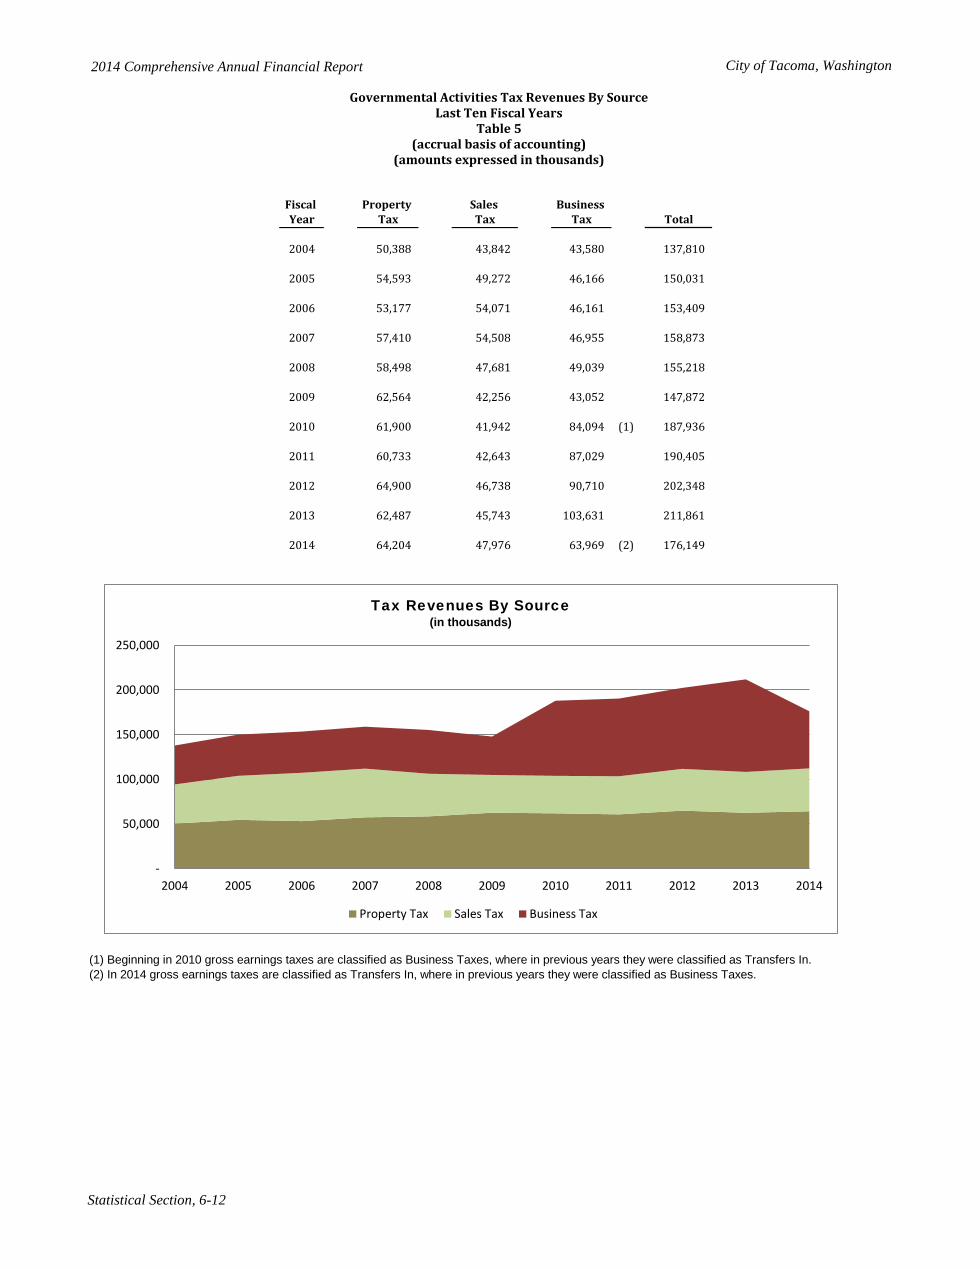
2014 Comprehensive Annual Financial Report City of Tacoma, Washington
Statistical Section, 6-12
Fiscal Property Sales Business Year Tax Tax Tax Total
2004 50,388 43,842 43,580 137,810
2005 54,593 49,272 46,166 150,031
2006 53,177 54,071 46,161 153,409
2007 57,410 54,508 46,955 158,873
2008 58,498 47,681 49,039 155,218
2009 62,564 42,256 43,052 147,872
2010 61,900 41,942 84,094 (1) 187,936
2011 60,733 42,643 87,029 190,405
2012 64,900 46,738 90,710 202,348
2013 62,487 45,743 103,631 211,861
2014 64,204 47,976 63,969 (2) 176,149
(1) Beginning in 2010 gross earnings taxes are classified as Business Taxes, where in previous years they were classified as Transfers In.(2) In 2014 gross earnings taxes are classified as Transfers In, where in previous years they were classified as Business Taxes.
(amounts expressed in thousands)
Governmental Activities Tax Revenues By SourceLast Ten Fiscal Years
Table 5(accrual basis of accounting)
-
50,000
100,000
150,000
200,000
250,000
2004 2005 2006 2007 2008 2009 2010 2011 2012 2013 2014
Tax Revenues By Source (in thousands)
Property Tax Sales Tax Business Tax
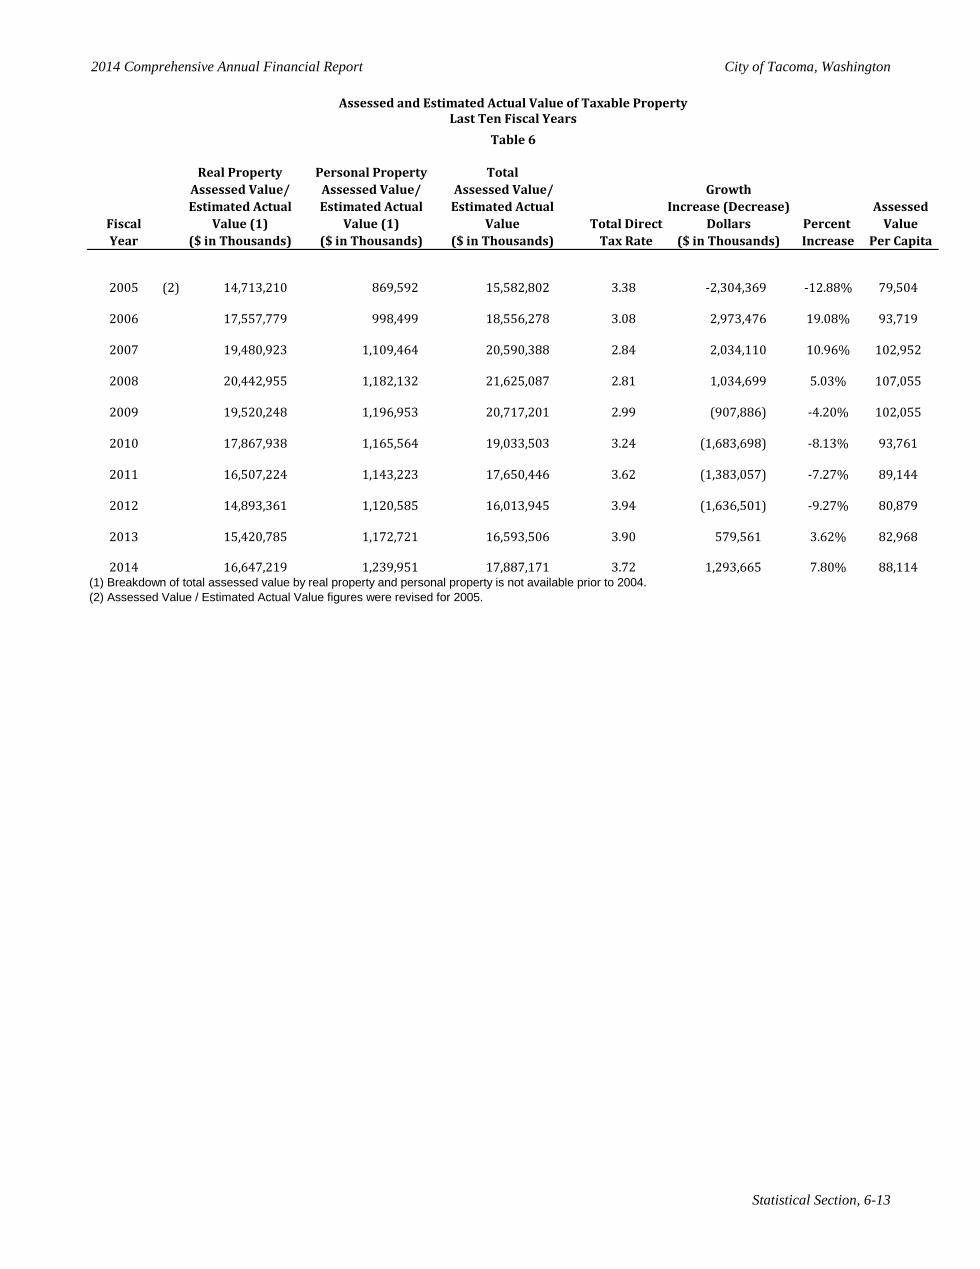
2014 Comprehensive Annual Financial Report City of Tacoma, Washington
Statistical Section, 6-13
Real Property Personal Property TotalAssessed Value/ Assessed Value/ Assessed Value/ GrowthEstimated Actual Estimated Actual Estimated Actual Increase (Decrease) Assessed
Fiscal Value (1) Value (1) Value Total Direct Dollars Percent ValueYear ($ in Thousands) ($ in Thousands) ($ in Thousands) Tax Rate ($ in Thousands) Increase Per Capita
2005 (2) 14,713,210 869,592 15,582,802 3.38 -2,304,369 -12.88% 79,504
2006 17,557,779 998,499 18,556,278 3.08 2,973,476 19.08% 93,719
2007 19,480,923 1,109,464 20,590,388 2.84 2,034,110 10.96% 102,952
2008 20,442,955 1,182,132 21,625,087 2.81 1,034,699 5.03% 107,055
2009 19,520,248 1,196,953 20,717,201 2.99 (907,886) -4.20% 102,055
2010 17,867,938 1,165,564 19,033,503 3.24 (1,683,698) -8.13% 93,761
2011 16,507,224 1,143,223 17,650,446 3.62 (1,383,057) -7.27% 89,144
2012 14,893,361 1,120,585 16,013,945 3.94 (1,636,501) -9.27% 80,879
2013 15,420,785 1,172,721 16,593,506 3.90 579,561 3.62% 82,968
2014 16,647,219 1,239,951 17,887,171 3.72 1,293,665 7.80% 88,114(1) Breakdown of total assessed value by real property and personal property is not available prior to 2004.(2) Assessed Value / Estimated Actual Value figures were revised for 2005.
Assessed and Estimated Actual Value of Taxable PropertyLast Ten Fiscal Years
Table 6
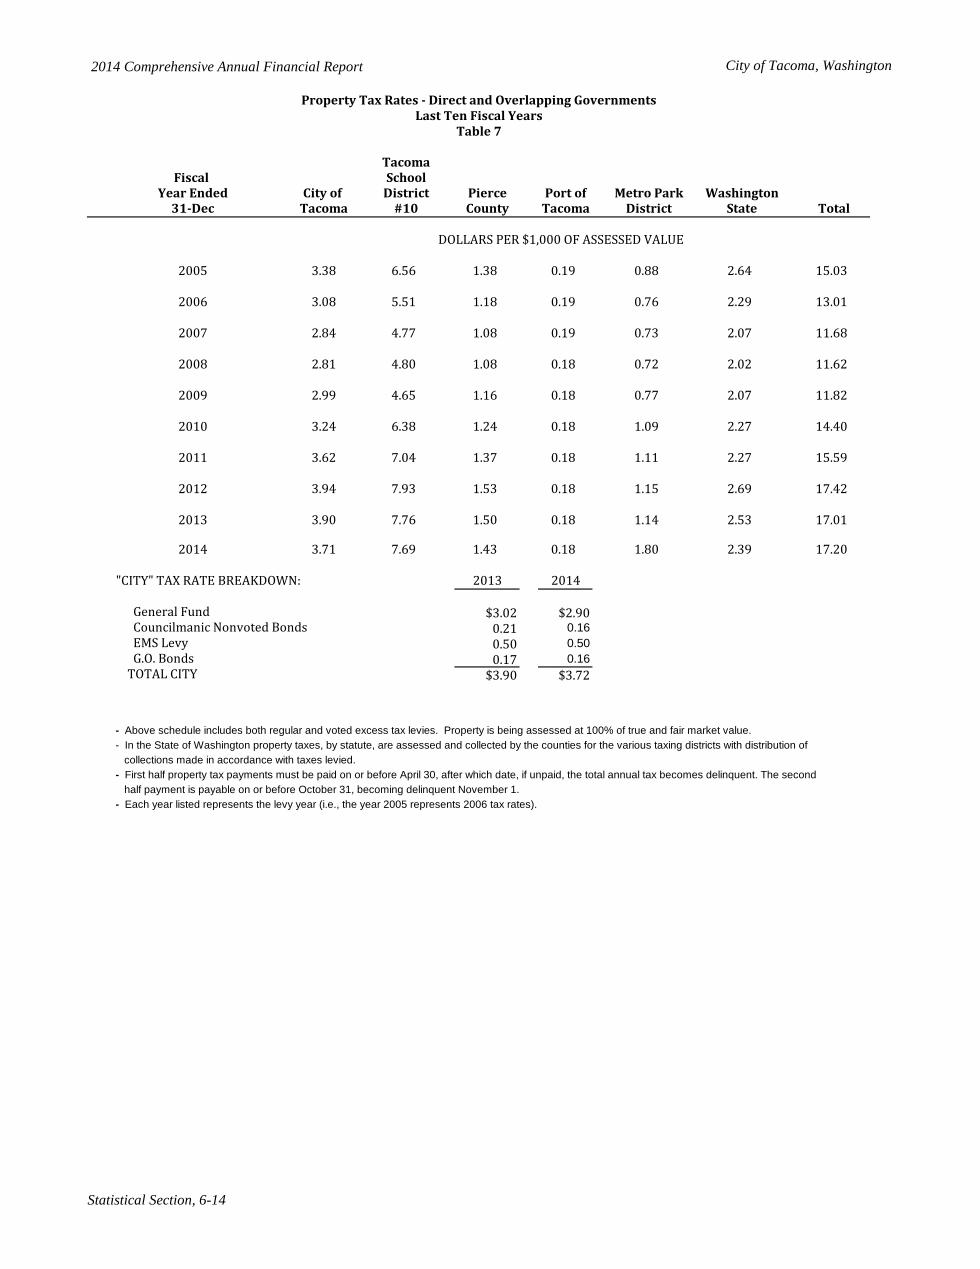
2014 Comprehensive Annual Financial Report City of Tacoma, Washington
Statistical Section, 6-14
TacomaFiscal School
Year Ended City of District Pierce Port of Metro Park Washington31-Dec Tacoma #10 County Tacoma District State Total
DOLLARS PER $1,000 OF ASSESSED VALUE
2005 3.38 6.56 1.38 0.19 0.88 2.64 15.03
2006 3.08 5.51 1.18 0.19 0.76 2.29 13.01
2007 2.84 4.77 1.08 0.19 0.73 2.07 11.68
2008 2.81 4.80 1.08 0.18 0.72 2.02 11.62
2009 2.99 4.65 1.16 0.18 0.77 2.07 11.82
2010 3.24 6.38 1.24 0.18 1.09 2.27 14.40
2011 3.62 7.04 1.37 0.18 1.11 2.27 15.59
2012 3.94 7.93 1.53 0.18 1.15 2.69 17.42
2013 3.90 7.76 1.50 0.18 1.14 2.53 17.01
2014 3.71 7.69 1.43 0.18 1.80 2.39 17.20
"CITY" TAX RATE BREAKDOWN: 2013 2014
General Fund $3.02 $2.90 Councilmanic Nonvoted Bonds 0.21 0.16 EMS Levy 0.50 0.50 G.O. Bonds 0.17 0.16 TOTAL CITY $3.90 $3.72
- Above schedule includes both regular and voted excess tax levies. Property is being assessed at 100% of true and fair market value.- In the State of Washington property taxes, by statute, are assessed and collected by the counties for the various taxing districts with distribution of collections made in accordance with taxes levied.- First half property tax payments must be paid on or before April 30, after which date, if unpaid, the total annual tax becomes delinquent. The second half payment is payable on or before October 31, becoming delinquent November 1.- Each year listed represents the levy year (i.e., the year 2005 represents 2006 tax rates).
Property Tax Rates - Direct and Overlapping GovernmentsLast Ten Fiscal Years
Table 7
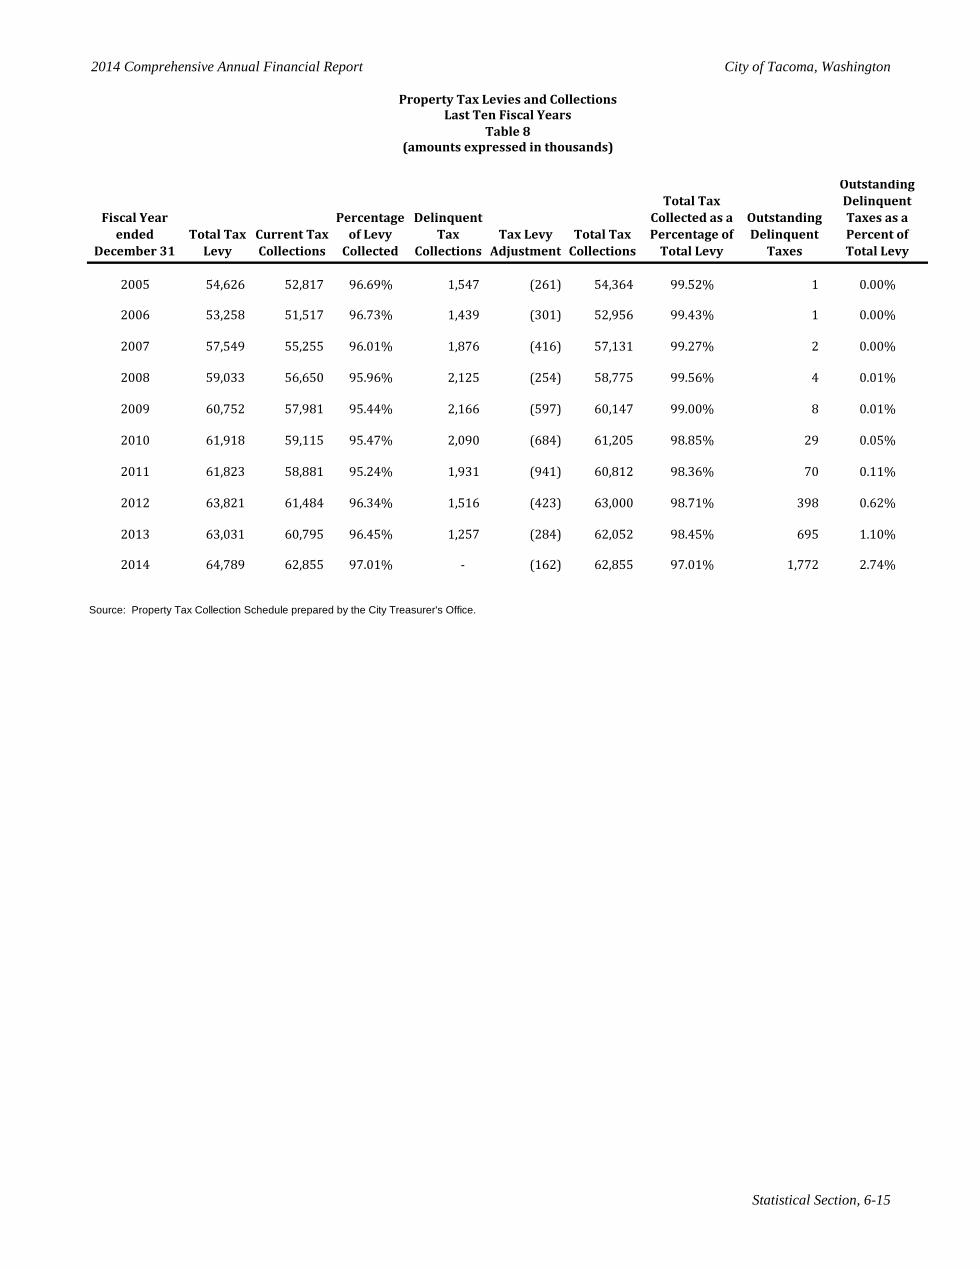
2014 Comprehensive Annual Financial Report City of Tacoma, Washington
Statistical Section, 6-15
Fiscal Year ended
December 31Total Tax
LevyCurrent Tax Collections
Percentage of Levy
Collected
Delinquent Tax
CollectionsTax Levy
AdjustmentTotal Tax
Collections
Total Tax Collected as a Percentage of
Total Levy
Outstanding Delinquent
Taxes
Outstanding Delinquent Taxes as a Percent of Total Levy
2005 54,626 52,817 96.69% 1,547 (261) 54,364 99.52% 1 0.00%
2006 53,258 51,517 96.73% 1,439 (301) 52,956 99.43% 1 0.00%
2007 57,549 55,255 96.01% 1,876 (416) 57,131 99.27% 2 0.00%
2008 59,033 56,650 95.96% 2,125 (254) 58,775 99.56% 4 0.01%
2009 60,752 57,981 95.44% 2,166 (597) 60,147 99.00% 8 0.01%
2010 61,918 59,115 95.47% 2,090 (684) 61,205 98.85% 29 0.05%
2011 61,823 58,881 95.24% 1,931 (941) 60,812 98.36% 70 0.11%
2012 63,821 61,484 96.34% 1,516 (423) 63,000 98.71% 398 0.62%
2013 63,031 60,795 96.45% 1,257 (284) 62,052 98.45% 695 1.10%
2014 64,789 62,855 97.01% - (162) 62,855 97.01% 1,772 2.74%
Source: Property Tax Collection Schedule prepared by the City Treasurer's Office.
Last Ten Fiscal Years
(amounts expressed in thousands)
Property Tax Levies and Collections
Table 8
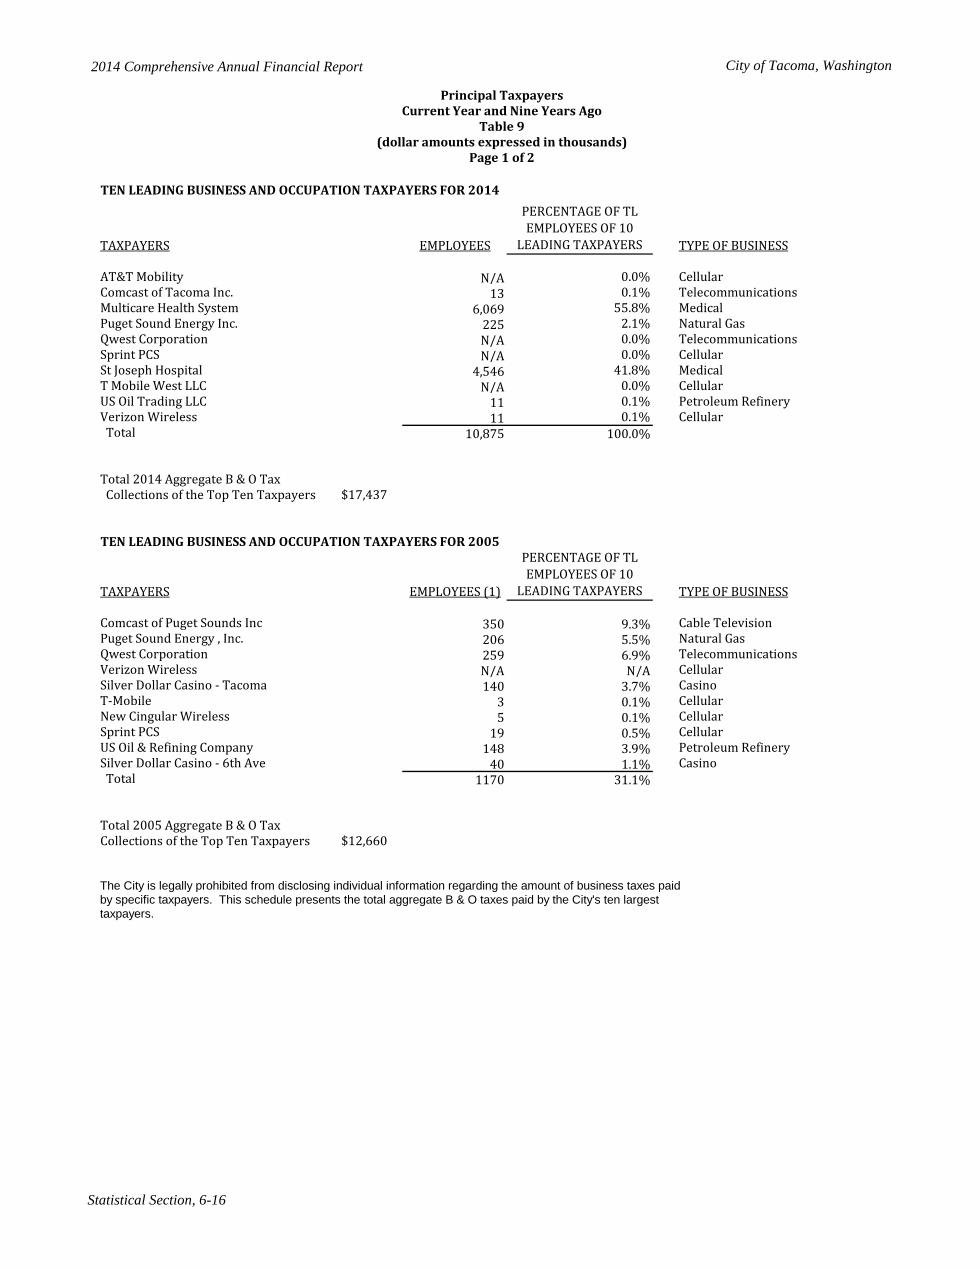
2014 Comprehensive Annual Financial Report City of Tacoma, Washington
Statistical Section, 6-16
TEN LEADING BUSINESS AND OCCUPATION TAXPAYERS FOR 2014
TAXPAYERS EMPLOYEES
PERCENTAGE OF TL EMPLOYEES OF 10
LEADING TAXPAYERS TYPE OF BUSINESS
AT&T Mobility N/A 0.0% CellularComcast of Tacoma Inc. 13 0.1% TelecommunicationsMulticare Health System 6,069 55.8% MedicalPuget Sound Energy Inc. 225 2.1% Natural GasQwest Corporation N/A 0.0% TelecommunicationsSprint PCS N/A 0.0% CellularSt Joseph Hospital 4,546 41.8% MedicalT Mobile West LLC N/A 0.0% CellularUS Oil Trading LLC 11 0.1% Petroleum RefineryVerizon Wireless 11 0.1% Cellular Total 10,875 100.0%
Total 2014 Aggregate B & O Tax Collections of the Top Ten Taxpayers $17,437
TEN LEADING BUSINESS AND OCCUPATION TAXPAYERS FOR 2005
TAXPAYERS EMPLOYEES (1)
PERCENTAGE OF TL EMPLOYEES OF 10
LEADING TAXPAYERS TYPE OF BUSINESS
Comcast of Puget Sounds Inc 350 9.3% Cable TelevisionPuget Sound Energy , Inc. 206 5.5% Natural GasQwest Corporation 259 6.9% TelecommunicationsVerizon Wireless N/A N/A CellularSilver Dollar Casino - Tacoma 140 3.7% CasinoT-Mobile 3 0.1% CellularNew Cingular Wireless 5 0.1% CellularSprint PCS 19 0.5% CellularUS Oil & Refining Company 148 3.9% Petroleum RefinerySilver Dollar Casino - 6th Ave 40 1.1% Casino Total 1170 31.1%
Total 2005 Aggregate B & O TaxCollections of the Top Ten Taxpayers $12,660
The City is legally prohibited from disclosing individual information regarding the amount of business taxes paidby specific taxpayers. This schedule presents the total aggregate B & O taxes paid by the City's ten largesttaxpayers.
Principal TaxpayersCurrent Year and Nine Years Ago
Table 9(dollar amounts expressed in thousands)
Page 1 of 2
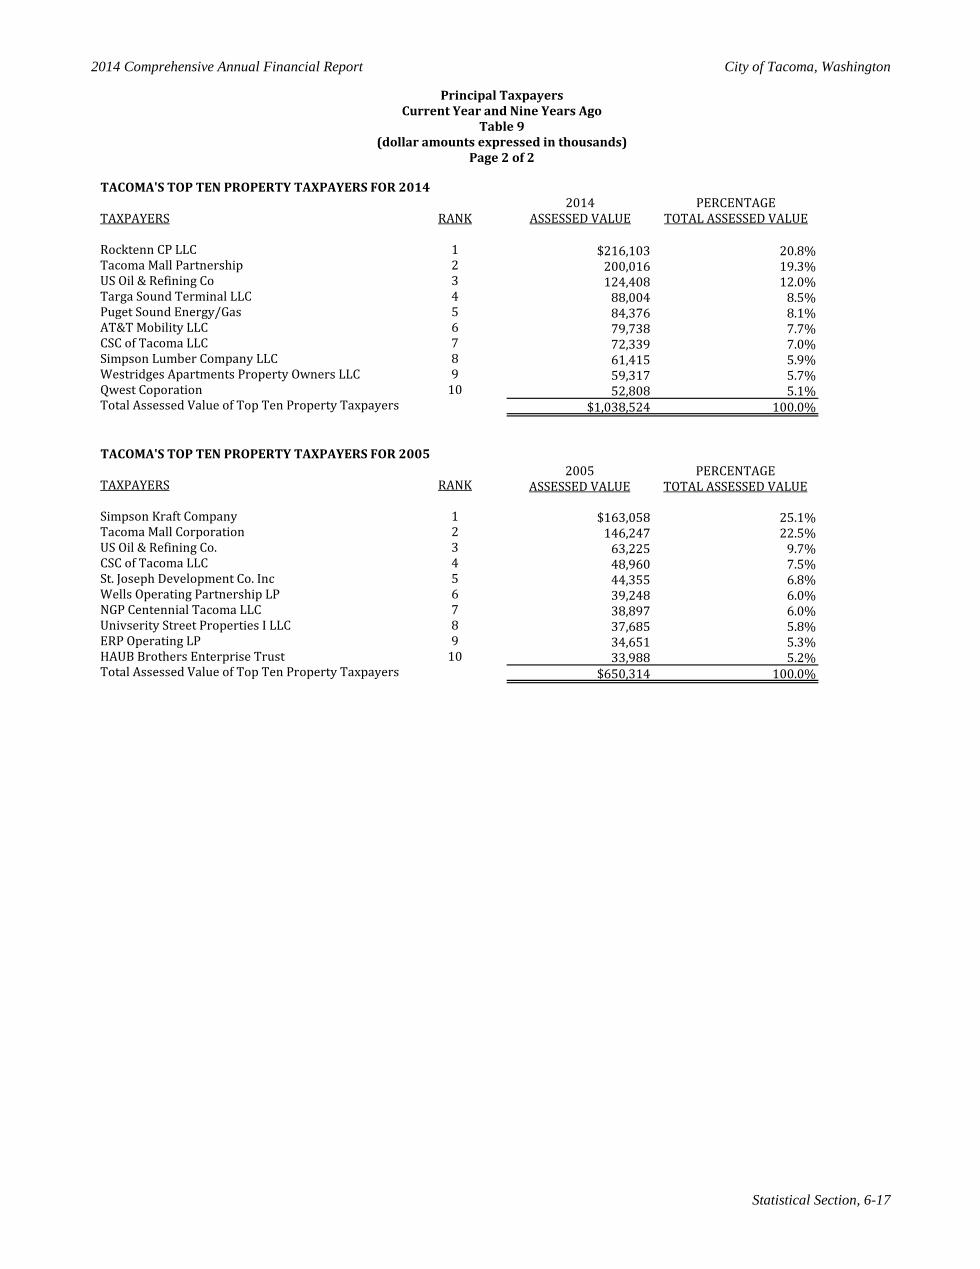
2014 Comprehensive Annual Financial Report City of Tacoma, Washington
Statistical Section, 6-17
Principal TaxpayersCurrent Year and Nine Years Ago
Table 9(dollar amounts expressed in thousands)
TACOMA'S TOP TEN PROPERTY TAXPAYERS FOR 20142014 PERCENTAGE
TAXPAYERS RANK ASSESSED VALUE TOTAL ASSESSED VALUE
Rocktenn CP LLC 1 $216,103 20.8%Tacoma Mall Partnership 2 200,016 19.3%US Oil & Refining Co 3 124,408 12.0%Targa Sound Terminal LLC 4 88,004 8.5%Puget Sound Energy/Gas 5 84,376 8.1%AT&T Mobility LLC 6 79,738 7.7%CSC of Tacoma LLC 7 72,339 7.0%Simpson Lumber Company LLC 8 61,415 5.9%Westridges Apartments Property Owners LLC 9 59,317 5.7%Qwest Coporation 10 52,808 5.1%Total Assessed Value of Top Ten Property Taxpayers $1,038,524 100.0%
TACOMA'S TOP TEN PROPERTY TAXPAYERS FOR 20052005 PERCENTAGE
TAXPAYERS RANK ASSESSED VALUE TOTAL ASSESSED VALUE
Simpson Kraft Company 1 $163,058 25.1%Tacoma Mall Corporation 2 146,247 22.5%US Oil & Refining Co. 3 63,225 9.7%CSC of Tacoma LLC 4 48,960 7.5%St. Joseph Development Co. Inc 5 44,355 6.8%Wells Operating Partnership LP 6 39,248 6.0%NGP Centennial Tacoma LLC 7 38,897 6.0%Univserity Street Properties I LLC 8 37,685 5.8%ERP Operating LP 9 34,651 5.3%HAUB Brothers Enterprise Trust 10 33,988 5.2%Total Assessed Value of Top Ten Property Taxpayers $650,314 100.0%
Page 2 of 2
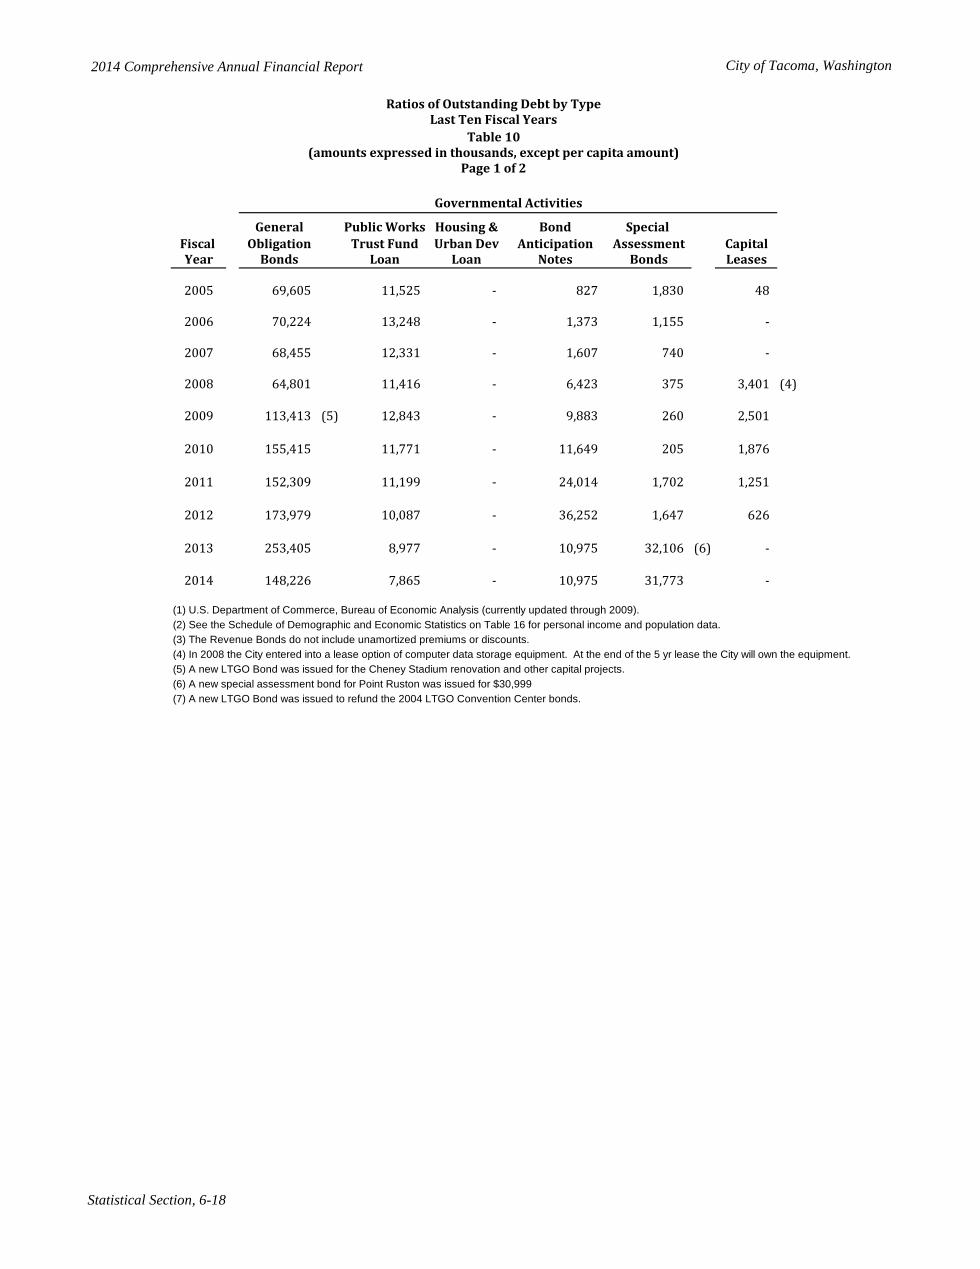
2014 Comprehensive Annual Financial Report City of Tacoma, Washington
Statistical Section, 6-18
General Public Works Housing & Bond Special Fiscal Obligation Trust Fund Urban Dev Anticipation Assessment CapitalYear Bonds Loan Loan Notes Bonds Leases
2005 69,605 11,525 - 827 1,830 48
2006 70,224 13,248 - 1,373 1,155 -
2007 68,455 12,331 - 1,607 740 -
2008 64,801 11,416 - 6,423 375 3,401 (4)
2009 113,413 (5) 12,843 - 9,883 260 2,501
2010 155,415 11,771 - 11,649 205 1,876
2011 152,309 11,199 - 24,014 1,702 1,251
2012 173,979 10,087 - 36,252 1,647 626
2013 253,405 8,977 - 10,975 32,106 (6) -
2014 148,226 7,865 - 10,975 31,773 -
(1) U.S. Department of Commerce, Bureau of Economic Analysis (currently updated through 2009).(2) See the Schedule of Demographic and Economic Statistics on Table 16 for personal income and population data.(3) The Revenue Bonds do not include unamortized premiums or discounts.(4) In 2008 the City entered into a lease option of computer data storage equipment. At the end of the 5 yr lease the City will own the equipment.(5) A new LTGO Bond was issued for the Cheney Stadium renovation and other capital projects.(6) A new special assessment bond for Point Ruston was issued for $30,999(7) A new LTGO Bond was issued to refund the 2004 LTGO Convention Center bonds.
Governmental Activities
Ratios of Outstanding Debt by TypeLast Ten Fiscal Years
Table 10(amounts expressed in thousands, except per capita amount)
Page 1 of 2
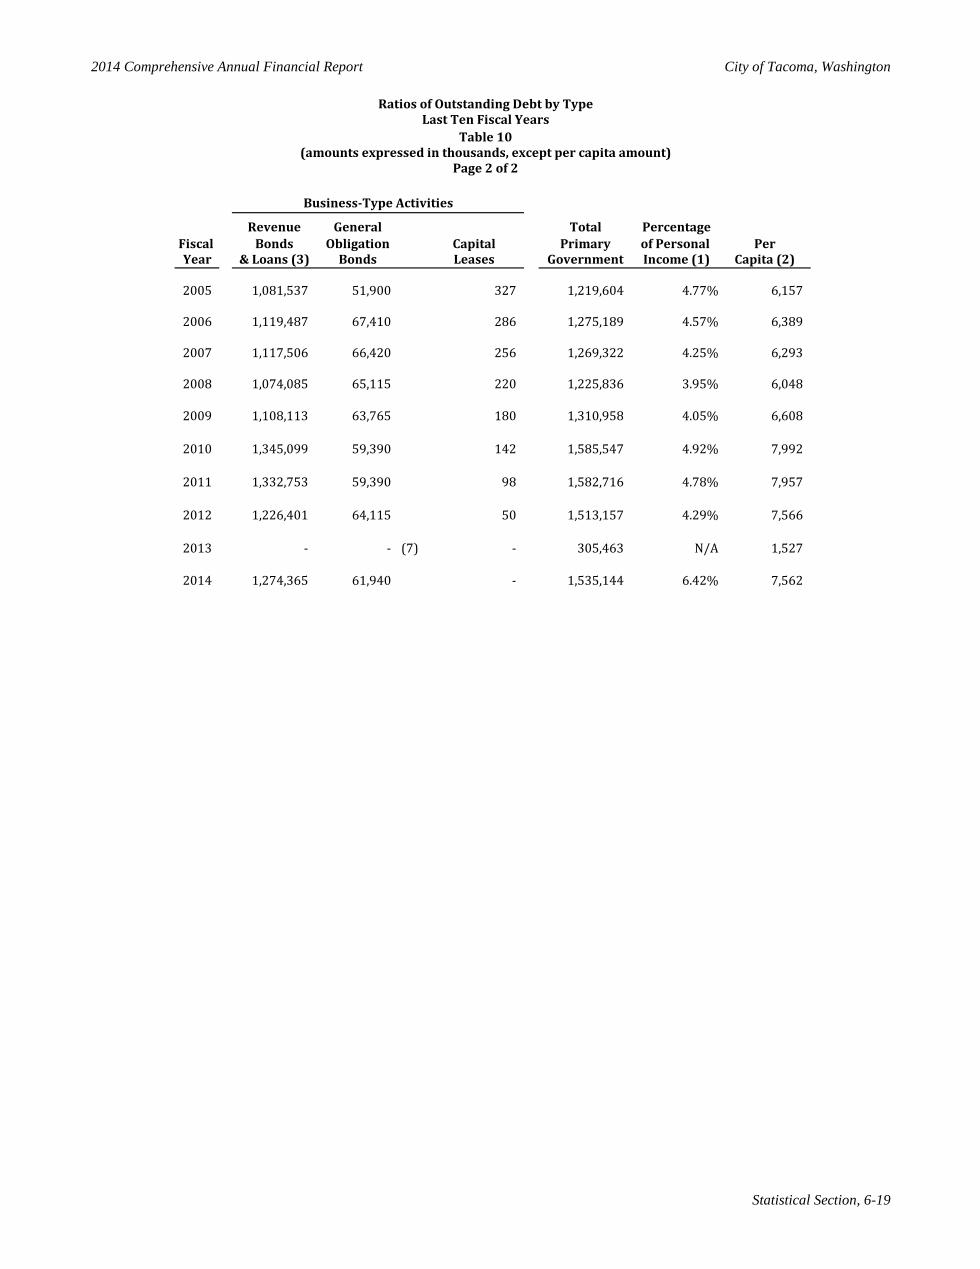
2014 Comprehensive Annual Financial Report City of Tacoma, Washington
Statistical Section, 6-19
Revenue General Total PercentageFiscal Bonds Obligation Capital Primary of Personal Per Year & Loans (3) Bonds Leases Government Income (1) Capita (2)
2005 1,081,537 51,900 327 1,219,604 4.77% 6,157
2006 1,119,487 67,410 286 1,275,189 4.57% 6,389
2007 1,117,506 66,420 256 1,269,322 4.25% 6,293
2008 1,074,085 65,115 220 1,225,836 3.95% 6,048
2009 1,108,113 63,765 180 1,310,958 4.05% 6,608
2010 1,345,099 59,390 142 1,585,547 4.92% 7,992
2011 1,332,753 59,390 98 1,582,716 4.78% 7,957
2012 1,226,401 64,115 50 1,513,157 4.29% 7,566
2013 - - (7) - 305,463 N/A 1,527
2014 1,274,365 61,940 - 1,535,144 6.42% 7,562
Business-Type Activities
Ratios of Outstanding Debt by TypeLast Ten Fiscal Years
Table 10(amounts expressed in thousands, except per capita amount)
Page 2 of 2
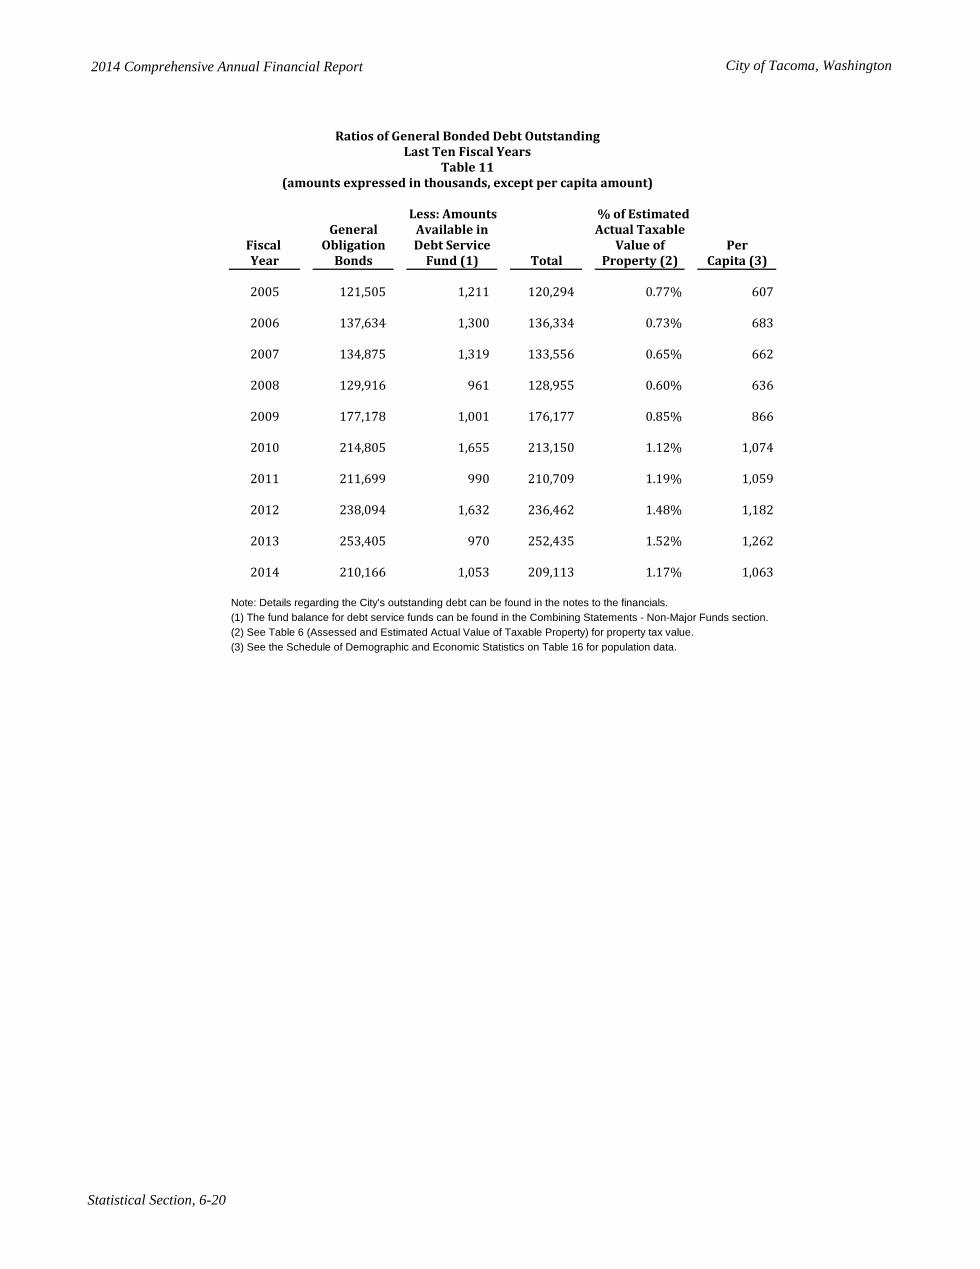
2014 Comprehensive Annual Financial Report City of Tacoma, Washington
Statistical Section, 6-20
Less: Amounts % of EstimatedGeneral Available in Actual Taxable
Fiscal Obligation Debt Service Value of PerYear Bonds Fund (1) Total Property (2) Capita (3)
2005 121,505 1,211 120,294 0.77% 607
2006 137,634 1,300 136,334 0.73% 683
2007 134,875 1,319 133,556 0.65% 662
2008 129,916 961 128,955 0.60% 636
2009 177,178 1,001 176,177 0.85% 866
2010 214,805 1,655 213,150 1.12% 1,074
2011 211,699 990 210,709 1.19% 1,059
2012 238,094 1,632 236,462 1.48% 1,182
2013 253,405 970 252,435 1.52% 1,262
2014 210,166 1,053 209,113 1.17% 1,063
Note: Details regarding the City's outstanding debt can be found in the notes to the financials.(1) The fund balance for debt service funds can be found in the Combining Statements - Non-Major Funds section. (2) See Table 6 (Assessed and Estimated Actual Value of Taxable Property) for property tax value.(3) See the Schedule of Demographic and Economic Statistics on Table 16 for population data.
Ratios of General Bonded Debt OutstandingLast Ten Fiscal Years
Table 11(amounts expressed in thousands, except per capita amount)
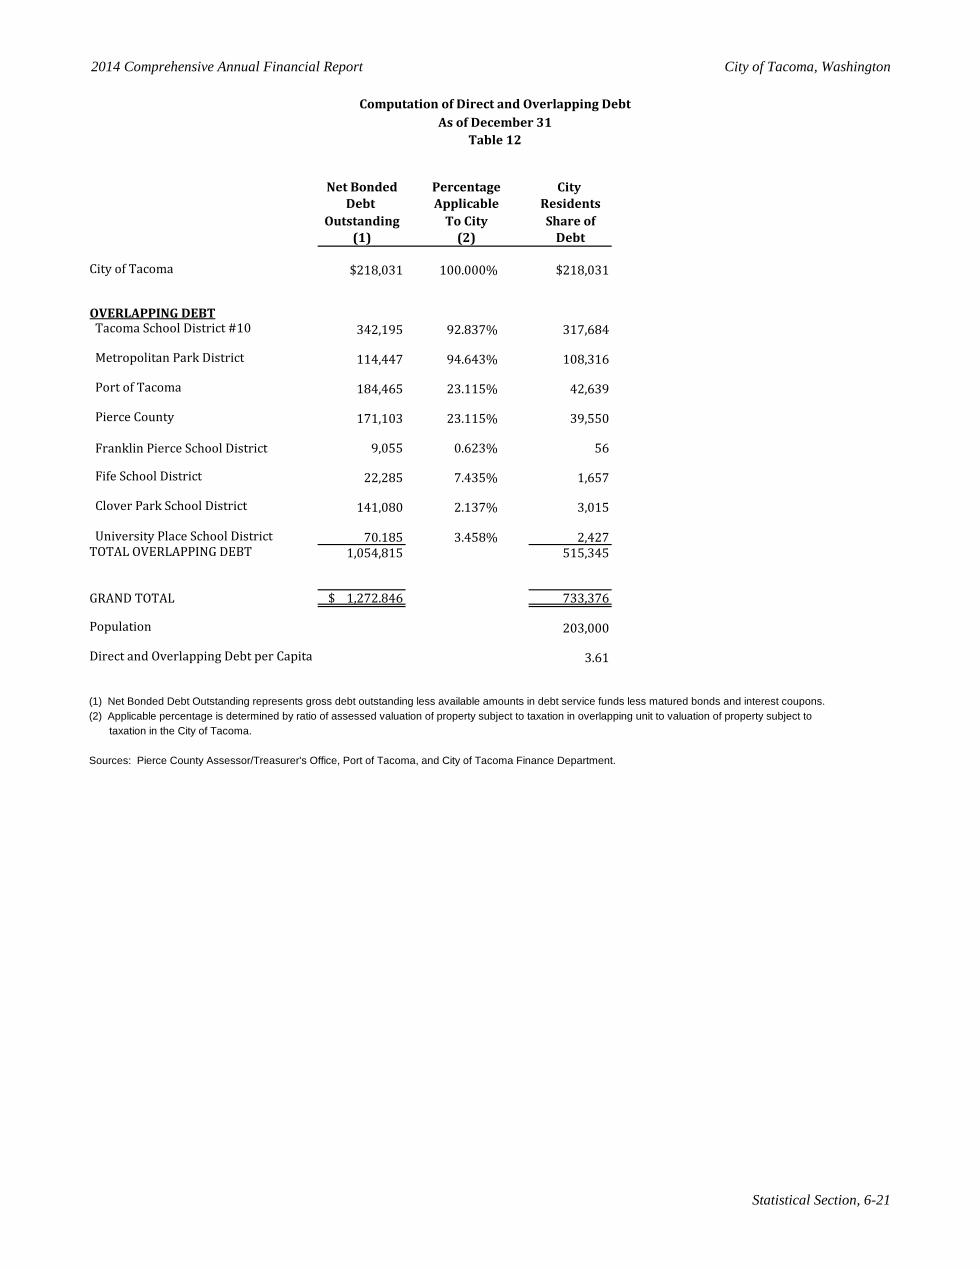
2014 Comprehensive Annual Financial Report City of Tacoma, Washington
Statistical Section, 6-21
Net Bonded Percentage City Debt Applicable Residents
Outstanding To City Share of(1) (2) Debt
City of Tacoma $218,031 100.000% $218,031
OVERLAPPING DEBT Tacoma School District #10 342,195 92.837% 317,684
Metropolitan Park District 114,447 94.643% 108,316
Port of Tacoma 184,465 23.115% 42,639
Pierce County 171,103 23.115% 39,550
Franklin Pierce School District 9,055 0.623% 56
Fife School District 22,285 7.435% 1,657
Clover Park School District 141,080 2.137% 3,015
University Place School District 70.185 3.458% 2,427TOTAL OVERLAPPING DEBT 1,054,815 515,345
GRAND TOTAL $ 1,272.846 733,376
Population 203,000
Direct and Overlapping Debt per Capita 3.61
(1) Net Bonded Debt Outstanding represents gross debt outstanding less available amounts in debt service funds less matured bonds and interest coupons.(2) Applicable percentage is determined by ratio of assessed valuation of property subject to taxation in overlapping unit to valuation of property subject to taxation in the City of Tacoma.
Sources: Pierce County Assessor/Treasurer's Office, Port of Tacoma, and City of Tacoma Finance Department.
Computation of Direct and Overlapping Debt
Table 12As of December 31
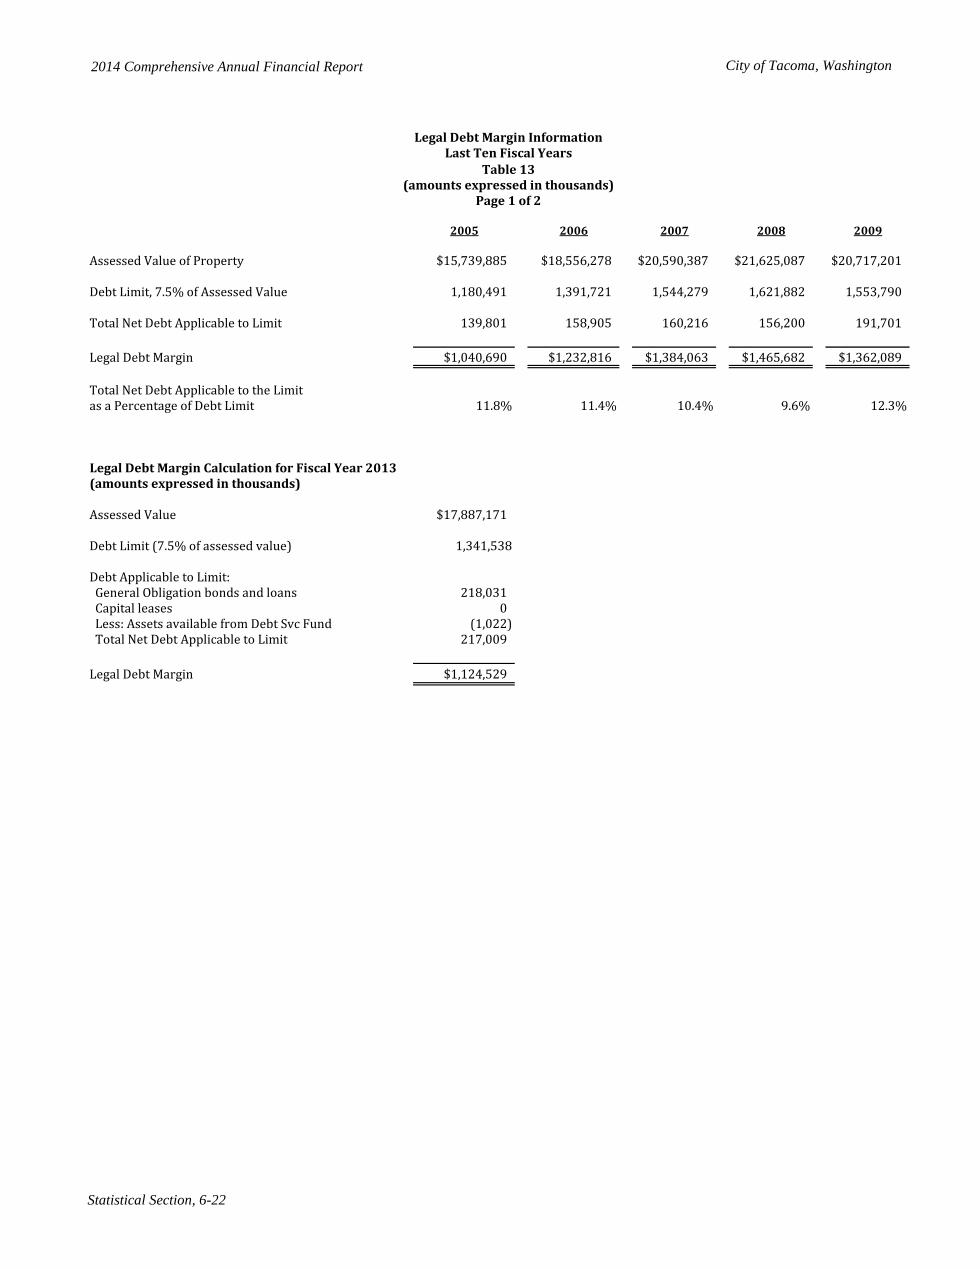
2014 Comprehensive Annual Financial Report City of Tacoma, Washington
Statistical Section, 6-22
2005 2006 2007 2008 2009
Assessed Value of Property $15,739,885 $18,556,278 $20,590,387 $21,625,087 $20,717,201
Debt Limit, 7.5% of Assessed Value 1,180,491 1,391,721 1,544,279 1,621,882 1,553,790
Total Net Debt Applicable to Limit 139,801 158,905 160,216 156,200 191,701
Legal Debt Margin $1,040,690 $1,232,816 $1,384,063 $1,465,682 $1,362,089
Total Net Debt Applicable to the Limitas a Percentage of Debt Limit 11.8% 11.4% 10.4% 9.6% 12.3%
Legal Debt Margin Calculation for Fiscal Year 2013(amounts expressed in thousands)
Assessed Value $17,887,171
Debt Limit (7.5% of assessed value) 1,341,538
Debt Applicable to Limit: General Obligation bonds and loans 218,031 Capital leases 0 Less: Assets available from Debt Svc Fund (1,022) Total Net Debt Applicable to Limit 217,009
Legal Debt Margin $1,124,529
Legal Debt Margin InformationLast Ten Fiscal Years
Table 13(amounts expressed in thousands)
Page 1 of 2
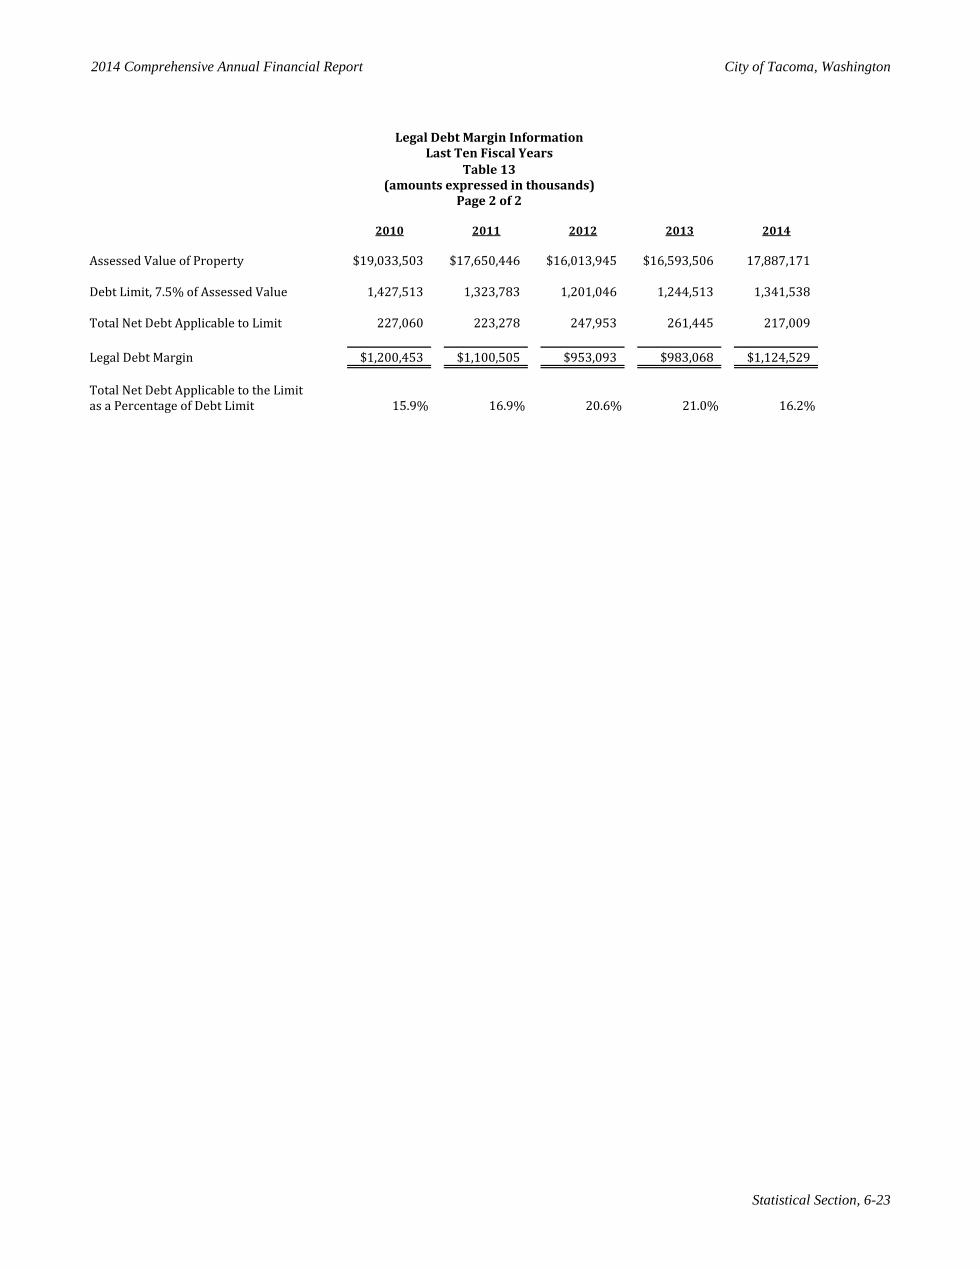
2014 Comprehensive Annual Financial Report City of Tacoma, Washington
Statistical Section, 6-23
2010 2011 2012 2013 2014
Assessed Value of Property $19,033,503 $17,650,446 $16,013,945 $16,593,506 17,887,171
Debt Limit, 7.5% of Assessed Value 1,427,513 1,323,783 1,201,046 1,244,513 1,341,538
Total Net Debt Applicable to Limit 227,060 223,278 247,953 261,445 217,009
Legal Debt Margin $1,200,453 $1,100,505 $953,093 $983,068 $1,124,529
Total Net Debt Applicable to the Limitas a Percentage of Debt Limit 15.9% 16.9% 20.6% 21.0% 16.2%
Last Ten Fiscal YearsTable 13
(amounts expressed in thousands)Page 2 of 2
Legal Debt Margin Information
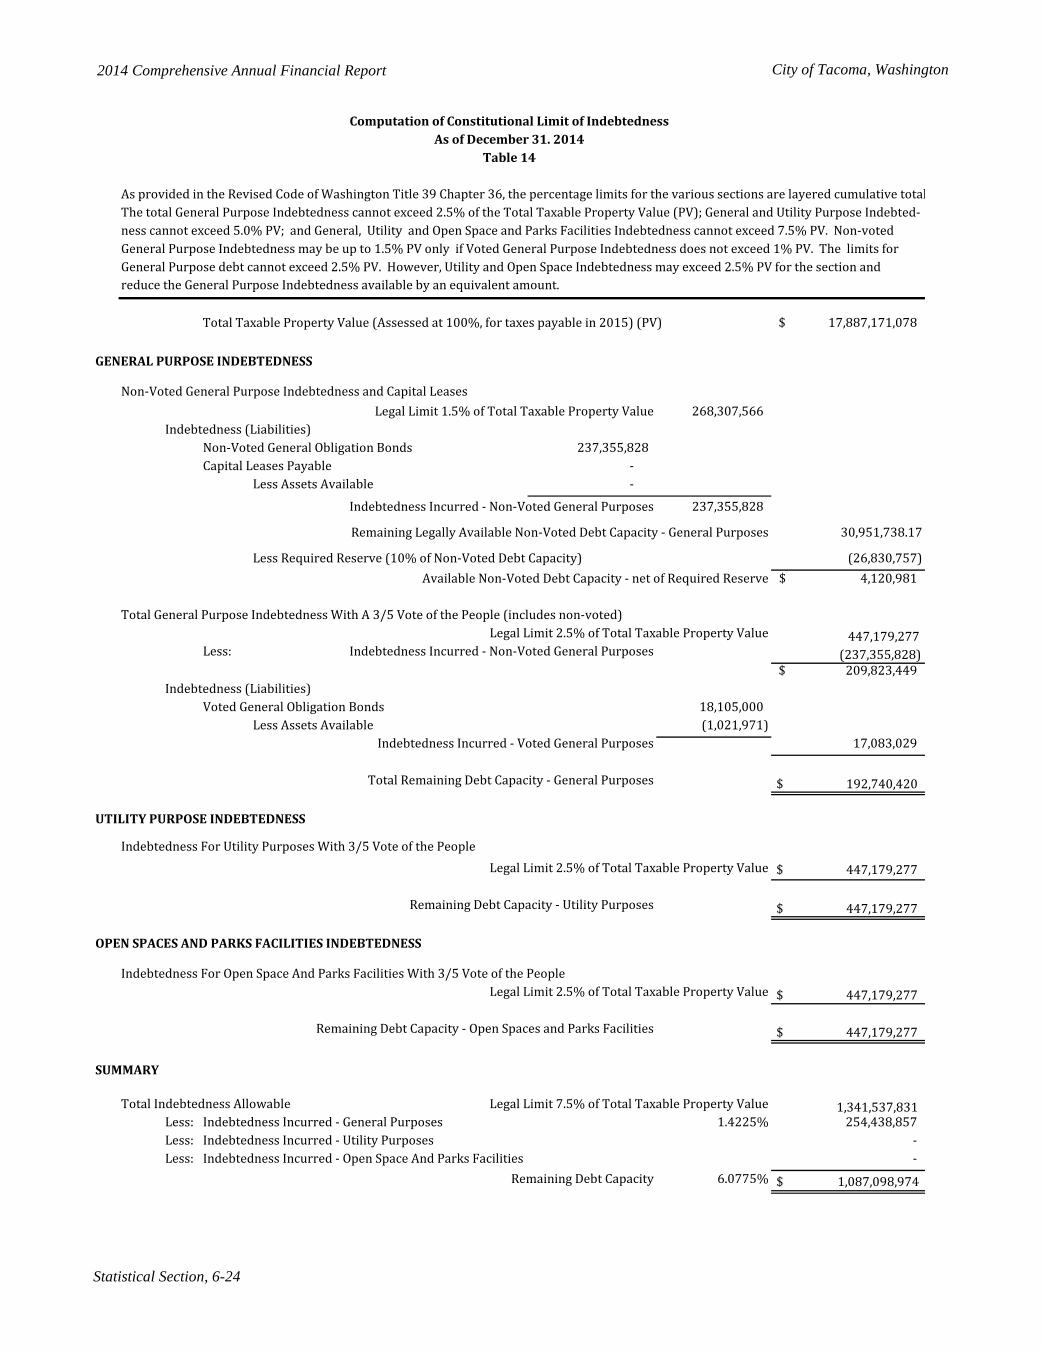
2014 Comprehensive Annual Financial Report City of Tacoma, Washington
Statistical Section, 6-24
As provided in the Revised Code of Washington Title 39 Chapter 36, the percentage limits for the various sections are layered cumulative total The total General Purpose Indebtedness cannot exceed 2.5% of the Total Taxable Property Value (PV); General and Utility Purpose Indebted- ness cannot exceed 5.0% PV; and General, Utility and Open Space and Parks Facilities Indebtedness cannot exceed 7.5% PV. Non-voted General Purpose Indebtedness may be up to 1.5% PV only if Voted General Purpose Indebtedness does not exceed 1% PV. The limits for General Purpose debt cannot exceed 2.5% PV. However, Utility and Open Space Indebtedness may exceed 2.5% PV for the section and reduce the General Purpose Indebtedness available by an equivalent amount.
17,887,171,078$
GENERAL PURPOSE INDEBTEDNESS
Non-Voted General Purpose Indebtedness and Capital LeasesLegal Limit 1.5% of Total Taxable Property Value 268,307,566
Indebtedness (Liabilities)Non-Voted General Obligation Bonds 237,355,828Capital Leases Payable -
Less Assets Available -
Indebtedness Incurred - Non-Voted General Purposes 237,355,828
Remaining Legally Available Non-Voted Debt Capacity - General Purposes 30,951,738.17
Less Required Reserve (10% of Non-Voted Debt Capacity) (26,830,757) Available Non-Voted Debt Capacity - net of Required Reserve 4,120,981$
Total General Purpose Indebtedness With A 3/5 Vote of the People (includes non-voted) Legal Limit 2.5% of Total Taxable Property Value 447,179,277
Less: Indebtedness Incurred - Non-Voted General Purposes (237,355,828)209,823,449$
Indebtedness (Liabilities)Voted General Obligation Bonds 18,105,000
Less Assets Available (1,021,971)Indebtedness Incurred - Voted General Purposes 17,083,029
Total Remaining Debt Capacity - General Purposes $ 192,740,420
UTILITY PURPOSE INDEBTEDNESS
Indebtedness For Utility Purposes With 3/5 Vote of the People Legal Limit 2.5% of Total Taxable Property Value $ 447,179,277
Remaining Debt Capacity - Utility Purposes $ 447,179,277
OPEN SPACES AND PARKS FACILITIES INDEBTEDNESS
Indebtedness For Open Space And Parks Facilities With 3/5 Vote of the People Legal Limit 2.5% of Total Taxable Property Value $ 447,179,277
Remaining Debt Capacity - Open Spaces and Parks Facilities $ 447,179,277
SUMMARY
Total Indebtedness Allowable Legal Limit 7.5% of Total Taxable Property Value 1,341,537,831 Less: Indebtedness Incurred - General Purposes 1.4225% 254,438,857Less: Indebtedness Incurred - Utility Purposes - Less: Indebtedness Incurred - Open Space And Parks Facilities -
Remaining Debt Capacity 6.0775% $ 1,087,098,974
Total Taxable Property Value (Assessed at 100%, for taxes payable in 2015) (PV)
Computation of Constitutional Limit of IndebtednessAs of December 31. 2014
Table 14

THIS PAGE LEFT INTENTIONALLY BLANK
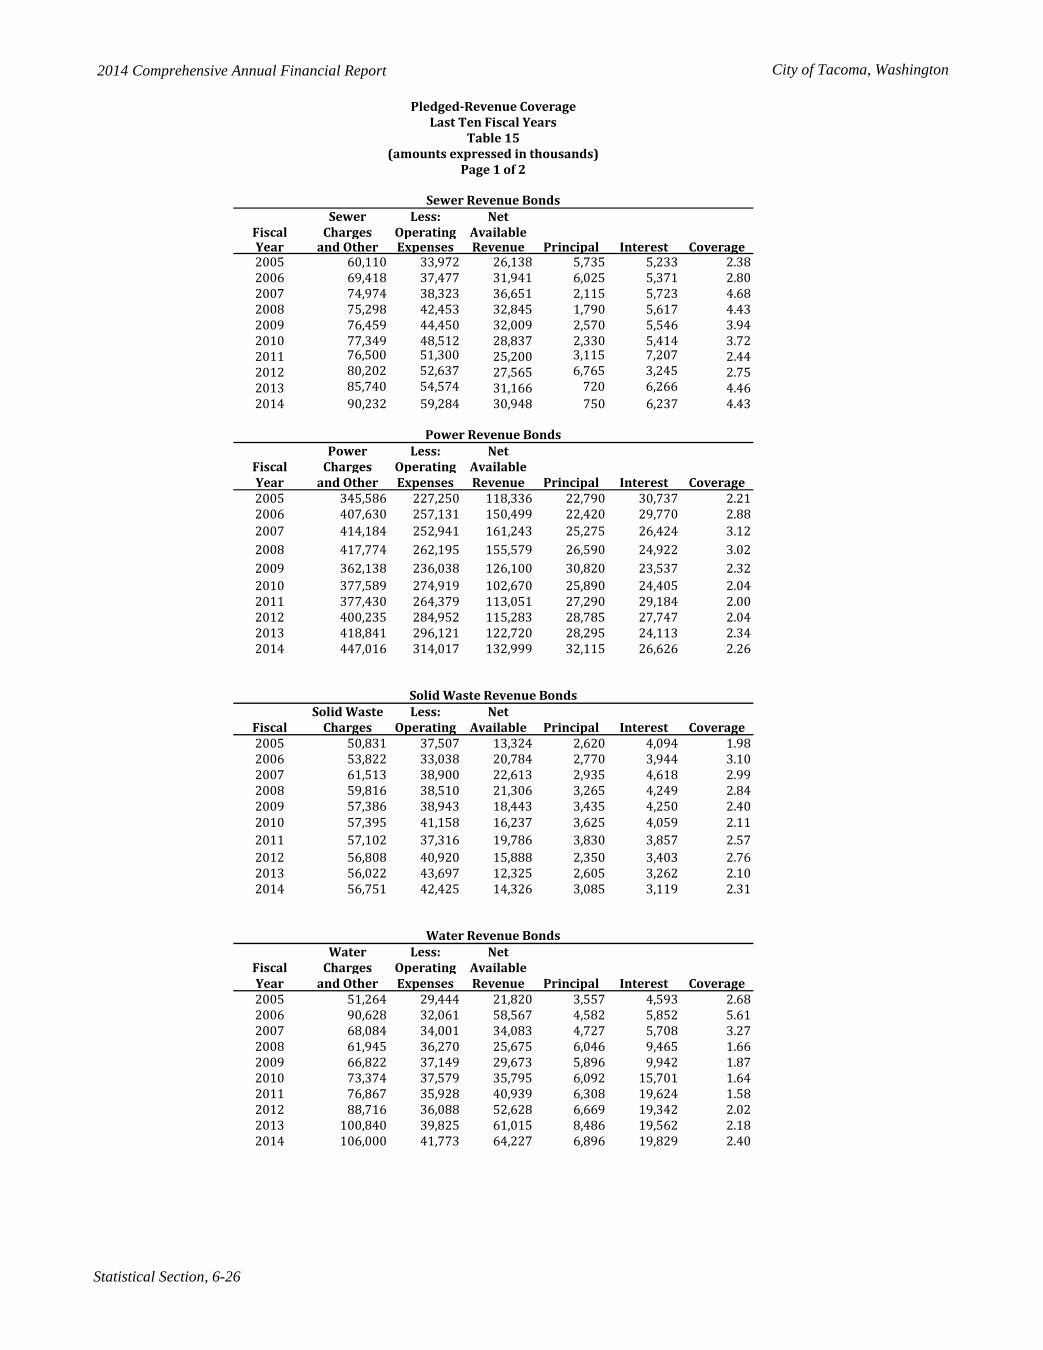
2014 Comprehensive Annual Financial Report City of Tacoma, Washington
Statistical Section, 6-26
Sewer Less: Net Fiscal Charges Operating AvailableYear and Other Expenses Revenue Principal Interest Coverage2005 60,110 33,972 26,138 5,735 5,233 2.382006 69,418 37,477 31,941 6,025 5,371 2.802007 74,974 38,323 36,651 2,115 5,723 4.682008 75,298 42,453 32,845 1,790 5,617 4.432009 76,459 44,450 32,009 2,570 5,546 3.942010 77,349 48,512 28,837 2,330 5,414 3.722011 76,500 51,300 25,200 3,115 7,207 2.442012 80,202 52,637 27,565 6,765 3,245 2.752013 85,740 54,574 31,166 720 6,266 4.462014 90,232 59,284 30,948 750 6,237 4.43
Power Less: Net Fiscal Charges Operating AvailableYear and Other Expenses Revenue Principal Interest Coverage2005 345,586 227,250 118,336 22,790 30,737 2.212006 407,630 257,131 150,499 22,420 29,770 2.882007 414,184 252,941 161,243 25,275 26,424 3.122008 417,774 262,195 155,579 26,590 24,922 3.022009 362,138 236,038 126,100 30,820 23,537 2.322010 377,589 274,919 102,670 25,890 24,405 2.042011 377,430 264,379 113,051 27,290 29,184 2.002012 400,235 284,952 115,283 28,785 27,747 2.042013 418,841 296,121 122,720 28,295 24,113 2.342014 447,016 314,017 132,999 32,115 26,626 2.26
Solid Waste Less: Net Fiscal Charges Operating Available Principal Interest Coverage2005 50,831 37,507 13,324 2,620 4,094 1.982006 53,822 33,038 20,784 2,770 3,944 3.102007 61,513 38,900 22,613 2,935 4,618 2.992008 59,816 38,510 21,306 3,265 4,249 2.842009 57,386 38,943 18,443 3,435 4,250 2.402010 57,395 41,158 16,237 3,625 4,059 2.112011 57,102 37,316 19,786 3,830 3,857 2.572012 56,808 40,920 15,888 2,350 3,403 2.762013 56,022 43,697 12,325 2,605 3,262 2.102014 56,751 42,425 14,326 3,085 3,119 2.31
Water Less: Net Fiscal Charges Operating AvailableYear and Other Expenses Revenue Principal Interest Coverage2005 51,264 29,444 21,820 3,557 4,593 2.682006 90,628 32,061 58,567 4,582 5,852 5.612007 68,084 34,001 34,083 4,727 5,708 3.272008 61,945 36,270 25,675 6,046 9,465 1.662009 66,822 37,149 29,673 5,896 9,942 1.872010 73,374 37,579 35,795 6,092 15,701 1.642011 76,867 35,928 40,939 6,308 19,624 1.582012 88,716 36,088 52,628 6,669 19,342 2.022013 100,840 39,825 61,015 8,486 19,562 2.182014 106,000 41,773 64,227 6,896 19,829 2.40
Water Revenue Bonds
Pledged-Revenue CoverageLast Ten Fiscal Years
Table 15(amounts expressed in thousands)
Page 1 of 2
Solid Waste Revenue Bonds
Power Revenue Bonds
Sewer Revenue Bonds
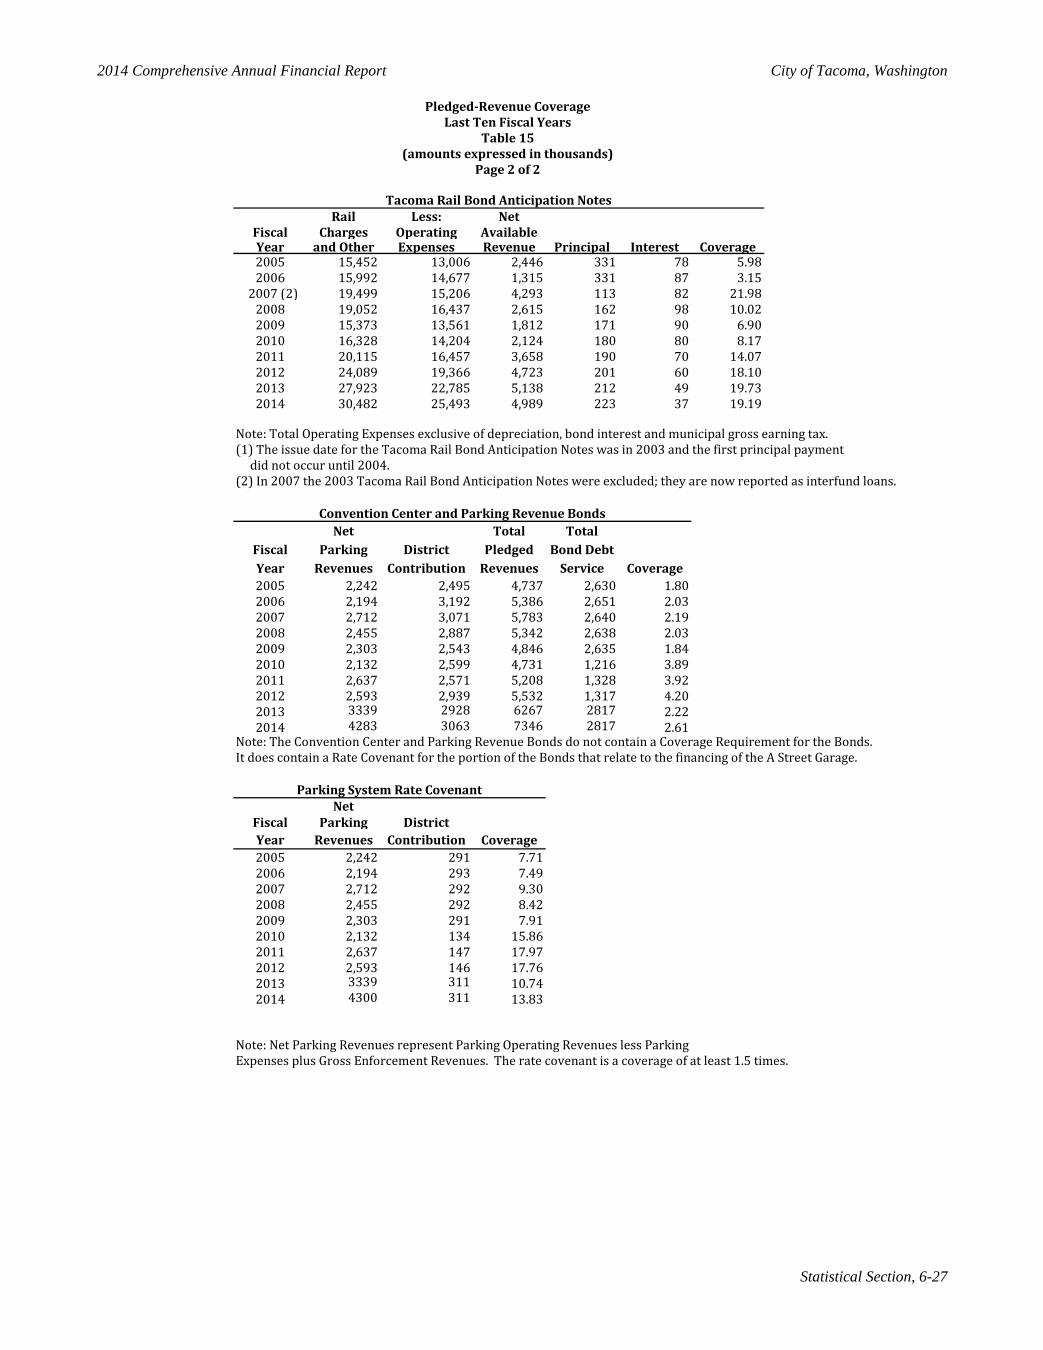
2014 Comprehensive Annual Financial Report City of Tacoma, Washington
Statistical Section, 6-27
Rail Less: Net Fiscal Charges Operating AvailableYear and Other Expenses Revenue Principal Interest Coverage2005 15,452 13,006 2,446 331 78 5.982006 15,992 14,677 1,315 331 87 3.15
'2007 (2) 19,499 15,206 4,293 113 82 21.982008 19,052 16,437 2,615 162 98 10.022009 15,373 13,561 1,812 171 90 6.902010 16,328 14,204 2,124 180 80 8.172011 20,115 16,457 3,658 190 70 14.072012 24,089 19,366 4,723 201 60 18.102013 27,923 22,785 5,138 212 49 19.732014 30,482 25,493 4,989 223 37 19.19
Note: Total Operating Expenses exclusive of depreciation, bond interest and municipal gross earning tax.(1) The issue date for the Tacoma Rail Bond Anticipation Notes was in 2003 and the first principal payment did not occur until 2004.(2) In 2007 the 2003 Tacoma Rail Bond Anticipation Notes were excluded; they are now reported as interfund loans.
Net Total TotalFiscal Parking District Pledged Bond DebtYear Revenues Contribution Revenues Service Coverage2005 2,242 2,495 4,737 2,630 1.802006 2,194 3,192 5,386 2,651 2.032007 2,712 3,071 5,783 2,640 2.192008 2,455 2,887 5,342 2,638 2.032009 2,303 2,543 4,846 2,635 1.842010 2,132 2,599 4,731 1,216 3.892011 2,637 2,571 5,208 1,328 3.922012 2,593 2,939 5,532 1,317 4.202013 3339 2928 6267 2817 2.222014 4283 3063 7346 2817 2.61
It does contain a Rate Covenant for the portion of the Bonds that relate to the financing of the A Street Garage.
Net Fiscal Parking DistrictYear Revenues Contribution Coverage2005 2,242 291 7.712006 2,194 293 7.492007 2,712 292 9.302008 2,455 292 8.422009 2,303 291 7.912010 2,132 134 15.862011 2,637 147 17.972012 2,593 146 17.762013 3339 311 10.742014 4300 311 13.83
Note: The Convention Center and Parking Revenue Bonds do not contain a Coverage Requirement for the Bonds.
Parking System Rate Covenant
Note: Net Parking Revenues represent Parking Operating Revenues less Parking Expenses plus Gross Enforcement Revenues. The rate covenant is a coverage of at least 1.5 times.
Pledged-Revenue CoverageLast Ten Fiscal Years
Table 15(amounts expressed in thousands)
Page 2 of 2
Tacoma Rail Bond Anticipation Notes
Convention Center and Parking Revenue Bonds
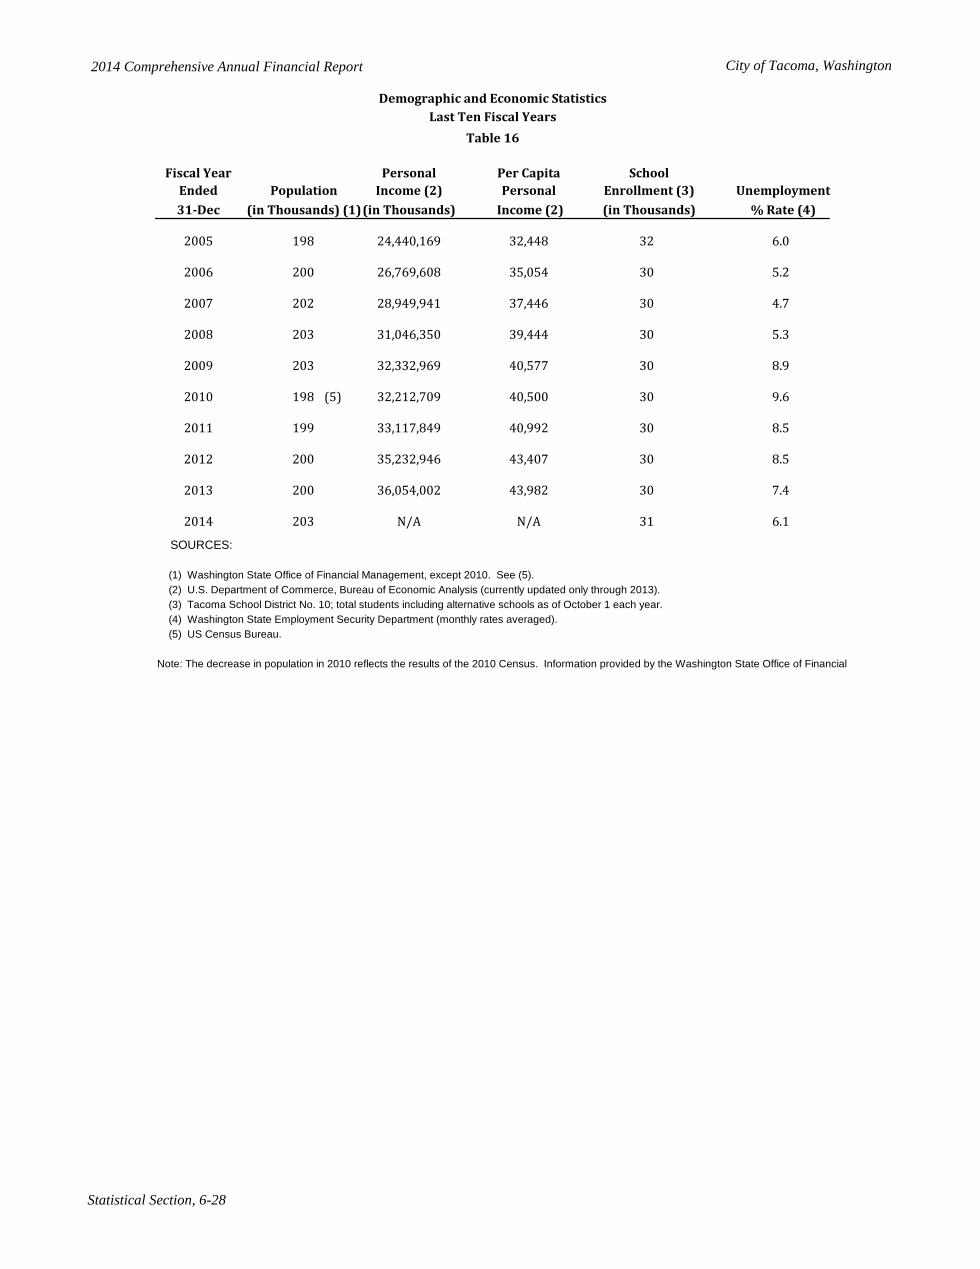
2014 Comprehensive Annual Financial Report City of Tacoma, Washington
Statistical Section, 6-28
Fiscal Year Personal Per Capita SchoolEnded Population Income (2) Personal Enrollment (3) Unemployment31-Dec (in Thousands) (1)(in Thousands) Income (2) (in Thousands) % Rate (4)
2005 198 24,440,169 32,448 32 6.0
2006 200 26,769,608 35,054 30 5.2
2007 202 28,949,941 37,446 30 4.7
2008 203 31,046,350 39,444 30 5.3
2009 203 32,332,969 40,577 30 8.9
2010 198 (5) 32,212,709 40,500 30 9.6
2011 199 33,117,849 40,992 30 8.5
2012 200 35,232,946 43,407 30 8.5
2013 200 36,054,002 43,982 30 7.4
2014 203 N/A N/A 31 6.1
SOURCES:
(1) Washington State Office of Financial Management, except 2010. See (5). (2) U.S. Department of Commerce, Bureau of Economic Analysis (currently updated only through 2013). (3) Tacoma School District No. 10; total students including alternative schools as of October 1 each year. (4) Washington State Employment Security Department (monthly rates averaged). (5) US Census Bureau.
Note: The decrease in population in 2010 reflects the results of the 2010 Census. Information provided by the Washington State Office of Financial
Demographic and Economic StatisticsLast Ten Fiscal Years
Table 16
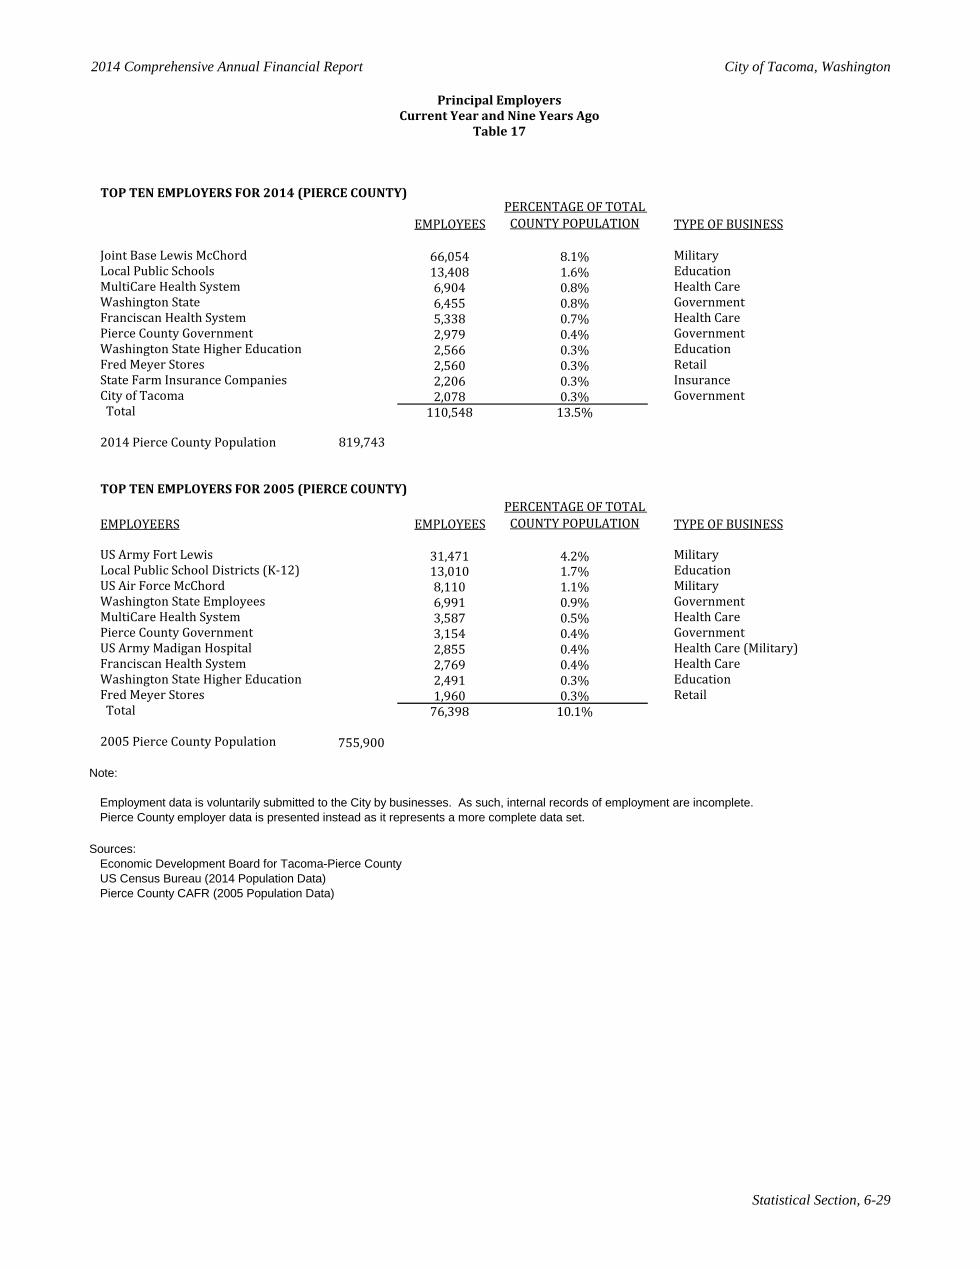
2014 Comprehensive Annual Financial Report City of Tacoma, Washington
Statistical Section, 6-29
TOP TEN EMPLOYERS FOR 2014 (PIERCE COUNTY)
EMPLOYEESPERCENTAGE OF TOTAL COUNTY POPULATION TYPE OF BUSINESS
Joint Base Lewis McChord 66,054 8.1% MilitaryLocal Public Schools 13,408 1.6% EducationMultiCare Health System 6,904 0.8% Health CareWashington State 6,455 0.8% GovernmentFranciscan Health System 5,338 0.7% Health CarePierce County Government 2,979 0.4% GovernmentWashington State Higher Education 2,566 0.3% EducationFred Meyer Stores 2,560 0.3% RetailState Farm Insurance Companies 2,206 0.3% InsuranceCity of Tacoma 2,078 0.3% Government Total 110,548 13.5%
2014 Pierce County Population 819,743
TOP TEN EMPLOYERS FOR 2005 (PIERCE COUNTY)
EMPLOYEERS EMPLOYEESPERCENTAGE OF TOTAL COUNTY POPULATION TYPE OF BUSINESS
US Army Fort Lewis 31,471 4.2% MilitaryLocal Public School Districts (K-12) 13,010 1.7% EducationUS Air Force McChord 8,110 1.1% MilitaryWashington State Employees 6,991 0.9% GovernmentMultiCare Health System 3,587 0.5% Health CarePierce County Government 3,154 0.4% GovernmentUS Army Madigan Hospital 2,855 0.4% Health Care (Military)Franciscan Health System 2,769 0.4% Health CareWashington State Higher Education 2,491 0.3% EducationFred Meyer Stores 1,960 0.3% Retail Total 76,398 10.1%
2005 Pierce County Population 755,900
Note:
Employment data is voluntarily submitted to the City by businesses. As such, internal records of employment are incomplete.Pierce County employer data is presented instead as it represents a more complete data set.
Sources:Economic Development Board for Tacoma-Pierce CountyUS Census Bureau (2014 Population Data)Pierce County CAFR (2005 Population Data)
Principal EmployersCurrent Year and Nine Years Ago
Table 17
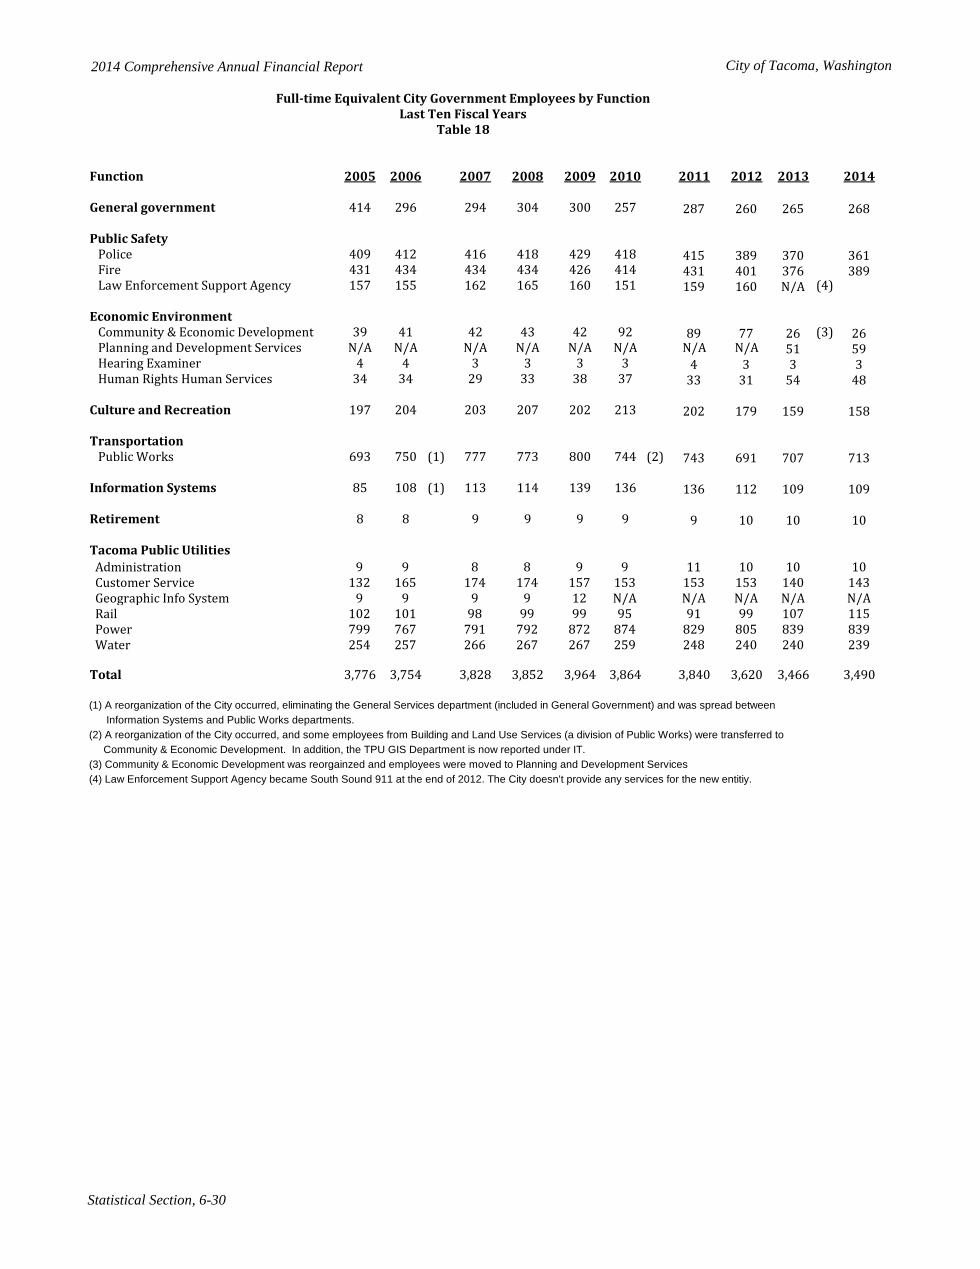
2014 Comprehensive Annual Financial Report City of Tacoma, Washington
Statistical Section, 6-30
Function 2005 2006 2007 2008 2009 2010 2011 2012 2013 2014
General government 414 296 294 304 300 257 287 260 265 268
Public Safety Police 409 412 416 418 429 418 415 389 370 361 Fire 431 434 434 434 426 414 431 401 376 389 Law Enforcement Support Agency 157 155 162 165 160 151 159 160 N/A (4)
Economic Environment Community & Economic Development 39 41 42 43 42 92 89 77 26 (3) 26 Planning and Development Services N/A N/A N/A N/A N/A N/A N/A N/A 51 59 Hearing Examiner 4 4 3 3 3 3 4 3 3 3 Human Rights Human Services 34 34 29 33 38 37 33 31 54 48
Culture and Recreation 197 204 203 207 202 213 202 179 159 158
Transportation Public Works 693 750 (1) 777 773 800 744 (2) 743 691 707 713
Information Systems 85 108 (1) 113 114 139 136 136 112 109 109
Retirement 8 8 9 9 9 9 9 10 10 10
Tacoma Public Utilities Administration 9 9 8 8 9 9 11 10 10 10 Customer Service 132 165 174 174 157 153 153 153 140 143 Geographic Info System 9 9 9 9 12 N/A N/A N/A N/A N/A Rail 102 101 98 99 99 95 91 99 107 115 Power 799 767 791 792 872 874 829 805 839 839 Water 254 257 266 267 267 259 248 240 240 239
Total 3,776 3,754 3,828 3,852 3,964 3,864 3,840 3,620 3,466 3,490
(1) A reorganization of the City occurred, eliminating the General Services department (included in General Government) and was spread between Information Systems and Public Works departments.(2) A reorganization of the City occurred, and some employees from Building and Land Use Services (a division of Public Works) were transferred to Community & Economic Development. In addition, the TPU GIS Department is now reported under IT.(3) Community & Economic Development was reorgainzed and employees were moved to Planning and Development Services(4) Law Enforcement Support Agency became South Sound 911 at the end of 2012. The City doesn't provide any services for the new entitiy.
Full-time Equivalent City Government Employees by FunctionLast Ten Fiscal Years
Table 18

THIS PAGE LEFT INTENTIONALLY BLANK
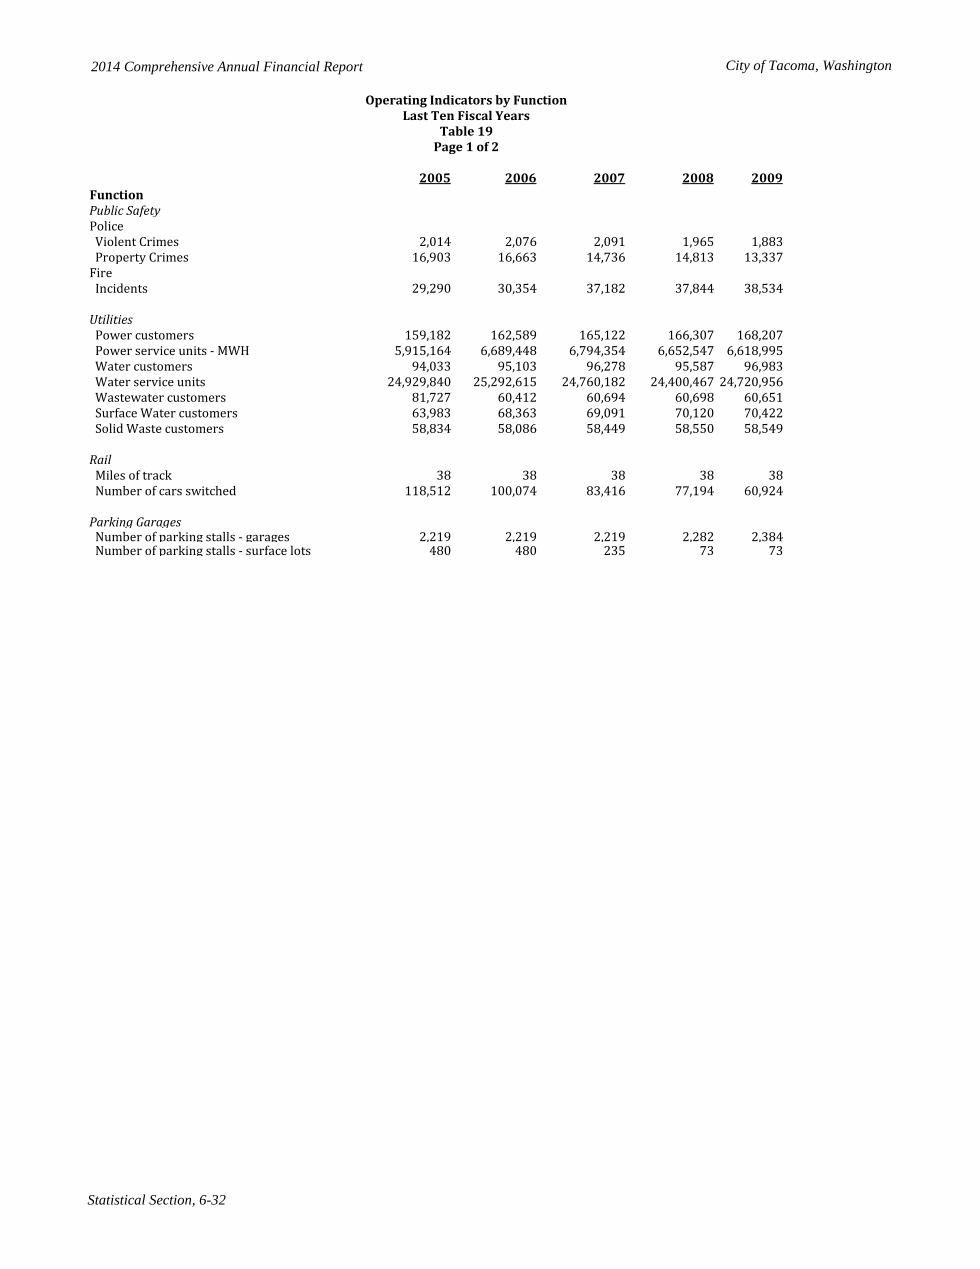
2014 Comprehensive Annual Financial Report City of Tacoma, Washington
Statistical Section, 6-32
2005 2006 2007 2008 2009FunctionPublic SafetyPolice Violent Crimes 2,014 2,076 2,091 1,965 1,883 Property Crimes 16,903 16,663 14,736 14,813 13,337Fire Incidents 29,290 30,354 37,182 37,844 38,534
Utilities Power customers 159,182 162,589 165,122 166,307 168,207 Power service units - MWH 5,915,164 6,689,448 6,794,354 6,652,547 6,618,995 Water customers 94,033 95,103 96,278 95,587 96,983 Water service units 24,929,840 25,292,615 24,760,182 24,400,467 24,720,956 Wastewater customers 81,727 60,412 60,694 60,698 60,651 Surface Water customers 63,983 68,363 69,091 70,120 70,422 Solid Waste customers 58,834 58,086 58,449 58,550 58,549 Rail Miles of track 38 38 38 38 38 Number of cars switched 118,512 100,074 83,416 77,194 60,924
Parking Garages Number of parking stalls - garages 2,219 2,219 2,219 2,282 2,384 Number of parking stalls - surface lots 480 480 235 73 73
Page 1 of 2
Operating Indicators by FunctionLast Ten Fiscal Years
Table 19
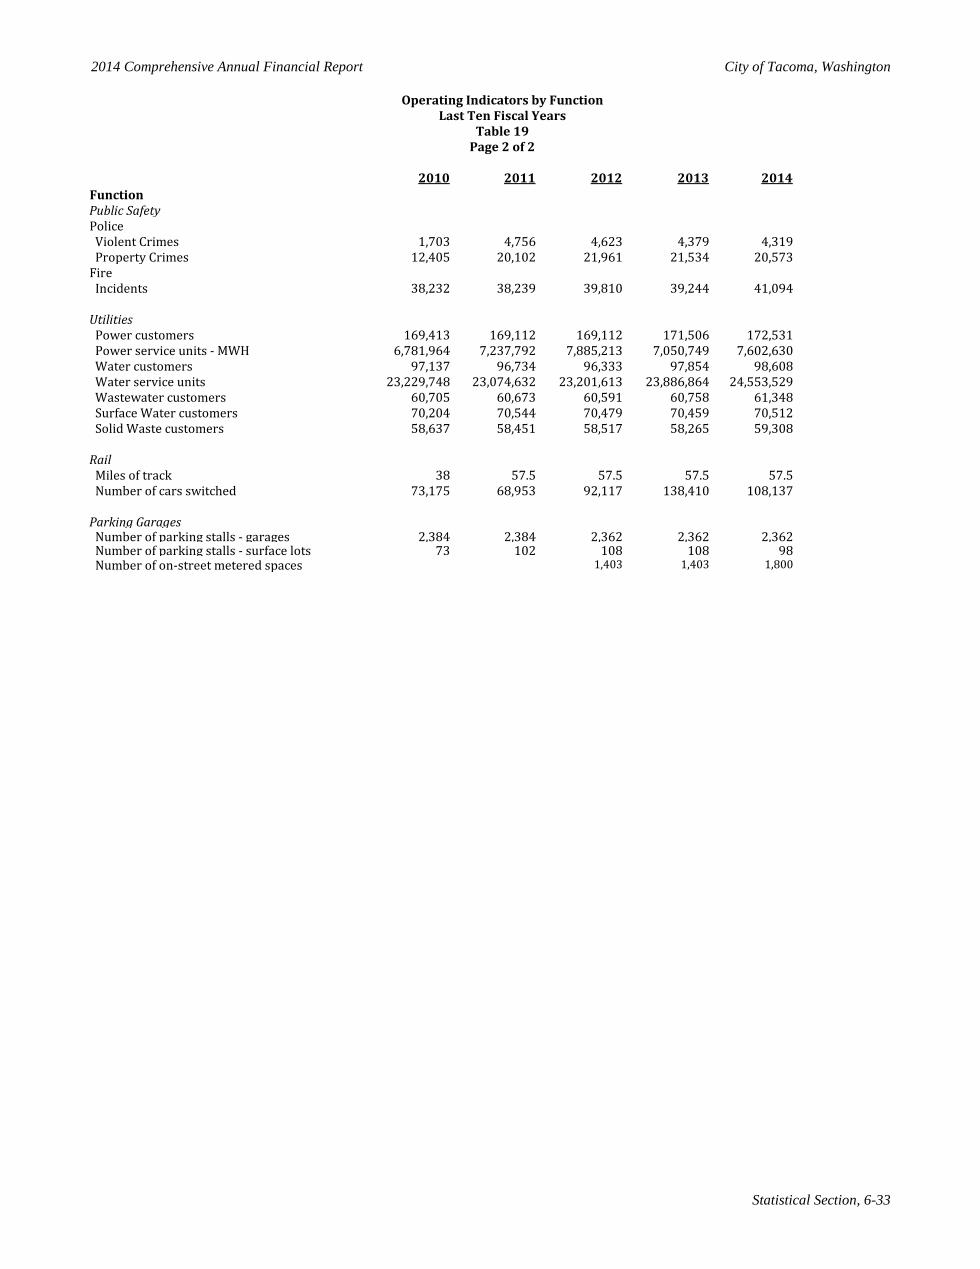
2014 Comprehensive Annual Financial Report City of Tacoma, Washington
Statistical Section, 6-33
2010 2011 2012 2013 2014FunctionPublic SafetyPolice Violent Crimes 1,703 4,756 4,623 4,379 4,319 Property Crimes 12,405 20,102 21,961 21,534 20,573Fire Incidents 38,232 38,239 39,810 39,244 41,094
Utilities Power customers 169,413 169,112 169,112 171,506 172,531 Power service units - MWH 6,781,964 7,237,792 7,885,213 7,050,749 7,602,630 Water customers 97,137 96,734 96,333 97,854 98,608 Water service units 23,229,748 23,074,632 23,201,613 23,886,864 24,553,529 Wastewater customers 60,705 60,673 60,591 60,758 61,348 Surface Water customers 70,204 70,544 70,479 70,459 70,512 Solid Waste customers 58,637 58,451 58,517 58,265 59,308 Rail Miles of track 38 57.5 57.5 57.5 57.5 Number of cars switched 73,175 68,953 92,117 138,410 108,137
Parking Garages Number of parking stalls - garages 2,384 2,384 2,362 2,362 2,362 Number of parking stalls - surface lots 73 102 108 108 98 Number of on-street metered spaces 1,403 1,403 1,800
Page 2 of 2
Operating Indicators by FunctionLast Ten Fiscal Years
Table 19
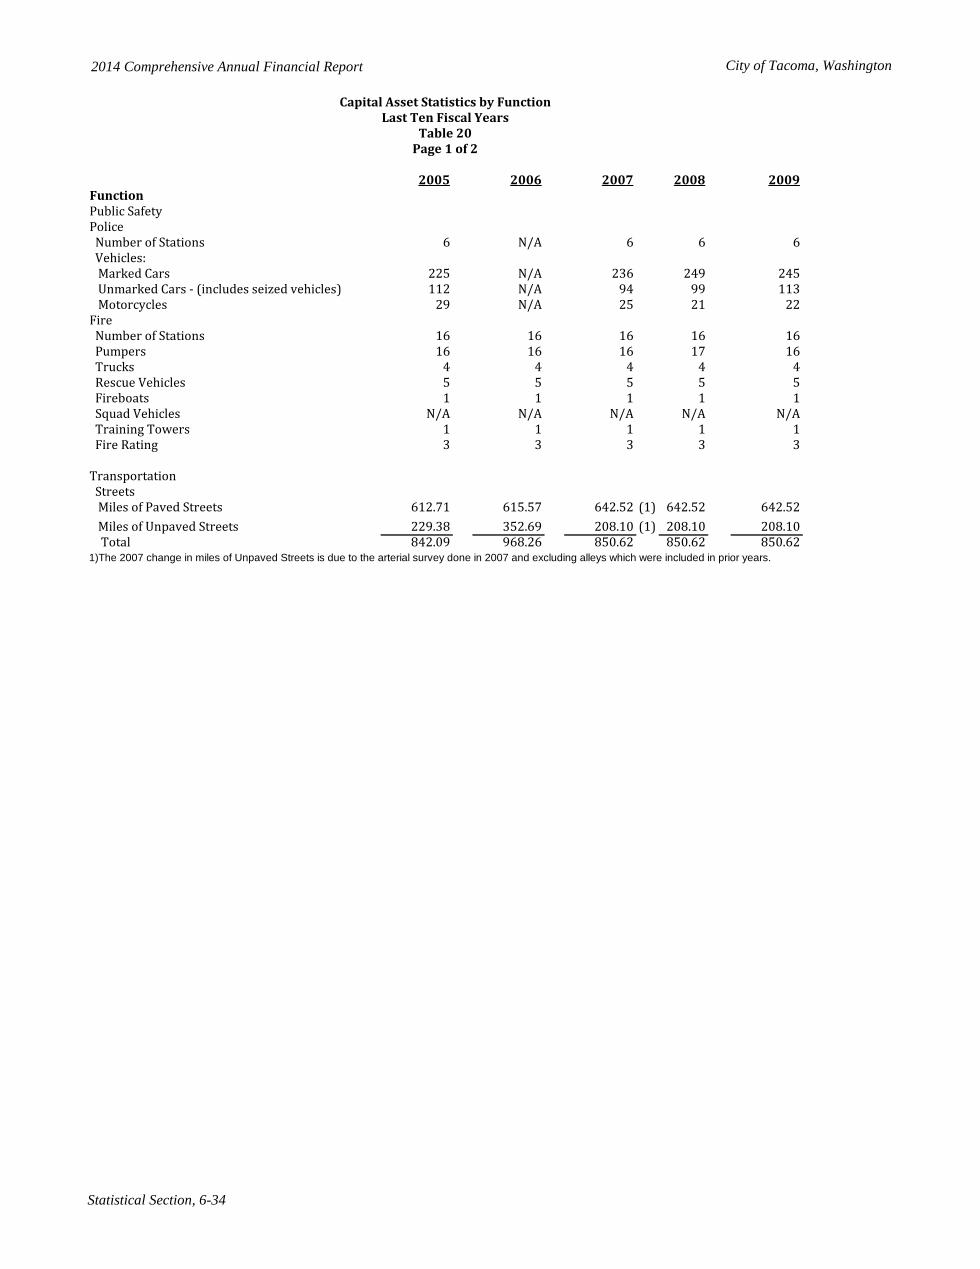
2014 Comprehensive Annual Financial Report City of Tacoma, Washington
Statistical Section, 6-34
2005 2006 2007 2008 2009FunctionPublic SafetyPolice Number of Stations 6 N/A 6 6 6 Vehicles: Marked Cars 225 N/A 236 249 245 Unmarked Cars - (includes seized vehicles) 112 N/A 94 99 113 Motorcycles 29 N/A 25 21 22Fire Number of Stations 16 16 16 16 16 Pumpers 16 16 16 17 16 Trucks 4 4 4 4 4 Rescue Vehicles 5 5 5 5 5 Fireboats 1 1 1 1 1 Squad Vehicles N/A N/A N/A N/A N/A Training Towers 1 1 1 1 1 Fire Rating 3 3 3 3 3
Transportation Streets Miles of Paved Streets 612.71 615.57 642.52 (1) 642.52 642.52 Miles of Unpaved Streets 229.38 352.69 208.10 (1) 208.10 208.10 Total 842.09 968.26 850.62 850.62 850.621)The 2007 change in miles of Unpaved Streets is due to the arterial survey done in 2007 and excluding alleys which were included in prior years.
Table 20Page 1 of 2
Capital Asset Statistics by FunctionLast Ten Fiscal Years
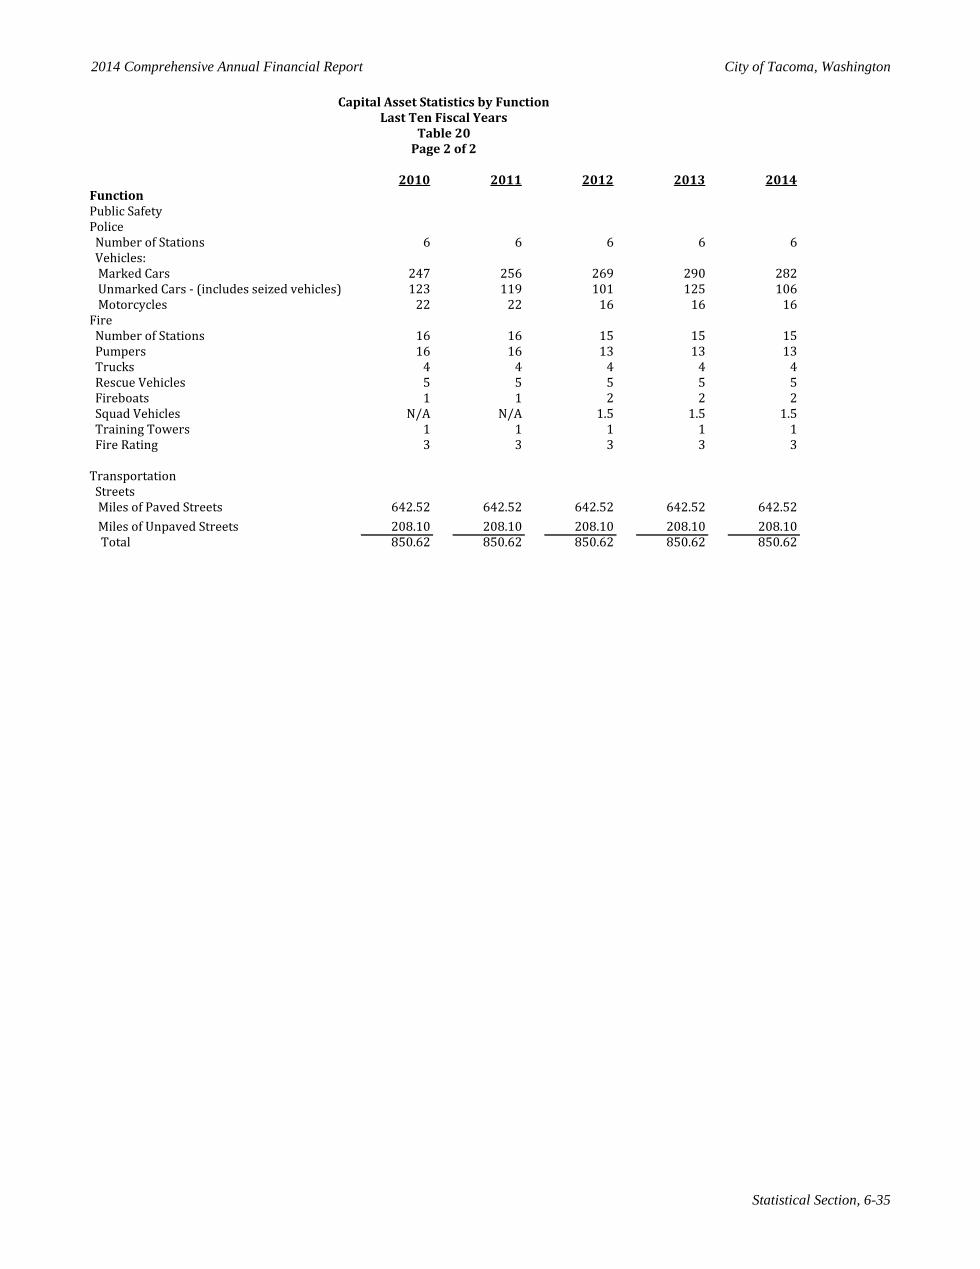
2014 Comprehensive Annual Financial Report City of Tacoma, Washington
Statistical Section, 6-35
2010 2011 2012 2013 2014FunctionPublic SafetyPolice Number of Stations 6 6 6 6 6 Vehicles: Marked Cars 247 256 269 290 282 Unmarked Cars - (includes seized vehicles) 123 119 101 125 106 Motorcycles 22 22 16 16 16Fire Number of Stations 16 16 15 15 15 Pumpers 16 16 13 13 13 Trucks 4 4 4 4 4 Rescue Vehicles 5 5 5 5 5 Fireboats 1 1 2 2 2 Squad Vehicles N/A N/A 1.5 1.5 1.5 Training Towers 1 1 1 1 1 Fire Rating 3 3 3 3 3
Transportation Streets Miles of Paved Streets 642.52 642.52 642.52 642.52 642.52 Miles of Unpaved Streets 208.10 208.10 208.10 208.10 208.10 Total 850.62 850.62 850.62 850.62 850.62
Capital Asset Statistics by FunctionLast Ten Fiscal Years
Table 20Page 2 of 2
2014 Comprehensive Annual Financial Report City of Tacoma, Washington
Statistical Section, 6-36
The following individuals contributed to the successful completion of the City of Tacoma's 2014 Comprehensive Annual Financial Report
COORDINATING AND SUPERVISORY STAFF GENERAL LEDGER
Andrew Cherullo, Finance Director Kathy AndersonSusan Ramirez, CPA, Assistant Finance Director Samuel BenscoterTeresa L. Sedmak, City Treasurer Susan CalhounLinda Parks, CPA, Senior Financial Manager John Ching, MBADouglas Swanson, Senior Financial Manager Min Soo ChunSally G. Cowan, MBA, Financial Manager Peggy DicksonGwen Herring, Financial Manager Trina Ealey, MBALisa Richardson, Financial Manager Eun Joo Ebenhoh, CPAMichael San Soucie, CPA, Financial Manager Jeff EdwardsSu Yi, Management Analyst III Clement GrayMary Mansperger, Senior Accountant LaVon HallMin Soo Chun, Accountant Sheri HayesJoel Sipes, Accountant Robyn Hovies
Kimberly JacksonSTATISTICAL SECTION Diana Kerin-Tate
Mary ManspergerJoel Sipes, Accountant Imelda MarquezDonna Ruby, Financial Assistant Catherine Marx
Linh NguyenLouis Nguyen, MBA
DESIGN AND LAYOUT Dorothy RussElizabeth San Juan
Angela McGeachy, Graphic Arts Specialist Dave ScottEmilee SibbettJoel Sipes
PRINTING Michele TuongCarinne Woodfolk
City of Tacoma Su YiGraphic Services Division
IMAGES
Cover photographs courtesy of Rob McNair-Huff
Contributing StaffTable 21