Embed Size (px)
Citation preview

2014 CAASPPInterpreting and Using
Results
September 2014
Webcast

Objectives
Workshop participants will be able to:• Describe the purposes of CAASPP reports• Interpret CAASPP results• Explain key statistics• Compare and contrast types of reports• Identify proper uses of reports
2014 Post-Test Workshop 2

• What’s New?• Results and Statistical Analysis• Using Results• Summary and Internet Reports• Data CDs• Individual Student Reports• Early Assessment Program
Agenda
2014 Post-Test Workshop 3

• Results are available for only those California Assessment of Student Performance and Progress (CAASPP) content areas administered.
• Results for the Early Assessment Program (EAP) for students in grade eleven who took these tests are not reported by the CAASPP Program.
• Percent tested data are not reported for the Standards-based Tests in Spanish (STS).
• Enrollment data—number and percentage—are not reported for the STS.
Post-Test Guide (PTG) 2–3
What’s New in 2014
2014 Post-Test Workshop 4

2014 Post-Test Workshop 5
• Since there were no CAASPP end-of-course (EOC) tests administered, there is no Student Master List Summary EOC report.
• Electronic reporting, formerly Quick-turnaround Reporting, is now offered for all remaining paper-pencil tests. Files have been available since August 8.– EAP results are part of electronic reporting.
• Handscoring of tests is not offered in 2014.
PTG 2–3
What’s New in 2014

• Report progress toward proficiency on the state’s academic content standards
• Notify where improvement needed– To help students’ achievement– To improve educational programs
Results: Purposes of CAASPP Reports
PTG 42014 Post-Test Workshop 6

• State goal: All students score at proficient or above
• 350 or higher scale score– CST for Science – CMA For Science – STS for RLA
• CAPA proficient: 35 or higher scale score
Results: Performance Levels
PTG 7–132014 Post-Test Workshop 7

• Advanced• Basic cut score
– CST for Science: 300 – CMA for Science: 300– STS for RLA: 300– CAPA: 30
• Below basic• Far below basic• For each testing program, cut points
vary for advanced and below basic by – Subject– Grade
Results: Other Performance Levels
2014 Post-Test Workshop 8
PTG 7 –13;Appendix B
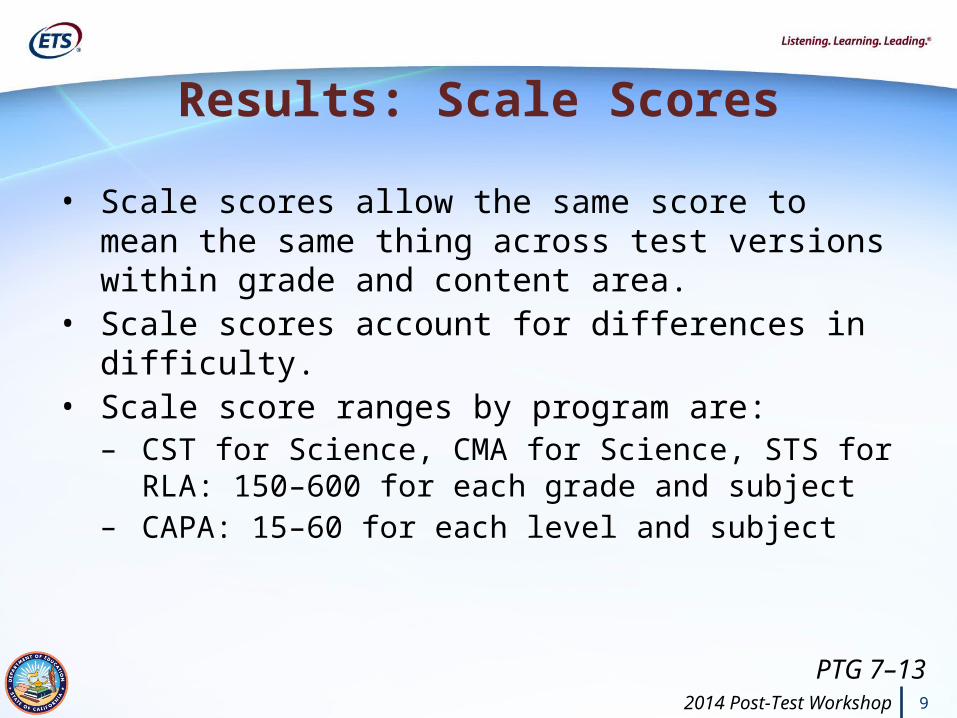
• Scale scores allow the same score to mean the same thing across test versions within grade and content area.
• Scale scores account for differences in difficulty.• Scale score ranges by program are:
– CST for Science, CMA for Science, STS for RLA: 150–600 for each grade and subject
– CAPA: 15–60 for each level and subject
PTG 7–132014 Post-Test Workshop 9
Results: Scale Scores

2014 Post-Test Workshop 10
• Psychometric procedure • Adjusts for test difficulty from year to year (form
to form)• Additional information in the technical reports
on the CDE Technical Reports and Studies Web page at http://www.cde.ca.gov/ta/tg/sr/technicalrpts.asp
Results: Equating
PTG 7

• Three to six clusters for each subject.
• May be useful as indicators of individual or group strengths and weaknesses.
• But. . . reporting clusters should be interpreted with caution.
Results: Reporting Clusters (Content Area)
PTG 8–13;Appendix A
2014 Post-Test Workshop 11

• Cluster percent correct available for CSTs for Science, CMA for Science, STS for RLA.
• Clusters are based on small numbers of items; therefore, may not be reliable or generalized.
• Clusters are NOT equated from year to year.• You should not compare reporting cluster
percent correct from year to year.
Results: Reporting ClustersCautions
PTG 8–13;Appendix A
2014 Post-Test Workshop 12

• Compare to percent-correct range of proficient students statewide
PTG 8–13;Appendix A
2014 Post-Test Workshop 13
Interpreting Reporting Clusters or Content Areas in the Same Year
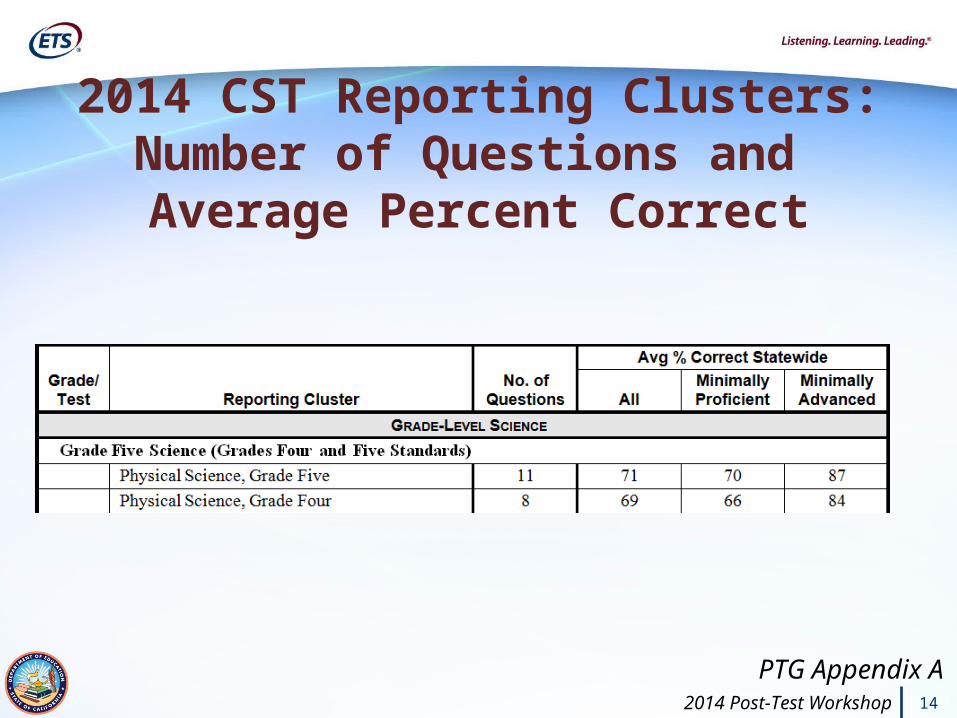
2014 CST Reporting Clusters:Number of Questions and Average Percent Correct
PTG Appendix A142014 Post-Test Workshop

Examples—Interpreting Reporting Clusters for the CST for Science
PTG 92014 Post-Test Workshop 15

• For instructional decisions in conjunction with other data
• CAPA ELA and mathematics in grade ten used in adequate yearly progress (AYP) calculations
Using Results
PTG 2, 42014 Post-Test Workshop 16

• Mean scale score – Same content and grade, varying years
• Percent in each performance level– Same content by grade across years
Year-to-Year ComparisonsDo Compare CSTs: Same Grade
and Same Content Area
PTG 10–132014 Post-Test Workshop 17

• Percentage of students scoring at PROFICIENT and above
– For a given grade and subject, e.g., percent proficient and above for grade 5 science in 2013 and 2014
– For a given subject and aggregated grades, e.g., percent proficient and above for grades 5, 8, and 10 science in 2013 and 2014
– Across grades and a subject, e.g., percent proficient and above in all courses and all grades
Year-to-Year ComparisonsDo Compare CSTs: Percent Proficient and Advanced
PTG 10–132014 Post-Test Workshop 18

• Individual scale scores or statistics based on scale scores for different grades or content areas– Subjects by grade are independently scaled – Different content standards are measured in different
grades• Cohorts across grades• Across tests• Scale scores to percent correct scores • CAPA to years prior to 2009, because of new standard
setting that year
Year-to-Year ComparisonsDon’t Compare
PTG 10–132014 Post-Test Workshop 19

2014 Post-Test Workshop 20
Example—Using CST Results to Compare Grade Results from Year to
Year
PTG 10202014 Post-Test Workshop

• What are they?– Student Master List Summary– Subgroup Summary
• Report emphasis: CSTs for Science – Criterion-referenced tests– Progress is measured in percent of students scoring
proficient and advanced• Back of reports provides guide to abbreviations
and score codes
Aggregate (Summary) Reports
PTG 16–392014 Post-Test Workshop 21

• Tests are as follows:– CSTs, CMA for Science: Grades 5, 8, and 10– CAPA for ELA and Mathematics: Grades 2–11; Levels I–V– CAPA for Science: Grades 5, 8, and 10; Level I, III–V– STS for RLA: Grades 2–11
• # and % at each performance level• Mean scale score• Reporting cluster: Mean percent correct (except CAPA)
Student Master List Summary
PTG 16–18;PTG 22–25
2014 Post-Test Workshop 22

Grade 5 Example
Student Master List Summary
PTG 252014 Post-Test Workshop 23

Student Master List SummaryBasic Statistics
PTG 23–25 2014 Post-Test Workshop 24

• For the content area:– Number of multiple-choice answer documents
submitted minus the number of answer documents marked to indicate that the student enrolled after the first day and was subsequently testedminus
– Documents marked as “Student enrolled after the first day of testing and was given this test”
• Does not apply to the STS
Who Counts? Number Enrolled
PTG 22–25252014 Post-Test Workshop

• For the content area, number of students who responded to any questions on the test or whose answer documents were marked to indicate that the student tested but marked no answers (special condition Z).
• Not included:– A = Students absent– E = Not tested due to significant medical emergency– P = Parent/guardian exemptions– T = Enrolled first day, not tested, tested at previous
school– Students with inconsistent grades– Non–English learners who took the STS
Who Counts? Number Tested
PTG 22–252014 Post-Test Workshop 26

• Number Valid Scores– For the subject, number of students tested at grade level who
received a score for the test.– Not included:
Incomplete tests Modified tests Non–English learners who took the STS Inconsistent grades
• Percent Valid Scores– For the subject, number of valid scores divided by the number of
students tested.
Who Counts? Number and Percent Valid Scores
PTG 24–252014 Post-Test Workshop 27

• All tests taken, including those taken with modifications, that result in a score
• Not included:– Incomplete tests– Non–English learners who took the STS– Inconsistent grades
Who Counts? Number Tested with Scores
PTG 24–252014 Post-Test Workshop 28

Student Master List SummaryPerformance Levels
PTG 23–252014 Post-Test Workshop 29
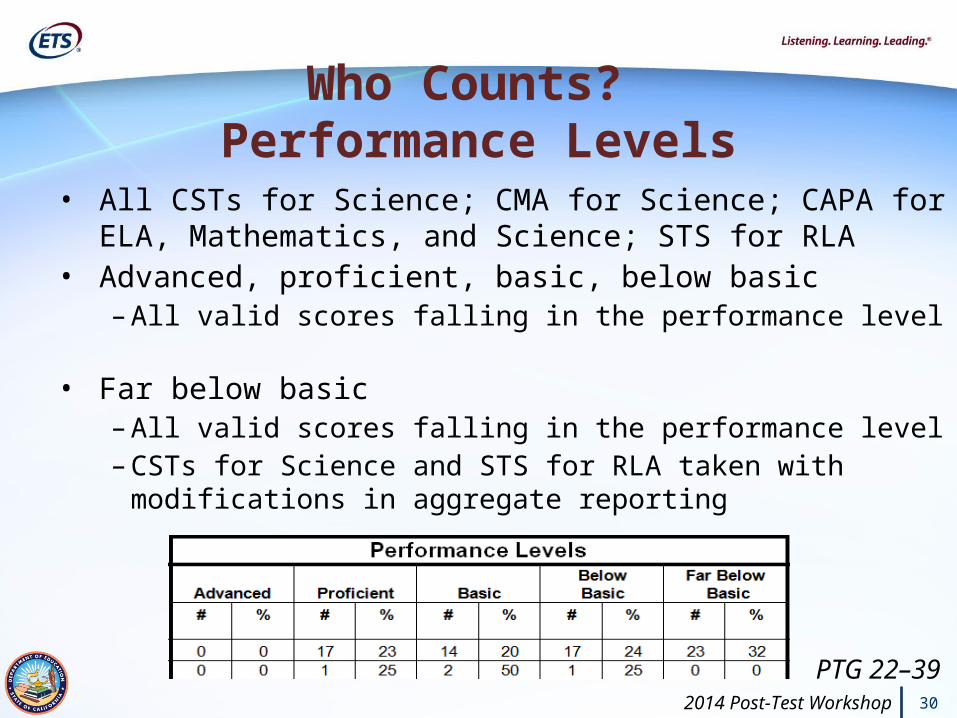
• All CSTs for Science; CMA for Science; CAPA for ELA, Mathematics, and Science; STS for RLA
• Advanced, proficient, basic, below basic– All valid scores falling in the performance level
• Far below basic– All valid scores falling in the performance level – CSTs for Science and STS for RLA taken with
modifications in aggregate reporting
Who Counts? Performance Levels
PTG 22–392014 Post-Test Workshop 30

• Average of valid scale scores• Can be used to compare results for the same
content/grade across years
Who Counts? Mean Scale Scores
PTG 24–252014 Post-Test Workshop 31

Compare to:
Average percent correct range for students statewide who scored proficient on the total test (See the Post-Test Guide, Appendix A.)
Student Master List Summary: Reporting Clusters
PTG 25322014 Post-Test Workshop

• Disability status– Based on disability status for CST, CMA, STS– CAPA: each disability type
• Economic status– Based on NSLP eligibility or parent education level
• Gender• English proficiency• Ethnicity• Ethnicity for Economic Status (only for CSTs, CMA, and
CAPA)
Subgroup Summary:CSTs, CMA, CAPA, and STS
PTG 26–39 2014 Post-Test Workshop 33

Subgroup Summary:Ethnicity for Economic Status
PTG 392014 Post-Test Workshop 34

Example: Economically disadvantaged for each ethnicity
Subgroup Summary:Ethnicity for Economic Status
PTG 292014 Post-Test Workshop 35

Subgroup Summary:Ethnicity for Economic Status
PTG 29 2014 Post-Test Workshop 36

• Summaries based on same data as paper reports: CSTs for Science; CMA for Science; CAPA for ELA; Mathematics; and Science, STS for RLA
• Available to the public online for school, district, county, and state
• “Students with Scores” = number tested with scores• More subgroups than paper reports
– Parent education– Special program participation
• Access from http://caaspp.cde.ca.gov/
PTG 65–73
Internet Reports
372014 Post-Test Workshop

2014 Post-Test Workshop 38
• In 2014, neither total enrollment nor percent tested data are included in Internet reports for any test.
• Aggregate scores will be reported on the Internet in mid-September 2014 after the CALPADS data corrections window.
Internet Reports
PTG 65–73

Internet Demonstration
2014 Post-Test Workshop 39

PTG 65–73
Internet Reports:CST Sample
2014 Post-Test Workshop 40

• CST (PTG 69) • CMA (PTG 69–70)
– Same as CST• CAPA (PTG 70−73)
– State level: same as CST; separate Level I– County, district, school
Mean scale score Percent proficient or above
• STS (PTG 73)– Same as CST
2014 Post-Test Workshop 41
Other Internet Reports

• What are they? – Lists of information from answer documents and scores of every student in
the LEA– In .txt format
• What are they used for?– Searching for specific data– Creating unique reports– Verifying paper reports
• What else is needed?– Text editor – or Desktop application– or Student Information System
Data CDs
2014 Post-Test Workshop 42

• As .txt, word wrap on
• With text editor, word wrap off
View of Data
2014 Post-Test Workshop 43

• Two files:– Demographics, special conditions, and test scores– Accommodations, modifications, English learners,
and irregularities• Data Layout = guide to location of data on files
– Position– Number of characters– Whether numeric or alpha
Organization of Data
2014 Post-Test Workshop 44

Data Layout Sample
2014 Post-Test Workshop 45

• CAASPP Student Record Label– Adhesive label to affix to student’s permanent school record
• CAASPP Student Master List– Alphabetical list of students and their scores– Tests listed in order within grade
CSTs CMA CAPA STS
• CAASPP Student Report: individual’s scores– Two 2-sided color copies for each test– For parents/guardians, school– Per California Code of Regulations, Title 5, Section 863, LEA must
forward one copy to parent/guardian within 20 business days
PTG 40–64
Individual Reports
2014 Post-Test Workshop 46

PTG 40–41
Student Record Label Grade 5 Sample: Student Name and Identification
2014 Post-Test Workshop 47

CST Grade 5 Example
PTG 40–41
Student Record Label
2014 Post-Test Workshop 48

CST/CMA Grade 10 Example
PTG 44
Student Master List
2014 Post-Test Workshop 49

CST Grade 5 Example
PTG 46–50
Student Report
2014 Post-Test Workshop 50

2014 Post-Test Workshop 51
Student ReportCMA Grade 5 Example
PTG 51–55

2014 Post-Test Workshop 52
Student ReportSTS Grade 2 Example
PTG 60–64

Explain to ParentsScale Score Average % correct
cluster score x 600• Reporting clusters not comparable
– Different difficulty– Varying number of questions– Average % correct of clusters % correct on total test (or
total number of test items)
• Scale scores– Use conversion tables resulting from statistical procedures– Equating allows scores to have similar meaning
(e.g., 350 = lowest score for CSTs proficient)
PTG 7–132014 Post-Test Workshop 53

• CST (PTG 46–50)– Front: Scale scores, performance levels, cluster percent correct– Back: Interpretation guide
• CMA (PTG 51−55)– Front: Scale scores, performance levels, cluster percent correct– Back: Interpretation guide
• CAPA (PTG 56−59)– Front: Scales scores, performance levels– Back: Interpretation guide
• STS (PTG 60-64) (in Spanish)– Front: Scale scores, performance levels, cluster percent correct– Back: Interpretation guide
Student Report Summary
2014 Post-Test Workshop 54

• Do’s– Do compare mean scale score, percent at performance levels
within same grade, same content area.– Do compare cluster scores to the corresponding proficient range
provided for this year. • Don’ts
– Don’t compare cluster scores to each other within test, nor across years, grades, content areas.
– Don’t compare mean scale scores across grades, content areas.• Summary and Internet reports• Data CDs• Individual reports
Summary
2014 Post-Test Workshop 55

Upcoming Dates
Event Date Post-Test Guide posted on http://caaspp.org Mid AugustAppendixes A & C of the Post-Test Guide posted on http://caaspp.org September 12Web Reports available on http://caaspp.cde.ca.gov September 17Research files available September 17Post-Test Guide distributed Mid SeptemberSummary Reports September 5 through October 10
2014 Post-Test Workshop 56

1. Return the 2015 CAASPP Superintendent’s Designation form and Security Agreement.
2. Finalize instructional schedule.3. Set up admin in CAASPP Test Operations
Management System prior to December 1.4. Enter and approve orders prior to December 1.
After order approval, test administration dates should NOT be changed.
2015 Setting Up Test Administrations
2014 Post-Test Workshop 57

• CDE CAASPP office– 916-445-8765– CAASPP Web page: http://www.cde.ca.gov/ta/tg/ca/– CAASPP Reporting Web site: http://caaspp.cde.ca.gov/
• CDE Accountability– [email protected] – 916-319-0863
• California Technical Assistance Center– 800-955-2954– http://caaspp.org/
For more information see:
2014 Post-Test Workshop 58

Early Assessment Program Results
August 2014Connie Grueter

2014 Post-Test Workshop 60
• 2014 EAP Student Report – Looks different than 2007 – 2013– Limited electronic data provided through Order Management System– Electronic data on CST Student Data CD-Rom
• 2014 Aggregate Data file– Available mid-September
Early Assessment Program (EAP)
2014 Post-Test Workshop 60
PowerPoint slides – www.CollegeEAP.org, Educators, About EAP.

2014 Post-Test Workshop 61
• An EAP informational web site has been developed: www.CollegeEAP.org. – The site provides EAP information for both
CSU and CCC– It is a resource for Students, Parents, and
Educators
PowerPoint slides – www.CollegeEAP.org, Educators, About EAP.
Early Assessment Program (EAP)
2014 Post-Test Workshop 61

2014 Post-Test Workshop 62
www.CollegeEAP.org
2014 Post-Test Workshop 62

2014 Post-Test Workshop 63
• Reporting Results – Ready for CSU and participating CCC college-level
English/Mathematics courses.
– Ready for CSU and participating CCC college-level English/Mathematics courses – Conditional This status in conjunction with a grade of “C” or better in
an approved English/math course or a supervised e-learning program can be exempt from the EPT or ELM for CSU or other English or math placement tests at participating California Community Colleges (CCC).
A list of courses and e-learning programs can be found at: www.csumathsuccess.org and www.csuenglishsuccess.org .
– Not yet demonstrating readiness for CSU and participating CCC college-level English/Mathematics courses.
Early Assessment Program (EAP)
2014 Post-Test Workshop 63

2014 Post-Test Workshop 64
Sam
ple
201
4 E
AP
Stu
den
t R
epor
tEarly Assessment Program (EAP)
2014 Post-Test Workshop 64

2014 Post-Test Workshop 65
• Web Resources– www.CollegeEAP.org
Links to CSU and CCC informational sites for Students, Parents, and Educators
– www.CalState.edu/EAP Provides a list of EAP Coordinators, EAP test
blueprints, and informational materials– www.CCCCO.edu/EAP
Provides a list of participating Community Colleges
PowerPoint slides – www.CollegeEAP.org, Educators, About EAP.
Early Assessment Program (EAP)
2014 Post-Test Workshop 65