Embed Size (px)
Citation preview

2014 ANNUAL REPORT

ANNUAL REPORT 2013 – 2014RACING AND WAGERING WESTERN AUSTRALIA2 3
For the year ended 31 July 2014
Hon Terry Waldron, MLAMinister for Sport and Recreation; Racing and GamingIn accordance with Section 61 of the Financial Management Act 2006, we hereby submit for your information and presentation to Parliament, the Annual Report of Racing and Wagering Australia for the fi nancial year ended 31 July 2014.The annual report has been prepared in accordance with the provisions of the Financial Management Act 2006 and the Racing and Wagering Australia Act 2003.
Jeff OvensRWWA Board Chairman
13 October 2014
Gary GliddonAudit & Risk Committee Chairman
13 October 2014
Statementof compliance

ANNUAL REPORT 2013 – 2014ANNUAL REPORT 2013 – 2014RACING AND WAGERING WESTERN AUSTRALIA4 5
Contents
Statement of Compliance 3
Table of Contents 4
Chapter One: Overview 5
Chairman and CEO Report 6Operational Structure 9Organisation Structure 10Racing and Wagering Western Australian Board 11Performance Management Framework 13
Chapter Two: Report On Operations 14
Racing 15Racing Integrity 21Marketing 24Retail 25Commercial 26Information Services 27Finance and Business Services 28Human Resources 28
Chapter Three: Disclosures and Legal Compliance 29
Opinion of the Auditor General 30Certifi cation of Financial Statements 33
Financial Statements 34 Statement of Comprehensive Income 34 Statement of Financial Position 35 Statement of Changes In Equity 36
Statement of Cash Flows 37Certifi cation of Key Performance Indicators 74Key Performance Indicators 75Other Financial Disclosures 79Governance Disclosures 80Other Legal Requirements 82Government Policy Requirements 83
Chapter OneChapter OneChapter OneChapter One
Overview

ANNUAL REPORT 2013 – 2014RACING AND WAGERING WESTERN AUSTRALIA6 7
Overview
Strong returns to racing and sportsRWWA funded racing distributions, grants and subsidies reached a record $131M for the year ending July 31, an increase of $14.9M or 12.9%. This represents the highest level of funding to the racing industry in its history and also the largest single increase the industry has received in one year. This funding commitment was made possible by the strong performance of the WATAB.
Although this is a positive outcome, racing across the three codes remains challenged in its ability to retain and attract new owners and provide acceptable returns to participants invested in the industry.
Racing is important to Western Australia. It has over 33,000 participants engaged in the sport, generating approximately $600M in direct expenditure with around 900,000 people attending race meetings each year throughout the state. Its economic and social contribution makes it an important part of the fabric of Western Australia.
In addition to RWWA’s funding, the Western Australian Government assisted the racing industry by way of the Racing Infrastructure and Royalties for Regions Grants Programs. In total, Western Australian racing clubs received $3.5M for the year. Funding under these grants programs has greatly assisted clubs address important Occupational Health and
Safety compliance together with investment towards improving the on course experience for customers.
Income from the WA Race Bets Levy totalled $33.1M in 2014 compared with $31.1M the prior year, an increase of 6.7%. RWWA receives this income as a Grant from the WA Government. It consists of the racefi elds revenue from wagering operators (including WA TAB) betting on Western Australia racing product.
As a result of the growth in turnover and margin from Sports betting, RWWA was able to distribute $4.5M to the Sports Wagering Account, an increase of 11.2% on 2013. These funds provide an important source of funding for sporting and recreational organisations throughout Western Australia.
Improved balance sheetRWWA’s overall fi nancial results after taking into account $135.3M in distributions, grants and subsidies to racing and sports generated a surplus of $9M with $11M in cash being added to the organisation’s balance sheet.
This result provides RWWA with year-end working capital of $45.4M, positioning the business favourably for future investment in its wagering and racing businesses.
RWWA has purposefully developed these reserves to enable it to support the racing industry with much needed infrastructure funding and to manage
the uncertainty and market volatility associated with revenue forecasting.
Signifi cant Issues & TrendsIn May 2014 the Western Australian Government announced in addition to other state owned assets the potential sale of the WATAB. To assist the Government in this process, RWWA undertook a detailed review of privatisation in Eastern States and the resulting impact to the State racing industries. RWWA continues to work with Government to ensure the best long term outcome is achieved for stakeholders. At the time of writing this report the Government has not made a decision regarding privatisation of the WATAB.
RWWA believes its wagering business, the WATAB, is in a competitive position to maintain and grow its wagering revenues for the benefi t of the Western Australian racing industry.
There are a number of signifi cant issues outside of RWWA’s control that challenge racing at a state and national level. The escalation of product fees by state based racing authorities is resulting in wagering operators shifting their customers spend from higher cost racing to lower or in some cases zero cost sports products.
The leakage of wagering turnover to non Australian based wagering operators is an ongoing threat. This occurs when Australian residents bet with overseas operators without the resulting payments of product fees
Chairman and CEO Report
Year in ReviewThe 2014 fi nancial year was pleasing one in setting a positive direction for the business moving forward. RWWA has again shown its capability to perform in what is a very competitive market.
Outstanding fi nancial resultsThe fi nancial results for Racing and Wagering Western Australia (RWWA) were again strong during 2014. Key highlights included;
• Wagering offcourse revenue growth of 7.2% over prior year
• Fixed odds revenue growth of 128%
• Mobile and tablet channel revenue growth of 115.7%
• Product fees received from betting on WA racing product up 6.7%
• Profi t surplus after distributions of $9.0M.
• Increase in working capital cash reserves of $11M.
The WATAB continues to perform at or above national benchmarks for revenue growth, fi xed odds yield and technology performance levels.
Whilst customer demand is transitioning from traditional pari-mutuel to fi xed odds betting products as well as to portable mobile and tablet channels, RWWA is well equipped to deal with these structural changes in consumer behaviour.
Sports betting continued to contribute signifi cantly to the businesses results with a revenue increase of 35.9% over the previous year. This result was aided by the World Cup (Soccer) in the latter part of the fi nancial year. While the location of this international event was less suitable for customers in Western Australia, RWWA achieved consistent participation levels and wagering outcomes with previous events.
Over the last year, RWWA continued to invest heavily in its new wagering brand TABTOUCH complementing the investment made in internet, mobile
and tablet technology platforms. The TABTOUCH brand will be the centrepiece to achieving future growth for the business. RWWA’s multi channel strategy is developing with the linking of retail cash betting to TABTOUCH mobile devices. Investment in these areas will continue as part of RWWA’s wagering strategy.
In addition to its investment in account based channels, RWWA developed, piloted and is seeking to progressively implement its new retail race wall platform to off-course TAB outlets and as well as key metropolitan and provincial clubs. Initial results from piloted outlets demonstrate growth in retail turnover and fi xed odds yield.
Increased investment in branding, channel and products was offset by other operational effi ciencies to the extent that the businesses overall expense rate was contained to 1.7% over the previous period.
Chairman and CEO Report
Revenue after Cost of Sales and Tax
2009/10 2010/11 2011/12 2012/13 2013/14
220
240
$M
200
180
160
140
120
Distributions, Grants and Subsidies
2009/10 2010/11 2011/12 2012/13 2013/14
Distributions, Grants & Subsidies
Sports Distributions 90
100
110
120
130
140
$M
80
70
60
50

ANNUAL REPORT 2013 – 2014RACING AND WAGERING WESTERN AUSTRALIA8 9
Overview
Enabling LegislationRacing and Wagering Western Australia commenced operations on 1 August 2003 upon the promulgation of the Racing and Wagering Western Australia Act 2003. The act established RWWA as the controlling authority for thoroughbred, harness and greyhound racing in Western Australia, together with the responsibility for off-course TAB wagering. Implementation of RWWA’s responsibilities occurred in two stages.
Effective 1 August 2003, RWWA assumed the principal club/controlling authority responsibilities of the Western Australian Turf Club, Western Australian Trotting Association and Western Australian Greyhound Racing Authority. On 30 January 2004, the Totalisator Agency Board Betting Act 1960 was repealed and RWWA assumed responsibility for the conduct of off-course TAB wagering. The Racing and Wagering Western Australia Regulations 2003 were enacted to establish key employee licensing procedures relating to RWWA’s wagering activities and to include those provisions of the Totalisator Agency Board (Betting) Regulations 1988 needed to control RWWA wagering activities. To complement the formation of RWWA, the Betting Control Board, established under the Betting Control Act 1954, was abolished and its functions transferred to the Gaming Commission of Western Australia, which was re-titled the Gaming and Wagering Commission of Western Australia.
Hence, the Gaming and Wagering Commission, under the Gaming and Wagering Commission Act 1987, now regulates RWWA’s gambling activities.
As part of the legislative package to establish RWWA, the Totalisator Agency Board Betting Tax Act 1960 was repealed and replaced by the Racing and Wagering Western Australia Tax Act 2003; and the Racing Restriction Act 2003. Under the Racing Restriction Act, no thoroughbred, harness or greyhound race for prize or reward (exceeding $50 in value) may be held without a licence from RWWA.
LegislationThe principal legislation governing RWWA is:
▪ Racing and Wagering Western Australia Act 2003
▪ Racing and Wagering Western Australia Tax Act 2003
▪ Racing Restriction Act 2003 ▪ Racing Bets Levy Act 2009 ▪ Gaming and Wagering
Commission Act 1987 ▪ Betting Control Act 1954.
Other legislation to which RWWA must comply includes the following. The list is not exhaustive but represents the legislation which impacts on the general operation of RWWA.
▪ Anti-Money Laundering and Counter Terrorism Financing Act 2006 (Commonwealth)
▪ Broadcasting and Recorded Entertainment Award 2010
▪ Copyright Act 1968 (Commonwealth)
▪ Corruption and Crime Commission Act 2003
▪ Criminal Code Act 1913 (WA) and Criminal Code Act 1995 (Commonwealth)
▪ Electoral Act 1907 ▪ Equal Opportunity Act 1984 ▪ Financial Management Act 2006 ▪ Freedom of Information Act 1992 ▪ Gaming and Betting (Contract
Securities) Act 1985 ▪ Interactive Gambling Act 2001 ▪ Long Service Leave Act 1958 ▪ Occupational Safety and
Health Act 1984 ▪ Patents Act 1990 ▪ Public Interest Disclosure Act 2003 ▪ State Government Agencies
Administration Award 2010 ▪ State Superannuation Act 2000 ▪ Statutory Corporations (Liabilities
of Directors) Act 1996 ▪ Superannuation Guarantee
(Administration) Act 1992 ▪ Trade Marks Act 1995 ▪ Trade Practice Act 1974 ▪ Unclaimed Money Act 1990 ▪ Workers Compensation and Injury
Management Act 1981 (WA) ▪ Fair Work Act 2009
Responsible MinisterThe Hon Terry Waldron MLA (Minister for Sport and Recreation; Racing and Gaming) is the Minister responsible for Racing and Wagering Western Australia.
Operational StructureChairman and CEO Report
and wagering taxes to Australian racing authorities and governments.
Declining on course revenues are a signifi cant issue affecting racing. Not only does this issue limit race clubs ability to invest appropriately in operational services, it also restricts club capacity to invest in important industry and public infrastructure facilities on course. As a result of the declining fi nancial state of race clubs, RWWA is required to accommodate this reduction in direct income with further indirect fi nancial support. Importantly, RWWA has the capacity to support the industry whilst working with it to make the necessary long term structural changes to achieve improved sustainability.
OutlookIt is important to highlight RWWA’s key business driver, the WATAB, has delivered in total $578M in distributions, grants and subsidies over the past 5 years for the benefi t of Western Australian racing. In addition, it has accumulated a further $45.4M in undistributed reserves from offcourse wagering for the purpose of future investment in key racing infrastructure projects and distributions.
To further consolidate WA’s position, RWWA needs to encourage breeders, owners and trainers to continue to invest in the breeding, ownership and racing infrastructure required to make the industry more prosperous.This investment underpins the industry as an important provider of employment to over seven
thousand people and the generator of around $600M in economic benefi t to the state’s economy.
RWWA’s planning has identifi ed the need to address the imbalance in stakes between Western Australia and the Eastern States. WA stakes, in particular thoroughbreds and metropolitan greyhounds compare unfavourably requiring progressive attention.
Whilst RWWA will continue to benefi t all three codes of racing, these benchmark targets, if met, will require an additional $15M in stake money over the next fi ve years. While ambitious, RWWA believes the targets are achievable through the effi cient and effective operation of the WATAB.
RWWA recognises the need to review its infrastructure base and plan for what will be necessary to meet the needs of the industry, its supporters, its customers and the practical realities of operating in a commercial environment.
Exceptional peopleRWWA’s 2014 results would not have been possible were it not for the many people who make Racing and Wagering successful. As Chairman I would like to thank the Board, staff, agents and racing industry participants for their contribution to the outstanding results of 2014.
In particular, I would like to pay tribute to the CEO and the RWWA Executive for what has been an exceptional performance under somewhat trying circumstances. It would have been
easy in these uncertain times to have been distracted by matters outside our control. Thankfully this has not been the case and the results refl ect the dedication our executive have toward building a better racing industry.
During the year three RWWA Board members retired, Jim Freemantle (11 years service), John Bradshaw (3 years service) and Ross Cooper (12 years service). RWWA welcomed three new members, Kirrilee Warr, Anthony Hasluck and Matt Benson to the RWWA Board.
I would like to thank Jim, John and Ross for their contributions to RWWA over many years and take this opportunity to welcome our new members.
Richard Burt CEO
Jeff Ovens Chairman

ANNUAL REPORT 2013 – 2014RACING AND WAGERING WESTERN AUSTRALIA10 11
Overview
Organisation StructureThe organisational structure of RWWA is based on a corporate model comprising a number of divisions which oversee the varying activities of the organisation.
Racing and Wagering Western Australian BoardThe management of RWWA’s business and affairs is under the direction of the RWWA Board.
Operational Structure
Standing (L–R): Mr Anthony Hasluck, Mr Gary Gliddon, Mrs Kirrilee Warr, Professor John Yovich, Mr Ross CooperSeated (L–R): Dr Lianne Cretney-Barnes, Mr Jeff Ovens, Mr Robert Charles Pearson
Board Members
Mr Jeff Ovens(Chairman)
First appointed1 February 2012
Mr Robert Pearson(Nominated by Thoroughbred Racing Industry Bodies)
First appointed1 August 2003
Mr Ross Cooper(Nominated by Harness Racing Industry Bodies)
First appointed1 August 2003Retired 31 July 2014
Mr Gary Gliddon(Nominated by Greyhound Racing Industry Bodies)
First appointed21 November 2011
Dr Lianne Cretney-Barnes(Has expertise in Business Administration, Management and Marketing)
First appointed1 February 2011
Professor John Yovich(Specialist veterinarian with lifelong involvement in racing industry)
First appointed1 February 2013
Mr Anthony Hasluck(One of WA’s leading communications consultants)
First appointed1 February 2014
Mrs Kirrilee Warr(Director of a broad acre agricultural enterprise and is active in regional communities)
First appointed1 February 2014
Information ServicesGeneral Manager
Mike Meehan
Racing – General Manager
Ken Norquay
Chief Executive O� cer
Richard Burt
MarketingGeneral Manager
Alister Shennan
Racing IntegrityGeneral Manager
Denis Borovica
Finance & Business ServicesGeneral Manager
Julian Hilton–Barber
Human ResourcesGeneral Manager
Matthew Thomas
Retail – General Manager
Michael Saunders
CommercialExecutive Manager
Scott McDowell

ANNUAL REPORT 2013 – 2014RACING AND WAGERING WESTERN AUSTRALIA12 13
Overview
Board CommitteesThe Board has established committees to oversee various functions of the organisation and industry. These committees have delegated authority to perform certain functions and exercise powers of the Board. The formal committees of the Board, their terms of reference and membership are listed below:
Integrity Assurance Committee Racing Operations CommitteeThe Integrity Assurance Committee (IAC) has primary oversight of those aspects of RWWA’s functions that relate to; stewards, drug testing and control, licensing and registration, handicapping and racing appeals.
The IAC also performs the role of RWWA’s Audit Committee and has oversight for the Internal Audit Function, Risk Management, and Legislative Compliance. The IAC also reviews and approves the Annual Report.
This committee is responsible for the racing functions of RWWA. Its responsibilities include consulting with industry bodies, programming and racing dates, loans, grants and distributions.
Members Include:• Dr Lianne Cretney-Barnes (Chairperson)• Mr Anthony Hasluck • Mr Jeff Ovens (ex-offi cio) • Mrs Kirrilee Warr• Mr Richard Burt (Deputy)
Members include:• Mr Robert Pearson (Chairman)• Mr Ross Cooper (Deputy Chairman)• Mr Gary Gliddon• Professor John Yovich• Mr Jeff Ovens (ex-offi cio)• Mr Richard Burt (Deputy)
Operational StructureRelationship to Government Goals
Results–Based Service DeliveryGreater focus on achieving results in key service delivery areas for the benefi t of all Western Australians
Desired Outcomes Effectiveness Indicators Services Provided Effi ciency IndicatorsTo achieve an optimum level of funding for the development of racing and sports in Western Australia
Value of Grants distributed to clubs
Grants administration, evaluation and distribution
-
To effi ciently administer and to provide effective leadership in the development, integrity and welfare of the racing industry in Western Australia
Distribution to Industry Administration of industry distribution to the clubs
-
% of Winners Swabbed / Returned Negative
Maintain the integrity of the Western Australian racing industry
-
Average number of starters in Western Australia races
Guarantee the ongoing welfare and sustainability of the Western Australian racing industry
-
To provide an effi cient, competitive and responsible wagering service for Western Australia
Primary Betting System availability
Provision of a betting system which is effi cient, reliable, maintainable and capable
-
Number of bets processed
Financial and Economic ResponsibilityResponsibly managing the State’s fi nances through the effi cient and effective delivery of services, encouraging economic activity and reducing regulatory burdens on the private sector
Desired Outcomes Effectiveness Indicators Services Provided Effi ciency IndicatorsTo effi ciently administer the racing and wagering industry in Western Australia
Operating Profi t (excluding the profi t/loss from sale of assets) before distribution to codes
Provision of Racing, Stewarding, Wagering, Financial, Marketing, Human Resource, IT, Strategic and other services
Staff (FTE)
Margin per employee
Racing and Steward expenses per WA race meeting
Profi t per employee
Return on Assets (operating profi t as a percentage of total assets)
To provide a competitive wagering service for Western Australia
Margin Provision of services to support Wagering
-Annual growth in TAB Turnover on WA racing
RWWA’s key performance indicators are aligned to the above government goals (i.e. Results–Based Service Delivery and Financial and Economic Responsibility).RWWA’s key performance indicators are also reported in the Financials section of this Annual Report.
Performance Management Framework

ANNUAL REPORT 2013 – 2014RACING AND WAGERING WESTERN AUSTRALIA14 15
Chapter TwoChapter TwoChapter TwoChapter TwoChapter TwoChapter TwoChapter TwoChapter Two
Report onoperations
The Racing Division is responsible for racing operations including fi xture planning, racing systems and information maintenance, handicapping and grading, programming, stakes supervision, vision contracts, industry consultation, racing industry development, industry training, club and racing industry related OSH, control of RWWA-owned animal industry training venues, major event support and the overall strategic direction of the racing industry in Western Australia.
Operations and DistributionThe 2013/14 season provided 883 race meetings across the three codes of racing, featuring a total of 8,180 races and producing 75,331 starters. Of these, 7,882 individual animals raced including 4,076 thoroughbreds, 1,993 standardbreds and 1,813 greyhounds.
Funding for Race ClubsIn 2013/14 RWWA funded fi fty clubs, at 51 venues and eight training venues in total, including the following:• One greyhound club (WAGRA) racing at three
venues (Cannington, Mandurah and Northam)• Thirty four thoroughbred clubs (including tenanted
arrangements such as Coolgardie at Kalgoorlie)• One thoroughbred training only venue – Lark Hill• Thirteen harness clubs (including tenanted
arrangements such as York at Northam)• Two dual code clubs including York Racing
and Narrogin Race and Pace• Seven harness training only venues – Byford,
Cunderdin, Dunbarton, Guildford, Jandakot, South Suburban and Wanneroo
Total distribution funding (in the form of event and training fees) provided to Western Australian racing clubs in 2013/14 amounted to $20.7M or 17.3% of total industry distributions.
Racing
Distribution 2014 Tri Code © The West Australian

ANNUAL REPORT 2013 – 2014RACING AND WAGERING WESTERN AUSTRALIA16 17
In July 2010 the Western Australian State Government announced a $13M funding program over fi ve years towards racing infrastructure. The Western Australian State Government also approved boost funding from Royalties for Regions (R4R) of $6.6M in November 2012, increasing infrastructure grant funding to the Racing Industry to $19.6M during the period 2010/11 – 2014/15. RWWA administers the Racecourse Infrastructure Grants Program (RIGP) for the Minister for Racing and Gaming. In 2013/14 grant funding to the value of $3.6M was approved by the Minister for Racing and Gaming for a total of 65 projects.A number of major works including the redevelopment of the York Racecourse facilities have been undertaken in 2013/14. The focus on infrastructure improvements to facilities, to ensure Occupational Safety and Health (OSH) compliance and support for animal
welfare related projects, has continued in 2013/14, with provincial clubs benefi ting from grants for improvements to track surfaces, OSH facilities work’s packages, Stewards towers, trackwork safety systems across all codes and further rollout of plastic safety running rail to provincial thoroughbred Clubs.
The RWWA Board has committed to the construction of the new greyhound racing facility at Cannington to an amount of $13M.
RWWA has also funded the Ascot Racecourse synthetic track redevelopment ($3.5M) and the Pinjarra Race Club’s track and facility upgrades ($0.8M) to provide winter racing fl exibility for the thoroughbred code. These projects will be completed in August 2014.
In total, 30 clubs across the three codes were awarded grants. The more signifi cant projects that received grant funding included (total project cost):
1. York Race Club – Race day facilities redevelopment ($1.3M)
2. Three Provincial Thoroughbred Racing Clubs – Plastic Running Rail ($0.3M)
3. Nine Regional Thoroughbred Clubs – OSH package of works ($0.8M)
4. Seven Regional Harness Racing Clubs – Facility and equipment upgrades ($0.3M)
5. Metropolitan Racing – Plastic running rail for Belmont inner grass and track and equipment renovations at all tracks ($0.5M)
6. Gloucester Park Semaphore Board/Vision Screen ($0.3M)
Infrastructure Grants
RIGP/R4R Funding Allocated by RWWA
2013/14Since 2010/11
RIGP Grants $1.94M $10.1M
R4R Boost $1.68M $2.9M
Distribution paid by RWWA for 2013/14 to Clubs and Participants is contained in the following table:
Distributions “Paid to Participants” on
Behalf of Clubs$’000
Distributions Paid Directly to Clubs
$’000
Total Distributions
$’000
% of Distributions Paid to Participants
Thoroughbreds 62,472 11,143 73,615 84.9%Harness 25,381 4,982 30,363 83.6%Greyhounds 11,224 4,551 15,775 71.1%
Total 99,076 20,677 119,753 82.7%
• Total Distributions to Clubs excludes capital infrastructure funding, SKY associated costs, pooling fees and product fees.• The source of funds for distributions is made up of RWWA profi ts/retained earnings and government grants and
through Western Australia Race Fields legislation which requires all Race Fields grants to be passed to the clubs.
Lark Hill Thoroughbred Training ComplexWork Health and Safety and consultation have been themes to underpin capital works, planning and operational governance throughout 2013/14.
With the ongoing support of the Lark Hill Track Sub–Committee, a number of signifi cant enhancements have been implemented improving track and facility lighting, maintenance utilising specialised sand track sieving equipment, horse walk and containment areas, horse /stakeholder separations, patron facilities, security and tie-up stalls.
A greening strategy has also commenced with the planting of some 50 native trees throughout the complex. Lark Hill
TABtouch saddlecloths have been introduced providing an added professional aspect to trial day activities, offering a more readily identifi able connection to Lark Hill as the RWWA owned training and trialling centre and complementing RWWA’s TABtouch rebranding initiatives.
The procurement of a new 10-year 220,000kL pa water licence from the Department of Water has been vital in assuring Lark Hill’s operational future and the certainty to proceed with key master planning initiatives, the concept which includes residential stabling, aqua-exercise facilities, additional tracks (synthetic) and other amenities fundamental to a state-of-the-art training facility.
Byford Harness Training ComplexUrban expansion surrounding the State’s largest offi cial harness training centre at Byford has been a key focus throughout the year. RWWA has been vigilant in responding to a number of local planning development proposals that potentially threaten the sustainable longevity of the Byford harness training precinct and community. RWWA continues to be an active voice in confronting the impacts of urbanisation, with the mandate to safeguard the long term future of harness training in Byford, and to further develop the Complex as a ‘Centre of Excellence’.
With development approval secured to commence a number of key initiatives including a dedicated internal driveway to the site (from Briggs Road) and construction of a new parade ring enclosure, progression towards this objective will enable completion of these initiatives within the next 12 months.
Together with the Byford Track Sub-Committee, a number of initiatives have been implemented throughout the period to enhance the safety and supervision of stakeholders who utilise the complex. With the ongoing support of the Byford Harness Club, the complex is now open 365 days of the year. Work, health and safety best practice will continue to underpin all future operational governance and planning machinations.
Lark Hill and Byford Training‘Centres of Excellence’
Report onoperations
Aerial view of Byford Harness Training Complex

ANNUAL REPORT 2013 – 2014RACING AND WAGERING WESTERN AUSTRALIA18 19
2014 Major activities in relationto Thoroughbred Racing
▪ RWWA provided thoroughbred race clubs with payments for stakes and subsidies of $57.6M.
▪ The Westspeed Scheme provided owners, breeders, trainers and riders with an additional $4.8M in bonuses.
▪ Race clubs conducted a total of 295 race meetings (including non–TAB meetings) and 2,256 races and paid $60.4M in stakes and subsidies.
▪ The Western Australian thoroughbred race clubs paid a total of $53.8M in prize money, with 23,925 starters. There were 4,076 individual thoroughbreds that raced in the period.
▪ WA TAB wagering, including fi xed odds, on Western Australian thoroughbred racing was $266.7M, an increase of 3.2% from 2012/13.
▪ The Magic Millions Yearling Sales recorded an aggregate for the premier sale of $12.3M and an average sale price for the premier sale of $45K. The clearance rate for this sale was 82%.
▪ Esperance Bay Turf Club was upgraded to a provincial race club for the fi rst time.
Thoroughbred Racing
Railway Stakes Winner, Luckygray (Image by Scott Hollands)
Winterbottom Stakes (Image by Scott Hollands)
2014 Perth Cup Winner, Black Tycoon (Image by Scott Hollands)
2014 Major activities in relation to Harness Racing ▪ RWWA provided harness race clubs with base and feature stakes funding of $22.8M.
▪ RWWA paid out an additional $0.9M in Westbred Bonuses.
▪ Race clubs conducted a total of 282 race-meetings and 2,342 races which provided 23,801 racing opportunities for 1,993 individual horses that raced during the period.
▪ The 23,801 starters were trained by 467 individual trainers with 56 trainers having 100 or more starters for the year and 19 having 200 or more starters for the year.
▪ During the year a total of 232 WA trained mares earned at least one of the new EPONA Bonuses winning 540 races and generating $275K in credits. Seven mares each earned the maximum credit amount of $5,000 and a total of $14K was paid out in claims to the owners of nine mares.
▪ Gary Hall Snr became the fi rst Western Australian trainer to train 200 winners in a season (September to August). He fi nished the racing season training 214 winners (212 in WA and 2 in Queensland). Gary Hall
Snr is the only trainer to ever record two successive seasons with $3million plus in stakes.
▪ Chris Lewis drove in excess of 100 winners for the racing season – this is the 26th time he has passed the 100 winners in a season milestone and the 21st successive century in a season.
Harness Racing
Report onoperations
GP Oaks (Image by William Crabb)

ANNUAL REPORT 2013 – 2014RACING AND WAGERING WESTERN AUSTRALIA20 21
2014 Major activities in relation to Greyhound Racing ▪ RWWA provided the Western Australian Greyhound Racing Association (WAGRA) with base and feature stake funding of $10.5M.
▪ The WESTCHA$E Incentive Scheme paid out $733K for the year, up 28.5% on 2012/13, with 286 individual greyhounds earning bonuses for their connections.
▪ WAGRA conducted 3,582 races at 306 meetings, which provided 27,605 racing opportunities for 1,813 individual greyhounds.
▪ Consistent with RWWA’s animal welfare policies, RWWA supports the ‘homing’ of retired greyhounds, under the programme known in WA as Greyhounds As Pets (GAP). RWWA funded $125K towards the cost of running the GAP programme during 2013/14.
▪ WA chasing sensation MIATA (retired from racing in May 2013) was announced as the Australian Greyhound Racing Association’s Australian Greyhound of the Year for 2012/13, after becoming the fi rst ever WA greyhound to receive the national accolade in calendar year 2012.
▪ The RWWA Information Services Division continued development of OzChase, the joint venture greyhound racing system designed, built, hosted and maintained in WA for the use by the 2 joint venture partners, RWWA and Greyhound Racing New South Wales (GRNSW). RWWA ‘went live’ on the system for our full business operations in December 2013, joining the ACT, NSW, NT, SA and Tas who were already fully operational on OzChase.
Racing Queensland Limited ‘went live’ on the system in July 2014, becoming the fi nal User State to move onto the platform.
▪ Additionally, the Greyhounds Australasia (GA)-funded OzChase NDR Project was completed by RWWA during 2013/14, with OzChase now consuming and relaying greyhound racing data on an ongoing basis to GA and the non-OzChase jurisdictions of Greyhound Racing Victoria and Greyhound Racing New Zealand.
Greyhound Racing
On Coin (Image by Joe Mulder) Greyhounds as Pets Owners and dogs © The West Australian
Racing Integrity
As part of RWWA’s ongoing commitment to upholding the integrity of WA’s racing industry to the highest level, in August 2013 RWWA appointed an additional investigator. This was to complement other enhanced operational strategies across the three codes of racing which have included increased investment in sample analysis, higher levels of non-race day activities including race day stable and fl oat inspections and other integrity initiatives.
The appointment of an additional investigator has enabled the RWWA Integrity Department to further increase the level of non-race day activities at race meetings, trials, track work and other site visits, inspections and surveillance.
The recommendations arising from the January 2012, RWWA commissioned independent review into the control and conduct of Harness racing assessing all facets of integrity operations (conducted by Mr Ron Davies QC) have now been implemented in accordance with the RWWA Board resolutions. These include the establishment of an expert Form Analyst position to assist Stewards in race and wagering review. Access to additional race and wagering related data has also been facilitated through the year to complement an increased internal operational focus in relation to form and wagering analysis.
In December 2013, RWWA signed a Memorandum of Understanding (MOU) with the Australian Crime Commission. The purpose of the MOU is to provide a framework for cooperation between the Parties in relation to the lawful sharing of information and intelligence to assist in the delivery of RWWA’s functions in relation to integrity. The timely sharing of information and intelligence and other cooperative arrangements will contribute to the production of key intelligence products to support enforcement of the Rules of racing, other investigatory processes and enhance the performance of the parties’ respective statutory functions. A similar draft MOU is currently being established between RWWA and the Western Australian Police Force.
Throughout 2013, the Australian Racing Board (ARB), which is the peak national body for thoroughbred horse racing in Australia, promulgated a number of new National Rules of Racing which enhance the regulatory control of racing. These included rules relating to:
▪ Banning the use of anabolic steroids in the Australian Thoroughbred Industry as of May 2014 which extends to all horses, not restricted to only those presented for racing, with no therapeutic exemptions applicable in the rules of any kind.
Report onoperations
Industry TrainingHighlights
▪ Nine apprentice jockeys commenced in 2013/14, including two school based with four graduating into senior ranks during the period under review. Four apprentices relocated to other states, one to Victoria and three to Queensland.
▪ RWWA again supported the National Apprentice Jockey Challenge, with a heat being held at Ascot in April, which was won by Priscilla Schmidt, representing Queensland. WA apprentices rode in each heat, represented by Mitchell Pateman, Ben Paterson, Chanelle O’Grady, Jerry Noske, Ellie Cockram and Danielle Conroy. Chanelle O’Grady won her heat at Eagle Farm, Brisbane.
▪ At Kalgoorlie races on 12 April 2014 all eight winners were ridden by female Apprentice Jockeys, including fi ve by Emma Stent.
▪ Nine new C Grade Drivers commenced during the season.
▪ 13 drivers progressed to B Grade Drivers’ Licences during this period.
▪ RWWA was awarded the 2013 CCI Large Employer Excellence Award for its Trainee and Apprentice Jockey training programs.

ANNUAL REPORT 2013 – 2014RACING AND WAGERING WESTERN AUSTRALIA22 23
▪ Various rule enhances regarding race-day administration of substances, including therapeutic substances, extended to “one clear day” from the day of the race, including banning administration of any substances in this time frame, by any method, where substances are considered to be “alkalinising agents”
Compliance with these rules will be enforced by RWWA through regular stable inspections, inspections of medications and medication records, and increased out of competition testing as well as race day sampling. Accordingly the RWWA integrity department is responding through amendments to staffi ng arrangements and resourcing to ensure it is able to effectively deliver the expectations of the industry in this regard. This will inevitably result in further increases in relation to the number of samples
taken for analysis by the Chem Centre in Perth to provide for regulation of these new rules which has continued to incrementally grow since RWWA’s inception across all codes.
RWWA is strongly focused on animal welfare matters throughout the industry and has established the position of Equine Welfare Offi cer in 2014 that will be responsible for ensuring the development, implementation and longevity of RWWA’s Retirement from Racing Program for race horses. The key focus of this position in the initial phase is the promotion of life after racing of Thoroughbred and Standardbred horses to competition, recreation and leisure participants of the wider Equestrian Industry.
This position complements RWWA’s existing commitment to the Greyhound as Pets (GAP) program and other welfare initiatives applied in relation
to racing animals. Animal welfare continues to be a key focus of attention, with on-going review of various welfare policies being undertaken through the year and the strict enforcement of these.
RWWA is also supporting several key animal welfare and drug control research projects including:
▪ Research being proposed by the University of Sydney and the National Measurements Institute (NMI) who have made a joint application for an Australian Research Council (ARC) linkage grant to part fund a three year research project that aims to develop a working method to detect and identify gene doping in race horses. Racing Industry partners include the Australian Racing Forensic Laboratory (NSW), Racing Analytical Services Ltd (VIC).
Racing Integrity
Off The Track Murdoch Vet Research © The West Australian
▪ Through a partnership between RWWA and Murdoch University, researchers conducted a 12-month endoscopic survey of over 580 horses during the 2012/13 racing seasons into clinical research studies into exercise-induced pulmonary haemorrhage (EIPH) in thoroughbred racehorses in Western Australia. The aim of the research focuses on the identifi cation of risk factors that could be potentially addressed to minimise EIPH and identifying management factors, rather than medication, which can serve to improve welfare of racehorses and jockey safety. The second
phase of this project commenced in July 2014 and consists of a prospective, longitudinal study involving Thoroughbred racehorses participating in races at Perth’s metropolitan and provincial racetracks over an 18-month period.
▪ RWWA has fully funded a collaborative Greyhound health project with Murdoch University researchers. The project is entitled; “The prevalence and diversity of gastrointestinal parasites within the Racing Greyhound Industry of Western Australia”.
Racing Integrity
Report onoperations
Statistics for 2013/14 across the three codes are as follows:
Thoroughbred Samples PositivesPost Race 2019 2TCO2 1429 0OOCT 108 0Human 292 9
Harness Samples PositivesPost Race 1204 0 TCO2 2719 1OOCT 75 0Human 135 Nil
Greyhound Samples PositivesPost Race 1210 1OOCT 14 0

ANNUAL REPORT 2013 – 2014RACING AND WAGERING WESTERN AUSTRALIA24 25
2013/14 saw the successful relaunch of the TAB brand in WA. Following on from a two year program of research driven product and pricing improvements the TAB launched its ‘Man on a Horse’ Campaign to inform customers of the change and take a fresh look at the TAB.
As part of this journey the TAB decided to focus on a single brand - The TAB. It became clear with research showing the TAB brand had a strong awareness and favourability that customers perceived it as a tired brand that our customers were comfortable with. The challenge in rebranding was to retain our loyal customers and bring back those that had left over the last fi ve years.
As part of this decision our Sports Betting Brand, Player, was replaced by The TAB as the home of Sport and Racing. In other brand related work our online and mobile platforms were consolidated under the one brand Tabtouch.
The TAB brand relaunch resulted in the entire retail network being re-signed with the new identity. Over 320 outlets were completed within a ten week period. A major TV led campaign was launched in September using consistent imagery of “The Man on A Horse” as the spokesperson for the TAB.
The overall campaign has been very successful. The re-brand clearly played a key part in the commercial success of the TAB in the 13/14 year.
Launched in September last year, the new look brand campaign has helped our business achieve many new records – account openings, ticket sales, TABtouch downloads and increased market share. All business objectives set at the beginning of the campaign have been met and/or signifi cantly overachieved.
▪ Amongst frequent customers we saw a 9% increase in brand consideration or ‘desire to use’ and a 4% increase amongst infrequent customers too.
▪ Prospective customers reported the TAB as their most popular provider increasing by 15%, outperforming our 5% target. We also achieved a 6% increase in brand consideration amongst our prospective customer audience.
▪ As an iconic brand and market leader, increasing brand awareness was one of the hardest goals. A campaign target of a 5% increase in brand awareness was bettered by an actual increase of 10% amongst frequent customers.
It has been pleasing to see the positive results from our investment from both a marketing and technology perspective in the wagering brand. It is worth noting some of the major changes:
▪ Our new website was relaunched.
▪ Fixed Odds and Tote prices are now
displayed side by side throughout all our channels including fi xed odds racing prices on SKY.
▪ A more competitive price position has been adopted in our Fixed Odds business.
▪ A more consistent common user interface exists across all our electronic platforms.
▪ New customer features including Blackbook and a preference centre for customising bet limits have been added to the website.
▪ New CRM technology has been deployed allowing a more targeted approach to our customer loyalty program.
▪ Our customer fi rst programs continue to identify and remove pain points around transactions and services with all our channels.
In other key areas within marketing good progress was made in improving and integrating our Fixed Odds Sports offering. The TAB now provides an extensive range of sports and bet types. As an example coverage of 120 soccer leagues is now provided to our customers.
Marketing
The Retail division is responsible for RWWA’s TAB agency network. At the end of the 2013/14 fi nancial year, RWWA’s retail network consisted of 327 agencies segmented into the following categories:
• Service Level 1 (SL1)Fulltime TAB Agencies – 90
• Service Level 2 (SL2)PubTAB Agencies – 106
• Service Level 3 (SL3)Self Service PubTAB Agencies – 131
There was a shift in the volume of SL2 and SL3 agencies in 2013/14 as the introduction of an additional two hundred self service betting terminals allowed the conversion of a number of SL2 PubTABs to SL3.
The SL3 Self Service PubTAB model improves the TAB experience for both hoteliers and customers. Hoteliers can focus on the ability to lower their variable costs (staff wages) and customers get all of the digital benefi ts of a self service terminal.
Retail TAB agencies remain an information rich, cash friendly and social betting experience for our customers. The challenge for Retail is the ability to adapt in an increasingly digital environment.
In 2013/14, the RWWA Board approved a Retail investment strategy (pending privatisation decision by the government) that would see Race Walls and information terminals technology (shown above) delivered
to all SL1 and SL2 agencies over 24 months. The Race Wall technology comprises ten screens that include Sky 1 and 2, the next six races to jump and two other screens that help customers manage their raceday.
Importantly for all Retail stakeholders, RWWA has now completed its research and has begun the development of TABtouch initiatives that will increase the mobile platform’s exposure in Retail. The aim is to give customers a greater level of connection with the retail cash business through easier transactions, mobile product benefi ts and retail rewards.
Retail
Report onoperations
TAB Agency Currambine TAB Agency Perth Central

ANNUAL REPORT 2013 – 2014RACING AND WAGERING WESTERN AUSTRALIA26 27
The Commercial division is responsible for the development and implementation of strategies to improve RWWA’s commercial viability and consequently enhance the sustainability of the WA Racing industry. This is achieved through evaluation of strategic business initiatives and commercial partnerships, benchmarking best practice in wagering against competitors as well as wagering innovation and product development. The division is also responsible for enhancing the corporate reputation of the organisation as well as initiating key bodies of research.
There have been a number of changes in the Australian wagering landscape which are being evaluated for their impact on RWWA and the WA racing industry including:
▪ Race Fields Fee Increases – Several racing authorities have increased their race fi eld fees and changed the methodologies by which they are calculated. In some instances, there is now a differentiation in fees applicable for totalisator, Fixed Odds and exchange products. RWWA has modelled the impact of these changes and is formulating strategies to mitigate the impact of increasing fees.
▪ Further Wagering Industry Consolidation as a result of a number of European operators acquiring the few remaining Australian corporate bookmakers.
▪ Licensing Arrangements – Queensland Racing, the Queensland Government and Tatts have negotiated the terms of a new wagering license. The license comprised, amongst other things, a signifi cant reduction in the level of wagering tax payable by the wagering operator with the benefi t being passed on to the Queensland racing industry. In addition the ACT government has announced the sale of ACTTAB to Tabcorp, without confi rming the long term racing industry funding commitments or sources.
▪ Benchmarking the TAB Corporate Reputation – a detailed corporate reputation survey was undertaken that highlighted the need for the TAB to enhance its commitment to, and engagement with, the community. As a result a number of social corporate responsibility initiatives will be undertaken. An initial $80,000 funding contribution has been made to the Riding for the Disabled Association of Western Australia (RDAWA), to maintain the wellbeing of RDAWA horses. Negotiations are underway with other organisations to pursue community engagement initiatives that are aligned or associated with the objectives of RWWA.
▪ Enhanced Commitment to Animal Wellbeing - An Animal Wellbeing Committee was created to communicate and raise public awareness of RWWA’s animal wellbeing initiatives, mandates and involvement. In addition, the TAB Off the Track program was launched to support Western Australian retired racehorses.
Commercial
...enhancing the corporate reputation of the organisation as well as initiating key bodies of research
Information Services
The Information Services Division is responsible for providing strategic IT direction, technical innovation and support.
The IS division supports all RWWA wagering and racing information systems, ticket machines, information security, data communications, all wagering related technical infrastructure, and Racing Radio.
During 2013/14, the following signifi cant operational and strategic milestones were achieved:
In Infrastructure:
• Admin Disaster Recovery move from city-based location to new location.
• Race Wall pilot rollout to 5 agencies as part of New Agency design.
• Racecourse Wi-Fi trials.
• New Greyhound racing system with WA and QLD coming online – All states excepting VIC now use the Greyhound System.
In Cross-Channel:
• Location-based Identifi cation.
• All-up, which allows each way for each leg.
• Racing vs. Sports.
• Early Bird Quaddie, which allows punters to place a second quaddie on a meeting.
• Enhanced FOB Racing.
In Customer Experience:
• Rebranding.
• Desktop platform relaunch as TABTouch.com.au.
• Enhancements to TABTouch.mobi to matchTABTouch.com.au functionality in:
• Free Bet support for loyalty strategy
• Blackbook, which allows punters to “tag” a runner so that they can keep track of when a runner next runs
• Favourite Numbers
• Single Bet Slip
• Dedicated Android application for mobile wagering.
• Fixed Odds Product Enhancements:
• Multi betting
• Inside/Outside betting
• Odds & Evens betting
• Gamifi cation
• Progressive Dividends (World Cup)
Report onoperations

ANNUAL REPORT 2013 – 2014ANNUAL REPORT 2013 – 2014RACING AND WAGERING WESTERN AUSTRALIA28 29
Human Resources
The Human Resources (HR) division is responsible for the development and implementation of human resource management strategy and effective management of all related workplace and employee related functions across the organisation.
The division provides support to staff and managers on all employment related matters including recruitment, induction, performance management, interpretation and application of policies and workplace conditions. Advice and support to line managers in their people management skills and workforce planning has remained a constant requirement as the organisation continues to develop and change. Learning & Development, OSH & employee wellness functions also play a key role within the Division for RWWA and external stakeholders, which include TAB agents and the broader racing industry. In addition, the delivery of Payroll services and the management of staff data and reporting sit within this division.
During the reporting period, the HR team has focussed on achieving the leadership capabilities and culture changes outcomes from the previous year. Primarily this has involved a broad range of activities targeting specifi c work groups. From building awareness around our culture for all employees through internal workshops to strengthening leadership capabilities through learning groups, one-on-one coaching and defi ning specifi c competencies required of a leader, this year has seen positive results achieved across all employee levels. With our core values redefi ned to align with our vision and purpose and the implementation of our online learning and management system onTRACK, RWWA is well positioned to continue building capability and engagement, further reinforcing our ongoing commitment to invest in our people and culture strategy.
This division is responsible for fi nancial management and strategy, risk and business continuity systems, wagering compliance, audit and legal matters, the administration of licensing and registration of racing participants/animals, business intelligence functions, including data mining and strategic analysis, and a variety of other business services.
The division has continued to provide wide ranging support to the organisation in the achievement of goals and objectives whilst maintaining a focus on prudent fi nancial management and on improving effi ciency and effectiveness.
Finance and Business Services
Report onoperations
Chapter ThreeChapter ThreeChapter Three
Disclosures andlegal compliance
ANNUAL REPORT 2013 – 2014RACING AND WAGERING WESTERN AUSTRALIA30 31
Disclosures andlegal compliance

ANNUAL REPORT 2013 – 2014RACING AND WAGERING WESTERN AUSTRALIA32 33
Disclosures andlegal compliance
Jeff OvensRWWA Board Chairman
13 October 2014
Gary GliddonAudit & Risk Committee Chairman
13 October 2014
For the year ending 31 July 2014The accompanying fi nancial statements of Racing and Wagering Western Australia have been prepared in compliance with the provisions of the Financial Management Act 2006 from proper accounts and records to present fairly the fi nancial transactions for the fi nancial year ending 31 July 2014 and the fi nancial position as at 31 July 2014.
At the date of signing we are not aware of any circumstances which would render the particulars included in the fi nancial statements misleading or inaccurate.
Julian Hilton–BarberGeneral Manager Finance and Business Services and Chief Financial Offi cer
13 October 2014
Certifi cation of Financial Statements

ANNUAL REPORT 2013 – 2014RACING AND WAGERING WESTERN AUSTRALIA34 35
Disclosures andlegal compliance
Income Notes 2014 2013
$000 $000RevenueMargin 2 339,474 315,741 Interest revenue 2,616 2,609 Other revenue 4 18,406 17,780
Total Revenue 360,496 336,130
Gains
Gain on disposal of non–current assets 5 - 257Total Gains - 257
Total Income 360,496 336,387
Expenses
ExpensesCost of sales 83,488 72,321 Wagering Tax 3 42,716 40,417 Racing Services 6, 30 15,319 15,655 Wagering Services 6, 30 83,962 82,549 Support Services 6, 30 31,622 29,966 Projects 30 107 599 Grants and subsidies 7 14,557 3,747 Distribution to racing and sports industries 8 124,205 117,665 Loss on disposal of non-current assets 5 301 -
Total Expenses 396,277 362,919
Loss before grants and subsidies from State Government (35,781) (26,532)Grants and subsidies from State Government 20 44,739 36,782
Profi t for the period 8,958 10,250
Other Comprehensive Income
Items not reclassifi ed subsequently to profi t or lossChanges in asset revaluation surplus 21 2,382 1,489 Total other comprehensive income 2,382 1,489
Total Comprehensive Income for the period 11,340 11,739
See also Note 29 ‘Schedule of Income and Expenses by Service’The Statement of Comprehensive Income should be read in conjunction with the accompanying notes.
Statement of Comprehensive Income – For the year ended 31 July 2014
Assets Notes 2014 2013
Current Assets $000 $000Cash and cash equivalents 22 84,975 67,745 Inventories 9 569 406 Receivables 10 1,864 2,017 Other current assets 12 6,017 5,679 Non–current assets classifi ed as held for sale 13 551 900
Total Current Assets 93,976 76,747 Non–Current AssetsInvestments 11 352 352 Other Non–current assets 12 414 627 Property, plant and equipment 14 48,791 48,864 Capital works in progress 1,721 2,287 Intangible Assets 16 30,558 30,279
Total Non-Current Assets 81,836 82,409
Total Assets 175,812 159,156
Liabilities
Current LiabilitiesPayables 18 40,856 36,229 Provisions 19 6,732 5,275
Total Current Liabilities 47,588 41,504 Non–Current LiabilitiesPayables 18 1,040 1,000 Provisions 19 808 1,617
Total Non–Current Liabilities 1,848 2,617
Total Liabilities 49,436 44,121
Net Assets 126,376 115,035
Equity
Contributed Equity 21 60,884 60,884 Reserves 21 65,492 54,151
Total Equity 126,376 115,035
The Statement of Financial Position should be read in conjunction with the accompanying notes.
Statement of Financial Position – As at 31 July 2014

ANNUAL REPORT 2013 – 2014RACING AND WAGERING WESTERN AUSTRALIA36 37
Disclosures andlegal compliance
Notes Contributed Equity
General Reserves
Asset Revaluation
Reserves
Retained Earnings
Total Equity
$000 $000 $000 $000 $000
Balance at 1 August 2012 21 60,884 21,407 16,204 - 98,495 Changes in accounting policy 1 (u) - 4,801 - - 4,801
Restated balance at 1 August 2012 60,884 26,208 16,204 - 103,296
Surplus - - - 10,250 10,250
Other comprehensive income - - 1,489 - 1,489 Total comprehensive income for the year - - 1,489 10,250 11,739
Transactions with owners in their capacity as owners:
Capital appropriations - - - - -
Other contributions by owners - - - - -
Transfers between reserves - 10,250 - (10,250) -
Distributions to owners - - - - -
Total - 10,250 - (10,250) -
Balance at 31 July 2013 60,884 36,458 17,693 - 115,035
Balance at 1 August 2013 60,884 36,458 17,694 - 115,035
Surplus - - - 8,958 8,958
Other comprehensive income - - 2,382 - 2,382 Total comprehensive income for the year - - 2,382 8,958 11,340
Transactions with owners in their capacity as owners:
Capital appropriations - - - - -
Other contributions by owners - - - - -
Transfers between reserves - 8,958 - (8,958) -
Distributions to owners - - - - -
Total - 8,958 - (8,958) -
Balance at 31 July 2014 60,884 45,416 20,076 - 126,376
The Statement of Changes in Equity should be read in conjunction with the accompanying notes.
Statement of Changes in Equity – For the year ended 31 July 2014
Cash Flows from Operating Activities Notes 2014 2013
$000 $000ReceiptsReceipts from customers 2,124,367 2,022,632 Interest received 2,616 2,609 GST receipts on sales 36,934 35,218 Other receipts 9,991 10,035
PaymentsCustomers (1,774,376) (1,698,931)Creditors (200,233) (192,016)Employee benefi ts (34,632) (33,018)Distributions, Grants and Subsidies (138,762) (119,864)Interest paid (24) (28)GST payments on purchases (16,062) (15,021)GST payments to taxation authority (21,023) (20,272)Other payments (6,360) (6,790)Net cash used in operating activities 22 (17,564) (15,446)
Cash Flows from Investing Activities
ReceiptsProceeds from sales of non–current assets 659 2,671 PaymentsPurchase of non–current physical assets (10,604) (12,436)Net cash used in investing activities (9,945) (9,765)
Cash Flows from State Government
Government Grant reimbursement 44,739 36,782 Net cash provided by State Government 44,739 36,782
Net Increase in cash and cash equivalents 17,230 11,571 Cash and cash equivalents at the beginning of period 67,745 56,174 Cash and cash equivalents at the end of period 22 84,975 67,745
The Statement of Cash Flows should be read in conjunction with the accompanying notes.
Statement of Cash Flows – For the year ended 31 July 2014

ANNUAL REPORT 2013 – 2014RACING AND WAGERING WESTERN AUSTRALIA38 39
Disclosures andlegal compliance
For the year ending 31 July 2014
Australian Accounting Standards
GeneralRWWA’s fi nancial statements for the year ended 31 July 2014 have been prepared in accordance with Australian Accounting Standards. The term ‘Australian Accounting Standards’ includes Standards and Interpretations issued by the Australian Accounting Standard Board (AASB).
RWWA has adopted any applicable, new and revised Australian Accounting Standards from their operative dates.
Early adoption of standardsRWWA cannot early adopt an Australian Accounting Standard unless specifi cally permitted by Treasurer’s Instruction (TI) 1101 ‘Application of Australian Accounting Standards and Other Pronouncements’. There has been no early adoption of Australian Accounting Standards that have been issued or amended (but not operative) by RWWA for the annual reporting period ended 31 July 2014.
1. Summary of Signifi cant Accounting Policies
(a) General StatementRWWA prepares general purpose fi nancial statements in accordance with the Australian Accounting Standards, the Framework, Statements of Accounting Concepts and other authoritative pronouncements of the Australian Accounting Standards Board as applied by the Treasurer’s Instructions. Several of these are modifi ed by the Treasurer’s Instructions to vary application, disclosure, format and wording.
The Financial Management Act 2006 and the Treasurer’s Instructions impose legislative provisions that govern the preparation of fi nancial statements and take precedence over the Australian Accounting Standards, the Framework, Statements of Accounting Concepts and other authoritative pronouncements of the AASB.
Where modifi cation is required and has had a material or signifi cant fi nancial effect upon the reported results, details of that modifi cation and the resulting fi nancial effect are disclosed in the notes to the fi nancial statements.
(b) Basis of PreparationThe fi nancial statements have been prepared on the accrual basis of accounting (except for Grant Income which is recognised on a cash basis) using the historical cost convention, except for land and building which have been measured at fair value.
The accounting policies adopted in the preparation of the fi nancial statements have been consistently applied throughout all periods presented unless otherwise stated.
The fi nancial statements are presented in Australian dollars and all values are rounded to the nearest thousand dollars ($’000).
The preparation of fi nancial statements requires management to make judgements, about the application of accounting policies that have a signifi cant effect on the amounts recognised in the fi nancial statements. RWWA evaluates these judgements regularly.
Key estimates and assumptions concerning the future are based on historical experience and various other factors that have a signifi cant risk of causing a material adjustment to the carrying amount of assets and liabilities within the next fi nancial year.
Notes to the Financial Statements
(c) Reporting EntityThe reporting entity comprises Racing and Wagering Western Australia (RWWA).
(d) Income
Revenue RecognitionThis represents revenue earned from the sale of goods and services net of returns, allowances and duties and taxes paid. Betting receipts are only recognised as revenue when the events to which they relate are fi nalised.
InterestInterest income is accrued on a time basis by reference to the outstanding principal and the effective interest rate applicable.
Unclaimed Dividends Betting dividends are deducted from turnover to arrive at the commission on turnover. In accordance with the RWWA Act 2003 (Section 104), dividends that are not claimed within seven months are included as income under Other Revenue.
GainsThe gain or loss on the disposal of assets is recognised at the date the signifi cant risks and rewards of ownership of the asset passes to the buyer, usually when the purchaser takes delivery of the asset. The gain or loss on disposal is calculated as the difference between the carrying amount of the asset at the time of disposal and the net proceeds on disposal.
Government Grants and SubsidiesThe Western Australian Government provides partial reimbursement for GST paid on the operator’s margin.
Under the Gaming and Wagering Commission Act 1987 (section 110B), the Gaming and Wagering Commission may credit RWWA with proceeds from the Western Australian Race Fields legislation. The Racing and Wagering Western Australia Act 2003 (section107A) requires these funds to be credited into a special purpose account for distribution to registered racing clubs in Western Australia. Treasurer’s Instruction 1102 requires these amounts to be disclosed as Grants from the State Government.
Royalties for Regions funds as well as contributions received through the Racecourse Infrastructure Grants Program are recognised as revenue at fair value in the period in which RWWA obtains control of the funds. RWWA obtains control of the funds at the time the funds are deposited into RWWA’s bank account.
(e) Product Fee ExpenseProduct Fees are generally charged to wagering operators (including RWWA) by the State controlling bodies of each racing code for the use of Race Fields listings. Additional product fees on sporting events and international racing are negotiated with the relevant controlling bodies. Permission to use Western Australian Race Fields is controlled by the Western Australian Department of Racing, Gaming and Liquor.
(f) TaxSection 102 of the RWWA Act 2003 requires RWWA to pay tax in respect of bets at the rate imposed by Sections 4 and 5.
Notes to the Financial Statements

ANNUAL REPORT 2013 – 2014RACING AND WAGERING WESTERN AUSTRALIA40 41
Disclosures andlegal compliance
Notes to the Financial Statements
Parimutuel and Fixed Odds Betting (FOB)The tax rate for Parimutuel Sports betting is 5.0% of turnover, whereas the tax rate for Parimutuel Racing is 11.91% of gross revenue. The tax rate for Fixed Odds Betting (FOB) Sports is 0.5% of turnover and FOB Racing is 2.0% of turnover.
(g) Goods and Services TaxRevenues, expenses and assets are recognised net of GST, except where the amount of the GST incurred is not recoverable from the Australian Taxation Offi ce (ATO). In these circumstances, the GST is recognised as part of the cost of acquisition of the asset or as part of the expense. Receivables and payables are stated with the amount of the GST included.
The net amount of GST recoverable from, or payable to, the ATO is included as a current asset or liability in the Statement of Financial Position.
Cash Flows are included in the Statement of Cash Flows on a gross basis. The GST components of cash fl ows arising from investing and fi nancing activities which are recoverable from, or payable to, the ATO are classifi ed as operating cash fl ows. The GST on operator’s margin, which is reimbursed by the Western Australian Government, is classifi ed as cash fl ows from State Government.
(h) Property, Plant and Equipment and Infrastructure
Capitalisation/Expensing of assetsItems of property, plant and equipment and infrastructure costing over $5,000 are recognised as assets and the cost of utilising assets is expensed (depreciated) over their useful lives. Items of property, plant and equipment costing less than $5,000 are expensed direct to the Statement of Comprehensive Income (other than where they form part of a group of similar items which are signifi cant in total).
Initial recognition and measurementAll items of property, plant and equipment are initially recognised at cost.
Subsequent measurementSubsequent to initial recognition as an asset, the revaluation model is used for the measurement of land, buildings and infrastructure and the cost model for all other property, plant and equipment and infrastructure. Land, buildings and infrastructure are carried at fair value less accumulated depreciation (buildings and infrastructure only) and accumulated impairment losses. All other items of property, plant and equipment are carried at cost less accumulated depreciation and accumulated impairment losses.
Where market-based evidence is available, the fair value of land and buildings and infrastructure is determined on the basis of current market buying values determined by reference to recent market transactions. When buildings are revalued by reference to recent market transactions, the accumulated depreciation is eliminated against the gross carrying amount of the asset and the net amount restated to the revalued amount.
In the absence of market-based evidence, the fair value of land and buildings is determined on the basis of existing use. This normally applies where buildings are specialised or where land use is restricted. Fair value for existing use assets is determined by reference to the cost of replacing the remaining future economic benefi ts embodied in the asset. (i.e. depreciated replacement cost). Where the fair value of buildings is determined on the depreciated replacement cost basis, the gross carrying amount and the accumulated depreciation are restated proportionately. Fair value for restricted use land is determined by comparison with market evidence for land with similar approximate utility (high restricted use land) or market value of comparable unrestricted land (low restricted use land).
Land and buildings are independently valued annually by the Western Australian Land Information Authority (Valuation Services) and recognised annually to ensure that the carrying amount does not differ materially from the assets fair value at the end of the reporting period.
Infrastructure is carried at historical cost less accumulated depreciation and accumulated impairment loss.
The most signifi cant assumptions and judgements in estimating fair value are made in assessing whether to apply the existing use basis to assets in determining estimated economic life. Professional judgement by the valuer is required where the evidence does not provide a clear distinction between market type assets and existing use assets.
DerecognitionUpon disposal or derecognition of an item of property, any revaluation relating to that asset is retained in the asset revaluation surplus.
Asset Revaluation ReserveThe asset revaluation reserve is used to record increments and decrements on the revaluation of non-current assets as described in note 14 ‘Property, Plant and Equipment’.
DepreciationAll non-current assets having a limited useful life are systematically depreciated over their estimated useful lives in a manner that refl ects the consumption of their future economic benefi ts.
Depreciation is calculated using the straight line method, using rates which are reviewed annually. Estimated useful lives for each class of depreciable asset are:
2013/14
Buildings 10 to 40 years
Infrastructure 10 years
Leasehold Improvements (a) 5 to 15 years
Motor vehicles 5 years
Machinery Plant and Equipment 5 years
Furniture and Fittings 5 years
Computer Equipment 4 years
Software (b) 2 to 15 years
(a) Leasehold Improvements useful life will depend on duration of lease. (b) Software that is integral to the operation of related hardware.
Land is not depreciated.
Notes to the Financial Statements

ANNUAL REPORT 2013 – 2014RACING AND WAGERING WESTERN AUSTRALIA42 43
Disclosures andlegal compliance
Notes to the Financial Statements
(i) Intangible Assets
Capitalisation/Expensing of AssetsAcquisitions and internally generated intangible assets costing over $10,000 are capitalised. The cost of utilising the assets is expensed (amortised) over their useful life. Costs incurred of less than $10,000 are immediately expensed directly to the Statement of Comprehensive Income.
All acquired and internally developed intangible assets are initially measured at cost.
The cost model is applied for subsequent measurement requiring the asset to be carried at cost less any accumulated amortisation and accumulated impairment losses.
Amortisation for intangible assets with fi nite useful lives is calculated for the period of the expected benefi t (estimated useful life) on the straight line basis using rates which are reviewed regularly. All intangible assets controlled by RWWA have a fi nite useful life and zero residual value. The expected useful lives for each class of intangible asset are:
Software (a) 2 to 15 years
Web site costs 3 to 5 years
Domain names 10 years
(a) Software that is not integral to the operation of any related hardware.
Computer SoftwareSoftware that is an integral part of the related hardware is treated as property, plant and equipment. Software that is not an integral part of the related hardware is treated as an intangible asset.
Web site costsWeb site costs are charged as expenses when they are incurred unless they relate to the acquisition or development of an asset when they may be capitalised and amortised. Generally, costs in relation to feasibility studies during the planning phase of a web site, and ongoing costs of maintenance during the operating phase are expensed. Costs incurred in building or enhancing a web site, to the extent that they represent probable future economic benefi ts that can be reliably measured, are capitalised.
Domain NamesDomain names have a fi nite useful life and are carried at cost less accumulated amortisation and accumulated impairment losses.
(j) Impairment of AssetsProperty, plant and equipment, infrastructure and intangible assets are tested for any indication of impairment at the end of each reporting period. Where there is an indication of impairment, the recoverable amount is estimated. Where the recoverable amount is less than the carrying amount, the asset is considered impaired and is written down to the recoverable amount and an impairment loss is recognised. Where an asset measured at cost is written down to recoverable amount, an impairment loss is recognised in profi t or loss. Where a previously revalued asset is written down to recoverable amount, the loss is recognised as a revaluation decrement in other comprehensive income.
The risk of impairment is generally limited to circumstances where an asset’s depreciation is materially understated, where the replacement cost is falling or where there is a signifi cant change in useful life. Each relevant class of assets is reviewed annually to verify that the accumulated depreciation/amortisation refl ects the level of consumption or expiration of the asset’s future economic benefi ts and to evaluate any impairment risk from falling replacement costs.
Intangible assets with an indefi nite useful life and intangible assets not yet available for use are tested for impairment at the end of the reporting period irrespective of whether there is any indication of impairment.
The recoverable amount of assets identifi ed as surplus assets is the higher of fair value less costs to sell and the present value of future cash fl ows expected to be derived from the asset. Surplus assets carried at fair value have no risk of material impairment where fair value is determine by reference to market-based evidence. Where fair value is determined by reference to depreciated replacement cost, surplus assets are at risk of impairment and the recoverable amount is measured. Surplus assets at cost are tested for indications of impairment at the end of each reporting period.
(k) Non-Current Assets Classifi ed as Held for SaleNon-current assets held for sale are recognised at the lower of carrying amount and fair value less costs to sell, and are disclosed separately from other assets in the Statement of Financial Position. Assets classifi ed as held for sale are not depreciated or amortised.
(l) LeasesRWWA holds a number of operating leases for buildings and operating equipment. Lease payments are expensed on a straight line basis over the lease term as this represents the pattern of benefi ts derived from the leased properties and equipment.
(m) Financial InstrumentsIn addition to cash, RWWA has two categories of fi nancial instrument:
• Receivables
• Financial liabilities measured at amortised cost.
These have been disaggregated into the following classes:
Financial Assets
• Cash and cash equivalents
• Receivables
Financial Liabilities
• Payables
• Agents Deposits.
Initial recognition and measurement of fi nancial instruments is at fair value which normally equates to the transaction cost or the face value. Subsequent measurement is at amortised cost using the effective interest method.
The fair value of short-term receivables and payables is the transaction cost or the face value because there is no interest rate applicable and subsequent measurement is not required as the effect of discounting is not material.
(n) Cash and Cash EquivalentsFor the purpose of the Statement of Cash Flows, cash and cash equivalent (and restricted cash and cash equivalent) assets comprise cash on hand and short term deposits with original maturities of three months or less that are readily convertible to a known amount of cash and which are subject to insignifi cant risk of changes in value.
Notes to the Financial Statements

ANNUAL REPORT 2013 – 2014RACING AND WAGERING WESTERN AUSTRALIA44 45
Disclosures andlegal compliance
Notes to the Financial Statements
(o) Accrued SalariesAccrued salaries represent the amount due to staff but unpaid at the end of the fi nancial year, as the pay date for the last pay period for that fi nancial year does not coincide with the end of fi nancial year. Accrued salaries are settled within a fortnight of the fi nancial year end. RWWA considers the carrying amount of accrued salaries to be equivalent to its net fair value.
(p) InventoriesInventories are measured at the lower of cost and net realisable value. The cost of inventories is based on the fi rst-in fi rst-out principle, and includes expenditure incurred in acquiring the inventories and bringing them to their existing location and condition.
Inventories not held for resale are valued at cost unless they are no longer required, in which case they are valued at net realisable value.
(q) ReceivablesReceivables are recognised and carried at original invoice amount less an allowance for any uncollectible amounts (i.e. impairment). The collectability of receivables is reviewed on an ongoing basis and any receivables identifi ed as uncollectible are written-off against the allowance account. The allowance for uncollectible amounts (doubtful debts) is raised when there is objective evidence that RWWA will not be able to collect its debts. The carrying amount is equivalent to fair value as it is due for settlement within 30 days. Agents settle on a weekly basis.
(r) PayablesPayables are recognised when RWWA becomes obliged to make future payments as a result of a purchase of assets or services at the amounts payable. The carrying amount is equivalent to fair value, as they are generally settled within 30 days.
(s) ProvisionsProvisions are liabilities of uncertain timing and amount and are recognised where there is a present legal or constructive obligation as a result of a past event and when the outfl ow of resources embodying economic benefi ts is probable and a reliable estimate can be made of the amount of the obligation. Provisions are reviewed at the end of each reporting period.
(i) Provisions – Employee Benefi tsAll annual leave and long service leave provisions are in respect of employees’ services up to the end of the reporting period.
Annual LeaveAnnual leave is not expected to be settled wholly within 12 months after the end of the reporting period and is therefore considered to be ‘other long-term employee benefi ts’. The annual leave liability is recognised and measured at the present value of amounts expected to be paid when the liabilities are settled using the remuneration rate expected to apply at the time of settlement.
When assessing expected future payments consideration is given to expected future wage and salary levels including non-salary components such as employer superannuation contributions as well as the experience of employee departures and periods of service. The expected future payments are discounted to present value using market yields at the end of the reporting period on national government bonds with terms to maturity that match, as closely as possible, the estimated future cash outfl ows.
The provision for annual leave is classifi ed as current liability as RWWA does not have an unconditional right to defer settlement of the liability for at least 12 months after the reporting period.
Long Service LeaveA liability for long service leave is recognised after an employee has completed two years of service based on remuneration rates current as at the end of the reporting period.
The liability for long service leave expected to be settled within 12 months after the end of the reporting date is recognised and measured at the undiscounted amounts expected to be paid when the liabilities are settled. Long service leave expected to be settled more than 12 months after the end of the reporting date is measured at the present value of amounts expected to be paid when the liabilities are settled. Leave liabilities are in respect of services provided by employees up to the reporting date.
When assessing expected future payments consideration is given to expected future wage and salary levels including non-salary components such as employer superannuation contributions. In addition, the long service leave liability also considers the experience of employee departures and periods of service. The expected future payments are discounted to present value using market yields at the reporting date on national government bonds with terms to maturity that match, as closely as possible, the estimated future cash outfl ows.
Unconditional long service leave provisions are classifi ed as current liabilities as RWWA does not have an unconditional right to defer settlement of the liability for at least 12 months after the reporting period. Pre-conditional and conditional long service leave provisions are classifi ed as non-current liabilities because RWWA has an unconditional right to defer the settlement of the liability until the employees has completed the requisite years of service.
SuperannuationThe Government Employees Superannuation Board (GESB) and other funds administer public sector superannuation arrangements in Western Australia in accordance with legislative requirements. Eligibility criteria for membership in particular schemes for public sector employees varies according to commencement and implementation date.
Employees may contribute to the Gold State Superannuation Scheme (GSS), a defi ned benefi t lump sum scheme now closed to new members. Employees commencing employment prior to 16 April 2007 who were not members of GSS became non-contributory members of the West State Superannuation Scheme (WSS). Employees commencing employment on or after 16 April 2007 became members of the GESB Super Scheme (GESBS). From 30 March 2012, existing members of WSS or GESBS and new employees became able to choose their preferred superannuation fund. RWWA makes concurrent contributions to GESB or other funds on behalf of employees in compliance with the Commonwealth Government’s Superannuation Guarantee (Administration) Act 1992. Contributions to these accumulation schemes extinguish RWWA’s liability for superannuation charges in respect of employees who are not members of the Pension Scheme or GSS.
The GSS Scheme, the WSS Scheme, and the GESBS, where the current service superannuation charge is paid by RWWA to the GESB, are defi ned contribution schemes. The liabilities for current service superannuation charges under the GSS, the WSS, and the GESBS are extinguished by the concurrent payment of employer contributions to the GESB.
The GSS is a defi ned benefi t scheme for the purposes of employees and whole-of-government reporting. However, from an agency perspective, apart from the transfer benefi ts, it is a defi ned contribution plan under AASB 119.
AMP manages the AMP Custom Superannuation Fund, an accumulation fund for casual staff.
(ii) Provisions – OtherEmployment on-costs, including workers’ compensation insurance and payroll tax, are not employee benefi ts and are recognised separately as liabilities and expenses when the employment to which they relate has occurred. Employment on-costs are included as part of ‘Other expenses’ and are not included as part of RWWA’s ‘Employee benefi ts expense’. The related liability is included in ‘Employment on-costs provision.’
Notes to the Financial Statements

ANNUAL REPORT 2013 – 2014RACING AND WAGERING WESTERN AUSTRALIA46 47
Disclosures andlegal compliance
Notes to the Financial Statements
(t) Superannuation ExpenseSuperannuation expense is recognised in the Statement of Comprehensive Income in profi t or loss for defi ned contribution plans, including the concurrent payment of employer contributions to the GSS scheme, as and when the contribution falls due.
(u) Comparative FiguresComparative fi gures are, where appropriate, reclassifi ed to be comparable with the fi gures presented in the current fi nancial year.
In compliance with Australian Accounting Standard AASB 1004 ‘Contributions’, in the current year RWWA has recognised contributions received from Royalties for Regions and Racecourse Infrastructure Grants Program as income in the statement of comprehensive income and restated the prior year fi gures to bring them in line with current year fi gures. The restatement of prior year fi gures has resulted in an increase in prior year comprehensive income of $946,000 and total equity by $5,749,000.
Key Sources of Estimation UncertaintyKey estimates and assumptions concerning the future are based on historical experience and various other factors that have a signifi cant risk of causing a material adjustment to the carrying amount of assets and liabilities within the next fi nancial year.
Long Service LeaveSeveral estimations and assumptions used in calculating RWWA’s long service leave provision include expected future salary rates, discount rates, employee retention rates and expected future payments. Changes in these estimations and assumptions may impact on the carrying amount of the long service leave provision.
Disclosure of Changes in Accounting Policy and Estimates
Initial application of an Australian Accounting StandardRWWA has applied the following Australian Accounting Standards effective for annual reporting periods beginning on or after 1 August 2013 that impacted on RWWA:
AASB 13 Fair Value MeasurementThis Standard defi nes fair value, sets out a framework for measuring fair value and requires additional disclosures for assets and liabilities measured at fair value. There is no fi nancial impact
AASB 119 Employee Benefi tsThis Standard supersedes AASB 119 (October 2010), making changes to the recognition, presentation and disclosure requirements.
RWWA assessed employee leave patterns to determine whether annual leave is a short-term or other long-term employee benefi t. The resultant discounting of annual leave liabilities that were previously measured at the undiscounted amounts is not material.
AASB 1048 Interpretation of StandardsThis Standard supersedes AASB 1048 (June 2012), enabling references to the Interpretations in all other Standards to be updated by reissuing the service Standard. There is no fi nancial impact.
AASB 2011-8 Amendments to Australian Accounting Standards arising from AASB 13 [AASB 1, 2, 3, 4, 5, 7, 9, 2009-11, 2010-7, 101, 102, 108, 110, 116, 117, 118, 119, 120, 121, 128, 131, 132, 133, 134, 136, 138, 139, 140, 141, 1004, 1023 & 1038 and Int 2, 4, 12, 13, 14, 17, 19, 131 & 132]This Standard replaces the existing defi nition and fair value guidance in other Australian Accounting Standards and Interpretations as the result of issuing AASB 13 in September 2011. There is no fi nancial impact.
AASB 2011-10 Amendments to Australian Accounting Standards arising from AASB 119 (September 2011)[AASB 1, 8, 101, 124, 134, 1049 & 2011-8 and Int 14]This Standard makes amendments to other Australian Accounting Standards and Interpretations as a result of issuing AASB 119 in September 2011. The resultant discounting of annual leave liabilities that were previously measured at the undiscounted amounts is not material.
AASB 2012-2 Amendments to Australian Accounting Standards – Disclosures – Offsetting Financial Assets and Financial Liabilities [AASB 7 & 132]This Standard amends the required disclosures in AASB 7 to include information that will enable users of an entity’s fi nancial statements to evaluate the effect or potential effect of netting arrangements, including rights of set-off associated with the entity’s recognised fi nancial assets and recognised fi nancial liabilities, on the entity’s fi nancial position. There is no fi nancial impact.
AASB 2012-5 Amendments to Australian Accounting Standards arising from Annual Improvements 2009-11 Cycle [AASB 1, 101, 116, 132 & 134 and Int 2]This Standard makes amendments to the Australian Accounting Standards and Interpretations as a consequence of the annual improvements process. There is no fi nancial impact.
AASB 2012-6 Amendments to Australian Accounting Standards – Mandatory Effective Date of AASB 9 and Transition Disclosures [AASB 9, 2009-11, 2010-7, 2011-7 & 2011-8]This Standard amends the mandatory effective date of AASB 9 Financial Instruments to 1 January 2015 (instead of 1 January 2013). Further amendments are also made to numerous consequential amendments arising from AASB 9 that will now apply from 1 January 2015. There is no fi nancial impact.
AASB 2012-9 Amendment to AASB 1048 arising from the Withdrawal of Australian Int 1039The withdrawal of Int 1039 Substantive Enactment of Major Tax Bills in Australia has no fi nancial impact for RWWA during the reporting period and at balance date. Measurement of tax assets and liabilities continues to be measured in accordance with enacted or substantively enacted tax law pursuant to AASB 112.46-47.
AASB 2012-10 Amendments to Australian Accounting Standards – Transition Guidance and Other Amendments [AASB 1, 5, 7, 8, 10, 11, 12, 13, 101, 102, 108, 112, 118, 119, 127, 128, 132, 133, 134, 137, 1023, 1038, 1039, 1049 & 2011-7 and Int 12]The Standard introduces a number of editorial alterations and amends the mandatory application date of Standards for not-for-profi t entities accounting for interests in other entities. There is no fi nancial impact.
AASB 2013-9 Amendments to Australian Accounting Standards – Conceptual Framework, Materiality and Financial Instruments.Part A of this omnibus Standard makes amendments to other Standards arising from revisions to the Australian Accounting Conceptual Framework for periods ending on or after 20 December 2013. Other Parts of this Standard become operative in later periods. There is no fi nancial impact for Part A of the Standard.
Notes to the Financial Statements
DONE

ANNUAL REPORT 2013 – 2014RACING AND WAGERING WESTERN AUSTRALIA48 49
Disclosures andlegal compliance
Notes to the Financial Statements
DONE
Future impact of Australian Accounting Standards not yet operativeRWWA cannot early adopt an Australian Accounting Standard unless specifi cally permitted by TI 1101 ‘Applications of Australian Accounting Standards and Other Pronouncements’. Consequently, RWWA has not applied the following Australian Accounting Standards and Australian Accounting Interpretations that have been issued but are not yet effective. Where applicable, RWWA plans to apply these Standards and their interpretations from their application date:
Title Operative for reporting periods beginning on/after
Int 21 LeviesThis Interpretation clarifi es the circumstances under which a liability to pay a government levy imposed should be recognised. There is no fi nancial impact for RWWA at reporting date.
1 Jan 2014
AASB 9 Financial InstrumentsThis Standard supersedes AASB 139 Financial Instruments:Recognition and Measurement, introducing a number of changes to accounting treatments.The mandatory application date of this Standard was amended to 1 January 2018 by AASB 2014-1RWWA has not yet determined the application or the potential impact of the Standard.
1 Jan 2018
AASB 10 Consolidated Financial StatementsThis Standard, issued in August 2011, supersedes AASB 127 Consolidated and Separate Financial Statements and Int 112 Consolidation – Special Purpose Entities, introducing a number of changes to accounting treatments.Mandatory application of this Standard was deferred by AASB 2012-10 Amendments to Australian Accounting Standards – Transition Guidance and Other Amendments. The adoption of the new Standard has no fi nancial impact for RWWA as it does not impact accounting for related bodies and the Authority has no interests in other entities.
1 Jan 2014
AASB 11 Joint ArrangementsThis Standard, issued in August 2011, supersedes AASB 131 Interests in Joint Ventures, introduces new principles for determining the type of joint arrangement that exists, which are more aligned to the actual rights and obligations of the parties to the arrangement.Mandatory application of this Standard was deferred for not-for-profi t entities by AASB 2012-10. RWWA has not yet determined the application or the potential impact of the Standard.
1 Jan 2014
AASB 12 Disclosure of Interests in Other EntitiesThis Standard, issued in August 2011, supersedes disclosure requirements in AASB 127 Consolidated and Separate Financial Statements, AASB 128 Investments in Associates and AASB 131 Interests in Joint Ventures.Mandatory application of this Standard was deferred for not-for-profi t entities by AASB 2012-10. RWWA has not yet determined the application or the potential impact of the Standard.
1 Jan 2014
AASB 14 Regulatory Deferral AccountsRWWA has not yet determined the application or the potential impact of the Standard.
1 Jan 2016
Title Operative for reporting periods beginning on/after
AASB 127 Separate Financial Statements
This Standard, issued in August 2011, supersedes AASB 127 Consolidated and Separate Financial Statements, removing the consolidation requirements of the earlier standard whilst retaining accounting and disclosure requirements for the preparation of separate fi nancial statements. Mandatory application was deferred for not-for-profi t entities by AASB 2012-10.
There is no fi nancial impact.
1 Jul 2014
AASB 128 Investments in Associates and Joint VenturesThis Standard supersedes AASB 128 Investments in Associates, introducing a number of clarifi cations for the accounting treatments of changed ownership interest.Mandatory application of this Standard was deferred for not-for-profi t entities by AASB 2012-10. RWWA has not yet determined the application or the potential impact of the Standard.
1 Jan 2014
AASB 1031 MaterialityThis Standard supersedes AASB 1031 (February 2010), removing Australian guidance on materiality not available in IFRSs and refers to guidance on materiality in other Australian pronouncements. RWWA has not yet determined the application or the potential impact of the Standard.
1 Jan 2014
AASB 1055 Budgetary ReportingThis Standard requires specifi c budgetary disclosures in the general purpose fi nancial statements of not-for-profi t entities within the General Government Sector. The Department will be required to disclose additional budgetary information and explanations of major variances between actual and budgeted amounts, though there is no fi nancial impact.
1 Jan 2014
AASB 2009-11 Amendments to Australian Accounting Standardsarising from AASB 9 [AASB 1, 3, 4, 5, 7, 101, 102, 108, 112, 118, 121, 127, 128, 131, 132, 136, 139,1023 & 1038 and Int 10 & 12][modifi ed by AASB 2010-7]
1 Jan 2015
AASB 2010-7 Amendments to Australian Accounting Standards arising from AASB 9 (December 2010) [AASB 1, 3, 4, 5, 7, 101, 102, 108, 112, 118, 120, 121, 127, 128, 131,132, 136, 137, 139, 1023 & 1038 and Int 2, 5, 10, 12,19 & 127]This Standard makes consequential amendments to other Australian Accounting Standards and Interpretations as a result of issuing AASB 9 in December 2010.RWWA has not yet determined the application or the potential impact of the Standard.
1 Jan 2015
AASB 2011-7 Amendments to Australian Accounting Standards arising from the Consolidation and Joint Arrangements Standards [AASB 1, 2, 3, 5, 7, 101, 107, 112, 118,121, 124, 132, 133, 136, 138, 139, 1023 & 1038 and Int 5, 9, 16 & 17]This Standard gives effect to consequential changes arising from the issue of AASB 10, AASB 11, AASB 127 Separate Financial Statements and AASB 128 Investments in Associates and Joint Ventures. Mandatory application was deferred for not for- profi t entities by AASB 2012-10. RWWA has not yet determined the application or the potential impact of the Standard.
1 Jan 2014
Notes to the Financial Statements

ANNUAL REPORT 2013 – 2014RACING AND WAGERING WESTERN AUSTRALIA50 51
Disclosures andlegal compliance
Notes to the Financial Statements
Title Operative for reporting periods beginning on/after
AASB 2012-3 Amendments to Australian Accounting Standards – Offsetting Financial Assets and Financial Liabilities [AASB 132]This Standard adds application guidance to AASB 132 to address inconsistencies identifi ed in applying some of the offsetting criteria, including clarifying the meaning of “currently has a legally enforceable right of set-off” and that some gross settlement systems may be considered equivalent to net settlement. RWWA does not routinely hold fi nancial assets and liabilities that it intends to settle on a net basis, therefore there is no fi nancial impact.
1 Jan 2014
AASB 2013-3 Amendments to AASB 136 – Recoverable Amount Disclosures for Non-Financial Assets.This Standard introduces editorial and disclosure changes. There is no fi nancial impact.
1 Jan 2014
AASB 2013-4 Amendments to Australian Accounting Standards – Novation of Derivatives and Continuation of Hedge Accounting [AASB 139]This Standard permits the continuation of hedge accounting in circumstances where a derivative, which has been designated as a hedging instrument, is novated from one counterparty to a central counterparty as a consequence of laws or regulations.RWWA does not routinely enter into derivatives or hedges, therefore there is no fi nancial impact.
1 Jan 2014
AASB 2013-8 Amendments to Australian Accounting StandardsAustralian Implementation Guidance for Not-for-Profi t Entities – Control and Structured Entities [AASB 10, 12 & 1049].The amendments, issued in October 2013, provide signifi cant guidance in determining whether a not-for-profi t entity controls another entity when fi nancial returns are not a key attribute of the investor’s relationship. The Standard has no fi nancial impact in its own right, rather the impact results from the adoption of the amended AASB 10.
1 Jan 2014
AASB 2013-9 Amendments to Australian Accounting Standards Conceptual Framework, Materiality and Financial Instruments.This omnibus Standard makes amendments to other Standards arising from the deletion of references to AASB 1031 in other Standards for periods beginning on or after 1 January 2014 (Part B), and, defers the application of AASB 9 to 1 January 2017 (Part C). The application date of AASB 9 was subsequently deferred to 1 January 2018 by AASB 2014-1. RWWA has not yet determined the application or the potential impact of AASB9, otherwise there is no fi nancial impact for Part B.
1 Jan 20141 Jan 2017
AASB 2014-1 Amendments to Australian Accounting StandardsRWWA has not yet determined the application or potential impact of the Standard.
1 Jul 20141 Jan 20151 Jan 20161 Jan 2018
Notes to and Forming Part of the Financial Statements
2014 2013$000 $000
2 MarginMargin on Turnover inclusive of GST 367,252 342,591 Goods and Services Tax (27,778) (26,850)
339,474 315,741
The Goods and Services Tax (GST) is not applied to the consumption of gambling services. It is however, applied to the operator’s margin defi ned as the subscription (wagering less sales commission) less the amount of prizes (dividends).The State provides reimbursement to gaming operators (including RWWA) for GST paid on the operator’s margin on Fixed Odds Betting and Parimutuel Sports.Treasurer’s Instruction 1102 requires the GST reimbursement to be disclosed as a grant from the State Government rather than offset against the cost to which it applies.
3 Wagering TaxTax on turnover 5,959 2,711 Tax on margin 36,757 37,706
42,716 40,417
4 Other RevenueOther Revenue 9,830 9,527 Unclaimed dividends (Racing) 8,572 8,253 Dividends 4 -
18,406 17,780
5 Net (loss)/gain on disposal of Property, Plant, Equipment and VehiclesProceeds from disposal 659 2,672 Cost of disposal (960) (2,415)Net (loss)/gain (301) 257
6 Racing, Wagering and Support ServicesEmployee Benefi t Expense 35,280 33,498 Depreciation and Amortisation Expense 12,735 12,495 Finance Costs 24 28 Supplies and Services 45,617 45,936 Advertising and Promotions 17,477 16,955 Communications 5,201 5,088 Accommodation 7,406 7,244 Other Expenses 7,163 6,926
130,903 128,170
DONE

ANNUAL REPORT 2013 – 2014RACING AND WAGERING WESTERN AUSTRALIA52 53
Disclosures andlegal compliance
Notes to and Forming Part of the Financial Statements
2014 2013$000 $000
7 Grants and subsidiesGrants and subsidies expenseGrants 9,372 451 Subsidies 1,668 1,748 RIGP 2,092 1,317 R4R 1,425 231
14,557 3,747
8 Distributions to Racing and Sports IndustriesThoroughbreds 73,615 69,017 Harness 30,363 29,765 Greyhounds 15,775 14,880 Sports 4,452 4,003
124,205 117,665
9 InventoriesCurrentInventories not held for resale:At Cost:Tickets 365 245 Agency Spares and Consumables 204 161
569 406
10 ReceivablesCurrentReceivables 992 1,571 Accrued Revenue 303 215 Other Debtors 589 251 Allowance for impairment of receivables (20) (20)
1,864 2,017
Reconciliation of changes in the allowance for impairment of receivables:Balance at start of year 20 20 Doubtful debts expense recognised in the income statement 223 68 Amounts written off during the year (223) (68)Balance at end of year 20 20
RWWA does not hold any collateral as security or other credit enhancements relating to receivables.
DONE
Notes to and Forming Part of the Financial Statements
2014 2013$000 $000
11 InvestmentsNon currentAt cost:Unlisted Shares 352 352
352 352
Reconciliation
Carrying amount at start of period 352 352 Additions - - Disposals - - Carrying amount at end of period 352 352
12 Other AssetsCurrentPrepayments 6,017 5,679
6,017 5,679
Non–CurrentPrepayments 414 627
414 627
DONE

ANNUAL REPORT 2013 – 2014RACING AND WAGERING WESTERN AUSTRALIA54 55
Disclosures andlegal compliance
Notes to and Forming Part of the Financial Statements
2014 2013$000 $000
13 Non–current assets classifi ed as held for saleOpening balanceFreehold land 840 2,220 Buildings 60 78
900 2,298
Assets reclassifi ed as held for saleFreehold land 500 840 Buildings 51 60
551 900
Total assets classifi ed as held for saleFreehold land 1,340 3,060 Buildings 111 138
1,451 3,198
Less assets soldFreehold land 840 2,220 Buildings 60 77
900 2,297
Closing balanceFreehold land 500 840 Buildings 51 60
551 900
No freehold properties are in the process of being sold.
DONE
Notes to and Forming Part of the Financial Statements
2014 2013$000 $000
14 Property, Plant & EquipmentFreehold landAt fair value 21,131 20,086 Accumulated impairment losses - -
21,131 20,086 BuildingsAt fair value 9,285 7,162 Accumulated depreciation (425) (327)
8,860 6,835 Leasehold improvementsAt cost 10,490 9,389 Accumulated depreciation (7,525) (6,579)
2,965 2,810 InfrastructureAt cost 4,891 6,731 Accumulated depreciation (2,894) (3,029)
1,997 3,702 Machinery, Plant & EquipmentAt cost 3,369 3,172 Accumulated depreciation (2,224) (2,042)
1,145 1,130 Computer EquipmentAt cost 33,133 31,463 Accumulated depreciation (22,454) (19,300)
10,679 12,163 Furniture and FittingsAt cost 3,834 3,653 Accumulated depreciation (2,803) (2,397)
1,031 1,256 Motor VehiclesAt cost 3,042 2,769 Accumulated depreciation (2,059) (1,887)
983 882
48,791 48,864 Freehold land and buildings were revalued as at 1 July 2013 by Western Australian Land Information Authority. The valuations were performed during the year ended 31 July 2013 and recognised at 31 July 2013. The fair value of all land and buildings has been determined by reference to recent market transactions. In undertaking the revaluation, fair value was determined by reference to market values for land: $21,131,000 (2013: $20,086,000) and Buildings $8,577,000 (2013: $8,494,000). For the remaining balance, fair value of buildings was determined on the basis of depreciated replacement cost and fair value of land was determined on the basis of comparison with market evidence for land with low level utility (high restricted use land).Reconciliations of the carrying amounts of property, plant and equipment at the beginning and end of the reporting period are set out below.
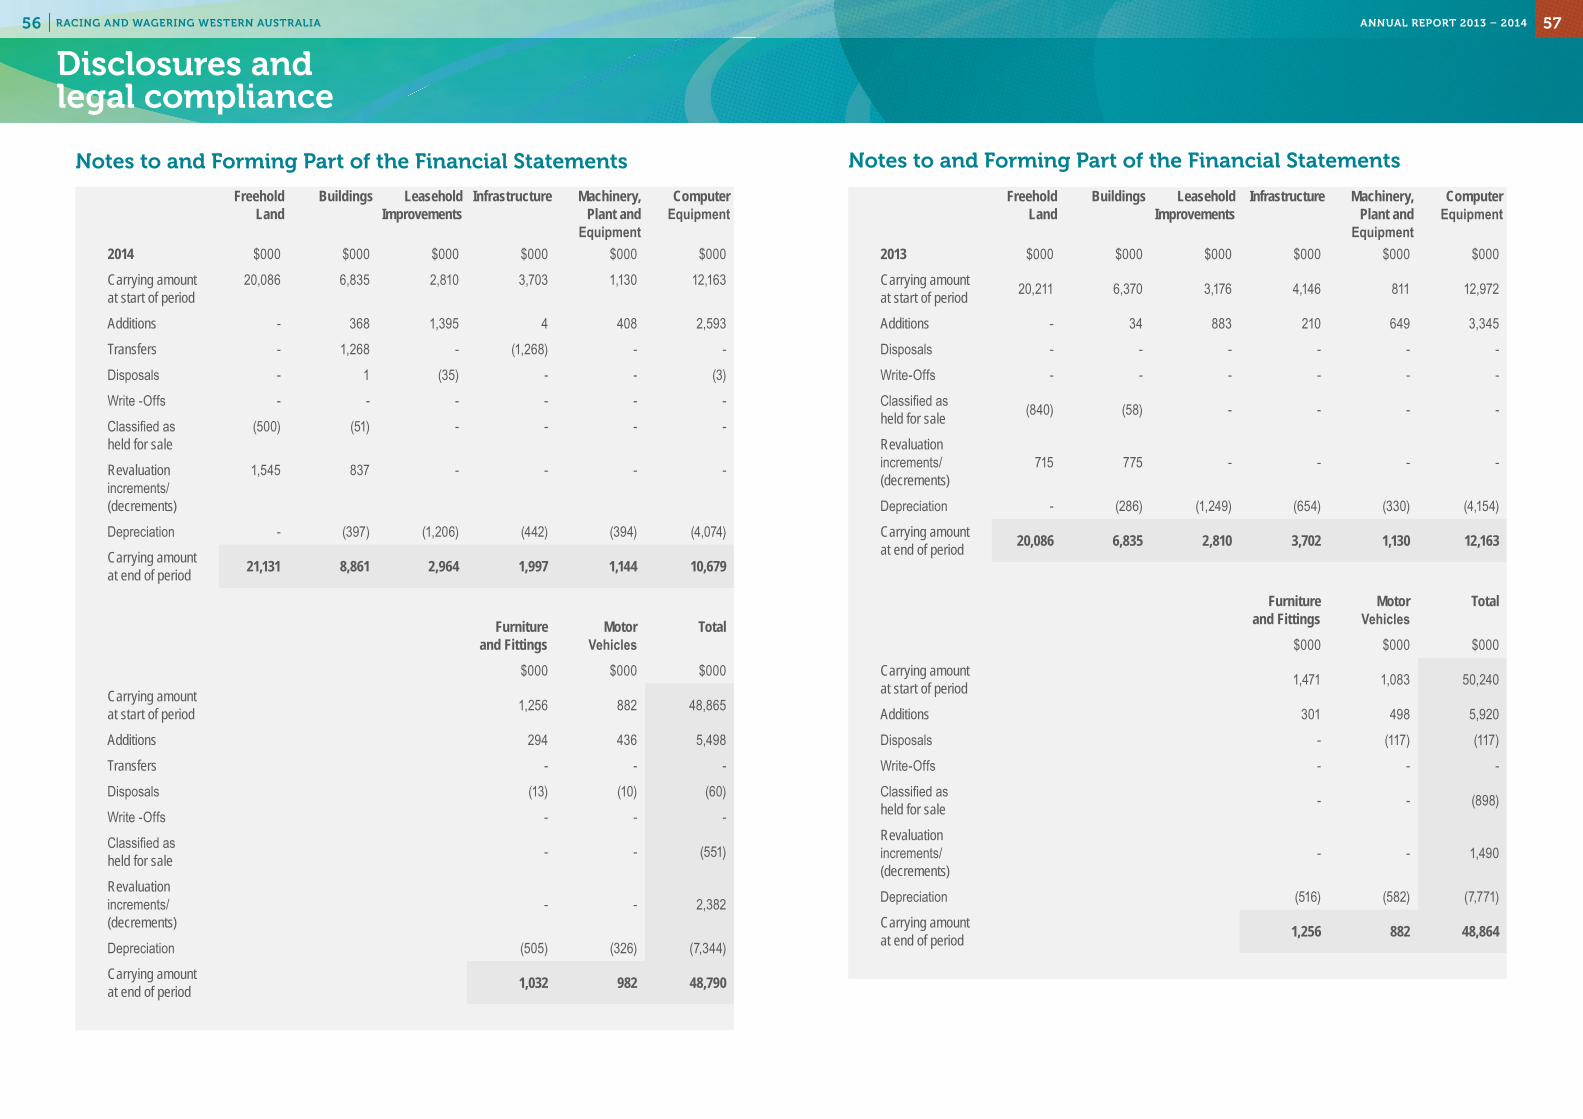
ANNUAL REPORT 2013 – 2014RACING AND WAGERING WESTERN AUSTRALIA56 57
Disclosures andlegal compliance
Notes to and Forming Part of the Financial Statements
Freehold Land
Buildings Leasehold Improvements
Infrastructure Machinery, Plant and
Equipment
Computer Equipment
2014 $000 $000 $000 $000 $000 $000
Carrying amount at start of period
20,086 6,835 2,810 3,703 1,130 12,163
Additions - 368 1,395 4 408 2,593
Transfers - 1,268 - (1,268) - -
Disposals - 1 (35) - - (3)
Write -Offs - - - - - -
Classifi ed as held for sale
(500) (51) - - - -
Revaluation increments/ (decrements)
1,545 837 - - - -
Depreciation - (397) (1,206) (442) (394) (4,074)
Carrying amount at end of period 21,131 8,861 2,964 1,997 1,144 10,679
Furniture and Fittings
Motor Vehicles
Total
$000 $000 $000
Carrying amount at start of period 1,256 882 48,865
Additions 294 436 5,498
Transfers - - -
Disposals (13) (10) (60)
Write -Offs - - -
Classifi ed as held for sale - - (551)
Revaluation increments/ (decrements)
- - 2,382
Depreciation (505) (326) (7,344)
Carrying amount at end of period 1,032 982 48,790
Notes to and Forming Part of the Financial Statements
Freehold Land
Buildings Leasehold Improvements
Infrastructure Machinery, Plant and
Equipment
Computer Equipment
2013 $000 $000 $000 $000 $000 $000
Carrying amount at start of period 20,211 6,370 3,176 4,146 811 12,972
Additions - 34 883 210 649 3,345
Disposals - - - - - -
Write-Offs - - - - - -
Classifi ed as held for sale (840) (58) - - - -
Revaluation increments/ (decrements)
715 775 - - - -
Depreciation - (286) (1,249) (654) (330) (4,154)
Carrying amount at end of period 20,086 6,835 2,810 3,702 1,130 12,163
Furniture and Fittings
Motor Vehicles
Total
$000 $000 $000
Carrying amount at start of period 1,471 1,083 50,240
Additions 301 498 5,920
Disposals - (117) (117)
Write-Offs - - -
Classifi ed as held for sale - - (898)
Revaluation increments/ (decrements)
- - 1,490
Depreciation (516) (582) (7,771)
Carrying amount at end of period 1,256 882 48,864
DONE

ANNUAL REPORT 2013 – 2014RACING AND WAGERING WESTERN AUSTRALIA58 59
Disclosures andlegal compliance
DONE
Notes to and Forming Part of the Financial Statements
15 Fair value measurementsAssets measured at fair value:
Level 1 Level 2 Level 3 Fair value at end of
period2014 $000 $000 $000 $000
Non-current assets classifi ed as held for sale (Note 13) - 551 - 551
Land (Note14) - 20,756 375 21,131
Buildings (Note 14) - 6,627 1,950 8,577
- 27,934 2,325 30,259
There were no transfers between Levels 1, 2 or 3 during the period.
Valuation techniques to derive Level 2 fair valuesLevel 2 fair values of Non-current assets held for sale, Land and Buildings are derived using the market approach. Market evidence of sales prices of comparable land and buildings in close proximity is used to determine price per square metre.
Non-current assets held for sale have been written down to fair value less costs to sell. Fair value has been determined by reference to market evidence of sales prices of comparable assets.
Fair value measurements using signifi cant unobservable inputs (Level 3)
Land Buildings2014 $000 $000
Fair value at start of period 310 1,982
Additions - -
Revaluation increments recognised in Other Comprehensive Income 65 29
Depreciation Expense - (61)
Fair value at end of period 375 1,950
Total gains or losses for the period included in profi t or loss under “Other Gains” - -
Change in unrealised gains or losses for the period included in profi t or loss for assets held at the end of the reporting period.
- -
Notes to and Forming Part of the Financial Statements
Valuation processesThere were no changes in valuation techniques during the period
Transfers in and out of a fair value level are recognised on the date of the event or change in circumstances that caused the transfer. Transfers are generally limited to assets newly classifi ed as non-current assets held for sale as Treasurer’s instructions require valuations of land, buildings and infrastructure to be categorised within Level 3 where the valuations will utilise signifi cant Level 3 inputs on a recurring basis.Fair value for existing use specialised buildings and infrastructure assets is determined by reference to the cost of replacing the remaining future economic benefi ts embodied in the asset, i.e. the depreciated replacement cost. Depreciated replacement cost is the current replacement cost of an asset less accumulated depreciation calculated on the basis of such cost to refl ect the already consumed or expired economic benefi t, or obsolescence, and optimisation (where applicable) of the asset. Current replacement cost is generally determined by reference to the market observable replacement cost of a substitute asset of comparable utility and the gross project size specifi cations.Fair value for restricted use land is based on market value, by either using market evidence of sales of comparable land that is unrestricted less restoration costs to return the site to a vacant and marketable condition (low restricted use land), or, comparison with market evidence for land with low level utility (high restricted use land).Signifi cant Level 3 inputs used by RWWA are derived and evaluated as follows:
Historical cost per square metre fl oor area (m2).
The costs of constructing specialised buildings with similar utility are extracted from fi nancial records of RWWA, then indexed by movements in CPI.Consumed economic benefi t/obsolescence of asset.
These are estimated by the Western Australian Land Information Authority (Valuation Services).
Selection of land with restricted utility.
Fair value for restricted use land is determined by comparison with market evidence for land with low level utility. Relevant comparators of land with low level utility are selected by the Western Australian Land Information Authority (Valuation Services).
Description and fair value as at 30 July 2014
Valuation technique(s)
Unobservable inputs
Range of unobservable inputs (weighted average)
Relationship of unobservable inputs to fair value
Land ($375,000)Depreciated Replacement Cost Method
Selection of land with similar approximate utility
($1.81 per m²)Higher value of similar land increases estimated fair value.
Buildings ($1,950,400)
Depreciated Replacement Cost Method
Consumed economic benefi t/obsolescence of asset
1.45% – 1.54% per year (1.49% per year)
Greater consumption of economic benefi t or increased obsolescence lowers fair value.
Historical cost per cubic metre (m³)
$556.13 – $669.31 per m² ($616.93 per m²)
Lower historical cost per cubic metre (m³) reduces fair value.
Reconciliations of the opening and closing balances are provided in Note 14.

ANNUAL REPORT 2013 – 2014RACING AND WAGERING WESTERN AUSTRALIA60 61
Disclosures andlegal compliance
Notes to and Forming Part of the Financial Statements
2014 2013$000 $000
16 Intangible AssetsComputer software
At cost 55,505 49,879
Accumulated amortisation (24,954) (19,609)
30,551 30,270
Domain names
At cost 25 25
Accumulated amortisation (18) (16)
7 9
30,558 30,279
Reconciliation
Computer software
Carrying amount at start of period 30,269 29,890
Additions 5,673 5,102
Amortisation (5,391) (4,722)
Carrying amount at end of period 30,551 30,270
Domain names
Carrying amount at start of period 9 12
Amortisation (2) (3)
Carrying amount at end of period 7 9
30,558 30,279 17 Impairment of Assets
There were no indications of impairment to property, plant and equipment and intangible assets at 31 July 2014.RWWA held no intangible assets with an indefi nite useful life during the reporting period.No surplus assets are held by RWWA as at 31 July 2014.
Notes to and Forming Part of the Financial Statements
2014 2013$000 $000
18 PayablesCurrentTrade Payables 6,628 4,159
Unclaimed dividends and refunds 6,654 6,534
TAB Payables and Account betting deposits 14,113 12,288
Other Payables 5,212 4,409
GST Payable 1,660 1,811
Accrued Expenses 6,589 7,028
40,856 36,229 Non CurrentAgents deposits and property bonds 1,040 1,000
1,040 1,000

ANNUAL REPORT 2013 – 2014RACING AND WAGERING WESTERN AUSTRALIA62 63
Disclosures andlegal compliance
Notes to and Forming Part of the Financial Statements
2014 2013$000 $000
19 ProvisionsCurrentEmployee benefi ts provisionAnnual Leave (a) 2,451 2,105 Long Service Leave (b) 3,905 2,478
6,356 4,583 Other provisionsEmployment on–costs (c ) 376 692
376 692
6,732 5,275 Non CurrentEmployee benefi ts provisionLong Service Leave (b) 729 1,411
729 1,411 Other provisionsEmployment on–costs (c ) 79 206
79 206
808 1,617 (a) Annual leave liabilities have been classifi ed as current as there is no unconditional
right to defer settlement for at least 12 months after the reporting period. Assessments indicate that actual settlement of the liabilities is expected to occur as follows:
Within 12 months of the end of the reporting period 1,949 1,673 More than 12 months after the end of the reporting period 503 432
2,452 2,105 (b) Long service leave liabilities have been classifi ed as current as there is no unconditional right
to defer settlement for at least 12 months after the end of the reporting period. Assessments indicate that actual settlement of the liabilities is expected to occur as follows:
Within 12 months of the end of the reporting period 900 546 More than 12 months after the end of the reporting period 3,733 3,343
4,633 3,889 (c) The settlement of annual and long service leave liabilities gives rise to the payment of employment
on–costs including workers compensation premiums and payroll tax. The provision is measured at the present value of expected future payments. The associated expense, apart from the unwinding of the discount (fi nance cost), is included under ‘Other expenses’ at Note 6.
Movements in Other provisionsMovements in each class of provisions during the fi nancial year, other than employee benefi ts, are set out below.
Employment on–cost provisionCarrying amount at start of period 898 850 Additional provisions recognised 1,628 1,991 Payments/other sacrifi ces of economic benefi ts (2,071) (1,943)Carrying amount at end of period 455 898
Notes to and Forming Part of the Financial Statements
2014 2013$000 $000
20 Grants and Subsidies from State GovernmentGovernment Grant 44,739 36,782 Grants income (includes Racefi elds, RIGP and other Grant Income) 44,739 36,782
21 EquityContributed equityBalance at the start of the period 60,884 60,884 Contributions - - Distributions - - Balance at the end of the period 60,884 60,884
ReservesAsset revaluation reserve:Balance at the start of the period 17,694 16,204 Net revaluation increments/(decrements): Land 1,545 714 Buildings 837 775 Infrastructure - - Transfer to General Reserve - - Balance at the end of the period 20,076 17,693
General reserve:Balance at the start of the period 36,458 21,408 Changes in accounting policy - 4,800 Transfer from Retained Earnings 8,958 10,250 Balance at the end of the period 45,416 36,458
Balance of reserves at end of the period 65,492 54,151
Retained earningsBalance at the start of the period - - Result for the period 8,958 10,250 Transfer from Asset Revaluation Reserve - - Transfer to General Reserve (8,958) (10,250)Balance at the end of the period - -
General reserveThe purpose of the general reserve is to cushion the effect of turnover fl uctuations, or for supplementing payments made to the racing codes; to meet capital commitments, including the repayment of borrowings; to provide for capital development in the long term interests of RWWA; to meet contingent losses; and for the maintenance, repair, improvement and equipment of premises used by RWWA or its agencies.
DONE

ANNUAL REPORT 2013 – 2014RACING AND WAGERING WESTERN AUSTRALIA64 65
Disclosures andlegal compliance
Notes to and Forming Part of the Financial Statements
2014 2013$000 $000
22 Notes to the Statement of Cash FlowsCash at bank earns interest at fl oating rates based on daily bank deposit rates. Short–term deposits are made for varying periods of between one and three months, depending upon the immediate cash requirements of RWWA, and earn interest at the respective short–term deposit rates. Reconciliation of cashCash at the end of the fi nancial year as shown in the Statement of Cash Flows is reconciled to the related items in the Statement of Financial Position as follows:
Cash and cash equivalentsCash at bank 16,979 25,733 Restricted cash* 3,940 969 Cash on hand 56 43 Short–term deposits 64,000 41,000
84,975 67,745 * Royalties for Region fund – unspent funds are committed to projects and programs in WA regional areas.
Reconciliation of profi t to net cash fl ows provided by/(used in) operating activitiesProfi t/(Loss) for the period 8,958 10,250
Non cash items:Depreciation and amortisation expense 12,735 12,495 Doubtful debts expense - 68 Net (gain)/loss on sale of property, plant and equipment 301 (257)Write off of investment - 1
Grants and Subsidies from State Government (44,739) (36,782)
(Increase)/decrease in assets:Receivables / Accrued Income 153 797 Current inventories (163) (13)Prepayments (124) (2,753)
Increase/(decrease) in liabilities:Trade creditors 5,138 956 Other creditors (320) (511)Annual leave and long service leave provisions 1,091 331 Other current provisions (443) 48 Net GST Receipts/Payments - (75)Change in GST Receivables/Payables (151) -
Net cash used in operating activities (17,564) (15,445)
DONE
Notes to and Forming Part of the Financial Statements
2014 2013$000 $000
23 Financial Instruments
(a) Financial Risk Management objectives and policies
Financial Instruments held by RWWA are cash and cash equivalents, receivables, payables and agent deposits.RWWA has limited exposure to fi nancial risks. RWWA’s overall risk management programme focuses on managing the risks identifi ed below.
Credit RiskCredit risk arises when there is the possibility of RWWA’s receivables defaulting on their contractual obligations resulting in fi nancial loss to RWWA. The majority of the authority’s trading with customers is conducted on a cash basis. In addition, receivable balances are monitored on an ongoing basis with the result that the RWWA’s exposure to bad debts is minimal. At the end of the reporting period there were no signifi cant concentrations of credit risk.
The maximum exposure to credit risk at the end of the reporting period in relation to each class of recognised fi nancial assets is the gross carrying amount of those assets inclusive of any provisions for impairment.
Liquidity RiskLiquidity risk arises when RWWA is unable to meet its fi nancial obligations as they fall due. RWWA is exposed to liquidity risk through its trading in the normal course of business. RWWA has appropriate procedures to manage cash fl ows by monitoring forecast cashfl ows to ensure that suffi cient funds are available to meet its commitments.
Market RiskMarket risk is the risk that changes in market prices such as foreign exchange rates and interest rates will affect RWWA’s income or the value of its holdings of fi nancial instruments. RWWA does not trade in foreign currency and is not materially exposed to other price risks [for example, equity securities or commodity prices changes]. The Authority has no such exposure.
RWWA has limited exposure to foreign currency risk on purchases that are denominated in a currency other than Australian dollars.
Other than as detailed in the interest rate sensitivity analysis table, RWWA’s exposure to interest rate risk is limited because it does not have any borrowings.
(b) Categories of Financial Instruments
The carrying amounts of each of the following categories of fi nancial assets and fi nancial liabilities at the end of the reporting period are:
Financial AssetsCash and cash equivalents 84,975 67,745 Receivables (a) 1,864 2,017
Financial LiabilitiesPayables (a) 39,196 34,417 Agent Deposits 1,040 1,000
(a) The amount of receivables/payables excludes GST recoverable/payables to the ATO (statutory receivable/payable).

ANNUAL REPORT 2013 – 2014RACING AND WAGERING WESTERN AUSTRALIA66 67
Disclosures andlegal compliance
(c) Financial Instrument Disclosures
Credit Risk
The following table discloses RWWA’s maximum exposure to credit risk and the ageing analysis of fi nancial assets.
RWWA’s maximum exposure to credit risk at the end of reporting period is the carrying amount of fi nancial assets as shown below.
The table discloses the ageing of fi nancial assets that are past due but not impaired and impaired fi nancial assets. The table is based on information provided to senior management of RWWA.
RWWA does not hold any collateral as security or other credit enhancements relating to the fi nancial assets it holds.
Ageing analysis of fi nancial assetsPast due but not impaired
Carrying Amount
Not past due
and not impaired
Up to 1 month
1–3 months
3 months to 1 year
1–5 years
More than 5 years
Impaired fi nancial
assets
$’000 $’000 $’000 $’000 $’000 $’000 $’000 $’0002014Cash and cash equivalents 84,975 84,975
Receivables (a) 1,864 1,522 - 326 16 - - - 86,839 86,497 - 326 16 - - -
2013Cash and cash equivalents 67,745 67,745
Receivables (a) 2,017 1,204 - 813 - - - - 69,762 68,949 - 813 - - - -
(a) The amount of receivables excludes GST recoverable/payable to the ATO (statutory receivable/payable).
Liquidity Risk and Interest Rate Exposure
The following table details RWWA’s interest rate exposure and the contractual maturity analysis of fi nancial assets and fi nancial liabilities. The maturity analysis section includes interest and principal cash fl ows. The interest rate exposure section analyses only the carrying amounts of each item.
Notes to and Forming Part of the Financial Statements
Inte
rest
rate
expo
sure
and
mat
urity
analy
sis o
f fi n
ancia
l ass
ets a
nd fi
nanc
ial lia
bilit
ies
Inte
rest
Rat
e Exp
osur
e Ma
turit
y Dat
esW
eight
ed
Aver
age E
ffect
ive
Inte
rest
Rat
e
Carry
ing
Amou
ntFi
xed
Inte
rest
Ra
te
Varia
ble
Inte
rest
Ra
te
Non
Inte
rest
Be
arin
g
Nom
inal
Amou
ntUp
to 1
mon
th1-
3 m
onth
s3 m
onth
s to
1 ye
ar1-
5 yea
rsMo
re
than
5 ye
ars
%$0
00$0
00$0
00$0
00$0
00$0
00$0
00$0
00$0
00$0
00
2014
Finan
cial A
ssets
Cash
and c
ash
equiv
alents
3.35%
84,9
76
64,0
00
20,91
9 56
8
4,976
20
,976
64,0
00
- -
-
Rece
ivable
s (a)
1,86
4 -
- 1,
864
1,86
4 1,
522
326
16
- -
86,84
0 64
,000
20,91
9 1,
920
86,84
0 22
,498
64,32
6 16
-
-
Finan
cial L
iabilit
iesPa
yable
s (a)
39,19
6 -
- 39
,196
39,19
6 39
,196
- -
- -
Agen
t dep
osits
2.50%
1,04
0 -
1,04
0 -
1,04
0 -
- -
- 1,
040
40,23
6 -
1,04
0 39
,196
40,23
6 39
,196
- -
- 1,
040
2013
Finan
cial A
ssets
Cash
and c
ash
equiv
alents
3.72%
67,74
5 41
,000
26
,702
43
67,74
5 26
,745
41,0
00
- -
-
Rece
ivable
s (a)
2,01
7 -
- 2,
017
2,01
7 1,
204
813
- -
- 69
,762
41,00
0 26
,702
2,06
0 69
,762
27,94
9 41
,813
- -
-
Finan
cial L
iabilit
iesPa
yable
s (a)
34,4
17
- -
34,4
17
34,4
17
34,4
17
- -
- -
Agen
t dep
osits
2.75%
1,00
0 -
1,00
0 -
1,00
0 -
- -
- 1,
000
35,41
7 -
1,00
0 34
,417
35,41
7 34
,417
- -
- 1,
000
(a) T
he am
ount
of re
ceiva
bles/p
ayab
les ex
clude
s GST
reco
vera
ble/pa
yable
to th
e ATO
(stat
utory
rece
ivable
/paya
ble).
The a
moun
ts dis
close
d are
the c
ontra
ctual
undis
coun
ted ca
sh fl o
ws of
each
clas
s of fi
nanc
ial lia
bilitie
s.
Inter
est r
ate se
nsitiv
ity an
alysis
The f
ollow
ing ta
ble re
pres
ents
a sum
mary
of th
e inte
rest
rate
sens
itivity
of R
WW
A’s fi n
ancia
l ass
ets an
d liab
ilities
at th
e end
of th
e rep
ortin
g per
iod on
the
surp
lus fo
r the
perio
d for
a 1%
chan
ge in
inter
est r
ates.
It is a
ssum
ed th
at a c
hang
e in i
ntere
st ra
tes is
held
cons
tant th
roug
hout
the re
porti
ng pe
riod.
Notes to and Forming Part of the Financial Statements

ANNUAL REPORT 2013 – 2014RACING AND WAGERING WESTERN AUSTRALIA68 69
Disclosures andlegal compliance
Notes to and Forming Part of the Financial Statements
-100 basis points +100 basis pointsCarrying amount
Surplus Equity Surplus Equity
$000 $000 $000 $000 $0002014Financial AssetsCash and cash equivalents 84,975 (849) (849) 849 849
Financial LiabilitiesAgent deposits 1,040 (10) (10) 10 10 Total (Decrease)/Increase (859) (859) 859 859
-100 basis points +100 basis pointsCarrying amount
Surplus Equity Surplus Equity
$000 $000 $000 $000 $0002013Financial AssetsCash and cash equivalents 67,745 (677) (677) 677 677
Financial LiabilitiesAgent deposits 1,000 (10) (10) 10 10 Total (Decrease)/Increase (687) (687) 687 687
Fair Values
All fi nancial assets and liabilities recognised in the Statement of Financial Position, whether they are carried at cost or fair value, are recognised at amounts that represent a reasonable approximation of fair value unless otherwise stated in the applicable notes.
Notes to and Forming Part of the Financial Statements
2014 2013$000 $000
24 CommitmentsCommitments are inclusive of GST.
Capital CommitmentsCommitments in relation to capital expenditure contracted for at the reporting date but not recognised in the fi nancial statements as liabilities are payable as follows:
Within one year 3,369 1,156 3,369 1,156
The capital commitments include amounts for:Customer Information Terminals and communications upgrade 1,854 1,156 Racewalls rollout 1,342 - Software upgrades 173 -
3,369 1,156
Lease CommitmentsCommitments in relation to leases contracted for at the reporting date but not recognised in the fi nancial statements as liabilities are payable as follows:
Within one year 4,791 4,902 Later than one year but not later than fi ve years 12,561 12,826 Later than fi ve years 9,911 4,598
27,263 22,326
Representing:Non–cancellable operating leases 27,263 22,326
27,263 22,326
The non–cancellable operating lease commitments include amounts for:Property 27,263 22,326
27,263 22,326

ANNUAL REPORT 2013 – 2014RACING AND WAGERING WESTERN AUSTRALIA70 71
Disclosures andlegal compliance
Notes to and Forming Part of the Financial Statements
2014 2013$000 $000
Other Expenditure CommitmentsOther expenditure commitments contracted for at the end of the reporting period but not recognised as liabilities, are payable as follows:
Within one year 12,006 10,354 Later than one year but not later than fi ve years 7,823 16,365
19,829 26,719
25 Contingent liabilities Contract performance guarantees exist to the value of $29.7K over future rental payments on TAB Agencies.
26 Events occurring after the end of the reporting periodThere are no signifi cant post reporting period events.
27 Remuneration of members of the Accountable Authority and senior offi cersRemuneration of members of the Accountable AuthorityThe number of members of the Accountable Authority, whose total of fees, salaries, superannuation, non-monetary benefi ts and other benefi ts for the fi nancial year, fall within the following bands are:
$10,001 – $20,000 2 1 $20,001 – $30,000 2 - $30,001 – $40,000 5 6 $40,001 – $50,000 - 2 $60,001 – $70,000 1 -
Base remuneration received in relation to 2014 319 314Annual leave and long service leave accruals - -Other Benefi ts - -The total remuneration of members of the Accountable Authority is: 319 314
The total remuneration includes the superannuation expense incurred by RWWA in respect of members of the accountable authority.No members of the Accountable Authority are members of the Pension Scheme.
Notes to and Forming Part of the Financial Statements
2014 2013$000 $000
Remuneration of Senior Offi cersThe number of senior offi cers, other than senior offi cers reported as members of the Accountable Authority, whose total fees, salaries, superannuation, non–monetary benefi ts and other benefi ts for the fi nancial year, fall within the following bands are:
$40,001 – $50,000 - 1 (a)$60,001 – $70,000 - 1 (a)$120,001 – $130,000 1 - (b)$170,001 – $180,000 - 1 $180,001 – $190,000 - 1 $210,001 – $220,000 1 - $230,001 – $240,000 - 1 $240,001 – $250,000 1 - $250,001 – $260,000 1 -$260,001 – $270,000 - 1 $270,001 – $280,000 1 - $280,001 – $290,000 - 1 $300,001 – $310,000 1 - $310,001 – $320,000 - 1 $320,001 – $330,000 1 -$330,001 – $340,000 - 1 $340,001 – $350,000 1 - $620,001 – $630,000 - 1 $650,001 – $660,000 1 -
Base remuneration received in relation to 2014 2,695 2,498 Annual leave and long service leave accruals 39 6 Other Benefi ts 10 13 The total remuneration of senior offi cers is: 2,744 2,518
(a) Senior offi cers employed for partial periods of the fi nancial year in their positions.(b) New position created during the fi nancial year therefore remuneration relates to partial period of the fi nancial year.Remuneration includes any fees, salaries, superannuation, leave entitlements (annual and long service leave taken and accrued) and other benefi ts due or receivable during the year. No senior offi cers are members of the Pension Scheme.
28 Remuneration of AuditorRemuneration paid or payable to the Auditor General in respect of the audit for the current fi nancial year is as follows:
Auditing the accounts, fi nancial statements and Key performance indicators
130 124
29 Supplementary Financial InformationWrite–offs
Bad Debts Written off 235 68 235 68

ANNUAL REPORT 2013 – 2014RACING AND WAGERING WESTERN AUSTRALIA72 73
Disclosures andlegal compliance
Notes to and Forming Part of the Financial Statements
30 Schedule of Income and Expense by ServiceRacing Wagering Unallocated Total
2014 2013 2014 2013 2014 2013 2014 2013$000 $000 $000 $000 $000 $000 $000 $000
INCOMERevenueMargin - - 339,474 315,741 - - 339,474 315,741 Interest revenue - - - - 2,616 2,609 2,616 2,609 Other revenue 4,625 4,081 12,999 13,031 781 668 18,405 17,780 Gain on disposal of non–current assets - - - - - 257 - 257
Total Income 4,625 4,081 352,473 328,772 3,397 3,534 360,495 336,387
EXPENSESCost of sales - - 83,488 72,321 - - 83,488 72,321 Wagering Tax - - 42,715 40,417 - - 42,715 40,417 Racing Services 15,319 15,655 - - - - 15,319 15,655 Wagering Services - - 83,962 82,549 - - 83,962 82,549 Support Services - - - - 31,622 29,966 31,622 29,966 Projects 7 (42) 55 130 45 511 107 599 Grants and subsidies 12,889 1,999 1,668 1,748 - - 14,557 3,747 Distribution to racing and sports industries 119,753 113,662 - - 4,452 4,003 124,205 117,665
Loss on disposal of non–current assets - - - - 301 - 301 -
Total Expenses 147,968 131,274 211,888 197,165 36,420 34,480 396,276 362,919
Profi t/(Loss) before Grants and Subsidies
(143,343) (127,193) 140,585 131,607 (33,023) (30,946) (35,781) (26,532)
Grants and subsidies from State Government (GST Reimbursement)
6,441 3,363 5,104 2,296 33,194 31,123 44,739 36,782
Profi t/(Loss) for the period (136,902) (123,830) 145,689 133,903 171 177 8,958 10,250
Notes to and Forming Part of the Financial Statements
31 Explanatory StatementThis statement provides details of any signifi cant variations between the actual results for 2013 and 2014.Signifi cant variations are considered to be those in excess of 10% or $2.5M.Signifi cant variances between actual results for 2013 and 2014
Comment 2014 Actual 2013 Actual Variance$000 $000 $000
Revenue Margin (1) 339,474 315,741 23,733 Interest Revenue 2,616 2,609 7 Other Revenue 18,406 17,780 626 Gains Gain on disposals of non-current assets - 257 (257)Expenses Cost of sales (1) 83,488 72,320 11,168 Wagering Tax (1) 42,715 40,417 2,298 Racing services 15,319 15,655 (336) Wagering Services 83,962 82,549 1,413 Support Services 31,622 29,966 1,656 Projects (2) 107 599 (492) Grants and subsidies (3) 14,557 3,747 10,810 Distribution to racing and sports industries (4) 124,205 117,665 6,540 Loss on disposal of non-current assets (5) 301 - 301
Grants and subsidies from State Government (6) 44,739 36,782 7,957
Comment(1) Margin, and the associated Cost of Sales and Wagering Tax all increased against last
year due to margin generated on the enhanced FOB racing product.(2) Project costs by their nature vary year on year and for 2014 there has been a decrease in activities that have been expensed.(3) Increase in expenditure in relation to the prior year due to RWWA funded grant expenditure on the installation of
a synthetic training track at Ascot, the winterisation of the Pinjarra Thoroughbreds racetrack as well as Grants to clubs to assist with OHS related issues. In the current year we also have a full year of RfR related Grants whereas in the prior year the initiative was only available for the last two months of the fi nancial year.
(4) RWWA Distribution Policy for 2013/14 allowed for an increase in funding over 2012/13.(5) While the increase in Loss on disposals of non-current assets is greater than
10% for 2014, the gain is not of a material nature for the year.(6) Increase is the result of additional contributions received through the Royalties for Regions initiative
($3.2M), $2M received from the WA product fees received from DRGL as well as an additional $2.8M GST reimbursement mainly due to the additional margin earned on FOB racing.

ANNUAL REPORT 2013 – 2014RACING AND WAGERING WESTERN AUSTRALIA74 75
Disclosures andlegal compliance
Jeff OvensRWWA Chairman
13 October 2014
Gary GliddonAudit & Risk Committee Chairman
13 October 2014
For the Year Ended 31 July 2014We hereby certify that the key performance indicators for Racing and Wagering Western Australia (RWWA) are based on proper records, are relevant and appropriate for assisting users to assess the performance of RWWA and fairly represent the performance of RWWA for the fi nancial year ended 31 July 2014.
Certifi cation of Key Performance Indicators Key Performance Indicators for the year ended 31 July 2014
Outcome: To provide an effi cient, competitive and responsible betting service for Western Australia.Effectiveness Indicators
Description 2014Actual
2014Target
2013Actual
Result
Number of Bets Processed
The number of bets processed is an indicator of the TAB's competitiveness in the wagering and gambling marketplace.
'000 180,819 176,938 173,761 The number of bets processed for 2014 is better than the target result, primarily due to the increased turnover in Fixed Odds Products and through the mobile channel despite an increasingly competitive environment.
Primary Betting System availability
The availability of the betting system is paramount to the TAB's ability to generate revenue. The high availability target refl ects the importance RWWA places on this. A service that is reliable is necessary for the TAB's to attract and retain customers.
% 99.98 99.96 99.99 The availability of the betting system during the year is consistent with RWWA's target and prior year ratios.
Margin per employee
Margin per employee is a measure of the competitiveness of the business.
$000 939 869 Margin per employee is up on last year due to the increase in margin in 2014 particularly in Fixed Odds products, with the FTE number being in line with target and slightly less than 2013.
Profi t per employee
Profi t per employee, like margin per employee is a measure of the effi ciency of the business in delivering wagering revenue and also providing racing and integrity services to the industry.
$000 369 351 Profi t per employee is slightly higher than last year, with the increase in Operating profi ts before distributions and a slight decrease in FTE.
DONE

ANNUAL REPORT 2013 – 2014RACING AND WAGERING WESTERN AUSTRALIA76 77
Disclosures andlegal compliance
Key Performance Indicators for the year ended 31 July 2014
Effectiveness Indicators
Description 2014Actual
2014Target
2013Actual
Result
Return on assets (Operating profi t as a percentage of total assets)
Return on assets is a widely accepted indicator of the effi ciency in the use of assets.
% 75.9 77.5 79.6 Return on Assets is lower than last year and target. While the operating profi t for 2014 is higher than the result in 2013, total assets for 2014 is $16.7M higher than 2013, resulting in the decreased ROA ratio.
Staff (FTE) With staff employee benefi ts expense being one of the largest costs categories at RWWA, managing the FTE levels is an important part of ensuring an effi cient competitive business.
No. 362 362 363 The number of FTE at the end of 2013/14 is in line with the target for the year.
DONE
Key Performance Indicators for the year ended 31 July 2014
Outcome: To achieve optimum level of funding to the racing industry and for sports.Effectiveness Indicators
Description 2014Actual
2014Target
2013Actual
Result
Distribution to Industry
RWWA's primary purpose is to provide a sustainable future for the Western Australian Racing industry, achieved by maintaining the optimum level of funding to the racing industry.
$000 124,205 123,363 117,665 As per previous years, RWWA Distribution Policy for 2013/14 allowed for an increase in funding over 2012/13, with the aim of keeping distribution increases at sustainable levels.
% Change on prior year
5.6 4.8 3.4
Grants to Industry (RWWA Funded)
Grants to industry are essential to provide the safest possible racing environment and ensure the integrity of the racing product.
$000 9,494 296 244 Increase from the prior fi nancial year is the result of expenditure on the Ascot synthetic training track, winterisation of the Pinjarra Thoroughbreds racing track as well as a grant to clubs to assist with OHS related issues.
Grants to Industry (WA Government Funded)
$000 3,617 6,400 5,730 Funding of $4.4M received from Royalties for Regions however not all funding received has been allocated to race clubs. Funding is due to be assessed, allocated and spent in the next two fi nancial years.
Margin Margin is an important indicator of the capacity of RWWA to fund the racing industry and sports.
$000 339,474 315,741 Margin increased against last year as a result of a 4.3% increase in the volume of national and international races, along with solid growth and increase margin percentage in the Fixed Odds product.
Operating Profi t excluding the profi t/loss from sale of assets before distribution to codes.
Operating Profi t excluding the profi t/loss from sale of assets before distribution to codes highlights the amount of revenue that has been generated for distribution to the Racing clubs.
$000 133,464 127,658 The increase on last year is primarily as a result of the growth in margin, with continued constraint in the growth of expenditure.

ANNUAL REPORT 2013 – 2014RACING AND WAGERING WESTERN AUSTRALIA78 79
Disclosures andlegal compliance
Key Performance Indicators for the year ended 31 July 2014
Outcome: To effi ciently administer, and to provide effective leadership in the development, integrity and welfare of the racing and wagering industry in Western Australia.
Effectiveness Indicators
Description 2014Actual
2014Target
2013Actual
Result
Racing and Steward expenses per WA race meeting
The racing and stewarding functions performed by RWWA are paramount to both the development and integrity of the racing industry. In delivering these functions, RWWA ensures that the cost of delivery is keep under control, and the cost per meeting is an important indicator of how well RWWA is at controlling the cost of delivery.
$000 17.7 17.2 17.4 The targeted decrease on 2012/13 was a result of constrained increases in budgeted costs and 6 additional races. The actual change on 2012/13 was 1.94%, primarily due to increased costs incurred with one less meeting.
% Change on prior year
1.94 (1.02) 2.60
Annual Growth in TAB Turnover on WA racing
The TAB accepts bets on racing and sports product from WA, the Eastern States, and International Jurisdictions. The growth in TAB turnover on WA Racing, is an indictor that the WA product is seen as an attractive proposition, demonstrating a quality product, with high levels of integrity.
% 1.45 2.93 Modest Growth in TAB Turnover on WA Racing in 2013/14 was due to a slight reduction in the target number of meetings held and a slight reduction in fi eld sizes.
Effi ciency Indicators
Description 2014Actual
2014Target
2013Actual
Result
% of Winners Swabbed / Returned Negative
A key component in maintaining the integrity of the racing industry is an effi cient and effective drug testing regime and the "% of winners swabbed / returned negative" is a key indicator of the drug testing regime impact on the industry.
Thoroughbreds % 99.8 99.8 The result is consistent with previous years.Harness % 99.8 99.4
Greyhounds % 99.8 99.8
Average number of starters in WA Races (excluding non-TAB Meetings)
The average number of starters in WA races is an indicator of a healthy population of animals available for racing in WA.
Thoroughbreds No. 10.7 10.4 The average number of starters for Throughbreds and Greyhounds have shown a slight increase in 2014 after a slight decrease in the average starters in 2013. Harness has shown a slight dip in numbers in 2014 but the average for all three codes remain at healthy, sustainable levels.
Harness No. 9.7 10.0 Greyhounds No. 7.9 7.7
Pricing PoliciesRWWA has discretion over pricing for goods and services rendered.
Capital WorksIn Progress
Project Name Expected Yearof Completion
Expected Cost to Complete
$’000
Estimated Total Cost of Project
$’000Racing Infrastructure 14/15 69 1,890Wagering Infrastructure 14/15 1,316 3,820Support Infrastructure 14/15 1,660 6,449
Employment and Industrial Relations
Staff Profi leAs at the end of the reporting year the number of people employed at RWWA was 472 (494 in 2013). The employee profi le is expressed below as full time equivalent numbers (FTE) rather than as headcount. FTE indicates the number of hours worked and paid, divided by weekly hours of 38.0.
Employee Profi le Full Time Equivalent (FTE)2014 2013
Full time 206 210
Part time 26 29
Casuals 57 59
Maximum–term contracts 66 62
TOTAL 355 360
Industrial RelationsWithin the reporting period the RWWA General Staff Agreement 2012 and the RWWA Racing Radio 2012 Agreement were in place. These agreements are due to expire in August 2015 so re-negotiations for new staff agreements will commence in the fi rst half of 2015.
Safety, Health and Injury ManagementRWWA has recognised the need to take a lead role in guiding and supporting the racing industry in understanding and meeting its obligations under the harmonised Work Health and Safety Act and Regulations. Despite a delayed introduction the new OSH legislation is anticipated for introduction by the state government in 2015 (however an exact date is yet to be announced).
To deliver this, RWWA has prioritised dedicated resources to undertake risk identifi cation, assessment and control activities, deliver training to industry stakeholders and assist in the implementation of safety management systems at all licensed race clubs. During 2012/13 the focus was to rollout a standardised and simple to use OSH management system to each race club to support them in achieving legislative compliance and in doing so protecting the health and wellbeing of club staff, contractors and the public.
Other Financial Disclosures

ANNUAL REPORT 2013 – 2014RACING AND WAGERING WESTERN AUSTRALIA80 81
Disclosures andlegal compliance
During 2013/14 the focus has moved to monitoring the implementation of appropriate safety management system policies and procedures at each racecourse facility. This has been achieved via the completion of regular OSH system audits using a standardised audit checklist based on Australian Standard 4801:2001. The goal of the audit process is to ensure that race club committees and their staff are actively managing their OSH responsibilities whilst seeking to improve the standard of health and safety across all areas of their racecourse facility.
Also built into the race club audit process is a review of existing racecourse infrastructure which occurs in collaboration with the RWWA Stewards and the RWWA Project Manager (RIGP). This process seeks to identify issues and defi ciencies across all race club locations to enable the prioritisation of upgrades and replacement of ageing racecourse infrastructure in the coming years.
Governance DisclosuresContracts with Senior Offi cersAt the date of reporting, other than contracts of employment or Directorship appointment, no Senior Offi cers (Directors and Executives) or fi rms of which Senior Offi cers are members or entities in which Senior Offi cers have substantial interests had any interests in existing or proposed contracts with RWWA.
However, it is noted that some Senior Offi cers own (full and/or part) of racehorses and/or greyhounds which participate within Western Australia.
Insurance Premiums Paid to Indemnify Members of the BoardAn insurance policy was undertaken to indemnify members of the Board against any liability incurred under sections 13 or 14 of the Statutory Corporations (Liabilities of Directors) Act 1996. The amount of the insurance premium paid for 2014 was $16,575.
RWWA’s Corporate Governance PrinciplesRWWA’s Board strongly supports the principles of Corporate Governance and is committed to maintaining the highest standards within the organisation. This is particularly important given that RWWA has to balance commercial decisions with the welfare and integrity of the racing industry within a heavily regulated environment. This is to ensure that RWWA and the racing industry remain viable and sustainable into the future.
Board Powers, Structure, Composition and MembershipThe management of the business and affairs of RWWA is under the direction of the RWWA Board.
RWWA Act 2003 gives RWWA broad powers in relation to the management of its affairs and also in the management and regulation of the Western Australian Racing Industry.
While Gaming and Wagering Commission of Western Australia regulates RWWA’s commercial wagering activities, RWWA’s Board is not subject to government direction.
Part 2, Division 2 of RWWA Act 2003 describes how the Board is to be structured, its composition and membership.
The Board comprises: ▪ One chairperson appointed by the Minister responsible for RWWA. ▪ Four members selected for their expertise in management, fi nance, business, commerce or information technology, one of which has knowledge of and experience in regional development.
▪ Three members representing each of the racing codes – one representative from each code.
Regulatory Disclosure and Stakeholders CommunicationsA Board Member who has a notifi able interest in matters involving RWWA must conform to the following
▪ disclose this interest to the Board ▪ not vote on the matter and ▪ must not be present while the matter or resolution is being considered at the meeting
However, if the Board has passed a resolution that specifi es the Board Member, the interest and the matter and the other Board Members voting for the resolution are satisfi ed, the interest should not disqualify the Board Member from considering or voting on the matter (Sections 18 & 19, Schedule 1, clause 8(1) of the RWWA Act 2003).
RWWA complies with the requirements of disclosure as required by RWWA Act 2003, Financial Management Act 2006 and applicable Australian Accounting Standards.
RWWA maintains regular communications with its stakeholders through:
▪ Racing Industry Consultative Groups ▪ TAB Agents Advisory Council ▪ Meetings with the Minister responsible for RWWA ▪ Communications with employees
Robust Management and Compliance ProcessesRWWA has a sound system of Risk Management, Compliance and Internal Control. Risk Management, Compliance, Internal Control framework and Governance Structure have been implemented to ensure that risks are properly managed to ensure RWWA’s ongoing viability and sound reputation. RWWA is responsible for ensuring that high standards of Risk Management and Compliance are maintained. This is monitored by the Board’s Integrity Assurance Committee, Risk Management, Compliance, Internal Audit and Stewards functions operating within the organisation. RWWA is committed to complying with all legislative requirements, including but not limited to OH&S (Occupational Health and Safety) and Equal Opportunity requirements.
Ethical Decision MakingRWWA considers the social, environmental, fi nancial and ethical impact on RWWA’s stakeholders and the community when making decisions.
RWWA has developed a Responsible Wagering Policy to guide Board Members, Employees and TAB Agents in the responsible provision of Wagering Services and to ensure that RWWA provides customers with the highest standard of customer care.
Strategy, Planning and MonitoringTo fulfi l RWWA’s Purpose, an annual Statement of Corporate Intent and a Strategic Development Plan (longer term plan) is developed which documents the plans, direction and vision for RWWA and the Racing Industry.
The Board monitors and evaluates the progress of implementing the Strategic and Business Plans of RWWA.
Encouraged Enhanced PerformanceRWWA undertakes performance appraisals of all employees, including the CEO and Executive Members as part of the Performance Management System. Annual Budgets and Business Plans are developed to meet the targets set in the Statement of Corporate Intent and the Strategic Development Plan and these are linked into RWWA’s Performance Management System.
SustainabilityRWWA considers sustainability as an important issue; not only for the organisation but also for the Western Australian Racing Industry. RWWA believes that sustainability concentrates on providing a sustainable future; focusing on economic, environmental and social elements. RWWA is continuing with the implementation of a sustainable culture within the organisation for its key stakeholders.
Key Initiatives include: ▪ Continuous OH&S audits of all race clubs ▪ Responsible Wagering Programme and Code of Conduct ▪ Equity and diversity within the workplace ▪ Ensuring the fi nancial viability of the Western Australia Racing Industry through fi nancial practices.
RWWA is committed to improving its sustainability practices and principles.
Governance Disclosures

ANNUAL REPORT 2013 – 2014RACING AND WAGERING WESTERN AUSTRALIA82 83
Disclosures andlegal compliance
AdvertisingIn compliance with section 175ZE of the Electoral Act 1907, RWWA reports that it incurred the following expenditure in relation to advertising, market research, polling, direct mail and media advertising:
Total expenditure for 2013/14 was $6.3M and was incurred as follows:
Advertising Agencies $’000303 Lowe 1,973Raging Pixels 12Sumo Group 72Engage Digital- Silverpop 54Digital Balance 168RKS Productions 103Firey Productions 37Meltwater 15Market Research AgenciesIPSOS 267Gartner Group 359Media Advertising OrganisationsHeritage FM 3Western Sports Media (Sport FM) 39FM 104.9 11The West Australian 28Croc Media 116Redwave Media 23Google Adwords 64Facebook 3Media AgenciesAdcorp 39Carat 2,849Isentia Pty Ltd (Media Monitors) 26Campaign Monitor 5Total Expenditure 6,266
Record KeepingIn accordance with Section 61 of State Records Act 2000, RWWA provides the following information in support of compliance with the State Records Commission’s Standard 2 (Principle 6).
To maintain accurate records a schedule is in place to conduct testing of records integrity on an ongoing basis. This schedule was used during 2013/14 for checks of records held at offsite storage, on RWWA’s intra-web and on central databases. The process includes cross referencing of information recorded on the intra-web with permanent and temporary records archived both onsite and offsite.
Other Legal Requirements
Occupational Safety and HealthThe RWWA executive team are committed to providing a safe and healthy working environment for all staff, contractors and visitors to the organisation. RWWA’s aim is to promote the proactive management of workplace safety, health and wellbeing based around the setting of measurable objectives and targets for improvement. These objectives and targets are designed to control high risk activities and to improve the standard of occupational safety and health management throughout RWWA and the wider racing industry in Western Australia.
RWWA’s formal mechanism for consultation currently resides in the OSH Advisory Committee which consists of key mandatory position holders as well as volunteer representatives from across the organisation. The OSH Advisory Committee meets quarterly to discuss and address risks identifi ed during the previous period. In addition to this an active hazard identifi cation and control process has been introduced at all RWWA locations the results of which are tracked via action item summaries. Internal staff OSH training has also received more focused attention with the rollout of OSH modules within the ONTrack training system. Some RWWA staff members have also completed external training courses as deemed necessary for their roles which included fi rst aid, building evacuations, working at heights, electrical equipment testing and tagging and operating chainsaws.
Importantly RWWA’s OSH management system including its policies and procedures are compliant with the injury management requirements of the Workers’ Compensation and Injury Management Act 1981, including the development of return to work plans for injured staff. Regular workers compensation case reviews are also conducted with RiskCover WA representatives to ensure claims are being appropriately managed and are also being closed out as quickly as possible.
Insurance and Loss Time Injury Table
Measure Actual results Results against target2011/12(1) 2013/14 (2) Target Comment on result
Number of fatalities 0 0 0 Target achieved
Lost time injury and/or disease incidence rate 1.12 0.28
0 or 10% reduction(3)
(actual target can be stated)
Target achieved
Lost time injury and/or disease severity rate 25 0
0 or 10% reduction(3)
(actual target can be stated)
Target achieved
Percentage of injured workers returned to work:
Target achieved (i) within 13 weeks 75% 100% Actual result to be stated
Greater than or equal to 80% (ii) within 26 weeks 75% 100%
Percentage of managers trained in occupational safety, health and injury management responsibilities
28% 29% Greater than or equal to 80%
Target not met – still building further
capability in this area
Note (1) This is a three-year trend and as such the year is to be three years prior to current reporting year (i.e. current year is 2013/14 and comparison year is 2011/12).
Note (2) The current year i.e. 2013/14. Note (3) The reduction may be calculated over a three year period.
Government Policy Requirements

14 Hasler RoadOsborne Park WA 6017T: (08) 9445 5333T: (08) 9445 5333F: (08) 9244 5914F: (08) 9244 5914www.rwwa.com.auwww.rwwa.com.au