Embed Size (px)
Citation preview
WAGERING WORKING PARTY
WAGERING REPORT
OCTOBER 2014
Wagering Working Panel Wagering Report October 2014
Pag
e2
Background
Concern over a range of wagering matters prompted Harness Racing Australia (HRA) to appoint
a special committee, the Wagering Working Party, in late 2013 to examine wagering issues and
make recommendations as to how turnover can be boosted, with a resultant increase in
industry funding.
The members of the Working Party appointed by the HRA Executive were Ross Cooper –
Chairman, Sam Nati, Harvey Kaplan and Shane Anderson, with Andrew Kelly fulfilling the
secretariat position.
Terms of Reference for The Panel were:
To determine ways to grow wagering turnover on harness racing
To identify ways to broaden the appeal of Australian harness racing as a wagering
proposition
To examine ways of making information more readily accessible to the punting public
To examine ways to attract and retain both new and existing customers
Once established, The Panel met regularly to plan activities to assist in the development of a
breeding industry plan which can be owned by the entire industry.
The need to review and update current statistical data, along with effective industry
engagement were considered priorities.
Wagering Working Panel Wagering Report October 2014
Pag
e3
Current Wagering Position
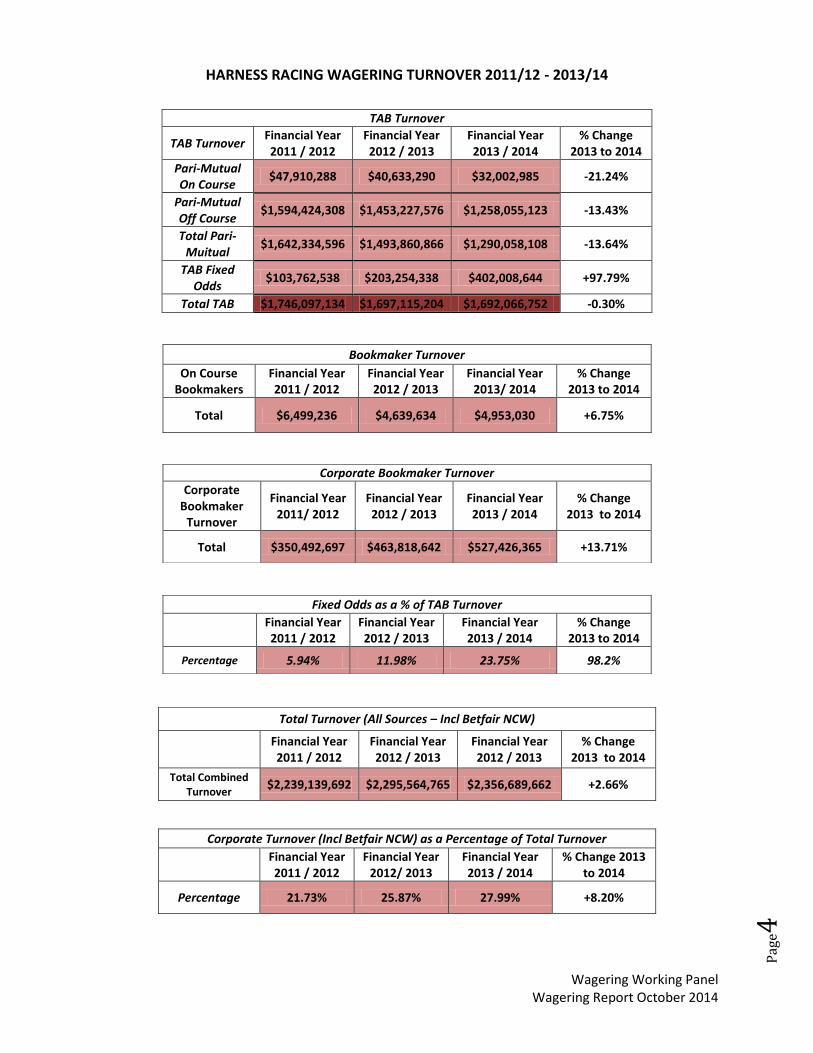
Given that wagering is critical to fund the harness racing industry, the increase in total turnover
in 2013/14 of more than $61-million – or 2.66% – to almost $2.4-billion was pleasing. The
increasing popularity of fixed price betting and corporate bookmakers requires careful
management and constant monitoring, particularly with respect to TAB fixed odds yields and
the lower returns to the industry from corporate bookmakers.
Total TAB turnover (pari-mutuel and fixed odds) at almost $1.7-billion was down marginally on
the previous year but the pari-mutuel component, of $1.29-billion, was down $204-million or
almost 14%. Fixed odds betting with the TABs was $402-million, up a stunning 98%, the second
year running it had almost doubled in turnover volume.
The growth of turnover with corporate bookmakers provided further evidence that the
industry’s traditional funding model, of dependence on TAB distributions, has been seriously
eroded. Turnover with the corporates rose almost 14% to just over $527.4-million.
Betting exchange operator, Betfair, had net customer winnings - the criteria used to determine
commission payments to the industry - increase almost two percent on the prior year but still
well down on 2011-2012 figures.
In a stark reminder of why the race fields legislation has been so critical to the industry, the
statistics show the corporate bookmakers’ share of total turnover rose by more than 8% and
now stands at 28%.
Some jurisdictions have increased the commission paid by the corporates and it will be
interesting to see the impact this has on industry funding in the years ahead.
The tables on the next page provide the detail of wagering activity on harness racing in the past
three financial years.
Wagering Working Panel Wagering Report October 2014
Pag
e4
HARNESS RACING WAGERING TURNOVER 2011/12 - 2013/14
TAB Turnover
TAB Turnover Financial Year 2011 / 2012
Financial Year 2012 / 2013
Financial Year 2013 / 2014
% Change 2013 to 2014
Pari-Mutual On Course
$47,910,288 $40,633,290 $32,002,985 -21.24%
Pari-Mutual Off Course
$1,594,424,308 $1,453,227,576 $1,258,055,123 -13.43%
Total Pari-Muitual
$1,642,334,596 $1,493,860,866 $1,290,058,108 -13.64%
TAB Fixed Odds
$103,762,538 $203,254,338 $402,008,644 +97.79%
Total TAB $1,746,097,134 $1,697,115,204 $1,692,066,752 -0.30%
Bookmaker Turnover
On Course Bookmakers
Financial Year 2011 / 2012
Financial Year 2012 / 2013
Financial Year 2013/ 2014
% Change 2013 to 2014
Total $6,499,236 $4,639,634 $4,953,030 +6.75%
Corporate Bookmaker Turnover
Corporate Bookmaker
Turnover
Financial Year 2011/ 2012
Financial Year 2012 / 2013
Financial Year 2013 / 2014
% Change 2013 to 2014
Total $350,492,697 $463,818,642 $527,426,365 +13.71%
Fixed Odds as a % of TAB Turnover Financial Year
2011 / 2012 Financial Year 2012 / 2013
Financial Year 2013 / 2014
% Change 2013 to 2014
Percentage 5.94% 11.98% 23.75% 98.2%
Total Turnover (All Sources – Incl Betfair NCW)
Financial Year 2011 / 2012
Financial Year 2012 / 2013
Financial Year 2012 / 2013
% Change 2013 to 2014
Total Combined Turnover
$2,239,139,692 $2,295,564,765 $2,356,689,662 +2.66%
Corporate Turnover (Incl Betfair NCW) as a Percentage of Total Turnover
Financial Year 2011 / 2012
Financial Year 2012/ 2013
Financial Year 2013 / 2014
% Change 2013 to 2014
Percentage 21.73% 25.87% 27.99% +8.20%
Wagering Working Panel Wagering Report October 2014
Pag
e5
The Process
The Working Party determined the Terms of Reference would be best fulfilled via an industry
based survey complemented by external interviews with the three TAB wagering operators and
selected professional punters.
From this, a set of realistic recommendations could flow which were based on survey data,
wagering experts and evidence based information.
The first step was an exhaustive survey which attracted almost 1,000 respondents. Determining
why and how people bet, and what factors influence their wagering decisions, was a primary
objective of the survey – and there were some interesting results.
Step two were interviews with TAB wagering operators and selected professional punters in
order to stress test the veracity of survey responses, as well as gaining an insight into the
industry from their own perspective and customer feedback.
The similarity between the industry survey feedback and the information gathered from the
interviews gave the Working Party great confidence in the data and in turn the
recommendations which could be made.
A weakness in the process was not directly hearing from the large number of casual punters
who wager on harness racing - however, the Working Party took the view early in the piece that
recommendations which enhanced the likelihood of investment from the most regular
customers would have a positive impact on less frequent or engaged customers.
Wagering Working Panel Wagering Report October 2014
Pag
e6
The Findings
The major body of work undertaken was a large scale on-line survey which attracted almost
1000 responses - the majority of whom described themselves as either 'Professional' or
'Frequent' Punters.
The survey was complemented by meetings and interviews with each of the three Australian
TAB's and a number of professional punters which were designed to discuss how these
organisations viewed harness racing as a wagering proposition as well as providing an
opportunity to test the veracity of the survey results.
It is also important to note that the recommendations of the Wagering Working Party have
been deliberately designed so as to not negatively impact or alienate any one particular harness
racing wagering customer segment - which is important given there are behavioral differences
between the Professional and Frequent punters which affect investment.
Complete unedited versions of the survey have been provided to all HRA Members in report
form - covering not only the national responses, but also the State by State responses.
While the detail below explores some of the interesting differences between States, the
Working Party dealt with the National Aggregate Report and TAB wagering operator feedback
to determine recommendations.
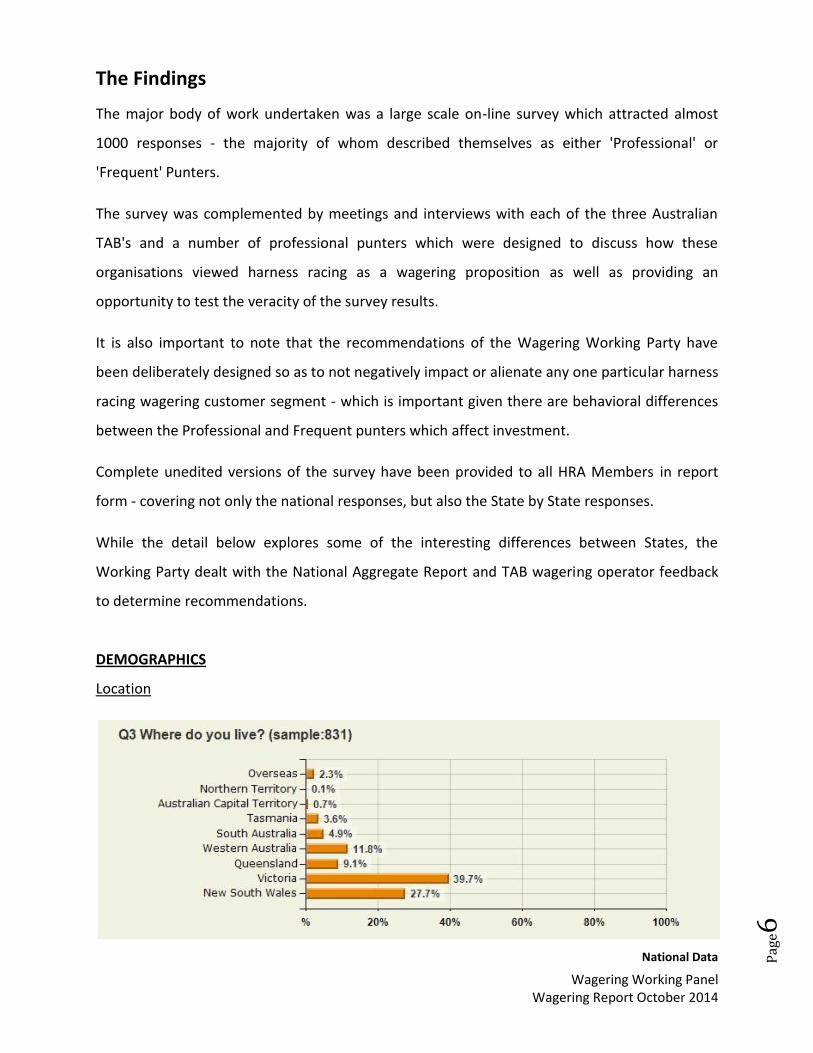
DEMOGRAPHICS
Location
National Data
Wagering Working Panel Wagering Report October 2014
Pag
e7
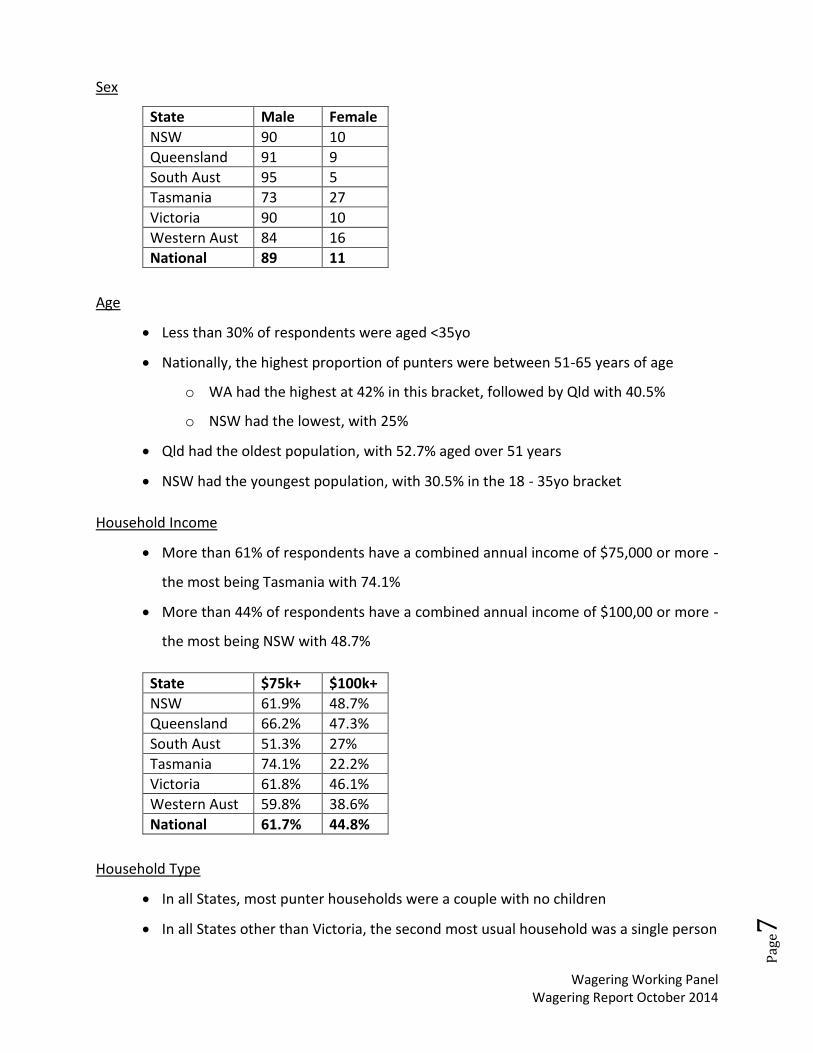
Sex
State Male Female
NSW 90 10
Queensland 91 9
South Aust 95 5
Tasmania 73 27
Victoria 90 10
Western Aust 84 16
National 89 11
Age
Less than 30% of respondents were aged <35yo
Nationally, the highest proportion of punters were between 51-65 years of age
o WA had the highest at 42% in this bracket, followed by Qld with 40.5%
o NSW had the lowest, with 25%
Qld had the oldest population, with 52.7% aged over 51 years
NSW had the youngest population, with 30.5% in the 18 - 35yo bracket
Household Income
More than 61% of respondents have a combined annual income of $75,000 or more -
the most being Tasmania with 74.1%
More than 44% of respondents have a combined annual income of $100,00 or more -
the most being NSW with 48.7%
State $75k+ $100k+
NSW 61.9% 48.7%
Queensland 66.2% 47.3%
South Aust 51.3% 27%
Tasmania 74.1% 22.2%
Victoria 61.8% 46.1%
Western Aust 59.8% 38.6%
National 61.7% 44.8%
Household Type
In all States, most punter households were a couple with no children
In all States other than Victoria, the second most usual household was a single person
Wagering Working Panel Wagering Report October 2014
Pag
e8
44% of households have children living at home
Employment
Almost half (49.1%) of the punters responding to the survey were employed full-time
o Of these, half are in professional or middle management positions
o 8% are executive management
o 13% are skilled tradespersons
Over a quarter (26.4%) are self-employed
11% are retired
Connection to Harness Racing
People are passionate about harness racing:
o In all States, the most popular answer (minimum 45% in Tas) was "I am a harness
racing enthusiast"
o The second most popular answer (minimum 22% in Queensland) was "I live for
harness racing"
Involvement
There is a strong link between ownership and wagering
o In all States, most respondents were also owners (minimum was 51% in SA)
31% of respondents do not have an involvement other than wagering
WAGERING HABITS
The wagering habits of respondents were interesting. While some wagered across harness and
Thoroughbreds, most were very loyal and predominately harness racing focussed.
However, even the most loyal would wager on other racing codes if they has a tip - which
usually came from an acquaintance who owners a thoroughbred or greyhound.
Greyhounds was by far the least popular of the racing codes - usually with customers wagering
simply to fill in time between harness races - but still well ahead of Sport.
Wagering Working Panel Wagering Report October 2014
Pag
e9
TAB's advise that Sports is the entry level for new account holders, so strategies to educate and
introduce harness racing to them is important. This is particularly true owing to the fact only
7% of money wagered by these new account holders is directed to harness racing.
The Wagering Mix itself was relatively consistent across the country.
It was also interesting that on-line gaming such as poker and other casino games hardly got a
mention.
Sports Betting
40% have never bet on sports
Of the 60% that have bet on sports, only 17% do so frequently or very frequently
Qld is the State in which most harness punters are likely to bet on sports either
Occasionally, Frequently or Very Frequently (86.7%)
Victoria is the State in which most harness punters are likely to bet on sports either
Frequently or Very Frequently (27%)
Harness Racing
Over 87% of respondents bet on harness racing Occasionally (20.1%), Frequently
(25.7%) or Very Frequently (41.3%)
Tasmania (55.6%) and Victoria (54.1%) had the highest percentage of Very Frequent
respondents
Thoroughbred Racing
Of the wagering options, aside from harness racing, most respondents are also likely
to bet on Thoroughbred Racing
o This is most true in Victoria where 17.8% bet Very Frequently on Thoroughbred
Racing - rising to 60.1% more than Occasionally
Greyhound Racing
Greyhound Racing is the least popular option of the respondents, with 76.4%
answering that they either Never (47.7%), or Rarely (28.7%) bet on them
Less than 10% of respondents bet on Greyhound Racing Frequently or Very
Frequently
Wagering Working Panel Wagering Report October 2014
Pag
e10
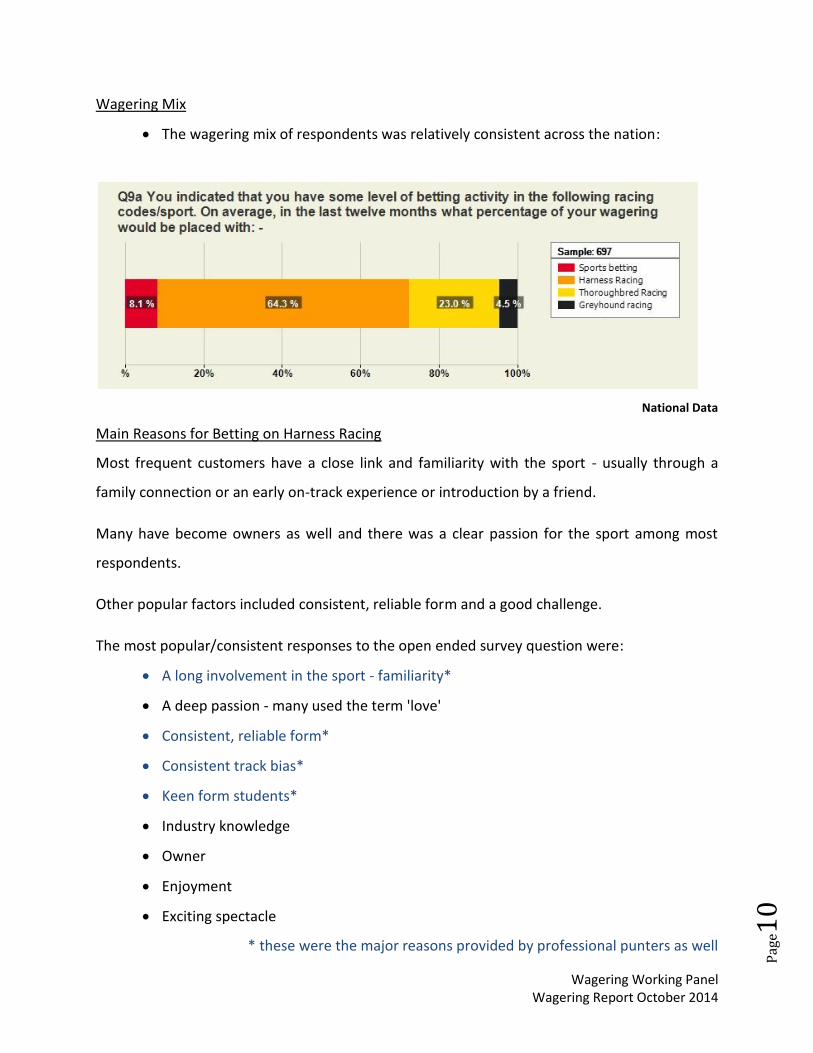
Wagering Mix
The wagering mix of respondents was relatively consistent across the nation:
National Data
Main Reasons for Betting on Harness Racing
Most frequent customers have a close link and familiarity with the sport - usually through a
family connection or an early on-track experience or introduction by a friend.
Many have become owners as well and there was a clear passion for the sport among most
respondents.
Other popular factors included consistent, reliable form and a good challenge.
The most popular/consistent responses to the open ended survey question were:
A long involvement in the sport - familiarity*
A deep passion - many used the term 'love'
Consistent, reliable form*
Consistent track bias*
Keen form students*
Industry knowledge
Owner
Enjoyment
Exciting spectacle
* these were the major reasons provided by professional punters as well
Wagering Working Panel Wagering Report October 2014
Pag
e11
Unappealing Elements of Harness Racing
Most of the unappealing aspects fell within the general area of Integrity.
The Working Party is well aware that Integrity issues could be an easy target - based often on
perception (or even through the pocket) rather than reality.
And so it may be in some instances - however, a deeper look at what were overwhelmingly
common themes finds most can be addressed quite easily as explained in the recommendations
section.
While the integrity issues focused on Stablemates - Change of Tactics - Stewards
interpretations of tactics - Collusion - form reversal - inconsistent penalties - Prohibited
Substances, other common issues included the number of short-priced favorites (defined as
being less than $1.50), small pools, standing starts, incompetent drivers, false starts and delays,
slow tempo leading to boring races, horses galloping and leader biased tracks (particularly
smaller tracks).
Respondents described the elements of harness racing which made it unappealing as a
wagering option as:
Short priced favorites
Small pools*
Standing Starts*
Integrity issues:
stablemates
team driving*
form reversal
drugs
inconsistent stewards decisions
driving tactics
collusion*
Bad drivers*
False starts and delays
Wagering Working Panel Wagering Report October 2014
Pag
e12
Slow tempo - boring races - few moves
Horses galloping
Small tracks - leader bias
* these were the major reasons provided by professional punters as well
Main Reasons for Betting on Sports
This was an open ended question with 705 reasons provided. The most popular responses
being:
Don't often bet
Limited chances - only two teams/players
An interest while watching a game - makes the game more exciting
Lots of different betting options
Easy, simple
Fun
Can watch games live on FTA TV
Main Reasons for Betting on Thoroughbred Racing
This was an open ended question with 1061 reasons provided. The most popular responses
being:
Larger pools = value and good dividends
More value in favorites
Media coverage and availability of information
Tips
Carnivals, major races
Social activity - follow a friends horse
Enjoyment
Time slot
Fun
Main Reasons for Betting on Greyhound Racing
This was an open ended question with 1061 reasons provided. The most popular responses
being:
Wagering Working Panel Wagering Report October 2014
Pag
e13
Quick turnaround/return - fast paced
Fill in time - relieve boredom
Tips
Early speed indicators
Small fields
Social activity - follow a friends dog
Pick a number/box
They're always on Sky
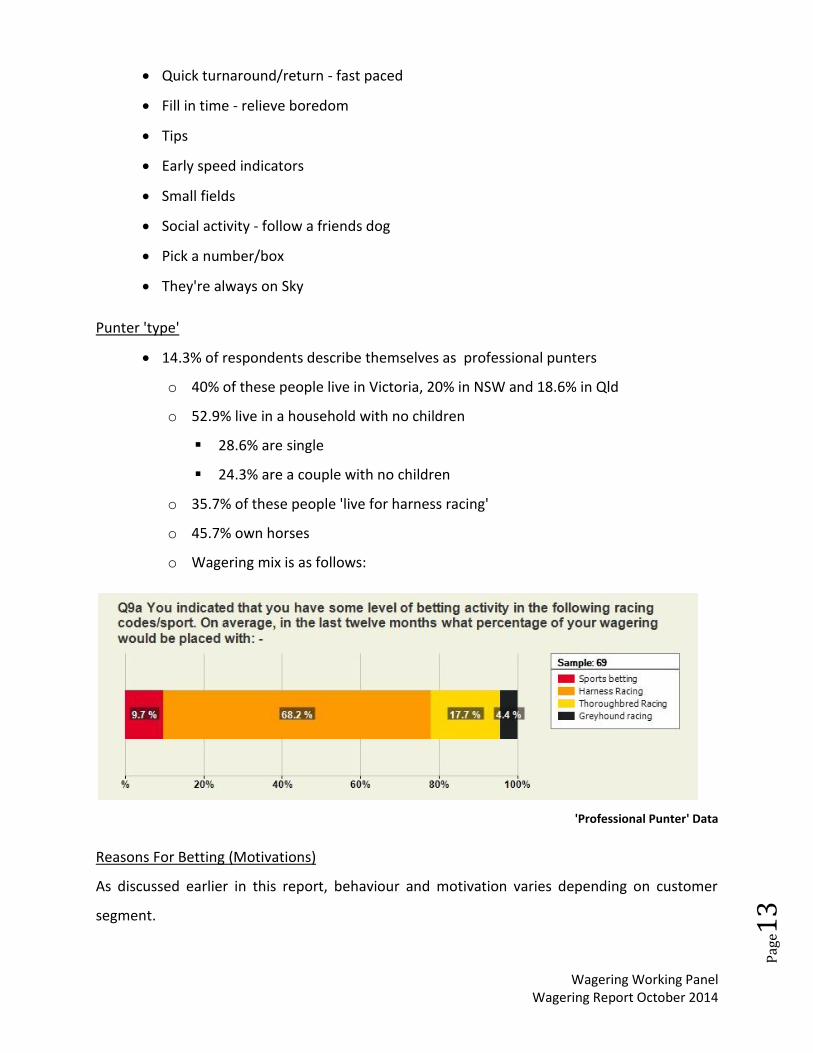
Punter 'type'
14.3% of respondents describe themselves as professional punters
o 40% of these people live in Victoria, 20% in NSW and 18.6% in Qld
o 52.9% live in a household with no children
28.6% are single
24.3% are a couple with no children
o 35.7% of these people 'live for harness racing'
o 45.7% own horses
o Wagering mix is as follows:
'Professional Punter' Data
Reasons For Betting (Motivations)
As discussed earlier in this report, behaviour and motivation varies depending on customer
segment.
Wagering Working Panel Wagering Report October 2014
Pag
e14
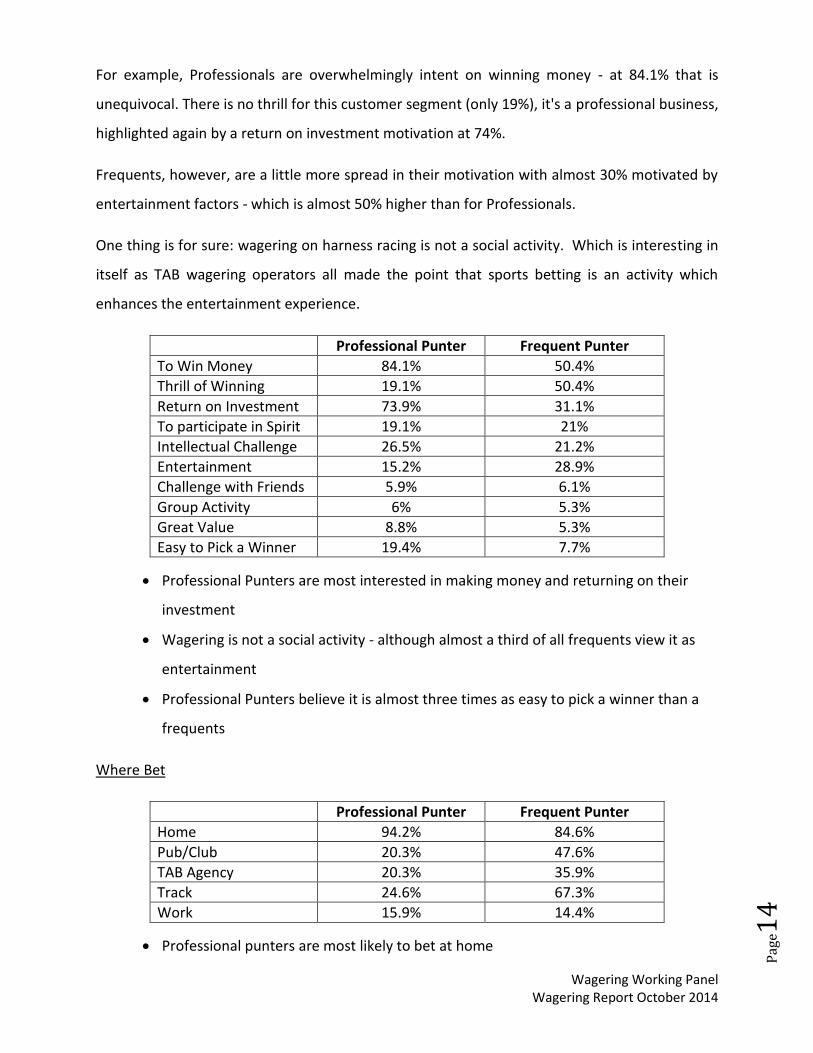
For example, Professionals are overwhelmingly intent on winning money - at 84.1% that is
unequivocal. There is no thrill for this customer segment (only 19%), it's a professional business,
highlighted again by a return on investment motivation at 74%.
Frequents, however, are a little more spread in their motivation with almost 30% motivated by
entertainment factors - which is almost 50% higher than for Professionals.
One thing is for sure: wagering on harness racing is not a social activity. Which is interesting in
itself as TAB wagering operators all made the point that sports betting is an activity which
enhances the entertainment experience.
Professional Punter Frequent Punter
To Win Money 84.1% 50.4%
Thrill of Winning 19.1% 50.4%
Return on Investment 73.9% 31.1%
To participate in Spirit 19.1% 21%
Intellectual Challenge 26.5% 21.2%
Entertainment 15.2% 28.9%
Challenge with Friends 5.9% 6.1%
Group Activity 6% 5.3%
Great Value 8.8% 5.3%
Easy to Pick a Winner 19.4% 7.7%
Professional Punters are most interested in making money and returning on their
investment
Wagering is not a social activity - although almost a third of all frequents view it as
entertainment
Professional Punters believe it is almost three times as easy to pick a winner than a
frequents
Where Bet
Professional Punter Frequent Punter
Home 94.2% 84.6%
Pub/Club 20.3% 47.6%
TAB Agency 20.3% 35.9%
Track 24.6% 67.3%
Work 15.9% 14.4%
Professional punters are most likely to bet at home
Wagering Working Panel Wagering Report October 2014
Pag
e15
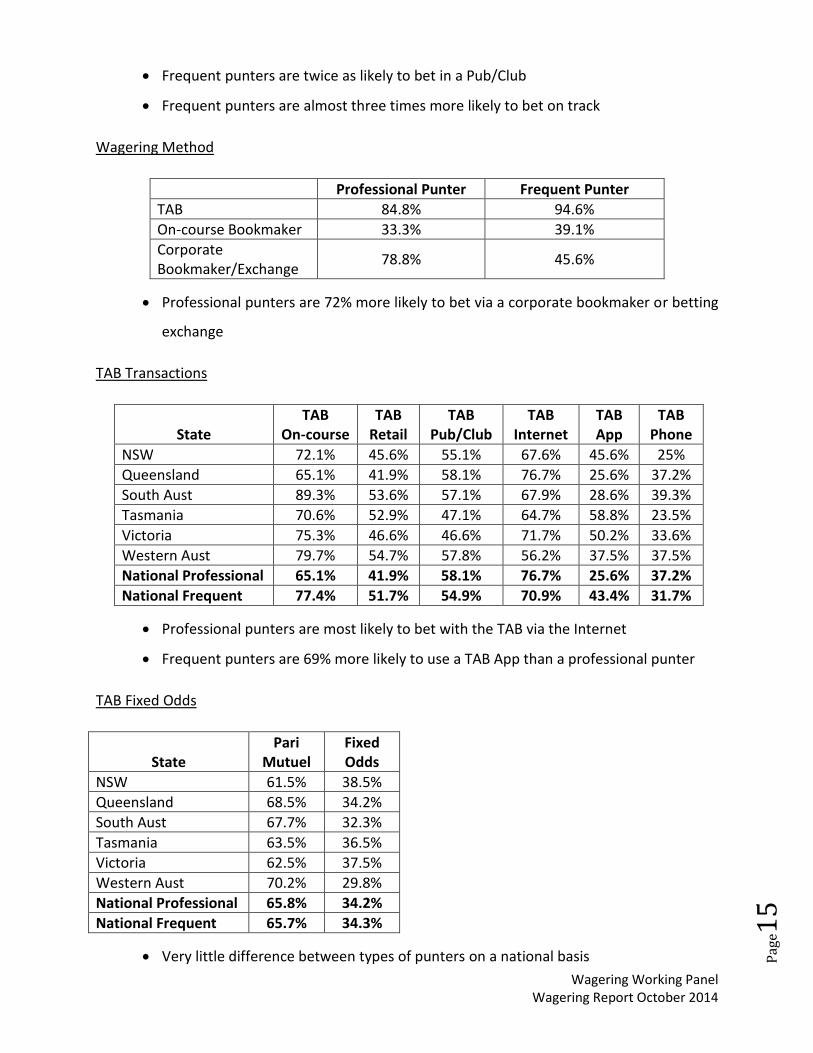
Frequent punters are twice as likely to bet in a Pub/Club
Frequent punters are almost three times more likely to bet on track
Wagering Method
Professional Punter Frequent Punter
TAB 84.8% 94.6%
On-course Bookmaker 33.3% 39.1%
Corporate Bookmaker/Exchange
78.8% 45.6%
Professional punters are 72% more likely to bet via a corporate bookmaker or betting
exchange
TAB Transactions
State
TAB On-course
TAB Retail
TAB Pub/Club
TAB Internet
TAB App
TAB Phone
NSW 72.1% 45.6% 55.1% 67.6% 45.6% 25%
Queensland 65.1% 41.9% 58.1% 76.7% 25.6% 37.2%
South Aust 89.3% 53.6% 57.1% 67.9% 28.6% 39.3%
Tasmania 70.6% 52.9% 47.1% 64.7% 58.8% 23.5%
Victoria 75.3% 46.6% 46.6% 71.7% 50.2% 33.6%
Western Aust 79.7% 54.7% 57.8% 56.2% 37.5% 37.5%
National Professional 65.1% 41.9% 58.1% 76.7% 25.6% 37.2%
National Frequent 77.4% 51.7% 54.9% 70.9% 43.4% 31.7%
Professional punters are most likely to bet with the TAB via the Internet
Frequent punters are 69% more likely to use a TAB App than a professional punter
TAB Fixed Odds
State
Pari Mutuel
Fixed Odds
NSW 61.5% 38.5%
Queensland 68.5% 34.2%
South Aust 67.7% 32.3%
Tasmania 63.5% 36.5%
Victoria 62.5% 37.5%
Western Aust 70.2% 29.8%
National Professional 65.8% 34.2%
National Frequent 65.7% 34.3%
Very little difference between types of punters on a national basis
Wagering Working Panel Wagering Report October 2014
Pag
e16
NSW punters (38.5%) are the highest users of TAB fixed odds, but by only 1% over
Victoria (37.5%)
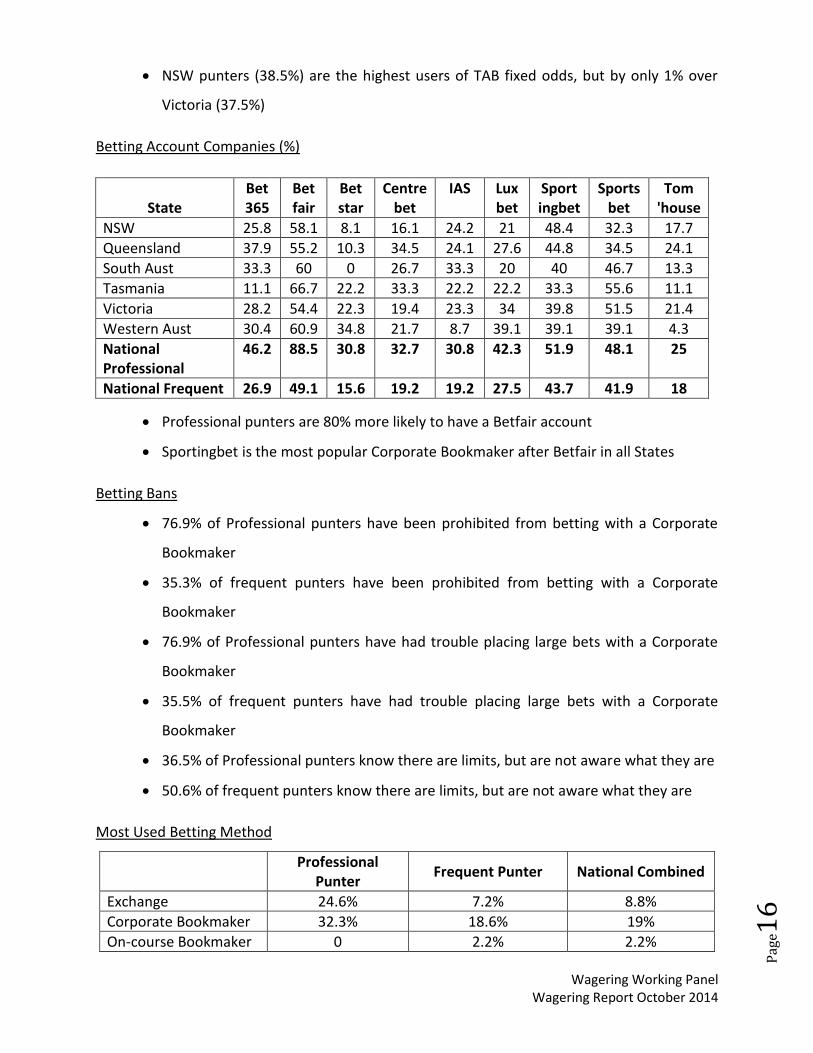
Betting Account Companies (%)
State
Bet 365
Bet fair
Bet star
Centre bet
IAS Lux bet
Sport ingbet
Sports bet
Tom 'house
NSW 25.8 58.1 8.1 16.1 24.2 21 48.4 32.3 17.7
Queensland 37.9 55.2 10.3 34.5 24.1 27.6 44.8 34.5 24.1
South Aust 33.3 60 0 26.7 33.3 20 40 46.7 13.3
Tasmania 11.1 66.7 22.2 33.3 22.2 22.2 33.3 55.6 11.1
Victoria 28.2 54.4 22.3 19.4 23.3 34 39.8 51.5 21.4
Western Aust 30.4 60.9 34.8 21.7 8.7 39.1 39.1 39.1 4.3
National Professional
46.2 88.5 30.8 32.7 30.8 42.3 51.9 48.1 25
National Frequent 26.9 49.1 15.6 19.2 19.2 27.5 43.7 41.9 18
Professional punters are 80% more likely to have a Betfair account
Sportingbet is the most popular Corporate Bookmaker after Betfair in all States
Betting Bans
76.9% of Professional punters have been prohibited from betting with a Corporate
Bookmaker
35.3% of frequent punters have been prohibited from betting with a Corporate
Bookmaker
76.9% of Professional punters have had trouble placing large bets with a Corporate
Bookmaker
35.5% of frequent punters have had trouble placing large bets with a Corporate
Bookmaker
36.5% of Professional punters know there are limits, but are not aware what they are
50.6% of frequent punters know there are limits, but are not aware what they are
Most Used Betting Method
Professional
Punter Frequent Punter National Combined
Exchange 24.6% 7.2% 8.8%
Corporate Bookmaker 32.3% 18.6% 19%
On-course Bookmaker 0 2.2% 2.2%
Wagering Working Panel Wagering Report October 2014
Pag
e17
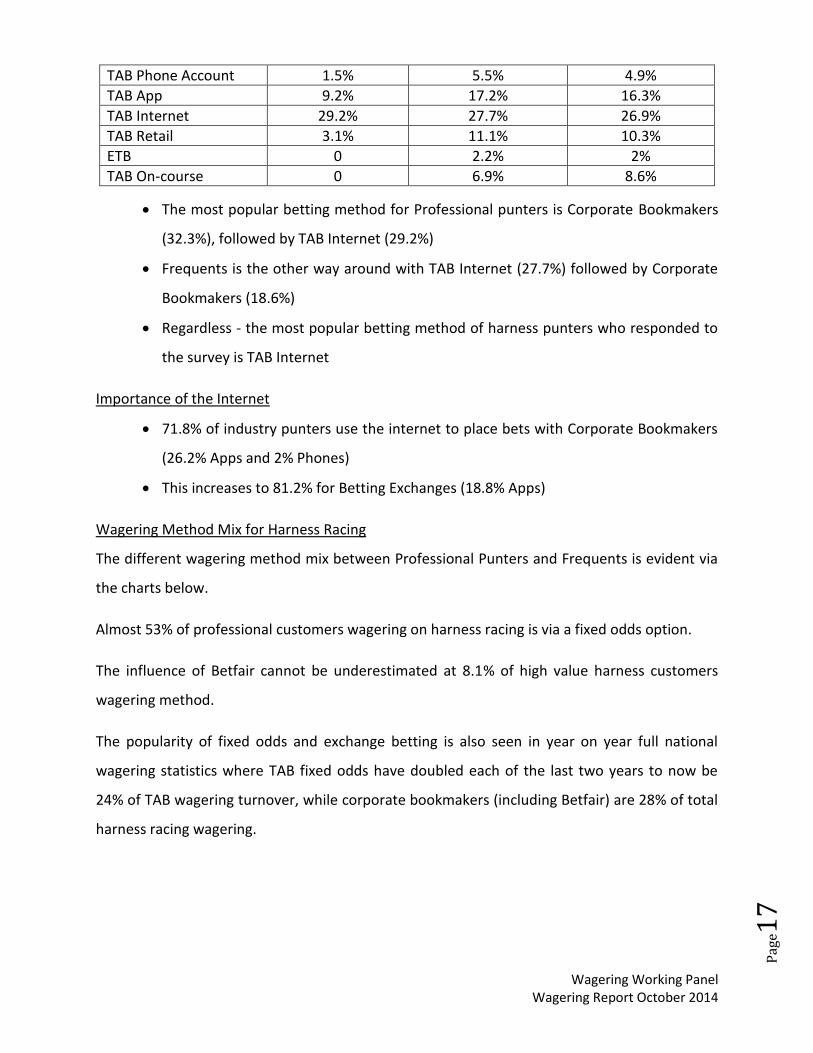
TAB Phone Account 1.5% 5.5% 4.9%
TAB App 9.2% 17.2% 16.3%
TAB Internet 29.2% 27.7% 26.9%
TAB Retail 3.1% 11.1% 10.3%
ETB 0 2.2% 2%
TAB On-course 0 6.9% 8.6%
The most popular betting method for Professional punters is Corporate Bookmakers
(32.3%), followed by TAB Internet (29.2%)
Frequents is the other way around with TAB Internet (27.7%) followed by Corporate
Bookmakers (18.6%)
Regardless - the most popular betting method of harness punters who responded to
the survey is TAB Internet
Importance of the Internet
71.8% of industry punters use the internet to place bets with Corporate Bookmakers
(26.2% Apps and 2% Phones)
This increases to 81.2% for Betting Exchanges (18.8% Apps)
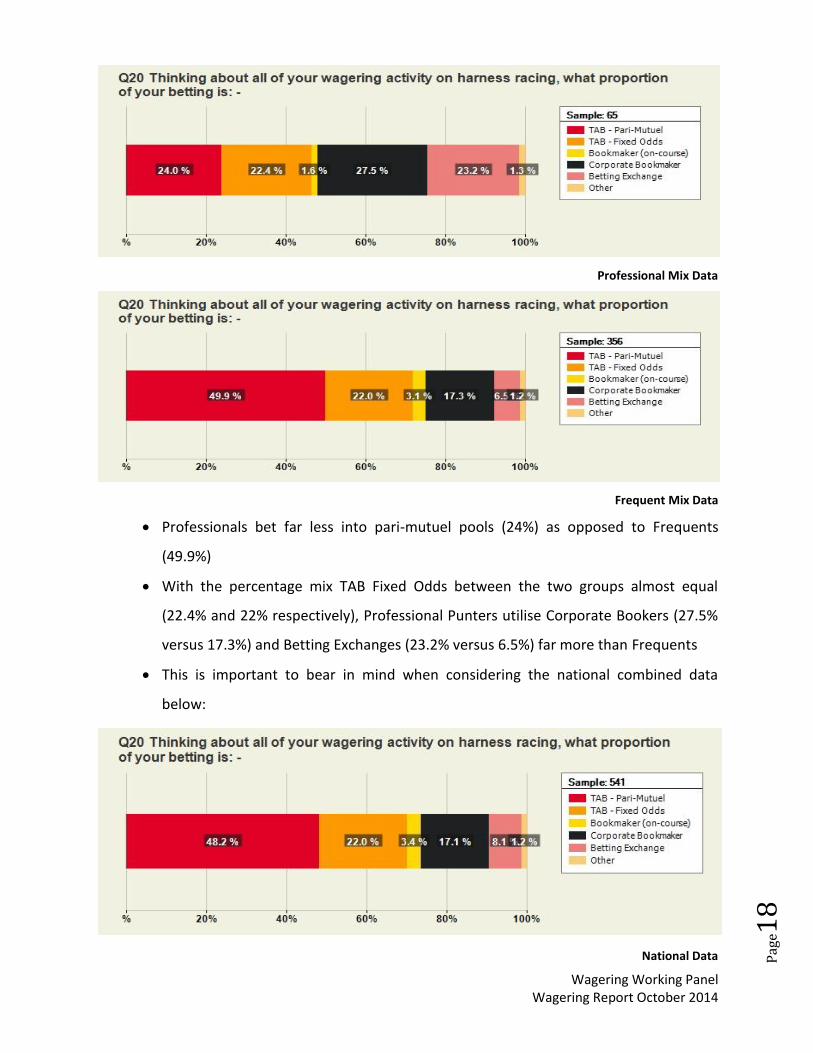
Wagering Method Mix for Harness Racing
The different wagering method mix between Professional Punters and Frequents is evident via
the charts below.
Almost 53% of professional customers wagering on harness racing is via a fixed odds option.
The influence of Betfair cannot be underestimated at 8.1% of high value harness customers
wagering method.
The popularity of fixed odds and exchange betting is also seen in year on year full national
wagering statistics where TAB fixed odds have doubled each of the last two years to now be
24% of TAB wagering turnover, while corporate bookmakers (including Betfair) are 28% of total
harness racing wagering.
Wagering Working Panel Wagering Report October 2014
Pag
e18
Professional Mix Data
Frequent Mix Data
Professionals bet far less into pari-mutuel pools (24%) as opposed to Frequents
(49.9%)
With the percentage mix TAB Fixed Odds between the two groups almost equal
(22.4% and 22% respectively), Professional Punters utilise Corporate Bookers (27.5%
versus 17.3%) and Betting Exchanges (23.2% versus 6.5%) far more than Frequents
This is important to bear in mind when considering the national combined data
below:
National Data
Wagering Working Panel Wagering Report October 2014
Pag
e19
Bet Sizes
Large Bets
o A large bet for a Professional Punter is >$200 (90.85%) and averages $3116.48
o A large bet for Frequent Punter is also >$200 (46.4%) but a lower average at
$518.39
o Frequents second most popular definition of a large bet was $1 to $15 (23.5%)
Average Bets
o An average bet for a Professional Punter is also >$200 (44.6%) and averages
$420.39
o An average bet for Frequent Punter is between $1 and $50 (76.5%) and averages
$56.89
Small Bets
o A small bet for a Professional Punter is between $1 and $50 (87.3%) and
averages $43.78
o A small bet for Frequent Punter is between $1 and $50 (93.2%) and averages
$9.49
Bet Types
The three most enjoyable bet types for Professional Punters are:
o Win
o Quadrella
o Trifecta
The three most enjoyable bet types for Frequent Punters are:
o Win
o Each Way
o Trifecta
However, Professional Punters more regularly bet Place Only than Trifecta
Jackpots
Jackpots are most likely to influence Professional Punters, with 43.1% stating that it
influences them to increase wagering activity
Wagering Working Panel Wagering Report October 2014
Pag
e20
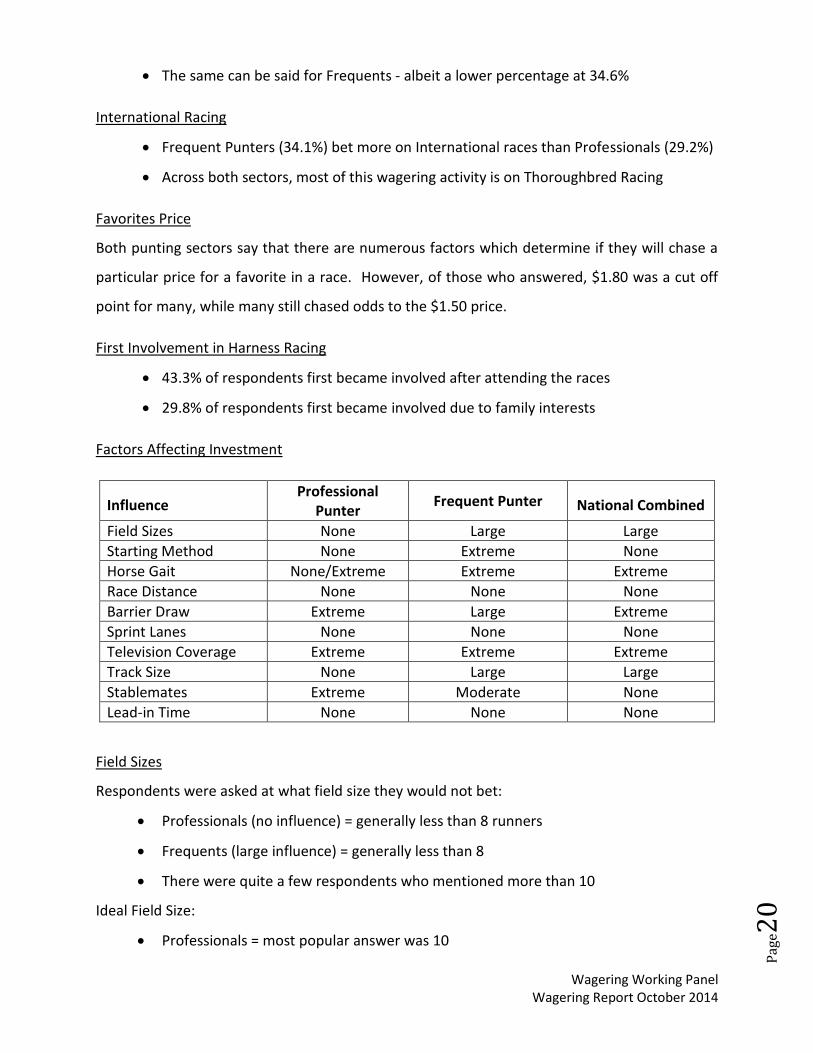
The same can be said for Frequents - albeit a lower percentage at 34.6%
International Racing
Frequent Punters (34.1%) bet more on International races than Professionals (29.2%)
Across both sectors, most of this wagering activity is on Thoroughbred Racing
Favorites Price
Both punting sectors say that there are numerous factors which determine if they will chase a
particular price for a favorite in a race. However, of those who answered, $1.80 was a cut off
point for many, while many still chased odds to the $1.50 price.
First Involvement in Harness Racing
43.3% of respondents first became involved after attending the races
29.8% of respondents first became involved due to family interests
Factors Affecting Investment
Influence Professional
Punter Frequent Punter
National Combined
Field Sizes None Large Large
Starting Method None Extreme None
Horse Gait None/Extreme Extreme Extreme
Race Distance None None None
Barrier Draw Extreme Large Extreme
Sprint Lanes None None None
Television Coverage Extreme Extreme Extreme
Track Size None Large Large
Stablemates Extreme Moderate None
Lead-in Time None None None
Field Sizes
Respondents were asked at what field size they would not bet:
Professionals (no influence) = generally less than 8 runners
Frequents (large influence) = generally less than 8
There were quite a few respondents who mentioned more than 10
Ideal Field Size:
Professionals = most popular answer was 10
Wagering Working Panel Wagering Report October 2014
Pag
e21
Frequents = most popular answer was 10
Starting Method
Respondents were asked if they had a preferred starting method:
Professionals (no influence)
o 60.5% prefer mobile starts
o 25.6% will not bet on Standing Starts
Frequents (extreme influence)
o 59.5% prefer mobile starts
o 18.2% will not bet on Standing Starts
Horse Gait
Respondents were asked if they had a preference for Pacers or Trotters:
Professionals (equally no influence and extreme influence):
o 60.5% prefer betting on Pacers but will still bet on Trotters
o 27.9% prefer betting on Pacers but will not bet on Trotters
o 2.3% prefer betting on Trotters but will still bet on Pacers
Frequents (extreme influence):
o 55.3% prefer betting on Pacers but will still bet on Trotters
o 24.6% prefer betting on Pacers but will not bet on Trotters
o 6.8% prefer betting on Trotters but will still bet on Pacers
In Victoria (no influence):
o 54.2% prefer betting on Pacers but will still bet on Trotters
o 18.1% prefer betting on Pacers but will not bet on Trotters
o 11.8% prefer betting on Trotters but will still bet on Pacers
Race Distance
Respondents were asked if they had a preference for Race Distance:
Professionals (no influence) - when pushed 50% said a mile
Frequents (no influence) - when pushed most said 2200m
Barrier Draw
Respondents were asked how the barrier draw influenced their betting activity:
Wagering Working Panel Wagering Report October 2014
Pag
e22
Professionals (extreme influence):
o "influences leader, so vital"
o "most important factor after ability of horse"
o "less likely to bet if favorite draws well"
Frequents (large influence):
o "big advantage on small tracks"
o "dictates who leads"
o "rarely back poorly drawn horses"
o "better the draw, the more I bet"
o "gate speed vital"
o "wide barriers and second lines makes it hard to win"
o "determined speed maps and field position"
Television Coverage
All respondents rated it 'extreme'. If they can't watch, they don't bet.
Sprint Lanes
Respondents were asked if Sprint Lanes influenced their betting:
Professionals (no influence):
o 46.2% said it depends on the race
o 35.9% said generally more likely
o 15.4% said generally less likely
Frequents (no influence):
o 36% said it depends on the race
o 39.9% said generally more likely
o 17% said generally less likely
While there was no standout position, it was more accepted that sprint lanes are no great
influence on betting.
Track Size
Respondents were asked which size tracks they prefer to bet on:
Professionals (no influence):
Wagering Working Panel Wagering Report October 2014
Pag
e23
o 59.6% said 900m - 1200m
o 19.1% said no preference
Frequents (no influence):
o 54.4% said 900m - 1200m
o 27.4% said no preference
Stablemates
Respondents were asked how having stablemates in the same race influenced their betting
activity:
Professionals (extreme influence):
o "tactics should be announced in advance"
o "team driving - real or perceived, is a worry"
Frequents (moderate influence):
o "they may assist each other"
o "usually back the horse with stable driver"
o "team driving is evident"
o "tactics seem to change too much"
o "it really worries me when betting - suspicious"
o "depends on stable involved"
o "more problematic on small tracks"
o "hate it"
o "generally don't bet"
Lead-in Times
Although rated as no influence - most respondents commented about the importance of lead-in
times for a range of reasons:
"horse manners"
"delays"
"rushing form"
"sometimes miss the race altogether"
Other Factors Affecting Investment
Wagering Working Panel Wagering Report October 2014
Pag
e24
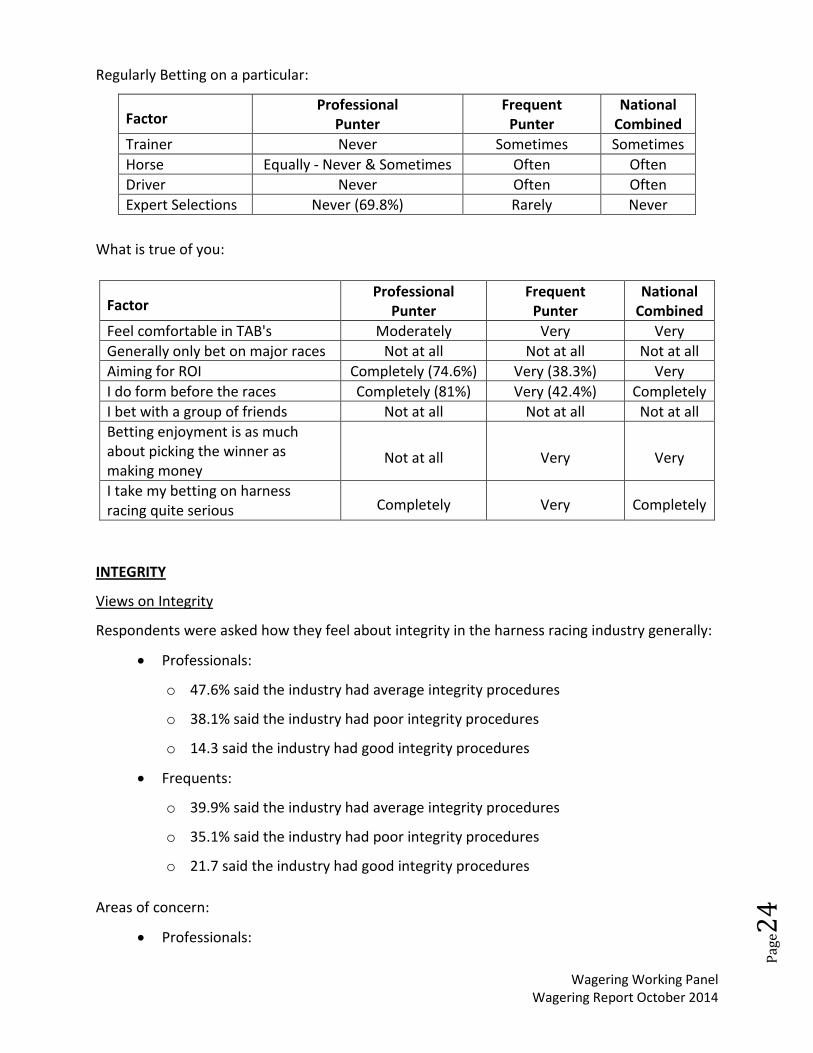
Regularly Betting on a particular:
Factor Professional
Punter Frequent
Punter National
Combined
Trainer Never Sometimes Sometimes
Horse Equally - Never & Sometimes Often Often
Driver Never Often Often
Expert Selections Never (69.8%) Rarely Never
What is true of you:
Factor Professional
Punter Frequent
Punter National
Combined
Feel comfortable in TAB's Moderately Very Very
Generally only bet on major races Not at all Not at all Not at all
Aiming for ROI Completely (74.6%) Very (38.3%) Very
I do form before the races Completely (81%) Very (42.4%) Completely
I bet with a group of friends Not at all Not at all Not at all
Betting enjoyment is as much about picking the winner as making money
Not at all
Very
Very
I take my betting on harness racing quite serious
Completely
Very
Completely
INTEGRITY
Views on Integrity
Respondents were asked how they feel about integrity in the harness racing industry generally:
Professionals:
o 47.6% said the industry had average integrity procedures
o 38.1% said the industry had poor integrity procedures
o 14.3 said the industry had good integrity procedures
Frequents:
o 39.9% said the industry had average integrity procedures
o 35.1% said the industry had poor integrity procedures
o 21.7 said the industry had good integrity procedures
Areas of concern:
Professionals:
Wagering Working Panel Wagering Report October 2014
Pag
e25
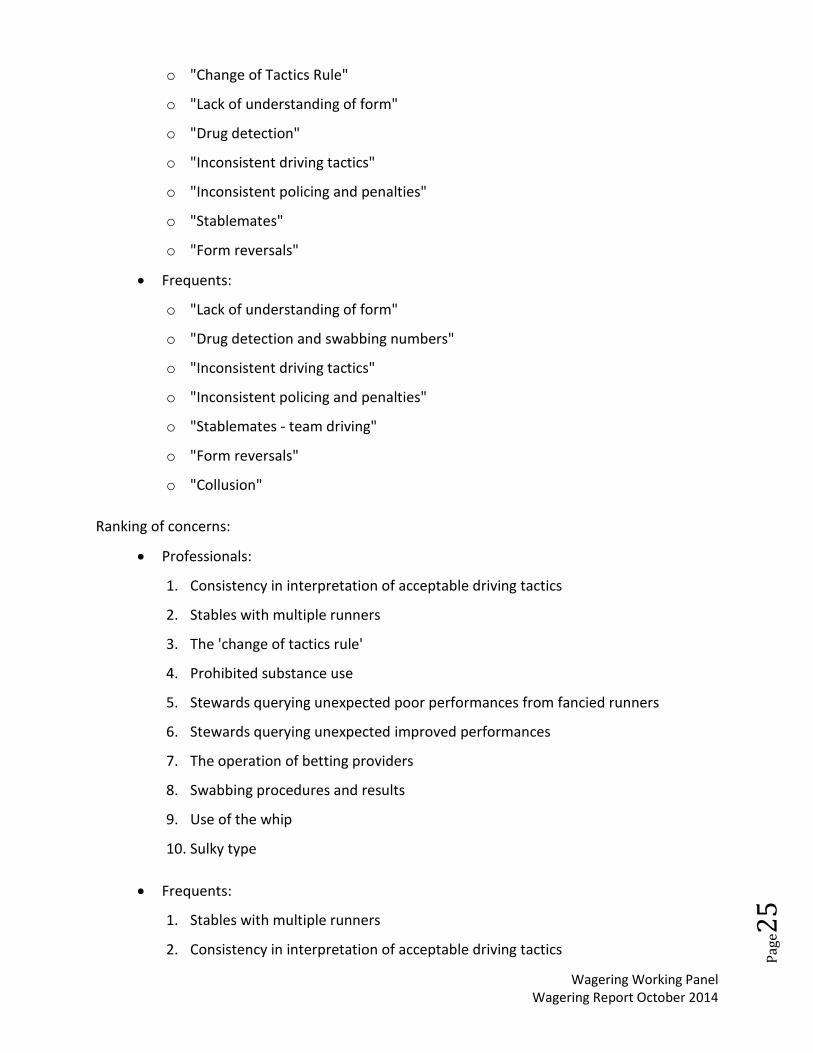
o "Change of Tactics Rule"
o "Lack of understanding of form"
o "Drug detection"
o "Inconsistent driving tactics"
o "Inconsistent policing and penalties"
o "Stablemates"
o "Form reversals"
Frequents:
o "Lack of understanding of form"
o "Drug detection and swabbing numbers"
o "Inconsistent driving tactics"
o "Inconsistent policing and penalties"
o "Stablemates - team driving"
o "Form reversals"
o "Collusion"
Ranking of concerns:
Professionals:
1. Consistency in interpretation of acceptable driving tactics
2. Stables with multiple runners
3. The 'change of tactics rule'
4. Prohibited substance use
5. Stewards querying unexpected poor performances from fancied runners
6. Stewards querying unexpected improved performances
7. The operation of betting providers
8. Swabbing procedures and results
9. Use of the whip
10. Sulky type
Frequents:
1. Stables with multiple runners
2. Consistency in interpretation of acceptable driving tactics
Wagering Working Panel Wagering Report October 2014
Pag
e26
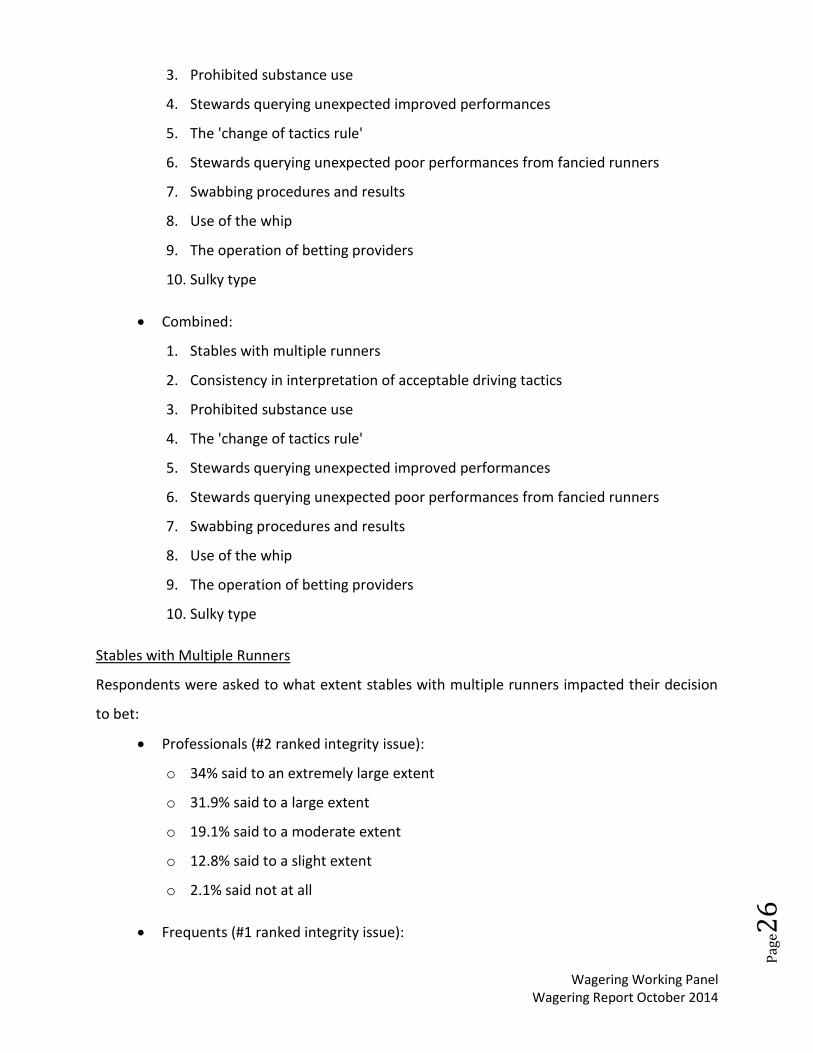
3. Prohibited substance use
4. Stewards querying unexpected improved performances
5. The 'change of tactics rule'
6. Stewards querying unexpected poor performances from fancied runners
7. Swabbing procedures and results
8. Use of the whip
9. The operation of betting providers
10. Sulky type
Combined:
1. Stables with multiple runners
2. Consistency in interpretation of acceptable driving tactics
3. Prohibited substance use
4. The 'change of tactics rule'
5. Stewards querying unexpected improved performances
6. Stewards querying unexpected poor performances from fancied runners
7. Swabbing procedures and results
8. Use of the whip
9. The operation of betting providers
10. Sulky type
Stables with Multiple Runners
Respondents were asked to what extent stables with multiple runners impacted their decision
to bet:
Professionals (#2 ranked integrity issue):
o 34% said to an extremely large extent
o 31.9% said to a large extent
o 19.1% said to a moderate extent
o 12.8% said to a slight extent
o 2.1% said not at all
Frequents (#1 ranked integrity issue):
Wagering Working Panel Wagering Report October 2014
Pag
e27
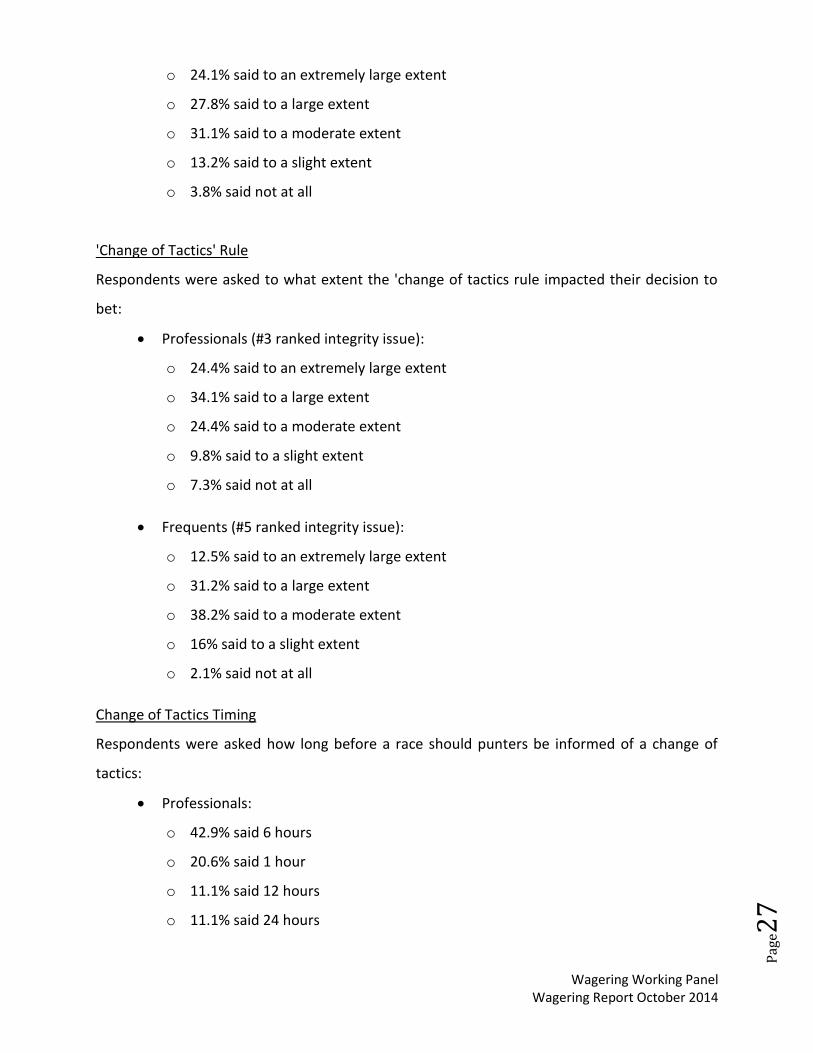
o 24.1% said to an extremely large extent
o 27.8% said to a large extent
o 31.1% said to a moderate extent
o 13.2% said to a slight extent
o 3.8% said not at all
'Change of Tactics' Rule
Respondents were asked to what extent the 'change of tactics rule impacted their decision to
bet:
Professionals (#3 ranked integrity issue):
o 24.4% said to an extremely large extent
o 34.1% said to a large extent
o 24.4% said to a moderate extent
o 9.8% said to a slight extent
o 7.3% said not at all
Frequents (#5 ranked integrity issue):
o 12.5% said to an extremely large extent
o 31.2% said to a large extent
o 38.2% said to a moderate extent
o 16% said to a slight extent
o 2.1% said not at all
Change of Tactics Timing
Respondents were asked how long before a race should punters be informed of a change of
tactics:
Professionals:
o 42.9% said 6 hours
o 20.6% said 1 hour
o 11.1% said 12 hours
o 11.1% said 24 hours
Wagering Working Panel Wagering Report October 2014
Pag
e28
Frequents:
o 28.1% said 1 hour
o 15.6% said 24 hours
o 13.8% said 6 hours
o 13.5% said 30 minutes
All punters overwhelmingly believe change of tactics should be made public (90.5%
and 81.2% respectively)
Acceptable Driving Tactics
Respondents were asked to what extent concerns about the consistency of interpretation of
acceptable driving tactics impacted their decision to bet:
Professionals (#1 ranked integrity issue):
o 22.9% said to an extremely large extent
o 20.8% said to a large extent
o 29.2% said to a moderate extent
o 20.8% said to a slight extent
o 6.2% said not at all
Frequents (#2 ranked integrity issue):
o 20.4 said to an extremely large extent
o 29.6% said to a large extent
o 33.1% said to a moderate extent
o 13.4% said to a slight extent
o 3.5% said not at all
Query Unexpected Improved Performance
Respondents were asked to what extent stewards querying unexpected improved
performances impacted their decision to bet:
Professionals (#6 ranked integrity issue):
o 31% said to an extremely large extent
o 17.2% said to a large extent
o 24.1% said to a moderate extent
Wagering Working Panel Wagering Report October 2014
Pag
e29
o 13.8% said to a slight extent
o 13.8% said not at all
Frequents (#4 ranked integrity issue):
o 14.2% said to an extremely large extent
o 29% said to a large extent
o 34.4% said to a moderate extent
o 18.6% said to a slight extent
o 3.8% said not at all
Query Unexpected Poor Performance
Respondents were asked to what extent stewards querying unexpected poor performances
from fancied runners impacted their decision to bet:
Professionals (#5 ranked integrity issue):
o 33.3% said to an extremely large extent
o 20% said to a large extent
o 23.3% said to a moderate extent
o 10% said to a slight extent
o 13.3% said not at all
Frequents (#6 ranked integrity issue):
o 39% said to an extremely large extent
o 23.7% said to a large extent
o 22.9% said to a moderate extent
o 12.7% said to a slight extent
o 1.7% said not at all
Prohibited Substance Use
Respondents were asked to what extent prohibited substance use impacted their decision to
bet:
Professionals (#4 ranked integrity issue):
o 27.8% said to an extremely large extent
o 16.7% said to a large extent
Wagering Working Panel Wagering Report October 2014
Pag
e30
o 33.3% said to a moderate extent
o 8.3% said to a slight extent
o 13.9% said not at all
Frequents (#3 ranked integrity issue):
o 35.8% said to an extremely large extent
o 26.3% said to a large extent
o 21.8% said to a moderate extent
o 13.4% said to a slight extent
o 2.8% said not at all
ACCESSING FORM
Respondents were asked how they access form. The following rankings reflect the popularity of
each option:
Professionals:
1. Websites
2. Sky racing coverage
3. Twitter and Newspapers (equal)
4. TAB Agency or Pub/Club
5. Blogs and Wagering Apps (equal)
Frequents:
1. Websites
2. Newspapers
3. Sky racing coverage
4. TAB Agency or Pub/Club
5. Twitter
6. Wagering Apps
7. Blogs
Combined:
1. Websites
2. Newspapers
Wagering Working Panel Wagering Report October 2014
Pag
e31
3. Sky racing coverage
4. TAB Agency or Pub/Club
5. Twitter
6. Wagering Apps
7. Blogs
Blogs
Respondents were which Blogs they follow to access information:
Professionals:
o iForm - 66.7%
o Goodform - 50%
Frequents:
iForm - 47.4%
Goodform - 63.2%
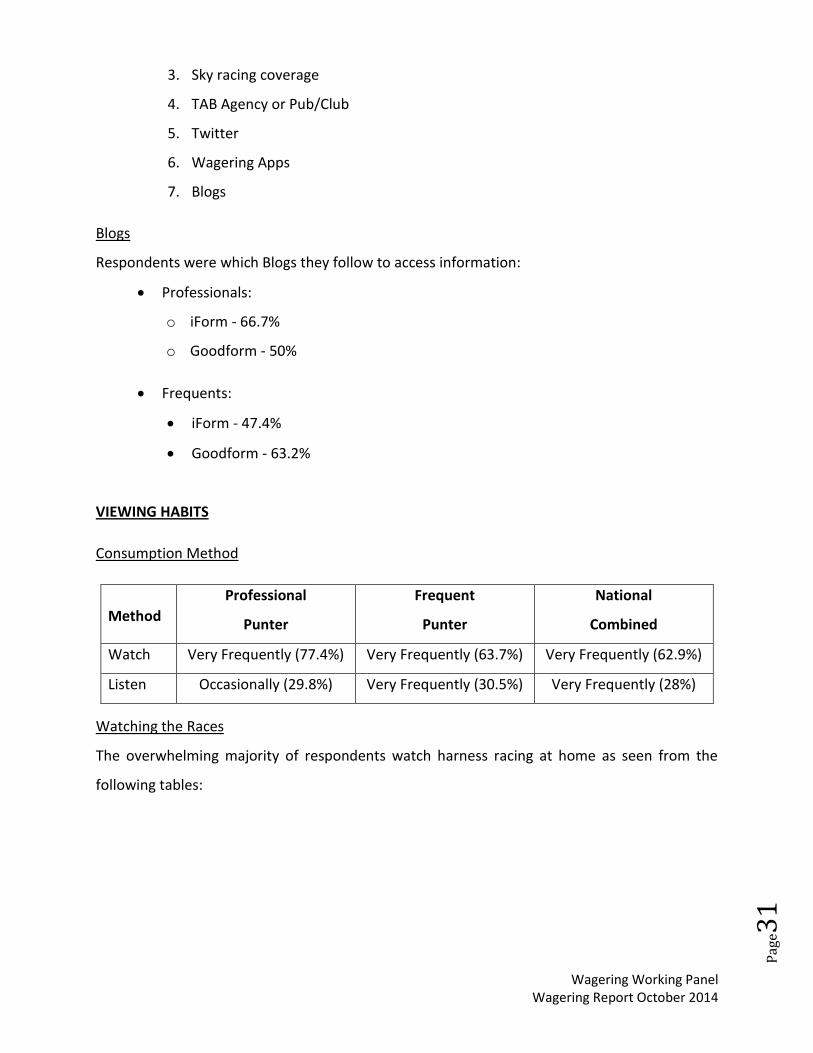
VIEWING HABITS
Consumption Method
Method
Professional
Punter
Frequent
Punter
National
Combined
Watch Very Frequently (77.4%) Very Frequently (63.7%) Very Frequently (62.9%)
Listen Occasionally (29.8%) Very Frequently (30.5%) Very Frequently (28%)
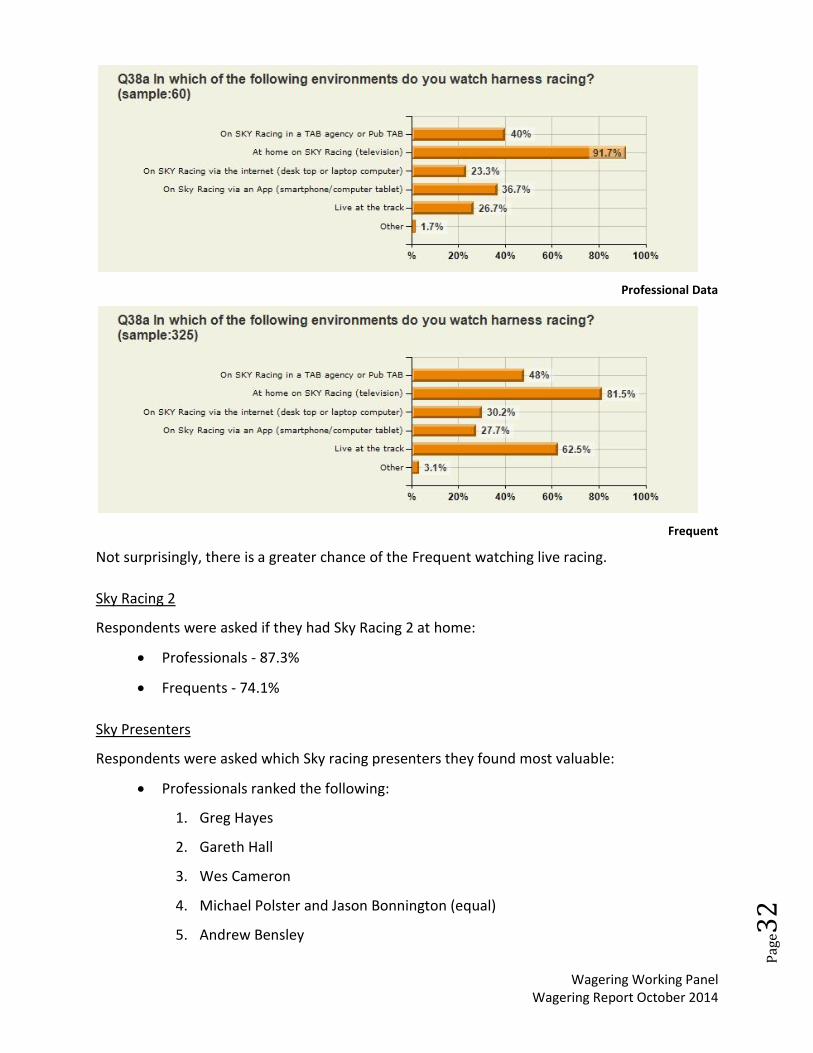
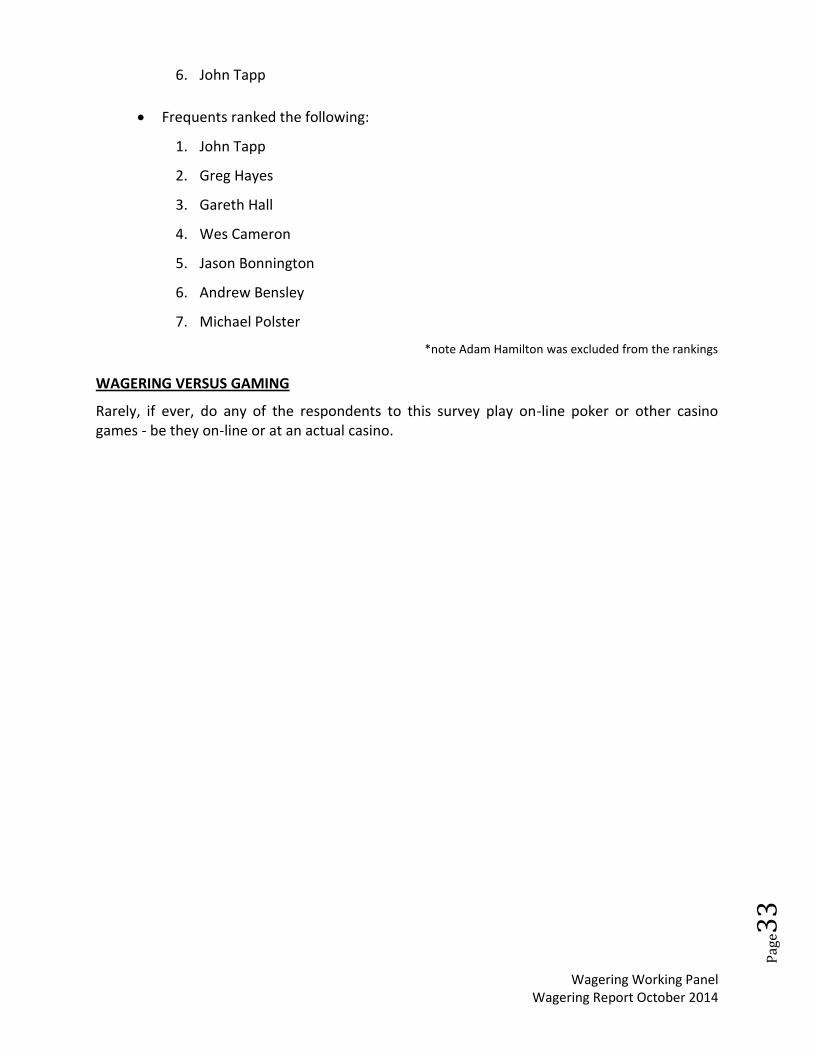
Watching the Races
The overwhelming majority of respondents watch harness racing at home as seen from the
following tables:
Wagering Working Panel Wagering Report October 2014
Pag
e32
Professional Data
Frequent
Not surprisingly, there is a greater chance of the Frequent watching live racing.
Sky Racing 2
Respondents were asked if they had Sky Racing 2 at home:
Professionals - 87.3%
Frequents - 74.1%
Sky Presenters
Respondents were asked which Sky racing presenters they found most valuable:
Professionals ranked the following:
1. Greg Hayes
2. Gareth Hall
3. Wes Cameron
4. Michael Polster and Jason Bonnington (equal)
5. Andrew Bensley
Wagering Working Panel Wagering Report October 2014
Pag
e33
6. John Tapp
Frequents ranked the following:
1. John Tapp
2. Greg Hayes
3. Gareth Hall
4. Wes Cameron
5. Jason Bonnington
6. Andrew Bensley
7. Michael Polster
*note Adam Hamilton was excluded from the rankings
WAGERING VERSUS GAMING
Rarely, if ever, do any of the respondents to this survey play on-line poker or other casino games - be they on-line or at an actual casino.
Wagering Working Panel Wagering Report October 2014
Pag
e34
Recommendations
In all, the Wagering Working party has made 30 recommendations – supported by a further 25
sub-recommendations.
These fall within six general headings:
Integrity
Drivers
Racing Presentation
Wagering Operators
Promotion of Ownership
Access to wagering Information
The Working Party found that in many instances, the recommendations addressed multiple
Terms of Reference.
Accordingly, each of the terms was given a number (as below) which was in turn assigned to
each of the recommendations which, when cross-referenced, denotes which Term or Terms
that particular recommendation is designed to address.
1. To determine ways to grow wagering turnover on harness racing
2. To identify ways to broaden the appeal of Australian harness racing as a wagering
proposition
3. To examine ways of making information more readily accessible to the punting public
4. To examine ways to attract and retain both new and existing customers
Wagering Working Panel Wagering Report October 2014
Pag
e35
1. INTEGRITY RECOMMENDATIONS
Change of Tactics:
A change of tactics refers to the usual starting and racing pattern of a horse in the
first 400m of a race, having taken into account its last six starts
A trainer contemplating a change of tactics must inform the Stewards at least 90-
minutes prior to the race to explain the racing tactics and driving instructions
which will be given for the race (1 & 4)
A change of tactics may be disallowed by the Stewards if considered not to give
the horse the best chance of finishing the race in the best possible position (1)
If deemed a change of tactics, then Stewards will advise and update the public via
Sky Racing, Radio, Racecaller, Twitter and Website at least 60-minutes prior to the
race (1, 2, 3 & 4)
Investigations should be made to circulate this information visually via Sky Racing
(in a similar fashion to Late Mail) (1, 2, 3 & 4)
Stablemates:
A trainer with stablemates in the same race must inform the Stewards at least 90-
minutes prior to the race to explain the racing tactics of each horse and driving
instructions which will be given for the race (1, 3 & 4)
Stewards will make information public 60-minutes prior to the race if considered a
change of tactics based on previous racing pattern of the stablemates (1, 3 & 4)
Regardless - the conversation will be noted in Stewards Report (3 & 4)
Stewards should be proactive in asking questions of drivers and trainers as to the
reasons certain tactics were or were not employed during a race - with comments
noted in Stewards Reports (1, 3 & 4)
A Form Analyst should be employed by each State Controlling Body - with part of their
job to provide expert opinion to Stewards Panels on the pre and post race tactics,
tempo and horse performances (1 & 4)
Penalty Guidelines should be developed in order to establish a consistent link between
racing incidents and other rule breaches to specific penalties (1, 2, 3 & 4)
Wagering Working Panel Wagering Report October 2014
Pag
e36
Establish a uniform Stewards Report template (1 & 3)
2. DRIVERS
Introduce a Platinum Licence criteria in order that only the best performed and
competent drivers can compete in Listed and Group Races (1 & 4)
Suggested considerations:
o must be equivalent across all States
o must set clear requirements and expectations
o must be reviewed annually, taking into account performance, success,
presentation, driving record
Tough and uniform penalties for bad drives – including poor judgment/decisions (1 &
4)
Balance driver suspensions or fines in accord with regularity of competition,
experience and age (1, 2 & 4)
Introduce an annual national Drivers Series/Championship to showcase skills and
profile (1, 2, 3 & 4)
3. RACING PRESENTATION
Abolish standing starts for pacing races and gradually reduce their use in trotting races
(1, 2 & 4)
Investigate options to minimise unnecessary delays at the start of races - including a
no gear adjustment policy within 2-minutes of the advertised start time (1, 2 & 4)
Identify ways to declare all-clear quicker (1, 2 & 4)
Live streaming of races via digital platforms (1, 2, 3 & 4)
Negotiate 5-minute lead-in space for major races on both Sky1 & Sky2 (1, 2, 3 & 4)
Live streaming of races via digital platforms (1, 2, 3 & 4)
Race as punctually as possible within the context of the Sky Racing schedule and
unforseen delays at other venues (1, 3 & 4)
Identify ways to declare ‘all clear’ quicker (1 & 2)
Uniform color coding of barrier via saddlecloths or plates (1, 2 & 3)
Wagering Working Panel Wagering Report October 2014
Pag
e37
4. WAGERING OPERATORS
Mandate a minimum liability amount that all licensed wagering operators are required
to accept. The suggested amount to lose is $1000 (1, 2 & 4)
Advocate a single domestic wagering pool for harness racing (1, 2 & 4)
Increase seeded (minimum) pools & jackpots (1, 2 & 4)
Develop regular fixed odds multi-bets which combine harness racing and sports
products (1, 2, 3 & 4)
Introduce head-to-head Driver Challenge betting (including with interstate Drivers) (1,
2 & 4)
Evaluate the relationship and responsibilities between the harness racing industry and
major wagering partners with regards to the marketing and promotion of wagering
products and wagering information - is the balance right? is everyone aware of their
responsibilities within the relationship? (1, 2, 3 & 4)
5. OWNERSHIP
As with sport, engagement and participation develops familiarity which leads to
wagering to enhance entertainment, hence there needs to be greater promotion of
Ownership and Syndication - emphasising fun and value (1, 2, 3 & 4)
Establish an on-track familiarisation program offering patrons: (1, 2, 3 & 4)
Double seater sulky rides
Mobile barrier rides
Explanation of gear and jargon
Autograph sessions with trainers and drivers
Ownership information packs available on-track and featured prominently in industry
websites (1, 2, 3 & 4)
6. ACCESS TO INFORMATION
Important wagering and racing information needs to be consolidated into a single hub,
utilising all available digital media platforms for the distribution of: (1, 2, 3 & 4)
Wagering Working Panel Wagering Report October 2014
Pag
e38
Simple Form
Scratchings
Previews
Expert Selections
Change of Tactics
Trainer and Driver performance statistics
News bites
Direct links to wagering operator websites
Promote and share content from Sky Racing: (1, 2, 3 & 4)
In The Gig - edited highlights packages
Pacing & Chasing - edited highlights packages
On-line access to existing and commissioned interviews and profiles of industry
hero's (color pieces and profiles)
Weekly preview program dedicated to major national meeting
Accessibility of all media to wider public
Enhance the www.harness.org.au website to include pop-ups of simple information
such as selections, scratchings and links to wagering operators based on internet
activity (1 & 3)
Wagering Working Panel Wagering Report October 2014
Pag
e39
APPENDIX A - NATIONAL AGGREGATE REPORT
Attached.
Wagering Working Panel Wagering Report October 2014
Pag
e40
APPENDIX B - ACKNOWLEDGEMENTS
The Wagering Working Party extends sincere thanks and gratitude to the following people and
organisations:
1. Each and every person who took the time to provide responses to the industry on-line
survey.
2. Tabcorp, TattsBet and WATAB Executives and Staff who provided valuable information
and statistics during the interview phase.
3. The professional punters who agreed to interviews on the proviso of anonymity.
4. Members of HRA who provided valuable feedback and advice during the draft stages of
Working Party's work.