Embed Size (px)
Citation preview
1
2014
ANNUAL COOPERATIVE
BUSINESS SURVEY
Final Report
February 13, 2015
In collaboration with the
National Society of Accountants for Cooperatives
2
Background and Acknowledgment
The University of Wisconsin Center for Cooperatives (UWCC), in collaboration with the National Society of Accountants for Cooperatives (NSAC), has completed a year-long pilot of the Annual Cooperative Business Survey. The goal of the project was to develop a methodology for collecting annual financial data, including patronage equity and refund practices, from cooperative firms. The Annual Cooperative Business Survey is part of the broader Cooperative Economy Data Project, which is comprised of ongoing research efforts by UWCC to more fully describe, analyze and understand the economic behavior and impact of cooperatives across sectors.
In early summer of this year, a U.S. Census branch Research Data Center (RDC) will be opening on the UW-Madison campus. The RDC process was co-led by Brent Hueth, who will serve as Executive Director, and is supported by six colleges and schools on campus. The RDC grew out of UWCC’s successful 2013 proposal to develop a methodology for identifying cooperative business firms within the Economic Census of U.S. industry. The new RDC will facilitate research to 1) more comprehensively identify cooperatives and model their performance; and 2) identify food and agricultural industries, examine the changing structure of food and agricultural markets, and analyze the role that cooperatives play in them.
Through collaboration with the Division of Entrepreneurship and Economic Development (DEED) of University of Wisconsin-Extension, UWCC has access to the National Establishment Time-Series (NETS) database, which includes longitudinal sales and employment data on business establishments in the U.S.
The Center has recently been awarded a two-year grant to update the 2009 Research on the Economic Impact of Cooperatives (REIC) report, which described and quantified for the first time the magnitude of economic activity by U.S. cooperative businesses.
The Cooperative Business Study, completed in 2012, sampled a set of the cooperatives identified in the REIC study, and used an intensive interview methodology to gather data on governance practices. The next phase of this project will be to analyze these data in relation to financial performance over time.
As enterprises owned by their members and operated to meet their needs, cooperatives have significant impacts on their local economies and in their relevant business sectors. Collaborations such as this one significantly contribute to research efforts to deepen our understanding about the unique role that cooperatives play in our economy. Brent Hueth Faculty Director, University of Wisconsin Center for Cooperatives Associate Professor, Dept. of Agricultural and Applied Economics, University of Wisconsin-Madison [email protected]
Lynn Pitman Project Manager, University of Wisconsin Center for Cooperatives [email protected]
3
Summary: Survey Response
In 2014, UWCC completed a year-long pilot of the Annual Cooperative Business Survey. The goal of the
project was to develop an instrument and methodology for collecting annual financial data from
cooperative firms, including patronage equity and refund practices. The initial online survey was
distributed by email in late October/early November 2013 to 5461 current NSAC members who held
financial management positions at their cooperative. The list was reviewed so that only one survey per
firm was distributed.
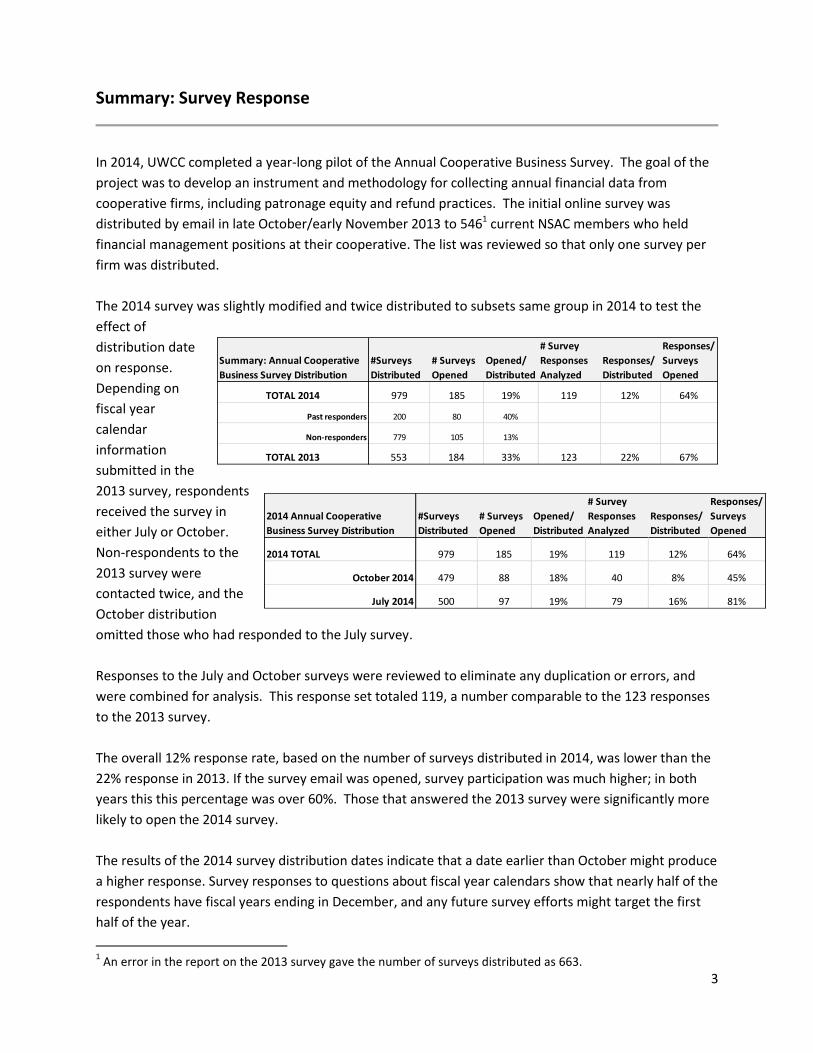
The 2014 survey was slightly modified and twice distributed to subsets same group in 2014 to test the
effect of
distribution date
on response.
Depending on
fiscal year
calendar
information
submitted in the
2013 survey, respondents
received the survey in
either July or October.
Non-respondents to the
2013 survey were
contacted twice, and the
October distribution
omitted those who had responded to the July survey.
Responses to the July and October surveys were reviewed to eliminate any duplication or errors, and
were combined for analysis. This response set totaled 119, a number comparable to the 123 responses
to the 2013 survey.
The overall 12% response rate, based on the number of surveys distributed in 2014, was lower than the
22% response in 2013. If the survey email was opened, survey participation was much higher; in both
years this this percentage was over 60%. Those that answered the 2013 survey were significantly more
likely to open the 2014 survey.
The results of the 2014 survey distribution dates indicate that a date earlier than October might produce
a higher response. Survey responses to questions about fiscal year calendars show that nearly half of the
respondents have fiscal years ending in December, and any future survey efforts might target the first
half of the year.
1 An error in the report on the 2013 survey gave the number of surveys distributed as 663.
Summary: Annual Cooperative
Business Survey Distribution
#Surveys
Distributed
# Surveys
Opened
Opened/
Distributed
# Survey
Responses
Analyzed
Responses/
Distributed
Responses/
Surveys
Opened
TOTAL 2014 979 185 19% 119 12% 64%
Past responders 200 80 40%
Non-responders 779 105 13%
TOTAL 2013 553 184 33% 123 22% 67%
2014 Annual Cooperative
Business Survey Distribution
#Surveys
Distributed
# Surveys
Opened
Opened/
Distributed
# Survey
Responses
Analyzed
Responses/
Distributed
Responses/
Surveys
Opened
2014 TOTAL 979 185 19% 119 12% 64%
October 2014 479 88 18% 40 8% 45%
July 2014 500 97 19% 79 16% 81%
4
The 2014 survey instrument was modified slightly to clarify questions and aid data entry. It also
included a variation for the electric co-operative sector that used sector-specific terminology about
patronage practices. These minor modifications should not
have affected response rate.
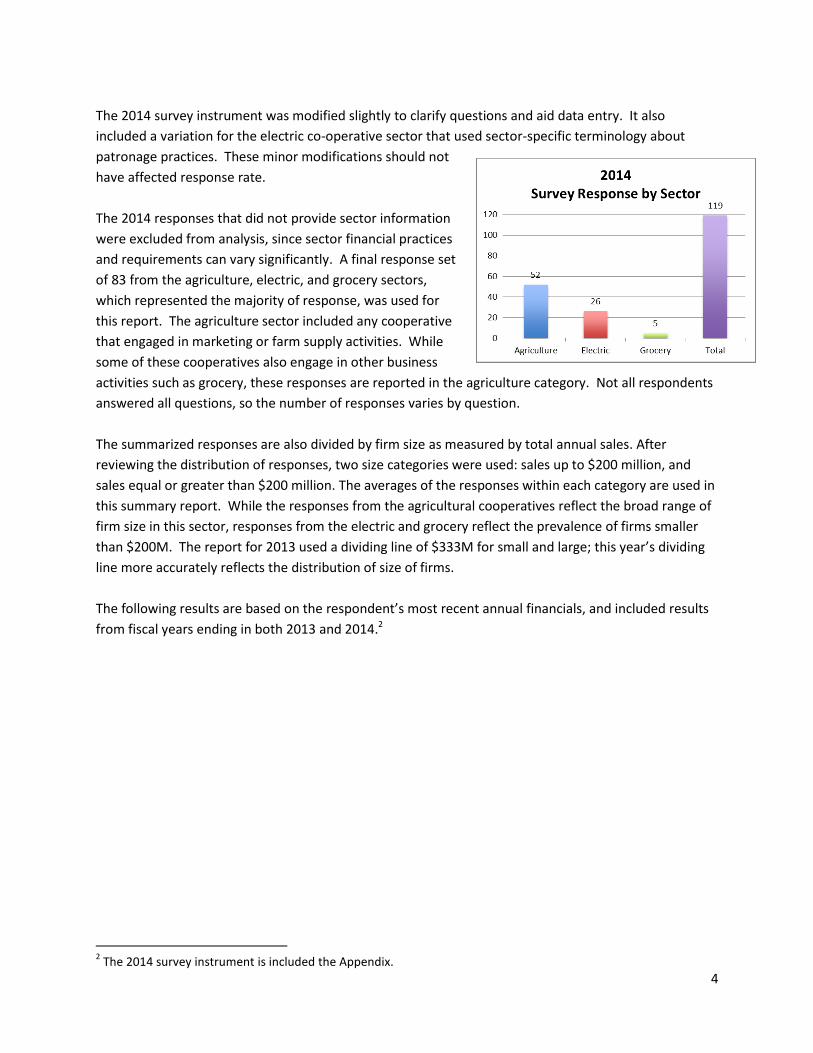
The 2014 responses that did not provide sector information
were excluded from analysis, since sector financial practices
and requirements can vary significantly. A final response set
of 83 from the agriculture, electric, and grocery sectors,
which represented the majority of response, was used for
this report. The agriculture sector included any cooperative
that engaged in marketing or farm supply activities. While
some of these cooperatives also engage in other business
activities such as grocery, these responses are reported in the agriculture category. Not all respondents
answered all questions, so the number of responses varies by question.
The summarized responses are also divided by firm size as measured by total annual sales. After
reviewing the distribution of responses, two size categories were used: sales up to $200 million, and
sales equal or greater than $200 million. The averages of the responses within each category are used in
this summary report. While the responses from the agricultural cooperatives reflect the broad range of
firm size in this sector, responses from the electric and grocery reflect the prevalence of firms smaller
than $200M. The report for 2013 used a dividing line of $333M for small and large; this year’s dividing
line more accurately reflects the distribution of size of firms.
The following results are based on the respondent’s most recent annual financials, and included results
from fiscal years ending in both 2013 and 2014.2
2 The 2014 survey instrument is included the Appendix.
5
Sales and Net Earnings by Source
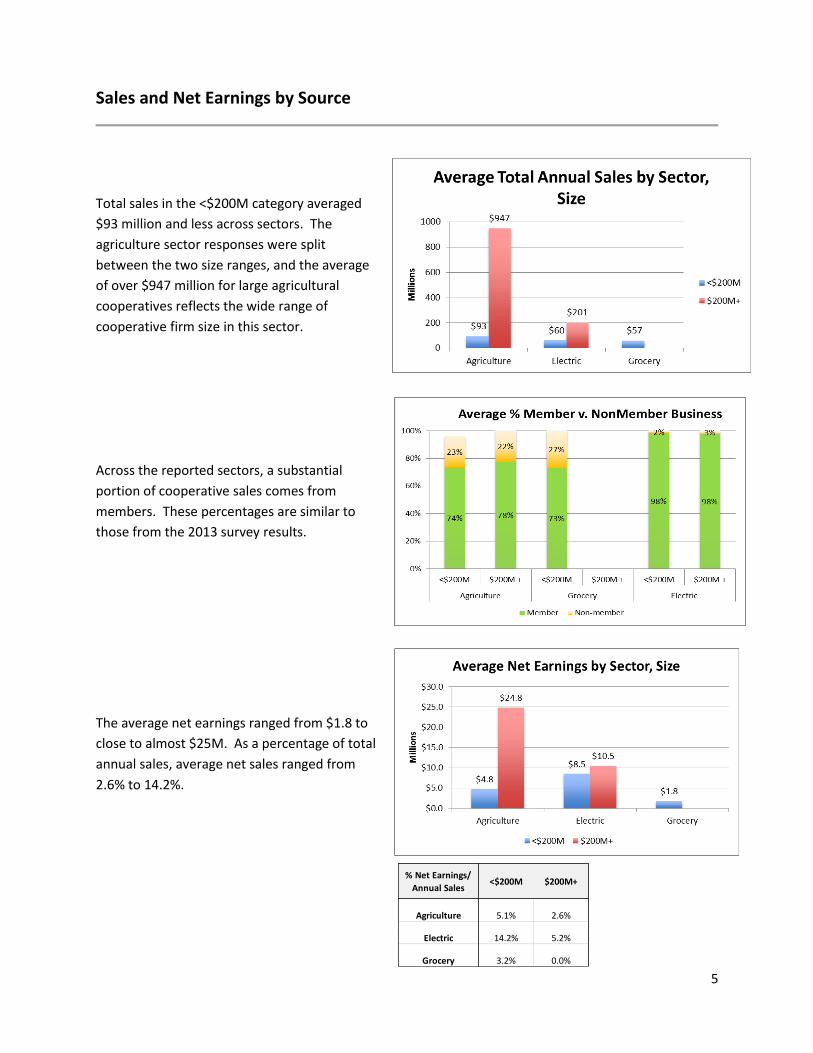
Total sales in the <$200M category averaged
$93 million and less across sectors. The
agriculture sector responses were split
between the two size ranges, and the average
of over $947 million for large agricultural
cooperatives reflects the wide range of
cooperative firm size in this sector.
Across the reported sectors, a substantial
portion of cooperative sales comes from
members. These percentages are similar to
those from the 2013 survey results.
The average net earnings ranged from $1.8 to
close to almost $25M. As a percentage of total
annual sales, average net sales ranged from
2.6% to 14.2%.
% Net Earnings/
Annual Sales<$200M $200M+
Agriculture 5.1% 2.6%
Electric 14.2% 5.2%
Grocery 3.2% 0.0%
6
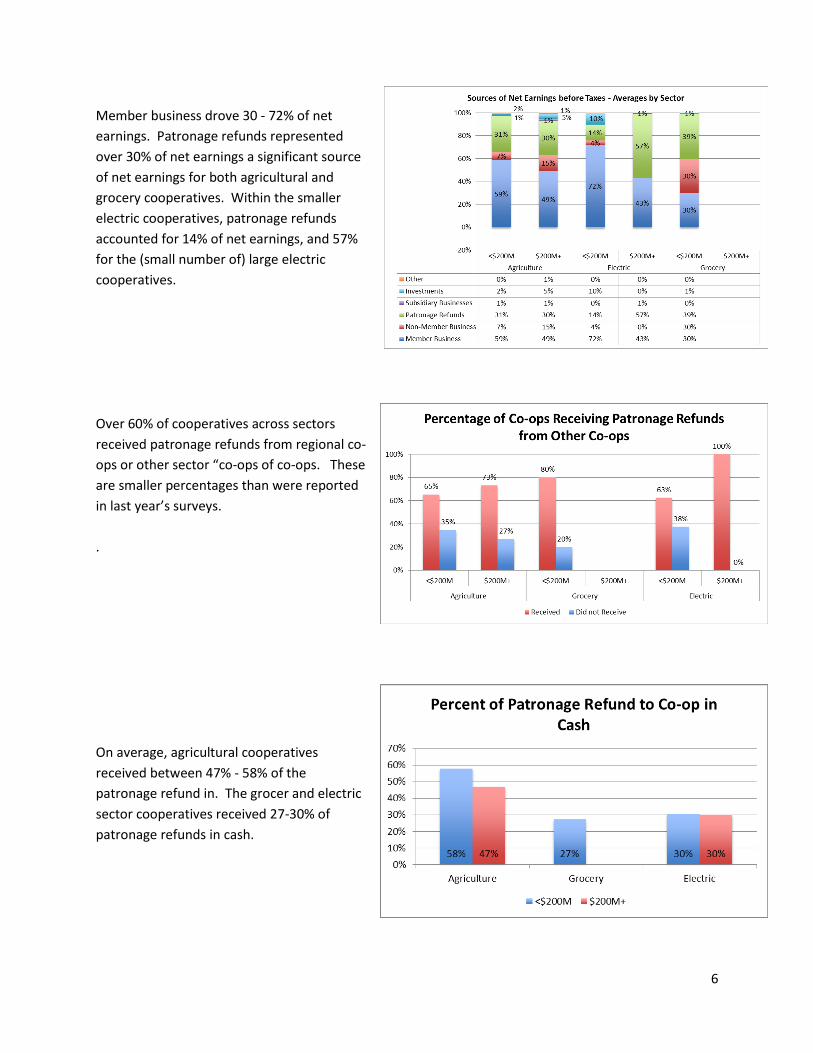
Member business drove 30 - 72% of net
earnings. Patronage refunds represented
over 30% of net earnings a significant source
of net earnings for both agricultural and
grocery cooperatives. Within the smaller
electric cooperatives, patronage refunds
accounted for 14% of net earnings, and 57%
for the (small number of) large electric
cooperatives.
Over 60% of cooperatives across sectors
received patronage refunds from regional co-
ops or other sector “co-ops of co-ops. These
are smaller percentages than were reported
in last year’s surveys.
.
On average, agricultural cooperatives
received between 47% - 58% of the
patronage refund in. The grocer and electric
sector cooperatives received 27-30% of
patronage refunds in cash.
7
Patronage Allocations
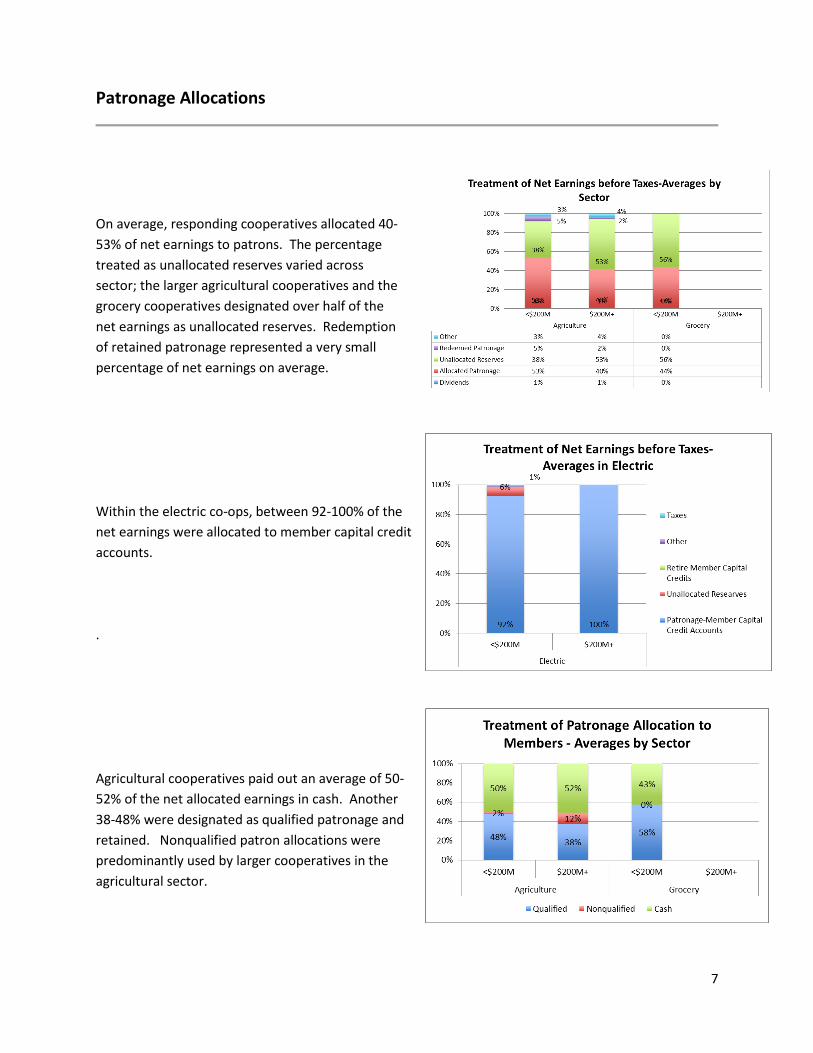
On average, responding cooperatives allocated 40-
53% of net earnings to patrons. The percentage
treated as unallocated reserves varied across
sector; the larger agricultural cooperatives and the
grocery cooperatives designated over half of the
net earnings as unallocated reserves. Redemption
of retained patronage represented a very small
percentage of net earnings on average.
Within the electric co-ops, between 92-100% of the
net earnings were allocated to member capital credit
accounts.
.
Agricultural cooperatives paid out an average of 50-
52% of the net allocated earnings in cash. Another
38-48% were designated as qualified patronage and
retained. Nonqualified patron allocations were
predominantly used by larger cooperatives in the
agricultural sector.
8
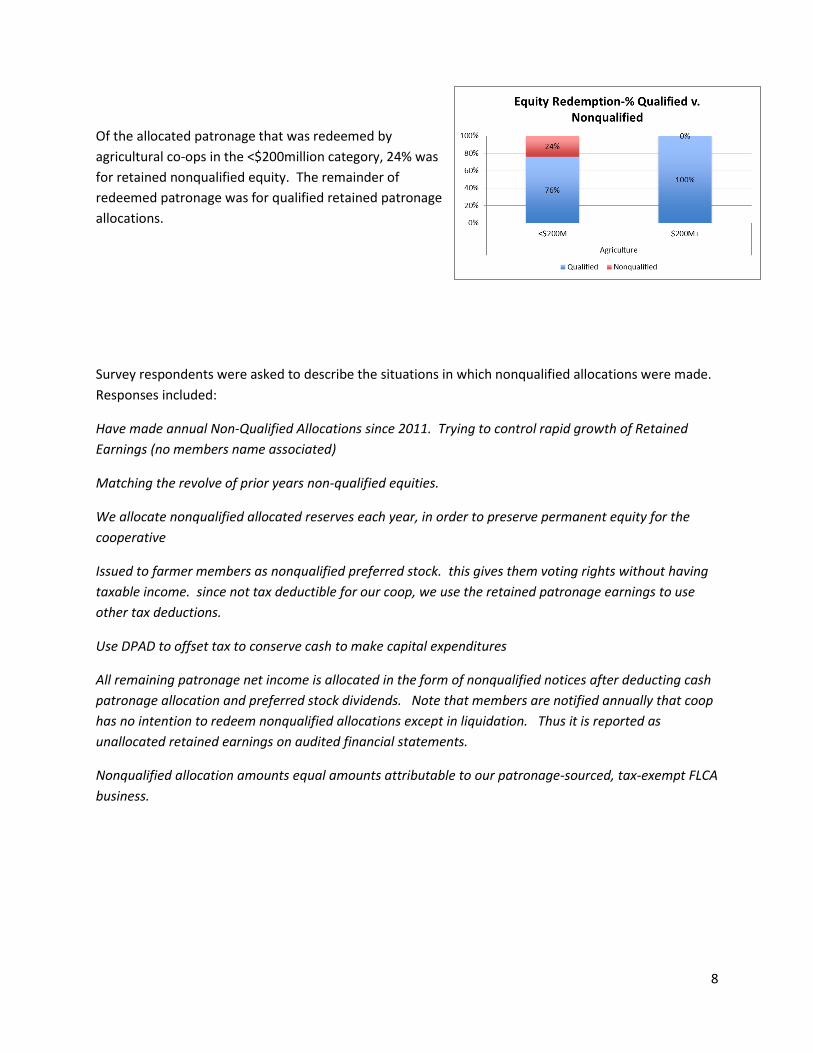
Of the allocated patronage that was redeemed by
agricultural co-ops in the <$200million category, 24% was
for retained nonqualified equity. The remainder of
redeemed patronage was for qualified retained patronage
allocations.
Survey respondents were asked to describe the situations in which nonqualified allocations were made.
Responses included:
Have made annual Non-Qualified Allocations since 2011. Trying to control rapid growth of Retained
Earnings (no members name associated)
Matching the revolve of prior years non-qualified equities.
We allocate nonqualified allocated reserves each year, in order to preserve permanent equity for the
cooperative
Issued to farmer members as nonqualified preferred stock. this gives them voting rights without having
taxable income. since not tax deductible for our coop, we use the retained patronage earnings to use
other tax deductions.
Use DPAD to offset tax to conserve cash to make capital expenditures
All remaining patronage net income is allocated in the form of nonqualified notices after deducting cash
patronage allocation and preferred stock dividends. Note that members are notified annually that coop
has no intention to redeem nonqualified allocations except in liquidation. Thus it is reported as
unallocated retained earnings on audited financial statements.
Nonqualified allocation amounts equal amounts attributable to our patronage-sourced, tax-exempt FLCA
business.
9
Equity Redemption Programs
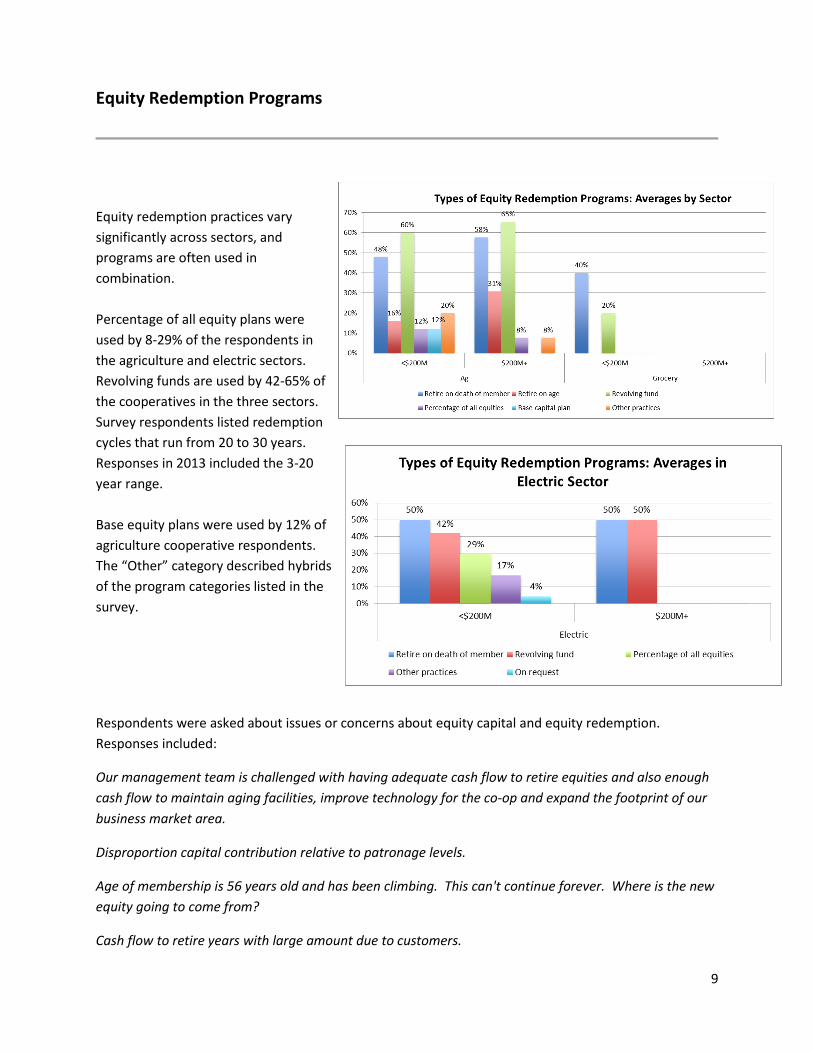
Equity redemption practices vary
significantly across sectors, and
programs are often used in
combination.
Percentage of all equity plans were
used by 8-29% of the respondents in
the agriculture and electric sectors.
Revolving funds are used by 42-65% of
the cooperatives in the three sectors.
Survey respondents listed redemption
cycles that run from 20 to 30 years.
Responses in 2013 included the 3-20
year range.
Base equity plans were used by 12% of
agriculture cooperative respondents.
The “Other” category described hybrids
of the program categories listed in the
survey.
Respondents were asked about issues or concerns about equity capital and equity redemption.
Responses included:
Our management team is challenged with having adequate cash flow to retire equities and also enough
cash flow to maintain aging facilities, improve technology for the co-op and expand the footprint of our
business market area.
Disproportion capital contribution relative to patronage levels.
Age of membership is 56 years old and has been climbing. This can't continue forever. Where is the new
equity going to come from?
Cash flow to retire years with large amount due to customers.
10
Accumulating equity to fund capital expenditures to compete with non-cooperative entities.
Constant need for more equity in order to expand and upgrade facilities accommodating growth of
producers.
We are considering some fundamental changes in our patronage program. As we think about our
patrons of today and of the future, they are different from the patrons of yesterday. They demand more
immediacy. Some of our proposed changes include making the value of the co-op membership more
meaningful & valuable to the patron, having the value be more tangible & immediate instead of a small
check our patrons are required to take to the bank to deposit each year.
Locating inactive members.
We are trying to get to a 15 year revolvement. We are constrained by available cash. We revolve at
least one year, and when cash is available, more than one year.
One issue would be what to do with patrons that are still actively farming and earning equity and their
equity has been redeemed through our age redemption program. We don't have a set plan on this yet,
but we keep discussing it at planning sessions. Patrons that are over 79 and still earning are basically
getting paid 100%, not all at the time the allocated is issued but as soon as the next age redemption
happens.
Would like to shrink the time of the revolve and always a balance to create permanent equity within the
cooperative
Our member companies have been consolidating over the years so they are bigger and fewer. Since we
are very current with our redemptions the majority of voting interests is with fewer members giving
them considerable power.
Keeping the unallocated equity below a board approved 65%
About two-thirds of our equity consists of allocations from our power supply cooperative. They are on a
much slower rotation period than we are.
Revolvment is based on board discretion, currently targeted at 7 years
Due to the expansion we have been slow at paying out old equity. Have two more major projects then
cash flow can be used to increase annual payouts
Determining balance between a)building sufficient equity and capital to expand the business and b)
returning cash to our producer members in keeping with cooperative principles
Every year. We make nonqualified allocations to Producers and Businesses.
11
Outlook and Capital Expenditures
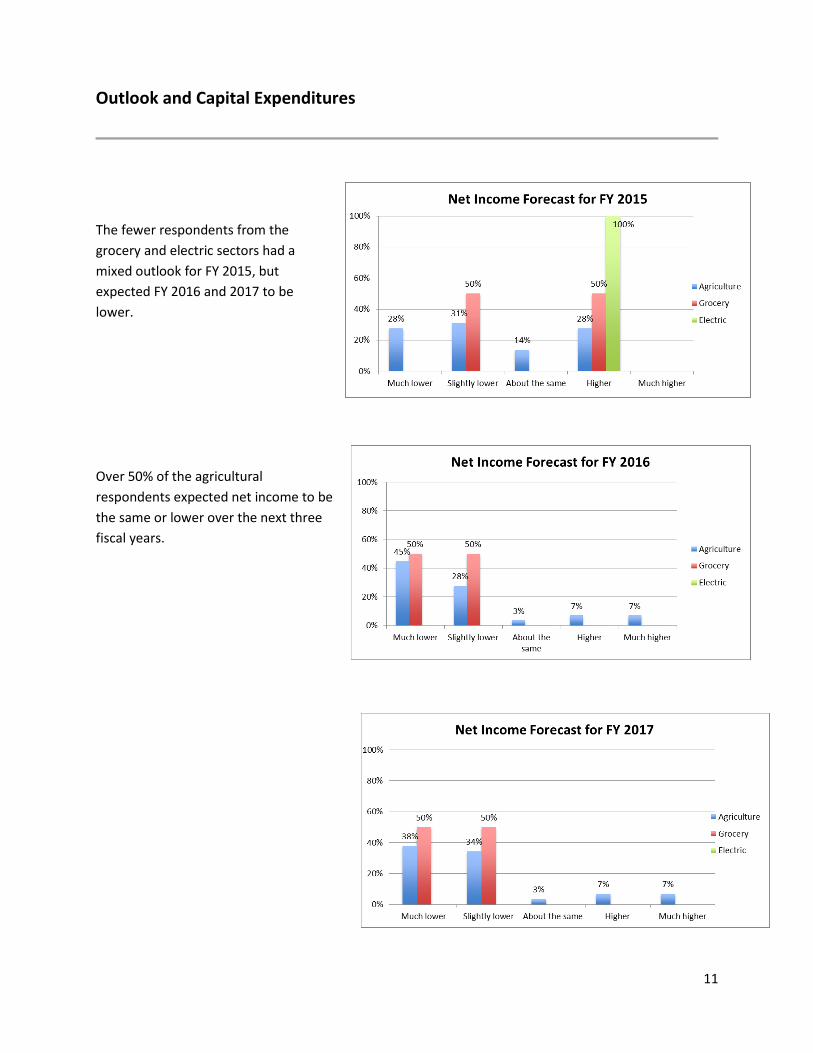
The fewer respondents from the
grocery and electric sectors had a
mixed outlook for FY 2015, but
expected FY 2016 and 2017 to be
lower.
Over 50% of the agricultural
respondents expected net income to be
the same or lower over the next three
fiscal years.
12
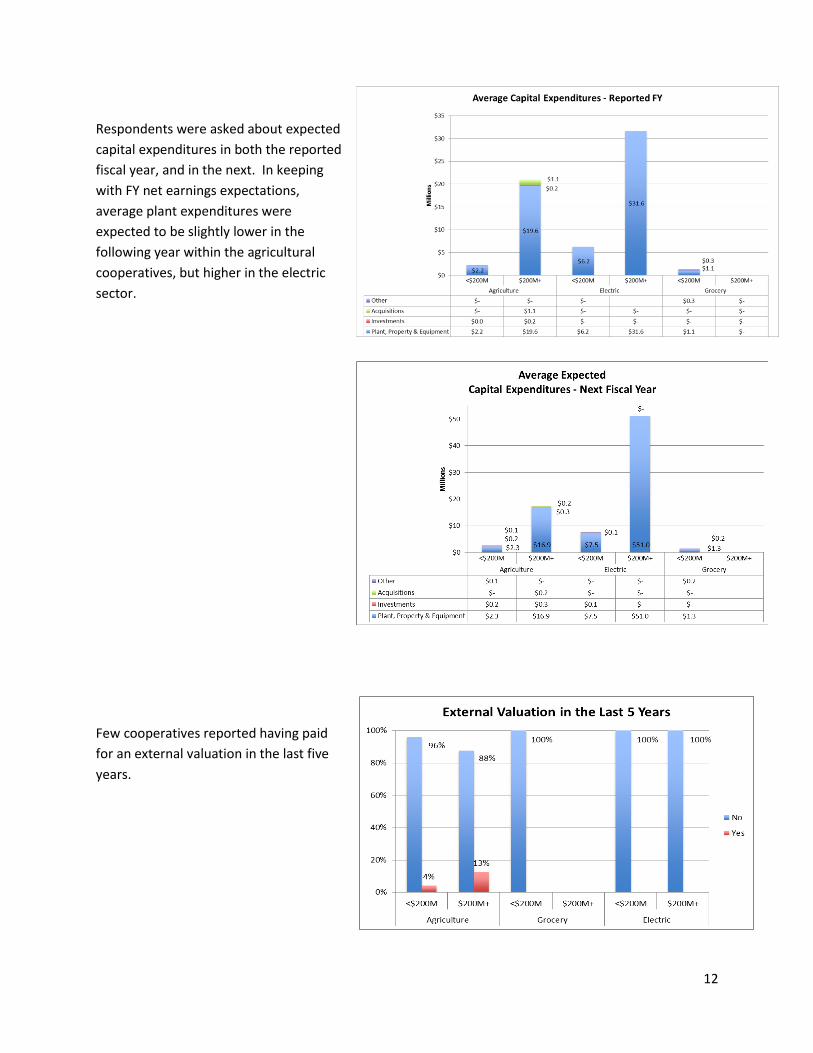
Respondents were asked about expected
capital expenditures in both the reported
fiscal year, and in the next. In keeping
with FY net earnings expectations,
average plant expenditures were
expected to be slightly lower in the
following year within the agricultural
cooperatives, but higher in the electric
sector.
Few cooperatives reported having paid
for an external valuation in the last five
years.
13
Balance Sheet Comparisons
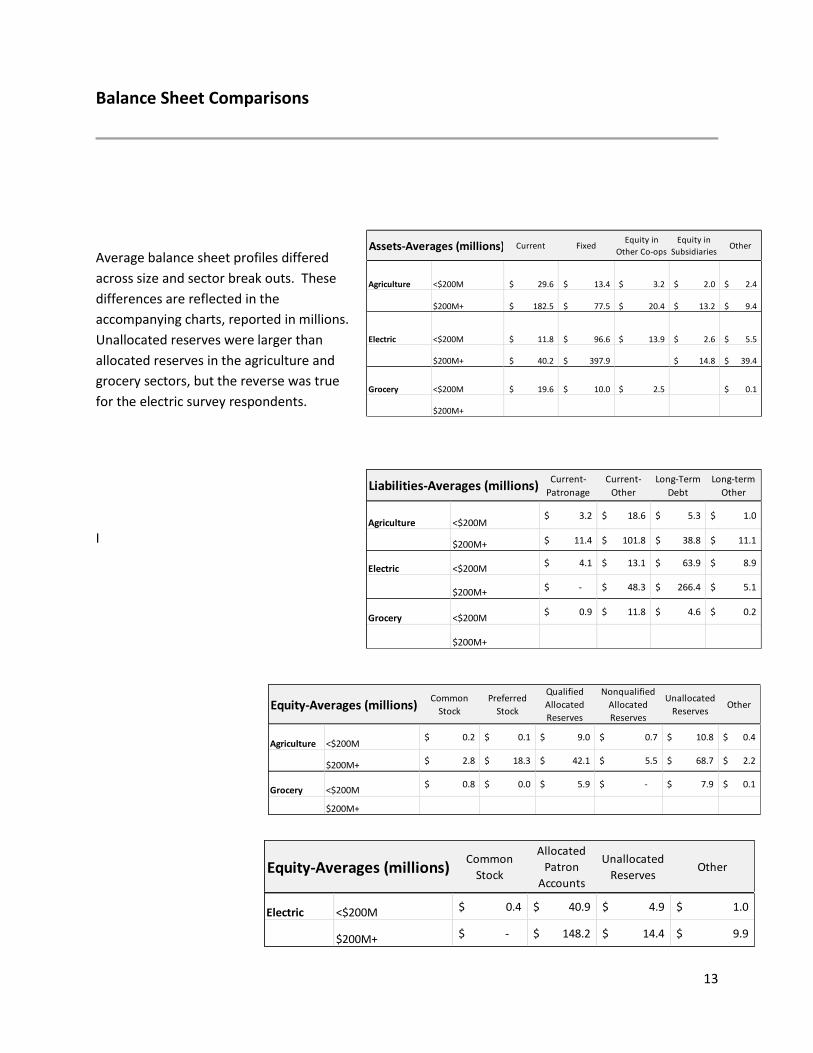
Average balance sheet profiles differed
across size and sector break outs. These
differences are reflected in the
accompanying charts, reported in millions.
Unallocated reserves were larger than
allocated reserves in the agriculture and
grocery sectors, but the reverse was true
for the electric survey respondents.
I
Assets-Averages (millions) Current FixedEquity in
Other Co-ops
Equity in
SubsidiariesOther
Agriculture <$200M 29.6$ 13.4$ 3.2$ 2.0$ 2.4$
$200M+ 182.5$ 77.5$ 20.4$ 13.2$ 9.4$
Electric <$200M 11.8$ 96.6$ 13.9$ 2.6$ 5.5$
$200M+ 40.2$ 397.9$ 14.8$ 39.4$
Grocery <$200M 19.6$ 10.0$ 2.5$ 0.1$
$200M+
Liabilities-Averages (millions)Current-
Patronage
Current-
Other
Long-Term
Debt
Long-term
Other
Agriculture <$200M3.2$ 18.6$ 5.3$ 1.0$
$200M+ 11.4$ 101.8$ 38.8$ 11.1$
Electric <$200M4.1$ 13.1$ 63.9$ 8.9$
$200M+-$ 48.3$ 266.4$ 5.1$
Grocery <$200M0.9$ 11.8$ 4.6$ 0.2$
$200M+
Equity-Averages (millions)Common
Stock
Preferred
Stock
Qualified
Allocated
Reserves
Nonqualified
Allocated
Reserves
Unallocated
ReservesOther
Agriculture <$200M0.2$ 0.1$ 9.0$ 0.7$ 10.8$ 0.4$
$200M+ 2.8$ 18.3$ 42.1$ 5.5$ 68.7$ 2.2$
Grocery <$200M0.8$ 0.0$ 5.9$ -$ 7.9$ 0.1$
$200M+
Equity-Averages (millions)Common
Stock
Allocated
Patron
Accounts
Unallocated
ReservesOther
Electric <$200M 0.4$ 40.9$ 4.9$ 1.0$
$200M+ -$ 148.2$ 14.4$ 9.9$
14
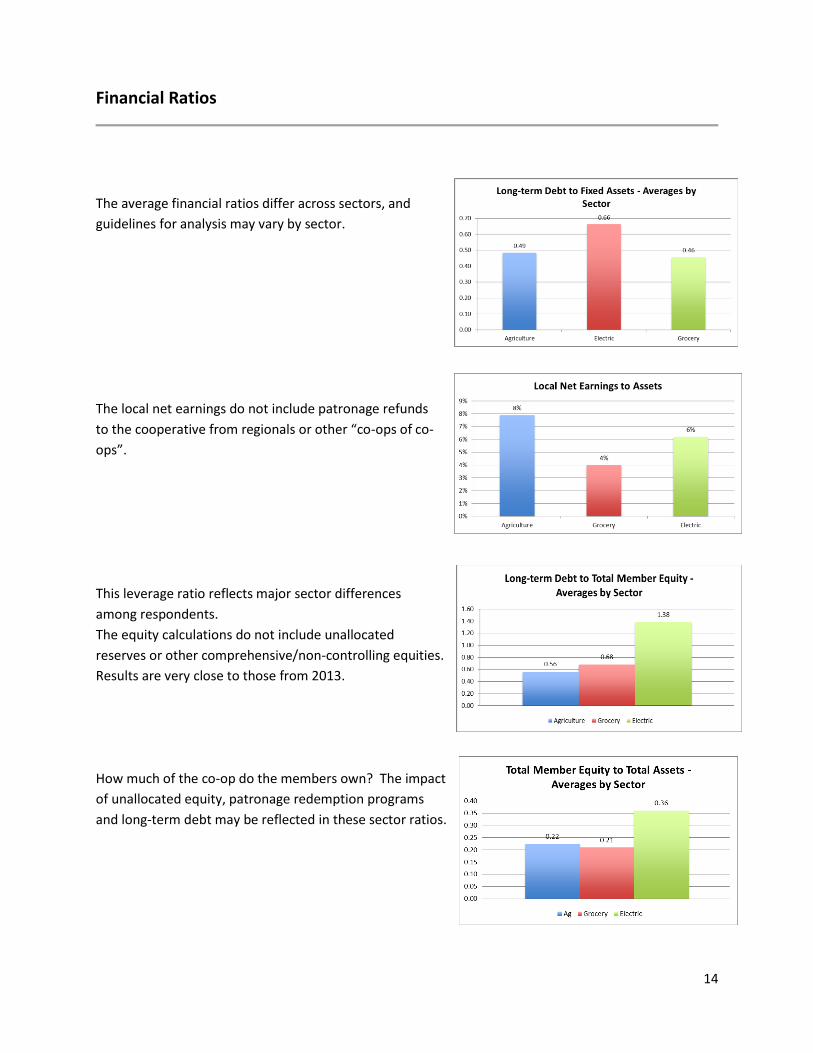
Financial Ratios
The average financial ratios differ across sectors, and
guidelines for analysis may vary by sector.
The local net earnings do not include patronage refunds
to the cooperative from regionals or other “co-ops of co-
ops”.
This leverage ratio reflects major sector differences
among respondents.
The equity calculations do not include unallocated
reserves or other comprehensive/non-controlling equities.
Results are very close to those from 2013.
How much of the co-op do the members own? The impact
of unallocated equity, patronage redemption programs
and long-term debt may be reflected in these sector ratios.
15
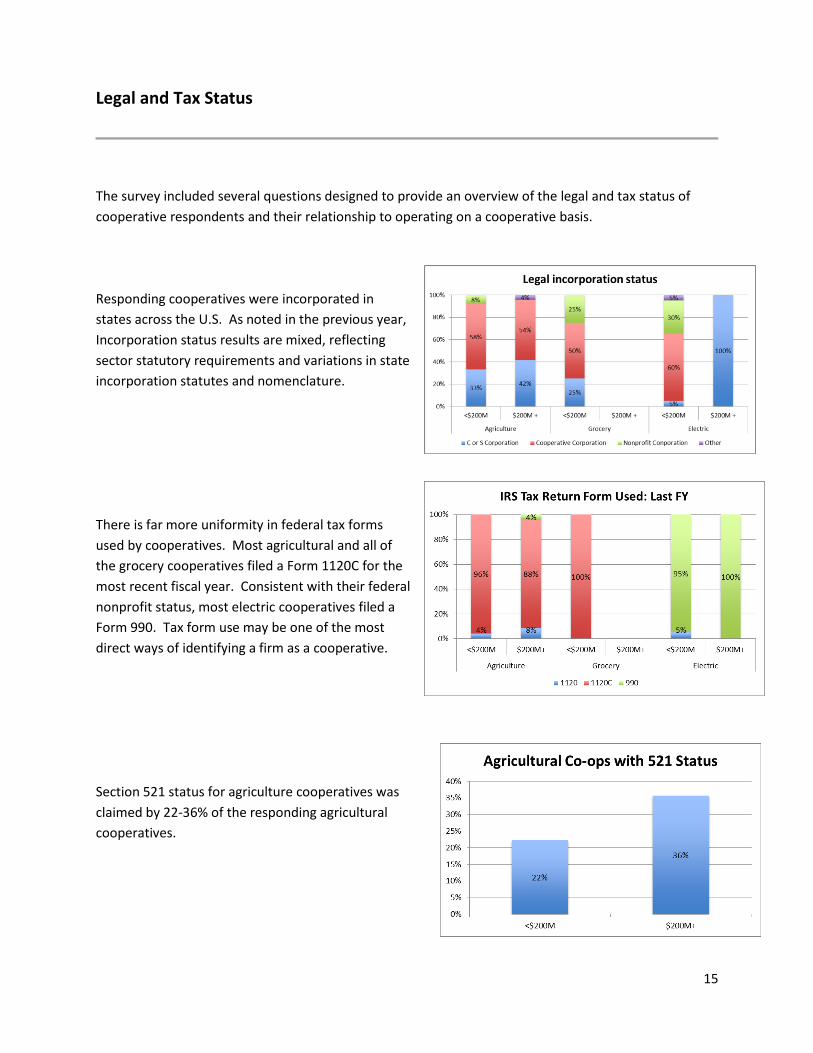
Legal and Tax Status
The survey included several questions designed to provide an overview of the legal and tax status of
cooperative respondents and their relationship to operating on a cooperative basis.
Responding cooperatives were incorporated in
states across the U.S. As noted in the previous year,
Incorporation status results are mixed, reflecting
sector statutory requirements and variations in state
incorporation statutes and nomenclature.
There is far more uniformity in federal tax forms
used by cooperatives. Most agricultural and all of
the grocery cooperatives filed a Form 1120C for the
most recent fiscal year. Consistent with their federal
nonprofit status, most electric cooperatives filed a
Form 990. Tax form use may be one of the most
direct ways of identifying a firm as a cooperative.
Section 521 status for agriculture cooperatives was
claimed by 22-36% of the responding agricultural
cooperatives.
16
Conclusions and Next Steps
The year-long pilot survey project with the NSAC membership has highlighted the opportunities and
challenges of using survey methodology to collect data. The NSAC membership list represents the most
qualified group of possible respondents: cooperative financial professionals who are members of a
professional organization. While the survey was endorsed by NSAC, under 20% of those receiving the
survey invitation opened the survey itself. Of those survey respondents, approximately 20% of the
survey respondents answered a survey in both 2013 and 2014. While these response rates are within
typical ranges, they would need to be substantially higher to produce enough data to look at results
over time, and to produce more in-depth snapshots on an annual basis.
UWCC has been actively pursuing initiatives to develop data resources for researching cooperative
financial behavior, and the role cooperatives play in the economy. Since this project was initiated, other
larger data sets have become available, and may have some of the data that the survey was designed to
collect.
However, the survey does offer opportunities to gather data on financial issues that are unique to
cooperatives and is not available elsewhere. It is interesting to note that 45-67% of those who opened
the survey invitation email went on to participate in the survey. Any new survey project should be
supported by a strong publicity and communication program to encourage participation. In addition,
identifying ways to cost-effectively increase the universe of cooperative contacts would also increase
the amount of response data available for analysis.
UWCC continues to move forward in its efforts to develop more comprehensive data resources to
support research about the cooperative sector. It recognizes that partnerships with key cooperative
organizations are critical. UWCC highly values its relationship with NSAC, and looks forward to
continued collaborative efforts.
17
Appendix
2014. Annual Cooperative Business Survey - Text
Q1 To complete this short survey, you will need a copy of your cooperative's audited financial
statements from the most recent fiscal year, and a copy of the annual report. Please use information
from these financial statements to answer the survey questions.
Please use the arrows on the bottom of the survey to advance or go back a page. Using your browser's
back button will take you out of the survey.
Please note that you can partially complete the survey and reopen it later by closing the browser
window, and using the unique link in your email to reopen the survey. Any data entered will be saved,
and will reappear when you reopen the survey.
Q2 Your cooperative's most recently audited financial statements are from what fiscal year?
2013 (1)
2014 (2)
Q3 In which month does your cooperative's fiscal year begin?
January (1)
February (2)
March (3)
April (4)
May (5)
June (6)
July (7)
August (8)
September (9)
October (10)
November (11)
December (12)
18
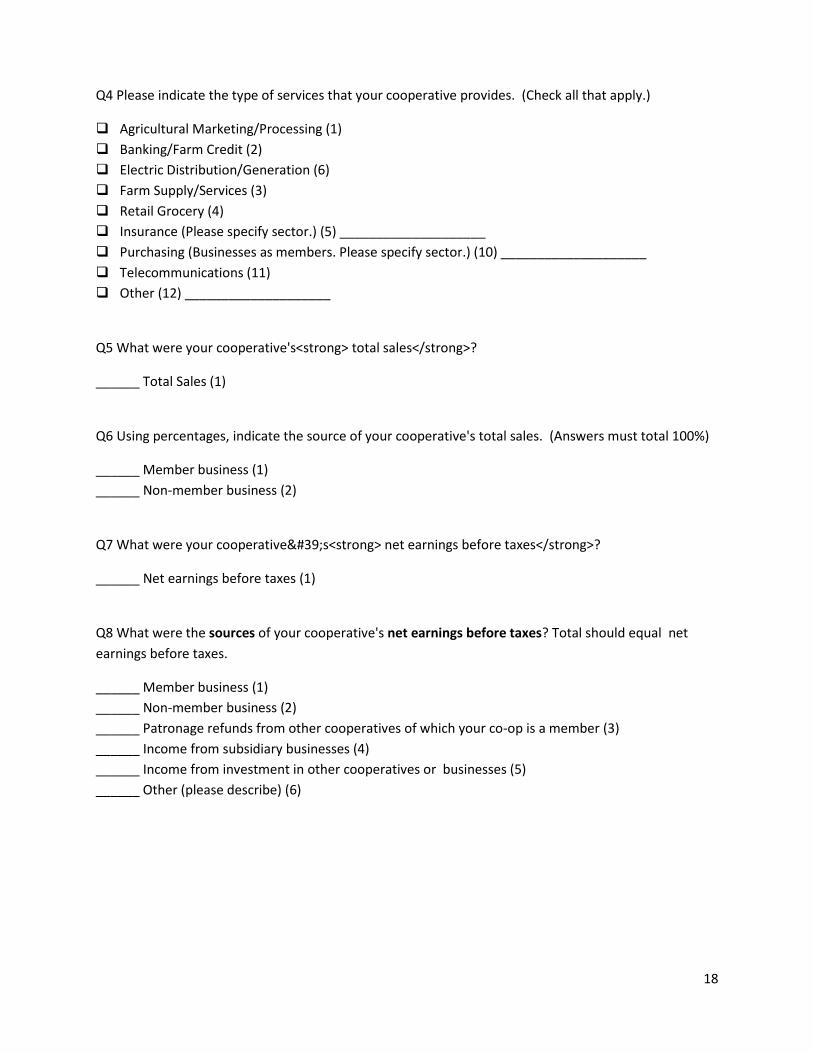
Q4 Please indicate the type of services that your cooperative provides. (Check all that apply.)
Agricultural Marketing/Processing (1)
Banking/Farm Credit (2)
Electric Distribution/Generation (6)
Farm Supply/Services (3)
Retail Grocery (4)
Insurance (Please specify sector.) (5) ____________________
Purchasing (Businesses as members. Please specify sector.) (10) ____________________
Telecommunications (11)
Other (12) ____________________
Q5 What were your cooperative's<strong> total sales</strong>?
______ Total Sales (1)
Q6 Using percentages, indicate the source of your cooperative's total sales. (Answers must total 100%)
______ Member business (1)
______ Non-member business (2)
Q7 What were your cooperative's<strong> net earnings before taxes</strong>?
______ Net earnings before taxes (1)
Q8 What were the sources of your cooperative's net earnings before taxes? Total should equal net
earnings before taxes.
______ Member business (1)
______ Non-member business (2)
______ Patronage refunds from other cooperatives of which your co-op is a member (3)
______ Income from subsidiary businesses (4)
______ Income from investment in other cooperatives or businesses (5)
______ Other (please describe) (6)
19
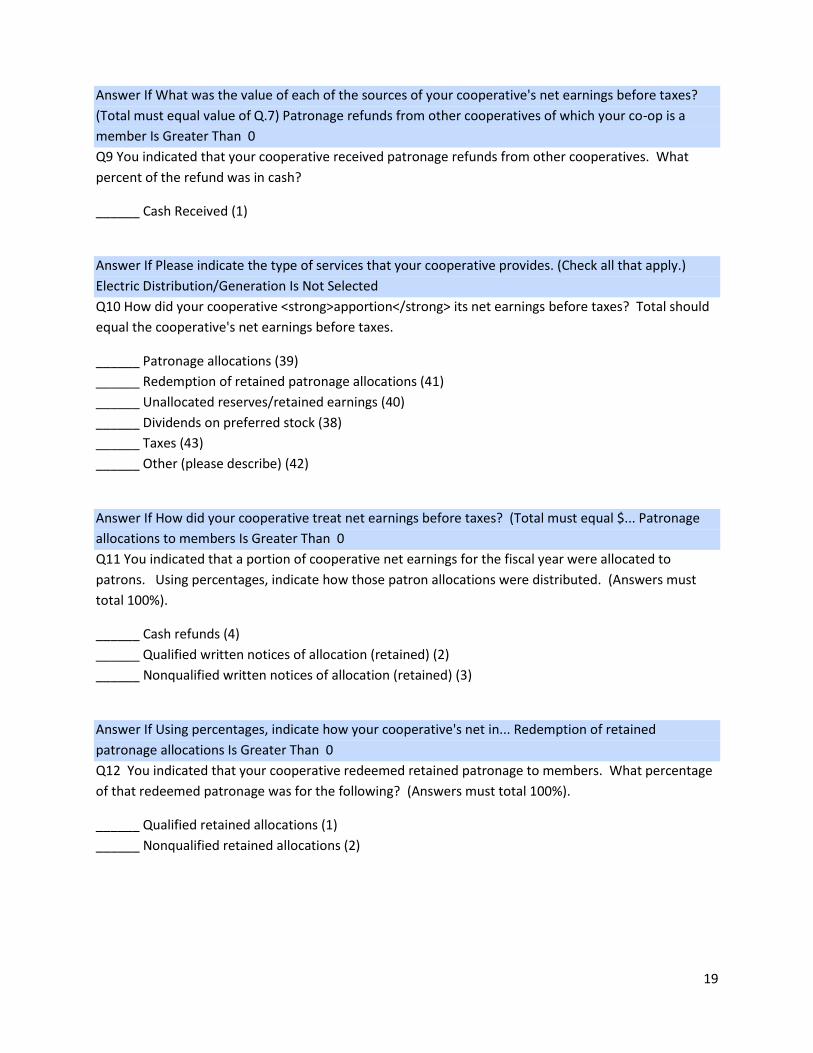
Answer If What was the value of each of the sources of your cooperative's net earnings before taxes?
(Total must equal value of Q.7) Patronage refunds from other cooperatives of which your co-op is a
member Is Greater Than 0
Q9 You indicated that your cooperative received patronage refunds from other cooperatives. What
percent of the refund was in cash?
______ Cash Received (1)
Answer If Please indicate the type of services that your cooperative provides. (Check all that apply.)
Electric Distribution/Generation Is Not Selected
Q10 How did your cooperative <strong>apportion</strong> its net earnings before taxes? Total should
equal the cooperative's net earnings before taxes.
______ Patronage allocations (39)
______ Redemption of retained patronage allocations (41)
______ Unallocated reserves/retained earnings (40)
______ Dividends on preferred stock (38)
______ Taxes (43)
______ Other (please describe) (42)
Answer If How did your cooperative treat net earnings before taxes? (Total must equal $... Patronage
allocations to members Is Greater Than 0
Q11 You indicated that a portion of cooperative net earnings for the fiscal year were allocated to
patrons. Using percentages, indicate how those patron allocations were distributed. (Answers must
total 100%).
______ Cash refunds (4)
______ Qualified written notices of allocation (retained) (2)
______ Nonqualified written notices of allocation (retained) (3)
Answer If Using percentages, indicate how your cooperative's net in... Redemption of retained
patronage allocations Is Greater Than 0
Q12 You indicated that your cooperative redeemed retained patronage to members. What percentage
of that redeemed patronage was for the following? (Answers must total 100%).
______ Qualified retained allocations (1)
______ Nonqualified retained allocations (2)
20
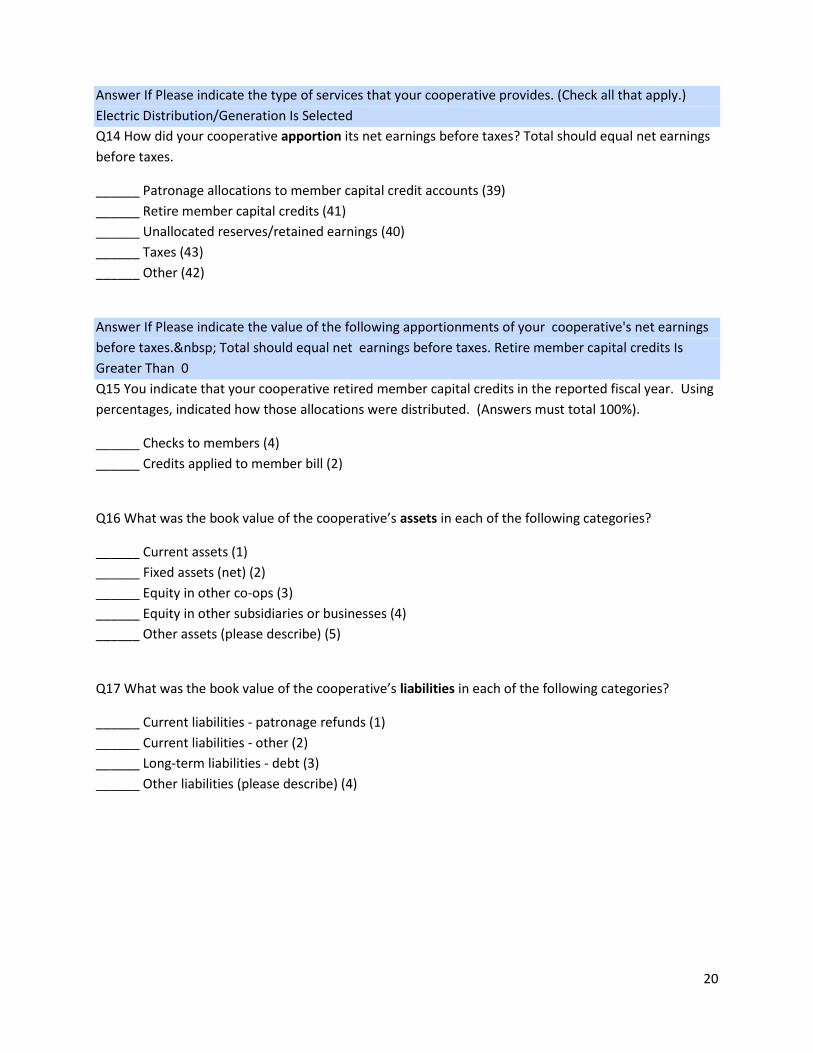
Answer If Please indicate the type of services that your cooperative provides. (Check all that apply.)
Electric Distribution/Generation Is Selected
Q14 How did your cooperative apportion its net earnings before taxes? Total should equal net earnings
before taxes.
______ Patronage allocations to member capital credit accounts (39)
______ Retire member capital credits (41)
______ Unallocated reserves/retained earnings (40)
______ Taxes (43)
______ Other (42)
Answer If Please indicate the value of the following apportionments of your cooperative's net earnings
before taxes. Total should equal net earnings before taxes. Retire member capital credits Is
Greater Than 0
Q15 You indicate that your cooperative retired member capital credits in the reported fiscal year. Using
percentages, indicated how those allocations were distributed. (Answers must total 100%).
______ Checks to members (4)
______ Credits applied to member bill (2)
Q16 What was the book value of the cooperative’s assets in each of the following categories?
______ Current assets (1)
______ Fixed assets (net) (2)
______ Equity in other co-ops (3)
______ Equity in other subsidiaries or businesses (4)
______ Other assets (please describe) (5)
Q17 What was the book value of the cooperative’s liabilities in each of the following categories?
______ Current liabilities - patronage refunds (1)
______ Current liabilities - other (2)
______ Long-term liabilities - debt (3)
______ Other liabilities (please describe) (4)
21
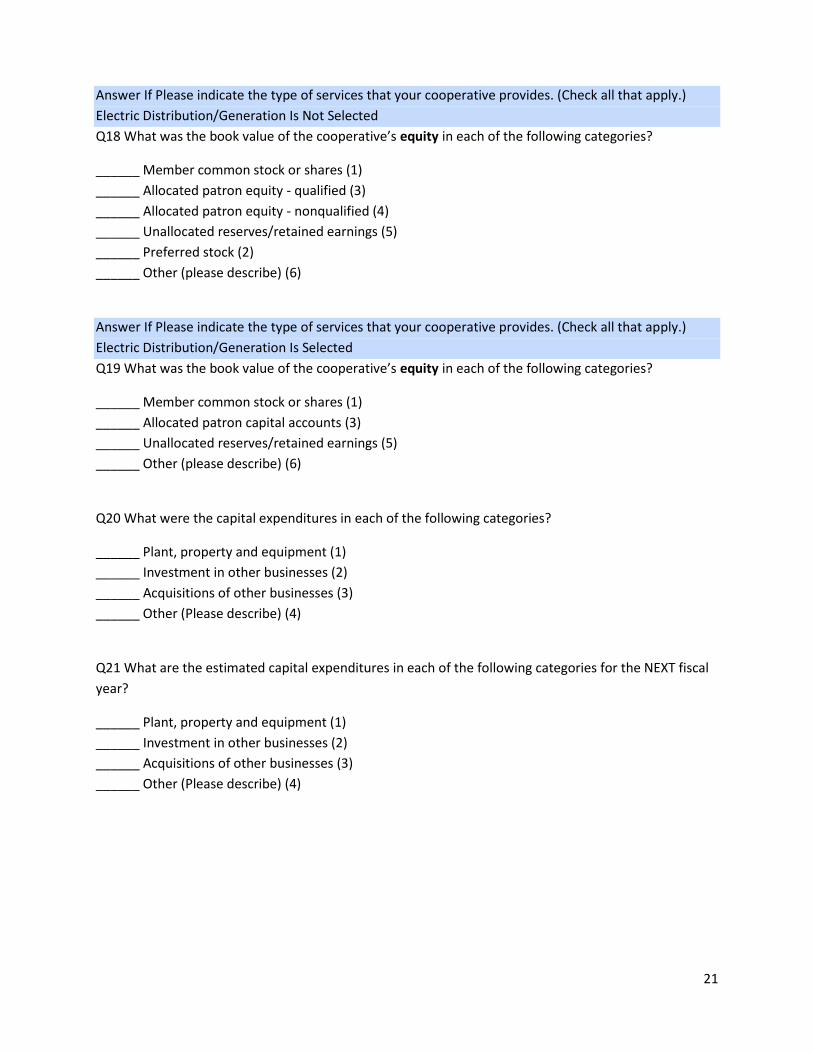
Answer If Please indicate the type of services that your cooperative provides. (Check all that apply.)
Electric Distribution/Generation Is Not Selected
Q18 What was the book value of the cooperative’s equity in each of the following categories?
______ Member common stock or shares (1)
______ Allocated patron equity - qualified (3)
______ Allocated patron equity - nonqualified (4)
______ Unallocated reserves/retained earnings (5)
______ Preferred stock (2)
______ Other (please describe) (6)
Answer If Please indicate the type of services that your cooperative provides. (Check all that apply.)
Electric Distribution/Generation Is Selected
Q19 What was the book value of the cooperative’s equity in each of the following categories?
______ Member common stock or shares (1)
______ Allocated patron capital accounts (3)
______ Unallocated reserves/retained earnings (5)
______ Other (please describe) (6)
Q20 What were the capital expenditures in each of the following categories?
______ Plant, property and equipment (1)
______ Investment in other businesses (2)
______ Acquisitions of other businesses (3)
______ Other (Please describe) (4)
Q21 What are the estimated capital expenditures in each of the following categories for the NEXT fiscal
year?
______ Plant, property and equipment (1)
______ Investment in other businesses (2)
______ Acquisitions of other businesses (3)
______ Other (Please describe) (4)
22
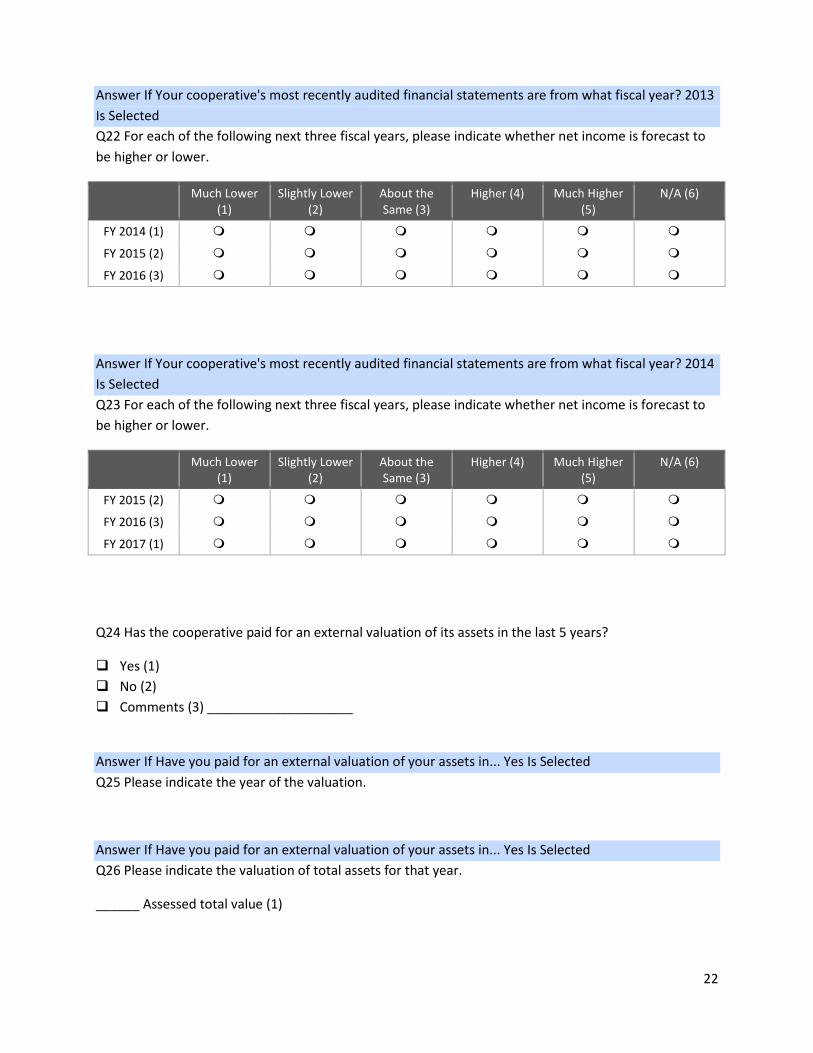
Answer If Your cooperative's most recently audited financial statements are from what fiscal year? 2013
Is Selected
Q22 For each of the following next three fiscal years, please indicate whether net income is forecast to
be higher or lower.
Much Lower (1)
Slightly Lower (2)
About the Same (3)
Higher (4) Much Higher (5)
N/A (6)
FY 2014 (1)
FY 2015 (2)
FY 2016 (3)
Answer If Your cooperative's most recently audited financial statements are from what fiscal year? 2014
Is Selected
Q23 For each of the following next three fiscal years, please indicate whether net income is forecast to
be higher or lower.
Much Lower (1)
Slightly Lower (2)
About the Same (3)
Higher (4) Much Higher (5)
N/A (6)
FY 2015 (2)
FY 2016 (3)
FY 2017 (1)
Q24 Has the cooperative paid for an external valuation of its assets in the last 5 years?
Yes (1)
No (2)
Comments (3) ____________________
Answer If Have you paid for an external valuation of your assets in... Yes Is Selected
Q25 Please indicate the year of the valuation.
Answer If Have you paid for an external valuation of your assets in... Yes Is Selected
Q26 Please indicate the valuation of total assets for that year.
______ Assessed total value (1)
23
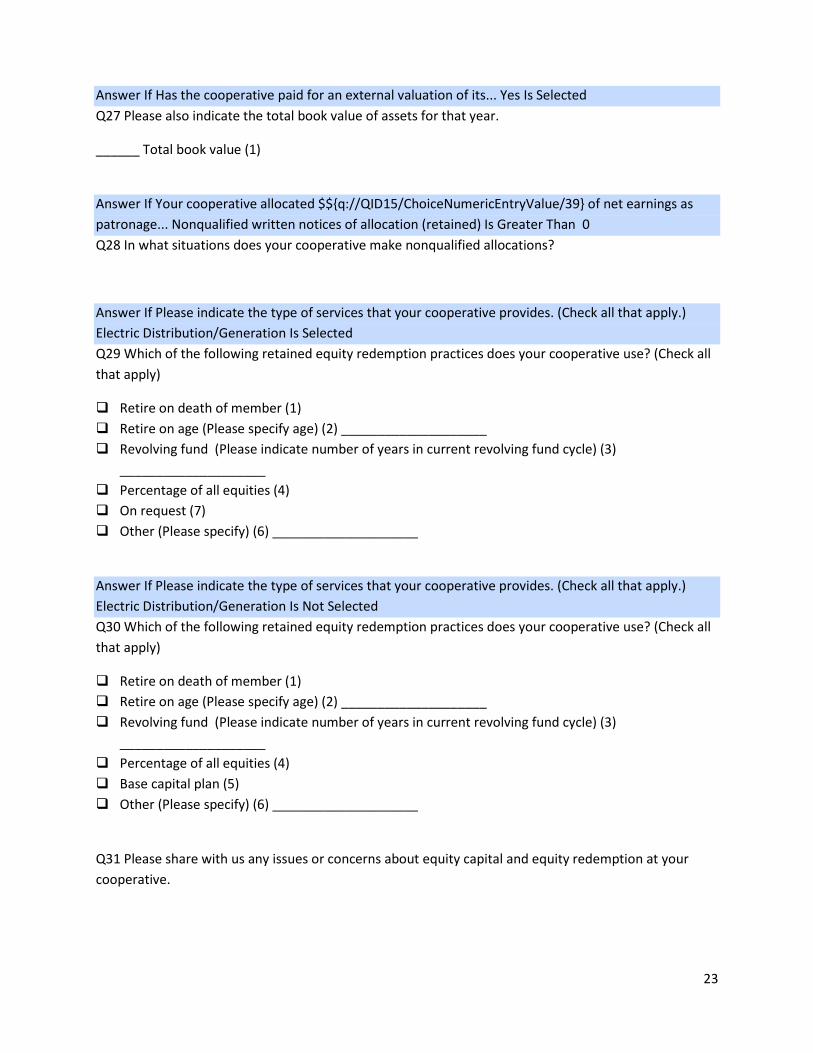
Answer If Has the cooperative paid for an external valuation of its... Yes Is Selected
Q27 Please also indicate the total book value of assets for that year.
______ Total book value (1)
Answer If Your cooperative allocated $${q://QID15/ChoiceNumericEntryValue/39} of net earnings as
patronage... Nonqualified written notices of allocation (retained) Is Greater Than 0
Q28 In what situations does your cooperative make nonqualified allocations?
Answer If Please indicate the type of services that your cooperative provides. (Check all that apply.)
Electric Distribution/Generation Is Selected
Q29 Which of the following retained equity redemption practices does your cooperative use? (Check all
that apply)
Retire on death of member (1)
Retire on age (Please specify age) (2) ____________________
Revolving fund (Please indicate number of years in current revolving fund cycle) (3)
____________________
Percentage of all equities (4)
On request (7)
Other (Please specify) (6) ____________________
Answer If Please indicate the type of services that your cooperative provides. (Check all that apply.)
Electric Distribution/Generation Is Not Selected
Q30 Which of the following retained equity redemption practices does your cooperative use? (Check all
that apply)
Retire on death of member (1)
Retire on age (Please specify age) (2) ____________________
Revolving fund (Please indicate number of years in current revolving fund cycle) (3)
____________________
Percentage of all equities (4)
Base capital plan (5)
Other (Please specify) (6) ____________________
Q31 Please share with us any issues or concerns about equity capital and equity redemption at your
cooperative.
24
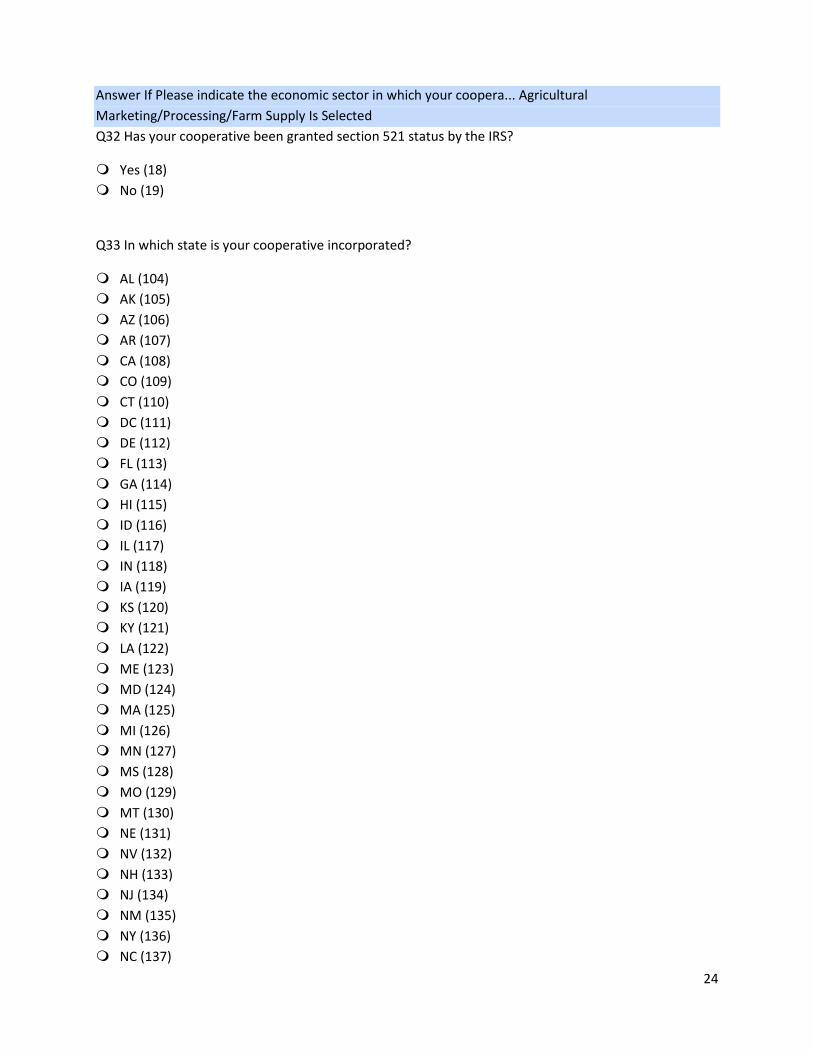
Answer If Please indicate the economic sector in which your coopera... Agricultural
Marketing/Processing/Farm Supply Is Selected
Q32 Has your cooperative been granted section 521 status by the IRS?
Yes (18)
No (19)
Q33 In which state is your cooperative incorporated?
AL (104)
AK (105)
AZ (106)
AR (107)
CA (108)
CO (109)
CT (110)
DC (111)
DE (112)
FL (113)
GA (114)
HI (115)
ID (116)
IL (117)
IN (118)
IA (119)
KS (120)
KY (121)
LA (122)
ME (123)
MD (124)
MA (125)
MI (126)
MN (127)
MS (128)
MO (129)
MT (130)
NE (131)
NV (132)
NH (133)
NJ (134)
NM (135)
NY (136)
NC (137)
25
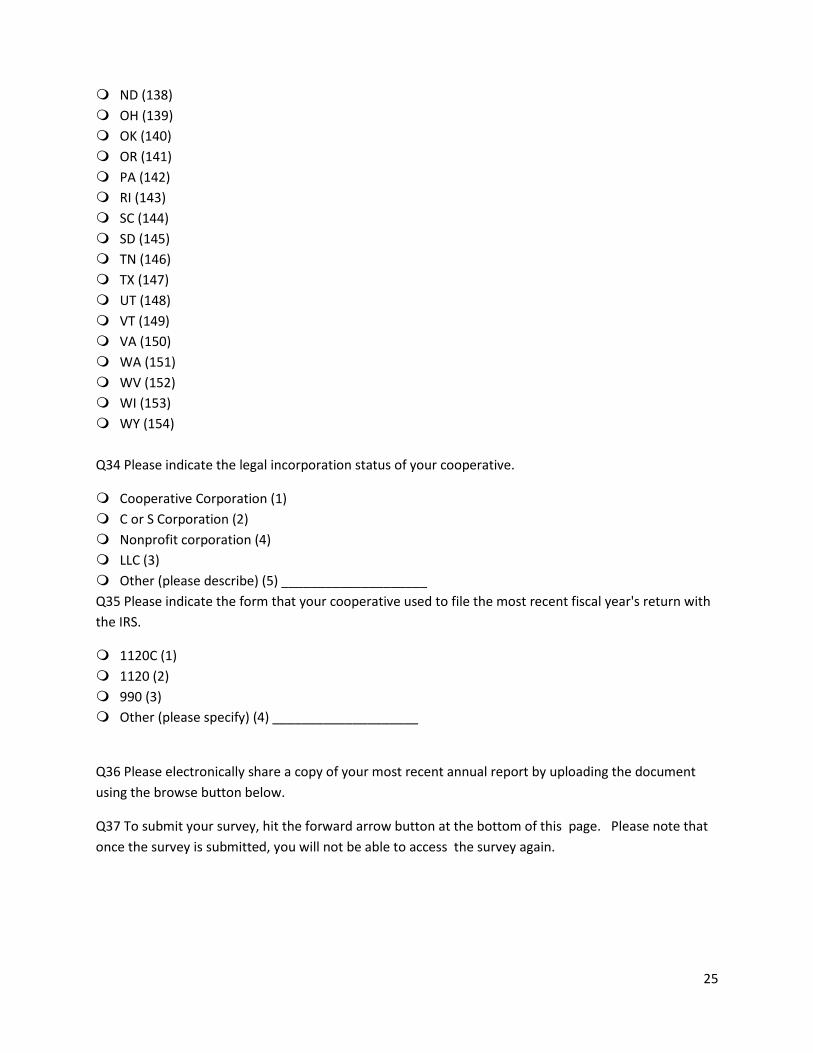
ND (138)
OH (139)
OK (140)
OR (141)
PA (142)
RI (143)
SC (144)
SD (145)
TN (146)
TX (147)
UT (148)
VT (149)
VA (150)
WA (151)
WV (152)
WI (153)
WY (154)
Q34 Please indicate the legal incorporation status of your cooperative.
Cooperative Corporation (1)
C or S Corporation (2)
Nonprofit corporation (4)
LLC (3)
Other (please describe) (5) ____________________
Q35 Please indicate the form that your cooperative used to file the most recent fiscal year's return with
the IRS.
1120C (1)
1120 (2)
990 (3)
Other (please specify) (4) ____________________
Q36 Please electronically share a copy of your most recent annual report by uploading the document
using the browse button below.
Q37 To submit your survey, hit the forward arrow button at the bottom of this page. Please note that
once the survey is submitted, you will not be able to access the survey again.