Embed Size (px)
Citation preview
2014-2018 Financial Plan
Council Priorities Committee
Township of Langley
September 9, 2013
1
Operating Budget Overview
� Sustainability Vision, Goals and Guiding Principles
� 2014-2018 Budget Timeline
� Providing Context:
o Population Growth, past and projected
o 2013 Property Tax Comparison
o Household Impact of Property Tax Increases
o Revenue & Cost Drivers
� 2014 Budget Guidelines, Issues & Challenges
� Items referred to the Budget Process
� 2014 Enhancements included in 2013-2017 Budget
� Budget Simulator
� Next Steps
2
Sustainability Vision, Goals & Guiding Principles…
3
Sustainability Vision
To build a legacy for future generations by leading and commiting the community to a lifestyle that is socially, culturally, economically and environmentallybalanced.
4
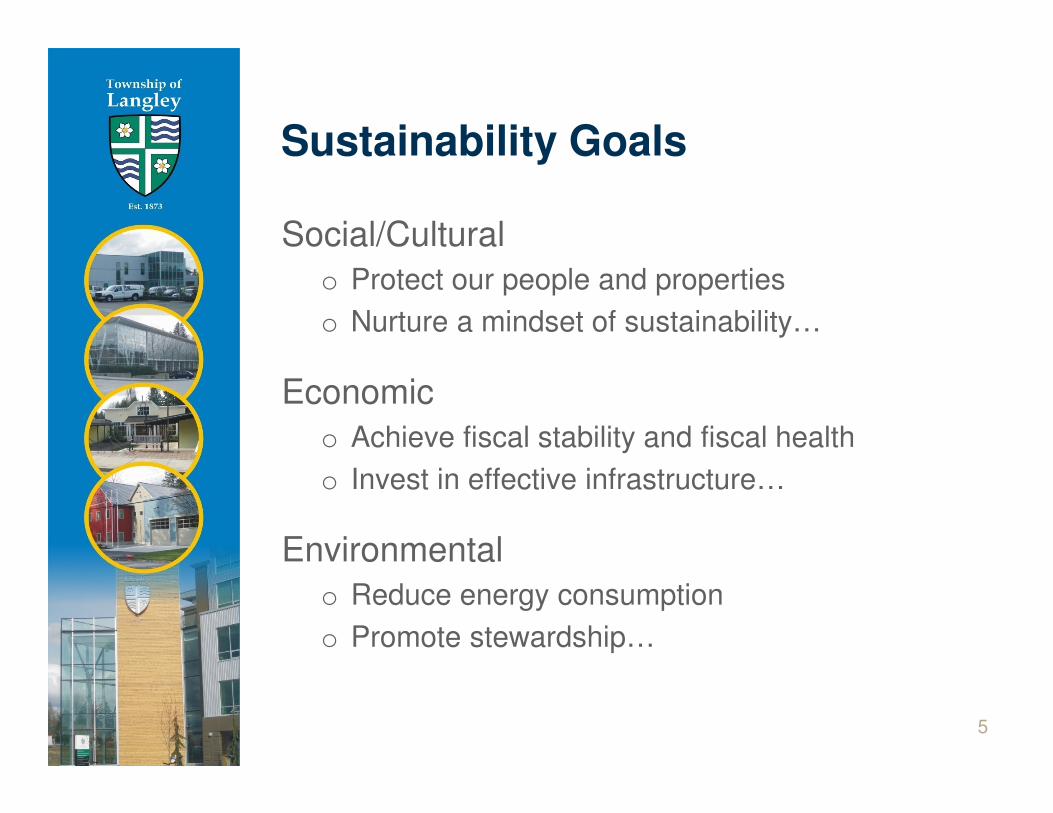
Sustainability Goals
Social/Cultural
o Protect our people and properties
o Nurture a mindset of sustainability…
Economic
o Achieve fiscal stability and fiscal health
o Invest in effective infrastructure…
Environmental
o Reduce energy consumption
o Promote stewardship…
5
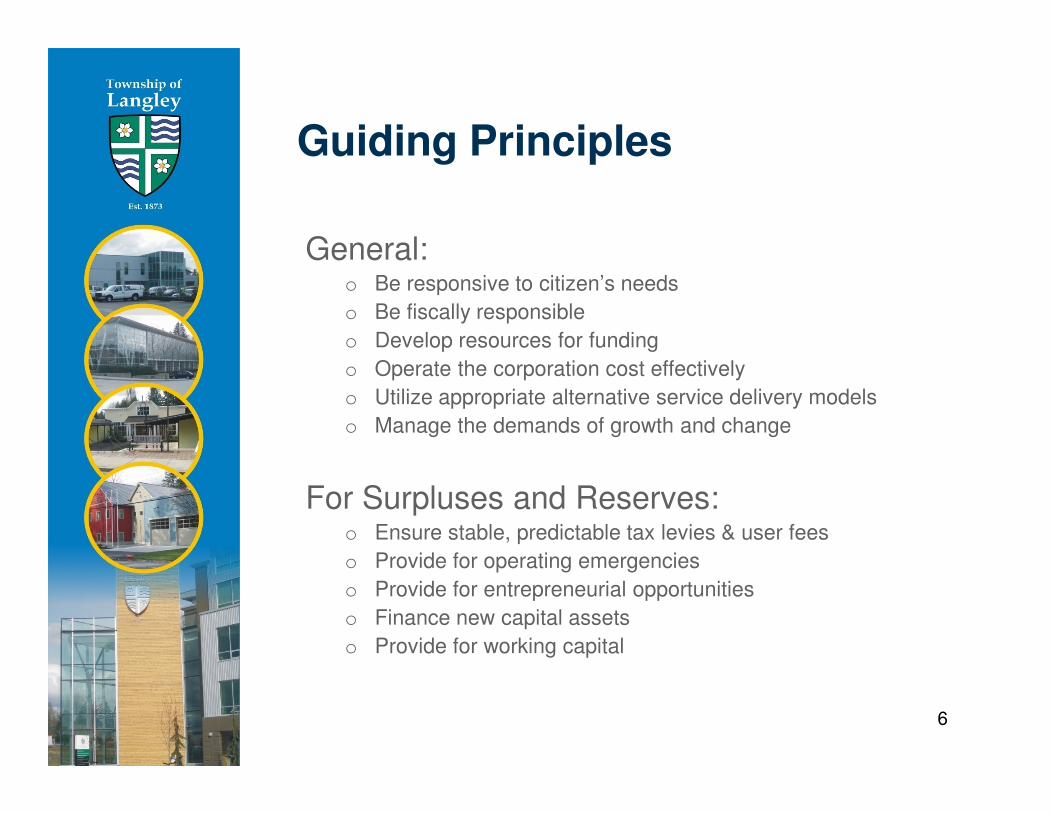
Guiding Principles
General:o Be responsive to citizen’s needs
o Be fiscally responsible
o Develop resources for funding
o Operate the corporation cost effectively
o Utilize appropriate alternative service delivery models
o Manage the demands of growth and change
For Surpluses and Reserves:o Ensure stable, predictable tax levies & user fees
o Provide for operating emergencies
o Provide for entrepreneurial opportunities
o Finance new capital assets
o Provide for working capital
6
2014-2018 Budget Timeline…
7
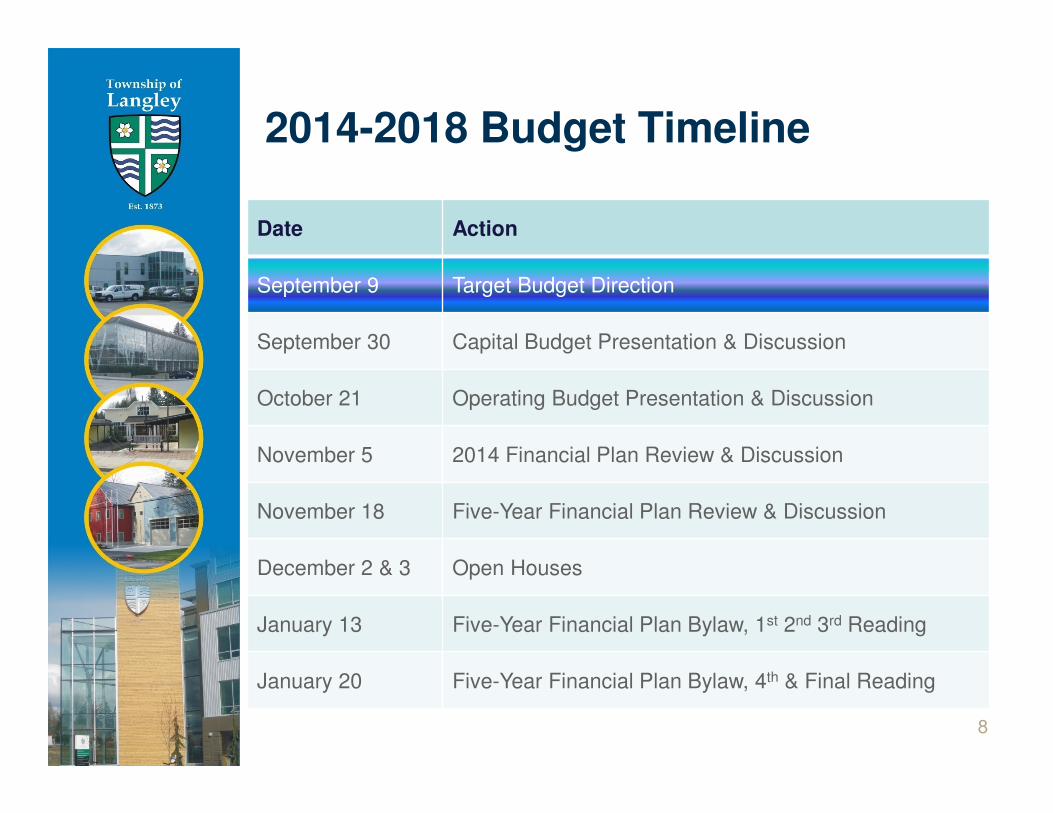
2014-2018 Budget Timeline
8
Date Action
September 9 Target Budget Direction
September 30 Capital Budget Presentation & Discussion
October 21 Operating Budget Presentation & Discussion
November 5 2014 Financial Plan Review & Discussion
November 18 Five-Year Financial Plan Review & Discussion
December 2 & 3 Open Houses
January 13 Five-Year Financial Plan Bylaw, 1st 2nd 3rd Reading
January 20 Five-Year Financial Plan Bylaw, 4th & Final Reading
Providing Context…
9
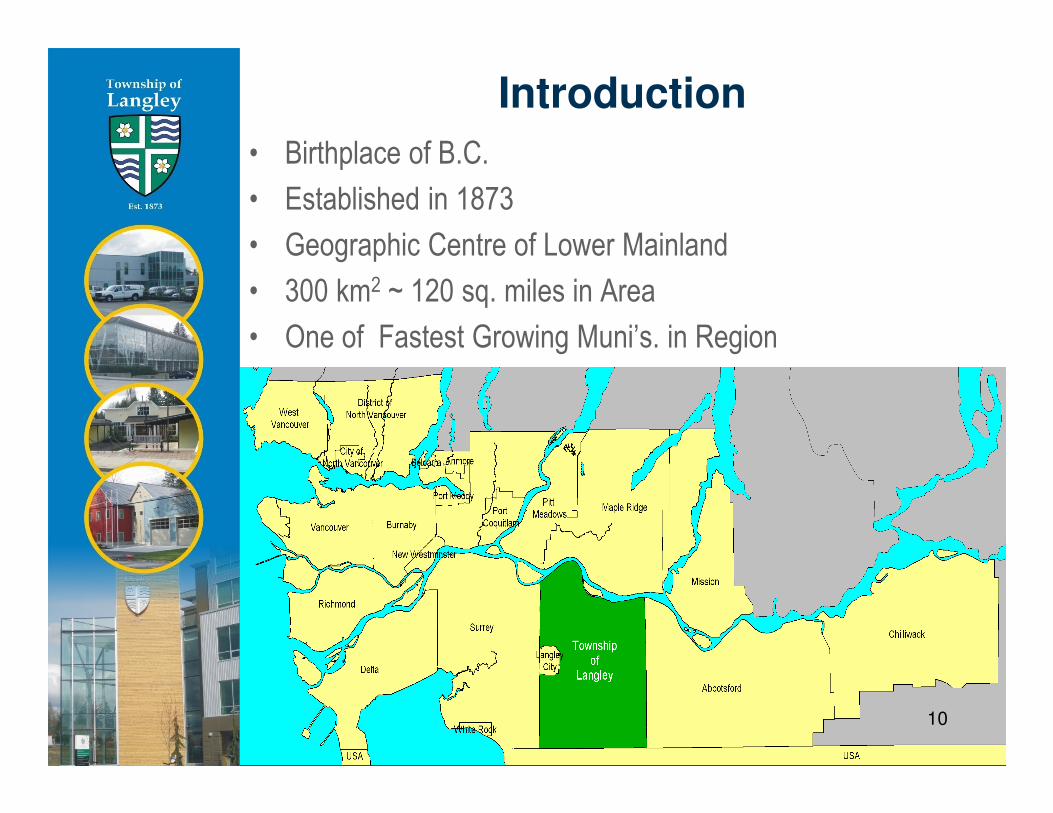
• Birthplace of B.C.
• Established in 1873
• Geographic Centre of Lower Mainland
• 300 km2 ~ 120 sq. miles in Area
• One of Fastest Growing Muni’s. in Region
Introduction
10
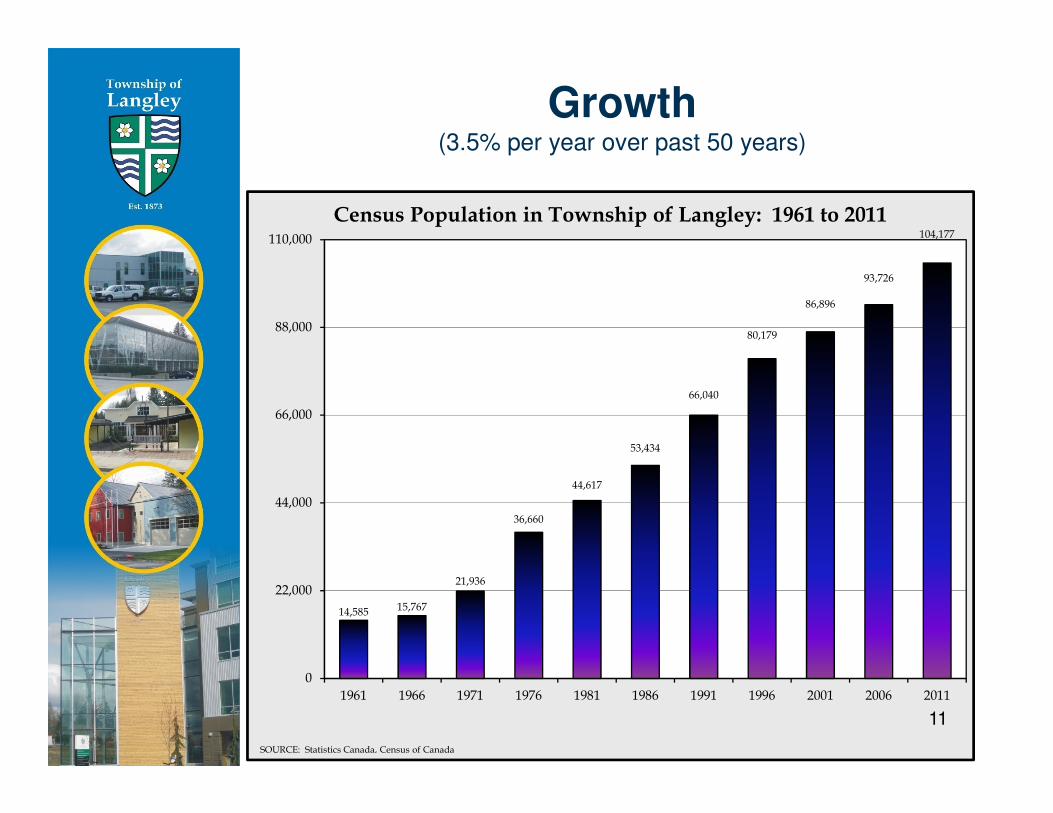
Growth(3.5% per year over past 50 years)
14,58515,767
21,936
36,660
44,617
53,434
66,040
80,179
86,896
93,726
104,177
0
22,000
44,000
66,000
88,000
110,000
1961 1966 1971 1976 1981 1986 1991 1996 2001 2006 2011
Census Population in Township of Langley: 1961 to 2011
SOURCE: Statistics Canada, Census of Canada
11
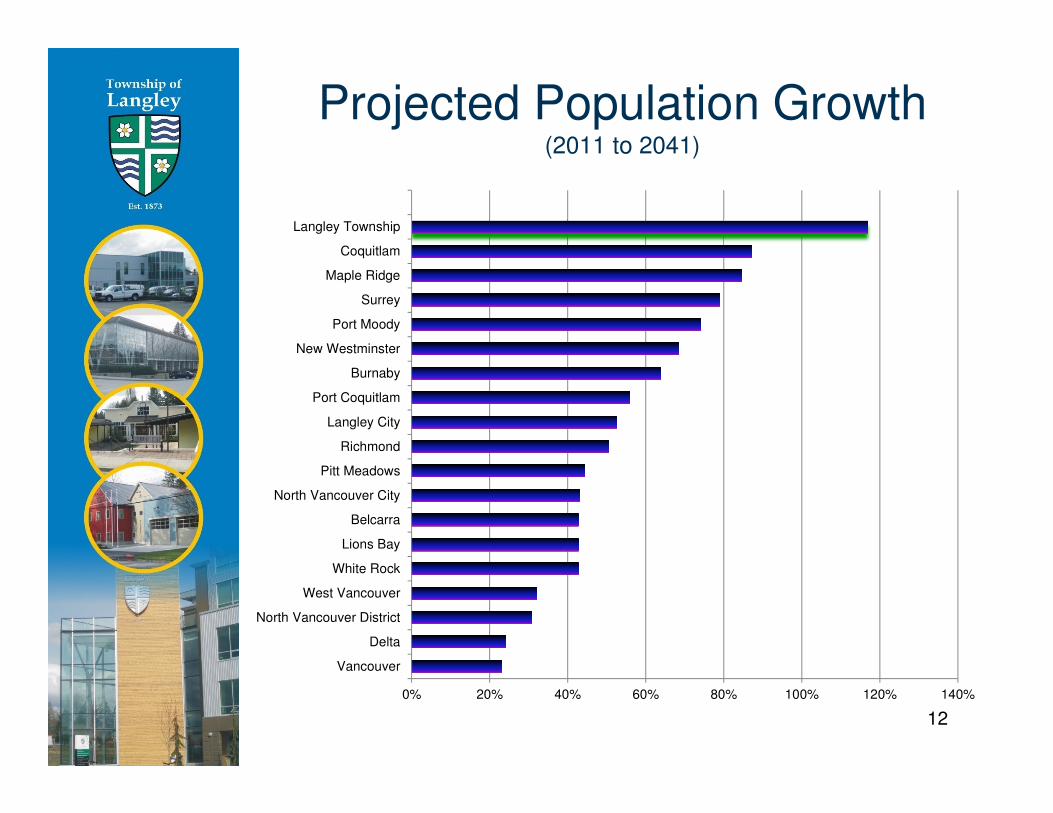
Projected Population Growth(2011 to 2041)
0% 20% 40% 60% 80% 100% 120% 140%
Vancouver
Delta
North Vancouver District
West Vancouver
White Rock
Lions Bay
Belcarra
North Vancouver City
Pitt Meadows
Richmond
Langley City
Port Coquitlam
Burnaby
New Westminster
Port Moody
Surrey
Maple Ridge
Coquitlam
Langley Township
12

2012 Property Tax Comparison
13
Municipality CasinoResidential
Tax RateHouse Value
Household Municipal
Property Taxes
Port Moody 3.30760 735,045 2,431
North Vancouver 2.36446 990,375 2,342
New Westminster Yes 3.54410 660,389 2,340
Coquitlam Yes 3.11480 676,062 2,106
Burnaby Yes 2.23260 920,290 2,055
Richmond Yes 2.00128 993,118 1,988
Abbotsford 4.90751 398,228 1,954
Delta 3.33030 586,293 1,953
Port Coquitlam 3.71290 524,684 1,948
AVERAGE 3.33764 620,919 1,931
Maple Ridge 4.08880 462,137 1,890
Langley City Yes 3.72500 458,913 1,709
Pitt Meadows 3.72580 455,477 1,697
Langley Township 3.19978 506,454 1,621
Surrey Yes 2.35469 614,771 1,448
Chilliwack 4.45502 331,542 1,447
The Township receives approx. $120K
per year in
Gaming Revenue
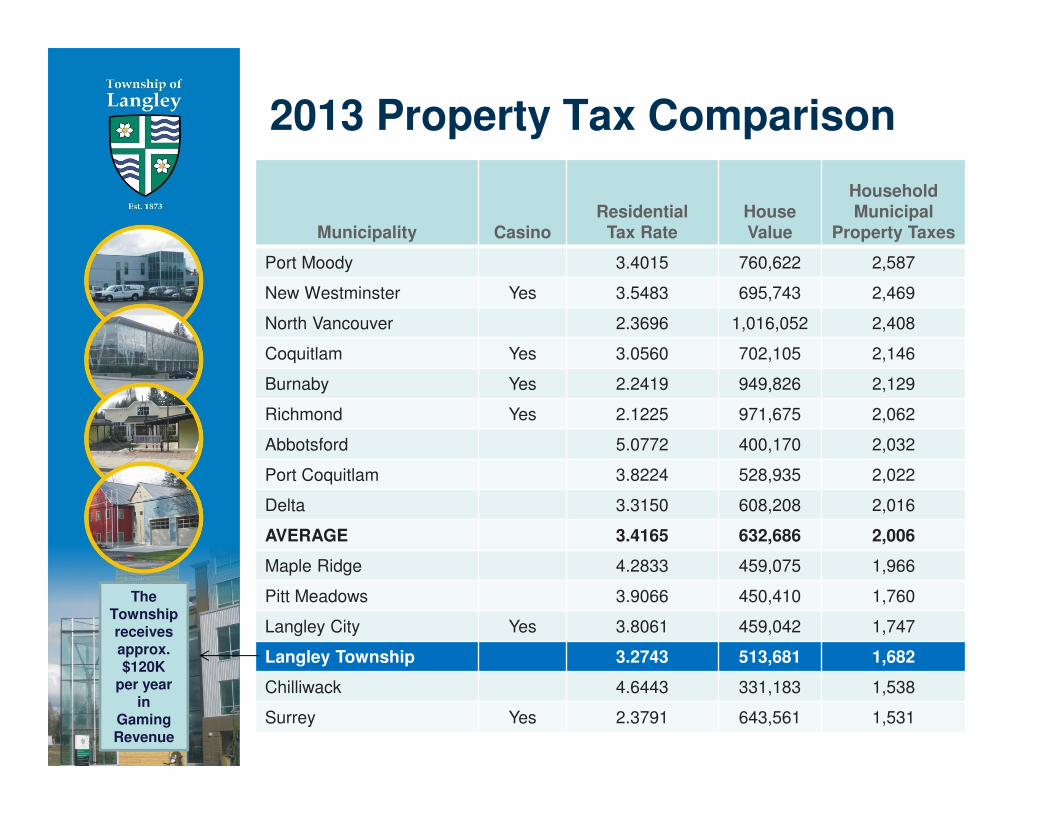
2013 Property Tax Comparison
14
Municipality CasinoResidential
Tax RateHouse Value
Household Municipal
Property Taxes
Port Moody 3.4015 760,622 2,587
New Westminster Yes 3.5483 695,743 2,469
North Vancouver 2.3696 1,016,052 2,408
Coquitlam Yes 3.0560 702,105 2,146
Burnaby Yes 2.2419 949,826 2,129
Richmond Yes 2.1225 971,675 2,062
Abbotsford 5.0772 400,170 2,032
Port Coquitlam 3.8224 528,935 2,022
Delta 3.3150 608,208 2,016
AVERAGE 3.4165 632,686 2,006
Maple Ridge 4.2833 459,075 1,966
Pitt Meadows 3.9066 450,410 1,760
Langley City Yes 3.8061 459,042 1,747
Langley Township 3.2743 513,681 1,682
Chilliwack 4.6443 331,183 1,538
Surrey Yes 2.3791 643,561 1,531
The Township receives approx. $120K
per year in
Gaming Revenue
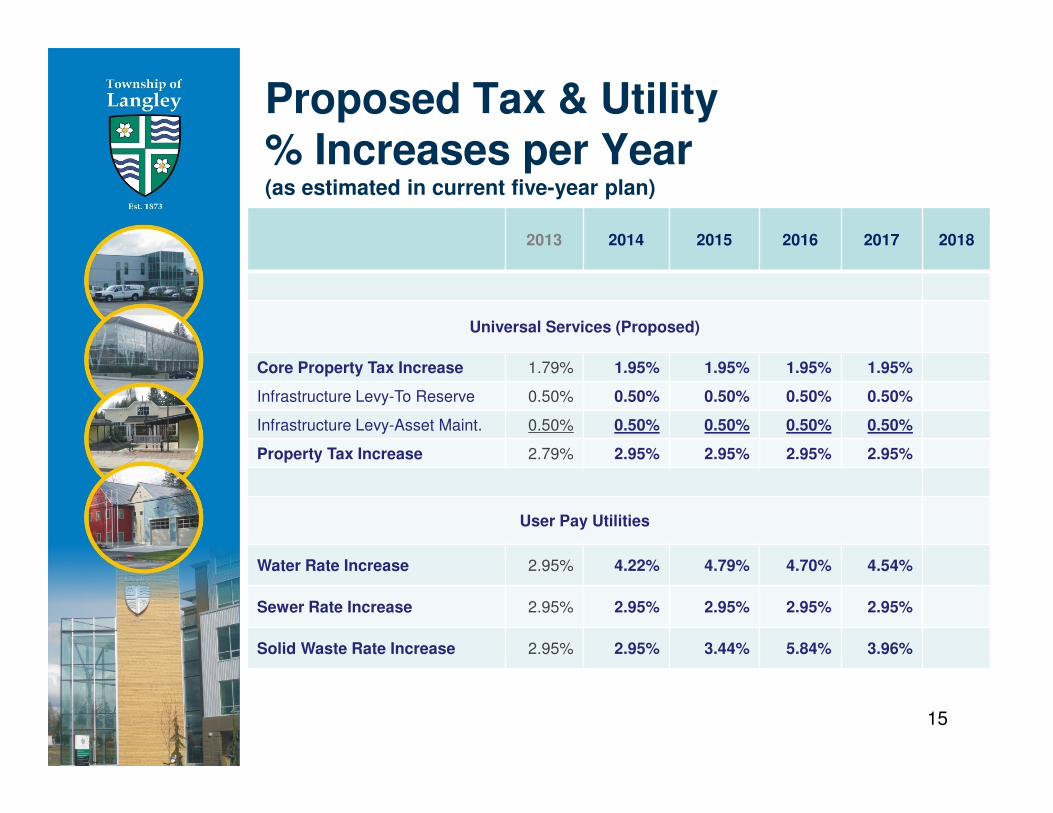
Proposed Tax & Utility % Increases per Year (as estimated in current five-year plan)
2013 2014 2015 2016 2017 2018
Universal Services (Proposed)
Core Property Tax Increase 1.79% 1.95% 1.95% 1.95% 1.95%
Infrastructure Levy-To Reserve 0.50% 0.50% 0.50% 0.50% 0.50%
Infrastructure Levy-Asset Maint. 0.50% 0.50% 0.50% 0.50% 0.50%
Property Tax Increase 2.79% 2.95% 2.95% 2.95% 2.95%
User Pay Utilities
Water Rate Increase 2.95% 4.22% 4.79% 4.70% 4.54%
Sewer Rate Increase 2.95% 2.95% 2.95% 2.95% 2.95%
Solid Waste Rate Increase 2.95% 2.95% 3.44% 5.84% 3.96%
15
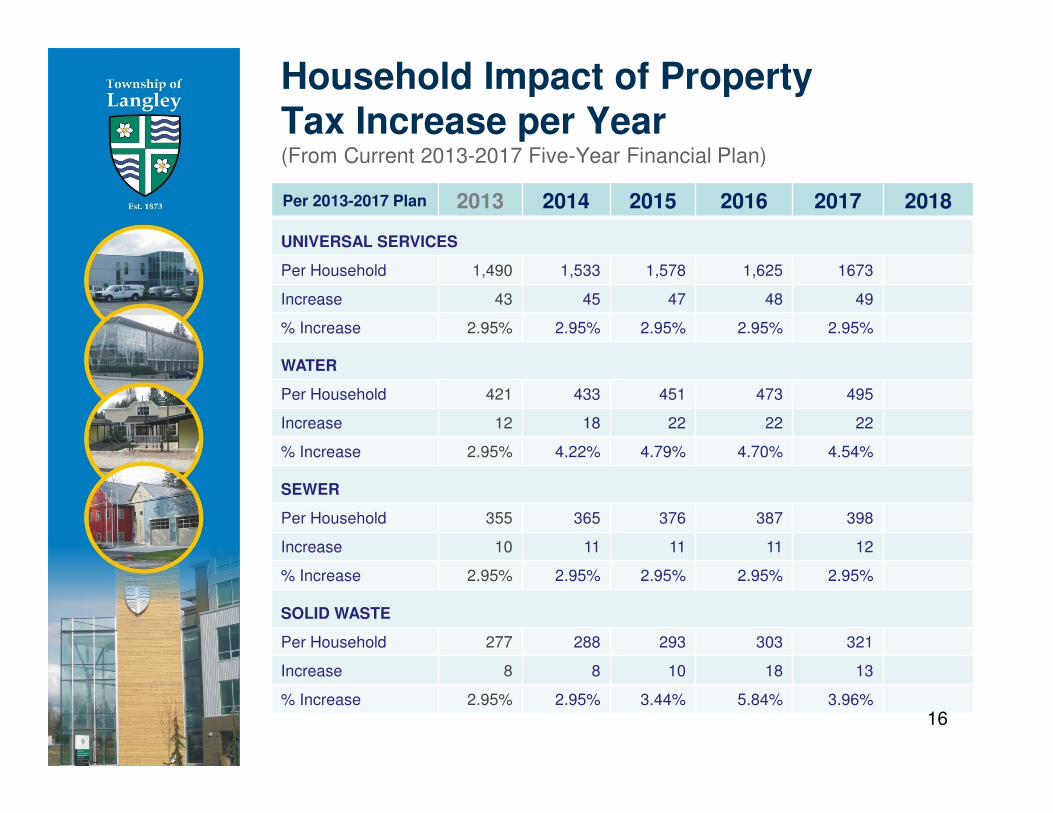
Household Impact of Property Tax Increase per Year(From Current 2013-2017 Five-Year Financial Plan)
Per 2013-2017 Plan 2013 2014 2015 2016 2017 2018
UNIVERSAL SERVICES
Per Household 1,490 1,533 1,578 1,625 1673
Increase 43 45 47 48 49
% Increase 2.95% 2.95% 2.95% 2.95% 2.95%
WATER
Per Household 421 433 451 473 495
Increase 12 18 22 22 22
% Increase 2.95% 4.22% 4.79% 4.70% 4.54%
SEWER
Per Household 355 365 376 387 398
Increase 10 11 11 11 12
% Increase 2.95% 2.95% 2.95% 2.95% 2.95%
SOLID WASTE
Per Household 277 288 293 303 321
Increase 8 8 10 18 13
% Increase 2.95% 2.95% 3.44% 5.84% 3.96%
16
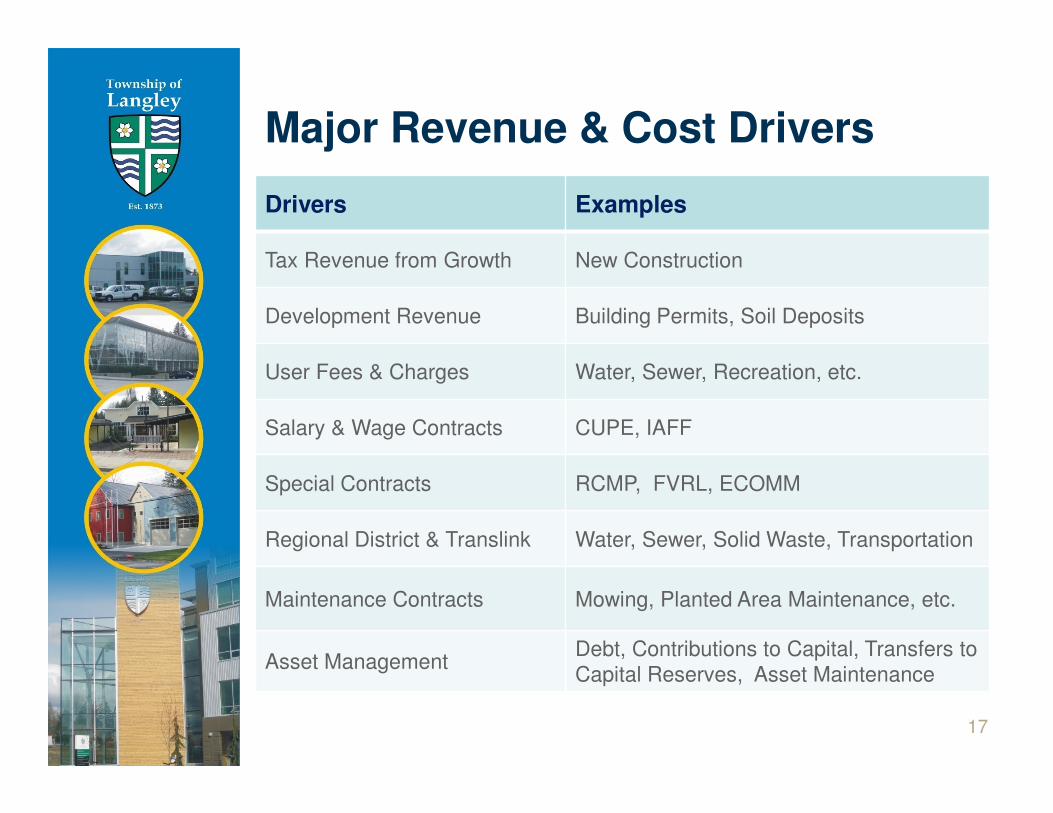
Major Revenue & Cost Drivers
17
Drivers Examples
Tax Revenue from Growth New Construction
Development Revenue Building Permits, Soil Deposits
User Fees & Charges Water, Sewer, Recreation, etc.
Salary & Wage Contracts CUPE, IAFF
Special Contracts RCMP, FVRL, ECOMM
Regional District & Translink Water, Sewer, Solid Waste, Transportation
Maintenance Contracts Mowing, Planted Area Maintenance, etc.
Asset ManagementDebt, Contributions to Capital, Transfers to Capital Reserves, Asset Maintenance
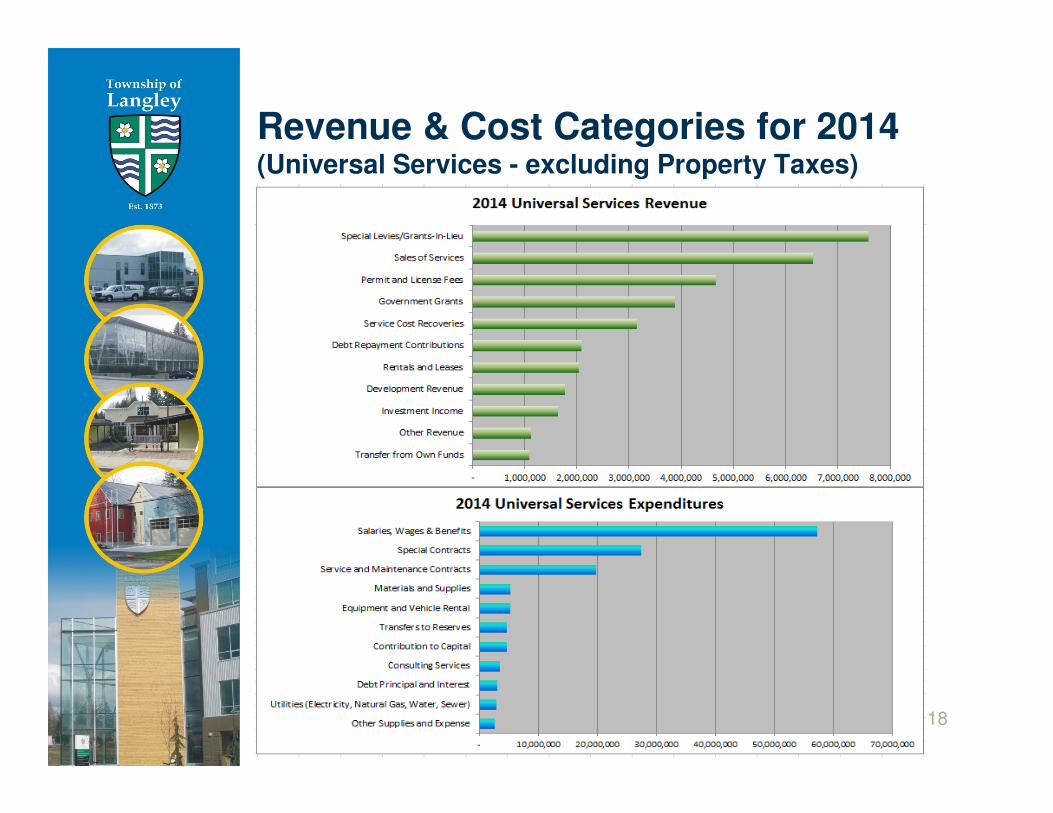
Revenue & Cost Categories for 2014(Universal Services - excluding Property Taxes)
18
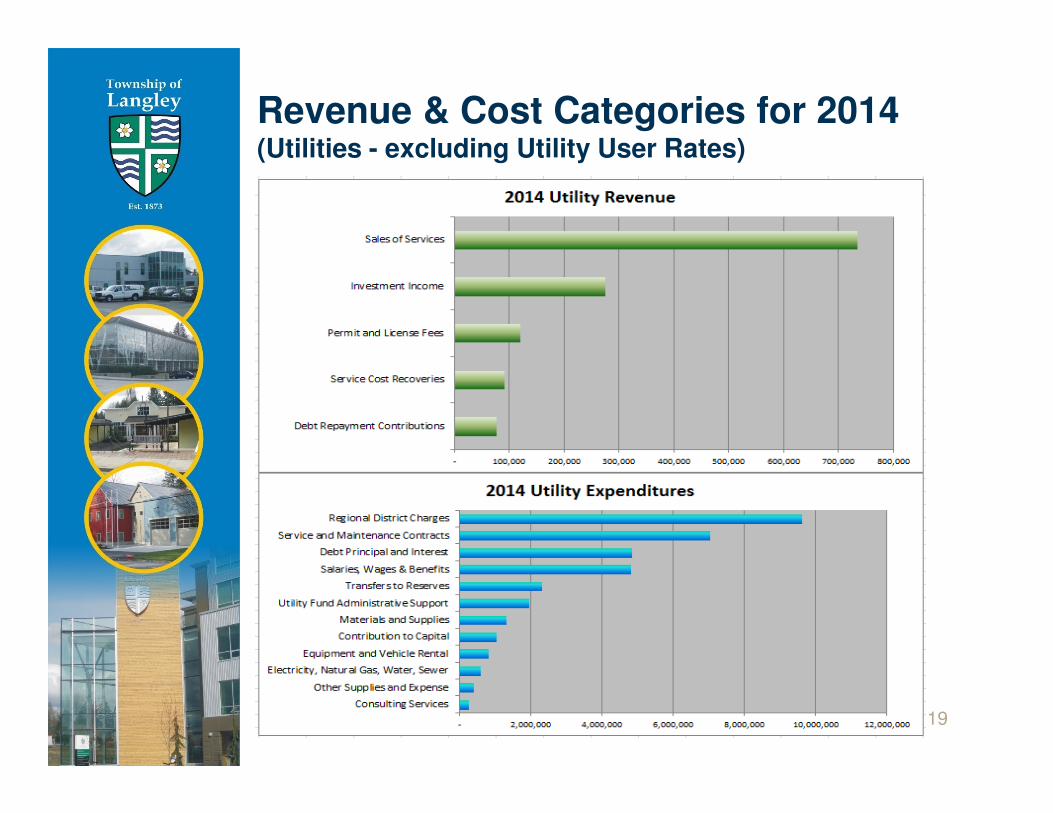
Revenue & Cost Categories for 2014(Utilities - excluding Utility User Rates)
19
2014 Budget Guidelines, Issues & Challenges…
20
2014 Budget Guidelines
In order to achieve a sustainable tax increase for
2014 and beyond, the following preparation
guidelines have been emphasized:
� Add known contract increases;
� Review 2013 operating savings and identify reductions
that can be made permanent;
� Evaluate potential for new revenue opportunities;
� Identify operating impact of new capital
(development capital contributed and municipal capital);
� Minimal opportunity to add service enhancements unless
supported by a compelling or cost neutral business case;
� Focus on service maintenance over service enhancement.21
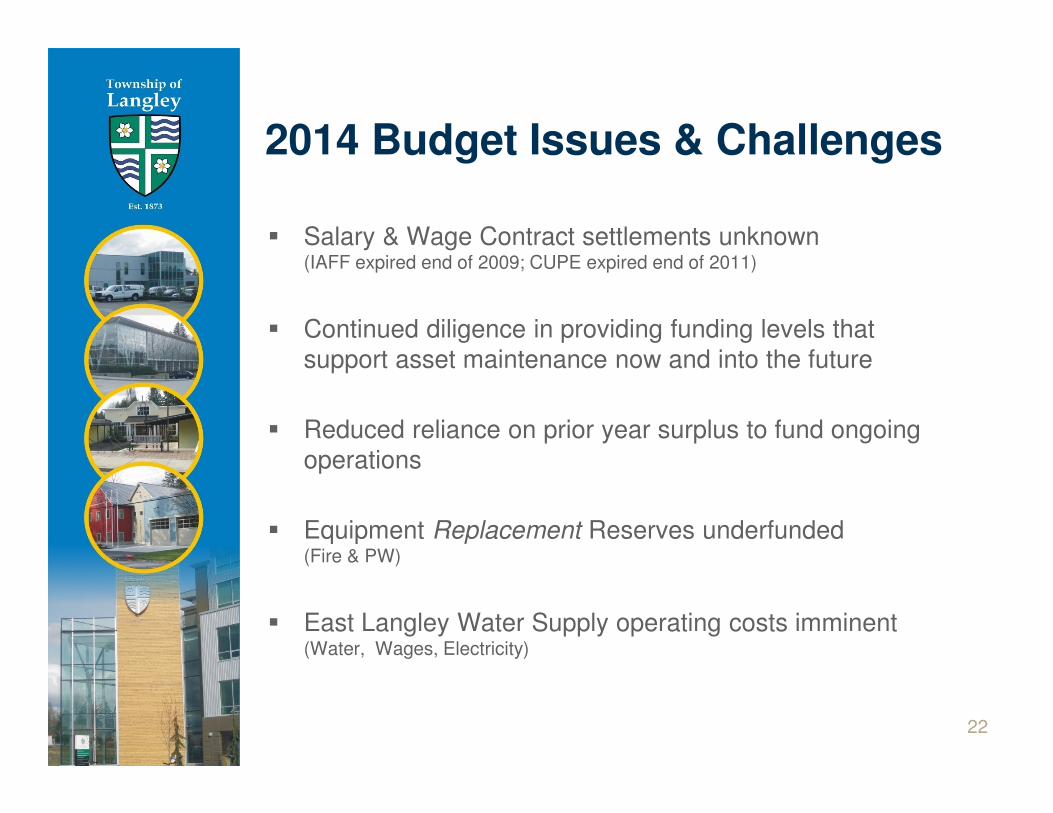
2014 Budget Issues & Challenges
� Salary & Wage Contract settlements unknown (IAFF expired end of 2009; CUPE expired end of 2011)
� Continued diligence in providing funding levels that support asset maintenance now and into the future
� Reduced reliance on prior year surplus to fund ongoing operations
� Equipment Replacement Reserves underfunded (Fire & PW)
� East Langley Water Supply operating costs imminent (Water, Wages, Electricity)
22
Items Referred to Budget Process…
23
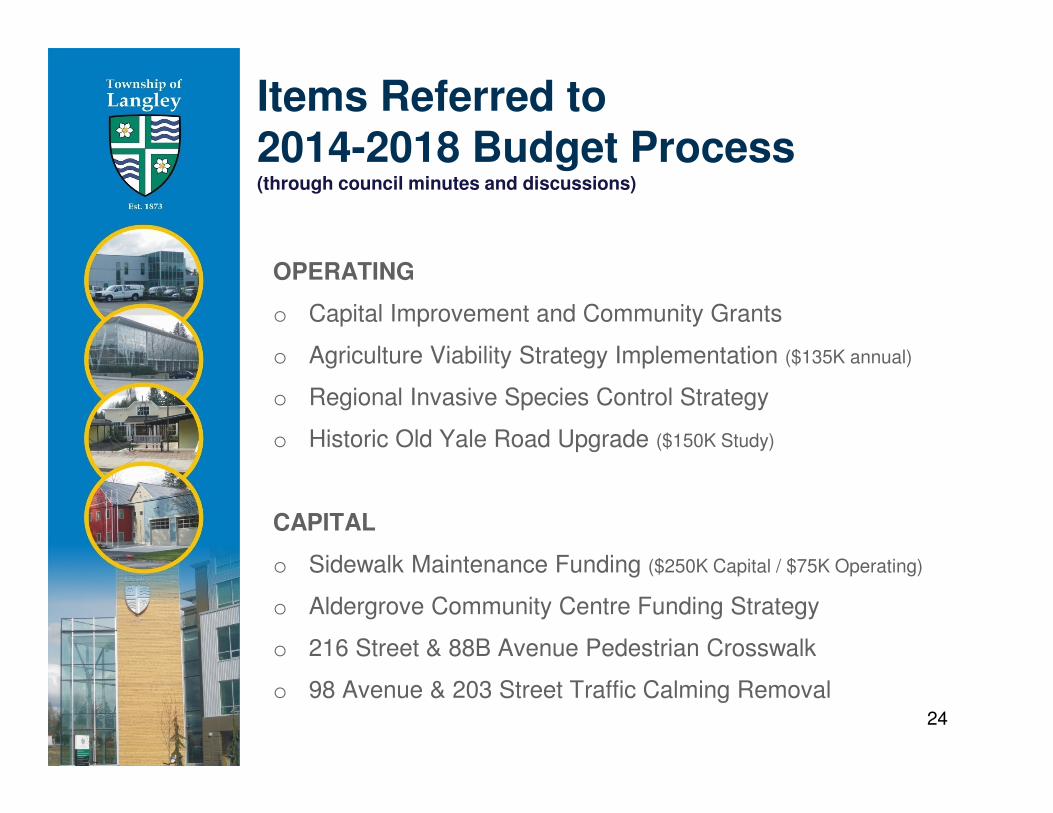
Items Referred to 2014-2018 Budget Process(through council minutes and discussions)
OPERATING
o Capital Improvement and Community Grants
o Agriculture Viability Strategy Implementation ($135K annual)
o Regional Invasive Species Control Strategy
o Historic Old Yale Road Upgrade ($150K Study)
CAPITAL
o Sidewalk Maintenance Funding ($250K Capital / $75K Operating)
o Aldergrove Community Centre Funding Strategy
o 216 Street & 88B Avenue Pedestrian Crosswalk
o 98 Avenue & 203 Street Traffic Calming Removal24

2014 Enhancements from 2013-2017 Budget…
25
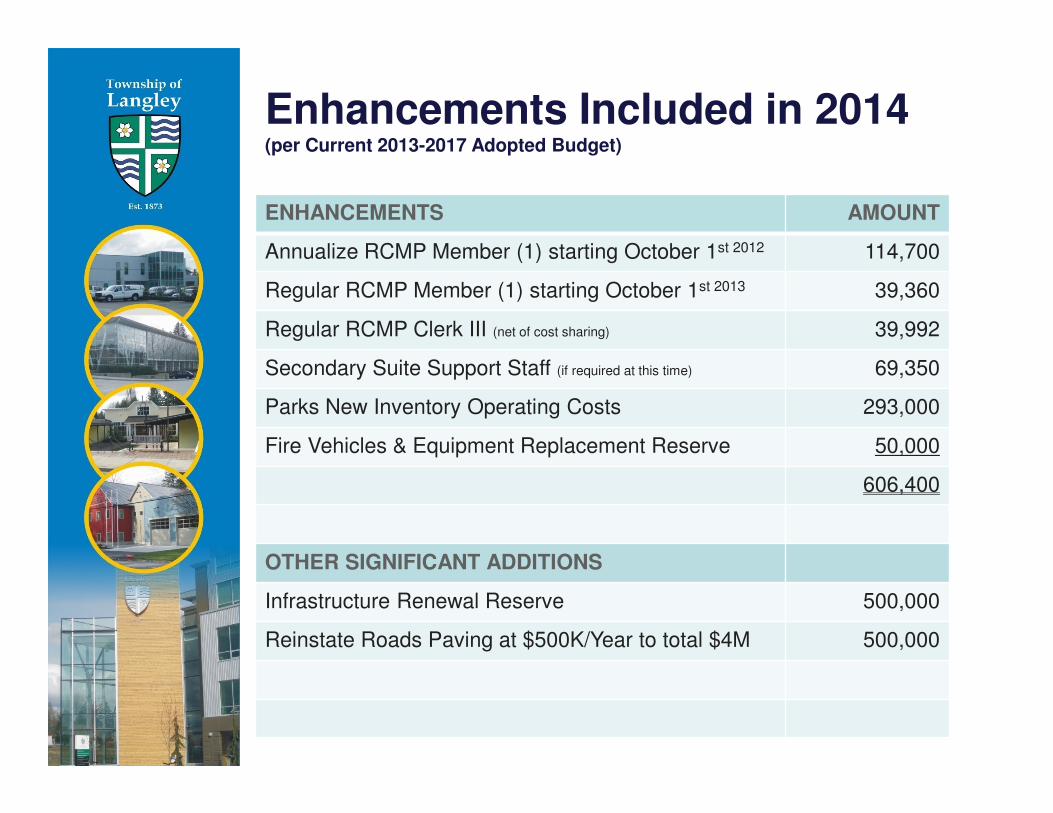
Enhancements Included in 2014(per Current 2013-2017 Adopted Budget)
26
ENHANCEMENTS AMOUNT
Annualize RCMP Member (1) starting October 1st 2012 114,700
Regular RCMP Member (1) starting October 1st 2013 39,360
Regular RCMP Clerk III (net of cost sharing) 39,992
Secondary Suite Support Staff (if required at this time) 69,350
Parks New Inventory Operating Costs 293,000
Fire Vehicles & Equipment Replacement Reserve 50,000
606,400
OTHER SIGNIFICANT ADDITIONS
Infrastructure Renewal Reserve 500,000
Reinstate Roads Paving at $500K/Year to total $4M 500,000
Budget Simulator / Service Catalogue…
27
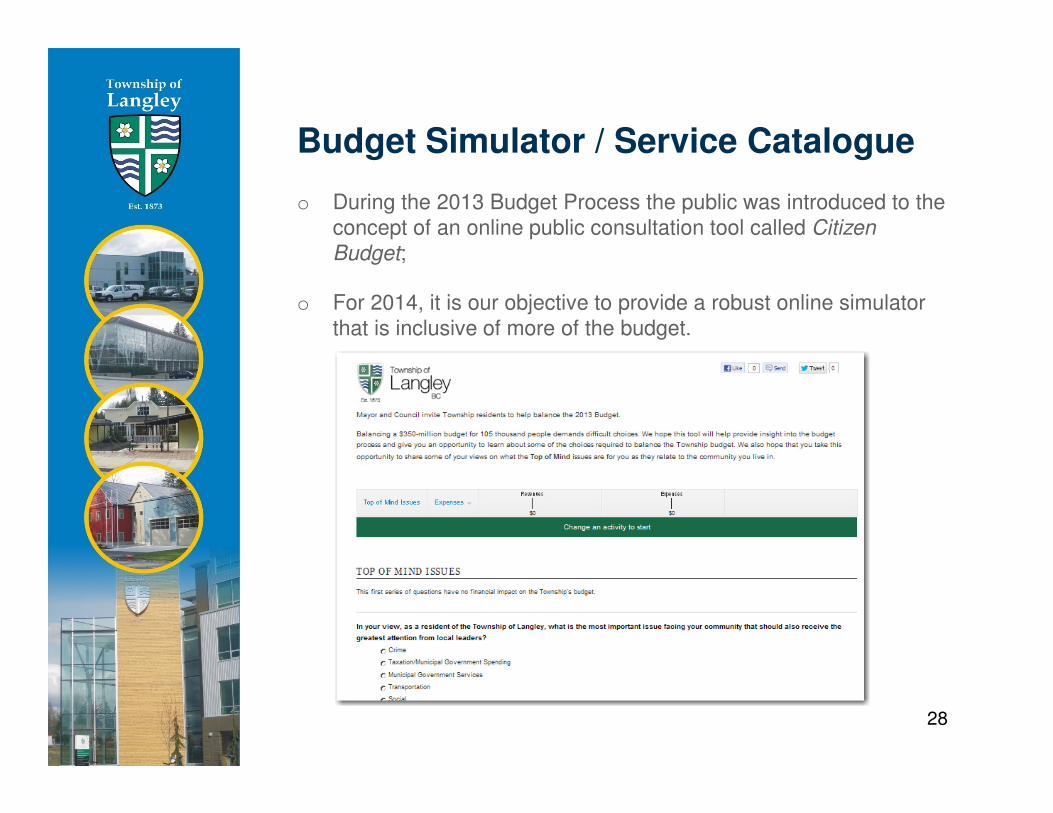
Budget Simulator / Service Catalogue
o During the 2013 Budget Process the public was introduced to the concept of an online public consultation tool called Citizen
Budget;
o For 2014, it is our objective to provide a robust online simulator that is inclusive of more of the budget.
28
Next Steps…
29
Next Steps…
30
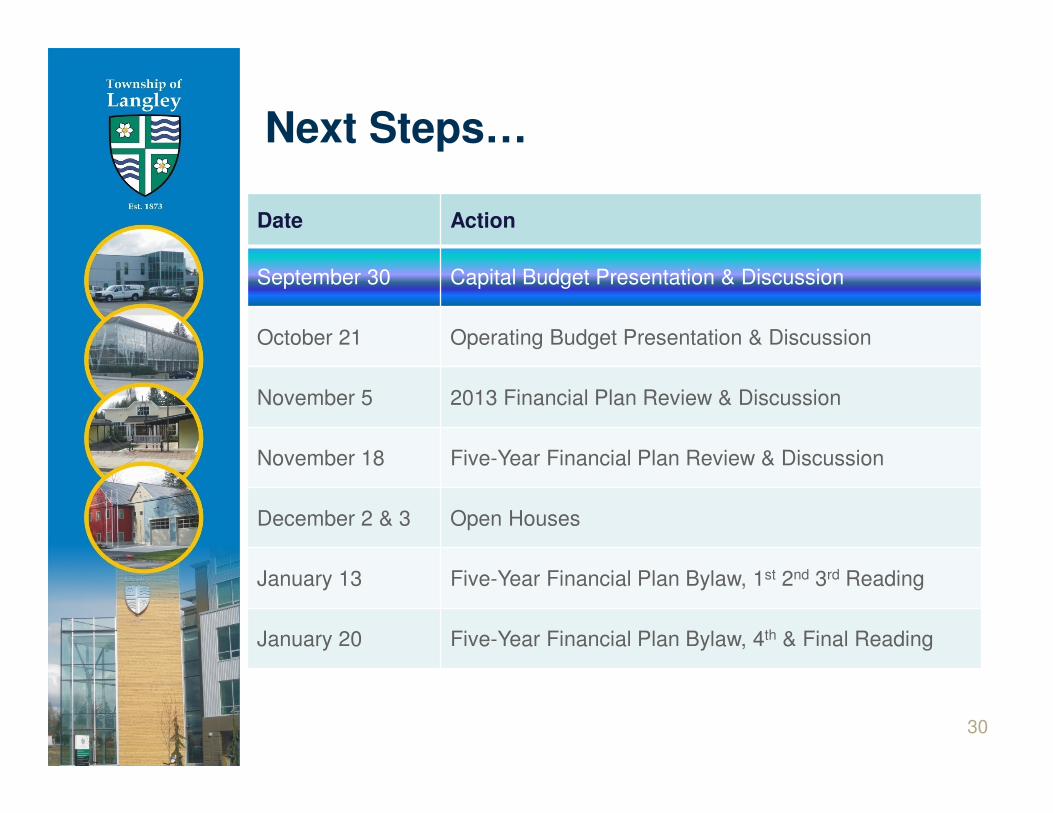
Date Action
September 30 Capital Budget Presentation & Discussion
October 21 Operating Budget Presentation & Discussion
November 5 2013 Financial Plan Review & Discussion
November 18 Five-Year Financial Plan Review & Discussion
December 2 & 3 Open Houses
January 13 Five-Year Financial Plan Bylaw, 1st 2nd 3rd Reading
January 20 Five-Year Financial Plan Bylaw, 4th & Final Reading