Embed Size (px)
Citation preview

Cancer Cell, Volume 26
Supplemental Information
Postsurgical Adjuvant Tumor Therapy
by Combining Anti-Angiopoietin-2 and Metronomic
Chemotherapy Limits Metastatic Growth
Kshitij Srivastava, Junhao Hu, Claudia Korn, Soniya Savant, Martin Teichert, Stephanie S. Kapel, Manfred Jugold, Eva Besemfelder, Markus Thomas, Manolis Pasparakis, and Hellmut G. Augustin

Pre-surgery
0
5
10
15M
icro
-met
s co
unts
IgG
Ctr
Ang
2 A
b
***IgG Ctr Ang2 Ab
A
2 mm
B
Dor
sal
Vent
ral
Post-surgery
Figure S1, related to Figure 1 (A) Pre and post-surgery bioluminescence images of mice bearing 4T1-luciferase tagged orthotopic mammary tumors. Post-surgery bioluminescence imaging confirmed the absence of detectable metastatic progression prior to primary tumor resection and absence of residual primary tumor after mastectomy. Mice meeting both criteria were randomized into treatment groups (B) Representative low magnification images of HE stained lung sections from IgG and anti-Ang2 antibody treated mice bearing lung metastases originating from orthotopic 4T1 breast cancer. Black arrows mark macro-metastasis and arrowheads mark micro-metastatic lesions (magnification shown in the insets). (C) Quantitation of frequency of micro-metastatic lesions in lungs (n=5; values are mean±SD; ***p≤0.001; the experiment was reproduced three times with similar results. The figure shows representa-tive images from one of the experiment.
C
1
Pre-su
rgery
Post-s
urgery
0
500
1000
1500
2000
Ser
um V
EG
F co
ncen
tratio
n (p
g/m
l) ***
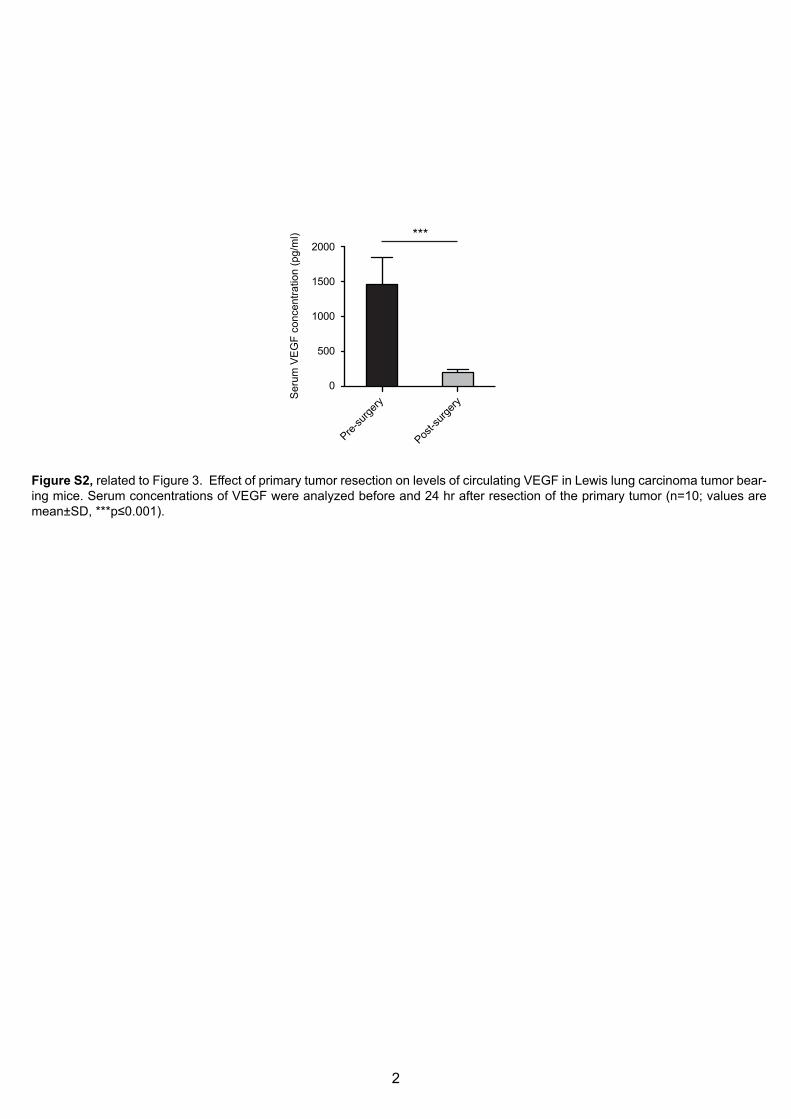
Figure S2, related to Figure 3. Effect of primary tumor resection on levels of circulating VEGF in Lewis lung carcinoma tumor bear-ing mice. Serum concentrations of VEGF were analyzed before and 24 hr after resection of the primary tumor (n=10; values are mean±SD, ***p≤0.001).
2

Paclita
xel
Gemcit
abine
0.0
0.5
1.0
1.5
2.0 **
Ly6
C-h
i cel
ls
(% o
f tot
al c
ells
in lu
ng m
ets)
VEGF Ab Ang2 AbIgG Ctr
100 µm
HIF
1α
100 µm
H&
E
C
D VEGF Ab Ang2 AbIgG Ctr
Figure S3, related to Figure 4. (A-B) Comparative analysis of effect of metronomic Gemcitabine and metronomic Paclitaxel on the recruitment of myeloid derived CD11bGr1 and Cd11bGr1Ly6Chi cells (n=5, values are mean±SD, **p≤0.01). The experiment was performed twice with similar results. The data from one representative experiment are shown in the figure. (C-D) Representative immunohistochemical images of HE and HIF1-alpha stained lung sections. Samples from different treatment groups (IgG, anti-Ang2 antibody and anti-VEGF antibody) were stained to visualize hypoxic areas in lung metastases originating from Lewis lung carcinoma (scale bar: 100µm).
Paclita
xel
Gemcit
abine
**
CD
11b+
Gr1
+ ce
lls
(% o
f tot
al c
ells
in lu
ng m
ets)
0
10
20
30
40
A B
3

IgG
Ang2 A
b0.0
0.5
1.0
1.5
2.0
Tie2
+ CC
R2- fr
actio
nof
mac
roph
ages
(%)
95.8%
0 200 400 600 800 1KFSC-A
0
200
400
600
800
1K
SSC-
A
94.6%
0 200 400 600 800 1KSSC-W
0
200
400
600
800
1K
SSC-
H
3.05%
0 200 400 600 800 1KFSC-A
100
101
102
103
104
CD45
2.51%
100
101
102
103
104
F4/80
100
101
102
103
104
CD11
b
3.87% 1.37%
2.05%92.7%
100
101
102
103
104
Tie2
100
101
102
103
104
CCR2
50.1%
0 200 400 600 800 1KFSC-A
0
200
400
600
800
1K
SSC-
A
43.1% 0.36%
0.152%56.4%
100
101
102
103
104
Tie2
100
101
102
103
104
CCR2
11.7%
100
101
102
103
104
F4/80
100
101
102
103
104
CD11
b
83.5%
0 200 400 600 800 1KSSC-W
0
200
400
600
800
1K
SSC-
H
8.79%
0 200 400 600 800 1KFSC-A
100
101
102
103
104
CD45
IgG
Ang2 Ab
A B
C
0
100
200
300
400
Ser
um C
CL2
(pg/
ml)
IgG C
tr
Ang2 A
b
***
Grou
pIg
GAn
tiAng
2Fo
ldp-
Sign
ifi-
12
31
23
chan
geva
lue
canc
e
TREM
-165
44.57
822
611.4
8511
404.6
175
1966
.0515
1002
.9995
643.8
9711
.230.0
307
*
CXCL
1022
86.30
537
00.78
898
23.77
414
89.08
4589
1.19713
8.989
56.2
80.0
660
ns
TIMP
-127
433.6
305
5333
2.905
5315
0.501
1722
9.100
525
28.08
241
80.09
555.5
90.0
100
*
CCL2
4037
3.363
550
327.8
425
4093
3.69
2365
9.449
3848
.074
3992
.4015
4.18
0.005
2**
CXCL
154
76.89
1515
521.7
515
6683
.9765
2723
.9035
2193
.1425
3213
.143
3.40
0.054
9ns
CCL1
1710
.018
496.6
93769.4
99457.3
26728.5
225
-28.0
375
2.57
0.115
3ns
IL-1
b36
58.70
738
69.76
5515
87.61
912
94.10
314
31.60
3595
7.791
2.47
0.035
5*
IL-1
769
48.28
124
7.029
527
41.09
1521
87.99
220
14.74
3552
8.897
2.10
0.219
9ns
CCL1
712
090.9
925
4257
.381
7202
.4025
6394
.398
3348
.7555
2123
.4055
1.98
0.105
2ns
CXCL
212
29.96
910
78.70
5589
2.96110
22.9911
71.27
0529
6.887
1.29
0.228
0ns
Il-6
1200
.573
23.04
25798.8
575
281.3
42717.8
02632.7
735
1.24
0.371
5ns
GM-C
SF27
720.3
935
1689
4.797
520
898.5
1624
911.6
1612
206.0
495
1839
5.521
1.18
0.264
5ns
CXCL
913
492.8
125
6828
.827
3415
7.293
1992
0.065
513
986.5
105
1922
1.71
1.03
0.480
0ns
BLC
9100
.224
3675
.001
8174
.123
1206
4.205
3376
.4645
5077
.079
1.02
0.482
8ns
Cal3
5639
1.914
554
919.8
0256
426.0
1955
190.9
915
5563
7.317
5497
9.213
51.01
0.147
0ns
Cal1
5642
8.529
554
779.0
1456
566.5
4855
733.0
4355
798.0
5855
340.2
9251.0
10.3
189
ns
Cal2
5621
1.933
5601
4.161
556
311.3
175
5645
3.274
556
720.3
4256
205.6
731.0
00.0
894
ns
sICAM
-155
969.8
4755
590.1
3155
842.6
385
5604
8.613
556
414.0
805
5599
1.181
0.99
0.056
5ns
CCL3
1941
.0945
858.7
085
4197
.5065
2704
.9725
2037
.5025
2489
.703
0.97
0.470
8ns
C5/C
5a42
901.1
9144
271.5
505
4463
6.647
553
213.3
7444
237.2
8344
674.7
190.9
30.1
556
ns
CXCL
1173
0.64211
7.62689
7.22382
8.41610
03.95
926
6.272
50.8
30.3
678
ns
CCL1
272
44.23
3545
39.87
935
19.49
1559
25.61
7584
51.06
2542
76.58
10.8
20.2
674
ns
TNFa
3108
3.552
522
599.3
629
385.5
0933
777.9
838
208.7
6440
058.4
5750.7
40.0
195
*
IL-4
1343
.5815
69.21
551047
.4925
1452
.544
1444
.9225
524.4
495
0.72
0.275
6ns
IL-1
a28
435.922
166.9
875
8046
.703
2733
3.458
2162
7.957
3274
0.32
0.72
0.161
8ns
IL-2
716
967.3
435
2145
.5905
59.79
78859
.938
6041
.9965
1197
6.633
50.71
0.334
9ns
CCL1
156
67.41
9517
73.2424
24.82
457
72.5849
93.532
36.44
60.7
00.1
930
ns
IL-3
926.4
46435.6
91708.3
691479
.4705
1174
.391
690.2
020.6
20.0
956
ns
IL-1
ra15
863.3
633
889.8
615
9831
.068
4168
4.397
2528
0.547
532
689.9
4850.6
00.0
986
ns
M-CS
F46
52.81
5531
93.90
337
48.07
541
02.86
6520
31.50
614
459.5
10.5
60.2
406
ns
IL-1
014
97.64
9511
6.14191
4.94516
49.92
720
17.09
590
0.941
50.5
50.1
298
ns
IL-2
4162
.7305
2830
.7035
1611
.4705
7132
.1565
4073
.776
5129
.9055
0.53
0.045
3*
IFN-
gam
ma
1719
9.469
7784
.4465
7553
.429
1817
2.583
518
559.1
1934
306.4
6250.4
60.0
535
ns
G-CS
F31
1.19275
.861532
7.774
511
49.66
7552
8.806
538
.9595
0.42
0.185
2ns
IL-1
2 p70
950.4
41278
.262
945.1
295
2294
.222
2492
.109
3060
.204
0.40
0.001
8**
IL-2
358
38.52
3534
41.60
585
7.21770
59.91
8510
354.2
5293
04.41
40.3
80.0
167
*
IL-1
615
144.1
375
1965
6.642
527
63.65
9550
099.4
1839
995.3
685
4690
0.523
50.27
0.002
4**
CCL4
4704
.722
5297
.558
4247
.419
1982
0.674
516
549.2
0222
862.4
9650.2
40.0
006
***
CCL5
1577
2.665
543
91.80
3-1
61.64
5536
291.4
5531
525.7
855
2161
1.755
0.22
0.011
3*
IL-1
387
13.41
635
84.26
0518
17.30
9520
304.7
345
2479
2.158
2677
8.595
50.20
0.001
2**
IL-7
1804
.077
577.9
975
1072
.758
2302
1.117
580
24.37
222
227.7
2850.0
60.0
136
*
CXCL
1234
8.969-1.12
15-175
.4105
1596
.2545
360.8
5872.7
140.0
60.0
428
*
IL-5
-33.8
76-141
.7045
216.0
365
630.1
175
486.8
075
-56.9
945
0.04
0.110
5ns
D
<1000 1000-2000 2000-4000 4000-8000 8000-16000 16000-32000 <32000
Signal intensity
0 50K 100K 150K 200K 250K
FSC-A
0
50K
100K
150K
200K
250K
SSC
-A
88.6
0 50K 100K 150K 200K 250K
SSC-W
0
50K
100K
150K
200K
250K
SSC
-H
96.3
0 50K 100K 150K 200K 250K
FSC-A
0102
103
104
105
CD45
2.72
TREM
1
0 102 103 104 105
CD11b
0102
103
104
105
42.1
E
0 50K 100K 150K 200K 250K
SSC-W
0
50K
100K
150K
200K
250K
SSC
-H
93.6
TREM
1
0 102 103 104 105CD31
0102
103
104
1050.0569 3.35e-3
24.275.80 50K 100K 150K 200K 250K
FSC-A
089.5
50K
100K
150K
200K
250K
SSC
-A
0 50K 100K 150K 200K 250K
FSC-A
0102
103
104
5
CD45
-Pdp
n-Ly
ve-
7.13
10
4

Figure S4, related to Figure 5. (A-B) FACS analysis of CCR-negative Tie-2-positive macrophages in the 4T1 model. (A) Repre-sentative FACS plots from flow cytometric analyses of lung metastases of mice treated in the adjuvant settings with IgG or anti-Ang2 antibody after resection of orthotopic mammary primary tumor (4T1) for the identification and quantification of different macrophage subsets recruited to the metastatic niche. (B) Quantitation of CCR2-negative Tie2-positive macrophages as fraction of total macrophages in lung metastases of mice treated in the adjuvant setting with IgG or anti-Ang2 antibody after resection of orthotopic mammary primary tumor (4T1) (n=5 mice). The experiment was performed twice with similar results. The data from one representative experiment are shown in the figure. (C-D) Evaluation of the effect of Ang2 neutralization on local and systemic concentration of CCL2. (C) Effect of treatment in adjuvant setting with IgG or Ang2 Ab on serum protein levels of CCL2 as analysed by ELISA (n=4 mice) (D) Heatmap showing comparative fold change of cytokines in protein lysates from lung metasta-ses following IgG or Ang2 Ab treatment of mice (LLC tumor model) as analysed by Mouse Cytokine Antibody Array. CCL2 has been highlighted in red font. Quantification was based on signal intensity measured on Gray levels using FIJI. (E) FACS analysis of TREM-1 presentation in stromal compartment of lung metastases. (E-top panel) Representative FACS plots from flow cytomet-ric analyses of lung metastases three weeks after resection of sub-cutaneous Lewis lung carcinoma tumor for identification of TREM1 presentation on myeloid cells recruited to metastatic niche. (E-bottom panel) Representative FACS plots from flow cytometric analyses of lung metastases three weeks after resection of sub-cutaneous Lewis lung carcinoma tumor for identifica-tion of TREM1 presentation on endothelial cells in metastatic niche. (F) Evaluation of specificity and efficiency of Mx1Cre mediated CCR2 depletion. (F-Top panel) Representative plot of FACS analysis of CCR2 depletion in myeloid cells from spleen of PolyIC injected Mx1Cre+ or Mx1Cre- mice. CD45+ cells were gated for CD11b, F4/80 and CCR2. (F-middle panel) Representative plot of FACS analysis of CCR2 depletion in myeloid cells from lungs of PolyIC injected Mx1Cre+ or Mx1Cre- mice. CD45+ cells were gated for Cd11b, F4/80 and CCR2. (F-bottom panel) Representative FACS plot analysis of CCR2 depletion in endothelial cells from lungs of Poly IC injected Mx1Cre+ or Mx1Cre- mice. CD45- cells were gated for CD31 and CCR2. Mx1Cre induction by polyIC specifically depleted CCR2 expression in myeloid cells.Values are mean±SD; ***p≤0.001, ns=non-significant.
0 50K 100K 150K 200K 250KFSC-A
0
102
103
104
1051.71
0 50K 100K 150K 200K 250KFSC-A
0
102
103
104
105 14.3
0 50K 100K 150K 200K 250KFSC-A
0
102
103
104
1052.22
0 50K 100K 150K 200K 250KFSC-A
0
102
103
104
105 9.59
0 102 103 104 105
0
102
103
104
105 4.1
0 50K 100K 150K 200K 250K
0
102
103
104
10566.3
0 102 103 104 105
0
102
103
104
105 2.91
0 50K 100K 150K 200K 250KFSC-A
0
102
103
104
10517.8
0 102 103 104 105
0
102
103
104
105 1.37
0 50K 100K 150K 200K 250K
0
102
103
104
105
47.8
0 102 103 104 105
0
102
103
104
105 1.86
0 50K 100K 150K 200K 250K
0
102
103
104
105
7.76
F4/80 FSC-A F4/80 FSC-A
CD
11b
CC
R2
CD
11b
CC
R2
CD
31
CC
R2
CD
31
CC
R2
Ccr2fl/fl::Mx1Cre- Ccr2fl/fl::Mx1Cre+
CD
11b
CC
R2
CD
11b
CC
R2
Lung
mac
roph
age
(gat
ed fo
r CD
45+)
Spl
een
mac
roph
age
(gat
ed fo
r CD
45+)
Lung
EC
(gat
ed fo
r CD
45-)
F
F4/80 FSC-A F4/80
5

p-IκBα (Ser32)
IκB
Actin
Ctr Ang2
Ang2 +
low TNFα
High TNFα
Low TNFα
A
H
unst
imul
ated
high
TN
Fαlo
w T
NFα
Ang
2A
ng2+
low
TN
Fα
50µm
PhalloidinDAPI p65
Nor
mal
ized
Vca
m-1
expr
essi
on
Contro
lIgG
Ang2 A
b0
2
4
6
8 **7
5
3
1
B
Figure S5, related to Figure 6. (A) qRT-PCR analysis of Vcam-1 expression in tissue lysates from lung metastases following IgG or anti-Ang2 antibody treatment. Mice were treated for 3 weeks post-resection of the primary tumor (Lewis lung carcinoma model). Whole lung lysates from mice sacrificed immediately post-resection of the primary tumor were included as control group to evaluate basal levels of expression (n=5 mice). The experiment was reproduced three times with similar results. The data from one representative experiment are shown in the figure. (B) Patient dataset (GSE3494) analyses to evaluate correlation of Ang2 expression with expression of adhesion molecules in context of cancer progression. (A) Correlation analysis between ANG2 and ICAM1 expression profiles in non-metastatic breast cancer samples (Grade 1) or advanced metastatic breast cancer samples (Grade 2&3) using the GSE3494 data set (n=67).(C) Representative Western blot analysis of ICAM-1 after stimulation of HUVEC with rhAng2 in the presence of a cell permeable STAT3 inhibitor peptide or inactive control peptide. Cells were pretreated with respective peptide for 1 hr before stimulation (n=3 replicates). (D) Quantification of ICAM1 protein expression after stimulation of HUVEC with rhAng2 in the presence of a STAT3 inhibitor peptide or inactive control peptide (n=3 replicates). (E) Representative Western blot analysis of ICAM-1 upon stimulation of HUVEC with rhAng2 and/or low concentration of rhTNFα compared to high rhTNFα (classical inducer of NF-kB signaling). (F) Quantification of ICAM1 protein expression after stimula-tion of HUVEC with rhAng2 and/or low concentrations of rhTNFα compared to high rhTNFα (n=3 replicates). (G) Cell lysates obtained from stimulated HUVEC were blotted to detect phospho-IkBα and total IkB-α. Prestarved HUVEC were stimulated by PBS (Ctrl), Ang2 (400ng/ml), low TNFα (1ng/ml) , high TNFα (10ng/ml) or a combination of Ang2 (400ng/ml) and low TNFα (1ng/ml) for 15 min prior to preparation of cell lysates. The experiment was reproduced three times with similar results. Data from one representative experiment are shown in the figure. (H) Representative images of prestarved HUVEC after stimulation with PBS (Ctrl), Ang2 (400ng/ml), low TNFα (1ng/ml) , high TNFα (10ng/ml) or a combination of Ang2 (400ng/ml) and low TNFα (1ng/ml) for 15 min to visualize nuclear translocation of p65 subunit (red). Phalloidin (green) was stained to visualize the cytoskeleton, whereas nuclei (blue) were stained with DAPI. The experiment was reproduce three times with similar results. Data from one representative experiment are shown in the figure. Values are mean±SD, *p≤0.05, **p≤0.01, ***p≤0.001, ns=non-significant.
G2+G3
4 5 6 7 8
4
6
8
10
Correlation coefficient (Spearman’s r)=0.2246p value (two-tailed)=0.0461
G1
4 5 6 7 8
4
6
8
10
Correlation coefficient (Spearman’s r)= -0.1236p value (two-tailed)=0.3192
Ang2Peptide
+- +- - C
tr
STA
T3-i
+
ICAM-1
Actin
D
E
0.00.51.01.52.0
Ang2Peptide
+- +- -
Ctr
STA
T3-i
+
**
ns
ICA
M-1
leve
l
ICAM-1
Actin
TNFα
Ang2
- -- + +- -
10 n
g
1 ng
1 ng
F
G
0.00.51.01.52.0
Ang2 - + +- -TNFα - -
10 n
g
1 ng
1 ng
ICA
M-1
leve
l *****
*** ns
***
Relative ANG2 expression
Rel
ativ
e IC
AM
-1ex
pres
sion
Relative ANG2 expression
Rel
ativ
e IC
AM
-1ex
pres
sion
Correlation analysis between ICAM-1 and ANG2 in breastcancer samples using the GSE3494 data set (n=67)
C
6

Movie S1, related to Figure 6. Movie footage of macrophages flowing over a HUVEC coated µ-Slide in a parallel flow chamber. The HUVEC coated chambers were treated with IgG for 12 hr and then subjected to continuous flow of macrophages at a rate of 30 µl/min over a period of 1 min.
Movie S2, related to Figure 6, Movie footage of macrophages flowing over a HUVEC coated µ-Slide in a parallel flow chamber. The HUVEC coated chambers were treated with Ang2 Ab for 12 hr and then subjected to continuous flow of macrophages at a rate of 30 µl/min over a period of 1 min.
Movie S3, related to Figure 6. Movie footage of microspheres flowing over a HUVEC coated µ-Slide in a parallel flow chamber. The HUVEC coated chambers were treated with IgG for 12 hr and then subjected to continuous flow of microspheres conjugated to either IgG antibodies at a rate of 30 µl/min over a period of 1 min.
Movie S4, related to Figure 6. Movie footage of microspheres flowing over a HUVEC coated µ-Slide in a parallel flow chamber. The HUVEC coated chambers were treated with Ang2 Ab for 12 hr and then subjected to continuous flow of microspheres conjugated to ICAM-1 antibodies at a rate of 30 µl/min over a period of 1 min.
7

58.4%
0 50K 100K 150K 200K 250K
FSC-A
0
50K
100K
150K
200K
250K
SSC
-A
88.5%
0 50K 100K 150K 200K 250K
SSC-W
0
50K
100K
150K
200K
250K
SSC
-H
11.9%
0 102
103
104
105
Gr1
010
2
103
104
105
CD
11b 89.0%
7.97%
0 102
103
104
105
Ly6G
010
2
103
104
105
Ly6C
74.9%
0 50K 100K 150K 200K 250K
FSC-A
0
50K
100K
150K
200K
250K
SSC
-A
92.7%
0 50K 100K 150K 200K 250K
SSC-W
0
50K
100K
150K
200K
250K
SSC
-H
4.85%
0 102
103
104
105
Gr1
010
2
103
104
105
CD
11b 95.9%
0.210%
0 102
103
104
105
Ly6G
010
2
103
104
105
Ly6C
Ang
2 A
b +
VE
GF
Ab
Ang
2 A
b +
VEG
F A
b +
Met
(GEM
)
Figure S6, related to Figure 7. Effect of different adjuvant therapeutic regimens on mobilization of CD133+VEFR2+Ter119- myeloid cells. Mice were treated for three weeks after mastectomy for removal of the primary tumor (4T1 orthotopic breast cancer). The treatment groups were as follows: IgG = control IgG group; MTD (PTX) = maximum tolerable dose Paclitaxel chemotherapy; Ang2 Ab = anti-Ang2 antibody treatment; LDMC (PTX) = Low dose metronomic chemotherapy; LDMC (PTX) + Ang2 Ab = combination of low-dose metronomic chemotherapy and anti-Ang2 antibody treatment (n=4 mice). The experiment was performed twice with similar results. Data from one representative experiment are shown in the figure. (B) Effect of antiangiogenic therapies or their combination with metronomic Gemcitabine on recruitment of immature myeloid cells to metastatic niche. Representative FACS plots from flow cytometric analyses of lung metastases of mice treated in the adjuvant setting with a combination of anti-VEGF antibody and anti-Ang2 antibody or anti-VEGF antibody, anti-Ang2 antibody and metronomic Gemcitabine for quantitation of recruited bone marrow derived cells (CD11b-positive Gr1-positive Ly6Chi). The mice were treated for three weeks after resection of syngenic Lewis lung carcinoma primary tumors (n=5 mice). The experiment was performed twice with similar results. Data from one representative experiment are shown in the figure. (C) Effect of Ang2 Ab treatment on the local concentrations of Bv8 (ELISA of lung metastatic foci) in postsurgically treated tumor bearing mice (n=5 mice). (D) Effect of Ang2 neutralization on Bv8 mediated angiogenesis and branch formation. Tube formation assays were performed using HCMEC (human cardiac microvascular endothelial cells) and Bv8 (500ng/ml), a major proan-giogenic cytokine from immature myeloid cells, was used as stimulus. Three increasing concentrations of IgG or Ang2 antibody were used to evaluate the effect on the average number of branches and the cumulative branch length after 6 h time point (n=5); values are mean±SD; *p≤0.05, ***p≤0.001, ns=non-significant). The experiment was reproduced three times with similar results. Data from one representative experiment are shown in the figure.
IgG
Ang2A
b0
100
200
300
400ns
Bv8
conc
entr
atio
n(p
g/m
l lun
g m
ets
lysa
tes)
IgG
Ang2 A
b
MTD (PTX)
LDMC (P
TX)
LDMC (P
TX)+ Ang
2 Ab
0
1000
2000
3000C
D13
3+V
EG
FR2+
Ter1
19-
mey
loid
cel
ls p
er 1
x107
** *
*
NS
A
B
C D
Aver
age
num
ber o
f br
anch
es p
er m
m2
0
5
10
15
20
IgGanti-Ang2
*
***
***
5 µg 10 µg 30 µg
8

Supplemental Experimental Procedures
Antibody reagents: The murine-chimeric antibody anti-Ang2 was generated as a derivate
of previously described human anti-Ang2 LC06 antibody (anti-murine/human Ang-2)
(Thomas et al., 2013). Murine-chimeric anti-VEGF antibody was generated based on the
human anti-VEGF B20-4.1 (anti-murine/human VEGF-A) (Liang et al., 2006). Both murine-
chimeric antibodies were generated by molecular fusion of human variable domains to
constant antibody domains of murine IgG2a.
Antibody genes were ordered as gene syntheses and cloned via unique restriction sites
using standard cloning procedures into separate expression vectors enabling secretory
expression in HEK cells growing in suspension. HEK293-F cells (Invitrogen) were
transfected according to the cell supplier’s instructions using Maxiprep (Qiagen)
preparations of the antibody vectors, Opti-MEM I medium (Invitrogen) and 293fectin
(Invitrogen) and the recombinant antibodies were then produced in serum-free FreeStyle
293 expression medium (Invitrogen) during 6 days.
For transient expression of murine-chimeric anti-Ang2 and anti-VEGF, transfected HEK cells
were cultured in stirred 10 l fermenters. Antibody containing cell culture supernatants were
harvested by centrifugation and sterile filtrated. Proteins were purified from supernatants
referring to standard protocols - Protein A, ion exchange and size exclusion chromatography
were applied. Purified antibodies were concentrated and diafiltrated by membrane-based
tangential flow filtration. The protein concentration was determined by measuring the OD at
280 nm, using a molar extinction coefficient calculated according to Pace et al (1995). Each
antibody was analytically characterized by SDS-PAGE, size-exclusion chromatography and
mass spectrometry. In addition, Surface Plasmon Resonance analysis was used to
demonstrate that target specificity and high affinity of anti-Ang2 and anti-VEGF parent
antibodies (Thomas et al., 2013; Liang et al., 2006) was maintained in the murine-chimeric
antibodies. Antibodies were stored in 20 mM histidine, 140 mM NaCl (pH 6.0) at −80 °C at a
concentration of 3 mg/ml. Endotoxin levels of both stock solutions was below 0.2 EU/ml.
Treatment regimens: Mice were treated intraperitoneally (i.p.) with the Ang2 Ab or control
IgG or VEGF Ab (10mg/kg) twice a week. For combination therapy, toxicity evaluation and
survival studies in 4T1 orthotopic breast cancer model, animals received Abraxane™
9
(Paclitaxel) for low-dose metronomic chemotherapy (6mg/kg, i.p, qd) or for maximum
tolerable dose (MTD) (30mg/kg, i.p., qdx5, 1 cycle) as previously described (Ng et al.,
2006). Mice within Lewis lung carcinoma model received either Abraxane™ at low-dose
metronomic chemotherapy (6mg/kg, i.p, qd) (Ng et al, 2006) or Gemcitabine (Sigma) at
metronomic dosing (1mg/kg, i.p. qd) or at MTD (150mg/kg, i.p, twice a week) (Tran Cao et
al., 2010). CCL2 neutralizing antibodies (R&D) or control IgG were administered at dosage
of 2mg/kg twice a week for accessing the role of CCL2 in adjuvant settings as described
before (Zhu et al., 2011). All treatments were initiated after primary tumor resection and
randomization into treatment groups. CCR2 flox/flox::Mx1 Cre positive or negative mice
(Willenborg et al., 2012) were treated with three injections of Poly IC (Invivogen, 250µg, i.p.)
for Cre induction after primary tumor resection at day 0, 2 and 4 as previously described
(Pajerowski et al., 2010).
Additional animal experiments
Matrigel plug assay: 1) To analyze the effect of Ang2 neutralization on recruitment of
CCR2+ macropahges: LLC (1x10⁶) cells were implanted in C57BL6 mice and the primary
tumor was removed after 2 weeks. Post-resection mice were treated with either IgG or Ang2
Ab. Serum was collected from mice 10 days post-resection of the primary tumor. Matrigel
(BD Bioscience, 354230) plugs containing 25% serum from either IgG or Ang2Ab treated
mice were implanted subcutaneously in the flanks of WT SCID mice. Another group to
evaluate the effect of addition of recombinant CCL2 to serum of Ang2 Ab treated mice was
also included in the Matrigel plug implanted animals. 2) To analyze the effect of Ang2
neutralization on Bv8 mediated angiogenesis. Matrigel was mixed at 4 °C with mouse
bFGF (R&D, 3139-FB-025/CF) dissolved in NSS at a final concentration equal to 1.0 µg/ml
or Bv8 (Peprotech, 100-46) dissolved in NSS at final concentration equal to 500ng/ml and
injected subcutaneously (0.5 ml/mouse) into the flank of 6–8 week-old SCID mice (Charles
River). Matrigel with NSS alone was used as negative control. Mice implanted with Bv8
containing Matrigel plus were treated with either IgG or Ang2 Ab. The plugs were collected
for further processing after 10 days of implantation.
Tail vein metastasis model: Tail vein metastasis experiments were performed in order to
study how Ang-2 affects expression of endothelial specific adhesion molecules, which may
10
enhance homing of metastases enhancing macrophages. LLC cells (1x10⁶) were injected i.v.
and anti-Ang-2 antibody or IgG was administered i.p 1 hr after tumor cell injection. Lungs
were collected after 24 hr for cryo-preservation until further processing.
Frequency of metastatic lesion quantification: Number of metastatic lesions in lung and
bones were quantified by bioluminescent imaging and histological analysis. Frequency of
lymph node metastases were quantified on basis of bioluminescent imaging and confirmed
by necropsy.
Ex vivo analytical assays
Histological analyses and immunohistochemical procedures: For bone histology,
femurs were harvested, fixed overnight in 2% paraformaldehyde at 4°C, and decalcified in
0.5 M EDTA (pH 7.4) for 14 days at 4°C prior to paraffin embedding and sectioning at 5 µm.
Sections were stained with hematoxylin and eosin (H&E). PFA-fixed (4%) ovaries and Zinc
fixed Lungs were paraffin-embedded, sectioned (7µm) and stained with H&E. Sections of
Zinc fixed lung and Matrigel plugs were immunostained with antibodies against CD31
(1:100, BD553370/557355), SMA (1:200, Sigma C6198), F4/80 (1:100, Invitrogen
MF48004), CCR2 (1:150, ThermoScientific PA1-27409), F4/80(1:100, AbD Serotec
MAK0497R), HIF1alpha (1:100, Abcam ab8366). The primary antibodies were detected by
fluorescent-conjugated secondary antibodies (1:500, Invitrogen A11006 or Invitrogen
A21085), biotinylated secondary antibody (1:200, VectorLab BA 4001) or HRP-conjugated
secondary antibody (1:250, DAKO K403). Biotinylated and HRP secondary antibodies were
detected using DAB substrate kits (Liquid DAB+ Substrate (Dako K3468) or DAB peroxidase
Substrate Kit (VectorLab,SK 4100). Imaging was done on an Olympus IX81 microscope.
Image analysis
Vasculature analyses in metastases: Images of stained samples against CD31, SMA and
DAPI were acquired with the Zeiss Cell Observer. Analysis of CD31-positive areas within
each DAPI-enriched region of interest was performed using the Fiji image processing
software package. Vessel size distribution was determined by filtering identified CD31+
vessels according to area in 4 categories (I: 0-100 µm2; II: 100-400 µm2; III: 400-1600 µm2;
IV: >1600 µm2). The resulting number was set to proportion to the total vessel number.
SMA+ pericyte coverage was determined by analyzing the colocalization of CD31+ and
11

SMA+ areas in double stained samples. By the process of Gaussian Blurring a sufficient
overlap was created and compared to the number of total CD31+ vessels.
Mean metastatic lung fraction: H&E stained images of lung sections were acquired with
Zeiss Cell Observer. Five FOV per section and 5 sections per sample were analyzed.
Metastatic area fraction was analyzed using Trainable Weka Segmentation plugin of Fiji
image processing software package and expressed as percentage of lung cellularity area.
Matrigel plugs: Images of stained samples against F4/80, CCR2 and DAPI were acquired
with Zeiss Cell Observer. Analysis of F4/80 and CCR2 dual positive cells within DAPI
enriched region was performed using the Fiji image processing software package. Images of
double stained samples against CD31 and using DAPI were acquired with the Zeiss Cell
Observer. Analysis of CD31-positive areas within each DAPI-enriched region of interest was
performed using the Fiji image processing package.
Flow cytometry: For FACS analysis, lung metastases were harvested, briefly washed with
cold PBS and subsequently minced on ice. The tissue was digested with 3mg/ml
Collagenase A (Sigma) in DMEM at 37° for 30 min. A single cell suspension was prepared
by passing the cells through a syringe with an 18 G cannula and filtering them through a
70µm cell strainer. For macrophage identification, cells were stained with the following
antibodies: rat anti-mouse CD45-FITC (1:400, BD Pharmingen 30-F11), rat anti-mouse
CD11b-PE-Cy7 (M1/70) (1:000, eBioscience 25-0112-82), Tie2-PE (TEK4), (1:200,
eBioscience 12-5987-81); CCR2-APC (1:50, R&D systems FAB5538-A); F4/80-Pacific blue
(1:100, AbD Serotec MCA497PBT) and TREM-1-PE (1:100, R&D systems FAB1187P).
Similarly for endothelial cell identification, cells were stained with following antibodies rat
anti-mouse CD45-FITC (1:400, BD Pharmingen 30-F11); Lyve-1-FITC (1:250, eBioscience
53-0443); TREM-1-PE (1:100, R&D systems FAB1187P); CD31-APC (1:100, BD
Pharmingen 551262) and hamster anti-mouse Podoplanin-Alexa488 (1:100, e-bioscience
53-5381-82) Similarly for myeloid subset identification, cells were stained with following
antibodies rat anti-mouse CD11b-PE (1:000, eBioscience 12-0112); Gr1-FITC (1:100, BD
Pharmingen 553127); Ly6G (1A8)-Pacific Blue (1:100, Biolegend 127612), Ly6C (HK1.4)-
APC (1:25, Biolegend 128016).
12

For VEGFR2+CD133+Ter119- myeloid cells evaluation blood was collected in heparinized
tubes. Cell suspensions were evaluated after red cell lysis and labeling by flow cytometry
according to the protocol described earlier (Goon et al., 2006). At least 105 events per
sample were analyzed. BMRC were defined as CD45-(1:400, BD Pharmingen, 561086)
/Ter119-(1:200, BD Pharmingen, 553673) /VEGFR2+ (1:200, BD Pharmingen, 561252)
/CD133+(1:25, ebioscience, 11-1331). FACS analysis was performed with a FACS Canto™
(Becton Dickinson) and data were processed using FlowJoTM (TreeStar, OR).
Cellular and biochemical studies
Cell culture: LLC (Lewis lung carcinoma; obtained from ATCC) and 4T1-luc (mammary
cancer cell line; kindly provided by Dr. Gary Sahagian, Tufts University, Boston, USA) were
cultured at 37°C and 5% CO2 in MEM (Invitrogen) and RMPI 1640 (Gibco). The medium
was supplemented with 10% FCS, 1% streptomycin and penicillin, 1% glutamine, 1%
sodium pyruvate, and 1% nonessential amino acid. HUVE (human umbilical vein
endothelial) cells and HCME (human cardiac microvascular endothelial) cells were cultured
at 37°C, 100% humidity and 5% CO2 using Endopan3 medium (Pan Biotech GmbH) and
Endothelial cell growth medium MV (Promocell) respectively, supplemented with 1%
streptomycin and penicillin, 5% glutamine, 10% FCS, and 50 Ag/mL gentamycin. U937 cells
were cultured at 37°C and 5% CO2 in RPMI 1640 (Gibco) containing 10% FCS, 1%
glutamine, and 1% streptomycin and penicillin.
Flow chamber experiments: First, microsphere were prepared by covalently conjugating
yellow-green and PE carboxylated fluorescent microspheres (2 µm, Polysciences, Inc.,
Warrington-PA) to protein G (Sigma P4689) using a carbodiimide-coupling kit (Polysciences,
Inc). PE-conjugated microspheres were incubated with nonimmune mouse IgG (mIgG,
Southern Biotech, Birmingham, AL, catalog no. 0102-14), while yellow-green microspheres
were bound to anti-ICAM 1 mouse monoclonal antibody (MEM-111 Abcam, ab2213,
Cambridge, MA) for 2 hr at room temperature on a rotary shaker. Subsequently, the
microspheres were washed with PBS and BSA (0.1%). Prior to use, the microspheres were
washed and sonicated. Second, the flow chamber assay was performed using a µ-Slide 1
0.2 Luer Flow Kit (Ibidi GmbH) and a REGLO compact cassette pump (ISMATEC, IDEX
Health & Science GmbH) with a flow rate of 30µl/min. The µ-Slides were coated with
13

HUVEC and were preincubated overnight with Anti-Ang-2 Ab or IgG. The video capture
system consisted of an Olympus IX81 inverted epifluorescence microscope (Olympus) with
a MCV52 Full-HD camera system (Martin Microscope Company). The capture resolution
and rate was 1080p at 29.97 fps. The captured video was stabilized using iMovie 11v.9.04
(Apple Inc.), exported as uncompressed image sequence (29.97fps) and subsequently
processed using FIJI (Fiji is just image J, released under the General Public License). The
video footage (1 min per flow chamber) was quantified using the MTrack2 plug-in. Tracked
objects consisted either of rolling U937 cells on a HUVEC matrix or a mix of IgG-conjugated
R-PE microspheres and anti-ICAM-1-conjugated yellow-green microspheres.
Endothelial cell stimulation experiments: HUVEC (1.5x10⁵) were seeded in 6-well plates
(Becton Dickinson 35-3046) followed by overnight starvation in endothelial basal media
supplemented with 0.5% FCS (starvation medium). Cells were stimulated with either rhAng2
(400ng/ml, R&D 623AN-CF) or PBS in starvation medium for 24 h. RNA was isolated, cDNA
synthesized and CCL2 expression was evaluated by TaqMan qRT-PCR .
Stimulations with rhAng2 and/or TNFα (low 1ng/ml or high 10 ng/ml, R&D 210-TA-CF) were
carried out for 15 min after overnight starvation. Cells were lysed using RIPA buffer, protein
concentrations were determined by BCA Protein Assay Kit (Pierce) followed by SDS-PAGE
and Western Blotting. The primary antibodies used to probe blots were rabbit anti-human
ICAM-1 (4915S, Cell Signaling), rabbit mAb anti-Phospho-IκBα (Ser32) (2859, Cell
Signaling), rabbit mAb anti-IκBα (4812, Cell Signaling) and rabbit anti-beta Actin (sc-16,
Santa Cruz Biotechnology). The membranes were incubated with horseradish peroxidase-
conjugated (HRP) secondary antibody (DAKO) and detected using enhanced
chemiluminescence substrate (ECL, Pierce). Blots were quantified using Fiji software.
For p65 nuclear translocation studies stimulated cells were fixed with 4% PFA,
permeabilized with Triton X-100 and stained with rabbit anti-human p65 (8242, Cell
Signaling), which was detected by Alexa 546 conjugated goat anti rabbit secondary antibody
(Life technologies, A11071). Phalloidin was stained with Alexa Fluor® 488 Phalloidin
(A12379, Invitrogen) probe to visualize the cytoskeleton while nuclei were stained using
DAPI. Images were takes using LSM 710 confocal microscope.
14

Stimulations with rhAng2 were carried out for 5 and 10 min after overnight starvation for
evaluation of STAT3 phosphorylation or nuclear translocation of p-STAT3. For studying
direct effect of Ang2 stimulation on phosphorylation of STAT-3, cells were lysed using RIPA
buffer, protein concentrations were determined by BCA Protein Assay Kit (Pierce) followed
by SDS-PAGE, Western Blotting and quantification using GE Amersham WB system. The
primary antibodies used to probe blots were mouse anti-human STAT3 (9139, Cell
Signaling) and rabbit anti-human p-STAT3 (Tyr 705) (9145, Cell Signaling). These were
detected by Amersham wb goat anti mouse cy3 29038275 and wb goat anti rabbit Cy5
29038278.
For p-STAT3 nuclear translocation studies stimulated cells were fixed with 4% PFA,
permeabilized with Triton X-100 and stained with rabbit anti-human p-STAT3 (Tyr 705)
(9145, Cell Signaling), which was detected by Alexa 546 conjugated goat anti rabbit
secondary antibody (Life technologies, A11071). Phallaoidin was stained with Alexa Fluor®
488 Phalloidin (A12379, Invitrogen) probe to visualize the cytoskeleton while nuclei were
stained using DAPI. Images were takes using Zeiss Cell observer microscope.
Stat3 inhibition experiment: HUVEC (1.5x10⁵) were seeded in 6-well plates and starved
overnight in endothelial basal media supplemented with 0.5% FCS. Cells were incubated for
1 hr with 200 µM of either Stat3 inhibitor (573095, Millipore) or control peptide (573105,
Millipore) prior to rhAng2 (400ng/ml) stimulation for 1 h. Cell lysates were subjected to SDS-
PAGE followed by Western Blotting. Antibodies used were rabbit anti-human ICAM-1 and
rabbit anti-beta actin as described before.
Sprouting assay: Spheroids obtained by hanging drop method from cultured HCMEC were
seeded in collagen matrix in 24 well plates. The spheroids were stimulated with either
VEGF+bFGF (25ng/ml, R&D) (positive control), recombinant Bv8 (500ng/ml) or PBS
(negative control). The Bv8 treated spheroids were also treated with either IgG or Ang2 Ab
(1ug/ml). The cytokines were replenished after every 24 hr and the assay was stopped after
3 days. Images were takes using Olympus IX-81 microscope and sprout length was
analyzed using Cell F® software. 10 spheroids were analyzed for each experimental
condition.
15

Tube formation assay: Single cell suspension containing 25,000 HCMEC was added to each
well of collagen matrix coated 96 well plates. The seeded cells were stimulated with either
VEGF+bFGF (R&D) (positive control), recombinant Bv8 (500ng/ml) or PBS (negative
control). The Bv8 treated cells were also treated with either IgG or Ang2 Ab (5,10,20ug/ml).
Images were takes using Zeiss Cell observer microscope and number of branches were
analyzed using Fiji. 10 wells were analyzed per condition.
Western blot of murine tissue: For Western immunoblotting, lung metastases were
dissected, chopped and homogenized in RIPA buffer using a manual tissue homogenizer.
Protein concentrations were determined and protein lysates were separated by SDS-PAGE
followed by Western Blotting. Mouse ICAM-1 was detected using goat anti-mouse ICAM-1
(AF796, R&D) and actin was used as loading control. Blots were quantified using Fiji
software and signals were normalized to respective loading controls.
qRT-PCR: Total RNA from lung or HUVEC lysates was extracted using the RNeasy mini kit
(Qiagen) and subjected to a reverse transcriptase reaction using QuantiTect Rev.
Transcription Kit (Qiagen). cDNA was used in three replicates for qRT-PCR using pre-
designed TaqMan gene expression assay primers (Applied Biosystems) (mouse ICAM1:
Mm00516023_m1; mouse VCAM1: Mm01320970_m1; mouse ß-actin: Mm00607939_S1;
human CCL2: Hs00234140_m1; human ß2M: Hs00984230_m1). Expression data were
acquired and analyzed using an Applied Biosystems StepOne Plus Real time PCR system.
ELISA & cytokine array: Circulating levels of serum mCCL2, mGCSF and mVEGF or CCL2
and Bv8 in protein lysates from metastatic lesions were measured using commercial ELISA
kits (mCCL2,mVEGF and mGCSF from R&D and Bv8 from Cusabio®) as described by the
manufacturer.
Mouse cytokine array was purchased from R&D and level of cytokines was assessed as per
directions of the manufacturer. Briefly, the array membranes were blocked with blocking
buffer at room temperature for 1 h, and media and the detection antibody cocktail were
added and incubated at 4 °C overnight. After washing thrice with 2 ml of wash buffer at room
temperature, streptavidin- HRP was added to each membrane and incubated at room
temperature for 30 min. After washing, the cytokines were detected by a chemiluminescence
reaction. Spots were quantified by using FIJI® after background subtraction. Normalized
16

data were analyzed for treatment specific differences as processed and results per set were
used to determine the mean differences in cytokine abundance and significance was tested
using Students t-test.
References: Goon, P. K., Lip, G. Y., Boos, C. J., Stonelake, P. S., and Blann, A. D. (2006). Circulating endothelial cells, endothelial progenitor cells, and endothelial microparticles in cancer. Neoplasia 8, 79-88. Liang, W. C., Wu, X., Peale, F. V., Lee, C. V., Meng, Y. G., Gutierrez, J., Fu, L., Malik, A. K., Gerber, H. P., Ferrara, N., et al. (2006) Cross-species vascular endothelial growth factor (VEGF)-blocking antibodies completely inhibit the growth of human tumor xenografts and measure the contribution of stromal VEGF. J Biol Chem 281, 951–61 Ng, S. S., Sparreboom, A., Shaked, Y., Lee, C., Man, S., Desai, N., Soon-Shiong, P., Figg, W. D., and Kerbel, R. S. (2006). Influence of formulation vehicle on metronomic taxane chemotherapy: albumin-bound versus cremophor EL-based paclitaxel. Clin Cancer Res 12, 4331-4338. Pace, C. N., Vajdos, F., Fee, L., Grimsley, G., Gray, T (1995) How to measure and predict the molar absorption coefficient of a protein. Protein Sci 4, 2411–2423. Pajerowski, A. G., Shapiro, M. J., Gwin, K., Sundsbak, R., Nelson-Holte, M., Medina, K., and Shapiro, V. S. (2010). Adult hematopoietic stem cells require NKAP for maintenance and survival. Blood 116, 2684-2693. Thomas, M., Kienast, Y., Scheuer, W., Bahner, M., Kaluza, K., Gassner, C., Herting, F., Brinkmann, U., Seeber, S., Kablie, A., et al. (2013) A novel angiopoietin-2 selective fully human antibody with potent anti-tumoral and anti-angiogenic efficacy and superior side effect profile compared to Pan-Angiopoietin-1/-2 inhibitors. PLoS ONE 8:e54923. Tran Cao, H. S., Bouvet, M., Kaushal, S., Keleman, A., Romney, E., Kim, G., Fruehauf, J., Imagawa, D. K., Hoffman, R. M., and Katz, M. H. (2010). Metronomic gemcitabine in combination with sunitinib inhibits multisite metastasis and increases survival in an orthotopic model of pancreatic cancer. Mol Cancer Ther. 9, 2068-2078. Willenborg, S., Lucas, T., van Loo, G., Knipper, J. A., Krieg, T., Haase, I., Brachvogel, B., Hammerschmidt, M., Nagy, A., Ferrara, N., et al. (2012). CCR2 recruits an inflammatory macrophage subpopulation critical for angiogenesis in tissue repair. Blood 120, 613-625. Zhu, X., Fujita, M., Snyder, L. A., and Okada, H. (2011). Systemic delivery of neutralizing antibody targeting CCL2 for glioma therapy. J Neuro-oncol. 104, 83-92.
17

![Establishment and Identification of Small Cell Lung Cancer Cell … · [CANCER RESEARCH 45, 2913-2923, June 1985] Establishment and Identification of Small Cell Lung Cancer Cell Lines](https://img.pdfslide.us/doc/110x75/60347fa5d25195593e3efdb8/establishment-and-identification-of-small-cell-lung-cancer-cell-cancer-research.jpg)