Embed Size (px)
Citation preview
1
2013 WATER QUALITY REPORT
The City of Yakima is pleased once again to present for you
our annual report of water quality. In addition to disclosing
the results of our major testing programs, we hope this letter
will inform you about your tap water and inspire confidence
that the water we all rely on is of the highest quality possible.
In pursuit of that goal the Water and Irrigation Division staff is
committed to around-the-clock vigilance and service, and we
are proud to announce that your tap water meets and ex-
ceeds all state and federal requirements.
WHERE YOUR WATER COMES FROM
The Naches River supplies most of Yakima’s drinking water.
Our diversion is located along Hwy 12 and supplies the Naches
River Water Treatment Plant at Rowe Hill. After treatment,
water flows by gravity along the highway into town. During
times of heavy runoff or when the Plant requires downtime
maintenance, we can draw upon our 4 wells. They are located
at Kiwanis Park, Kissel Park, Gardner Park, and Yakima Airport.
These wells draw from the Ellensburg Aquifer and are also
tested regularly.
Introduction and source
water education
1
Summary tables, pt.1 and
glossary with definitions
2
Summary tables, pt. 2 and
your invitation to participate
3
Water Use Efficiency, helpful
tips, hardness information
4
Photo collage of construction
at the Naches River WTP
5
Inside this issue:
Naches River WTP 2.4 Billion
Airport Well 225 Million
Kissel Well 253 Million
Kiwanis Well 257 Million
Gardner Well 659 Million
Billing Rate: $0.20/100 Gallons
2013 Gallons Produced
Naches River Water Treatment Plant

2
All drinking water, including bottled water, may reasonably be expected to contain at
least small amounts of some contaminants. The presence of contaminants does not
necessarily indicate that the water poses a health risk. More information about contami-
nants and potential health effects can be obtained by calling the Environmental Protec-
tion Agency’s Safe Drinking Water Hotline at 1-800-426-4791.
Every year we take hundreds of samples and analyze them for disinfection byproducts,
synthetic and volatile organics, biological, radiological, and inorganic contaminants.
The tables below show the most important and frequently requested results for 2013.
If you have any questions about these tests or if you would like to know about a sub-
stance not listed here you can call the Water Quality Specialist at 509-576-6477.
Microbial Contaminants
Each year 840 samples from the distribution system are collected and analyzed to comply with the
Total Coliform Rule (TCR). Coliforms are environmentally ubiquitous bacteria that live in the ground.
The presence of coliforms in the water may indicate a leak, a cross-connection, or other problems.
Name Units MCL MCLG Number detected Range low/high Violation?
Total Coliform Sample <5% 0 0.12%* 0—100% No
* The 0.12% detected indicates that one sample of 840 was positive. Repeat and upstream/downstream sampling were all negative.
Turbidity Turbidity is a measure of the “cloudiness” of water. High turbidity can indicate poor water quality.
Sources of turbidity are generally attributed to soil runoff caused by heavy rain or snowmelt.
Name Units MCL 2013 Average Range low/high Violation?
Turbidity NTU TT 0.03 0.01—0.08 No
Disinfection Byproducts (DBP’s) are formed when the chlorine added as a disinfectant combines with
the naturally occurring organic matter (NOM) to form potentially harmful compounds. These com-
pounds are divided into two main groups: Trihalomethanes (THM’s) and Haloacetic Acids (HAA5’s.)
Disinfection and
Disinfection Byproducts
Name Units MCL / MRDL Range 2013 Average Violation?
Chlorine mg/L 4.0 0.06—1.64 0.84 No
TTHM’s ppb 80 0.0—69.0 28.5 No
HAA5’s ppb 60 0.0—53.9 18.3 No
Glossary for Tables
< = less than
MCL = Maximum Contaminant Level, the highest level of a
contaminant allowed in drinking water.
MCLG = Maximum Contaminant Level Goal, the level of
contaminant below which there is no known or expected
health risk.
mg/L = milligrams per liter. Equal to ppm.
MRDL = Maximum Residual Disinfectant Level, the highest
level of a disinfectant allowed in drinking water.
MRDLG = Maximum Residual Disinfectant Level Goal, the
level of drinking water disinfectant below which there is
no known or expected health risk.
NTU = Nephelometric Turbidity Unit.
ppm = part per million
ppb = part per billion
TT = Treatment Technique, a required process intended to
reduce the level of a contaminant.

3
Primary Standards
National Primary Drinking Water Regulation primary standards are legally enforceable standards that
apply to public water systems. There are more primary standards not included here because they
were present in undetectable amounts.
Name Units MCL MCLG Amount detected Violation? Source
Arsenic ppm 0.01 0 0.00022 No Erosion of natural deposits, industrial waste.
Barium ppm 2 2 0.00212 No Erosion of natural deposits, industrial waste.
Chromium ppm 0.1 0.1 <0.0001 No Erosion of natural deposits, industrial waste.
Nitrate ppm 10 10 <0.07 No Erosion of natural deposits, fertilizer runoff,
sewage, and faulty septic systems.
Nitrite ppm 1 1 <0.07 No Erosion of natural deposits, fertilizer runoff,
sewage, and faulty septic systems.
Thallium ppm 0.0005 0.002 0.00013 No Industrial waste.
Fluoride
Fluoride is added to drinking water to improve dental health. Fluoridation in Yakima began in 2004
after a referendum vote in 2001. For more information about water system fluoridation, please visit
the DOH website: http://www.doh.wa.gov/Portals/1/Documents/Pubs/160-021_Fluoridate_Facts.pdf
Name Units MCL MCLG 2013 Average Range Violation?
Fluoride ppm 4.0 2.0 0.92 0.77—1.22 No
Lead and Copper
Lead and copper are specially regulated contaminants under the Lead and Copper Rule, however lead
is also a primary regulated substance. They are included here as an inorganic environmental contami-
nant from the WTP, and not as the results of our tri-annual Lead and Copper testing program.
Name Units MCL MCLG Amount detected Violation?
Lead mg/L 0.015 0 < 0.0001 No
Copper mg/L 1.3 0 0.000064 No
About Lead in Drinking Water
If present, elevated levels of lead can cause
serious health problems, especially for preg-
nant women and young children. Lead in
drinking water is primarily from materials and
components associated with service lines and
home plumbing. The City of Yakima is respon-
sible for providing high quality drinking water,
but cannot control the variety of materials
used in plumbing components. When your
water has been sitting for several hours, you
can minimize the potential for lead exposure
to lead by flushing your tap for 30 seconds to 2
minutes before using water for drinking or
cooking. If you are concerned about lead in
your water, you may wish to have your water
tested. Information on lead in drinking water,
testing methods, and steps you can take to
minimize exposure is available from the Safe
Drinking Water Hotline (800) 426-4791, or
http://www.epa.gov/safewater/lead.
Questions, Comments, Concerns?
The City of Yakima welcomes your input!
The City Council meets on the first and third
Tuesday of each month at City Hall Council
Chambers. You are encouraged to attend. If
you would like to schedule a tour of the
Naches River Water Treatment Plant, please
call 575-6177. If you would like to talk about
this report please call 576-6477.
Secondary Standards
Secondary standards are non-enforceable guidelines regulating contaminants that may have cosmetic
or aesthetic effects, such as taste, odor, or staining. Substances listed here that do not have an MCL
are presented by popular request.
Name Units MCL Amount detected Name Units MCL Amount Detected
Calcium mg/L — 8.29 Manganese mg/L 0.05 <0.0001
Color mg/L 15 < 4 Sodium mg/L 250 2.2
Iron mg/L 0.3 <0.0097 Sulfate mg/L — 6.91
Magnesium mg/L — 1.52 Zinc mg/L 5 0.00066
4
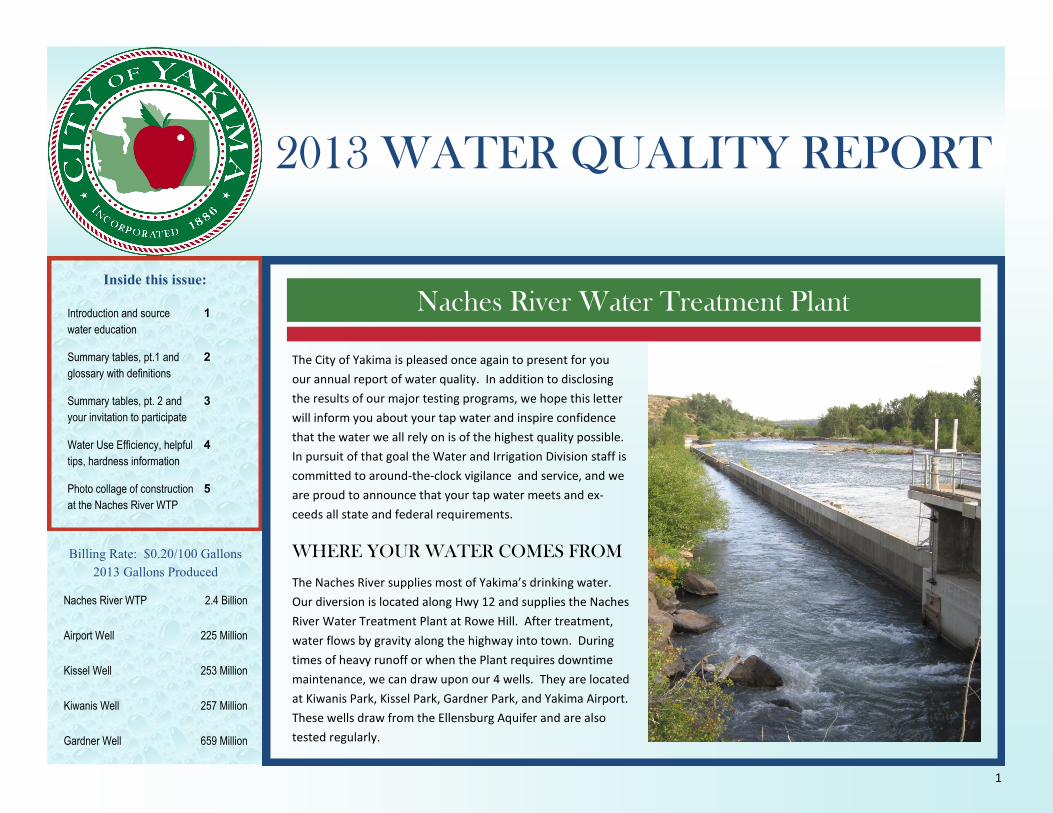
Very Soft Moderately Hard
0 ppm 100 ppm 50 ppm
Naches River WTP 27 ppm
How Is My Water?
Hardness is a term used to describe water when substantial amounts of Magnesium and
Calcium are present. These nontoxic minerals can leave behind deposits on basins and
fixtures called water spots, and hard water does not dissolve soap as readily as softer wa-
ter so lather and suds are more difficult to produce.
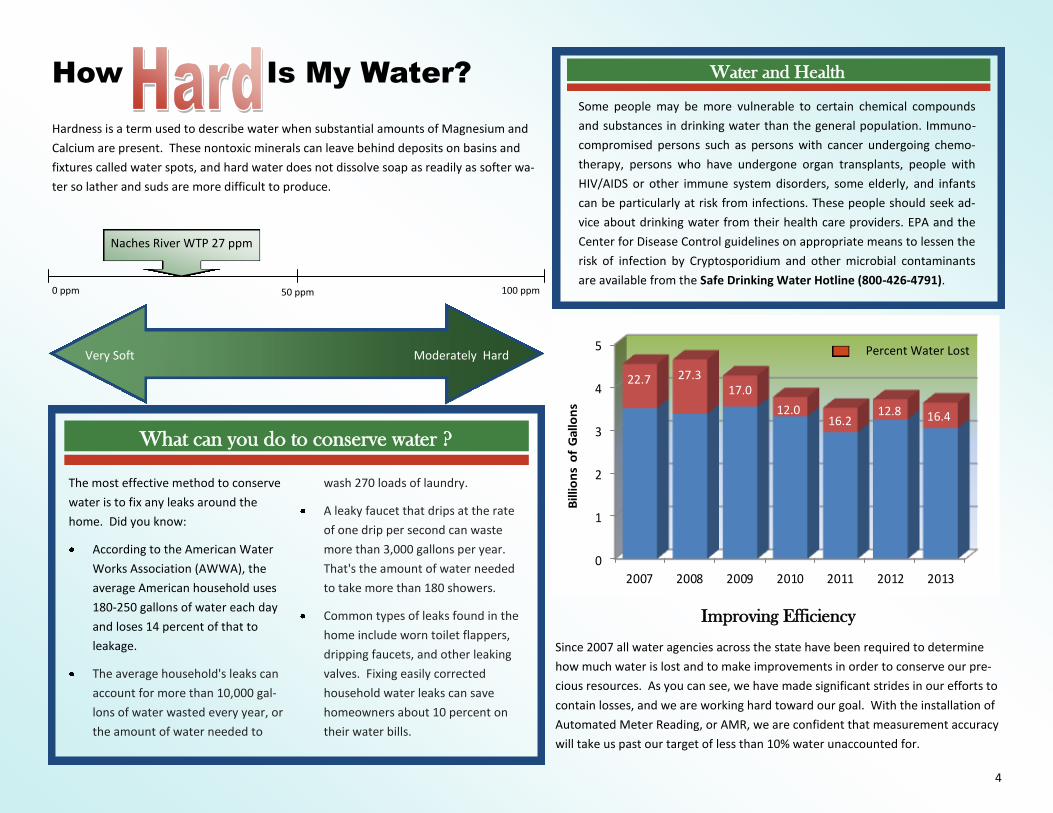
Improving Efficiency
Since 2007 all water agencies across the state have been required to determine
how much water is lost and to make improvements in order to conserve our pre-
cious resources. As you can see, we have made significant strides in our efforts to
contain losses, and we are working hard toward our goal. With the installation of
Automated Meter Reading, or AMR, we are confident that measurement accuracy
will take us past our target of less than 10% water unaccounted for.
What can you do to conserve water ?
The most effective method to conserve
water is to fix any leaks around the
home. Did you know:
According to the American Water
Works Association (AWWA), the
average American household uses
180-250 gallons of water each day
and loses 14 percent of that to
leakage.
The average household's leaks can
account for more than 10,000 gal-
lons of water wasted every year, or
the amount of water needed to
wash 270 loads of laundry.
A leaky faucet that drips at the rate
of one drip per second can waste
more than 3,000 gallons per year.
That's the amount of water needed
to take more than 180 showers.
Common types of leaks found in the
home include worn toilet flappers,
dripping faucets, and other leaking
valves. Fixing easily corrected
household water leaks can save
homeowners about 10 percent on
their water bills.
Some people may be more vulnerable to certain chemical compounds
and substances in drinking water than the general population. Immuno-
compromised persons such as persons with cancer undergoing chemo-
therapy, persons who have undergone organ transplants, people with
HIV/AIDS or other immune system disorders, some elderly, and infants
can be particularly at risk from infections. These people should seek ad-
vice about drinking water from their health care providers. EPA and the
Center for Disease Control guidelines on appropriate means to lessen the
risk of infection by Cryptosporidium and other microbial contaminants
are available from the Safe Drinking Water Hotline (800-426-4791).
Water and Health
0
1
2
3
4
5
2007 2008 2009 2010 2011 2012 2013B
illio
ns
of
Gal
lon
s
Percent Water Lost
22.7 27.3 17.0
12.0 16.2
12.8 16.4

5
Forming and rebar of the backwash
lagoons. Over 2,500 cubic yards of
concrete were poured.
Core drilling the WTP for backwash waste lines.
Forming up the walls of the transfer pump building sumps.
Leak-checking the transfer pump sumps after concrete pour.
Northernmost lagoon fully wetted with
transfer pump building in background.
Excavation of new 42
inch waste line, the old
sump, and grade check-
ing the elevations for
the new sump. The
large red shorebox was
used to prevent under-
mining the filter build-
ing foundation.
In order to comply with regulations and to keep up with ever-improving technological standards, the Naches Riv-
er Water Treatment Plant began an overhaul of its backwash lagoon, electrical service and distribution system,
and the SCADA system. This 3.4 million dollar project began in October 2013 and will finish in May 2014.