Embed Size (px)
Citation preview
2 0 1 3 W A T E R Q U A L I T Y R E P O R T
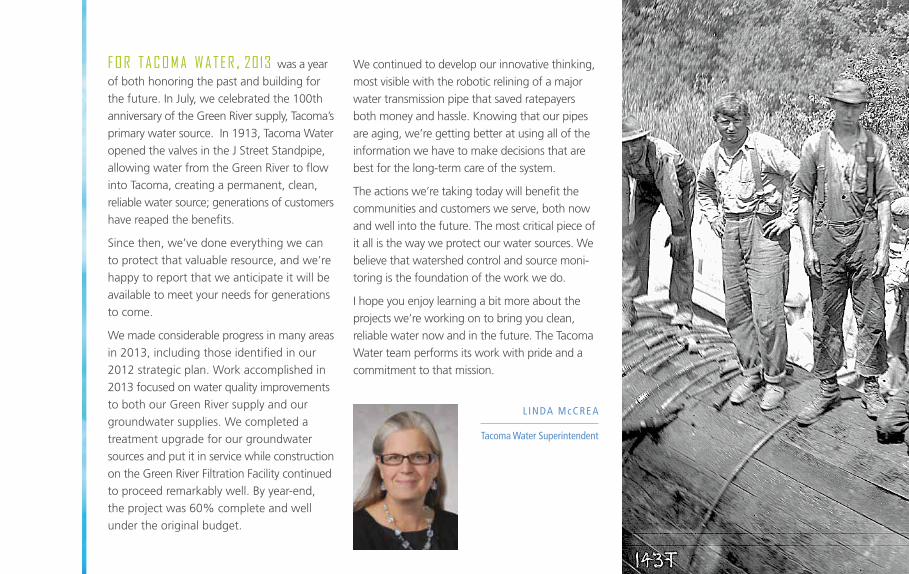
f o r t a c o m a w a t e r , 2013 was a year of both honoring the past and building for the future. In July, we celebrated the 100th anniversary of the Green River supply, Tacoma’s primary water source. In 1913, Tacoma Water opened the valves in the J Street Standpipe, allowing water from the Green River to flow into Tacoma, creating a permanent, clean, reliable water source; generations of customers have reaped the benefits.
Since then, we’ve done everything we can to protect that valuable resource, and we’re happy to report that we anticipate it will be available to meet your needs for generations to come.
We made considerable progress in many areas in 2013, including those identified in our 2012 strategic plan. Work accomplished in 2013 focused on water quality improvements to both our Green River supply and our groundwater supplies. We completed a treatment upgrade for our groundwater sources and put it in service while construction on the Green River Filtration Facility continued to proceed remarkably well. By year-end, the project was 60% complete and well under the original budget.
L INDA McCREA
Tacoma Water Superintendent
We continued to develop our innovative thinking, most visible with the robotic relining of a major water transmission pipe that saved ratepayers both money and hassle. Knowing that our pipes are aging, we’re getting better at using all of the information we have to make decisions that are best for the long-term care of the system.
The actions we’re taking today will benefit the communities and customers we serve, both now and well into the future. The most critical piece of it all is the way we protect our water sources. We believe that watershed control and source moni-toring is the foundation of the work we do.
I hope you enjoy learning a bit more about the projects we’re working on to bring you clean, reliable water now and in the future. The Tacoma Water team performs its work with pride and a commitment to that mission.
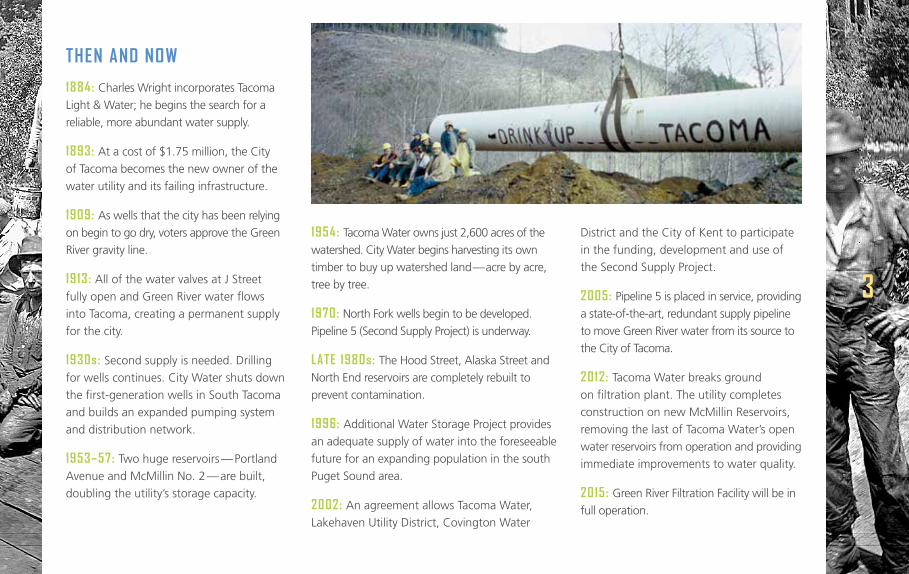
THEN AND NOW
1884: Charles Wright incorporates Tacoma Light & Water; he begins the search for a reliable, more abundant water supply.
1893: At a cost of $1.75 million, the City of Tacoma becomes the new owner of the water utility and its failing infrastructure.
1909: As wells that the city has been relying on begin to go dry, voters approve the Green River gravity line.
1913: All of the water valves at J Street fully open and Green River water flows into Tacoma, creating a permanent supply for the city.
1930s: Second supply is needed. Drilling for wells continues. City Water shuts down the first-generation wells in South Tacoma and builds an expanded pumping system and distribution network.
1953–57: Two huge reservoirs — Portland Avenue and McMillin No. 2 — are built, doubling the utility’s storage capacity.
1954: Tacoma Water owns just 2,600 acres of the watershed. City Water begins harvesting its own timber to buy up watershed land — acre by acre, tree by tree.
1970: North Fork wells begin to be developed. Pipeline 5 (Second Supply Project) is underway.
LATE 1980s: The Hood Street, Alaska Street and North End reservoirs are completely rebuilt to prevent contamination.
1996: Additional Water Storage Project provides an adequate supply of water into the foreseeable future for an expanding population in the south Puget Sound area.
2002: An agreement allows Tacoma Water, Lakehaven Utility District, Covington Water
District and the City of Kent to participate in the funding, development and use of the Second Supply Project.
2005: Pipeline 5 is placed in service, providing a state-of-the-art, redundant supply pipeline to move Green River water from its source to the City of Tacoma.
2012: Tacoma Water breaks ground on filtration plant. The utility completes construction on new McMillin Reservoirs, removing the last of Tacoma Water’s open water reservoirs from operation and providing immediate improvements to water quality.
2015: Green River Filtration Facility will be in full operation.
33
GETTING CLOSER TO FILTERED WATER
The Green River is one of the few remaining large unfiltered surface water supplies in the U.S.— but not for long. New federal requirements call for the treatment of cryptosporidium, a naturally occurring organism that shows up at very low levels in the Green River; Tacoma Water will treat it by filtering the water supply.
Tacoma Water is less than one year away from completing the Green River Filtration Facility, which will provide a wide range of benefits to you. When completed in early 2015, the facility will be able to deliver up to 150 million gallons per day of water that:
n is protected from many contaminants, including cryptosporidium
n tastes, smells and looks better
n has less sand and silt
n will be more reliably delivered year-round
WHAT A DIFFERENCE A YEAR MAKES
2013 was an extraordinary year at the filtration facility. In the course of 12 months,
WELL, WELL , WELL
CHANGES TO GROUNDWATER SUPPLY IMPROVE PUBLIC HEALTH
4
In 2013, Tacoma Water wrapped up a $4.2 million construction project that significantly improves the groundwater supply by bringing it to the same standard as the rest of our water.
Most of Tacoma Water’s supply is from the Green River, but groundwater from wells in South Tacoma supplements the river supply when it is limited or demand is high, making those wells a critical local resource. Until late last year, the only treatment the well water received was chlorine disinfection.
At the Hood Street Reservoir, we built chemical systems to add fluoride and sodium hydroxide to the groundwater supply. Those changes provide uniform fluoride levels for healthier teeth and reduce water acidity to prevent household plumbing corrosion.
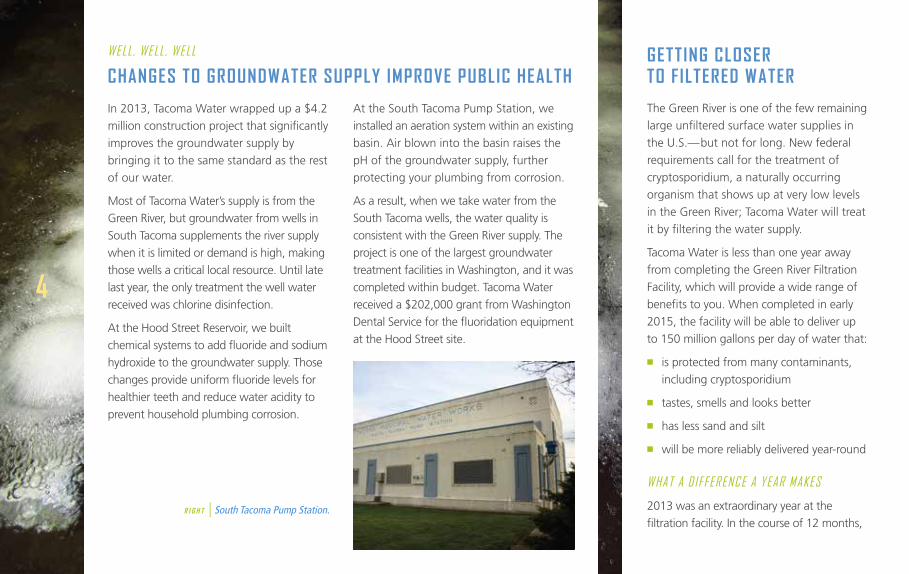
At the South Tacoma Pump Station, we installed an aeration system within an existing basin. Air blown into the basin raises the pH of the groundwater supply, further protecting your plumbing from corrosion.
As a result, when we take water from the South Tacoma wells, the water quality is consistent with the Green River supply. The project is one of the largest groundwater treatment facilities in Washington, and it was completed within budget. Tacoma Water received a $202,000 grant from Washington Dental Service for the fluoridation equipment at the Hood Street site.
r i g h t | South Tacoma Pump Station.
crews worked more than 300,000 hours to move the project from underground to 25 feet above ground. Massive steel and concrete walls — the walls that will hold all of Tacoma’s Green River water supply as it is treated — rose out of the ground. In total, more than 3,000 concrete trucks came and went.
One of the challenges of the project has been determining how to start up new pieces of the facility without interrupting the daily business of delivering your water — safely and reliably — the way we always have. We are pleased to report that Tacoma Water staff, along with its very capable contractor and design team, successfully met that challenge throughout the year.
During that time, the project cost dropped from $195 million to $186 million. Tacoma Water is responsible for 67% of the project cost. The remaining expenses are divided among the other project partners: Covington Water District, the City of Kent, and Lakehaven Utility District.
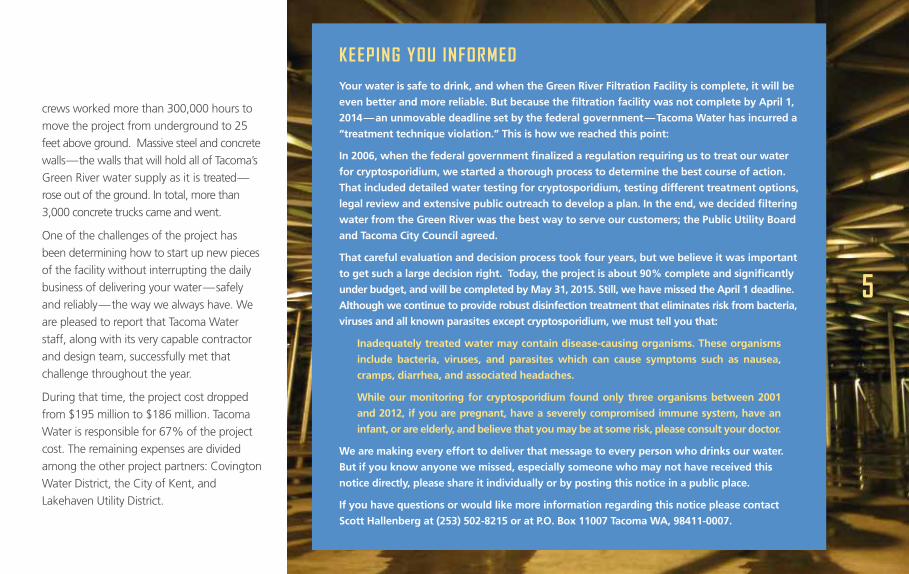
KEEPING YOU INFORMED
Your water is safe to drink, and when the Green River Filtration Facility is complete, it will be
even better and more reliable. But because the filtration facility was not complete by April 1,
2014 — an unmovable deadline set by the federal government — Tacoma Water has incurred a
“treatment technique violation.” This is how we reached this point:
In 2006, when the federal government finalized a regulation requiring us to treat our water
for cryptosporidium, we started a thorough process to determine the best course of action.
That included detailed water testing for cryptosporidium, testing different treatment options,
legal review and extensive public outreach to develop a plan. In the end, we decided filtering
water from the Green River was the best way to serve our customers; the Public Utility Board
and Tacoma City Council agreed.
That careful evaluation and decision process took four years, but we believe it was important
to get such a large decision right. Today, the project is about 90% complete and significantly
under budget, and will be completed by May 31, 2015. Still, we have missed the April 1 deadline.
Although we continue to provide robust disinfection treatment that eliminates risk from bacteria,
viruses and all known parasites except cryptosporidium, we must tell you that:
Inadequately treated water may contain disease-causing organisms. These organisms
include bacteria, viruses, and parasites which can cause symptoms such as nausea,
cramps, diarrhea, and associated headaches.
While our monitoring for cryptosporidium found only three organisms between 2001
and 2012, if you are pregnant, have a severely compromised immune system, have an
infant, or are elderly, and believe that you may be at some risk, please consult your doctor.
We are making every effort to deliver that message to every person who drinks our water.
But if you know anyone we missed, especially someone who may not have received this
notice directly, please share it individually or by posting this notice in a public place.
If you have questions or would like more information regarding this notice please contact
Scott Hallenberg at (253) 502-8215 or at P.O. Box 11007 Tacoma WA, 98411-0007.
5
Plan developed by Tacoma Water. The plan protects 32 species of fish and wildlife that live or may live in the watershed; it includes 66 ways to improve habitat and reduce our impacts on sensitive species, including those protected under the Endangered Species Act.
In those 12 years since, we’ve implemented nearly all of those measures and continue to monitor and conduct research to track their progress. In 2013,
6
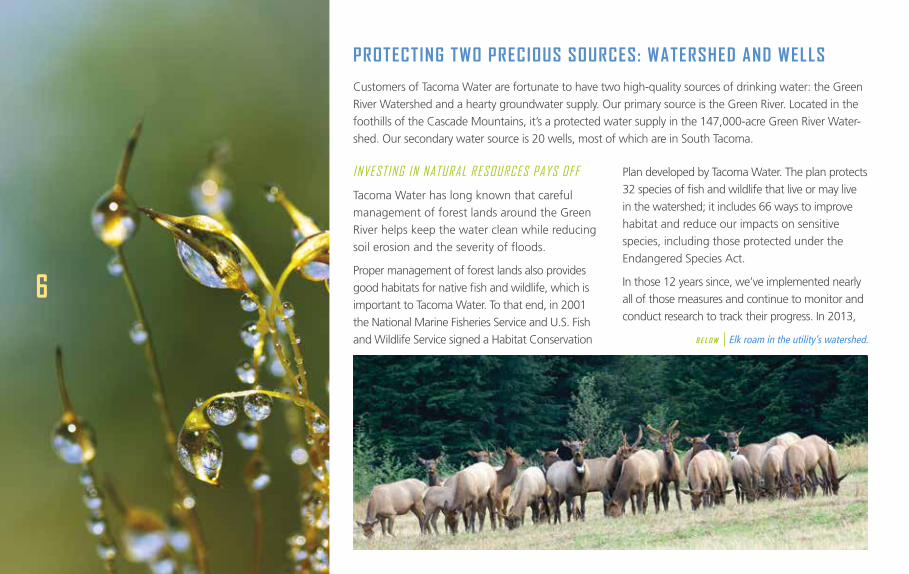
PROTECTING TWO PRECIOUS SOURCES: WATERSHED AND WELLS
Customers of Tacoma Water are fortunate to have two high-quality sources of drinking water: the Green River Watershed and a hearty groundwater supply. Our primary source is the Green River. Located in the foothills of the Cascade Mountains, it’s a protected water supply in the 147,000-acre Green River Water-shed. Our secondary water source is 20 wells, most of which are in South Tacoma.
INVESTING IN NATURAL RESOURCES PAYS OFF
Tacoma Water has long known that careful management of forest lands around the Green River helps keep the water clean while reducing soil erosion and the severity of floods.
Proper management of forest lands also provides good habitats for native fish and wildlife, which is important to Tacoma Water. To that end, in 2001 the National Marine Fisheries Service and U.S. Fish and Wildlife Service signed a Habitat Conservation b e l o w | Elk roam in the utility’s watershed.
7
we reported the first 10 years of our progress to the National Marine Fisheries Service and the U.S. Fish & Wildlife Service. The agencies said they are pleased with Tacoma Water’s efforts.
Managing the watershed under the guidance of the Habitat Conservation Plan allows us to continue to meet our mission of providing clean, reliable water now and in the future, while also being good stewards of the lands entrusted to us and the species that depend on them.
KEEPING GROUNDWATER CLEAN
Groundwater contamination is often caused by accidental spills, leaks or discharges from industry, businesses and homes. Protecting our groundwater sources is very important and involves all of us. Tacoma Water does its part by establishing policies and protective boundaries around drinking water wells to prevent contaminants from reaching the aquifer.
Most of our groundwater system is in the South Tacoma Groundwater Protection District, roughly from S. 19th Street to S. 80th Street and S. Orchard Street to Yakima Avenue. Businesses within that area are monitored, and regulated if necessary,
based on their use and handling of hazardous substances. The Tacoma-Pierce County Health Department conducts periodic inspections of regulated businesses and educates them on the importance of proper material handling, storage and disposal. The health department can also issue citations if a business fails to comply with material handling requirements.
There are also things you can do to help protect our groundwater:
n Use natural lawn care methods when possible.
n Wash your vehicle at a commercial car wash, where the water is recycled and processed prior to disposal. If you do wash your car at home, use an environmentally friendly soap.
n Store chemicals in their original containers and quickly clean up spills.
n Dispose of used oil and other chemicals at a hazardous waste facility. Many landfills offer this service at no charge to residential customers.
For more information on protecting our groundwater sources, please call us at (253) 502-8665.
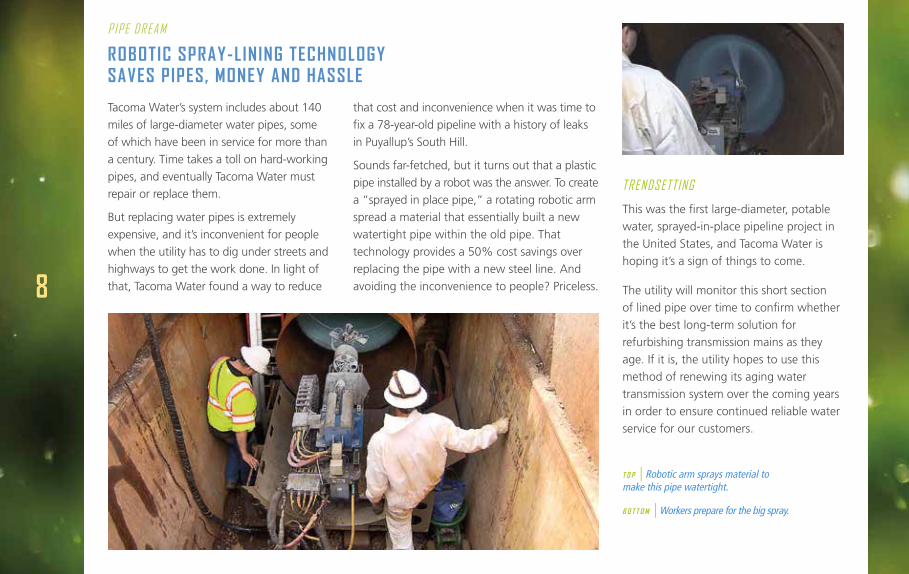
PIPE DREAM
ROBOTIC SPRAY-LINING TECHNOLOGY SAVES PIPES, MONEY AND HASSLE
Tacoma Water’s system includes about 140 miles of large-diameter water pipes, some of which have been in service for more than a century. Time takes a toll on hard-working pipes, and eventually Tacoma Water must repair or replace them.
But replacing water pipes is extremely expensive, and it’s inconvenient for people when the utility has to dig under streets and highways to get the work done. In light of that, Tacoma Water found a way to reduce 8
that cost and inconvenience when it was time to fix a 78-year-old pipeline with a history of leaks in Puyallup’s South Hill.
Sounds far-fetched, but it turns out that a plastic pipe installed by a robot was the answer. To create a “sprayed in place pipe,” a rotating robotic arm spread a material that essentially built a new watertight pipe within the old pipe. That technology provides a 50% cost savings over replacing the pipe with a new steel line. And avoiding the inconvenience to people? Priceless.
TRENDSETTING
This was the first large-diameter, potable water, sprayed-in-place pipeline project in the United States, and Tacoma Water is hoping it’s a sign of things to come.
The utility will monitor this short section of lined pipe over time to confirm whether it’s the best long-term solution for refurbishing transmission mains as they age. If it is, the utility hopes to use this method of renewing its aging water transmission system over the coming years in order to ensure continued reliable water service for our customers.
t o p | Robotic arm sprays material to make this pipe watertight.
b o t t o m | Workers prepare for the big spray.
DELIVERING YOUR WATER
Most of your water comes from the Green River in south King County. The Green River Watershed is a 231-square-mile forested area that serves as a collection point for melting snow and seasonal rainfall in an uninhabited area of the Cascade Mountains between Chinook and Snoqualmie passes. Tacoma Water owns about 11% of the watershed land along the river.
Through agreements with other landowners, we limit watershed access and carefully control activities, such as recreation, road maintenance and logging.
We also own and operate seven wells on the North Fork of the Green River and take water from them during periods when Green River water is too turbid to use.
We supplement the Green River supply with groundwater from more than 20 additional wells to meet peak summer demands. Most are in Tacoma city limits.
KEEPING YOU HEALTHY
Drinking water, including bottled water, may reasonably be expected to contain at least small amounts of some contaminants. The presence of contaminants does not necessarily indicate that water poses a health risk. More information about contaminants and potential health effects can be obtained by calling the Environmental Protection Agency’s Safe Drinking Water Hotline, (800) 426-4791.
Some people may be more vulnerable to contaminants in drinking water than the general population. Immuno-compromised persons, such as persons with cancer undergoing chemotherapy, persons who have undergone organ transplants, people with HIV/AIDS or other immune system disorders, some elderly and infants can be particularly at risk from infections. These people should seek advice about drinking water from their health care providers. Environmental Protection Agency/Centers for Disease Control guidelines on appropriate means to lessen the risk of infection by cryptosporidium and other microbial contaminants are available from the Safe Drinking Water Hotline, (800) 426-4791.
9
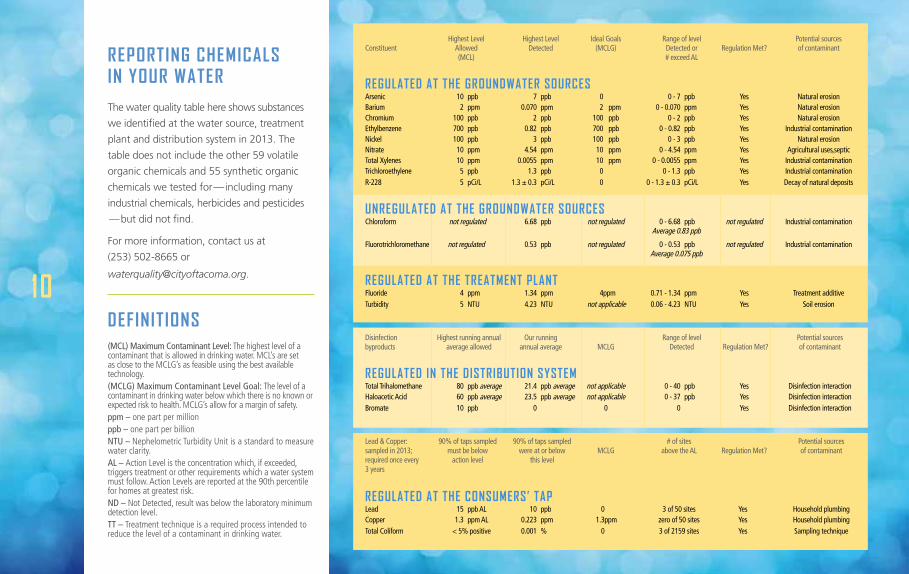
REPORTING CHEMICALS IN YOUR WATER
The water quality table here shows substances
we identified at the water source, treatment
plant and distribution system in 2013. The
table does not include the other 59 volatile
organic chemicals and 55 synthetic organic
chemicals we tested for — including many
industrial chemicals, herbicides and pesticides
— but did not find.
For more information, contact us at
(253) 502-8665 or
DEFINITIONS(MCL) Maximum Contaminant Level: The highest level of a contaminant that is allowed in drinking water. MCL’s are set as close to the MCLG’s as feasible using the best available technology.(MCLG) Maximum Contaminant Level Goal: The level of a contaminant in drinking water below which there is no known or expected risk to health. MCLG’s allow for a margin of safety.ppm – one part per millionppb – one part per billionNTU – Nephelometric Turbidity Unit is a standard to measure water clarity.AL – Action Level is the concentration which, if exceeded, triggers treatment or other requirements which a water system must follow. Action Levels are reported at the 90th percentile for homes at greatest risk.ND – Not Detected, result was below the laboratory minimum detection level.TT – Treatment technique is a required process intended to reduce the level of a contaminant in drinking water.
10
Highest Level Highest Level Ideal Goals Range of level Potential sourcesConstituent Allowed Detected (MCLG) Detected or Regulation Met? of contaminant (MCL) # exceed AL
REGULATED AT THE GROUNDWATER SOURCES Arsenic 10 ppb 7 ppb 0 0 - 7 ppb Yes Natural erosionBarium 2 ppm 0.070 ppm 2 ppm 0 - 0.070 ppm Yes Natural erosionChromium 100 ppb 2 ppb 100 ppb 0 - 2 ppb Yes Natural erosionEthylbenzene 700 ppb 0.82 ppb 700 ppb 0 - 0.82 ppb Yes Industrial contaminationNickel 100 ppb 3 ppb 100 ppb 0 - 3 ppb Yes Natural erosionNitrate 10 ppm 4.54 ppm 10 ppm 0 - 4.54 ppm Yes Agricultural uses,septicTotal Xylenes 10 ppm 0.0055 ppm 10 ppm 0 - 0.0055 ppm Yes Industrial contaminationTrichloroethylene 5 ppb 1.3 ppb 0 0 - 1.3 ppb Yes Industrial contaminationR-228 5 pCi/L 1.3 ± 0.3 pCi/L 0 0 - 1.3 ± 0.3 pCi/L Yes Decay of natural deposits
UNREGULATED AT THE GROUNDWATER SOURCES Chloroform not regulated 6.68 ppb not regulated 0 - 6.68 ppb not regulated Industrial contamination Average 0.83 ppb
Fluorotrichloromethane not regulated 0.53 ppb not regulated 0 - 0.53 ppb not regulated Industrial contamination Average 0.075 ppb
REGULATED AT THE TREATMENT PLANT Fluoride 4 ppm 1.34 ppm 4 ppm 0.71 - 1.34 ppm Yes Treatment additiveTurbidity 5 NTU 4.23 NTU not applicable 0.06 - 4.23 NTU Yes Soil erosion
Disinfection Highest running annual Our running Range of level Potential sourcesbyproducts average allowed annual average MCLG Detected Regulation Met? of contaminant
REGULATED IN THE DISTRIBUTION SYSTEM Total Trihalomethane 80 ppb average 21.4 ppb average not applicable 0 - 40 ppb Yes Disinfection interactionHaloacetic Acid 60 ppb average 23.5 ppb average not applicable 0 - 37 ppb Yes Disinfection interactionBromate 10 ppb 0 0 0 Yes Disinfection interaction
Lead & Copper: 90% of taps sampled 90% of taps sampled # of sites Potential sourcessampled in 2013; must be below were at or below MCLG above the AL Regulation Met? of contaminantrequired once every action level this level 3 years
REGULATED AT THE CONSUMERS’ TAP Lead 15 ppb AL 10 ppb 0 3 of 50 sites Yes Household plumbingCopper 1.3 ppm AL 0.223 ppm 1.3 ppm zero of 50 sites Yes Household plumbingTotal Coliform < 5% positive 0.001 % 0 3 of 2159 sites Yes Sampling technique
FINDING SUBSTANCES IN YOUR WATERTap water and bottled water sources include rivers, lakes, streams, reservoirs, springs and wells. As water travels over or through the ground, it dissolves naturally occurring minerals and can pick up other substances resulting from the presence of animals or human activity. Those substances may include inorganic material such as salts and metals, synthetic and volatile organic material from industrial processes, storm water runoff and septic systems, and pesticides and herbicides from agriculture and residential uses. To ensure your drinking water is safe, the EPA and/or the Washington State Board of Health prescribe regulations that limit the amount of certain contaminants in public water systems.
ORGANISMS
Cryptosporidium (KRIP-toe-spo-RID-ee-um)
Cryptosporidium is a microscopic organism commonly found in open surface water sources. Swallowing cryptosporidium can cause diarrhea, fever and other stomach and abdominal symptoms. We tested the Green River for cryptosporidium on a monthly basis from 2001 – 2012. Samples were collected and analyzed using the best available method approved by the EPA. We did detect cryptosporidium in the untreated Green River 3 times during this 12 year period. We have had no reported instances of cryptosporidium-related health problems in our service area. New federal drinking water rules require us to treat for cryptosporidium by 2014.
Giardia (GEE-are-DEE-uh)
Giardia lamblia is another microscopic organism commonly found in open-surface waters such as rivers, lakes and streams. Like other water systems that use open surface water sources, federal and state regulations require us to treat Green River water for Giardia. We kill Giardia effectively with disin- fecting chemicals like chlorine and ozone.
GASES
Radon
Radon is a naturally occurring radioactive gas. Breathing radon can cause lung cancer in humans. Ninety-eight percent of detected radon comes from indoor air generally released from soil beneath homes. Radon can release from tap water, but in much smaller quantities – only about 1 percent of radon exposure comes from drinking water.
We test for radon in our groundwater sources. Federal guidelines require drinking water to contain no more than 4,000 picocuries per liter (a picocurie is a measure of radiation). We took 111 samples and tested them between 1992 and 2013. Findings show an average of 291 picocuries per liter. Our largest single test shows 530 picocuries per liter.
MINERALS
Lead & Copper
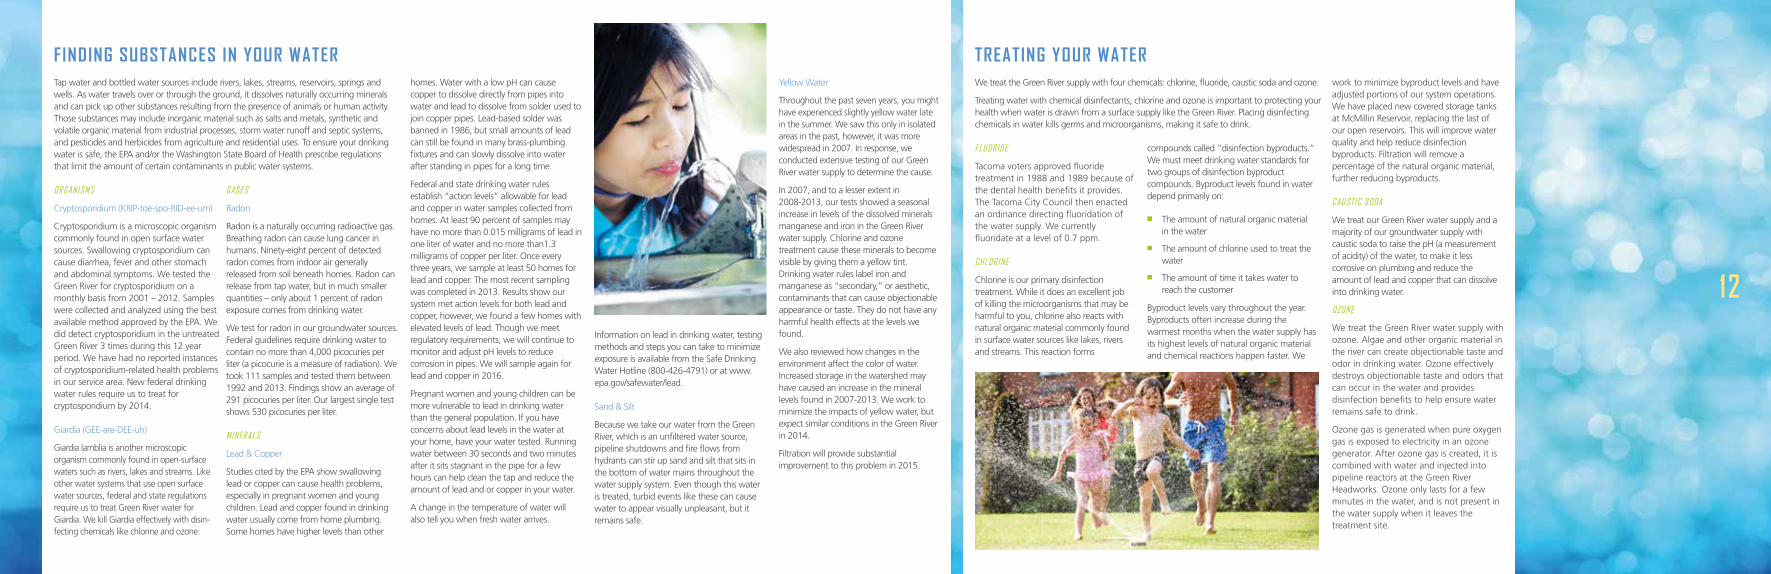
Studies cited by the EPA show swallowing lead or copper can cause health problems, especially in pregnant women and young children. Lead and copper found in drinking water usually come from home plumbing. Some homes have higher levels than other
homes. Water with a low pH can cause copper to dissolve directly from pipes into water and lead to dissolve from solder used to join copper pipes. Lead-based solder was banned in 1986, but small amounts of lead can still be found in many brass-plumbing fixtures and can slowly dissolve into water after standing in pipes for a long time.
Federal and state drinking water rules establish “action levels” allowable for lead and copper in water samples collected from homes. At least 90 percent of samples may have no more than 0.015 milligrams of lead in one liter of water and no more than1.3 milligrams of copper per liter. Once every three years, we sample at least 50 homes for lead and copper. The most recent sampling was completed in 2013. Results show our system met action levels for both lead and copper, however, we found a few homes with elevated levels of lead. Though we meet regulatory requirements, we will continue to monitor and adjust pH levels to reduce corrosion in pipes. We will sample again for lead and copper in 2016.
Pregnant women and young children can be more vulnerable to lead in drinking water than the general population. If you have concerns about lead levels in the water at your home, have your water tested. Running water between 30 seconds and two minutes after it sits stagnant in the pipe for a few hours can help clean the tap and reduce the amount of lead and or copper in your water.
A change in the temperature of water will also tell you when fresh water arrives.
Information on lead in drinking water, testing methods and steps you can take to minimize exposure is available from the Safe Drinking Water Hotline (800-426-4791) or at www.epa.gov/safewater/lead.
Sand & Silt
Because we take our water from the Green River, which is an unfiltered water source, pipeline shutdowns and fire flows from hydrants can stir up sand and silt that sits in the bottom of water mains throughout the water supply system. Even though this water is treated, turbid events like these can cause water to appear visually unpleasant, but it remains safe.
Yellow Water
Throughout the past seven years, you might have experienced slightly yellow water late in the summer. We saw this only in isolated areas in the past, however, it was more widespread in 2007. In response, we conducted extensive testing of our Green River water supply to determine the cause.
In 2007, and to a lesser extent in 2008-2013, our tests showed a seasonal increase in levels of the dissolved minerals manganese and iron in the Green River water supply. Chlorine and ozone treatment cause these minerals to become visible by giving them a yellow tint. Drinking water rules label iron and manganese as “secondary,” or aesthetic, contaminants that can cause objectionable appearance or taste. They do not have any harmful health effects at the levels we found.
We also reviewed how changes in the environment affect the color of water. Increased storage in the watershed may have caused an increase in the mineral levels found in 2007-2013. We work to minimize the impacts of yellow water, but expect similar conditions in the Green River in 2014.
Filtration will provide substantial improvement to this problem in 2015.
TREATING YOUR WATERWe treat the Green River supply with four chemicals: chlorine, fluoride, caustic soda and ozone.
Treating water with chemical disinfectants, chlorine and ozone is important to protecting your health when water is drawn from a surface supply like the Green River. Placing disinfecting chemicals in water kills germs and microorganisms, making it safe to drink.
compounds called “disinfection byproducts.” We must meet drinking water standards for two groups of disinfection byproduct compounds. Byproduct levels found in water depend primarily on:
n The amount of natural organic material in the water
n The amount of chlorine used to treat the water
n The amount of time it takes water to reach the customer
Byproduct levels vary throughout the year. Byproducts often increase during the warmest months when the water supply has its highest levels of natural organic material and chemical reactions happen faster. We
work to minimize byproduct levels and have adjusted portions of our system operations. We have placed new covered storage tanks at McMillin Reservoir, replacing the last of our open reservoirs. This will improve water quality and help reduce disinfection byproducts. Filtration will remove a percentage of the natural organic material, further reducing byproducts.
CAUSTIC SODA
We treat our Green River water supply and a majority of our groundwater supply with caustic soda to raise the pH (a measurement of acidity) of the water, to make it less corrosive on plumbing and reduce the amount of lead and copper that can dissolve into drinking water.
OZONE
We treat the Green River water supply with ozone. Algae and other organic material in the river can create objectionable taste and odor in drinking water. Ozone effectively destroys objectionable taste and odors that can occur in the water and provides disinfection benefits to help ensure water remains safe to drink.
Ozone gas is generated when pure oxygen gas is exposed to electricity in an ozone generator. After ozone gas is created, it is combined with water and injected into pipeline reactors at the Green River Headworks. Ozone only lasts for a few minutes in the water, and is not present in the water supply when it leaves the treatment site.
FLUORIDE
Tacoma voters approved fluoride treatment in 1988 and 1989 because of the dental health benefits it provides. The Tacoma City Council then enacted an ordinance directing fluoridation of the water supply. We currently fluoridate at a level of 0.7 ppm.
CHLORINE
Chlorine is our primary disinfection treatment. While it does an excellent job of killing the microorganisms that may be harmful to you, chlorine also reacts with natural organic material commonly found in surface water sources like lakes, rivers and streams. This reaction forms
12
WATER SMART
Water conservation makes it possible to use existing supplies more efficiently and provides opportunities to develop our regional water supply and fish enhancement programs. This helps ensure enough water remains available regionally to meet your needs and the needs of our community, as well as those of fish, animals and the environment.
The Washington State Department of Health requires municipal water suppliers to establish a water conservation goal and report on its progress annually. Tacoma Water’s conservation goal is to reduce the amount of water each person uses by 8.4% between Jan. 1, 2011, and Jan. 1, 2018. With the focus on “smart use” of water, we know that working together we can achieve that goal. Please see TacomaWater.com/smart to learn ways you can be “water smart.”
3628 S. 35th St. • Tacoma, WA 98409
PRSRT STDUS POSTAGE
PAIDTACOMA WAPERMIT NO 2
TACOMA PUBLIC UTILITY BOARDThe Tacoma Public Utility Board is the governing and policy-making body for Tacoma Water. To become involved in water quality decisions, you may participate in public meetings, held on the second and fourth Wednesdays of each month at 6:30 p.m. in the Tacoma Public Utilities Auditorium, 3628 S. 35th St. in Tacoma.
YOUR WATER QUALITY REPORTThis report contains information about your drinking water.
Congress and the EPA require us to inform you annually about your drinking water and its impacts. Although most content in this report is required, we are pleased to share additional helpful information about your water and the work we do to get it to you.
We produced and mailed this report for about 37 cents per customer.
CONTACT INFORMATIONWater Quality(253) 502-8215waterquality@ cityoftacoma.orgTacomaWater.com
Conservation(253) 502-8723 conservation@ cityoftacoma.org
Cross Connection Control / Backflow Prevention(253) 502-8215backflow@ cityoftacoma.org
Rates(253) 502-8974
National Radon Hotline(800) 55-RADON(800) 557-2366
Washington State Department of Healthdoh.wa.gov/ehp/dw
U.S. Environmental Protection AgencySafe Drinking Water Hotline(800) 426-4791epa.gov/safewater
The hotline and EPA website offer information about drinking water contami-nants and their potential health effects as well as guidelines from the U.S. Centers for Disease Control about appropriate ways to reduce the risk of infection by cryptosporidium and other microbial contami-nants. Both sources also offer information about lead in drinking water, testing methods and steps you can take to minimize exposure.
FPOFPO
1 1A MESSAGE FROM THE ENVIRONMENTAL PROTECTION AGENCY
Your drinking water currently meets EPA’s revised drinking water standard for arsenic. However, it does contain low levels of naturally occurring arsenic not associated with known sources of industrial contamination. There is a small chance that some people who drink water containing low levels of arsenic for many years could develop circulatory disease, cancer or other health problems. Most types of cancer and circulatory diseases are due to factors other than exposure to arsenic. EPA’s standard balances the current understanding of arsenic’s health effects against the costs of removing arsenic from drinking water.
TACOMAWATER.COM