Embed Size (px)
Citation preview
2013 Safflower Irrigation Research Results
Presentation by
L. Niel Allen
Extension Irrigation Specialist
Earl Creech, Clark Israelsen, Mike Pace Students Holly Kent and Phillip Castro
Logan, Utah February 21, 2014
Irrigated Safflower
Adequate water is important to the production of high safflower yields.
Excess irrigation can reduce yields, increase late weed growth, and create an environment where safflower is more susceptible to Alternaria leaf spot.
Alternaria leaf spot is caused by fungi that grow on leaves of safflower and can decrease yield and is expensive to control. Disease occurs when spores land on leaves or stems, germinate in the presence of free moisture, and directly penetrate and infect the plant.
Introduction
Questions Investigated: 1. When and how often should safflower be
irrigated? 2. At what growth stage should irrigation
be terminated? and 3. How does irrigation impact Alternaria
leaf spot?

Greenville Utah Agriculture Experiment Farm, North Logan, Utah (field in 2011)
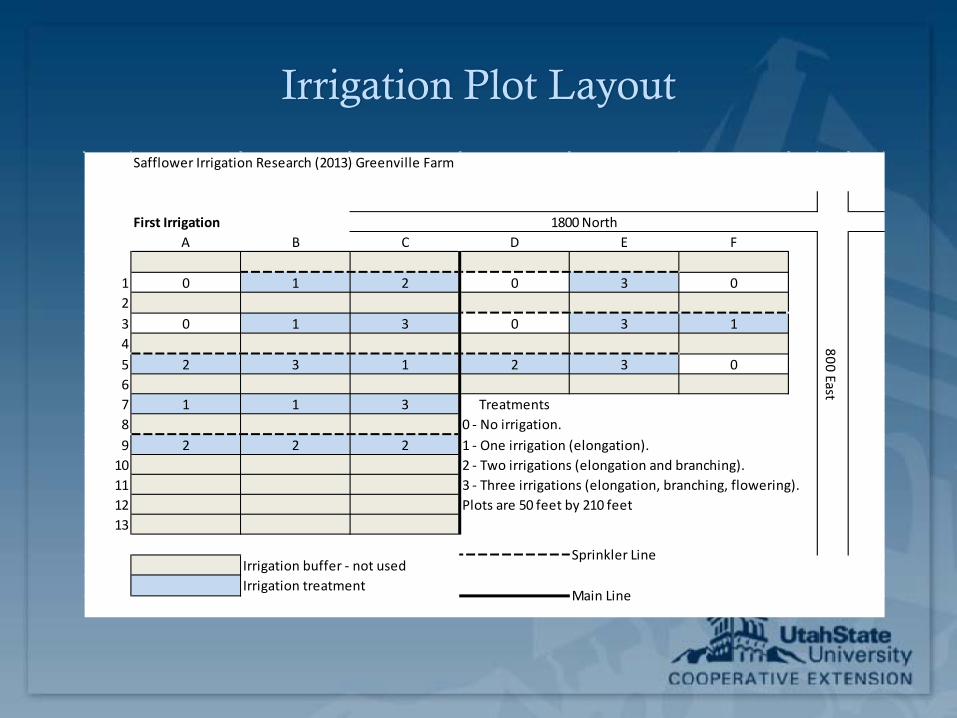
Irrigation Plot Layout
Safflower Irrigation Research (2013) Greenville Farm
First IrrigationA B C D E F
1 0 1 2 0 3 023 0 1 3 0 3 145 2 3 1 2 3 067 1 1 3 Treatments8 0 - No irrigation.9 2 2 2 1 - One irrigation (elongation).
10 2 - Two irrigations (elongation and branching).11 3 - Three irrigations (elongation, branching, flowering).12 Plots are 50 feet by 210 feet13
Irrigation buffer - not used Irrigation treatment
1800 North
800 East
Sprinkler Line
Main Line
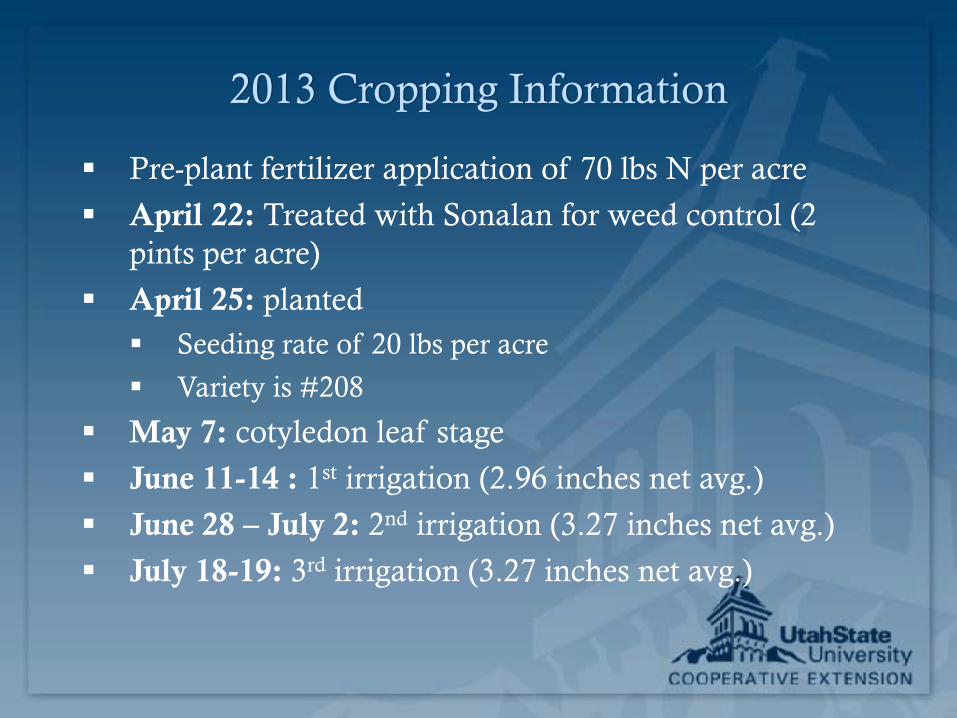
2013 Cropping Information
Pre-plant fertilizer application of 70 lbs N per acre
April 22: Treated with Sonalan for weed control (2 pints per acre)
April 25: planted Seeding rate of 20 lbs per acre
Variety is #208
May 7: cotyledon leaf stage
June 11-14 : 1st irrigation (2.96 inches net avg.)
June 28 – July 2: 2nd irrigation (3.27 inches net avg.)
July 18-19: 3rd irrigation (3.27 inches net avg.)
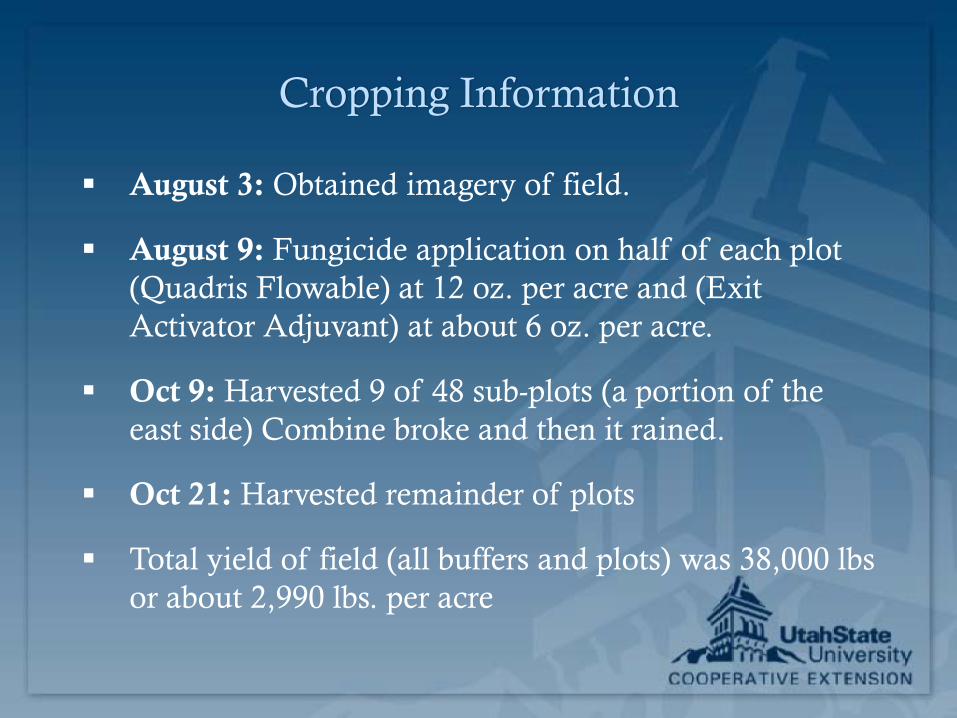
Cropping Information
August 3: Obtained imagery of field.
August 9: Fungicide application on half of each plot (Quadris Flowable) at 12 oz. per acre and (Exit Activator Adjuvant) at about 6 oz. per acre.
Oct 9: Harvested 9 of 48 sub-plots (a portion of the east side) Combine broke and then it rained.
Oct 21: Harvested remainder of plots
Total yield of field (all buffers and plots) was 38,000 lbs or about 2,990 lbs. per acre
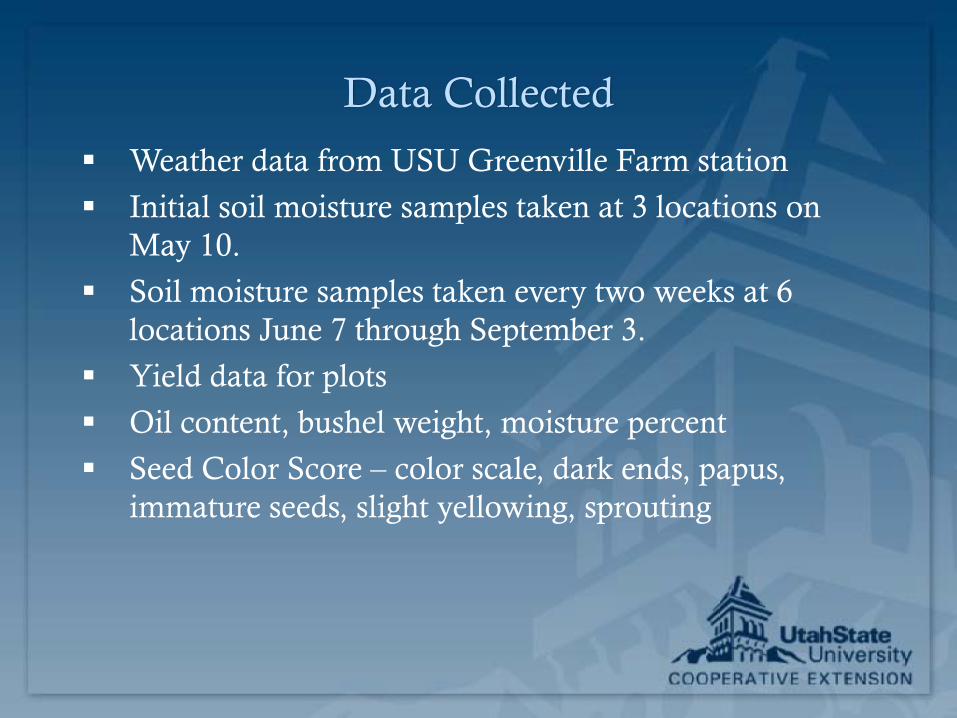
Data Collected
Weather data from USU Greenville Farm station
Initial soil moisture samples taken at 3 locations on May 10.
Soil moisture samples taken every two weeks at 6 locations June 7 through September 3.
Yield data for plots
Oil content, bushel weight, moisture percent
Seed Color Score – color scale, dark ends, papus, immature seeds, slight yellowing, sprouting
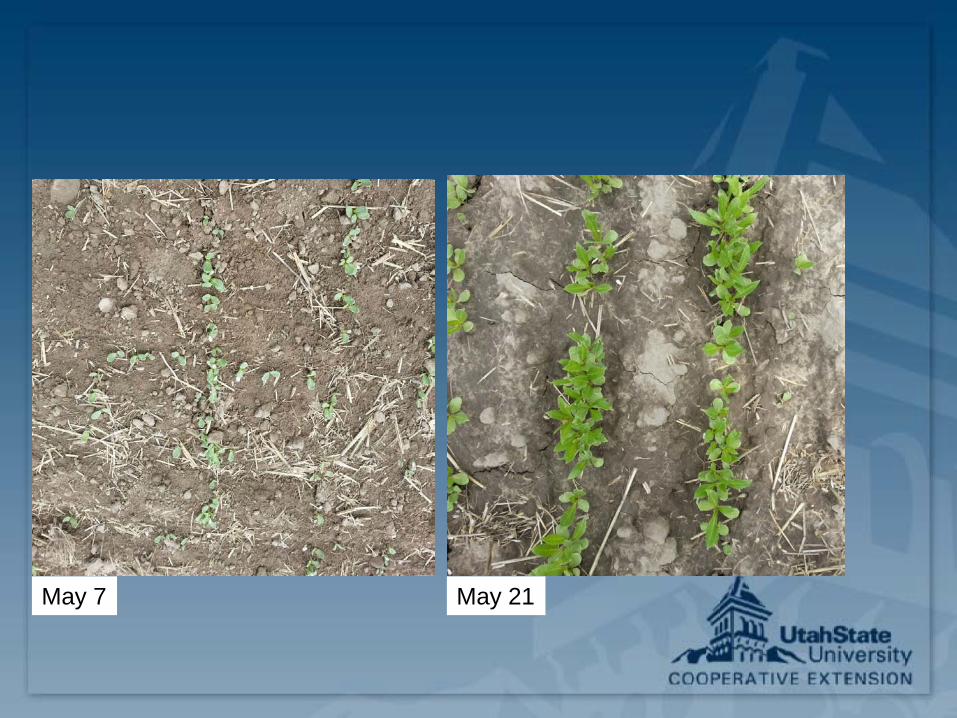
May 7 May 21
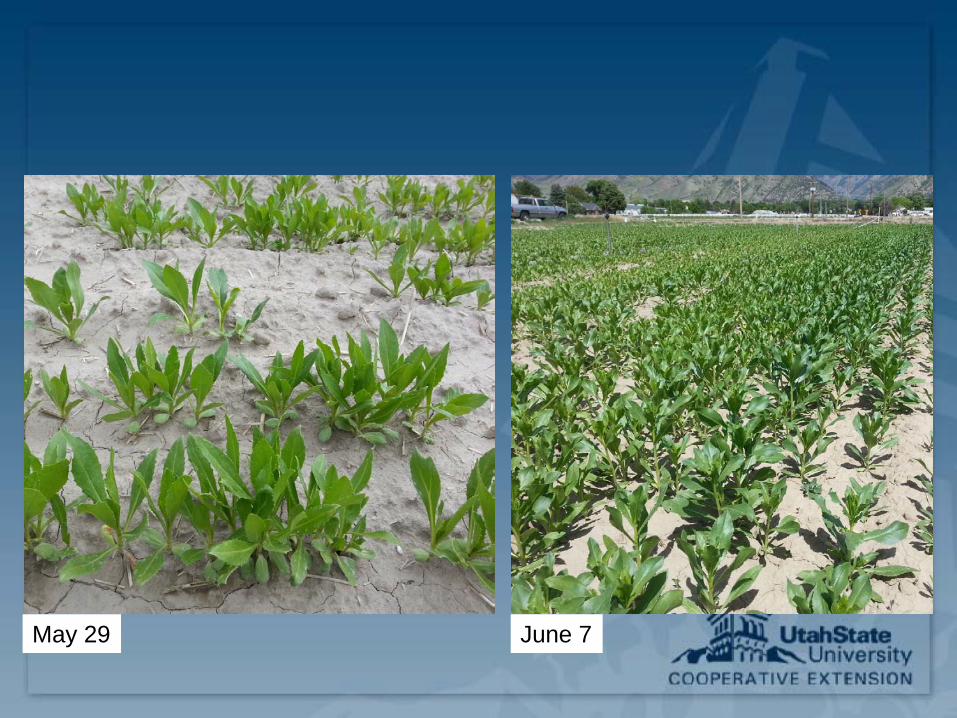
May 29 June 7
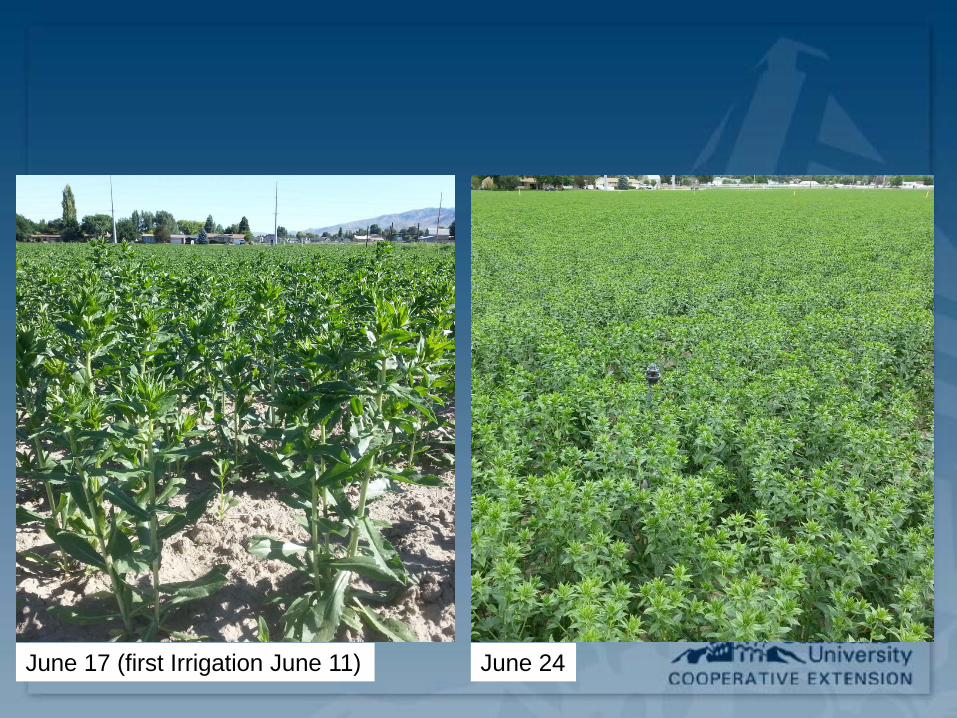
June 17 (first Irrigation June 11) June 24
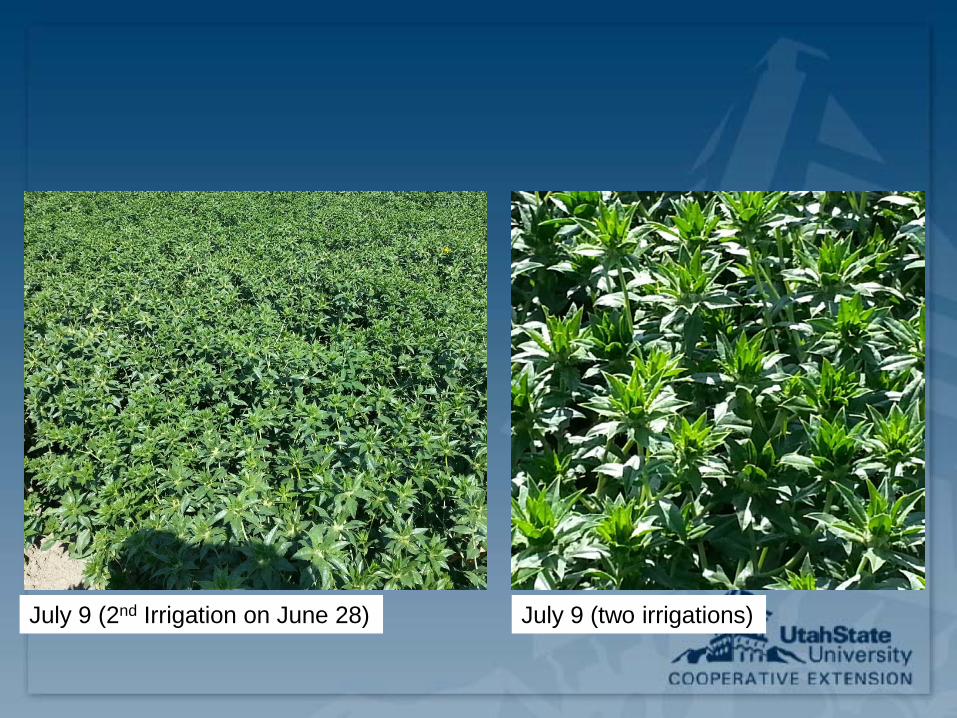
July 9 (2nd Irrigation on June 28) July 9 (two irrigations)
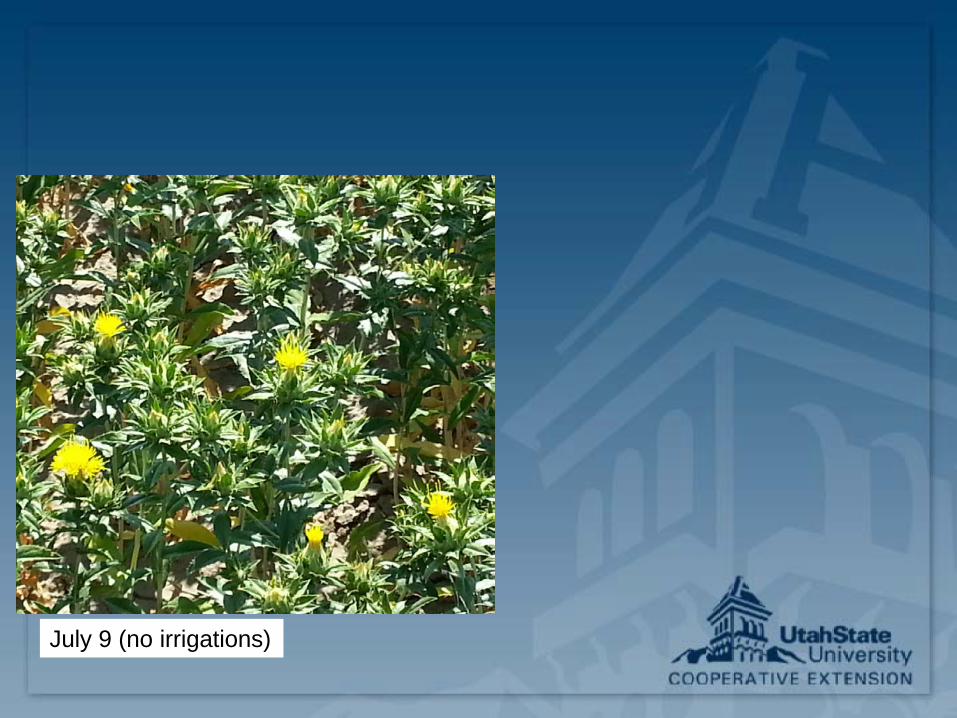
July 9 (no irrigations)
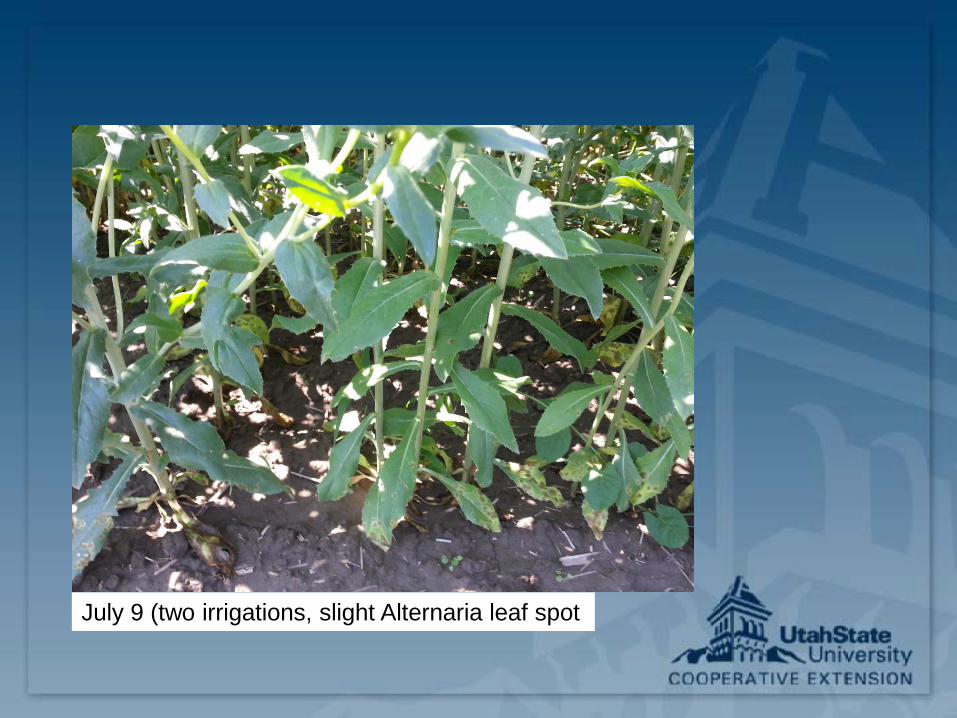
July 9 (two irrigations, slight Alternaria leaf spot
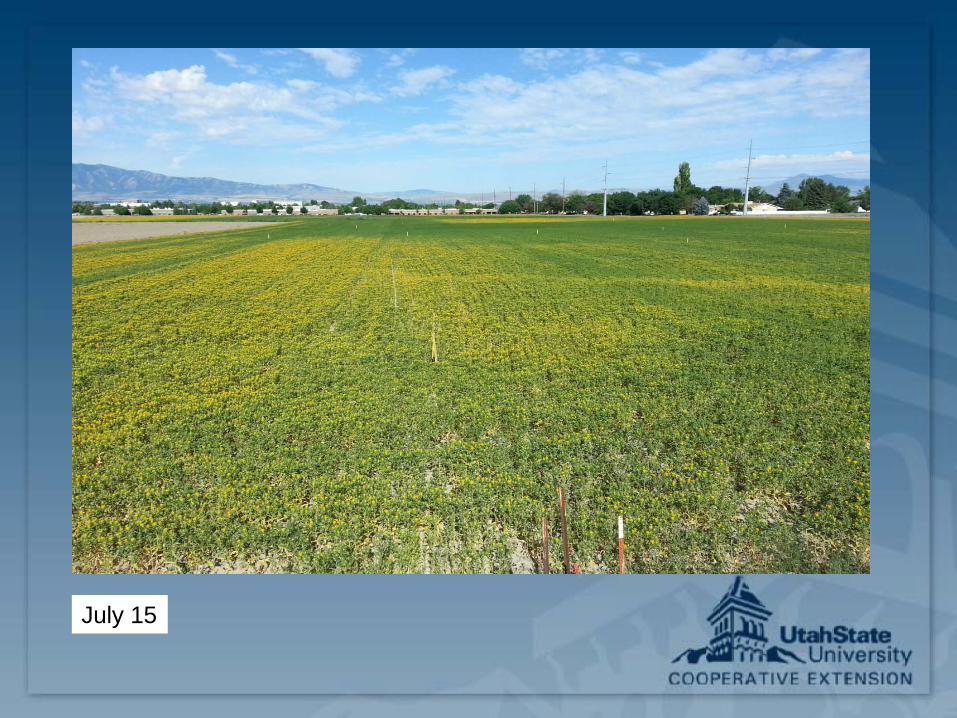
July 15
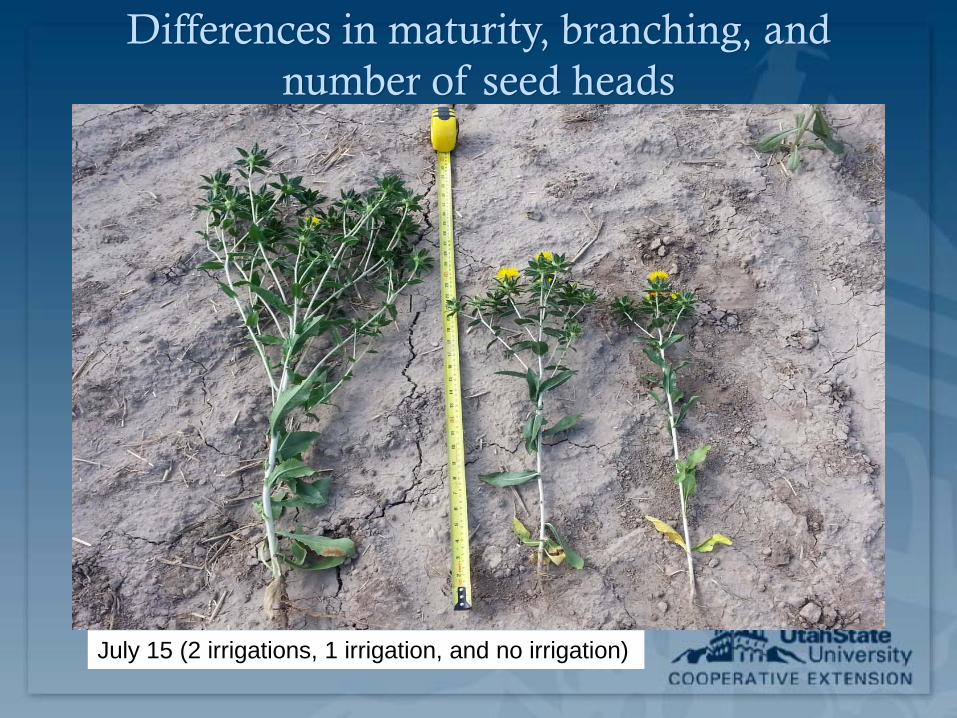
Differences in maturity, branching, and number of seed heads
July 15 (2 irrigations, 1 irrigation, and no irrigation)
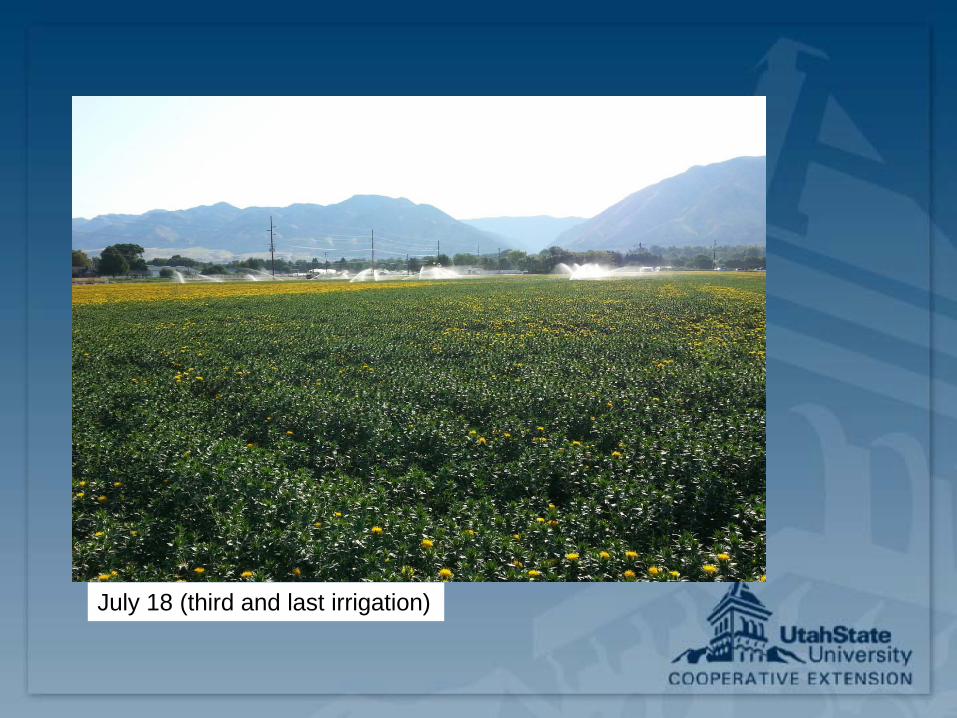
July 18 (third and last irrigation)
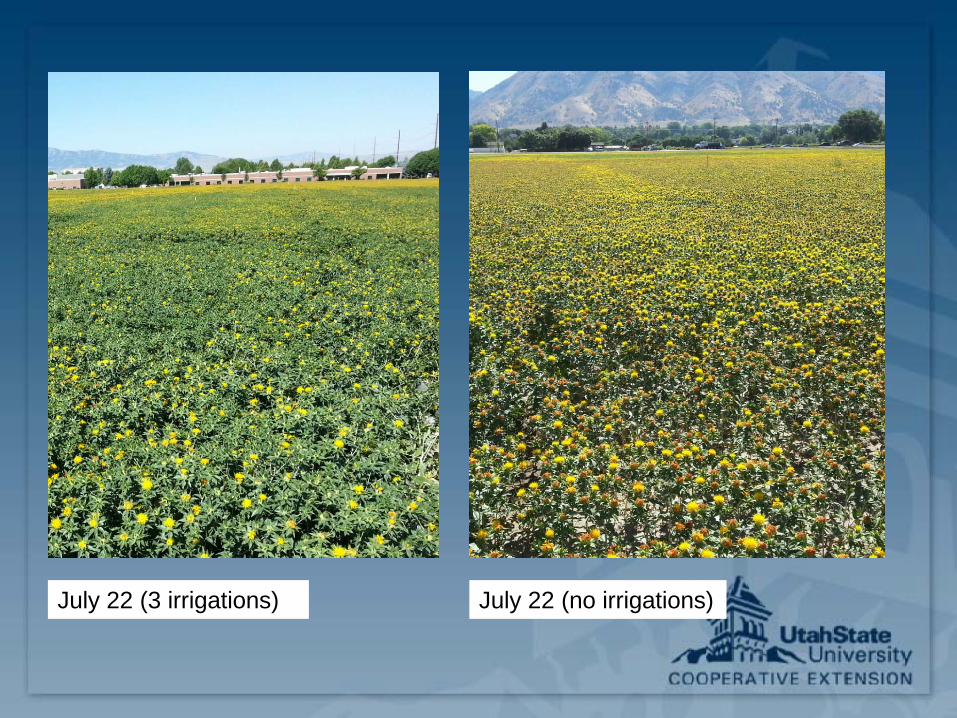
July 22 (3 irrigations) July 22 (no irrigations)
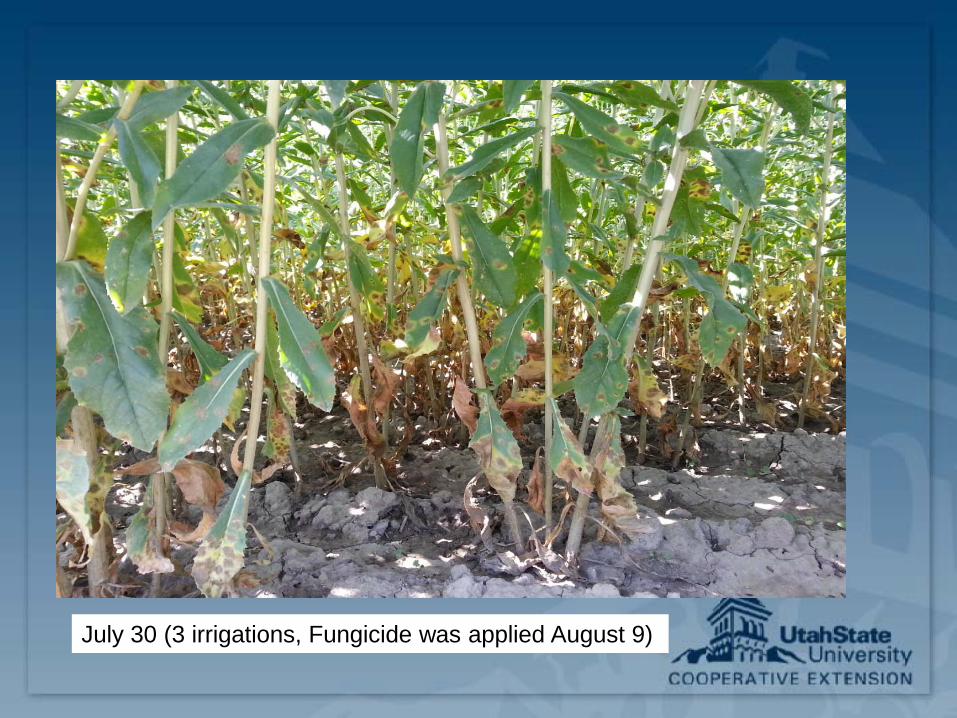
July 30 (3 irrigations, Fungicide was applied August 9)
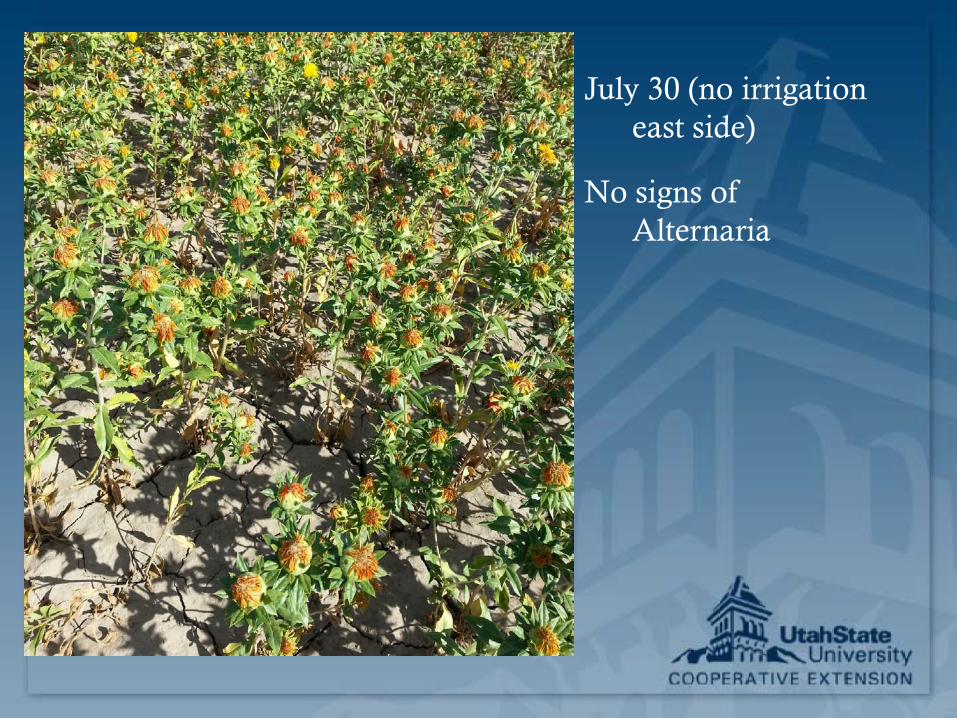
July 30 (no irrigation east side)
No signs of Alternaria
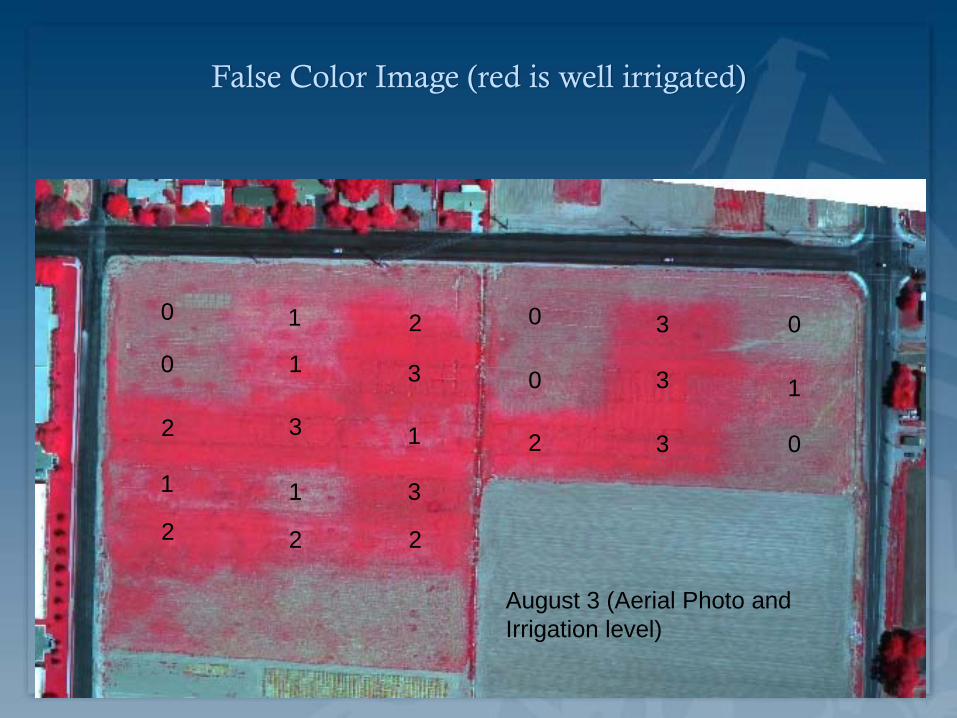
False Color Image (red is well irrigated)
August 3 (Aerial Photo and Irrigation level)
0
0
2
1
2
0
0
0
0
2 2
2 2 3
3
3
3
3
3
1
1
1
1
1
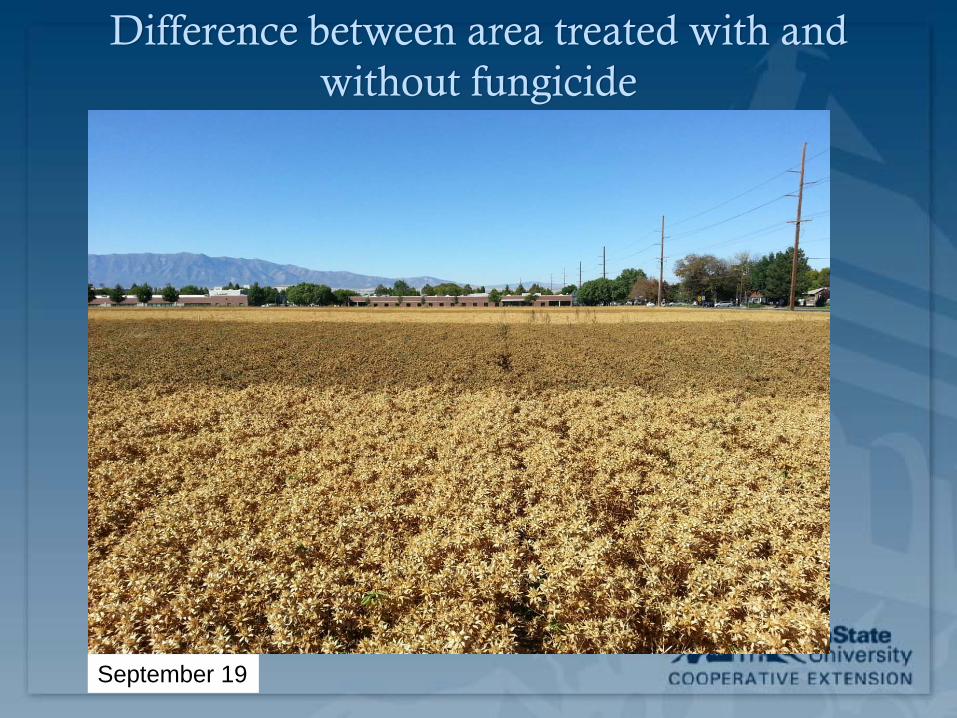
Difference between area treated with and without fungicide
September 19
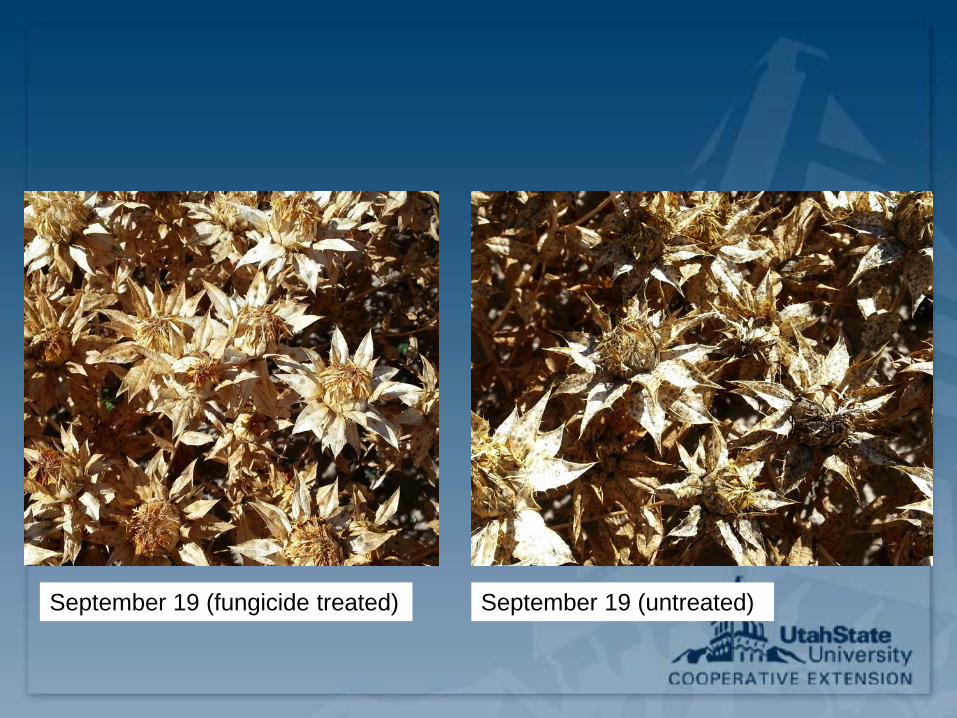
September 19 (fungicide treated) September 19 (untreated)
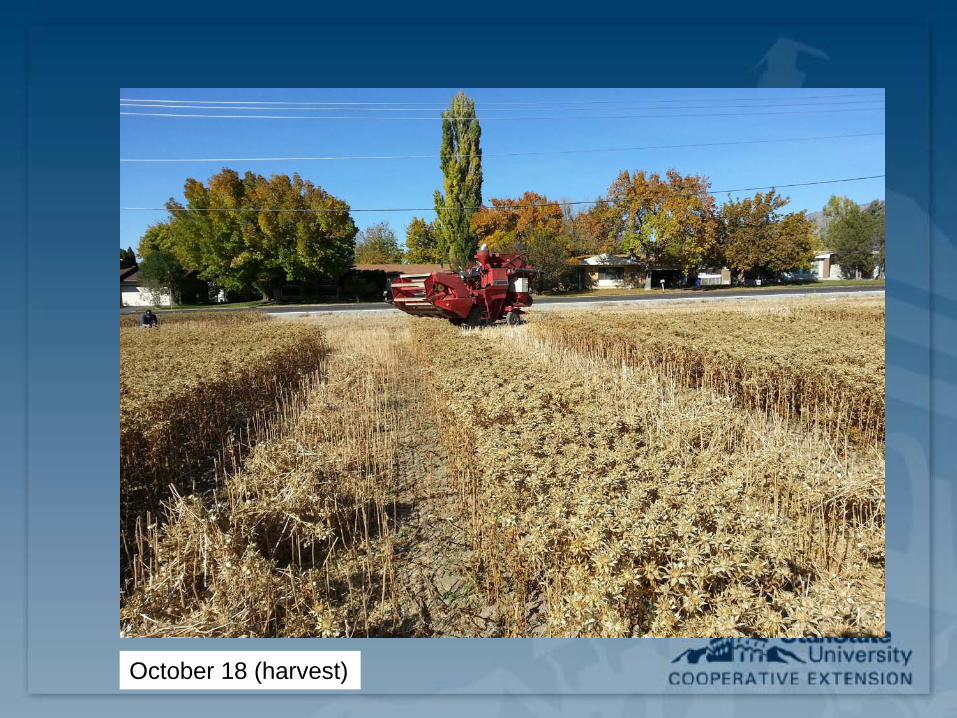
October 18 (harvest)
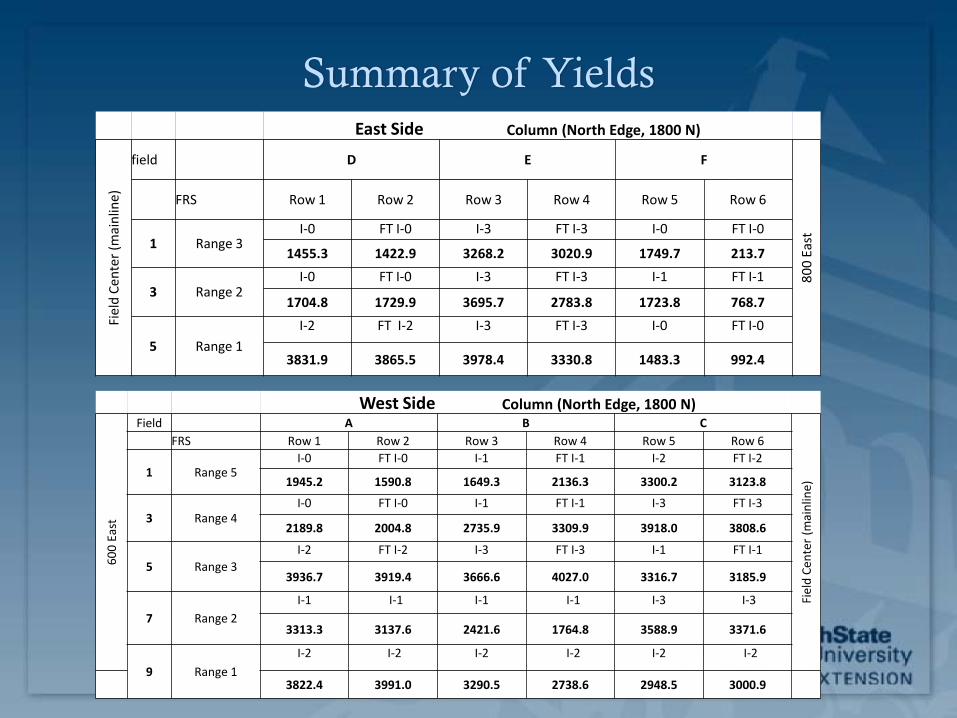
Summary of Yields East Side Column (North Edge, 1800 N)
Fiel
d Ce
nter
(mai
nlin
e)
field D E F
800
East
FRS Row 1 Row 2 Row 3 Row 4 Row 5 Row 6
1 Range 3 I-0 FT I-0 I-3 FT I-3 I-0 FT I-0
1455.3 1422.9 3268.2 3020.9 1749.7 213.7
3 Range 2 I-0 FT I-0 I-3 FT I-3 I-1 FT I-1
1704.8 1729.9 3695.7 2783.8 1723.8 768.7
5 Range 1 I-2 FT I-2 I-3 FT I-3 I-0 FT I-0
3831.9 3865.5 3978.4 3330.8 1483.3 992.4
West Side Column (North Edge, 1800 N)
600
East
Field A B C
Fiel
d Ce
nter
(mai
nlin
e)
FRS Row 1 Row 2 Row 3 Row 4 Row 5 Row 6
1 Range 5 I-0 FT I-0 I-1 FT I-1 I-2 FT I-2
1945.2 1590.8 1649.3 2136.3 3300.2 3123.8
3 Range 4 I-0 FT I-0 I-1 FT I-1 I-3 FT I-3
2189.8 2004.8 2735.9 3309.9 3918.0 3808.6
5 Range 3 I-2 FT I-2 I-3 FT I-3 I-1 FT I-1
3936.7 3919.4 3666.6 4027.0 3316.7 3185.9
7 Range 2 I-1 I-1 I-1 I-1 I-3 I-3
3313.3 3137.6 2421.6 1764.8 3588.9 3371.6
9 Range 1 I-2 I-2 I-2 I-2 I-2 I-2
3822.4 3991.0 3290.5 2738.6 2948.5 3000.9
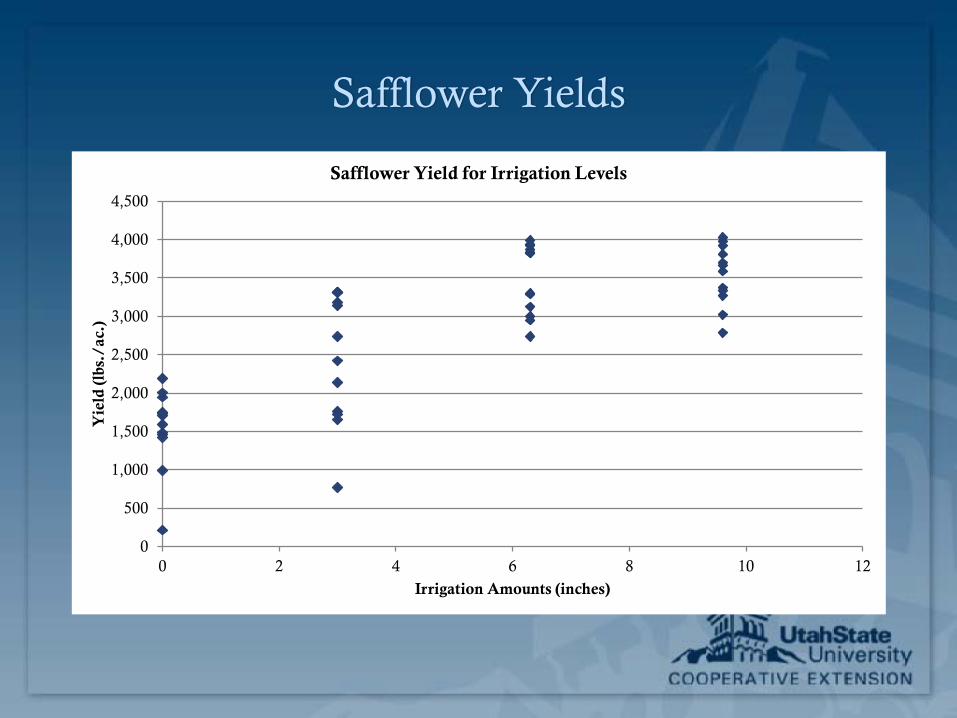
Safflower Yields
0
500
1,000
1,500
2,000
2,500
3,000
3,500
4,000
4,500
0 2 4 6 8 10 12
Yie
ld (l
bs./
ac.)
Irrigation Amounts (inches)
Safflower Yield for Irrigation Levels
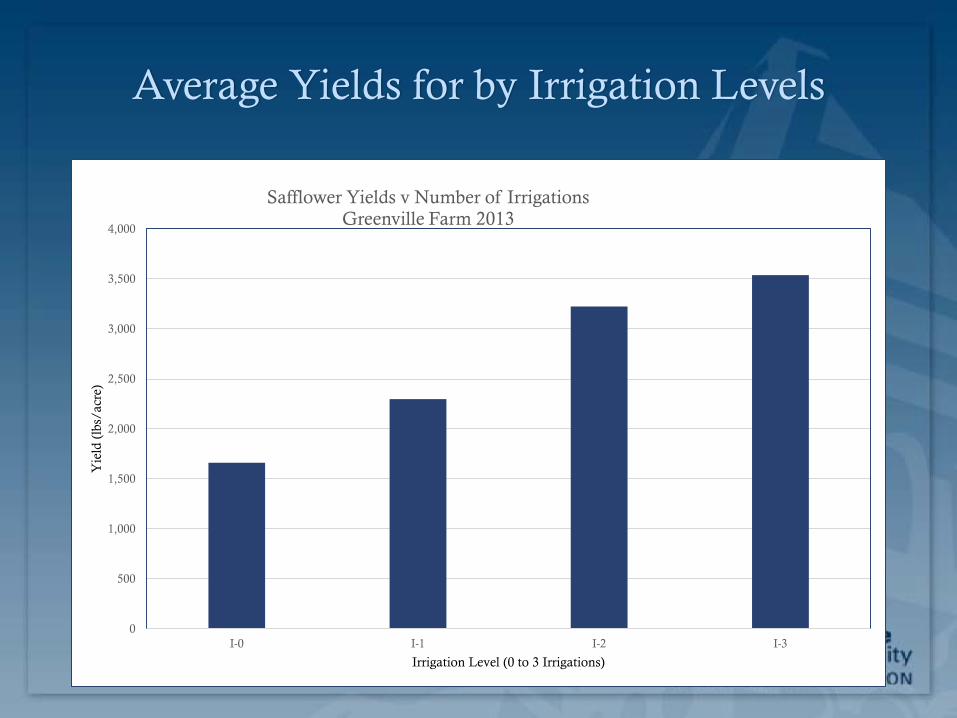
Average Yields for by Irrigation Levels
0
500
1,000
1,500
2,000
2,500
3,000
3,500
4,000
I-0 I-1 I-2 I-3
Yie
ld (
lbs/
acre
)
Irrigation Level (0 to 3 Irrigations)
Safflower Yields v Number of Irrigations Greenville Farm 2013
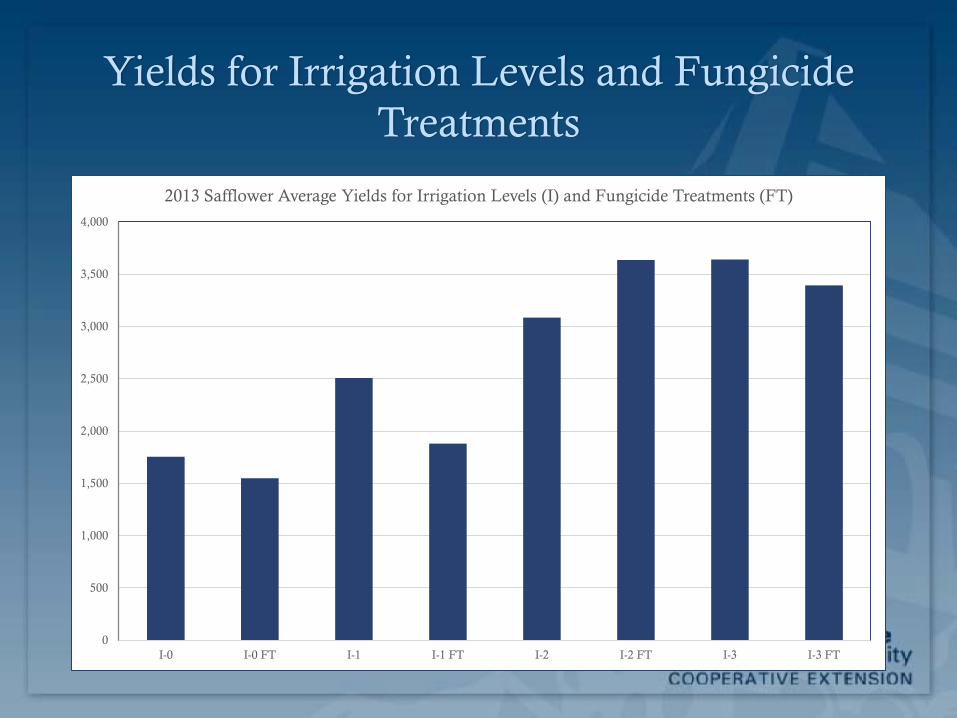
Yields for Irrigation Levels and Fungicide Treatments
0
500
1,000
1,500
2,000
2,500
3,000
3,500
4,000
I-0 I-0 FT I-1 I-1 FT I-2 I-2 FT I-3 I-3 FT
2013 Safflower Average Yields for Irrigation Levels (I) and Fungicide Treatments (FT)
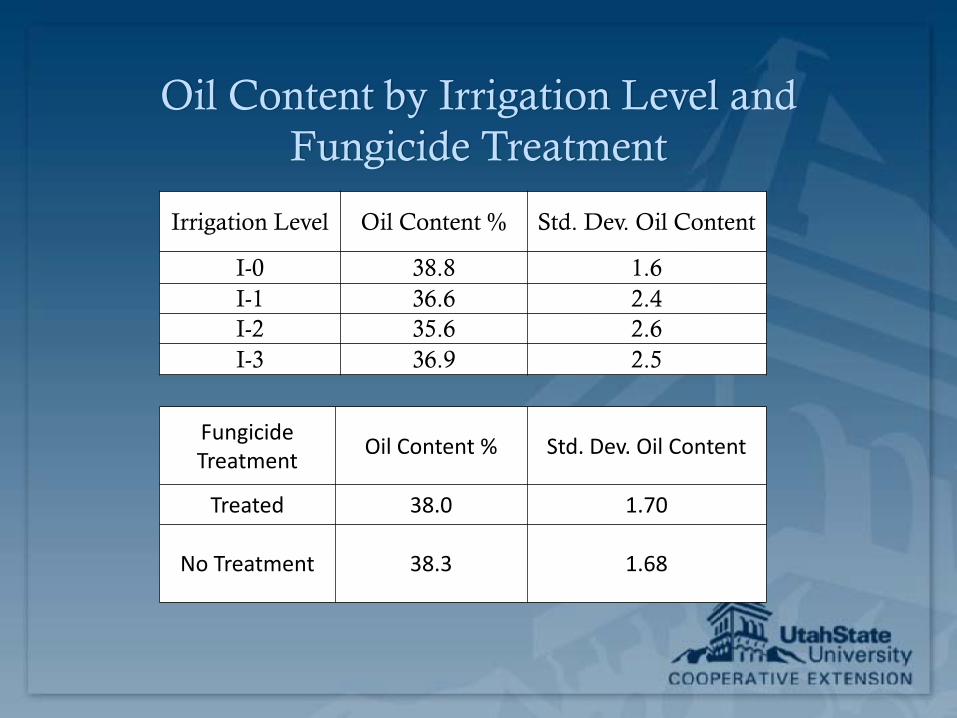
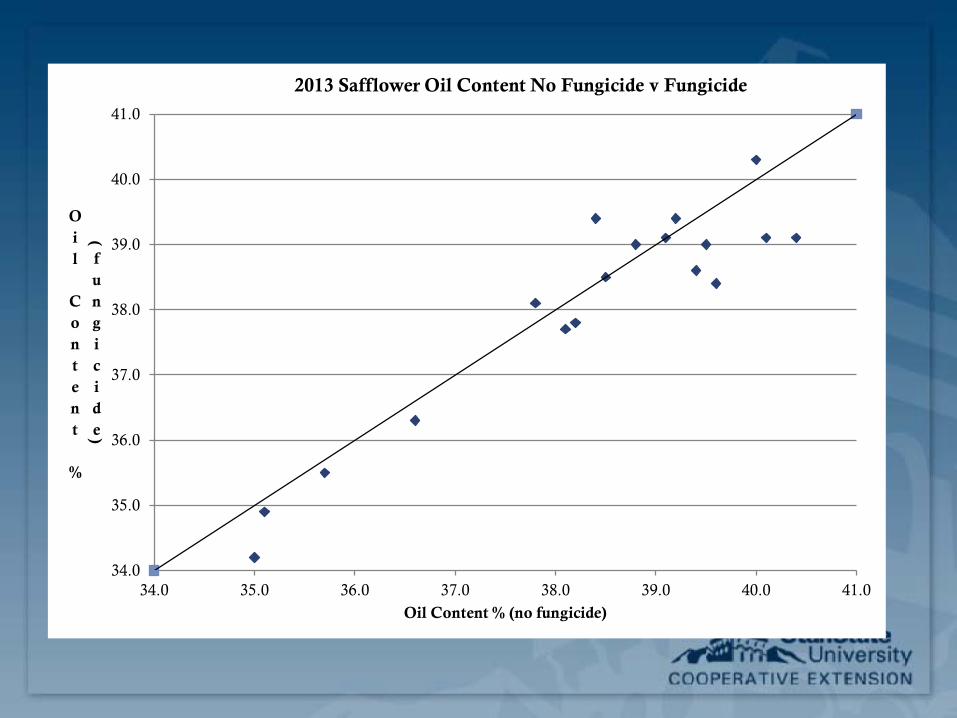
Oil Content by Irrigation Level and Fungicide Treatment
Fungicide Treatment
Oil Content % Std. Dev. Oil Content
Treated 38.0 1.70
No Treatment 38.3 1.68
Irrigation Level Oil Content % Std. Dev. Oil Content
I-0 38.8 1.6 I-1 36.6 2.4 I-2 35.6 2.6 I-3 36.9 2.5
34.0
35.0
36.0
37.0
38.0
39.0
40.0
41.0
34.0 35.0 36.0 37.0 38.0 39.0 40.0 41.0
Oil
Content
%
(
fungicide)
Oil Content % (no fungicide)
2013 Safflower Oil Content No Fungicide v Fungicide
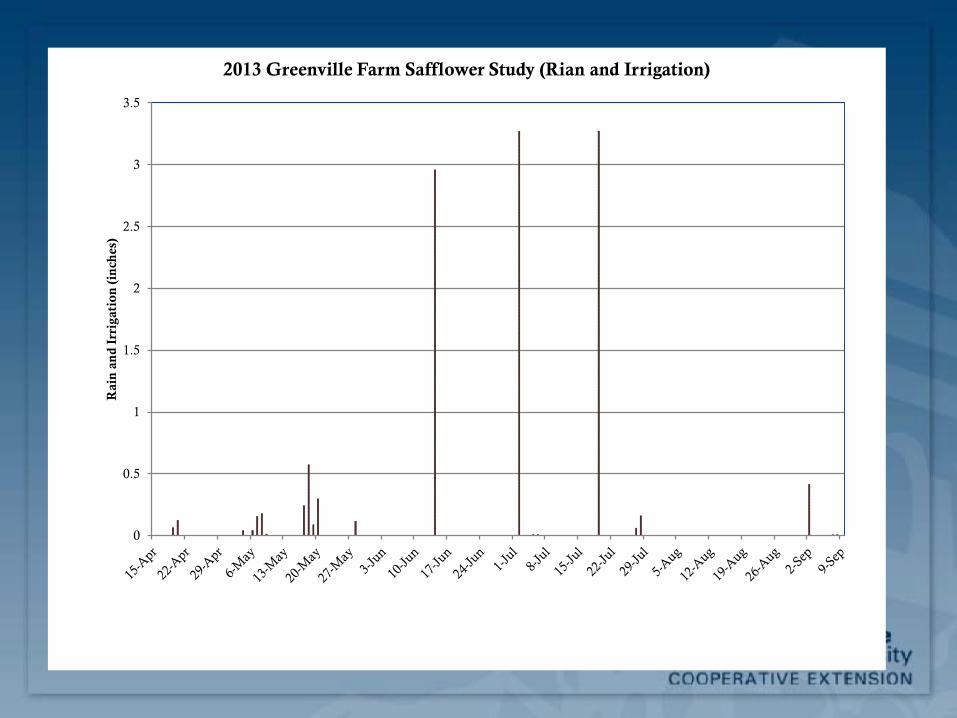
2013 Greenville Farm Rain and Irrigation
0
0.5
1
1.5
2
2.5
3
3.5 R
ain
an
d Ir
riga
tion
(in
ches
)
2013 Greenville Farm Safflower Study (Rian and Irrigation)
0
2
4
6
8
10
12
14
16
18
20 E
T (
in.)
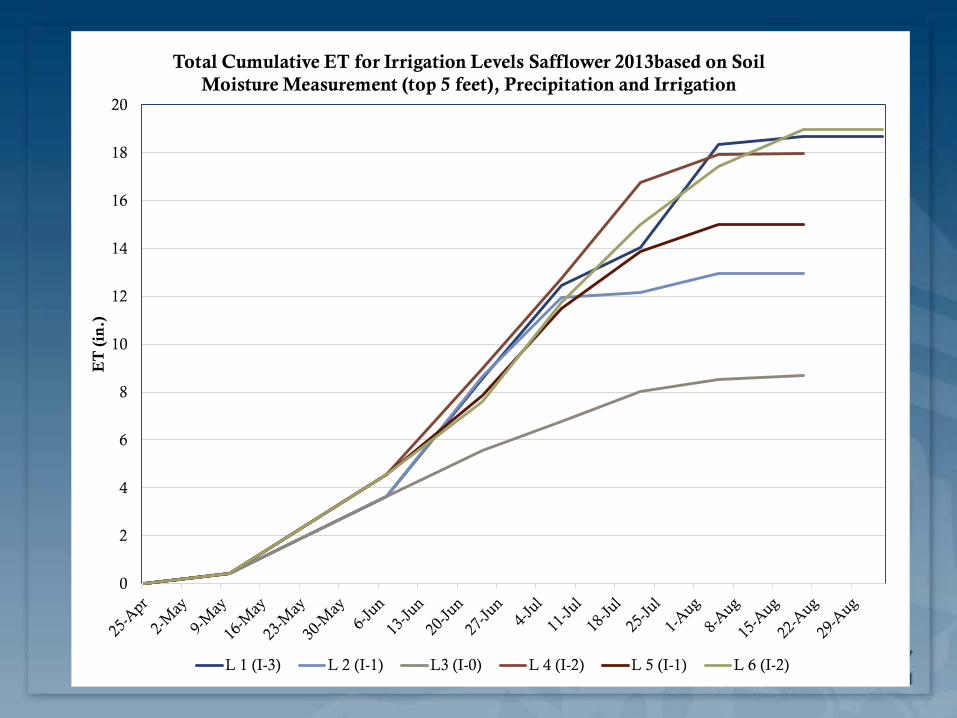
Total Cumulative ET for Irrigation Levels Safflower 2013based on Soil Moisture Measurement (top 5 feet), Precipitation and Irrigation
L 1 (I-3) L 2 (I-1) L3 (I-0) L 4 (I-2) L 5 (I-1) L 6 (I-2)

Safflower Seasonal Soil Water Depletion in top 5 feet (2013)
Location No. Irrigations Soil Water
Depletion (in.) ET
(in.)
1 - E 3 6.27 18.68
2 - E 1 7.89 12.94
3 - E 0 6.65 8.68
4 - W 2 9.71 17.97
5 - W 1 8.85 15.01
6 - W 2 9.79 18.96
E is located on East side of mainline
W is located on West side of mainline
Precipitation May 1 - August 31 (2.02 inches)
Precipitation May 1 - May31 (1.77 inches)
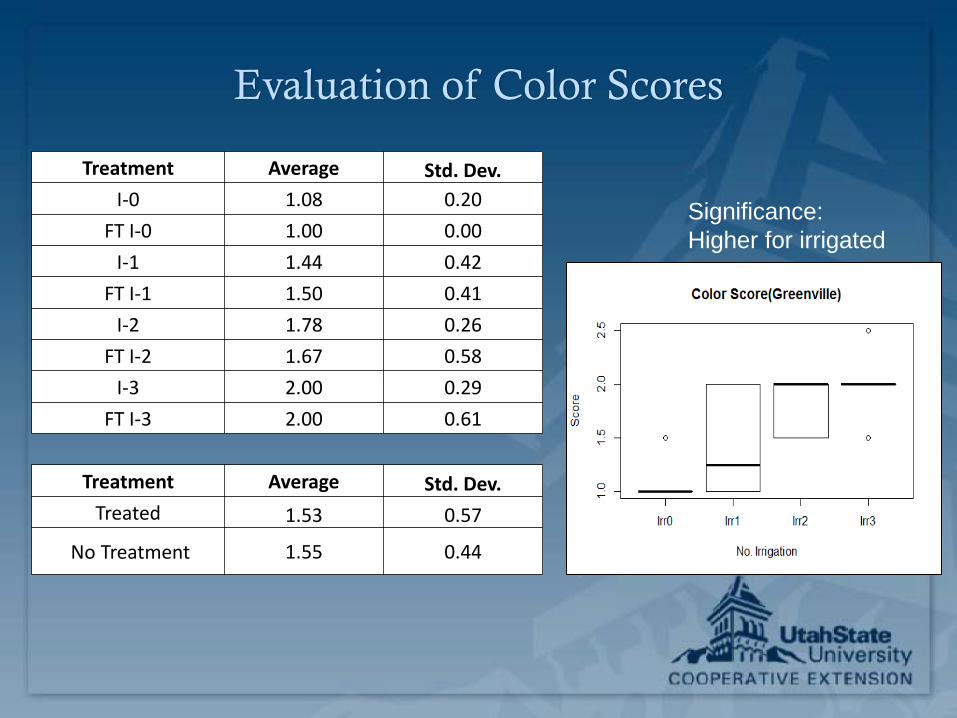
Evaluation of Color Scores
Treatment Average Std. Dev. I-0 1.08 0.20
FT I-0 1.00 0.00
I-1 1.44 0.42
FT I-1 1.50 0.41
I-2 1.78 0.26
FT I-2 1.67 0.58
I-3 2.00 0.29
FT I-3 2.00 0.61
Treatment Average Std. Dev. Treated 1.53 0.57
No Treatment 1.55 0.44
Significance: Higher for irrigated
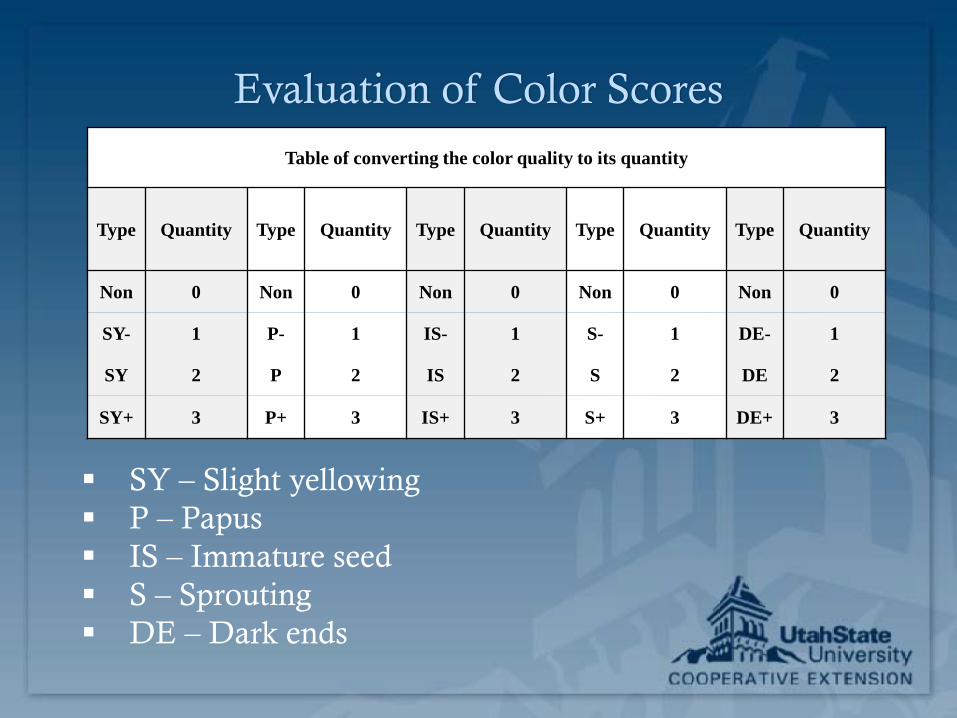
Evaluation of Color Scores
SY – Slight yellowing P – Papus IS – Immature seed S – Sprouting DE – Dark ends
Table of converting the color quality to its quantity
Type Quantity Type Quantity Type Quantity Type Quantity Type Quantity
Non 0 Non 0 Non 0 Non 0 Non 0
SY- 1 P- 1 IS- 1 S- 1 DE- 1
SY 2 P 2 IS 2 S 2 DE 2
SY+ 3 P+ 3 IS+ 3 S+ 3 DE+ 3

Evaluation of Slight Yellowing Treatment Average Std. Dev.
I-0 0.00 0.00 FT I-0 0.00 0.00
I-1 1.00 0.93 FT I-1 0.50 0.58
I-2 0.78 0.97 FT I-2 0.67 1.15
I-3 1.29 1.25 FT I-3 2.00 0.71
Treatment Average Std. Dev.
Treated 0.82 1.01
No Treatment 0.77 1.00
Significance: More yellowing for irrigated
Without Treatment

Evaluation of Papus Treatment Average Std. Dev.
I-0 1.50 0.84
FT I-0 1.60 0.89
I-1 0.88 0.99
FT I-1 0.25 0.50
I-2 0.11 0.33
FT I-2 0.67 1.15
I-3 0.29 0.76
FT I-3 0.40 0.89
Treatment Average Std. Dev.
Treated 0.76 0.97
No Treatment 0.61 0.89
Significance: Highest for non-irrigated.
Without Treatment
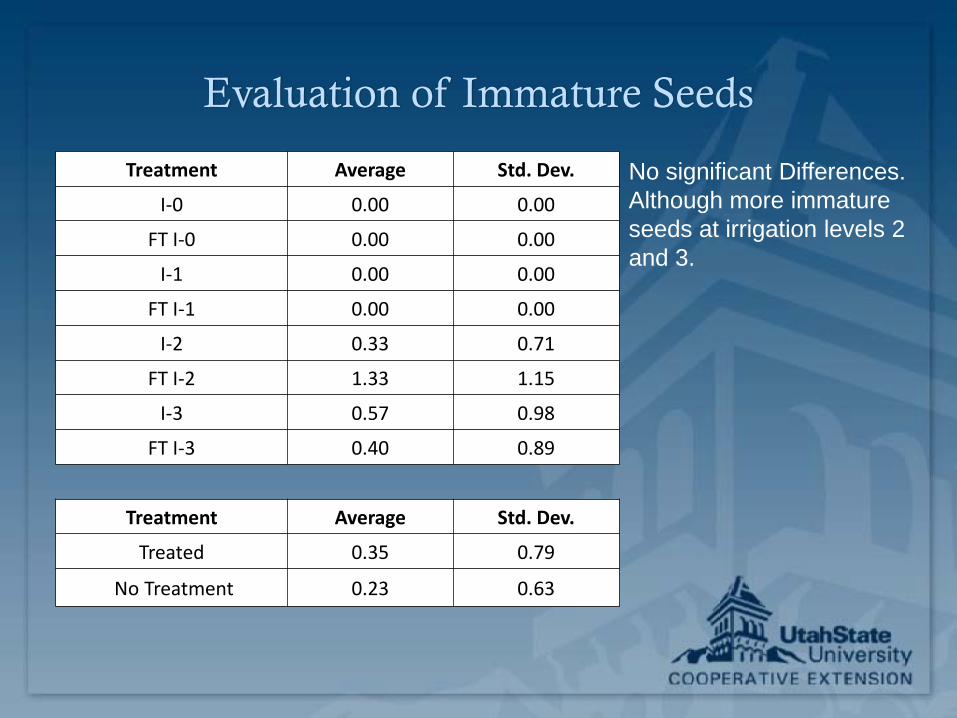
Evaluation of Immature Seeds
Treatment Average Std. Dev.
I-0 0.00 0.00
FT I-0 0.00 0.00
I-1 0.00 0.00
FT I-1 0.00 0.00
I-2 0.33 0.71
FT I-2 1.33 1.15
I-3 0.57 0.98
FT I-3 0.40 0.89
Treatment Average Std. Dev.
Treated 0.35 0.79
No Treatment 0.23 0.63
No significant Differences. Although more immature seeds at irrigation levels 2 and 3.
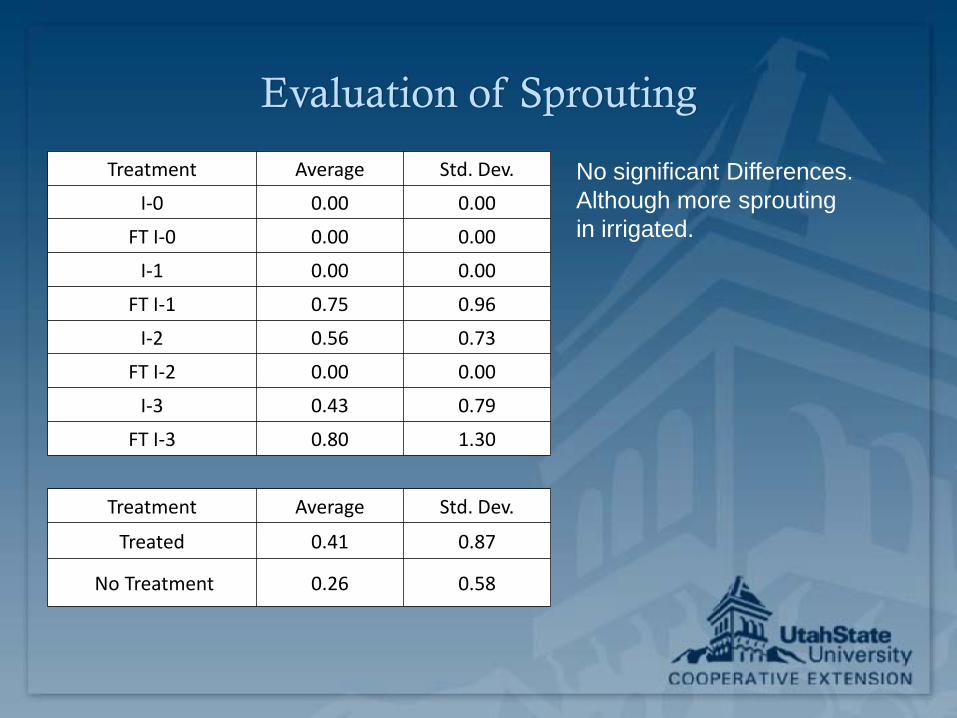
Evaluation of Sprouting
Treatment Average Std. Dev.
I-0 0.00 0.00
FT I-0 0.00 0.00
I-1 0.00 0.00
FT I-1 0.75 0.96
I-2 0.56 0.73
FT I-2 0.00 0.00
I-3 0.43 0.79
FT I-3 0.80 1.30
Treatment Average Std. Dev.
Treated 0.41 0.87
No Treatment 0.26 0.58
No significant Differences. Although more sprouting in irrigated.
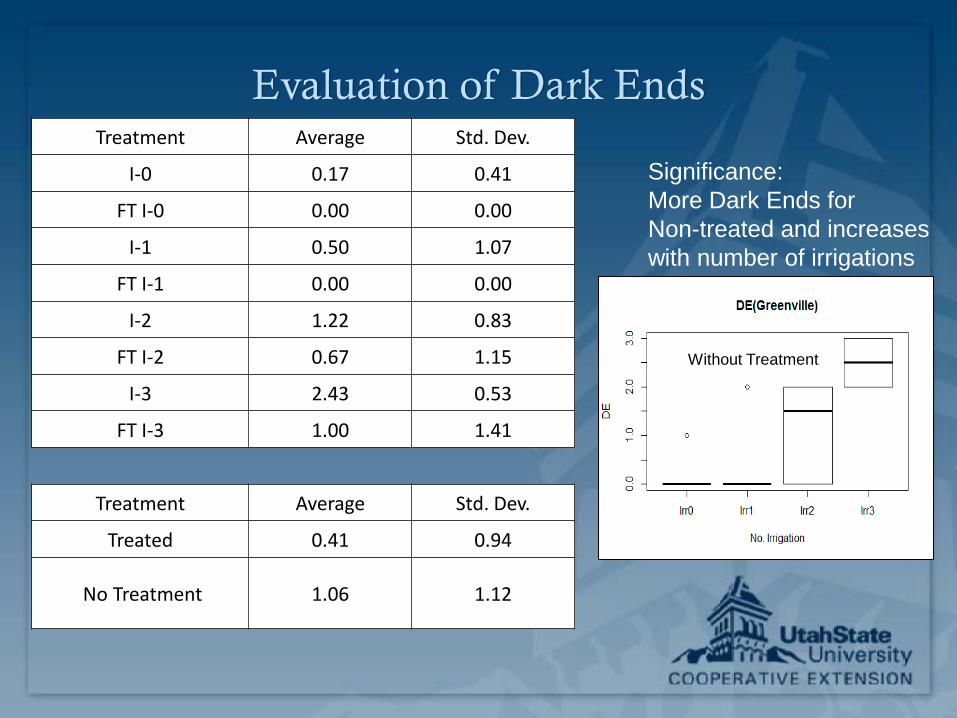
Evaluation of Dark Ends Treatment Average Std. Dev.
I-0 0.17 0.41
FT I-0 0.00 0.00
I-1 0.50 1.07
FT I-1 0.00 0.00
I-2 1.22 0.83
FT I-2 0.67 1.15
I-3 2.43 0.53
FT I-3 1.00 1.41
Treatment Average Std. Dev.
Treated 0.41 0.94
No Treatment 1.06 1.12
Significance: More Dark Ends for Non-treated and increases with number of irrigations
Without Treatment
Summary
The number of irrigations made effected the yields with a high significance level. There was the least difference in yield moving from 2 to 3 irrigations.
The alternaria leaf spot disease was not a significant factor in the yield.
The fungicide treatment resulted in improvement of slight yellowing and dark ends.
In 2013 there was very little rain in June, July, and August while the was maturing. The results could change during a year with higher precipitation.


![Pos Ine Ftiagmeno to Anthropino on[Papus]](https://img.pdfslide.us/doc/110x75/5695d0521a28ab9b0291fdf8/pos-ine-ftiagmeno-to-anthropino-onpapus.jpg)