Embed Size (px)
Citation preview

1
2013 Research Agenda: Australian Universities International Directors’ Forum
Presentation to Australian International Education Conference
Alan Olsen, Director, Strategy Policy and Research in Education P/L 9 October 2013
Introduction The Australian Universities International Directors’ Forum (AUIDF) is a forum for International Directors in 38 Australian universities. This paper presents the research agenda of AUIDF in 2013, covering three studies
Benchmarking Australian University International Operations 2012, involving 37
members of Universities Australia, covering 85,538 commencing international students. The study has been conducted from 2002 to 2012; this session will include time series
Benchmarking from the Public Domain, analysis of data on numbers of students in
Australian universities from Australia’s Department of Education in 2012.
Outgoing International Mobility of Australian University Students 2012, a stocktake
and benchmarking of outgoing international study experiences of students in Australian universities in 2012 by type of experience, domestic or international, level of study, gender, duration of experience, field of education and destination. The research includes analysis of the relationship between funding and participation in outgoing mobility. The methodology developed in Australia for measuring access to mobility, the number of international study experiences in a year as a proportion of the number of completing undergraduates in that year, has been adopted by Open Doors.
Benchmarking Australian University International Operations
AUIDF has been carrying out these benchmarking studies since 2002. 29 universities participated in 2002, 33 in 2003, 34 in 2004 and 2005, 36 in 2006 and 2007, 37 in 2008 and 2009, 38 in 2010, 37 in 2011 and 38 in the 2012 study which was carried out in 2013. The population has increased from 57,000 commencing students in 2002 to 85,500 commencing students in 2011. Benchmarking at its simplest is a means of comparing one’s performance with that of one’s peers. For an education institution, it is the collection of information about an aspect of the institution’s operations in a way that enables comparisons to be made with other institutions. The results of the comparison can then highlight areas where improvements are needed, where the institution can learn from others and where problems have to be investigated. The focus of the research is on international students on campus in Australia. The research scope does not include international students in off-campus/distance/flexible mode, and does not include international students at offshore campuses. Each participating university receives an individual report and, in each individual report, individual responses are highlighted. Each individual report is different and no participant’s individual responses are reported to any other participant. For the benchmarking of international operations, a questionnaire was distributed to Australian universities in March 2013, seeking 2012 data, in ten areas

2
Costs of International Offices
Staffing of international marketing, enquiries, admissions and compliance
International admissions policies, procedures and quotas
International student services
International student mobility
Costs of recruiting international students from source countries
Conversion rates from applications to offers to commencements
Structure of International Offices
Scholarships provided by universities to international students
Accommodation provided by universities for international students. Universities were invited to participate in all ten aspects, or to cherrypick those aspects where they wished to participate. 37 universities participated in the study. Results were distributed to universities in June 2013. Members of AUIDF have agreed that some of the high level findings in the report can be provided to this Conference. The 37 participating universities reported 85,538 commencing international students, a large population that makes the study compelling. International Office Costs
37 universities reported on both International Office costs and income from international on campus student fees, using actual or estimate figures for 2012. Universities are able to benchmark their performance with that of their peers comparing International Office costs as a proportion of international student fee income. The 37 universities reported aggregate income from international on campus student fees in 2012 of $3.857 billion, from $3.892 billion in 37 universities in 2011, $3.642 billion in 38 in 2010 and $3.065 billion in 37 in 2009. International Office budgets, excluding commissions, aggregated in 2012 to $226.2 million or 5.9% of income. Commissions aggregated to $142.3 million or 3.7% of income. Costs devolved to faculties aggregated to $25.3 million or 0.7% of income. The costs of international operations in 2012, including international office costs, commissions and devolved costs, aggregated to $393.8 million or 10.2% of revenue, from 10.3% in 2011, 10.7% in 2010 and 10.7% in 2009. Chart 1 shows Cost % Including Devolved Costs. It shows the range of the 37 responses,
the average of the 37 responses (14.1%) and the median response (12.5%).
Chart 1 Cost % Including Devolved Costs
14.1%12.5%
0% 10% 20% 30% 40%

3
Across the 37 universities, the aggregate cost of recruiting a student, including commissions and devolved costs, was 10.2% but, among the 37 universities, the average of the responses was 14.1% and the median was 12.5%. As shown in Chart 2 Size of International Student Program and International Office Costs %, there appear to be some economies of scale.
Chart 2 Size of International Student Program and International Office Costs %
0%
5%
10%
15%
20%
25%
30%
35%
40%
45%
50%
$0 $50 $100 $150 $200 $250 $300 $350
Co
st %
incl
Co
mm
issi
on
s an
d D
evo
lved
Revenue $ million
Charts 1 and 2 provide data on costs of international operations as a proportion of international revenue. Because international revenue is a function of pipeline and duration, measures of international costs as a proportion of revenue also are a function of pipeline and duration. To minimise the effects of pipeline and duration, costs of international operations, including commissions and devolved costs, have been analysed as costs per commencement. 37 universities were able to report both International Office costs and numbers of commencing students in 2012, enabling benchmarking of costs per commencement. The 37 universities reported 85,538 commencements in 2012. International Office budgets, excluding commissions, aggregated in 2012 to $226.2 million or $2,645 per commencement, from $2,455 in 2011, $2,121 in 2010 and $1,746 in 2009. Commissions in 2012 aggregated to $142.3 million or $1,664 per commencement, from $1,444 in 2011, $1,395 in 2010 and $1,219 in 2009. Devolved costs amounted to $25.3 million or $296 per commencement, from $251 in 2011, $194 in 2010 and $165 in 2009.

4
The costs of international operations in 2012 aggregated to $293.8 million or $4,604 per commencement, from $4,149 in 2011, $3,710 in 2010 and $3,155 in 2009. Across the 37 universities, the aggregate cost of recruiting a student, including commissions and devolved costs, was $4,604. Among the 37 universities, the average of the responses was $4,769 and the median was $4,899. As shown in Chart 3 Number of Starters and $ Cost per Starter, with duration and pipeline
excluded, economies of scale are less obvious.
Chart 3 Number of Starters and $ Cost per Starter
$0
$1,000
$2,000
$3,000
$4,000
$5,000
$6,000
$7,000
$8,000
0 1,000 2,000 3,000 4,000 5,000 6,000$ C
ost
per
Sta
rter
incl
Co
mm
issi
on
s an
d D
evo
lved
Number of Commencements
Proportion of Starts through Agents Thirty-three universities reported both the number of commencements in 2012 and the number of commencements through agents, enabling benchmarking of the proportion of students through agents. The 33 universities reported 81,377 commencements in 2012, with 51,523 commencements or 63.3% through agents. Chart 4 Number of Starters and % Starts through Agents explores the relationship
between numbers of commencements and proportion through agents and suggests that the larger international student programs use agents for about the same proportions of students as the smaller international student programs.

5
Chart 4 Number of Starters and % Starts through Agents
0%
20%
40%
60%
80%
100%
0 1,000 2,000 3,000 4,000 5,000 6,000
% S
tart
s w
ith
Co
mm
issi
on
Commencements
Staffing
37 universities reported an aggregate 552.1 staff in 2012 dedicated to marketing, and an aggregate 85,538 commencing international students. In aggregate, it takes 6.5 marketing staff to achieve 1,000 international commencements, from 5.4 in 2011, 4.4 in 2010 and 4.4 in 2009. 37 universities reported an aggregate 526.6 staff in 2012 dedicated to admissions, and an aggregate 85,538 commencing international students. In aggregate, it takes 6.2 admissions staff to achieve 1,000 commencements, from 5.6 in 2011, 4.9 in 2010 and 4.7 in 2009. Costs of Recruitment for Key Source Countries If salaries, publications and scholarships are regarded as fixed costs that do not vary across countries, then commissions, travel, advertising and marketing, exhibitions, freight and the costs of office(r)s overseas are country costs that do vary across countries. Commissions, travel, advertising and marketing, exhibitions, freight and the costs of office(r)s overseas in aggregate provide a country cost of recruiting students from that country. Importantly Australia is a source country. In total 28 universities responded. For these 28 universities, the country costs aggregated to $136.7 million, including $99.9 million in commissions. The 28 universities recruited 64,575 international students in 2012 at a country cost of $2,118 per student, from $1,807 in 2011, $1,822 in 2010 and $1,598 in 2009. This country cost in 2012 included commission of $1,547, from $1,371 in 2011 $1,377 in 2010 and $1,203 in 2009.

6
Table 1 Source Regions shows the regions from which students were recruited. Included in
the total for Europe are 2,413 students recruited from European Union countries.
Table 1 Source Regions
Source Region Number of Commencements
Australia 17,570 North East Asia 18,526 South East Asia 10,397 South/Central Asia 5,158 Americas 5,362 Europe 3,684 Middle East/North Africa 2,315 Sub Saharan Africa 900 Oceania 407 Unknown 256 Total 64,575
For all 28 universities in aggregate, Chart 5 displays Country Cost of Recruitment by Source Country. It shows the country cost of recruitment, including commission cost, for
each of the top 35 source countries/regions in the study, in order of the size of the country/region as a source country/region.
Chart 5 Country Cost of Recruitment by Source Country
$0
$500
$1,000
$1,500
$2,000
$2,500
$3,000
$3,500
$4,000
$4,500
$5,000

7
For all 28 universities in aggregate, Chart 6 shows Cost and Yield: Country Cost and Number of Commencements for the top 17 source countries/regions, those that were the sources of more than 500 students in 2012. In Chart 6, the countries in the bottom right hand quadrant are those which are large source countries for Australia with relatively low country costs. Ideally, all source countries would be in the bottom right hand quadrant with Australia and, more or less, China.
Chart 6
Cost and Yield: Country Cost and Number of Commencements
Australia
China
India
Malaysia
US
Singapore
Thailand
Canada
BangladeshHK
GermanyPakistan
Vietnam
Indonesia
Sth Korea
Sri Lanka
Norway
$0
$400
$800
$1,200
$1,600
$2,000
$2,400
$2,800
$3,200
$3,600
$4,000
0 5,000 10,000 15,000 20,000
Recruitment Channels and Conversion: Applications/Offers/Commencements
Universities were invited to benchmark conversion rates, from numbers of applicants to numbers of students offered to numbers of commencements, by level of study, or by recruitment channel or by both level and channel. In total, 32 universities provided data for 2012 by level of study, enabling, for each level of study, benchmarking of conversion from applicants to offers, conversion from offers to commencements and conversion from applications to commencements. In aggregate, at all levels in these 32 universities, 311,701 applications resulted in 223,034 offers and 73,128 commencements. Overall, 71.6% of applicants received an offer, 32.8% of those who received an offer commenced and, as a function of those two results, 23.5% of applicants commenced. Conversion rates since data collection commenced have been relatively stable. In 2012, universities processed 4.3 applications to obtain a commencement, compared with 3.9 in 2011, 4.0 in 2010, 4.1 in 2009, 4.1 in 2008, 3.8 in 2007, 4.0 in 2006, 3.8 in 2005, 4.0 in 2004, 4.2 in 2003 and 4.0 in 2002. Chart 7 All Levels Starts/Applications %: Time Series displays time series from 2002 to
2012 in the proportion of applicants who commence.

8
Chart 7 All Levels Starts/Applications %: Time Series
0%
5%
10%
15%
20%
25%
30%
2002 2003 2004 2005 2006 2007 2008 2009 2010 2011 2012
Median
Average
Aggregate
Scholarships
Universities were invited to provide data on the scholarships they offered to international students. The survey was limited to scholarships (full or partial), fee waivers and stipends that were
funded fully by the university, from non-government sources, or by donations that are totally at the discretion of the university
available only to international students
offered at the commencement of the student’s degree program. The survey did not cover
scholarships/stipends for study in transnational education programs
scholarships/stipends also available to domestic students, such as sports scholarships
scholarships or travel grants for outgoing mobility
prizes or awards provided after commencement of degree study in Australia
preparatory program scholarships/stipends
scholarships/stipends funded by government or other external funding bodies. Thirty-one universities reported spending $291.8 million on scholarships and stipends for commencing international students in 2012, including $267.5 million on scholarships and stipends for commencing international postgraduate research students in 2012. These 30 universities earned $3.456 billion in revenue from international students in 2012. In aggregate, these 31 universities in 2012 re-invested 8.5% of their international student revenue in scholarships for commencing international students, including 7.8% of international student revenue on scholarships for commencing international postgraduate research students. 8.5% and 7.8% are big numbers, higher than the 3.7% spent by universities on commissions. Chart 8 Proportion of Revenue on Postgraduate Research Scholarships shows the
range of responses from 31 universities, the average of the 31 responses (12.3%) and the median response (6.5%).

9
Chart 8 Proportion of Revenue on Postgraduate Research Scholarships
12.3%6.5%
0% 20% 40% 60% 80% 100% 120% 140%
Benchmarking from the Public Domain The Australian government releases data annually from the higher education statistics collection. From these statistics, from the public domain, it is possible to benchmark for all universities a number of measures of universities’ international student programs. The Department of Education in July 2013 released data on international student numbers in Australian higher education providers in 2012. This analysis edits that data to include only the 39 Australian universities In the 39 universities, there were 209,906 international students onshore in Australia in 2012. The range among the 39 universities was from 381 students to 13,241 students as in Chart 9 Numbers of International Students in Australian Universities 2012: Onshore. The median university had 4,986 international students onshore in Australia, from 4,788 in 2011, 4,732 in 2010, 4,205 in 2009, 3,615 in 2008, 3,328 in 2007, 3,495 in 2006 and 3,327 in 2005.
Chart 9 Numbers of International Students in Australian Universities 2012: Onshore
4,986
In the 39 universities, the 209,906 international students, onshore in Australia in 2012, made up 19.1% of the 1,098,469 students, onshore in Australia in 2012, in the 39 universities, from 20.6% in 2011, 21.3% in 2010, 21.1% in 2009, 20.3% in 2008, 19.4% in 2007, 19.1% in 2006 and 18.6% in 2005. The range among the 39 universities was from 3.7% to 44.0% as in Chart 10 Proportions of International Students in Australian Universities 2011: Onshore. The figure in the median university was 17.3%, from 19.6% in 2011, 19.8% in 2010, 18.9% in 2009, 18.5% in 2008, 17.1% in 2007, 16.3% in 2006 and 15.4% in 2005.

10
Chart 10 Proportions of International Students in Australian Universities 2011: Onshore
17.3%
0% 10% 20% 30% 40% 50%
To put into international perspective the size of Australia’s international student program, Chart 11 OECD Undergraduates, from analysis of OECD’s Education at a Glance 2013, is
about undergraduates only. Australia in 2011 had the highest proportion of international students among its university undergraduate population of any OECD economy.
Chart 11 OECD Undergraduates
21%
7%
0% 5% 10% 15% 20% 25%
AustraliaUnited Kingdom
Switzerland
Austria
New Zealand
Belgium
Germany
SwedenCanada
OECD averageDenmark
IrelandIceland
Hungary
NetherlandsFinland
Slovak RepublicUnited States
Japan
Portugal
Estonia
Spain
Slovenia
Norway
Poland
Chile
Across Australia, 30.1% of all postgraduate research students in 2012 were international, from 28.6% in 2011, 26.9% in 2010, 24.5% in 2009, 21.8% in 2008, 19.7% in 2007, 18.1% in 2006 and 17.1% in 2005.

11
The range among the 39 universities was from 4.7% to 46.0% as in Chart 12 Proportion of Postgraduate Research Students Who Are International. The figure in the median university in 2012 was 29.8%, from 28.6% in 2011, 27.0% in 2010, 23.1% in 2009, 20.3% in 2008, 18.9% in 2007, 17.9% in 2006 and 16.6% in 2005.
Chart 12
Proportion of Postgraduate Research Students Who Are International
29.8%
0% 10% 20% 30% 40% 50%
To put into international perspective Australia’s reliance on international higher degree by research students, Chart 13 OECD Advanced Research is from analysis of OECD’s
Education at a Glance 2013. Australia in 2011 had a higher proportion of international research students than the OECD average, a higher proportion than US but a lower proportion than UK.
Chart 13 OECD Advanced Research
31%
20%
0% 10% 20% 30% 40% 50% 60%
SwitzerlandUnited Kingdom
New Zealand
Netherlands
Australia
Belgium
United States
SwedenIreland
DenmarkCanada
AustriaIceland
OECD average
JapanSpain
FinlandPortugal
Slovenia
Slovak Republic
Germany
Estonia
Hungary
Norway
Chile
Poland

12
As in Chart 14 Proportions of International Students and International Research Students, the proportion of postgraduate research students who are international grew from 11.4% in 1998 to 30.1% in 2012, at the same time as the proportion of onshore students in Australian universities who are international grew from 8.3% to 19.1%. The Australian experience shows that it is possible to grow an international student program at the same time as an international postgraduate research student program. They are not mutually exclusive.
Chart 14 Proportions of International Students and International Research Students
0%
5%
10%
15%
20%
25%
30%
35%
1998 1999 2000 2001 2002 2003 2004 2005 2006 2007 2008 2009 2010 2011 2012
International % of Onshore Students - Australia
International % of Research Students - Australia
The Australian government publishes annually data on progress rates and attrition rates for commencing bachelor degree students for 37 universities. The standard for measuring academic performance in Australia is the student progress rate: how much of what I attempted did I pass? Commencing international bachelor students passed 84.68% of what they attempted in 2012, and did better than commencing domestic bachelor students, who passed 83.64%. In 2008, 2009, 2010 and 2011 there was no difference (less than one percentage point) between the progress rates for commencing international bachelor students and commencing domestic bachelor students. But in 2012, the international cohort did better, by a percentage point, as in Chart 15 Student Progress Rates: Time Series.

13
Chart 15 Student Progress Rates: Time Series
80%
81%
82%
83%
84%
85%
86%
87%
88%
89%
90%
2001 2002 2003 2004 2005 2006 2007 2008 2009 2010 2011 2012
Domestic
International
Aggregate
In 22 universities in 2012, from 23 in 2011, 22 in 2010 and 15 in 2009, commencing international undergraduates did better than domestic students. In nine universities in 2012, from 11 in 2011, 11 in 2010 and 15 in 2009, domestic students did better. In six universities, from three in 2011, four in 2010 and seven in 2009, there was no difference (less than one percentage point). We should interpret these results as showing that increasing numbers of Australian universities are setting entry standards for international undergraduates that lead to successful outcomes, are monitoring academic performance and are providing English language and study skills support. Outgoing International Mobility of Australian University Students
Universities in 2013 also benchmarked outgoing student mobility, seeking to quantify the international study experiences in 2012 of students at Australian universities. The AUIDF mobility study of 2012 in 2013 coincided with the AsiaBound Baseline Audit, supported by the Australian government through Universities Australia. In 38 Australian universities in 2012, 24,763 students at all levels undertook international study experiences, from 20,906 in 36 universities in 2011, 18,340 in 37 in 2010, 15,058 in 36 in 2009, 10,718 in 37 in 2007 Table 2 International Study Experiences 2012 by Type shows these 20,906 international
study experiences by type.

14
Table 2 International Study Experiences 2012 by Type
Type Number of Experiences
Exchange 7,813 Other Semester or Year Programs 513 Short Term Programs 8,570 Placements or Practical Training 3,707 Research 3,868 Other 292 Total 24,763
The key cohort of importance to universities is domestic undergraduates. How many Australian undergraduates have access to an international study experience during the undergraduate degree? In the 38 universities, 15,180 Australian undergraduate students undertook international study experiences in 2012. In the 38 universities, there were 115,181 domestic undergraduate completions in 2012. The number of international study experiences undertaken by Australian undergraduate students in 2012 was equivalent to 13.1% of domestic undergraduate completions in 2012, from 12.3% in 2011, 12.0% in 2010 and 8.8% in 2009, suggesting that 12.3% of completing Australian undergraduates in Australian universities undertake international study experiences. The figure for the average university in 2012 was 12.2%, the median was 12.0%. This Australian undergraduate access figure of 13.1% compares with 13.8% in US. Open Doors in 2012 reported that, in 2010/11, 13.8% of US undergraduates completing bachelor degrees studied abroad prior to graduation.
92.8% of all experiences were for credit, 1.6% were not for credit but recognised for purposes such as development of international skills and 5.6% were not for credit: 89.6% of short term study experiences were for credit, 79.7% of practical experiences were for credit. 74.1% of experiences were by undergraduates, 80.2% of experiences were by Australian (rather than international) students and 59.0% of experiences were undertaken by women. A 59:41 gender split means that 44% more women than men are undertaking international study experiences. Universities reported the field of education for 24,223 students with international study experiences in 2012. Health (18%), Society and Culture (15%) and Management and Commerce (14%) were the most commonly reported fields. Detail is at Attachment 1 International Study Experiences 2012: Fields of Education. Universities reported the destinations of 23,664 international study experiences. 35.0% went to Europe, (including 33.4% to EU countries), 33.2% went to Asia (including 15.8% to North East Asia, 12.8% to South East Asia and 4.6% to South Asia), 23.4% went to the Americas, 3.1% went to Oceania, 2.3% went to Sub Saharan Africa, and 1.2% went to Middle East/North Africa. Detail is at Attachment 2 International Study Experiences 2012: Destination Regions.
15
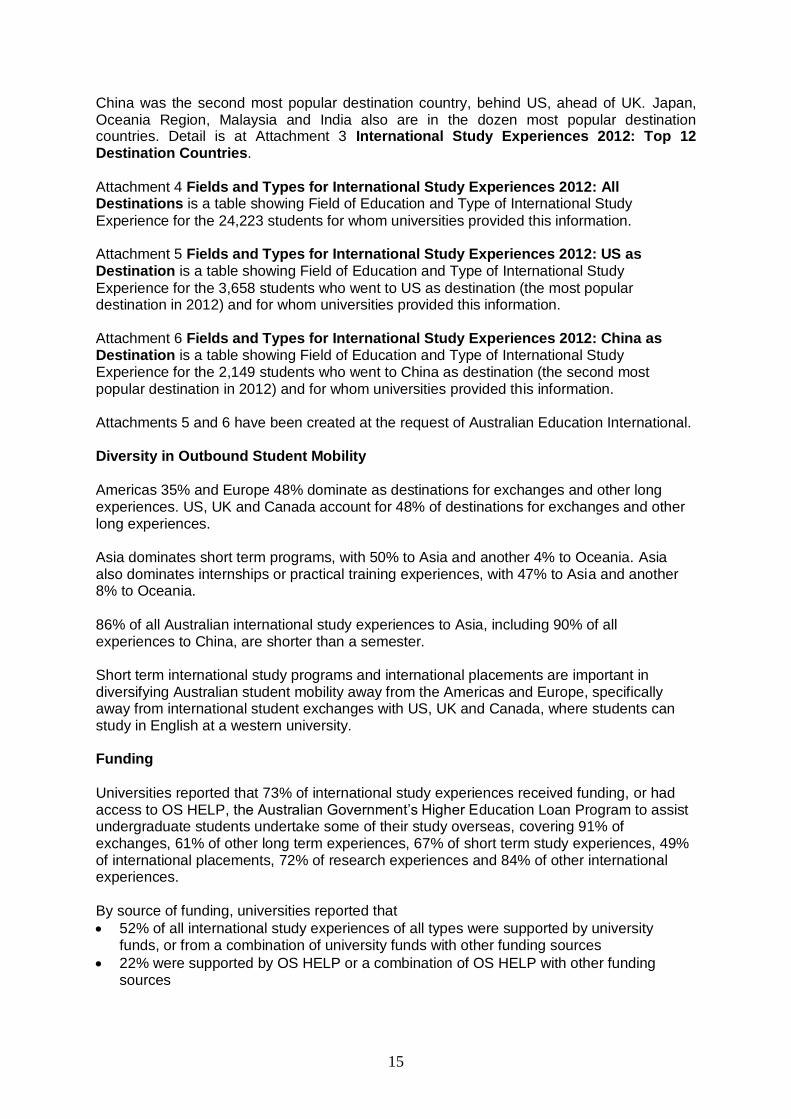
China was the second most popular destination country, behind US, ahead of UK. Japan, Oceania Region, Malaysia and India also are in the dozen most popular destination countries. Detail is at Attachment 3 International Study Experiences 2012: Top 12 Destination Countries.
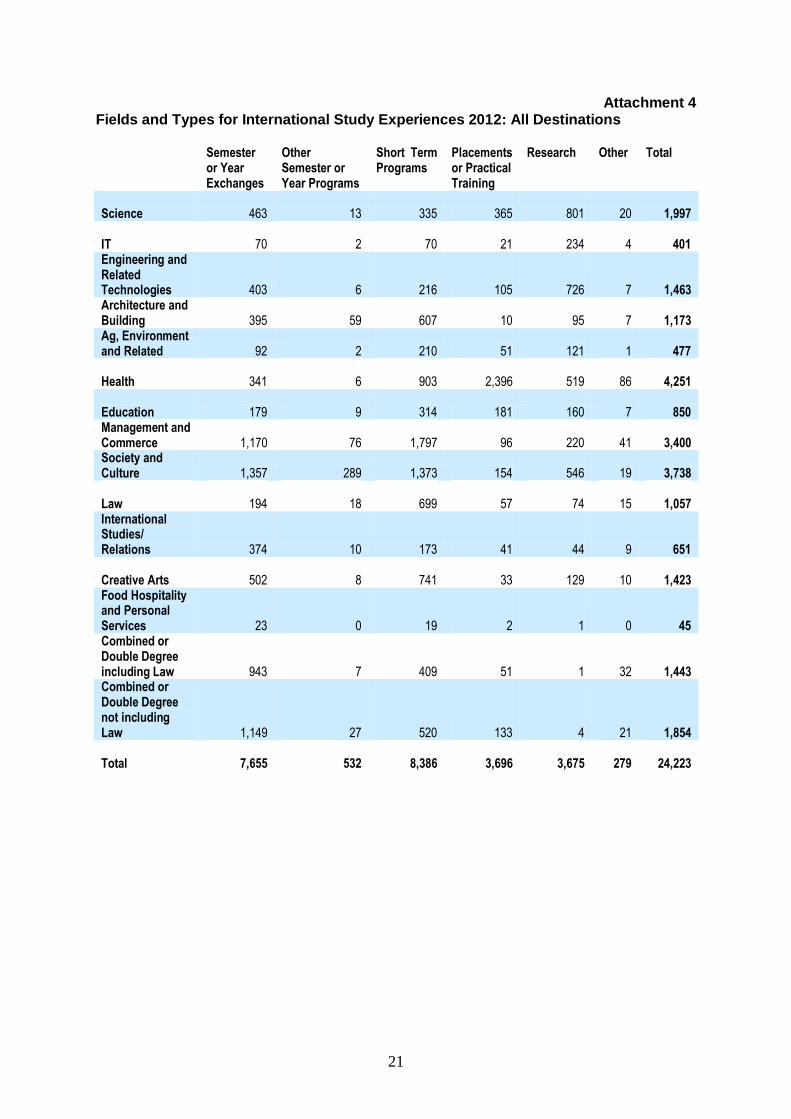
Attachment 4 Fields and Types for International Study Experiences 2012: All Destinations is a table showing Field of Education and Type of International Study
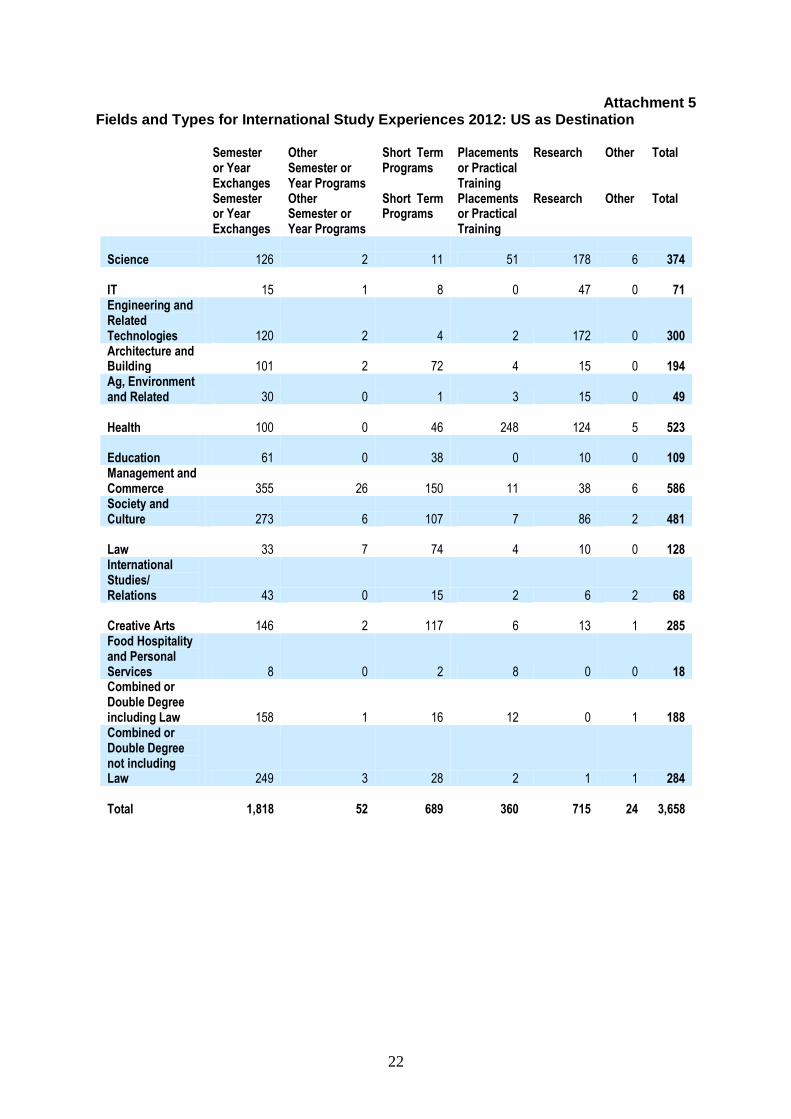
Experience for the 24,223 students for whom universities provided this information. Attachment 5 Fields and Types for International Study Experiences 2012: US as Destination is a table showing Field of Education and Type of International Study
Experience for the 3,658 students who went to US as destination (the most popular destination in 2012) and for whom universities provided this information. Attachment 6 Fields and Types for International Study Experiences 2012: China as Destination is a table showing Field of Education and Type of International Study Experience for the 2,149 students who went to China as destination (the second most popular destination in 2012) and for whom universities provided this information. Attachments 5 and 6 have been created at the request of Australian Education International. Diversity in Outbound Student Mobility Americas 35% and Europe 48% dominate as destinations for exchanges and other long experiences. US, UK and Canada account for 48% of destinations for exchanges and other long experiences. Asia dominates short term programs, with 50% to Asia and another 4% to Oceania. Asia also dominates internships or practical training experiences, with 47% to Asia and another 8% to Oceania. 86% of all Australian international study experiences to Asia, including 90% of all experiences to China, are shorter than a semester. Short term international study programs and international placements are important in diversifying Australian student mobility away from the Americas and Europe, specifically away from international student exchanges with US, UK and Canada, where students can study in English at a western university. Funding
Universities reported that 73% of international study experiences received funding, or had access to OS HELP, the Australian Government’s Higher Education Loan Program to assist undergraduate students undertake some of their study overseas, covering 91% of exchanges, 61% of other long term experiences, 67% of short term study experiences, 49% of international placements, 72% of research experiences and 84% of other international experiences. By source of funding, universities reported that
52% of all international study experiences of all types were supported by university funds, or from a combination of university funds with other funding sources
22% were supported by OS HELP or a combination of OS HELP with other funding sources

16
7% were supported by funds from Australian Government programs, such as the Endeavour Awards program
11% were supported by private funds or from foundations in Australia
0.2% were supported by funds from an overseas government or foundation. By amounts of funding, the 38 universities reported in aggregate $28.1 million in funding for international study experiences in 2012, from $28.2 million in 36 universities in 2011, $26.9 million in 37 universities in 2010, $24.2 million in 2009 and $16.6 million in 2007, including
$19.7 million in university funds, from $18.6 million in 36 universities in 2011, $20.1 million in 37 universities in 2010, $17.4 million in 2009 and $12.9 million in 2007
$7.9 million in funds from Australian Government programs, from $7.5 million in 36 universities in 2011, $6.3 million in 37 universities in 2010, $6.3 million in 2009 and $3.5 million in 2007
$391,000 from private funds or foundations in Australia, from $2.1 million in 36 universities in 2011, $443,000 in 37 universities in 2010, $614,000 in 2009 and $144,000 in 2007.
Universities reported a further $31.6 million in loan funds from OS HELP, from $25.3 million in 36 universities in 2011, $19.1 million in 37 universities in 2010, $11.3 million in 2009 and $8.6 million in 2007. Does funding of outward mobility matter? Universities play the dominant role in funding outward mobility. As university funds for outward mobility increase, does access to mobility increase? Chart 16 Funding and Access looks at university funding per domestic undergraduate
completion and Australian undergraduate access to international study experiences.
Chart 16 Funding and Access
0%
5%
10%
15%
20%
25%
30%
$0 $50 $100 $150 $200 $250 $300 $350 $400 $450 $500 $550 $600
UG
Acc
ess
to In
tern
atio
nal
Stu
dy
Exp
erie
nce
s
University Funding per UG Completion

17
As university funding per (domestic undergraduate) completion increases, access to international study experiences by Australian undergraduates increases. So funding is sufficient to grow outward mobility opportunities. But funding is not necessary. The chart shows counter-examples, where five universities have lifted Australian undergraduate access to international study opportunities above 15% with modest amounts of funding.

18
Attachment 1 International Study Experiences 2012: Fields of Education
Field Number of
Experiences % of All
Experiences
Science 1,997 8.2% IT 401 1.7% Engineering 1,463 6.0% Architecture/Building 1,173 4.8% Agriculture/Environment 477 2.0% Health 4,251 17.5% Education 850 3.5% Management and Commerce 3,400 14.0% Society and Culture 3,738 15.4% Law 1,057 4.4% International 651 2.7% Creative Arts 1,423 5.9% Hospitality 45 0.2% Combined including Law 1,443 6.0% Combined excluding Law 1,854 7.7% Total 24,223 100.0%

19
Attachment 2 International Study Experiences 2012: Destination Regions
Destination Region Number of Experiences
% of All Experiences
Europe 8,288 35.0% European Union 7,900 33.4%
Asia 7,856 33.2% North East Asia 3,750 15.8% South East Asia 3,026 12.8%
South Asia 1,081 4.6% Americas 5,534 23.4% Oceania Region 723 3.1% Sub Saharan Africa 540 2.3% Middle East/North Africa 295 1.2% Australia 430 1.8% Total 23,664 100.0%

20
Attachment 3 International Study Experiences 2012: Top 12 Destination Countries
Destination Number of
Experiences % of All
Experiences
US 3,672 15.5% China 2,145 9.1% UK 2,115 8.9% Canada 1,277 5.4% Italy 996 4.2% France 974 4.1% Germany 933 3.9% Japan 835 3.5% Oceania Region 723 3.1% Malaysia 653 2.8% India 614 2.6% The Netherlands 500 2.1%
21
Attachment 4 Fields and Types for International Study Experiences 2012: All Destinations Semester
or Year Exchanges
Other Semester or Year Programs
Short Term Programs
Placements or Practical Training
Research Other Total
Science 463 13 335 365 801 20 1,997 IT 70 2 70 21 234 4 401 Engineering and Related Technologies 403 6 216 105 726 7 1,463 Architecture and Building 395 59 607 10 95 7 1,173 Ag, Environment and Related 92 2 210 51 121 1 477 Health 341 6 903 2,396 519 86 4,251 Education 179 9 314 181 160 7 850 Management and Commerce 1,170 76 1,797 96 220 41 3,400 Society and Culture 1,357 289 1,373 154 546 19 3,738 Law 194 18 699 57 74 15 1,057 International Studies/ Relations 374 10 173 41 44 9 651 Creative Arts 502 8 741 33 129 10 1,423 Food Hospitality and Personal Services 23 0 19 2 1 0 45 Combined or Double Degree including Law 943 7 409 51 1 32 1,443 Combined or Double Degree not including Law 1,149 27 520 133 4 21 1,854 Total 7,655 532 8,386 3,696 3,675 279 24,223
22
Attachment 5 Fields and Types for International Study Experiences 2012: US as Destination
Semester or Year Exchanges
Other Semester or Year Programs
Short Term Programs
Placements or Practical Training
Research Other Total
Semester or Year Exchanges
Other Semester or Year Programs
Short Term Programs
Placements or Practical Training
Research Other Total
Science 126 2 11 51 178 6 374 IT 15 1 8 0 47 0 71 Engineering and Related Technologies 120 2 4 2 172 0 300 Architecture and Building 101 2 72 4 15 0 194 Ag, Environment and Related 30 0 1 3 15 0 49 Health 100 0 46 248 124 5 523 Education 61 0 38 0 10 0 109 Management and Commerce 355 26 150 11 38 6 586 Society and Culture 273 6 107 7 86 2 481 Law 33 7 74 4 10 0 128 International Studies/ Relations 43 0 15 2 6 2 68 Creative Arts 146 2 117 6 13 1 285 Food Hospitality and Personal Services 8 0 2 8 0 0 18 Combined or Double Degree including Law 158 1 16 12 0 1 188 Combined or Double Degree not including Law 249 3 28 2 1 1 284 Total 1,818 52 689 360 715 24 3,658

23
Attachment 6 Fields and Types for International Study Experiences 2012: China as Destination
Semester or Year Exchanges
Other Semester or Year Programs
Short Term Programs
Placements or Practical Training
Research Other Total
Science 3 0 43 18 34 0 98
IT 1 0 36 3 30 0 70
Engineering and Related
Technologies 15 1 54 4 66 0 140 Architecture and
Building 8 10 72 1 7 1 99 Ag, Environment
and Related 0 1 6 0 2 0 9
Health 1 0 43 86 17 0 147
Education 1 1 17 21 6 0 46 Management and
Commerce 34 1 442 14 16 3 510 Society and
Culture 30 107 224 11 10 0 382
Law 2 1 244 4 5 0 256 International
Studies/ Relations 30 2 38 2 3 0 75
Creative Arts 9 0 93 0 7 0 109
Food Hospitality and Personal
Services 0 0 0 0 0 0 0 Combined or
Double Degree including Law 20 1 30 2 0 1 54 Combined or
Double Degree not including
Law 20 10 118 6 0 0 154
Total 174 135 1,460 172 203 5 2,149