Embed Size (px)
DESCRIPTION
Central Appalachian Sustainable Economies (CASE) is an interactive regional network of innovators cultivating new ideas and resources in central Appalachia to grow healthy communities. The “CASE study” component of this network expands upon past and present regional successes of the CASE network in order to operate as a guide or set of best practices for the region as a whole. This research component will also actively identify “smart approaches” for expanding CASE projects as well as assessing the growth of applied sustainability throughout the region. This particular CASE study focuses specifically on economic diversification through energy integration with a specific focus on solar development in West Virginia.
Citation preview

0

1
Special thanks to: Steve Kominar, Peni Adams, Roger Ford, Kelley Goes, David Levine, Pat Esposito, Joseph Weidman, Ken Nemeth, Jennifer Hudson, Murphy Poindexter, Dino Beckett, Darrin McCormick, Ben Carraux, Christian Smith, Jamie Throwbridge, Rob and Melissa Taylor, Jerry Mounts, Edna Thompson, Mark Mitchell, Kelly Jo Drey, Rebecca Prokity, David Mitchell, Keith Pauley, Steve Owen, Christopher Burgess, Claire Austin, Larry Sherwood, Mark Muchow, Bart Krishnamoorthy, Tom Tarka, Greg Adolfson, Kent Spellman, Mary Hunt-Lieving, Mike McKechnie, the late Mike Whitt, Leasha Johnson, Terrry Sammons, Thom Worlledge, Jessie Sayer, Billy Perish, Gonzalo Vizcardo, Crystal Good, Stephen Smith and all our family and others we forgot to mention. Special thanks to all residents of Williamson and West Virginia as a whole – your passion never ceases to inspire our work.
CASE Study
Central Appalachian Sustainable Economies (CASE) is an interactive regional network of innovators cultivating new
ideas and resources in central Appalachia to grow healthy communities. The “CASE study” component of this
network expands upon past and present regional successes of the CASE network in order to operate as a guide or
set of best practices for the region as a whole. This research component will also actively identify “smart
approaches” for expanding CASE projects as well as assessing the growth of applied sustainability throughout the
region. This particular CASE study focuses specifically on economic diversification through energy integration with a
specific focus on solar development in West Virginia.
Organization Information
Sustainable Williamson
1130 Midland Ave. Williamson, WV 25661
Tel 304-601-9091
sustainablewilliamson.org
Research Team
Primary Investigator – J. Eric Mathis: Executive Director of Sustainable Williamson
Research Director – Frank Fineis: Intern for Sustainable Williamson
Research Assistant – Alex Donesky: Intern for the City of Williamson

2
Table of Contents
I. Acronyms .............................................................................................................................. 1
II. Introduction .......................................................................................................................... 2
III. Market Analysis ..................................................................................................................... 8
IV. Solar Initiatives .................................................................................................................... 31
V. Financing options ................................................................................................................ 32
VI. Regulatory Framework ........................................................................................................ 48
VII. Utilities' Best Case Scenerios .............................................................................................. 70
VIII. References........................................................................................................................... 76
IX. Appendix A .......................................................................................................................... 83
X. Appendix B .......................................................................................................................... 84

1
AEP: American Electric Power ALEC: American Legislative Exchange Council AIRE: Appalachian Institute for Renewable Energy AMI: Advanced metering infrastructure API: Application programming interface ARC: Appalachian Regional Commission AREC: Alternative renewable energy credit ARPS: Alternative renewable portfolio standard BCCAP: Bergen County Community Action Partnership BNEF: Bloomberg New Energy Finance BOD: Board of directors CAGR: Compound annual growth rate CCA: Community Choice Aggregation CDE: Community development entity CMC: Competency Model Clearinghouse DER: Distributed Energy Resources DOE: Department of Energy DP&L: Dayton Power and Light DSIRE: Database of State Incentives for Renewables & Efficiency DSM: Demand-side Management EEI: Edison Electrical Institute EEPA: Electric energy purchase agreement EIA: Energy Information Administration E-ON: Energy Optimization Network EPA: Environmental Protection Agency FERC: Federal Energy Regulatory Commission GATS: Generation Attribute Tracking System GW(h): Gigawatt (hour) IEP: Integrated Energy Park
TM
IOU: Investor owned utility IPO: Initial public offering IREC: Interstate Renewable Energy Council ITC: Investment tax credit kW(h): Kilowatt (hour) LCOE: Leveraged cost of energy MTR: Mountaintop removal MW(h): Megawatt (hour) NABCEP: North American Board of Certified Energy Practicioners NARUC: National Association of Regulatory Utility Commissioners NEG: Net excess generation
NEM: Net energy metering NG: Natural gas NMTC: New market tax credit NREL: National Renewable Energy Laboratory O&M: Operations and Maintenance PACE: Property Assessed Clean Energy PJM: PJM Interconnection LLC PPA: Power purchase agreement PSC: Public Services Commission PUC: Public Utilities Commission PUCO: Public Utilities Commission of Ohio PURPA: Public Utility Regulatory Policies Act PV: Photovoltaic QEI: Qualified equity investor QF: Qualifying facility RE: Renewable energy REC: Renewable energy credit REPI: Renewable Energy Production Incentive RFP: Request for proposals RPS: Renewable portfolio standard REW: Renewable Energy World (magazine) ROI: Return on Investment SAPC: Solar Access to Public Capital SBA: Small Business Administration SEIA: Solar Energy Industries Association SEPA: Solar Electric Power Association SGIP: Small Generator Interconnection Procedures SPPA: Solar power purchase agreement SREC: Solar renewable energy credit TOU: Time-of-use TPO: Third-party ownership USDA: United States Department of Agriculture VPP: Virtual power plant WVEDA: West Virginia Economic Development Authority WVEC: West Virginia Environmental Council WVU: West Virginia University
Acronyms

2
Within America’s present energy paradigm of drawing lines in the sand, we have come to a
crossroads as we consider the future sustainability of America’s global position in traditional as
well as emerging energy markets. A strict demarcation has been drawn where we as a country
either take the high road and adopt a genuine “all-the-above” energy strategy or continue down
our present path of politicizing energy markets. In a January 2013 article written for Renewable
Energy World (REW), the principle investigator of this report explains the shifts in this faltering
energy paradigm, which is emerging in the least likely of places: “as the age old ‘us vs. them’
debate continues, many West Virginia residents, companies, and entrepreneurs are beginning
to identify synergies between renewable energy and fossil fuels, specifically building
unexpected coalitions in the heart of coal country.” (Mathis, 2012, para. 2).
As this study will thoroughly explain and outline, our research team, after comprehensive
research on the subject, concluded that it is in the immediate interest of the residents,
government and energy industry stakeholders of West Virginia to pursue an “integrated path
forward.” It is through the lens of Sustainable Williamson that our teams believes that this
process should not be done at the expense of the existing fossil fuels industry, but rather, adopt
an “all-of-the-above” energy policy, also referred to as an “energy mix” or “integrated energy”
approach. For example, in Clean Edge, the world’s first renewable energy research and advisory
firm, highlights in its 2013 annual report the importance of an integrated or “energy mix”
approach when it notes that:
Some argue that America’s cheap natural gas will crowd out clean energy technologies,
but we strongly believe this is not the case, as solar and wind have seen repeated record
deployment in recent years and state-based RPS [renewable portfolio standards] keep
deployment targets on track. Instead, it appears that the future of energy in the U.S.
belongs to a mix of clean energy, improved efficiency, and responsible natural gas
resource development.
Moreover, a 2012 report by Ernst & Young entitled “Cleantech Matters: Global
Competitions (Global cleantech insights and trends report)” conducted a survey of 100
executives involved in developing corporate energy strategies. Given Ernst & Young’s
impeccable reputation as a global leader in assurance, tax transaction, and advisory services
perhaps the following conclusion may provide an objective snap shot of what some could
Introduction

3
consider an “all-the-above” corporate strategy already being adopted within the private
sector:
Energy mix has become a strategic issue at the C-suite level of billion dollar corporations
as a significant – and rising – share of operating costs go to energy. While reducing
energy costs through energy efficiency measures is often the foremost objective of
energy strategy, a number of other subsidiary goals are also driving strategy, such as
energy security, carbon reduction and price stability. Regulatory compliance, together
with reputational and brand aspects, also plays a part (Ernst & Young, 2012, p. 5).
Reflecting the above “energy mix” approach, this CASE study provides a glimpse into the
potential West Virginia has for rapidly integrating solar throughout the state by targeting
residential, commercial and industrial energy markets by way of utility-scale energy
development. This potential is being actualized in real-world projects that are emerging both in
the coalfields of Southern WV and throughout the state. In a more recent REW piece written on
April 30th, 2013, the aforementioned author noted recent progress in the heart of coal country
with an emerging project of Sustainable Williamson called Energy Optimization. He stated that
Sustainable Williamson “hopes that these projects will provide a working framework for ‘energy
optimization’ in the region – transitioning communities from an aging monolithic fossil fuel
economy to a rejuvenating diversified energy mix economy without picking winners or losers”
(Mathis, 2013, para. 2).
Keeping this integrative path in mind, the following case study will examine one component of
this approach - solar.1 Additionally, given the primary purpose of this report is to provide a
comprehensive “dashboard” for West Virginia state leaders and elected officials, our team
focused on the emerging solar market in a nation-wide and state-specific context with a
particular focus on solar financing models as well as regulatory frameworks and incentive
structures. From this analysis we provide several recommendations including virtual rooftop
solar, expanded access to virtual net metering, third-party solar financing options and utility
decoupling to name a few.
In order to fully assess specific integrative approaches to energy development, our team at
Sustainable Williamson is presently conducting several experimental pilot programs in the
Southern West Virginia town of Williamson. The significant market barriers found in Williamson
provide valuable information for addressing general market barriers to solar development
1 Please note that our emphasis upon solar is not to be considered a specific bias of the proposed “integrated path
forward.” To the contrary, our team and partners are dedicated to the development of all energy resources given their market maturity/viability.

4
throughout the state and beyond. These include, most prominently, large divisions between
traditional and emerging energy resources and difficulties in attaining market penetration in
areas other than the normative “moral-markets” found within more progressive and/or
prosperous northern regions of the state (e.g., purchasing RE = saving the planet or becoming
energy independent) where return on investment (ROI) is peripheral at best. When considering
these barriers as well as our research to date, our team has developed a comprehensive
roadmap that considers five of the fundamental pre-requisites to effective solar market
penetration. The breakdown is as follows:
Market Analysis: Overview of present market conditions as well as a synthesized
roadmap for West Virginia.
Solar Initiatives: Overview of solar industry support network.
Financing Options: Overview of solar financing options.
Regulatory Framework: Specific analysis as it relates to financing options and virtual net
metering.
Utilities’ Best Case Scenarios: Potential measures that will ensure utility industry
success during solar expansion
The following two projects are underway in Williamson, WV and to a large extent, across
Southern WV to begin implementing the underpinnings of an energy and industrially diverse
West Virginia rooted in a genuine all-the-above approach:
Sustainable Williamson’s vision is to connect community stakeholders with specific programs
under the banner of “applied-sustainability” and to activate personal engagement with
economic development through market-driven projects. Williamson residents believe that
central Appalachian communities will choose to actively participate in community development
while making efforts to retain their investment within local economies by creating reliable well-
paid jobs and an expanded local tax base. Diverse participation in the development of triple-
bottom line markets will stimulate vital economic growth, thus improving health, wealth, and
well-being. It should be noted that Sustainable Williamson’s specific focus on applied
sustainability as opposed to sustainable development2 in general simply translates to
2 The authors understand this concept as it is defined by the United Nations Brudtland Report. When assessing
most literature and more importantly projects that utilize this concept, we find that there is an over emphasis
Sustainable Williamson

5
Sustainable Williamson’s emphasis upon and utilization of market-driven models that will
bolster America’s competitive position in contemporary global energy markets which considers
the merits of sustainability, that is, a strong emphasis is placed on considering the impacts our
present decisions will make on future generations (e.g., America’s national debt).
This citywide effort became possible when Williamson Mayor Darrin McCormick spoke at a city
council meeting encouraging the council and local citizens to accept energy efficiency and
renewable energy as a means to sustain a way of life for future generations. In 2011, the
Williamson Redevelopment Authority adopted a new slogan: “Where Development Meets
Sustainability.” The city, with the help of Sustainable Williamson, now hosts several community
gardens, a weekly farmers’ market, and a monthly 5k race amongst many other public health
initiatives that accompany its commitments to sustainable energy integration; the latter
commitment is the specific focus of this report.
Challenges and Opportunities
Once a favorite retailer for shoppers in Mingo and surrounding counties as well as a hub for the
coal and banking industries in the region, the City of Williamson is no longer a bustling center of
commerce it once was. Williamson’s economic decline began as a result of the devastating 1977
flood, only to be followed by another flood in 1984, just as most businesses were beginning to
recover from debt. In 1990, the Clean Air Act regulations began to affect the coal industry as
fewer mining permits were issued in the region. In Appalachia, local and state governments are
dependent on the coal industry; 40% of jobs are directly reliant on the coal industry in some
counties (West Virginia Office of Miners' Health, Safety and Training, 2012). In Williamson, the
coal industry provides financial support to community schools, local organizations, and political
campaigns.
The Appalachian Regional Commission ranks Mingo County as one of the most economically
distressed counties in Appalachia based on three economic indicators: average unemployment
rate, per capita income, and poverty rate. According to the U.S. Census Bureau, 21% of local
residents in Williamson are living below the poverty threshold, compared to the national
average of 14.3%, and in 2012 Mingo County had an annual average unemployment rate of
9.9%, compared to a national average of only 8.1% (U.S. Bureau of Labor Statistics, 2013).
upon the ecological and social components with little to no applied component regarding the economic pillar. This accounts for our use of applied sustainability which serves as a direct response to the profound shortcoming or ignoring the important role market systems play in sustaining the other two pillars.

6
According to the West Virginia Health Statistics Center, much of the state's out-migration has
been younger people who have been forced to move away to find work in other regions
because of fewer economic opportunities, a phenomenon referred to as “brain drain.”
According to a Health Statistics Center’s 2002 report, “they marry and raise their families
elsewhere. Then, after they retire, many West Virginians come back home to enjoy life in the
Mountain State” (WV Health Statistics center, 2002). Indeed, the state has the second highest
percentage of persons aged 65 and older and the third lowest percentage of people under age
18 in the nation (U.S. Census Bureau, 2008).
After years of low economic growth, Williamson’s city government leaders are consistently
looking for new ways to survive and spark economic recovery. The city has attempted hiring
freezes, layoffs, and levying greater percentages of employee contribution to health care
insurance, and yet, the essential services that the city provides continue to decline.
The consideration of geographic and topographic disadvantages plays an important role in
shaping our strategy to diversify the economic backbone of coal dependent communities, that
is, energy. According to the Appalachian Regional Commission (ARC), rural communities in
mountainous regions experience limited economic opportunity and slow growth rates. These
regions typically lack diverse inter-industry relationships between counties; coal field
communities typically mirror the coal-dependent economies of their spatial neighbors. More
importantly and to highlight the un-sustainable nature of the prevailing mono-economies found
in Southern West Virginia, the heavily coal-dependent West Virginia economy is sensitive a host
of factors – national coal demand, environmental legislation, the health of the national
economy, etc. – without having other reserve industries for potentially laid-off coal industry
workers.
Building upon a strong energy economy in southern West Virginia, Sustainable Williamson aims
to negotiate and actuate economic diversification by catalyzing local investment in municipal
and neighborhood solar/energy-efficiency projects. Residents and municipal officials are already
demonstrating widespread support for these projects because of their immediate benefits of
reducing energy burdens for households and city municipal buildings. Sustainable energy
professionals from across the nation have traveled to Williamson to share knowledge with
professionals in coal-based industries and community residents, including at-risk youth.

7
Discussions have focused on the economic feasibility, research and development, operations
and maintenance, design and installation of new sustainable energy technologies.
Gilliam Solar, a West Virginia company based in “The Heart of the Billion Dollar Coalfield”
(Williamson, WV), is a solution-based company specifically designed to bridge the gap between
the fossil fuel and solar industries. It’s a simple concept. Both energy resources are more
productive when they work in a collaborative or “integrative” fashion, rather than an
ideologically driven environment of division or “us vs. them.”3 Given this fact, Gilliam Solar is
uniquely poised to bring the promise of renewable technologies and West Virginia’s fossil fuel
based energy expertise together to the same table.
Photovoltaic (PV) Design & Installation
Through its collaborative partnerships, Gilliam Solar is presently developing several novel
approaches to developing residential-, commercial- and utility-scale solar. While potential exists
for expansion into other well-established renewable energy markets outside of central
Appalachia, Gilliam Solar is first and foremost am integrative PV company.
Target Markets
To date, Gilliam Solar has initiated important discussions and research to assess the
development of coupled generation (by means of utility-scale natural gas and solar) on both
active and inactive mine sites throughout the central Appalachian region. Gilliam Solar has
developed an innovative financing model believed to be economically attractive to coal
companies and landowners alike. Gilliam Solar is presently organizing a cross-sector coalition in
order to procure the necessary support for these projects. Perhaps their logo says it all:
3 See REW article entitled “The Importance of Understanding our Renewable Energy Worldview: Why Fossil Fuels
Are our Friends” http://www.renewableenergyworld.com/rea/blog/post/2013/05/disruptive-threatsstrategic-considerations-
a-utility-lobbying-group-keeps-it-real
Gilliam Solar

8
Market Analysis
Sustainable Williamson’s research team has analyzed several challenges facing the West
Virginia economy, its coal companies, and its electric utilities. We propose a solution to these
challenges: solar energy growth on the residential, commercial, and utility-scale levels, through
the rollout of Virtual Power Plants.
Declining Appalachian Coal Industry
The United States Energy Information Administration (EIA) projects in their Annual Energy
Outlook for 2013 that the renewable energy (RE) sector will nearly double its output from 2009
to 2035, while in the same period, it predicts that Appalachian coal production will decrease
(EIA, 2013, pp. 6, 85). Significant declines in mining productivity over the past decade have
substantially reduced the long term sustainability of Appalachian coal. This has resulted in
higher prices for the commodity, causing the market to replace it with coal from other regions,
namely from mines farther
west with more easily
accessible deposits.
Appalachian coal output is
expected to continue on this
decline for an indefinite
period. According to the EIA’s
latest Quarterly Coal Report,
between March 2012 and
March 2013 West Virginia
coal production fell by 12.3%,
and total U.S. coal
production declined 8%
between this time as well
(EIA, 2013, p. 6).
In 1940, 1-in-5 workers in West Virginia were employed at or in support of a coal mine. Due to
mechanization and a host of other causes, by 2011 less than 5% of the state’s workers were
employed in a coal-related field, even though production had increased through 1980’s and
90’s. With Appalachian coal production predicted to decrease and employment within the
Appalachian coal production predicted to decline (USGS, 2009).
Market Analysis

9
industry to decrease even more rapidly, West Virginia needs to strongly consider adopting an
integrated path forward.
Our team suspects that the state’s dependence on price-unstable fossil fuels paired with the
growing scarcity of coal have resulted in a steeper residential electricity price increase over the
last ten years compared to nationally averaged retail prices and prices in neighboring states
Pennsylvania and Ohio (using a linear regression based upon EIA data).4 West Virginia saw an
4 The EIA calculates that West Virginia derives 96% of electricity from coal. National bituminous coal prices
increased from $39.92/short-ton in 2006 to $60.88/short-ton 2010. Sub-bituminous coal prices have likewise increased 98% between 2000 and 2010. Appalachian coal is also the most expensive in the nation. Table 7.9 Coal Prices, Selected Years, 1949-2011 [Data file]. (2011). Retrieved from Energy Information Administration website: http://www.eia.gov/coal/data.cfm#prices.
Historical employment at mines in West Virginia (left axis) and coal production in millions of tons (right axis).

10
average of .131 cents/kWh/quarter increase from October 2004 to February 2013, while the
national average was only .080 cents/kWh/quarter. That figure for Pennsylvania and Ohio was
.111 and .103 cents/kWh/quarter, respectively. It is important to note that this rate increase
discrepancy occurred despite both PA and OH establishing solar carve-outs, i.e. legislation
mandating a solar energy quota fulfilled by electrical utilities, prior to 2010. The normative
assumption is that rates increase with solar penetration. The following findings say otherwise:
In addition to the above findings, Ohio Public Utilities Commission’s recent study (August, 2013)
examined the relationship between renewable resource additions and wholesale electricity
markets in Ohio. The Staff of the Public Utilities Commission of Ohio conducted this study in an
attempt to quantify the changes in wholesale electricity prices and generator emissions that are
likely to occur as a result of the state’s Alternative Energy Portfolio Standard (AEPS)
requirements. The report concluded:
“The model simulations indicate that, consistent with theoretical expectations, Ohioans
are already benefiting from renewable resource additions through downward pressure
on wholesale market prices and reduced emissions. No severe congestion issues or
emergency curtailments were observed, even after incorporating all approved projects,

11
which suggests that the electric grid in Ohio is sufficiently robust to support the
continued development of utility-scale renewable projects.” (Ohio PUC, 2013, p. 7)
Disruptive Challenges for the Electric Utility Industry
According to a 2013 report from the Edison Electric Institute (EEI), although distributed energy
resources (DER) such as PV, wind, and geothermal systems account for less than 1% of
nationwide load, DER and demand-side management (DSM) technologies such as smart-grid
technology and energy efficiency tools pose significant “disruptive challenges” to the electric
utility industry. Along with a more energy conscious consumer and a national dialogue in favor
of efficiency, DER and DSM pose two large threats to the current utility model: decreased
growth in energy demand and additional costs to integrate and maintain these new
technologies within the existing grid infrastructure. In tandem, these effects will reduce electric
utility revenue and force electricity costs upwards, further alienating non-DER participants and
increasing the chance that these customers will consider alternative energy sources. Circling
back to the conclusions found in the Ernst & Young’s report further unpacks the demographics
and trends found within the diverse pool of utility customers as they relate to “C-suite level of
billion dollar corporations.” Indeed, these large/corporate customers are becoming more
conscious consumers by valuing the “reputational and brands aspects” of DER/DSM integration
as well as the obvious, lower energy costs.
Company self-generation of energy and integration of renewables into the energy supply
have been implemented at significant rates to meet these ends, with these practices set
to accelerate over the next five years. The main barriers to self-generation and use of
renewables are mostly related to risks and financial returns, suggesting that adoption
could come even faster with financing innovations and increase cost competitiveness of
renewables. In summary, only those corporations that have a comprehensive and diverse
energy strategy will be able to create a competitive advantage in the new world of a
more resource-efficient and low-carbon economy (Ernst & Young, 2012, p. 5).
Given this corporate trend, currently, distributed energy does not pose a near-term threat to
the utility model. However, in the next seven years this will most likely change. According to the
EEI, Bloomberg New Energy Finance (BNEF) projects that nationwide solar system installations
will continue at a 22% compound annual growth rate, reaching a total capacity of 30 gigawatts
by 2020. BNEF also projects by 2020 distributed energy resources will account for 10% of energy
capacity in the United States. This energy market shift, which corresponds to a 10% decrease in
utility load, will cause a 100% increase in electricity rates for non-DER customers. As DER
generation becomes only more widespread, “the cost of providing interconnection and back-up

12
supply for variable resources [intermittent resources without base load capacity such as wind
and PV] will add to the utility cost burden” (EEI, 2013, p. 5).
DER and DSM also have the potential to expose the electric utility to stranded costs, i.e. the
unrecovered costs associated with the investment in new generation plants and transmission
lines in the present that will go un-utilized in the future. Stranded costs will further exacerbate
retail electricity costs as well. While electricity prices are expected to increase due to scarcity as
well as socio-political trends favoring DER/DSM integration, less time will be required to achieve
PV price-parity. For approximately 16% of the U.S. retail electricity market where rates are
$0.15/kWh or above, solar has achieved price-parity with traditional energy sources. This is a
state referred to as being “in the money” or cost competitive where the cost to produce solar is
at or below the cost of producing energy from traditional resources. By 2017 the amount of the
U.S. retail electricity market “in the money” for PV will increase to 33% (EEI, 2013, p. 13). If
retail energy prices continue to increase over the next seven years at the same rate that they
have been increasing since 2005, combined with Clean Edge’s projections for trends in the
levelized cost of energy (LCOE) of solar PV, solar could be as affordable as traditional residential
electricity prices as soon as midyear of 2016. Solar energy could be affordable to all sectors of
the retail electricity market – residential, commercial, industrial, and transportation – by
midyear of 2017(EIA, 2005 – 2013) (Pernick & Wilder, 2012, p. 9).
The total effect of DER/DSM and the declining cost of PV creates what the EEI refers to as the
“vicious cycle,” illustrated below.
0
5
10
15
20
25
30
35
40
45
2007 2008 2009 2010 2011 2012 2013 2014 2015 2016 2017 2018 2019 2020
Ce
nts
/ k
Wh
West Virginia Solar PV "In the Money"
Possible PVLCOE
Retail Res.
Retail All Sect.

13
As revenues decline and new energy competition evolves, the public utility credit quality rating
– currently a BBB majority, down from the AA norm during the 1980’s – will continue to erode
until public utilities face severely reduced access to low-cost capital, once the heralded strength
of the industry. The higher cost of capital will be pushed onto the consumer, who will then
further consider DER and DSM systems. This, in turn, further reduces utilities’ revenues, the
industry’s access to low-cost capital, and the competiveness of their electricity in the retail
market. EEI’s insight is recognizing similar trends that have occurred in other public regulated
sectors, that is, public utilities industry must avoid this scenario lest it die out in a similar fashion
as the airlines and telecommunications giants of the 1970’s.
The Institute highlights several beneficial industry responses to energy efficiency and
distributed generation: a stranded cost charge paid by DER and fully departing customers; a
customer advance to aid construction that recovers some upfront costs of capital expenditures
and mitigates stranded costs; and “identify[ing] new business models and services that can be
provided by electric utilities in all states to customers in order to recover lost margin while
providing valuable customer service” (EEI, 2013, p. 18). Shortly, we will address the ideal
examples and scenarios for the West Virginian electric utility industry that allow for the
recovery of stranded costs while ameliorating their structural disincentives towards DER
integration and energy efficiency measures.
Growing Solar Industry
When assessing the global energy markets, we can no longer frame renewable energy as a
marginal or alternative energy resource. With its rise in demand both nationally as well as
internationally, renewable energy generation is quickly becoming a dominant force that we
must all contend with. For example, the European Photovoltaic Industry Association’s “Global
Market Outlook for Photo-voltaics 2013-2017” major finds include:

14
Around the world, 31.1 GW of PV systems were installed in
2012, up from 30.4 GW in 2011; PV remains, after hydro and
wind power, the third most important renewable energy
source in terms of globally installed capacity.
Germany was the top market for 2011, with 7.6 GW of
newly connected systems; followed by China with an
estimated 5GW; Italy with 3.4 GW, the USA with 3.3 GW;
and Japan with an estimated 2 GW.
Under a pessimistic “business‐as‐usual” scenario, the global
annual market could reach 48 GW in 2017; under a “policy‐
driven” scenario, it could be as high as 84 GW in 2017.
IREC’s projections for U.S. solar PV capacity
We can already see from European markets that government policies incentivizing solar energy
development and use are effective in motivating consumers to buy and businesses to innovate.
For example, Germany’s implementation of a feed-in-tariff policy guaranteeing long-term power
purchasing agreements at an agreed upon price – this policy has accounted for up to 75% of all
solar deployment. Net metering and financial incentives, such as Solar Renewable Energy
Credits and feed-in tariffs for solar-generated electricity, have supported solar PV installations
both nationally and on an individual state level within the US. Though German feed-in tariffs
have begun to stifle innovation and price improvements, this is merely the result of poor tariff
design; the tariffs have served their purpose of jump-starting the renewables market
wonderfully but their slow rate decreases have created too much demand at high prices
Quick facts
Utility PV installations have
grown 670% between
2010 and 2012 (SEIA,
2013, “Introduction”).
Cumulative operating PV
capacity now stands at
7,962 MW (SEIA, 2013,
“Key Findings”)
From Q1 of 2012 to Q1 of
2013, residential system
prices fell 15.8% from
$5.86/Watt to just
$4.93/Watt (“Installed
Price”).
For the second year in a
row, PV was the number‐
one new source of
electricity generation
installed in Europe.

15
preventing competition and cost-reductions. We will discuss the solutions to this issue in the
“Financial Options” section below (Pernick & Wilder, 2013: p. 38).
In 2012, the United States’ total
installed solar capacity reached
3,328 MW, representing a 76%
growth from 2011, and it is
expected that installed capacity
will reach 4,375 MW by the end of
2013 2013 (SEIA, 2013, “Market
Outlook”). In 2012, the U.S. had
3,328 MW of installed PV capacity,
representing 10.7% of global
capacity (EPIA, 2012, p. 36). This
rapid growth rate was substantially
driven by the rise of utility-scale
solar projects across the nation (IREC, 2012, p. 17).
The Solar Foundation claims in their National Solar Job Consensus 2012 that 44.2% of all
surveyed solar firms expect to add new employees between 2012 and 2013, while only 3.6%
expect to cut solar jobs (The Solar Foundation, 2012, p. 15). While there are a range of
employment opportunities across the solar sector, many are well paid. According to the Bureau
of Labor Statistics, the mean annual wage in 2010 for electricians at a solar power plant was
$59,020, for residential/commercial solar water heater plumbers that figure was $50,550, and
solar power plant welders, cutters, solders, and brazers earned $45,990. The BLS claims that
"According to industry sources, solar installers usually have starting salaries between $30,000
and $40,000 per year," while positions requiring more education such as electrical and industrial
engineers can earn more than $90,000 annually (Hamilton, 2011, pp. 9, 16, 18). These jobs
require various levels of education and training; they include installation, manufacturing, sales,
and engineering. As the solar job force increases, new training and education programs have
rapidly developed. There will also be continuing demand across the solar financial sector as the
U.S. has been a huge innovator in project finance through the invention of no-money-down
solar leases and power purchase agreements.
As of September of 2012, there were 119,016 solar industry jobs in the United States, a 13%
increase from the 105,145 jobs twelve months prior(The Solar Foundation, 2012, p. 5). Between
August 2011 and August 2012, the fossil fuel electric generation sector lost 4,000 jobs (a 3.77%
U.S. Solar is growing exponentially (taken from SEIA, 6/2012)

16
decline), and 850 coal mining jobs were lost (a 0.83% decline). 2013 is expected to have a 17%
growth in solar industry employment with 44.2% of firms slated to hire new workers, all while
the employment growth for the nation is projected to be a modest 1.5% (p. 14).
Within the industry there will be immense growth across each solar occupation between 2012
and 2013:
1. Photovoltaic installers (21% growth)
2. Manufacturing (9% growth)
3. Sales and distribution (22% growth)
4. Project development (14% growth)
5. Other (18% growth)
These developments in the solar industry are supplemented by employment growth in energy
efficiency technologies. The Department of Energy concludes that a full deployment of smart
grid technology across West Virginia will induce $215 million of job creation (DOE NETL, 2009, p.
9). Solar DER growth must also be considered alongside the large strides made in energy
efficiency through the implementation of demand-side management technologies and the first
steps towards a smarter grid.
Developments in Demand Side Management
Perhaps the most widely implemented DSM technology is the smart meter, which allows for
semi-real-time to real-time energy data transfer between supplier and consumer. The energy
supplier may create a tiered pricing system for on-peak and off-peak load rates and the
consumer are then incentivized to reduce consumption during those hours of higher electricity
17
prices. This system will also provide the necessary information for the consumer to curtail
consumption in general. Between 2007 and 2011, the growth in smart meter installations
experienced a compound annual growth rate of around 47% and accounted for 14.1% of all
energy served in the U.S. in 2011, up from just 2.2% in 2007. Also during 2011, 20% of all public
and state owned utilities had deployed smart-meters and 31% of their employees had them as
well (Zpryme, 2013, p. 6).
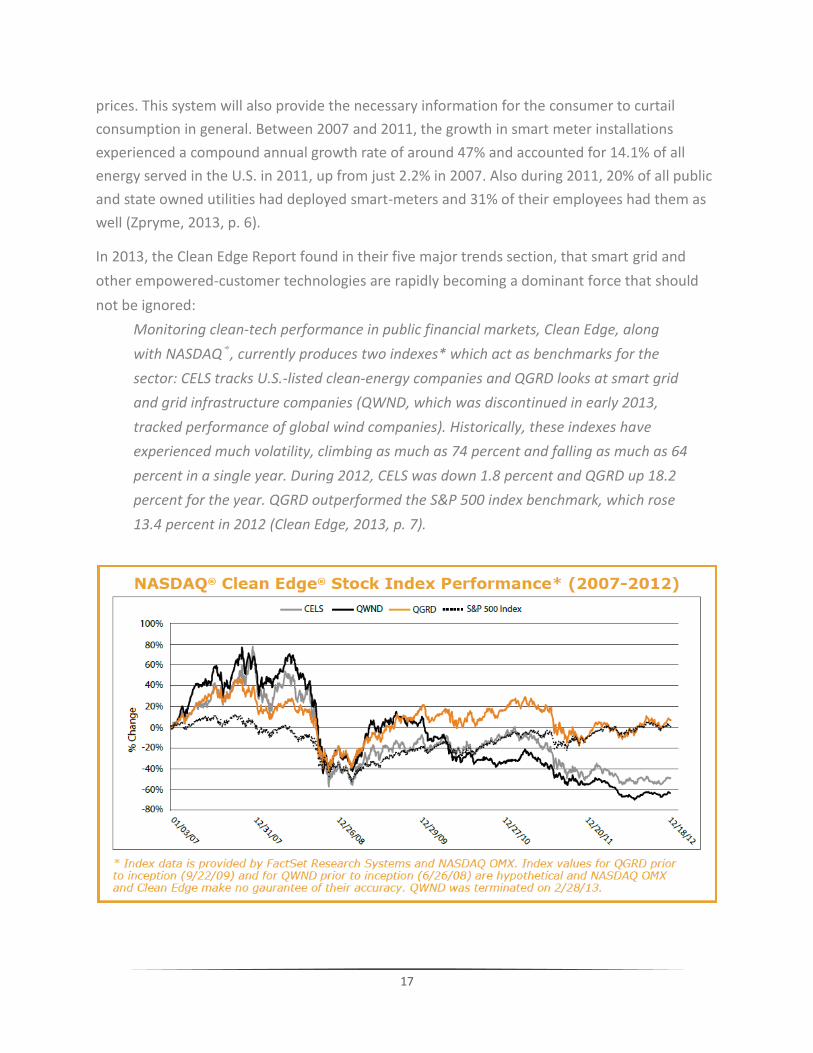
In 2013, the Clean Edge Report found in their five major trends section, that smart grid and
other empowered-customer technologies are rapidly becoming a dominant force that should
not be ignored:
Monitoring clean-tech performance in public financial markets, Clean Edge, along
with NASDAQ®, currently produces two indexes* which act as benchmarks for the
sector: CELS tracks U.S.-listed clean-energy companies and QGRD looks at smart grid
and grid infrastructure companies (QWND, which was discontinued in early 2013,
tracked performance of global wind companies). Historically, these indexes have
experienced much volatility, climbing as much as 74 percent and falling as much as 64
percent in a single year. During 2012, CELS was down 1.8 percent and QGRD up 18.2
percent for the year. QGRD outperformed the S&P 500 index benchmark, which rose
13.4 percent in 2012 (Clean Edge, 2013, p. 7).

18
Synergies between the clean tech and high tech sectors have spurred numerous firms
dedicated to utility data usage software. Silicon Valley’s darling Nest Labs ships 45,000
programmable thermostats a month; these devices analyze homeowners’ energy usage
patterns, weather forecasts, and other data to maximize energy efficiency through a
smartphone application interface (Clean Edge, 2013, p. 8). Founded in 2007, tech firm Opower
delivers utility data usage via a smart thermostat to its customers so that they can compete
with their neighbors, even Facebook friends, for energy savings. Opower estimates that its
services have saved a cumulative two terawatt-hours of electricity since its inception (p. 8).
Further application of smart grid technologies will continue to reduce consumer electrical
demand, consequently augmenting the chances of an electricity price increase, thus making PV
systems more affordable – an application of “the vicious cycle” mentioned in the above Edison
Electric Institute report.
Utilities are beginning to make use of smart grid technologies as well, thus further enabling a
more empowered-customer, a trend not unlike those seen across the high tech sectors
(cellphones that report data usage, hybrid automobiles that track fuel economy) and the
Internet (formerly top-down generated content has been supplanted by user-generated
content):
In Texas, utility Reliant Energy installs a free Nest thermostat for customers of its
Learn & Conserve energy-saving plan, while TXU Energy reported 100,000 downloads
of its iPhone and Android smart-phone app for remote thermostat control by the end
of 2012. Reliant and TXU are two of seven utilities that have implemented the Green
Button, a U.S. Department of Energy initiative for smart meter-enabled customers to
track their energy use on their utility’s web site; nearly 30 other utilities in 17 states
have committed to do the same (Clean Edge, 2013, p. 9).
Solar Development in West Virginia
Within the state of West Virginia, economic benefits from solar PV deployment are largely the
product of job-creation and expanded local tax bases. A 2010 report from Berkley concludes
that PV development creates more jobs per megawatt of capacity than any other electricity
generation option with 20 manufacturing and 13 installation/maintenance jobs created per
installed megawatt. This represents substantial potential job growth for West Virginia in an
otherwise faltering economy. While the installation and maintenance jobs created are all
intrinsically linked to local job creation, the manufacturing jobs that are created are linked to

19
the factories where the PV panels are built. We strongly believe that PV module, wafer, and
inverter manufacturing plants will be developed in WV as well.5 PV companies locate
manufacturing facilities near thriving markets to cut down on transportation costs and areas
with appealing incentives, therefore, West Virginia is uniquely suited to capitalize on the
manufacturing job creation potential associated with the growing PV market for the following
reasons (see Appendix A).
West Virginia’s location would allow manufacturers overnight access to over half of the
population of the United States markets by means of the state’s access to enormous railway
infrastructure. Also, business costs in the state are 13% below the national average according to
the West Virginia Department of Commerce. These factors, along with the presence of a labor
force already trained in the energy industry (coal and natural gas), can be utilized to establish
West Virginia as the hub for the PV industry on the eastern seaboard of the United States.
Furthermore, the coal fields of West Virginia are ripe with potential for the deployment of
utility-scale PV generation capacity, increasing aggregate demand for solar on the East Coast.
While former strip mine sites may not be attractive for most forms of investment, they are
prime locations for PV electricity generation. This massive reservoir of electrical generation can
be exported to the energy hungry population hubs of the Northeast through, for example, the
PJM power pool. The PV industry has the potential to redefine West Virginia’s economic
landscape through research, development, construction, and implementation of a domestic
renewable energy source. This can all be achieved by adopting an integrative path forward that
is built upon synergies between traditional and emerging energy resources.
Moreover, and in lieu of West Virginia supporting an integrative path forward to economic
diversification, there are additional spin offs that may spur unforeseen developments in other
sectors essentially exemplifying an emergent quality founded upon what some have called
open-innovation. In a recent report by the National Renewable Energy Lab entitled “Energy
Systems Integration: A Convergence of Ideas” it highlights some of these emergent qualities
when the authors state that “energy systems have evolved from small, local, single-service
systems (e.g., the steam engines that powered the Industrial Revolution) into highly integrated,
continental systems that deliver energy services (e.g., natural gas and electricity
transmission/distribution systems that deliver to our homes and businesses).” The report goes
on to note that “integration is also increasing between the energy system and other systems -
such as data and information networks and water systems - that traditionally have not been
5 Due to the proprietary nature of some assumptions that are informing our teams analysis, we cannot fully
disclose what we “strongly believe” to be a highly probable path forward for economic diversification in West Virginia as it relates specifically to manufacturing.

20
linked with energy” (DOE NREL, 2012, p. 3). More pointedly, the report specifically unpacks the
open-innovation quality that an integrative path forward provides:
The combination of low-cost monitoring and control and the integration of data and
information networks with energy systems is enabling advanced control and
coordination across energy pathways and scales. For example, general Electric monitors
a significant number of turbines worldwide from two locations (Schenectady, New York,
and Salzbergen, Germany) provide maintenance and operation support. In addition,
improved monitoring and control, reductions in local power production costs (e.g., from
cost-competitive photovoltaics), interactive local energy management systems, and
potential electrification of automobiles allow consumers to play an increasingly
influential role in the future of energy systems by giving them the opportunity to act as
producers as well as consumers of energy and provide services to the larger energy
system (p. 4).
With these potentials in mind as well as considering West Virginia’s most underutilized asset –
surface mining sites – perhaps the EPA has many faces within our proposed paradigm of energy
integration, one of a collaborative partner to West Virginia’s economy as opposed to an enemy.
Through its “RE-Powering America’s Land Initiative,” the U.S. EPA has instituted policies to
encourage the use of former strip mine sites for solar development. Under the terms of the
initiative, contaminated lands, landfills, and mine sites, referred to as “brownfields,” are
considered ideal hosts for renewable energy resources. Since the Initiative’s commencement in
2008, it has seen a 40% compounded annual growth rate, with large utility-scale solar projects
(10 MW +) making up nearly 60% of the total installed capacity on contaminated lands (EPA,
2013, p.1).
The EPA partnered with the U.S. Department of Energy’s National Renewable Energy
Laboratory (NREL) in August of 2010 to evaluate the potential of eight brownfield sites in Nitro,
West Virginia for utility-scale PV systems. The sites within the study were primarily used-
chemical sites and capped landfills; none were coal mines. Their report was heavily in support
of solar development, concluding that the eight sites “are all feasible areas in which to
implement solar PV systems.” The report goes on to assert that “developing solar facilities on
brownfields can provide an economically viable reuse option for sites with significant cleanup
costs or for sites where local economic conditions prohibit traditional reuse of the site, as is the
case with Nitro,[West Virginia]” (NREL, 2010, p. 35). This positive development from Nitro is
further evidence that West Virginia is well-positioned to lead the East Coast PV market.

21
IEP
Industrial
Commercial
Residential
VPP
Synthesized Roadmap for West Virginia
When considering both Sustainable Williamson and Gilliam Solar along with the findings below,
we are presented with an exciting opportunity to develop an innovative approach to solar
integration that targets both residential, commercial and industrial applications of solar PV
without ever stepping foot on a rooftop. Built upon the existing progress made by Gilliam Solar
in establishing an Integrated Energy Park TM model (IEP) for coupled generation of Natural Gas
and Solar on post-mine land use sites in southern West Virginia, Sustainable Williamson is
assessing an integrated path forward that may provide a novel strategy for the integration of
multiple energy resources in the central Appalachian coalfields and beyond which include coal,
natural gas, biomass, hydro and solar. Phase 1 of this model begins with a coupled-generation
scenario (typically 1MW of solar for every 5MW of natural gas) blending both utility-scale
Natural Gas and Solar in a profitable manner with the intention of developing a load-matching
scenario (for every MW of solar installed there is a MW of natural gas installed) by building
from WV’s existing NEM rules. This shift from coupled-generation to load-matching essentially
renders the utility-scale solar component as the primary production technology (NG -> Solar) as
opposed to a supplementary technology (Solar -> NG). In turn, it is likely that this will provide a
“north star” in terms of how West Virginia may begin developing a policy strategy with the
following delineation in mind:
To further explain this policy strategy, our team at Sustainable Williamson has developed the
following video (Energy Optimization) which specifically unpacks IEPs and how they relate to
developing virtual power plants (VPP) where the key component to this is how virtual net-
metering will provide an integrated path forward for coal country as America continues its
integration of sustainable energy resources over the coming years. The following sections
provide suggested recommendations to lower the cost of solar through enriching existing net-
metering policies as they may potentially relate to a variety of innovative financing models.
Coupled Generation
Virtual Net-Metering
Load-Matching
Virtual Power Plants
Energy Integration

22
To serve as a real world example of energy integration as it relates to Sustainable Williamson’s
pilot Energy Optimization program and the aforementioned IEPs, the City of Williamson will
follow in the footsteps of Siemens Distributed Energy Management Systems (DEMS) 2008
8.6MW pilot in Germany where the baseload will primarily be Natural Gas. With the stated goal
of the “development of marketable virtual power plant,” Siemens outlined several points that is
presently informing Williamson’s efforts:
Definition of business models in different energy markets
Definition and implementation or optimal operation strategies for distributed
generation
Implementation of innovative communication concepts between distributed generation
and DEMS (Seimens, 2013, p. 5)
It is also important to note the intended expansion of Siemens pilot to 200MW which began
merging approximately 20MW in 2012 with the objective of integrating “different distributed
energy sources such as biomass plants, biogas block heating plants, wind turbines, and
hydroelectric plants throughout the whole of Germany.” (p. 7)
The innovative nature of Sustainable Williamson’s efforts should be obvious given that “the
integrated operation of multiple integrated renewable resources, energy storage, demand
response are largely uncharted” (Seimens, 2013, p. 10) as well as considering the novelty of
IEPs which are an essential part of the energy integration equation, that is, bridging the gap
between traditional and emerging energy resources in a synergistic fashion. According to
NREL’s insightful whitepaper entitled “Energy Systems Integration: A convergence of Ideas,” an
emphasis upon synergies or a “holistic approach” is paramount because “there is significant
danger that local optimizations may produce a solution that is far from global or societal
optimum.” Given the integrative nature of the Energy Optimization program that seeks to
develop linkages between IEP’s (global optimization) and local micro-grid (local optimization)
build out, it should be noted that our approach plays a significant role in filling knowledge gaps
or management uncertainties where a “set of optimal subsystems may improve global results
and resilience, but the boundaries between subsystems are unclear, and interactions between
subsystems have not been defined” (NREL, 2012, p. 6). Moreover, “if these systems are well
integrated into the larger energy system with correct control signals, the same local controls
can be used to provide ancillary services to the grid to facilitate the use of more wind and solar
energy” (p. 7). A case in point are the load matching pursuits related to the IEP model which
involve a 1 to 1 ratio of Natural Gas to Solar (NG -> Solar).

23
Utility Sector Solar and the Probable Rise of Virtual Rooftop Solar
Paradoxically, our team has found that the paradigm of rooftop installations may be
decreasingly relevant due to the various cost efficiencies resulting from an aggregated solar
approach. These include but are not limited to: lower transaction cost, economies of scale,
lower labor cost through mechanization, and the availability of federal loan guarantees. Within
the solar energy market, there are primarily three market sectors: residential, non-residential,
and utility. Together, the residential and non-residential sectors make up “distributed
generation installations.” There is a very simple and obvious trend within the solar market, as
summarized by the Interstate Renewable Energy Council: “PV installations are getting larger,”
especially among utility-sector installations (IREC, 2012, p. 22). From 2010 to 2011 the average
size of a distributed PV installation grew by 46% to 18kW, and the average size of a utility-
sector PV installation increased by 250% to 4.62 MW.
Average size of distributed generation PV installations (IREC 2012).
The industry is clearly embracing the benefits of utility PV, as demonstrated by the sector’s
enormous growth. The rise of utility-sector solar projects began with an increase from almost
0% to 15% of all grid installed PV capacity in 2009. These projects increased to 32% of all
capacity in 2010, 38% in 2011, and finally in 2012 utility solar made up 53% of all solar capacity
in the United States, and it is the fastest-growing application of solar power plants in the PV
industry (IREC, 2013, p. 7). Large-scale solar projects will continue to grow as more states enact
higher renewable standards portfolio requirements, create larger solar-carve outs, develop
their solar renewable energy credit markets, and continue tax rebate programs that augment
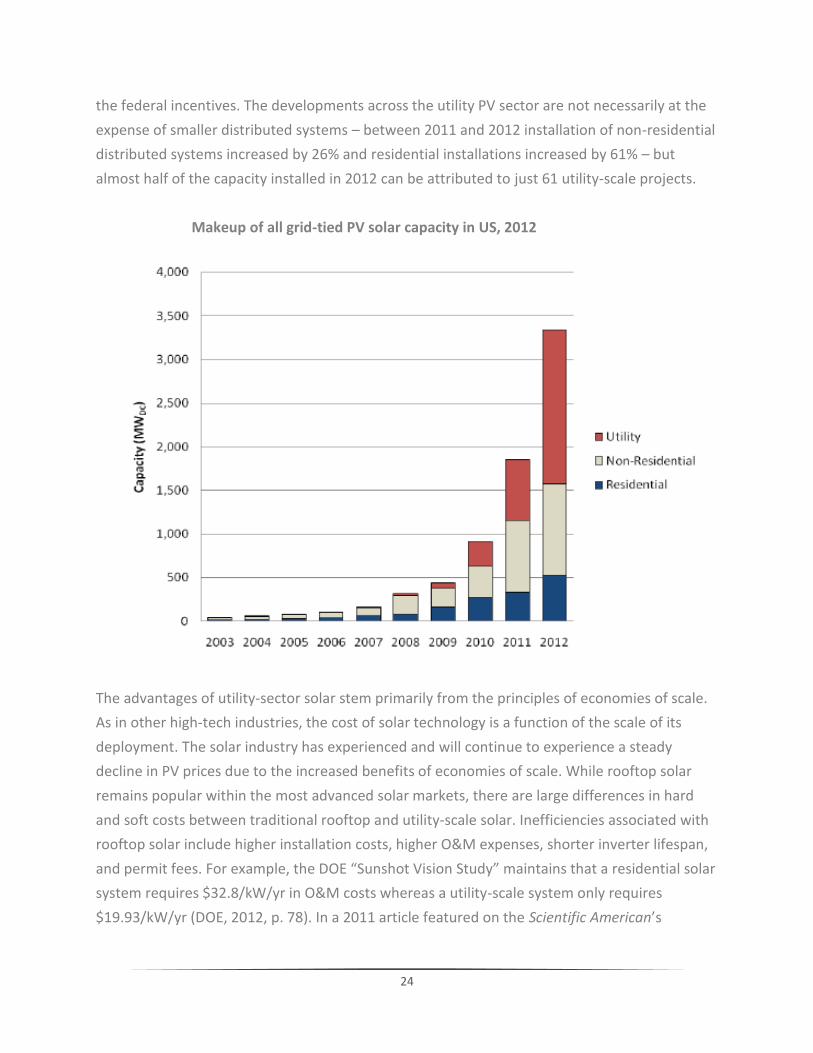
24
the federal incentives. The developments across the utility PV sector are not necessarily at the
expense of smaller distributed systems – between 2011 and 2012 installation of non-residential
distributed systems increased by 26% and residential installations increased by 61% – but
almost half of the capacity installed in 2012 can be attributed to just 61 utility-scale projects.
Makeup of all grid-tied PV solar capacity in US, 2012
The advantages of utility-sector solar stem primarily from the principles of economies of scale.
As in other high-tech industries, the cost of solar technology is a function of the scale of its
deployment. The solar industry has experienced and will continue to experience a steady
decline in PV prices due to the increased benefits of economies of scale. While rooftop solar
remains popular within the most advanced solar markets, there are large differences in hard
and soft costs between traditional rooftop and utility-scale solar. Inefficiencies associated with
rooftop solar include higher installation costs, higher O&M expenses, shorter inverter lifespan,
and permit fees. For example, the DOE “Sunshot Vision Study” maintains that a residential solar
system requires $32.8/kW/yr in O&M costs whereas a utility-scale system only requires
$19.93/kW/yr (DOE, 2012, p. 78). In a 2011 article featured on the Scientific American’s

25
website, DOE NREL data on the average cost per solar watt between the years 1980 and 2009
was demonstrated to follow an almost straight line on a logistic scale, implying that the cost of
solar PV falls exponentially with deployment, which suggests there may be a “Moore’s law for
solar” (Naam, 2011). When interviewed by our research team, SEPA Senior Research Associate
Bart Krishnamoorthy stated that “it is typically cheaper to install a 1 MW ground mounted over
one-hundred 10 kW rooftop systems because of soft costs and labor costs. Rather than
interconnecting one hundred systems, which takes additional time, money and permits, a 1
MW system would be a better value proposition. The price of modules also typically goes down
through large purchase orders as well; this also includes other components such as inverters
and racking supplies” (personal communication, June, 14 2013). These economies of scale are
well represented by the discrepancies between residential and utility-scale solar prices -
$4.93/Watt and $2.27/Watt, respectively, and over the past three years the cost decline has
been greater for utility installations than it has for distributed installations (SEIA, 2013,
“Installed Price”) (IREC, 2013: p 6).
Electricity prices over time, by sector. (SEIA 2013).
Another huge shortfall of rooftop solar – not all rooftops are suitable for solar installation.
Many rooftops do not face true south, the direction relevant to Northern Hemisphere solar

26
applications. Furthermore, certain rooftops are at an improper angle with the sun to
accommodate efficient solar panels. A 2012 study by the NREL found that only 22% to 27% of
residential rooftop area is suitable for hosting an on-site PV system (DOE NREL, 2012, p. 3).
Current trends across the public utility sector indicate that most of the industry remains
hesitant to develop and operate their own solar systems. In 2011, utility companies owned only
28% of utility sector PV installations, while two-thirds of the industry’s solar was obtained
through power purchase agreements, a financial tool discussed below (this was using data
extrapolated from 86% of utility-sector installations according to Larry Sherwood of IREC). For
instance, the largest two utility-scale solar projects developed in 2011, the 49 MW Mesquite
Solar 1 Plant in Arlington, AZ and the 35 MW plant in Webberville, TX, are owned by third party
financers. These third parties sell the solar energy to Pacific Gas and Electric Co. and Austin
Energy, respectively (IREC, 2012, p. 19). Many utilities seemingly go to great lengths to avoid
having to manage their own solar systems; many have developed rigorous solar purchasing
models, such as Dominion’s Solar Purchasing Program, a form of feed-in-tariff arrangement that
accounted for 2% of “utility-owned” solar capacity in 2012. In 2012 only 5% of utility-scale solar
installations were utility-owned, according to Sherwood, while 93% of utility PV is obtained
through PPAs.
Private solar financer-installers have begun to recognize the value of larger-scale solar projects
as well. Solar Mosaic, a three-year-old solar energy firm based in Oakland, CA, obtained over
$300,000 in private investments for a crowd-sourced solar initiative in a matter of twenty-four
hours in January 2013. The model works through small private contributors who may invest as
little as $25 into a given solar project and who are rewarded with a typical return of 4.5% once
the project begins operation for local energy consumers. Solar Mosaic’s first five projects were
their smallest – PV systems ranging from 1.5 kW to 29 kW – and they did not include a return
on investment (Solar Mosaic, “Browse Investments”). Since the firm’s sixth project, which
began the return on investment trend, their projects have been growing to full commercial-
scale capacity, reaching 114 kW and 487 kW systems as of late.
Perhaps more importantly, the solar installer-financer market leader, SolarCity, launched a
successful IPO at the end of 2012. Since 2008, the company has integrated large distributed
installations with power agreements to supply corporations such as Wal-Mart, Toyota, SpaceX,
and eBay with solar energy. SolarCity is also beginning to incorporate ground-mounted PV

27
systems, as in the case of the 947 kW King Estate Winery project. SolarStrong’s largest
completed project to date is a 6 MW ground-mount and rooftop system for the Davis-Monthan
Air Force base in Tucson, AZ (SolarCity, “Military”). Be it small 2kW residential rooftop solar or
multi-megawatt systems, SolarCity views itself as a utility company. “We sell energy, not
equipment,” says SolarCity CEO Lyndon Rive. Terry Grant, managing director at investment
bank Marathon Capital states, “SolarCity said to the investment world: people always pay their
utility bill…If they can act like a utility that happens to be solar, that’s a really good thing” (Clean
Edge, 2013, p. 11). SolarCity is also aware of the large risks and inconveniences that may come
with installing larger systems – non-residential solar market volatility, longer project timelines,
lengthy RFP bidding processes, and the fact that municipal, industrial, and commercial clients
typically face different electricity rates and rate structures than residential clients, among other
issues. Thus, compared to the first quarter of 2012 when non-residential systems made up
45.5% of the firm’s new installations, 190 of SolarCity’s 250 MW to be installed for 2013 will be
dedicated to residential systems (Kurlewitz, 2013). We suspect that SolarCity will remain
focused on its residential third party ownership model due to these difficulties in working
across sectors. Nonetheless, IREC’s 2013 “U.S. Solar Market Trends” report concludes “U.S. PV
market growth will continue in 2013, with larger utility-scale projects leading the way” (IREC,
2013, p. 17).
A virtual rooftop system, i.e. a local offsite utility-scale solar array that distributes energy to
individual residences, avoids the inefficiencies of rooftop solar (higher installation costs, higher
O&M expenses, shorter inverter lifespan, etc.). This model should make use of “virtual” meter
aggregation, or virtual net metering, a practice currently in place in a number of states including
West Virginia. Within a virtual net metering system multiple electric meters are collected into
one inflow-outflow mechanism so that more than one consumer may benefit from a single
solar array. A virtual rooftop system is one in which many residents will acquire energy from
the centralized generation array as well as supplemental energy from conventional utility
generation when load cannot be met by solar such as the load-matching scenario mentioned
above (NG -> Solar). This system must be net-metered: the offsite solar array will be monitored
for both the energy it feeds into the grid (outflow) and the energy required on the opposite side
of the system when solar does not satisfy demand (inflow). Net generation credits will be
passed on to the virtual rooftop participants, further incentivizing investment through low
energy prices. A virtual rooftop system, similar to a solar garden, is very much akin to a type of
Community Shared Solar model, discussed in the “Financial Options” section below. For

28
example, the Clean Energy Collective, LLC (CEC) located in Carbondale, CO, provides a member-
owned model that enables individuals to directly own panels in a commercial-scale community
shared solar farm through power purchase agreements with the local electric utilities (DOE
NREL, 2012, p. 22). Moreover, given that a dominant trend in any given market is a tendency to
migrate towards economies of scale, these recent trends in utility-scale solar development and
integration should be considered when assessing the almost ideological nature of rooftop solar
for the sake of VPP deployment.
Job Creation and Tax Revenue
The first step in assessing job output from each potential IEP required a baseline density of
natural gas wells within a reasonable distance from the site – 5 miles. Using natural gas
wellhead data from the West Virginia Geologic and Economic Survey’s interactive online maps,
an average production for each wellhead was evaluated based upon production between the
years 2008 and 2012. Using .KMZ files pinpointing ten “AM active” and “A2 active, reclamation”
surface coal mining sites across six West Virginia counties, natural gas wellhead data from the
West Virginia Geological and Economic Survey’s interactive maps, and information from the gas
generator suppliers, it was determined that around 13 wells on average would be able to
supply our 10 MW natural gas facility (see Appendix B). Our team found at least 60 active
surface mining sites, all of which were in close proximity to over 13 wellheads. Running NREL’s
Jobs and Economic Development Impact models for 2 MW of solar capacity and 10 MW of
natural gas capacity, the following table displays potential job growth for West Virginia given a
full deployment of IEP’s across the state:
Construction
period* jobs per
site
Operations
period** jobs per
site
Full
deployment
construction
period* jobs
Full deployment
operations period**
jobs
Solar 16 1 960 60
Natural gas 28 12 1680 720
Total 44 13 2640 780
*Construction period jobs are defined in full-time job equivalents, or 2080 hour/year units; that is, the number of full-time
jobs sustained for one year during the span of IEP construction. Full deployment refers to the construction of 60 IEP’s.
**Operations period jobs are sustained throughout the lifespan of the IEP.

29
Again, this is a conservative estimate of job creation, especially given that these figures only
include solar and natural gas deployment, neglecting biomass and smart coal
development/research potential on these sites.
As for tax estimates, each integrated energy park would be subject to the West Virginia
business and operations (B&O) tax as well as the local property tax. According to data provided
by Mark Muchow and Jeff Amburgey of the West Virginia Department of Revenue, as well as
being subject to a 6.5% corporation net income tax, each 12 MW IEP would be expected to
contribute around $54,500 per year in B&O tax. As for property taxes, each IEP would be
subject to an average 2.21% or 2.85% tax on 60% of assessed land value, depending on whether
the site is located outside of or within a municipality. In total, the IEP model presents large job
creation and tax revenue growth for West Virginia as well as for coal companies with
performance bonds tied up in the reclamation process.

30
Recommendation: Activate the West Virginia Solar Energy Industry Association (WV-SEIA) and
develop the board of directors (BOD). The Solar Energy Industry Association is a national trade
association dedicated to the many aspects of solar project development, and it has well-
established state chapters operating in fourteen states. The WV-SEIA board of directors should
represent a diverse body of solar industry and energy policy experts throughout West Virginia.
This association should actively remain a neutral market-development entity and avoid any and
all relationships with entrenched environmental groups6 in order to develop a collaborative and,
in the end, successful policy strategy.
At present, there are few programs that encourage collaboration across the energy sector. To
date, Community Power Network has initiated an open discussion group entitled WV-SUN to
encourage emerging advocates of solar to engage in open discussion regarding developing the
solar industry in West Virginia. Additionally, the West Virginia Environmental Council (WVEC)
has been the primary legislative body for the solar industry to date.
The WVEC
In July 2008 the West Virginia Environmental Council published the “West Virginia
Citizens’ Energy Plan” recommending that the state implement a renewable portfolio
standard requiring public electric utilities to generate 25% of their energy from
renewables (WVEC, 208, p.9). The legislature passed RPS legislation in 2009 with a goal
of 25% of energy to be derived from renewable and alternative energy sources including
natural gas and clean coal technologies. The WVEC also recommended the
implementation of a state tax incentive for solar systems, in particular, solar water
heaters. This was also enacted in 2009.
According to Don Garvin, Legislative Coordinator for the WVEC, the group’s “most
important legislative accomplishment regarding solar is the $2000 residential solar tax
credit passed by the legislature in 2009.” This state income tax credit allows for a private
resident to receive up to a credit worth 30% of the installed cost of the solar system,
6 Environmental groups that are explicitly anti-fossil fuel and would not be supportive of a collaborative approach
suggested by this report, that is, an integrated path forward.
Solar Initiatives

31
with a cap at $2000 (personal communication, July 26, 2013). The state income tax
credit for solar is slated to expire in July of 2014.
In 2012 the WVEC successfully lobbied for House Bill 2740. The bill reads as follows:
“Therefore, any covenant, restriction, or condition contained in any governing
document of a housing association executed or recorded after the effective date of this
section that effectively prohibits or restricts the installation or use of a solar energy
system is void and unenforceable…” That a housing association can refuse or deny the
implementation of solar systems in “common areas” and “common structures” remains
valid.
Universities
West Virginia University’s participation in the Department of Energy’s Solar Decathlon:
WVU is competing in the 2013 Solar Decathlon with their entry, a house entitled
“PEAK.” PEAK is a self-sustaining log cabin structure that utilizes a PV generation system
as well as a solar powered hot water system, along with structural insulated panels and
many smart-technology applications that minimize energy usage (WVU Solar Decathlon,
“The Design”).
Marshall University’s Center for Environmental, Geotechnical, and Applied Sciences
completed a 6 kW solar project atop University High School in Huntington in partnership
with the West Virginia Department of Energy and the West Virginia Brownfields
Assistance Center. University High School itself is located on a reclaimed surface mine
site. The system includes real-time data monitoring that will be incorporated into the
school’s science classes (Marshall University, 2012).
The American Public University System in Charles Town, WV is currently home to the
largest solar array in the state. The system was successfully completed in the middle
part of 2012, and it is a 407 kW-capacity, 1600-panel array.

32
Recommendation: Upon consideration of regulatory recommendations (below), the following financing options should be aggressively pursued in collaboration with our team of finance experts to further reduce barriers to market penetration.
The three main pillars of competitiveness in the solar industry are the ability to acquire
customers at low cost, install inexpensively, and achieve low cost of capital for leases or power
purchase agreements. To realize a low cost of capital solar, dealers and developers must often
partner with so-called “tax equity” investors due to the structure of state and federal solar
incentives. Successful solar financing models make strategic use of as many municipal, state
and federal incentives as possible but maintain consideration of market trends and technical
details. The current market orientation away from rooftop and towards utility scale solar – as
discussed in the market analysis – and the technical efficiencies of the latter which account for
this shift, weigh heavily in the financial analyses and recommendations for our own projects.
Organizations seeking to develop solar energy on their own facilities (“hosts”) should
thoroughly review the relative advantages and disadvantages of the precedent solar financing
models when designing their own approach. They should also research any relevant
government incentives applicable to their jurisdiction and local solar energy service providers
should they choose to develop solar energy. This section discusses some of the major solar
energy financing models and is intended to assist policymakers, businesses, nonprofits,
government agencies, suppliers, service providers and contractors, and others prospectively
pursuing solar energy development.
Below are a variety of models that have been devised by a broad range of solar investors and
developers to most effectively take advantage of state and federal incentive structures given
their circumstances.
Commercial Enterprises and Private Individuals
Self-Ownership and Self-Financing
Simply put, in the self-ownership and self-financing model a company (the host) purchases and
develops a solar project from a solar energy developer, paying the up-front costs. The energy
Financing Options

33
produced is used for the owner’s own needs, and any surplus, depending on the jurisdiction,
may be sold to the local utility. The owner may benefit from federal and state tax incentives,
from a potential net metering arrangement that credits the owner’s electricity bill, as well as
from the selling of any renewable energy credits that become available through solar power
production (discussed below). The owner is responsible for the operations and maintenance of
the installation.
Third Party Ownership Models
1. Leasing: Solar energy developers often do not require the host to pay substantial or any
up-front costs; instead, the solar energy project is amortized over years or even
decades. The host makes lease payments to the developer for the installation, and uses
the energy produced. A higher down payment on the lease will reduce the monthly
lease payment: there is the possibility of positive cashflow from day one of the solar
installation, should the lease payments be less than the original electricity bill. On the
developer’s side, some finance companies specialize in arranging the financing for
developers’ solar installation costs. The host and the developer will decide which party
is responsible for upkeep and repair costs, although SolarCity, the nation’s largest
residential solar financer-installer, insures all O&M costs are covered within the lease
contract. Typically the host will have the option to buy the solar system at the end of the
lease agreement.
2. LLC Leasing Model – Investors form necessary legal structures (a Limited Liability
Company) through which they contribute to the installation of the renewable energy
project. Once the system is installed, the LLC owns it and can generate a modest return
on investment over a 5-7 year period through incentives including accelerated
depreciation, a federal investment tax credit, the sale of produced electricity and
renewable energy credits (RECs). During this time, the LLC will lease space for the
system from the community organization. After 5-7 years, the LLC may decide to donate
the system to the community group as a charitable donation. The system will continue
to produce clean energy, and could be a source of electricity or revenue for the
organization for another 15+ years.
3. Solar Power Purchase Agreements: In Solar Power Purchase Agreements, or Solar PPAs
or SPPAs, companies (the host) contract with solar energy developers to install solar
panels on their properties at no initial cost. The company (the host) and the developer

34
negotiate a long-term (10, 15, or more years) price for the solar electricity, and the host
pays the developer for the quantity of energy produced by the system. As with self-
ownership, any surplus, depending on the jurisdiction, may be sold to the local utility via
net metering. The developer still owns and operates the installation, and as such can
receive eligible tax credits such as ITCs and NMTCs for solar energy. The developer also
receives any available solar renewable energy credits, thus further reducing the overall
price offered in the host’s energy purchasing contract. A crucial aspect of the PPA
structure is that a system owner (by means of a third-party developer) can take
advantage of federal tax incentives that a tax-exempt entity cannot. This model
increasingly makes up a larger part of new solar energy development.
Securitization
An emerging and yet untested financial strategy within the solar industry, securitization
involves constructing a portfolio of contracted revenue from solar projects, bundling the
portfolio, and selling it as individual securities. This process aggregates pools of future
payments on solar loan or power purchase contracts, and through a structuring process
transforms their future cash flows into a security. Such transactions could provide the issuers'
overseers with a significant amount of upfront cash for capital spending or other business
ventures. The U.S. Department of Energy (DOE) has formed the Solar Access to Public Capital
(SAPC) working group through NREL to facilitate securitization of solar by standardizing the
power purchase agreements (PPAs), leases, and other instruments on which they are based and
to improve clarity on risk. In a 2012 Standard & Poor's report, the firm details three categories
of risk: (1) limited performance data, (2) a lack of large-scale services, and (3) declining panel
prices, but it nonetheless concludes that the “securitization of solar systems could be a feasible
financing tool for developers who wish to monetize future cash flows” (S&P, 2012, p.7) It will
cut developers’ financing cost because “the creditworthiness of the transaction is dependent
upon the collateral pool and not the credit quality of the issuer, which in most cases is in the
speculative-grade category” (p. 7). This financial innovation could help make solar technologies
even more affordable for an average consumer because it will bring in investors who don’t have
the wherewithal to look at solar directly but know securitized products.

35
Feed in Tariff
The feed-in-tariff (FIT) is a
policy mechanism designed to
accelerate investment in
renewable energy technologies.
It achieves this by offering long-
term contracts to renewable
energy producers, typically
based on the cost of generation
of each technology. FIT’s offer
cost-based compensation to renewable energy producers by providing price certainty and long-
term contracts that help finance renewable energy investments. Under the final order of the
Federal Energy Regulatory Commission’s PURPA Avoided Cost Docket 4822-U, electrical utilities
are required to purchase power at their avoided cost, i.e. their marginal cost of producing an
additional quantity of energy. The tariff (or rate) may differ to enable various technologies to be
profitably developed. This may include different tariffs for projects in different site locations
(e.g. rooftop versus ground-mounted solar PV projects), of different sizes (e.g., residential or
commercial scale), and sometimes for different geographic regions. The tariffs are typically
designed to ratchet downward over time to both reflect and encourage, technological change.
The fact that the payment levels are performance-based puts the incentive on producers to

36
maximize the overall output and efficiency of their project. Below are a few examples of FIT
programs currently being adopted by utility companies and communities in the United States.
1. Dominion Resources Inc.: This utility company operates and supplies energy in the
Midwest, Mid-Atlantic and Northeast regions of the U.S currently offers Virginia
residents access to a pilot Solar Purchasing Program. The format of this model is as
follows: Participants install and own the solar generation system but sell the electricity
and Solar Renewable Energy Certificates (SRECs) back to Dominion at a premium rate of
$0.15/kWh, Dominion’s avoided cost. Participating customers will continue to purchase
all of the electricity for their home or business from Dominion on their current rate
schedule. Dominion also purchases the SRECs on behalf of its customers who wish “to
support the development and production of renewable energy in Virginia and our
surrounding region” through the company’s Green Power® program. Participants in the
program can match 100 percent of their electricity use in renewables, or they can buy
154 kilowatt-hour blocks of renewables for $2 each. The charges for these purchases are
added to the participating customer’s bill (Dominion Resources Inc., “About the
Program”).
2. Georgia Power: In its Solar Buy Back Program, the firm purchases renewable energy
from eligible providers (solar system hosts) on a first-come, first-serve basis until the
cumulative generating capacity of all renewable sources reaches a specific amount set
by the Georgia Public Service Commission. The company will pay its avoided cost as
defined by the most recent informational filing made by the company in compliance
with PURPA. Georgia Power may purchase additional energy from the provider at an
agreed upon price. Qualifying customers may sell all of the energy produced from solar
installations (granted they are ≤100 kW in size) to Georgia Power at the “Solar Purchase
Price,” which is currently 17 cents per kWh (Georgia Power, “Selling”).
3. Marin Clean Energy (MCE): In 2010, Marin Energy Authority launched, Marin Clean
Energy, the first Community Choice Aggregate Feed-in Tariff program. To streamline the
procurement process for small local renewable energy systems, MCE has designed a
feed-in tariff to provide long-term contracts for renewable energy system owners.
System owners are obligated to sign 20-year contracts. The tariff is determined by the
program’s total remaining capacity before the contract is signed. The characteristics of
the renewable energy system – whether the energy is generated during peak hours
(solar), around the clock (biomass, fuel cell, landfill gas) or intermittently (wind) – are
considered as well when determining the tariff (MCE, “Frequently Asked Questions”)

37
Property Assessed Clean Energy (PACE)
PACE a local government/community initiative that began in 2008 for energy efficiency building
modifications; it is currently only available to commercial enterprises after the residential PACE
program was halted in 2010. The PACE program begins with a local government establishing, in
law or public policy, “a specific goal or objective: promoting energy efficiency as a means to
promote jobs or better air quality, for example” (PACENow, “Commercial PACE”). The owner
procures a thorough energy audit of the property for a project cost/savings analysis of the
modifications, then the municipality sells bonds secured solely by participating property
owners. Projects receive 100% financing from the municipality who agree to accept a property
tax assessment for up to 20 years. 71 commercial-scale projects have been financed through
PACE (“Commercial PACE”).
Community Shared Solar
A Community Shared Solar installation is a large solar array interconnected to the utility
distribution system, in which the generated electricity is credited to “subscribers” of the
installation. Community shared solar allows customers who are otherwise unable to have a
solar system, such as renters or property owners with poor solar access, to receive solar
electricity from an offsite system. “System community options" expand access to solar power
for renters, those with shaded roofs, and those who choose not to install a residential system
on their home for financial or other reasons. Ratepayers and taxpayers fund solar incentive
programs. Accordingly, as a matter of equity, solar energy programs should be designed in a
manner that allows all contributors to participate. Furthermore, as opposed to standard
residential rooftop generation, Community Shared Solar benefits from economies of scale.
Currently About 1.5%, or 17 MW of distributed PV systems use a Community Share Solar model
(IREC, 2012, p.21). Depending on the needs of the community pursuing shared solar different
models may be adopted:
Utility-Sponsored Model: A utility owns or operates a project that is open to voluntary
ratepayer participation. (Examples: Sacramento Municipal Utility District –Solar Shares
Program; Tucson Electric Power – Bright Tucson Program)

38
Special Purpose Entity (SPE) Model: Individuals join in a business enterprise to develop
a community shared solar project. (Examples: University Park Community Solar LLC;
Clean Energy Collective LLC; Island Community Solar LLC)
Nonprofit Model: A charitable nonprofit corporation administers a community shared
solar project on behalf of donors or members, and the nonprofit receives solar
electricity, RECs, and net metering benefits as well. (Examples: Winthrop Community
Solar Project; Solar for Sakai)
Public Entities
Self-Ownership
As with the self-ownership model for corporations, simply put, a government body (the host)
contracts with a developer, typically selected through a competitive bidding process after
issuing a request for proposals (RFP), to obtain a solar installation to power public buildings.
Any surplus, depending on the jurisdiction, may be sold to the local utility. The government
entity issues bonds with long-term maturity to finance the up-front costs of solar energy
development. Depending on the laws and regulations of the state, bonds may be issued
specifically for solar energy development, or general revenue bonds or other bonds or financing
may be used. The government entity is then responsible for the operations and maintenance of
the installation. In general, governments have lower borrowing costs than private entities, and
by definition are not mobile, so they typically have less risk in solar energy adoption.

39
Community Choice Aggregation
Local municipalities bundle together residences and small commercial institutions into an
autonomous energy-demanding entity. The state legislature must mandate the creation of local
government CCA’s, a policy that has been successfully implemented in California, Illinois,
Massachusetts, New Jersey, Ohio, and Rhode Island. The CCA acts as a publically owned non-
profit energy provider. The CCA is not a muni or a co-op: “What separates CCA agreements
from the municipal utility model is that CCA’s generally take over the existing utility’s role as
provider [i.e. the guarantor of energy generation], while still relying on the previous
infrastructure and maintenance of the existing investor owned utility (IOU)” (Allen, 2012, para.
3). The CCA may or may not own the electricity generating resources. The CCA may also
incorporate a rate stabilization fund, which allows for the streamlining of energy prices even
when fuel prices rise (Local Government Commission, 2006, p.5). Individual residents have the
choice to opt out of the CCA.
Bond-PPA Hybrid Morris Model
Named for Morris County, New Jersey, where it was first implemented, the Bond-PPA Hybrid
Morris Model seeks to take advantage of government agencies’ lower borrowing costs as well
as private corporations’ solar energy tax incentives by combining features of the government
self-ownership model with the corporate Solar PPA model. A public entity (the administrator)
issues an RFP seeking a solar developer to build, operate, and own a solar project or portfolio of
projects on public buildings (local hosts). When a solar company is selected the administrator
sells bonds to finance the development costs of the PV installation. The administrator then
enters into both a lease-purchase agreement with the winning bidder and a PPA (on behalf of
the local hosts) to buy the electricity from the PV system. The solar company then passes the
money it earns from the tax incentives (unavailable to municipalities) and SRECs – sold to Utility
companies seeking comply with state Renewable Portfolio Standards – on to the administrator
in the form of discounted electricity. As with self-ownership, any surplus, depending on the
jurisdiction, may be sold to the local utility (Speer, 2012). The model has only been proven to
work in states with SREC programs.

40
Bond-PPA cash flow structure
Image courtesy of National Renewable Energy Laboratory
Nonprofits
BCCAP Model
Named after the Bergen County Community Action Partnership Inc., the first organization to
develop and implement it, the BCCAP model is specifically designed for non-profit
organizations, whether acting individually or several nonprofits collaborating. In it, a nonprofit
or group of nonprofit organizations partner with a qualified equity investor (QEI) to finance the
development of a solar energy installation. The nonprofits create an affiliate organization to
manage the project and receive the investment, which the QEI either already has raised or has
the ability to raise for the purposes of the solar energy project. In the BCCAP case, the affiliate
was a community development entity (CDE), as the projects took place in low-income areas.
Given that most nonprofit organizations are tax-exempt, they cannot benefit from the tax
credits available in solar energy. Thus, the rights and obligations of the solar installation are
transferred to the QEI so that it may reap the ITCs and NMTC’s available to solar energy, which
is a major incentive for the QEI in the first place.
Bond/PPA/BCCAP Hybrid
As with the Morris model, a government agency issues bonds to finance solar energy
development and leases out the installation to the developer, to which it makes power
purchase payments. However, the host sites are nonprofit organizations instead of public

41
buildings, especially nonprofits that contract with the government agency to provide public
services, as the government agency will benefit through reduced costs for the nonprofit and, in
turn, the granting agency. Sustainable Williamson seeks to further assess the development of
this model in the future as it relates to Community Choice Aggregation.
State and Federal Incentives/Direct Loans/Loan Guarantee Programs
New Market Tax Credits (NMTCs)
The NMTC Program attracts investment capital to low-income communities by permitting
individual and corporate investors to receive a tax credit against their Federal income tax return
in exchange for making equity investments in community development entities– a domestic
corporation or partnership which demonstrate a primary a mission of serving, or providing
investment capital for, low-income communities or low-income persons. The credit totals 39
percent of the original investment amount and is claimed over a period of seven years (five
percent for each of the first three years, and six percent for each of the remaining four years).
The investment in the CDE cannot be redeemed before the end of the seven-year period (IRS,
2010).
Federal Business Energy ITC
Private and public solar developers of residential and commercial projects are able to receive a
Investment Tax Credit (ITC) equal to 30% of total project expenses. This incentive is in wide use
and will remain in effect until December 31, 2016 (DESIRE, “Buisness”).
Federal Bonus Depreciation
Eligible renewable-energy systems properties entitle the owner to deduct a significant portion
of the adjusted basis of the property during the tax year the property is first placed in service.
For property placed in service from 2008 – 2013 the allowable first-year deduction is 50% of the
eligible basis. This legislation extended the placed in service deadline for 50% first-year bonus
depreciation by one year, from December 31, 2012 to December 31, 2013 (DESIRE, “Modified”).

42
IRS MACRS
Modified Accelerated Cost Recovery System (MACRS) is an accounting practice used to allocate
the cost of wear and tear on a piece of equipment over time – in this case, more quickly than
the expected system life. The Internal Revenue Service allows a five-year modified accelerated
cost recovery system for commercial PV systems. Although a solar array may produce power
during the entirety of a 20-year PPA, the system owner (through means of the solar developer)
can take advantage of the entire tax benefit within the first five years (DESIRE, “Modified”).
WV Residential Solar Tax Credit
Private residents can receive up to a 30% income tax credit after the purchase of a solar system,
with a $2000 cap. Solar water heating systems must derive at least 50% of energy from the sun
in order to qualify. Excess tax credits can rollover over into the next taxable year until July 1,
2014. INCENTIVE NOLONGER AVAILABLE – desire.org
WV EDA Direct Loan Program
Funds projects from $50,000 up to $10 million, includes a two tiered interest rate system: for
projects between $50,000 and $800,000, rate is the New York prime rate minus four percent,
otherwise the rate is equal to the U.S. Treasury Note rate of equivalent maturity plus three
percent. Rates have a four percent floor. To qualify, the borrower must create one job for every
$15,000 in loans. WVEDA can participate up to 45% in eligible fixed assets (land, site
preparation, construction, and equipment), and the borrower must have at least 10% equity
invested. The borrower must guarantee at least 20% of the loan or provide an Irrevocable
Letter of Credit. This is strictly a reimbursement plan as the loan occurs after the completion of
a project, thus the borrower must have interim financing before WVEDA loan approval
(WVEDA, “Direct”).
SBA’s CDC/504 Direct Loan Program
The borrower’s eventual company must operate as a for-profit enterprise, and the borrower
must have a tangible net worth of $15 million or less and an average net income less than $5

43
million after taxes for the preceding two years. The borrower must have “reasonable owner
equity to invest,” and cannot have funds available from other sources that amount to a
significant amount of the project’s total financing. In the case of a renewable energy project,
the maximum loan is $5.5 million. The project assets are considered collateral. Interest rates
are “slightly above the current market rate for five and ten year Treasury notes,” and the Small
Business Administration (SBA) includes a three percent fee that can be financed as well.
Maturity terms are between ten and twenty years (SBA, “Real Estate”).
USDA REAP
Through the Unite States Department of Agriculture’s Rural Energy for America Program
(REAP), private individuals can receive financial assistance for rural small businesses to install RE
systems in the form of loan guarantees and grants. A “small business” in the context of a utility-
scale solar producer is limited to an annual energy output of 4 million megawatt hours. The
USDA guarantees 70% of debt for projects between $5 and $10 million and 60% for projects
between $10 and $25 million (maximum). The Renewable Energy System Grant ($500,000) and
the Energy Efficiency Improvement Grant ($250,000) are available, but grants cannot fund
more than 25% or $500,000 of the project, whichever is less. The USDA combined loan
guarantee and grant requests cannot exceed 75% of the total project cost (USDA, “Business”).
Department of Energy’s REPI Program
The Renewable Energy Production Incentive (REPI) program is a direct payment to the energy
producer equal to ¢1.5/kWh valued in 1993 dollars, or about ¢2.1/kWh in 2013 dollars. The
“energy producer” must be an entity of the State or a nonprofit electrical cooperative. The
annual incentive payment lasts for the first ten years of project operation with possible funding
available for each subsequent year according to the availability of annual appropriations. The
REPI program has not been utilized since 2007, although its expiration date is 2026. This is
probably a sign that utility-scale RE projects have been increasingly designated to the private
sector (USDOE, 2007, “Renewable”).
Pilot Community Tax Equity Finance Model
The model explored by our team to finance community developed solar energy systems in
Williamson centers on tax equity finance and three key participants:

44
1. Individuals and community businesses– Community Project Funders– who principally or
wholly fund the development of a solar energy system.
2. Neighbors and community entities– Community Project Beneficiaries– who lack the
funds necessary to fully develop a solar energy system but wish to ultimately own and
operate a solar energy system developed by Community Project Funders.
3. A Limited Liability Corporation (LLC), through which the investors (the Community
Project Funders) will incorporate the project and operate the solar energy system for
the first six years (approximately) of its lifetime. The structural and operational specifics
of this entity, to be formed by the Community Project Funders, are complex and not the
focus of this case study.
In tax equity finance, Community Project Funders with a large portion of certain kinds of
income in higher brackets (most notably and advantageously passive income) can recover
between 80% and 90% of their depreciable solar energy system development expense. In cases
where these funders have especially large sums of income in higher tax brackets, it is possible
for the funder to realize a profit on their ownership interest in the development.
The funders, after fully realizing the tax benefits over a six-year period, are then able to sell the
solar energy system to the Community Project Beneficiaries at a “bargain sale to charity” price
(between 70% and 80%) over its original development cost. The option to structure a charitable
donation of the system is also possible, but more complex, and thus not discussed in this case
study. This option adds to the return for project funders and further benefits the beneficiary by
eliminating the need to raise cash for system purchase at discount.
Community Project Funders: Community project funders are individuals or local businesses
who provide the capital that is necessary to originally develop a solar energy system, such as a
solar electric system on a nonprofit, municipal or other public property. These individuals or
business partners:
1. Are able to maximally or optimally take advantage of the tax incentives offered for
renewable energy development at their level of ownership in the LLC
2. Form an LLC (Limited Liability Corporation) to develop the solar energy system
3. Manage and operate the solar electric system for the first 6 years of its 25+ year lifetime

45
4. Will most favorably have a tax liability on “passive income”, non-salary income derived
from investments or business enterprises in which the investor does not actively
participate.
5. Consult their tax professionals, such as a Certified Public Accountant (CPA) or Tax
Attorney, to ensure that they qualify for and are able to maximally and optimally realize
the tax incentives they derive from their membership interest in the LLC capitalizing,
developing and operating the solar energy system.
The Community Project Funders will receive a portion of the tax incentives equal to their
ownership interest in the LLC, i.e., an individual with a 25% ownership interest (the money they
provide to the LLC divided by the total amount of money provided to the LLC) in the LLC would
receive 25% of all tax benefits available to the LLC as a result of its solar energy system
development.
Community project Funders in West Virginia who pay substantial federal income tax on
“passive income” in the 28% - 35% tax brackets can recover 80% - 110% of their ownership
interest in the LLC vie tax incentives available for renewable energy development, as illustrated
in the figure to the right:
Upon assessing this Tax Equity Financing Model, we determined that we should consult with
our legal team at Key, Fox and Wiedman in order to understand whether:
1. Potential investors qualify for these tax credits
2. Potential investors are able to optimally and maximally receive the incentives at their
level of ownership in the LLC
3. Assumptions about WV Tax Credit were in fact applicable to the entire photo-voltaic
system
This “pilot” model proved to be unviable because of its reliance upon the West Virginia’s
Alternative-Fuel Motor Vehicles Tax Credit. Our initial assumptions led our team to believe that
by bundling the above tax credit along with both the Federal Business Energy ITC and the
Federal Modified Accelerated Cost Recovery System would actually provide a return on the
Community Funder’s investment.

46
Given that the West Virginia tax incentive is available to eligible taxpayers who construct or
purchase and install “qualified alternative fueling infrastructure,” our team came to the
conclusion that the entire solar energy system did not fall under the prevue of fueling
infrastructure due the distinction between “conversion technology” versus “storage
technology.” The language is as follows:
“Qualified alternative fuel vehicle refueling infrastructure” means property owned by
the applicant for the tax credit and used for storing alternative fuels and for dispensing
such alternative fuels into fuel tanks of motor vehicles, including, but not limited to,
compression equipment, storage tanks and dispensing units for alternative fuel at the
point where the fuel is delivered: Provided, That the property is installed and located in
this state and is not located on a private residence or private home.
“Qualified alternative fuel vehicle home refueling infrastructure” means property
owned by the applicant for the tax credit located on a private residence or private home
and used for storing alternative fuels and for dispensing such alternative fuels into fuel
tanks of motor vehicles, including, but not limited to, compression equipment, storage
tanks and dispensing units for alternative fuel at the point where the fuel is delivered or
for providing electricity to plug-in hybrid electric vehicles or electric vehicles: Provided,
That the property is installed and located in this state.
The credit provided in this article is not available to and may not be claimed by any
taxpayer under any obligation pursuant to any federal or state law, policy or regulation
to convert to the use of alternative fuels for any motor vehicle.
Additional Information
Below are introductory resources to some of the solar financing models mentioned in this
section:
Environmental Protection Agency – “Solar Power Purchase Agreements”
http://www.epa.gov/greenpower/buygp/solarpower.htm
Grow Solar Wisconsin. “Third-Party Ownership.”
http://www.growsolar.org/toolbox/third-party-ownership/
National Renewable Energy Laboratory. “Solar PV Project Financing: Regulatory and
Legislative Challenges for Third-Party PPA System Owners” by Katharine Kollins, Bethany
Speer, and Karlynn Cory. http://www.nrel.gov/docs/fy10osti/46723.pdf

47
National Renewable Energy Laboratory. “Financing Solar PV at Government Sites with
PPAs and Public Debt” by Claire Kreycik
https://financere.nrel.gov/finance/content/financing-solar-pv-government-sites-ppas-
and-public-debt
PACE – “About Pace”
http://pacenow.org/about-pace/
Rahus Institute
http://www.californiasolarcenter.org/sppa.html
Run on Sun – “Solar for Non Profits” http://runonsun.com/html/solar-for-non-
profits.html
Solar Energy Industries Association. “Third-Party Solar Financing.”
http://www.seia.org/policy/finance-tax/third-party-financing
Tioga Energy – “Solar Financing PPA” http://www.tiogaenergy.com/tioga-energy-
resource/other-solar-information/financing-solar-ppa
Solar Energy Industries Association – “Solar Power Purchase Agreements: Fact Sheet”
http://www.seia.org/research-resources/solar-power-purchase-agreements

48
Recommendations: When considering the following findings, our team strongly recommends
two specific changes within WV net metering: 1) expand the 2 mile radius limitation from “point
generation” to the entire state to allow for a broad application of virtual net metering and 2)
increase the present interconnection system capacity limitations for all categories (i.e.,
industrial, commercial and residential) as suggested by IREC’s “Best Practices” (below). With
regards to the current WV Alternative Renewable Portfolio Standards (ARPS) we recommend the
development of a solar set-aside, or “carve out,” in a manner comparable to Ohio and
Pennsylvania ARPS in order to spur continued competitive growth of solar in West Virginia but
perhaps more appropriately and in the spirit of our proposed integrated path forward we
strongly recommend the development of a carve out that incentivizes energy integration (e.g.,
solar and natural gas). Furthermore we urge that the WV Public Service Commission (PSC) must
establish rules regarding alternative energy credits ownership, which they have yet to do, for
net-metering to proceed effectively. We also recommend that the WV PSC review the time-of-
use pricing systems being adopted in several western states as well as the revenue decoupling
policies for electrical utilities currently employed in 30 states, both of which could save money
for WV residents, protect utilities from imminent shifts in the economic landscape and further
incentivizes growth of renewable energy development.
TPO, PPA’s and Leasing Arrangements in WV
Currently the primary reason solar financer-installers are not choosing to develop in West
Virginia is that state regulatory protocols regarding third party financing remain ambiguous. If
the WVPSC were to enact regulation designating solar third party originators (TPOs) as public
utilities, the PSC would gain a high level of control over terms rates, and conditions of service
offered by the TPO. Moreover, a determination of public utility status would likely prohibit
TPOs from direct sales of electricity within the service territories of other certificated electric
public utilities pursuant to West Virginia Code Section 24-2-11(b). The burdens of such
regulation would likely dissuade a TPO from offering service in West Virginia, and the
indeterminate status of this regulation makes for an unappealing investment market.
Regulatory Framework

49
The EPA’s “RE-Powering America’s Land Initiative” highlights the immense potential for solar
development in West Virginia that is currently being stifled by the undetermined regulatory
framework for third party financing in the state. As the agency concludes in its study of
“brownfields” (abandoned strip-mines in this case), “a third-party ownership PPA provides the
most feasible way for a [solar] system to be financed on these sites” (NREL, 2010, p.27).
Examination of whether a host customer utilizing a third-party owned system could net-meter
is important as well, because the ability to net-meter is often essential to successful financing
for on-site renewable energy systems.
In another NREL Technical Report “Solar PV Project Financing: Regulatory and Legislative
Challenges for Third-Party PPA System Owners,” outlines the most common regulatory
obstructions facing the implementation of third-party owned PV systems in the United States.
The report concludes “most state laws and regulations that complicate third party ownership in
monopoly territories have been in place for decades and did not originate specifically to
prevent the third-party PPA model. In general, the third party PPA model is not specifically
outlawed” (NREL, 2010, p.7). Third party ownership may become an issue under the following
conditions:
The definition of electric utility is a “seller of electricity”: The solar PPA model specifies
that the customer would directly purchase their energy from the solar developer, thus
making the developer a seller of electricity and susceptible to being deemed a public
utility, should a state have defined a public utility in such a manner. California,
Colorado, Florida, and Arizona have all faced this issue regarding the implementation
of PPAs; California and Colorado have passed specific legislation to exempt a third-
party owned system from being considered a public utility.
The definition of electric utility specifies the use of “power generation equipment”:
The solar developer in a PPA may be qualified as a public utility because the developer
manages electric power generation equipment. Such was the case in Oregon and
Nevada, both of which passed legislative and regulatory solutions. Nevada’s solution is
of particular interest: The Public Utilities Commission of Nevada declared third party
owned systems as non-utility entities. Special consideration was given to these
systems’ ability to incorporate net metering because “allowing third-party ownership
of net-metered systems is consistent with state policy goals to encourage the
development of, and private investment in, renewable energy sources, stimulate
economic growth in Nevada, and enhance the diversification of energy sources” (p.

50
12).
Net metering: Under favorable net metering circumstances, solar energy generated in
excess of onsite load is sold back to the utility and then credited to the customer’s
electrical bill, thus greatly incentivizing (larger scale?) solar deployment. But, third
party owned systems might not qualify as facilities or customers that are allowed to
net-meter. This issue has been problematic in New Jersey and Texas and has only been
resolved successfully for TPO in New Jersey. According to the state’s revised net
energy metering (NEM) and interconnection rules, a “customer-generator facility” is
defined as “…the equipment used by a customer-generator to generate, manage,
and/or monitor electricity” (p. 16). Because the host in a PPA model uses the
developer-owned electrical equipment, i.e. the solar system, the host is eligible for net
metering.
The West Virginia 2009 Alternative Renewable Portfolio Standards legislation defines “electric
utility” in section 24-2F-3:
"Electric utility" means any electric distribution company or electric generation
supplier that sells electricity to retail customers in this state. Unless specifically
provided for otherwise, for the purposes of this article, the term "electric utility" may
not include rural electric cooperatives, municipally owned electric facilities or utilities
serving less than thirty thousand residential electric customers in West Virginia.
At first it may seem that any implementation of TPO solar systems may be obstructed by the
clause stating that an electric utility is defined as “any electric generation supplier that sells
electricity.” However, as long as the solar provider has contracted fewer than “residential
electric customers,” it will not be labeled an electrical utility. . There should be legal research
conducted with regards to confirming/refuting this conclusion, as well as towards addressing a
scenario where a solar developer has aggregated 30,000+ customers within West Virginia.
Regarding NEM eligibility, we have considered whether the PSC’s current regulations would
permit customers with TPO system to net-meter their system as well. The NEM regulations
appear to allow TPO systems that are leased, but would appear to prohibit TPO systems that
are installed pursuant to a PPA with the host customer. This is because the NEM regulations
restrict eligibility to the program for a “customer-generator” who either owns and operates a
NEM facility or leases and operates a NEM facility. Therefore, one should expect a conflict

51
similar to New Jersey’s net metering situation in which “customer-generator” was defined as
one who either owns or operates an NEM facility, but was later changed to refer to a party that
simply “uses” the equipment. But, as with NREL’s findings on Nevada’s NEM and
interconnection laws, the “Vision Statement of the [West Virginia] Public Services Commission”
specifically states that the body will “work tirelessly to assure…an increase in business
investment, job creation/retention and the state’s overall competitiveness…that consumers
receive the best value in utility service from financially viable and technically competent
companies…” (WVPSC, “Mission”). With its declaration that net metering further promotes the
deployment of solar PV systems, the Nevada Public Utilities Commission has provided a
valuable precedent that the WVPSC should review.
West Virginia’s Alternative Renewable Portfolio Standards
Currently 29 states and the District of Columbia have enacted renewable portfolio standards
(RPS) for electrical utility companies. RPS legislation sets a goal for a specific output or
percentage of public utility energy to come from alternative or renewable energy sources by a
specified date. In 2009, West Virginia enacted an ARPS (Alternative Renewable Portfolio
Standard) with a goal of 25% of investor-owned utility (IOU) energy to come from alternative or
renewable energy sources by 2025, either through direct generation or through the purchase of
renewable energy credits (RECs). The ARPS does not include a set-aside for solar energy.
Qualifying renewable energy sources include solar, wind, hydro, biomass, and geothermal.
Qualifying alternative energy sources include clean-coal technology, coal-bed methane, natural
gas, clean coal, synthetic gas, integrated gasification combined cycle, and many more. The state
established benchmark goals that 10% of IOU’s with more than 30,000 customers would
generate energy from these renewable sources from 2015 to 2019, 15% from 2020 to 2024,
and 25% by January 1, 2025. Natural gas may only contribute up to 10% of the total generation
to be considered for meeting the RPS; otherwise there is no minimum contribution from
renewable energy sources (DESIRE, “West”)
The West Virginian ARPS is a goal, with non-compliance projected to be a non-issue in the
coming years largely because the legislation is more an “Alternative Portfolio Standard” instead
of a “Renewable Energy Standard,” hence the establishment of an “Alternative Renewable
Energy Credit” market instead of the traditional “Renewable Energy Credit” market (personal
interview with Steve Kominar, June 2013). Compliance with ARPS goals will be evaluated by the

52
West Virginia Public Services Commission and will be based upon an IOU’s required number of
ARECs; the PSC will begin evaluation in 2015.
One AREC is awarded for each megawatt-hour (MWh) generated by alternative energy
resources, two ARECs are awarded for every MWh generated by renewable energy resources,
and three ARECs are awarded for every MWh generated by renewable energy sources located
on a reclaimed surface mine in West Virginia. The PSC may also grant one AREC to an IOU for
every ton of carbon dioxide reduced or offset by RPS compliance and for every MWh conserved
via demand-side management technology implementation. ARECs may be generated or
purchased from a facility in West Virginia or within the PJM service territory (DESIRE, “West”).
It is quite possible that an AREC will be diminutive in value compared to other REC or solar
renewable energy credits (SRECs) because of the absence of a strictly renewable energy
requirement, and because the PSC has yet to establish firm noncompliance measures. There are
only three other states that have retained a serious commitment to clean coal technologies
(coal mine methane, integrated gasification combined cycle, etc.) within their RPS guidelines:
Pennsylvania, Ohio, and Michigan. Both Pennsylvania and Ohio have a solar side-aside for 0.5%
of total IOU electrical output by 2020 and 2024, respectively, and therefore have solar
renewable energy credits instead of simply ARECS. In order to spur a healthy growth of solar
within West Virginia, the state should implement a solar set-aside, or “carve-out,” in a manner
comparable to these states with the most similar RPS guidelines as West Virginia (DESIRE,
“Ohio,” “Pennsylvania”)
After establishing the institutional framework for an AREC market, a state with RPS legislation
must then implement a process by which an independent energy producer may register with
the state to earn actual ARECs. This process varies state by state and is always under the
jurisdiction of the state’s public utilities commission. Here we analyze the SREC/AREC
registration processes of Ohio, Pennsylvania, and West Virginia:
Ohio: The entire process of being considered a qualified “Renewable Energy Resource
Generating Facility” may be completed on-line. A registration walkthrough can be found
on the Public Utilities Commission of Ohio’s website, along with all required forms. The
applicant must first reserve a case number through the PUCO Docketing Information
System, which can be found on the commission’s website. Then the applicant completes
an online REN (Renewable Energy Resource) form – fourteen pages in length. Once the
53
application is complete, it must be filed electronically in the Docketing Information
System. Finally, once PUCO approves of the renewable energy system, the system
owner must register with an AREC tracking system in order to buy and sell credits. Either
the GATS (used in PJM territory) or MISO system may be utilized (PUCO, “Docketing”).
Pennsylvania: Similar to Ohio, Pennsylvania’s entire AREC registration process can be
completed through the state’s public utilities commission website, which also contains a
walkthrough of the registration process and all necessary forms. The applicant must first
create an account on the PUC website and proceed to provide information on their
alternative/renewable energy facility in the required forms. The applicant must
complete an on-line attestation to complete the online registration. Finally, once the
PUC approves of the renewable energy system, the system owner must register with the
GATS AREC tracking system (PUC, “Pennsylvania”).
West Virginia: The state provides no on-line walkthrough of the AREC acquisition
process or required forms. There appears to be no clear registration process – our team
was directed to prior AREC filings available on the West Virginia PSC website. According
to these previous filings, the applicant must petition for certification of certain facilities
as a Qualified Energy Resource in accordance with Title 150-34 Rules governing the
ARPS rules. The remainder of the registration process is unclear – it seems that the
applicant will remain in correspondence with the WV PSC to follow up with various
renewable energy generation qualification issues until AREC certification is awarded or
denied.
Net Metering Trends
More than 40 U.S. states plus the District of Columbia and four U.S. territories have established
net metering policies, and many have subsequently expanded their policies to accommodate
expanding solar markets. Net metering is the application of an electrical meter system that
monitors customer inflow (consumption) of energy and customer outflow (production) of
energy via a distributed energy resource system. The customer’s produced energy is sent to the
grid, at which point the customer will receive a net metering credit to help offset their
electricity bill. 20 states (plus the District of Columbia and Puerto Rico) allow net metering for
certain systems one megawatt (MW) or greater in capacity. At the upper end of the spectrum,
Massachusetts allows net metering for certain systems up to 10 MW, and New Mexico allows
net metering for certain systems up to 80 MW. In several states, including Arizona, New Jersey

54
and Ohio, there is no stated capacity limit. In many cases, states limit systems to a certain
percentage (e.g., 125%) of the customer’s load so that customers do not intentionally oversize
their systems. Furthermore, some states have established individual system capacity limits that
vary by utility type, system type or customer type.
Some states, such as California and Utah, have increased the aggregate capacity limit for net
metering due to the rapidly growing popularity of grid-tied solar. Others, such as Pennsylvania,
have either clarified or enhanced provisions governing the treatment of net excess generation
at the end of a billing period. Many states now allow customers to carry these resulting net
excess generation credits forward to the following billing period at the full retail value of a kWh,
either indefinitely or during a 12-month period, in the case of West Virginia.
Notably, all state net metering policies include solar as an eligible technology. In recent years,
states have commonly extended net metering to other kinds of renewable energy systems as
well. Almost all states that have addressed REC ownership for net-metered systems, including
Arkansas, Colorado and Florida, have concluded that RECs belong to customers (as opposed to
utilities). The issue of REC ownership is increasingly important as utilities seek to meet
renewable portfolio standard (RPS) obligations.
DSIRE’s Summary of WV Net metering
Net metering in West Virginia is available to all retail electricity customers. System capacity
limits vary depending on the customer type and electric utility type, according to the following
table (IREC, Vote Solar Initiative, 2012, p. 99).
Customer
Type
IOUs with
30,000
customers
or more
IOUs with fewer
than 30,000
customers,
municipal
utilities, electric
cooperatives
Residential 25 kW 25 kW
Commercial 500 kW 50 kW
Industrial 2 MW 50 kW

55
Systems that generate electricity using "alternative" or "renewable energy" resources are
eligible for net metering, including photovoltaics, wind, geothermal, biomass, landfill gas, run of
the river hydropower, biofuels, fuel cells, and combined heat and power (technically called
"recycled energy" in the rules). Net excess generation (NEG) may be carried over to a customer-
generator's next bill as a kilowatt-hour (kWh) credit at retail rate and may be rolled over,
indefinitely. The credits may only be applied to the energy portion of the bill (not to fixed costs
or demand charges, for example).
Recently, a handful of states have expanded net metering by allowing meter aggregation for
multiple systems at different facilities on the same piece of property owned by the same
customer. This is referred to as “virtual” net metering when multiple meters are accumulated
into a single meter. In several states, certain customers may net-meter multiple systems at
different facilities on different properties owned by one person, such is the case with a large
housing complex. In addition, “community net metering” and “neighborhood net metering,”
which allow for the joint benefits of a solar project by multiple users, is in effect or under
development in a small number of states, including Massachusetts. West Virginia customers
may aggregate meters (either physically or virtually) and apply net metering credits earned on
one meter to additional meters, as long as they are located within two miles of the point of
generation. The associated costs of meter aggregation are the responsibility of the customer.
Net metering tariffs must be identical in rate structure, retail-rate components, and monthly
charges, to the tariff for which the customer would qualify if that customer were not a
customer-generator. Customers on a time-of-use tariff are also permitted to net meter
(discussed below). Net metering may be accomplished using a single, bi-directional meter or
two meters. In the event that two meters are used, the net number of kWh for billing purposes
will be determined by subtracting the amount of electricity flowing from the customer to the
utility from the amount of electricity flowing from the utility to the customer. The state has
placed a 3% aggregate program capacity limit on the total output of net-metered DER, i.e.
utilities may refuse net metering on additional DER systems once 3% of their peak demand, as
measured from the previous year, is met by distributed energy systems.
The issue of who owns the alternative energy credits (or renewable energy credits) remains
unresolved. The PSC must establish rules regarding alternative energy credits for the alternative
energy portfolio standard, and as a result, the PSC has not yet addressed credit ownership for

56
the purpose of net metering. Finally, each customer with a net-metered system up to 50 kW
must carry a minimum of $100,000 in liability insurance. Customers with systems greater than
50 kW and up to 500 kW are required to carry a minimum of $500,000, and customers with
systems greater than 500 kW must carry a minimum of $1 million in liability insurance.
Regional Accessibility to Net Metering
Because net metering policy is carried out by the electric utilty companies as opposed to the
state Public Service Commision, accessibility to net metering applications and installation in the
PJM region varies from company to company:
Ohio
Customers of Dayton Power and Light (DP&L) can find information and application
forms by searching “Net Meter” on the company’s website (oddly, as a side note,
neither “Net Metering” nor “Net Meters” yields the correct results). The page walking
customers through the process is straight forward and user friendly. As with FirstEnergy
and AEP applications DP&L’s application requires documentation, site plans and
diagrams. The site also states:
“Net metering is intended to help customers offset their monthly bill. Your net
meter will measure how much power your location produces and consumes. If
you produce more power than you use in a certain month, you will receive a
credit from DP&L. For example, if you consume 100 kilowatt-hours (kWh) and
you produce 110 kWh, you will receive a credit for the excess 10 kWh on your
next month’s bill. Net metering is not intended for customers to sell power to
DP&L for profit. DP&L will not approve net metering applications where the
expected power production far exceeds the customer’s electrical requirements. If
you would like to sell power as an Independent Power Producer, please email us
for guidance” (Dayton Power & Light, “Install”).
Neither South Central Power Company nor Consolidated Electric Cooperative Inc. have
any information regarding Net Metering on their website.
Customers with Duke Energy can find information and application forms on a page on
their “Customer Generation” webpage. This page includes a link to a short form
application for “interconnection” (referring to net metering) as well as a link to
information about selling SRECs to Duke Energy (Duke Energy, “Customer”).

57
Note that the descriptions of American Energy Producers’ And FirstEnergy’s processes,
mentioned below, apply here as well.
Pennsylvania
Champion Energy’s website has neither a search function nor a clear link for customers
interested in net metering. One can find their policy by searching “Champion Energy Net
Metering”. Buried in a document:
“To be considered eligible to participate in Champion’s Net Metering
Program, residential customers must generate a portion or all of their
own residential retail electricity requirements using energy generation
equipment located on their premises. Additionally, the residential
customer must have a meter capable of measuring the flow of electricity
in both directions and the meter must be tested and calibrated by the
Utility to assure accuracy prior to commencing services under this
Program. When the residential customer’s interval or hourly net usage
results in a net flow of electricity from the customer to Champion, the
customer will be credited for the electricity provide to Champion at the
rate provided under the applicable service tariff. This Program is available
to residential l customers on a first come, first serve basis until the
capacity of all participating generators is equal to the maximum Program
limit of Champion’s peak load supplied by Champion the preceding
calendar year. Please contact Champion at 1.877.653.5090 or the Utility
for additional details about available net metering programs in your
residential area” (Champion Energy Services, p.3).
Duquesne Light’s website has a “Customer Generation” page that provides a
straightforward procedure for application requiring diagrams, site plans, documentation
and application fees (Duquese Light, “Customer”).
West Virginia
While customers with FirstEnergy can find the required information and forms to begin the
process by simply searching “Net Metering” on the companies site. American Electric Power
(AEP) does not provide access to the forms online. AEP users must call the customer service line
and request the forms by mail or email. The application process for FirstEnergy interconnection

58
requires submissions of documentation, diagrams and site plans of the facilities being
registered but the process is outlined with step-by-step guidance. By comparison, AEP’s
informational handout for registration is a 32 page packet filled with definitions, equipment
requirements, conditions of service, provisions and 7 appendices. Though the content provided
by both companies is relatively similar, FirstEnergy’s format of presentation is much more
accessible and user-friendly (FirstEnergy, “Mon”).
In light of these inconsistencies in accessability to net metering options for PJM region electrical
consumers, we recommend that the WV PSC enforce stricter standards for access among utility
companies operating within West Virginia.
Time-of-Use
Time-of-use pricing is a variable-rate billing method for electricity constructed upon time-of-
day-dependent rates instead of a flat per-kWh rate. The premise here is that electricity is more
expensive when in high demand (e.g. by air conditioners in the afternoon on hot, sunny days)
and that variable pricing should help reduce demand during these hours. Thus, time-of-use
rates are higher when electric demand is higher. Charging higher electricity prices during peak
demand has the effect of shifting demand to those times of the day corresponding to when
energy is least expensive (up to 50%+ less costly). This in turn means that fewer new power
plants will be necessitated to meet peak load, helping utilities to reduce exposure to stranded
costs.
The time-of-use billing system has expanded to include bi-directional net metering programs
(referred to as time-of-use metering). As with consumption, utilities that offer time-of-use
metering tier the value of the customer’s generated energy in accordance with daily and
seasonal energy demand schedules. For instance, customers of the California-based Pacific Gas
and Electric Company (PG&E) receive credits for energy generated between the hours of 12PM
and 7PM throughout the summer that are worth more than three times those credits for
energy generated during off-peak hours. Utilities such as PG&E have developed bi-directional
rate schedules with on-peak and partial-peak periods in order to better reflect the utility costs
of generating power at various times of the day, especially during high demand (PG&E, “Time”).
Customer generators on a time-of-use rate schedule can optimize their net energy bill by
earning more valuable credits for energy generated during peak hours while simultaneously
shifting their consumption to off-peak hours. PV systems can be very financially attractive when

59
combined with time-of-use metering because solar output is the strongest precisely during
peak load.
Daily variable rates are new to most public utilities commissions, and policy development in this
arena has been slow. Typically, regulators first make decisions about advanced metering
infrastructure (AMI) deployment. Only later do they work out the details of variable pricing. The
California Public Utilities Commission has set forth a plan to make time-of-use rates the
commercial standard for all of the state’s major electric utilities. Many other states are now
looking to follow suit. However, customers, by and large, remain unaware of time-of-use billing
options. As TOU becomes more widely implemented, solar PV deployment will continue to
become more economically feasible.
IREC’s Best NEM Policies and “Freeing the Grid” Grades
IREC has established the following best practices for net metering policies:
All utilities (including municipal utilities and electric cooperatives, not just IOU’s) should
be subject to the state policy.
All customer classes should be eligible.
The individual system capacity should not exceed the customer’s service entrance
capacity. Otherwise, there should be no individual system capacity limit.
There should be no aggregate system capacity limit.
Any customer’s net excess generation at the end of a billing period should be credited to
the customer’s next bill as a kWh credit (at the utility’s full retail rate) indefinitely, until
the customer leaves the utility’s system.
Utilities should not be permitted to impose an application fee for net metering.
Utilities should not be permitted to impose any charges or fees for net metering that
would not apply if the customer were not engaged in net metering.
Utilities should not be permitted to force customers to switch to a different tariff.
Customers should have the option to switch to a different tariff, including a time-of-use
tariff, if they so choose. If a customer is on a time-of-use tariff, when net metering they
should be credited for the appropriate time-of-use period in the billing period.
Customers should have ownership of any RECs associated with the customer’s electricity
generation.
Customers should be permitted to offset load measured by multiple meters on the same
property using a centrally located system.

60
The state public utilities commission should adopt comprehensive interconnection
standards for customer-sited systems.
In its annual publication, the team that develops “Freeing the Grid” assigns each state a letter
grade (A through F) according to its net metering policies as well as its DER interconnection
procedures. In 2012, West Virginia received an A for its net metering policies namely for the
state’s 12-month NEM credit lifespan policy, its approval of aggregate net metering, and its
consumer protection practices that prevent the net metering customer from having to pay for
unspecified additional equipment, fees, etc. While the state received a strong letter grade, the
IREC withheld more praise for the state’s net metering policies due to the prescribed 3%
aggregate program capacity limit and state’s lack of details regarding REC ownership (IREC, et
al., 2012, p. 99). As for DER interconnection procedures, West Virginia received a B grade. High
points of the state’s procedures include lenient external disconnect switch requirements and
tiered insurance requirements for DER systems. The IREC was dissatisfied with the state’s
interconnection process requiring “timelines longer than the FERC standards” and the
individual system capacity limits, mentioned above (p. 99).
In the context of “virtual rooftop” solar, a key component to Virtual Power Plants, the “Freeing
the Grid” report is particularly relevant. The report awards an additional “bonus point” within
its grading criteria to a state with a community shared renewables program:
“For a variety of reasons, customers may be unable to host an on-site renewable energy
system…Forward looking states are beginning to address this program gap and expand
opportunities for customers to participate in renewable energy through shared
renewables programs. Under a shared renewables program, customers are allowed to
invest in an off-site renewable energy system and still participate in net metering and
other state-level incentive programs” (p. 14).
West Virginia did not receive this additional bonus point because the state does not have such a
program in place. A “virtual rooftop” solar program would function similarly to the community
shared renewables program as described above; therefore we should like to see policy changes
to where Freeing the Grid would be able to consider the state for the shared renewables bonus.

61
Other Considerations for WV Net metering
We strongly recommend that the following be considered when developing a VPP based
market for solar development:
Penetration Screening Revisions: Distributed energy systems may often fail a fast
track interconnection process due to the “penetration screen” – criteria ensuring
that a DER system will have a minimal impact on the utility’s grid. The screen is
incorporated into the Federal Energy Regulatory Commission’s Small Generator
Interconnection Procedures (SGIP) and is reflected in most state interconnection
procedures. Failure to pass the screen prevents an interconnection request from
proceeding along an expedited path, and this typically occurs when the aggregate
generation on a line section exceeds 15% of the line section’s annual peak load.
Generators that exceed this standard fail the fast track review and will either
proceed to a supplemental review that is heavily dependent on utility discretion or
will face a lengthy, costly, and potentially unnecessary full study process. Both
Hawaii and California have circumvented this issue by offering an objective
supplemental review process allowing the utility to study the generators in question
without requiring a full study. Recommendation: Review both Hawaii’s rule 14H and
California’s rule 21 for “best practices” (IREC, et al., 2012, 106).
Model Net Metering Rules: Interstate Renewable Energy Council’s model net
metering rules have been highly influential in New Jersey and Colorado, which are
widely considered to prescribe the best net metering policies in the United States.
IREC’s model rules apply to systems rated up to a customer’s service entrance
capacity (p. 115). Recommendation: Review these rules available at:
http://www.irecusa.org/NMmodel09
Model Interconnection Procedures and Procedures for Small Generator Facilities:
IREC’s model interconnection procedures incorporate the best practices of small-
generator interconnection procedures developed by various state governments, the
FERC standards, the National Association of Regulatory Utility Commissioners
(NARUC), and the Mid-Atlantic Distributed Resources Initiative (MADRI). IREC’s
model standards include four levels of interconnection. Recommendation: Review
these standards at: http://www.irecusa.org/ICmodel09
Perceived Cross-Subsidization Through Net metering: The primary complaint from
utilities is that net metering is built on a subsidy, that “every purchase of a kWh that
a net metering customer avoids shifts the burden of recovering the fixed costs of

62
building and operating the utility grid to non-paying customers” (p. 107). This is
exactly the sentiment addressed by the EEI in its January 2013 report, that utilities
will face higher costs to integrate DER, and non-DER customers will subsidize the grid
usage of DER customers. IREC advocates for solid research that includes credible
data and utility as well as stakeholder participation regarding each localized issue of
the costs and benefits of an interconnected net-metered system. In recognizing that
there is much debate over the true value net-metered DER electricity, we
recommend that West Virginia remain with a one-for-one net-meter credit on the
customer’s bill.
WV PSC – Petitions for Rulemaking
Our team researched the question of how interested parties might initiate a proceeding before
the West Virginia Public Utility Commission to modify a regulation or Commission rule. Our
understanding is that the need for Commission action may result from a change in legislation
defining the scope of rights and obligations under the WV net metering law.
Our overall conclusion is there is little legal or decision precedent describing how the
Commission responds to rulemaking petitions or whether it has any obligation to respond to
rulemaking. We believe this is because it is generally accepted that citizens and organizations
have the right to request action by state administrative agencies. And it appears to be the
practice of the Commission to entertain and respond to petitions for commission action. This is
consistent with long standing principles of Administrative Law, grounded in the Constitutional
rights of citizens to petition the government for redress of grievances.
A more difficult question is whether the PSC could be compelled to respond to a petition for
rulemaking. While it is at times difficult to force an administrative agency to respond to
rulemaking requests, our team believes the WV Commission would have an enforceable
obligation to change Commission rules to conform to a statutory modification. That action
could be sparked by a motion to initiate a general investigation or by a petition for a
declaratory ruling from an interested party.

63
Examples of petitions for administrative action considered by the WVPSC
City of New Martinsville v. WV PSC, __WV Supreme Ct. _____, June 11, 2012; Mon Power and
PE, Case No. 11-0249-E-P, Commission Final Order, November 22, 2011 (granting utility
petitions for declaratory order and for interim relief seeking a ruling that utilities are entitled to
the alternative and renewable energy resource credits (credits) generated from three
"qualifying facilities" (QFs) under the Public Utility Regulatory Policies Act of 1978 (PURPA)
pursuant to Electric Energy Purchase Agreements (EEPAs or PURPA Agreements) with the QFs.
On October 12, 2010, the Kanawha County Commission on behalf of itself, its Metro 911 agency
and several emergency service providers, filed a letter requesting a general WV PSC
investigation to review protocols for local exchange carriers to notify 911 centers during
significant telephone service outages, and require the carriers to provide prompt notice of
outages.
Decoupling
In the 2013 Edison Electrical Institute report discussed above, the EEI concludes that the public
electrical utility industry must implement many changes to the current revenue recovery
method. The EEI suggests that one regulatory policy in particular may simultaneously help
incentivize renewable energy growth, ensure stable revenue for utilities, and stabilize energy
prices for consumers – revenue decoupling. The term “decoupling” refers to the concept of
separating a utility’s revenue from the volume of its energy sales. Whereas a non-decoupled
utility can only increase its revenue and its profits by increasing electricity sales, what is
referred to as the “Throughput Incentive,” decoupling allows for routine price adjustments so
that the gap between a utility’s projected revenues and its actual revenues are either fully or
partially insured. Revenue decoupling fundamentally differs from the traditional rate charging
system: “while traditional regulation sets prices, then lets revenues float up or down with
consumption, decoupling sets revenues, then lets prices float down or up with consumption”
(RAP, 2011, p. 10).
As of 2011, 30 states had implemented decoupling mechanisms across various electric and gas
utilities. The decoupling mechanism typically functions using the following procedures:

64
The utility determines its “allowed revenue” for a given billing period based upon a test
period. Allowed revenue is an all-inclusive cost – it is the sum of net expenses, taxes,
and the allowed rate of return to investors.
Variable costs, most notably fuel costs, are already recovered through separate fuel and
purchased-power rates. Thus, the decoupling mechanism is directed towards recovering
fixed costs, i.e. non-production costs. Most decoupling is based upon a “return per
customer” model, whereby allowed costs are primarily a function of total customer
count (NREL, 2009, p. 9). The Regulatory Assistance Project (RAP) explains, “customer
count is somewhat more closely related with growth in non-production costs, stronger
than either growth in system peak or growth in energy sales. These data support using
the number of customers served as the driver for computing allowed revenues between
rate cases” (RAP, 2011, p. 16). Therefore the allowed revenue is calculated period-to-
period based upon a test period and a projected customer count.
Once an allowed revenue has been agreed upon by the utility and the public services
commission, the utility can use one of two methods for setting rates – deferral
decoupling or current period decoupling, both of which are illustrated here:
Ratemaking Equation With Deferral Decoupling
Ratemaking Equation With Current Period Decoupling
=
= -
We strongly suggest adopting a deferral decoupling mechanism which uses a balancing
account to keep track of discrepancies between projected revenue and actual revenue.
The balance, either positive or negative, is credited to the succeeding allowed revenue
and is therefore passed on to consumers in the form of higher or lower per unit rates.
With current period decoupling, rates are adjusted for each billing cycle, ensuring stable
utility revenue at all points.

65
There are several different levels of decoupling policies – full, partial, and limited. Full
decoupling insulates a utility’s revenue collections from any and all deviations of actual sales
from expected sales. Deviations result in a “true up,” i.e. a price adjustment. The NREL claims
that full decoupling is the most widely practiced form of decoupling (NREL, 2009, p. 6). Partial
decoupling insures a certain percentage of the actual/projected revenue discrepancy will be
recovered by a “true up.” Finally, limited decoupling insures revenue recovery only under
certain circumstances such as severe weather.
The benefits of decoupling are many and all are rooted in the fact that through this process,
“improved generational efficiency is the only means by which [utilities] can boost profits,”
because sales are accounted for previous to revenue generation (RAP, 2011, p.45). First off,
energy efficiency is no longer an enemy to the utility under decoupling. Secondly, customers’
bills will average a constant price over time – true up adjustments generally fall under $2.00 per
month, which is usually under 1% of a customer’s bill according to RAP. Finally, as decoupling
reduces the volatility and risk of a utility’s net earnings, the utility becomes more appealing to
credit rating companies – this may also help avoid the “vicious cycle” scenario described by the
EEI. The higher credit ratings will improve the utility’s access to low-cost capital, a cost that will
be factored into the allowed revenue figure and eventually passed onto the consumer in the
form of lower electricity prices. The RAP estimates that “The overall impact is on the order of a
3% reduction in the equity capitalization rate, which in turn can produce about a 3% decrease in
revenue required for the return on rate base, or about a 1% decrease in the total cost of service
to consumers” (p. 38). During this period of slow (or even declining) growth in revenues, a weak
economy, and a more energy-conscious society, it is recommended that the West Virginia
Public Services Commission implement some sort of decoupling mechanism policy, even if it is
not full decoupling.
Recently Proposed Legislation Related to Renewable Energy Incentives
H. B. 2118 – “The West Virginia Renewable Energy Act”
This bill, proposed and sponsored by delegate Nancy Guthrie, would establish an investment
cost recovery incentive for customer-generated electricity from renewable energy systems. The
incentive amounts to $0.15 per kilowatt hour of developed capacity multiplied by a factor of 2.4
if the electricity is generated using solar modules manufactured in-state, by 1.2 for any other
renewable system manufactured in-state, and by 0.8 for all other renewable systems, but not

66
to exceed $2000 per year for each recipient. The act also establishes rates and terms for sales
of customer-generated electricity to utility companies (1) For ten year contracts the rate is
$0.15 per kilowatt hour (2) for twenty year contracts the rate is $0.32 per kilowatt hour and (3)
for electricity generated from solar modules, solar inverters or solar energy systems
manufactured in the state the rate is $0.54 per kilowatt hour. Lastly, the act would provide tax
credits to electric light and power companies that purchase customer-generated electricity.
These credits would equal twenty-five one-hundredths of one percent of the businesses'
taxable power sales or $25,000, whichever is greater.
Our take: Taking the form of a feed-in-tariff, this bill provides strong incentives for
future distributed solar development and manufacturing in West Virginia. However, the
rigid premium rates being proposed for those selling to utility companies will quickly
distort the price of solar specifically and electricity rates in general. Though premium
rates above retail electricity prices are proven to encourage investment in renewable
energy, long contract periods with no rate adjustments could negatively impact the free
market functioning of the solar market by prohibiting solar prices to fall. Our team
recommends a re-examination of the issues associated with feed-in-tariffs, with
attention paid to how this has stifled innovation and kept prices high in the Spanish and
German solar markets.
H. B. 2141 – The Renewable Portfolio Standards Sustainable Energy Act
This bill, proposed and sponsored by delegate Barbara Fleischauer, would overhaul current
West Virginia energy portfolio standards to require providers to generate or acquire electricity
from renewable energy systems (defined as biomass, geothermal energy, solar energy, wind
and low impact, small hydroelectric and micro hydro projects). Current legislation allows
providers to comply with portfolio standards with energy obtained from alternative energy
systems, including fossil fuels, with no renewable energy requirement. The bill establishes a
timeline for increases in the renewable portfolio standards through 2025, at which point no less
than 15% of the energy sold by providers must be obtained from renewable sources. Lastly, the
bill proposes a “renewable energy fund” supported by a $0.02 contribution made by providers
for every kilowatt-hour they sell to retail customers in the state.
Our take: Given that current ARPS standards in West Virginia are easily met with clean
coal and natural gas generation, electricity and power providers are not being
incentivized to expand renewable generation. This bill properly addresses this issue by
67
establishing a “renewable carve-out”. In addition, perhaps considering the innovative
nature of the ARPS in incentivizing energy integration should be further examined such
as setting specific energy generation thresholds where direct integration may receive a
multiplier (e.g., coupled generation between coal and biomass).
H. B. 2176 to modify The Alternative and Renewable Portfolio Standard
H.B. 2176 aims to amend and re-enact the Alternative and Renewable Portfolio Standard,
establish the legal ownership of renewable energy credits for “the generator of the energy until
sold or otherwise traded.” The bill also requires utility companies to credit any excess
customer-owned renewable generation delivered to the utility’s electrical grid under a net
metering agreement, and that they pay this customer-generator for any unused energy credits
“at an average annual rate based on the electric utility’s avoided-cost rate.” Finally, the bill
increases the allowed kilowatt capacity for interconnected customer-generators to 50 kW for
residential systems.
Our Take: The Legislature’s acknowledgement of the generator’s ownership energy
credit is promising in the context of expanding DER, especially given the fact that the bill
will help create opportunities for third-party ownership to expand within WV. The
increase in allowed capacity is also welcomed given that IREC estimates that the average
size of a DER system in 2012 was 18 kW, not far from the current residential capacity
limit of 25 kW.
H. B. 2316 to modify the Alternative and Renewable Energy Portfolio
H.B. 2316 would remove language from the current alternative and renewable energy portfolio
standards that limits utility companies to “no more than ten percent of the credits used each
year to meet the compliance requirements” are “acquired from the generation or purchase of
electricity generated from natural gas”. It also removes the ten percent ceiling for credits
acquired from “supercritical technology” (i.e. clean coal).
Our take: This bill would only serve to further weaken the renewable energy
development incentives of an already quite ineffective Alternative and Renewable
Portfolio Standard especially when one considers our proposed integrative path forward.
68
H. B. 2348 – West Virginia Energy Expansion Fund
This bill would create and implement a fund “to encourage the development and use of
renewable forms of energy and efficiency programs, projects and enterprises.” The fund would
draw from a mandatory charge of $0.00035 per kilowatt-hour on all electricity consumers of
the state. The public purpose of the fund is to generate the maximum economic benefits over
time from renewable energy and energy efficiency for the ratepayers of the state through a
portfolio of initiatives and programs that advance and promote increased availability, use, and
affordability of renewable energy and energy efficiency. The fund would also foster the
formation, growth, expansion, and retention of renewable energy and energy efficiency
measures and their related enterprises, institutions and projects to serve the state. To these
ends the fund may make grants, contracts, loans, equity investments, bill credits and rebates to
customers, to provide financial or debt service obligation assistance. Systems employing the
following technologies would be eligible for funding: Solar photovoltaic and solar thermal
electric energy; wind energy; geothermal energy; fuel cells; landfill gas; waste-to-energy which
is a component of conventional municipal solid waste plant technology; naturally flowing water
and hydroelectric; low emission, advanced biomass power conversion technologies; anaerobic
digesters and storage and conversion technologies.
Our Take: The proposed fund is a much-needed supplement to the incentives already in
place for renewable energy investment in West Virginia. Unfortunately H.B. 2348 does
not properly incentivize either the consumer or the utility to invest in DER or DSM
technologies by obscuring price signals (e.g., stranded cost, vicious cycle, etc.).This issue
should be addressed before this more supplemental legislation is enacted. Additionally,
developing an integrated path forward as opposed to primarily focusing on renewable
energy alone should be considered.
H.B. 2564 to Modify the Alternative and Renewable Energy Portfolio
This bill would add a clause to the current Alternative and Renewable Energy Portfolio Standard
legislation to delay the implementation of the enumerated standards, “so long as any coal is
imported into the United States.”
Our Take: We do not have any suggestions concerning this proposed modification as it
does not fall in line with our proposed integrated path forward.

69
H.B. 3080 to modify the Alternative and Renewable Energy Portfolio
This bill would add language to the current Portfolio Standards to include solar renewable
energy credits (SRECs) and distinguish them from ARECs. The bill provides terms and provisions
for the distribution and trading of SRECs as well as a portfolio requirement of two percent of
electrical output represented in SRECs by 2025 and a further requirement that twenty-five
percent of SRECs are obtained from distributed solar renewable energy resources by that same
year.
Our Take: A solar carve-out would be the fastest, most well explored manner of
encouraging solar development. The twenty-five percent distributed generation
requirement will spur growth in smaller systems while (hopefully) allowing adequate
space for utility-scale solar to grow as well. Unfortunately, this carve-out will most likely
face devastating resistance from energy-partisans. For this reason, developing an
integrated path forward as opposed to primarily focusing on renewable energy alone
should be strongly considered.
Policy Recommendation Regarding WV SB 441
Under West Virginia’s current business tax code, corporations are subject to a range of three
taxes. Any one firm can be subject to one or several of the following: the Corporate Net Income
Tax (CNIT), the Business and Occupations (B&O) tax, and the Business and Franchise (BF) tax.
Electric power producers must comply with the 9% CNIT on standard operating income –
revenue derived from electricity sales and alternative/renewable energy credits minus
expenditures – as well as the B&O tax. Public utilities and electric power producers “may take a
credit equal to the amount of West Virginia Business Franchise Tax liability multiplied by the
percentage that gross income subject to Business and Occupation Tax is of total West Virginia
gross receipts,” and hence are effectively not subject to the BF tax should all of their business
activities reside within West Virginia. The mechanics of the Business and Occupations tax are as
follows:
𝑩&𝑶 𝒕𝒂𝒙 𝒐𝒃𝒍𝒊𝒈𝒂𝒕𝒊𝒐𝒏𝒔 = 𝒄𝒂𝒑𝒂𝒄𝒊𝒕𝒚 𝒇𝒂𝒄𝒕𝒐𝒓 ∗ 𝒏𝒂𝒎𝒆𝒑𝒍𝒂𝒕𝒆 𝒄𝒂𝒑𝒂𝒄𝒊𝒕𝒚 𝒊𝒏 𝒌𝑾 ∗ $𝟐𝟐. 𝟕𝟖
“Taxable generating capacity” is defined as the product of a generating unit’s capacity factor
and its nameplate capacity. The capacity factor is usually calculated by the energy industry as
the amount of actual energy produced in a given time period divided by the maximum possible
amount energy that could have been produced were the generating unit operating at full load

70
over the same period. West Virginia tax code designates two different capacity factors, one for
generating units in operation between the years of 1991 and 1994 and one for all generating
units constructed after 1994. For the older units, the capacity factor is average four-year
generation divided by the unit’s maximum possible annual generation – the typical definition of
capacity factor. If the generating unit was brought online within this four year timespan, January
1, 1991 but prior to December 31, 1994, “then the average four-year generation is computed
through the annualization of the average monthly net generation of such unit during its months
of operations between 1991 and 1994.” For all newer electrical generation, the capacity factor
for all energy sources except wind power is 40% regardless of a generation unit’s ability to
produce energy in a given time period.
Wind power generation is subject to a tax benefit in West Virginia by Senate Bill 440 by allowing
all wind turbines constructed after 2007 a 12% capacity factor. Over the course of a year, a wind
turbine will only produce about 12% of its maximum annual generation due to the system’s
dependence on suitable weather patterns - it is an intermittent energy source. Similarly, solar
energy generation is intermittent. The Energy Information Administration estimates that solar
system capacity factors range from 11% - 26%, depending on region and local weather patterns.
Thus, subjecting a solar electric power producers in West Virginia are subject to a taxable
generating capacity relying on, in some cases, over a 100% overestimation of the capacity
factor, corresponding to similar levels of over-taxation (via the B&O tax) on a solar system’s
actual electrical output. For example, suppose a 10 MW solar array is built in Kanawha County,
and it has a capacity factor of 18%. Subjecting the system to a 40% capacity factor would result
in a tax liability of $91,120 per year, whereas using the actual capacity factor would lead to a
55% lower tax liability of $41,004 per year.
Seeing that wind power already benefits from legislation recognizing the intermittency of wind
turbine output, solar power should be treated similarly for one simple reason: different energy
resource technologies cannot be taxed as if they all functioned in one manner. Additionally, the
West Virginian State Legislature should allow for the free market amongst renewable energy
industries; by unduly burdening the solar energy industry with excess taxes the Legislature is in
effect “picking winners and losers.” Currently, the fossil fuel industry does not pay its fair share
of the B&O tax – the EIA estimates that coal generation plants utilize an 85% capacity factor,
and conventional natural gas generation uses an 87% figure. When the West Virginia
Department of Revenue sets the capacity factor at 40%, the fossil fuel industry is effectively
paying less than half of what their B&O tax burden should be.

71
Our team recommends an amendment to SB 440, specifically regarding section §11-13-2o. The
amendment should read: “For taxable periods on or after the first day of January, two thousand
thirteen, the taxable generating capacity of a generating unit utilizing solar energy technology,
either solar photovoltaic cells or solar thermal, shall equal twenty percent of the official
capability of the unit.”

72
With distributed energy resources and demand-side management slated to significantly impact
public utilities’ revenues, potential for growth, and overall sustainability, the industry must
consider new business models and customer services. For example, customers with solar units
are (a) exerting additional costs onto the utilities by the “increased cost of supporting a
network capable of managing and integrating distributed generation services” while (b)
lowering their demand for utilities’ energy, thus exposing the industry to unrecoverable capital
investments – stranded costs. Under the current majority business models, only non-DER
customers are projected to subsidize these additional costs imposed by DER and DSM. By
revising tariff structures, e.g. implementing tiered rates and decoupling, and by becoming
champions of energy efficiency instead of foes, many electrical utility companies have already
mitigated many of the significant risks mentioned in the EEI’s 2013 report and positioned
themselves well for future success. Below we discuss several of these examples, as well as
scenarios that West Virginian utilities may seek for similar success.
Examples Here are listed the top ten utilities in terms of solar generation according to the Solar Electric
Power Association’s “2012 Top Solar Ranking” report. A description of a couple of these
utilities, as well as other notable players in the DER/DSM-integrated utilities environment,
should serve as the industry’s best examples.
Utilities’ Best Case Scenarios

73
Pacific Gas & Electricity Co: The aforementioned PG&E Company has the largest solar
holdings in the United States. Currently, it owns and operates more than 100 MW of its
own solar generation capacity, and PG&E Co recently entered into twenty-year power
purchase contracts with the owners of the 150 MW Copper Mountain Solar Facility and
the 10 MW El Dorado Solar Plant, both located in the Mojave Desert. PG&E also has a
PPA with the operators of the 230 MW Antelope Valley Solar Ranch, located in the
Mojave Desert as well. The IOU administers the “California Solar Initiative,” an incentive
program for persons hoping to install distributed solar systems. For systems under 30
kW in capacity, the customer may choose between a one-time up-front payment based
on an estimate of the system's future performance or monthly payments from PG&E for
five years based on the amount of kWh produced. The monthly payment option has
varied rates based on residential, commercial, and non-profit customer kWh production
(State of California, et al., “How”). PG&E Co offers its customers four rate structures,
traditional flat rate and time-of-use being two of them. The utility also operates under
revenue decoupling, allowing for it to aggressively pursue smart grid technologies – they
offer a smartphone application that notifies a customer who is approaching on-peak
usage – and energy efficiency initiatives. All of the information can be found by
navigating the utility’s website, www.pge.org. This IOU is an excellent model for the
traditionally operating utilities industry.
Sacramento Municipal Utility District: SMUD is the 6th largest customer owned electric
utility. In accordance with the EEI’s advice, SMUD has developed numerous “new
business models and services” that continue to keep it ahead of its RPS requirement –
20% renewables by the end of 2013 – and financially secure. Beginning in 2014, SMUD
will implement a tiered-price system using “Base Usage” and “Base Plus” energy rates
whereby customers pay different rates depending upon a threshold amount of
consumed kilowatt-hours (the threshold depends on the season). This system will
remain in effect until the end of 2017 when it transitions into a residential time-of-use
system, where electricity rates vary significantly between the summer peak hours of 4
PM – 7 PM Monday through Friday, and the rest of the week. This system “aligns [the
rate structure] with the cost of providing electricity service” (SMUD, 2013, “Preparing”).
Not only has the utility developed its own air conditioner, the 31% more efficient
“AquaChil1” AC system, but SMUD is planning to have 600,000 smart meters installed in
the near future. Finally, the utility also offers a Home Performance Loan that allows

74
residents to finance energy efficiency measures that result in a minimum of 15% energy
savings.
Tennessee Valley Authority: Currently, the TVA owns and operates 14 solar PV sites.
Customers may further TVA’s investment in solar and renewable energies buy opting
into the “Green Power Switch”: customers pay $4 per month for 150 kWh to be offset
by solar, wind, and biomass (TVA, “Q&A”). The TVA has also partnered with Nissan
North America, the State of Tennessee, and other institutions to develop and deploy
solar powered electric vehicle charging stations. The first station was unveiled in 2011,
included a storage unit, and pumped excess energy into the grid as well. As part of the
TVA’s 2011 Integrated Resource Plan, the utility’s Energy Efficiency and Demand
Response Program will be responsible for saving at least 5.9 GWh of energy by 2020
(TVA, 2011, p.112). In June 2012 The Clarion newspaper reported the “TVA has found its
cheapest option for lowering its cost is to reduce demand. The have a set goal to reduce
energy usage by 3.5% by 2012, which is enough to avoid building two new power
plants” (The Clarion, 2012). Although there is no decoupling policy in place for the TVA,
“In 2010 the Chattanooga Gas Co. [a TVA subsidiary] was granted an increased monthly
charge for fixed costs to “more properly align the interest of ratepayers and utilities in
better promoting energy efficiency. The approach is approved for a three-year trial,”
according to the American Council for an Energy Efficient Economy (American Council
for the Energy-Efficient Economy, “Tennessee”).
Xcel Energy (Colorado)/Public Service Company of Colorado: Xcel is a private investor-
owned utility company operating in ten states. In Colorado, the local Public Utilities
Commission regulates Xcel, where it operates as the Public Service Company of
Colorado (PSCco). By November 2011, Xcel had predicted that it would meet the state’s
2020 RPS mandate of 30% renewable energy generation in 2012 – 8 years ahead of
schedule (Vote_Solar). The company has also expanded its DSM program to curb
electricity usage by 11.5% by 2020 (American Council for an Energy Efficient Economy,
“Colorado”). According to the firm, investment in renewable energy saves money,
because the future costs of fossil fuels are expected to fluctuate immensely. For
example, Xcel recently entered into a 200 MW, 25-year PPA with Limon Wind II LLC., an
agreement projected to save Xcel around a present-valued $100 million (The Vote Solar
Initiative, “Colorado”). PSCco, like the soon-to-be SMUD model, operates on a price-
tiered system: customers pay a lower electricity rate for the first 500 kWh consumed,
and rates increase for all energy consumed in excess of that threshold. According to the

75
Colorado’s Public Utilities Commission, these rates “more accurately reflect the cost of
producing electricity” (State of Colorado PUC, “About”). By encouraging energy
efficiency, Xcel diminishes its need for further capital expenditures on additional
generation facilities, therefore reducing its exposure to stranded costs.
Possible Scenarios for WV Utilities Based upon current trends, both market and legislative, and seeing as neither the West Virginia
State Legislature nor the West Virginia Public Utilities Commission have enacted policies that,
besides for the $2000 income tax credit for residential solar, directly encourage the deployment
of solar systems, there are numerous policy options that will incentivize renewable energy
development, energy efficiency, and sustainable revenue practices for the state’s public
utilities. So as to encourage the public electric utilities operating within West Virginia to come
in line closer to those leading the way in utility-integrated solar, e.g. those mentioned above,
the following practices should be considered, especially in a synthesized manner:
Decoupling: In 2011, FirstEnergy’s West Virginian utilities, Potomac Edison Company
and Monongahela Power Company, established energy efficiency programs under a
larger “Energy Efficiency and Conservation Plan.” The EEC Plan calls for a 0.5% reduction
in demand through 2016. Here are two such programs: the Residential Low Income
Program targets low-income households for energy efficiency improvements, and the
Non-Residential High Efficiency Lighting Program provides non-residential customer
rebates on certain high efficiency lighting systems. Neither program achieved their first
year targets (FirstEnergy Co., 2012, pp. 6,7).
FirstEnergy fell short of its goals because it simply has no revenue incentive to decrease
demand. Decoupling would only make FirstEnergy immune from the harmful effects of
decreased demand; the policy itself does not encourage energy efficiency. A sliding scale
limited decoupling mechanism can. Should FirstEnergy fall short of its allowed revenue
projection, it would recover a certain percentage of the discrepancy between allowed
and actual revenues based upon the success of its energy efficiency programs like those
specified in the EEC Plan. Solar deployment would be much more feasible within West
Virginia if public utilities were insured against lost revenue that would result from
widespread DER integration.

76
Table 1: Summary of Actual Residential Low-Income Participants and Savings
Number of Participants MWH Energy Savings
2012 Yr End Plan
Actual % 2012 Yr End Plan
Actual %
Mon Power 533 522 98% 588 377 64%
Polomac Edison 240 208 87% 266 232 88%
West Virginia 773 730 94% 853 609 71%
Table 2: Summary of Actual Non-Residential High Efficiency Lighting Participants and Savings
Number of Participants MWH Energy Savings
2012 Yr End Plan
Actual % 2012 Yr End Plan
Actual %
Mon Power 396 21 5% 5,362 2,777 52%
Polomac Edison 134 6 4% 1,807 297 16%
West Virginia 532 27 5% 7,170 3,074 43%
Smart meters: The deployment of more smart meters across West Virginia, especially if
combined with a decoupling policy, would allow the utility customer more information
on their energy usage and subsequently more means to reduce or reorganize
consumption so that on-peak demand can be shaved. This would lower utilities’
operational costs, making the chances of the EEI’s “vicious cycle” scenario less likely due
to lower grid costs and
fewer required additional
generation facilities.
Although FirstEnergy and
AEP have advanced
metering infrastructure
(including smart meter
technology) programs,
West Virginia remains
untouched with virtually
zero smart meter
penetration according to
the EEI:

77
Rate schedule restructuring: Similar to the Sacramento Municipal Utility District, West
Virginia utilities should consider a more organized on-peak and off-peak rate system or
even TOU tariffs. Currently, Potomac Edison’s “peak” hours are between 7AM and
10PM, which are very broad compared to more developed price-tiered models
(Potomac Edison Company 2012). A revised rate schedule would more accurately reflect
the cost of energy generation and distribution, thus preparing the utilities to better
equip themselves for a changing energy landscape of integrated DER and DSM. The
more transparency regarding electricity rates the better, because then customers can
make educated decisions on their energy consumption, eventually leading to lower fixed
costs. Additionally, in the same way that the three utilities discussed above are using
energy efficiency to shield themselves from stranded costs, a West Virginian utility
should be able to better assess the need for additional capital expenditures when their
customers are aware of their consumption habits and the true price of the energy they
consume.
78
References
Allen, W. (October 15, 2012). Community Choice Aggregation: Giving Consumers Access to Clean Energy [Web log message]. Retrieved from http://thinkprogress.org/climate/2012/10/15/1006681/community-choice-aggregation-giving-consumers-access-to-clean-energy/
American Council for an Energy-Efficient Economy. (March 27, 2013). State Energy Efficiency Policy
Database Tennessee. Retrieved from http://aceee.org/sector/state-policy/tennessee American Council for an Energy-Efficient Economy. (March 27, 2013). State Energy Efficiency Policy
Database Colorado. Retrieved from http://aceee.org/sector/state-policy/colorado Appalachian Regional Commission. (2004). Moving Appalachia Forward: Appalachian Regional
Commission Strategic Plan 2005-2010. Washington D.C.: Appalachian Regional Commission B. Krishnamoorthy, personal communication, June 14, 2013. Champion Energy Services. Champion Energy Services, LLC. ERCOT Residential, Fixed Rate Product.
Retrieved from http://www.championenergyservices.com/images/TOS_Oncor.pdf Clean Edge, Inc. (March 2013). Clean Energy Trends 2013. Retrieved from
www.cleanedge.com/reports/clean-energy-trends-2013 D. Garvin, personal communication, June 26, 2013. Database of State Incentives for Renewables & Efficiency, DSIRE. (November 19, 2012). West Virginia
Incentives/Policies for Renewables & Efficiency. Retrieved from http://www.dsireusa.org/incentives/incentive.cfm?Incentive_Code=WV05R
Database of State Incentives for Renewables & Efficiency, DSIRE. (August 9, 2012). Pennsylvania
Incentives/Policies for Renewables & Efficiency. Retrieved from http://www.dsireusa.org/incentives/incentive.cfm?incentive_code=pa06r
Database of State Incentives for Renewables & Efficiency, DSIRE. (November 8, 2012). Ohio
Incentives/Policies for Renewables & Efficiency. Retrieved from http://www.dsireusa.org/incentives/incentive.cfm?Incentive_Code=OH14R
Database of State Incentives for Renewables & Efficiency, DSIRE. (2013). Federal Business Energy
Investment Tax Credit (ITC). Retrieved from
http://www.dsireusa.org/incentives/incentive.cfm?Incentive_Code=US02F.

79
Database of State Incentives for Renewables & Efficiency, DSIRE. (2013). Modified Accelerated Cost-Recovery System (MACRS) + Bonus Depreciation (2008-2013). Retrieved from http://www.dsireusa.org/incentives/incentive.cfm?Incentive_Code=US06F
Duke Energy. Customer Owned Generation. Retrieved July 12, 2013 from http://www.duke-
energy.com/ohio/customer-owned-generation.asp Dayton Power & Light. Install Renewable Energy at Your Home Business. Retrieved July 12, 2013 from
http://www.dpandl.com/environment/renewable-energy/install-renewable-energy-at-your-home-or-business/
Dominion Resources Inc. Solar Purchase Program FAQs. Retrieved July 8, 2013 from
https://www.dom.com/about/stations/renewable/solar/solar-purchase-program-faqs.jsp Duquesne Light. Customer Generation. Retrieved July 12, 2013 from
https://www.duquesnelight.com/forYourHome/SaveEnergyAndSaveMoney/CustomerGeneration.cfm
Edison Electric Institute. (January, 2013). Disruptive Challenges: Financial Implications and Strategic
Responses to a Changing Retail Electric Business. Retrieved from www.eei.org/ourissues/finance/Documents/disruptivechallenges.pdf
Energy Information Administration. (April, 2013). Annual Energy Outlook 2013 with Projections to
2040. Retrieved from http://www.eia.gov/forecasts/aeo/ Energy Information Administration. (July, 2013). Quarterly Coal Report January – March 2013.
Retrieved from http://www.eia.gov/coal/production/quarterly/ Energy Information Administration. (Every report in 3 month intervals January 2005 through March
2013). Electric Power Monthly. Retrieved from http://www.eia.gov/electricity/monthly/ Ernst & Young. (2012). Cleantech matters: Global competiveness. Retrieved from www.ey.com
FirstEnergy Company. Mon Power Retail Interconnection. Retrieved July 12, 2013 from https://www.firstenergycorp.com/content/fecorp/feconnect/monpower/retail.html
FirstEnergy Company. (March 1, 2013). Annual Energy Efficiency and Peak Demand
Reduction Program Portfolio Status Report to the Public Service Commission of West Virginia. Retrieved from www.psc.state.wv.us%2Fscripts%2FWebDocket%2FViewDocument.cfm%3FCaseActivityID%3D363688&ei=XMz_UeXvF4LS9QSA74GQDA&usg=AFQjCNHU4yJses9sx_-DnfcPvjGwIsDMNQ&sig2=ucPpTQQZ1yg_CVbz3U8pyg&bvm=bv.50165853,d.eWU

80
Georgia Power. Solar Buy Back. Retrieved July 8, 2013 from http://www.georgiapower.com/earthcents/green/solar-buyback.cshtml
Internal Revenue Service. (May 2010). New Markets Tax Credit. Report code: LMSB-04-0510-016.
Retrieved from www.irs.gov/pub/irs-utl/atgnmtc.pdf Interstate Renewable Energy Council. (2012). 2012 Annual Updates & Trends Report. Retrieved from
http://www.irecusa.org/publications/. Interstate Renewable Energy Council. (2012). Net Metering – Past, Present, and Future. Retrieved
from Sites.energetics.com/madri/pdfs/Keyes.pdf. Interstate Renewable Energy Council, The Vote Solar Initiative, Network for New Energy Sources,
North Carolina Solar Center. (November, 2012). Freeing the Grid 2012: Best Practices in State Net Metering Policies and Interconnection Procedures. Retrieved from www.freeingthegrid.org.
Kurlewitz, A. (March, 18, 2013). The Numbers Behind SolarCity’s Success. Retrieved on August 2, 2013
from Greentech Media website: http://www.greentechmedia.com/articles/read/The-Numbers-Behind-SolarCitys-Success
L. Sherwood, personal communication, June 26, 2013. Local Area Unemployment Statistics [Data file]. (2013). Retrieved from U.S. Bureau of Labor Statistics
website: http://www.bls.gov/data/#unemployment Local Government Commission, State of California Energy Commission. (2006). Community Choice
Aggregation. Retrieved from www.energy.ca.gov/2006publications/CEC-500-2006-082/CEC-500-2006-082.PDF
Marin Clean Energy. Frequently Asked Questions. Retrieved July 9, 2013 from
https://marincleanenergy.info/feed-in-tariff Marshall University Research Corporation. (May 24, 2012). Marshall Announces Solar Panel
Installation and Education Project at University High School. Retrieved from http://muwww-new.marshall.edu/murc/marshall-announces-solar-panel-installation-and-education-project-at-university-high-school/
Mathis, J. E. (January 5, 2012). West Virginia Energy Outlook 2012: Identifying Synergies Between
Renewables and Fossil Fuel. Retrieved March 12, 2013, from Renewable Energy World website: http://www.renewableenergyworld.com/rea/news/article/2012/01/west-virginia-energy-outlook-2012-identifying-synergies-between-renewables-and-fossil-fuel

81
Mathis, J.E. (April 30, 2013). Renewable Energy Optimization in the Heart of Coal Country. Retrieved March 12, 2013, from Renewable Energy World website: http://www.renewableenergyworld.com/rea/news/article/2013/04/renewable-energy-optimization-in-the-heart-of-coal-country
Naam, R. (March 16, 2011). Smaller, Cheaper, Faster: Does Moore’s Law Apply to Solar Cells? Retrieved from Scientific American website: http://blogs.scientificamerican.com/guest-blog/2011/03/16/smaller-cheaper-faster-does-moores-law-apply-to-solar-cells/
Ohio Public Utilities Commission. (2013). Renewable Resources and Wholesale Price Suppression.
Retrieved from http://www.midwestenergynews.com/wp-content/uploads/2013/09/PUCO-renewable-energy-standard-study.pdf
PACENow. Commercial PACE. Retrieved July 9, 2013 from http://pacenow.org/about-
pace/commercial-pace-programs/. Pacific Gas and Electric. Time of Use Rates. Retrieved July 31, 2013 from
http://www.pge.com/TOUintro/#tou classhdrclr Pennsylvania Utilities Commission. Pennsylvania AEPS Alternative Energy Credit Program. Retrieved
July 12, 2013 from http://paaeps.com/credit/ Pernick, R., & Wilder, C. (2012). Clean Tech Nation. New York, NY: HarperCollins. European Photovoltaic Industry Association. (2012). Global Market Outlook for Photo-voltaics 2013-
2017. Retrieved from http://www.epia.org/news/publications/global-market-outlook-for-photovoltaics-2013-2017/
Potomac Edison Company. (2012). The Potomac Edison Company Rates and Rules & Regulations for Electric Service in Certain Counties in West Virginia. Retrieved July
18, 2013 from https://www.firstenergycorp.com/content/dam/customer/Customer%2520Choice/Files/west-virginia/tariffs/WVPERetailTariff.pdf
Property Assessed Clean Energy. (2013). Commercial PACE. http://pacenow.org/about-
pace/commercial-pace-programs/. Accessed June 2013. Public Utilities Commission of Ohio. Docketing Information System. Retrieved July 12, 2013 from
http://dis.puc.state.oh.us/ Regulatory Assistance Project. (2011). Revenue Regulation and Decoupling: A guide to theory and
Application. Retrieved from www.raponline.org/document/download/id/902.

82
Sacramento Municipal Utilities District. (April 2013). Preparing for the Future: 2013 Rate Proposal. Retrieved from https://www.smud.org/en/residential/customer-service/rate-information/2013-residential-rate-proposal/2013-Rate-FAQs.htm
Siemens AG. (April 18, 2013). Virtual Power Plants in Competitive Wholesale Electricity Markets.
Retrieved from resnick.caltech.edu/docs/d-Siemens_Grid3.pdf Small Business Administration. Real Estate and Equipment Loans: CDC/504. Retrieved July 9, 2013
from http://www.sba.gov/category/navigation-structure/loans-grants/small-business-loans/sba-loan-programs/real-estate-and-eq
SolarCity. Military Client Portfolio. Retrieved June 15, 2013 from
http://www.solarcity.com/commercial/portfolio/military/ Solar Electric Power Association. (2012). 2012 Top 10 Solar Rankings.
http://www.solarelectricpower.org/media/279520/sepa-top-10-executive-summary_final-v2.pdf
Solar Energy Industries Association, GTM Research. (2013). US Solar Market Insight Q1 2013.
Retrieved from SEIA website: http://salsa.wiredforchange.com/o/6422/p/salsa/web/common/public/signup? signup_page_KEY=6703. Accessed June 2013. Solar Mosaic. Browse Investments. Retrieved June 15, 2013 from
http://www2.liu.edu/cwis/cwp/library/workshop/citapa.htm. Speer, B. K. (September 4, 2012). Municipal Bond - Power Purchase Agreement Model Continues to
Provide Low-Cost Solar Energy. Retrieved from National Renewable Energy Laboratory website: https://financere.nrel.gov/finance/content/municipal-bond-power-purchase-agreement-model-
continues-provide-low-cost-solar-energy Standard and Poor. (January 23, 2012). Will Securitization Help Fuel the U.S. Solar Power Industry?.
Retrieved from Clean Energy Finance Center website: www.cleanenergyfinancecenter.org/wpcontent/uploads/WillSecuritizationHelpFuelTheUSSolarPowerIndustry_Jan2012_tsr-copy.pdf
State of California, & California Energy Commission, & California Public Utilities Commission. How
Much Will My Incentive Be? Retrieved on July 15, 2013 from Go Solar California website: http://www.gosolarcalifornia.ca.gov/csi/step3.php
State of Colorado Public Utilities Commission. About Xcel Energy’s Seasonally Tiered Rates. Retrieved
July 16, 2013 from http://cdn.colorado.gov/cs/Satellite/DORA-PUC/CBON/DORA/1251642963374.

83
Tennessee Valley Authority. (March 2011). Integrated Energy Plan TVA’s Environmental and Energy
Future. Retrieved from www.tva.gov/environment/reports/irp/pdf/Final_IRP_complete.pdf Tennessee Valley Authority. Q&A Green Power Switch. Retrieved July 15, 2013 from
http://www.tva.com/greenpowerswitch/green_mainfaq.htm The Clarion. (July 18, 2013). Power Board Takes Part in EEDR Program to Help Evaluate Usage, Save
Customers Money. http://www.theclarion.org/index.php?option=com_content&view=article&id=4451:power-board-takes-part-in-eedr-program-to-help-evaluate-usage-save-customers-money&catid=55:news&Itemid=143
The Solar Foundation. (November, 2012). National Solar Job Consensus 2012. Retrieved from
http://thesolarfoundation.org/research/national-solar-jobs-census-2012 The Vote Solar Initiative. (November 13, 2011). Colorado to Achieve 30% Renewables 8 Years Early,
Saves Ratepayers Big Bucks. Retrieved from http://votesolar.org/2011/11/colorado-to-achieve-30-renewables-8-years-early-ratepayer-savings-of-409-million/
The 2012 Statistical Abstract: State Rankings [Data file]. (July 2008). Retrieved from U.S. Census
Bureau website: http://www.census.gov/compendia/statab/rankings.html U.S. Department of Agriculture. Business and Cooperative Assistance. Retrieved July 9, 2013 from
http://www.rurdev.usda.gov/bcp_reapreseei.html U.S. Department of Energy. (March 19, 2007). Renewable Energy Production Incentive. Retrieved
from http://apps1.eere.energy.gov/repi/ U.S. Department of Energy. (2012). Sunshot Vision Study February 2012. Retrieved from
http://www1.eere.energy.gov/solar/sunshot/vision_study.html U.S. Department of Energy National Renewable Energy Laboratory. (2012). A Guide to Community
Shared Solar: Utility, Private, and Nonprofit Project Development. Retrieved from www.nrel.gov/docs/fy12osti/54570.pdf
U.S. Department of Energy, National Renewable Energy Laboratory. (December 2009). Decoupling
Policies: Options to Encourage Energy Efficiency Policies for Utilities. Report code: NREL/BR-6A2-46606. Retrieved from www.nrel.gov/docs/fy10osti/46606.pdf

84
U.S. Department of Energy, National Renewable Energy Laboratory. (July 2012). Energy Systems A Convergence of Ideas. Report Code: NREL/TP-6A00-55649. Retrieved from www.nrel.gov/esi/pdfs/55649.pdf.
U.S. Department of Energy, National Renewable Energy Laboratory, U.S. Environmental Protection
Agency. (August, 2010). Feasibility Study of Eocnomics and Performance of Solar Photovoltaics in Nitro, West Virginia. Report code: NREL/TP -6A2-48594. Retrieved from www.nrel.gov/docs/fy10osti/48594.pdf
U.S. Department of Energy, National Renewable Energy Laboratory. (February 2010). Solar PV Project Financing: Regulatory and Legislative Challenges for Third-Party PPA System Owners. Report code: NREL/TP-6A2-46723. Retrieved from www.nrel.gov/docs/fy10osti/46723.pdf
U.S. Department of Energy, National Energy Technical Laboratory (August 20, 2009). West Virginia
Smart Grid Implementation Plan. Report Code: DOE/NETL-2009/1386. U. S. Environmental Protection Agency. (2013). RE-Powering America’s Land Initiative: Renewable
Energy Projects on Potentially Contaminated Land, Landfills, and Mine Sites. Retrieved from http://www.epa.gov/oswercpa/
West Virginia Department of Commerce. (2013). WV Industries. Retrieved from
http://www.wvcommerce.org/business/industries/default.aspx West Virginia Economic Development Authority. Direct Loan Program. Retrieved July 9, 2013 from
http://www.wveda.org/program-directloan.html West Virginia Environmental Council. (July 2008). West Virginia Citizens’ Energy Plan For Economic Opportunities and a Sustainable Future. Retrieved from
www.wvecouncil.org/issues/renewable_energy/WVEC_Citizen_Energy_Plan_2008.pdf West Virginia H.B. 103, 2009 West Virginia H.B. 2740, 2012. West Virginia Office of Miners' Health, Safety and Training. (October 10, 2012). West Virginia Coal
Mining Facts. Retrieved June 25, 2013 from http://www.wvminesafety.org/wvcoalf acts.htm West Virginia Public Service Commission. Mission Statement of the Public Service Commission.
Retrieved on June 23, 2013 from http://www.psc.state.wv.us/missionstatement.htm

85
West Virginia University Solar Decathlon. The Design. Retrieved June 28, 2013 from http://solar.wvu.edu/
ZPryme Research and Consulting. (2012). U.S. Smart Meter Trends. Retrieved from
www.smartgridresearch.org.
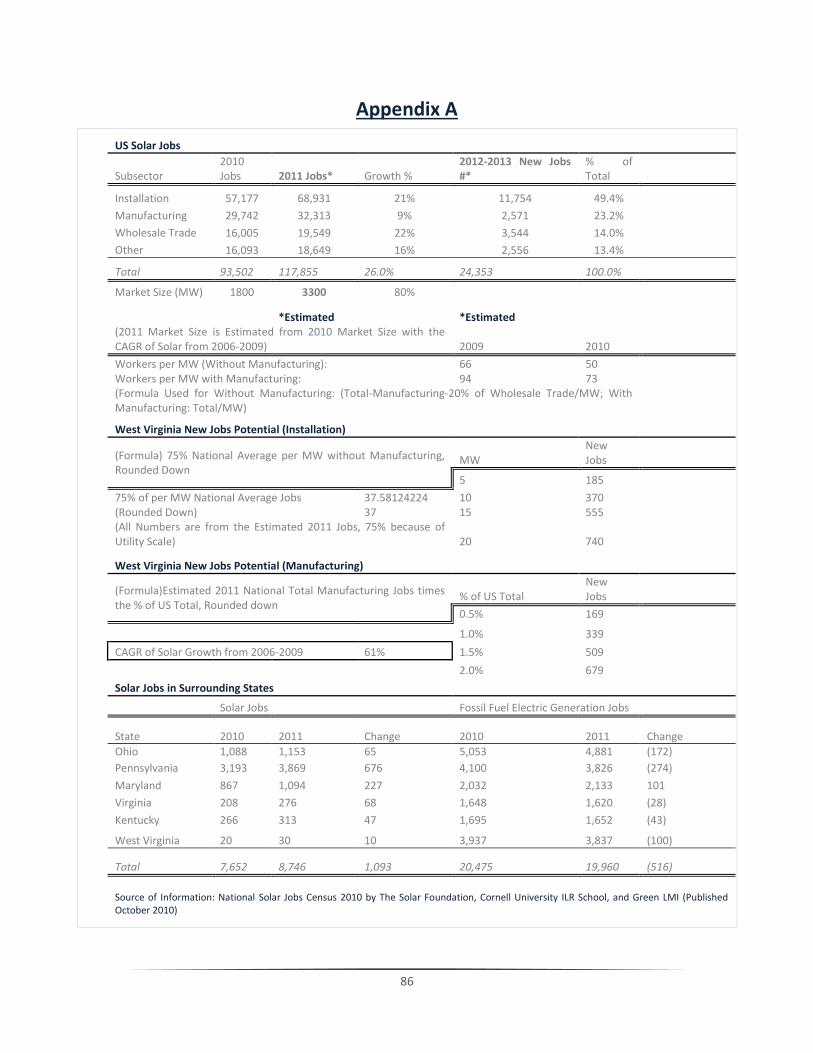
86
Appendix A
US Solar Jobs
Subsector 2010 Jobs 2011 Jobs* Growth %
2012-2013 New Jobs #*
% of Total
Installation 57,177 68,931 21% 11,754 49.4% Manufacturing 29,742 32,313 9% 2,571 23.2% Wholesale Trade 16,005 19,549 22% 3,544 14.0% Other 16,093 18,649 16% 2,556 13.4%
Total 93,502 117,855 26.0% 24,353 100.0%
Market Size (MW) 1800 3300 80%
*Estimated
*Estimated
(2011 Market Size is Estimated from 2010 Market Size with the CAGR of Solar from 2006-2009) 2009 2010
Workers per MW (Without Manufacturing): 66 50 Workers per MW with Manufacturing: 94 73 (Formula Used for Without Manufacturing: (Total-Manufacturing-20% of Wholesale Trade/MW; With
Manufacturing: Total/MW) West Virginia New Jobs Potential (Installation)
(Formula) 75% National Average per MW without Manufacturing, Rounded Down
MW New Jobs
5 185 75% of per MW National Average Jobs 37.58124224 10 370 (Rounded Down) 37 15 555 (All Numbers are from the Estimated 2011 Jobs, 75% because of
Utility Scale) 20 740
West Virginia New Jobs Potential (Manufacturing)
(Formula)Estimated 2011 National Total Manufacturing Jobs times the % of US Total, Rounded down
% of US Total New Jobs
0.5% 169
1.0% 339
CAGR of Solar Growth from 2006-2009 61% 1.5% 509
2.0% 679
Solar Jobs in Surrounding States
Solar Jobs Fossil Fuel Electric Generation Jobs
State 2010 2011 Change 2010 2011 Change
Ohio 1,088 1,153 65 5,053 4,881 (172)
Pennsylvania 3,193 3,869 676 4,100 3,826 (274)
Maryland 867 1,094 227 2,032 2,133 101
Virginia 208 276 68 1,648 1,620 (28)
Kentucky 266 313 47 1,695 1,652 (43)
West Virginia 20 30 10 3,937 3,837 (100)
Total 7,652 8,746 1,093 20,475 19,960 (516)
Source of Information: National Solar Jobs Census 2010 by The Solar Foundation, Cornell University ILR School, and Green LMI (Published October 2010)

87
Appendix B Sustainable Williamson’s research team utilized the National Renewable Energy Laboratory’s Jobs and Economic Development Impact (JEDI) model in assessing the Integrated Energy Park model’s potential for job creation across the state. A very conservative estimate of 60 IEP-friendly sites across the Southern Coalfields alone renders a coupled-generation plant (10 MW natural gas, 2 MW solar) a solid investment in economic diversification. Our methodology for counting potential sites is as follows: (1) Suitability of natural gas reserves when a site is located far away from an interstate natural
gas transmission line: a. 10 “AM active” or “A2 active, reclamation” surface mine sites across six counties (Logan,
Wyoming, Mingo, McDowell, Kanawha, and Lincoln) were identified using GPS coordinates found on mining permits available through the West Virginia Department of Environmental Protection’s website.
b. For each site, data for 200 wells within a five mile radius was aggregated through the “Oil and Natural Gas Wells” map available on the West Virginia Geologic and Economic Survey’s website.
c. Proceeding by manner of proximity, each well’s annual production was averaged (in Mcf) for 2008 – 2012. If years were missing, only the available years between 2008 and 2012 were used. If production was reported as “0” for fewer than 6 months of the year, then a conservative estimate for the average of all of the production months were used as a substitute for the non-production months, so as to more helpfully assess the well’s capacity.
d. Some wells have not been in production since before 2008 or were classified as “Final Type Unsuccessful,” in which case the well was not included.
e. The average annual production amongst the 200 wells sampled across the 10 different active surface mining sites was around 8700 Mcf, or 725 Mcf per month, i.e. 23.8 Mcf per day.
f. The company supplying the natural gas generators has informed our team that each 2 MW generator, five total, will consume 2100 cubic feet of processed natural gas per hour in order to produce peak output. This figure translates to 10.5 Mcf per hour under peak load, or 252 Mcf of processed natural gas per day.
g. Using conservative assumptions that the gas derived from the wells is only 80% methane and that standard processed natural gas is 95% methane, it would take 299.25 Mcf/day of unprocessed natural gas to achieve peak output. This correlates to a 13 wellhead-per-site rule-of-thumb.
(2) Across Kanawha, Mingo, McDowell, Lincoln, Fayette, Logan, Wyoming, Boone, Wayne, Raleigh, and Clay counties, active surface mining permits (AM-active and A2-active, reclamation) were identified. There are more than 60 permits for active surface mine sites, but for a conservative estimate, the team crosschecked only 60 of these sites with Google Earth to verify mine locations. Within five miles of each site are indeed situated in excess of 13 wellheads, thus each site may qualify as a potential IEP location, given that financing is available for onsite CO2/H2S/hydrocarbon processing equipment should the IEP be located

88
a significant distance away from an interstate transmission gas pipeline. A map of these pipelines is included here:
(3) JEDI models for solar and natural gas projects 2 MW and 10 MW in respective capacity
were run. The job projections below are an estimate, but keep in mind that they do not include any jobs created by the hopeful implementation of biomass for the generation of ethanol and bio-thermal energy as well as that the solar component of any IEP is modular, meaning that a 2 MW array can be easily expanded given viable financing.
According to Mark Muchow from the West Virginia Department of Revenue, each IEP site is subject to the business and operations (B&O) tax, which is equal to nameplate capacity * 40% * $22.78/kw. Together each IEP will secure around $109,000 in state B&O tax revenue per year. This gross tax can be reduced by the Industrial Expansion and Revitalization Tax Credit, which may reduce B&O tax liability by up to 50% according to Muchow. This yields $54,500 in B&O taxes per IEP, and this revenue goes to West Virginia’s General Revenue Fund, half of which is specifically dedicated to primary and secondary education. According to Jeff Amburgey, also from the state’s Department of Revenue, the average property tax rate within a West Virginian municipality was 2.85%, and outside a municipality the average rate was 2.21%. These rates

89
would then apply to 60% of the assessed property value for each IEP. Needless to say, the IEP model would greatly benefit the tax streams of some of the most economically depressed counties in the country.

90