Embed Size (px)
Citation preview

CITY OF PLAYFORD – ICT SERVICES - ASSET MANAGEMENT PLAN (Endorsed by Council – 23/7/2013)
CITY OF PLAYFORD
2013 / 2014
Information Communications Technology
Asset Management Plan
CITY OF PLAYFORD – ICT SERVICES - ASSET MANAGEMENT PLAN (Endorsed by Council – 23/7/2013)
Document Control
Document ID: 59_04_070905_lgasa_iamp template v11
Rev No Date Revision Details Author Reviewer Approver
1 March 2010 Version 1 Chris Horsell
Rachel Paterson Paul Alberton
Jodi Wright
Peter Oye
May 2010 Community Consultation
1 July 2010 Council Endorsement
2 March 2011 Version 2 Chris Horsell Paul Alberton Peter Oye
3 April 2013 Version 3 Simon Reiter
Jof Horricks
Paul Alberton Mal Hemmerling
© Copyright 2012 – All rights reserved.
The Institute of Public Works Engineering Australia.
www.ipwea.org.au/namsplus
CITY OF PLAYFORD – ICT SERVICES - ASSET MANAGEMENT PLAN (Endorsed by Council – 23/7/2013)
TABLE OF CONTENTS
1. EXECUTIVE SUMMARY .................................................................................................................................................. 1 What Council Provides ........................................................................................... 1 What does it Cost? ................................................................................................. 1 Plans for the Future ................................................................................................ 1 Measuring our Performance ................................................................................... 1 The Next Steps ....................................................................................................... 2
2. INTRODUCTION .............................................................................................................................................................. 3 2.1 Background ...................................................................................................... 3 2.2 Goals and Objectives of Asset Management .................................................... 4 2.3 Plan Framework ............................................................................................... 5 2.4 Core and Advanced Asset Management .......................................................... 6 2.5 Community Consultation .................................................................................. 6
3. LEVELS OF SERVICE ..................................................................................................................................................... 7 3.1 Customer Research and Expectations ............................................................. 7 3.2 Strategic and Corporate Goals ....................................................................... 11 3.3 Legislative Requirements ............................................................................... 11 3.4 Current Levels of Service ............................................................................... 12 3.5 Desired Levels of Service .............................................................................. 13
4. FUTURE DEMAND ........................................................................................................................................................ 14 4.1 Demand Drivers ............................................................................................. 14 4.2 Demand Forecast .......................................................................................... 14 4.3 Demand Impact on Assets ............................................................................. 14 4.4 Demand Management Plan............................................................................ 14 4.5 Asset Programs to meet Demand .................................................................. 15
5. LIFECYCLE MANAGEMENT PLAN ............................................................................................................................... 16 5.1 Background Data ........................................................................................... 16 5.2 Risk Management Plan .................................................................................. 18 5.3 Routine Operations and Maintenance Plan .................................................... 19 5.4 Renewal / Replacement Plan ......................................................................... 22 5.5 Creation/ Acquisition / Upgrade Plan .............................................................. 25
6. FINANCIAL SUMMARY ................................................................................................................................................. 27 6.1 Financial Statements and Projections ............................................................ 27 6.2 Funding Strategy ............................................................................................ 31 6.3 Valuation Forecasts ....................................................................................... 31 6.4 Key Assumptions made in Financial Forecasts .............................................. 33
7. PLAN IMPROVEMENT AND MONITORING ................................................................................................................... 34 7.1 Status of Asset Management Practices .......................................................... 34 7.2 Improvement Program ................................................................................... 35 7.3 Monitoring and Review Procedures ................................................................ 35
8. REFERENCES ............................................................................................................................................................... 36 9. APPENDICES ................................................................................................................................................................ 37
E ABBREVIATIONS ......................................................................................... 38 F GLOSSARY .................................................................................................. 39
- 1 -
CITY OF PLAYFORD – ICT SERVICES - ASSET MANAGEMENT PLAN (Endorsed by Council – 23/7/2013)
1. EXECUTIVE SUMMARY
What Council Provides
Council provides an Information Communication Technology (ICT) Services network to enable the delivery of services to the community which support the governance and accountability of Council. These services are provided in partnership with end users to enable a systematic process of capturing, organising, sharing and using information to enable us to meet our strategic objectives and deliver services to our Community.
What does it Cost?
The projected outlays necessary to provide the services covered by this Asset Management Plan (AM Plan) includes operations, maintenance, renewal and upgrade of existing assets over the 10 year planning period is $26.03m or $2.60m on average per year.
Estimated available funding for this period is $25.28m or $2.53m on average per year which is 97% of the cost to provide the service. This is a funding shortfall of $-0.07m on average per year.
Plans for the Future
Council plans to operate and maintain the ICT network to achieve the following strategic objectives.
1. We are committed to meeting customer needs and providing well informed advice and direction so that users of our systems achieve the best possible outcomes. We aim to strive for excellence and best practice in technology, information management and service delivery to meet customer expectations at the highest level possible, subject to budget limitations
2. Ensure the ICT network is maintained at a safe and functional standard.
3. Build our capacity for excellence 4. Ensure we apply resources to meet
short term requirements and long term sustainability
5. Operation, maintenance, renewal and upgrade of all ICT assets to meet service levels are set in annual budgets.
6. ICT infrastructure, including servers, desktops, personal computers, printers, mobile devices, networking, telephony and audio visual equipment replacement will be managed via business plans.
Measuring our Performance
Quality ICT assets will be maintained in a reasonably usable condition. Defects found or reported that are outside our service standard will be repaired. See our maintenance response service levels (Appendix A) for details of defect prioritisation and response time.
Function Our intent is that an appropriate ICT network is maintained in partnership with other levels of government and stakeholders for the sustainable delivery of ICT systems.
ICT asset attributes will be maintained at a safe level and associated equipment be provided to ensure key functional objectives are met:
Cultivate continuous improvement practice across the organisation
Strategically develop and administer assets for maximum organisational and community benefit
The main functional consequence of the ICT services is to enable us to deliver more efficient and more effective services to our community, and thereby achieve Council’s strategic objectives by:
Applying a whole-of-organisation approach to the consideration and delivery of services and projects.
Ensuring that cost effective, integrated and innovative solutions can be delivered to meet challenges,
Broadening the understanding and ownership of knowledge management within the organisation

- 2 -
CITY OF PLAYFORD – ICT SERVICES - ASSET MANAGEMENT PLAN (Endorsed by Council – 23/7/2013)
Safety We monitor all ICT and prioritise and repair defects in accordance with our inspection schedule to ensure they are safe and fully operational.
The Next Steps
This actions resulting from this Asset Management Plan are:
Review data management quality procedures.
Compile a long term financial plan based on asset life cycle funding requirements
Implement trend analysis and capacity planning to facilitate proactive asset acquisitions based on organisational growth.
- 3 -
CITY OF PLAYFORD – ICT SERVICES - ASSET MANAGEMENT PLAN (Endorsed by Council – 23/7/2013)
2. INTRODUCTION
2.1 Background
This Asset Management Plan is to demonstrate responsive management of assets (and services provided from assets), compliance with regulatory requirements, and to communicate funding required providing the required levels of service.
Previous patterns of ICT assets have generally been opportunistic and driven by demand. The number of assets that City of Playford has acquired over time and the ad hoc nature of asset investment mean that the City of Playford’s resources to maintain and upgrade the asset have not been adequate. The expectations associated with levels of service for ICT have changed over the years, staff and community need is a significant factor in the management of Technology assets. City of Playford recognises that its relationship with its communities is changing, and that communities are more involved in levels of service consultation and decision making. The asset management plan follows the format for AM Plans recommended in Section 4.2.6 of the International Infrastructure Management Manual1. The ICT Asset Management Plan is to be read with the following planning documents:
ICT Strategy.
ICT Team Operational Plan.
Organisational Excellence Plan.
Economic Prosperity Plan.
Asset Management Strategy.
Council Plan.
Long Term Financial Plan.
Environmental Goal Plan.
Community Wellbeing Plan.
Emergency Response Plan.
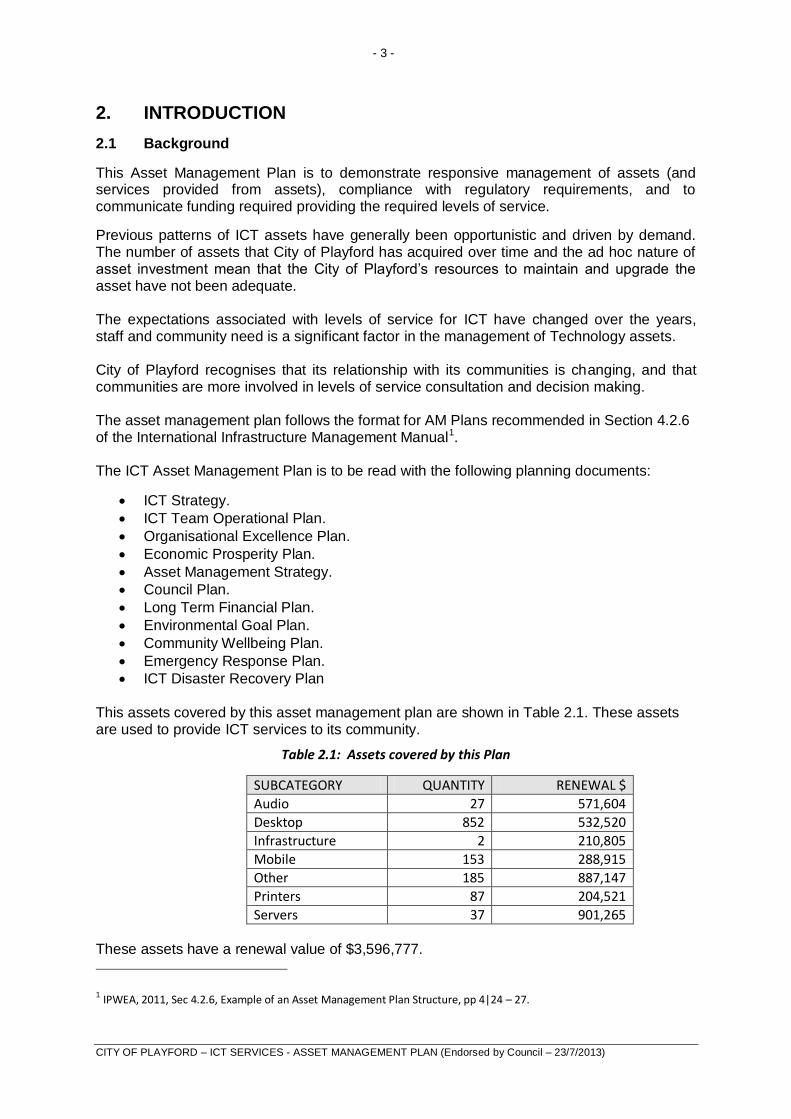
ICT Disaster Recovery Plan This assets covered by this asset management plan are shown in Table 2.1. These assets are used to provide ICT services to its community.
Table 2.1: Assets covered by this Plan
SUBCATEGORY QUANTITY RENEWAL $
Audio 27 571,604
Desktop 852 532,520
Infrastructure 2 210,805
Mobile 153 288,915
Other 185 887,147
Printers 87 204,521
Servers 37 901,265
These assets have a renewal value of $3,596,777.
1 IPWEA, 2011, Sec 4.2.6, Example of an Asset Management Plan Structure, pp 4|24 – 27.

- 4 -
CITY OF PLAYFORD – ICT SERVICES - ASSET MANAGEMENT PLAN (Endorsed by Council – 23/7/2013)
Assumptions
This Plan is based on current service level and purchase dollars. It does not take into consideration any new equipment or systems that may be implemented over the coming year.
Consulting or Contractor costs for implementation of replacement equipment have not been included in the replacement cost, however it is planned that this will be included in future revisions of this plan.
Due to financial system change during the reporting period, operating and maintenance costs have been extrapolated from values used for the last plan and indexed representing 2 cycles of CPI (eg taken to be 3%).
Exclusions
Leased assets are not included in replacement, although at some point in time in the future these leased assets may be owned by the City of Playford.
Most Council software is not currently included in the asset management database, although these assets will be included in future revisions of this plan.
Key stakeholders in the preparation and implementation of this are:
Asset Strategy Governance and Asset Management Strategies
Councillors/Board Members Represent needs of community/shareholders,
Allocate resources to meet the organisation’s objectives in providing services while managing risks,
Ensure organisation is financially sustainable. CEO/General Manager Manage organisation operational activities and future planning
strategic direction.
ICT Services Team Operational and service levels, data information and analysis.
Finance Team Long Term Financial Plans and operational financial data.
2.2 Goals and Objectives of Asset Management
The Council exists to provide services to its community. Some of these services are provided by IT and associated assets. Council has acquired IT assets by ‘purchase’, by contract, or operating lease to meet increased levels of service.
Council’s goal in managing IT assets is to meet the defined level of service (as amended from time to time) in the most cost effective manner for present and future consumers. The key elements of IT asset management are:
Taking a life cycle approach
Developing cost-effective management strategies for the long term.
Providing a defined level of service and monitoring performance.
Understanding and meeting the demands of growth through demand management and Technology investment.
Managing risks associated with asset failures.
Sustainable use of physical resources.
Continuous improvement in asset management practices.2
2 IIMM 2006 Sec 1.1.3, p 1.3
- 5 -
CITY OF PLAYFORD – ICT SERVICES - ASSET MANAGEMENT PLAN (Endorsed by Council – 23/7/2013)
2.3 Plan Framework
Key elements of the plan are:
Levels of service – specifies services and levels of service to be provided by Council.
Future demand – how this will impact on future service delivery and how this is to be met.
Life cycle management – how Council will manage its existing and future assets to provide the required services.
Financial summary – what funds are required to provide the required services.
Asset management practices.
Monitoring – how the plan will be monitored to ensure it is meeting Council’s objectives.
Asset Management Improvement Plan.
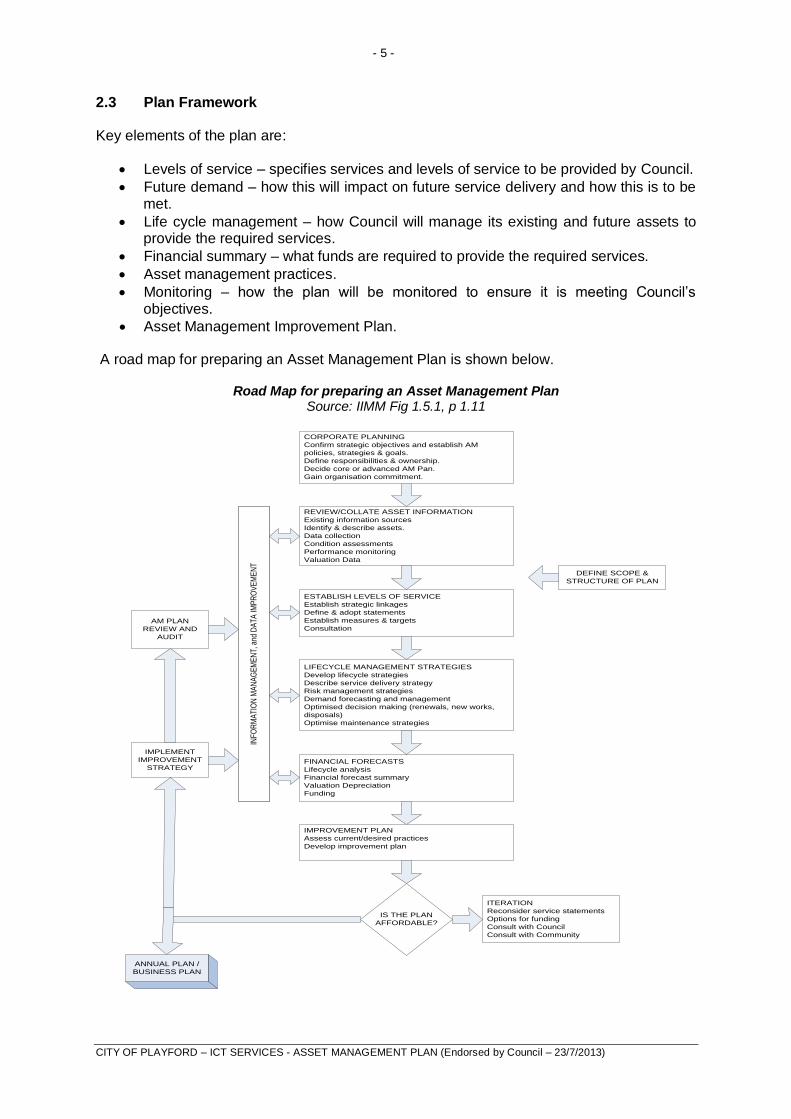
A road map for preparing an Asset Management Plan is shown below.
Road Map for preparing an Asset Management Plan Source: IIMM Fig 1.5.1, p 1.11
IS THE PLAN
AFFORDABLE?
CORPORATE PLANNING
Confirm strategic objectives and establish AM
policies, strategies & goals.
Define responsibilities & ownership.
Decide core or advanced AM Pan.
Gain organisation commitment.
REVIEW/COLLATE ASSET INFORMATION
Existing information sources
Identify & describe assets.
Data collection
Condition assessments
Performance monitoring
Valuation Data
ESTABLISH LEVELS OF SERVICE
Establish strategic linkages
Define & adopt statements
Establish measures & targets
Consultation
LIFECYCLE MANAGEMENT STRATEGIES
Develop lifecycle strategies
Describe service delivery strategy
Risk management strategies
Demand forecasting and management
Optimised decision making (renewals, new works,
disposals)
Optimise maintenance strategies
FINANCIAL FORECASTS
Lifecycle analysis
Financial forecast summary
Valuation Depreciation
Funding
IMPROVEMENT PLAN
Assess current/desired practices
Develop improvement plan
ITERATION
Reconsider service statements
Options for funding
Consult with Council
Consult with Community
DEFINE SCOPE &
STRUCTURE OF PLAN
INF
OR
MA
TIO
N M
AN
AG
EM
EN
T, a
nd D
AT
A IM
PR
OV
EM
EN
T
AM PLAN
REVIEW AND
AUDIT
IMPLEMENT
IMPROVEMENT
STRATEGY
ANNUAL PLAN /
BUSINESS PLAN
INF
OR
MA
TIO
N M
AN
AG
EM
EN
T, a
nd D
AT
A IM
PR
OV
EM
EN
T

- 6 -
CITY OF PLAYFORD – ICT SERVICES - ASSET MANAGEMENT PLAN (Endorsed by Council – 23/7/2013)
2.4 Core and Advanced Asset Management
This IT Asset Management Plan is prepared as a ‘core’ asset management plan in accordance with the International Infrastructure Management Manual. It is prepared to meet minimum legislative and organisational requirements for sustainable service delivery and long term financial planning and reporting. Core asset management is a ‘top down’ approach where analysis is applied at the ‘system’ or ‘network’ level
Future revisions of this will move towards ‘advanced’ asset management using a ‘bottom up’ approach for gathering asset information for individual assets to support the optimisation of activities and programs to meet agreed service levels.
2.5 Community Consultation
This ‘core’ asset management plan is prepared to facilitate community consultation initially through feedback on public display of draft asset management plans prior to adoption by the Council. Future revisions of the asset management plan will incorporate community consultation on service levels and costs of providing the service. This will assist the Council and the community in matching the level of service needed by the community, service risks and consequences with the community’s ability and willingness to pay for the service.
- 7 -
CITY OF PLAYFORD – ICT SERVICES - ASSET MANAGEMENT PLAN (Endorsed by Council – 23/7/2013)
3. LEVELS OF SERVICE
3.1 Customer Research and Expectations
The City of Playford has been undertaking an independent evaluation of Council services through a Resident Satisfaction Survey since 2001.
In 2012, Newfocus Research successfully tendered for this task and was commissioned to undertake the Resident Satisfaction Survey.
Council representatives and Newfocus consultants worked together to develop a new instrument which was pilot tested a number of times, with final approval provided by the Executive.
Objectives
The broad objectives of the Resident Satisfaction Survey were to:
Aid an understanding of customers’ needs and expectations in order to assist in the design and delivery of Council services.
Measure resident perceptions of the City as a place to live.
Understand what could be done to improve perceptions and presentation of the City.
Evaluate the effectiveness of Council services and programs. Methodology
Quantitative research among the broad population within suburbs of the City of Playford.
A sample of 600 residents were interviewed by telephone. We interviewed 100 residents in each ward.
Fieldwork was conducted between 8 and 21 August 2012.
Key Findings:
Awareness of services provided by Council
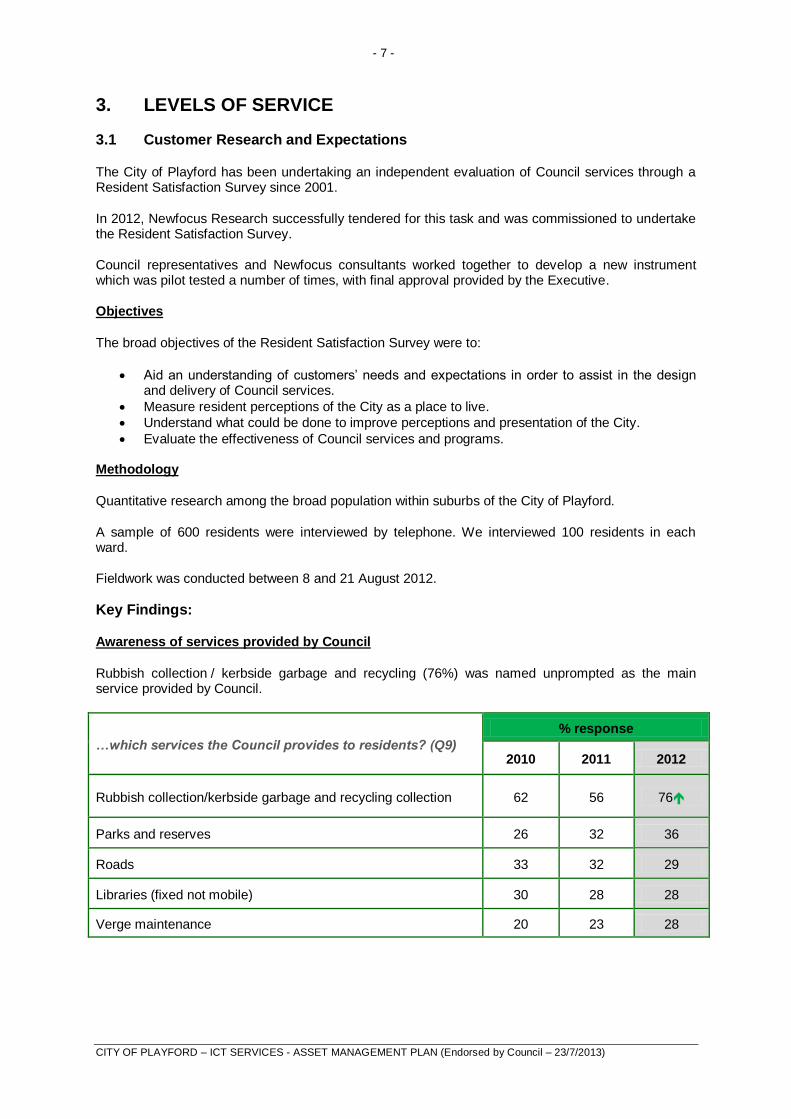
Rubbish collection / kerbside garbage and recycling (76%) was named unprompted as the main service provided by Council.
…which services the Council provides to residents? (Q9)
% response
2010 2011 2012
Rubbish collection/kerbside garbage and recycling collection 62 56 76
Parks and reserves 26 32 36
Roads 33 32 29
Libraries (fixed not mobile) 30 28 28
Verge maintenance 20 23 28

- 8 -
CITY OF PLAYFORD – ICT SERVICES - ASSET MANAGEMENT PLAN (Endorsed by Council – 23/7/2013)
Usage of services provided by Council
Rubbish collection / kerbside garbage and recycling is the service that most residents use in the City of Playford (73% up from 53%).
Claimed usage of other services, however, declined in comparison to 2011.
Council Strategic Goals - Community Wellbeing
Most aspects of Community Assets and Recreation & Leisure continue to be rated well among residents.
Community Assets Mean score (0-10)
2010 2011 2012
Parks and gardens are well maintained 7.2 7.2 7.4
Playgrounds are well maintained 7.2 7.1 7.5
Recreation & Leisure Mean score (0-10)
2010 2011 2012
The provision and maintenance of bicycle paths
is excellent 5.9 6.4 6.2
Ovals and sporting grounds are well maintained 7.4 7.5 7.8
Council supports a range of local sporting clubs* 6.9 6.8 7.5
Council supports a range of community groups
and programs in Playford* 6.9 6.8 7.5
Crime & Safety
Mean score (0-10)
2010
(n~399)
2011
(n~552)
2012
(n~592)
I feel safe in the City of Playford 6.2 6.4 6.4
Graffiti and vandalism control is effective 5.8 5.8 6.2
- 9 -
CITY OF PLAYFORD – ICT SERVICES - ASSET MANAGEMENT PLAN (Endorsed by Council – 23/7/2013)
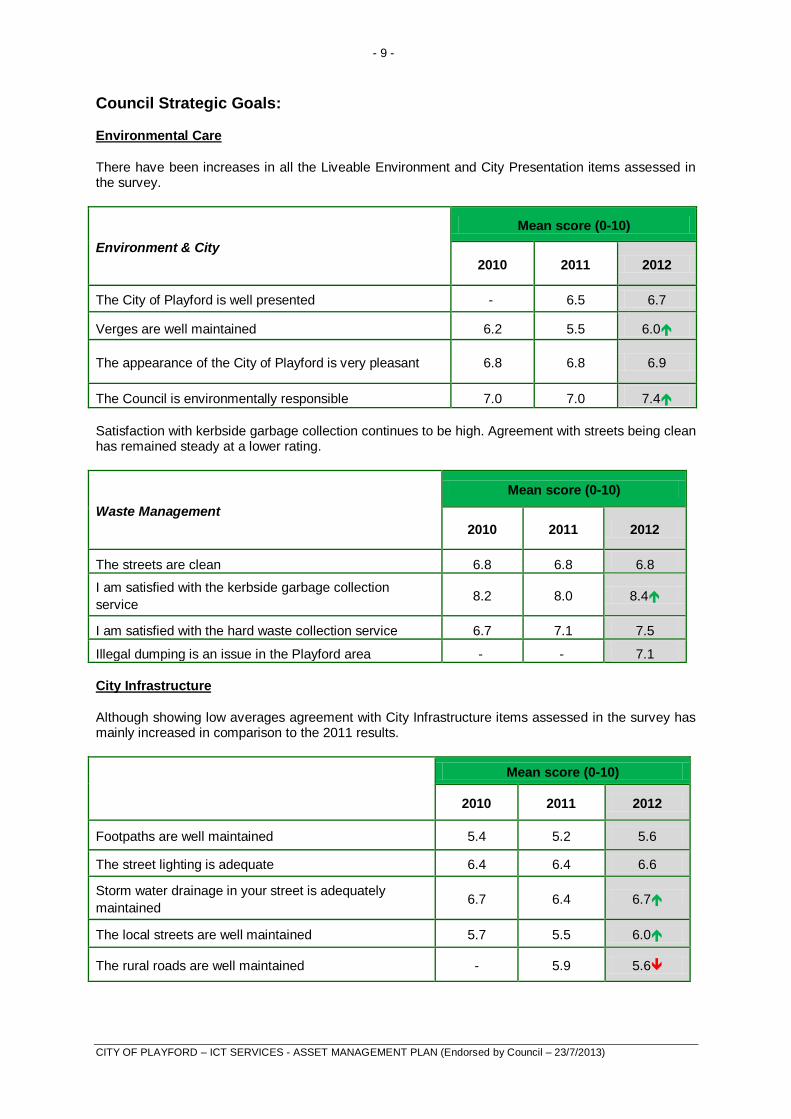
Council Strategic Goals:
Environmental Care
There have been increases in all the Liveable Environment and City Presentation items assessed in the survey.
Environment & City
Mean score (0-10)
2010 2011 2012
The City of Playford is well presented - 6.5 6.7
Verges are well maintained 6.2 5.5 6.0
The appearance of the City of Playford is very pleasant 6.8 6.8 6.9
The Council is environmentally responsible 7.0 7.0 7.4
Satisfaction with kerbside garbage collection continues to be high. Agreement with streets being clean has remained steady at a lower rating.
Waste Management
Mean score (0-10)
2010 2011 2012
The streets are clean 6.8 6.8 6.8
I am satisfied with the kerbside garbage collection
service 8.2 8.0 8.4
I am satisfied with the hard waste collection service 6.7 7.1 7.5
Illegal dumping is an issue in the Playford area - - 7.1
City Infrastructure
Although showing low averages agreement with City Infrastructure items assessed in the survey has mainly increased in comparison to the 2011 results.
Mean score (0-10)
2010 2011 2012
Footpaths are well maintained 5.4 5.2 5.6
The street lighting is adequate 6.4 6.4 6.6
Storm water drainage in your street is adequately
maintained 6.7 6.4 6.7
The local streets are well maintained 5.7 5.5 6.0
The rural roads are well maintained - 5.9 5.6

- 10 -
CITY OF PLAYFORD – ICT SERVICES - ASSET MANAGEMENT PLAN (Endorsed by Council – 23/7/2013)
Organisational Excellence
Agreement with Council’s communications items assessed in the survey are at a medium level.
Communications
Mean score (0-10)
2010 2011 2012
The Council's goals and vision are clear and
communicated to residents 6.2 5.9 6.2
The Council communicates well with its residents 6.0 6.2 6.0
Agreement with Governance and Strategy items remain in line with previous results
Government & Strategy
Mean score (0-10)
2010 2011 2012
The Council is responsive to community needs 6.3 6.3 6.2
The Council invites residents to participate in decision-
making 5.0 5.7 5.9
The Council is open and accountable to the community 5.5 6.4 6.2
The Council provides value for money in return for the
rates I pay each year 5.5 5.4 5.1
The Council plans for the future 5.6 6.8 6.7
Elected Members do their job of representing my views
well 6.1 5.5 5.7
Overall Satisfaction with Council
Overall Satisfaction with Council stood at 68 out of 100 in 2012. This represented a slight decrease in comparison to the previous results.
Satisfaction score Total Male Female 40 or
under 41 to 60
Age 61
+
Overall satisfaction with the
Council 68 67 68 69 65 71
Value for Money
Mean score (0-10)
2010 2011 2012
The Council provides value for money in return for the
rates I pay each year 5.5 5.4 5.1
Council uses this information in developing the Strategic Management Plan and in allocation of resources in the budget.
- 11 -
CITY OF PLAYFORD – ICT SERVICES - ASSET MANAGEMENT PLAN (Endorsed by Council – 23/7/2013)
3.2 Strategic and Corporate Goals
This is prepared under the direction of Council’s vision, mission, goals and objectives.
Our vision is:
The City of Playford is committed to the sustainable provision of built and natural assets that contribute to community wellbeing. We will achieve this through community driven service levels and asset wise application of integrated knowledge management and financial systems.
Our mission is:
ICT is the systematic process of capturing, organising, sharing and using information to enable us to meet our strategic objectives and deliver services to our Community.
Relevant Council goals and objectives and how these are addressed in this Asset Management Plan are:
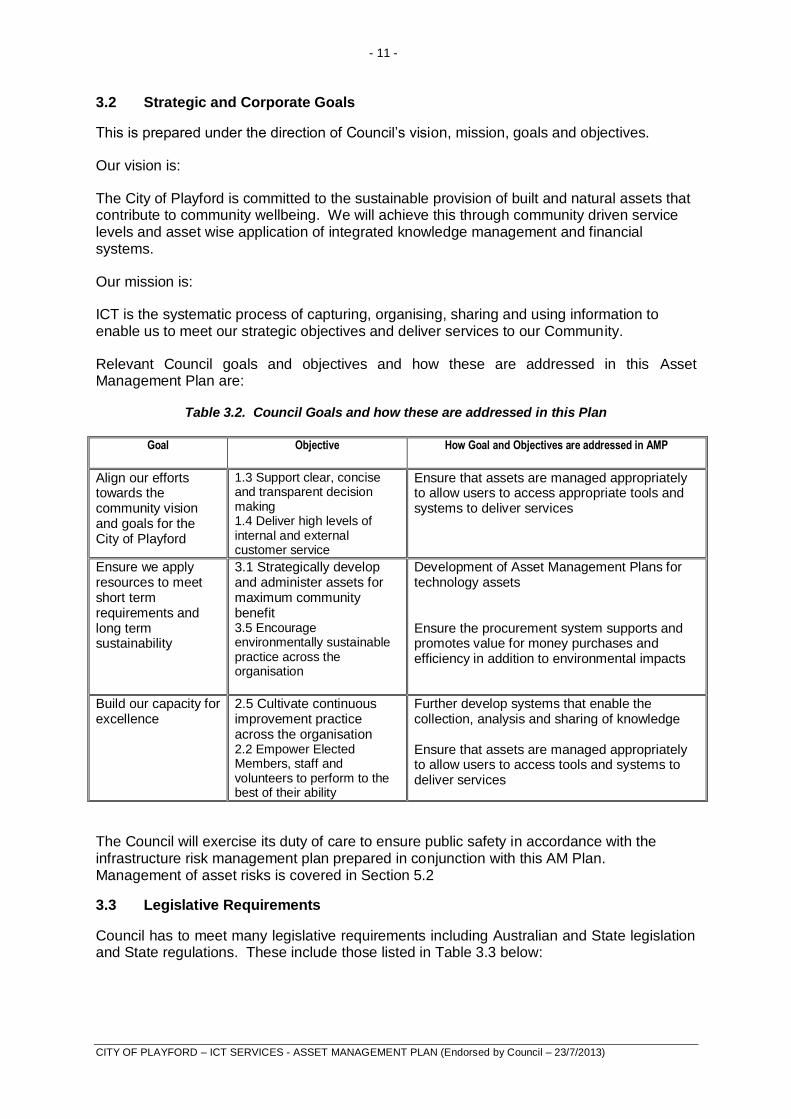
Table 3.2. Council Goals and how these are addressed in this Plan
Goal Objective How Goal and Objectives are addressed in AMP
Align our efforts towards the community vision and goals for the City of Playford
1.3 Support clear, concise and transparent decision making 1.4 Deliver high levels of internal and external customer service
Ensure that assets are managed appropriately to allow users to access appropriate tools and systems to deliver services
Ensure we apply resources to meet short term requirements and long term sustainability
3.1 Strategically develop and administer assets for maximum community benefit 3.5 Encourage environmentally sustainable practice across the organisation
Development of Asset Management Plans for technology assets Ensure the procurement system supports and promotes value for money purchases and efficiency in addition to environmental impacts
Build our capacity for excellence
2.5 Cultivate continuous improvement practice across the organisation 2.2 Empower Elected Members, staff and volunteers to perform to the best of their ability
Further develop systems that enable the collection, analysis and sharing of knowledge Ensure that assets are managed appropriately to allow users to access tools and systems to deliver services
The Council will exercise its duty of care to ensure public safety in accordance with the infrastructure risk management plan prepared in conjunction with this AM Plan. Management of asset risks is covered in Section 5.2
3.3 Legislative Requirements
Council has to meet many legislative requirements including Australian and State legislation and State regulations. These include those listed in Table 3.3 below:

- 12 -
CITY OF PLAYFORD – ICT SERVICES - ASSET MANAGEMENT PLAN (Endorsed by Council – 23/7/2013)
Table 3.3. Legislative Requirements
Legislation Requirement
Local Government Act Sets out role, purpose, responsibilities and powers of local governments including the preparation for sustainable service delivery.
State records Act Sets out responsibilities and requirements in relation to the management of Council records.
Freedom of Information Sets out the framework for processing requests for Council information and records.
Building Code of Australia The BCA contains technical provisions for the design and construction of buildings and other structures, covering such matters as structure, fire resistance, access and egress, services and equipment, and certain aspects of health and amenity.
OHS&W Act 1986 To secure the health, safety and welfare of persons at work.
To eliminate, at their source, risks to the health, safety and welfare of persons at work.
To protect the public against risks to health or safety arising out of or in connection with the activities of persons at work, or the use of operation of various types of plant.
Disability Discrimination Act-1992 Contains powers for City of Playford to install and remove traffic control devices.
Privacy Act Sets out the framework for the management of individual’s private information.
3.4 Current Levels of Service
In an ICT framework there are two aspects to service level, in particular the assets we provide and how often they are replaced are determined by age rather than by a specific condition of the asset.
Useful life takes into account:
Services (hardware and software) provided to users – replacement of which is most often determined by age and technological development rather than deterioration of an asset;
Availability of those services we provide in terms of systems and other user problem resolution.
The other aspect that defines our service level is in relation to availability of systems and problem resolution.
Asset managers plan, implement and control technical service levels to influence the customer service levels.3
3 IPWEA, 2011, IIMM, p 2.22
- 13 -
CITY OF PLAYFORD – ICT SERVICES - ASSET MANAGEMENT PLAN (Endorsed by Council – 23/7/2013)
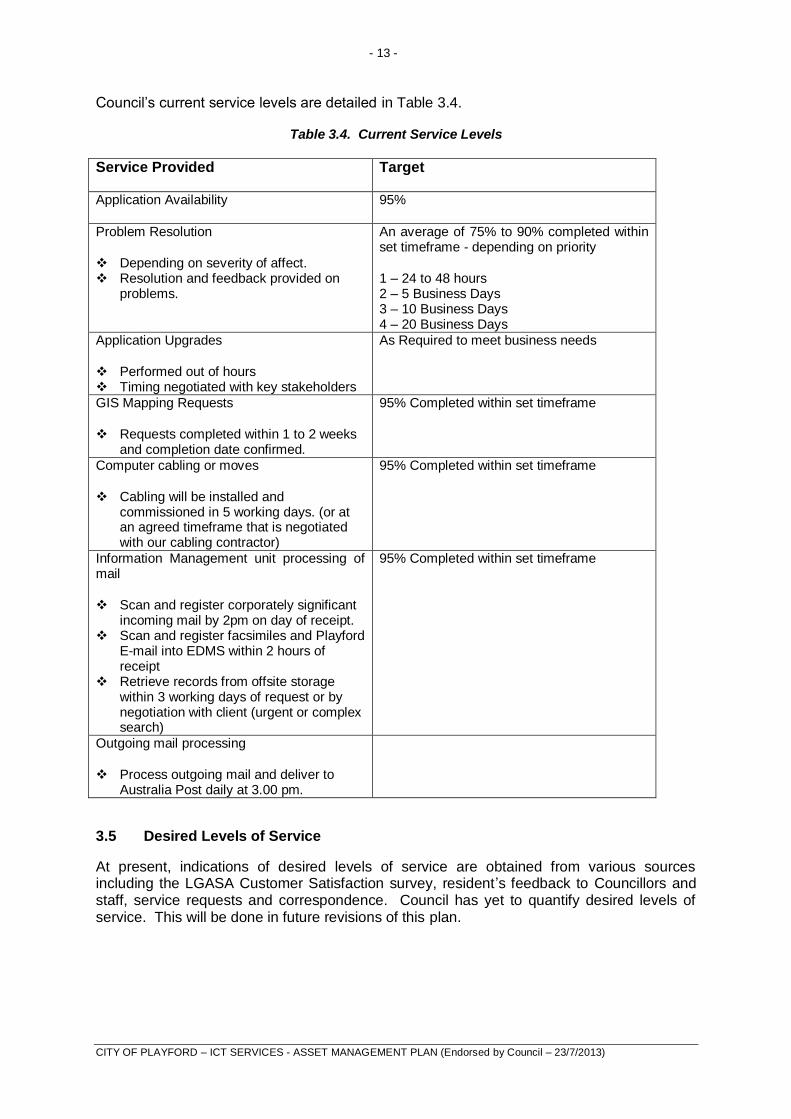
Council’s current service levels are detailed in Table 3.4.
Table 3.4. Current Service Levels
Service Provided Target
Application Availability 95%
Problem Resolution
Depending on severity of affect. Resolution and feedback provided on
problems.
An average of 75% to 90% completed within set timeframe - depending on priority
1 – 24 to 48 hours 2 – 5 Business Days 3 – 10 Business Days 4 – 20 Business Days
Application Upgrades
Performed out of hours Timing negotiated with key stakeholders
As Required to meet business needs
GIS Mapping Requests
Requests completed within 1 to 2 weeks and completion date confirmed.
95% Completed within set timeframe
Computer cabling or moves
Cabling will be installed and commissioned in 5 working days. (or at an agreed timeframe that is negotiated with our cabling contractor)
95% Completed within set timeframe
Information Management unit processing of mail
Scan and register corporately significant incoming mail by 2pm on day of receipt.
Scan and register facsimiles and Playford E-mail into EDMS within 2 hours of receipt
Retrieve records from offsite storage within 3 working days of request or by negotiation with client (urgent or complex search)
95% Completed within set timeframe
Outgoing mail processing
Process outgoing mail and deliver to Australia Post daily at 3.00 pm.
3.5 Desired Levels of Service
At present, indications of desired levels of service are obtained from various sources including the LGASA Customer Satisfaction survey, resident’s feedback to Councillors and staff, service requests and correspondence. Council has yet to quantify desired levels of service. This will be done in future revisions of this plan.

- 14 -
CITY OF PLAYFORD – ICT SERVICES - ASSET MANAGEMENT PLAN (Endorsed by Council – 23/7/2013)
4. FUTURE DEMAND
4.1 Demand Drivers
Drivers affecting demand include population change, changes in demographics, seasonal factors, vehicle ownership rates, consumer preferences and expectations, technological changes, economic factors, agricultural practices, environmental awareness, etc.
4.2 Demand Forecast
Factors affecting demand include population change, changes in demographics, seasonal factors, consumer preferences and expectations, economic factors, environmental awareness, technological developments, etc.
4.3 Demand Impact on Assets
Demand factor trends and impacts on service delivery are summarised in Table 4.3
Table 4.3. Demand Factors, Projections and Impact on Services
Demand factor Present position Projection Impact on services
Increase End Users and Remote Community Services
Resources are allocated to what we can fund or provide, not service driven.
Increased Staff and Community users due to population growth to 157,932 within the next 20 years.
Increased need for ICT assets and systems (software). Increase costs and resourcing.
Demographics Reactive approach for any changes in demographics and population growth.
A significant increase for this need due to aging and multicultural community.
Changing customer demands which will result in a greater focus on online services.
Environmental Implementation of environmentally friendly equipment when renewal is due.
Reduce and measure our carbon footprint.
Possible new software for reporting and greater focus on environmental cost of systems and technology.
4.4 Demand Management Plan
Demand for new services will be managed through a combination of managing existing assets, upgrading of existing assets and providing new assets to meet demand and demand management. Demand management practices include non-asset solutions, insuring against risks and managing failures.
Non-asset solutions focus on providing the required service without the need for the organisation to own the assets and management actions including reducing demand for the service, reducing the level of service (allowing some assets to deteriorate beyond current service levels) or educating customers to accept appropriate asset failures4. Examples of non-asset solutions include providing services from existing infrastructure such as aquatic centres and libraries that may be in another community area or public toilets provided in commercial premises.
Opportunities identified to date for demand management are shown in Table 4.4. Further opportunities will be developed in future revisions of this plan.
4 IPWEA, 2011, IIMM, Table 3.4.1, p 3|58.

- 15 -
CITY OF PLAYFORD – ICT SERVICES - ASSET MANAGEMENT PLAN (Endorsed by Council – 23/7/2013)
Table 4.4. Demand Management Plan Summary
Service Activity Demand Management Plan
Planning ICT will aim to realise the following actions within the City’s Organisational Excellence and Environmental Care Goal Plans: Ensure that we are providing systems and solutions to
enable staff to deliver appropriate services to the community.
Ensure staff have access to tools that enable efficiency and productivity in the delivery of services.
Enable Council to move towards best practice in relation to is technology systems and equipment.
Service Delivery To ensure that the services required are driving the demand for our IT assets.
Financial Developing long term Financial Management plans to ensure financial sustainability.
4.5 Asset Programs to meet Demand
Changes to the size and scope of City of Playford’s ICT is an ongoing issue that can be driven by changes in work practices, technology, staffing or increasing work load due to a number of factors. Current strategies to address this are triggered when the item of technology is due for renewal, projected population growth, and consultation with the users of the plan occurs.
Figure 1. Upgrade and New Assets to meet Demand
This graph shows a linear growth over the 20 year period. Acquiring these new assets will commit the organisation to fund ongoing operations, maintenance and renewal costs for the period that the service provided from the assets is required. These future costs are identified and considered in developing forecasts of future operations, maintenance and renewal costs in Section 5.

- 16 -
CITY OF PLAYFORD – ICT SERVICES - ASSET MANAGEMENT PLAN (Endorsed by Council – 23/7/2013)
5. LIFECYCLE MANAGEMENT PLAN
The Lifecycle Management Plan details how Council plans to manage and operate the assets at the agreed levels of service (defined in Section 3) while optimising life cycle costs.
5.1 Background Data
This data only covers currently owned assets; there are a significant number of assets that are currently leased by council which may at a future point in time become an asset of Council. These assets still require ongoing maintenance and replacement at end of life but have not been specifically addressed in this version of the plan. It is anticipated that this will be an element of consideration in future revisions of this plan.
5.1.1 Physical parameters
The Council owned assets covered by this are shown in Table 2.1.
The useful life of an asset is defined as a period over which a depreciable asset is expected to be fully utilised. This period can be significantly impacted by City of Playford’s maintenance practices.
The age profile of Council’s assets is shown in Figure 2.
Figure 2. Asset Age Profile
5.1.2 Asset capacity and performance
Council’s services are generally provided to meet design standards where these are available.
Locations where deficiencies in service performance are known are detailed in Table 5.1.2.
- 17 -
CITY OF PLAYFORD – ICT SERVICES - ASSET MANAGEMENT PLAN (Endorsed by Council – 23/7/2013)
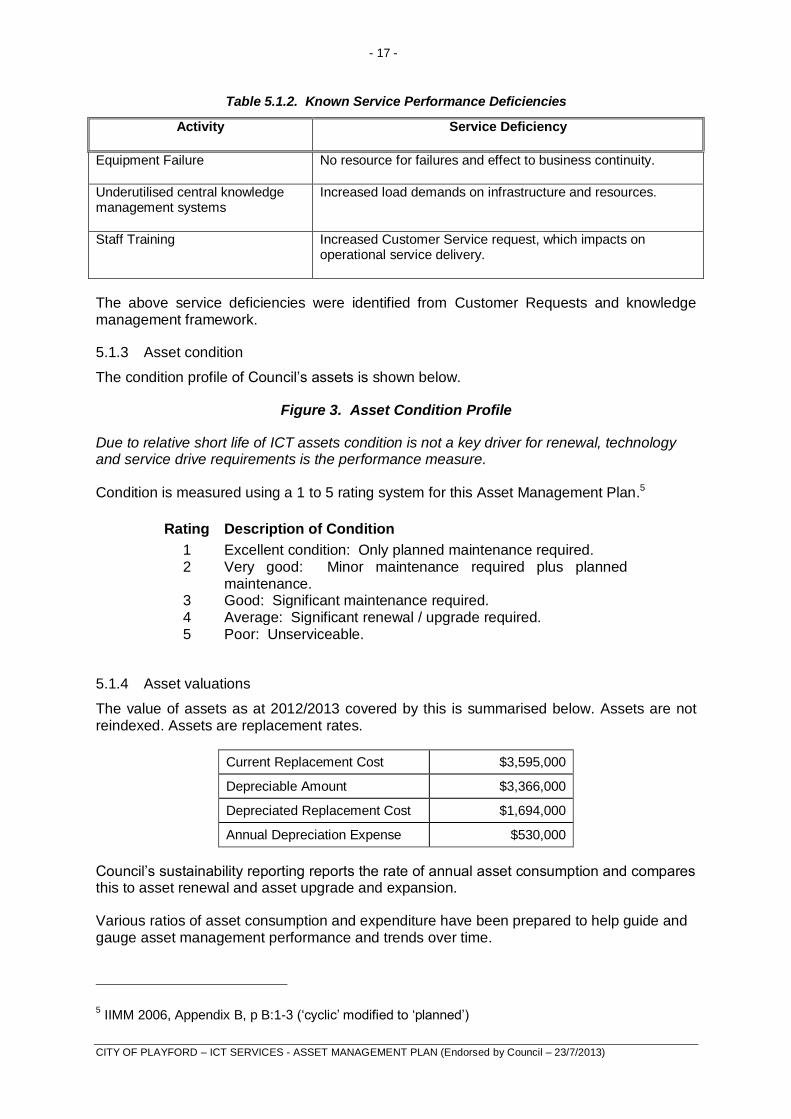
Table 5.1.2. Known Service Performance Deficiencies
Activity Service Deficiency
Equipment Failure No resource for failures and effect to business continuity.
Underutilised central knowledge management systems
Increased load demands on infrastructure and resources.
Staff Training Increased Customer Service request, which impacts on operational service delivery.
The above service deficiencies were identified from Customer Requests and knowledge management framework.
5.1.3 Asset condition
The condition profile of Council’s assets is shown below.
Figure 3. Asset Condition Profile
Due to relative short life of ICT assets condition is not a key driver for renewal, technology and service drive requirements is the performance measure.
Condition is measured using a 1 to 5 rating system for this Asset Management Plan.5
Rating Description of Condition
1 Excellent condition: Only planned maintenance required. 2 Very good: Minor maintenance required plus planned
maintenance. 3 Good: Significant maintenance required. 4 Average: Significant renewal / upgrade required. 5 Poor: Unserviceable.
5.1.4 Asset valuations
The value of assets as at 2012/2013 covered by this is summarised below. Assets are not reindexed. Assets are replacement rates.
Current Replacement Cost $3,595,000
Depreciable Amount $3,366,000
Depreciated Replacement Cost $1,694,000
Annual Depreciation Expense $530,000
Council’s sustainability reporting reports the rate of annual asset consumption and compares this to asset renewal and asset upgrade and expansion.
Various ratios of asset consumption and expenditure have been prepared to help guide and gauge asset management performance and trends over time.
5 IIMM 2006, Appendix B, p B:1-3 (‘cyclic’ modified to ‘planned’)
- 18 -
CITY OF PLAYFORD – ICT SERVICES - ASSET MANAGEMENT PLAN (Endorsed by Council – 23/7/2013)
Rate of Annual Asset Consumption (Depreciation/Depreciable Amount)
15.70%
Rate of Annual Asset Renewal (Capital renewal exp/Depreciable amount)
17.80%
Rate of Annual Asset Upgrade/New (Capital upgrade exp/Depreciable amount)
1.20%
Rate of Annual Asset Upgrade/New (including contributed assets)
1.20%
In 2013/2014 the organisation plans to renew assets at 113.20% of the rate they are being consumed and will be increasing its asset stock by 1.20% in the year.
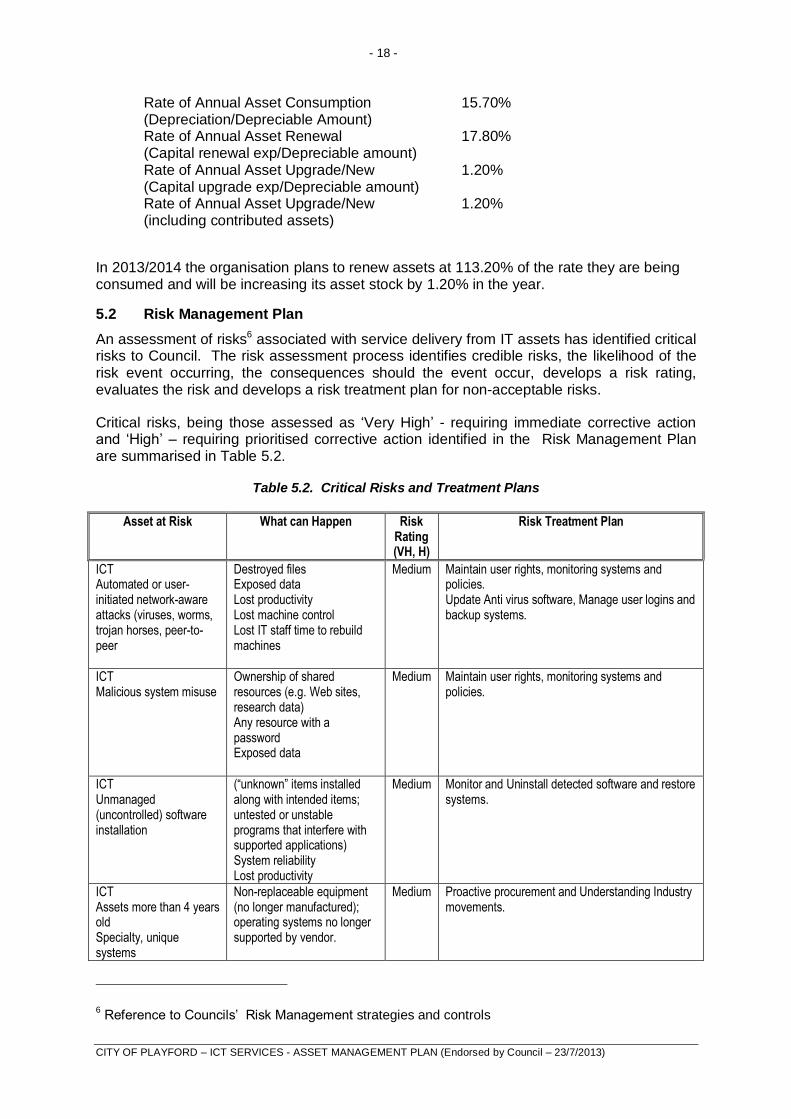
5.2 Risk Management Plan
An assessment of risks6 associated with service delivery from IT assets has identified critical risks to Council. The risk assessment process identifies credible risks, the likelihood of the risk event occurring, the consequences should the event occur, develops a risk rating, evaluates the risk and develops a risk treatment plan for non-acceptable risks.
Critical risks, being those assessed as ‘Very High’ - requiring immediate corrective action and ‘High’ – requiring prioritised corrective action identified in the Risk Management Plan are summarised in Table 5.2.
Table 5.2. Critical Risks and Treatment Plans
Asset at Risk What can Happen Risk Rating (VH, H)
Risk Treatment Plan
ICT Automated or user-initiated network-aware attacks (viruses, worms, trojan horses, peer-to-peer
Destroyed files Exposed data Lost productivity Lost machine control Lost IT staff time to rebuild machines
Medium Maintain user rights, monitoring systems and policies. Update Anti virus software, Manage user logins and backup systems.
ICT Malicious system misuse
Ownership of shared resources (e.g. Web sites, research data) Any resource with a password Exposed data
Medium Maintain user rights, monitoring systems and policies.
ICT Unmanaged (uncontrolled) software installation
(“unknown” items installed along with intended items; untested or unstable programs that interfere with supported applications) System reliability Lost productivity
Medium Monitor and Uninstall detected software and restore systems.
ICT Assets more than 4 years old Specialty, unique systems
Non-replaceable equipment (no longer manufactured); operating systems no longer supported by vendor.
Medium Proactive procurement and Understanding Industry movements.
6 Reference to Councils’ Risk Management strategies and controls
- 19 -
CITY OF PLAYFORD – ICT SERVICES - ASSET MANAGEMENT PLAN (Endorsed by Council – 23/7/2013)
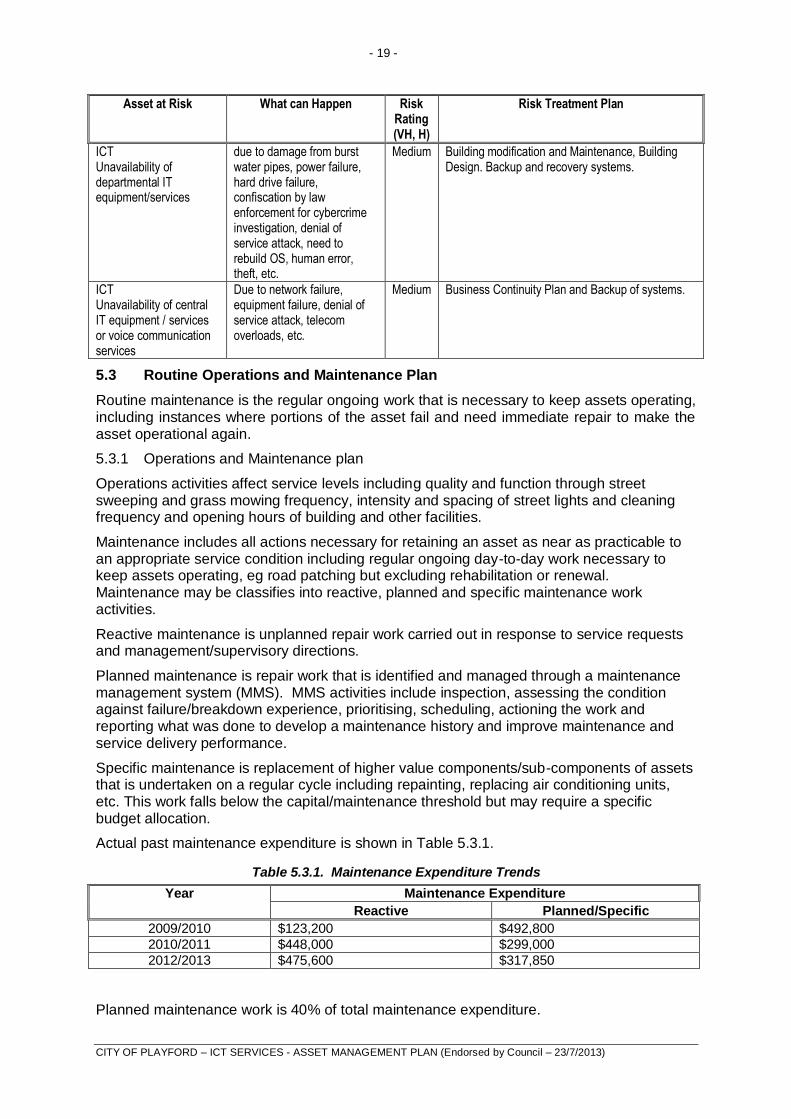
Asset at Risk What can Happen Risk Rating (VH, H)
Risk Treatment Plan
ICT Unavailability of departmental IT equipment/services
due to damage from burst water pipes, power failure, hard drive failure, confiscation by law enforcement for cybercrime investigation, denial of service attack, need to rebuild OS, human error, theft, etc.
Medium Building modification and Maintenance, Building Design. Backup and recovery systems.
ICT Unavailability of central IT equipment / services or voice communication services
Due to network failure, equipment failure, denial of service attack, telecom overloads, etc.
Medium Business Continuity Plan and Backup of systems.
5.3 Routine Operations and Maintenance Plan
Routine maintenance is the regular ongoing work that is necessary to keep assets operating, including instances where portions of the asset fail and need immediate repair to make the asset operational again.
5.3.1 Operations and Maintenance plan
Operations activities affect service levels including quality and function through street sweeping and grass mowing frequency, intensity and spacing of street lights and cleaning frequency and opening hours of building and other facilities.
Maintenance includes all actions necessary for retaining an asset as near as practicable to an appropriate service condition including regular ongoing day-to-day work necessary to keep assets operating, eg road patching but excluding rehabilitation or renewal. Maintenance may be classifies into reactive, planned and specific maintenance work activities.
Reactive maintenance is unplanned repair work carried out in response to service requests and management/supervisory directions.
Planned maintenance is repair work that is identified and managed through a maintenance management system (MMS). MMS activities include inspection, assessing the condition against failure/breakdown experience, prioritising, scheduling, actioning the work and reporting what was done to develop a maintenance history and improve maintenance and service delivery performance.
Specific maintenance is replacement of higher value components/sub-components of assets that is undertaken on a regular cycle including repainting, replacing air conditioning units, etc. This work falls below the capital/maintenance threshold but may require a specific budget allocation.
Actual past maintenance expenditure is shown in Table 5.3.1.
Table 5.3.1. Maintenance Expenditure Trends
Year Maintenance Expenditure
Reactive Planned/Specific
2009/2010 $123,200 $492,800
2010/2011 $448,000 $299,000
2012/2013 $475,600 $317,850
Planned maintenance work is 40% of total maintenance expenditure.
- 20 -
CITY OF PLAYFORD – ICT SERVICES - ASSET MANAGEMENT PLAN (Endorsed by Council – 23/7/2013)
Maintenance expenditure levels are considered to be adequate to meet projected service levels, which may be less than or equal to current service levels. Where maintenance expenditure levels are such that will result in a lesser level of service, the service consequences and service risks have been identified and service consequences may be highlighted in this AM Plan and service risks considered in the Risk Management Plan.
Assessment and prioritisation of reactive maintenance is undertaken by Council staff using experience and judgement.
5.3.2 Operations and Maintenance Strategies
The organisation will operate and maintain assets to provide the defined level of service to approved budgets in the most cost-efficient manner. The operation and maintenance activities include:
Scheduling operations activities to deliver the defined level of service in the most efficient manner,
Undertaking maintenance activities through a planned maintenance system to reduce maintenance costs and improve maintenance outcomes. Undertake cost-benefit analysis to determine the most cost-effective split between planned and unplanned maintenance activities (50 – 70% planned desirable as measured by cost),
Maintain a current asset risk register for assets and present service risks associated with providing services from assets and reporting Very High and High risks and residual risks after treatment to management and Council/Board,
Review current and required skills base and implement workforce training and development to meet required operations and maintenance needs,
Review asset utilisation to identify underutilised assets and appropriate remedies, and over utilised assets and customer demand management options,
Maintain a current hierarchy of critical assets and required operations and maintenance activities,
Develop and regularly review appropriate emergency response capability,
Review management of operations and maintenance activities to ensure Council is obtaining best value for resources used.
Asset hierarchy
An asset hierarchy provides a framework for structuring data in an information system to assist in collection of data, reporting information and making decisions. The hierarchy includes the asset class and component used for asset planning and financial reporting and service level hierarchy used for service planning and delivery.
The organisation’s service hierarchy is shown is Table 5.3.2.
Table 5.3.2: Asset Service Hierarchy
Service Hierarchy Service Level Objective
To be reviewed in future plans
Critical Assets
Critical assets are those assets which have a high consequence of failure but not necessarily a high likelihood of failure. By identifying critical assets and critical failure modes, organisations can target and refines investigative activities, maintenance plans and capital expenditure plans at the appropriate time.

- 21 -
CITY OF PLAYFORD – ICT SERVICES - ASSET MANAGEMENT PLAN (Endorsed by Council – 23/7/2013)
Operations and maintenances activities may be targeted to mitigate critical assets failure and maintain service levels. These activities may include increased inspection frequency, higher maintenance intervention levels, etc. Critical assets failure modes and required operations and maintenance activities are detailed in Table 5.3.2.1.
5.3.2.1: Critical Assets and Service Level Objectives
Critical Assets Critical Failure Mode Operations & Maintenance Activities
To be reviewed in future plans
Standards and specifications
Maintenance work is carried out in accordance with the following Standards and Specifications.
Service Provided Target Hardware As per manufacturer warranty conditions
Software As per manufacturer warranty conditions
5.3.3 Summary of future operations and maintenance expenditures
Future operations and maintenance expenditure is forecast to trend in line with the value of the asset stock as shown in Figure 4. Note that all costs are shown in purchase dollar values.
Figure 4. Projected Operations and Maintenance Expenditure
Deferred maintenance, ie works that are identified for maintenance and unable to be funded are to be included in the risk assessment process in the IT Risk Management Plan.
Maintenance is funded from Council’s operating budget and grants where available. This is further discussed in Section 6.2.
- 22 -
CITY OF PLAYFORD – ICT SERVICES - ASSET MANAGEMENT PLAN (Endorsed by Council – 23/7/2013)
5.4 Renewal / Replacement Plan
Renewal expenditure is major work which does not increase the asset’s design capacity but restores, rehabilitates, replaces or renews an existing asset to its original service potential. Work over and above restoring an asset to original service potential is upgrade / expansion or new works expenditure.
5.4.1 Renewal plan
Assets requiring renewal are identified from estimates of remaining life obtained from the asset register through the ‘Renewal Model’. Candidate proposals are inspected to verify
accuracy of remaining life estimate and to develop a preliminary renewal estimate.
Assets requiring renewal/replacement are identified from one of three methods provided in the ‘Expenditure Template’.
Method 1 uses Asset Register data to project the renewal costs using acquisition year and useful life to determine the renewal year, or
Method 2 uses capital renewal expenditure projections from external condition modelling systems (such as Pavement Management Systems), or
Method 3 uses a combination of average network renewals plus defect repairs in the Renewal Plan and Defect Repair Plan worksheets on the ‘Expenditure template’.
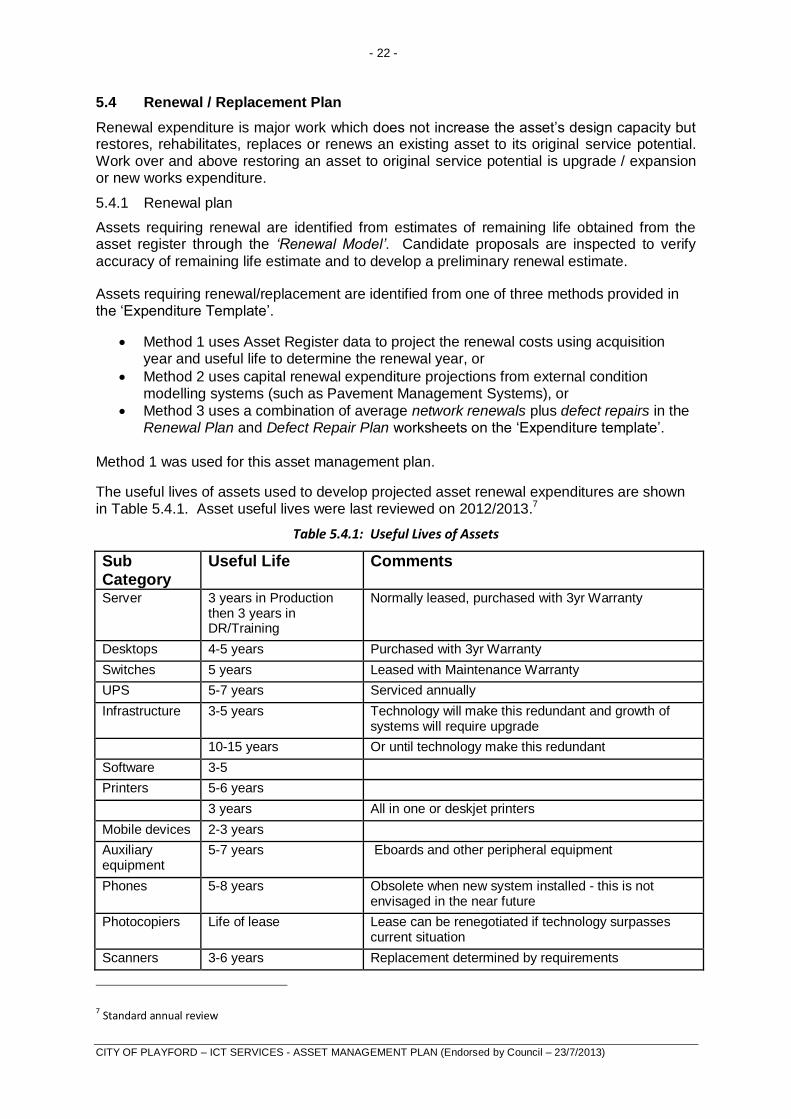
Method 1 was used for this asset management plan.
The useful lives of assets used to develop projected asset renewal expenditures are shown in Table 5.4.1. Asset useful lives were last reviewed on 2012/2013.7
Table 5.4.1: Useful Lives of Assets
Sub Category
Useful Life Comments
Server 3 years in Production then 3 years in DR/Training
Normally leased, purchased with 3yr Warranty
Desktops 4-5 years Purchased with 3yr Warranty
Switches 5 years Leased with Maintenance Warranty
UPS 5-7 years Serviced annually
Infrastructure 3-5 years Technology will make this redundant and growth of systems will require upgrade
10-15 years Or until technology make this redundant
Software 3-5
Printers 5-6 years
3 years All in one or deskjet printers
Mobile devices 2-3 years
Auxiliary equipment
5-7 years Eboards and other peripheral equipment
Phones 5-8 years Obsolete when new system installed - this is not envisaged in the near future
Photocopiers Life of lease Lease can be renegotiated if technology surpasses current situation
Scanners 3-6 years Replacement determined by requirements
7 Standard annual review
- 23 -
CITY OF PLAYFORD – ICT SERVICES - ASSET MANAGEMENT PLAN (Endorsed by Council – 23/7/2013)
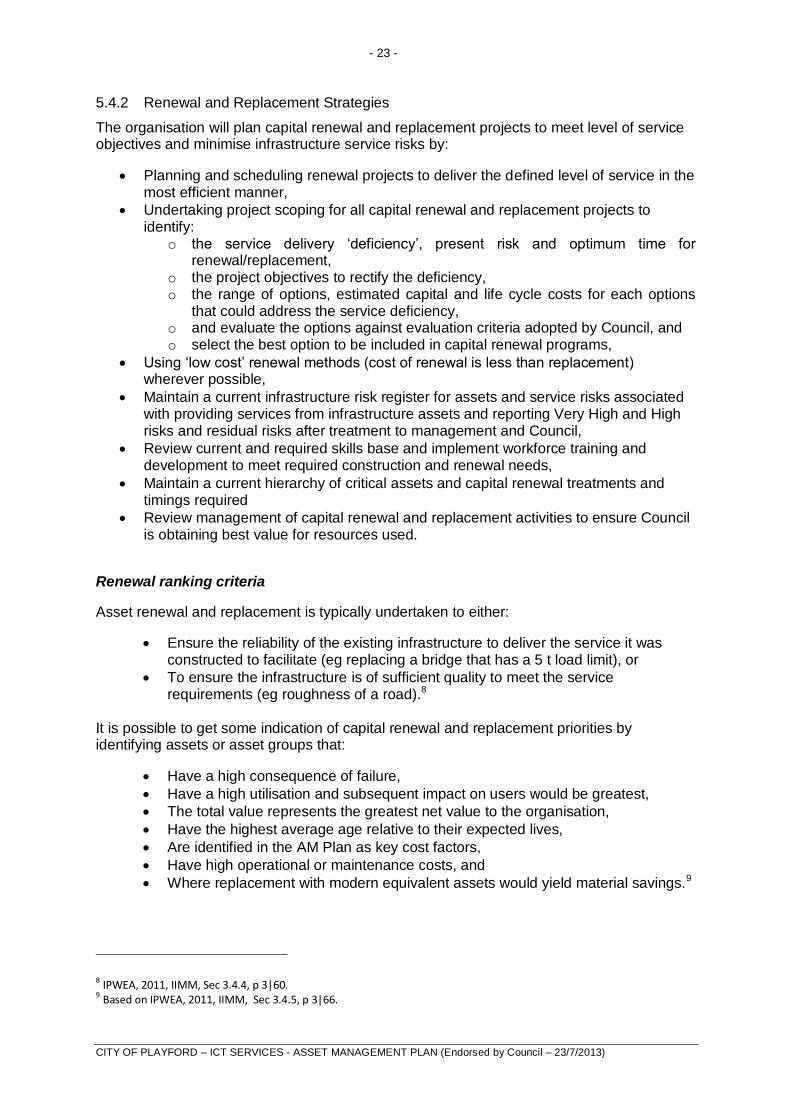
5.4.2 Renewal and Replacement Strategies
The organisation will plan capital renewal and replacement projects to meet level of service objectives and minimise infrastructure service risks by:
Planning and scheduling renewal projects to deliver the defined level of service in the most efficient manner,
Undertaking project scoping for all capital renewal and replacement projects to identify:
o the service delivery ‘deficiency’, present risk and optimum time for renewal/replacement,
o the project objectives to rectify the deficiency, o the range of options, estimated capital and life cycle costs for each options
that could address the service deficiency, o and evaluate the options against evaluation criteria adopted by Council, and o select the best option to be included in capital renewal programs,
Using ‘low cost’ renewal methods (cost of renewal is less than replacement) wherever possible,
Maintain a current infrastructure risk register for assets and service risks associated with providing services from infrastructure assets and reporting Very High and High risks and residual risks after treatment to management and Council,
Review current and required skills base and implement workforce training and development to meet required construction and renewal needs,
Maintain a current hierarchy of critical assets and capital renewal treatments and timings required
Review management of capital renewal and replacement activities to ensure Council is obtaining best value for resources used.
Renewal ranking criteria
Asset renewal and replacement is typically undertaken to either:
Ensure the reliability of the existing infrastructure to deliver the service it was constructed to facilitate (eg replacing a bridge that has a 5 t load limit), or
To ensure the infrastructure is of sufficient quality to meet the service requirements (eg roughness of a road).8
It is possible to get some indication of capital renewal and replacement priorities by identifying assets or asset groups that:
Have a high consequence of failure,
Have a high utilisation and subsequent impact on users would be greatest,
The total value represents the greatest net value to the organisation,
Have the highest average age relative to their expected lives,
Are identified in the AM Plan as key cost factors,
Have high operational or maintenance costs, and
Where replacement with modern equivalent assets would yield material savings.9
8 IPWEA, 2011, IIMM, Sec 3.4.4, p 3|60. 9 Based on IPWEA, 2011, IIMM, Sec 3.4.5, p 3|66.

- 24 -
CITY OF PLAYFORD – ICT SERVICES - ASSET MANAGEMENT PLAN (Endorsed by Council – 23/7/2013)
The ranking criteria used to determine priority of identified renewal and replacement proposals is detailed in Table 5.4.2.
Table 5.4.2. Renewal Priority Ranking Criteria
Criteria Weighting
Age 40%
Technology 20%
Service Level 40%
Renewal and replacement standards
Renewal work is carried out in accordance with the following Standards and Specifications.
As per the manufacturers recommendations
As per the manufacturers stated life expectation
As per current ICT trends and industry standards. Renewal work is carried out in carried out in accordance with consideration of industry current best practice and user or system requirements.
5.4.3 Summary of future renewal expenditure
Projected future renewal expenditures are forecast to increase over time as the asset stock ages. The costs are summarised in Figure 5. Note that all costs are shown in purchase dollar values.
The projected capital renewal program is shown in Appendix B.
Figure 5. Projected Capital Renewal and Replacement Expenditure
Deferred renewal, ie those assets identified for renewal and not scheduled for renewal in capital works programs are to be included in the risk assessment process in the Risk Management Plan.
- 25 -
CITY OF PLAYFORD – ICT SERVICES - ASSET MANAGEMENT PLAN (Endorsed by Council – 23/7/2013)
Renewals are to be funded from Council’s Capital Works Program and grants where available. This is further discussed in Section 6.2.
5.5 Creation/ Acquisition / Upgrade Plan
New works are those works that create a new asset that did not previously exist, or works which upgrade or improve an existing asset beyond its existing capacity. They may result from growth, social or environmental needs.
5.5.1 Selection criteria
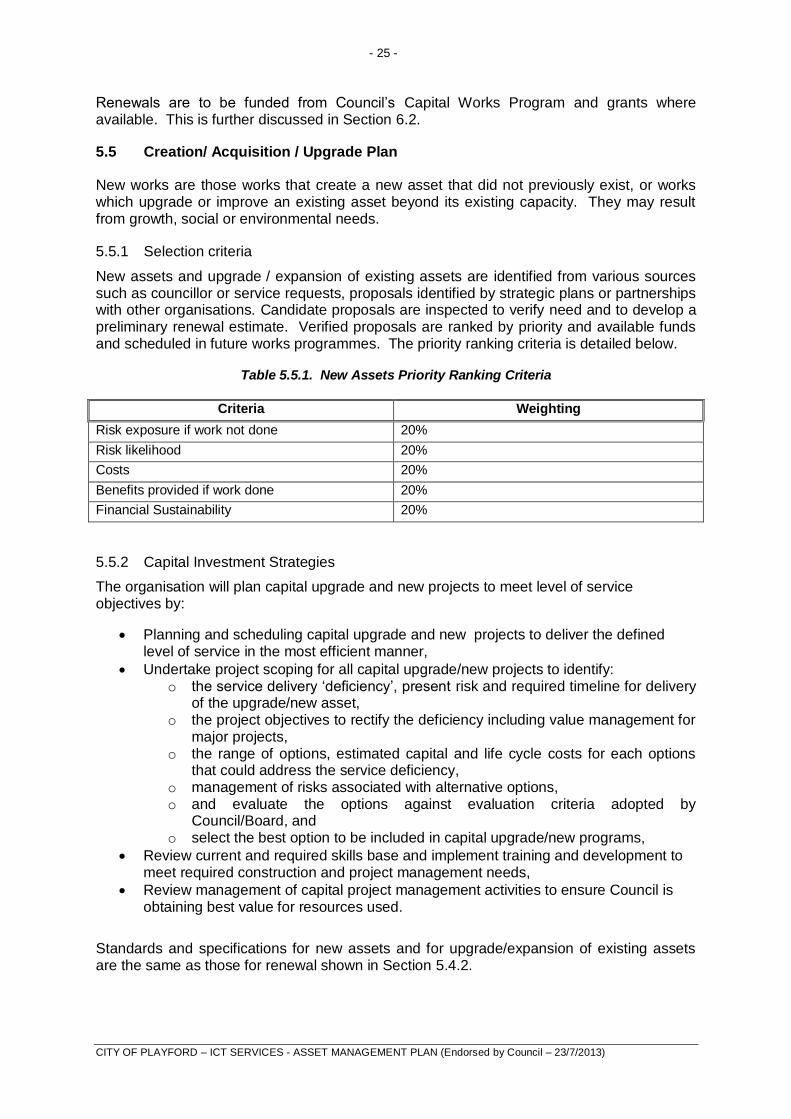
New assets and upgrade / expansion of existing assets are identified from various sources such as councillor or service requests, proposals identified by strategic plans or partnerships with other organisations. Candidate proposals are inspected to verify need and to develop a preliminary renewal estimate. Verified proposals are ranked by priority and available funds and scheduled in future works programmes. The priority ranking criteria is detailed below.
Table 5.5.1. New Assets Priority Ranking Criteria
Criteria Weighting
Risk exposure if work not done 20%
Risk likelihood 20%
Costs 20%
Benefits provided if work done 20%
Financial Sustainability 20%
5.5.2 Capital Investment Strategies
The organisation will plan capital upgrade and new projects to meet level of service objectives by:
Planning and scheduling capital upgrade and new projects to deliver the defined level of service in the most efficient manner,
Undertake project scoping for all capital upgrade/new projects to identify: o the service delivery ‘deficiency’, present risk and required timeline for delivery
of the upgrade/new asset, o the project objectives to rectify the deficiency including value management for
major projects, o the range of options, estimated capital and life cycle costs for each options
that could address the service deficiency, o management of risks associated with alternative options, o and evaluate the options against evaluation criteria adopted by
Council/Board, and o select the best option to be included in capital upgrade/new programs,
Review current and required skills base and implement training and development to meet required construction and project management needs,
Review management of capital project management activities to ensure Council is obtaining best value for resources used.
Standards and specifications for new assets and for upgrade/expansion of existing assets are the same as those for renewal shown in Section 5.4.2.
- 26 -
CITY OF PLAYFORD – ICT SERVICES - ASSET MANAGEMENT PLAN (Endorsed by Council – 23/7/2013)
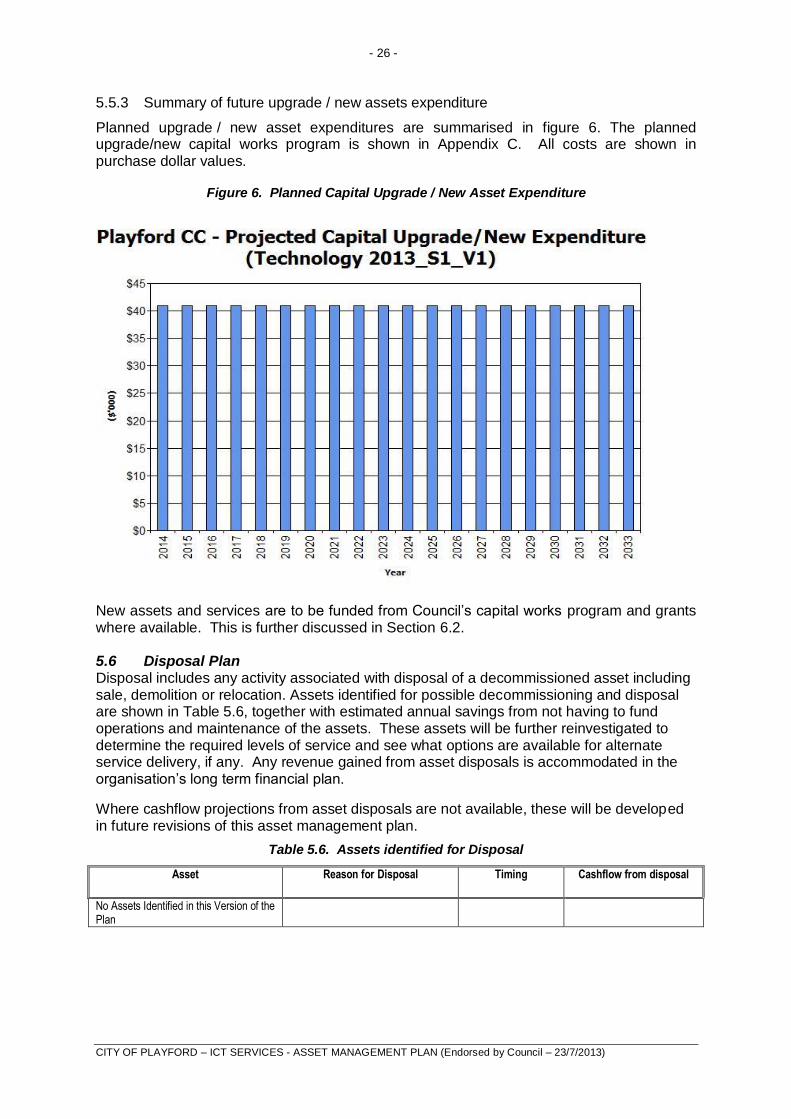
5.5.3 Summary of future upgrade / new assets expenditure
Planned upgrade / new asset expenditures are summarised in figure 6. The planned upgrade/new capital works program is shown in Appendix C. All costs are shown in purchase dollar values.
Figure 6. Planned Capital Upgrade / New Asset Expenditure
New assets and services are to be funded from Council’s capital works program and grants where available. This is further discussed in Section 6.2. 5.6 Disposal Plan Disposal includes any activity associated with disposal of a decommissioned asset including sale, demolition or relocation. Assets identified for possible decommissioning and disposal are shown in Table 5.6, together with estimated annual savings from not having to fund operations and maintenance of the assets. These assets will be further reinvestigated to determine the required levels of service and see what options are available for alternate service delivery, if any. Any revenue gained from asset disposals is accommodated in the organisation’s long term financial plan.
Where cashflow projections from asset disposals are not available, these will be developed in future revisions of this asset management plan.
Table 5.6. Assets identified for Disposal
Asset Reason for Disposal Timing Cashflow from disposal
No Assets Identified in this Version of the Plan
- 27 -
CITY OF PLAYFORD – ICT SERVICES - ASSET MANAGEMENT PLAN (Endorsed by Council – 23/7/2013)
6. FINANCIAL SUMMARY
This section contains the financial requirements resulting from all the information presented in the previous sections of this plan. The financial projections will be improved as further information becomes available on desired levels of service and current and projected future asset performance.
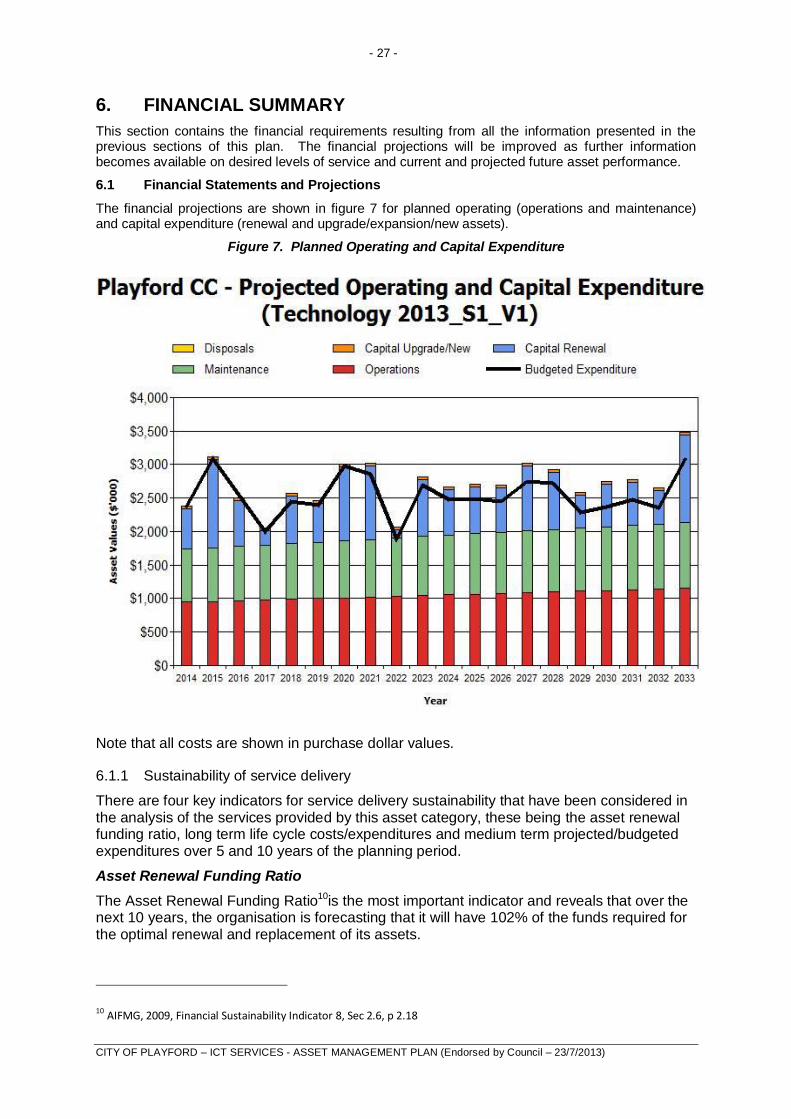
6.1 Financial Statements and Projections
The financial projections are shown in figure 7 for planned operating (operations and maintenance) and capital expenditure (renewal and upgrade/expansion/new assets).
Figure 7. Planned Operating and Capital Expenditure
Note that all costs are shown in purchase dollar values.
6.1.1 Sustainability of service delivery
There are four key indicators for service delivery sustainability that have been considered in the analysis of the services provided by this asset category, these being the asset renewal funding ratio, long term life cycle costs/expenditures and medium term projected/budgeted expenditures over 5 and 10 years of the planning period.
Asset Renewal Funding Ratio
The Asset Renewal Funding Ratio10is the most important indicator and reveals that over the next 10 years, the organisation is forecasting that it will have 102% of the funds required for the optimal renewal and replacement of its assets.
10 AIFMG, 2009, Financial Sustainability Indicator 8, Sec 2.6, p 2.18
- 28 -
CITY OF PLAYFORD – ICT SERVICES - ASSET MANAGEMENT PLAN (Endorsed by Council – 23/7/2013)
Long term - Life Cycle Cost
Life cycle costs (or whole of life costs) are the average costs that are required to sustain the service levels over the asset life cycle. Life cycle costs include operations and maintenance expenditure and asset consumption (depreciation expense). The life cycle cost for the services covered in this asset management plan is $2.36m per year (average operations and maintenance expenditure plus depreciation expense projected over 10 years).
Life cycle costs can be compared to life cycle expenditure to give an initial indicator of affordability of projected service levels when considered with age profiles. Life cycle expenditure includes operations, maintenance and capital renewal expenditure. Life cycle expenditure will vary depending on the timing of asset renewals. The life cycle expenditure over the 10 year planning period is $2.49m per year (average operations and maintenance plus capital renewal budgeted expenditure in LTFP over 10 years).
A shortfall between life cycle cost and life cycle expenditure is the life cycle gap. The life cycle gap for services covered by this asset management plan is $0.12m per year (-ve = gap, +ve = surplus).
Life cycle expenditure is 105% of life cycle costs.
The life cycle costs and life cycle expenditure comparison highlights any difference between present outlays and the average cost of providing the service over the long term. If the life cycle expenditure is less than that life cycle cost, it is most likely that outlays will need to be increased or cuts in services made in the future.
Knowing the extent and timing of any required increase in outlays and the service consequences if funding is not available will assist organisations in providing services to their communities in a financially sustainable manner. This is the purpose of the asset management plans and long term financial plan.
Medium term – 10 year financial planning period
This asset management plan identifies the projected operations, maintenance and capital renewal expenditures required to provide an agreed level of service to the community over a 10 year period. This provides input into 10 year financial and funding plans aimed at providing the required services in a sustainable manner.
These projected expenditures may be compared to budgeted expenditures in the 10 year period to identify any funding shortfall. In a core asset management plan, a gap is generally due to increasing asset renewals for ageing assets.
The projected operations, maintenance and capital renewal expenditure required over the 10 year planning period is $2.56m on average per year.
Estimated (budget) operations, maintenance and capital renewal funding is $2.49m on average per year giving a 10 year funding shortfall of $-0.07m per year. This indicates that Council expects to have 97% of the projected expenditures needed to provide the services documented in the asset management plan.
Medium Term – 5 year financial planning period
The projected operations, maintenance and capital renewal expenditure required over the first 5 years of the planning period is $2.49m on average per year.
Estimated (budget) operations, maintenance and capital renewal funding is $2.45m on average per year giving a 5 year funding shortfall of $-0.04m. This indicates that Council expects to have 99% of projected expenditures required to provide the services shown in this asset management plan.
- 29 -
CITY OF PLAYFORD – ICT SERVICES - ASSET MANAGEMENT PLAN (Endorsed by Council – 23/7/2013)
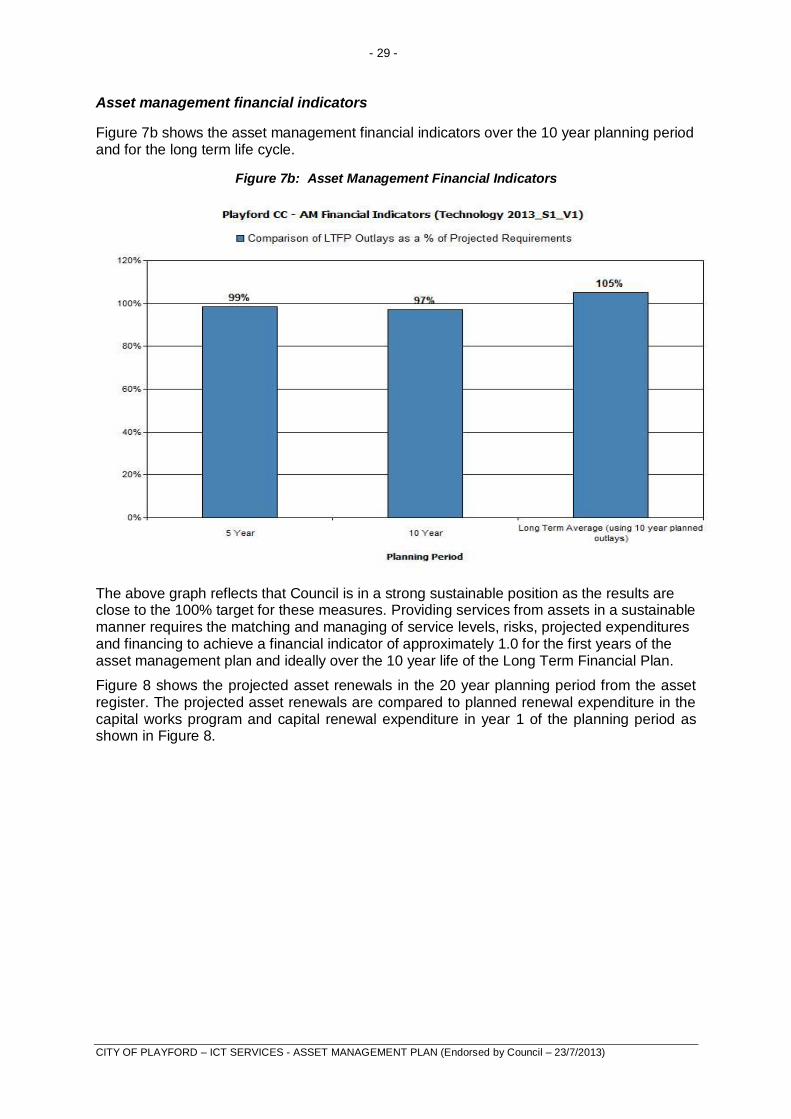
Asset management financial indicators
Figure 7b shows the asset management financial indicators over the 10 year planning period and for the long term life cycle.
Figure 7b: Asset Management Financial Indicators
The above graph reflects that Council is in a strong sustainable position as the results are close to the 100% target for these measures. Providing services from assets in a sustainable manner requires the matching and managing of service levels, risks, projected expenditures and financing to achieve a financial indicator of approximately 1.0 for the first years of the asset management plan and ideally over the 10 year life of the Long Term Financial Plan.
Figure 8 shows the projected asset renewals in the 20 year planning period from the asset register. The projected asset renewals are compared to planned renewal expenditure in the capital works program and capital renewal expenditure in year 1 of the planning period as shown in Figure 8.
- 30 -
CITY OF PLAYFORD – ICT SERVICES - ASSET MANAGEMENT PLAN (Endorsed by Council – 23/7/2013)
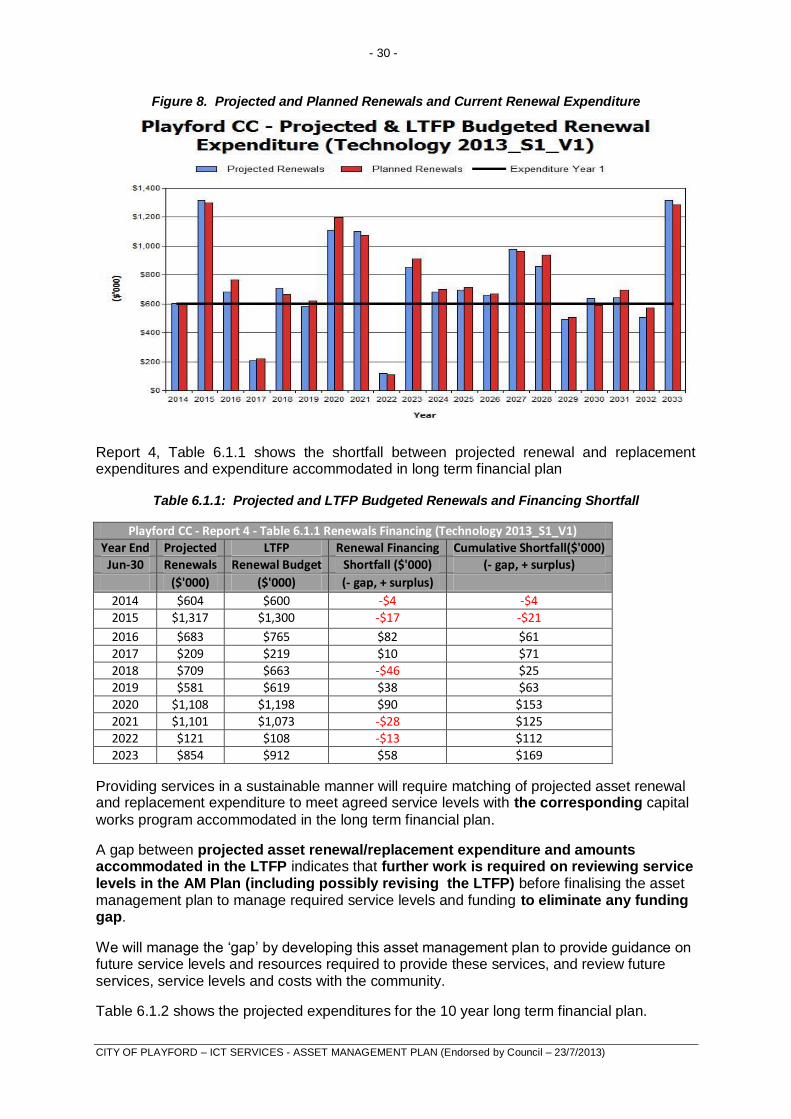
Figure 8. Projected and Planned Renewals and Current Renewal Expenditure
Report 4, Table 6.1.1 shows the shortfall between projected renewal and replacement expenditures and expenditure accommodated in long term financial plan
Table 6.1.1: Projected and LTFP Budgeted Renewals and Financing Shortfall
Playford CC - Report 4 - Table 6.1.1 Renewals Financing (Technology 2013_S1_V1)
Year End Projected LTFP Renewal Financing Cumulative Shortfall($'000)
Jun-30 Renewals Renewal Budget Shortfall ($'000) (- gap, + surplus)
($'000) ($'000) (- gap, + surplus)
2014 $604 $600 -$4 -$4
2015 $1,317 $1,300 -$17 -$21
2016 $683 $765 $82 $61
2017 $209 $219 $10 $71
2018 $709 $663 -$46 $25
2019 $581 $619 $38 $63
2020 $1,108 $1,198 $90 $153
2021 $1,101 $1,073 -$28 $125
2022 $121 $108 -$13 $112
2023 $854 $912 $58 $169
Providing services in a sustainable manner will require matching of projected asset renewal and replacement expenditure to meet agreed service levels with the corresponding capital
works program accommodated in the long term financial plan.
A gap between projected asset renewal/replacement expenditure and amounts accommodated in the LTFP indicates that further work is required on reviewing service levels in the AM Plan (including possibly revising the LTFP) before finalising the asset management plan to manage required service levels and funding to eliminate any funding gap.
We will manage the ‘gap’ by developing this asset management plan to provide guidance on future service levels and resources required to provide these services, and review future services, service levels and costs with the community.
Table 6.1.2 shows the projected expenditures for the 10 year long term financial plan.
- 31 -
CITY OF PLAYFORD – ICT SERVICES - ASSET MANAGEMENT PLAN (Endorsed by Council – 23/7/2013)
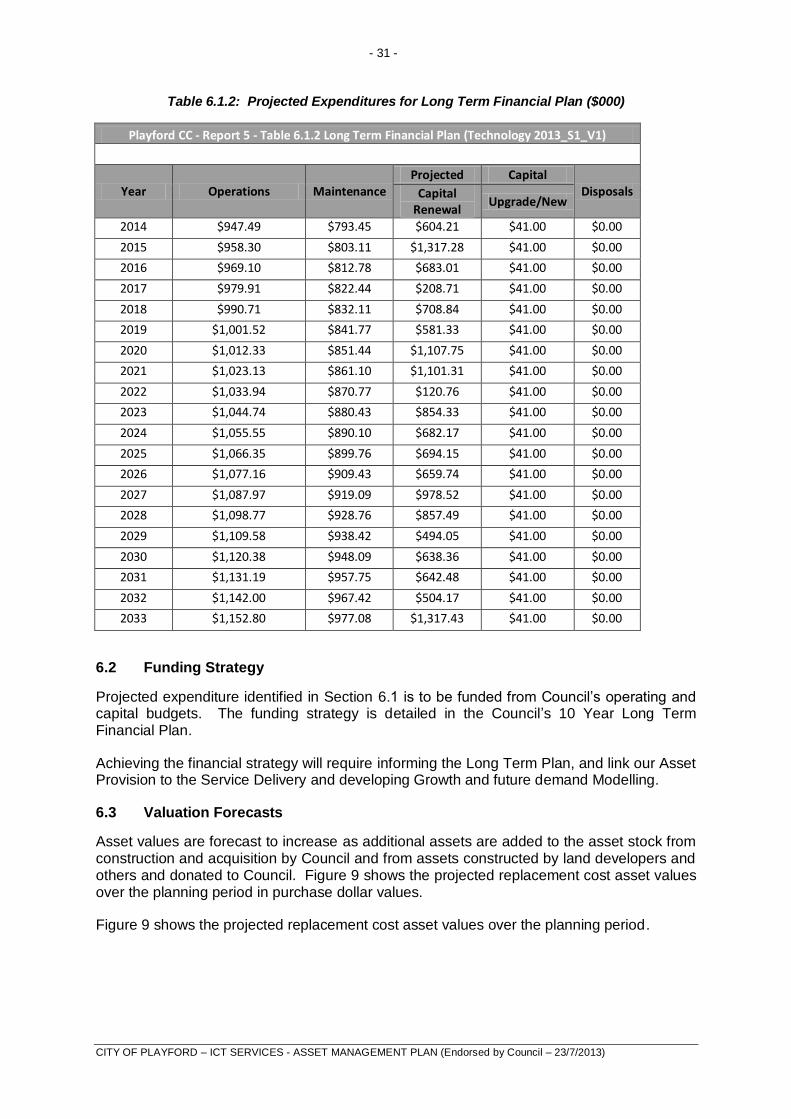
Table 6.1.2: Projected Expenditures for Long Term Financial Plan ($000)
Playford CC - Report 5 - Table 6.1.2 Long Term Financial Plan (Technology 2013_S1_V1)
Year Operations Maintenance Projected Capital
Disposals Capital Renewal
Upgrade/New
2014 $947.49 $793.45 $604.21 $41.00 $0.00
2015 $958.30 $803.11 $1,317.28 $41.00 $0.00
2016 $969.10 $812.78 $683.01 $41.00 $0.00
2017 $979.91 $822.44 $208.71 $41.00 $0.00
2018 $990.71 $832.11 $708.84 $41.00 $0.00
2019 $1,001.52 $841.77 $581.33 $41.00 $0.00
2020 $1,012.33 $851.44 $1,107.75 $41.00 $0.00
2021 $1,023.13 $861.10 $1,101.31 $41.00 $0.00
2022 $1,033.94 $870.77 $120.76 $41.00 $0.00
2023 $1,044.74 $880.43 $854.33 $41.00 $0.00
2024 $1,055.55 $890.10 $682.17 $41.00 $0.00
2025 $1,066.35 $899.76 $694.15 $41.00 $0.00
2026 $1,077.16 $909.43 $659.74 $41.00 $0.00
2027 $1,087.97 $919.09 $978.52 $41.00 $0.00
2028 $1,098.77 $928.76 $857.49 $41.00 $0.00
2029 $1,109.58 $938.42 $494.05 $41.00 $0.00
2030 $1,120.38 $948.09 $638.36 $41.00 $0.00
2031 $1,131.19 $957.75 $642.48 $41.00 $0.00
2032 $1,142.00 $967.42 $504.17 $41.00 $0.00
2033 $1,152.80 $977.08 $1,317.43 $41.00 $0.00
6.2 Funding Strategy
Projected expenditure identified in Section 6.1 is to be funded from Council’s operating and capital budgets. The funding strategy is detailed in the Council’s 10 Year Long Term Financial Plan.
Achieving the financial strategy will require informing the Long Term Plan, and link our Asset Provision to the Service Delivery and developing Growth and future demand Modelling.
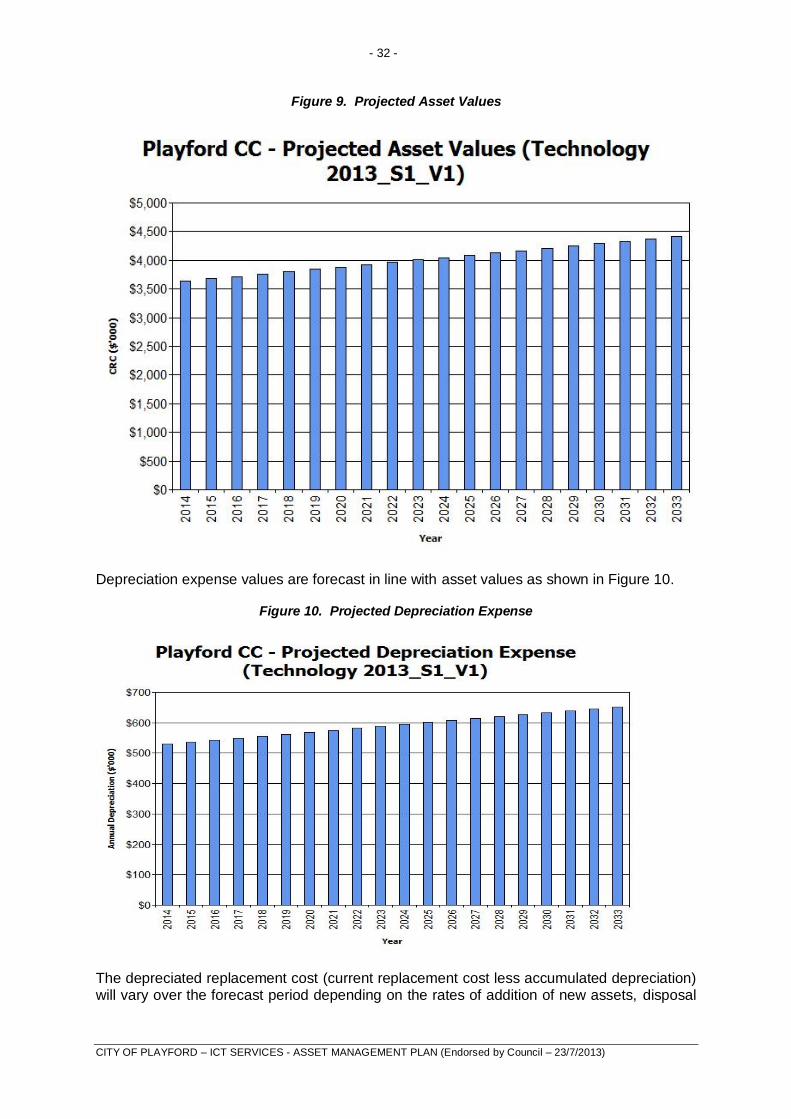
6.3 Valuation Forecasts
Asset values are forecast to increase as additional assets are added to the asset stock from construction and acquisition by Council and from assets constructed by land developers and others and donated to Council. Figure 9 shows the projected replacement cost asset values over the planning period in purchase dollar values.
Figure 9 shows the projected replacement cost asset values over the planning period.
- 32 -
CITY OF PLAYFORD – ICT SERVICES - ASSET MANAGEMENT PLAN (Endorsed by Council – 23/7/2013)
Figure 9. Projected Asset Values
Depreciation expense values are forecast in line with asset values as shown in Figure 10.
Figure 10. Projected Depreciation Expense
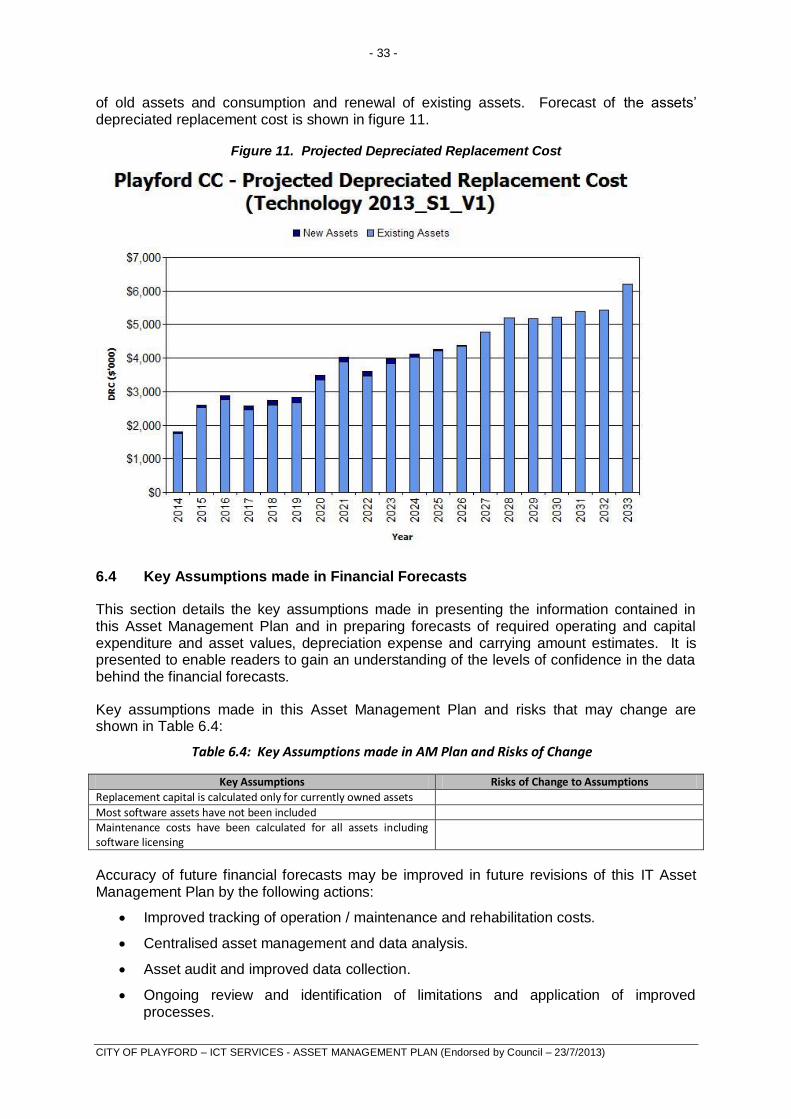
The depreciated replacement cost (current replacement cost less accumulated depreciation) will vary over the forecast period depending on the rates of addition of new assets, disposal
- 33 -
CITY OF PLAYFORD – ICT SERVICES - ASSET MANAGEMENT PLAN (Endorsed by Council – 23/7/2013)
of old assets and consumption and renewal of existing assets. Forecast of the assets’ depreciated replacement cost is shown in figure 11.
Figure 11. Projected Depreciated Replacement Cost
6.4 Key Assumptions made in Financial Forecasts
This section details the key assumptions made in presenting the information contained in this Asset Management Plan and in preparing forecasts of required operating and capital expenditure and asset values, depreciation expense and carrying amount estimates. It is presented to enable readers to gain an understanding of the levels of confidence in the data behind the financial forecasts.
Key assumptions made in this Asset Management Plan and risks that may change are shown in Table 6.4:
Table 6.4: Key Assumptions made in AM Plan and Risks of Change
Key Assumptions Risks of Change to Assumptions
Replacement capital is calculated only for currently owned assets
Most software assets have not been included Maintenance costs have been calculated for all assets including software licensing
Accuracy of future financial forecasts may be improved in future revisions of this IT Asset Management Plan by the following actions:
Improved tracking of operation / maintenance and rehabilitation costs.
Centralised asset management and data analysis.
Asset audit and improved data collection.
Ongoing review and identification of limitations and application of improved processes.

- 34 -
CITY OF PLAYFORD – ICT SERVICES - ASSET MANAGEMENT PLAN (Endorsed by Council – 23/7/2013)
7. PLAN IMPROVEMENT AND MONITORING
7.1 Status of Asset Management Practices
7.1.1 Accounting and financial systems
The City of Playford uses the Technology One, One Council, financial system. This system has an Asset Database module and a General Ledger module.
Accountabilities for financial systems
The finance module is the responsibility of the Finance function and asset module is the responsibility of the Asset Strategy function. There is joint responsibility for ensuring the integrity of the system and asset financial information overall.
Accounting standards and regulations
The City of Playford prepares general purpose financial reports in accordance with Australian equivalents to International Financial Reporting Standards (AIFRS) as they apply to not-for-profit entities, other authoritative pronouncements of the Australian Accounting Standards Board, Urgent Issues Group Interpretations (UIGs) and relevant South Australian legislation.
Capital/maintenance threshold
Accounting for Property, Plant, Equipment and Infrastructure Policy, the objective of this policy is to provide guidance around identifying, classifying, valuing, recording and disposing of non-current physical assets. This will provide for greater understanding and accuracy of City of Playford’s capital requirements and depreciation expenses in the context of financial sustainability and intergenerational equity as well as ensuring that City of Playford is meeting its statutory reporting obligations.
Required changes to accounting financial systems arising from this AM Plan
Any changes to our current financial systems will be driven from the Service review and the asset strategy framework.
7.2.1 Asset management system
Asset registers
The City of Playford uses the Technology One, One Council, financial system. This system has an Asset Database module and a General Ledger module.
Linkage from asset management to financial system
The GL module references transactions from the Asset module through an asset number field. Transfer of financial information from the Asset to the GL module is automatic via system posting transactions.
Accountabilities for asset management system and data maintenance
The finance module is the responsibility of the Finance function and asset module is the responsibility of the Asset Strategy function. There is joint responsibility for ensuring the integrity of the system and asset financial information overall.

- 35 -
CITY OF PLAYFORD – ICT SERVICES - ASSET MANAGEMENT PLAN (Endorsed by Council – 23/7/2013)
Required changes to asset management system arising from this AM Plan
Any changes to our current financial systems will be driven from the Service review and the asset strategy framework.
7.2 Improvement Program
The asset management improvement plan generated from this Plan is shown in Table 7.2.
Table 7.2. Improvement Plan
Task No
Task Responsibility Resources Required
Timeline
1. Review process to develop a model to support decision making in regard to leasing or purchasing of Assets
System Services
Current Resources
2013/2014
2. Software audit and data capture System Services
Current Resources
2013/2014
3. Develop tools to assist Growth Modelling for technology assets
System Services
Current Resources
2013/2014
4. Develop model to redefine Service Levels System Services
Current Resources
2013/2014
7.3 Monitoring and Review Procedures
This asset management plan will be reviewed during annual budget planning processes and amended to recognise any material changes in service levels and/or resources available to provide those services as a result of budget decisions.
The AM Plan will be updated annually to ensure it represents the current service level, asset values, projected operations, maintenance, capital renewal and replacement, capital upgrade/new and asset disposal expenditures and projected expenditure values incorporated into the Council’s long term financial plan.
The mandatory AM Plan has a life of 4 years (Council/Board election cycle) and is due for complete revision and updating within 12 months of each Council/Board election. City of Playford also reviews and published updated plans annually as a part of the long term planning process.
7.4 Performance Measures
The effectiveness of the asset management plan can be measured in the following ways:
The degree to which the required projected expenditures identified in this asset management plan are incorporated into the organisation’s long term financial plan,
The degree to which 1-5 year detailed works programs, budgets, business plans and organisational structures take into account the ‘global’ works program trends provided by the asset management plan,
The degree to which the existing and projected service levels and service consequences (what we cannot do), risks and residual risks are incorporated into the organisation’s Strategic Plan and associated plans,
The Asset Renewal Funding Ratio achieving the target of 1.0.

- 36 -
CITY OF PLAYFORD – ICT SERVICES - ASSET MANAGEMENT PLAN (Endorsed by Council – 23/7/2013)
8. REFERENCES
IPWEA, 2006, ‘International Infrastructure Management Manual’, Institute of Public Works Engineering Australia, Sydney, www.ipwea.org.au/IIMM
IPWEA, 2008, ‘NAMS.PLUS Asset Management’, Institute of Public Works Engineering Australia, Sydney, www.ipwea.org.au/namsplus.
IPWEA, 2009, ‘Australian Infrastructure Financial Management Guidelines’, Institute of Public Works Engineering Australia, Sydney, www.ipwea.org.au/AIFMG.
IPWEA, 2011, ‘International Infrastructure Management Manual’, Institute of Public Works Engineering Australia, Sydney, www.ipwea.org.au/IIMM
Organisation, ‘Strategic Plan 20XX – 20XX’,
Organisation, ‘Annual Plan and Budget’.
- 37 -
CITY OF PLAYFORD – ICT SERVICES - ASSET MANAGEMENT PLAN (Endorsed by Council – 23/7/2013)
9. APPENDICES
Appendix A Maintenance Response Levels of Service
Appendix B Projected 10 year Capital Renewal and Replacement Works Program
Appendix C Projected 10 year Capital Upgrade/New Works Program
Appendix D Budgeted Expenditures Accommodated in LTFP
Appendix E Abbreviations
Appendix F Glossary
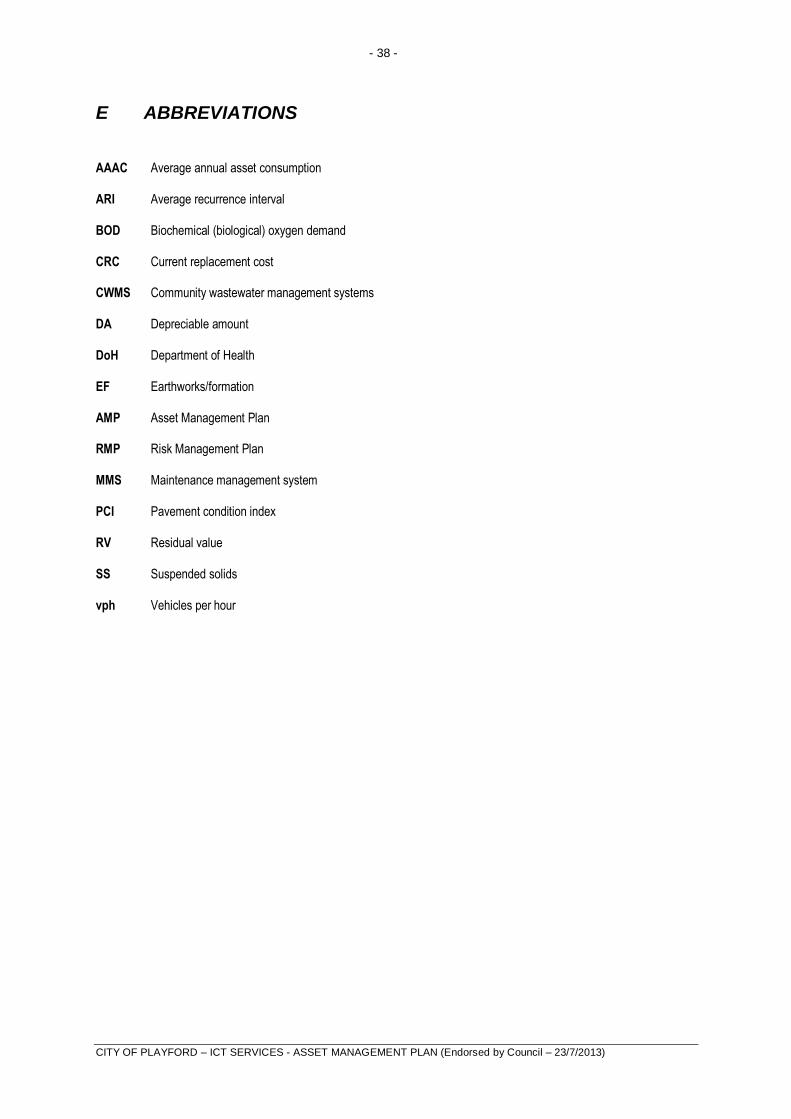
- 38 -
CITY OF PLAYFORD – ICT SERVICES - ASSET MANAGEMENT PLAN (Endorsed by Council – 23/7/2013)
E ABBREVIATIONS
AAAC Average annual asset consumption
ARI Average recurrence interval
BOD Biochemical (biological) oxygen demand
CRC Current replacement cost
CWMS Community wastewater management systems
DA Depreciable amount
DoH Department of Health
EF Earthworks/formation
AMP Asset Management Plan
RMP Risk Management Plan
MMS Maintenance management system
PCI Pavement condition index
RV Residual value
SS Suspended solids
vph Vehicles per hour

- 39 -
CITY OF PLAYFORD – ICT SERVICES - ASSET MANAGEMENT PLAN (Endorsed by Council – 23/7/2013)
F GLOSSARY
Annual service cost (ASC) An estimate of the cost that would be tendered, per annum, if tenders were called for the supply of a service to a performance specification for a fixed term. The Annual Service Cost includes operating, maintenance, depreciation, finance / opportunity and disposal costs, less revenue.
Asset class Grouping of assets of a similar nature and use in an entity's operations (AASB 166.37).
Asset condition assessment The process of continuous or periodic inspection, assessment, measurement and interpretation of the resultant data to indicate the condition of a specific asset so as to determine the need for some preventative or remedial action.
Asset management The combination of management, financial, economic, engineering and other practices applied to physical assets with the objective of providing the required level of service in the most cost effective manner.
Assets Future economic benefits controlled by the entity as a result of past transactions or other past events (AAS27.12).
Property, plant and equipment including infrastructure and other assets (such as furniture and fittings) with benefits expected to last more than 12 months.
Average annual asset consumption (AAAC)* The amount of a local government’s asset base consumed during a year. This may be calculated by dividing the Depreciable Amount (DA) by the Useful Life and totalled for each and every asset OR by dividing the Fair Value (Depreciated Replacement Cost) by the Remaining Life and totalled for each and every asset in an asset category or class.
Brownfield asset values** Asset (re)valuation values based on the cost to replace the asset including demolition and restoration costs.
Capital expansion expenditure Expenditure that extends an existing asset, at the same standard as is currently enjoyed by residents, to a new group of users. It is discretional expenditure, which increases future operating, and maintenance costs, because it increases Council’s asset base, but may be associated with additional revenue from the new user group, eg extending a drainage or road network, the
provision of an oval or park in a new suburb for new residents.
Capital expenditure Relatively large (material) expenditure, which has benefits, expected to last for more than 12 months. Capital expenditure includes renewal, expansion and upgrade. Where capital projects involve a combination of renewal, expansion and / or upgrade expenditures, the total project cost needs to be allocated accordingly.
Capital funding Funding to pay for capital expenditure.
Capital grants Monies received generally tied to the specific projects for which they are granted, which are often upgrade and / or expansion or new investment proposals.
Capital investment expenditure See capital expenditure definition.
Capital new expenditure Expenditure which creates a new asset providing a new service to the community that did not exist beforehand. As it increases service potential it may impact revenue and will increase future operating and maintenance expenditure.
Capital renewal expenditure Expenditure on an existing asset, which returns the service potential or the life of the asset up to that which it had originally. It is periodically required expenditure, relatively large (material) in value compared with the value of the components or sub-components of the asset being renewed. As it reinstates existing service potential, it has no impact on revenue, but may reduce future operating and maintenance expenditure if completed at the optimum time, eg resurfacing or resheeting a material part of a road network, replacing a material section of a drainage network with pipes of the same capacity, resurfacing an oval. Where capital projects involve a combination of renewal, expansion and / or upgrade expenditures, the total project cost needs to be allocated accordingly.
Capital upgrade expenditure Expenditure, which enhances an existing asset to provide a higher level of service or expenditure that will increase the life of the asset beyond that which it had originally. Upgrade expenditure is discretional and often does not result in additional revenue unless direct user charges apply. It will increase operating and maintenance expenditure in the future because of the increase in the Council’s asset base, eg widening the sealed area of an existing road, replacing drainage pipes with pipes of a greater capacity, enlarging a grandstand at a sporting facility. Where capital projects involve a combination of renewal, expansion and / or upgrade

- 40 -
CITY OF PLAYFORD – ICT SERVICES - ASSET MANAGEMENT PLAN (Endorsed by Council – 23/7/2013)
expenditures, the total project cost needs to be allocated accordingly.
Carrying amount The amount at which an asset is recognised after deducting any accumulated depreciation / amortisation and accumulated impairment losses thereon.
Class of assets See asset class definition.
Component An individual part of an asset which contributes to the composition of the whole and can be separated from or attached to an asset or a system.
Cost of an asset The amount of cash or cash equivalents paid or the fair value of the consideration given to acquire an asset at the time of its acquisition or construction, plus any costs necessary to place the asset into service. This includes one-off design and project management costs.
Current replacement cost (CRC) The cost the entity would incur to acquire the asset on the reporting date. The cost is measured by reference to the lowest cost at which the gross future economic benefits could be obtained in the normal course of business or the minimum it would cost, to replace the existing asset with a technologically modern equivalent new asset (not a second hand one) with the same economic benefits (gross service potential) allowing for any differences in the quantity and quality of output and in operating costs.
Current replacement cost “As New” (CRC) The current cost of replacing the original service potential of an existing asset, with a similar modern equivalent asset, ie the total cost of replacing an existing asset with an as NEW or similar asset expressed in current dollar values.
Cyclic maintenance** Replacement of higher value components / sub-components of assets that is undertaken on a regular cycle including repainting, building roof replacement, cycle, replacement of air conditioning equipment, etc. This work generally falls below the capital / maintenance threshold and needs to be identified in a specific maintenance budget allocation.
Depreciable amount The cost of an asset, or other amount substituted for its cost, less its residual value (AASB 116.6).
Depreciated replacement cost (DRC) The current replacement cost (CRC) of an asset less, where applicable, accumulated depreciation calculated on the basis of such cost to reflect the already consumed or expired future economic benefits of the asset.
Depreciation / amortisation The systematic allocation of the depreciable amount (service potential) of an asset over its useful life.
Economic life See useful life definition.
Expenditure The spending of money on goods and services. Expenditure includes recurrent and capital.
Fair value The amount for which an asset could be exchanged, or a liability settled, between knowledgeable, willing parties, in an arms length transaction.
Greenfield asset values ** Asset (re)valuation values based on the cost to initially acquire the asset.
Heritage asset An asset with historic, artistic, scientific, technological, geographical or environmental qualities that is held and maintained principally for its contribution to knowledge and culture and this purpose is central to the objectives of the entity holding it.
Impairment loss The amount by which the carrying amount of an asset exceeds its recoverable amount.
Infrastructure assets Physical assets of the entity or of another entity that contribute to meeting the public's need for access to major economic and social facilities and services, eg roads, drainage, footpaths and cycleways. These are typically large, interconnected networks or portfolios of composite assets. The components of these assets may be separately maintained, renewed or replaced individually so that the required level and standard of service from the network of assets is continuously sustained. Generally the components and hence the assets have long lives. They are fixed in place and often have no market value.
Investment property Property held to earn rentals or for capital appreciation or both, rather than for: (a) use in the production or supply of goods or services or for administrative purposes; or (b) sale in the ordinary course of business (AASB 140.5)
Level of service The defined service quality for a particular service against which service performance may be measured. Service levels usually relate to quality, quantity, reliability, responsiveness, environmental, acceptability and cost).
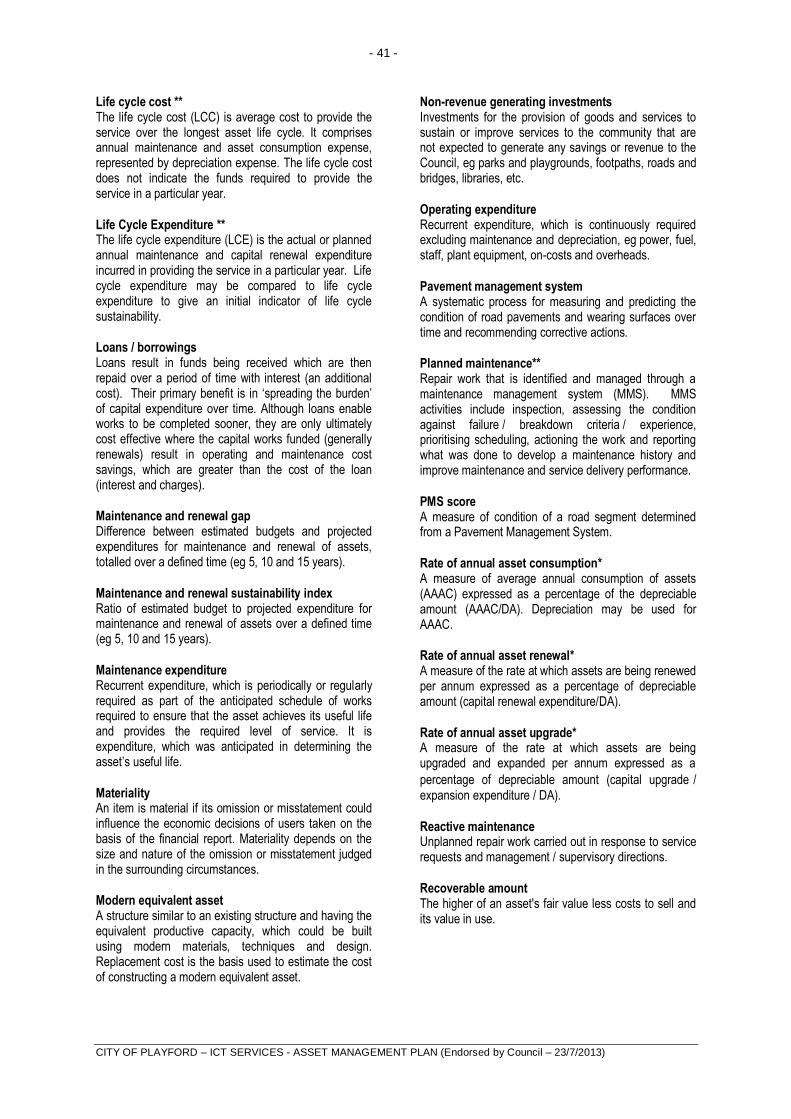
- 41 -
CITY OF PLAYFORD – ICT SERVICES - ASSET MANAGEMENT PLAN (Endorsed by Council – 23/7/2013)
Life cycle cost ** The life cycle cost (LCC) is average cost to provide the service over the longest asset life cycle. It comprises annual maintenance and asset consumption expense, represented by depreciation expense. The life cycle cost does not indicate the funds required to provide the service in a particular year.
Life Cycle Expenditure ** The life cycle expenditure (LCE) is the actual or planned annual maintenance and capital renewal expenditure incurred in providing the service in a particular year. Life cycle expenditure may be compared to life cycle expenditure to give an initial indicator of life cycle sustainability.
Loans / borrowings Loans result in funds being received which are then repaid over a period of time with interest (an additional cost). Their primary benefit is in ‘spreading the burden’ of capital expenditure over time. Although loans enable works to be completed sooner, they are only ultimately cost effective where the capital works funded (generally renewals) result in operating and maintenance cost savings, which are greater than the cost of the loan (interest and charges).
Maintenance and renewal gap Difference between estimated budgets and projected expenditures for maintenance and renewal of assets, totalled over a defined time (eg 5, 10 and 15 years).
Maintenance and renewal sustainability index Ratio of estimated budget to projected expenditure for maintenance and renewal of assets over a defined time (eg 5, 10 and 15 years).
Maintenance expenditure Recurrent expenditure, which is periodically or regularly required as part of the anticipated schedule of works required to ensure that the asset achieves its useful life and provides the required level of service. It is expenditure, which was anticipated in determining the asset’s useful life.
Materiality An item is material if its omission or misstatement could influence the economic decisions of users taken on the basis of the financial report. Materiality depends on the size and nature of the omission or misstatement judged in the surrounding circumstances.
Modern equivalent asset A structure similar to an existing structure and having the equivalent productive capacity, which could be built using modern materials, techniques and design. Replacement cost is the basis used to estimate the cost of constructing a modern equivalent asset.
Non-revenue generating investments Investments for the provision of goods and services to sustain or improve services to the community that are not expected to generate any savings or revenue to the Council, eg parks and playgrounds, footpaths, roads and bridges, libraries, etc.
Operating expenditure Recurrent expenditure, which is continuously required excluding maintenance and depreciation, eg power, fuel, staff, plant equipment, on-costs and overheads.
Pavement management system A systematic process for measuring and predicting the condition of road pavements and wearing surfaces over time and recommending corrective actions.
Planned maintenance** Repair work that is identified and managed through a maintenance management system (MMS). MMS activities include inspection, assessing the condition against failure / breakdown criteria / experience, prioritising scheduling, actioning the work and reporting what was done to develop a maintenance history and improve maintenance and service delivery performance.
PMS score A measure of condition of a road segment determined from a Pavement Management System.
Rate of annual asset consumption* A measure of average annual consumption of assets (AAAC) expressed as a percentage of the depreciable amount (AAAC/DA). Depreciation may be used for AAAC.
Rate of annual asset renewal* A measure of the rate at which assets are being renewed per annum expressed as a percentage of depreciable amount (capital renewal expenditure/DA).
Rate of annual asset upgrade* A measure of the rate at which assets are being upgraded and expanded per annum expressed as a
percentage of depreciable amount (capital upgrade / expansion expenditure / DA).
Reactive maintenance Unplanned repair work carried out in response to service requests and management / supervisory directions.
Recoverable amount The higher of an asset's fair value less costs to sell and its value in use.
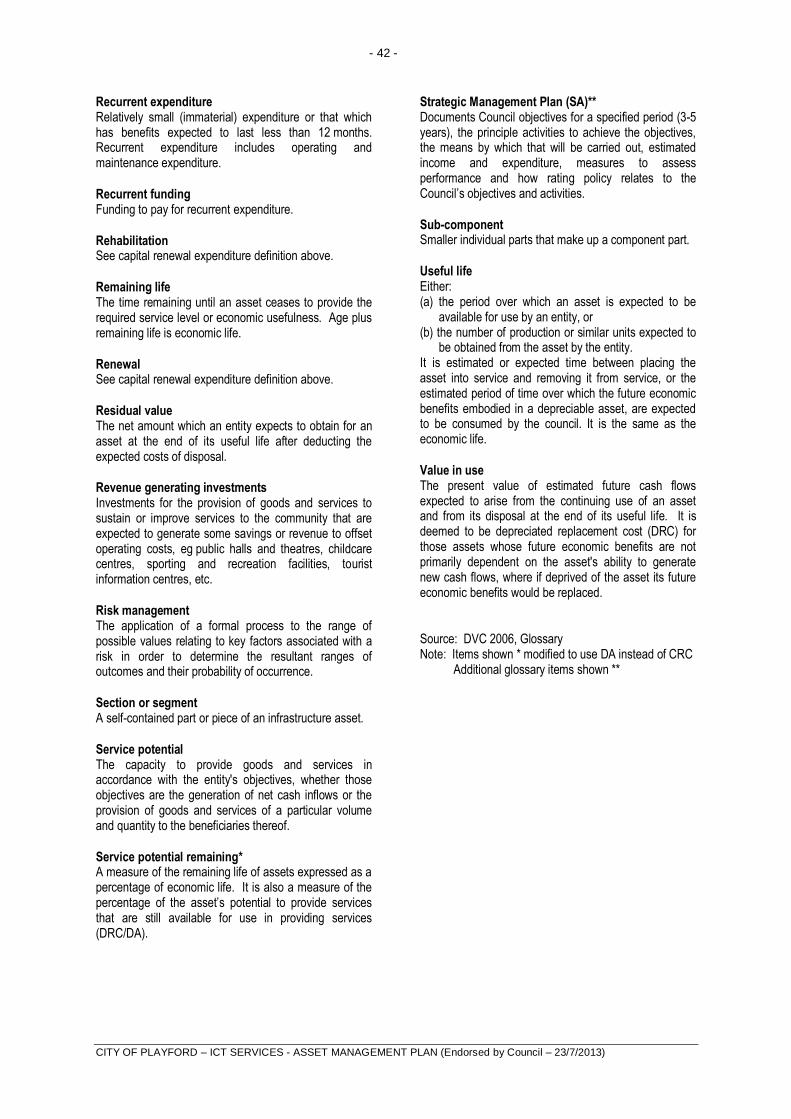
- 42 -
CITY OF PLAYFORD – ICT SERVICES - ASSET MANAGEMENT PLAN (Endorsed by Council – 23/7/2013)
Recurrent expenditure Relatively small (immaterial) expenditure or that which has benefits expected to last less than 12 months. Recurrent expenditure includes operating and maintenance expenditure.
Recurrent funding Funding to pay for recurrent expenditure.
Rehabilitation See capital renewal expenditure definition above.
Remaining life The time remaining until an asset ceases to provide the required service level or economic usefulness. Age plus remaining life is economic life.
Renewal See capital renewal expenditure definition above.
Residual value The net amount which an entity expects to obtain for an asset at the end of its useful life after deducting the expected costs of disposal.
Revenue generating investments Investments for the provision of goods and services to sustain or improve services to the community that are expected to generate some savings or revenue to offset operating costs, eg public halls and theatres, childcare centres, sporting and recreation facilities, tourist information centres, etc.
Risk management The application of a formal process to the range of possible values relating to key factors associated with a risk in order to determine the resultant ranges of outcomes and their probability of occurrence.
Section or segment A self-contained part or piece of an infrastructure asset.
Service potential The capacity to provide goods and services in accordance with the entity's objectives, whether those objectives are the generation of net cash inflows or the provision of goods and services of a particular volume and quantity to the beneficiaries thereof.
Service potential remaining* A measure of the remaining life of assets expressed as a percentage of economic life. It is also a measure of the percentage of the asset’s potential to provide services that are still available for use in providing services (DRC/DA).
Strategic Management Plan (SA)** Documents Council objectives for a specified period (3-5 years), the principle activities to achieve the objectives, the means by which that will be carried out, estimated income and expenditure, measures to assess performance and how rating policy relates to the Council’s objectives and activities.
Sub-component Smaller individual parts that make up a component part.
Useful life Either: (a) the period over which an asset is expected to be
available for use by an entity, or (b) the number of production or similar units expected to
be obtained from the asset by the entity. It is estimated or expected time between placing the asset into service and removing it from service, or the estimated period of time over which the future economic benefits embodied in a depreciable asset, are expected to be consumed by the council. It is the same as the economic life.
Value in use The present value of estimated future cash flows expected to arise from the continuing use of an asset and from its disposal at the end of its useful life. It is deemed to be depreciated replacement cost (DRC) for those assets whose future economic benefits are not primarily dependent on the asset's ability to generate new cash flows, where if deprived of the asset its future economic benefits would be replaced.
Source: DVC 2006, Glossary Note: Items shown * modified to use DA instead of CRC Additional glossary items shown **