Embed Size (px)
Citation preview

A survey of agricultural custom operators is conducted in Nebraska every two years. A total of 217 survey responses were received in 2020 with information reflecting the current rates charged by custom operators for machine hire services and other work they provide for neighboring farms and ranches or as part of a business enterprise that covers a broader area. Survey participants identified by Nebraska Extension personnel, or in some cases, self-identified custom operators, received a paper survey or a link to the custom rates survey online.
Actual rates paid for custom services may vary from those listed in these survey results due to differences in the operators responding and those providing services across the State. This report provides a summary of State averages for specific custom operations in Table 1. More detailed information covering results of the custom rates survey by Nebraska Agricultural Statistical Districts is provided in two parts. Part I of the survey focused on spring and summer farm
and ranch operations, such as planting, tillage, and baling hay. Part II of the custom rates survey included questions about fall operations such as harvesting, hauling grain and livestock, as well as miscellaneous custom work activities on the farm.
Detailed custom rate information from survey responses included in Part I and II are grouped by Nebraska Agricultural Statistics Districts as shown on the map below (Figure 1). Due in part to the State’s diversity in agriculture, rates for similar operations can vary greatly from one area of the state to another. Custom rates reported include charges for use of necessary equipment, fuel, labor, and supplies such as baling wire or twine provided by the custom operator.
Seed, fertilizer, and chemical costs are not included the custom rates unless specified per operation. The information presented in this publication should be used only as a guide when figuring what to charge or pay for custom operations.
2020 Nebraska Farm Custom RatesGlennis A. McClure, Extension Educator – Farm & Ranch Management Analyst
Jim A. Jansen, Agricultural Economist
EC823(Revised June 2020)
Figure 1. USDA Agricultural Statistics Services reporting districts for Nebraska.
©1994-2020, The Board of Regents of the University of Nebraska, on behalf of the University of Nebraska-Lincoln Extension. All rights reserved.
Extension is a Division of the Institute of Agricultural and Natural Resources at the University of Nebraska–Lincoln cooperating with the Counties and the United States Department of Agriculture. University of Nebraska–Lincoln Extension educational programs abide with the nondiscrimination policies of the University of Nebraska–Lincoln and the United States Department of Agriculture.
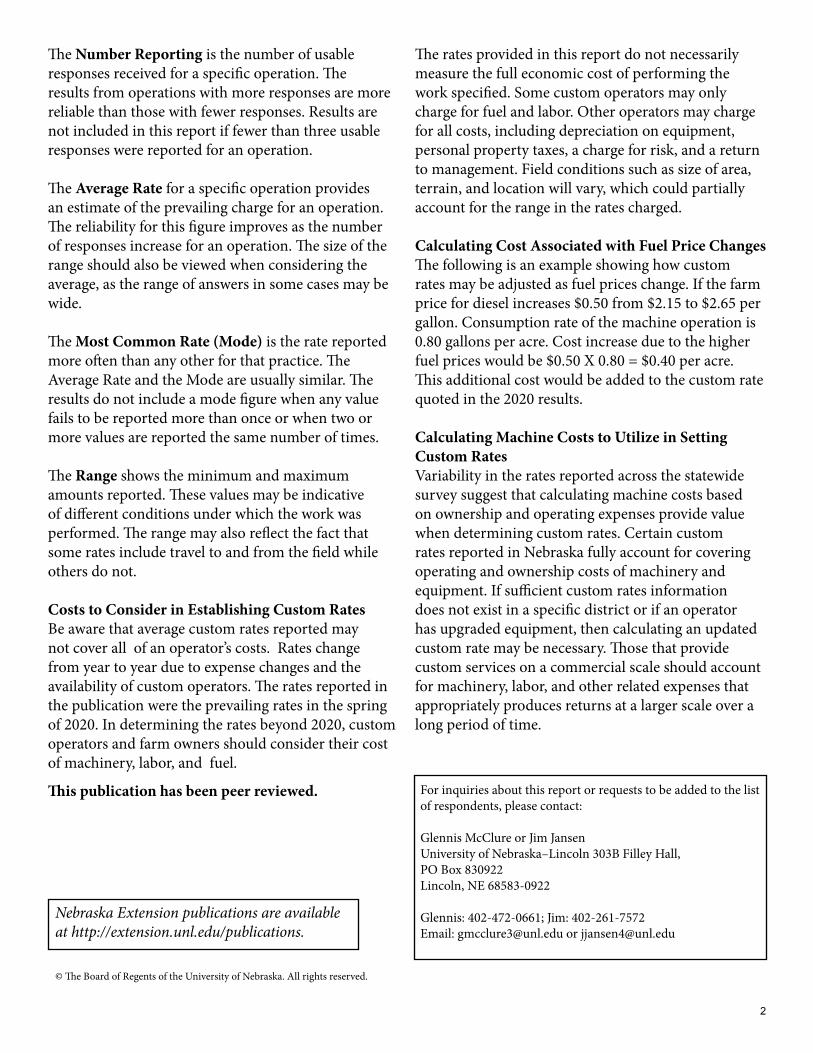
The Number Reporting is the number of usable responses received for a specific operation. The results from operations with more responses are more reliable than those with fewer responses. Results are not included in this report if fewer than three usable responses were reported for an operation.
The Average Rate for a specific operation provides an estimate of the prevailing charge for an operation. The reliability for this figure improves as the number of responses increase for an operation. The size of the range should also be viewed when considering the average, as the range of answers in some cases may be wide.
The Most Common Rate (Mode) is the rate reported more often than any other for that practice. The Average Rate and the Mode are usually similar. The results do not include a mode figure when any value fails to be reported more than once or when two or more values are reported the same number of times.
The Range shows the minimum and maximum amounts reported. These values may be indicative of different conditions under which the work was performed. The range may also reflect the fact that some rates include travel to and from the field while others do not.
Costs to Consider in Establishing Custom RatesBe aware that average custom rates reported may not cover all of an operator’s costs. Rates change from year to year due to expense changes and the availability of custom operators. The rates reported in the publication were the prevailing rates in the spring of 2020. In determining the rates beyond 2020, custom operators and farm owners should consider their cost of machinery, labor, and fuel.
The rates provided in this report do not necessarily measure the full economic cost of performing the work specified. Some custom operators may only charge for fuel and labor. Other operators may charge for all costs, including depreciation on equipment, personal property taxes, a charge for risk, and a return to management. Field conditions such as size of area, terrain, and location will vary, which could partially account for the range in the rates charged.
Calculating Cost Associated with Fuel Price Changes The following is an example showing how custom rates may be adjusted as fuel prices change. If the farm price for diesel increases $0.50 from $2.15 to $2.65 per gallon. Consumption rate of the machine operation is 0.80 gallons per acre. Cost increase due to the higher fuel prices would be $0.50 X 0.80 = $0.40 per acre. This additional cost would be added to the custom rate quoted in the 2020 results.
Calculating Machine Costs to Utilize in Setting Custom RatesVariability in the rates reported across the statewide survey suggest that calculating machine costs based on ownership and operating expenses provide value when determining custom rates. Certain custom rates reported in Nebraska fully account for covering operating and ownership costs of machinery and equipment. If sufficient custom rates information does not exist in a specific district or if an operator has upgraded equipment, then calculating an updated custom rate may be necessary. Those that provide custom services on a commercial scale should account for machinery, labor, and other related expenses that appropriately produces returns at a larger scale over a long period of time.
For inquiries about this report or requests to be added to the list of respondents, please contact:
Glennis McClure or Jim Jansen University of Nebraska–Lincoln 303B Filley Hall, PO Box 830922 Lincoln, NE 68583-0922
Glennis: 402-472-0661; Jim: 402-261-7572Email: [email protected] or [email protected]
This publication has been peer reviewed.
Nebraska Extension publications are available at http://extension.unl.edu/publications.
© The Board of Regents of the University of Nebraska. All rights reserved.
2
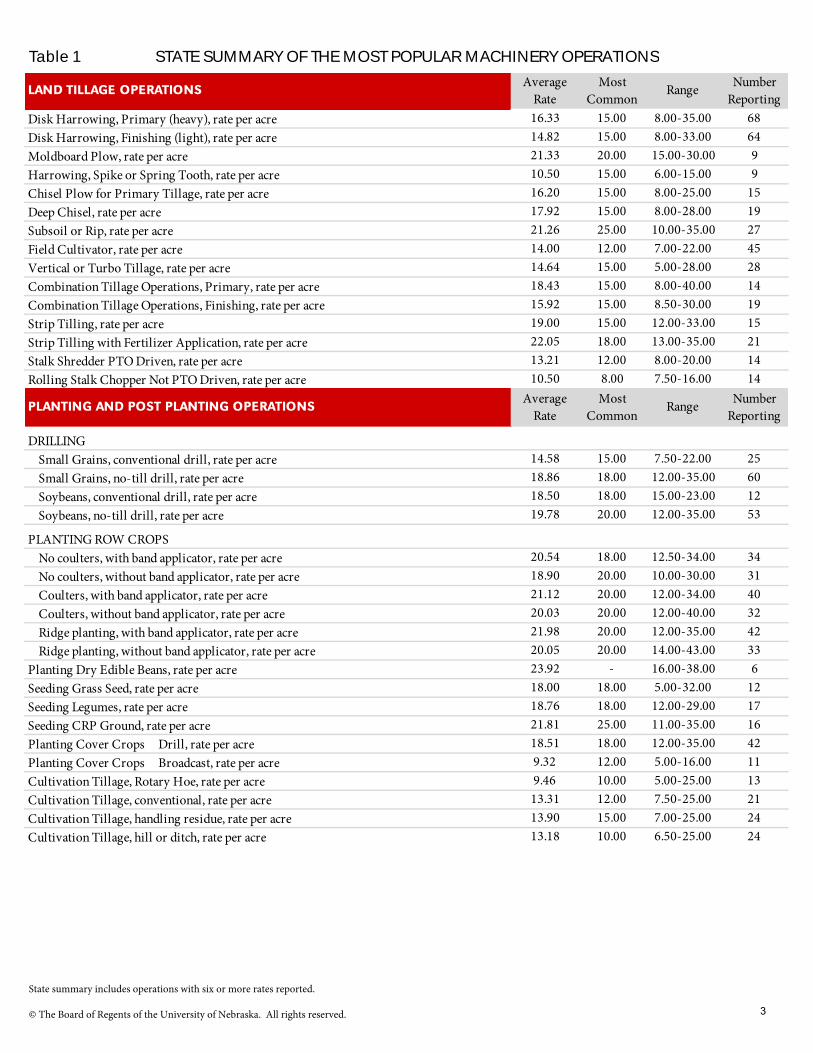
LAND TILLAGE OPERATIONSAverage
RateMost
Common Range Number
ReportingDisk Harrowing, Primary (heavy), rate per acre 16.33 15.00 8.00-35.00 68Disk Harrowing, Finishing (light), rate per acre 14.82 15.00 8.00-33.00 64Moldboard Plow, rate per acre 21.33 20.00 15.00-30.00 9Harrowing, Spike or Spring Tooth, rate per acre 10.50 15.00 6.00-15.00 9Chisel Plow for Primary Tillage, rate per acre 16.20 15.00 8.00-25.00 15Deep Chisel, rate per acre 17.92 15.00 8.00-28.00 19Subsoil or Rip, rate per acre 21.26 25.00 10.00-35.00 27Field Cultivator, rate per acre 14.00 12.00 7.00-22.00 45Vertical or Turbo Tillage, rate per acre 14.64 15.00 5.00-28.00 28Combination Tillage Operations, Primary, rate per acre 18.43 15.00 8.00-40.00 14Combination Tillage Operations, Finishing, rate per acre 15.92 15.00 8.50-30.00 19Strip Tilling, rate per acre 19.00 15.00 12.00-33.00 15Strip Tilling with Fertilizer Application, rate per acre 22.05 18.00 13.00-35.00 21Stalk Shredder PTO Driven, rate per acre 13.21 12.00 8.00-20.00 14Rolling Stalk Chopper Not PTO Driven, rate per acre 10.50 8.00 7.50-16.00 14
PLANTING AND POST PLANTING OPERATIONSAverage
RateMost
Common Range Number
Reporting
DRILLING Small Grains, conventional drill, rate per acre 14.58 15.00 7.50-22.00 25 Small Grains, no-till drill, rate per acre 18.86 18.00 12.00-35.00 60 Soybeans, conventional drill, rate per acre 18.50 18.00 15.00-23.00 12 Soybeans, no-till drill, rate per acre 19.78 20.00 12.00-35.00 53
PLANTING ROW CROPS No coulters, with band applicator, rate per acre 20.54 18.00 12.50-34.00 34 No coulters, without band applicator, rate per acre 18.90 20.00 10.00-30.00 31 Coulters, with band applicator, rate per acre 21.12 20.00 12.00-34.00 40 Coulters, without band applicator, rate per acre 20.03 20.00 12.00-40.00 32 Ridge planting, with band applicator, rate per acre 21.98 20.00 12.00-35.00 42 Ridge planting, without band applicator, rate per acre 20.05 20.00 14.00-43.00 33Planting Dry Edible Beans, rate per acre 23.92 - 16.00-38.00 6Seeding Grass Seed, rate per acre 18.00 18.00 5.00-32.00 12Seeding Legumes, rate per acre 18.76 18.00 12.00-29.00 17Seeding CRP Ground, rate per acre 21.81 25.00 11.00-35.00 16Planting Cover Crops Drill, rate per acre 18.51 18.00 12.00-35.00 42Planting Cover Crops Broadcast, rate per acre 9.32 12.00 5.00-16.00 11Cultivation Tillage, Rotary Hoe, rate per acre 9.46 10.00 5.00-25.00 13Cultivation Tillage, conventional, rate per acre 13.31 12.00 7.50-25.00 21Cultivation Tillage, handling residue, rate per acre 13.90 15.00 7.00-25.00 24Cultivation Tillage, hill or ditch, rate per acre 13.18 10.00 6.50-25.00 24
Table 1 STATE SUMMARY OF THE MOST POPULAR MACHINERY OPERATIONS
State summary includes operations with six or more rates reported.
© The Board of Regents of the University of Nebraska. All rights reserved. 3

HAYING AND BALING Average
RateMost
Common Range Number
ReportingMowing, rate per acre 14.29 15.00 10.00-20.00 24Raking, rate per acre 6.93 5.00 2.00-15.00 41Mowing and Raking when one rate quoted, rate per acre 19.41 20.00 5.00-29.00 17Swathing with Crushing/Crimping, rate per hour 106.05 125.00 12-160 21Swathing with Crushing/Crimping, rate per acre 15.69 15.00 5.00-35.00 54Swathing without Crushing/Crimping, rate per acre 17.70 15.00 14.00-35.00 10Raking Cornstalks, rate per acre 8.71 10.00 3.00-16.00 19BALING Small Square Bales with Twine Tie, rate per bale 0.94 1.00 0.50-1.25 19 Small Square Bales With Wire Tie, rate per bale 1.50 - 0.50-4.00 6 Large Square Bales, rate per bale 14.38 16.00 10.00-16.00 8 Large Round Bales Without Net Wrap, rate per bale 13.65 12.00 10.00-18.00 27 Large Round Bales With Net Wrap, rate per bale 14.57 15.00 10.00-25.00 65 Cornstalks Large Round Bales with Net Wrap, rate per bale 16.37 15.00 11.00-20.00 26
SMALL GRAIN HARVESTAverage
RateMost
Common Range Number
ReportingWindrowing Grain Crops, rate per acre 12.17 - 10.00-15.00 6Combining Small Grains, flat charge, no hauling, rate per acre 34.38 35.00 22.00-55.00 37Hauling Small Grain to Local Storage, cents per bushel 0.13 0.15 0.05-0.24 29
APPLICATION OF FERTILIZER Average
RateMost
Common Range Number
ReportingDry Fertilizer Solid Broadcast, inc. labor & applicator, rate per acre 6.66 7.50 3.00-10.00 25Dry Fertilizer Solid Broadcast, applicator rent only, rate per acre 6.33 6.00 4.50-8.00 6Dry Fertilizer Variable Rate, rate per acre 8.18 6.50 5.00-15.00 21Liquid Fertilizer Solid, labor & applicator, rate per acre 8.74 7.00 3.00-22.00 32Liquid Fertilizer Solid, applicator rent only, rate per acre 7.08 - 2.50-11.50 6Liquid Fertilizer Variable, labor & applicator, rate per acre 10.65 10.00 5.00-20.00 21Liquid Fertilizer Variable, applicator rent only, rate per acre 8.25 8.00 2.50-12.00 6Anhydrous Ammonia, knife with coulters, rate per acre 16.16 15.00 7.50-25.00 38Anhydrous Ammonia, applicator only, rate per acre 12.17 16.00 6.00-16.00 6
INSECT, DISEASE, AND WEED CONTROL Average
Rate Most
Common Range Number
ReportingSpraying Weed Control, boom or recirculating, rate per acre 7.03 8.00 5.00-8.00 17Spraying Weed Control, self-propelled sprayer, rate per acre 7.53 7.00 4.00-16.00 55Crop Spraying by Aircraft, rate per acre 8.72 9.00 2.50-15.00 10
HARVESTING GRAINS & SOYBEANSAverage
Rate Most
Common Range Number
ReportingCombining Irrigated Corn, flat rate per acre 39.34 35.00 23.00-66.00 86Combining Irrigated Corn, flat rate per bushel 0.32 0.30 0.15-0.55 15Combining Dryland Corn, flat rate per acre 36.62 35.00 24.00-72.00 105Combining Dryland Corn, flat rate per bushel 0.30 0.30 0.13-0.44 10Combining High Moisture Corn, flat rate per acre 42.72 55.00 27.50-65.00 29Combining Soybeans, flat rate per acre 37.29 35.00 22.00-70.00 114
Table 1 STATE SUMMARY OF THE MOST POPULAR MACHINERY OPERATIONS
State summary includes operations with six or more rates reported.
© The Board of Regents of the University of Nebraska. All rights reserved. 4

HAULING OPERATIONSAverage
Rate Most
Common Range Number
ReportingHAULING GRAIN From Combine with Tractor and Grain Cart, rate per acre 5.75 5.00 2.35-10.00 20 From Combine with Tractor and Grain Cart, rate per bushel 0.09 0.06 0.01-0.24 7 Grain Truck to Storage or Elevator, flat rate per bushel 0.12 0.12 0.05-0.25 57 Grain (above 16 miles), additional charge per bushel 0.08 0.10 0.01-0.22 32 Dry Edible Beans to Storage or Elevator, rate per bushel 0.10 0.15 0.05-0.15 10HAULING HAY
Hauling Large Round Bales of Hay or Cornstalks (avg load 16.7 Tons), rate per load 90.83 - 35-200 6Hauling Large Round Bales of Hay or Cornstalks (avg load 15.8 Tons), rate per loaded mile 5.00 4.00 1.00-10.00 11Loading and Moving Large Rounds with Tractor, rate per bale 4.57 5.00 1.00-10.00 15HAULING SILAGEHauling Silage from Field to Silo by Truck, rate per hour 92.14 100.00 45-100 7Hauling Silage from Field to Silo by Truck, rate per ton 3.07 3.50 1.50-4.50 7HAULING LIVESTOCKHauling Cattle by Semi-trailer Truck (avg load 52,143 lbs), rate per loaded mile 3.80 4.00 1.35-6.94 11Hauling Cattle by Goose-Necked Trailer (avg load 15,250 lbs), rate per loaded mile 2.81 2.00 2.00-5.00 8
MAKING SILAGE AND EARLAGEAverage
RateMost
Common Range Number
ReportingCorn Silage (field chopping, hauling, filling, packing), flat rate per ton 25.67 10.00 10-100 6Corn Silage (field chopping and hauling), flat rate per ton 8.96 8.00 8.00-10.00 6
OTHER CUSTOM SERVICESAverage
RateMost
Common Range Number
ReportingGrain Bin Storage, no air or electric charge included, monthly rate per bushel 0.04 0.04 0.01-0.10 22Grain Bin Storage, with air or electric charge included, monthly rate per bushel 0.04 0.02 0.01-0.10 23Drying Grain, per point of moisture removed, rate per bushel 0.04 0.03 0.03-0.05 7Elevating Grain (on farm), rate per bushel 0.05 0.05 0.02-0.12 11Treating Soybean Seed Grain (inc. cost of chemical treatment, rate per bushel 12.21 11.00 10.00-15.00 6Checking Pivots During Irrigation Season, rate per hour 23.33 - 10.00-40.00 6Checking Pivots During Irrigation Season, rate per acre 10.13 10.00 2.00-20.00 16Closing Pivot Tracks, rate per hour 65.82 50.00 9-125 11Closing Pivot Tracks, rate per pivot 171.36 100.00 60-500 11Mowing Grass Pasture or CRP, rate per acre 27.17 25.00 8.00-75.00 6Skid Steer Loader Rent, rate per hour 59.00 55.00 35.00-85.00 10Clearing Cedar Trees, rate per metered hour 94.69 100.00 20-200 16Trenching, rate per foot 1.80 2.00 0.80-3.00 6Loading and Spreading Solid Manure, rate per hour 150.00 - 50-250 6
Table 1 STATE SUMMARY OF THE MOST POPULAR MACHINERY OPERATIONS
State summary includes operations with six or more rates reported.
© The Board of Regents of the University of Nebraska. All rights reserved. 5

CUSTOM PRACTICE Northwest North Northeast Central East Southwest South Southeast STATE
Number Reporting 8 4 13 8 22 7 5 12 68
Average Rate 14.69 14.25 16.35 16.06 16.39 20.14 14.60 15.46 16.33
Range 8.00-22.00 9.00-18.00 10.00-25.00 9.00-25.00 12.00-25.00 9.00-35.00 9.00-20.00 11.00-23.00 8.00-35.00
Most Common 15.00 18.00 15.00 15.00 15.00 18.00 - 15.00 15.00
Number Reporting 8 4 10 8 21 7 5 12 64
Average Rate 13.13 12.38 15.00 15.13 14.94 18.07 12.70 14.75 14.82
Range 8.00-16.00 8.50-16.00 10.00-20.00 8.50-25.00 9.00-20.00 8.50-33.00 8.50-18.00 9.50-20.00 8.00-33.00
Most Common 15.00 - 15.00 15.00 15.00 15.00 - 15.00 15.00
Number Reporting 3 # # # 4 # # # 9
Average Rate 21.67 - - - 23.00 - - - 21.33
Range 15.00-30.00 - - - 18.00-30.00 - - - 15.00-30.00
Most Common - - - - - - - - 20.00
Number Reporting # # # # 5 # # # 9
Average Rate - - - - 11.10 - - - 10.50
Range - - - - 6.00-15.00 - - - 6.00-15.00
Most Common - - - - 12.00 - - - 15.00
CHISEL PLOW (3 TO 8 INCHES) FOR PRIMARY TILLAGE, rate per acre
Number Reporting 6 # # # 4 # # 4 15
Average Rate 13.50 - - - 19.00 - - 17.25 16.20
Range 8.00-18.00 - - - 11.00-25.00 - - 15.00-20.00 8.00-25.00
Most Common - - - - - - - - 15.00
DEEP CHISEL (DEEPER THAN USUAL PLOW DEPTH), rate per acre
Number Reporting 6 # 3 # 9 # # # 19
Average Rate 15.00 - 17.33 - 20.17 - - - 17.92
Range 8.00-20.00 - 12.00-25.00 - 12.00-28.00 - - - 8.00-28.00
Most Common - - - - 15.00 - - - 15.00
Number Reporting 5 # 7 3 11 3 # # 27
Average Rate 21.00 - 21.71 21.67 20.55 29.00 - - 21.26
Range 10.00-30.00 - 15.00-28.00 12.00-35.00 15.00-28.00 22.00-35.00 - - 10.00-35.00
Most Common 30.00 - 25.00 - 25.00 - - - 25.00
NEBRASKA AGRICULTURAL STATISTICS DISTRICTS
DISK HARROWING, TANDEM OR OFFSET, PRIMARY (HEAVY, DEEP, LEAVING ROUGH SURFACE), rate per acre
- - - - - - - - - - - - - - - - - - - - - - - - - - - - All Units in Dollars Unless Specified - - - - - - - - - - - - - - - - - - - - - - - - - - - -
LAND TILLAGE OPERATIONS
DISK HARROWING, TANDEM OR OFFSET, FINISHING (SECONDARY, LIGHT, SEEDBED PREPARATION), rate per acre
MOLDBOARD PLOWING, rate per acre
HARROWING, SPIKE OR SPRING TOOTH, rate per acre
SUBSOIL OR RIP, rate per acre
© The Board of Regents of the University of Nebraska. All rights reserved.
2020 NEBRASKA CUSTOM RATES - PART I
6

CUSTOM PRACTICE Northwest North Northeast Central East Southwest South Southeast STATE
Number Reporting 6 # 12 # 19 3 3 7 45
Average Rate 12.67 - 13.83 - 14.16 15.83 11.83 15.50 14.00
Range 8.00-17.00 - 7.00-20.00 - 9.00-20.00 8.50-22.00 8.50-15.00 10.00-22.00 7.00-22.00
Most Common 12.00 - 12.00 - 12.00 - - - 12.00
Number Reporting # 3 4 3 9 4 # 8 28
Average Rate - 13.00 14.00 12.00 15.00 15.50 - 14.25 14.64
Range - 9.00-18.00 8.00-19.00 9.00-15.00 5.00-20.00 9.00-28.00 - 10.00-20.00 5.00-28.00
Most Common - - - - 15.00 - - 20.00 15.00
Number Reporting # # # # # # # # 3
Average Rate - - - - - - - - 11.33
Range - - - - - - - - 8.00-14.00
Most Common - - - - - - - - -
Number Reporting # 3 # 3 4 # 3 # 14
Average Rate - 27.67 - 30.00 13.00 - 26.67 - 18.43
Range - 18.00-40.00 - 20.00-40.00 8.00-15.00 - 10.00-40.00 - 8.00-40.00
Most Common - - - - 15.00 - - - 15.00
Number Reporting # # 4 # 9 # # 3 19
Average Rate - - 13.75 - 14.28 - - 16.00 15.92
Range - - 12.00-15.00 - 8.50-18.00 - - 12.00-20.00 8.50-30.00
Most Common - - 14.00 - 15.00 - - - 15.00
Number Reporting 4 # # # 5 # # # 15
Average Rate 18.25 - - - 21.40 - - - 19.00
Range 12.00-21.00 - - - 14.00-33.00 - - - 12.00-33.00
Most Common 20.00 - - - - - - - 15.00
Number Reporting 3 4 # 4 8 6 # # 21
Average Rate 22.67 21.75 - 19.00 24.00 22.83 - - 22.05
Range 22.00-24.00 18.00-25.00 - 18.00-22.00 14.00-35.00 18.00-32.00 - - 13.00-35.00
Most Common 22.00 22.00 - 18.00 24.00 18.00 - - 18.00
NEBRASKA AGRICULTURAL STATISTICS DISTRICTS
STRIP TILLING (TILLAGE ONLY, LEAVING ABOUT AN 8 INCH SEEDBED), rate per acre
STRIP TILLING (TILLAGE with FERTILIZER APPLICATION, LEAVING ABOUT AN 8 INCH SEEDBED), rate per acre
- - - - - - - - - - - - - - - - - - - - - - - - - - - - All Units in Dollars Unless Specified - - - - - - - - - - - - - - - - - - - - - - - - - - - -
FIELD CULTIVATOR (3 TO 8 INCHES WITH SHANKS OR SWEEPS), rate per acre
VERTICAL OR TURBO TILLAGE, rate per acre
BLADE PLOW OR WIDE SWEEP BLADE, rate per acre
COMBINATION TILLAGE OPERATIONS, PRIMARY TILLAGE, rate per acre
COMBINATION TILLAGE OPERATIONS, FINISHING TILLAGE, rate per acre
© The Board of Regents of the University of Nebraska. All rights reserved.
2020 NEBRASKA CUSTOM RATES - PART I
7
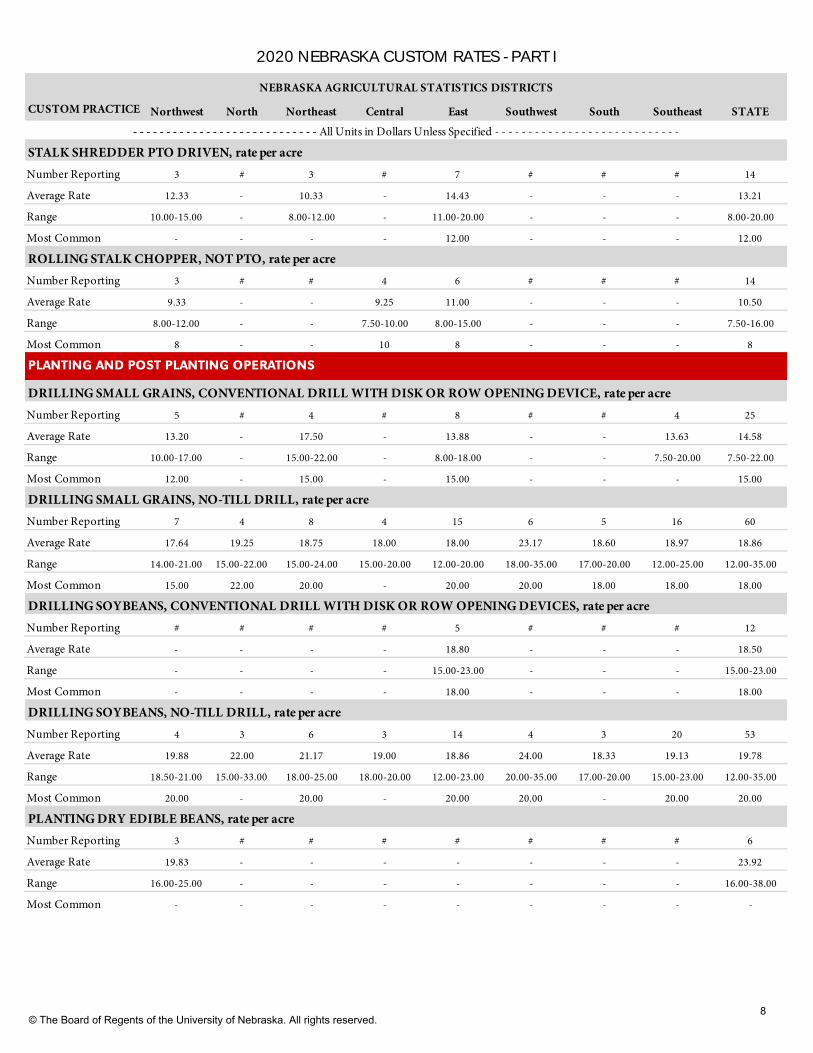
CUSTOM PRACTICE Northwest North Northeast Central East Southwest South Southeast STATE
Number Reporting 3 # 3 # 7 # # # 14
Average Rate 12.33 - 10.33 - 14.43 - - - 13.21
Range 10.00-15.00 - 8.00-12.00 - 11.00-20.00 - - - 8.00-20.00
Most Common - - - - 12.00 - - - 12.00
Number Reporting 3 # # 4 6 # # # 14
Average Rate 9.33 - - 9.25 11.00 - - - 10.50
Range 8.00-12.00 - - 7.50-10.00 8.00-15.00 - - - 7.50-16.00
Most Common 8 - - 10 8 - - - 8
Number Reporting 5 # 4 # 8 # # 4 25
Average Rate 13.20 - 17.50 - 13.88 - - 13.63 14.58
Range 10.00-17.00 - 15.00-22.00 - 8.00-18.00 - - 7.50-20.00 7.50-22.00
Most Common 12.00 - 15.00 - 15.00 - - - 15.00
Number Reporting 7 4 8 4 15 6 5 16 60
Average Rate 17.64 19.25 18.75 18.00 18.00 23.17 18.60 18.97 18.86
Range 14.00-21.00 15.00-22.00 15.00-24.00 15.00-20.00 12.00-20.00 18.00-35.00 17.00-20.00 12.00-25.00 12.00-35.00
Most Common 15.00 22.00 20.00 - 20.00 20.00 18.00 18.00 18.00
Number Reporting # # # # 5 # # # 12
Average Rate - - - - 18.80 - - - 18.50
Range - - - - 15.00-23.00 - - - 15.00-23.00
Most Common - - - - 18.00 - - - 18.00
Number Reporting 4 3 6 3 14 4 3 20 53
Average Rate 19.88 22.00 21.17 19.00 18.86 24.00 18.33 19.13 19.78
Range 18.50-21.00 15.00-33.00 18.00-25.00 18.00-20.00 12.00-23.00 20.00-35.00 17.00-20.00 15.00-23.00 12.00-35.00
Most Common 20.00 - 20.00 - 20.00 20.00 - 20.00 20.00
Number Reporting 3 # # # # # # # 6
Average Rate 19.83 - - - - - - - 23.92
Range 16.00-25.00 - - - - - - - 16.00-38.00
Most Common - - - - - - - - -
NEBRASKA AGRICULTURAL STATISTICS DISTRICTS
DRILLING SMALL GRAINS, NO-TILL DRILL, rate per acre
DRILLING SOYBEANS, CONVENTIONAL DRILL WITH DISK OR ROW OPENING DEVICES, rate per acre
DRILLING SOYBEANS, NO-TILL DRILL, rate per acre
PLANTING DRY EDIBLE BEANS, rate per acre
STALK SHREDDER PTO DRIVEN, rate per acre
ROLLING STALK CHOPPER, NOT PTO, rate per acre
DRILLING SMALL GRAINS, CONVENTIONAL DRILL WITH DISK OR ROW OPENING DEVICE, rate per acre
- - - - - - - - - - - - - - - - - - - - - - - - - - - - All Units in Dollars Unless Specified - - - - - - - - - - - - - - - - - - - - - - - - - - - -
PLANTING AND POST PLANTING OPERATIONS
© The Board of Regents of the University of Nebraska. All rights reserved.
2020 NEBRASKA CUSTOM RATES - PART I
8

CUSTOM PRACTICE Northwest North Northeast Central East Southwest South Southeast STATE
Number Reporting # # # # # # # # 3
Average Rate - - - - - - - - 29.33
Range - - - - - - - - 25.00-38.00
Most Common - - - - - - - - 25.00
Number Reporting # # # # 8 # # # 12
Average Rate - - - - 14.88 - - - 18.00
Range - - - - 5.00-20.00 - - - 5.00-32.00
Most Common - - - - 20.00 - - - 18.00
Number Reporting # # # # # # # # 5
Average Rate - - - - - - - - 20.60
Range - - - - - - - - 18.00-25.00
Most Common - - - - - - - - 18.00
Number Reporting 3 # # # 7 # # 6 17
Average Rate 19.00 - - - 18.14 - - 20.00 18.76
Range 15.00-22.00 - - - 15.00-20.00 - - 17.00-29.00 12.00-29.00
Most Common - - - - 18.00 - - 18.00 18.00
Number Reporting # # # # # # # # 3
Average Rate - - - - - - - - 22.33
Range - - - - - - - - 18.00-27.00
Most Common - - - - - - - - -
Number Reporting 4 # # # 8 # # 4 16
Average Rate 21.25 - - - 19.25 - - 24.00 21.81
Range 18.00-25.00 - - - 11.00-25.00 - - 17.00-32.00 11.00-35.00
Most Common - - - - 22.00 - - - 25.00
Number Reporting 5 3 5 3 17 3 # 10 42
Average Rate 16.90 20.67 19.20 17.33 17.26 24.33 - 18.80 18.51
Range 15.00-20.00 18.00-22.00 16.00-24.00 15.00-19.00 12.50-25.00 18.00-35.00 - 15.00-32.00 12.00-35.00
Most Common 15.00 22.00 18.00 - 18.00 - - 15.00 18.00
NEBRASKA AGRICULTURAL STATISTICS DISTRICTS
PLANTING COVER CROPS - DRILL, rate per acre
SEEDING GRASS SEED, rate per acre
SEEDING GRASS SEED WITH DEPTH BANDS, rate per acre
SEEDING LEGUMES, rate per acre
SEEDING LEGUMES WITH DEPTH BANDS, rate per acre
SEEDING CRP GROUND, rate per acre
PLANTING SUGARBEETS, rate per acre- - - - - - - - - - - - - - - - - - - - - - - - - - - - All Units in Dollars Unless Specified - - - - - - - - - - - - - - - - - - - - - - - - - - - -
© The Board of Regents of the University of Nebraska. All rights reserved.
2020 NEBRASKA CUSTOM RATES - PART I
9

CUSTOM PRACTICE Northwest North Northeast Central East Southwest South Southeast STATE
Number Reporting # # 4 # 7 # # # 11
Average Rate - - 8.25 - 11.07 - - - 9.32
Range - - 5.00-16.00 - 5.00-16.00 - - - 5.00-16.00
Most Common - - 6.00 - 12.00 - - - 12.00
Number Reporting # # # # # # # # 3
Average Rate - - - - - - - - 13.45
Range - - - - - - - - 6.85-18.50
Most Common - - - - - - - - -
Number Reporting # # 3 # 10 # # # 13
Average Rate - - 10.00 - 9.90 - - - 9.46
Range - - 5.00-15.00 - 5.00-25.00 - - - 5.00-25.00
Most Common - - - - 10.00 - - - 10.00
Number Reporting 3 # 3 4 8 # 3 4 21
Average Rate 12.50 - 11.50 14.00 13.50 - 13.33 12.00 13.31
Range 7.50-18.00 - 7.50-15.00 10.00-19.00 7.50-25.00 - 10.00-18.00 8.00-18.00 7.50-25.00
Most Common - - - - 15 - - - 12
Number Reporting 4 # # 5 12 # # 3 24
Average Rate 15.25 - - 11.80 14.29 - - 13.67 13.90
Range 8.00-20.00 - - 8.00-15.00 7.00-25.00 - - 8.00-18.00 7.00-25.00
Most Common - - - - 16.00 - - - 15.00
Number Reporting 3 # # 6 11 # 5 3 24
Average Rate 13.67 - - 11.79 12.77 - 12.10 15.00 13.18
Range 8.00-18.00 - - 8.50-15.25 6.50-25.00 - 8.50-20.00 12.00-18.00 6.50-25.00
Most Common - - - 10.00 15.00 - 10.00 - 10.00
Number Reporting 3 # 4 # 8 # 3 16 34
Average Rate 18.67 - 19.38 - 21.13 - 22.00 19.66 20.54
Range 16.00-22.00 - 12.50-25.00 - 16.00-28.00 - 18.00-25.00 14.00-34.00 12.50-34.00
Most Common - - 20.00 - 24.00 - - 18.00 18.00
NEBRASKA AGRICULTURAL STATISTICS DISTRICTS
CULTIVATION TILLAGE, CULTIVATOR HANDLING RESIDUE &/OR MAKING RIDGES, rate per acre
CULTIVATION TILLAGE, HILL OR DITCH FOR IRRIGATION, rate per acre
PLANTING ROW CROPS, NO COULTERS OR ROW CLEANING DEVICE INCLUDES NO-TILL, WITH BAND APPLICATOR, rate per acre
PLANTING COVER CROPS - BROADCAST, rate per acre
PLANTING COVER CROPS -AERIAL, rate per acre
CULTIVATION TILLAGE, ROTARY HOE, rate per acre
CULTIVATION TILLAGE, CONVENTIONAL CROP CULTIVATOR, rate per acre
- - - - - - - - - - - - - - - - - - - - - - - - - - - - All Units in Dollars Unless Specified - - - - - - - - - - - - - - - - - - - - - - - - - - - -
© The Board of Regents of the University of Nebraska. All rights reserved.
2020 NEBRASKA CUSTOM RATES - PART I
10

CUSTOM PRACTICE Northwest North Northeast Central East Southwest South Southeast STATE
Number Reporting 3 # 5 # 6 # 3 14 31
Average Rate 18.67 - 18.20 - 20.83 - 18.67 17.50 18.90
Range 16.00-20.00 - 15.00-20.00 - 16.00-24.00 - 16.00-20.00 10.00-22.00 10.00-30.00
Most Common 20.00 - 18.00 - 24.00 - 20.00 20.00 20.00
Number Reporting 3 # 10 # 14 4 5 6 40
Average Rate 22.00 - 18.43 - 22.07 23.00 22.00 22.42 21.12
Range 19.00-25.00 - 15.00-25.00 - 12.00-30.00 20.00-25.00 18.00-25.00 15.00-34.00 12.00-34.00
Most Common - - 15.00 - 25.00 25.00 - - 20.00
Number Reporting # # 3 # 10 # 4 12 32
Average Rate - - 18.00 - 21.95 - 19.25 21.28 20.03
Range - - 17.00-20.00 - 12.50-40.00 - 18.00-21.00 12.00-40.00 12.00-40.00
Most Common - - 17.00 - 20.00 - 18.00 20.00 20.00
Number Reporting 4 4 7 9 12 6 6 # 42
Average Rate 17.88 23.75 21.29 20.50 23.00 23.67 22.00 - 21.98
Range 15.00-22.00 20.00-28.00 16.00-26.00 18.00-23.50 12.00-30.00 20.00-35.00 20.00-25.00 - 12.00-35.00
Most Common - - 20.00 20.00 24.00 20.00 20.00 - 20.00
Number Reporting # # 7 6 7 # 3 8 33
Average Rate - - 18.86 17.67 21.93 - 19.67 21.00 20.05
Range - - 15.00-25.00 15.00-20.00 15.50-26.00 - 18.00-21.00 14.00-43.00 14.00-43.00
Most Common - - 20.00 18.00 25.00 - - 15.00 20.00
Number Reporting 3 5 3 # 9 # # 7 24
Average Rate 15.33 13.60 16.00 - 13.44 - - 14.14 14.29
Range 15.00-16.00 10.00-18.00 12.00-20.00 - 10.00-18.00 - - 12.00-18.00 10.00-20.00
Most Common 15.00 10.00 - - 12.00 - - 12.00 15.00
Number Reporting 5 5 5 5 17 # # 13 41
Average Rate 9.20 9.00 4.60 6.60 7.12 - - 6.46 6.93
Range 7.00-12.00 5.00-11.00 3.00-6.00 2.00-10.00 4.00-15.00 - - 4.00-10.00 2.00-15.00
Most Common 7.00 10.00 5.00 10.00 10.00 - - 5.00 5.00
- - - - - - - - - - - - - - - - - - - - - - - - - - - - All Units in Dollars Unless Specified - - - - - - - - - - - - - - - - - - - - - - - - - - - -
NEBRASKA AGRICULTURAL STATISTICS DISTRICTS
PLANTING ROW CROPS, WITH COULTERS, WITH BAND APPLICATOR, rate per acre
PLANTING ROW CROPS, WITH COULTERS, WITHOUT BAND APPLICATOR, rate per acre
PLANTING ROW CROPS, WITH ROW CLEANING DEVICES FOR RIDGE PLANTING, WITH BAND APPLICATOR, rate per acre
PLANTING ROW CROPS, WITH ROW CLEANING DEVICES FOR RIDGE PLANTING, WITHOUT BAND APPLICATOR, rate per acre
MOWING, rate per acre
RAKING, rate per acre
HAYING, BALING and GRINDING HAY
PLANTING ROW CROPS, NO COULTERS OR ROW CLEANING DEVICE INCLUDES NO-TILL, WITHOUT BAND APPLICATOR, rate per acre
© The Board of Regents of the University of Nebraska. All rights reserved.
2020 NEBRASKA CUSTOM RATES - PART I
11

CUSTOM PRACTICE Northwest North Northeast Central East Southwest South Southeast STATE
Number Reporting 3 3 # 3 6 # # 3 17
Average Rate 24.00 22.00 - 22.00 17.83 - - 14.00 19.41
Range 22.00-25.00 20.00-26.00 - 17.00-29.00 12.00-25.00 - - 5.00-25.00 5.00-29.00
Most Common 25.00 20.00 - - 15.00 - - - 20.00
Number Reporting # # # # 4 # # 14 21
Average Rate - - - - 105.00 - - 118.71 106.05
Range - - - - 20-150 - - 12-160 12-160
Most Common - - - - 125.00 - - 125.00 125.00
Number Reporting 6 3 5 6 19 4 4 19 54
Average Rate 16.00 15.33 14.20 16.50 17.95 16.25 14.50 14.08 15.69
Range 15.00-18.00 14.00-16.00 10.00-20.00 14.00-19.00 12.00-35.00 14.00-18.00 11.00-19.00 5.00-18.00 5.00-35.00
Most Common 16.00 16.00 - - 15.00 - 14.00 15.00 15.00
Number Reporting # # # # # # # # 4
Average Rate - - - - - - - - 51.75
Range - - - - - - - - 12-100
Most Common - - - - - - - - -
Number Reporting # # # # 4 # # # 10
Average Rate - - - - 20.75 - - - 17.70
Range - - - - 15.00-35.00 - - - 14.00-35.00
Most Common - - - - 15.00 - - - 15.00
Number Reporting 3 # 4 # 11 # # 6 19
Average Rate 1.00 - 0.86 - 0.99 - - 1.04 0.94
Range 1.00-1.00 - 0.70-1.00 - 0.50-1.25 - - 0.75-1.25 0.50-1.25
Most Common 1.00 - 1.00 - 1.00 - - 1.00 1.00
Number Reporting # # # # 4 # # # 6
Average Rate - - - - 1.94 - - - 1.50
Range - - - - 1.00-4.00 - - - 0.50-4.00
Most Common - - - - - - - - -
- - - - - - - - - - - - - - - - - - - - - - - - - - - - All Units in Dollars Unless Specified - - - - - - - - - - - - - - - - - - - - - - - - - - - -
NEBRASKA AGRICULTURAL STATISTICS DISTRICTS
BALING SMALL SQUARE BALES WITH TWINE TIE, (AVERAGE LBS/BALE = 64#), rate per bale
BALING SMALL SQUARE BALES WITH WIRE TIE, (AVERAGE LBS/BALE = 60#), rate per bale
MOWING AND RAKING (Where one rate is quoted or contracted.), rate per acre
SWATHING WITH CRUSHING/CRIMPING, rate per hour
SWATHING WITH CRUSHING/CRIMPING, rate per acre
SWATHING WITHOUT CRUSHING/CRIMPING, rate per hour
SWATHING WITHOUT CRUSHING/CRIMPING, rate per acre
© The Board of Regents of the University of Nebraska. All rights reserved.
2020 NEBRASKA CUSTOM RATES - PART I
12

CUSTOM PRACTICE Northwest North Northeast Central East Southwest South Southeast STATE
Number Reporting # # # # # # # 3 8
Average Rate - - - - - - - 14.33 14.38
Range - - - - - - - 12.00-16.00 10.00-16.00
Most Common - - - - - - - - 16.00
Number Reporting # # 3 # 14 # # 10 27
Average Rate - - 13.50 - 13.93 - - 12.90 13.65
Range - - 13.00-14.00 - 10.00-18.00 - - 10.00-15.00 10.00-18.00
Most Common - - - - 15.00 - - 12.00 12.00
Number Reporting 5 6 9 7 20 # 3 28 65
Average Rate 16.40 16.00 13.17 15.86 15.25 - 13.00 14.16 14.57
Range 14.00-20.00 10.00-25.00 10.00-16.00 10.00-25.00 10.00-20.00 - 11.00-15.00 10.00-18.00 10.00-25.00
Most Common - 15.00 13.00 15.00 15.00 - - 15.00 15.00
Number Reporting # # # # 3 # # # 5
Average Rate - - - - 2.00 - - - 1.65
Range - - - - 0.25-5.00 - - - 0.25-5.00
Most Common - - - - - - - - 0.25
Number Reporting 5 # # # 7 # # 6 15
Average Rate 5.60 - - - 4.00 - - 3.67 4.57
Range 4.00-10.00 - - - 2.00-5.00 - - 1.00-5.00 1.00-10.00
Most Common 4 - - - 5 - - 5 5
Number Reporting # # # # # # # # 5
Average Rate - - - - - - - - 14.80
Range - - - - - - - - 10.00-18.00
Most Common - - - - - - - - 15.00
Number Reporting # # # # # # # # 3
Average Rate - - - - - - - - 51.67
Range - - - - - - - - 15-110
Most Common - - - - - - - - -
Number Reporting # # 3 # 8 # # 8 19
Average Rate - - 5.33 - 9.31 - - 7.19 8.71
Range - - 5.00-6.00 - 4.00-16.00 - - 3.00-15.00 3.00-16.00
Most Common - - 5.00 - - - - - 10.00
- - - - - - - - - - - - - - - - - - - - - - - - - - - - All Units in Dollars Unless Specified - - - - - - - - - - - - - - - - - - - - - - - - - - - -
NEBRASKA AGRICULTURAL STATISTICS DISTRICTS
LOADING AND STACKING SMALL SQUARE BALES, rate per bale
SHREDDING CORNSTALKS, rate per acre
LOADING AND MOVING LARGE ROUND BALES WITH TRACTOR, (AVERAGE DISTANCE = 3.3 miles), rate per bale
BALING LARGE SQUARE BALES, (AVERAGE LBS/BALE = 1350#), rate per bale
BALING LARGE ROUND BALES WITHOUT NET WRAP, (AVERAGE LBS/BALE = 1473#), rate per bale
BALING LARGE ROUND BALES WITH NET WRAP, (AVERAGE LBS/BALE = 1511#), rate per bale
RAKING CORNSTALKS, rate per acre
RAKING CORNSTALKS, rate per hour
© The Board of Regents of the University of Nebraska. All rights reserved.
2020 NEBRASKA CUSTOM RATES - PART I
13

CUSTOM PRACTICE Northwest North Northeast Central East Southwest South Southeast STATE
Number Reporting 3 # 6 # 10 # # 8 26
Average Rate 18.33 - 14.67 - 16.40 - - 17.19 16.37
Range 17.00-20.00 - 13.00-15.00 - 11.00-20.00 - - 14.00-20.00 11.00-20.00
Most Common - - 15.00 - 15.00 - - 18.00 15.00
Number Reporting # # # # # # # # 3
Average Rate - - - - - - - - 10.00
Range - - - - - - - - 9.50-10.50
Most Common - - - - - - - - -
Number Reporting 3 # # # # # # # 6
Average Rate 11.83 - - - - - - - 12.17
Range 10.50-13.00 - - - - - - - 10.00-15.00
Most Common - - - - - - - - -
Number Reporting 4 4 3 3 9 5 3 9 37
Average Rate 26.00 41.25 35.00 43.33 37.22 32.80 40.00 31.44 34.38
Range 22.00-32.00 35.00-50.00 30.00-38.00 40.00-50.00 24.00-55.00 22.00-40.00 35.00-45.00 22.00-38.00 22.00-55.00
Most Common 25.00 40.00 - 40.00 35.00 35.00 - 30.00 35.00
Number Reporting # # # # # # # # 5
Average Rate - - - - - - - - 28.20
Range - - - - - - - - 21.00-46.00
Most Common - - - - - - - - 25.00
Number Reporting # # # # # # # # 4
Average Rate - - - - - - - - 0.20
Range - - - - - - - - 0.10-0.25
Most Common - - - - - - - - -
Number Reporting 5 # # 3 9 6 # 5 29
Average Rate 0.20 - - 0.11 0.12 0.13 - 0.10 0.13
Range 0.15-0.24 - - 0.10-0.12 0.05-0.24 0.08-0.15 - 0.05-0.16 0.05-0.24
Most Common 0.15 - - 0.10 0.10 0.15 - - 0.15
- - - - - - - - - - - - - - - - - - - - - - - - - - - - All Units in Dollars Unless Specified - - - - - - - - - - - - - - - - - - - - - - - - - - - -
NEBRASKA AGRICULTURAL STATISTICS DISTRICTS
GRINDING DRY HAY, rate per ton
BALING CORNSTALKS WITH NET WRAP, (AVERAGE LBS/BALE = 1318#), rate per bale
WINDROWING GRAIN CROPS, rate per acre
COMBINING SMALL GRAINS, FLAT CHARGE WITH NO HAULING, rate per acre
COMBINING SMALL GRAINS, MINIMUM WITH EXTRA CHARGE FOR HIGH YIELDS, rate per acre
SMALL GRAIN HARVEST( WHEAT, OATS, AND BARLEY)
ADDITIONAL FEE ABOVE MINIMUM FOR COMBINING SMALL GRAINS FOR YIELD OVER 24.75 BUSHEL PER ACRE, rate per bushel
HAULING SMALL GRAIN FROM COMBINE TO LOCAL STORAGE, flat rate per bushel
© The Board of Regents of the University of Nebraska. All rights reserved.
2020 NEBRASKA CUSTOM RATES - PART I
14

CUSTOM PRACTICE Northwest North Northeast Central East Southwest South Southeast STATE
Number Reporting # # # # 9 # # # 18
Average Rate - - - - 0.09 - - - 0.08
Range - - - - 0.02-0.24 - - - 0.01-0.24
Most Common - - - - 0.15 - - - 0.15
Number Reporting # # 6 # 5 3 # 10 25
Average Rate - - 5.71 - 7.10 7.33 - 6.90 6.66
Range - - 3.00-7.25 - 4.00-10.00 6.50-8.00 - 3.00-10.00 3.00-10.00
Most Common - - 7.00 - - - - 7.50 7.50
Number Reporting # # # # # # # # 6
Average Rate - - - - - - - - 6.33
Range - - - - - - - - 4.50-8.00
Most Common - - - - - - - - 6.00
Number Reporting # # 3 # # # # # 3
Average Rate - - 9.00 - - - - - 9.00
Range - - 2.00-15.00 - - - - - 2.00-15.00
Most Common - - - - - - - - -
Number Reporting # # 5 # 7 # # 7 21
Average Rate - - 7.05 - 8.89 - - 8.32 8.18
Range - - 5.00-10.25 - 6.50-15.00 - - 6.50-11.00 5.00-15.00
Most Common - - 5.00 - 6.50 - - - 6.50
Number Reporting 5 # 5 # 9 3 4 11 32
Average Rate 7.20 - 6.24 - 9.56 7.17 7.63 10.82 8.74
Range 5.00-12.00 - 3.00-7.25 - 7.00-14.00 7.00-7.50 6.50-10.00 6.00-22.00 3.00-22.00
Most Common 5.00 - 7.00 - 7.00 7.00 7.00 12.00 7.00
Number Reporting # # # # 3 # # # 6
Average Rate - - - - 7.33 - - - 7.08
Range - - - - 2.50-11.50 - - - 2.50-11.50
Most Common - - - - - - - - -
- - - - - - - - - - - - - - - - - - - - - - - - - - - - All Units in Dollars Unless Specified - - - - - - - - - - - - - - - - - - - - - - - - - - - -
NEBRASKA AGRICULTURAL STATISTICS DISTRICTS
LIQUID FERTILIZER SOLID APPLICATION, POWER, LABOR, & APPLICATOR, rate per acre
LIQUID FERTILIZER SOLID APPLICATION, APPLICATOR RENTAL ONLY, rate per acre
APPLICATION OF FERTILIZER (EXCLUDING COST OF FERTILIZER)
HAULING SMALL GRAIN EXTRA DISTANCE, additional rate per bushel (when hauling over 13.5 miles)
DRY FERTILIZER SOLID BROADCAST, INCLUDING POWER, LABOR, & APPLICATOR, rate per acre
DRY FERTILIZER SOLID BROADCAST, APPLICATOR RENTAL ONLY, rate per acre
DRY FERTILIZER SOLID BROADCAST, APPLICATOR RENTAL ONLY, rate per ton
DRY FERTILIZER VARIABLE RATE, INCLUDING POWER, LABOR, & APPLICATOR, rate per acre
© The Board of Regents of the University of Nebraska. All rights reserved.
2020 NEBRASKA CUSTOM RATES - PART I
15

CUSTOM PRACTICE Northwest North Northeast Central East Southwest South Southeast STATE
Number Reporting # # 3 # 9 4 3 6 21
Average Rate - - 9.00 - 10.44 10.88 9.00 10.08 10.65
Range - - 5.00-15.00 - 6.50-16.00 7.00-20.00 7.00-11.00 7.00-13.00 5.00-20.00
Most Common - - - - 10.00 - - - 10.00
Number Reporting # # # # 4 # # # 6
Average Rate - - - - 8.50 - - - 8.25
Range - - - - 2.50-12.00 - - - 2.50-12.00
Most Common - - - - - - - - 8.00
Number Reporting # # # # 3 # # # 5
Average Rate - - - - 16.83 - - - 14.70
Range - - - - 16.00-18.00 - - - 8.00-18.00
Most Common - - - - - - - - -
Number Reporting # # # # # # # 3 5
Average Rate - - - - - - - 12.83 11.30
Range - - - - - - - 7.50-16.00 6.00-16.00
Most Common - - - - - - - - -
Number Reporting # # # # 14 # 3 24 38
Average Rate - - - - 16.70 - 18.00 15.76 16.16
Range - - - - 12.00-24.00 - 16.00-20.00 7.50-25.00 7.50-25.00
Most Common - - - - 18 - - 15 15
Number Reporting # # # # # # # 4 6
Average Rate - - - - - - - 13.75 12.17
Range - - - - - - - 8.00-16.00 6.00-16.00
Most Common - - - - - - - 16.00 16.00
- - - - - - - - - - - - - - - - - - - - - - - - - - - - All Units in Dollars Unless Specified - - - - - - - - - - - - - - - - - - - - - - - - - - - -
NEBRASKA AGRICULTURAL STATISTICS DISTRICTS
ANHYDROUS AMMONIA, CONVENTIONAL KNIFE, APPLICATOR RENTAL ONLY, rate per acre
ANHYDROUS AMMONIA, KNIFE WITH COULTERS, POWER, LABOR, & APPLICATOR, rate per acre
ANHYDROUS AMMONIA, KNIFE WITH COULTERS, APPLICATOR RENTAL ONLY, rate per acre
LIQUID FERTILIZER VARIABLE RATE, POWER, LABOR, & APPLICATOR, rate per acre
LIQUID FERTILIZER VARIABLE RATE, APPLICATOR RENTAL ONLY, rate per acre
ANHYDROUS AMMONIA, CONVENTIONAL KNIFE, POWER, LABOR, & APPLICATOR, rate per acre
© The Board of Regents of the University of Nebraska. All rights reserved.
2020 NEBRASKA CUSTOM RATES - PART I
16

CUSTOM PRACTICE Northwest North Northeast Central East Southwest South Southeast STATE
Number Reporting # # # # # # # # 5
Average Rate - - - - - - - - 2.70
Range - - - - - - - - 1.00-5.00
Most Common - - - - - - - - 3.00
Number Reporting # # # # # # # # 4
Average Rate - - - - - - - - 4.38
Range - - - - - - - - 1.50-12.00
Most Common - - - - - - - - 2.00
Number Reporting 5 # 5 # 6 # # 4 17
Average Rate 6.50 - 7.30 - 6.92 - - 7.63 7.03
Range 5.00-8.00 - 6.00-8.00 - 6.00-8.00 - - 7.00-8.00 5.00-8.00
Most Common - - 8.00 - 6.00 - - 8.00 8.00
Number Reporting 6 # 9 4 19 7 5 13 55
Average Rate 9.00 - 7.33 7.63 8.11 7.07 7.45 7.88 7.53
Range 6.50-16.00 - 6.00-10.00 7.00-8.50 6.00-16.00 4.00-8.50 7.00-8.25 6.00-16.00 4.00-16.00
Most Common - - 6.00 7.00 7.00 7.00 7.00 7.50 7.00
Number Reporting # # 4 # 3 # # # 10
Average Rate - - 9.44 - 8.17 - - - 8.72
Range - - 8.50-11.00 - 2.50-15.00 - - - 2.50-15.00
Most Common - - - - - - - - 9.00
Number Reporting # # # # 7 # # 3 12
Average Rate - - - - 79.71 - - 121.67 87.33
Range - - - - 35-150 - - 65-225 35-225
Most Common - - - - 80.00 - - - 80.00
Number Reporting # # # # 8 # # # 11
Average Rate - - - - 95.08 - - - 89.97
Range - - - - 65-150 - - - 60-150
Most Common - - - - 90.00 - - - 90.00
- - - - - - - - - - - - - - - - - - - - - - - - - - - - All Units in Dollars Unless Specified - - - - - - - - - - - - - - - - - - - - - - - - - - - -
NEBRASKA AGRICULTURAL STATISTICS DISTRICTS
DRYLAND SOYBEANS (AVERAGE TIMES OVER THE FIELD = 4.5), rate per acre
IRRIGATED SOYBEANS (AVERAGE TIMES OVER THE FIELD = 5), rate per acre
INJECTION PUMP FOR CHEMICALS WITH CENTER PIVOT IRRIGATION, (POWER, LABOR, & APPLICATOR), rate per acre
INJECTION PUMP FOR CHEMICALS WITH CENTER PIVOT IRRIGATION, (APPLICATOR RENTAL ONLY), rate per acre
INSECT, DISEASE, AND WEED CONTROL PER APPLICATION (EXCLUDES COST OF MATERIALS)
CUSTOM CONTRACT FARMING (DOES NOT INCLUDE INPUT COSTS)
SPRAYING WEED CONTROL, BOOM OR RECIRCULATING SPRAYER (Pulled by Tractor), rate per acre
CROP SPRAYING of INSECTICIDES &/or HERBICIDES by SELF-PROPELLED SPRAYER, rate per acre
CROP SPRAYING BY AIRCRAFT OF INSECTICIDES AND/OR HERBICIDES, rate per acre
© The Board of Regents of the University of Nebraska. All rights reserved.
2020 NEBRASKA CUSTOM RATES - PART I
17

CUSTOM PRACTICE Northwest North Northeast Central East Southwest South Southeast STATE
Number Reporting # # # # 6 # # 4 12
Average Rate - - - - 99.83 - - 126.25 103.25
Range - - - - 74-150 - - 65-225 60-225
Most Common - - - - - - - - 90.00
Number Reporting # # # # 8 # # 3 14
Average Rate - - - - 106.10 - - 113.00 110.42
Range - - - - 66-150 - - 89-150 60-200
Most Common - - - - 100.00 - - - 100.00
Number Reporting Yes 7
Number Reporting No 9
Number Reporting Yes 5
Number Reporting No 11
- - - - - - - - - - - - - - - - - - - - - - - - - - - - All Units in Dollars Unless Specified - - - - - - - - - - - - - - - - - - - - - - - - - - - -
NEBRASKA AGRICULTURAL STATISTICS DISTRICTS
DOES THE CUSTOM FARMING RATE INCLUDE HAULING GRAIN FROM FIELD TO ELEVATOR?
DRYLAND CORN (AVERAGE TIMES OVER THE FIELD = 4.5), rate per acre
IRRIGATED CORN (AVERAGE TIMES OVER THE FIELD = 5), rate per acre
DOES THE CUSTOM FARMING RATE INCLUDE HAULING GRAIN FROM FIELD TO FARM?
© The Board of Regents of the University of Nebraska. All rights reserved.
2020 NEBRASKA CUSTOM RATES - PART I
18

CUSTOM PRACTICE Northwest North Northeast Central East Southwest South Southeast STATE
HARVESTING GRAINS & SOYBEANS
COMBINING IRRIGATED CORN, flat rate per acre
Number Reporting 8 3 16 6 24 4 # 26 86
Average Rate 37.63 45.00 38.72 42.50 42.25 40.00 - 36.46 39.34
Range 26.00-60.00 35.00-50.00 30.00-65.00 35.00-50.00 30.00-65.00 30.00-55.00 - 23.00-66.00 23.00-66.00
Most Common 38.00 50.00 30.00 - 35.00 - - 40.00 35.00
COMBINING IRRIGATED CORN, flat rate per bushel
Number Reporting # # # 5 # 5 4 # 15
Average Rate - - - 0.30 - 0.38 0.32 - 0.32
Range - - - 0.22-0.35 - 0.30-0.55 0.28-0.35 - 0.15-0.55
Most Common - - - 0.35 - 0.30 - - 0.30
COMBINING IRRIGATED CORN, BASE ACRE PLUS YIELD CHARGE, base rate per acre
Number Reporting # # # # # # # # 7
Average Rate - - - - - - - - 27.57
Range - - - - - - - - 5.00-50.00
Most Common - - - - - - - - -
YIELD PER ACRE THAT TRIGGERS AN ADDITIONAL PER BUSHEL CHARGE
Average Bu/Acre - - - - - - - - 132
ADDITIONAL PER BUSHEL CHARGE WHEN YIELD (noted above) PER ACRE IS MET
Average Rate/Bushel - - - - - - - - 0.19
EXTRA CHARGE PER BUSHEL FOR HAULING IRRIGATED CORN ABOVE AGREED UPON MILES, rate per bushel
Number Reporting 4 3 8 4 15 # 4 6 42
Average Rate 0.11 0.09 0.12 0.12 0.08 - 0.04 0.06 0.09
Range 0.02-0.20 0.04-0.13 0.05-0.18 0.10-0.15 0.01-0.20 - 0.01-0.10 0.01-0.12 0.01-0.20
Most Common - - 0.10 0.10 0.05 - - 0.05 0.10
Average Miles - - 13 19 13 - 11 8 12
COMBINING DRYLAND CORN, flat rate per acre
Number Reporting 9 3 21 8 28 5 # 38 105
Average Rate 36.44 43.33 36.69 40.50 38.79 36.40 - 35.18 36.62
Range 25.00-72.00 35.00-50.00 25.00-60.00 35.00-50.00 24.00-65.00 30.00-50.00 - 25.00-72.00 24.00-72.00
Most Common 30.00 - 40.00 35.00 40.00 35.00 - 35.00 35.00
COMBINING DRYLAND CORN, flat rate per bushel
Number Reporting # # # # # 4 4 # 10
Average Rate - - - - - 0.31 0.33 - 0.30
Range - - - - - 0.13-0.44 0.30-0.35 - 0.13-0.44
Most Common - - - - - - 0.35 - 0.30
- - - - - - - - - - - - - - - - - - - - - - - - - - - - All Units in Dollars Unless Specified - - - - - - - - - - - - - - - - - - - - - - - - - - - -
NEBRASKA AGRICULTURAL STATISTICS DISTRICTS
© The Board of Regents of the University of Nebraska. All rights reserved.
2020 NEBRASKA CUSTOM RATES - PART II
19

CUSTOM PRACTICE Northwest North Northeast Central East Southwest South Southeast STATE
COMBINING DRYLAND CORN, BASE ACRE PLUS YIELD CHARGE, base rate per acre
Number Reporting # # # # # # # # 6
Average Rate - - - - - - - - 32.33
Range - - - - - - - - 21.00-50.00
Most Common - - - - - - - - -
YIELD PER ACRE THAT TRIGGERS AN ADDITIONAL PER BUSHEL CHARGE
Average Bu/Acre - - - - - - - - 109
ADDITIONAL PER BUSHEL CHARGE WHEN YIELD (noted above) PER ACRE IS MET
Average Rate/Bushel - - - - - - - - 0.20
EXTRA CHARGE PER BUSHEL FOR HAULING CORN ABOVE AGREED UPON MILES
Number Reporting 5 # 9 3 14 # 4 13 46
Average Rate 0.11 - 0.11 0.11 0.10 - 0.04 0.09 0.10
Range 0.02-0.20 - 0.05-0.18 0.10-0.13 0.02-0.20 - 0.01-0.10 0.01-0.25 0.01-0.25
Most Common - - 0.10 0.10 0.02 - - 0.10 0.10
Average Miles 12.6 - 10.6 15.0 12.2 18.3 11.3 9.8 11.0
COMBINING HIGH MOISTURE CORN, flat rate per acre
Number Reporting 3 3 7 # 9 # # 4 29
Average Rate 38.33 48.33 35.50 - 48.11 - - 40.38 42.72
Range 32.00-45.00 35.00-55.00 30.00-40.00 - 35.00-65.00 - - 27.50-49.00 27.50-65.00
Most Common - 55.00 38.00 - 65.00 - - - 55.00
COMBINING HIGH MOISTURE CORN, flat rate per bushel
Number Reporting # # # 3 # # # # 5
Average Rate - - - 0.31 - - - - 0.34
Range - - - 0.22-0.35 - - - - 0.22-0.48
Most Common - - - 0.35 - - - - 0.35
COMBINING SOYBEANS, flat rate per acre
Number Reporting 5 4 21 10 34 5 5 40 114
Average Rate 43.00 41.25 36.83 40.10 38.85 37.00 42.20 34.58 37.29
Range 30.00-70.00 35.00-50.00 25.00-65.00 35.00-50.00 22.00-70.00 35.00-40.00 35.00-53.00 25.00-70.00 22.00-70.00
Most Common 40.00 35.00 30.00 35.00 35.00 35.00 35.00 35.00 35.00
COMBINING SOYBEANS, flat rate per bushel
Number Reporting # # # # # # # # 3
Average Rate - - - - - - - - 0.54
Range - - - - - - - - 0.38-0.65
Most Common - - - - - - - - -
EXTRA PER BUSHEL CHARGE WHEN HAULING SOYBEANS ADDITIONAL DISTANCE
Number Reporting 4 3 8 4 15 3 5 13 51
Average Rate 0.15 0.09 0.11 0.13 0.11 0.12 0.05 0.10 0.11
Range 0.08-0.30 0.04-0.13 0.05-0.18 0.10-0.15 0.02-0.30 0.10-0.15 0.00-0.10 0.01-0.25 0.004-0.30
Most Common 0.10 - 0.10 0.13 0.10 0.10 0.10 0.12 0.10
Average Miles 15.0 10.0 12.0 20.0 12.0 18.3 11.0 9.8 11.4
- - - - - - - - - - - - - - - - - - - - - - - - - - - - All Units in Dollars Unless Specified - - - - - - - - - - - - - - - - - - - - - - - - - - - -
NEBRASKA AGRICULTURAL STATISTICS DISTRICTS
© The Board of Regents of the University of Nebraska. All rights reserved.
2020 NEBRASKA CUSTOM RATES - PART II
20

CUSTOM PRACTICE Northwest North Northeast Central East Southwest South Southeast STATE
COMBINING GRAIN SORGHUM WITHOUT PICKUP HEADER, flat rate per acre
Number Reporting # # # # # # # # 5
Average Rate - - - - - - - - 31.40
Range - - - - - - - - 25.00-37.00
Most Common - - - - - - - - 30.00
COMBINING MILLET WITH PICKUP HEADER, flat rate per acre
Number Reporting 3 # # # # # # # 4
Average Rate 25.33 - - - - - - - 25.25
Range 23.00-28.00 - - - - - - - 23.00-28.00
Most Common - - - - - - - - 25.00
COMBINING MILLET WITH PICKUP HEADER, BASE ACRE PLUS YIELD CHARGE, base rate per acre
Number Reporting 3 # # # # # # # 3
Average Rate 23.67 - - - - - - - 23.67
Range 23.00-24.00 - - - - - - - 23.00-24.00
Most Common 24.00 - - - - - - - 24.00
MILLET YIELD PER ACRE THAT TRIGGERS AN ADDITIONAL PER BUSHEL CHARGEAverage Bu/Acre 23 - - - - - - - 23
ADDITIONAL PER BUSHEL CHARGE WHEN MILLET YIELD (noted above) PER ACRE IS MET Average Rate/Bushel 0.24 - - - - - - - 0.24
COMBINING SUNFLOWERS, flat rate per acre
Number Reporting # # # # # # # # 3
Average Rate - - - - - - - - 34.00
Range - - - - - - - - 30.00-38.00
Most Common - - - - - - - - -
COMBINING STANDING DRY EDIBLE BEANS, rate per acre
Number Reporting # # # # # # # # 3
Average Rate - - - - - - - - 45.00
Range - - - - - - - - 40.00-50.00
Most Common - - - - - - - - -
HAULING OPERATIONS (GRAIN & HAY)
HAULING GRAIN FROM COMBINE WITH TRACTOR AND GRAIN CART TO THE EDGE OF THE FIELD, rate per acre
Number Reporting # # 5 # 8 # # 7 20
Average Rate - - 5.49 - 6.08 - - 5.71 5.75
Range - - 5.00-6.45 - 2.35-10.00 - - 5.00-7.00 2.35-10.00
Most Common - - 5.00 - 5.00 - - 6.00 5.00
HAULING GRAIN FROM COMBINE WITH TRACTOR AND GRAIN CART, rate per bushel
Number Reporting # # # # 3 # # # 7
Average Rate - - - - 0.06 - - - 0.09
Range - - - - 0.01-0.12 - - - 0.01-0.24
Most Common - - - - - - - - 0.06
- - - - - - - - - - - - - - - - - - - - - - - - - - - - All Units in Dollars Unless Specified - - - - - - - - - - - - - - - - - - - - - - - - - - - -
NEBRASKA AGRICULTURAL STATISTICS DISTRICTS
© The Board of Regents of the University of Nebraska. All rights reserved.
2020 NEBRASKA CUSTOM RATES - PART II
21

CUSTOM PRACTICE Northwest North Northeast Central East Southwest South Southeast STATE
HAULING GRAIN WITH GRAIN TRUCK TO STORAGE OR ELEVATOR, flat rate per bushel
Number Reporting 5 # 12 3 20 3 # 16 57
Average Rate 0.14 - 0.13 0.11 0.12 0.14 - 0.11 0.12
Range 0.05-0.20 - 0.10-0.22 0.10-0.12 0.05-0.25 0.10-0.20 - 0.05-0.16 0.05-0.25
Most Common - - 0.10 0.10 0.12 - - 0.12 0.12
EXTRA PER BUSHEL CHARGE WHEN HAULING GRAIN ADDITIONAL DISTANCE
Number Reporting 5 # 5 3 13 # # 4 32
Average Rate 0.13 - 0.07 0.08 0.07 - - 0.07 0.08
Range 0.02-0.20 - 0.05-0.10 0.01-0.13 0.02-0.20 - - 0.01-0.20 0.01-0.22
Most Common - - 0.05 - 0.10 - - 0.01 0.10
Average Miles 28 - 9 - 17 - - 12 16
HAULING DRY EDIBLE BEANS WITH TRUCK TO STORAGE OR ELEVATOR, flat rate per bushel
Number Reporting # # # # # # # 4 10
Average Rate - - - - - - - 0.11 0.10
Range - - - - - - - 0.05-0.15 0.05-0.15
Most Common - - - - - - - - 0.15
EXTRA PER BUSHEL CHARGE WHEN HAULING DRY BEANS ADDITIONAL DISTANCE
Number Reporting 3 # # # 3 # # # 6
Average Rate 0.14 - - - 0.07 - - - 0.13
Range 0.02-0.24 - - - 0.02-0.10 - - - 0.02-0.24
Most Common - - - - - - - - -
Average Miles 13 - - - 13 - - - 15
HAULING LARGE ROUND BALES HAY OR CORNSTALKS, (rate per load)
Number Reporting # # # # 3 # # # 6
Average Rate - - - - 128.33 - - - 90.83
Range - - - - 85-200 - - - 35-200
Most Common - - - - - - - - -
Average Tons/ Load - - - 19.7 - - - 16.7
HAULING LARGE ROUND BALES HAY OR CORNSTALKS, (rate per loaded mile)
Number Reporting # # # # 6 # # 3 11
Average Rate - - - - 4.17 - - 4.50 5.00
Range - - - - 1.00-10.00 - - 4.00-5.00 1.00-10.00
Most Common - - - - 4.00 - - - 4.00
Average Tons/ Load - - - 18.2 - - - 15.8
- - - - - - - - - - - - - - - - - - - - - - - - - - - - All Units in Dollars Unless Specified - - - - - - - - - - - - - - - - - - - - - - - - - - - -
NEBRASKA AGRICULTURAL STATISTICS DISTRICTS
© The Board of Regents of the University of Nebraska. All rights reserved.
2020 NEBRASKA CUSTOM RATES - PART II
22

CUSTOM PRACTICE Northwest North Northeast Central East Southwest South Southeast STATE
MAKING SILAGE AND EARLAGE
CORN SILAGE (FIELD CHOPPING, HAULING, FILLING AND PACKING SILO), flat rate per ton
Number Reporting # # # # 3 # # # 6
Average Rate - - - - 40.33 - - - 25.67
Range - - - - 10-100 - - - 10-100
Most Common - - - - - - - - 10.00
ALFALFA SILAGE (FIELD CHOPPING, HAULING, FILLING AND PACKING SILO), flat rate per ton
Number Reporting # # # # # # # # 3
Average Rate - - - - - - - - 43.67
Range - - - - - - - - 11-100
Most Common - - - - - - - - -
CORN SILAGE (FIELD CHOPPING AND HAULING), flat rate per ton
Number Reporting # # # # 3 # # # 6
Average Rate - - - - 9.75 - - - 8.96
Range - - - - 9.25-10.00 - - - 8.00-10.00
Most Common - - - - 10.00 - - - 8.00
CORN SILAGE (FIELD CHOPPING ONLY), rate per hour
Number Reporting # # # # # # # # 5
Average Rate - - - - - - - - 350.00
Range - - - - - - - - 125-500
Most Common - - - - - - - - 500.00
CORN SILAGE (FIELD CHOPPING ONLY), rate per ton
Number Reporting # # # # # # # # 3
Average Rate - - - - - - - - 5.85
Range - - - - - - - - 5.00-7.00
Most Common - - - - - - - - -
ALFALFA (FIELD CHOPPING ONLY), rate per hour
Number Reporting # # # # # # # # 3
Average Rate - - - - - - - - 458.33
Range - - - - - - - - 375-500
Most Common - - - - - - - - 500.00
- - - - - - - - - - - - - - - - - - - - - - - - - - - - All Units in Dollars Unless Specified - - - - - - - - - - - - - - - - - - - - - - - - - - - -
NEBRASKA AGRICULTURAL STATISTICS DISTRICTS
© The Board of Regents of the University of Nebraska. All rights reserved.
2020 NEBRASKA CUSTOM RATES - PART II
23

CUSTOM PRACTICE Northwest North Northeast Central East Southwest South Southeast STATE
HAULING SILAGE
HAULING SILAGE FROM FIELD to SILO by TRUCK, rate per hour
Number Reporting # # 3 # # # # # 7
Average Rate - - 100.00 - - - - - 92.14
Range - - 100-100 - - - - - 45-100
Most Common - - 100 - - - - - 100
HAULING SILAGE FROM FIELD to SILO by TRUCK, rate per ton
Number Reporting # # # # 3 # # 4 7
Average Rate - - - - 3.67 - - 3.25 3.07
Range - - - - 3.00-4.50 - - 1.50-4.50 1.50-4.50
Most Common - - - - - - - 3.50 3.50
DISTANCE ADJUSTMENT WHEN HAULING SILAGE from SILO by TRUCK, additional rate per mile
Number Reporting # # # # 4 # # 3 7
Average Rate - - - - 1.21 - - 2.78 1.87
Range - - - - 0.25-4.00 - - 0.35-4.00 0.25-4.00
Most Common - - - - 0.25 - - 4.00 4.00
Average Miles - - - - 2 - - 1 2
PACKING SILAGE BAGS, rate per ton
Number Reporting # # # # # # # 3 3
Average Rate - - - - - - - 7.67 7.67
Range - - - - - - - 7.00-8.00 7.00-8.00
Most Common - - - - - - - 8.00 8.00
GRAIN or SEED HANDLING, STORAGE and MISCELLANEOUS OPERATIONS
GRAIN BIN STORAGE - MONTHLY RATE PER BUSHEL, AIR OR ELECTRIC CHARGE NOT INCLUDED
Number Reporting 3 # 4 # 10 3 # 4 22
Average Rate 0.02 - 0.07 - 0.03 0.04 - 0.03 0.04
Range 0.01-0.03 - 0.04-0.10 - 0.01-0.08 0.03-0.05 - 0.01-0.05 0.01-0.10
Most Common 0.03 - - - 0.02 - - - 0.04
GRAIN BIN STORAGE - MONTHLY RATE PER BUSHEL, WITH AIR OR ELECTRIC CHARGE INCLUDED
Number Reporting # # 4 # 9 3 # 6 23
Average Rate - - 0.06 - 0.05 0.03 - 0.03 0.04
Range - - 0.05-0.08 - 0.02-0.10 0.02-0.05 - 0.01-0.08 0.01-0.10
Most Common - - 0.05 - 0.05 - - 0.02 0.02
DRYING GRAIN, (EXCLUDE HAULING), PER POINT OF MOISTURE REMOVED, rate per bushel
Number Reporting # # # # 3 # # # 7
Average Rate - - - - 0.04 - - - 0.04
Range - - - - 0.04-0.05 - - - 0.03-0.05
Most Common - - - - - - - - 0.03
- - - - - - - - - - - - - - - - - - - - - - - - - - - - All Units in Dollars Unless Specified - - - - - - - - - - - - - - - - - - - - - - - - - - - -
NEBRASKA AGRICULTURAL STATISTICS DISTRICTS
© The Board of Regents of the University of Nebraska. All rights reserved.
2020 NEBRASKA CUSTOM RATES - PART II
24

CUSTOM PRACTICE Northwest North Northeast Central East Southwest South Southeast STATE
ELEVATING GRAIN (ON FARM), rate per bushel
Number Reporting # # 3 # 5 # # 3 11
Average Rate - - 0.04 - 0.05 - - 0.03 0.05
Range - - 0.02-0.06 - 0.02-0.07 - - 0.02-0.06 0.02-0.12
Most Common - - - - 0.05 - - 0.02 0.05
BAGGING SHELLED CORN, rate per bushel
Number Reporting # # # # # # # # 4
Average Rate - - - - - - - - 0.07
Range - - - - - - - - 0.05-0.10
Most Common - - - - - - - - -
UNLOADING SHELLED CORN IN BAG, rate per bushel
Number Reporting # # # # # # # # 4
Average Rate - - - - - - - - 0.09
Range - - - - - - - - 0.06-0.10
Most Common - - - - - - - - 0.10
CLEANING WHEAT SEED OR SMALL GRAIN SEED, (no treatment), rate per bushel
Number Reporting # # # # # # # # 4
Average Rate - - - - - - - - 1.03
Range - - - - - - - - 0.91-1.20
Most Common - - - - - - - - 1.00
TREATING WHEAT SEED OR SMALL GRAIN SEED, (include cost of chemical treatment), rate per bushel
Number Reporting # # # # # # # # 4
Average Rate - - - - - - - - 7.22
Range - - - - - - - - 3.88-13.00
Most Common - - - - - - - - -
TREATING SOYBEANS SEED GRAIN (include cost of chemical treatment), rate per bushel
Number Reporting # # # # # # # # 6
Average Rate - - - - - - - - 12.21
Range - - - - - - - - 10.00-15.00
Most Common - - - - - - - - 11.00
HAULING LIVESTOCK
HAULING CATTLE BY SEMI-TRAILER TRUCK (average load 52,143 lbs), rate per loaded mile
Number Reporting 3 # # # 6 # # # 11
Average Rate 4.33 - - - 4.05 - - - 3.80
Range 4.00-5.00 - - - 1.35-6.94 - - - 1.35-6.94
Most Common 4.00 - - - 4.00 - - - 4.00
HAULING CATTLE BY GOOSED-NECKED STOCK TRAILER (average load 15,250 lbs), rate per loaded mile
Number Reporting # # # # 3 # # # 8
Average Rate - - - - 2.42 - - - 2.81
Range - - - - 2.00-3.00 - - - 2.00-5.00
Most Common - - - - - - - - 2.00
NEBRASKA AGRICULTURAL STATISTICS DISTRICTS
- - - - - - - - - - - - - - - - - - - - - - - - - - - - All Units in Dollars Unless Specified - - - - - - - - - - - - - - - - - - - - - - - - - - - -
© The Board of Regents of the University of Nebraska. All rights reserved.
2020 NEBRASKA CUSTOM RATES - PART II
25

CUSTOM PRACTICE Northwest North Northeast Central East Southwest South Southeast STATE
WASTE HANDLING
LOADING SOLID MANURE, rate per hour
Number Reporting # # # # # # # # 4
Average Rate - - - - - - - - 82.50
Range - - - - - - - - 50-100
Most Common - - - - - - - - 90.00
SPREADING SOLID MANURE, rate per hour
Number Reporting # # # # # # # # 3
Average Rate - - - - - - - - 106.67
Range - - - - - - - - 80-140
Most Common - - - - - - - - -
LOADING & SPREADING SOLID MANURE, rate per hour
Number Reporting # # 3 # # # # # 6
Average Rate - - 183.33 - - - - - 150.00
Range - - 120-250 - - - - - 50-250
Most Common - - - - - - - - 150.00
FENCING, TRENCHING, MOWING
BUILDING NEW FENCE (LABOR CHARGE ONLY FOR BUILDING 4 STRAND BARBED /WOOD POSTS), rate per hour
Number Reporting # # # # # # # # 3
Average Rate - - - - - - - - 25.00
Range - - - - - - - - 15.00-40.00
Most Common - - - - - - - - -
BUILDING NEW FENCE (LABOR CHARGE ONLY FOR BUILDING 4 STRAND BARBED /WOOD POSTS, rate per foot
Number Reporting # # # # # # # # 3
Average Rate - - - - - - - - 1.82
Range - - - - - - - - 1.00-2.45
Most Common - - - - - - - - -
TRENCHING, rate per foot
Number Reporting # # # # 3 # # # 6
Average Rate - - - - 1.60 - - - 1.80
Range - - - - 0.80-3.00 - - - 0.80-3.00
Most Common - - - - - - - - 2.00
NEBRASKA AGRICULTURAL STATISTICS DISTRICTS
- - - - - - - - - - - - - - - - - - - - - - - - - - - - All Units in Dollars Unless Specified - - - - - - - - - - - - - - - - - - - - - - - - - - - -
© The Board of Regents of the University of Nebraska. All rights reserved.
2020 NEBRASKA CUSTOM RATES - PART II
26

CUSTOM PRACTICE Northwest North Northeast Central East Southwest South Southeast STATE
CLEARING CEDAR TREES, rate per hour
Number Reporting # # 3 # 4 # # 8 16
Average Rate - - 123.33 - 70.00 - - 99.38 94.69
Range - - 50-200 - 50.00-95.00 - - 40-150 20-200
Most Common - - - - 50.00 - - 100.00 100.00
MOWING GRASS (CRP OR PASTURE), rate per hour
Number Reporting # # # # # # # 3 5
Average Rate - - - - - - - 110.00 112.00
Range - - - - - - - 90-140 80-150
Most Common - - - - - - - - -
MOWING GRASS (CRP OR PASTURE), rate per acre
Number Reporting # # # # 3 # # # 6
Average Rate - - - - 38.33 - - - 27.17
Range - - - - 15.00-75.00 - - - 8.00-75.00
Most Common - - - - - - - - 25.00
CHECKING PIVOTS, CLOSING TRACKS, SKID STEER and TRACTOR RENTAL RATES
CHECKING PIVOTS DURING IRRIGATION SEASON, rate per hour
Number Reporting # # # # 4 # # # 6
Average Rate - - - - 20.00 - - - 23.33
Range - - - - 10.00-30.00 - - - 10.00-40.00
Most Common - - - - - - - - -
CHECKING PIVOTS DURING IRRIGATION SEASON, rate per acre
Number Reporting # # # # 9 # # 3 16
Average Rate - - - - 10.78 - - 9.17 10.13
Range - - - - 2.00-20.00 - - 7.50-12.00 2.00-20.00
Most Common - - - - 10.00 - - - 10.00
CLOSING PIVOT TRACKS, rate per hour
Number Reporting # # # # 4 # # 3 11
Average Rate - - - - 52.25 - - 66.67 65.82
Range - - - - 9-125 - - 50-100 9-125
Most Common - - - - - - - 50.00 50.00
CLOSING PIVOT TRACKS, rate per pivot
Number Reporting # # # # 4 # # # 11
Average Rate - - - - 168.75 - - - 171.36
Range - - - - 75-250 - - - 60-500
Most Common - - - - 250.00 - - - 100.00
NEBRASKA AGRICULTURAL STATISTICS DISTRICTS
- - - - - - - - - - - - - - - - - - - - - - - - - - - - All Units in Dollars Unless Specified - - - - - - - - - - - - - - - - - - - - - - - - - - - -
© The Board of Regents of the University of Nebraska. All rights reserved.
2020 NEBRASKA CUSTOM RATES - PART II
27

CUSTOM PRACTICE Northwest North Northeast Central East Southwest South Southeast STATE
SKID STEER LOADER RENT, (EXCLUDE FUEL & OPERATOR), rate per metered hour
Number Reporting # # # # 6 # # 4 10
Average Rate - - - - 57.50 - - 68.75 59.00
Range - - - - 35.00-85.00 - - 40.00-85.00 35.00-85.00
Most Common - - - - 35.00 - - 75.00 55.00
TRACTOR RENT, TRACTOR ONLY (EXCLUDE FUEL AND OPERATOR), 70-89 H.P., rate per metered hour
Number Reporting # # # # 3 # # # 4
Average Rate - - - - 47.00 - - - 44.00
Range - - - - 18.00-85.00 - - - 18.00-85.00
Most Common - - - - - - - - -
TRACTOR RENT, TRACTOR ONLY (EXCLUDE FUEL AND OPERATOR), 90-109 H.P., rate per metered hour
Number Reporting # # # # 3 # # # 4
Average Rate - - - - 50.00 - - - 48.75
Range - - - - 22.00-85.00 - - - 22.00-85.00
Most Common - - - - - - - - -
TRACTOR RENT, TRACTOR ONLY (EXCLUDE FUEL AND OPERATOR), 110-149 H.P., rate per metered hour
Number Reporting # # # # # # # # 6
Average Rate - - - - - - - - 72.50
Range - - - - - - - - 30-125
Most Common - - - - - - - - -
TRACTOR RENT, TRACTOR ONLY (EXCLUDE FUEL AND OPERATOR), 150-199 PTO H.P., rate per metered hour
Number Reporting # # # # # # # # 7
Average Rate - - - - - - - - 55.00
Range - - - - - - - - 30-130
Most Common - - - - - - - - 35.00
TRACTOR RENT, TRACTOR ONLY (EXCLUDE FUEL AND OPERATOR), 200 & ABOVE PTO H.P., rate per metered hour
Number Reporting # # # # 3 # # 3 9
Average Rate - - - - 73.33 - - 110.00 82.78
Range - - - - 45-125 - - 40-150 40-150
Most Common - - - - - - - - 50.00
NEBRASKA AGRICULTURAL STATISTICS DISTRICTS
- - - - - - - - - - - - - - - - - - - - - - - - - - - - All Units in Dollars Unless Specified - - - - - - - - - - - - - - - - - - - - - - - - - - - -
© The Board of Regents of the University of Nebraska. All rights reserved.
2020 NEBRASKA CUSTOM RATES - PART II
28

CUSTOM PRACTICE Northwest North Northeast Central East Southwest South Southeast STATE
CUSTOM OPERATOR INFORMATION
ACRES COVERED PER YEAR IN CUSTOM WORK
Number Reporting 18 9 24 14 55 11 11 61 172
Average Acres 3,325 2,786 5,397 2,584 9,994 38,827 38,355 8,062 5,322
Range 80-20,000 20-12,000 25-90,000 55-18,000 50-400,000 100-400,000 300-400,000 50-400,000 20-400,000
HOURS SPENT PER YEAR ON CUSTOM WORK OPERATIONS
Number Reporting 10 6 20 7 41 10 10 38 119
Average Hours 846.30 917.33 439.60 520.71 1033.66 2280.30 2249.00 798.87 571.04
Range 10-3,000 4-2,500 5-3,000 25-2,500 10-20,000 5-20,000 40-20,000 7-20,000 4-20,000
LABOR RATE
AVERAGE LABOR RATE ASSUMED OR INCLUDED IN CUSTOM RATES, rate per hour
Number Reporting 11 8 20 9 39 8 9 41 123
Average Rate 20.05 18.50 21.45 22.33 19.87 18.88 18.67 18.17 19.35
Range 14.00-30.00 15.00-25.00 12.00-50.00 15.00-50.00 10.00-50.00 15.00-25.00 12.00-25.00 10.00-55.00 10.00-55.00
Most Common 20.00 15.00 20.00 15.00 20.00 15.00 20.00 20.00 20.00
DIESEL COST
EXPECTED FARM DELIVERED DIESEL FUEL COST IN 2020, price per gallon
Number Reporting 14 6 22 10 41 10 11 42 133
Average Price 2.17 1.86 2.13 2.07 2.04 2.04 2.08 2.17 2.12
Range 1.80-2.75 1.60-2.35 1.30-3.00 1.60-2.70 1.00-3.30 1.60-2.62 1.60-3.00 1.20-3.30 1.00-3.30
Most Common 2.20 1.60 2.00 2.00 2.00 1.80 1.80 2.00 2.00
NEBRASKA AGRICULTURAL STATISTICS DISTRICTS
- - - - - - - - - - - - - - - - - - - - - - - - - - - - All Units in Dollars Unless Specified - - - - - - - - - - - - - - - - - - - - - - - - - - - -
© The Board of Regents of the University of Nebraska. All rights reserved.
2020 NEBRASKA CUSTOM RATES - PART II
29