Embed Size (px)
Citation preview

2012 Hawai`i Annual Adult Community Mental Health Services Consumer Satisfaction Survey
Adult Mental Health Division
Prepared By: Judith M. Clarke, M.S.A, Stacy K.Y. Haitsuka, M.P.A., M.P.H, Chad Sakagawa, B.A., John J. Steffen, Ph.D. The authors would like to thank the Administrators, Managers and staff of the Community Mental Health Centers and Purchase of Service Providers for their assistance and cooperation in conducting this statewide survey.

2
EXECUTIVE SUMMARY This report details the statewide results of the FY2013 Hawai`i Annual Adult Community Mental Health Services Consumer Survey administered from August 1, 2012 through October 12, 2012. A total of 673 consumers were randomly selected to participate in this survey from among those who had received at least one Adult Mental Health Division (AMHD) funded clinical or case management service at a Community Mental Health Center (CMHC) or Purchase of Service Provider (POS) during the first half of FY20112. Of those, 69 were unreachable, 304 refused or did not respond, and 300 completed a valid survey yielding a response rate of 50% (Table 1). Among the larger providers, those with the highest response rates were: Kalihi-Palama Health Center (88%) and North Shore Mental Health (83%). Among the CMHCs, those with the highest response rates were: Windward Oahu (70%), Central Oahu (65%), and East Hawaii (56%). The survey instrument is used by mental health programs throughout the United States and is endorsed by the Substance Abuse Mental Services Administration’s (SAMHSA) Mental Health Statistics Improvement Program (MHSIP). Survey results are incorporated annually into SAMHSA’s Community Block Grant initiative, which is comprised of National Outcome Measures (NOMS) and the related Universal Reporting System (URS) tables. The survey instrument includes 39 statements addressing eight domains: 1) Satisfaction with Services; 2) Access to Services; 3) Appropriateness of Services; 4) Participation in Treatment Planning; 5) Outcomes of Services; 6) Functioning; 7) Social Connectedness; and four statements added to the survey by the State of Hawai`i. Participants rate each statement on a five-point scale ranging from “Strongly Agree,” “Agree,” “Neutral,” “Disagree,” to “Strongly Disagree.” For the past three years, results showed that consumers were more satisfied with culturally appropriate services, service appropriateness and quality than they were with the outcomes as a result of receiving services or their level of functioning. They rated most positively those factors related to their interaction with clinicians (i.e., Appropriateness of Services, Satisfaction with Services), but indicated less satisfaction with domains that relate directly to their day-to-day lives (i.e., Functioning, Outcomes, and Social Connectedness). This report also examines consumer responses based on sex, age, and diagnosis.

3
Adult Survey Highlights
• Participating providers: 15 • Surveys distributed: 673 surveys • Gender: 161 Males 129 Females 10 (not specified) • Survey Response Rate: 300 surveys (50%) **
Scale Scores*
• Hawai‘i specific questions: 93% • Appropriateness/Quality of Services: 92% • Access to Services: 90% • Satisfaction with Services: 90% • Participation in Treatment Planning: 84% • Functioning: 80% • Improved Outcomes from Services: 79% • Social Connectedness: 72%
*Scale Scores = For each item of the eight domains, the frequency of responses was calculated based on the cumulative percent of positive responses “Strongly Agree” and “Agree.” For example, a score of 89% indicates that the sample either strongly agreed or agreed with the statement. ** It should be noted that the response rate for the FY2012 sample was significantly lower than previous years in part because the Community Mental Health Centers were tasked with completing surveys for both this annual survey initiative and for a larger survey sample during the same period.

4
TABLE OF CONTENTS
INTRODUCTION ................................................................................................................................. 5
Table 1. 2010-2012 Comparison of Response Rate for Consumers Served by AMHD ........................ 6
Table 2. Percentage of Responders Reporting Positively on the Eight Domain Scores by Survey Year
................................................................................................................................... 7
Table 3. Hawai`i Adult Community Mental Health Consumer Survey Response Rates – Purchase of Service Providers by Survey Year ................................................................................. 8
Table 4. 2010-2012 Hawai`i Adult Community Mental Health Consumer Survey Response Rates – Community Mental Health Centers ............................................................................. 9
METHOD ......................................................................................................................................... 10
PROCEDURE ................................................................................................................................. 11
RESULTS ................................................................................................................................. 12
Table 5. 2010-2012 Domain Scores by Gender: Male ..................................................................... 13
Table 6. 2010-2012 Domain Scores by Gender: Female................................................................... 14
Table 7. 2010-2012 Domain Scores by Age: 18-34 ......................................................................... 15
Table 8. 2010-2012 Domain Scores by Age: 35-64 .......................................................................... 16
Table 9. 2010-2012 Domain Scores by Age: 65+ ............................................................................ 17
Table 10. 2010-2012 Domain Scores by Age: Age not Available ....................................................... 18
Table 11. 2010-2012 Domain Scores by Diagnosis: Schizophrenia and Related Disorders ................ 19
Table 12. 2010-2012 Domain Scores by Diagnosis: Bipolar and Mood Disorders ............................ 20
DISCUSSION ................................................................................................................................. 21
REFERENCES ................................................................................................................................. 21
Appendix A. Hawai`i Mental Health Services Consumer Survey 2012 .............................................. 22
Appendix B. Overview of the Eight Domains Addressed by the 2012 Hawai`i Adult Community Mental Health Consumer Survey ............................................................................... 27
Appendix C. Rank-Order Analysis of Positive Individual Item ........................................................... 29
Appendix D. Rank-Order Analysis of Negative Individual Item ......................................................... 31

5
INTRODUCTION The Adult Mental Health Division (AMHD) is committed to the inclusion of consumer participation at multiple levels of its services. One way to meet this goal is through the Mental Health Statistics Improvement Project (MHSIP) Consumer Survey. The AMHD surveys consumers across the State of Hawai`i on an annual basis. The present report summarizes the results of the FY2012 annual consumer satisfaction survey of randomly selected consumers including some who were discharged during the 2012 fiscal year. The survey compares FY2012 survey data with FY2011 and FY2010 survey data. Background The FY2012 Hawai`i Adult Community Mental Health Consumer Survey (HACMHCS) was distributed to 673 randomly selected consumers who had received at least one treatment or case management service from state-operated Community Mental Health Center (CMHC) or purchase of service (POS) provider between July 1 and December 31, 2011. To help improve response rates, the case management leads coordinated survey distribution, completion, and return within their CMHC or POS agency. As a result, 300 surveys were completed. Consumers unable to attend the meet and greet (including those who had been discharged) were sent their survey through the mail.
Analysis of Response Rates
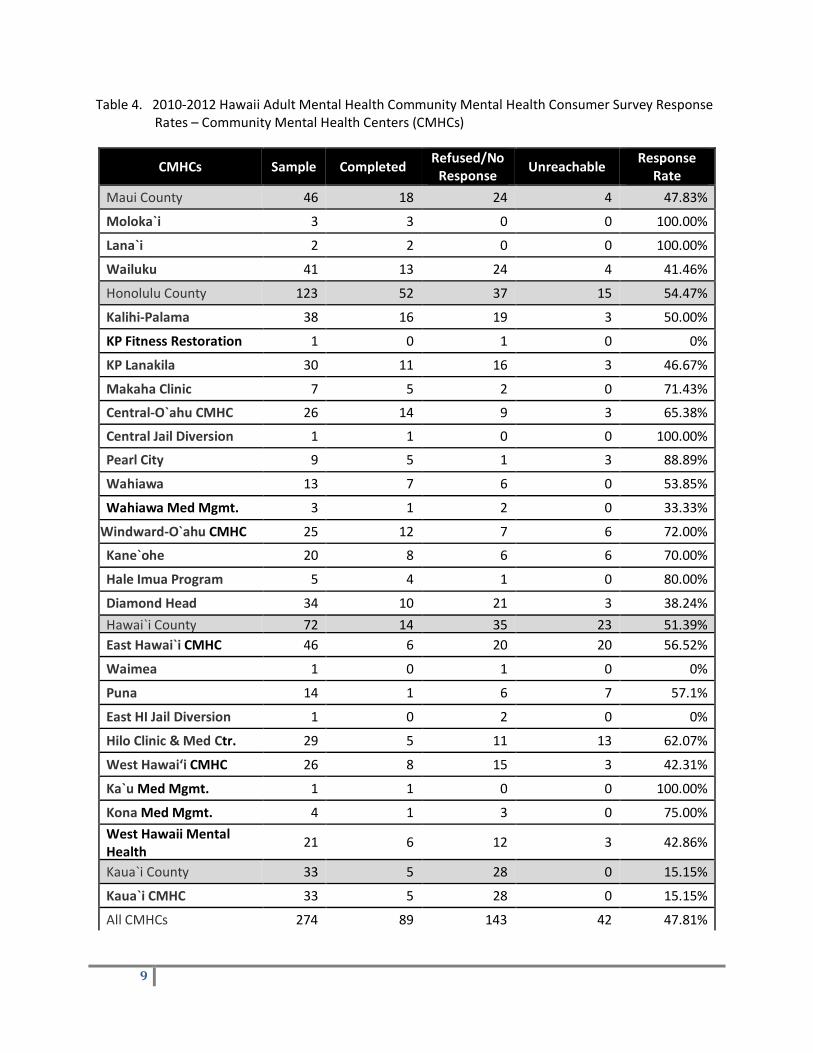
In Tables 3 and 4, both CMHCs and POS providers are ranked in order from highest response rates to lowest. Response rates are based on completed surveys/contact made and not the initial sample selected. In other words, consumers who did not have the opportunity to refuse to fill out a survey were not counted as having responded. Overall, the POS providers had a higher response rate than the CMHCs. Appendix A, shows the statements used to assess each domain and the sequence (number of the statements) in which they appear in the survey instrument. Consumers were asked to rate their agreement or disagreement with each statement using a 5-point Likert-type scale which includes “Strongly Agree,” “Agree,” “Neutral,” “Disagree” and “Strongly Disagree” with an option of “Does Not Apply.” Lower scores indicate higher levels of agreement with statements, which translate to more favorable perceptions of services provided. The General Satisfaction with Services domain is covered in the first three statements and the Access domain includes statements four through nine. There are nine statements within the Appropriateness domain (statements 10, 12 to 16, 18 to 20), two statements within the Treatment Planning domain (statements 11 and 17), eight statements within the Outcomes domain (statements 24 to 31), four statements within the Functioning domain (statements 32 to 35), four statements within the Social Connectedness domain (statements 36 to 39), and, lastly, three statements within the Hawai`i-specific domain (statements 21 to 23).

6
Table 1. 2010-2012 Comparison of Response Rates1 for Consumers Served by AMHD
Statewide 2010
Sample Completed Refused/No Response Unreachable Response Rate
CMHCs 467 230 132 105 63.5%
POS 333 383 131 49 53.9%
Total 800 443 263 154 59.3%
Statewide 2011
Sample Completed Refused/No Response Unreachable Response Rate
CMHCs 286 166 83 37 66.7%
POS 446 277 94 75 74.7%
Total 732 443 177 112 71.5%
Statewide 2012
Sample Completed Refused/No Response Unreachable Response Rate
CMHCs 274 89 143 42 38.4%
POS 399 211 161 27 56.7%
Total 673 300 304 69 49.7%
1 Response rate is the quotient of the number of completed surveys divided by the number of consumers who were contacted (i.e. list of consumers minus the number who were unreachable).

7
Table 2. Percentage of Responders Reporting Positively on the Eight Domain Scores by Survey Year
Statewide 2010 2011 2012 Hawaii-Specific 91.0% 90.8% 93.2% Appropriateness 90.5% 92.2% 91.8% Satisfaction 88.3% 87.7% 90.3% Treatment Planning 83.8% 85.9% 84.3% Access 82.4% 89.6% 90.2% Functioning 79.5% 81.1% 79.5% Treatment Outcomes 76.6% 79.9% 78.9% Social Connectedness 70.2% 71.7% 72.0%

8
Table 3. Hawai`i Adult Community Mental Health Consumer Survey Response Rates – Purchase of Service Providers (POS) by Survey Year
2 For 2011, CARE Hawaii, Inc. surveys were combined with CARE Hawaii CBCM.
POS 2010 2011 2012 Aloha House 80.6% 76.5% 0% APS Healthcare, Inc. 50.0% 66.7% n/a CARE Hawaii, CBCM 54.7% 76.1% 65.5% 2CARE Hawaii, Inc. 47.1% * * Community Empowerment Services
50.0% 80.8% 47.1%
Helping Hands Hawaii 61.1% 83.3% 39.1% Kalihi-Palama Health Center 50.0% 100.0% 87.5% Mental Health Kokua 100.0% 100.0% 32.0% North Shore Mental Health 81.8% 90.5% 83.2% The Institute for Human Services 33.3% 71.4% 13.1%
Total POS 63.5% 74.7% 56.72%
9
Table 4. 2010-2012 Hawaii Adult Mental Health Community Mental Health Consumer Survey Response Rates – Community Mental Health Centers (CMHCs)
CMHCs Sample Completed Refused/No Response Unreachable Response
Rate Maui County 46 18 24 4 47.83% Moloka`i 3 3 0 0 100.00% Lana`i 2 2 0 0 100.00% Wailuku 41 13 24 4 41.46% Honolulu County 123 52 37 15 54.47% Kalihi-Palama 38 16 19 3 50.00% KP Fitness Restoration 1 0 1 0 0% KP Lanakila 30 11 16 3 46.67% Makaha Clinic 7 5 2 0 71.43% Central-O`ahu CMHC 26 14 9 3 65.38% Central Jail Diversion 1 1 0 0 100.00% Pearl City 9 5 1 3 88.89% Wahiawa 13 7 6 0 53.85% Wahiawa Med Mgmt. 3 1 2 0 33.33%
Windward-O`ahu CMHC 25 12 7 6 72.00% Kane`ohe 20 8 6 6 70.00% Hale Imua Program 5 4 1 0 80.00% Diamond Head 34 10 21 3 38.24% Hawai`i County 72 14 35 23 51.39% East Hawai`i CMHC 46 6 20 20 56.52% Waimea 1 0 1 0 0% Puna 14 1 6 7 57.1% East HI Jail Diversion 1 0 2 0 0% Hilo Clinic & Med Ctr. 29 5 11 13 62.07% West Hawai‘i CMHC 26 8 15 3 42.31% Ka`u Med Mgmt. 1 1 0 0 100.00% Kona Med Mgmt. 4 1 3 0 75.00% West Hawaii Mental Health 21 6 12 3 42.86%
Kaua`i County 33 5 28 0 15.15% Kaua`i CMHC 33 5 28 0 15.15% All CMHCs 274 89 143 42 47.81%
10
METHOD
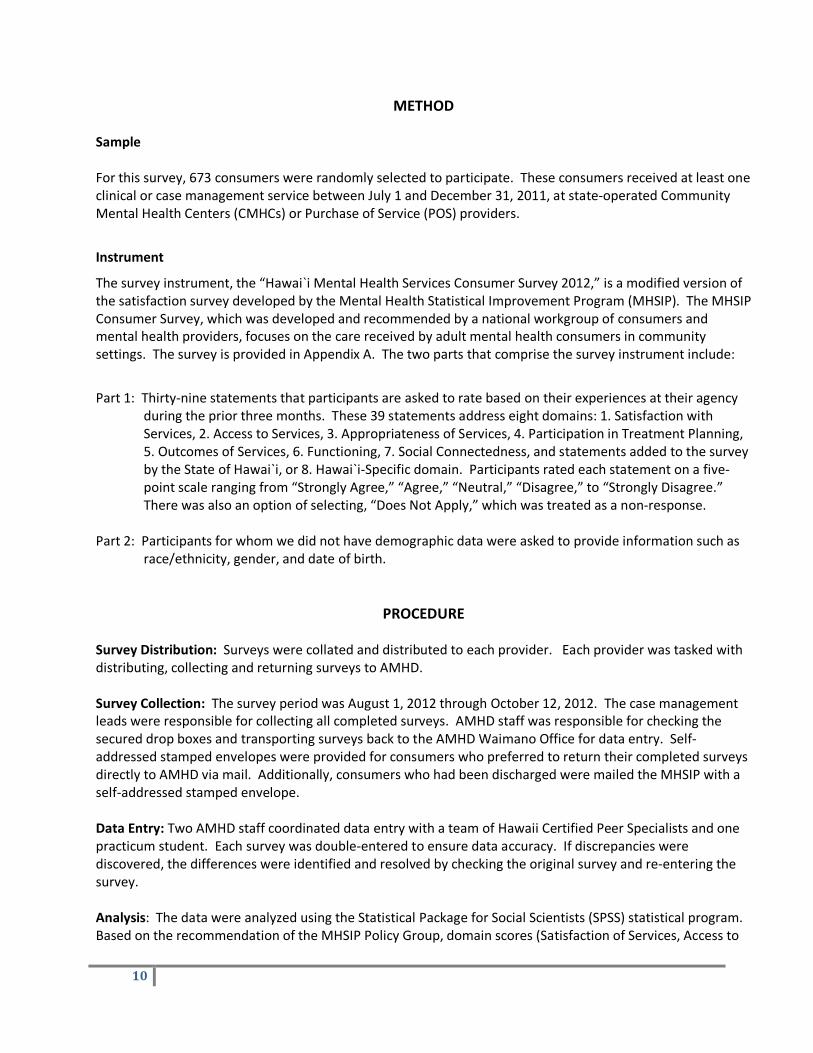
Sample For this survey, 673 consumers were randomly selected to participate. These consumers received at least one clinical or case management service between July 1 and December 31, 2011, at state-operated Community Mental Health Centers (CMHCs) or Purchase of Service (POS) providers.
Instrument
The survey instrument, the “Hawai`i Mental Health Services Consumer Survey 2012,” is a modified version of the satisfaction survey developed by the Mental Health Statistical Improvement Program (MHSIP). The MHSIP Consumer Survey, which was developed and recommended by a national workgroup of consumers and mental health providers, focuses on the care received by adult mental health consumers in community settings. The survey is provided in Appendix A. The two parts that comprise the survey instrument include:
Part 1: Thirty-nine statements that participants are asked to rate based on their experiences at their agency during the prior three months. These 39 statements address eight domains: 1. Satisfaction with Services, 2. Access to Services, 3. Appropriateness of Services, 4. Participation in Treatment Planning, 5. Outcomes of Services, 6. Functioning, 7. Social Connectedness, and statements added to the survey by the State of Hawai`i, or 8. Hawai`i-Specific domain. Participants rated each statement on a five-point scale ranging from “Strongly Agree,” “Agree,” “Neutral,” “Disagree,” to “Strongly Disagree.” There was also an option of selecting, “Does Not Apply,” which was treated as a non-response.
Part 2: Participants for whom we did not have demographic data were asked to provide information such as
race/ethnicity, gender, and date of birth.
PROCEDURE Survey Distribution: Surveys were collated and distributed to each provider. Each provider was tasked with distributing, collecting and returning surveys to AMHD. Survey Collection: The survey period was August 1, 2012 through October 12, 2012. The case management leads were responsible for collecting all completed surveys. AMHD staff was responsible for checking the secured drop boxes and transporting surveys back to the AMHD Waimano Office for data entry. Self-addressed stamped envelopes were provided for consumers who preferred to return their completed surveys directly to AMHD via mail. Additionally, consumers who had been discharged were mailed the MHSIP with a self-addressed stamped envelope. Data Entry: Two AMHD staff coordinated data entry with a team of Hawaii Certified Peer Specialists and one practicum student. Each survey was double-entered to ensure data accuracy. If discrepancies were discovered, the differences were identified and resolved by checking the original survey and re-entering the survey. Analysis: The data were analyzed using the Statistical Package for Social Scientists (SPSS) statistical program. Based on the recommendation of the MHSIP Policy Group, domain scores (Satisfaction of Services, Access to
11
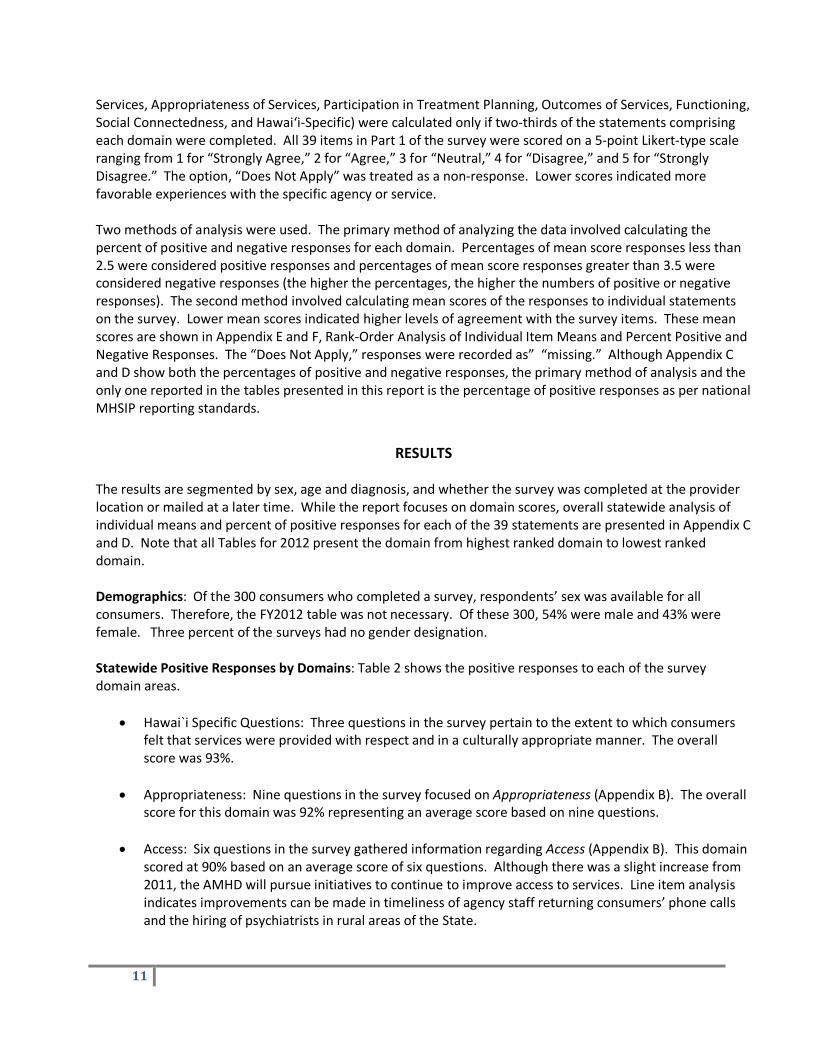
Services, Appropriateness of Services, Participation in Treatment Planning, Outcomes of Services, Functioning, Social Connectedness, and Hawai‘i-Specific) were calculated only if two-thirds of the statements comprising each domain were completed. All 39 items in Part 1 of the survey were scored on a 5-point Likert-type scale ranging from 1 for “Strongly Agree,” 2 for “Agree,” 3 for “Neutral,” 4 for “Disagree,” and 5 for “Strongly Disagree.” The option, “Does Not Apply” was treated as a non-response. Lower scores indicated more favorable experiences with the specific agency or service. Two methods of analysis were used. The primary method of analyzing the data involved calculating the percent of positive and negative responses for each domain. Percentages of mean score responses less than 2.5 were considered positive responses and percentages of mean score responses greater than 3.5 were considered negative responses (the higher the percentages, the higher the numbers of positive or negative responses). The second method involved calculating mean scores of the responses to individual statements on the survey. Lower mean scores indicated higher levels of agreement with the survey items. These mean scores are shown in Appendix E and F, Rank-Order Analysis of Individual Item Means and Percent Positive and Negative Responses. The “Does Not Apply,” responses were recorded as” “missing.” Although Appendix C and D show both the percentages of positive and negative responses, the primary method of analysis and the only one reported in the tables presented in this report is the percentage of positive responses as per national MHSIP reporting standards.
RESULTS
The results are segmented by sex, age and diagnosis, and whether the survey was completed at the provider location or mailed at a later time. While the report focuses on domain scores, overall statewide analysis of individual means and percent of positive responses for each of the 39 statements are presented in Appendix C and D. Note that all Tables for 2012 present the domain from highest ranked domain to lowest ranked domain.
Demographics: Of the 300 consumers who completed a survey, respondents’ sex was available for all consumers. Therefore, the FY2012 table was not necessary. Of these 300, 54% were male and 43% were female. Three percent of the surveys had no gender designation. Statewide Positive Responses by Domains: Table 2 shows the positive responses to each of the survey domain areas.
• Hawai`i Specific Questions: Three questions in the survey pertain to the extent to which consumers felt that services were provided with respect and in a culturally appropriate manner. The overall score was 93%.
• Appropriateness: Nine questions in the survey focused on Appropriateness (Appendix B). The overall
score for this domain was 92% representing an average score based on nine questions.
• Access: Six questions in the survey gathered information regarding Access (Appendix B). This domain scored at 90% based on an average score of six questions. Although there was a slight increase from 2011, the AMHD will pursue initiatives to continue to improve access to services. Line item analysis indicates improvements can be made in timeliness of agency staff returning consumers’ phone calls and the hiring of psychiatrists in rural areas of the State.

12
• Satisfaction: Three questions were asked in the survey to ascertain Satisfaction (Appendix B). The overall score for this domain was 90% which is an average score based on the three questions.
• Treatment Planning: The survey comprised two questions to indicate Treatment Planning (Appendix B). The overall score for this domain was 84%. There was an increase in the domain score from 2010.
• Functioning: Five questions indicate respondent’s impressions of Functioning (Appendix B). The overall score for this domain was 80%. The Functioning score decreased slightly compared to the 2011 score. AMHD will continue to implement initiatives to improve this domain.
• Treatment Outcomes: Eight questions were asked to get consumers’ perceptions on Outcome (Appendix C). The overall score for this domain was 79%.
• Social Connectedness: Four questions were asked in the survey to ascertain Social Connectedness (Appendix B). The score for this domain was 72%. Social Connectedness continues to lag behind other domains. Areas for improvement include opportunities to increase a sense of belonging for consumers in their communities. United Self Help, a group in Honolulu which is run by consumers, has increased social activities for consumers and has increased their efforts in advertising these activities. Anecdotally, many consumers attend these activities, which are encouraged through word- of-mouth.
Statewide, consumers reported positively in most domain areas; however, a historic pattern was repeated again this year showing that consumers were more satisfied with service provision and cultural appropriateness rather than with the outcomes of their services. Further, consumers rated most positively on factors related to their interaction with clinicians (i.e., Appropriateness of Services, Satisfaction), and gave slightly lower marks to the treatment planning which should involve both clinicians and consumers while giving the lowest marks to measures that relate directly to their lives (i.e., Outcomes, Functioning, and Social Connectedness). Survey findings will continue to guide the AMHD’s ongoing efforts to improve the quality of mental health services for adults, while expanding existing services.

13
SEX
Tables five through six, report the MHSIP positive responses by sex. Results show that over the three-year period, females like males have responded more positively on the services they receive, and focus less on their own daily functioning. Table 5. 2010-2012 Domain Scores by Gender - Male
Statewide 2010 2011 2012 Hawaii-Specific 92.4% 89.6% 91.4% Appropriateness 93.4% 90.2% 90.2% Satisfaction 89.5% 85.5% 89.0% Treatment Planning 83.1% 85.3% 81.1% Access 83.9% 87.7% 91.5% Functioning 84.1% 81.3% 81.1% Treatment Outcomes 79.3% 78.8% 76.1% Social Connectedness 75.4% 69.0% 70.5%

14
Table 6. 2010-2012 Domain Scores by Gender, Female
Statewide 2010 2011 2012 Hawaii-Specific 89.9% 92.2% 95.5% Appropriateness 88.2% 94.6% 93.8% Satisfaction 87.9% 90.2% 91.7% Treatment Planning 85.2% 86.7% 88.2% Access 80.9% 91.7% 88.5% Functioning 75.8% 80.8% 77.3% Treatment Outcomes 75.6% 81.2% 82.5% Social Connectedness 65.4% 74.9% 73.6%
15
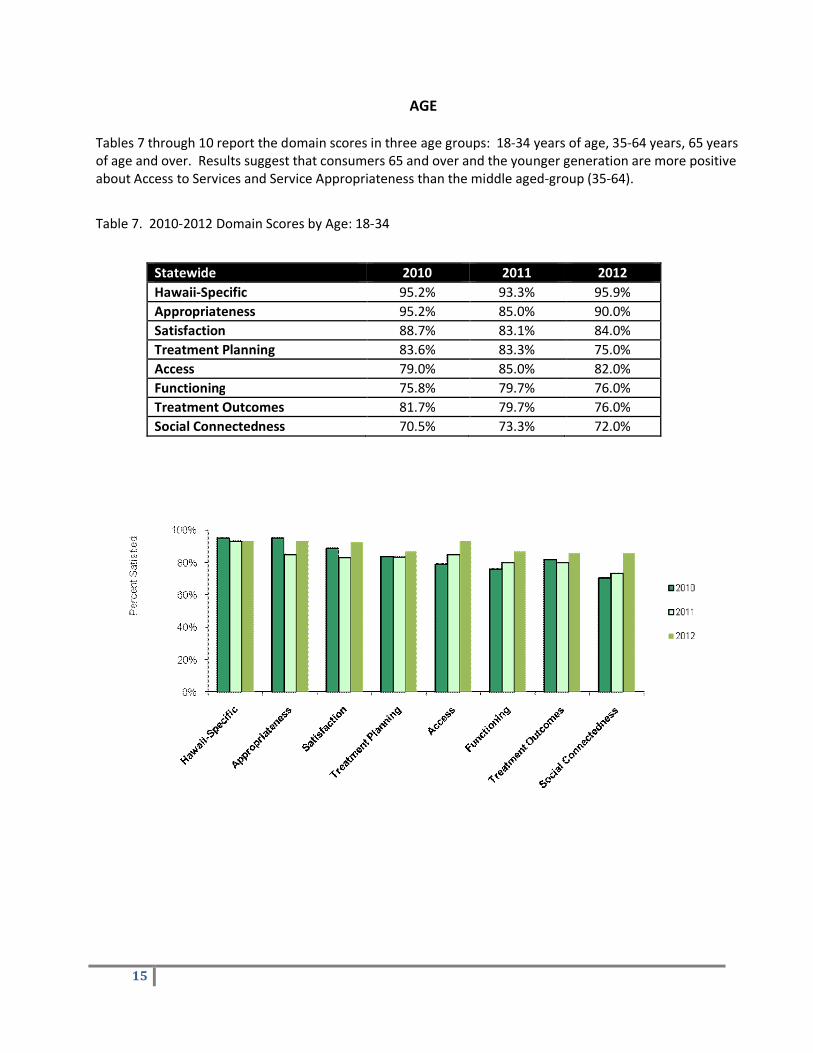
AGE Tables 7 through 10 report the domain scores in three age groups: 18-34 years of age, 35-64 years, 65 years of age and over. Results suggest that consumers 65 and over and the younger generation are more positive about Access to Services and Service Appropriateness than the middle aged-group (35-64).
Table 7. 2010-2012 Domain Scores by Age: 18-34
Statewide 2010 2011 2012 Hawaii-Specific 95.2% 93.3% 95.9% Appropriateness 95.2% 85.0% 90.0% Satisfaction 88.7% 83.1% 84.0% Treatment Planning 83.6% 83.3% 75.0% Access 79.0% 85.0% 82.0% Functioning 75.8% 79.7% 76.0% Treatment Outcomes 81.7% 79.7% 76.0% Social Connectedness 70.5% 73.3% 72.0%

16
Table 8. 2010-2012 Domain Scores by Age: 35-64
Statewide 2010 2011 2012 Hawaii-Specific 90.3% 90.4% 92.7% Appropriateness 89.2% 89.2% 92.1% Satisfaction 89.1% 87.9% 91.5% Treatment Planning 83.4% 86.1% 86.2% Access 82.1% 89.2% 91.8% Functioning 80.4% 81.4% 79.7% Treatment Outcomes 76.1% 80.7% 79.2% Social Connectedness 69.1% 71.2% 71.2%

17
Table 9. 2010-2012 Domain Scores by Age: 65+
Statewide 2010 2011 2012 Hawaii-Specific 90.3% 94.6% 93.3% Appropriateness 96.6% 100.0% 93.3% Satisfaction 86.7% 94.6% 92.9% Treatment Planning 93.1% 94.6% 86.7% Access 90.0% 100.0% 93.3% Functioning 82.8% 83.8% 86.7% Treatment Outcomes 81.5% 80.6% 85.7% Social Connectedness 82.8% 77.8% 85.7%

18
Table 10. 2010-2012 Domain Scores by Age: Age not Available
Statewide 2010 2011 2012 Hawaii-Specific 88.9% 84.0% n/a Appropriateness 77.8% 89.3% n/a Satisfaction 66.7% 85.7% n/a Treatment Planning 66.7% 77.8% n/a Access 88.9% 89.3% n/a Functioning 66.7% 76.0% n/a Treatment Outcomes 62.5% 69.2% n/a Social Connectedness 44.4% 64.0% n/a
19
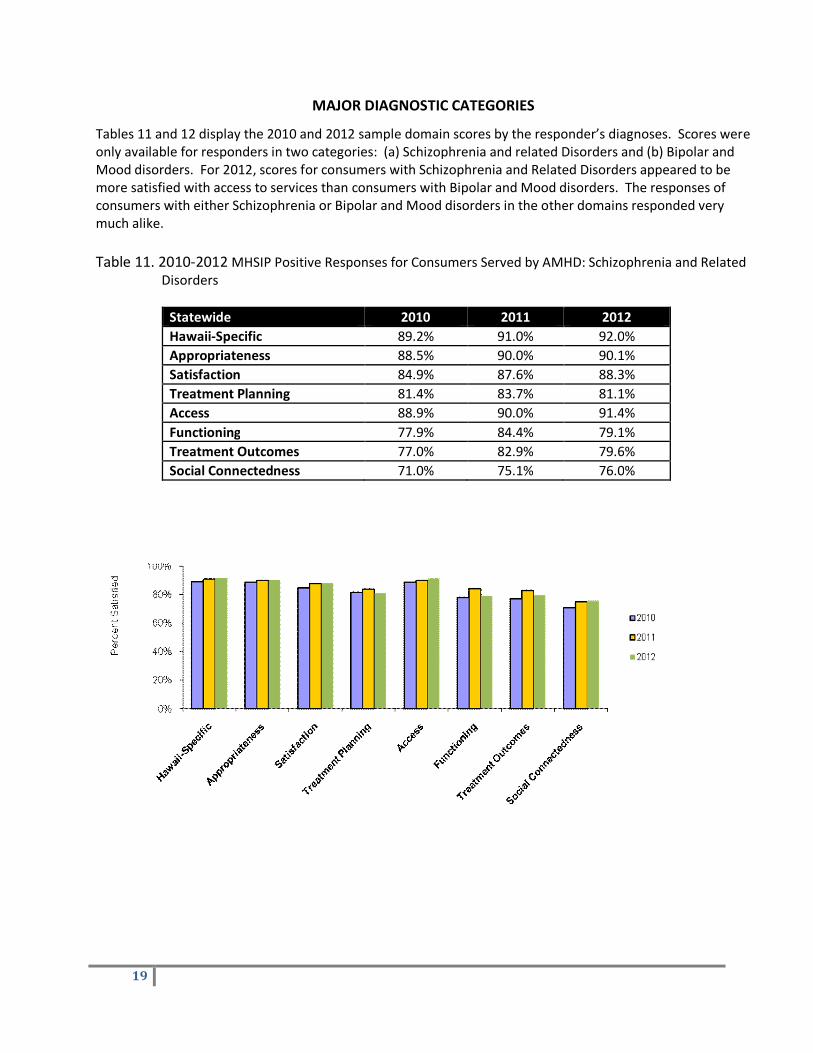
MAJOR DIAGNOSTIC CATEGORIES
Tables 11 and 12 display the 2010 and 2012 sample domain scores by the responder’s diagnoses. Scores were only available for responders in two categories: (a) Schizophrenia and related Disorders and (b) Bipolar and Mood disorders. For 2012, scores for consumers with Schizophrenia and Related Disorders appeared to be more satisfied with access to services than consumers with Bipolar and Mood disorders. The responses of consumers with either Schizophrenia or Bipolar and Mood disorders in the other domains responded very much alike. Table 11. 2010-2012 MHSIP Positive Responses for Consumers Served by AMHD: Schizophrenia and Related
Disorders
Statewide 2010 2011 2012 Hawaii-Specific 89.2% 91.0% 92.0% Appropriateness 88.5% 90.0% 90.1% Satisfaction 84.9% 87.6% 88.3% Treatment Planning 81.4% 83.7% 81.1% Access 88.9% 90.0% 91.4% Functioning 77.9% 84.4% 79.1% Treatment Outcomes 77.0% 82.9% 79.6% Social Connectedness 71.0% 75.1% 76.0%

20
Table 12. 2010-2012 MHSIP Positive Responses for Consumers Served by AMHD: Bipolar and Mood Disorders
Statewide 2010 2011 2012 Hawaii-Specific 92.1% 90.0% 95.2% Appropriateness 91.5% 88.6% 94.5% Satisfaction 92.2% 87.2% 93.7% Treatment Planning 85.3% 88.0% 88.7% Access 75.5% 88.6% 88.9% Functioning 79.8% 76.8% 80.2% Treatment Outcomes 77.0% 75.8% 77.9% Social Connectedness 70.5% 67.1% 66.9%

21
DISCUSSION Statewide, for FY2012, consumers generally reported an overall satisfaction in most domains including the Hawai`i-Specific question as well as, the Appropriateness and Access to Services domain indicating over 90% satisfaction positive. The pattern found in prior MHSIP administrations remains: Consumers were more satisfied with service provision than with the outcomes of services. They rated most positively those factors related to their interaction with clinicians (i.e., Appropriateness, Satisfaction), but indicated less satisfaction with domains that relate directly to their lives (i.e., Outcomes, Functioning, and Social Connectedness). Consumers also expressed the most dissatisfaction with dealing with symptoms, getting the services they thought they needed and their sense of belonging in the community (Appendix B). Despite Outcome and Social Connectedness scores indicating lower satisfaction, than the other domains, many consumers still rated these outcomes positively. One possible explanation is that consumers who have positive outcomes about themselves and about the services they receive are more likely to leave treatment and therefore survey responses for these consumers may not be represented.
While this year’s methodology included a convenience sample (N= 2,557) in addition to the random sample, the response rates for all CMHC and POS providers were markedly lower than the two previous years. It is also important to note that surveys have limitations and this survey only captured the perspectives of those consumers who agreed to participate. It is possible that these responses may differ from those who chose not to participate. However, we are confident that the findings can be generalized to the entire AMHD population served. The 2012 Hawai`i Consumer Survey is a modified version of the nationally accepted MHSIP Consumer Survey, and is a reliable survey instrument for collecting information about consumers’ perception of services provided by Hawai`i’s public mental health system. It is important to examine domains that were scored higher or lower to determine strengths and deficits in the current public mental health system (CMHC’s case management area). Mental health service providers should look at these relatively positive results not only as an indication of a job well done, but as a clear call for improvements in certain areas. Finally, it is important to note that the information garnered from the survey is invaluable regarding consumer perceptions that will support the ideals of a consumer-driven model. The feedback reflects the value of consumer involvement in the mental health system, which will inform policy and will highlight strengths for community mental health centers, providers and for the state as a whole.
REFERENCES
Mental Health Statistics Improvement Project (MHSIP): www.mhsip.org
The MHSIP Quality Report Toolkit: A Companion Document for the MHSIP Quality Report (2005)
Annual Consumer Survey-Hawai`i (1995, 1997, 2002, 2005, 2006, 2007, 2008, 2009, 2010, 2011, 2012)

22
APPENDIX A: Hawai‘i Mental Health Services Consumer Survey 2012
Date Survey was completed (MM/DD/YY):
Thank you for agreeing to participate in this survey. Please take a moment to review this page for information and instructions.
Purpose of this Survey
Your answers and those of others will tell us what people think of their mental health care. This information will help us to identify areas of strengths and areas in which improvements would help us provide the best possible services. In Part 1 of this survey, we ask you to rate the services you received from this agency during the last 3 months. In Part 2, we ask you about your access to care and your oral health; and in Part 3, we ask about demographic information, such as your age and ethnicity.
Voluntary and Confidential
• Your participation is voluntary. • Your answers will be confidential and will not affect your services at this agency. • This agency’s staff will NOT have access to your individual responses. Only
authorized personnel from the Department of Health will see your answers. Instructions
o Please read the instructions for each part of this survey (Parts 1, 2, and 3) before completing each section.
o After you complete this survey, drop it in the locked mailbox. o If you prefer to complete this survey at a later time, please ask for a prepaid return envelope and mail your completed survey to us.

23
Hawai‘i Mental Health Services Consumer Survey 2012
Instructions (Part 1): Please rate your level of agreement with each statement from “Strongly Agree” to “Strongly Disagree,” by circling the one response that best fits your experience with this agency during the last 3 months. If the statement does not apply to you, please circle “Does Not Apply.”
1. I like the services that I received here. Strongly
Agree
Agree Neutral
Disagree Strongly Disagree
Does Not
Apply 2. If I had other choices, I would still get services
from this agency. Strongly
Agree
Agree Neutral
Disagree Strongly Disagree
Does Not
Apply 3. I would recommend this agency to a friend or
family member. Strongly
Agree
Agree Neutral
Disagree Strongly Disagree
Does Not
Apply 4. The location of services was convenient (for
example, for parking, to public transportation, the distance, etc.).
Strongly
Agree
Agree
Neutral
Disagree
Strongly Disagree
Does Not
Apply
5. Staff were willing to see me as often as I felt it was necessary.
Strongly Agree
Agree
Neutral Disagree Strongly
Disagree Does Not
Apply 6. Staff returned my call in 24 hours. Strongly
Agree
Agree Neutral
Disagree Strongly Disagree
Does Not
Apply 7. Services were available at times that were
good for me. Strongly
Agree
Agree Neutral
Disagree Strongly Disagree
Does Not
Apply 8. I was able to get all the services I thought I needed.
Strongly Agree
Agree
Neutral Disagree Strongly
Disagree Does Not
Apply 9. I was able to see a psychiatrist when I wanted
to. Strongly
Agree
Agree Neutral
Disagree Strongly Disagree
Does Not
Apply 10. Staff here believes that I can grow, change and
recover. (Recovery is having a life that is meaningful to you – a home, a job, a loving partner, friends, children, hobbies, transportation.)
Strongly
Agree
Agree
Neutral
Disagree
Strongly Disagree
Does Not
Apply
11. I felt comfortable asking questions about my treatment and medication.
Strongly
Agree
Agree
Neutral
Disagree
Strongly Disagree
Does Not
Apply 12. I felt free to complain. Strongly
Agree
Agree Neutral
Disagree Strongly Disagree
Does Not
Apply 13. I was given information about my rights. Strongly
Agree
Agree Neutral
Disagree Strongly Disagree
Does Not
Apply 14. Staff encouraged me to take responsibility for
how I live my life. Strongly
Agree
Agree Neutral
Disagree Strongly Disagree
Does Not
Apply 15. Staff told me what side effects to watch out for (for example: dry mouth, drooling, itching, etc.).
Strongly
Agree
Agree
Neutral
Disagree
Strongly Disagree
Does Not
Apply 16. Staff respected my wishes about who is and
who is not to be given information about my treatment.
Strongly
Agree
Agree
Neutral
Disagree
Strongly Disagree
Does Not
Apply
17. I, not staff, decided my treatment goals. Strongly Agree
Agree
Neutral Disagree Strongly
Disagree Does Not
Apply

24
Hawai‘i Mental Health Services Consumer Survey 2012
18. Staff were sensitive to my cultural background (such as race, religion, language, traditions, etc.).
Strongly
Agree
Agree
Neutral
Disagree
Strongly Disagree
Does Not
Apply
19. Staff helped me obtain the information I needed so that I could take charge of managing my illness.
Strongly
Agree
Agree
Neutral
Disagree
Strongly Disagree
Does Not
Apply
20. I was encouraged to use consumer-run programs (such as support groups, drop-in centers, crisis phone line, peer specialist, etc.).
Strongly
Agree
Agree
Neutral
Disagree
Strongly Disagree
Does Not
Apply
21. I received services, including medications, in a timely manner, that is, there were no delays.
Strongly
Agree
Agree
Neutral
Disagree
Strongly Disagree
Does Not
Apply
22. Staff asked me about my physical health (such as medical problems, illnesses, health problems).
Strongly
Agree
Agree
Neutral
Disagree
Strongly Disagree
Does Not
Apply
23. Staff expressed an understanding of my values (your likes or dislikes, beliefs and ideas) in developing my treatment plan.
Strongly
Agree
Agree
Neutral
Disagree
Strongly Disagree
Does Not
Apply
24. As a direct result of services I received, I deal more effectively with daily problems.
Strongly
Agree
Agree
Neutral
Disagree
Strongly Disagree
Does Not
Apply
25. As a direct result of services I received, I am better able to control my life (that is, being in charge of, managing my life).
Strongly
Agree
Agree
Neutral
Disagree
Strongly Disagree
Does Not
Apply
26. As a direct result of services I received, I am better able to deal with crisis.
Strongly
Agree
Agree
Neutral
Disagree
Strongly Disagree
Does Not
Apply
27. As a direct result of services I received, I am getting along better with my family.
Strongly
Agree
Agree
Neutral
Disagree
Strongly Disagree
Does Not
Apply
28. As a direct result of services I received, I do better in social situations.
Strongly
Agree
Agree
Neutral
Disagree
Strongly Disagree
Does Not
Apply
29. As a direct result of services I received, I do better in school and/or work.
Strongly
Agree
Agree
Neutral
Disagree
Strongly Disagree
Does Not
Apply
30. As a direct result of services I received, my housing situation has improved.
Strongly
Agree
Agree
Neutral
Disagree
Strongly Disagree
Does Not
Apply
31. As a direct result of services I received, my symptoms are not bothering me as much.
Strongly
Agree
Agree
Neutral
Disagree
Strongly Disagree
Does Not
Apply
32. As a direct result of services I received, I do things that are more meaningful to me (that is, greater worth and importance).
Strongly
Agree
Agree
Neutral
Disagree
Strongly Disagree
Does Not
Apply
33. As a direct result of services I received, I am better able to take care of my needs.
Strongly
Agree
Agree
Neutral
Disagree
Strongly Disagree
Does Not
Apply
34. As a direct result of services I received, I am better able to handle things when they go wrong.
Strongly
Agree
Agree
Neutral
Disagree
Strongly Disagree
Does Not
Apply

25
Hawai‘i Mental Health Services Consumer Survey 2012
35. As a direct result of services I received, I am better able to do things I want to do.
Strongly
Agree
Agree
Neutral
Disagree
Strongly Disagree
Does Not
Apply
36. Thinking about people in my life other than mental health staff, I am happy with the friendships I have.
Strongly
Agree
Agree
Neutral
Disagree
Strongly Disagree
Does Not
Apply
37. Thinking about people in my life other than mental health staff, I have people with whom I can do enjoyable things.
Strongly
Agree
Agree
Neutral
Disagree
Strongly Disagree
Does Not
Apply
38. Thinking about people in my life other than mental health staff, I feel I belong in my community.
Strongly
Agree
Agree
Neutral
Disagree
Strongly Disagree
Does Not
Apply
39. Thinking about people in my life other than mental health staff, when in a crisis I would have the support I need from family or friends.
Strongly
Agree
Agree
Neutral
Disagree
Strongly Disagree
Does Not
Apply
--Please continue on to next page--

26
Hawai‘i Mental Health Services Consumer Survey 2012 Instructions (Part 3): Please complete the following demographic information.
46. What is your race or ethnicity (check all that apply)?
Alaska Native (322) American Indian (400) Black or African American (11) White or Caucasian (10) Portuguese (323)
NATIVE HAWAIIAN AND PACIFIC ISLANDER
American Samoan (16) Chamorro/CNMI (500) Chamorro/Guam (501) Chuukese (502) CNMI/Carolinian (503) Hawaiian (404) Kosraean (505) Marshallese (506) Palauan (507) Phonpeian (508) Yapese (509) Other Pacific Islander (317)
ASIAN
Asian Indian (410) Chinese (318) Filipino (325) Japanese (320) Korean (319) Vietnamese (321) Other Asian (407)
HISPANIC OR LATINO**
Cuban (402) Mexican (405) Puerto Rican (324) Other Hispanic or Latino (408)
** If Hispanic or Latino, also select a race (these are in the bold italics) OTHER
Other (14) Adopted--don't know (410) Unknown (411) Prefer not to answer (99)
47. Which race/ethnicity group do you PRIMARILY identify with?
48. What is your gender? Male Female
49. What is your date of birth? (MM/DD/YY)

27
APPENDIX B: Overview of the Eight Domains Addressed by the 2012 Hawaii Adult
Community Mental Health Survey
Domains Survey Statements Satisfaction
Overall satisfaction with services received
1. I like the services that I received here. 2. If I had other choices, I would still get services from this agency 3. I would recommend this agency to a friend or family members.
Access Entry into mental health services is timely and convenient
4. The location of the services was convenient.
5. Staff were willing to see me as often as I felt it was necessary 6. Staff returned my call within 24 hours 7. Services were available at times that were good for me. 8. I was able to get all the services I thought I needed. 9. I was able to see a psychiatrist when I wanted to.
Appropriateness Each consumer is treated as an individual, with a treatment plan that addresses strengths as well as weaknesses, proper ethno-cultural context, and consumer goals
10. Staff here believes that I can grow, change and recover. 12. I feel free to complain. 13. I was given information about my rights 14. Staff encouraged me to take responsibility for how I live my life 15. Staff told me what side effects to watch out for. 16. Staff respected my wishes about who is and who is not to be given information about my treatment. 18. Staff was sensitive to my cultural background. 19. Staff helped me obtain the information needed so that I could
take charge of managing my illness. 20. I was encouraged to use consumer-run programs.
Treatment Planning The extent to which consumers felt that they participated in their treatment planning process
11. I felt comfortable asking questions about my treatment and medication.
17. I, not staff, decided my treatment goals.
Outcome The extent to which mental health treatment had a positive effect on wellbeing, relationship, life circumstances, and potential recovery
24. As a direct result of services I received, I deal more effectively with daily problems.
25. As a direct result of services I received, I am better able to control my life.
26. As a direct result of services I received, I am better to deal with crisis.
27. As a direct result of services I received, I am getting along better with my family.
28. As a direct result of services I received, I do better in social situations.

28
Domains Survey Statements 29. As a direct result of services I received, I do better in school and
/or work. 30. As a direct result of services I received, my housing situation has improved. 31. As a direct result of services I received, my symptoms are not bothering me as much.
Functioning The extent to which mental health treatment had a positive effect on daily functioning
32. As a direct result of services I received, I do things that are more meaningful to me. 33. As a direct result of services I received, I am better able to take
care of my needs. 34. As a direct result of services I received, I am better able to handle things when they go wrong. 35. As a direct result of services I received, I am better able to do
things that I want to do. Social Connectedness The extent to which mental health treatment had a positive effect on one’s sense of belongingness
36. Thinking about people in my life other than mental health staff, I am happy with the friendships I have. 37. Thinking about people in my life other than mental health staff,
I have people with whom I can do enjoyable things. 38. Thinking about people in my life other than mental health staff, I
feel I belong in my community. 39. Thinking about people in my life other than mental health
staff, when in a crisis I would have the support I need from family or friends.
Hawai‘i-specific The extent to which consumers felt that services were provided with respect and in a culturally appropriate manner
21. I received services, including medications, in a timely manner, that is, there were no delays.
22. Staff asked about my physical health. 23. Staff expressed an understanding of my values in developing my
treatment plan.
29
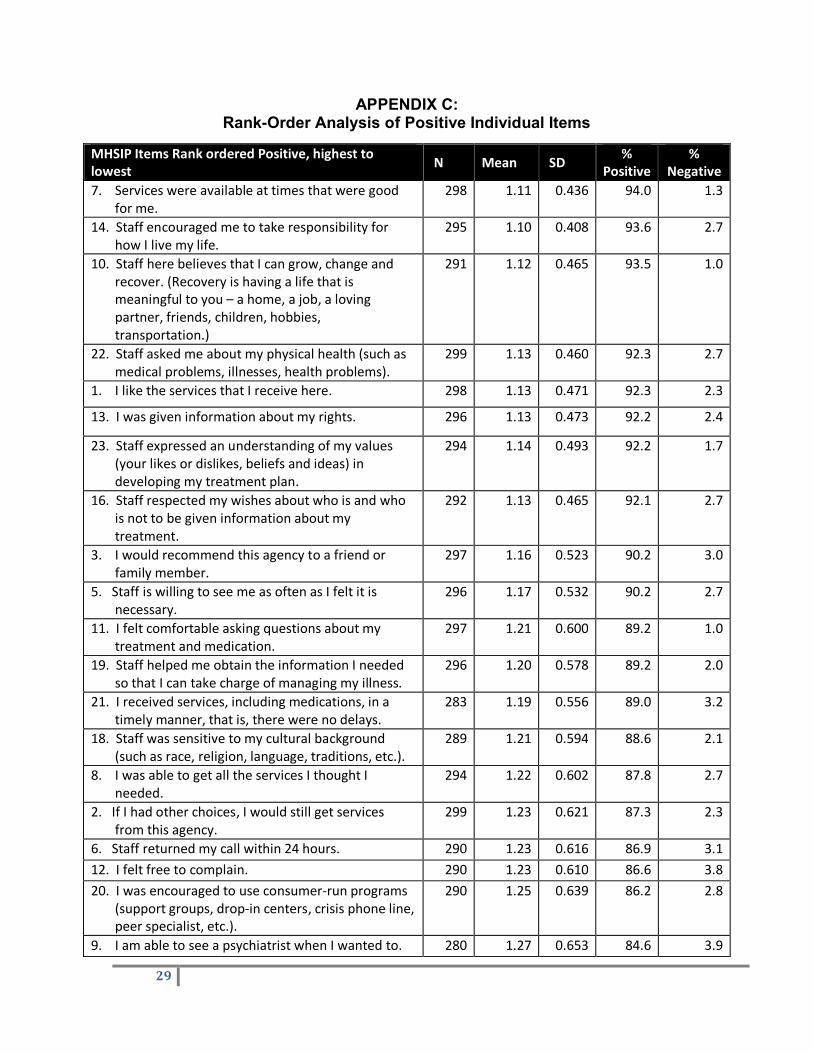
APPENDIX C: Rank-Order Analysis of Positive Individual Items
MHSIP Items Rank ordered Positive, highest to lowest N Mean SD %
Positive %
Negative 7. Services were available at times that were good
for me. 298 1.11 0.436 94.0 1.3
14. Staff encouraged me to take responsibility for how I live my life.
295 1.10 0.408 93.6 2.7
10. Staff here believes that I can grow, change and recover. (Recovery is having a life that is meaningful to you – a home, a job, a loving partner, friends, children, hobbies, transportation.)
291 1.12 0.465 93.5 1.0
22. Staff asked me about my physical health (such as medical problems, illnesses, health problems).
299 1.13 0.460 92.3 2.7
1. I like the services that I receive here. 298 1.13 0.471 92.3 2.3
13. I was given information about my rights. 296 1.13 0.473 92.2 2.4
23. Staff expressed an understanding of my values (your likes or dislikes, beliefs and ideas) in developing my treatment plan.
294 1.14 0.493 92.2 1.7
16. Staff respected my wishes about who is and who is not to be given information about my treatment.
292 1.13 0.465 92.1 2.7
3. I would recommend this agency to a friend or family member.
297 1.16 0.523 90.2 3.0
5. Staff is willing to see me as often as I felt it is necessary.
296 1.17 0.532 90.2 2.7
11. I felt comfortable asking questions about my treatment and medication.
297 1.21 0.600 89.2 1.0
19. Staff helped me obtain the information I needed so that I can take charge of managing my illness.
296 1.20 0.578 89.2 2.0
21. I received services, including medications, in a timely manner, that is, there were no delays.
283 1.19 0.556 89.0 3.2
18. Staff was sensitive to my cultural background (such as race, religion, language, traditions, etc.).
289 1.21 0.594 88.6 2.1
8. I was able to get all the services I thought I needed.
294 1.22 0.602 87.8 2.7
2. If I had other choices, I would still get services from this agency.
299 1.23 0.621 87.3 2.3
6. Staff returned my call within 24 hours. 290 1.23 0.616 86.9 3.1 12. I felt free to complain. 290 1.23 0.610 86.6 3.8 20. I was encouraged to use consumer-run programs
(support groups, drop-in centers, crisis phone line, peer specialist, etc.).
290 1.25 0.639 86.2 2.8
9. I am able to see a psychiatrist when I wanted to. 280 1.27 0.653 84.6 3.9

30
17. I, not staff, decided my treatment goals. 291 1.29 0.683 84.5 2.4 33. As a direct result of services I received, I am better able to take care of my needs.
1.28 0.665 84.3 3.7
4. The location of services was convenient (for example, for parking, to public transportation, the distance, etc.).
289 1.29 0.680 84.1 3.1
24. As a direct result of services I received, I deal more effectively with daily problems.
294 1.30 0.694 84.0 2.4
26. As a direct result of services I received, I am better able to deal with crisis.
298 1.29 0.686 83.9 3.0
15. Staff told me what side effects to watch out for (for example: dry mouth, drooling, itching, etc.).
285 1.29 0.668 82.8 5.3
25. As a direct result of services I received, I am better able to control my life (that is, being in charge of, managing my life).
293 1.32 0.711 82.6 3.1
35. As a direct result of services I received, I am better able to do things I want to do.
289 1.34 0.724 81.0 4.2
36. Thinking about people in my life other than mental health staff, I am happy with the friendships I have.
285 1.36 0.751 80.0 3.5
32. As a direct result of services I received, I do things that are more meaningful to me (that is, greater worth and importance).
292 1.36 0.740 79.8 4.5
37. Thinking about people in my life other than mental health staff, I have people with whom I can do enjoyable things.
286 1.37 0.756 79.4 3.8
34. As a direct result of services I received, I am better able to handle things when they go wrong.
297 1.39 0.769 78.1 4.4
30. As a direct result of services I received, my housing situation has improved.
269 1.42 0.786 76.6 4.8
28. As a direct result of services I received, I do better in social situations.
294 1.44 0.806 76.2 3.7
38. Thinking about people in my life other than mental health staff, I feel I belong in my community.
289 1.42 0.765 74.7 8.3
27. As a direct result of services I received, I am getting along better with my family.
285 1.45 0.802 74.7 5.6
31. As a direct result of services I received, my symptoms are not bothering me as much.
294 1.50 0.829 72.1 6.1
39. Thinking about people in my life other than mental health staff, when in a crisis I would have the support I need from family or friends.
289 1.49 0.808 70.6 9.3
29. As a direct result of services I received, I do better in school and/or work.
198 1.58 0.879 68.7 5.1
31
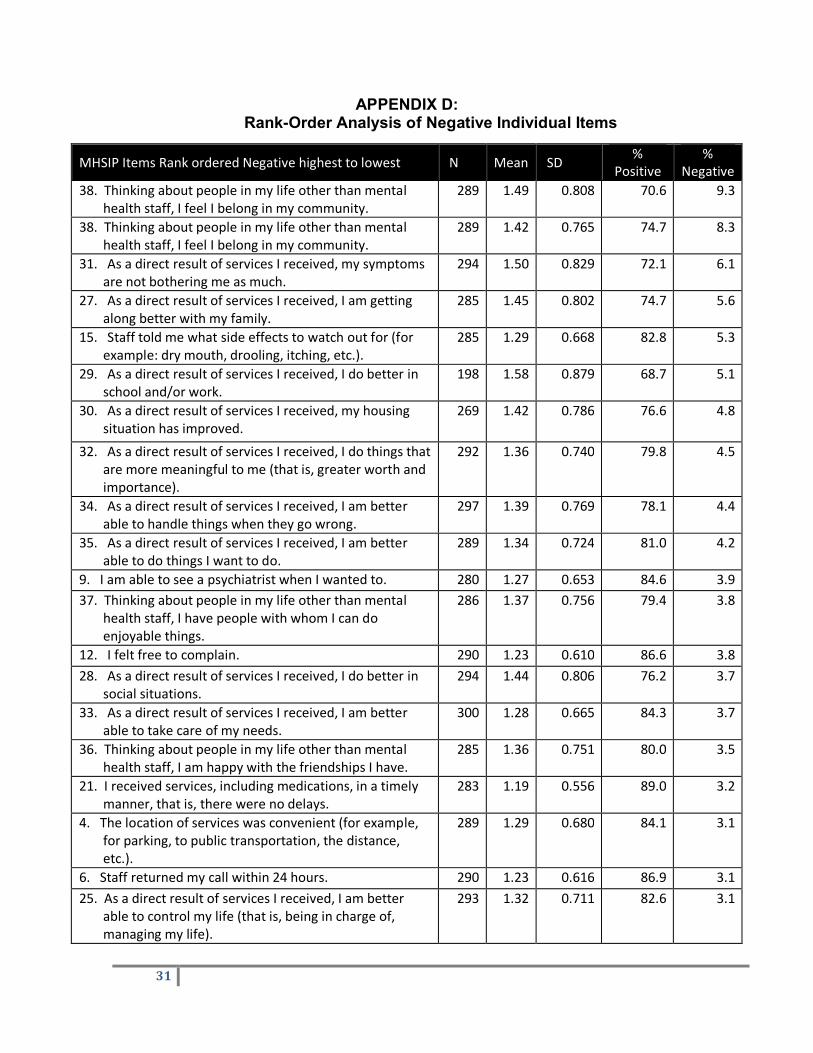
APPENDIX D: Rank-Order Analysis of Negative Individual Items
MHSIP Items Rank ordered Negative highest to lowest N Mean SD % Positive
% Negative
38. Thinking about people in my life other than mental health staff, I feel I belong in my community.
289 1.49 0.808 70.6 9.3
38. Thinking about people in my life other than mental health staff, I feel I belong in my community.
289 1.42 0.765 74.7 8.3
31. As a direct result of services I received, my symptoms are not bothering me as much.
294 1.50 0.829 72.1 6.1
27. As a direct result of services I received, I am getting along better with my family.
285 1.45 0.802 74.7 5.6
15. Staff told me what side effects to watch out for (for example: dry mouth, drooling, itching, etc.).
285 1.29 0.668 82.8 5.3
29. As a direct result of services I received, I do better in school and/or work.
198 1.58 0.879 68.7 5.1
30. As a direct result of services I received, my housing situation has improved.
269 1.42 0.786 76.6 4.8
32. As a direct result of services I received, I do things that are more meaningful to me (that is, greater worth and importance).
292 1.36 0.740 79.8 4.5
34. As a direct result of services I received, I am better able to handle things when they go wrong.
297 1.39 0.769 78.1 4.4
35. As a direct result of services I received, I am better able to do things I want to do.
289 1.34 0.724 81.0 4.2
9. I am able to see a psychiatrist when I wanted to. 280 1.27 0.653 84.6 3.9 37. Thinking about people in my life other than mental
health staff, I have people with whom I can do enjoyable things.
286 1.37 0.756 79.4 3.8
12. I felt free to complain. 290 1.23 0.610 86.6 3.8 28. As a direct result of services I received, I do better in
social situations. 294 1.44 0.806 76.2 3.7
33. As a direct result of services I received, I am better able to take care of my needs.
300 1.28 0.665 84.3 3.7
36. Thinking about people in my life other than mental health staff, I am happy with the friendships I have.
285 1.36 0.751 80.0 3.5
21. I received services, including medications, in a timely manner, that is, there were no delays.
283 1.19 0.556 89.0 3.2
4. The location of services was convenient (for example, for parking, to public transportation, the distance, etc.).
289 1.29 0.680 84.1 3.1
6. Staff returned my call within 24 hours. 290 1.23 0.616 86.9 3.1 25. As a direct result of services I received, I am better
able to control my life (that is, being in charge of, managing my life).
293 1.32 0.711 82.6 3.1

32
3. I would recommend this agency to a friend or family member.
297 1.16 0.523 90.2 3.0
26. As a direct result of services I received, I am better able to deal with crisis.
298 1.29 0.686 83.9 3.0
20. I was encouraged to use consumer-run programs (support groups, drop-in centers, crisis phone line, peer specialist, etc.).
290 1.25 0.639 86.2 2.8
16. Staff respected my wishes about who is and who is not to be given information about my treatment.
292 1.13 0.465 92.1 2.7
8. I was able to get all the services I thought I needed. 294 1.22 0.602 87.8 2.7 14. Staff encouraged me to take responsibility for how I
live my life. 295 1.10 0.408 93.6 2.7
5. Staff is willing to see me as often as I felt it is necessary. 296 1.17 0.532 90.2 2.7 22. Staff asked me about my physical health (such as
medical problems, illnesses, health problems). 299 1.13 0.460 92.3 2.7
17. I, not staff, decided my treatment goals. 291 1.29 0.683 84.5 2.4 24. As a direct result of services I received, I deal more
effectively with daily problems. 294 1.30 0.694 84.0 2.4
13. I was given information about my rights. 296 1.13 0.473 92.2 2.4 1. I like the services that I receive here. 298 1.13 0.471 92.3 2.3 2. If I had other choices, I would still get services from
this agency. 299 1.23 0.621 87.3 2.3
18. Staff was sensitive to my cultural background (such as race, religion, language, traditions, etc.).
289 1.21 0.594 88.6 2.1
19. Staff helped me obtain the information I needed so that I can take charge of managing my illness.
296 1.20 0.578 89.2 2.0
23. Staff expressed an understanding of my values (your likes or dislikes, beliefs and ideas) in developing my treatment plan.
294 1.14 0.493 92.2 1.7
7. Services were available at times that were good for me.
298 1.11 0.436 94.0 1.3
10. Staff here believes that I can grow, change and recover. (Recovery is having a life that is meaningful to you – a home, a job, a loving partner, friends, children, hobbies, transportation.)
291 1.12 0.465 93.5 1.0
11. I felt comfortable asking questions about my treatment and medication.
297 1.21 0.600 89.2 1.0