Embed Size (px)
Citation preview
Yara Fertilizer Industry HandbookDecember 2012
Yara Fertilizer Industry Handbook
1
List of contentsList of contents
F ili i d i Fertilizer industry overview– What is fertilizer? p. 2– The fertilizer industry p. 16
Fertilizer industry dynamics p. 26 – Ammonia p. 28p– Urea p. 33
Industry value drivers p. 39– Drivers of demand p. 42– Drivers of supply p. 60– Price relations p. 67– Production economics p 75– Production economics p. 75
Industrial applications p. 81
IR – Date: December 2012
What is fertilizer?
3
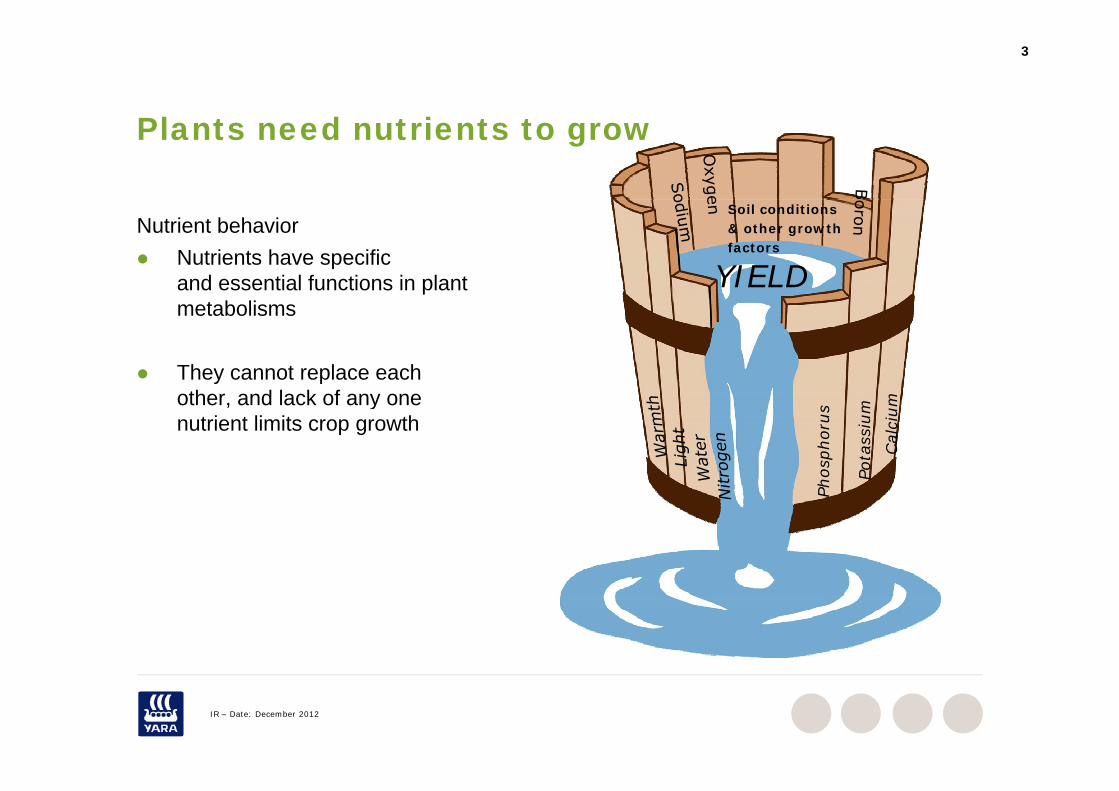
Plants need nutrients to growPlants need nutrients to grow
Soil conditionsNutrient behavior Nutrients have specific
and essential functions in plant metabolisms
YIELD
& other growthfactors
metabolisms
They cannot replace each other and lack of any one mother, and lack of any one nutrient limits crop growth
Pota
ssiu
m
hosp
horu
s
Cal
cium
Ph
IR – Date: December 2012
4
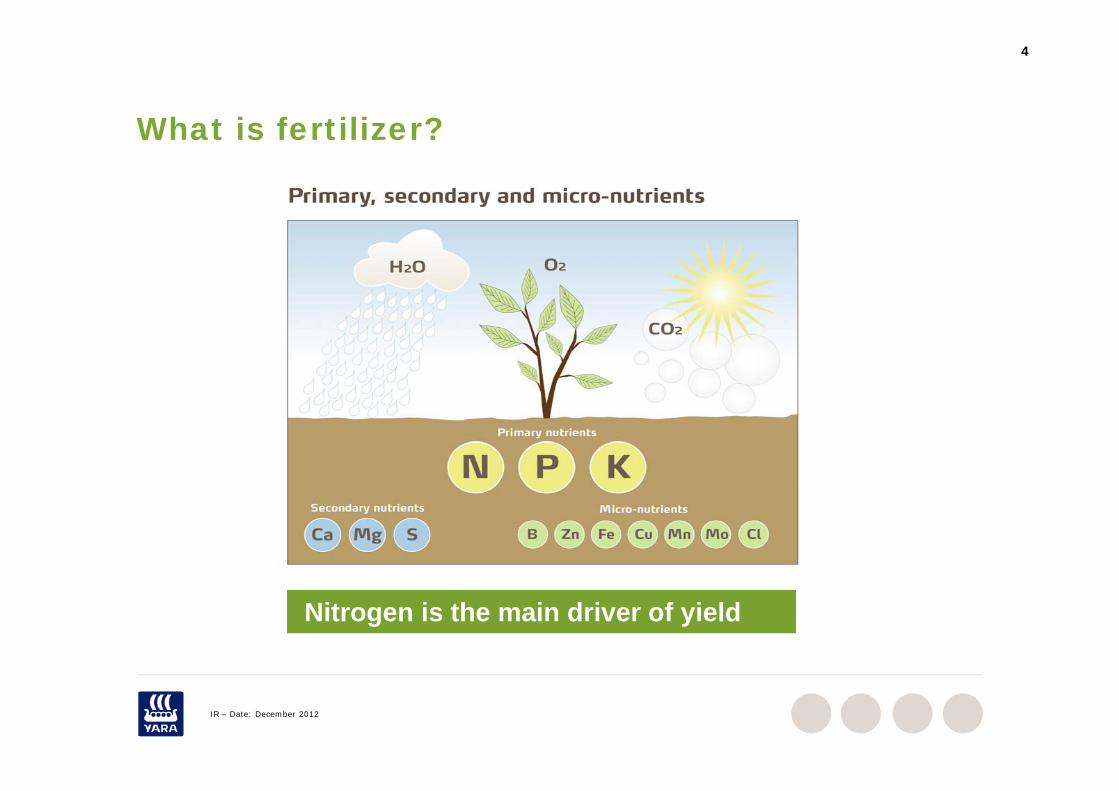
What is fertilizer?What is fertilizer?
Nitrogen is the main driver of yield
IR – Date: December 2012
5
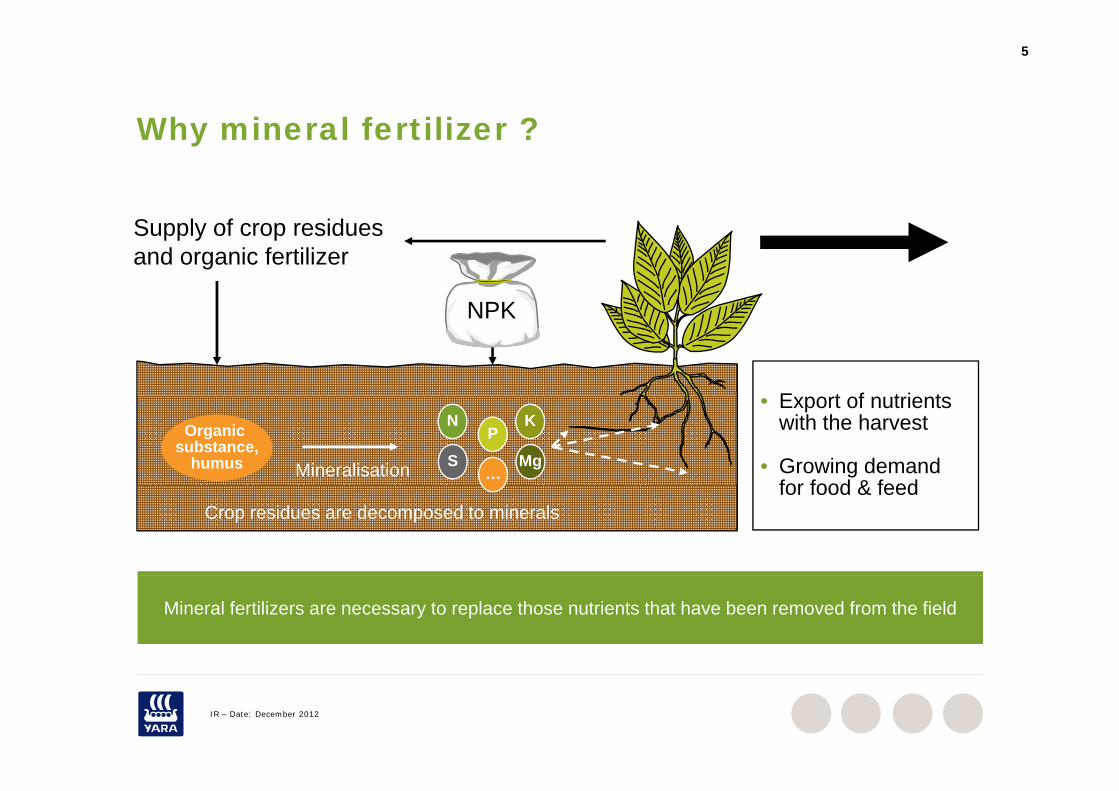
Why mineral fertilizer ?Why mineral fertilizer ?
Supply of crop residues and organic fertilizer
NPK
E t f t i t
NPK
NOrganicsubstance,
humus Mineralisation
• Export of nutrientswith the harvest
• Growing demand for food & feed
PK
S…
Mg
Crop residues are decomposed to mineralsfor food & feed
Mineral fertilizers are necessary to replace those nutrients that have been removed from the field
IR – Date: December 2012

6
Nit th t i t t t i tNitrogen – the most important nutrient
Nutrient characteristicsP i
16%
Primarybenefit Application Industry structure
Improve crop quality
Annual application
Fewer suppliers, production
Potassium(K)
23%crop quality application
not always done
production discipline
(K)Phosphorus
(P)
61% Increase crop
size Most important
and commonly
Annual application critical
Industry more fragmented, under consolidation
Nitrogen(N)
Total 177 milliontons nutrients
and commonly lacking nutrient
consolidation More dynamic
prices, but stable volume
tons nutrients
Source: IFA (season 2010/11)
IR – Date: December 2012
Source: IFA (season 2010/11)
7
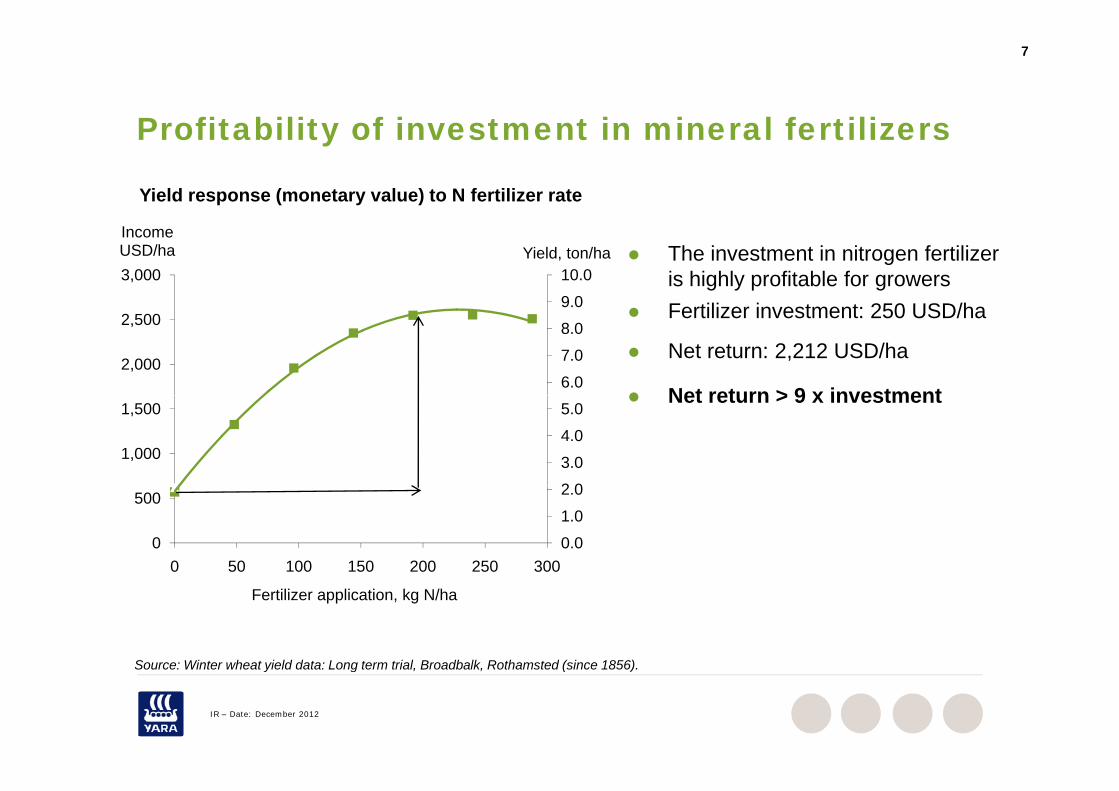
Profitability of investment in mineral fertilizersProfitability of investment in mineral fertilizers
Yield response (monetary value) to N fertilizer rate
The investment in nitrogen fertilizer is highly profitable for growersF tili i t t 250 USD/h9.0
10.03,000Yield, ton/ha
Income USD/ha
Fertilizer investment: 250 USD/ha
Net return: 2,212 USD/ha
Net return > 9 x investment6.0
7.0
8.0
9.0
2,000
2,500
Net return > 9 x investment
2 0
3.0
4.0
5.0
1,000
1,500
0.0
1.0
2.0
0
500
0 50 100 150 200 250 300
Fertilizer application, kg N/ha
Source: Winter wheat yield data: Long term trial Broadbalk Rothamsted (since 1856)
IR – Date: December 2012
Source: Winter wheat yield data: Long term trial, Broadbalk, Rothamsted (since 1856).
8
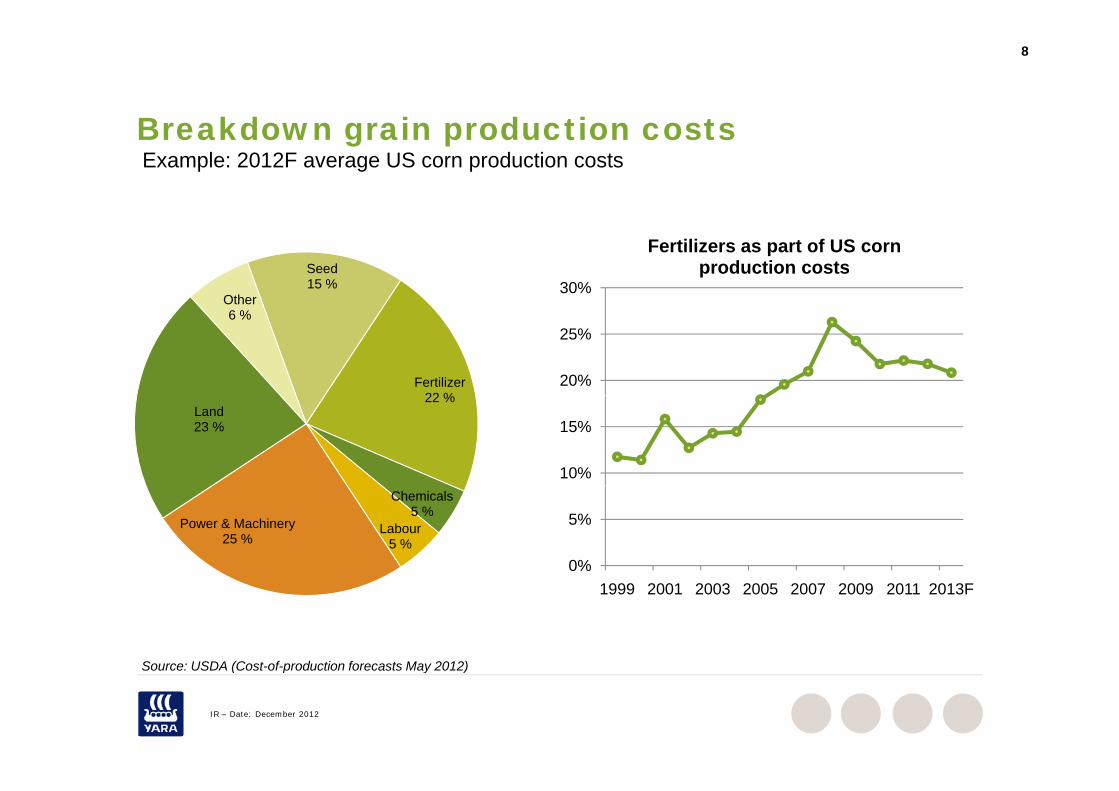
Breakdown grain production costsBreakdown grain production costsExample: 2012F average US corn production costs
Seed15 %
Other30%
Fertilizers as part of US corn production costs
Fertilizer22 %
6 %
20%
25%
22 %Land23 %
10%
15%
Chemicals5 %
Labour5 %
Power & Machinery25 %
0%
5%
Source: USDA (Cost of production forecasts May 2012)
1999 2001 2003 2005 2007 2009 2011 2013F
IR – Date: December 2012
Source: USDA (Cost-of-production forecasts May 2012)
9
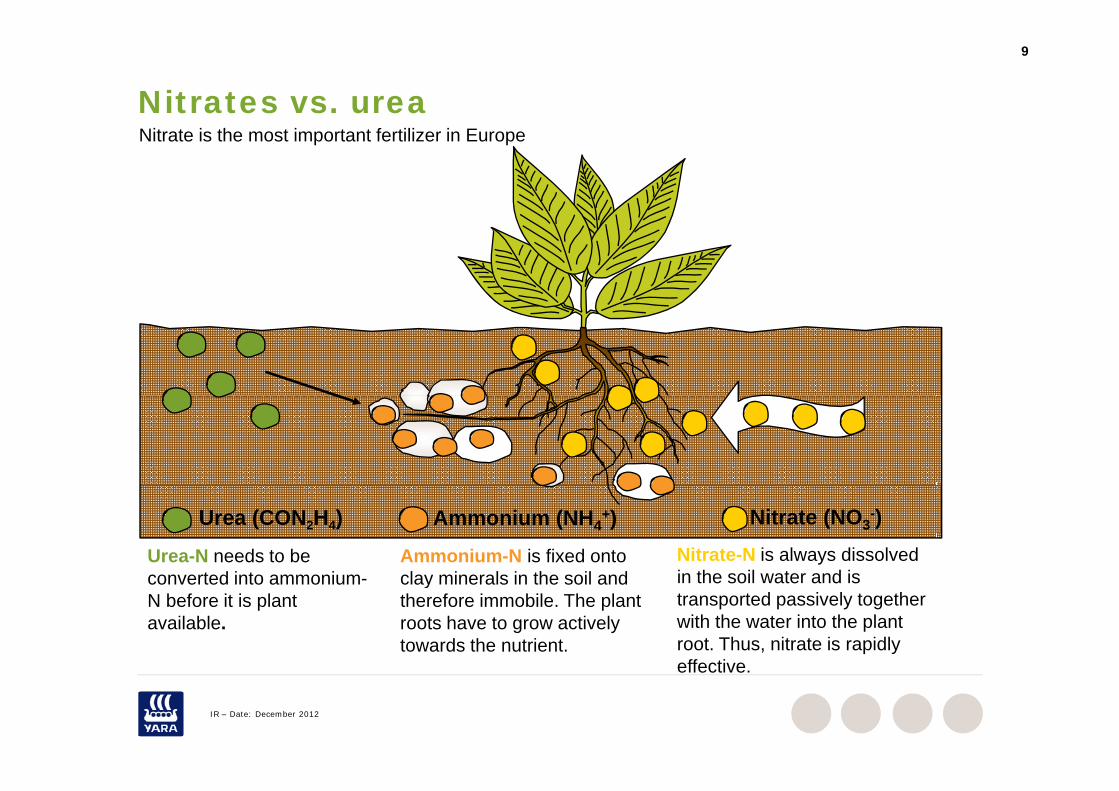
Nitrates vs. ureaNitrate is the most important fertilizer in Europe
Nitrate (NO3-)Ammonium (NH4
+)
Ammonium-N is fixed ontoclay minerals in the soil and
Nitrate-N is always dissolvedin the soil water and is
Urea (CON2H4)
Urea-N needs to beconverted into ammonium clay minerals in the soil and
therefore immobile. The plant roots have to grow activelytowards the nutrient.
in the soil water and istransported passively togetherwith the water into the plant root. Thus, nitrate is rapidlyeffective
converted into ammonium-N before it is plant available.
IR – Date: December 2012
effective.
10
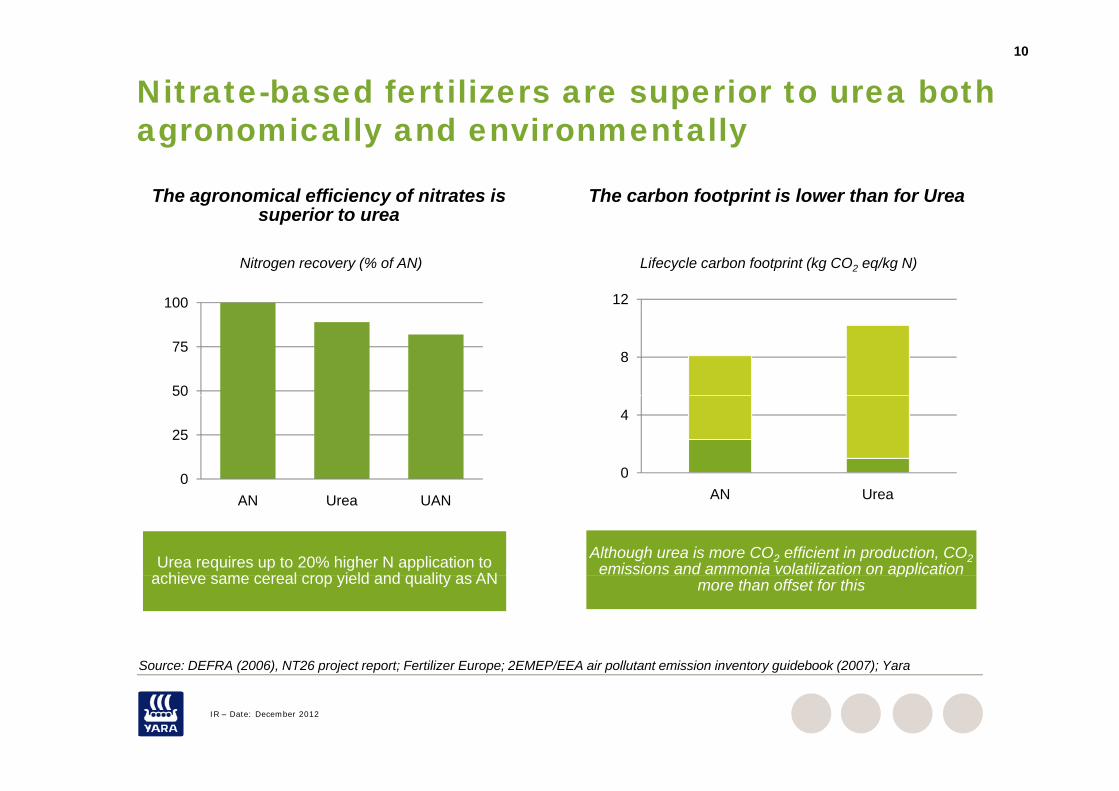
Nitrate-based fertilizers are superior to urea both agronomically and environmentallyagronomically and environmentally
The agronomical efficiency of nitrates is superior to urea
The carbon footprint is lower than for Urea
100
superior to urea
Nitrogen recovery (% of AN) Lifecycle carbon footprint (kg CO2 eq/kg N)
12
50
75
100
8
0
25
50
0
4
AN Urea UAN
Urea requires up to 20% higher N application to hi l i ld d lit AN
AN Urea
Although urea is more CO2 efficient in production, CO2emissions and ammonia volatilization on application
Source: DEFRA (2006) NT26 project report; Fertilizer Europe; 2EMEP/EEA air pollutant emission inventory guidebook (2007); Yara
achieve same cereal crop yield and quality as AN ppmore than offset for this
IR – Date: December 2012
Source: DEFRA (2006), NT26 project report; Fertilizer Europe; 2EMEP/EEA air pollutant emission inventory guidebook (2007); Yara
11
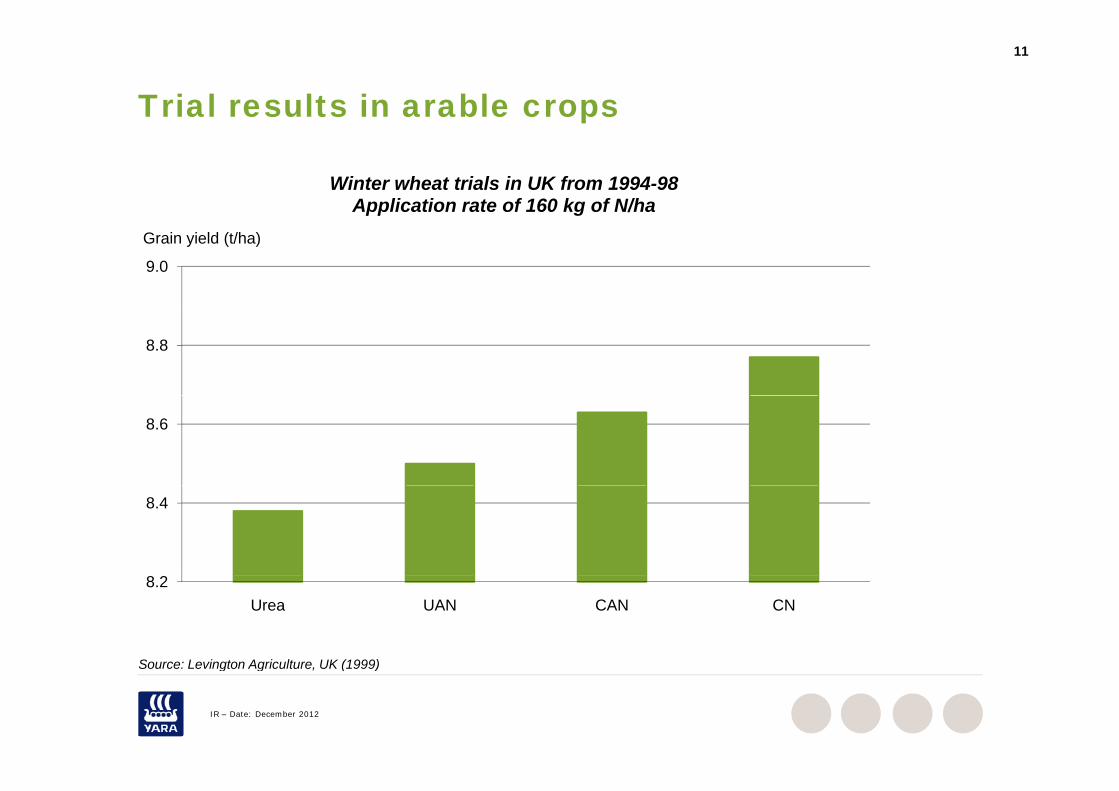
Trial results in arable crops
Winter wheat trials in UK from 1994-98Application rate of 160 kg of N/ha
9.0
Grain yield (t/ha)
8.8
8.6
8.4
8.2Urea UAN CAN CN
Source: Levington Agriculture UK (1999)
IR – Date: December 2012
Source: Levington Agriculture, UK (1999)
12
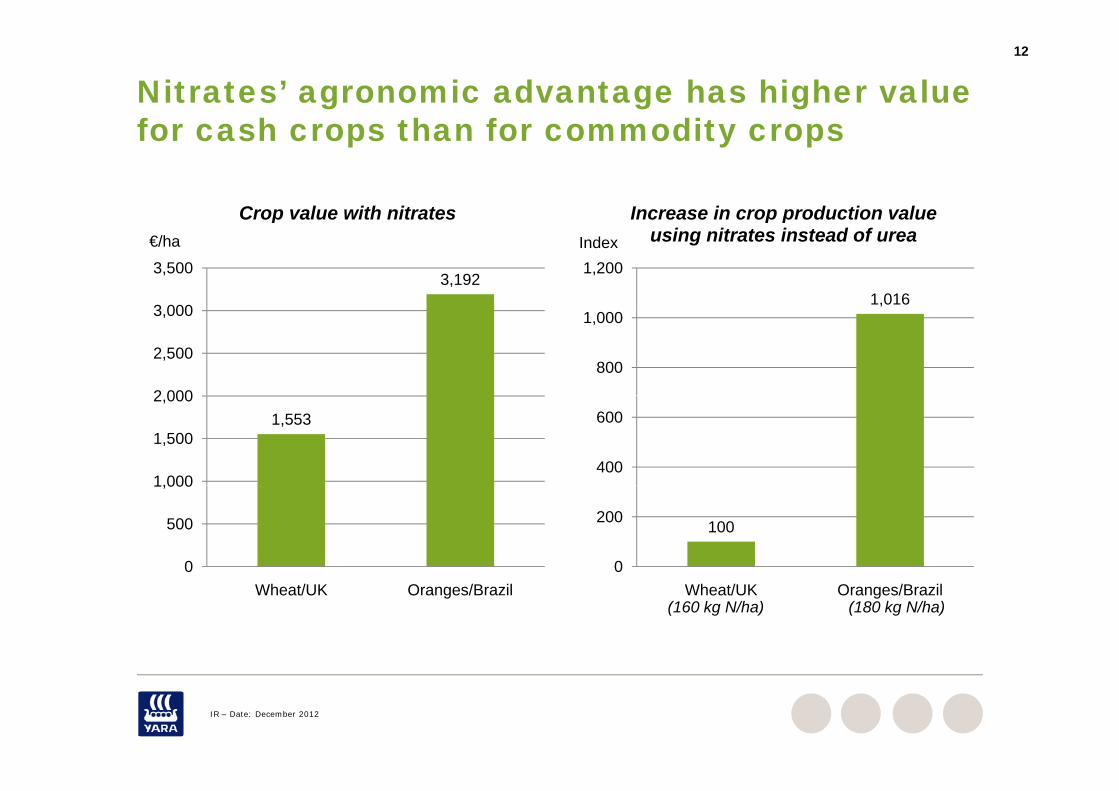
Nitrates’ agronomic advantage has higher value for cash crops than for commodity crops
Increase in crop production value
for cash crops than for commodity crops
Crop value with nitrates
1,016
1,200Index
Increase in crop production value using nitrates instead of urea
3,192
3 000
3,500
€/ha
Crop value with nitrates
,
800
1,000
2 000
2,500
3,000
400
6001,553
1,000
1,500
2,000
100
0
200
0
500
1,000
Wheat/UK Oranges/Brazil(160 kg N/ha) (180 kg N/ha)
Wheat/UK Oranges/Brazil
IR – Date: December 2012
13
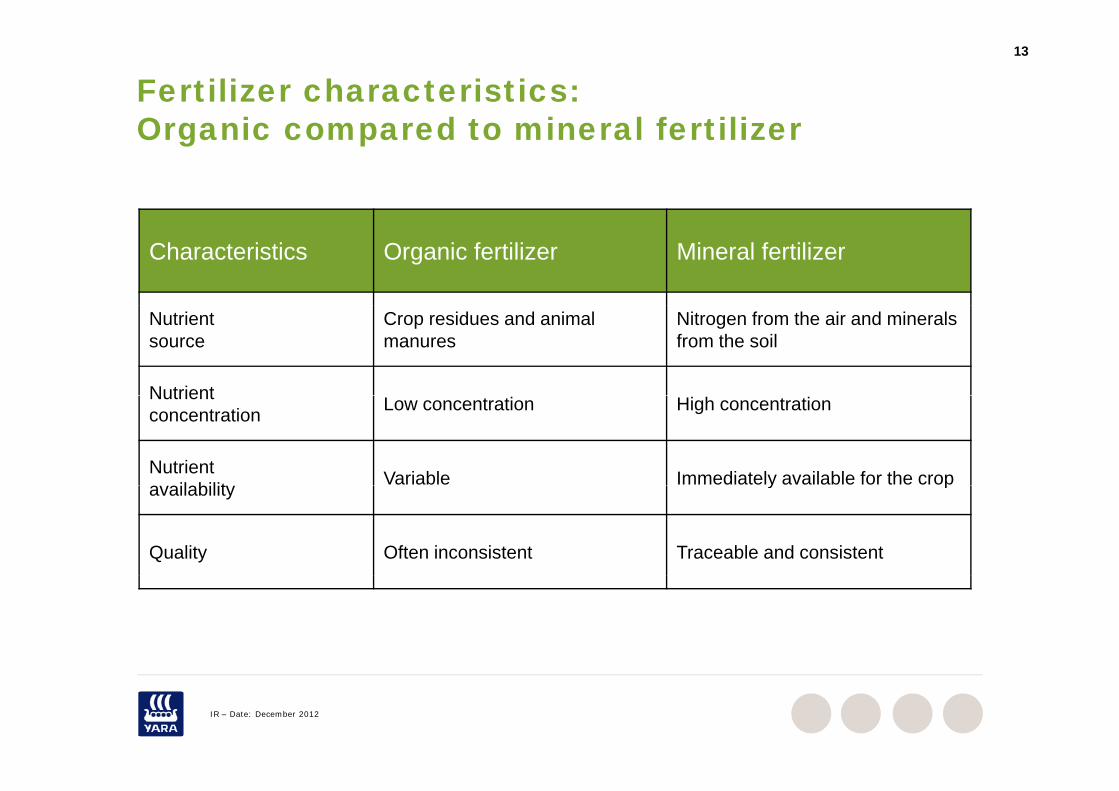
Fertilizer characteristics:Organic compared to mineral fertilizerOrganic compared to mineral fertilizer
Characteristics Organic fertilizer Mineral fertilizer
Nutrientsource
Crop residues and animal manures
Nitrogen from the air and minerals from the soil
NutrientNutrient concentration Low concentration High concentration
Nutrient il bilit Variable Immediately available for the cropavailability y p
Quality Often inconsistent Traceable and consistent
IR – Date: December 2012
14
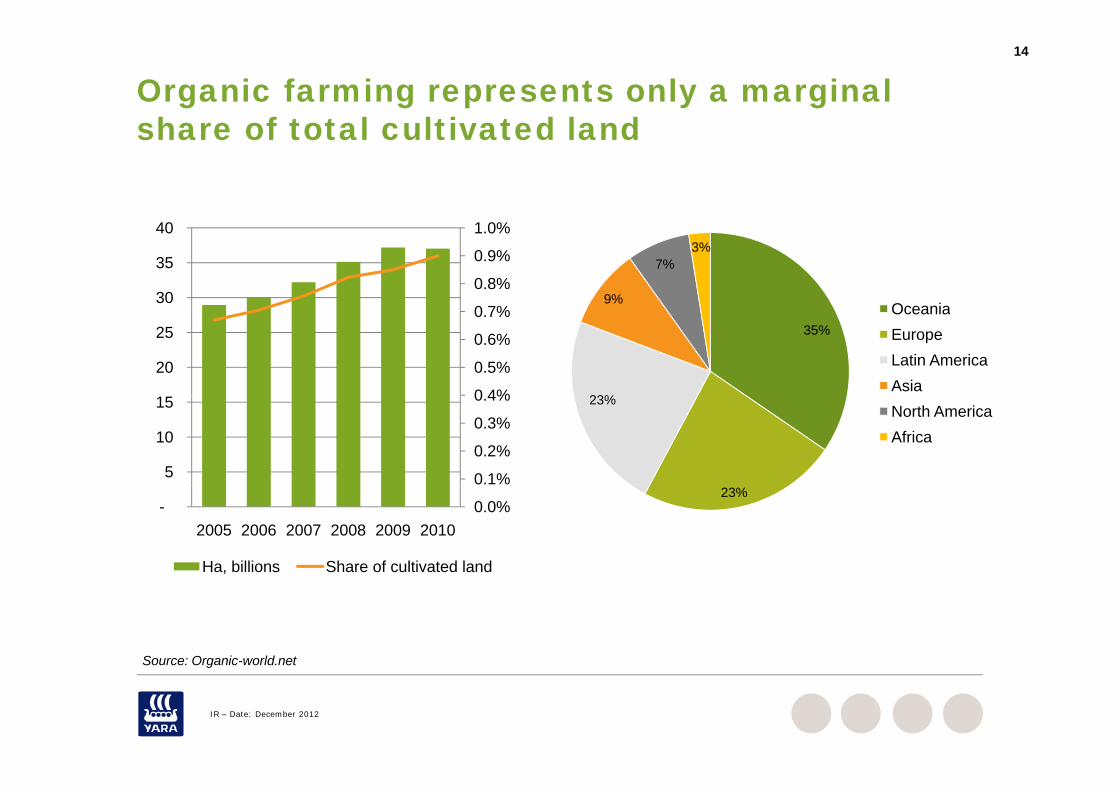
Organic farming represents only a marginal share of total cultivated landshare of total cultivated land
0 7%
0.8%
0.9%
1.0%
30
35
40
9%
7%3%
Oceania
0 4%
0.5%
0.6%
0.7%
20
25 35%
23%
OceaniaEuropeLatin AmericaAsia
0.1%
0.2%
0.3%
0.4%
5
10
15 23%North AmericaAfrica
0.0%-2005 2006 2007 2008 2009 2010
Ha, billions Share of cultivated land
23%
Source: Organic-world.net
IR – Date: December 2012
Source: Organic world.net
15
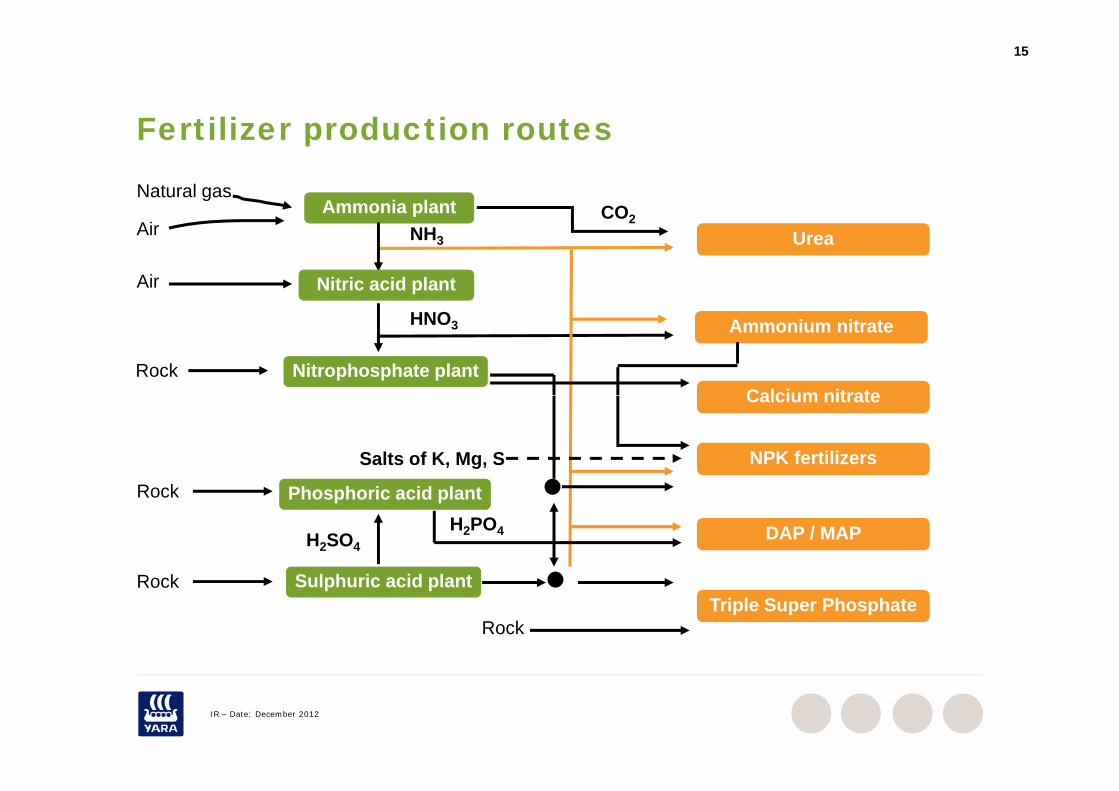
Fertilizer production routesFertilizer production routes
Ammonia plant CO2
Natural gasp
Nitric acid plant
NH3
CO2Urea Air
Air
Nitrophosphate plantRock
HNO3 Ammonium nitrate
Calcium nitrate
R k
Salts of K, Mg, S
Calcium nitrate
NPK fertilizers
Phosphoric acid plant
S l h i id l t
Rock
R k
H2PO4H2SO4DAP / MAP
Sulphuric acid plantRock
RockTriple Super Phosphate
IR – Date: December 2012
The fertilizer industry
17
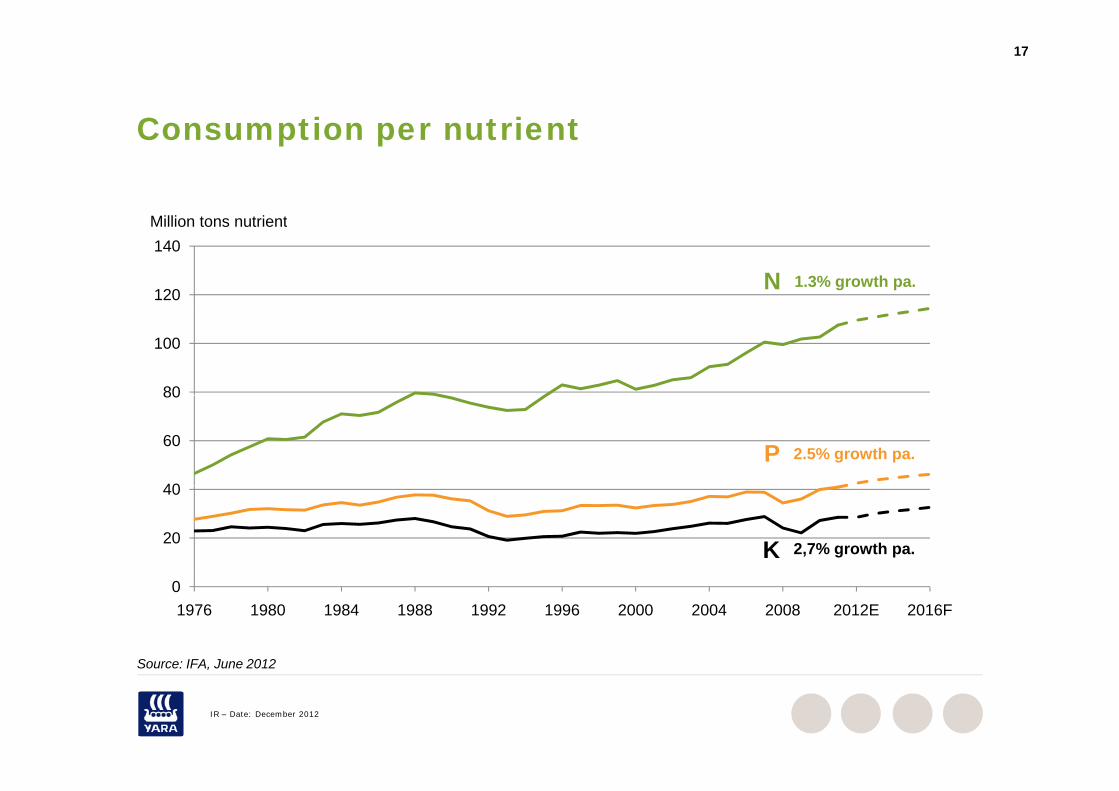
Consumption per nutrientConsumption per nutrient
Milli t t i t
120
140Million tons nutrient
N 1.3% growth pa.
80
100
40
60
80
2.5% growth pa.P
20
40
K 2,7% growth pa.
01976 1980 1984 1988 1992 1996 2000 2004 2008 2012E 2016F
Source: IFA June 2012
IR – Date: December 2012
Source: IFA, June 2012
18
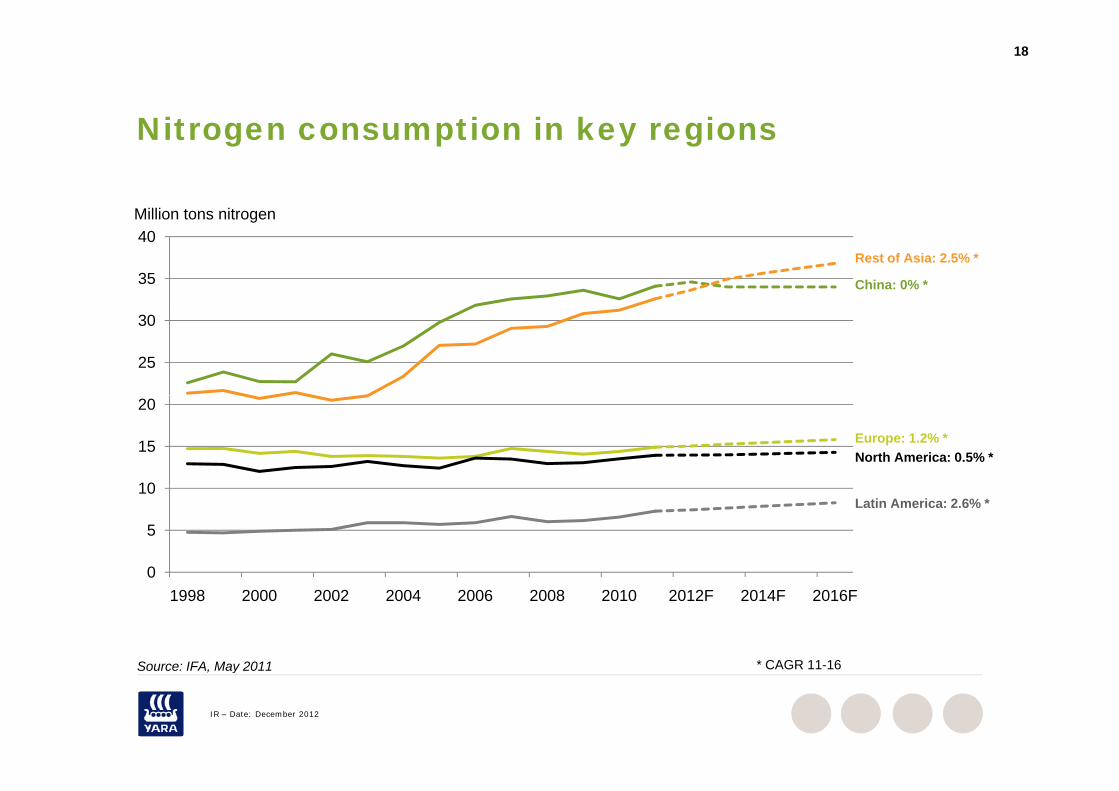
Nitrogen consumption in key regionsNitrogen consumption in key regions
Million tons nitrogen
35
40Million tons nitrogen
China: 0% *
Rest of Asia: 2.5% *
25
30
10
15
20
Europe: 1.2% *North America: 0.5% *
0
5
10Latin America: 2.6% *
01998 2000 2002 2004 2006 2008 2010 2012F 2014F 2016F
Source: IFA May 2011 * CAGR 11 16
IR – Date: December 2012
Source: IFA, May 2011 CAGR 11-16
19
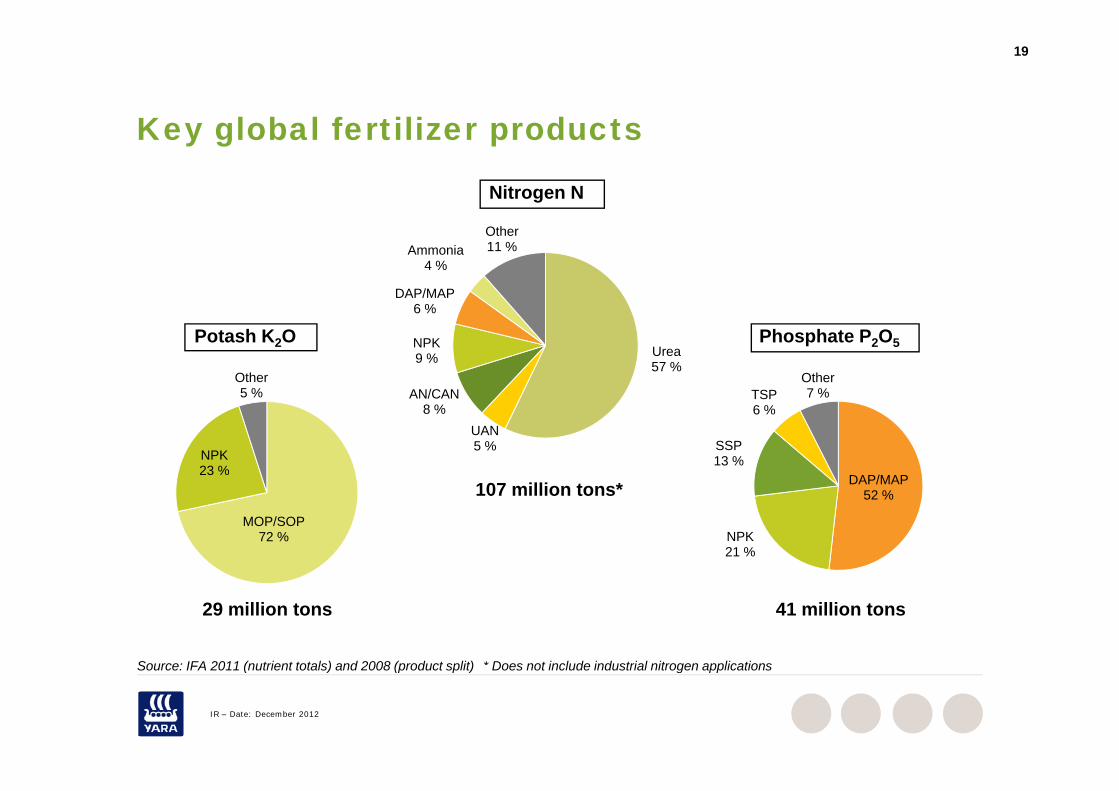
Key global fertilizer productsKey global fertilizer products
Nitrogen N
DAP/MAP6 %
Ammonia4 %
Other11 %
Urea57 %
AN/CAN
NPK9 %
6 %
Other5 % TSP
Other7 %
Potash K2O Phosphate P2O5
UAN5 %
AN/CAN8 %
NPK23 %
5 %
DAP/MAP
SSP13 %
TSP6 %
7 %
107 illi t *MOP/SOP
72 %
52 %
NPK21 %
107 million tons*
29 million tons 41 million tons
Source: IFA 2011 (nutrient totals) and 2008 (product split) * Does not include industrial nitrogen applications
IR – Date: December 2012
Source: IFA 2011 (nutrient totals) and 2008 (product split) Does not include industrial nitrogen applications
20
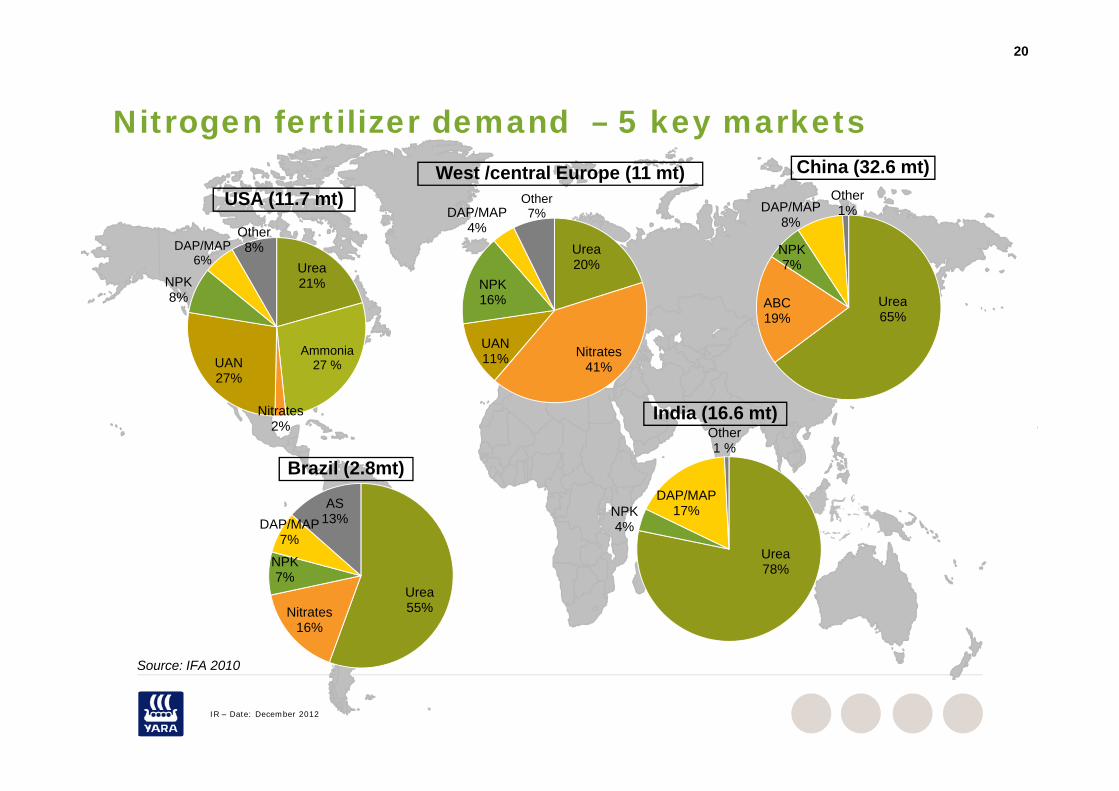
Nitrogen fertilizer demand – 5 key marketsNitrogen fertilizer demand 5 key marketsChina (32.6 mt)West /central Europe (11 mt)
USA (11.7 mt) DAP/MAPOther1%DAP/MAP
Other7%
Urea21%NPK
8%
DAP/MAP6%
Other8%
UreaABC
NPK7%
8%
Urea20%
NPK16%
DAP/MAP4%
7%
Ammonia27 %UAN
27%
Urea65%
ABC19%
Nitrates41%
UAN11%
India (16.6 mt)
Brazil (2.8mt)
Nitrates2% Other
1 %
NPK7%
DAP/MAP7%
AS13%
Urea78%
NPK4%
DAP/MAP17%
Source: IFA 2010
Urea55%Nitrates
16%
7%
IR – Date: December 2012
Source: IFA 2010
21
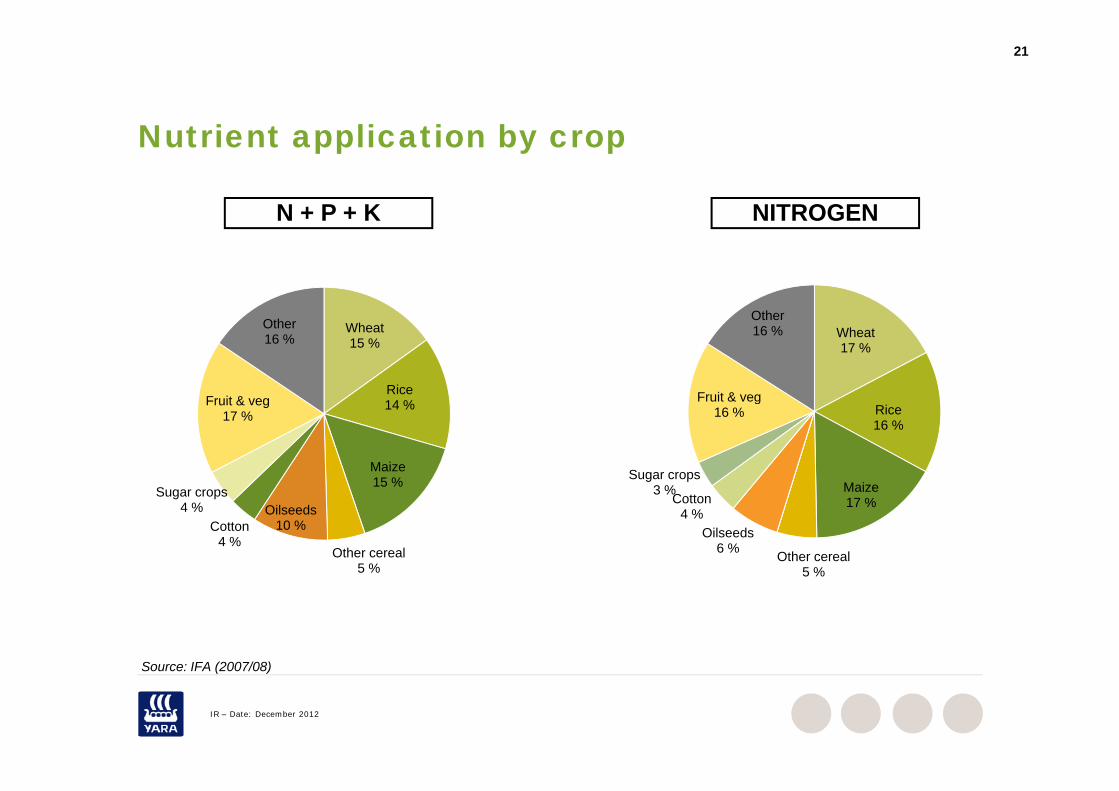
N t i t li ti b Nutrient application by crop
N + P + K NITROGENN + P + K NITROGEN
Wheat15 %
Rice&
Other16 % Wheat
17 %
Fruit & veg
Other16 %
14 %
Maize15 %
Fruit & veg17 % Rice
16 %
MaizeSugar crops
3 %
Fruit & veg16 %
15 %
Other cereal5 %
Oilseeds10 %Cotton
4 %
Sugar crops4 %
Maize17 %
Other cereal5 %
Oilseeds6 %
Cotton4 %
3 %
Source: IFA (2007/08)
5 %
IR – Date: December 2012
Source: IFA (2007/08)
22
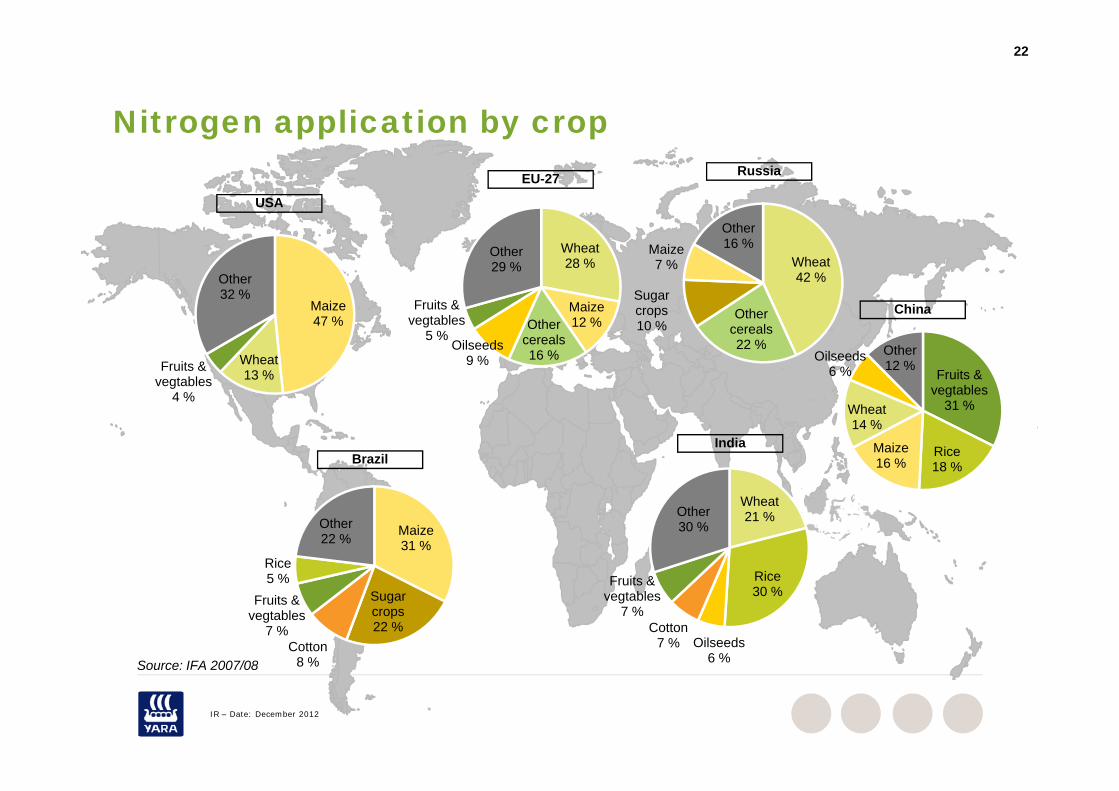
Nitrogen application by cropNitrogen application by cropRussiaEU-27
USA
Wheat42 %
Sugar
Maize7 %
Other16 %
Maize
Other32 %
Wheat28 %
MaizeFruits &
Other29 %
ChiOther cereals22 %
crops10 %
Maize47 %
Wheat13 %Fruits &
vegtables4 %
Maize12 %Other
cereals16 %
Oilseeds9 %
Fruits & vegtables
5 %
China
Fruits & vegtables
Oilseeds6 %
Other12 %
IndiaBrazil
4 % g31 %
Rice18 %
Maize16 %
Wheat14 %
Wheat21 %
Rice
Other30 %Maize
31 %Rice5 %
Other22 %
Rice30 %
Oilseeds6 %
Cotton7 %
Fruits & vegtables
7 %
Source: IFA 2007/08
Sugar crops22 %
Cotton8 %
Fruits & vegtables
7 %
5 %
IR – Date: December 2012
Source: IFA 2007/08 8 %
23
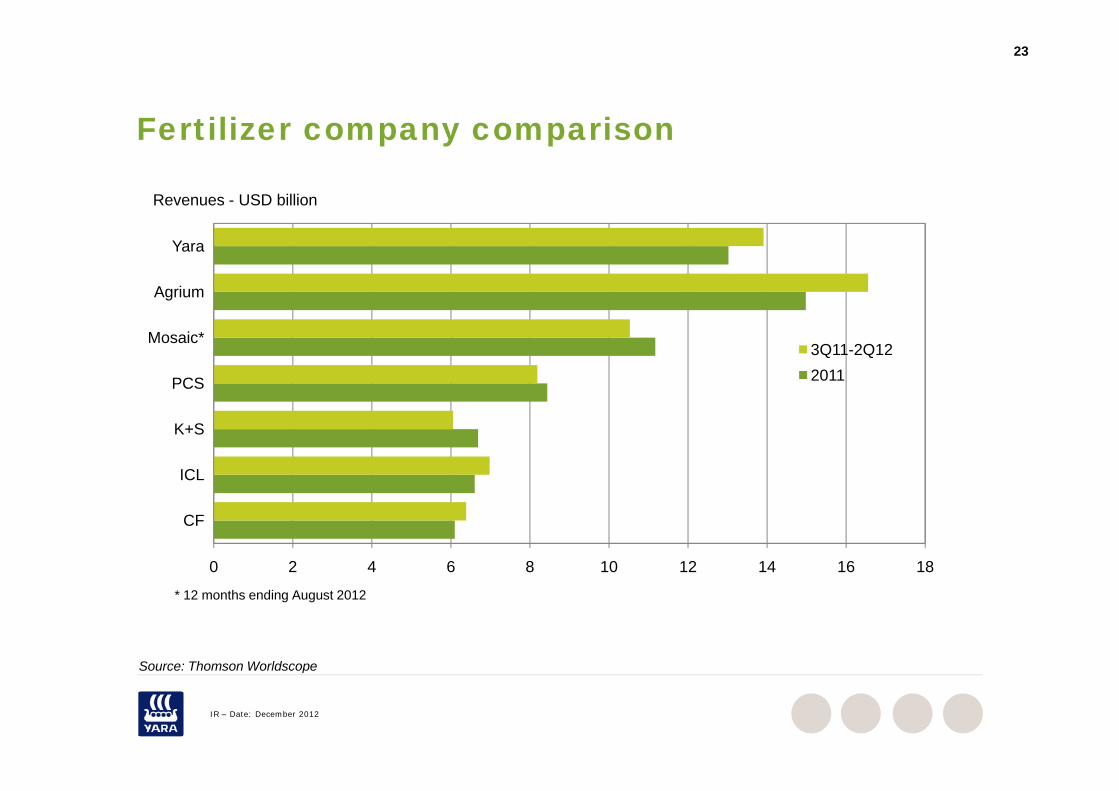
Fertilizer company comparisonFertilizer company comparison
Revenues - USD billion
Agrium
Yara
PCS
Mosaic*3Q11-2Q122011
ICL
K+S
0 2 4 6 8 10 12 14 16 18
CF
Source: Thomson Worldscope
* 12 months ending August 2012
IR – Date: December 2012
Source: Thomson Worldscope
24
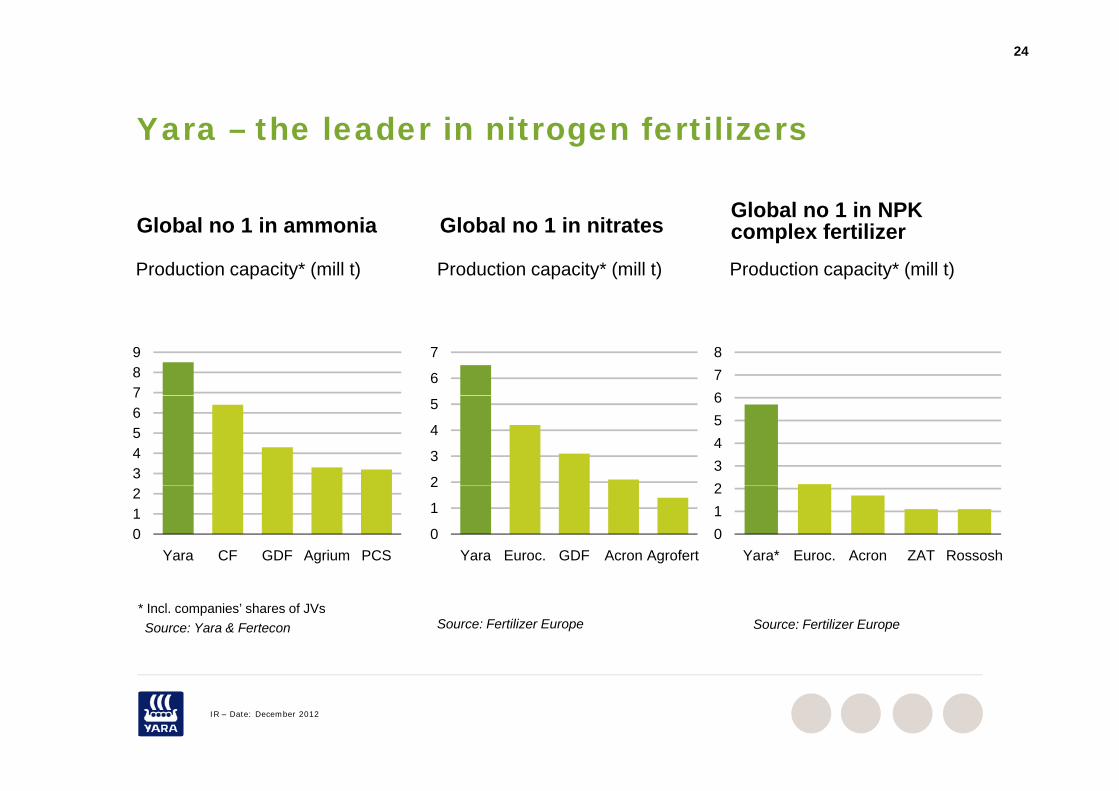
Yara the leader in nitrogen fertilizersYara – the leader in nitrogen fertilizers
Global no 1 in NPK
Production capacity* (mill t)
Global no 1 in ammonia Global no 1 in nitratesGlobal no 1 in NPK complex fertilizer
Production capacity* (mill t) Production capacity* (mill t)
789
678
6
7
34567
23456
2
3
4
5
012
Yara CF GDF Agrium PCS012
Yara* Euroc. Acron ZAT Rossosh0
1
2
Yara Euroc. GDF Acron Agrofert
* Incl. companies’ shares of JVsSource: Yara & Fertecon Source: Fertilizer EuropeSource: Fertilizer Europe
IR – Date: December 2012
25
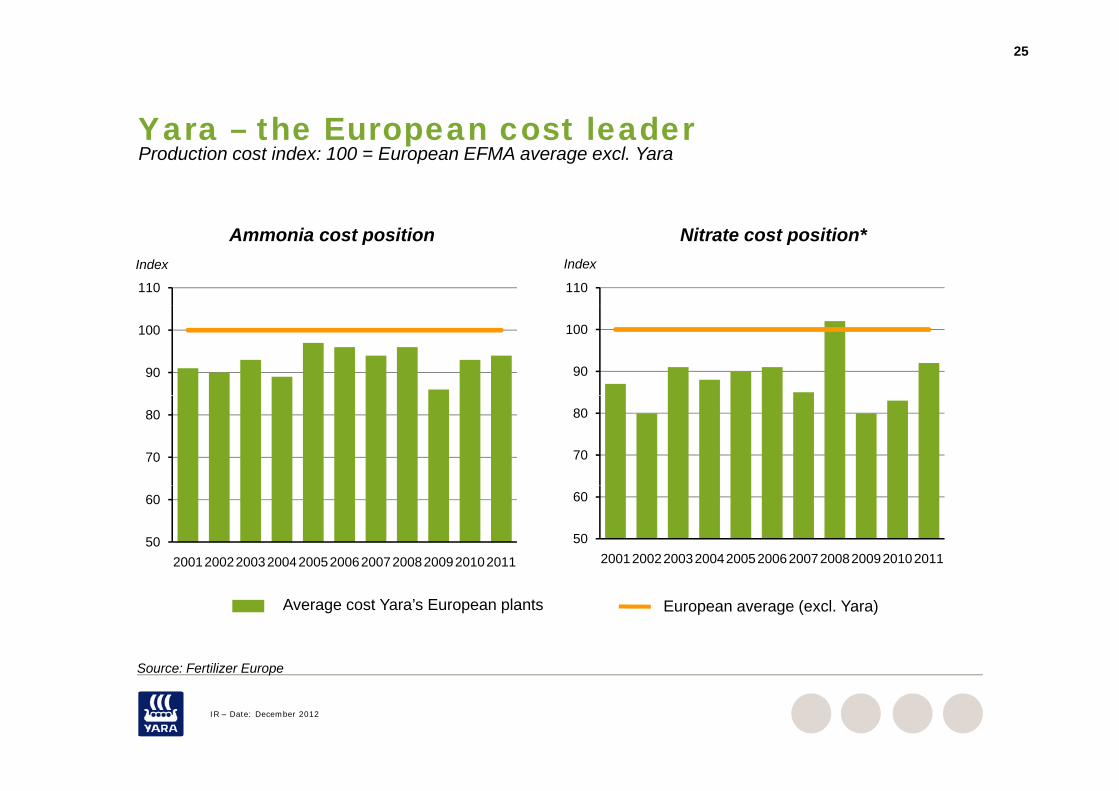
Yara the European cost leaderYara – the European cost leaderProduction cost index: 100 = European EFMA average excl. Yara
Ammonia cost position Nitrate cost position*Index Index
110 110
90
100
90
100
70
80
70
80
50
60
20012002200320042005200620072008200920102011
50
60
20012002200320042005200620072008200920102011
Average cost Yara’s European plants European average (excl. Yara)
S F tili E
IR – Date: December 2012
Source: Fertilizer Europe
Fertilizer industry dynamicse t e dust y dy a cs
27
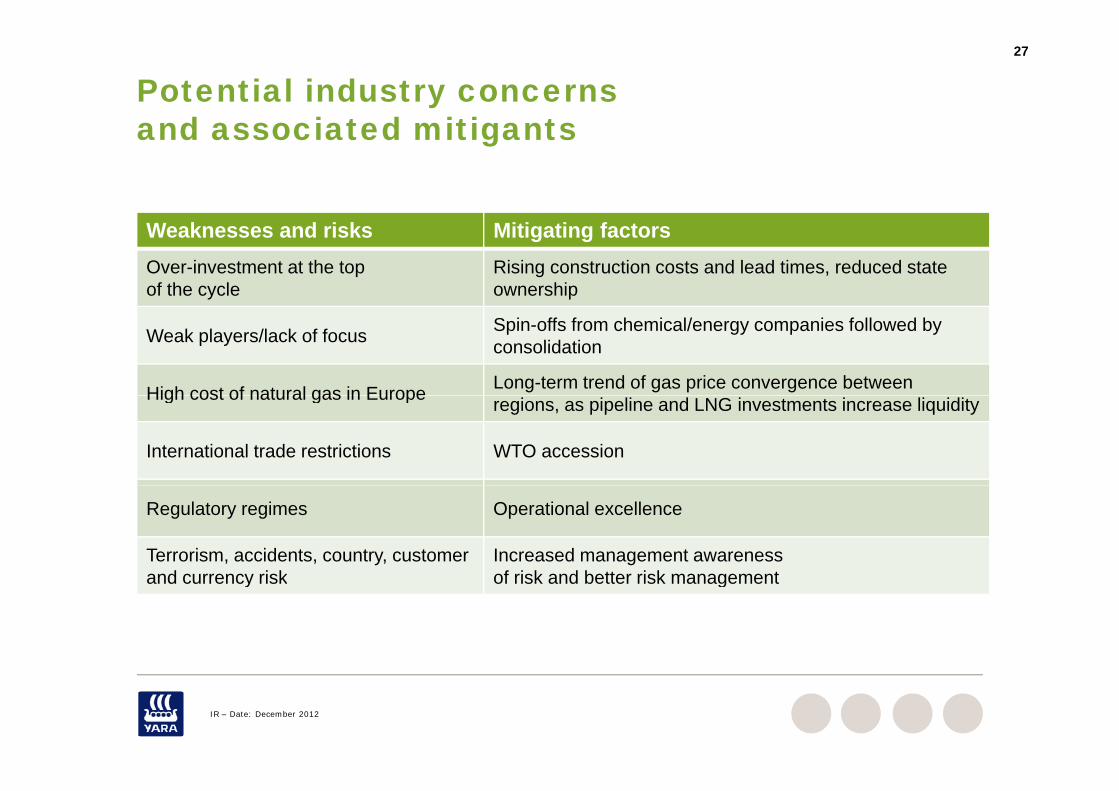
Potential industry concernsand associated mitigantsand associated mitigants
Weaknesses and risks Mitigating factorsOver-investment at the top of the cycle
Rising construction costs and lead times, reduced state ownership
Weak players/lack of focus Spin-offs from chemical/energy companies followed by consolidation
High cost of natural gas in Europe Long-term trend of gas price convergence between High cost of natural gas in Europe regions, as pipeline and LNG investments increase liquidity
International trade restrictions WTO accession
Regulatory regimes Operational excellence
Terrorism, accidents, country, customer and currency risk
Increased management awareness of risk and better risk managementand currency risk of risk and better risk management
IR – Date: December 2012
A iAmmonia
29
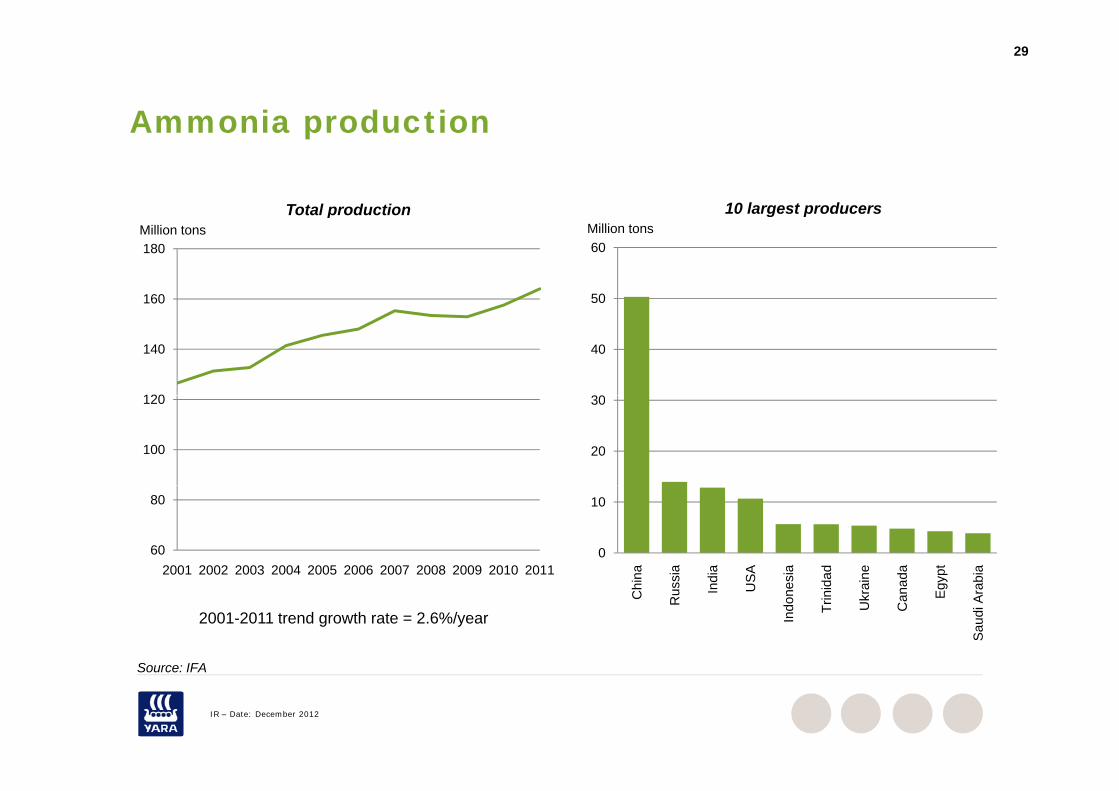
Ammonia productionAmmonia production
Total production 10 largest producers
160
180Million tons
p
50
60Million tons
g p
120
140
30
40
100
120
20
30
60
80
2001 2002 2003 2004 2005 2006 2007 2008 2009 2010 20110
10
na ia ia SA ia ad ne da pt ia
S IFA
2001-2011 trend growth rate = 2.6%/yearC
hin
Rus
s
Ind
US
Indo
nes
Trin
ida
Ukr
ain
Can
ad
Egy
Sau
di A
rab
IR – Date: December 2012
Source: IFA
30
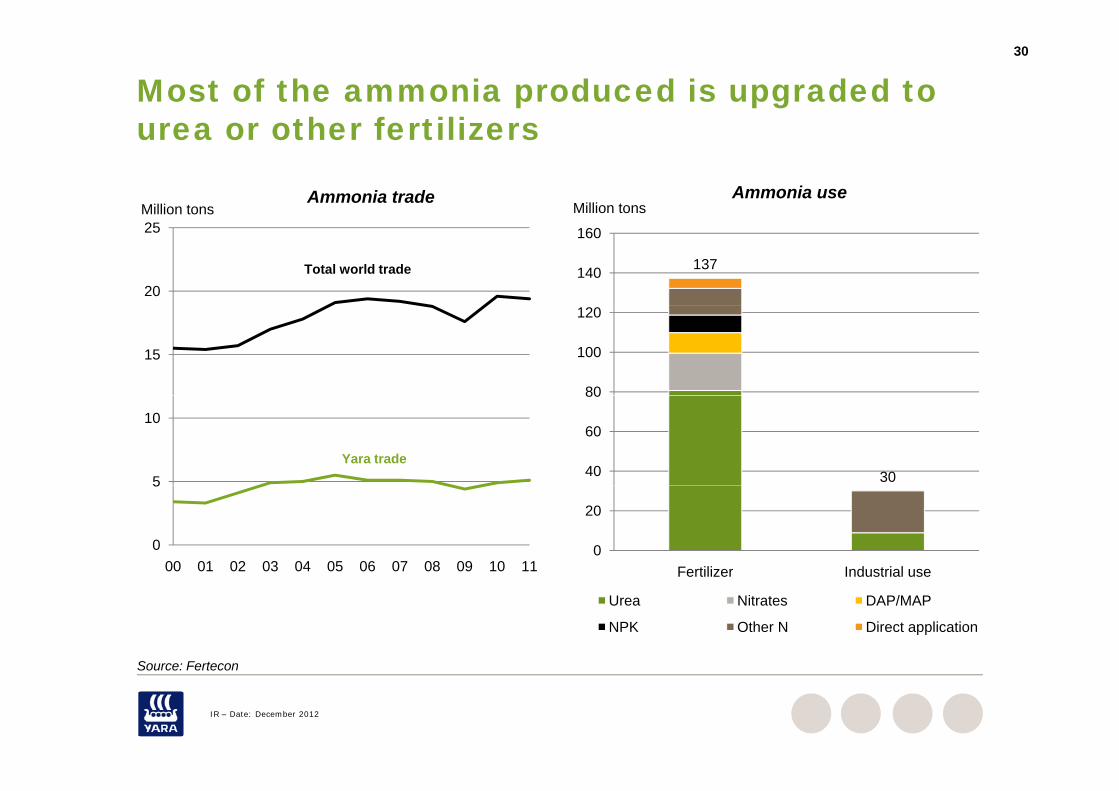
Most of the ammonia produced is upgraded to urea or other fertilizersurea or other fertilizers
Million tonsAmmonia use
Million tonsAmmonia trade
137140
160
20
25
Total world trade
80
100
120
15
3040
60
80
5
10
Yara trade
0
20
Fertilizer Industrial use
0
5
00 01 02 03 04 05 06 07 08 09 10 11 Fertilizer Industrial use
Urea Nitrates DAP/MAP
NPK Other N Direct application
TotalSource: Fertecon
IR – Date: December 2012
Source: Fertecon
31
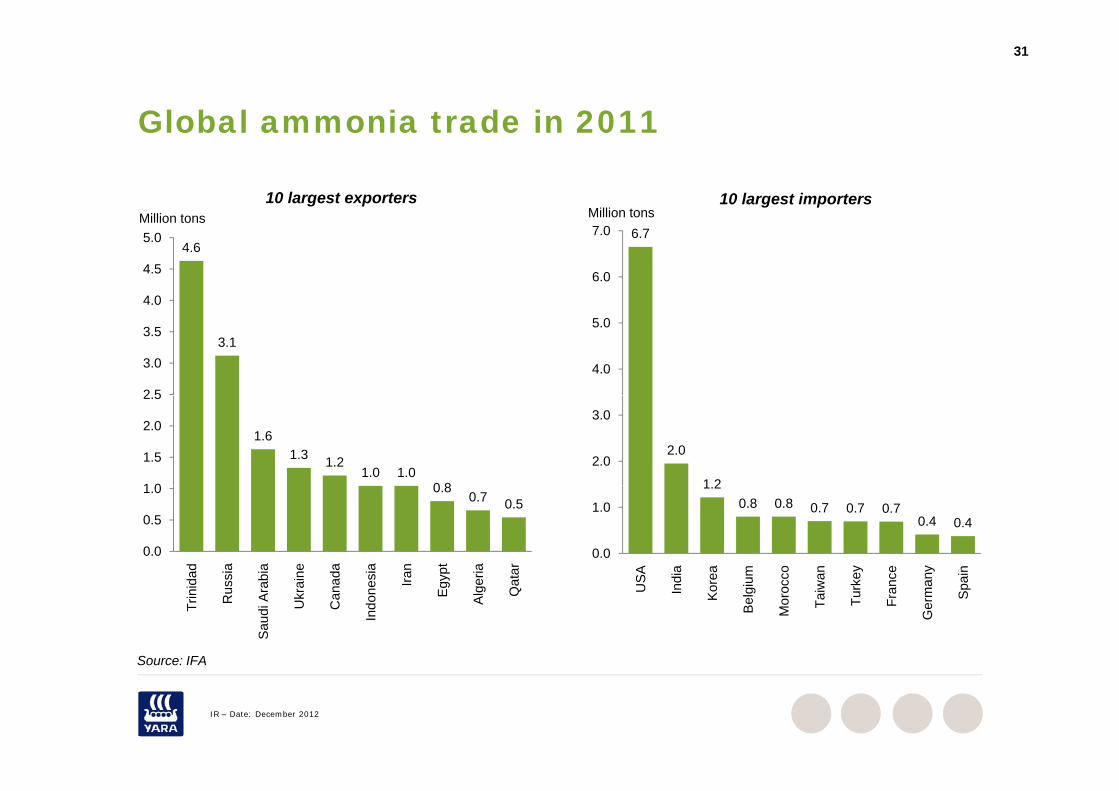
Global ammonia trade in 2011Global ammonia trade in 2011
Million tons10 largest exporters
Million tons10 largest importers
4.6
4.0
4.5
5.0Million tons
6.7
6.0
7.0Million tons
3.1
2 5
3.0
3.5
4.0
5.0
1.61.3 1.2
1.0 1.00 81 0
1.5
2.0
2.5
2.0
1 2
2.0
3.0
0.80.7 0.5
0.0
0.5
1.0
ad sia
bia ne da sia an ypt
ria ar
1.20.8 0.8 0.7 0.7 0.7
0.4 0.4
0.0
1.0
SA ia ea m co an ey ce ny in
Source: IFA
Trin
ida
Rus
s
Sau
di A
rab
Ukr
ain
Can
ad
Indo
nes Ira
Egy
Alg
er
Qat US
Ind
Kor
e
Bel
gium
Mor
occ
Taiw
a
Turk
e
Fran
c
Ger
man
Spa
IR – Date: December 2012
Source: IFA
32
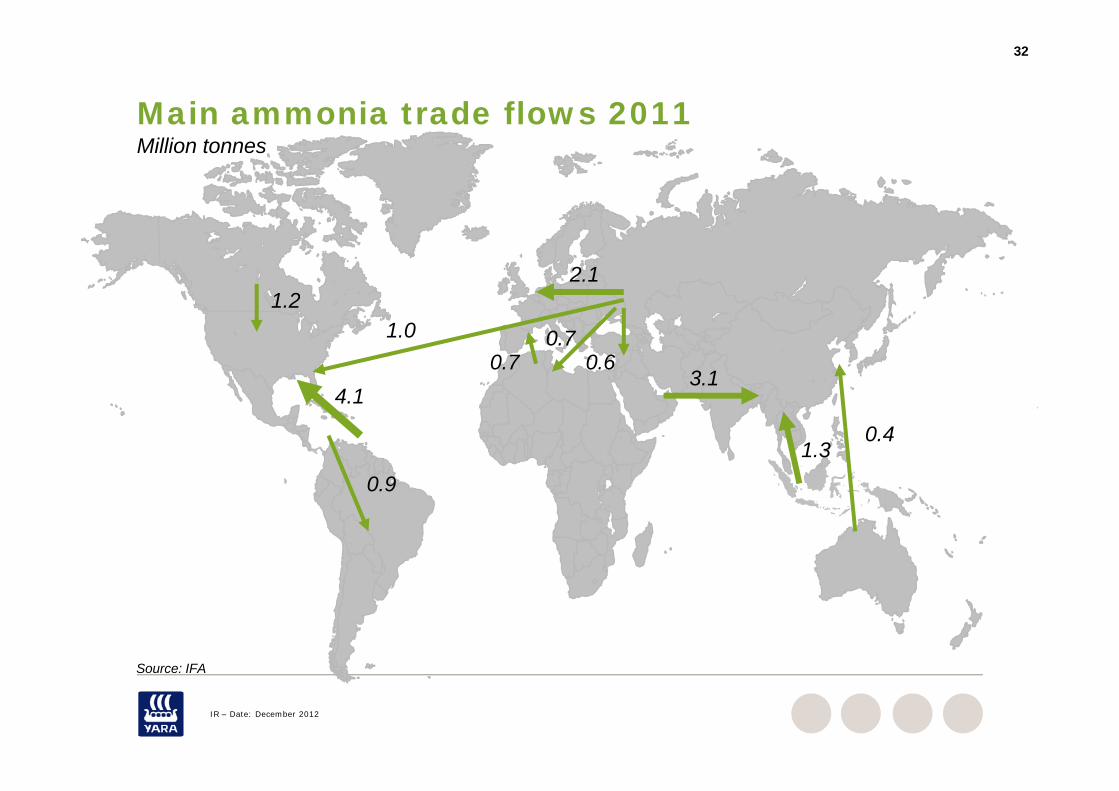
Main ammonia trade flows 2011Million tonnes
2.11.2
1.0 0.70.6
1.2
4 10.7
3.14.1
0 91.3
0.4
0.9
S IFA
IR – Date: December 2012
Source: IFA
Urea
34
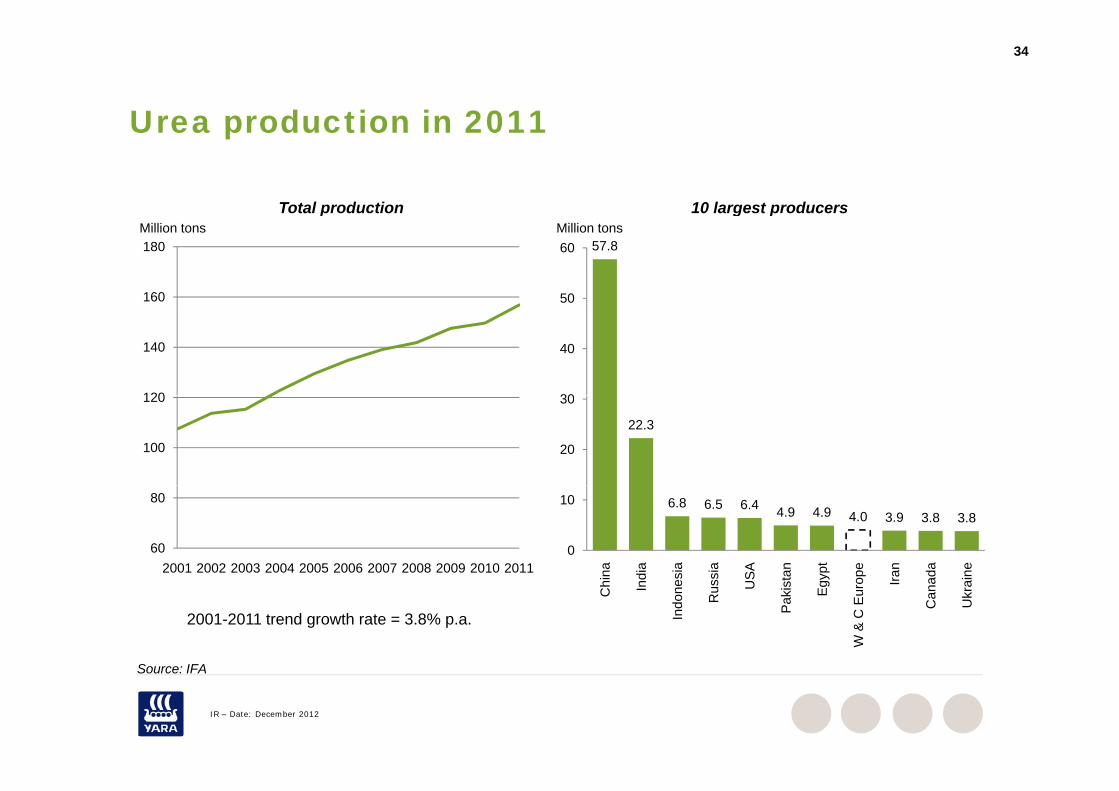
Urea production in 2011Urea production in 2011
10 largest producersTotal production
57.8
50
60Million tons
g p
160
180Million tons
p
30
40
120
140
22.3
20
30
100
120
6.8 6.5 6.4 4.9 4.9 4.0 3.9 3.8 3.8
0
10
na dia
sia
sia
SA an ypt
pe an da ne
60
80
2001 2002 2003 2004 2005 2006 2007 2008 2009 2010 2011
S IFA
Chi
n
Ind
Indo
nes
Rus
s
US
Paki
sta
Egy
W &
C E
urop Ira
Can
ad
Ukr
ain
2001-2011 trend growth rate = 3.8% p.a.
IR – Date: December 2012
Source: IFA
35
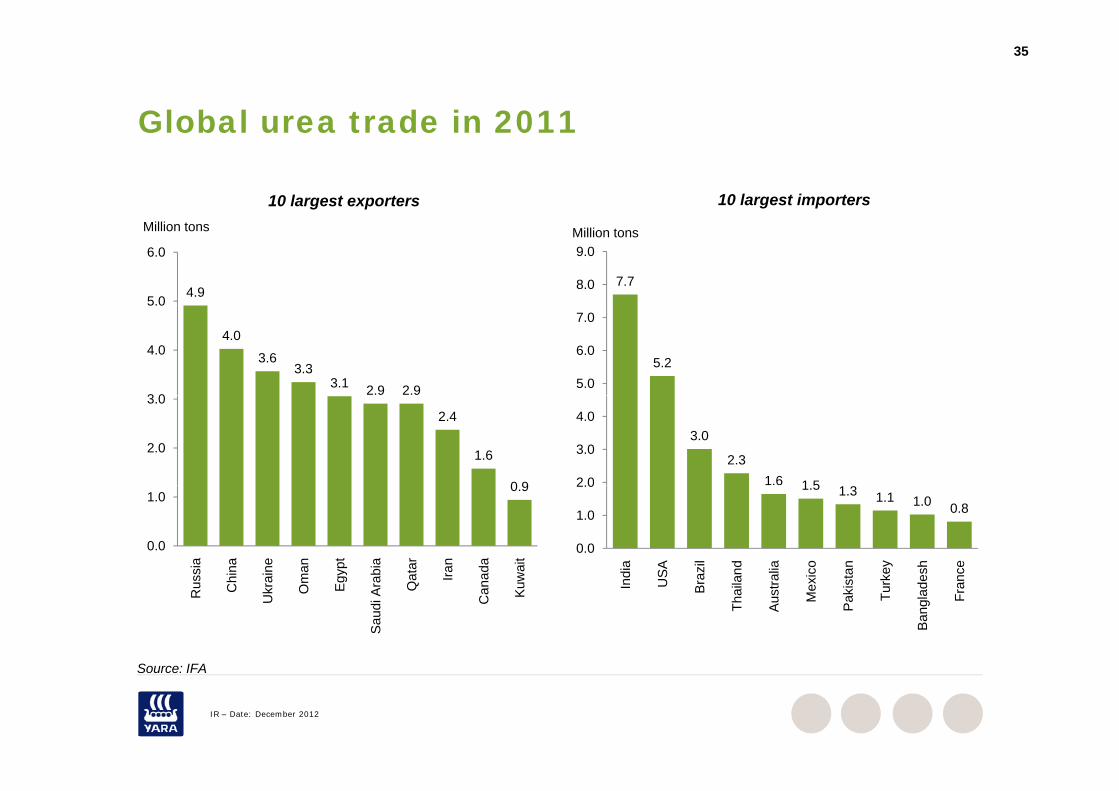
Global urea trade in 2011Global urea trade in 2011
10 largest exporters 10 largest importers
4.95.0
6.0
Million tons
7.78.0
9.0Million tons
4.0
3.63.3
3.1 2.9 2.93 0
4.05.2
5.0
6.0
7.0
2.4
1.6
0 9
2.0
3.0
3.0
2.31.6 1 52 0
3.0
4.0
0.9
0.0
1.0
sia
ina
ine
man yp
t
bia
atar ran
ada
wai
t
1.5 1.3 1.1 1.0 0.8
0.0
1.0
2.0
dia
SA azil
nd alia co tan
key
esh ce
S IFA
Rus Ch
Ukr
a
Om Eg
y
Sau
di A
ra Qa Ir
Can
a
Kuw Ind
US
Bra
Thai
la
Aus
tr a
Mex
i
Pak
ist
Turk
Ban
glad
e
Fran
IR – Date: December 2012
Source: IFA
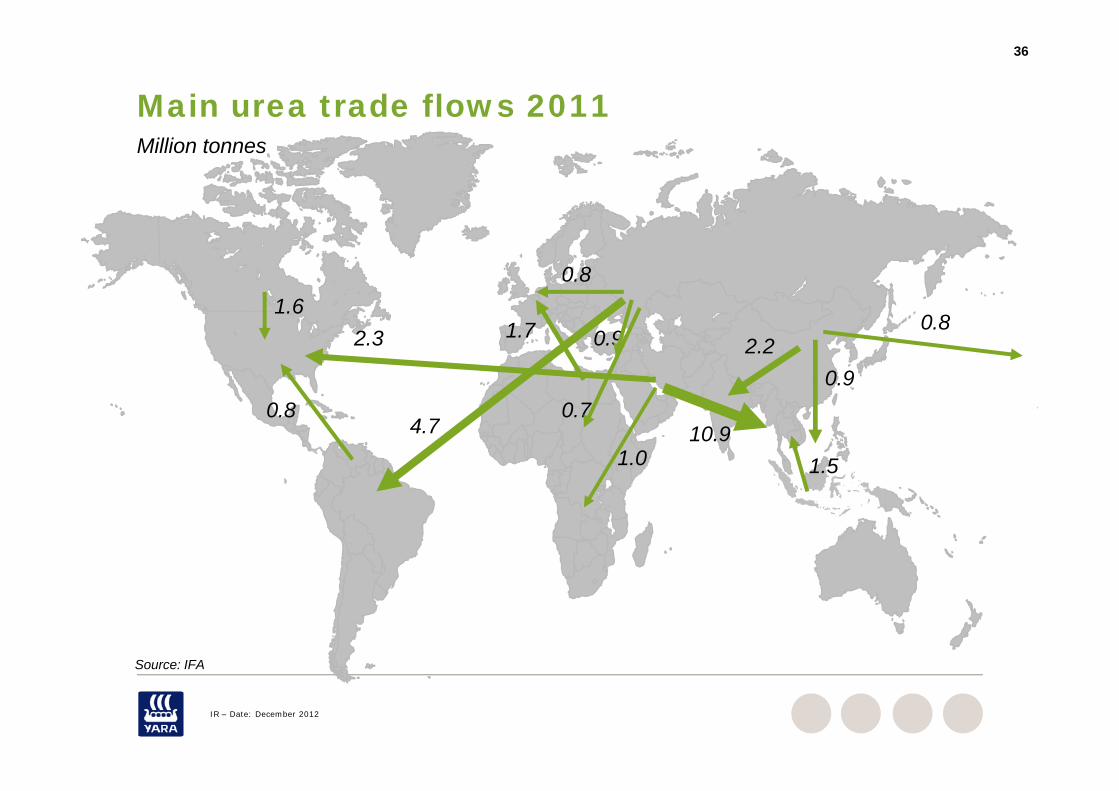
36
Main urea trade flows 2011Million tonnes
0.81 6
2.3 1.7 0.91.6
0.9
0.82.2
10.91.0
0.84.7
1.5
0.7
Source: IFA
IR – Date: December 2012
Source: IFA
37
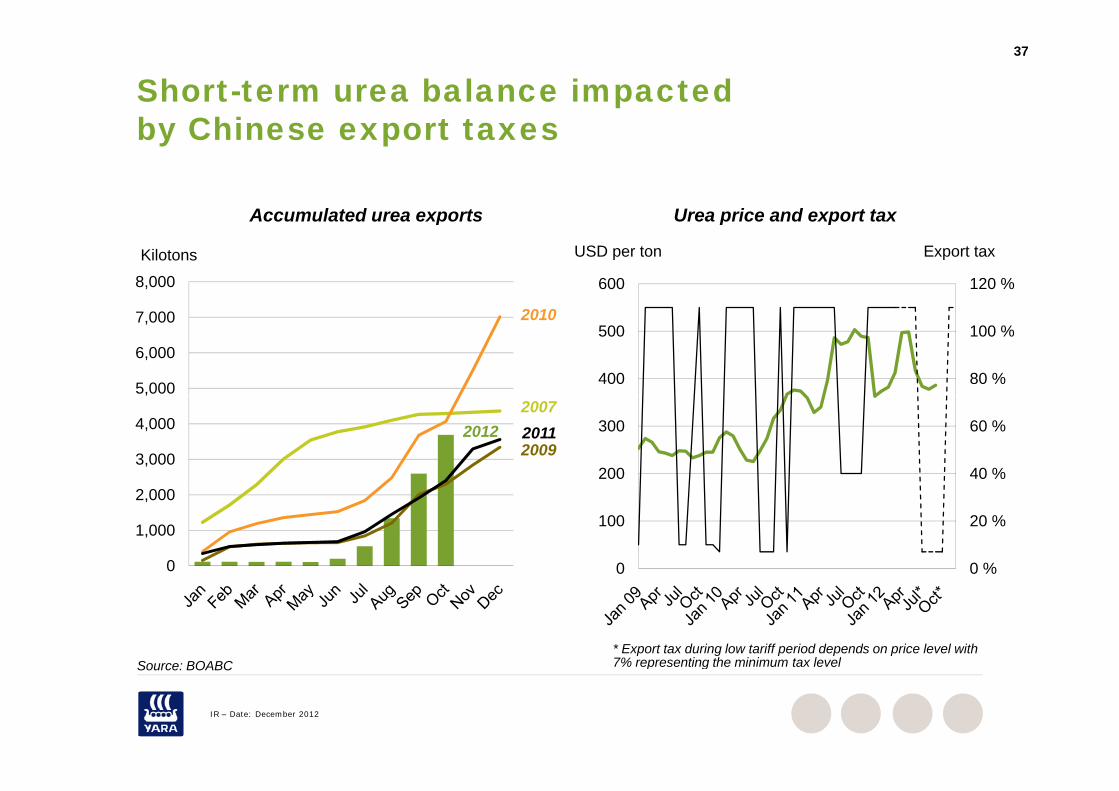
Short-term urea balance impactedby Chinese export taxesby Chinese export taxes
Accumulated urea exports Urea price and export tax
8,000
Kilotons
120 %600
USD per ton Export tax
Accumulated urea exports Urea price and export tax
5,000
6,000
7,000
80 %
100 %
400
5002010
3,000
4,000
,2007
40 %
60 %
200
300201120122009
0
1,000
2,000
0 %
20 %
0
100
Source: BOABC* Export tax during low tariff period depends on price level with 7% representing the minimum tax level
IR – Date: December 2012
Source: BOABC 7% representing the minimum tax level
38
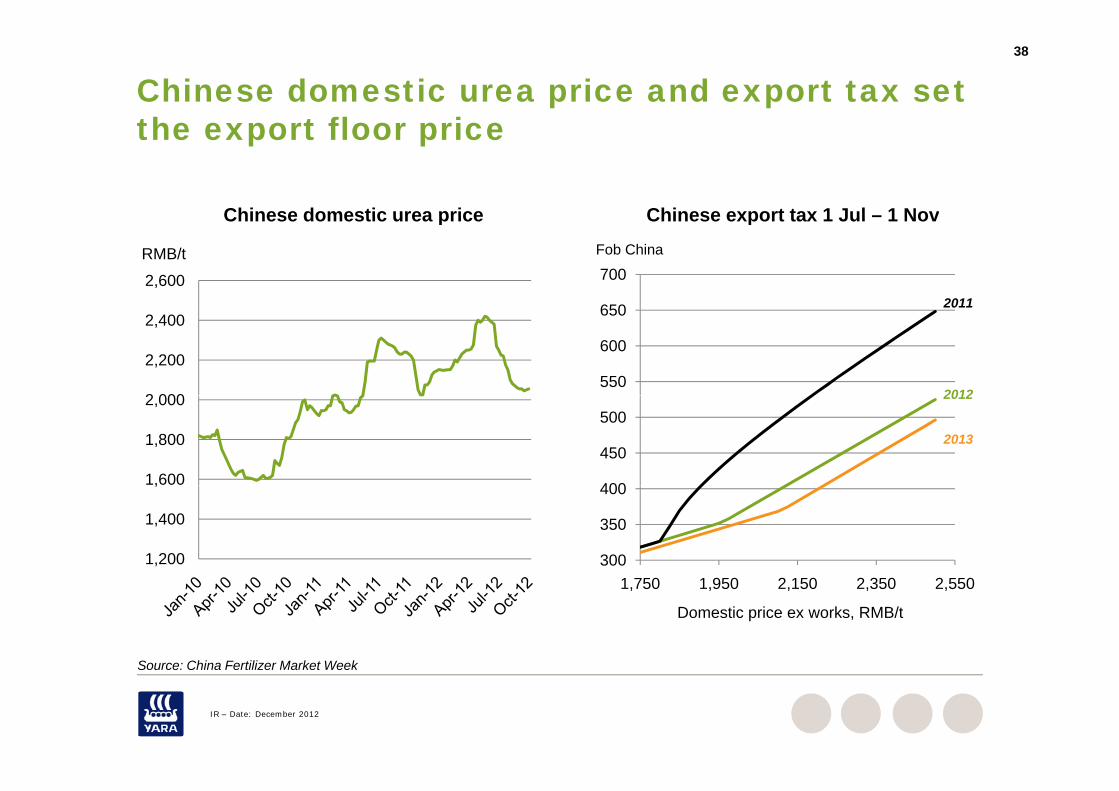
Chinese domestic urea price and export tax setthe export floor pricethe export floor price
Chinese export tax 1 Jul – 1 NovChinese domestic urea price
2,600
RMB/t
650
700Fob China
Chinese export tax 1 Jul – 1 NovChinese domestic urea price
2011
2 000
2,200
2,400
550
600
650 2011
2012
1,600
1,800
2,000
400
450
5002012
2013
1,200
1,400
,
300
350
400
Source: China Fertilizer Market Week
1,750 1,950 2,150 2,350 2,550
Domestic price ex works, RMB/t
IR – Date: December 2012
Source: China Fertilizer Market Week
I d l d iIndustry value drivers
40
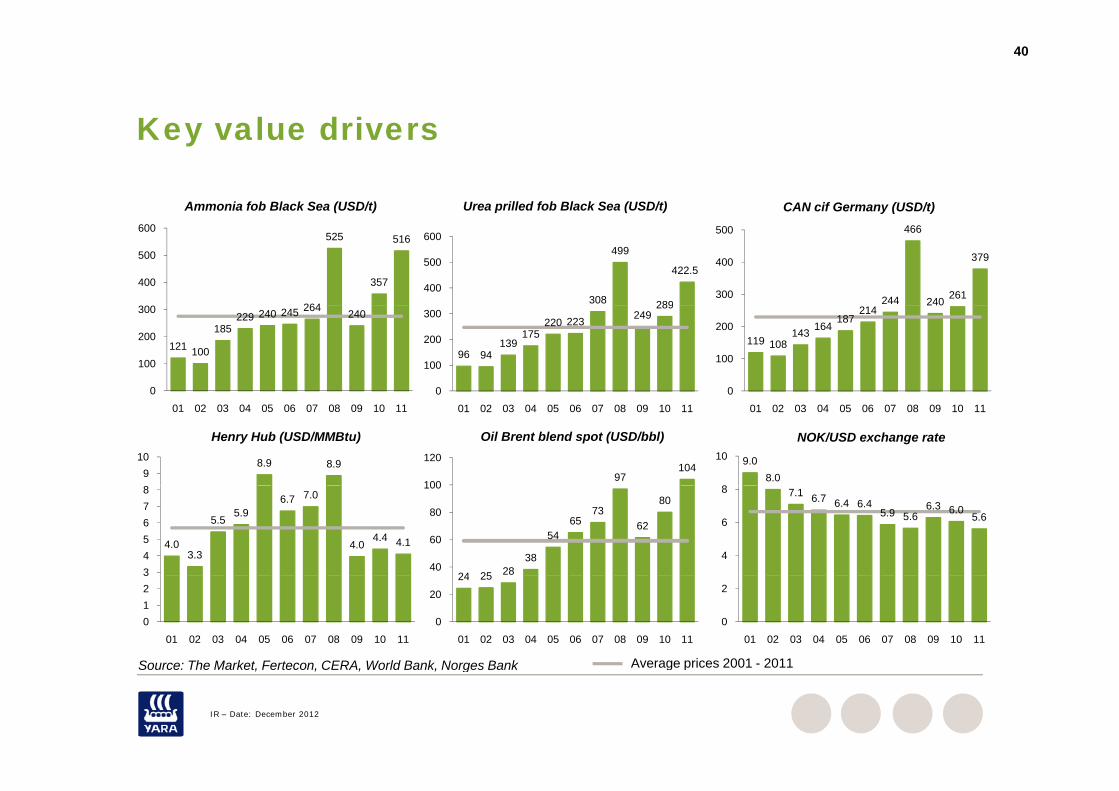
Key value driversKey value drivers
Ammonia fob Black Sea (USD/t) Urea prilled fob Black Sea (USD/t) CAN cif Germany (USD/t)
264
525
357
516
300
400
500
600
308
499
289
422.5400
500
600
244
466
240 261
379
300
400
500
121 100
185229 240 245 264 240
0
100
200
300
96 94139
175220 223 249
289
0
100
200
300
119 108143 164
187214
0
100
200
9.08.0
8
10
NOK/USD exchange rate
01 02 03 04 05 06 07 08 09 10 11 01 02 03 04 05 06 07 08 09 10 11 01 02 03 04 05 06 07 08 09 10 11
8.9 8.99
10
Henry Hub (USD/MMBtu)
97104
100
120
Oil Brent blend spot (USD/bbl)
7.1 6.7 6.4 6.45.9 5.6
6.3 6.05.6
4
6
8
4.03.3
5.55.9
6.7 7.0
4.04.4 4.1
345678
24 25 2838
5465
7362
80
40
60
80
100
0
2
01 02 03 04 05 06 07 08 09 10 110123
01 02 03 04 05 06 07 08 09 10 11
24 25
0
20
01 02 03 04 05 06 07 08 09 10 11
Average prices 2001 - 2011Source: The Market Fertecon CERA World Bank Norges Bank
IR – Date: December 2012
Average prices 2001 2011Source: The Market, Fertecon, CERA, World Bank, Norges Bank
41
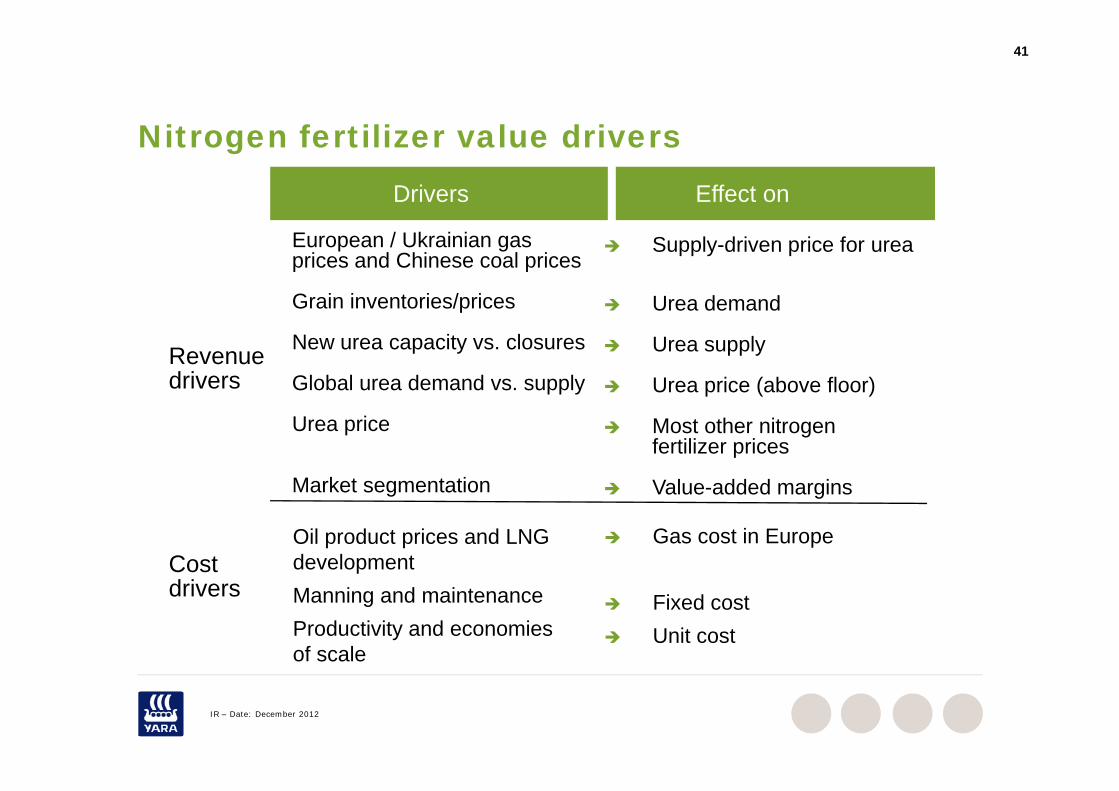
Nit f tili l d iNitrogen fertilizer value driversDrivers Effect on
Supply-driven price for urea
Urea demand
European / Ukrainian gas prices and Chinese coal prices
Grain inventories/prices Urea demand
Urea supply
Urea price (above floor)
Grain inventories/prices
New urea capacity vs. closures
Global urea demand vs. supplyRevenuedrivers p ( )
Most other nitrogenfertilizer prices
Value added margins
Urea price
Market segmentation Value-added marginsMarket segmentation
Gas cost in EuropeOil product prices and LNG developmentCost
Fixed cost Unit cost
Manning and maintenanceProductivity and economies of scale
drivers
IR – Date: December 2012

Drivers of demand
43
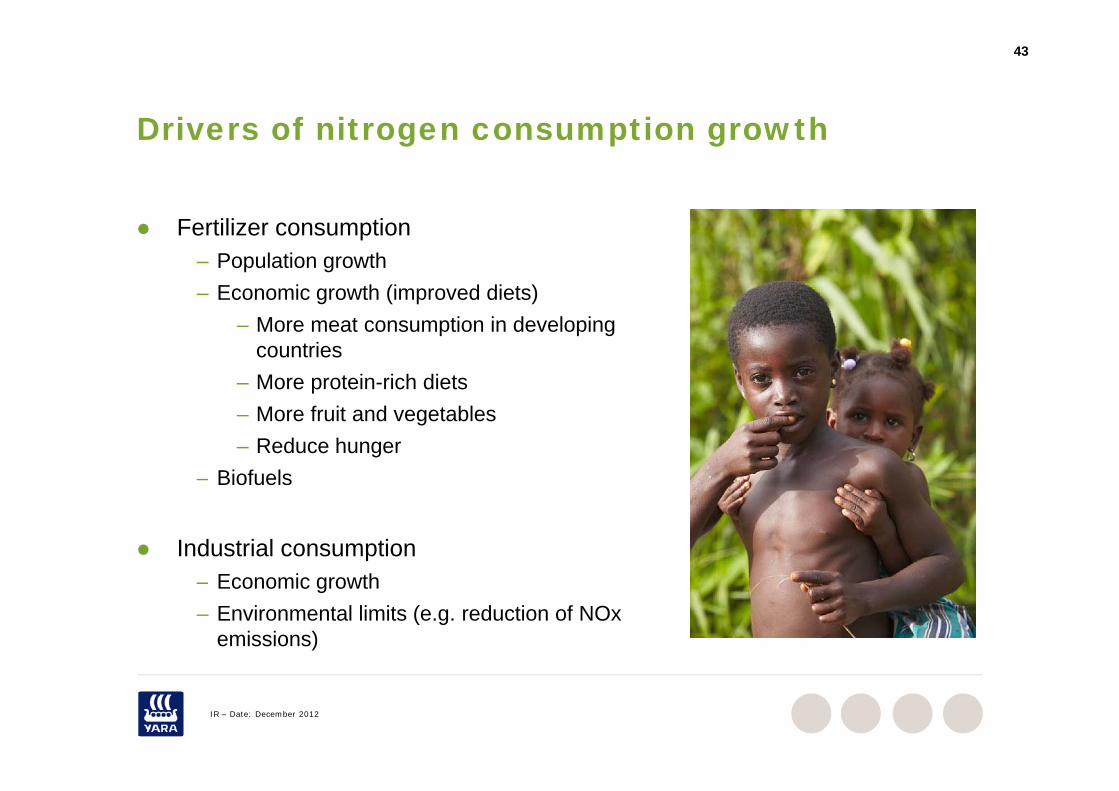
Drivers of nitrogen consumption growthDrivers of nitrogen consumption growth
Fertilizer consumption– Population growth– Economic growth (improved diets)
– More meat consumption in developing countries
– More protein-rich diets– More fruit and vegetables– Reduce hunger
– Biofuels
Industrial consumptionE i th– Economic growth
– Environmental limits (e.g. reduction of NOxemissions)
IR – Date: December 2012
44
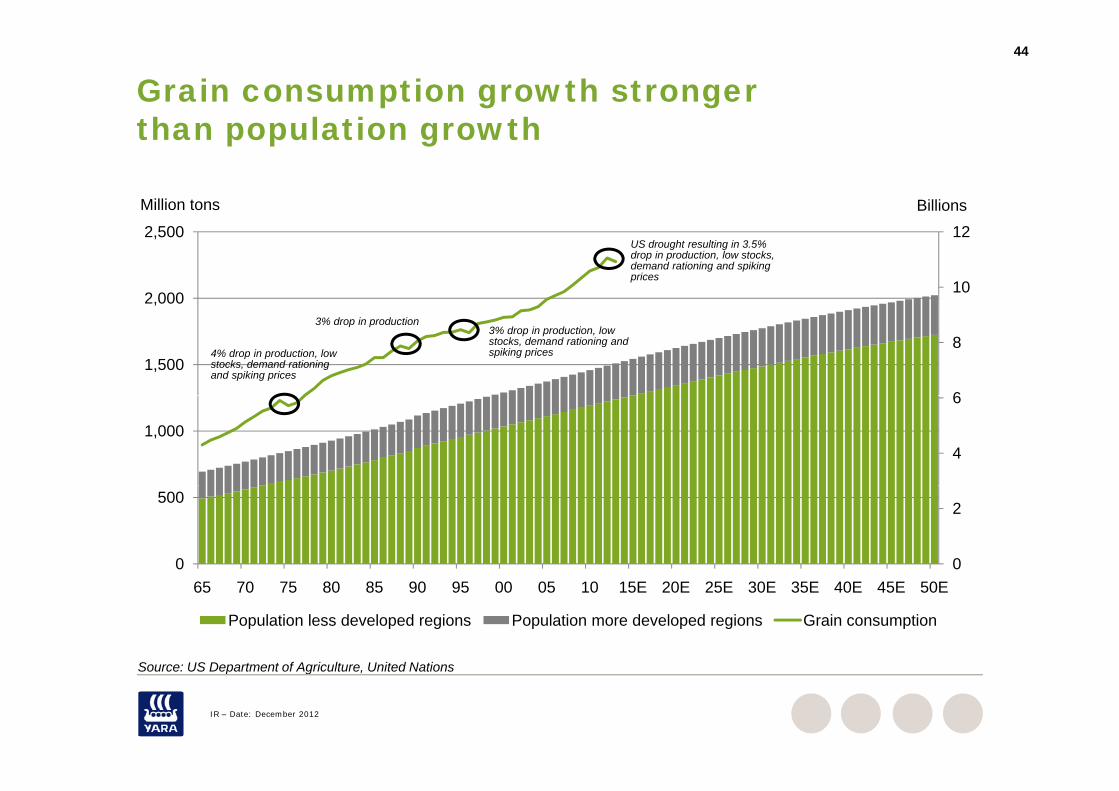
Grain consumption growth stronger than population growth
BillionsMillion tons
than population growth
10
12
2,000
2,500US drought resulting in 3.5% drop in production, low stocks, demand rationing and spiking prices
6
81,500
4% drop in production, low stocks, demand rationing and spiking prices
3% drop in production3% drop in production, low stocks, demand rationing and spiking prices
4
6
1,000
0
2
0
500
65 70 75 80 85 90 95 00 05 10 15E 20E 25E 30E 35E 40E 45E 50E
Population less developed regions Population more developed regions Grain consumption
Source: US Department of Agriculture United Nations
IR – Date: December 2012
Source: US Department of Agriculture, United Nations
45
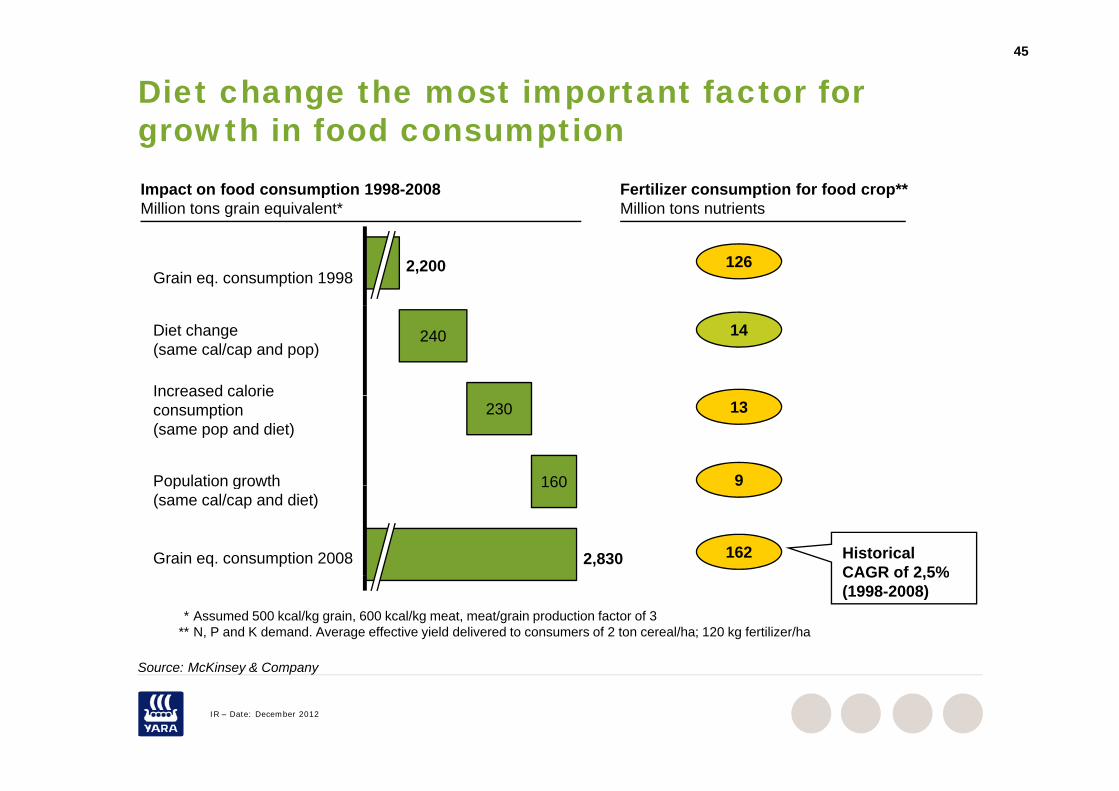
Diet change the most important factor for growth in food consumptiongrowth in food consumption
Fertilizer consumption for food crop**Million tons nutrients
Impact on food consumption 1998-2008Million tons grain equivalent*
2,200Grain eq. consumption 1998
126
g q
240Diet change(same cal/cap and pop)
Increased calorie
14
230
160
Increased calorieconsumption (same pop and diet)
Population growth
13
9160Population growth(same cal/cap and diet)
2,830Grain eq. consumption 2008
9
162 HistoricalCAGR of 2 5%
* Assumed 500 kcal/kg grain, 600 kcal/kg meat, meat/grain production factor of 3** N, P and K demand. Average effective yield delivered to consumers of 2 ton cereal/ha; 120 kg fertilizer/ha
CAGR of 2,5%(1998-2008)
So rce McKinse & Compan
IR – Date: December 2012
Source: McKinsey & Company
46
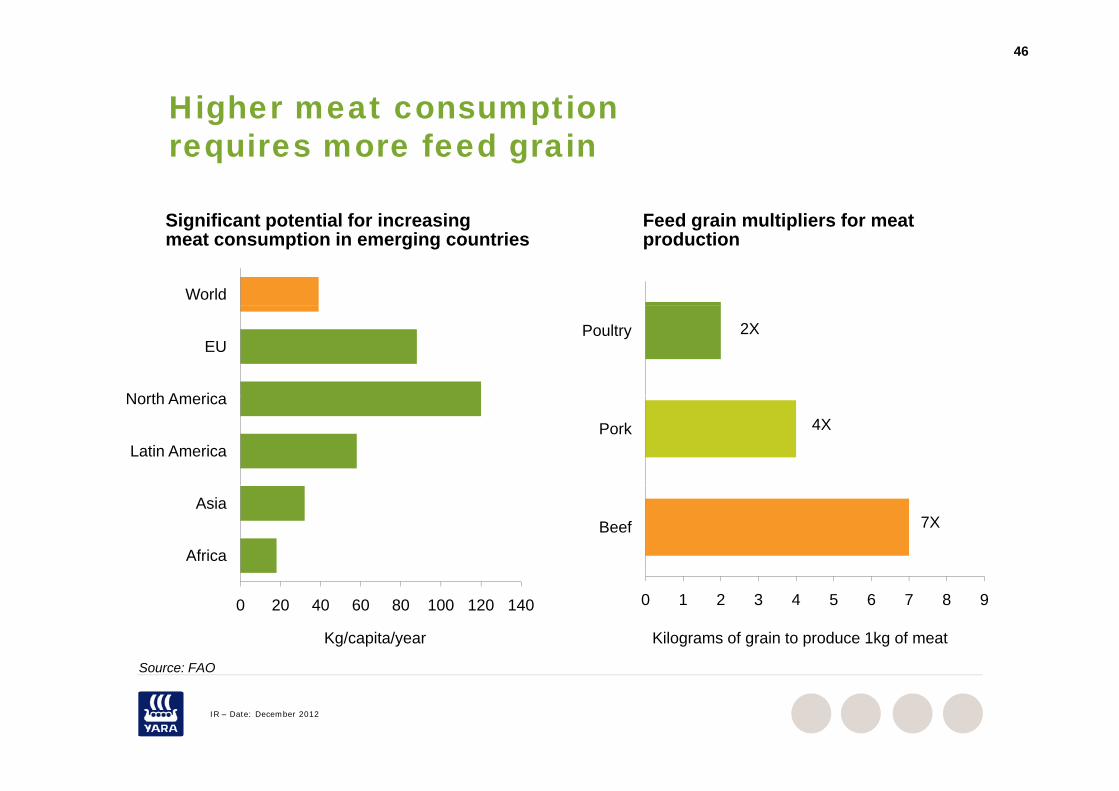
Higher meat consumption requires more feed grain
Si ifi t t ti l f i i F d i lti li f t
World
Significant potential for increasingmeat consumption in emerging countries
Feed grain multipliers for meat production
N th A i
EUPoultry 2X
Latin America
North America
Pork 4X
Africa
AsiaBeef 7X
0 20 40 60 80 100 120 140
Kg/capita/year
S FAO
0 1 2 3 4 5 6 7 8 9
Kilograms of grain to produce 1kg of meat
IR – Date: December 2012
Source: FAO
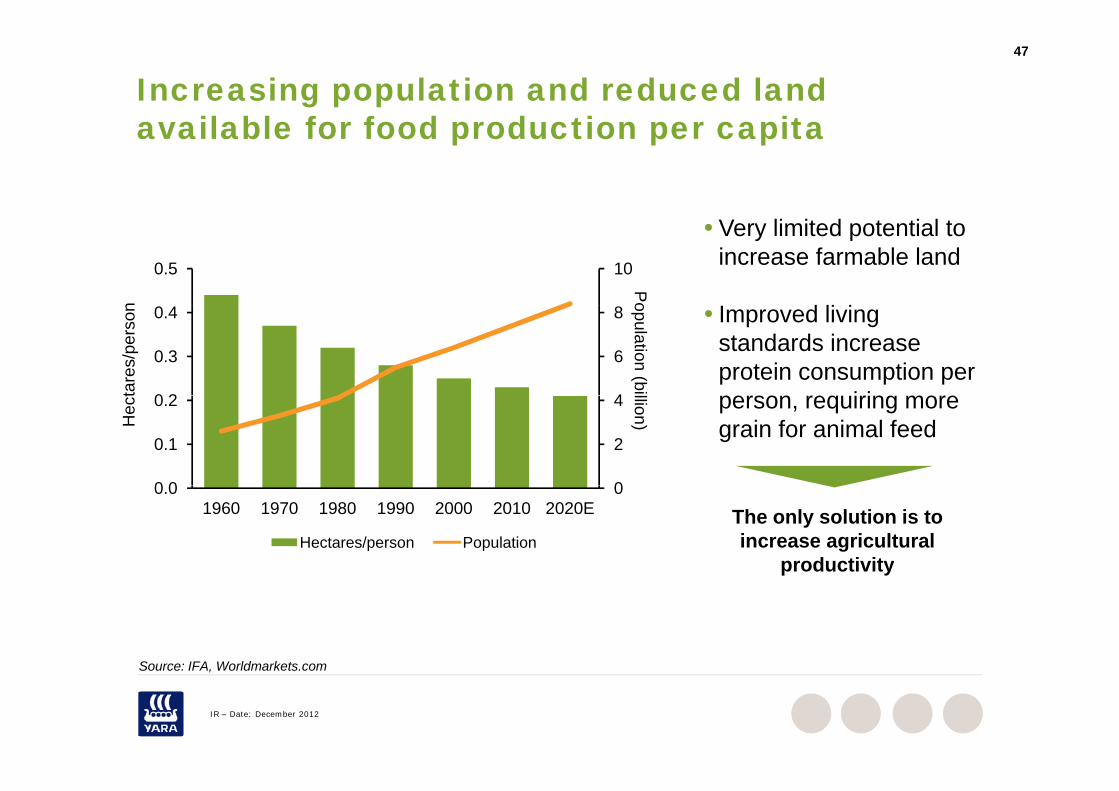
47
Increasing population and reduced land available for food production per capitaavailable for food production per capita
100.5
Pon
Very limited potential toincrease farmable land
I d li i
4
6
8
0 2
0.3
0.4
opulation (bitare
s/pe
rson Improved living
standards increase protein consumption per
i i
0
2
4
0 0
0.1
0.2
llion)Hec
t person, requiring more grain for animal feed
00.01960 1970 1980 1990 2000 2010 2020E
Hectares/person PopulationThe only solution is to increase agricultural
productivity
Source: IFA Worldmarkets com
p y
IR – Date: December 2012
Source: IFA, Worldmarkets.com
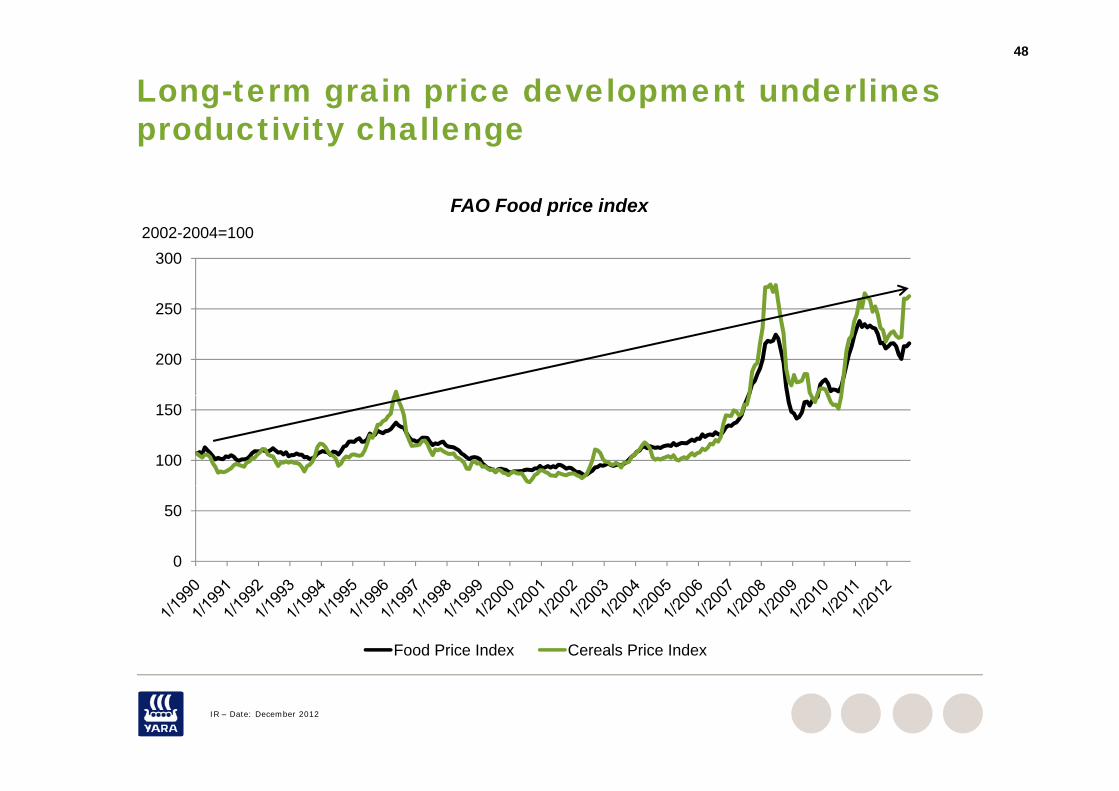
48
Long-term grain price development underlines productivity challengeproductivity challenge
FAO Food price index
250
3002002-2004=100
200
250
100
150
0
50
Food Price Index Cereals Price Index
IR – Date: December 2012
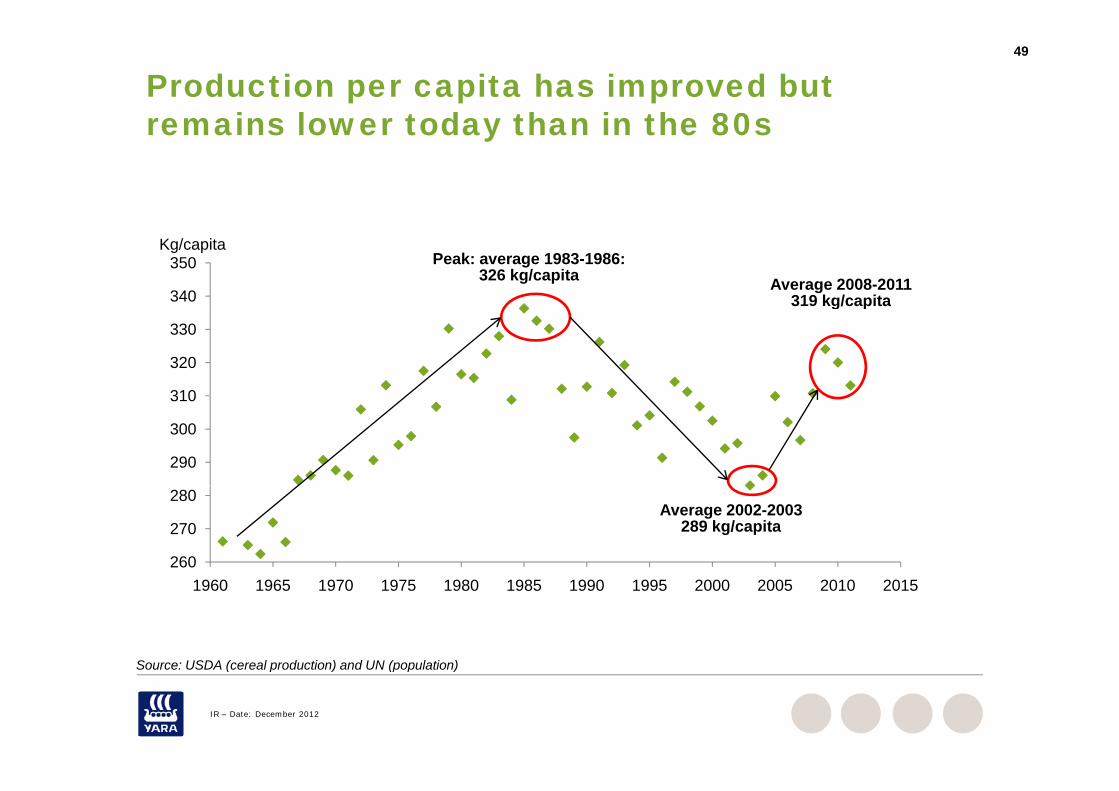
49
Production per capita has improved but remains lower today than in the 80sremains lower today than in the 80s
340
350Kg/capita
Peak: average 1983-1986:326 kg/capita Average 2008-2011
319 kg/capita
310
320
330
319 kg/capita
290
300
310
260
270
280Average 2002-2003
289 kg/capita
1960 1965 1970 1975 1980 1985 1990 1995 2000 2005 2010 2015
Source: USDA (cereal production) and UN (population)
IR – Date: December 2012
Source: USDA (cereal production) and UN (population)
50
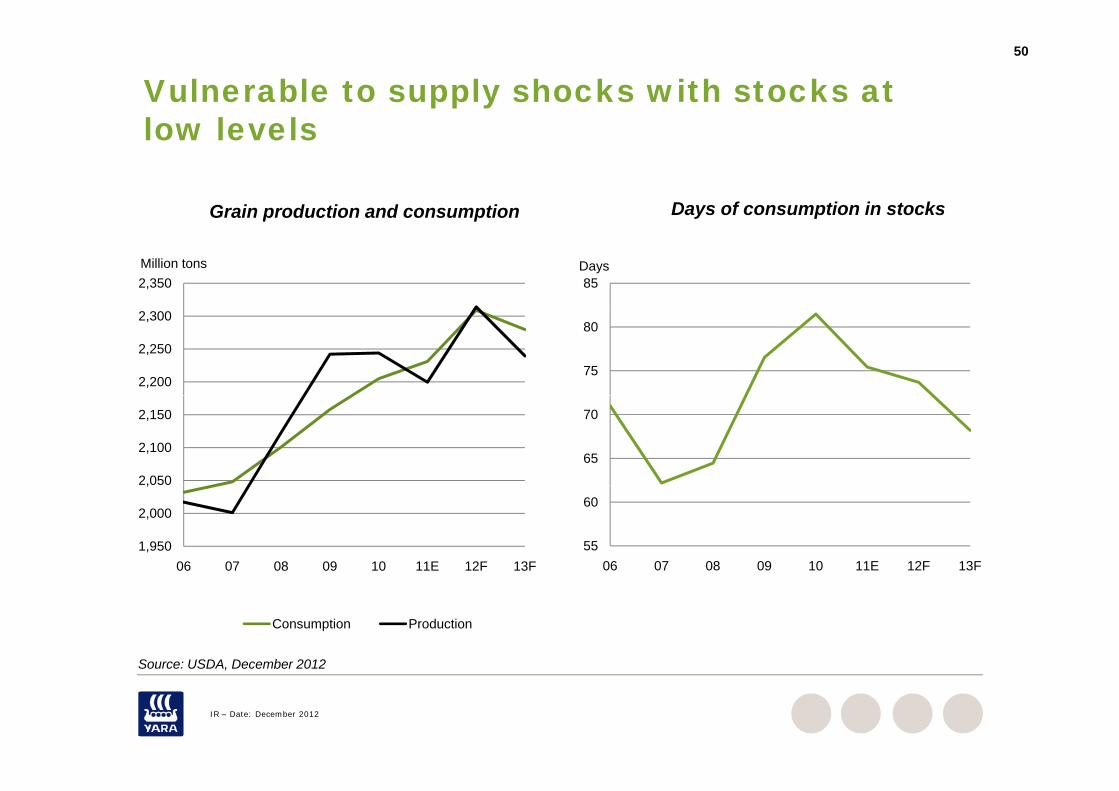
Vulnerable to supply shocks with stocks at low levelslow levels
Grain production and consumption Days of consumption in stocks
2,350Million tons
Grain production and consumption y p
85Days
2,200
2,250
2,300
75
80
2,050
2,100
2,150
65
70
1,950
2,000
,
06 07 08 09 10 11E 12F 13F55
60
06 07 08 09 10 11E 12F 13F
Consumption Production
Source: USDA December 2012
IR – Date: December 2012
Source: USDA, December 2012
51
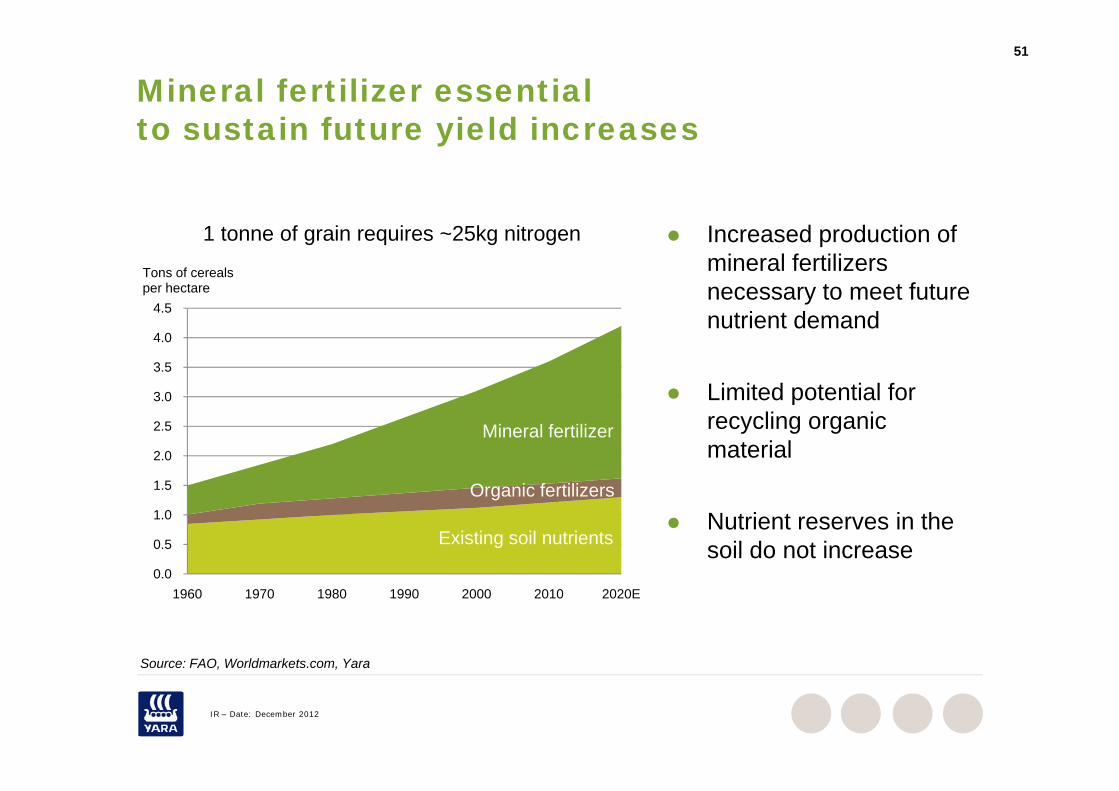
Mineral fertilizer essentialto sustain future yield increasesto sustain future yield increases
4 5
Tons of cereals per hectare
1 tonne of grain requires ~25kg nitrogen Increased production of mineral fertilizers necessary to meet future
3 0
3.5
4.0
4.5 nutrient demand
Limited potential for
1 5
2.0
2.5
3.0
Mineral fertilizer
O i f tili
Limited potential for recycling organic material
0 0
0.5
1.0
1.5 Organic fertilizers
Existing soil nutrients Nutrient reserves in the
soil do not increase0.0
1960 1970 1980 1990 2000 2010 2020E
Source: FAO Worldmarkets com Yara
IR – Date: December 2012
Source: FAO, Worldmarkets.com, Yara
52
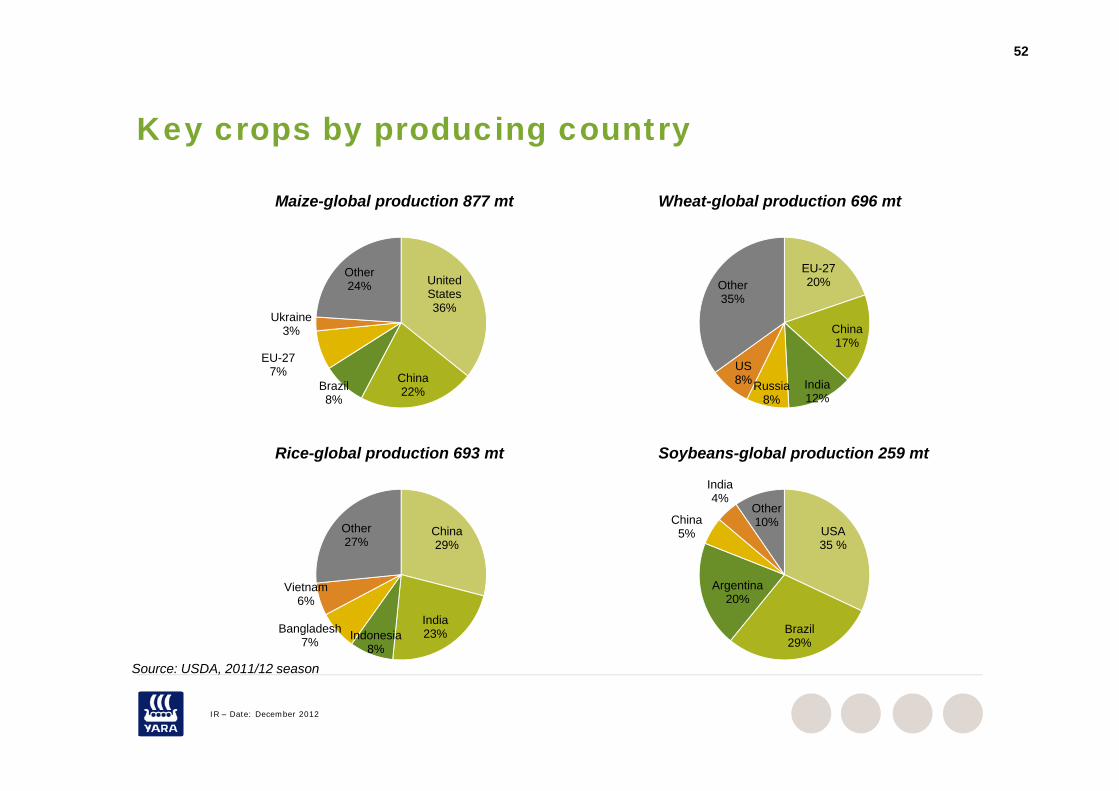
Key crops by producing countryKey crops by producing country
Maize-global production 877 mt Wheat-global production 696 mt
United States36%
Other24%
EU-2720%Other
35%36%
China22%Brazil
8%
EU-277%
Ukraine3% China
17%
India12%
Russia8%
US8%
22%8% 12%8%
Rice-global production 693 mt
India
Soybeans-global production 259 mt
China29%
Other27%
USA35 %
China5%
India4%
Other10%
S USDA 2011/12
India23%Indonesia
8%
Bangladesh7%
Vietnam6%
Brazil29%
Argentina20%
IR – Date: December 2012
Source: USDA, 2011/12 season
53
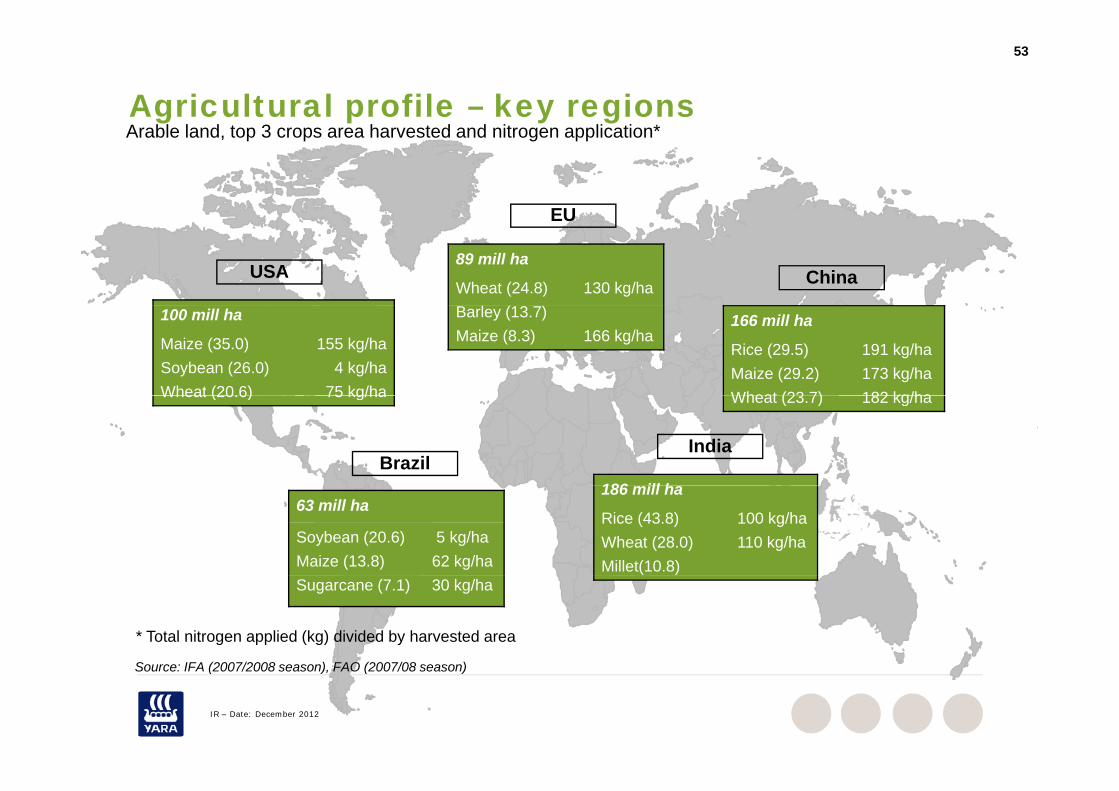
Agricultural profile – key regionsA bl l d t 3 h t d d it li ti *
EU
Arable land, top 3 crops area harvested and nitrogen application*
China
EU
USA89 mill ha
Wheat (24.8)B l (13 )
130 kg/ha
100 mill ha
Maize (35.0)Soybean (26.0)Wheat (20.6)
155 kg/ha4 kg/ha
75 kg/ha
Barley (13.7)Maize (8.3) 166 kg/ha
166 mill ha
Rice (29.5)Maize (29.2)Wheat (23 7)
191 kg/ha173 kg/ha182 kg/ha
IndiaBrazil
Wheat (20.6) 75 kg/ha Wheat (23.7) 182 kg/ha
186 ill h63 mill ha
Soybean (20.6) Maize (13.8)
5 kg/ha62 kg/ha
186 mill ha
Rice (43.8)Wheat (28.0)Millet(10.8)
100 kg/ha110 kg/ha
Source: IFA (2007/2008 season) FAO (2007/08 season)
Sugarcane (7.1) 30 kg/ha
* Total nitrogen applied (kg) divided by harvested area
IR – Date: December 2012
Source: IFA (2007/2008 season), FAO (2007/08 season)
54
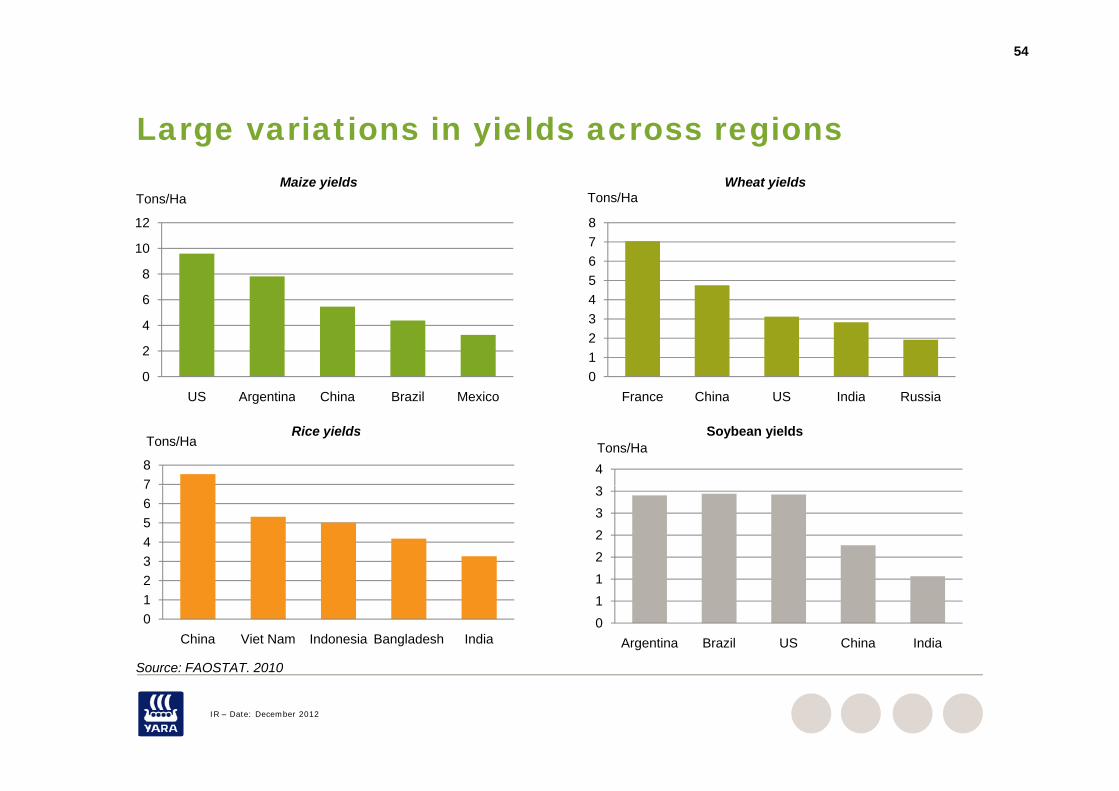
Large variations in yields across regionsLarge variations in yields across regions
Tons/HaMaize yields
Tons/HaWheat yields
6
8
10
12
45678
0
2
4
US Argentina China Brazil Mexico0123
France China US India RussiaUS Argentina China Brazil Mexico France China US India Russia
78
Tons/HaRice yields
4Tons/Ha
Soybean yields
34567
12233
S FAOSTAT 2010
012
China Viet Nam Indonesia Bangladesh India011
Argentina Brazil US China India
IR – Date: December 2012
Source: FAOSTAT. 2010
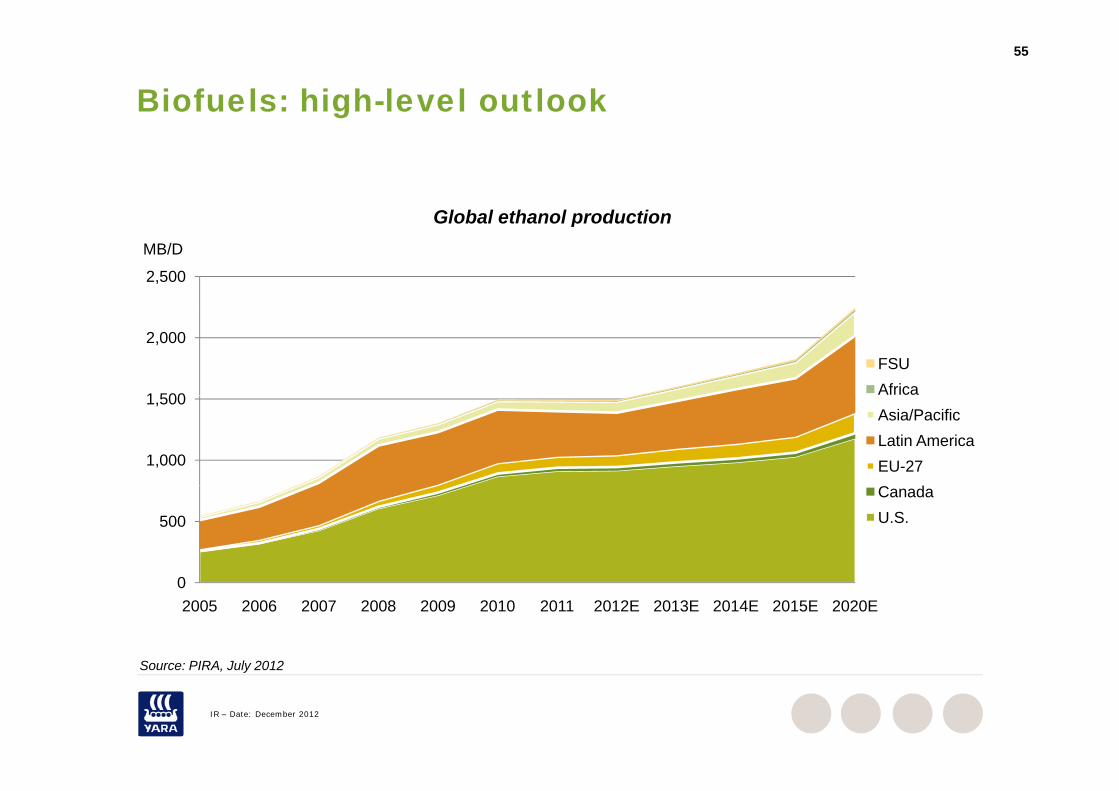
55
Biofuels: high-level outlook
Global ethanol production
2,500
MB/D
Global ethanol production
1 500
2,000FSUAfrica
1,000
1,500Asia/PacificLatin AmericaEU-27
500
CanadaU.S.
Source: PIRA July 2012
02005 2006 2007 2008 2009 2010 2011 2012E 2013E 2014E 2015E 2020E
IR – Date: December 2012
Source: PIRA, July 2012
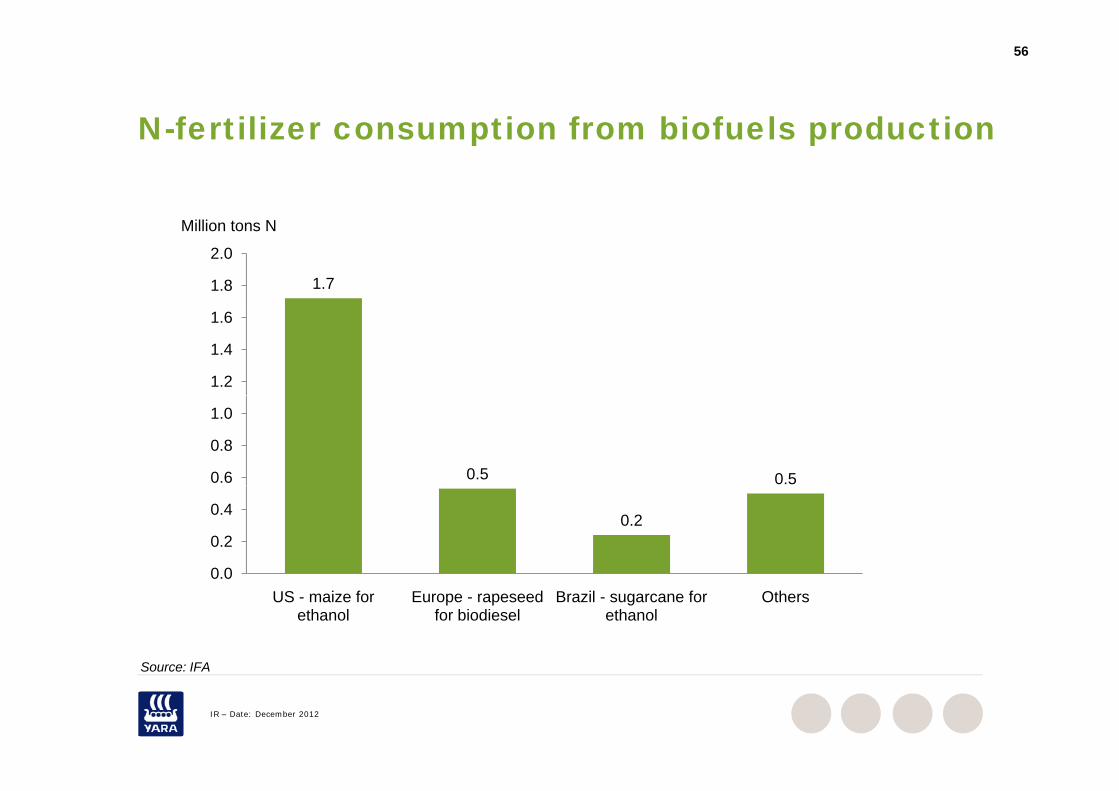
56
N fertilizer consumption from biofuels productionN-fertilizer consumption from biofuels production
1.71.8
2.0
Million tons N
1.2
1.4
1.6
0.5 0.50.6
0.8
1.0
0.2
0 0
0.2
0.4
US - maize for ethanol
Europe - rapeseed for biodiesel
Brazil - sugarcane for ethanol
Others0.0
Source: IFA
IR – Date: December 2012
Source: IFA
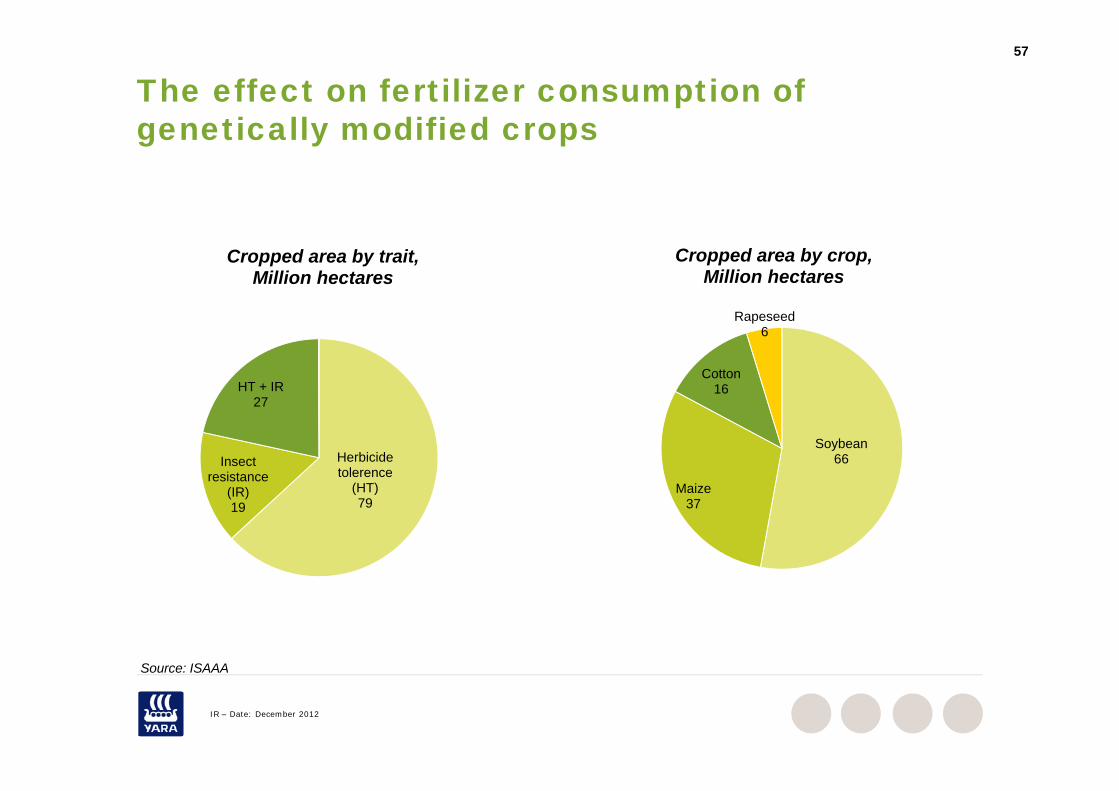
57
The effect on fertilizer consumption of genetically modified crops genetically modified crops
Cropped area by trait,Million hectares
Cropped area by crop,Million hectares
HT + IRCotton
16
Rapeseed6
Herbicide tolerence
(HT)
Insect resistance
27
Soybean66
M i(HT)79
(IR)19
Maize37
S ISAAA
IR – Date: December 2012
Source: ISAAA
58
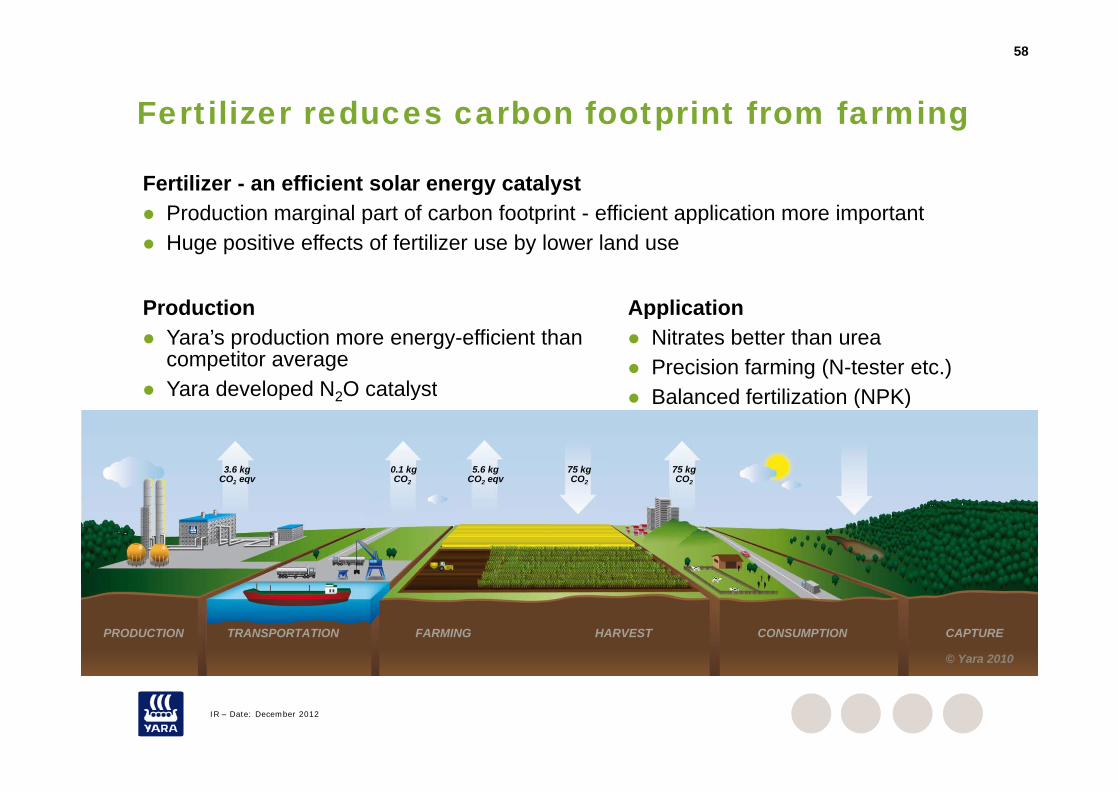
Fertilizer reduces carbon footprint from farmingp g
Fertilizer - an efficient solar energy catalyst Production marginal part of carbon footprint - efficient application more important
Application
Production marginal part of carbon footprint efficient application more important Huge positive effects of fertilizer use by lower land use
Production Application Nitrates better than urea Precision farming (N-tester etc.) Balanced fertilization (NPK)
Production Yara’s production more energy-efficient than
competitor average Yara developed N2O catalyst Balanced fertilization (NPK)Yara developed N2O catalyst
3.6 kgCO2 eqv
0.1 kgCO2
5.6 kgCO2 eqv
75 kgCO2
75 kgCO2
© Yara 2010
PRODUCTION TRANSPORTATION FARMING HARVEST CONSUMPTION CAPTURE
IR – Date: December 2012
59
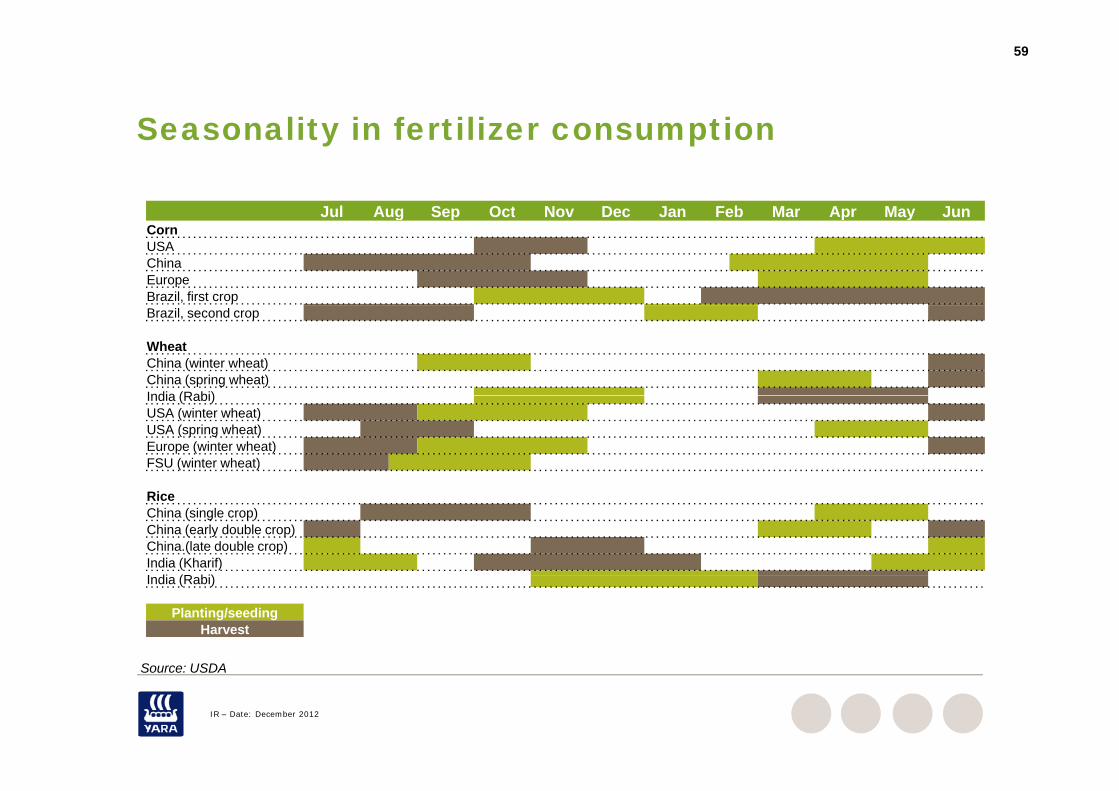
Seasonality in fertilizer consumptionSeasonality in fertilizer consumption
Jul Aug Sep Oct Nov Dec Jan Feb Mar Apr May JunJul Aug Sep Oct Nov Dec Jan Feb Mar Apr May JunCornUSAChinaEuropeBrazil, first cropBrazil, second crop
WheatChina (winter wheat)China (spring wheat)India (Rabi)India (Rabi)USA (winter wheat)USA (spring wheat)Europe (winter wheat)FSU (winter wheat)
RiceChina (single crop)China (early double crop)China.(late double crop)India (Kharif)I di (R bi)India (Rabi)
Planting/seedingHarvest
S USDA
IR – Date: December 2012
Source: USDA
Drivers of supply
61
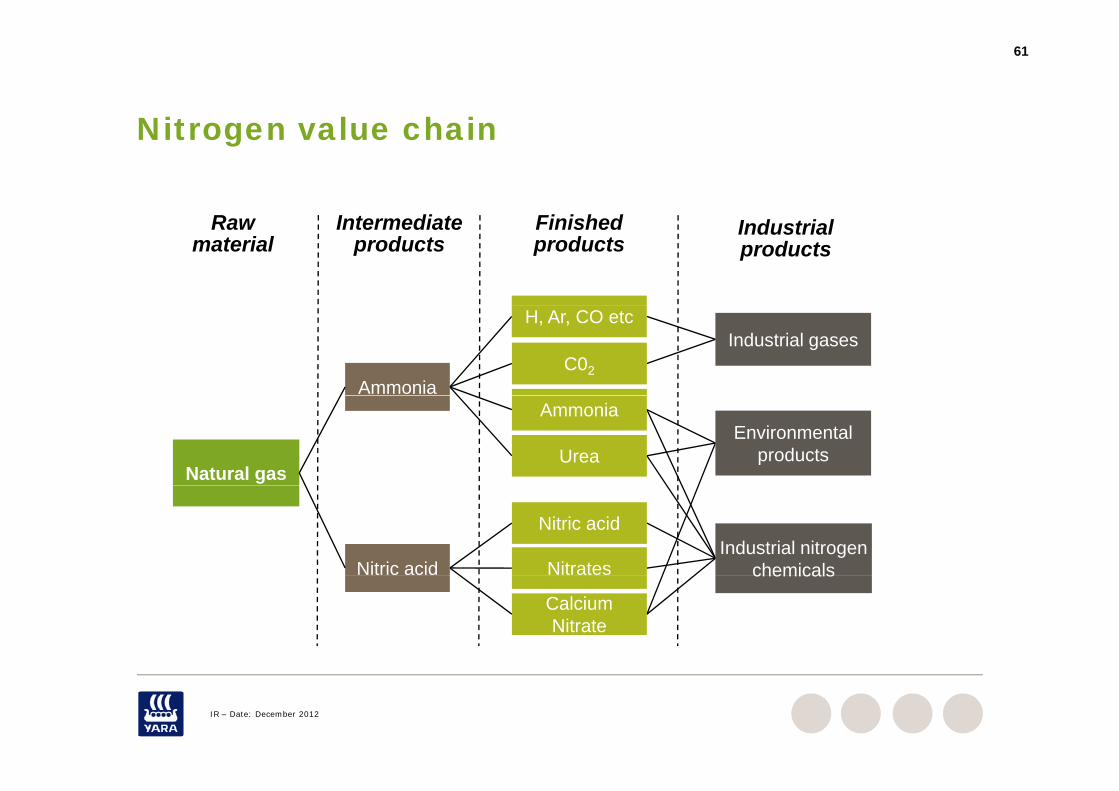
Nitrogen value chainNitrogen value chain
R I t di t Fi i h d Industrialproducts
Raw material
Intermediate products
Finished products
C02
H, Ar, CO etcIndustrial gases
Ammonia
Urea
AmmoniaEnvironmental
productsNatural gas
Nitrates
Nitric acidIndustrial nitrogen
chemicalsNitric acid chemicals
Calcium Nitrate
IR – Date: December 2012
62
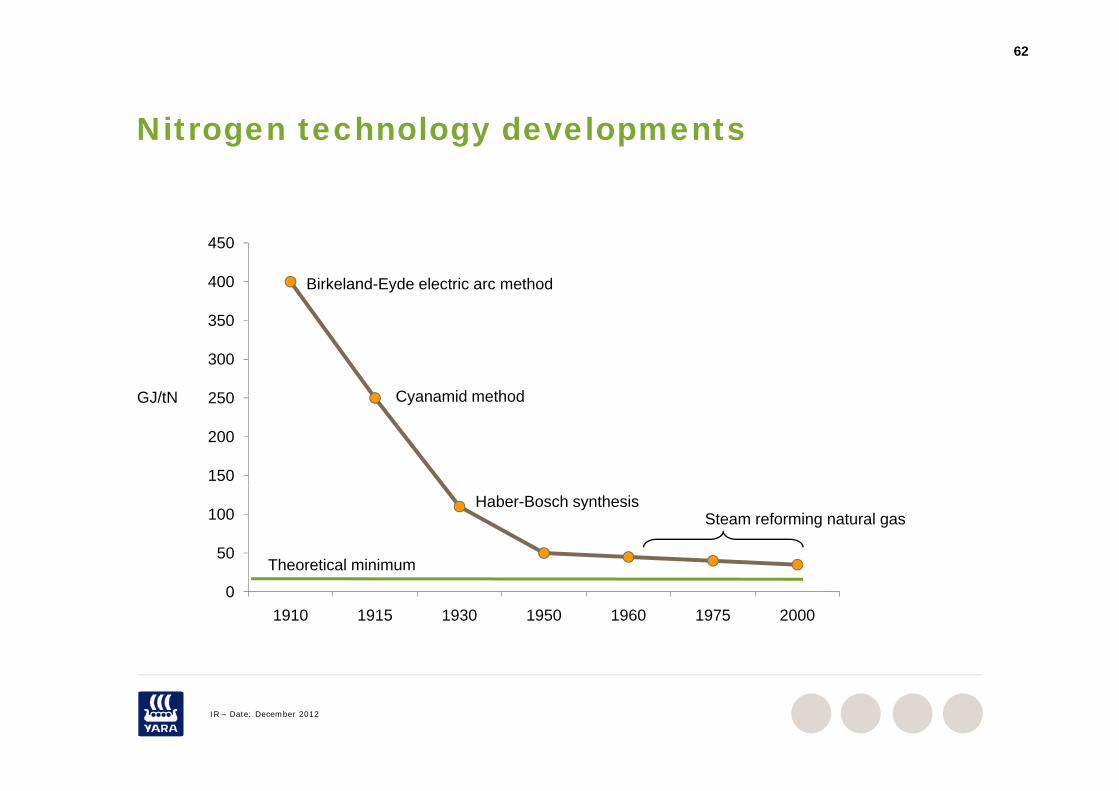
Nitrogen technology developmentsNitrogen technology developments
400
450
Birkeland-Eyde electric arc method
250
300
350
GJ/tN Cyanamid method
150
200
250GJ/tN Cyanamid method
50
100Haber-Bosch synthesis
Steam reforming natural gas
Theoretical minimum
01910 1915 1930 1950 1960 1975 2000
IR – Date: December 2012
63
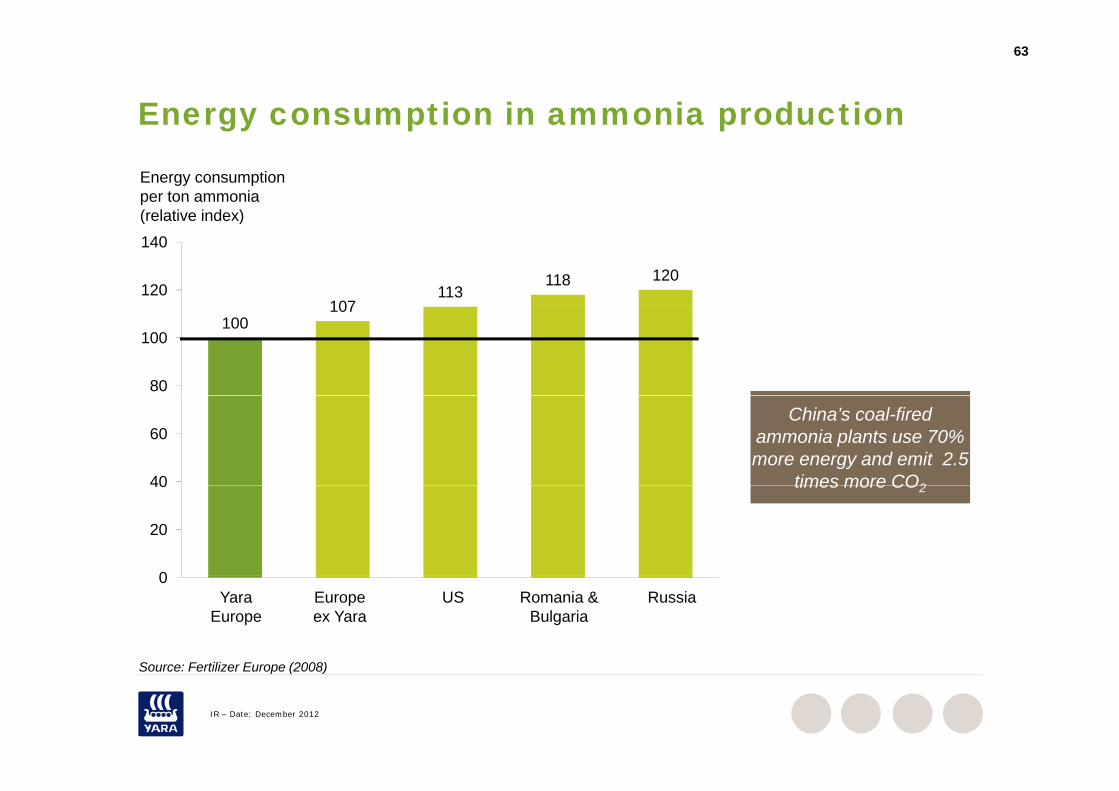
Energy consumption in ammonia productiongy p p
Energy consumptionper ton ammonia(relative index)
107113
118 120120
140(relative index)
100107
80
100
40
60China’s coal-fired
ammonia plants use 70% more energy and emit 2.5
times more CO2
0
20
40 times more CO2
0Yara
EuropeEurope ex Yara
RussiaRomania & Bulgaria
US
Source: Fertilizer Europe (2008)
IR – Date: December 2012
Source: Fertilizer Europe (2008)
64
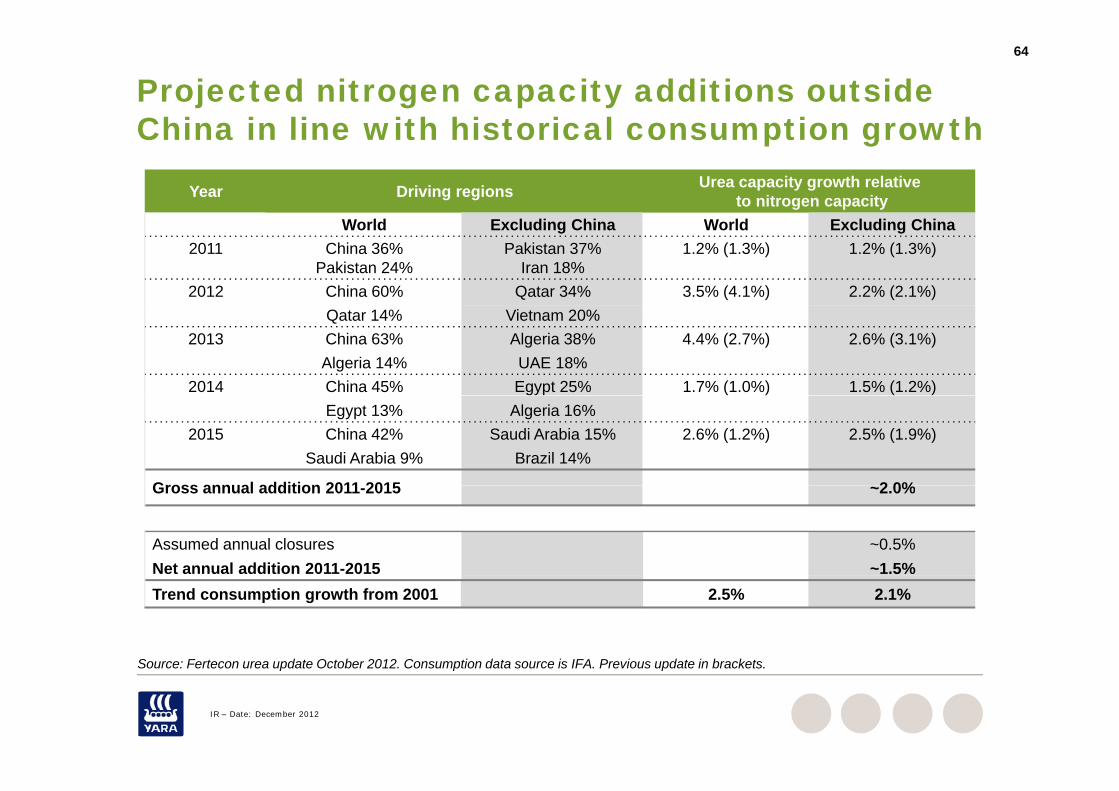
Projected nitrogen capacity additions outside China in line with historical consumption growthChina in line with historical consumption growth
Year Driving regions Urea capacity growth relativeto nitrogen capacity
World Excluding China World Excluding China2011 China 36%
Pakistan 24%Pakistan 37%
Iran 18%1.2% (1.3%) 1.2% (1.3%)
2012 China 60% Qatar 34% 3.5% (4.1%) 2.2% (2.1%)Qatar 14% Vietnam 20%
2013 China 63%Algeria 14%
Algeria 38%UAE 18%
4.4% (2.7%) 2.6% (3.1%)
2014 China 45% Egypt 25% 1.7% (1.0%) 1.5% (1.2%)Egypt 13% Algeria 16%
2015 China 42%Saudi Arabia 9%
Saudi Arabia 15%Brazil 14%
2.6% (1.2%) 2.5% (1.9%)
Gross annual addition 2011 2015 2 0%Gross annual addition 2011-2015 ~2.0%
Assumed annual closures ~0.5%Net annual addition 2011-2015 ~1.5%
Source: Fertecon urea update October 2012 Consumption data source is IFA Previous update in brackets
Trend consumption growth from 2001 2.5% 2.1%
IR – Date: December 2012
Source: Fertecon urea update October 2012. Consumption data source is IFA. Previous update in brackets.
65
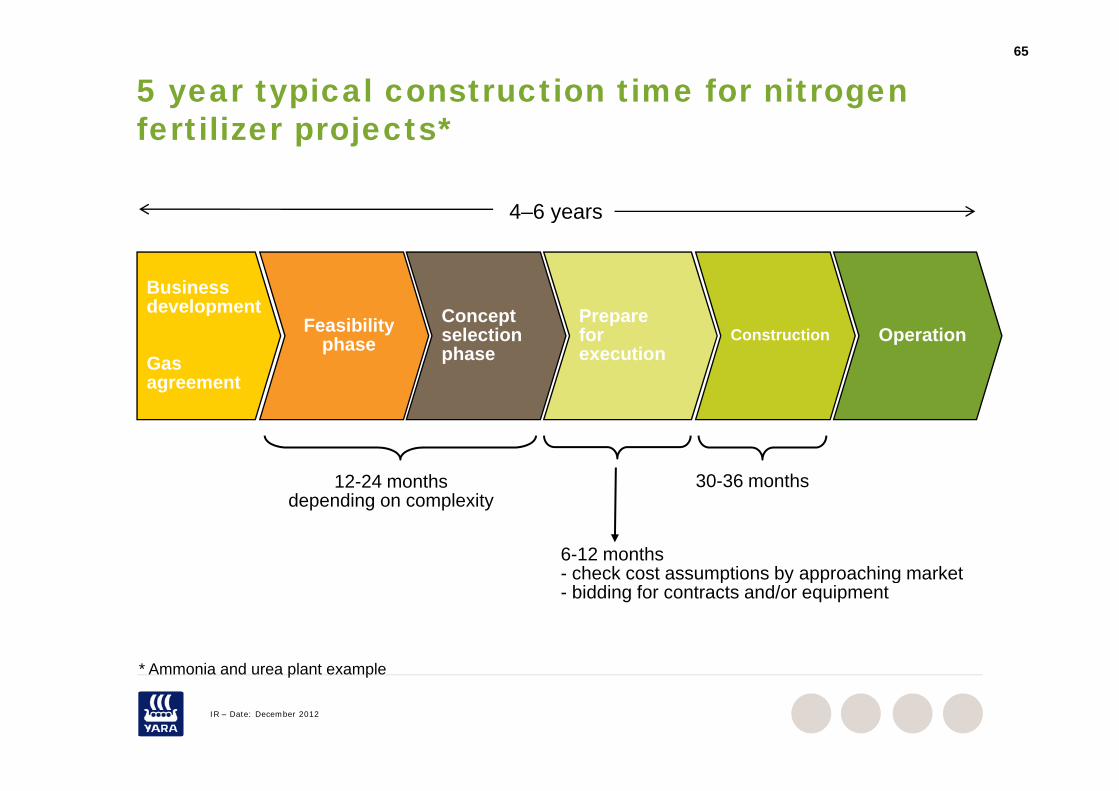
5 year typical construction time for nitrogen fertilizer projects*fertilizer projects*
4–6 years
Businessdevelopment
4 6 years
development
Gas agreement
Feasibilityphase
Conceptselectionphase
Preparefor execution
Construction Operation
12-24 months 30-36 months
6-12 months- check cost assumptions by approaching market
12 24 monthsdepending on complexity
30 36 months
- check cost assumptions by approaching market- bidding for contracts and/or equipment
* A i d l t l
IR – Date: December 2012
* Ammonia and urea plant example
66
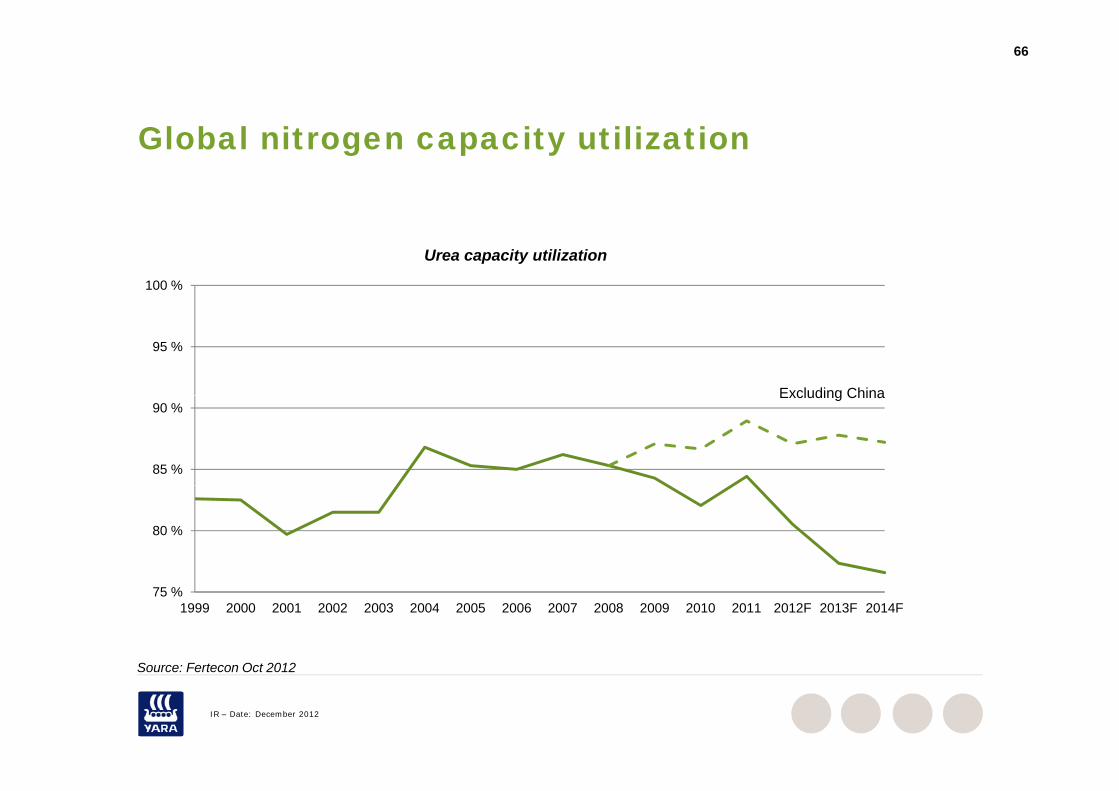
GGlobal nitrogen capacity utilization
100 %
Urea capacity utilization
95 %
Excluding China
85 %
90 %Excluding China
80 %
75 %1999 2000 2001 2002 2003 2004 2005 2006 2007 2008 2009 2010 2011 2012F 2013F 2014F
S F t O t 2012
IR – Date: December 2012
Source: Fertecon Oct 2012

P i l tiPrice relations

68
Feed stock costsFeed-stock costsYearly average gas prices
12
14
USD/MMBtu
8
10
4
6
0
2
2004 2005 2006 2007 2008 2009 2010 2011 1H12
US gas price (Henry Hub) Europe - hub spot Ukrainian gas Chinese Anthracite* Europe - oil linked
Source: World Bank Fertecon Pira (average import price into EU from World Bank used up to 1999 )
IR – Date: December 2012
Source: World Bank, Fertecon, Pira (average import price into EU from World Bank used up to 1999 )
69
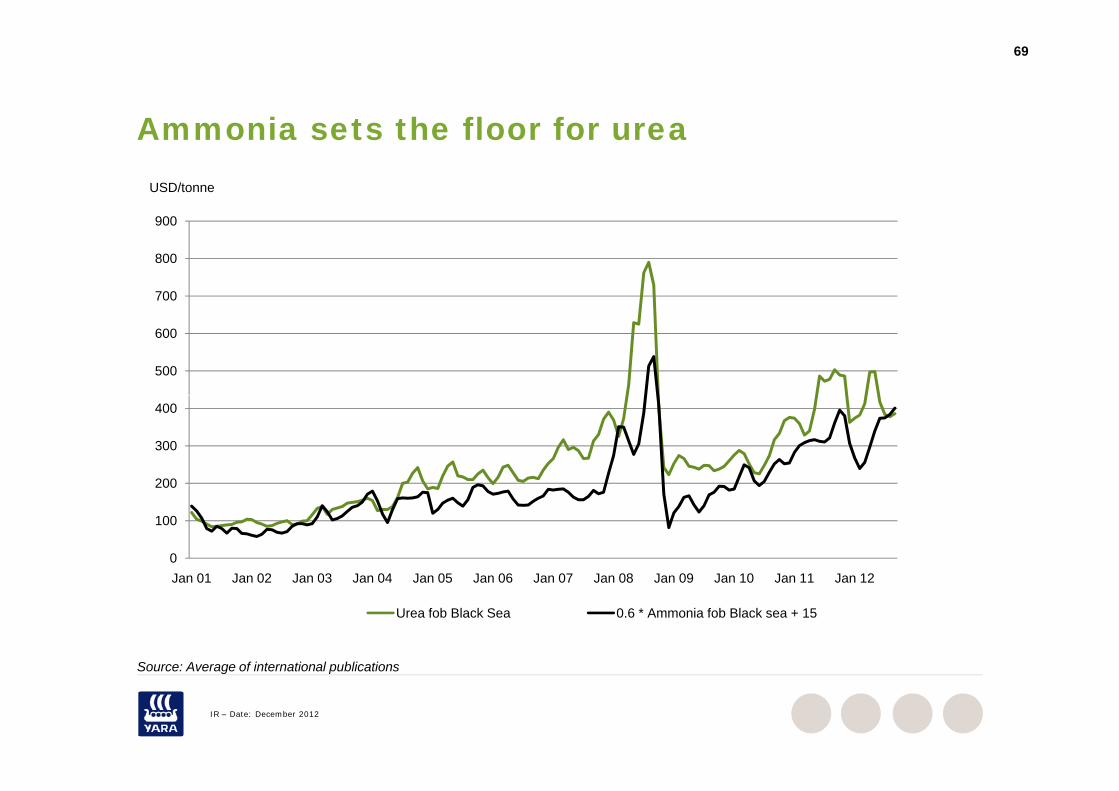
Ammonia sets the floor for urea
900
USD/tonne
Ammonia sets the floor for urea
700
800
900
500
600
200
300
400
0
100
200
J 01 J 02 J 03 J 04 J 05 J 06 J 07 J 08 J 09 J 10 J 11 J 12Jan 01 Jan 02 Jan 03 Jan 04 Jan 05 Jan 06 Jan 07 Jan 08 Jan 09 Jan 10 Jan 11 Jan 12
Urea fob Black Sea 0.6 * Ammonia fob Black sea + 15
Source: Average of international publications
IR – Date: December 2012
Source: Average of international publications
70
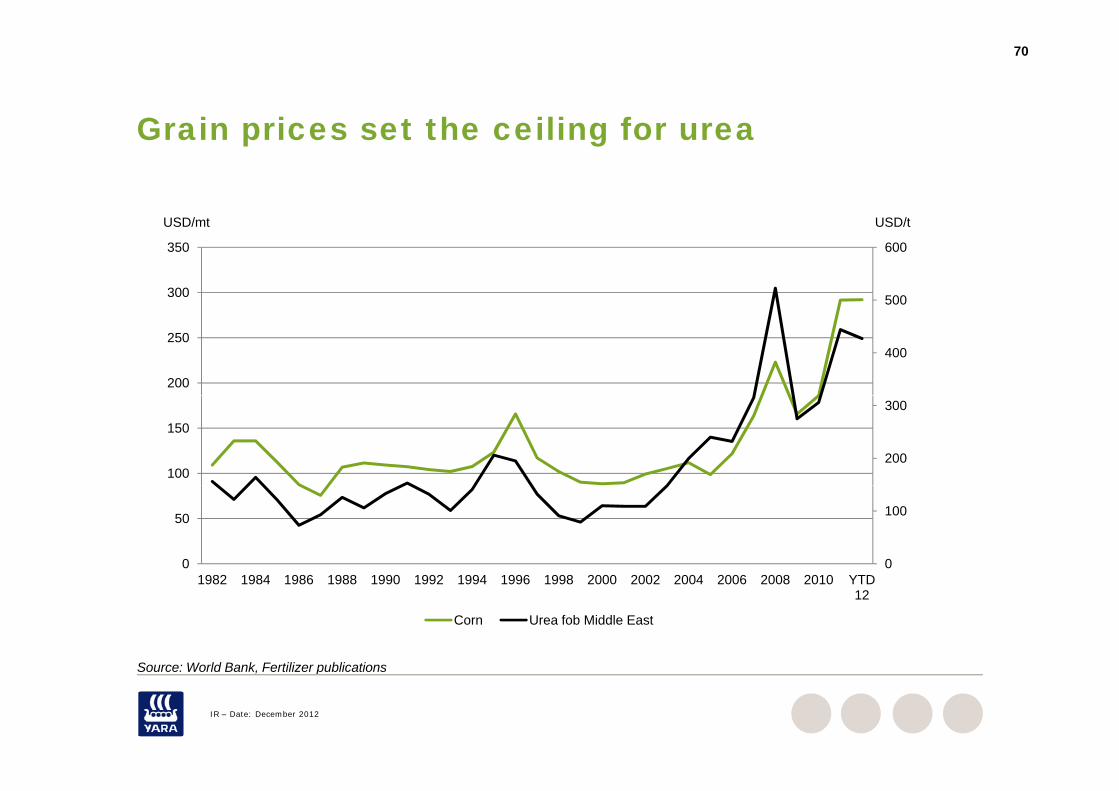
Grain prices set the ceiling for ureaGrain prices set the ceiling for urea
500
600
300
350
USD/tUSD/mt
400
200
250
200
300
100
150
0
100
0
50
1982 1984 1986 1988 1990 1992 1994 1996 1998 2000 2002 2004 2006 2008 2010 YTD1982 1984 1986 1988 1990 1992 1994 1996 1998 2000 2002 2004 2006 2008 2010 YTD 12
Corn Urea fob Middle East
Source: World Bank Fertilizer publications
IR – Date: December 2012
Source: World Bank, Fertilizer publications
71
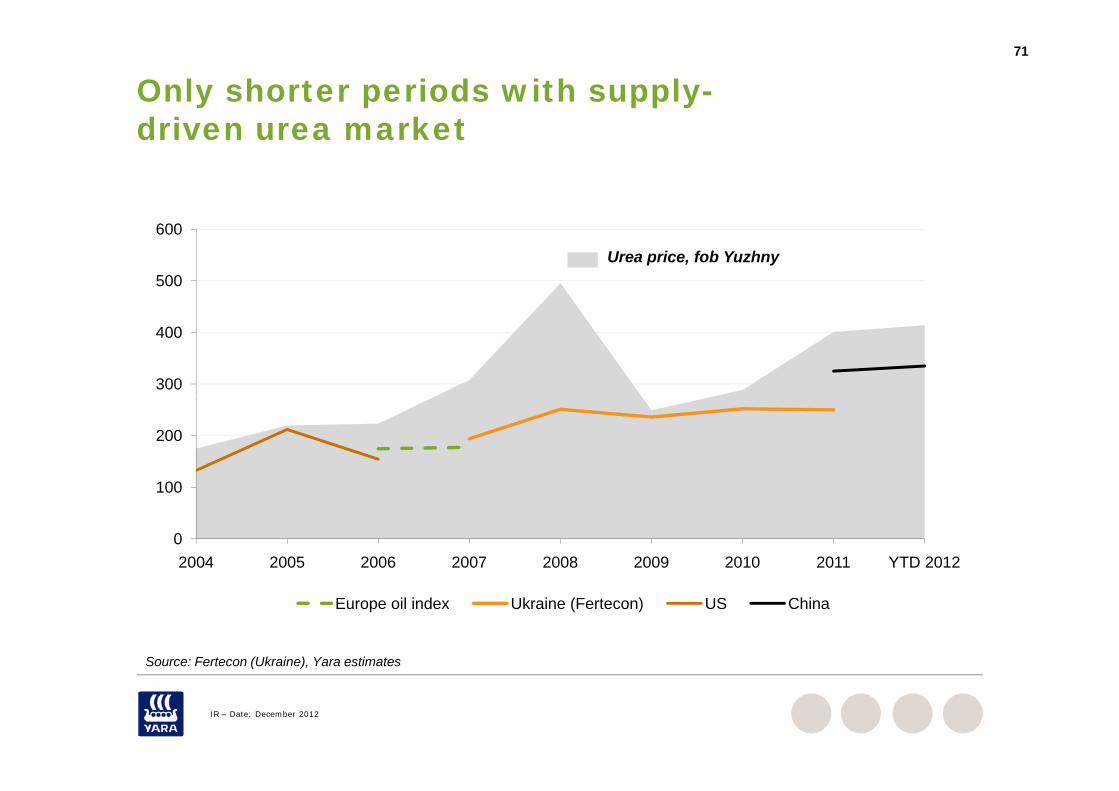
Only shorter periods with supply-driven urea marketdriven urea market
500
600
Urea price, fob Yuzhny
300
400
100
200
0
100
2004 2005 2006 2007 2008 2009 2010 2011 YTD 2012
Europe oil index Ukraine (Fertecon) US China
Source: Fertecon (Ukraine), Yara estimates
IR – Date: December 2012
Source: Fertecon (Ukraine), Yara estimates
72
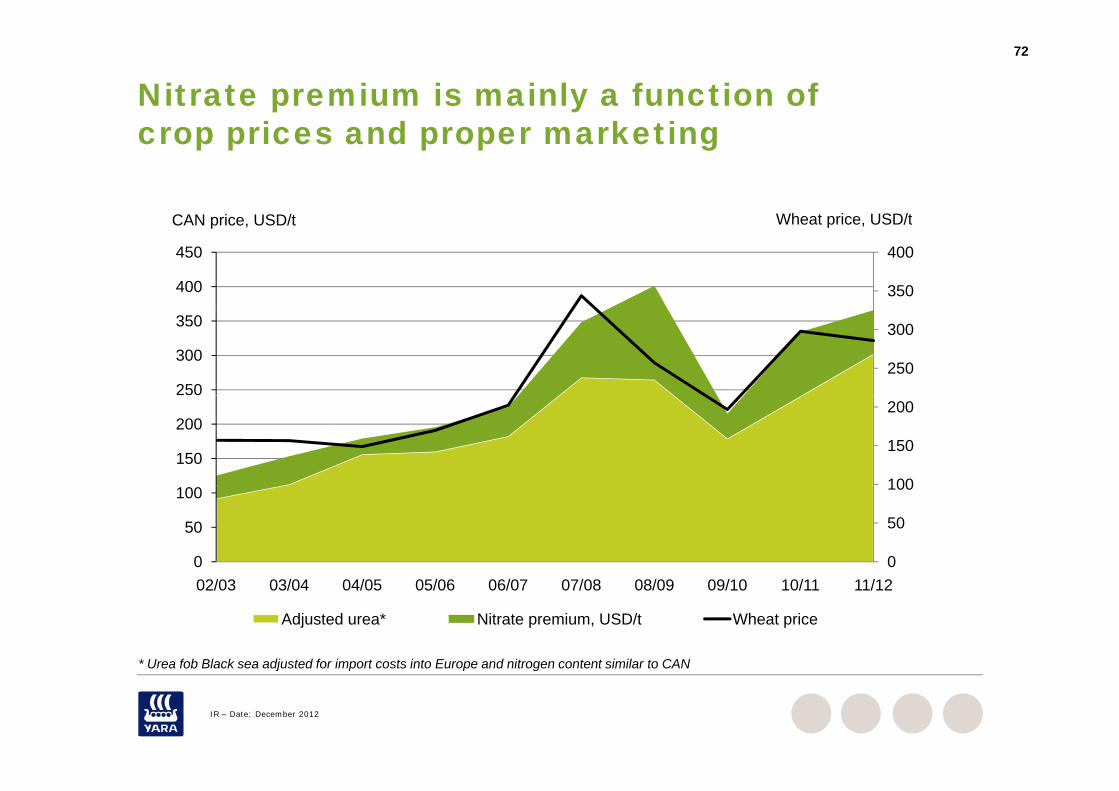
Nitrate premium is mainly a function of i d k ticrop prices and proper marketing
Wheat price USD/tCAN i USD/t
350
400
400
450
Wheat price, USD/tCAN price, USD/t
250
300
250
300
350
100
150
200
150
200
0
50
100
0
50
100
02/03 03/04 04/05 05/06 06/07 07/08 08/09 09/10 10/11 11/12
Adjusted urea* Nitrate premium, USD/t Wheat price
* Urea fob Black sea adjusted for import costs into Europe and nitrogen content similar to CAN
IR – Date: December 2012
Urea fob Black sea adjusted for import costs into Europe and nitrogen content similar to CAN
73
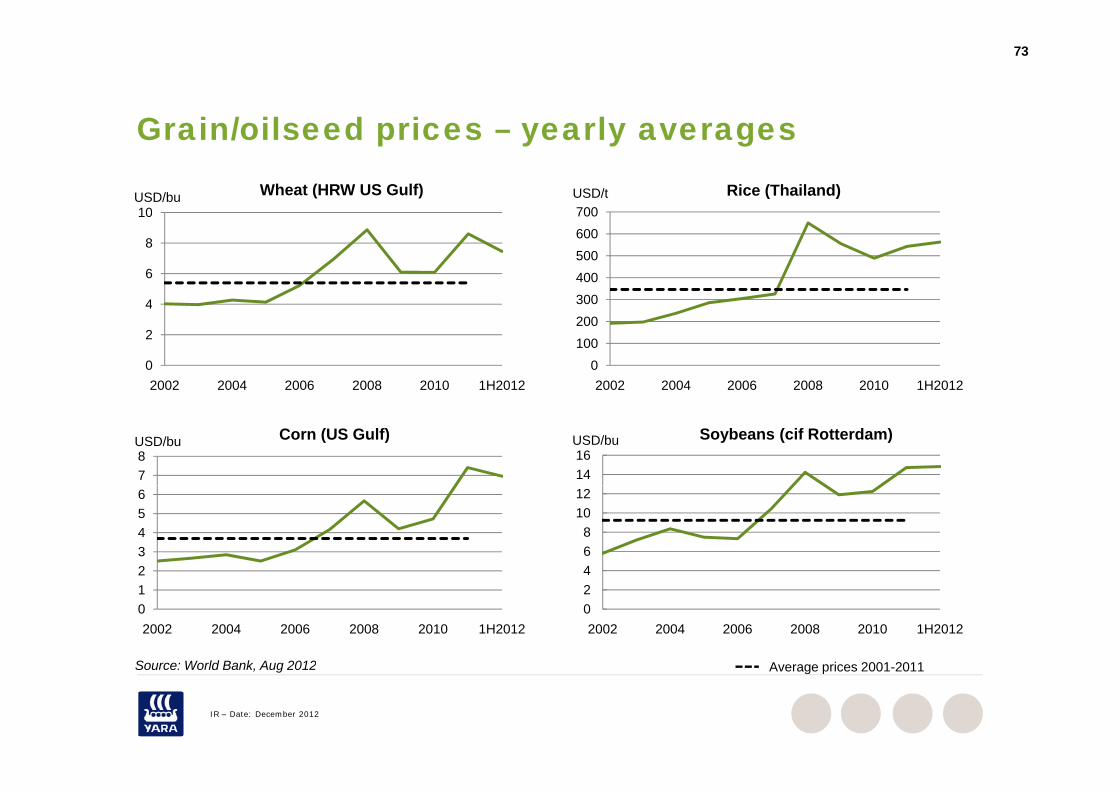
Grain/oilseed prices yearly averagesGrain/oilseed prices – yearly averages
10USD/bu Wheat (HRW US Gulf)
700USD/t Rice (Thailand)
4
6
8
10
300400500600700
0
2
4
2002 2004 2006 2008 2010 1H20120
100200
2002 2004 2006 2008 2010 1H2012
78USD/bu Corn (US Gulf)
1416USD/bu Soybeans (cif Rotterdam)
23456
468
1012
012
2002 2004 2006 2008 2010 1H2012
Source: World Bank Aug 2012
02
2002 2004 2006 2008 2010 1H2012
Average prices 2001 2011
IR – Date: December 2012
Source: World Bank, Aug 2012 Average prices 2001-2011

74
Fertilizer prices monthly averagesFertilizer prices – monthly averages
USD/t Ammonia fob Black Sea USD/tCAN cif Germany
600
800
1,000
USD/t
300
400
500USD/t
0
200
400
2001 2002 2003 2004 2005 2006 2007 2008 2009 2010 2011 20120
100
200
2001 2002 2003 2004 2005 2006 2007 2008 2009 2010 2011 20122001 2002 2003 2004 2005 2006 2007 2008 2009 2010 2011 2012 2001 2002 2003 2004 2005 2006 2007 2008 2009 2010 2011 2012
800USD/t
Urea prilled fob Black Sea
1,200USD/t
DAP fob US Gulf
200
400
600
400
600
800
1,000
Source: Average of international publications
0
200
2001 2002 2003 2004 2005 2006 2007 2008 2009 2010 2011 2012
Average prices 2001 - 2011
0
200
2001 2002 2003 2004 2005 2006 2007 2008 2009 2010 2011 2012
IR – Date: December 2012
Source: Average of international publications e age p ces 00 0
Production economics
76
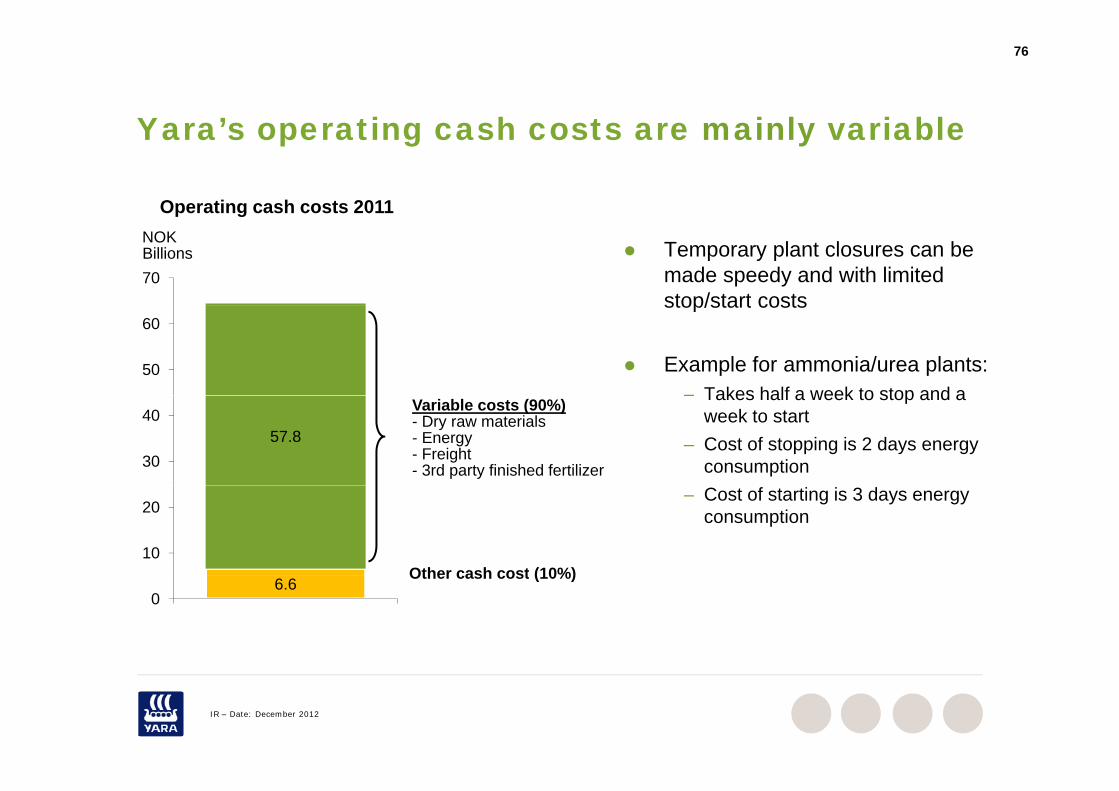
Yara’s operating cash costs are mainly variableYara’s operating cash costs are mainly variable
Operating cash costs 2011
70
Temporary plant closures can be made speedy and with limited stop/start costs
p gNOKBillions
50
60stop/start costs
Example for ammonia/urea plants:– Takes half a week to stop and a
57.830
40– Takes half a week to stop and a
week to start– Cost of stopping is 2 days energy
consumption
Variable costs (90%)- Dry raw materials- Energy- Freight- 3rd party finished fertilizer
10
20– Cost of starting is 3 days energy
consumption
Other cash cost (10%)6.6
0Other cash cost (10%)
IR – Date: December 2012
77
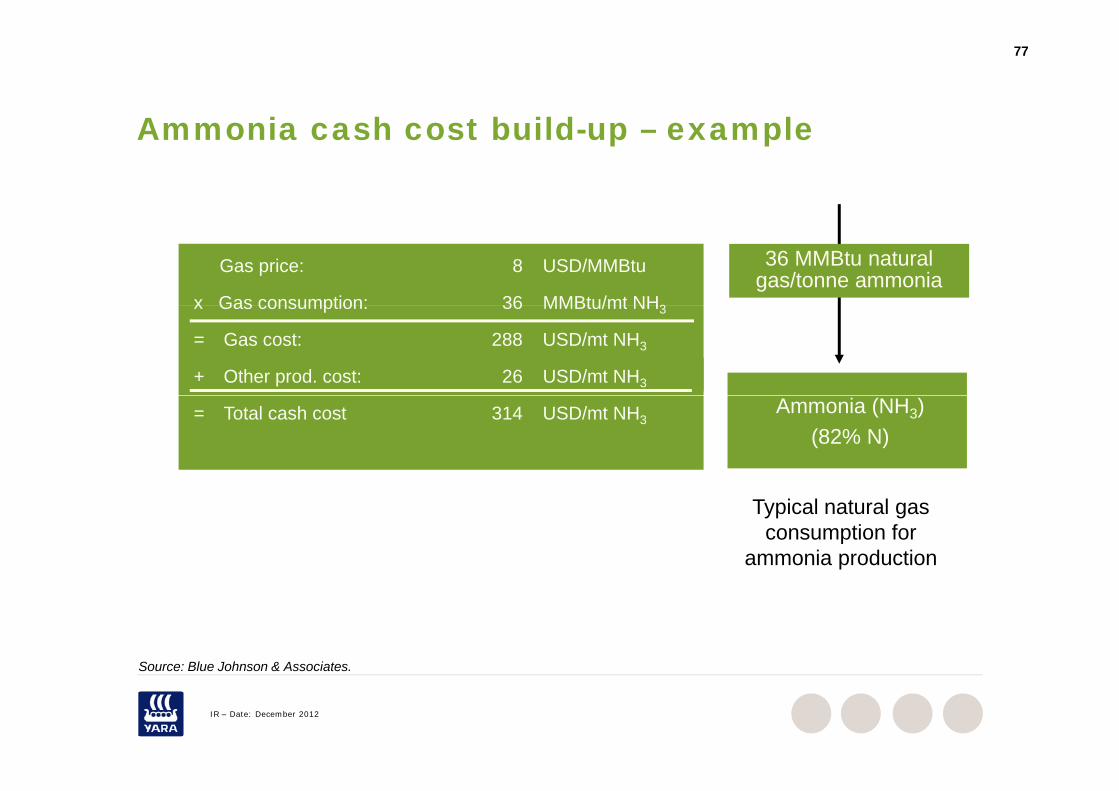
Ammonia cash cost build up example Ammonia cash cost build-up – example
Gas price: 8 USD/MMBtu
x Gas consumption: 36 MMBtu/mt NH3
36 MMBtu natural gas/tonne ammonia
x Gas consumption: 36 MMBtu/mt NH3
= Gas cost: 288 USD/mt NH3
+ Other prod. cost: 26 USD/mt NH3
Ammonia (NH3)(82% N)
= Total cash cost 314 USD/mt NH3
Typical natural gas consumption for
ammonia production
Source: Blue Johnson & Associates
IR – Date: December 2012
Source: Blue Johnson & Associates.
78
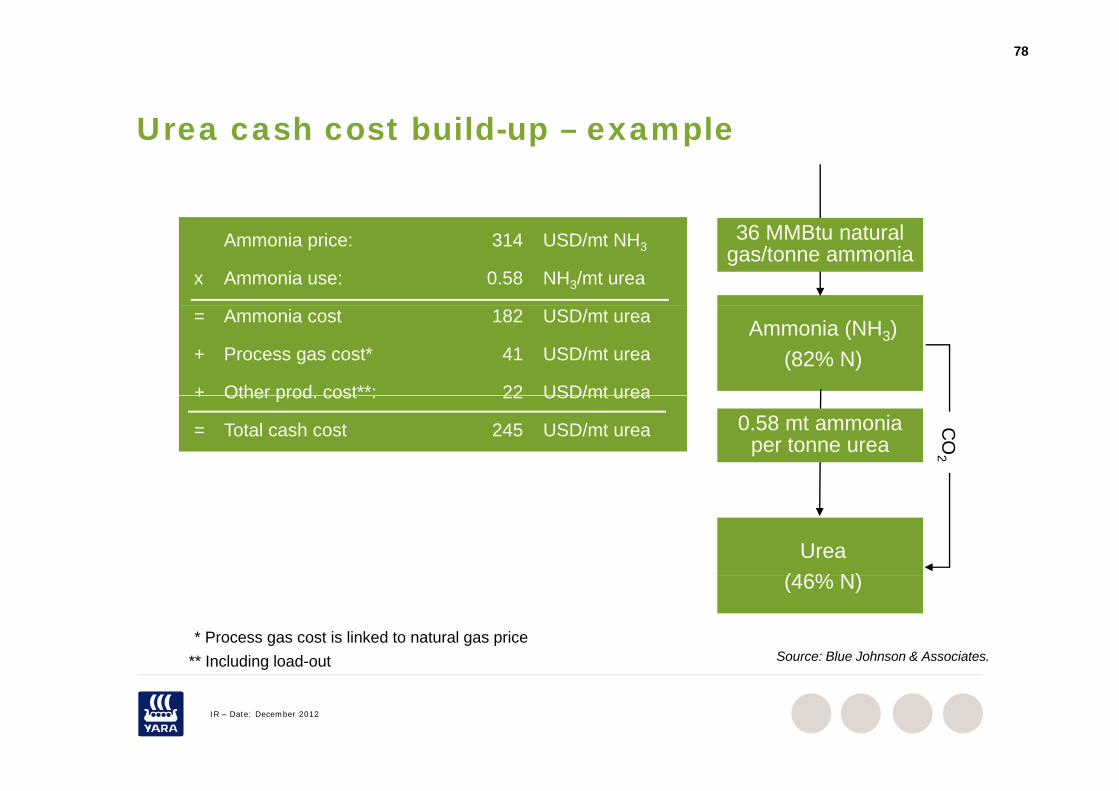
Urea cash cost build up example Urea cash cost build-up – example
36 MMBtu natural gas/tonne ammonia
Ammonia price: 314 USD/mt NH3
x Ammonia use: 0.58 NH3/mt urea
Ammonia (NH3)(82% N)
= Ammonia cost 182 USD/mt urea
+ Process gas cost* 41 USD/mt urea
+ Other prod cost**: 22 USD/mt urea+ Other prod. cost : 22 USD/mt urea
= Total cash cost 245 USD/mt urea 0.58 mt ammonia per tonne urea
CO
2
Urea(46% N)(46% N)
Source: Blue Johnson & Associates. ** Including load-out* Process gas cost is linked to natural gas price
IR – Date: December 2012
Including load out
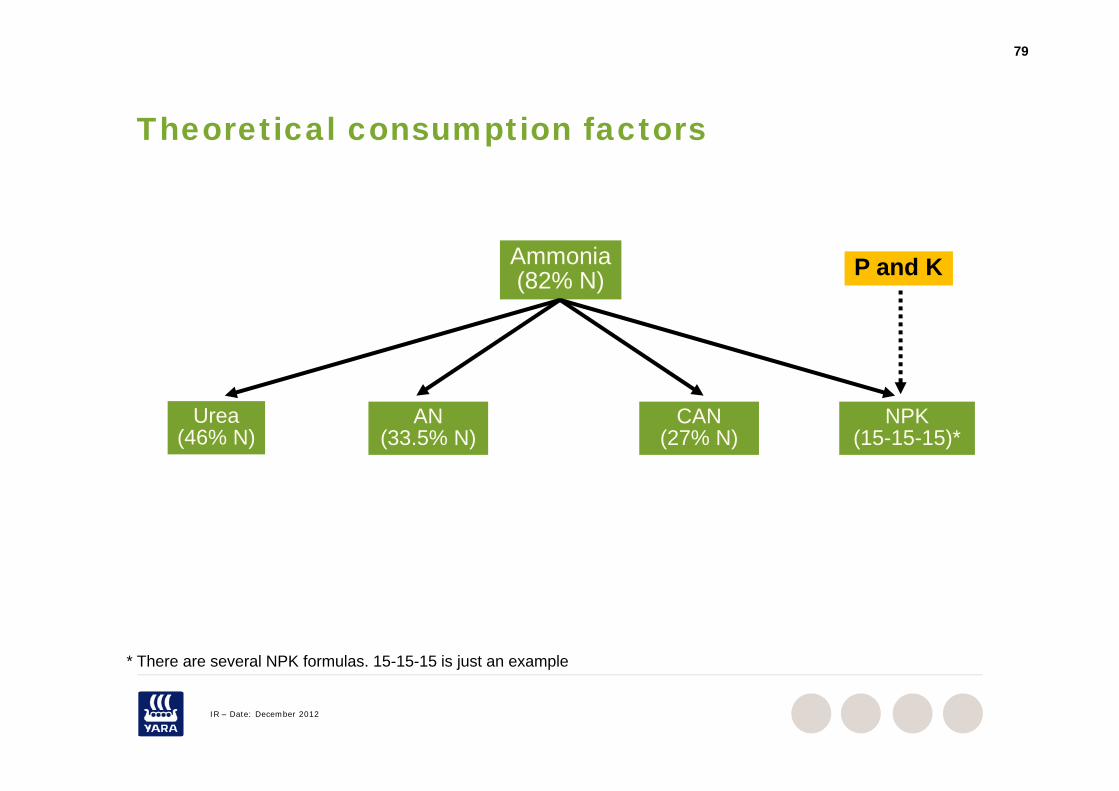
79
Theoretical consumption factorsTheoretical consumption factors
Ammonia(82% N) P and K
Urea(46% N)
AN(33.5% N)
CAN(27% N)
NPK(15-15-15)*
* There are several NPK formulas. 15-15-15 is just an example
IR – Date: December 2012
There are several NPK formulas. 15 15 15 is just an example
80
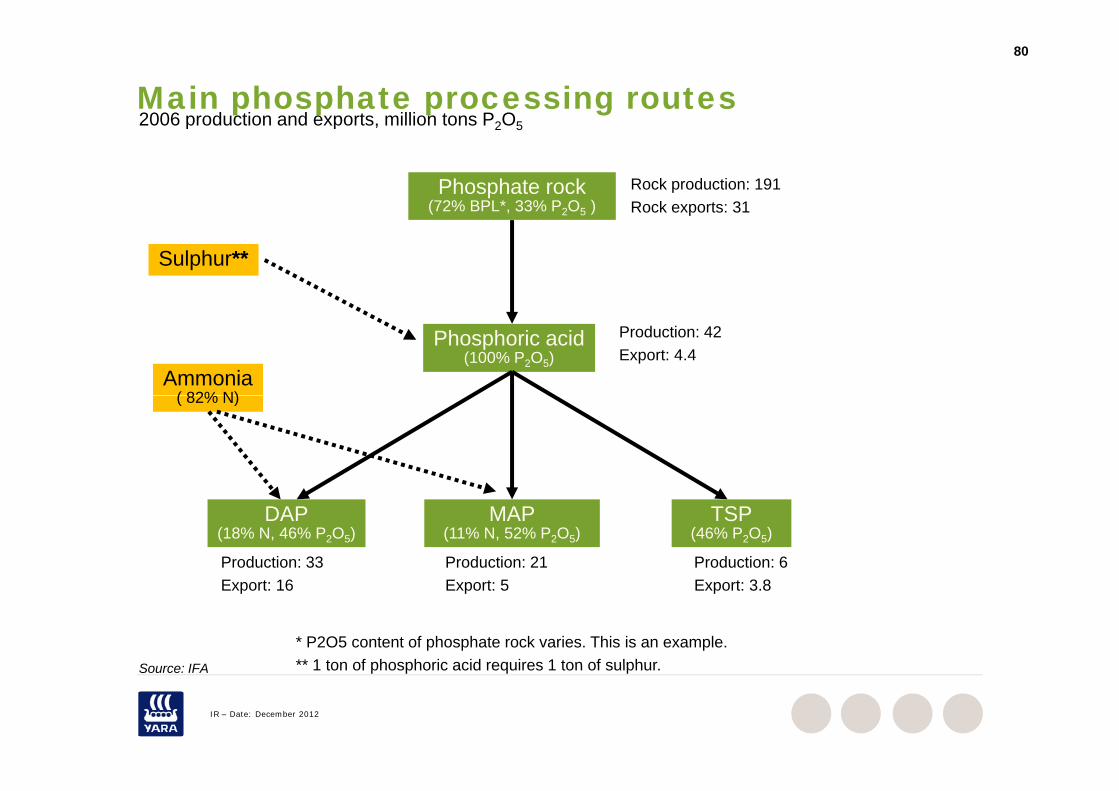
Main phosphate processing routes2006 production and exports, million tons P2O5
Phosphate rock(72% BPL*, 33% P2O5 )
Rock production: 191Rock exports: 31
p p , 2 5
Sulphur**
Phosphoric acid(100% P2O5)
Ammonia( 82% N)
Production: 42Export: 4.4
( 82% N)
DAP(18% N, 46% P2O5)
MAP(11% N, 52% P2O5)
TSP(46% P2O5)
Production: 33 Production: 21 Production: 6
* P2O5 content of phosphate rock varies. This is an example.** 1 ton of phosphoric acid requires 1 ton of sulphur
Export: 16 Export: 5 Export: 3.8
S IFA
IR – Date: December 2012
1 ton of phosphoric acid requires 1 ton of sulphur.Source: IFA
Industrial applicationsIndustrial applications
82
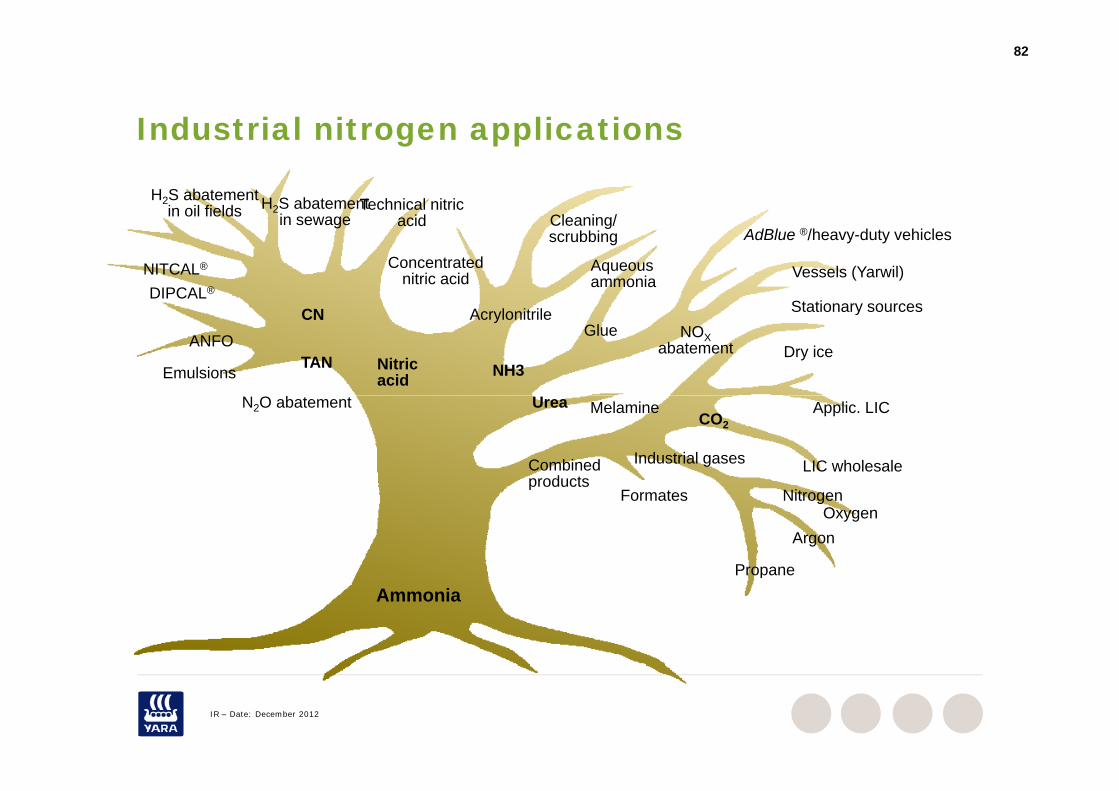
Industrial nitrogen applications
H2S abatement i Cl i /
H2S abatement in oil fields Technical nitric
id
Industrial nitrogen applications
DIPCAL®
NITCAL®
in sewage
Concentrated nitric acid
Cleaning/scrubbing
Aqueousammonia
AdBlue ®/heavy-duty vehicles
Stationary sources
Vessels (Yarwil)
in oil fields acid
Nitric acid
CNGlue
Stationary sources
Emulsions
ANFOTAN Dry ice
NH3
NOXabatement
Acrylonitrile
Melamine
Combined products
Urea
Industrial gases
N2O abatement Applic. LIC
LIC wholesale
CO2
productsNitrogen
OxygenArgon
Propane
Formates
AmmoniaPropane
IR – Date: December 2012
83
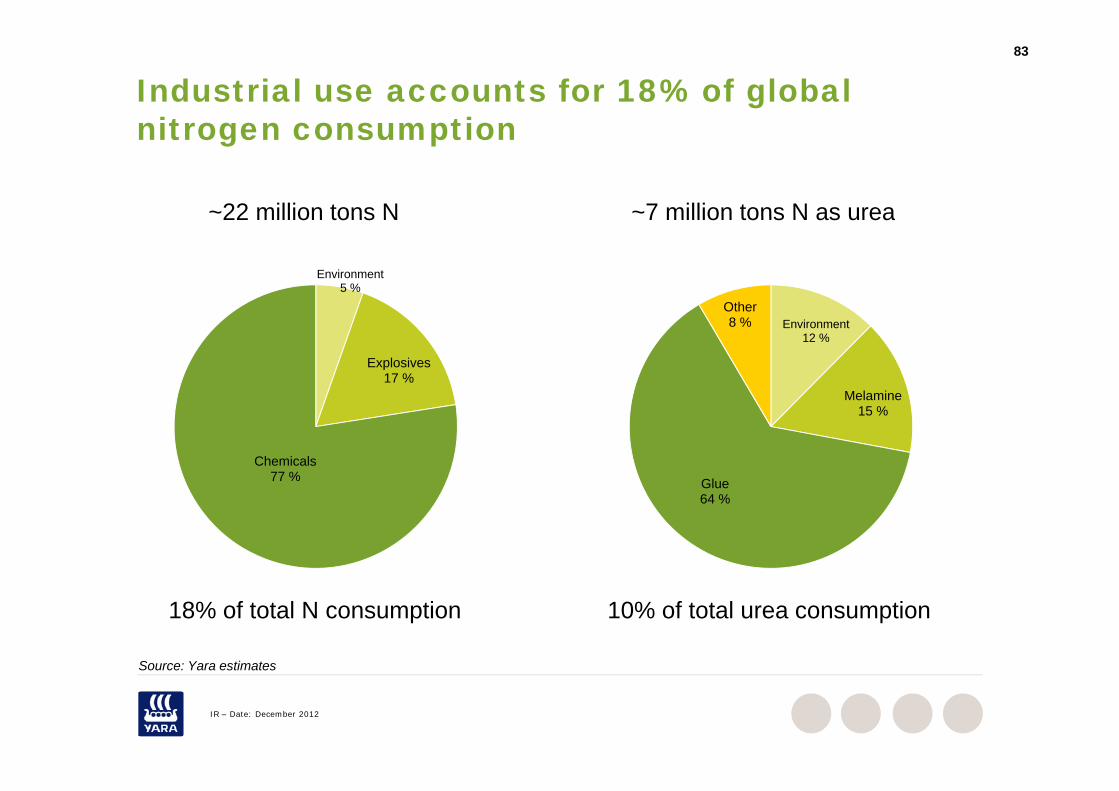
Industrial use accounts for 18% of global nitrogen consumptionnitrogen consumption
~22 million tons N ~7 million tons N as urea
Environment5 %
22 million tons N
Other
7 million tons N as urea
Explosives17 %
Environment12 %
Melamine
Other8 %
Chemicals77 %
Melamine15 %
GlueGlue64 %
18% of total N consumption 10% of total urea consumption
Source: Yara estimates
IR – Date: December 2012
Source: Yara estimates
84
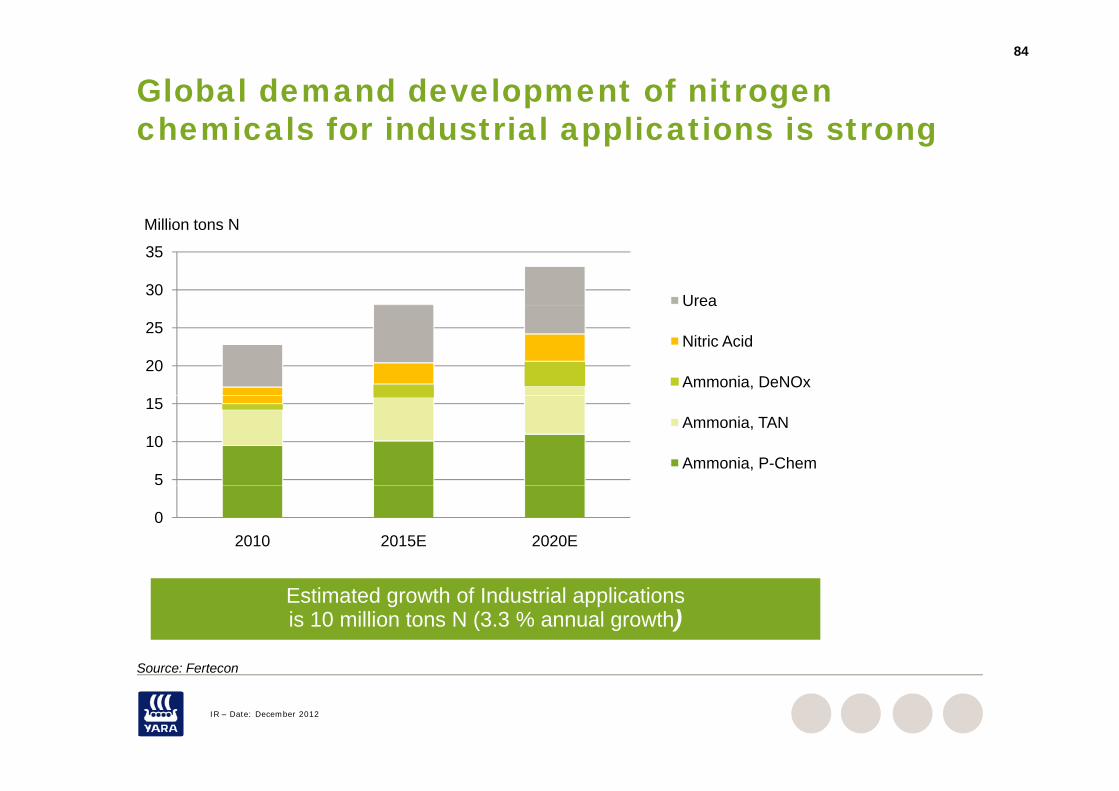
Global demand development of nitrogen chemicals for industrial applications is strongchemicals for industrial applications is strong
Million tons N
30
35
Urea
20
25
Urea
Nitric Acid
Ammonia, DeNOx
5
10
15Ammonia, TAN
Ammonia, P-Chem
02010 2015E 2020E
S F t
Estimated growth of Industrial applications is 10 million tons N (3.3 % annual growth)
IR – Date: December 2012
Source: Fertecon
85Example
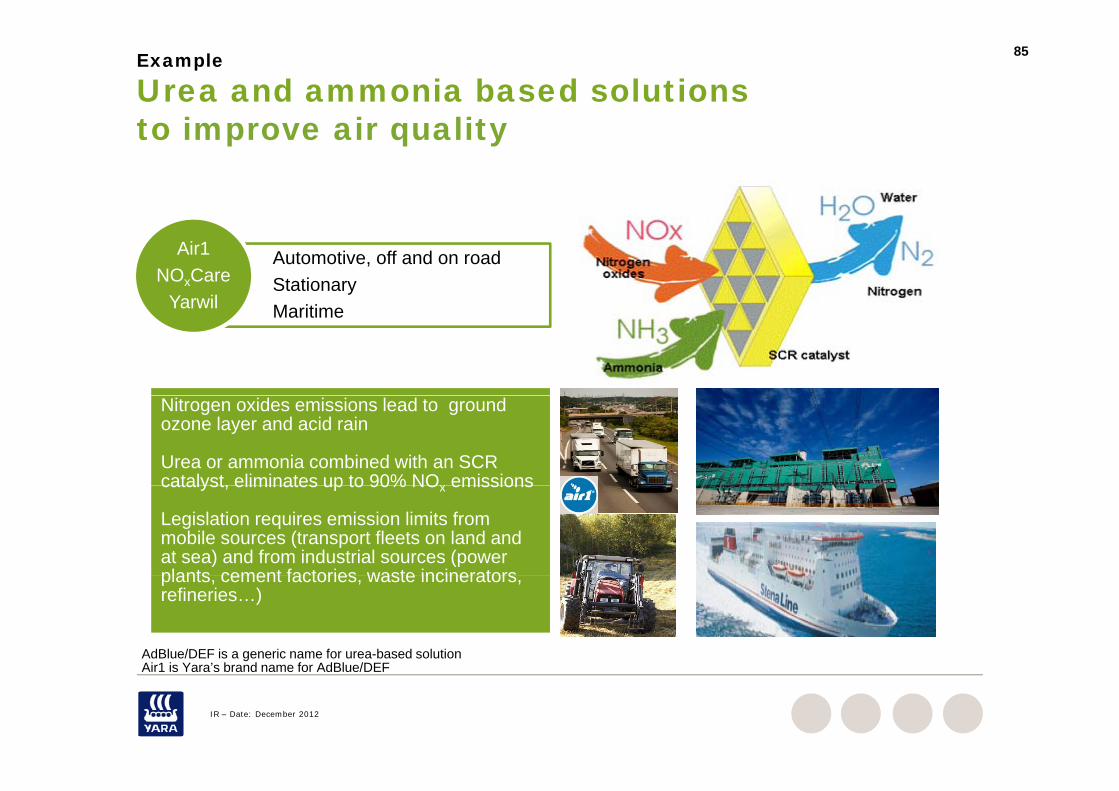
Urea and ammonia based solutions to improve air qualityto improve air quality
Automotive, off and on roadStationaryM iti
Air1NOxCare
Yarwil Maritime Yarwil
Nitrogen oxides emissions lead to ground ozone layer and acid rain
Urea or ammonia combined with an SCR catalyst, eliminates up to 90% NOx emissionscatalyst, eliminates up to 90% NOx emissions
Legislation requires emission limits from mobile sources (transport fleets on land and at sea) and from industrial sources (power plants cement factories waste incinerators
AdBlue/DEF is a generic name for urea-based solution Air1 is Yara’s brand name for AdBl e/DEF
plants, cement factories, waste incinerators, refineries…)
IR – Date: December 2012
Air1 is Yara’s brand name for AdBlue/DEF
86
Example
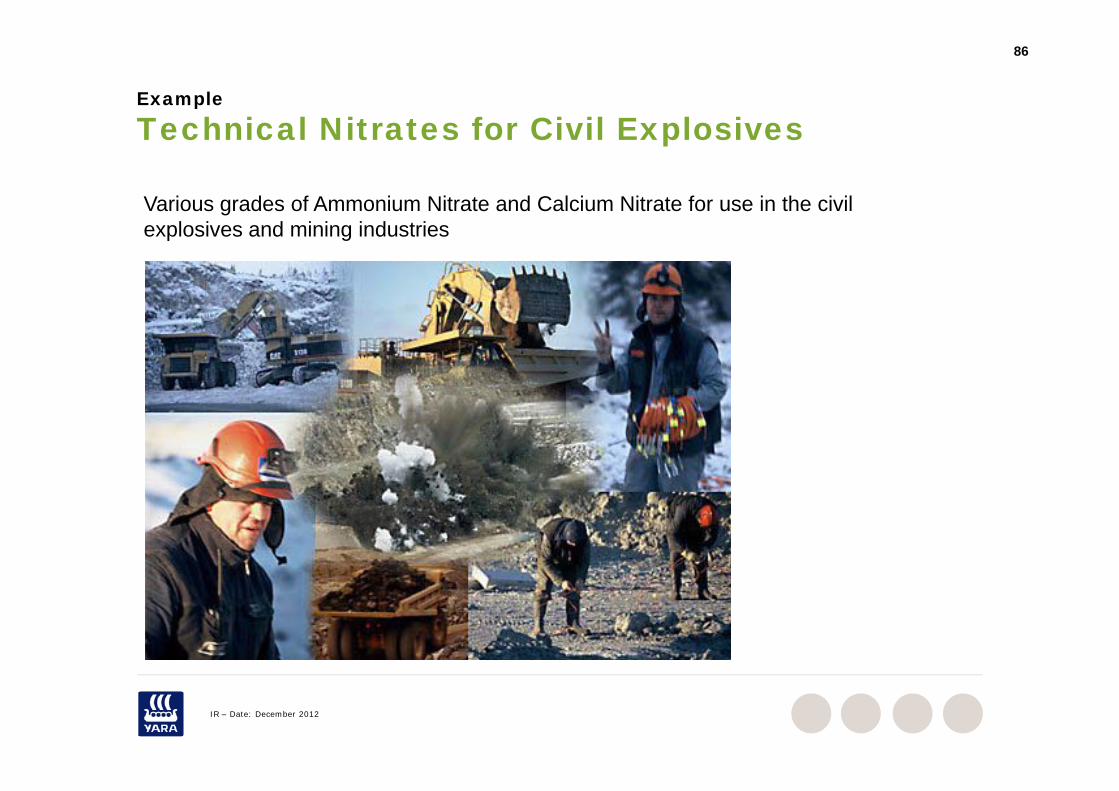
Technical Nitrates for Civil ExplosivesTechnical Nitrates for Civil Explosives
Various grades of Ammonium Nitrate and Calcium Nitrate for use in the civil explosives and mining industries
IR – Date: December 2012
87
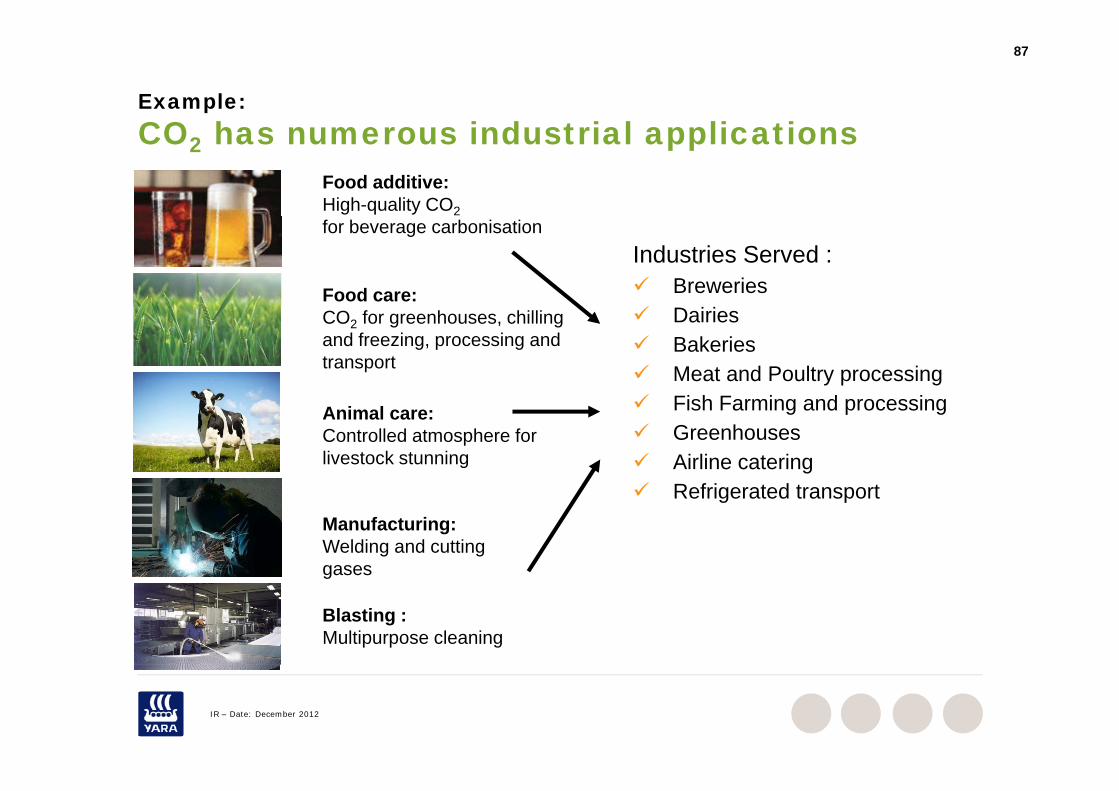
Example:CO h i d t i l li tiCO2 has numerous industrial applications
Food additive:High-quality CO2for beverage carbonisation
Food care:
Industries Served : Breweries
CO2 for greenhouses, chilling and freezing, processing and transport
Dairies Bakeries Meat and Poultry processing Fi h F i d iAnimal care:
Controlled atmosphere for livestock stunning
Fish Farming and processing Greenhouses Airline catering R f i t d t t
Manufacturing:Welding and cutting gases
Refrigerated transport
gases
Blasting :Multipurpose cleaning
IR – Date: December 2012
88
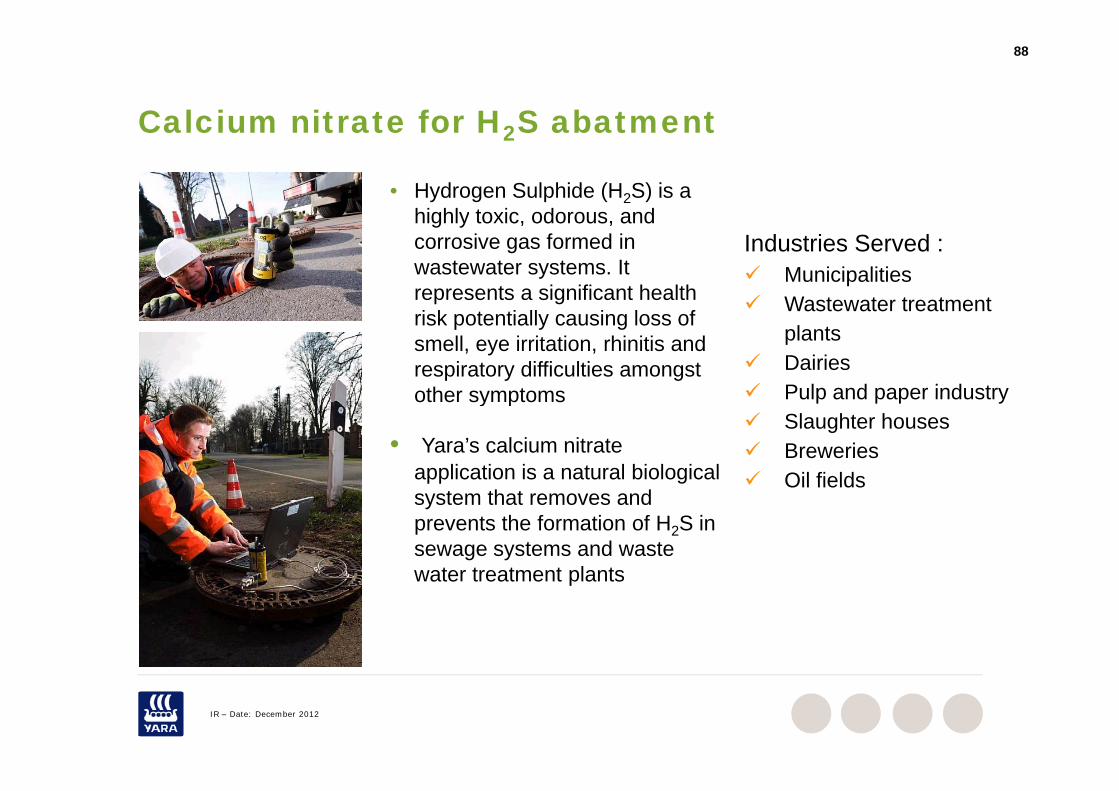
Calcium nitrate for H2S abatmentCalcium nitrate for H2S abatment
• Hydrogen Sulphide (H2S) is a highly toxic odorous andhighly toxic, odorous, and corrosive gas formed in wastewater systems. It represents a significant health
Industries Served : Municipalities Wastewater treatment
risk potentially causing loss ofsmell, eye irritation, rhinitis and respiratory difficulties amongstother symptoms
Wastewater treatment plants
Dairies Pulp and paper industryother symptoms
• Yara’s calcium nitrate application is a natural biological
Pulp and paper industry Slaughter houses Breweries Oil fields
system that removes and prevents the formation of H2S in sewage systems and wastewater treatment plants
Oil fields
water treatment plants
IR – Date: December 2012
89
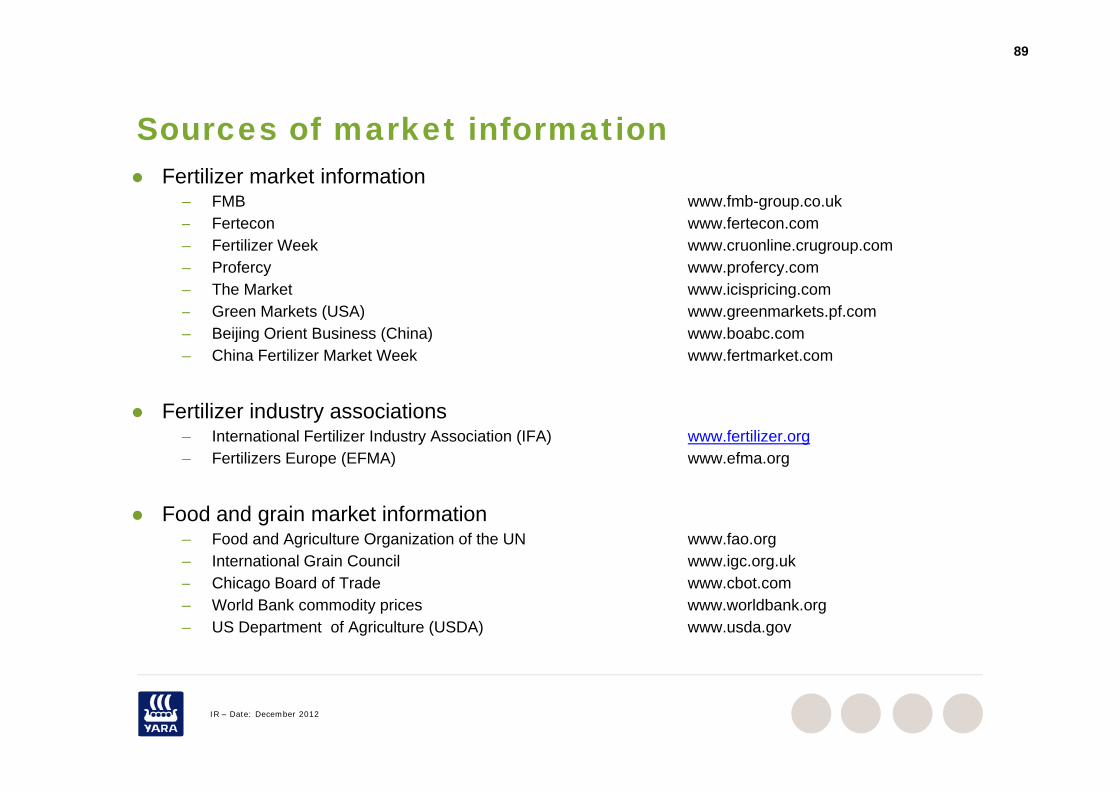
Sources of market informationSources of market information Fertilizer market information
– FMB www.fmb-group.co.uk– Fertecon www.fertecon.com– Fertilizer Week www.cruonline.crugroup.com– Profercy www.profercy.com– The Market www.icispricing.com
G M k t (USA) k t f– Green Markets (USA) www.greenmarkets.pf.com– Beijing Orient Business (China) www.boabc.com– China Fertilizer Market Week www.fertmarket.com
Fertilizer industry associations– International Fertilizer Industry Association (IFA) www.fertilizer.org– Fertilizers Europe (EFMA) www.efma.org
Food and grain market information– Food and Agriculture Organization of the UN www.fao.org– International Grain Council www.igc.org.uk– Chicago Board of Trade www.cbot.com– World Bank commodity prices www.worldbank.org– US Department of Agriculture (USDA) www.usda.gov
IR – Date: December 2012
www yara comwww.yara.com


![Manual.Site Managers Handbook[1] · Chemical fertilizer production requires about 42 gallons of petroleum to produce 110 pounds of nitrogen fertilizer. 10. Compost is an excellent](https://img.pdfslide.us/doc/110x75/5f1460c42acb4860253f1b5b/managers-handbook1-chemical-fertilizer-production-requires-about-42-gallons-of.jpg)