Embed Size (px)
Citation preview
2012
Deutsche Gesellschaftfür Ernährung e.V.
Summary
The Nutrition report 2012
German Nutrition Society
The Nutrition Report 2012
Summary
Published by the German Nutrition Society
On behalf of theFederal Ministry of Food, Agriculture and Consumer Protection
2
Imprint
Publisher German Nutrition Society Deutsche Gesellschaft für Ernährung e. V. Godesberger Allee 18 D–53175 Bonn Germany www.dge.de
Editor in Chief Prof. Dr. Peter Stehle, University of Bonn
Translation ABC Sprachschule Übersetzungen, Bonn
Scientific Secretary Dr. Eva Leschik-Bonnet
Editorial office Jessica Dinter, Birte A. Peterson-Sperlich, Klaus Schäbethal
Printing and XXXXXXXXXX processing
Edition 1st edition 2013
For reprint and dissemination with appendices, imprints and stickers written permission by the publisher and the German Nutrition Society is required. The use of texts and tables without agreement of the publisher violates copyright and will lead to prosecution. This is also true for copying, trans lation, microfilming and processing with electronic systems. This booklet has been carefully checked for its content by the publisher; however, a guarantee for the content cannot be given. Neither the publisher, nor the editors are liable for any personal injury or damage to property. Published by the German Nutrition Society on behalf of and sponsored by the Federal Ministry of Food, Agriculture and Consumer Protection.
ISBN 978-3-88749-247-2Art. No. 212 510
3
Introduction
This booklet called “The Nutrition Report 2012 – Summary“ is a very short version of the 12th Nutrition Report published by the German Nutrition Society. The Nutrition Report 2012 is an important instrument for those responsible in nutrition and health policy, and also for food manufacturers, for the public, nutritionists, dieticians and the media. The 5 chapters are providing substantial information about the nutritional situation in Germany, a review of the prevalence of pre-obesity and obesity in Germany, a description of the nutritional situation of seniors with need of care in private homes in Germany (ErnSiPP Study) and data about the situation, quality and satisfaction with “meals on wheels”. Aspects of food safety are always of broad public interest and so we continue to describe toxicological and micro-biological aspects of nutrition. Continuing the Nutrition Report 2008 and the report of the World Cancer Research Fund of 2007, a systematic analysis of the relation between nutrition and carcinogenesis was pursued evaluating the current evidence according to the guidelines of the German Nutrition Society (DGE). At last the influence of phytochemicals on human health was described updating the information of the last three Nutrition Reports.
Regrettably the long version of this Nutrition Report (more than 400 pages) is only available in German. For further information please contact:Deutsche Gesellschaft für Ernährung e. V. (German Nutrition Society)Science DepartmentGodesberger Allee 18D–53175 BonnEmail: [email protected]
Please enjoy reading this booklet.
4
Table of contents
Introduction . . . . . . . . . . . . . . . . . . . . . . . . . . . . . . . . . . . . . . . . . . . . . . . . . . . . . . . . 3
1 Nutritional Situation in Germany . . . . . . . . . . . . . . . . . . . . . . . . 7
1.1 Trendanalysisoffoodconsumptiononthebasisofagriculturalstatistics . . . . . . . . . . . . . . . . . . . . . . . . . . . . . . . . . . . . . . . 7
1.1.1 Methodology . . . . . . . . . . . . . . . . . . . . . . . . . . . . . . . . . . . . . . . . . . . . . . . . . 71.1.2 Results . . . . . . . . . . . . . . . . . . . . . . . . . . . . . . . . . . . . . . . . . . . . . . . . . . . . . 71.1.3 Evaluation . . . . . . . . . . . . . . . . . . . . . . . . . . . . . . . . . . . . . . . . . . . . . . . . . . . 10
1.2 Foodandnutrientintake–resultsoftheNationalNutritionSurveyII . . . . . . . . . . . . . . . . . . . . . . . . . 11
1.2.1 Methodology . . . . . . . . . . . . . . . . . . . . . . . . . . . . . . . . . . . . . . . . . . . . . . . . . 111.2.2 Results . . . . . . . . . . . . . . . . . . . . . . . . . . . . . . . . . . . . . . . . . . . . . . . . . . . . . . 121.2.3 Evaluation . . . . . . . . . . . . . . . . . . . . . . . . . . . . . . . . . . . . . . . . . . . . . . . . . . . 18
1.3 Nutrientintakeviasupplements– resultsoftheNationalNutritionSurveyII . . . . . . . . . . . . . . . . . . . . . . . . . 221.3.1 Methodology . . . . . . . . . . . . . . . . . . . . . . . . . . . . . . . . . . . . . . . . . . . . . . . . . 221.3.2 Results . . . . . . . . . . . . . . . . . . . . . . . . . . . . . . . . . . . . . . . . . . . . . . . . . . . . . 231.3.3 Evaluation . . . . . . . . . . . . . . . . . . . . . . . . . . . . . . . . . . . . . . . . . . . . . . . . . . . 24
1.4 Nutritionalsituationofvariouspopulationgroups–resultsoftheNationalNutritionSurveyII . . . . . . . . . . . . . . . . . . . . . . . . 24
1.4.1 Methodology . . . . . . . . . . . . . . . . . . . . . . . . . . . . . . . . . . . . . . . . . . . . . . . . . 241.4.2 Results . . . . . . . . . . . . . . . . . . . . . . . . . . . . . . . . . . . . . . . . . . . . . . . . . . . . . . 251.4.3 Evaluation . . . . . . . . . . . . . . . . . . . . . . . . . . . . . . . . . . . . . . . . . . . . . . . . . . . 26
1.5 IodinesupplyofschoolchildreninGermany– resultsoftheDONALDStudy . . . . . . . . . . . . . . . . . . . . . . . . . . . . . . . . . . . 271.5.1 Methodology . . . . . . . . . . . . . . . . . . . . . . . . . . . . . . . . . . . . . . . . . . . . . . . . . 271.5.2 Results . . . . . . . . . . . . . . . . . . . . . . . . . . . . . . . . . . . . . . . . . . . . . . . . . . . . . 271.5.3 Evaluation . . . . . . . . . . . . . . . . . . . . . . . . . . . . . . . . . . . . . . . . . . . . . . . . . . . 29
5
1.6 PrevalenceanddevelopmentofoverweightinGermany . . . . . . . . . . . . . 291.6.1 Methodology . . . . . . . . . . . . . . . . . . . . . . . . . . . . . . . . . . . . . . . . . . . . . . . . . 291.6.2 Results . . . . . . . . . . . . . . . . . . . . . . . . . . . . . . . . . . . . . . . . . . . . . . . . . . . . . 301.6.3 Evaluation . . . . . . . . . . . . . . . . . . . . . . . . . . . . . . . . . . . . . . . . . . . . . . . . . . . 32
1.7 Nutritionalprecautionsforemergencysituations . . . . . . . . . . . . . . . . . . 321.7.1 Methodology . . . . . . . . . . . . . . . . . . . . . . . . . . . . . . . . . . . . . . . . . . . . . . . . . 321.7.2 Results . . . . . . . . . . . . . . . . . . . . . . . . . . . . . . . . . . . . . . . . . . . . . . . . . . . . . 321.7.3 Evaluation . . . . . . . . . . . . . . . . . . . . . . . . . . . . . . . . . . . . . . . . . . . . . . . . . . . 33
2 Nutritional Situation of Seniors with Need of Care in Private Homes in Germany (ErnSiPP Study) . . . . . . . . . 34
2.1 Methodology . . . . . . . . . . . . . . . . . . . . . . . . . . . . . . . . . . . . . . . . . . . . . . . . 34
2.2 Results . . . . . . . . . . . . . . . . . . . . . . . . . . . . . . . . . . . . . . . . . . . . . . . . . . . . . 36
2.3 Evaluation . . . . . . . . . . . . . . . . . . . . . . . . . . . . . . . . . . . . . . . . . . . . . . . . . . . 39
3 Situation, Quality and Satisfaction with “Meals on Wheels” . . . . . . . . . . . . . . . . . . . . . . . . . . . . . . . . 43
3.1 Methodology . . . . . . . . . . . . . . . . . . . . . . . . . . . . . . . . . . . . . . . . . . . . . . . . 43
3.2 Results . . . . . . . . . . . . . . . . . . . . . . . . . . . . . . . . . . . . . . . . . . . . . . . . . . . . . 45
3.3 Evaluation. . . . . . . . . . . . . . . . . . . . . . . . . . . . . . . . . . . . . . . . . . . . . . . . . . . 49
4 Food Safety . . . . . . . . . . . . . . . . . . . . . . . . . . . . . . . . . . . . . . . . . . . . . . . 50
4.1 Microbiological aspects . . . . . . . . . . . . . . . . . . . . . . . . . . . . . . . . . . . . . 504.1.1 Methodology . . . . . . . . . . . . . . . . . . . . . . . . . . . . . . . . . . . . . . . . . . . . . . . . 504.1.2 Results . . . . . . . . . . . . . . . . . . . . . . . . . . . . . . . . . . . . . . . . . . . . . . . . . . . . . 504.1.3 Evaluation . . . . . . . . . . . . . . . . . . . . . . . . . . . . . . . . . . . . . . . . . . . . . . . . . . . 52
6
4.2 Undesiredsubstancesinfood–residuesofplantprotectionproducts . . . . . . . . . . . . . . . . . . . . . . . . . . . . 52
4.2.1 Methodology . . . . . . . . . . . . . . . . . . . . . . . . . . . . . . . . . . . . . . . . . . . . . . . . . 524.2.2 Results . . . . . . . . . . . . . . . . . . . . . . . . . . . . . . . . . . . . . . . . . . . . . . . . . . . . . 524.2.3 Evaluation . . . . . . . . . . . . . . . . . . . . . . . . . . . . . . . . . . . . . . . . . . . . . . . . . . . 54
4.3 Residuesinfoodofanimalorigin. . . . . . . . . . . . . . . . . . . . . . . . . . . . . . . . 544.3.1 Methodology . . . . . . . . . . . . . . . . . . . . . . . . . . . . . . . . . . . . . . . . . . . . . . . . . 544.3.2 Results . . . . . . . . . . . . . . . . . . . . . . . . . . . . . . . . . . . . . . . . . . . . . . . . . . . . . 544.3.3 Evaluation . . . . . . . . . . . . . . . . . . . . . . . . . . . . . . . . . . . . . . . . . . . . . . . . . . . 56
4.4 Environmentalcontaminantsinfoodandhumanbreastmilk . . . . . . . . 564.4.1 Methodology . . . . . . . . . . . . . . . . . . . . . . . . . . . . . . . . . . . . . . . . . . . . . . . . . 564.4.2 Results . . . . . . . . . . . . . . . . . . . . . . . . . . . . . . . . . . . . . . . . . . . . . . . . . . . . . 564.4.2.1 Environmental contaminants in food . . . . . . . . . . . . . . . . . . . . . . . . . . . . . . 564.4.2.2 Environmental contaminants in human breast milk . . . . . . . . . . . . . . . . . . 584.4.3 Evaluation . . . . . . . . . . . . . . . . . . . . . . . . . . . . . . . . . . . . . . . . . . . . . . . . . . . 59
4.5 Contaminantsinfoodformedduringheatingprocesses . . . . . . . . . . . . . 594.5.1 Evaluation of available scientific findings . . . . . . . . . . . . . . . . . . . . . . . . . . 59
5 Disease Prevention and Nutrition . . . . . . . . . . . . . . . . . . . . . . . 61
5.1 Relationshipbetweennutritionandcarcinogenesis . . . . . . . . . . . . . . . . 615.1.1 Methodology . . . . . . . . . . . . . . . . . . . . . . . . . . . . . . . . . . . . . . . . . . . . . . . . . 615.1.2 Results . . . . . . . . . . . . . . . . . . . . . . . . . . . . . . . . . . . . . . . . . . . . . . . . . . . . . . 615.1.3 Evaluation . . . . . . . . . . . . . . . . . . . . . . . . . . . . . . . . . . . . . . . . . . . . . . . . . . . 66
5.2 Influenceofphytochemicalsonhealth. . . . . . . . . . . . . . . . . . . . . . . . . . . . 675.2.1 Methodology . . . . . . . . . . . . . . . . . . . . . . . . . . . . . . . . . . . . . . . . . . . . . . . . . 675.2.2 Results . . . . . . . . . . . . . . . . . . . . . . . . . . . . . . . . . . . . . . . . . . . . . . . . . . . . . . 675.2.3 Evaluation . . . . . . . . . . . . . . . . . . . . . . . . . . . . . . . . . . . . . . . . . . . . . . . . . . . 69
The German 3-D-Food Pyramid . . . . . . . . . . . . . . . . . . . . . . . . . . . . . . . . . . . . 70
7
1 Nutritional Situation in Germany
1.1 Trend analysis of food consumption on the basis of agri cultural statistics
1.1.1 Methodology
The basis for calculating the long-term trend analysis is formed by the agricultural statistics compiled by the Federal Statistical Office and each federal ministry responsible for agri-culture which are published every year in the statistical yearbook on nutrition, agriculture and forestry (Section “D. Food Economy”). The corresponding data are recorded on the production or wholesale level (official company statistics) or on the basis of estimates of the food quantities in question based on tax revenue. The agricultural statistics show the food quantities available for consumption throughout the entire German economy; these are classed as “food consumption” for evaluation purposes. The listed quantities also contain food items which are not consumable (e. g. bones, peelings) or not intended for human consumption (e. g. used for animal feeding). For this reason, the listed annual “food con-sumption” per capita is usually higher than the quantities actually consumed. Due to the data collection methods which have been comparable for decades, it is possible to evaluate trends. Linear regression analysis were conducted for this purpose. In the presence of a significant regression coefficient β, the average annual change in per capita consumption is very probably different from zero (error probability p < 0.05; significant trend).
To obtain a nutritional physiological evaluation of food consumption, the listed data are set in relation to the food-related recommendations of the DGE to maintain a balanced, whole-some diet.
1.1.2 Results
Increased consumption of vegetables, citrus fruits, cheese, poultry meat and fish accompa-nied by a simultaneous decrease in the consumption of rye, potatoes, alcohol (calculated as aqueous ethyl alcohol), butter and vegetable fats (including margarine) are characteristic of the long-term development of food consumption per capita of the population in Germany from the 1950s until 2010. The consumption of grain products and fresh fruit is only changing slightly. Consumption of sucrose (sugar) rose considerably between the 1950s
8
and 1980s and remains at this high level to this day. Per capita sugar consumption was recalculated due to the increasing use of sugar beets for bioethanol production and for this reason, no trend statements are currently possible. Glucose consumption today is almost twice as high as it was roughly 20 years ago.
Several significant trends in food consumption per capita per year can be identified for the period 2000 to 2010/2011. The exclusive food consumption of total cereal grains rose by an average of 1.2 kg, but it was only the consumption of durum wheat, maize and oats that increased, whereas the significant decline in rye consumption continues.
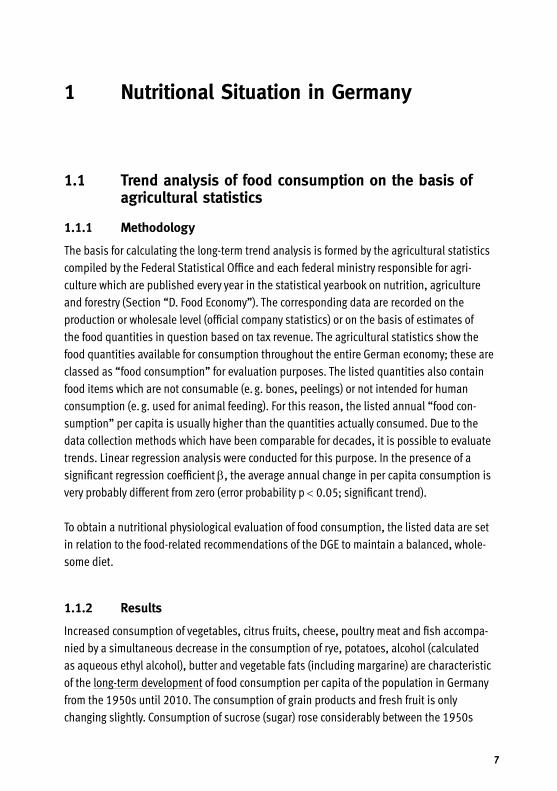
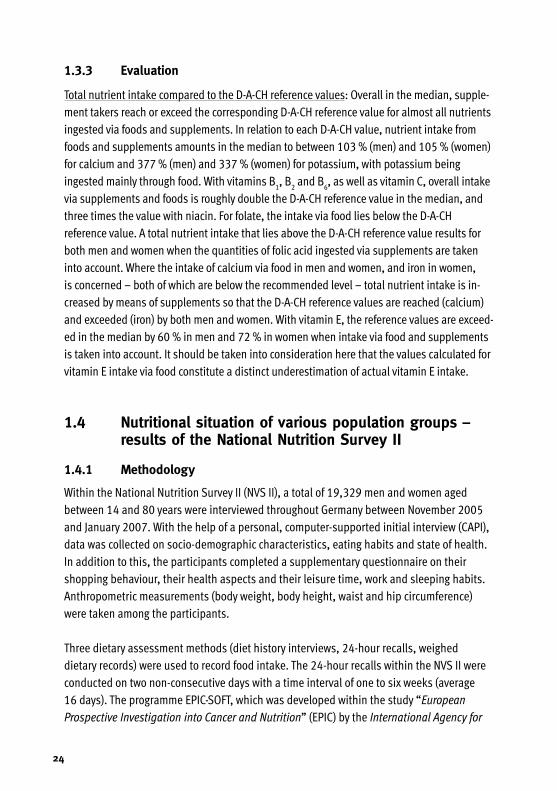
Pasta and rice consumption has increased by an average of 220 g and 150 g respectively, whereas consumption of legumes dropped slightly by approx. 40 g. This also applies to bread and bread rolls (average reduction approx. 200 g), with potato consumption also falling by an average of approx. 1.3 kg. Total vegetable consumption (Figure 1) shows average annual growth rates of approx. 1.1 kg attributable above all to the increases in the consumption of tomatoes (approx. 600 g), onions and carrots (approx. 130 g and 180 g respectively), leaf and stalk vegetables (approx. 100 g) and cucumbers (approx. 70 g). In contrast, there was a significant decline in the consumption of cabbage (approx. 150 g) and fresh legumes (approx. 50 g). Fruit consumption shows a reduction by an average of approx. 800 g caused above all by the decrease in the consumption of apples and peaches
25
20
15
10
5
0
kg/h
ead
and
year
Figure1:Consumption of selected vegetables (2000 to 2011)
CabbageTomatoesCarrots, beetroot Leaf and stalk vegetables Fresh legumes
Cucumbers Bulb vegetables
2000 2001 2002 2003 2004 2005 2006 2007 2008 2009 2010 2011
Year
9
(approx. 600 g and 90 g respectively). Among the tropical fruits, there was a reduction above all in the consumption of bananas, lemons, grapefruit and other citrus fruits. With the berry fruits, a significant increase can only be recognised for the blackberry, blueberry, cranberry group (average 40 g). In the confectionery area, the consumption of gumdrops and jelly products increased by an average of 70 g, as opposed to consumption of hard and soft caramel and honey which decreased by an average of 15 g and 25 g respectively. The biggest shift in this food group was in the consumption of chocolate goods which showed a significant increase of approx. 150 g on average.
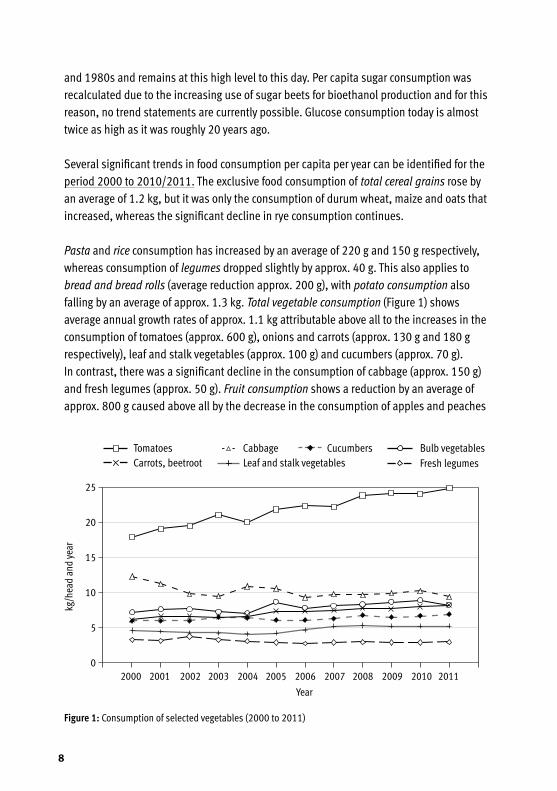
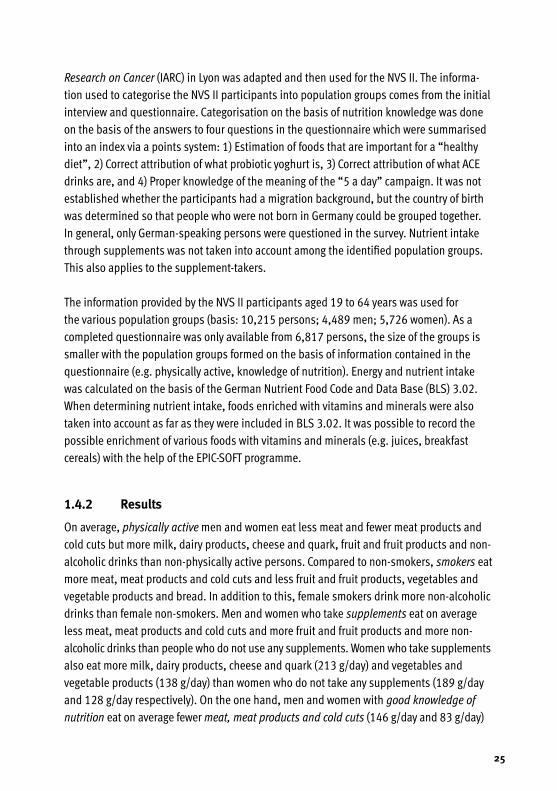
With milk and dairy products (Figure 2), an increase averaging almost 300 g was recorded for yoghurt along with a corresponding decrease of approx. 150 g in the consumption of but-termilk products. Altogether, cheese consumption has continued to rise, achieving growth rates of approx. 120 g during the observation period. This is attributable above all to the rise in the consumption of hard, semi-hard and soft cheese along with pasta filata and whey cheese, whereas there was a decline in cream cheese consumption by an average of 330 g. With meat, an increase in the consumption of poultry meat by an average of approx. 120 g was observed. Consumption of offal is in decline (average decrease approx. 100 g). Where beverage consumption is concerned there are significant increases with mineral water and
Cream
20
15
10
5
0
kg/h
ead
and
year
Figure2:Consumption of milk and dairy products (2000 to 2010)1) Since 2002 without industrial milk and other consumers milk2) Since 2004 without fermented milk, kefir, yoghurt and mixed milk products as well as mixed milk drinks made
out of cream 3) Since 2006 the data is not comparable to previous years due to an altered method of calculation.
Buttermilk products
Consumers milk
2000 2001 2002 2003 2004 2005 2006 2007 2008 2009 2010
Year
Yoghurt
Condensed milk products
Cons
umer
s m
ilk in
kg/
head
and
yea
r
80
60
40
20
0
1)
2)
3)
10
refreshing drinks (on average approx. 2.9 l and 1.1 l respectively). Consumption of fruit juices (including fruit nectars and vegetable juices), on the other hand, has declined by an average of approx. 0.5 l. An overall decline, if only slight, is still being experienced with coffee consumption, with an average of approx. 30 g of beans (equivalent to approx. ¾ l of liquid coffee) and tea consumption with an average of approx. 2 g (equivalent to approx. ¼ l of liquid tea). There has also been a further reduction in alcohol consumption (minus 70 ml), with beer being affected most severely by this development with a decline averaging approx. 2 l. There was also a slight reduction in the consumption of spirits (approx. 50 ml).
1.1.3 Evaluation
Compared to the current DGE benchmark (300 g to 600 g of meat per week including meat and sausage products derived from it), the calculated weekly per capita consumption is higher. Although this results in a good supply of protein, several vitamins (e.g. vitamin A, vitamin B
1, vitamin B
12) and bioavailable trace elements (e.g. zinc, iron), the higher intake
of undesired food ingredients (e.g. saturated fatty acids, cholesterol, purines) that goes hand in hand with it has to be evaluated as unfavourable. At the same time, due to typical methods of preparing (coating, fatty gravy) and characteristic patterns of consumption high meat consumption is often associated with significantly higher fat intake and hence a higher energy intake. The increase in fish consumption is evaluated as favourable from a nutri-tional perspective because this food group makes a considerable contribution to the supply of long-chain, highly unsaturated n-3 fatty acids. Where fat suppliers are concerned, the overall decrease in the consumption of spreadable fats is regarded as favourable because it reduces total fat consumption. As the consumption of vegetable oil is also on the decline, the ratio of (poly-) unsaturated to saturated fatty acids should be affected negatively. Due to the fact that grain (wheat) is also used for bioethanol production, and grain consump-tion is only increasing very slowly, it has to be assumed that consumption is probably too low to achieve the desired increase in the intake of grain dietary fibres. The consumption of sugar-sweetened refreshing drinks should not increase even further, especially among children and teenagers, but should be significantly reduced. From a nutritional perspective, the increased consumption of vegetables is very much to be welcomed and should have resulted in a further improvement in the supply of several vitamins and minerals, as well as phytochemicals and dietary fibres. As the trend analysis is showing a decrease in fruit consumption in the meantime, however, further efforts are required in this area in the fu-ture in order to counteract this trend, thereby enabling the use of the preventive potential of increased vegetable and fruit consumption.
11
1.2 Food and nutrient intake – results of the National Nutrition Survey II
1.2.1 Methodology
Within the National Nutrition Survey II (NVS II), a total of 19,329 men and women aged between 14 and 80 years were interviewed throughout Germany between November 2005 and January 2007. With the help of a personal, computer-supported initial interview (CAPI), data were collected on socio-demographic characteristics, eating habits and state of health. In addition to this, the participants completed a supplementary questionnaire on their shopping behaviour their health aspects and their leisure time, work and sleeping habits. Anthropometric measurements (body weight, body height, waist and hip circumference) were taken among the participants.
Three dietary assessment methods (diet history interviews, 24-hour recalls, weighed dietary records) were used to record food intake. The 24-hour recalls within the NVS II were conduct-ed on two nonconsecutive days with a time interval of one to six weeks (average 16 days). The programme EPIC-SOFT, which was developed within the study “European Prospective Investigation into Cancer and Nutrition” (EPIC) by the International Agency for Research on Cancer (IARC) in Lyon was adapted and then used for the NVS II. For a total of 13,926 survey participants aged between 14 and 80 years, two 24-hour recalls are available. The results shown here relate to 13,753 participants as only the details of the 15 to 80-year-olds were included in the evaluations on comparability with the D-A-CH reference values. The calcula-tion of energy and nutrient intake was made on the basis of the German Nutrient Food Code and Data Base (BLS) 3.02. When calculating nutrient intake, foods enriched with vitamins and minerals were also taken into account if they were contained in BLS 3.02. Possible enrichment with vitamins and minerals was recorded for various foods (e.g. juices, break-fast cereals) with the help of the EPIC-SOFT programme. In addition to this, a prospective weighed dietary record was kept twice for four days in a random sub-sample of approx. 1,000 persons. In this dietary record, the weighed quantities of all used foods and beverages were recorded as well as the precise details of their condition when purchased, the method of preparation and packaging. The food and nutrient intake of the NVS II participants, differ-entiated by gender, age and social class, are compared with the food-related benchmarks of the German Nutrition Society (DGE) and the D-A-CH reference values for nutrient intake of the nutrition societies in Germany, Austria and Switzerland.
The data was evaluated with the help of the programme SAS, Version 9.1 (SAS Institute Inc., Cary, North Carolina, USA). To calculate food and nutrient intake, the respective arithmeti-cal mean value from the first and second 24-hour recall was formed initially. Food intake is
12
expressed as an arithmetical mean value (MV) for the various population groups and nutri-ent intake as the median (p50), each with the 95 % confidence interval (CI). The compari-sons of food and nutrient intake, differentiated by gender, age and social class, are made on the basis of the confidence intervals of the mean value and median. Significant differences exist between the groups if the confidence intervals do not intersect or touch. To estimate the usual nutrient intake of the participants and avoid intra-individual variance, the Mul-tiple Source Method (MSM) was applied under consideration of the covariates gender, age, social class and body mass index (BMI). To describe the social status of the participants, the household net income, the level of education of the participant and the professional status of the main earner of the household were used to form a stratification index. On the basis of this index, the participants were classified into the groups “lower social class”, “middle social class” and “upper social class”. Possible socio-demographic distortions were mini-mised by weighting on the basis of the micro-census conducted in 2006 for the characteris-tics gender, age, federal state, secondary school qualifications, profession and household size. Underreporting by the participants was determined on the basis of the quotient from energy intake and resting energy expenditure. Resting energy expenditure was calculated under consideration of body height and body weight. A limit value of 0.965 was determined for the quotient from energy intake and resting energy expenditure. If the energy intake – resting energy expenditure quotient of a participant lies below this limit value, it has to be assumed that the energy intake established with the help of the 24-hour recalls does not reflect actual energy intake and that it is lower than actual energy intake.
1.2.2 Results
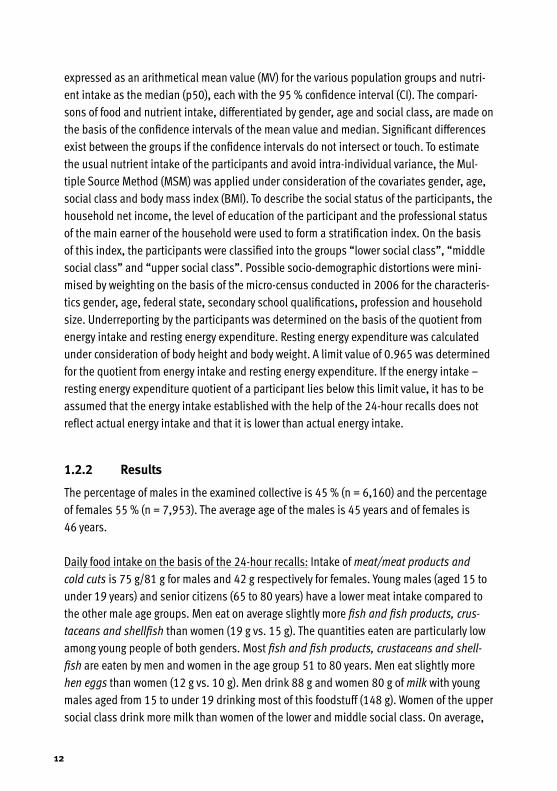
The percentage of males in the examined collective is 45 % (n = 6,160) and the percentage of females 55 % (n = 7,953). The average age of the males is 45 years and of females is 46 years.
Daily food intake on the basis of the 24-hour recalls: Intake of meat/meat products and cold cuts is 75 g/81 g for males and 42 g respectively for females. Young males (aged 15 to under 19 years) and senior citizens (65 to 80 years) have a lower meat intake compared to the other male age groups. Men eat on average slightly more fish and fish products, crus-taceans and shellfish than women (19 g vs. 15 g). The quantities eaten are particularly low among young people of both genders. Most fish and fish products, crustaceans and shell-fish are eaten by men and women in the age group 51 to 80 years. Men eat slightly more hen eggs than women (12 g vs. 10 g). Men drink 88 g and women 80 g of milk with young males aged from 15 to under 19 drinking most of this foodstuff (148 g). Women of the upper social class drink more milk than women of the lower and middle social class. On average,
13
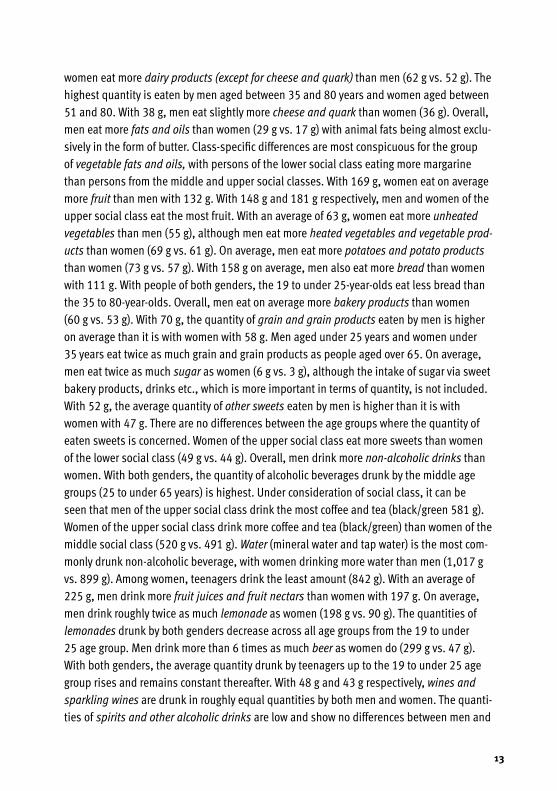
women eat more dairy products (except for cheese and quark) than men (62 g vs. 52 g). The highest quantity is eaten by men aged between 35 and 80 years and women aged between 51 and 80. With 38 g, men eat slightly more cheese and quark than women (36 g). Overall, men eat more fats and oils than women (29 g vs. 17 g) with animal fats being almost exclu-sively in the form of butter. Class-specific differences are most conspicuous for the group of vegetable fats and oils, with persons of the lower social class eating more margarine than persons from the middle and upper social classes. With 169 g, women eat on average more fruit than men with 132 g. With 148 g and 181 g respectively, men and women of the upper social class eat the most fruit. With an average of 63 g, women eat more unheated vegetables than men (55 g), although men eat more heated vegetables and vegetable prod-ucts than women (69 g vs. 61 g). On average, men eat more potatoes and potato products than women (73 g vs. 57 g). With 158 g on average, men also eat more bread than women with 111 g. With people of both genders, the 19 to under 25-year-olds eat less bread than the 35 to 80-year-olds. Overall, men eat on average more bakery products than women (60 g vs. 53 g). With 70 g, the quantity of grain and grain products eaten by men is higher on average than it is with women with 58 g. Men aged under 25 years and women under 35 years eat twice as much grain and grain products as people aged over 65. On average, men eat twice as much sugar as women (6 g vs. 3 g), although the intake of sugar via sweet bakery products, drinks etc., which is more important in terms of quantity, is not included. With 52 g, the average quantity of other sweets eaten by men is higher than it is with women with 47 g. There are no differences between the age groups where the quantity of eaten sweets is concerned. Women of the upper social class eat more sweets than women of the lower social class (49 g vs. 44 g). Overall, men drink more non-alcoholic drinks than women. With both genders, the quantity of alcoholic beverages drunk by the middle age groups (25 to under 65 years) is highest. Under consideration of social class, it can be seen that men of the upper social class drink the most coffee and tea (black/green 581 g). Women of the upper social class drink more coffee and tea (black/green) than women of the middle social class (520 g vs. 491 g). Water (mineral water and tap water) is the most com-monly drunk non-alcoholic beverage, with women drinking more water than men (1,017 g vs. 899 g). Among women, teenagers drink the least amount (842 g). With an average of 225 g, men drink more fruit juices and fruit nectars than women with 197 g. On average, men drink roughly twice as much lemonade as women (198 g vs. 90 g). The quantities of lemonades drunk by both genders decrease across all age groups from the 19 to under 25 age group. Men drink more than 6 times as much beer as women do (299 g vs. 47 g). With both genders, the average quantity drunk by teenagers up to the 19 to under 25 age group rises and remains constant thereafter. With 48 g and 43 g respectively, wines and sparkling wines are drunk in roughly equal quantities by both men and women. The quanti-ties of spirits and other alcoholic drinks are low and show no differences between men and
14
women. The high intake of these drinks among men aged between 19 and 25 years (16 g) is conspicuous.
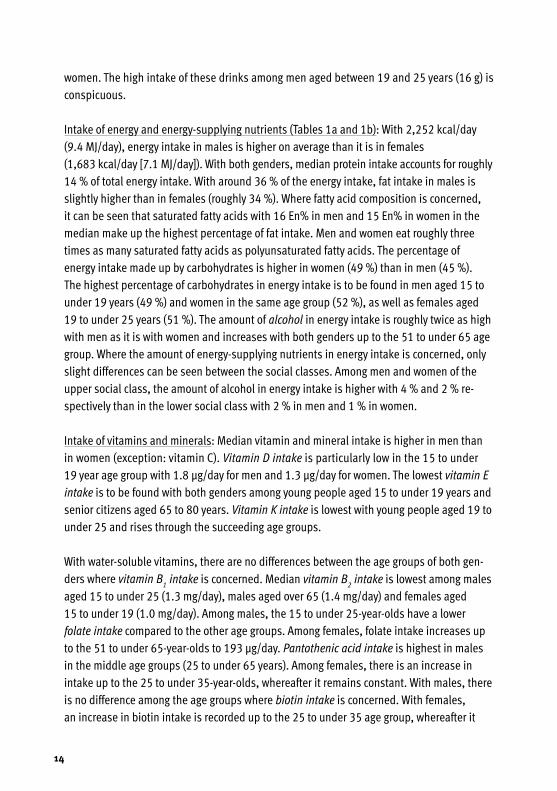
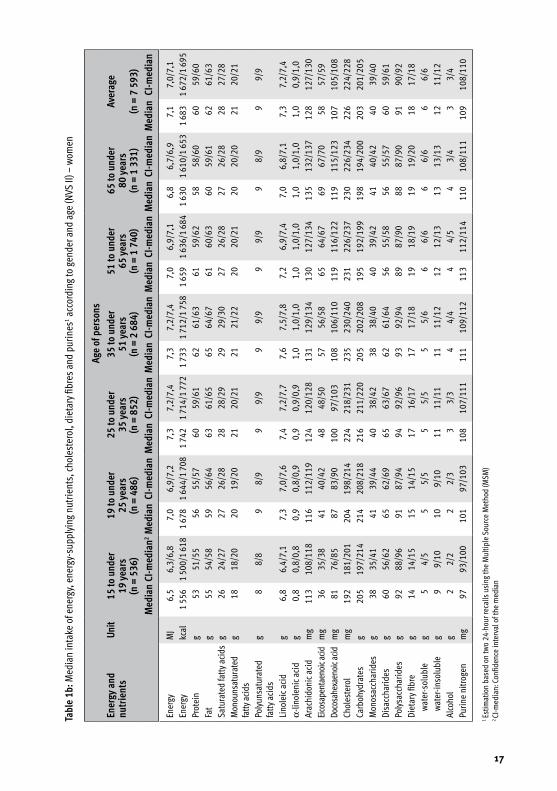
Intake of energy and energy-supplying nutrients (Tables 1a and 1b): With 2,252 kcal/day (9.4 MJ/day), energy intake in males is higher on average than it is in females (1,683 kcal/day [7.1 MJ/day]). With both genders, median protein intake accounts for roughly 14 % of total energy intake. With around 36 % of the energy intake, fat intake in males is slightly higher than in females (roughly 34 %). Where fatty acid composition is concerned, it can be seen that saturated fatty acids with 16 En% in men and 15 En% in women in the median make up the highest percentage of fat intake. Men and women eat roughly three times as many saturated fatty acids as polyunsaturated fatty acids. The percentage of energy intake made up by carbohydrates is higher in women (49 %) than in men (45 %). The highest percentage of carbohydrates in energy intake is to be found in men aged 15 to under 19 years (49 %) and women in the same age group (52 %), as well as females aged 19 to under 25 years (51 %). The amount of alcohol in energy intake is roughly twice as high with men as it is with women and increases with both genders up to the 51 to under 65 age group. Where the amount of energy-supplying nutrients in energy intake is concerned, only slight differences can be seen between the social classes. Among men and women of the upper social class, the amount of alcohol in energy intake is higher with 4 % and 2 % re-spectively than in the lower social class with 2 % in men and 1 % in women.
Intake of vitamins and minerals: Median vitamin and mineral intake is higher in men than in women (exception: vitamin C). Vitamin D intake is particularly low in the 15 to under 19 year age group with 1.8 µg/day for men and 1.3 µg/day for women. The lowest vitamin E intake is to be found with both genders among young people aged 15 to under 19 years and senior citizens aged 65 to 80 years. Vitamin K intake is lowest with young people aged 19 to under 25 and rises through the succeeding age groups.
With water-soluble vitamins, there are no differences between the age groups of both gen-ders where vitamin B
1 intake is concerned. Median vitamin B
2 intake is lowest among males
aged 15 to under 25 (1.3 mg/day), males aged over 65 (1.4 mg/day) and females aged 15 to under 19 (1.0 mg/day). Among males, the 15 to under 25-year-olds have a lower folate intake compared to the other age groups. Among females, folate intake increases up to the 51 to under 65-year-olds to 193 µg/day. Pantothenic acid intake is highest in males in the middle age groups (25 to under 65 years). Among females, there is an increase in intake up to the 25 to under 35-year-olds, whereafter it remains constant. With males, there is no difference among the age groups where biotin intake is concerned. With females, an increase in biotin intake is recorded up to the 25 to under 35 age group, whereafter it
15
remains constant. Vitamin B12
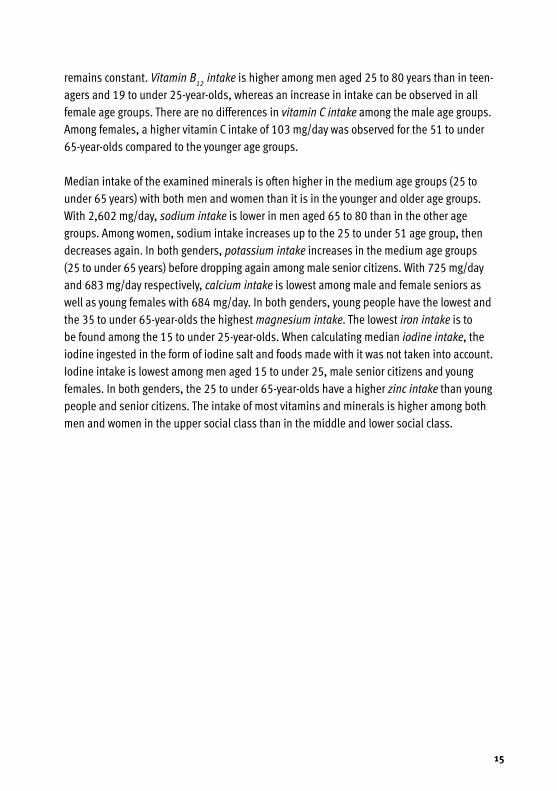
intake is higher among men aged 25 to 80 years than in teen-agers and 19 to under 25-year-olds, whereas an increase in intake can be observed in all female age groups. There are no differences in vitamin C intake among the male age groups. Among females, a higher vitamin C intake of 103 mg/day was observed for the 51 to under 65-year-olds compared to the younger age groups.
Median intake of the examined minerals is often higher in the medium age groups (25 to under 65 years) with both men and women than it is in the younger and older age groups. With 2,602 mg/day, sodium intake is lower in men aged 65 to 80 than in the other age groups. Among women, sodium intake increases up to the 25 to under 51 age group, then decreases again. In both genders, potassium intake increases in the medium age groups (25 to under 65 years) before dropping again among male senior citizens. With 725 mg/day and 683 mg/day respectively, calcium intake is lowest among male and female seniors as well as young females with 684 mg/day. In both genders, young people have the lowest and the 35 to under 65-year-olds the highest magnesium intake. The lowest iron intake is to be found among the 15 to under 25-year-olds. When calculating median iodine intake, the iodine ingested in the form of iodine salt and foods made with it was not taken into account. Iodine intake is lowest among men aged 15 to under 25, male senior citizens and young females. In both genders, the 25 to under 65-year-olds have a higher zinc intake than young people and senior citizens. The intake of most vitamins and minerals is higher among both men and women in the upper social class than in the middle and lower social class.

16
Tabl
e1a
:Med
ian
inta
ke o
f ene
rgy,
ene
rgy-
supp
lyin
g nu
trie
nts,
cho
lest
erol
, die
tary
fibr
es a
nd p
urin
es1 a
ccor
ding
to g
ende
r and
age
(NVS
II) –
men
Age
ofp
erso
nsEn
ergy
and
nu
trie
nts
Unit
15to
und
er
19y
ears
(n
=5
06)
19to
und
er
25y
ears
(n
=4
69)
25to
und
er
35y
ears
(n
=6
14)
35to
und
er
51y
ears
(n
=1
946
)
51to
und
er
65y
ears
(n
=1
460
)
65to
und
er
80y
ears
(n
=1
165
)
Aver
age
(n
=6
160
)M
edia
nCI
-med
ian2
Med
ian
CI-m
edia
nM
edia
nCI
-med
ian
Med
ian
CI-m
edia
nM
edia
nCI
-med
ian
Med
ian
CI-m
edia
nM
edia
nCI
-med
ian
Ener
gyM
J9,
28,
9/9,
59,
59,
3/9,
99,
59,
3/9,
79,
99,
7/10
,09,
39,
2/9,
58,
98,
7/9,
09,
49,
4/9,
5En
ergy
kcal
2 20
72
124/
2 26
12
280
2 22
2/2
360
2 27
22
225/
2 31
52
366
2 32
5/2
396
2 22
72
188/
2 26
92
121
2 07
8/2
158
2 25
22
234/
2 26
9Pr
otei
ng
7573
/77
8380
/85
8280
/84
8483
/85
8179
/82
7675
/78
8180
/82
Fat
g80
76/8
486
82/9
088
87/8
992
90/9
486
85/8
881
79/8
387
86/8
7Sa
tura
ted
fatty
aci
dsg
3635
/39
3938
/41
3937
/40
4140
/41
3837
/39
3635
/37
3938
/39
Mon
ouns
atur
ated
fa
tty a
cids
g27
25/2
828
28/3
029
29/3
031
30/3
130
29/3
027
27/2
829
29/3
0
Poly
unsa
tura
ted
fa
tty a
cids
g11
10/1
112
11/1
212
12/1
312
12/1
312
11/1
211
11/1
112
12/1
2
Lino
leic
aci
dg
8,9
8,5/
9,3
9,8
9,5/
10,1
10,0
9,8/
10,4
10,1
9,9/
10,4
9,4
9,1/
9,6
9,0
8,7/
9,1
9,6
9,5/
9,7
α-lin
olen
ic a
cid
g1,
11,
1/1,
21,
21,
2/1,
21,
21,
2/1,
31,
31,
3/1,
41,
31,
3/1,
41,
31,
3/1,
31,
31,
3/1,
3Ar
achi
doni
c aci
d m
g15
915
3/16
616
716
1/17
618
418
0/18
918
618
1/19
018
818
3/19
218
017
5/18
318
117
9/18
3Ei
cosa
pent
aeno
ic ac
idm
g58
57/6
065
64/6
873
71/7
580
78/8
187
84/8
978
76/8
276
76/7
7Do
cosa
hexa
enoi
c acid
mg
9994
/103
107
103/
111
119
117/
125
130
127/
133
135
130/
140
134
129/
140
125
123/
126
Chol
este
rol
mg
266
255/
280
297
284/
308
308
302/
313
314
309/
318
307
301/
314
294
286/
301
304
301/
307
Carb
ohyd
rate
sg
269
257/
282
260
256/
265
259
250/
264
258
253/
261
236
231/
240
230
226/
234
248
245/
250
Mon
osac
char
ides
g46
42/5
144
43/4
742
40/4
442
41/4
439
38/4
039
38/4
141
40/4
2Di
sacc
harid
esg
7570
/80
7266
/77
7268
/75
7069
/72
6159
/63
5857
/60
6665
/67
Poly
sacc
harid
esg
122
115/
128
121
119/
125
122
118/
124
122
120/
123
113
111/
115
112
110/
115
118
117/
119
Diet
ary
fibre
g17
16/1
817
16/1
718
17/1
819
19/2
020
20/2
121
21/2
219
19/2
0w
ater
-sol
uble
g6
5/6
65/
66
6/6
66/
67
6/7
77/
76
6/6
wat
er-in
solu
ble
g11
11/1
211
10/1
112
11/1
213
13/1
313
13/1
314
14/1
413
13/1
3Al
coho
lg
43/
45
4/5
76/
811
10/1
215
14/1
612
12/1
410
9/11
Purin
e ni
trog
enm
g13
713
4/14
315
414
6/15
915
515
2/15
815
815
6/16
016
015
7/16
314
814
4/15
115
515
3/15
6
1 Es
timat
ion
base
d on
two
24-h
our r
ecal
ls u
sing
the
Mul
tiple
Sou
rce
Met
hod
(MSM
)2 CI
-med
ian:
Con
fiden
ce in
terv
al o
f the
med
ian
17
Tabl
e1b
:Med
ian
inta
ke o
f ene
rgy,
ene
rgy-
supp
lyin
g nu
trie
nts,
cho
lest
erol
, die
tary
fibr
es a
nd p
urin
es1 a
ccor
ding
to g
ende
r and
age
(NVS
II) –
wom
en
Age
ofp
erso
nsEn
ergy
and
nu
trie
nts
Unit
15to
und
er
19y
ears
(n
=5
36)
19to
und
er
25y
ears
(n
=4
86)
25to
und
er
35y
ears
(n
=8
52)
35to
und
er
51y
ears
(n
=2
684
)
51to
und
er
65y
ears
(n
=1
740
)
65to
und
er
80y
ears
(n
=1
331
)
Aver
age
(n
=7
593
)M
edia
nCI
-med
ian2
Med
ian
CI-m
edia
nM
edia
nCI
-med
ian
Med
ian
CI-m
edia
nM
edia
nCI
-med
ian
Med
ian
CI-m
edia
nM
edia
nCI
-med
ian
Ener
gyM
J6,
56,
3/6,
87,
06,
9/7,
27,
37,
2/7,
47,
37,
2/7,
47,
06,
9/7,
16,
86,
7/6,
97,
17,
0/7,
1En
ergy
kcal
1 55
61
500/
1 61
81
678
1 64
4/1
708
1 74
21
714/
1 77
21
733
1 71
2/1
758
1 65
91
636/
1 68
41
630
1 61
0/1
653
1 68
31
672/
1 69
5Pr
otei
ng
5351
/55
5655
/57
6059
/61
6261
/63
6159
/62
5858
/60
6059
/60
Fat
g55
54/5
859
56/6
463
61/6
565
64/6
761
60/6
360
59/6
162
61/6
3Sa
tura
ted
fatty
aci
dsg
2624
/27
2726
/28
2828
/29
2929
/30
2726
/28
2726
/28
2827
/28
Mon
ouns
atur
ated
fa
tty a
cids
g18
18/2
020
19/2
021
20/2
121
21/2
220
20/2
120
20/2
021
20/2
1
Poly
unsa
tura
ted
fatty
aci
dsg
88/
89
8/9
99/
99
9/9
99/
99
8/9
99/
9
Lino
leic
aci
dg
6,8
6,4/
7,1
7,3
7,0/
7,6
7,4
7,2/
7,7
7,6
7,5/
7,8
7,2
6,9/
7,4
7,0
6,8/
7,1
7,3
7,2/
7,4
α-lin
olen
ic a
cid
g0,
80,
8/0,
80,
90,
8/0,
90,
90,
9/0,
91,
01,
0/1,
01,
01,
0/1,
01,
01,
0/1,
01,
00,
9/1,
0Ar
achi
doni
c aci
d m
g11
310
8/11
811
611
2/11
912
412
0/12
813
112
9/13
413
012
7/13
413
513
2/13
712
812
7/13
0Ei
cosa
pent
aeno
ic ac
idm
g36
35/3
841
40/4
248
48/5
057
56/5
865
64/6
769
67/7
058
57/5
9Do
cosa
hexa
enoi
c acid
mg
8176
/85
8783
/90
100
97/1
0310
810
6/11
011
911
6/12
211
911
5/12
310
710
5/10
8Ch
oles
tero
lm
g19
218
1/20
120
419
8/21
422
421
8/23
123
523
0/24
023
122
6/23
723
022
6/23
422
622
4/22
8Ca
rboh
ydra
tes
g20
519
7/21
421
420
8/21
821
621
1/22
020
520
2/20
819
519
2/19
919
819
4/20
020
320
1/20
5M
onos
acch
arid
esg
3835
/41
4139
/44
4038
/42
3838
/40
4039
/42
4140
/42
4039
/40
Disa
ccha
rides
g60
56/6
265
62/6
965
63/6
762
61/6
456
55/5
856
55/5
760
59/6
1Po
lysa
ccha
rides
g92
88/9
691
87/9
494
92/9
693
92/9
489
87/9
088
87/9
091
90/9
2Di
etar
y fib
reg
1414
/15
1514
/15
1716
/17
1717
/18
1918
/19
1919
/20
1817
/18
wat
er-s
olub
leg
54/
55
5/5
55/
55
5/6
66/
66
6/6
66/
6w
ater
-inso
lubl
eg
99/
1010
9/10
1111
/11
1111
/12
1212
/13
1313
/13
1211
/12
Alco
hol
g2
2/2
22/
33
3/3
44/
44
4/5
43/
43
3/4
Purin
e ni
trog
enm
g97
93/1
0010
197
/103
108
107/
111
111
109/
112
113
112/
114
110
108/
111
109
108/
110
1 Es
timat
ion
base
d on
two
24-h
our r
ecal
ls u
sing
the
Mul
tiple
Sou
rce
Met
hod
(MSM
)2 CI
-med
ian:
Con
fiden
ce in
terv
al o
f the
med
ian
18
1.2.3 Evaluation
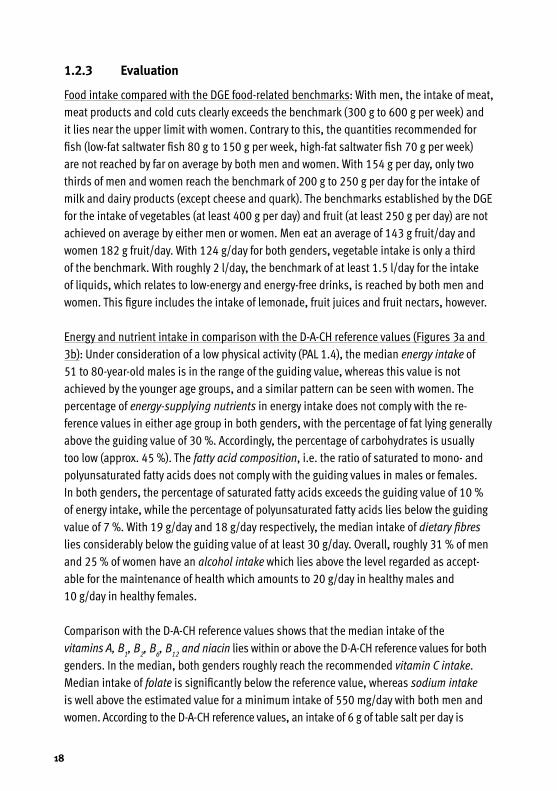
Food intake compared with the DGE food-related benchmarks: With men, the intake of meat, meat products and cold cuts clearly exceeds the benchmark (300 g to 600 g per week) and it lies near the upper limit with women. Contrary to this, the quantities recommended for fish (low-fat saltwater fish 80 g to 150 g per week, high-fat saltwater fish 70 g per week) are not reached by far on average by both men and women. With 154 g per day, only two thirds of men and women reach the benchmark of 200 g to 250 g per day for the intake of milk and dairy products (except cheese and quark). The benchmarks established by the DGE for the intake of vegetables (at least 400 g per day) and fruit (at least 250 g per day) are not achieved on average by either men or women. Men eat an average of 143 g fruit/day and women 182 g fruit/day. With 124 g/day for both genders, vegetable intake is only a third of the benchmark. With roughly 2 l/day, the benchmark of at least 1.5 l/day for the intake of liquids, which relates to low-energy and energy-free drinks, is reached by both men and women. This figure includes the intake of lemonade, fruit juices and fruit nectars, however.
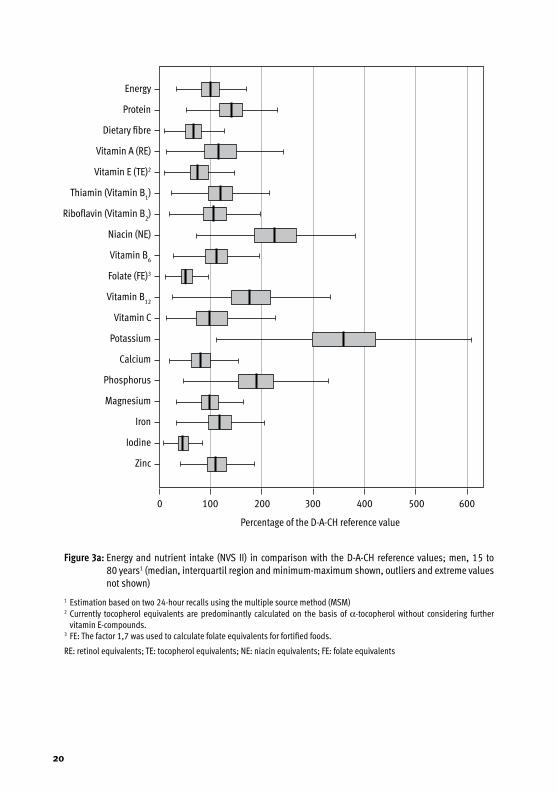
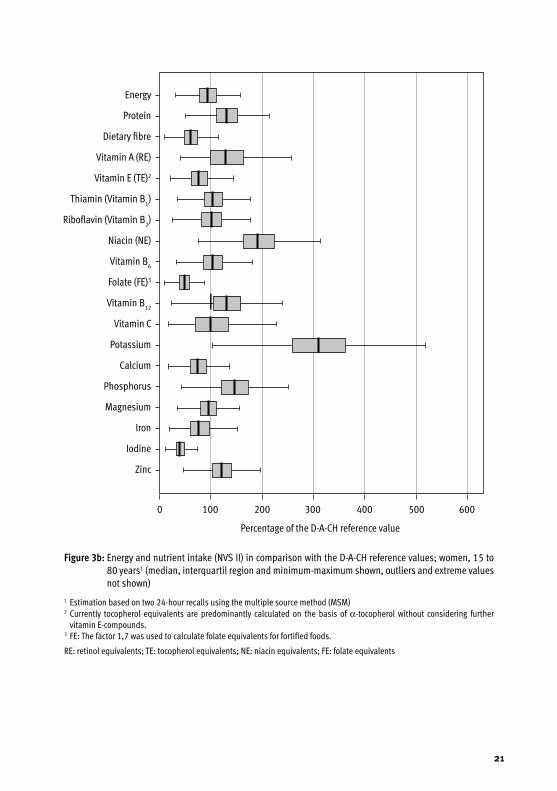
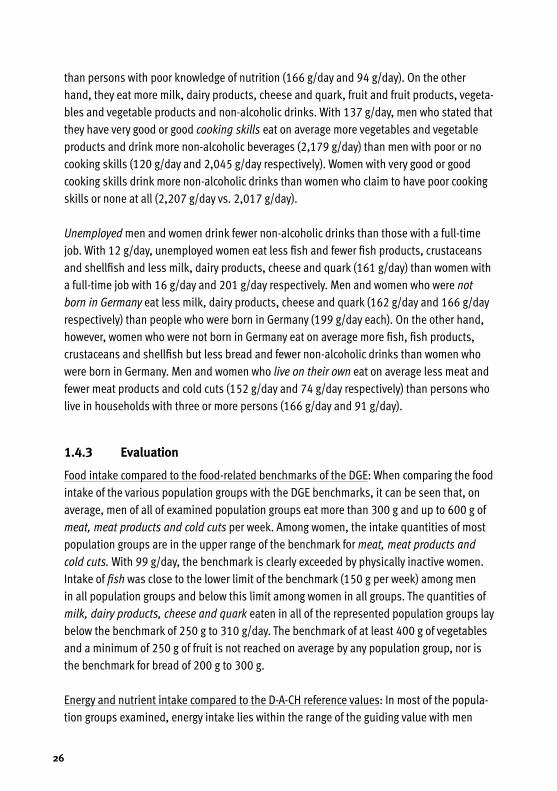
Energy and nutrient intake in comparison with the D-A-CH reference values (Figures 3a and 3b): Under consideration of a low physical activity (PAL 1.4), the median energy intake of 51 to 80-year-old males is in the range of the guiding value, whereas this value is not achieved by the younger age groups, and a similar pattern can be seen with women. The percentage of energy-supplying nutrients in energy intake does not comply with the re-ference values in either age group in both genders, with the percentage of fat lying generally above the guiding value of 30 %. Accordingly, the percentage of carbohydrates is usually too low (approx. 45 %). The fatty acid composition, i.e. the ratio of saturated to mono- and polyunsaturated fatty acids does not comply with the guiding values in males or females. In both genders, the percentage of saturated fatty acids exceeds the guiding value of 10 % of energy intake, while the percentage of polyunsaturated fatty acids lies below the guiding value of 7 %. With 19 g/day and 18 g/day respectively, the median intake of dietary fibres lies considerably below the guiding value of at least 30 g/day. Overall, roughly 31 % of men and 25 % of women have an alcohol intake which lies above the level regarded as accept- able for the maintenance of health which amounts to 20 g/day in healthy males and 10 g/day in healthy females.
Comparison with the D-A-CH reference values shows that the median intake of the vitamins A, B
1, B
2, B
6, B
12 and niacin lies within or above the D-A-CH reference values for both
genders. In the median, both genders roughly reach the recommended vitamin C intake. Median intake of folate is significantly below the reference value, whereas sodium intake is well above the estimated value for a minimum intake of 550 mg/day with both men and women. According to the D-A-CH reference values, an intake of 6 g of table salt per day is
19
regarded as sufficient. This equates to a sodium intake of 2,400 mg. Sodium intake in women is 1,932 mg/day (equivalent to 4.9 g/day of table salt) and 2,766 mg/day in men (equivalent to 7.0 g/day of table salt). Neither gender reaches the reference value for calcium (men: 807 mg/day, women 738 mg/day), with young people and senior citizens in particular falling well short. While men reach the recommended intake of iron with 11.8 mg/day, women do not with 9.6 mg/day. Females aged 15 to under 19 and 19 to under 25 in particular achieve slightly more than half of the recommended intake with a median intake of 8.2 and 8.6 mg/day respectively.
20
Figure3a:Energy and nutrient intake (NVS II) in comparison with the D-A-CH reference values; men, 15 to 80 years1 (median, interquartil region and minimum-maximum shown, outliers and extreme values not shown)
1 Estimation based on two 24-hour recalls using the multiple source method (MSM)2 Currently tocopherol equivalents are predominantly calculated on the basis of α-tocopherol without considering further
vitamin E-compounds.3 FE: The factor 1,7 was used to calculate folate equivalents for fortified foods.
RE: retinol equivalents; TE: tocopherol equivalents; NE: niacin equivalents; FE: folate equivalents
Energy
Protein
Dietary fibre
Vitamin A (RE)
Vitamin E (TE)2
Thiamin (Vitamin B1)
Riboflavin (Vitamin B2)
Niacin (NE)
Vitamin B6
Folate (FE)3
Vitamin B12
Vitamin C
Potassium
Calcium
Phosphorus
Magnesium
Iron
Iodine
Zinc
0 100 200 300 400 500 600
Percentage of the D-A-CH reference value
21
Energy
Protein
Dietary fibre
Vitamin A (RE)
Vitamin E (TE)2
Thiamin (Vitamin B1)
Riboflavin (Vitamin B2)
Niacin (NE)
Vitamin B6
Folate (FE)3
Vitamin B12
Vitamin C
Potassium
Calcium
Phosphorus
Magnesium
Iron
Iodine
Zinc
Figure3b:Energy and nutrient intake (NVS II) in comparison with the D-A-CH reference values; women, 15 to 80 years1 (median, interquartil region and minimum-maximum shown, outliers and extreme values not shown)
1 Estimation based on two 24-hour recalls using the multiple source method (MSM)2 Currently tocopherol equivalents are predominantly calculated on the basis of α-tocopherol without considering further
vitamin E-compounds.3 FE: The factor 1,7 was used to calculate folate equivalents for fortified foods.
RE: retinol equivalents; TE: tocopherol equivalents; NE: niacin equivalents; FE: folate equivalents
0 100 200 300 400 500 600
Percentage of the D-A-CH reference value
22
1.3 Nutrient intake via supplements – results of the National Nutrition Survey II
1.3.1 Methodology
Within the National Nutrition Survey II (NVS II), a total of 19,329 men and women aged between 14 and 80 years were interviewed throughout Germany between November 2005 and January 2007. With the help of a personal, computer-supported initial interview (CAPI), data was collected on socio-demographic characteristics, eating habits and state of health. In addition to this, the participants completed a supplementary questionnaire on their shopping behaviour, their health aspects and their leisure time, work and sleeping habits. Anthropometric measurements (body weight, body height, waist and hip circumference) were taken among the participants.
Three dietary assessment methods (diet history interviews, 24-hour recalls, weighed di -etary records) were used to record food intake. The 24-hour recalls within the NVS II were conducted on two non-consecutive days with a time interval of one to six weeks (average 16 days). The programme EPIC-SOFT, which was developed within the scope of the study “European Prospective Investigation into Cancer and Nutrition” (EPIC) by the International Agency for Research on Cancer (IARC) in Lyon was adapted and then used for the NVS II. For a total of 13,926 survey participants aged between 14 and 80 years, two 24-hour recalls are available.
In the course of the two 24-hour recalls in the NVS II, it was recorded whether the participants had taken any supplements on the day of the survey and if yes, which ones. During the survey, no difference was made between food supplements and medicines containing nutrients, some of which are only available in pharmacies or on prescription. Accordingly, supplements are understood below to be all nutritional supplements and medical products containing nutrients (e.g. analgesics with vitamin C).
Persons who stated that they had used a supplement in at least one of the two 24-hour recalls are described as supplement takers. As relatively high quantities of vitamins are also ingested via multivitamin drinks, the group of multivitamin drink consumers is shown separately. This group comprises persons who drink multivitamin juices, multivitamin fruit nectars and/or multivitamin juices mixed with mineral water.
The intake of nutrients via supplements was calculated with the help of a database main-tained at the Federal Research Institute of Nutrition and Food (MRI). It comprises around 2,700 supplements, most of whose nutrient data is from the years 2006 and 2007.
23
The intake of nutrients through foods is calculated with BLS 3.02. The intake quantities from the intake of food – including the recorded enrichment with vitamins and/or miner-als – and from supplements are added together to calculate total nutrient intake. Nutrient intake is assessed on the basis of the D-A-CH reference values.
Whether or not the frequency distributions regarding the use of supplements and/or the intake of multivitamin drinks differ between men and women and between the different age groups and social classes was checked using the chi-square test. Comparisons regarding the nutrient intake of supplement takers and non-supplement takers are made on the basis of the confidence intervals of the median (CI-Median). Differences between the groups are regarded as significant if the confidence intervals do not intersect. The data basis is the collective of the NVS II participants aged 15 to 80 years (total: 13,753; men: 6,160; women: 7,593). Data was weighted on the basis of the microcensus conducted in 2006 for the characteristics gender, age, federal state, secondary school qualifications, profession and household size.
1.3.2 Results
24.3 % of the participants took supplements on at least one of the two days of the survey and 5.2 % had a multivitamin drink. A higher percentage of women than men takes supple-ments (29.6 vs. 19.0 %; p < 0.001), uses multivitamin drinks (5.6 vs. 4.8 %; p < 0.50) and both combined (1.7 vs. 1.1 %; p < 0.001). The lowest percentage of supplement takers is to be found among males aged 19 to under 25 (11.7 %) and females aged 15 to under 19 (10.3 %). Where social class is concerned, differences can be seen with men regarding the intake of supplements (p < 0.001) and multivitamin drinks (p < 0.05). In the upper social class, the percentage of men who use supplements and/or use multivitamin drinks is higher than it is in the lower and middle social classes. The main supplement consists of a combination of vitamins and minerals. A further 0.7 % (38 men, 56 women) use “other supplements” which include coenzyme Q10, as well as fish oil and omega-3 fatty acid cap-sules. Where vitamin D and folate are concerned, the highest percentage of supplement tak-ers is to be found among 65 to 80-year-old men (vitamin D 5 %; folic acid 9 %) and women (vitamin D and folic acid 12 % respectively). Only around 8 % of women aged 19 to under 45 years take supplements containing folic acid. With 3 %, the percentage of young females (15 to under 19) who supplement folic acid is considerably lower.
24
1.3.3 Evaluation
Total nutrient intake compared to the D-A-CH reference values: Overall in the median, supple-ment takers reach or exceed the corresponding D-A-CH reference value for almost all nutrients ingested via foods and supplements. In relation to each D-A-CH value, nutrient intake from foods and supplements amounts in the median to between 103 % (men) and 105 % (women) for calcium and 377 % (men) and 337 % (women) for potassium, with potassium being ingested mainly through food. With vitamins B
1, B
2 and B
6, as well as vitamin C, overall intake
via supplements and foods is roughly double the D-A-CH reference value in the median, and three times the value with niacin. For folate, the intake via food lies below the D-A-CH reference value. A total nutrient intake that lies above the D-A-CH reference value results for both men and women when the quantities of folic acid ingested via supplements are taken into account. Where the intake of calcium via food in men and women, and iron in women, is concerned – both of which are below the recommended level – total nutrient intake is in-creased by means of supplements so that the D-A-CH reference values are reached (calcium) and exceeded (iron) by both men and women. With vitamin E, the reference values are exceed-ed in the median by 60 % in men and 72 % in women when intake via food and supplements is taken into account. It should be taken into consideration here that the values calculated for vitamin E intake via food constitute a distinct underestimation of actual vitamin E intake.
1.4 Nutritional situation of various population groups – results of the National Nutrition Survey II
1.4.1 Methodology
Within the National Nutrition Survey II (NVS II), a total of 19,329 men and women aged between 14 and 80 years were interviewed throughout Germany between November 2005 and January 2007. With the help of a personal, computer-supported initial interview (CAPI), data was collected on socio-demographic characteristics, eating habits and state of health. In addition to this, the participants completed a supplementary questionnaire on their shopping behaviour, their health aspects and their leisure time, work and sleeping habits. Anthropometric measurements (body weight, body height, waist and hip circumference) were taken among the participants.
Three dietary assessment methods (diet history interviews, 24-hour recalls, weighed dietary records) were used to record food intake. The 24-hour recalls within the NVS II were conducted on two non-consecutive days with a time interval of one to six weeks (average 16 days). The programme EPIC-SOFT, which was developed within the study “European Prospective Investigation into Cancer and Nutrition” (EPIC) by the International Agency for
25
Research on Cancer (IARC) in Lyon was adapted and then used for the NVS II. The informa-tion used to categorise the NVS II participants into population groups comes from the initial interview and questionnaire. Categorisation on the basis of nutrition knowledge was done on the basis of the answers to four questions in the questionnaire which were summarised into an index via a points system: 1) Estimation of foods that are important for a “healthy diet”, 2) Correct attribution of what probiotic yoghurt is, 3) Correct attribution of what ACE drinks are, and 4) Proper knowledge of the meaning of the “5 a day” campaign. It was not established whether the participants had a migration background, but the country of birth was determined so that people who were not born in Germany could be grouped together. In general, only German-speaking persons were questioned in the survey. Nutrient intake through supplements was not taken into account among the identified population groups. This also applies to the supplement-takers.
The information provided by the NVS II participants aged 19 to 64 years was used for the various population groups (basis: 10,215 persons; 4,489 men; 5,726 women). As a completed questionnaire was only available from 6,817 persons, the size of the groups is smaller with the population groups formed on the basis of information contained in the questionnaire (e.g. physically active, knowledge of nutrition). Energy and nutrient intake was calculated on the basis of the German Nutrient Food Code and Data Base (BLS) 3.02. When determining nutrient intake, foods enriched with vitamins and minerals were also taken into account as far as they were included in BLS 3.02. It was possible to record the possible enrichment of various foods with vitamins and minerals (e.g. juices, breakfast cereals) with the help of the EPIC-SOFT programme.
1.4.2 Results
On average, physically active men and women eat less meat and fewer meat products and cold cuts but more milk, dairy products, cheese and quark, fruit and fruit products and non-alcoholic drinks than non-physically active persons. Compared to non-smokers, smokers eat more meat, meat products and cold cuts and less fruit and fruit products, vegetables and vegetable products and bread. In addition to this, female smokers drink more non-alcoholic drinks than female non-smokers. Men and women who take supplements eat on average less meat, meat products and cold cuts and more fruit and fruit products and more non- alcoholic drinks than people who do not use any supplements. Women who take supplements also eat more milk, dairy products, cheese and quark (213 g/day) and vegetables and vegetable products (138 g/day) than women who do not take any supplements (189 g/day and 128 g/day respectively). On the one hand, men and women with good knowledge of nutrition eat on average fewer meat, meat products and cold cuts (146 g/day and 83 g/day)
26
than persons with poor knowledge of nutrition (166 g/day and 94 g/day). On the other hand, they eat more milk, dairy products, cheese and quark, fruit and fruit products, vegeta-bles and vegetable products and non-alcoholic drinks. With 137 g/day, men who stated that they have very good or good cooking skills eat on average more vegetables and vegetable products and drink more non-alcoholic beverages (2,179 g/day) than men with poor or no cooking skills (120 g/day and 2,045 g/day respectively). Women with very good or good cooking skills drink more non-alcoholic drinks than women who claim to have poor cooking skills or none at all (2,207 g/day vs. 2,017 g/day).
Unemployed men and women drink fewer non-alcoholic drinks than those with a full-time job. With 12 g/day, unemployed women eat less fish and fewer fish products, crustaceans and shellfish and less milk, dairy products, cheese and quark (161 g/day) than women with a full-time job with 16 g/day and 201 g/day respectively. Men and women who were not born in Germany eat less milk, dairy products, cheese and quark (162 g/day and 166 g/day respectively) than people who were born in Germany (199 g/day each). On the other hand, however, women who were not born in Germany eat on average more fish, fish products, crustaceans and shellfish but less bread and fewer non-alcoholic drinks than women who were born in Germany. Men and women who live on their own eat on average less meat and fewer meat products and cold cuts (152 g/day and 74 g/day respectively) than persons who live in households with three or more persons (166 g/day and 91 g/day).
1.4.3 Evaluation
Food intake compared to the food-related benchmarks of the DGE: When comparing the food intake of the various population groups with the DGE benchmarks, it can be seen that, on average, men of all of examined population groups eat more than 300 g and up to 600 g of meat, meat products and cold cuts per week. Among women, the intake quantities of most population groups are in the upper range of the benchmark for meat, meat products and cold cuts. With 99 g/day, the benchmark is clearly exceeded by physically inactive women. Intake of fish was close to the lower limit of the benchmark (150 g per week) among men in all population groups and below this limit among women in all groups. The quantities of milk, dairy products, cheese and quark eaten in all of the represented population groups lay below the benchmark of 250 g to 310 g/day. The benchmark of at least 400 g of vegetables and a minimum of 250 g of fruit is not reached on average by any population group, nor is the benchmark for bread of 200 g to 300 g.
Energy and nutrient intake compared to the D-A-CH reference values: In most of the popula-tion groups examined, energy intake lies within the range of the guiding value with men
27
and slightly below it with women (PAL 1.4). The percentage of fat of energy intake is always above the guiding value of 30 % in the population groups examined here. The guiding value for the percentage of carbohydrates of energy intake of > 50 % is not reached by far by men and women in the examined population groups. Intake of folate lies clearly below the recom-
mended level in all population groups examined. The highest folate intake is to be found in men
and women with good knowledge of nutrition (234 µg/day and 199 µg/day) and physically active
women (199 µg/day). The lowest folate intake is recorded for unemployed males (194 µg/day)
and female smokers (170 µg/day). The reference value for calcium is not reached in any of the
population groups examined. Calcium intake lies clearly below the recommended level in men and
women who are unemployed (746 mg/day and 678 mg/day respectively) or not born in Germany
(758 mg/day and 695 mg/day) and with women with poor knowledge of nutrition (696 mg/day).
1.5 Iodine supply of schoolchildren in Germany – results of the DONALD Study
1.5.1 Methodology
Within the longitudinally designed DONALD Study (DOrtmund Nutritional and Anthropo-metric Longitudinally Designed Study), detailed data on nutrition, state of health, growth, development and metabolism are collected at regular intervals from healthy participants from infancy to early adulthood. From the age of 3 to 4 years, 24-hour urine samples are also taken in addition to the medical and anthropometrical tests and the annual 3-day weighed dietary records. Iodine excretion was determined as the marker for iodine intake for evaluation in the 24-hour urine samples. The quantities eaten of the most important iodine suppliers (milk and whey-based dairy products, meat and meat products, saltwater fish, eggs and egg products) were calculated from the 3-day weighed dietary records which were kept parallel to the study. The total table salt intake of the children was established on the basis of the sodium excretion in their urine. Possible continuous changes in iodine excretion between 1996 and 2009 were analysed statistically by means of longitudinal regression models.
1.5.2 Results
The measured absolute daily iodine excretions (median) permit the assumption that boys have a better iodine supply (89.2 µg/day) than girls (81.4 µg/day). If 24-hour iodine excre-tion is set in relation to individual energy intake, however, there are no differences between the genders.
28
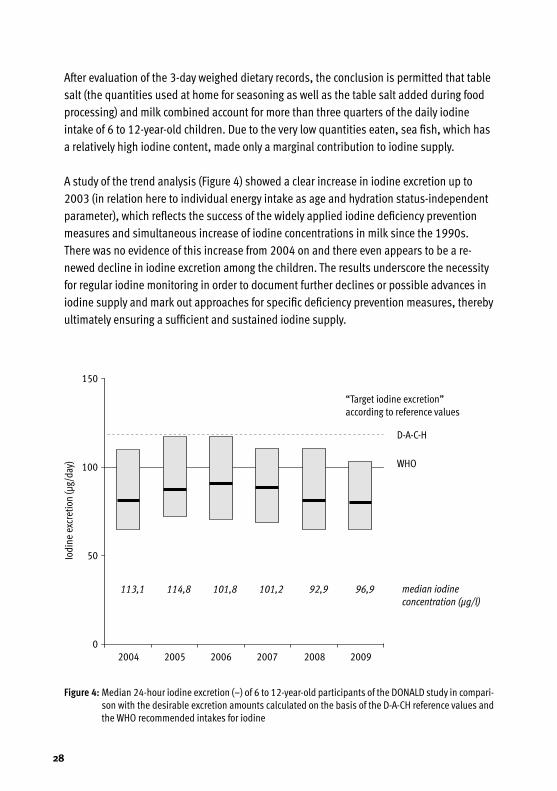
After evaluation of the 3-day weighed dietary records, the conclusion is permitted that table salt (the quantities used at home for seasoning as well as the table salt added during food processing) and milk combined account for more than three quarters of the daily iodine intake of 6 to 12-year-old children. Due to the very low quantities eaten, sea fish, which has a relatively high iodine content, made only a marginal contribution to iodine supply.
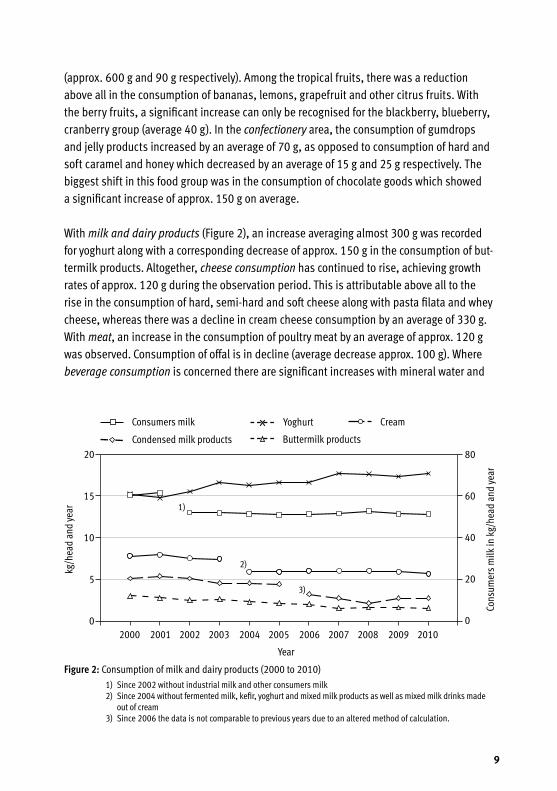
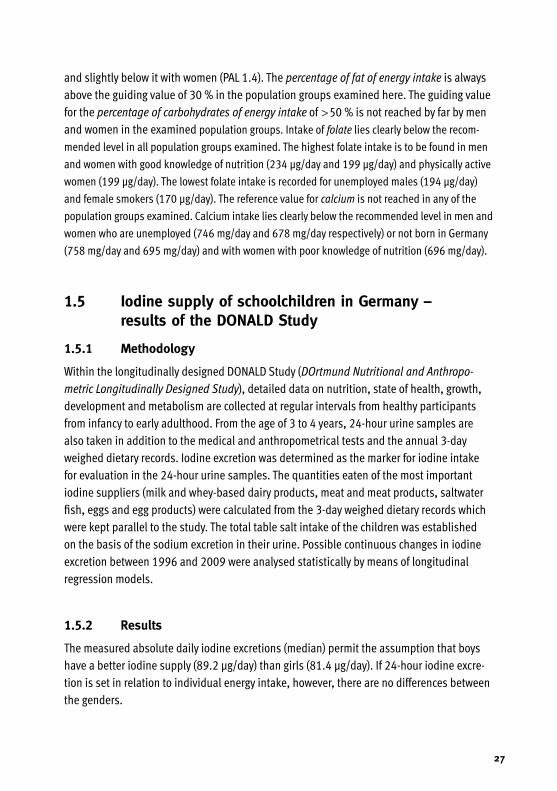
A study of the trend analysis (Figure 4) showed a clear increase in iodine excretion up to 2003 (in relation here to individual energy intake as age and hydration status-independent parameter), which reflects the success of the widely applied iodine deficiency prevention measures and simultaneous increase of iodine concentrations in milk since the 1990s. There was no evidence of this increase from 2004 on and there even appears to be a re-newed decline in iodine excretion among the children. The results underscore the necessity for regular iodine monitoring in order to document further declines or possible advances in iodine supply and mark out approaches for specific deficiency prevention measures, thereby ultimately ensuring a sufficient and sustained iodine supply.
Figure4:Median 24-hour iodine excretion (–) of 6 to 12-year-old participants of the DONALD study in compari-son with the desirable excretion amounts calculated on the basis of the D-A-CH reference values and the WHO recommended intakes for iodine
150
100
50
0
Iodi
ne e
xcre
tion
(µg/
day)
2004 2005 2006 2007 2008 2009
113,1 114,8 101,8 101,2 92,9 96,9 median iodine concentration (µg/l)
“Target iodine excretion” according to reference values
D-A-C-H
WHO
29
1.5.3 Evaluation
Under consideration of non-renal iodine losses of approx. 15 %, an appropriately desirable iodine excretion value of 119 µg/day can be derived from the D-A-CH reference values for iodine intake of 140 µg/day for 7 to under 10-year-olds. The comparative evaluation shows that well over 50 % of this group does not achieve the desirable iodine excretion and therefore also does not achieve the recommended iodine intake (median iodine excretion lies clearly below the target values). It must be taken into account here, however, that the reference values (D-A-CH as well as WHO) contain allowances in order to guarantee an iodine intake that meets requirements in almost all of the population groups. The fact that the majority of the study participants do not reach this recommended intake therefore should not be regarded as an iodine deficiency, but it nevertheless indicates an unsatisfactory situation.
1.6 Prevalence and development of overweight in Germany
1.6.1 Methodology
To evaluate the prevalence and development of overweight in Germany, the large national samples of the microcensuses of 1999, 2003, 2005 and 2009 were used along with data from the “German Health Interview and Examination Survey for Adults” (DEGS).
The microcensus is conducted by the Federal Statistical Office in a random sample of 1 % of German households with the inclusion of all household members. On top of the annually conducted basic programme, additional surveys are conducted on health-related issues and other matters. Within representative sub-samples, randomly selected adult household members were questioned about their body weight and height. The body mass index (BMI) and distribution of overweight (pre-obesity and obesity) were then calculated from the infor-mation provided by these voluntary participants.
Within the health monitoring, the Robert Koch Institute (RKI) conducts national health surveys on a regular basis. The first wave of the nationwide “German Health Interview and Examination Survey for Adults” (DEGS) was conducted in the years 2008 to 2011. In the course of this study, a random sample of the residential population of Germany aged 18 and over was questioned in detail about health-relevant topics and subjected to a medical examination. In this way, standardised measured values on body height and weight are available for a total of 7,116 adults aged 18 to 79 years. These values were also measured in the National Health Study 1998 (BGS98) in a standardised form, thus allowing a direct comparison of the two studies.
30
1.6.2 Results
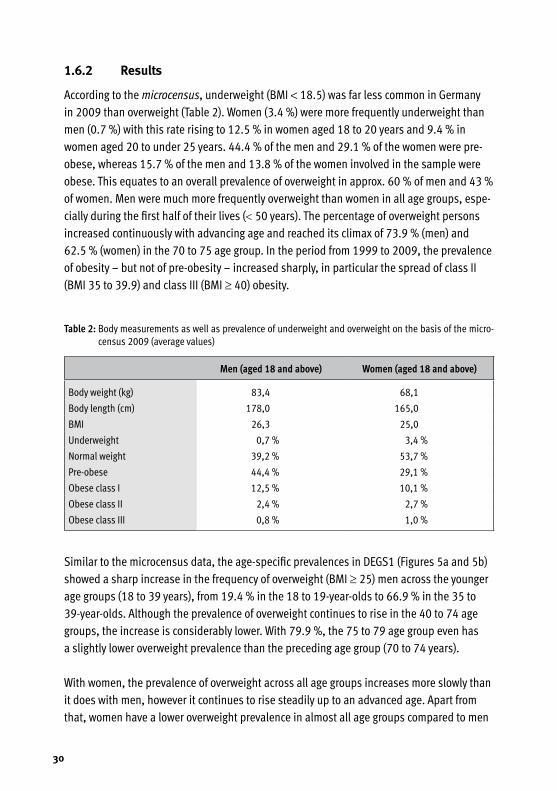
According to the microcensus, underweight (BMI < 18.5) was far less common in Germany in 2009 than overweight (Table 2). Women (3.4 %) were more frequently underweight than men (0.7 %) with this rate rising to 12.5 % in women aged 18 to 20 years and 9.4 % in women aged 20 to under 25 years. 44.4 % of the men and 29.1 % of the women were pre-obese, whereas 15.7 % of the men and 13.8 % of the women involved in the sample were obese. This equates to an overall prevalence of overweight in approx. 60 % of men and 43 % of women. Men were much more frequently overweight than women in all age groups, espe-cially during the first half of their lives (< 50 years). The percentage of overweight persons increased continuously with advancing age and reached its climax of 73.9 % (men) and 62.5 % (women) in the 70 to 75 age group. In the period from 1999 to 2009, the prevalence of obesity – but not of pre-obesity – increased sharply, in particular the spread of class II (BMI 35 to 39.9) and class III (BMI ≥ 40) obesity.
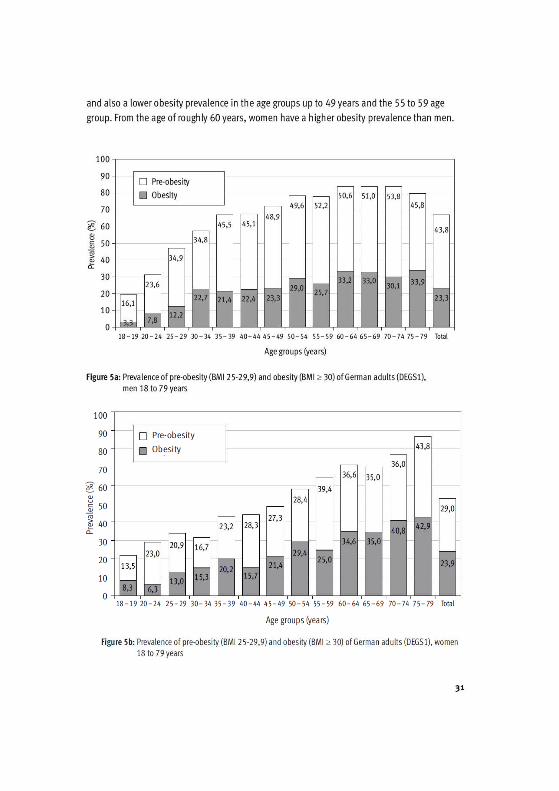
Similar to the microcensus data, the age-specific prevalences in DEGS1 (Figures 5a and 5b) showed a sharp increase in the frequency of overweight (BMI ≥ 25) men across the younger age groups (18 to 39 years), from 19.4 % in the 18 to 19-year-olds to 66.9 % in the 35 to 39-year-olds. Although the prevalence of overweight continues to rise in the 40 to 74 age groups, the increase is considerably lower. With 79.9 %, the 75 to 79 age group even has a slightly lower overweight prevalence than the preceding age group (70 to 74 years).
With women, the prevalence of overweight across all age groups increases more slowly than it does with men, however it continues to rise steadily up to an advanced age. Apart from that, women have a lower overweight prevalence in almost all age groups compared to men
Table2:Body measurements as well as prevalence of underweight and overweight on the basis of the micro-census 2009 (average values)
Men(aged18andabove) Women(aged18andabove)
Body weight (kg) 83,4 68,1
Body length (cm) 178,0 165,0
BMI 26,3 25,0
Underweight 0,7 % 3,4 %
Normal weight 39,2 % 53,7 %
Pre-obese 44,4 % 29,1 %
Obese class I 12,5 % 10,1 %
Obese class II 2,4 % 2,7 %
Obese class III 0,8 % 1,0 %
32
1.6.3 Evaluation
Overweight in Germany is very widespread among the adult population, with the prevalence increasing sharply with advancing age. Men of normal weight from the 30 to under 35 age group upward and women from the 55 to under 60 age group upward are in the minority. Interestingly, there are differences in the development of prevalences for pre-obesity and obesity in the individual age groups.
In Germany today, only a minority of adults are capable of keeping their body weight in the normal range (BMI 18.5 to 24.9) up to an advanced age. With persons who already are pre-obese, a clear trend towards the development of obesity with advancing age can be observed. Where class I obesity already exists, a tendency towards the development of class II or class III obesity with advancing age can be seen.
1.7 Nutritional precautions for emergency situations
1.7.1 Methodology
The appropriate measures to ensure the adequate supply of the population with food on a national, regional and local government level are presented on the basis of existing legal regulations, the Food Security Act (ESG) for periods of national emergency or defence dating back to 1965 and the Emergency Food Supply Act (EVG) to overcome the peacetime supply crises from 1990.
1.7.2 Results
Due to the changed geopolitical outline conditions, the likelihood of a supply crisis in Europe/Germany due to acts of war has decreased significantly. This is balanced off by an increase in the significance of occurrences which could result in a peacetime supply crisis (e.g. natural disasters, large-scale technical accidents, pandemics, epizootic diseases). The “critical” infrastructures which could possibly be affected by this include the supply of power, drinking water and food, telecommunications, the transport, traffic and finance system and the health system, i.e. medical care.
The state measures in supply shortages include regulations on the cultivation of crops and farming of animals, the treatment, processing and delivery of goods, the procurement and allocation of products, the determination of prices for products and the imposition of com-pulsory registration for companies involved in the food industry and agriculture. Material investment measures (storage) include the maintenance of a federal emergency reserve
33
(so-called Federal Grain Reserve) and a so-called civil emergency reserve (ZNR; ready-to-use foods). In the event of a crisis, these reserves are to be issued directly to consumers via community catering facilities by aid organisations such as the Federal Agency for Technical Relief (THW), German Red Cross (DRK) or German armed forces. When selecting the prod-ucts, their shelf life is of paramount importance in addition to the nutritional physiological aspects, i.e. a ratio of carbohydrates, protein and fat that is as well-balanced as possible. Cereal grains (wheat, oats and rye), rice, peas and lentils are usually stored for ten years in the warehouses of private storage space providers rented by the federal government. The quality of the goods is controlled continuously during storage. The Federal Office for Agricul-ture and Food (BLE) is responsible for the purchase, rollover (exchange of foods) and control of the national emergency reserves. The computer-supported information system “IS ENV” which has been set up in recent years is intended to enable quick communication between the various decision makers on different levels in times of crisis.
The emergency supply of food, which is only intended to last for a short time, must be sup-plemented by private food supplies. For this reason, in collaboration with the BLE and the ministries of the federal states responsible for emergency food supply, the Federal Ministry of Food, Agriculture and Consumer Protection has developed an information platform dealing with the topic of food supply (part of “IS ENV”) which can be freely accessed by all citizens (www.ernaehrungsvorsorge.de). The purpose is to make it easier for the general public to access information on food supply and how they can set up their own supply, and to provide information on the tasks, responsibilities and government activities in this area. The inter-net portal is part of “IS ENV” and the goal is to achieve increased preparedness among the general public to stock up with food, thereby enhancing their ability to help themselves.
1.7.3 Evaluation
In light of the changing geopolitical and economic outline conditions, the instruments de-signed to ensure food supply in times of crisis have to be reviewed regularly. Such a review is currently being performed with a view towards optimising food reserves on a national government level (best possible supply of the general public) and laying the legal founda-tions for the requirements and demands of efficient crisis management under the current economic and political outline conditions.
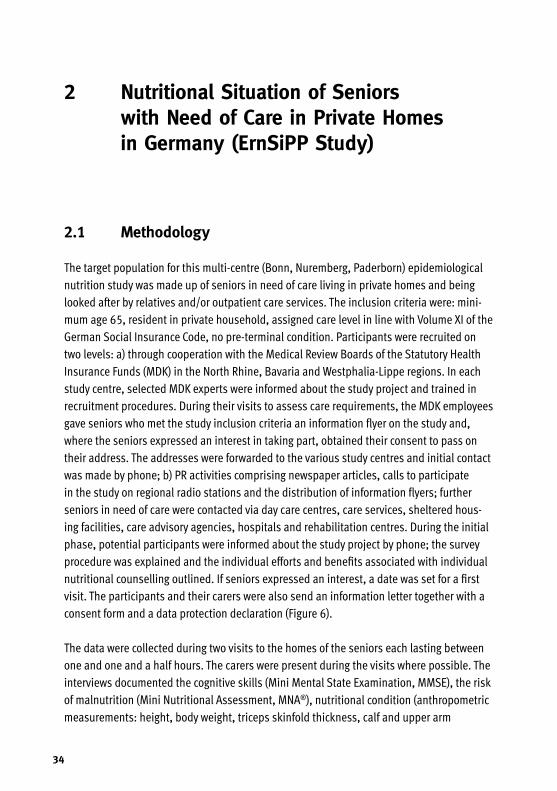
34
2 Nutritional Situation of Seniors with Need of Care in Private Homes in Germany (ErnSiPP Study)
2.1 Methodology
The target population for this multi-centre (Bonn, Nuremberg, Paderborn) epidemiological nutrition study was made up of seniors in need of care living in private homes and being looked after by relatives and/or outpatient care services. The inclusion criteria were: mini-mum age 65, resident in private household, assigned care level in line with Volume XI of the German Social Insurance Code, no pre-terminal condition. Participants were recruited on two levels: a) through cooperation with the Medical Review Boards of the Statutory Health Insurance Funds (MDK) in the North Rhine, Bavaria and Westphalia-Lippe regions. In each study centre, selected MDK experts were informed about the study project and trained in recruitment procedures. During their visits to assess care requirements, the MDK employees gave seniors who met the study inclusion criteria an information flyer on the study and, where the seniors expressed an interest in taking part, obtained their consent to pass on their address. The addresses were forwarded to the various study centres and initial contact was made by phone; b) PR activities comprising newspaper articles, calls to participate in the study on regional radio stations and the distribution of information flyers; further seniors in need of care were contacted via day care centres, care services, sheltered hous-ing facilities, care advisory agencies, hospitals and rehabilitation centres. During the initial phase, potential participants were informed about the study project by phone; the survey procedure was explained and the individual efforts and benefits associated with individual nutritional counselling outlined. If seniors expressed an interest, a date was set for a first visit. The participants and their carers were also send an information letter together with a consent form and a data protection declaration (Figure 6).
The data were collected during two visits to the homes of the seniors each lasting between one and one and a half hours. The carers were present during the visits where possible. The interviews documented the cognitive skills (Mini Mental State Examination, MMSE), the risk of malnutrition (Mini Nutritional Assessment, MNA®), nutritional condition (anthropometric measurements: height, body weight, triceps skinfold thickness, calf and upper arm
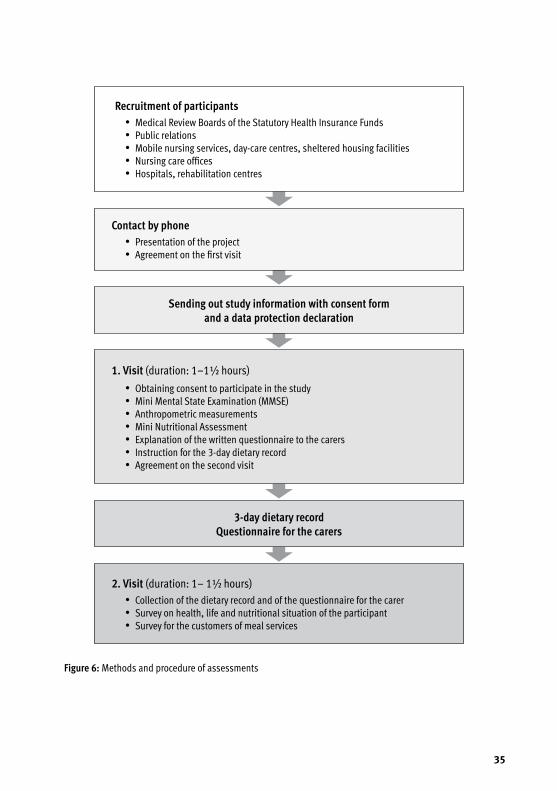
35
2.Visit (duration: 1– 1½ hours)• Collection of the dietary record and of the questionnaire for the carer• Survey on health, life and nutritional situation of the participant• Survey for the customers of meal services
Figure6:Methods and procedure of assessments
Recruitmentofparticipants• Medical Review Boards of the Statutory Health Insurance Funds• Public relations• Mobile nursing services, day-care centres, sheltered housing facilities• Nursing care offices• Hospitals, rehabilitation centres
Contactbyphone• Presentation of the project• Agreement on the first visit
Sendingoutstudyinformationwithconsentformandadataprotectiondeclaration
1.Visit(duration: 1–1½ hours)
• Obtaining consent to participate in the study• Mini Mental State Examination (MMSE)• Anthropometric measurements• Mini Nutritional Assessment• Explanation of the written questionnaire to the carers• Instruction for the 3-day dietary record• Agreement on the second visit
3-daydietaryrecordQuestionnaireforthecarers
36
circumference; questions on changes in weight), dietary habits (validated 3-day dietary record) and general health, life and nutritional situation (standardised interview, activities of daily life [ADL] according to Barthel). In the case of study participants using a “meals on wheels” service, an additional interview was conducted to record the supply structure, the meal range and the level of satisfaction with the service. The carers completed a question-naire on the scope and level of care support and housekeeping, the care workload and nutritional knowledge (Figure 6).
The data from the various study centres were merged and checked for plausibility. The SPSS 19.0 statistics programme was used for the purpose of evaluation. The dietary logs were evaluated using Version 8.0 of the EBISpro software. The dependence or independence of categorical variables was tested using the chi-square test according to Pearson. Differences in constant variables with normal distribution (verified using the Kolmogorov-Smirnov Test) were checked for significance using the T test for unpaired samples (e.g. gender, dementia) or univariate variance analysis (e.g. age groups, care levels). Constant variables without normal distribution were analysed accordingly using the Mann-Whitney U Test or the Kruskal-Wallis H Test. The significance level was defined as p < 0.05.
2.2 Results
A total of 353 persons in need of care took part in the study; 148 in Bonn, 103 in Nurem-berg and 102 in Paderborn. The study collective comprised 128 men (36.3 %) with an average age of 79.1 ± 7.8 years (minimum 65, maximum 96) and 225 women (63.7 %) with an average age of 82.0 ± 7.5 years (minimum 65, maximum 99). On average, the male participants are younger than their female counterparts (p < 0.001). 58.9 % of participants receive benefits in line with care level I, 29.7 % care level II and 11.3 % care level III under the long-term care insurance scheme based on sections 14 and 15 of Volume XI of the German Social Insurance Code. The seniors suffered from five chronic diseases in the median and, with the exception of one female participant, all had at least one chronic disease. The dominant diseases were cardiovascular diseases (hypertension, cardiac insufficiency, arrhythmia, coronary heart disease) with a prevalence of 86.1 % in the study collective, followed by joint diseases (arthritis, arthrosis) with 54.4 % and metabolic disorders (diabetes mellitus, lipidemia, hyperuricemia) with 46.7 %. While 42.8 % of participants were able to walk at least 50 metres with or without walking aid and 24.4 % could walk the same distance with the help of another person, 28.3 % were not able to walk this far. Using the Barthel Index, 60.6 % of participants were classified as in need of minor care, 19.0 % as in need of moderate care and 20.4 % as in need of high-level care.
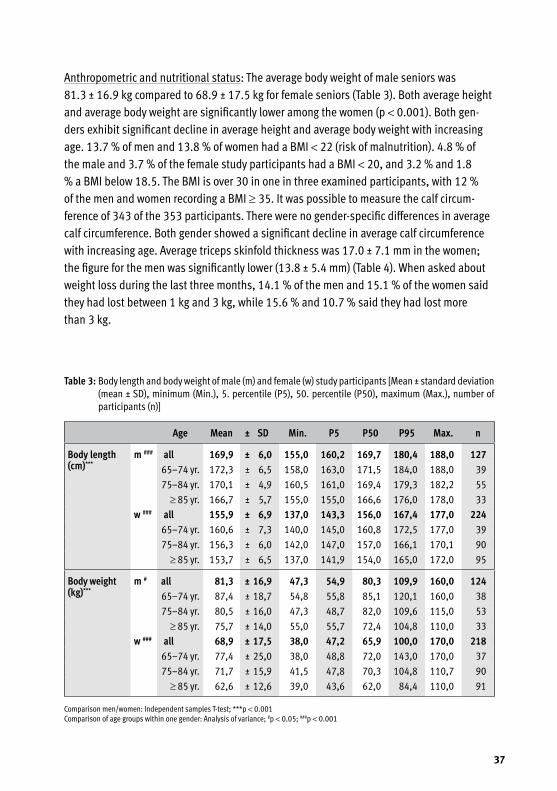
37
Anthropometric and nutritional status: The average body weight of male seniors was 81.3 ± 16.9 kg compared to 68.9 ± 17.5 kg for female seniors (Table 3). Both average height and average body weight are significantly lower among the women (p < 0.001). Both gen-ders exhibit significant decline in average height and average body weight with increasing age. 13.7 % of men and 13.8 % of women had a BMI < 22 (risk of malnutrition). 4.8 % of the male and 3.7 % of the female study participants had a BMI < 20, and 3.2 % and 1.8 % a BMI below 18.5. The BMI is over 30 in one in three examined participants, with 12 % of the men and women recording a BMI ≥ 35. It was possible to measure the calf circum-ference of 343 of the 353 participants. There were no gender-specific differences in average calf circumference. Both gender showed a significant decline in average calf circumference with increasing age. Average triceps skinfold thickness was 17.0 ± 7.1 mm in the women; the figure for the men was significantly lower (13.8 ± 5.4 mm) (Table 4). When asked about weight loss during the last three months, 14.1 % of the men and 15.1 % of the women said they had lost between 1 kg and 3 kg, while 15.6 % and 10.7 % said they had lost more than 3 kg.
Table3:Body length and body weight of male (m) and female (w) study participants [Mean ± standard deviation (mean ± SD), minimum (Min.), 5. percentile (P5), 50. percentile (P50), maximum (Max.), number of participants (n)]
Age Mean ± SD Min. P5 P50 P95 Max. n
Bodylength(cm)***
m### all 169,9 ± 6,0 155,0 160,2 169,7 180,4 188,0 12765–74 yr. 172,3 ± 6,5 158,0 163,0 171,5 184,0 188,0 39
75–84 yr. 170,1 ± 4,9 160,5 161,0 169,4 179,3 182,2 55
≥ 85 yr. 166,7 ± 5,7 155,0 155,0 166,6 176,0 178,0 33w### all 155,9 ± 6,9 137,0 143,3 156,0 167,4 177,0 224
65–74 yr. 160,6 ± 7,3 140,0 145,0 160,8 172,5 177,0 39
75–84 yr. 156,3 ± 6,0 142,0 147,0 157,0 166,1 170,1 90
≥ 85 yr. 153,7 ± 6,5 137,0 141,9 154,0 165,0 172,0 95
Bodyweight(kg)***
m# all 81,3 ± 16,9 47,3 54,9 80,3 109,9 160,0 12465–74 yr. 87,4 ± 18,7 54,8 55,8 85,1 120,1 160,0 38
75–84 yr. 80,5 ± 16,0 47,3 48,7 82,0 109,6 115,0 53
≥ 85 yr. 75,7 ± 14,0 55,0 55,7 72,4 104,8 110,0 33w### all 68,9 ± 17,5 38,0 47,2 65,9 100,0 170,0 218
65–74 yr. 77,4 ± 25,0 38,0 48,8 72,0 143,0 170,0 37
75–84 yr. 71,7 ± 15,9 41,5 47,8 70,3 104,8 110,7 90
≥ 85 yr. 62,6 ± 12,6 39,0 43,6 62,0 84,4 110,0 91
Comparison men/women: Independent samples T-test; ***p < 0.001Comparison of age groups within one gender: Analysis of variance; #p < 0.05; ###p < 0.001
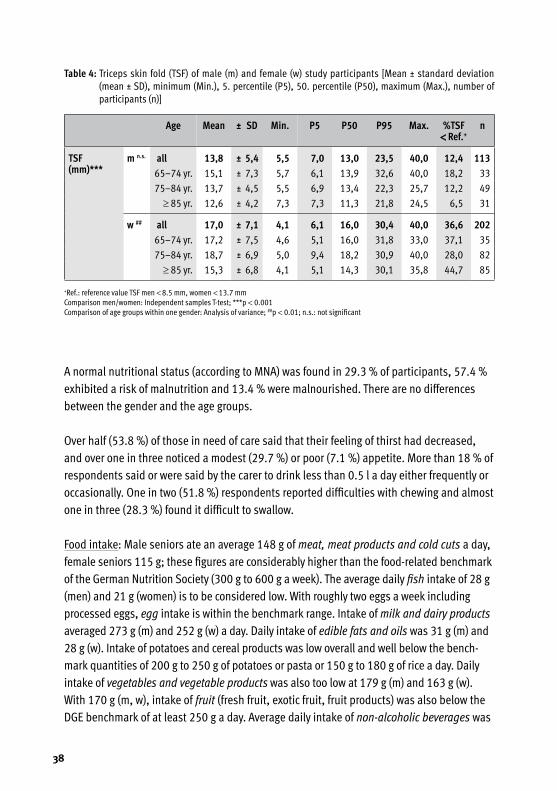
38
A normal nutritional status (according to MNA) was found in 29.3 % of participants, 57.4 % exhibited a risk of malnutrition and 13.4 % were malnourished. There are no differences between the gender and the age groups.
Over half (53.8 %) of those in need of care said that their feeling of thirst had decreased, and over one in three noticed a modest (29.7 %) or poor (7.1 %) appetite. More than 18 % of respondents said or were said by the carer to drink less than 0.5 l a day either frequently or occasionally. One in two (51.8 %) respondents reported difficulties with chewing and almost one in three (28.3 %) found it difficult to swallow.
Food intake: Male seniors ate an average 148 g of meat, meat products and cold cuts a day, female seniors 115 g; these figures are considerably higher than the food-related benchmark of the German Nutrition Society (300 g to 600 g a week). The average daily fish intake of 28 g (men) and 21 g (women) is to be considered low. With roughly two eggs a week including processed eggs, egg intake is within the benchmark range. Intake of milk and dairy products averaged 273 g (m) and 252 g (w) a day. Daily intake of edible fats and oils was 31 g (m) and 28 g (w). Intake of potatoes and cereal products was low overall and well below the bench-mark quantities of 200 g to 250 g of potatoes or pasta or 150 g to 180 g of rice a day. Daily intake of vegetables and vegetable products was also too low at 179 g (m) and 163 g (w). With 170 g (m, w), intake of fruit (fresh fruit, exotic fruit, fruit products) was also below the DGE benchmark of at least 250 g a day. Average daily intake of non-alcoholic beverages was
Table4:Triceps skin fold (TSF) of male (m) and female (w) study participants [Mean ± standard deviation (mean ± SD), minimum (Min.), 5. percentile (P5), 50. percentile (P50), maximum (Max.), number of participants (n)]
Age Mean ± SD Min. P5 P50 P95 Max. %TSF< Ref.+
n
TSF(mm)***
mn.s. all 13,8 ± 5,4 5,5 7,0 13,0 23,5 40,0 12,4 11365–74 yr. 15,1 ± 7,3 5,7 6,1 13,9 32,6 40,0 18,2 33
75–84 yr. 13,7 ± 4,5 5,5 6,9 13,4 22,3 25,7 12,2 49
≥ 85 yr. 12,6 ± 4,2 7,3 7,3 11,3 21,8 24,5 6,5 31
w## all 17,0 ± 7,1 4,1 6,1 16,0 30,4 40,0 36,6 20265–74 yr. 17,2 ± 7,5 4,6 5,1 16,0 31,8 33,0 37,1 35
75–84 yr. 18,7 ± 6,9 5,0 9,4 18,2 30,9 40,0 28,0 82
≥ 85 yr. 15,3 ± 6,8 4,1 5,1 14,3 30,1 35,8 44,7 85
+Ref.: reference value TSF men < 8.5 mm, women < 13.7 mmComparison men/women: Independent samples T-test; ***p < 0.001Comparison of age groups within one gender: Analysis of variance; ##p < 0.01; n.s.: not significant
39
1,504 g (m) and 1,489 g (w), with the lowest scores being recorded for women in the high-est age group. Overall, this figure is in line with the benchmark of 1.5 l a day.
Intake of energy, water and energy-supplying nutrients: Median daily energy intake was 2,016 kcal (8.4 MJ) for men and 1,708 kcal (7.1 MJ) for women; 63.0 % of men and 58.4 % of women did not achieve the individually calculated guiding value for daily energy intake. On average, energy intake was made up of around 38 energy percent of fat, 43 energy per-cent of carbohydrates and 16 energy percent of protein. Mean daily water intake (beverages, water in solid food) was roughly 2,397 ml for men and 2,231 ml for women, which means that both genders drank more than the guiding value of 1,990 ml for daily water intake. In the case of the majority of investigated vitamins and minerals, the median intake values were in line with the D-A-CH reference values for nutrient intake. Only in the case of vitamin D, vitamin E, folate and calcium were the median intake values of seniors of both genders below the reference values, although it is to be assumed that vitamin E intake is higher than estimated (Figures 7a and 7b).
The higher the care level, the lower the energy intake was among women (p < 0.05), re-sulting in a significantly lower intake of many of the nutrients. Comparison of type of care showed no significant differences between people cared for by family members and those receiving care from professional carers. Analysis of the energy and nutrient intake of people with and without dementia showed significantly lower intake values for water, folate, so-dium, calcium and magnesium among female seniors with dementia compared to female seniors not suffering from dementia.
2.3 Evaluation
In this study, both BMIs ≥ 30 and the risk of malnutrition were widespread among the participants. In the case of a high BMI, the primary objective must to be avoid a further increase in weight. Weight reduction is to be seen as critical in old age and should only be undertaken if medically indicated and accompanied by intensive physical activity, as a reduction in weight is always associated with a reduction in muscle mass and therefore with functional impairments. On the other hand, particular care must be taken in cases of malnutrition or malnutrition/dehydration risk to ensure ample quantities of food and drink as well as adequate intake of essential nutrients. Although the intake of most nutrients was adequate on average for the collective in this study, serious deficits in nutrient supply were also identified in some cases.
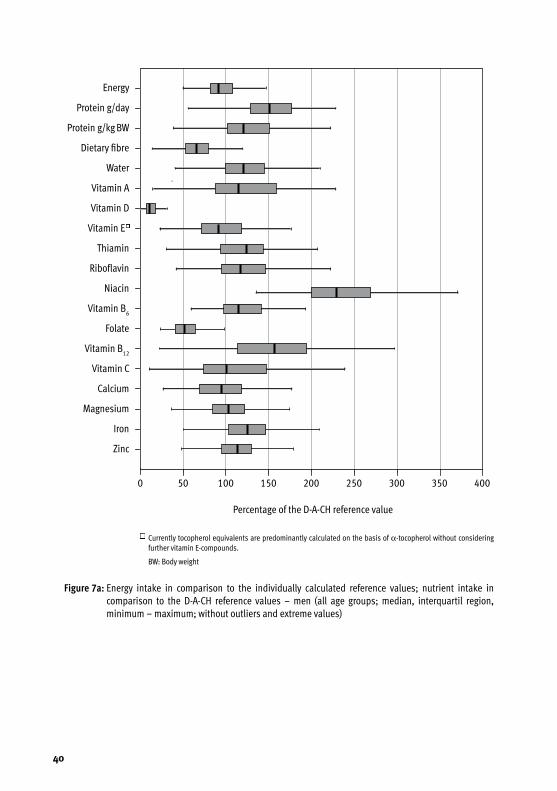
40
Figure7a:Energy intake in comparison to the individually calculated reference values; nutrient intake in comparison to the D-A-CH reference values – men (all age groups; median, interquartil region, minimum – maximum; without outliers and extreme values)
Energy
Protein g/day
Protein g/kg BW
Dietary fibre
Water
Vitamin A
Vitamin D
Vitamin E n
Thiamin
Riboflavin
Niacin
Vitamin B6
Folate
Vitamin B12
Vitamin C
Calcium
Magnesium
Iron
Zinc
0 50 100 150 200 250 300 350 400
Percentage of the D-A-CH reference value
n Currently tocopherol equivalents are predominantly calculated on the basis of α-tocopherol without considering further vitamin E-compounds.
BW: Body weight
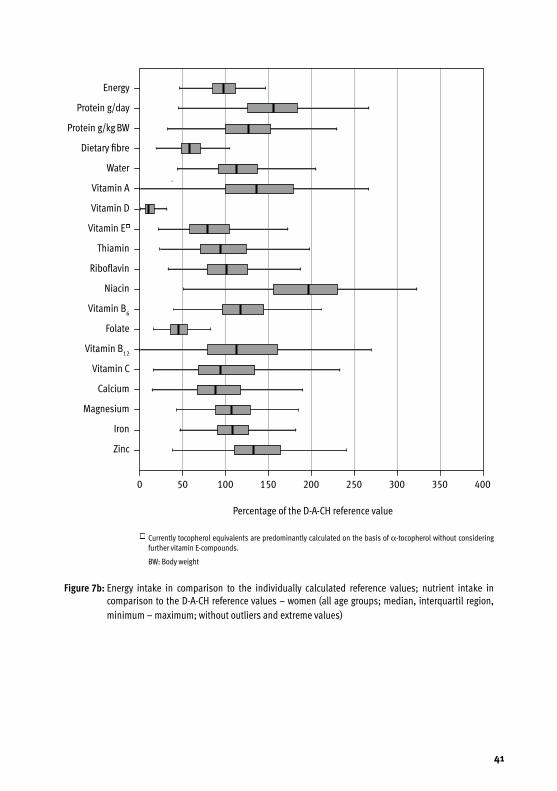
41
Figure7b:Energy intake in comparison to the individually calculated reference values; nutrient intake in comparison to the D-A-CH reference values – women (all age groups; median, interquartil region, minimum – maximum; without outliers and extreme values)
Energy
Protein g/day
Protein g/kg BW
Dietary fibre
Water
Vitamin A
Vitamin D
Vitamin E n
Thiamin
Riboflavin
Niacin
Vitamin B6
Folate
Vitamin B12
Vitamin C
Calcium
Magnesium
Iron
Zinc
0 50 100 150 200 250 300 350 400
Percentage of the D-A-CH reference value
n Currently tocopherol equivalents are predominantly calculated on the basis of α-tocopherol without considering further vitamin E-compounds.
BW: Body weight
42
Foods with a high nutrient density should be preferred in order to meet the reduced energy needs of older people while maintaining the intake of protein, vitamins and minerals. These foods contain a high proportion of essential nutrients relative to their energy volume. It would be possible to further improve the overall intake of vitamins, minerals and dietary fibre by increasing the intake of vegetables, fruit and whole grain products. This would also have a favourable impact on the nutrient ratio. In addition, nutrient losses due to in correct storage or keeping food hot for long periods should be avoided. Particular importance should be attached to the supply of vitamin D. As this vitamin is not contained in many foods and the body produces less of this vitamin as people get older, the diet must addition-ally be supplemented with vitamin D in order to achieve the reference value if the people in question do not have sufficient exposure to sunlight.
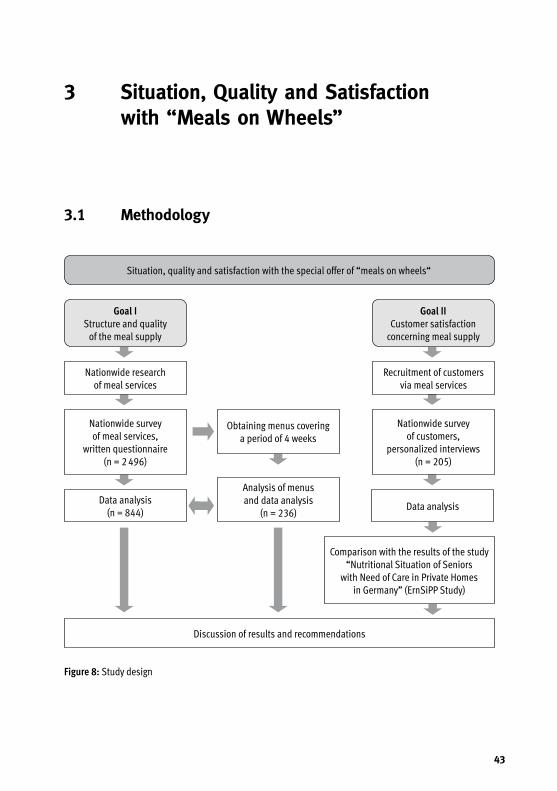
43
3 Situation, Quality and Satisfaction with “Meals on Wheels”
3.1 Methodology
Figure8:Study design
Situation, quality and satisfaction with the special offer of “meals on wheels“
Data analysis (n = 844)
Analysis of menus and data analysis
(n = 236)
Discussion of results and recommendations
GoalIStructure and quality
of the meal supply
Nationwide research of meal services
Nationwide survey of meal services,
written questionnaire (n = 2 496)
Data analysis
Nationwide survey of customers,
personalized interviews (n = 205)
Recruitment of customers via meal services
Obtaining menus covering a period of 4 weeks
Comparison with the results of the study “Nutritional Situation of Seniors
with Need of Care in Private Homes in Germany” (ErnSiPP Study)
GoalIICustomer satisfaction
concerning meal supply

44
The structure and quality of meal services and customer satisfaction with these services were determined through a full survey of providers throughout Germany. Menus supplied by the providers within the framework of the survey were analysed in order to determine the quality of meals. Customer satisfaction was measured using standardised interviews in different regions of Germany. To create a better overview, Germany’s 16 federal states were clustered into five regions based on the Nielsen areas. The designations “Region North”, “Region East”, “Region South”, “Region NRW” and “Region Centre” are used in the follow-ing. The address search for providers was based on an excerpt from the List of Municipalities of the Federal Statistical Office that filtered out all towns with at least 5,000 inhabitants. 1,628 towns were identified, and systematic search routines were then performed using specific keywords.
The search ascertained 2,496 providers, all of whom were contacted for the survey. The questionnaire was made available to the providers both in paper format and online.
In the written questionnaire, the providers were asked to supply menus covering a period of at least four weeks. Only the menus that covered this period and supplied meals seven days a week were analysed. The quality of meal planning was assessed using parameters geared towards the principles of a wholesome diet in line with the “10 dietary guidelines of the German Nutrition Society”.
In addition, food type frequency was determined in line with the “DGE Quality Standard for Meals on Wheels”. The German Nutrient Data Base, version 3.01, was used to estimate the fat content of meat products.
Customer satisfaction was measured using standardised interviews in different regions of Germany. The customers were recruited with the help of the meal services included in the survey. At least 40 persons were interviewed in each region, and the goal was to achieve representative depiction of urban and rural communities. Within the context of the research project, urban communities are taken to mean large cities, medium-sized cities and small towns.
Data input for the provider survey was performed with the help of the EvaSys statistics soft ware,which allows automatic recording of data. The PASW statistics programme, version 18.0.0, was used for subsequent data processing. In the case of categorical variables, the chi-square test according to Pearson was used to verify differences between two groups. If there were values < 5 in too many cells, categories were grouped or Fisher’s exact test was used. The U test according to Mann and Whitney was performed for variables with ordinal
45
scale level. Differences between more than two groups were analysed with the help of the H test according to Kruskal-Wallis. If no answers were given for individual questions, these questions were excluded from the final statistical tests. The significance level was defined as p < 0.05.
3.2 Results
Description of study cohort: A total of 2,496 providers of “meals on wheels” were identified
using the defined search criteria and contacted; 844 questionnaires (return rate 33.8 %) were
returned. 74.2 % of meal services are providers of the welfare sector and only 18.5 % are private
companies. The majority of providers (52.7 %) deliver only hot meals to the customers; a small
percentage (7.8 %) offer only deep-frozen meals. 76.5 % of providers (n = 646) generally supply
a meal to their customers on seven days a week, and only 12.8 % deliver meals on five days of
the week. The providers mainly make use of industrially produced deep-frozen menus; in other
words, 64.2 % do not produce the meals themselves.
Organisation of meal services is characterised by a high level of flexibility vis-à-vis the
customer.
In the case of 50.9 % of providers, the time from the end of cooking to start of delivery is less
than one hour, and one to two hours for 29.3 % of providers. 7.9 % said that meals are kept hot
for longer than two hours before the process of transport to the customer begins. 64.9 % of the
844 providers said that an HACCP concept is implemented in their operation. 33.1 % of providers
have conducted a risk analysis according to REG (EC) 852/2004 Article 5.
There are wide variations in prices. The majority of prices (80.2 %) are between 3.01 euros and
7 euros per meal.
Quality of meals (Table 5): The overwhelming majority of providers (72.8 %) say they are in a
position to provide information on the nutritional composition of the menus they offer; 52.1 %
rely on the information provided by their suppliers for this. In line with the “DGE Quality Standard
for Meals on Wheels”, a menu cycle should cover at least four weeks: 88.3 % of providers meet
this requirement. Meal services offer different types of meals that are geared towards the needs
of customers. The most frequent types are meals for diabetics (88.2 %). 75 % of providers
offer pureed meals for older people who have difficulty chewing or swallowing. Based on the
“DGE Quality Standard for Meals on Wheels”, a one-week cycle menu should include seven
portions of vegetables a week, including at least three portions of raw vegetables or salad.
46
The midday meals supplied by 34.4 % of providers contain vegetables daily; 26.1 % offer meals
that include vegetables five to six times a week, 31 % three to four times a week and a low
figure of 2.5 % just once to twice a week. 43.7 % of providers meet the requirement regarding the
frequency of salad or raw vegetables as part of the meal, while salad or raw vegetables are never
offered in 28.1 % of providers.
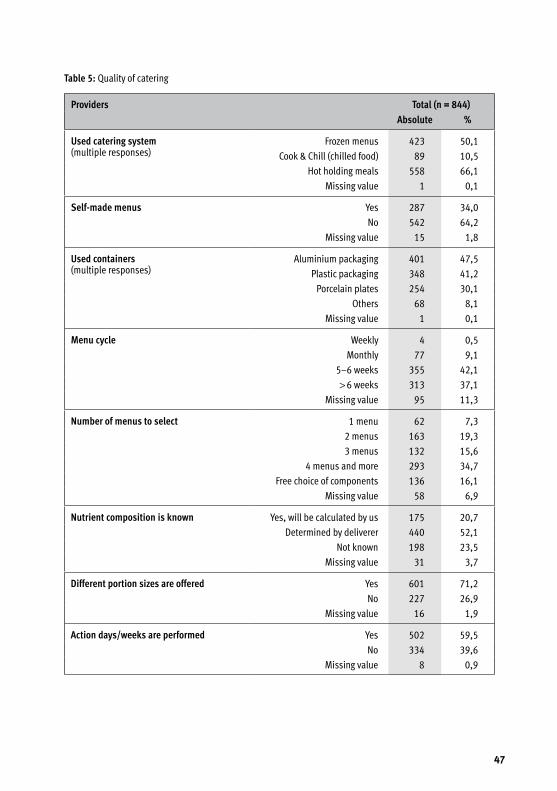
47
Table5:Quality of catering
Providers Total(n=844)Absolute %
Usedcateringsystem(multiple responses)
Frozen menus 423 50,1
Cook & Chill (chilled food) 89 10,5
Hot holding meals 558 66,1
Missing value 1 0,1
Self-mademenus Yes 287 34,0
No 542 64,2
Missing value 15 1,8
Usedcontainers(multiple responses)
Aluminium packaging 401 47,5
Plastic packaging 348 41,2
Porcelain plates 254 30,1
Others 68 8,1
Missing value 1 0,1
Menucycle Weekly 4 0,5
Monthly 77 9,1
5–6 weeks 355 42,1
> 6 weeks 313 37,1
Missing value 95 11,3
Numberofmenustoselect 1 menu 62 7,3
2 menus 163 19,3
3 menus 132 15,6
4 menus and more 293 34,7
Free choice of components 136 16,1
Missing value 58 6,9
Nutrientcompositionisknown Yes, will be calculated by us 175 20,7
Determined by deliverer 440 52,1
Not known 198 23,5
Missing value 31 3,7
Differentportionsizesareoffered Yes 601 71,2
No 227 26,9
Missing value 16 1,9
Actiondays/weeksareperformed Yes 502 59,5
No 334 39,6
Missing value 8 0,9
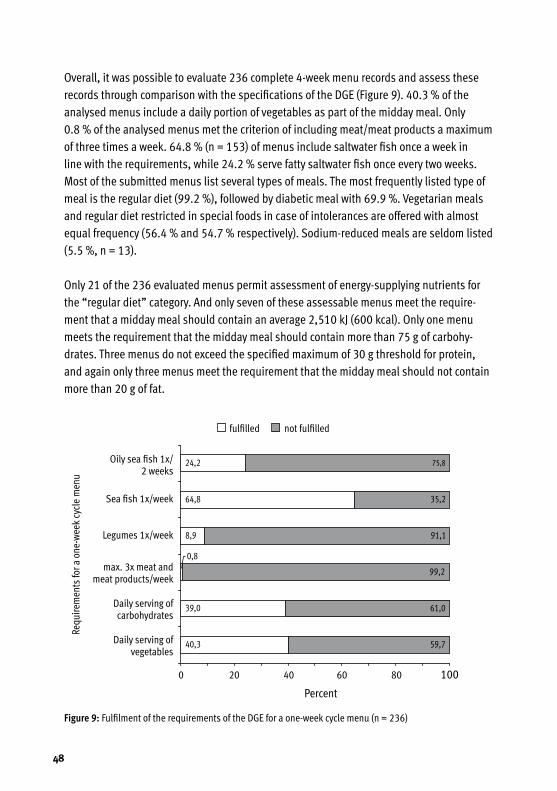
48
Overall, it was possible to evaluate 236 complete 4-week menu records and assess these records through comparison with the specifications of the DGE (Figure 9). 40.3 % of the analysed menus include a daily portion of vegetables as part of the midday meal. Only 0.8 % of the analysed menus met the criterion of including meat/meat products a maximum of three times a week. 64.8 % (n = 153) of menus include saltwater fish once a week in line with the requirements, while 24.2 % serve fatty saltwater fish once every two weeks. Most of the submitted menus list several types of meals. The most frequently listed type of meal is the regular diet (99.2 %), followed by diabetic meal with 69.9 %. Vegetarian meals and regular diet restricted in special foods in case of intolerances are offered with almost equal frequency (56.4 % and 54.7 % respectively). Sodium-reduced meals are seldom listed (5.5 %, n = 13).
Only 21 of the 236 evaluated menus permit assessment of energy-supplying nutrients for the “regular diet” category. And only seven of these assessable menus meet the require-ment that a midday meal should contain an average 2,510 kJ (600 kcal). Only one menu meets the requirement that the midday meal should contain more than 75 g of carbohy-drates. Three menus do not exceed the specified maximum of 30 g threshold for protein, and again only three menus meet the requirement that the midday meal should not contain more than 20 g of fat.
Requ
irem
ents
for a
one
-wee
k cy
cle
men
u
40,3 59,7
39,0 61,0
8,9 91,1
64,8 35,2
0,8
0 20 40 60 80 100
Percent
Oily sea fish 1x/ 2 weeks
Figure9:Fulfilment of the requirements of the DGE for a one-week cycle menu (n = 236)
75,824,2
99,2
fulfilled not fulfilled
Sea fish 1x/week
Legumes 1x/week
max. 3x meat and meat products/week
Daily serving of carbohydrates
Daily serving of vegetables
49
Customer satisfaction: A total of 205 persons (69 men, average age 81.5; 136 women, average age 81.9) were interviewed. Satisfaction levels with the service and the quality of “meals on wheels” are high. This applies to all sub-categories, from appearance and consis-tency through to taste and variety of meals. Satisfaction scores were also high for reliability of delivery, reachability of the meal services and helpfulness of the drivers.
3.3 Evaluation
On the whole, the findings show that the “meals on wheels” service meets the needs of older people in a wide range. This impression is supported by the results of all three survey tools. What is also true is that the findings point to both strengths and weaknesses. The strengths include the efficient structure and organisation of the service, consideration of customer preferences and a great variety of meals. Among the identified weaknesses are the fact that the majority of providers have no knowledge of the health status of their customers, in some cases a lack of risk analysis as part of hygiene management in the production, the absence of nutrient and quantitative data and non-compliance with the specifications of the German Nutrition Society for a one-week cycle menu.
50
4 Food Safety
4.1 Microbiological aspects
4.1.1 Methodology
The situation with regard to the occurrence of the most important foodborne infections and intoxications as well as the incidence of the responsible pathogens in foods in Germany is presented in its current status and in comparison with past years on the basis of the docu-mentation of foodborne disease outbreaks by the Robert Koch Institute (RKI) and supple-mentary data surveys conducted by the Federal Institute for Risk Assessment (BfR).
4.1.2 Results
In recent years, there has been a strong decline in the number of reported incidents of sal-monella infections in humans, caused in particular by Salmonella enteritidis. According to the survey findings of the regional states, salmonella is also being detected less frequently in raw chicken and pork meat and in hen’s eggs. In contrast, the reported figures for infec-tions with bacteria of the Campylobacter species in Germany are still considerably higher. Listeriosis is only of secondary importance in terms of absolute numbers but is extremely dangerous. This disease increasingly affects old people and those with underlying diseases, and this may be connected to the increase in the number of people with weaker immune systems as a result of the demographic trend. Changed intake habits, above all the trend towards pre-packaged foods that are cooled for long periods and not heated prior to intake, may also play a role in the rising number of reported cases of listeriosis. The high number of reported cases of norovirus and rotavirus infections and the increase in the number of cases of hepatitis E infections acquired in Germany underline the importance of research into the occurrence of these viruses in different foods as well as into transmission paths and ways of inactivating these viruses. As no suitable detection techniques exist for most food groups, it is not yet possible to estimate the actual percentage of foodborne viral infections. Trichinellosis is an extremely rare disease in Germany, and fattening pig stocks in Germany are practically trichinella-free. Livestock in some Eastern European countries is infected with this parasite more frequently, however, with the result that intake of raw meat from these countries or products made from this meat like cold cuts or raw ham can lead to infection. It is not possible to make any definitive statements regarding the significance of toxoplasms
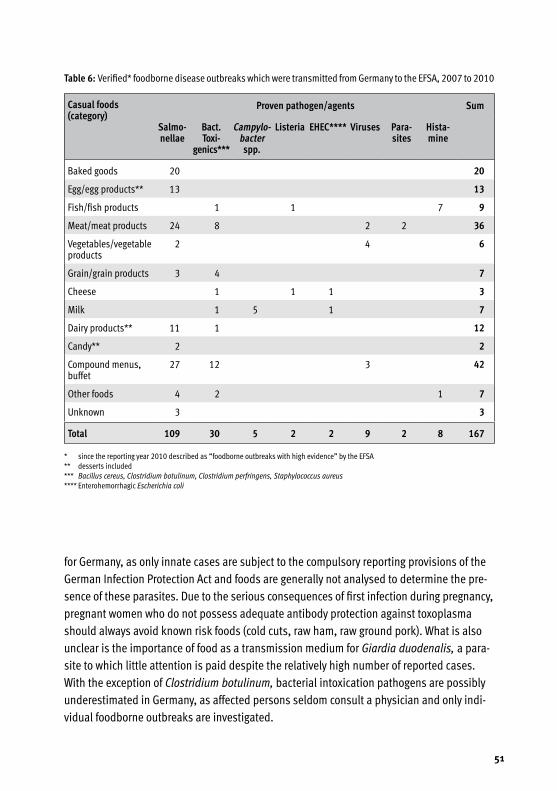
51
for Germany, as only innate cases are subject to the compulsory reporting provisions of the German Infection Protection Act and foods are generally not analysed to determine the pre-sence of these parasites. Due to the serious consequences of first infection during pregnancy, pregnant women who do not possess adequate antibody protection against toxoplasma should always avoid known risk foods (cold cuts, raw ham, raw ground pork). What is also unclear is the importance of food as a transmission medium for Giardia duodenalis, a para-site to which little attention is paid despite the relatively high number of reported cases. With the exception of Clostridium botulinum, bacterial intoxication pathogens are possibly underestimated in Germany, as affected persons seldom consult a physician and only indi-vidual foodborne outbreaks are investigated.
Table6:Verified* foodborne disease outbreaks which were transmitted from Germany to the EFSA, 2007 to 2010
Casualfoods(category)
Provenpathogen/agents Sum
Salmo-nellae
Bact.Toxi-
genics***
Campylo-bacterspp.
Listeria EHEC**** Viruses Para-sites
Hista-mine
Baked goods 20 20
Egg/egg products** 13 13
Fish/fish products 1 1 7 9
Meat/meat products 24 8 2 2 36
Vegetables/vegetable products
2 4 6
Grain/grain products 3 4 7
Cheese 1 1 1 3
Milk 1 5 1 7
Dairy products** 11 1 12
Candy** 2 2
Compound menus, buffet
27 12 3 42
Other foods 4 2 1 7
Unknown 3 3
Total 109 30 5 2 2 9 2 8 167
* since the reporting year 2010 described as “foodborne outbreaks with high evidence” by the EFSA** desserts included*** Bacillus cereus, Clostridium botulinum, Clostridium perfringens, Staphylococcus aureus**** Enterohemorrhagic Escherichia coli
52
4.1.3 Evaluation
A lack of knowledge regarding the correct way to handle food can lead to foodborne infec-tions or microbial food poisoning. The main causes of these diseases are the intake of raw foods of animal origin, inadequate cooling and heating, keeping food hot in an incorrect manner and inadequate kitchen and hand hygiene. Moreover, the EHEC outbreak in the early summer of 2011 showed that plant-based foods can also pose a threat if contaminat-ed with pathogens and eaten raw. Consumer education on the proper handling of foods is and will remain one of the key tools for the prevention of these diseases, as it is not entirely possible to prevent pathogens from entering the food chain. Moreover, pregnant women and people who are particularly susceptible to foodborne infections due to their very young or advanced age or as a result of pre-existing diseases or medication use should preferably refrain from eating known risk foods.
4.2 Undesired substances in food – residues of plant protection products
4.2.1 Methodology
The frequency of occurrence of plant protection products and their residues is reported and assessed on the basis of the annual “National Report on Plant Protection Products in Food” (Federal Office of Consumer Protection and Food Safety [BVL]) and the supplementary quar-terly evaluations of the official investigation findings published by the BVL since the spring of 2009 (these findings are broken down into samples from Germany, the European Commu-nity, third countries and of unknown origin).
4.2.2 Results
A total of 70,358 samples were analysed in Germany in the period from 2006 to 2009, an increase of around 31 % on the period between 2002 and 2005. 39.1 % of the samples had no detectable residues, 56.6 % contained residues within the admissible limits and 4.3 % contained levels of residues above these limits. While the percentage of samples without detectable residues was more or less constant in the period from 2006 to 2009, the per-centage of samples with residue levels above the admissible limits steadily decreased, from 5.4 % in 2006 to 3.2 % in 2009. At the same time, advances in analytical methods mean that the number of substances for which samples are tested has increased steadily in recent years, so that tests cover a far wider range of substances than they used to. As in previous years, testing focused on foods of plant origin, in particular fruit and vegetables. On average 4.6 % of 63,938 tested samples contained residues above the admissible maximum
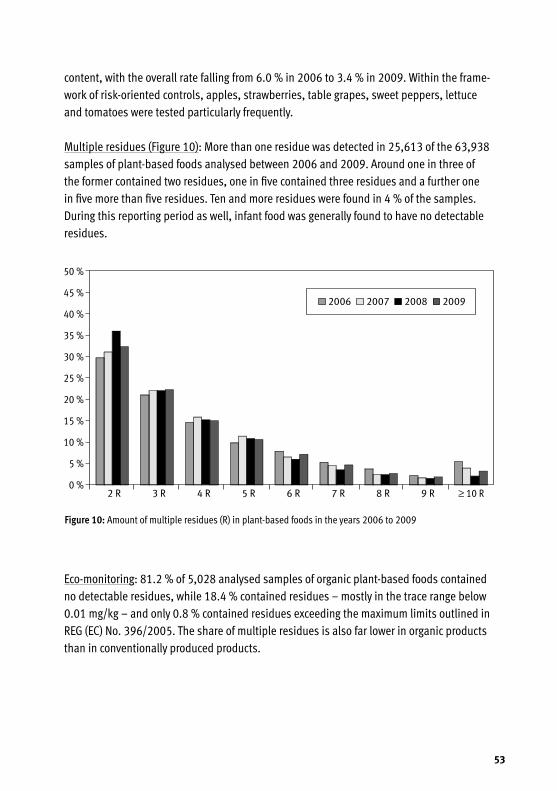
53
content, with the overall rate falling from 6.0 % in 2006 to 3.4 % in 2009. Within the frame-work of risk-oriented controls, apples, strawberries, table grapes, sweet peppers, lettuce and tomatoes were tested particularly frequently.
Multiple residues (Figure 10): More than one residue was detected in 25,613 of the 63,938 samples of plant-based foods analysed between 2006 and 2009. Around one in three of the former contained two residues, one in five contained three residues and a further one in five more than five residues. Ten and more residues were found in 4 % of the samples. During this reporting period as well, infant food was generally found to have no detectable residues.
Eco-monitoring: 81.2 % of 5,028 analysed samples of organic plant-based foods contained no detectable residues, while 18.4 % contained residues – mostly in the trace range below 0.01 mg/kg – and only 0.8 % contained residues exceeding the maximum limits outlined in REG (EC) No. 396/2005. The share of multiple residues is also far lower in organic products than in conventionally produced products.
Figure10:Amount of multiple residues (R) in plant-based foods in the years 2006 to 2009
2 R 3 R 4 R 5 R 6 R 7 R 8 R 9 R
50 %
45 %
40 %
35 %
30 %
25 %
20 %
15 %
10 %
5 %
0 %
2006 2007 2008 2009
≥ 10 R
54
4.2.3 Evaluation
The overall trend with regard to residues remains positive, and there were no detectable residues in most of the infant food and organic food products during the reporting period. As in previous years, fruit and vegetables were the focal point of testing activities. There has been a continuous downtrend in residue levels exceeding the maximum content in recent years and results are now almost consistently in the low single-digit percentage range. The possibility that this is partly due to Europe-wide harmonisation of maximum concentrations cannot be ruled out, however. In all products, levels above the acute reference dose that is of relevance to human health were seldom exceeded. Testing and assessment strategies are currently being developed for the assessment of the occurrence of multiple residues. In summary, it can be said that the evaluation of residues of plant protection products pro-vides no evidence whatsoever to suggest that people should refrain from including a high percentage of fruit and vegetables in their daily diets as recommended by nutrition experts.
4.3 Residues in food of animal origin
4.3.1 Methodology
The following information on the occurrence of residues of veterinary drugs, banned sub-stances and contaminants in foods of animal origin is based on the findings of the National Residue Control Plan (NRCP) for the period from 2006 to 2009, the findings of the Import Residue Control Plan for 2008 and 2009 and the annual reports on food safety published by the Federal Office of Consumer Protection and Food Safety (BVL) in printed form and on the Internet.
4.3.2 Results
NRCP: In the period from 2006 to 2009, 204,531 samples from animals or animal products were tested for 660 to 751 substances, with each sample only being tested for a specific spectrum of substances. All in all, 1,813,966 tests were performed. Moreover there were 1,041,673 samples that were tested using the “three-plate test”, a cost-efficient screening method for inhibitors of various antibiotics. There were issues with 687 samples (0.3 %) during this period; the samples in question contained either banned substances or sub-stances in which the residues exceeded the maximum content; the corresponding figure for the samples analysed using the three-plate test was 1,880 (0.2 %). Substances with ana-bolic effect and non-approved substances were detected in 163 samples (0.2 %). Levels of substances with antibacterial effects exceeding the legally defined maximum content were found in 69 samples (0.1 %). In addition, inadmissible levels of other veterinary drugs were
55
found in 63 samples (0.1 %) and other substances and environmental contaminants in 394 samples (1.5 %).
The illegal use of substances with hormonal effects to improve performance (e.g. 17-alpha- and 17-beta-19-nortestosterone) did not play any role during the reporting period. In the case of substances with antibacterial effects (sulphonamides, tetracyclines), the percent-age of levels exceeding the maximum content remained more or less the same during the reporting period at 0.1 % to 0.2 % of the approx. 2,500 and 4,000 tested samples from cattle, pigs, sheep, goats and horses. In the case of coccidiostats, which are used as food additives, there have been repeated problems in recent years due to carry-over during the feed production process. In 2008, lasalocid was detected in cattle and pigs in 7 out of 611 samples (1.1 %) and in broilers in 2 out of 299 samples (0.7 %). Mercury residues in kidney and liver exceeding the maximum content were found in 208 of the 5,492 (3.8 %) tested samples and were found most frequently in sheep (15.7 %), game (14.9 %), cows (7.1 %) and pigs (4.7 %). 413 samples from eggs were tested for dioxins. All samples were contaminated with dioxins and dioxin-like polychlorinated biphenyls (dl-PCBs) consistent with background levels averaging 0.9 pg per g of fat. Samples from free-range eggs exceed-ed the maximum level of 3 pg WHO-PCDD/F-TEQ per g of fat in eleven cases (8.9 %), with four cases in the barn egg samples (2.8 %). No levels exceeding the maximum content were found in organically or cage farmed eggs.
The use of malachite green is not permitted in food-producing animals in the EU, but it is still sometimes used illegally in fish production due to its efficacy in combating parasites and fungal diseases. Residues were detected in 33 out of 969 trout samples (3.4 %) and 7 out of 569 carp samples (1.2 %).
Import Residue Control Plan: In 2008 and 2009, 45,350 tests were performed on 2,969 samples of animal products from 42 and 44 third countries for 264 and 297 substances respectively, with each sample only being tested for a specific spectrum of substances.
The main problem regarding imports were residues of banned nitrofurans in food-producing animals. In 2008, these were found in 15 of the 32 tested pig intestine samples (46.9 %) and seven out of nine tested sheep intestine samples (77.8 %) from China and in one of twelve poultry meat samples (8.3 %) from Israel. Moreover, samples of animals from aquacul-ture (in particular shrimps from India and Sri Lanka) had residues of nitrofuran metabolites in 7 out of 78 samples (9.0 %) in 2008, followed by 10 out of 113 samples (8.8 %) in 2009.
56
4.3.3 Evaluation
During the reporting period from 2006 to 2009, contamination of food of animal origin with inadmissible substances or substance concentrations exceeding the maximum content was at a low level. In its assessment of the findings of the National Residue Control Plan and the Import Residue Control Plan, the Federal Institute for Risk Assessment (BfR) therefore comes to the conclusion that the one-time or occasional intake of food of animal origin containing residues in the concentrations observed to date does not pose any direct risk to the health of consumers. The focal point of testing in the coming years will remain the mercury and dioxin levels in food of animal origin as well as the malachite green and nitrofuran contami-nation (in the case of food from third countries) of aquaculture products.
4.4 Environmental contaminants in food and human breast milk
4.4.1 Methodology
Data from the official food monitoring and recent status surveys form the basis for the assessment of the occurrence of environmental contaminants.
4.4.2 Results
4.4.2.1 Environmental contaminants in food
Dioxins: Within the framework of a nationwide status survey on dioxins in feed and food of animal origin, around 1,100 samples were taken throughout Germany to ensure maximum representativeness and tested for dioxins and PCBs in the period from 2004 to 2008. A comparison with data collected for milk, meat and fish in a similar research project from 1995 to 1999 showed that current dioxin concentrations in all food of terrestrial origin are considerably lower due to wide-ranging emission reduction measures and that these con-centrations are generally well below the maximum contents laid down in the corresponding community legislation. There has also been a significant decrease in dioxin and dl-PCB concentrations in dairy products from North Rhine-Westphalia (Figure 11), where products from all dairies supplied with raw milk have been tested every four years since 1990. In sheep meat samples (nationwide project monitoring), the maximum concentration for dioxins (3 pg WHO-TEQ per g of fat) was exceeded in 2.2 % of samples and the total maxi-mum content for dioxins and dl-PCBs (4.5 pg WHO-TEQ per g of fat) in 8.2 % of samples.
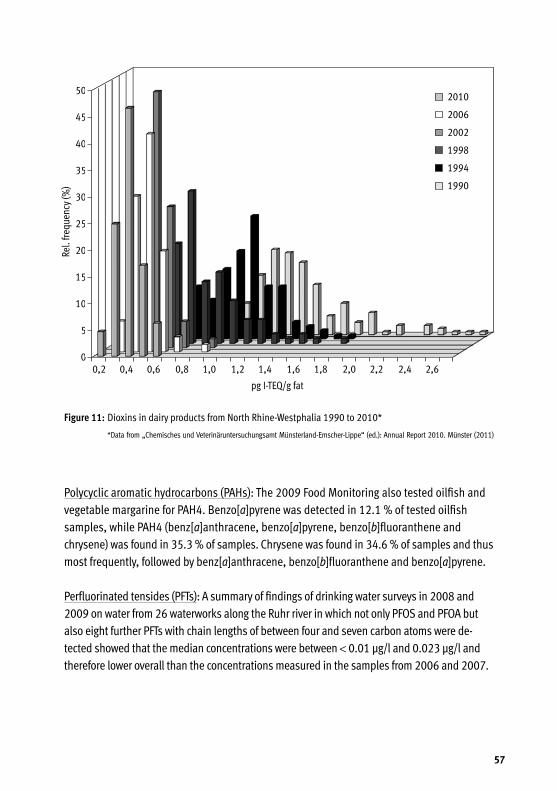
57
Polycyclic aromatic hydrocarbons (PAHs): The 2009 Food Monitoring also tested oilfish and vegetable margarine for PAH4. Benzo[a]pyrene was detected in 12.1 % of tested oilfish samples, while PAH4 (benz[a]anthracene, benzo[a]pyrene, benzo[b]fluoranthene and chrysene) was found in 35.3 % of samples. Chrysene was found in 34.6 % of samples and thus most frequently, followed by benz[a]anthracene, benzo[b]fluoranthene and benzo[a]pyrene.
Perfluorinated tensides (PFTs): A summary of findings of drinking water surveys in 2008 and 2009 on water from 26 waterworks along the Ruhr river in which not only PFOS and PFOA but also eight further PFTs with chain lengths of between four and seven carbon atoms were de-tected showed that the median concentrations were between < 0.01 µg/l and 0.023 µg/l and therefore lower overall than the concentrations measured in the samples from 2006 and 2007.
Figure11:Dioxins in dairy products from North Rhine-Westphalia 1990 to 2010*
* Data from „Chemisches und Veterinäruntersuchungsamt Münsterland-Emscher-Lippe“ (ed.): Annual Report 2010. Münster (2011)
50
45
40
35
30
25
20
15
10
5
0
Rel.
frequ
ency
(%)
0,2 0,4 0,6 0,8 1,0 1,2 1,4 1,6 1,8 2,0 2,2 2,4 2,6
pg I-TEQ/g fat
2010
2006
2002
1998
1994
1990
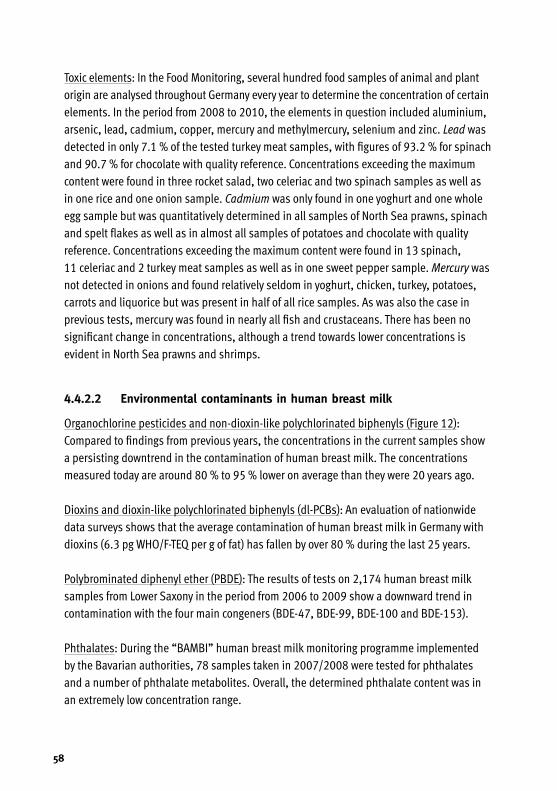
58
Toxic elements: In the Food Monitoring, several hundred food samples of animal and plant origin are analysed throughout Germany every year to determine the concentration of certain elements. In the period from 2008 to 2010, the elements in question included aluminium, arsenic, lead, cadmium, copper, mercury and methylmercury, selenium and zinc. Lead was detected in only 7.1 % of the tested turkey meat samples, with figures of 93.2 % for spinach and 90.7 % for chocolate with quality reference. Concentrations exceeding the maximum content were found in three rocket salad, two celeriac and two spinach samples as well as in one rice and one onion sample. Cadmium was only found in one yoghurt and one whole egg sample but was quantitatively determined in all samples of North Sea prawns, spinach and spelt flakes as well as in almost all samples of potatoes and chocolate with quality reference. Concentrations exceeding the maximum content were found in 13 spinach, 11 celeriac and 2 turkey meat samples as well as in one sweet pepper sample. Mercury was not detected in onions and found relatively seldom in yoghurt, chicken, turkey, potatoes, carrots and liquorice but was present in half of all rice samples. As was also the case in previous tests, mercury was found in nearly all fish and crustaceans. There has been no significant change in concentrations, although a trend towards lower concentrations is evident in North Sea prawns and shrimps.
4.4.2.2 Environmental contaminants in human breast milk
Organochlorine pesticides and non-dioxin-like polychlorinated biphenyls (Figure 12): Compared to findings from previous years, the concentrations in the current samples show a persisting downtrend in the contamination of human breast milk. The concentrations measured today are around 80 % to 95 % lower on average than they were 20 years ago.
Dioxins and dioxin-like polychlorinated biphenyls (dl-PCBs): An evaluation of nationwide data surveys shows that the average contamination of human breast milk in Germany with dioxins (6.3 pg WHO/F-TEQ per g of fat) has fallen by over 80 % during the last 25 years.
Polybrominated diphenyl ether (PBDE): The results of tests on 2,174 human breast milk samples from Lower Saxony in the period from 2006 to 2009 show a downward trend in contamination with the four main congeners (BDE-47, BDE-99, BDE-100 and BDE-153).
Phthalates: During the “BAMBI” human breast milk monitoring programme implemented by the Bavarian authorities, 78 samples taken in 2007/2008 were tested for phthalates and a number of phthalate metabolites. Overall, the determined phthalate content was in an extremely low concentration range.
59
4.4.3 Evaluation
The percentage of foods with environmental contaminant concentrations that exceed the legally defined maximum contents is generally low. Only in extremely seldom cases there is an acute health risk for consumers due to environmental contaminants in foods. The burden of environmental contaminants in human breast milk has been steadily declining for more than 25 years. It is still recommended that babies be fully breastfed (approx. 4 to 6 months) until spoon-feeding is initiated.
4.5 Contaminants in food formed during heating processes
4.5.1 Evaluation of available scientific findings
Heating of foods creates a multitude of substances that have the potential to adversely affect health. In animal experiments using rodents, heterocyclic aromatic amines (HAAs), polycyclic aromatic hydrocarbons (PAHs), acrylamide and furan cause malignant tumours, while 3-monochloropropane-1,2-diol (3-MCPD) causes benign tumours. At the current point in time, the possibility that the individual compounds listed above are carcinogenic for humans cannot be ruled out. There is still a need to counter the formation of HAAs, PAHs, acrylamide and furan by taking minimisation measures when preparing food in private households as follows:
Figure12:Time course of the contamination of human breast milk with organochlorine pesticides and poly-chlorinated biphenyls 2005 to 2009 (median in µg/g milk fat)*
*Data from „Niedersächsisches Landesgesundheitsamt“ (2011)
0,20
0,18
0,16
0,14
0,12
0,10
0,08
0,06
0,04
0,02
0
µg/g
milk
fat
Year
2005 2006 2007 2008 2009
β-HCH HCB Σ-DDT Σ-PCB
60
HAAs: HAAs are formed above all in the crust of roasted/grilled meat. It should be noted that the quantity of HAAs formed increases with duration of roasting/grilling. It is therefore recom mended that meat should be removed from the oven, pan or barbecue as soon as it has been adequately roasted/grilled and that charred areas of the meat should not be eaten.
PAHs: If food is grilled on charcoal from the side, the food does not become contaminated with PAHs. If food is grilled from below, it is advisable to: 1) chose lean meat; 2) use an alu-minium barbecue tray to prevent fat from dripping onto the hot coal; 3) not eat the charred areas of the food.
Acrylamide: All cereal and potato products like French fried potatoes, potato crisps or potato cakes should be prepared at medium temperatures. The oven temperatures should not ex-ceed 180 °C (fan assist) or 200 °C (without fan assist) in order to minimize the formation of acrylamide during baking and toasting. Toast should also be toasted only briefly and lightly. Fat frying temperatures should not exceed 175 °C, and the use of a maximum 100 g of frying product per litre of oil has shown itself to be beneficial. Children eat more than adults rela-tive to their body weight, and it must therefore be assumed that they eat higher amounts of acrylamide. Foods with relatively high acrylamide loads like French fried potatoes or potato crisps should therefore be eaten only seldom.
Furan: On current knowledge, it is to be assumed that the furan quantities found in com-mercial baby food pose no risk to babies. It is, however, possible to reduce the furan content further by removing the lids of the jars and stirring the contents for a couple of minutes in a water bath with a temperature of roughly 70 °C. Due to the low boiling point of furan, this causes most of the furan to be released from the baby food.
61
5 Disease Prevention and Nutrition
5.1 Relationship between nutrition and carcinogenesis
5.1.1 Methodology
In order to update the information in the 2004 and 2008 Nutrition Reports, a systematic literature search was performed for the period from 2008 to November 2011 using the same key terms. The literature search was performed using the “PubMed” database and evaluating the literature citations in original articles and overviews. A relationship is said to exist between nutrition factor and disease risk if this has been verified in the studies with a statistical probability of p < 0.05. Determination of the strength of the evidence (convinc-ing, probable, possible, insufficient) takes account of the design and quality of the avail-able studies and is based on the concept of the evidence-based guidelines of the German Nutrition Society, which are in turn based on the evaluation scheme of the World Health Organization (WHO).
The new findings for the individual cancers are described by disease group (malignant tumours of the digestive and respiratory organs, hormone-dependent malignant tumours, other malignant tumours) and the evidence is being “re-assessed”. To permit comparison, each disease group is preceded by the results of the evidence assessment outlined in the 2008 Nutrition Report. At the end of each section on the disease group in question, there is a table showing the evidence assessments from the 2004 and 2008 Nutrition Reports and the current assessment.
5.1.2 Results
Vegetables and fruit (Table 7): Based on the new findings of prospective cohort studies, there still is probable evidence that the increased intake of vegetables and fruit reduces the risk of malignant tumours in the mouth/pharynx/larynx, of squamous cell carcinomas in the esophagus and of malignant tumours in the colon, and possible evidence of a reduced risk of malignant tumours of the stomach and rectum as well as of adenocarcinomas of the esophagus. There is probable evidence that increased intake of fruit - and possible evidence that increased intake of vegetables - reduces the risk of malignant tumours of the lung. It is worthy of note that, in some of the studies on the malignant tumours of the digestive and
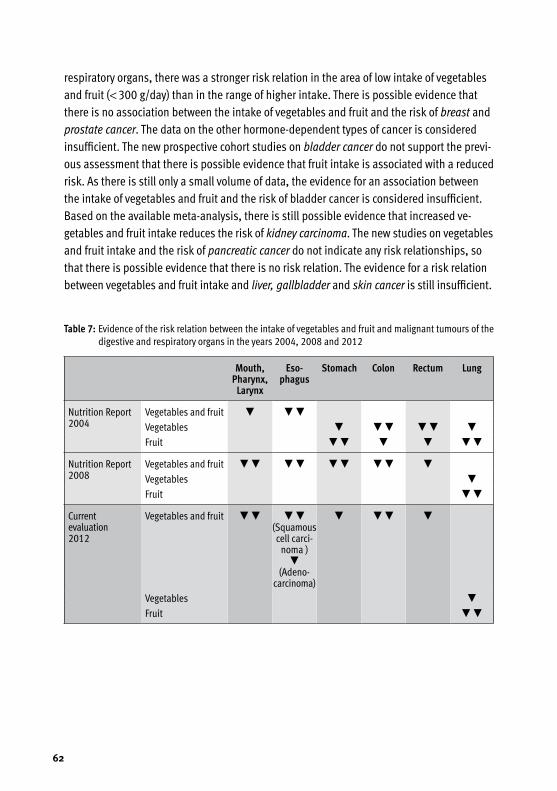
62
respiratory organs, there was a stronger risk relation in the area of low intake of vegetables and fruit (< 300 g/day) than in the range of higher intake. There is possible evidence that there is no association between the intake of vegetables and fruit and the risk of breast and prostate cancer. The data on the other hormone-dependent types of cancer is considered insufficient. The new prospective cohort studies on bladder cancer do not support the previ-ous assessment that there is possible evidence that fruit intake is associated with a reduced risk. As there is still only a small volume of data, the evidence for an association between the intake of vegetables and fruit and the risk of bladder cancer is considered insufficient. Based on the available meta-analysis, there is still possible evidence that increased ve - getables and fruit intake reduces the risk of kidney carcinoma. The new studies on vegetables and fruit intake and the risk of pancreatic cancer do not indicate any risk relationships, so that there is possible evidence that there is no risk relation. The evidence for a risk relation between vegetables and fruit intake and liver, gallbladder and skin cancer is still insufficient.
Table7: Evidence of the risk relation between the intake of vegetables and fruit and malignant tumours of the digestive and respiratory organs in the years 2004, 2008 and 2012
Mouth,Pharynx,
Larynx
Eso-phagus
Stomach Colon Rectum Lung
Nutrition Report 2004
Vegetables and fruit ▼ ▼▼Vegetables ▼ ▼▼ ▼▼ ▼Fruit ▼▼ ▼ ▼ ▼▼
Nutrition Report 2008
Vegetables and fruit ▼▼ ▼▼ ▼▼ ▼▼ ▼Vegetables ▼Fruit ▼▼
Current evaluation 2012
Vegetables and fruit ▼▼ ▼▼ (Squamous cell carci-
noma )▼
(Adeno-carcinoma)
▼ ▼▼ ▼
Vegetables ▼Fruit ▼▼
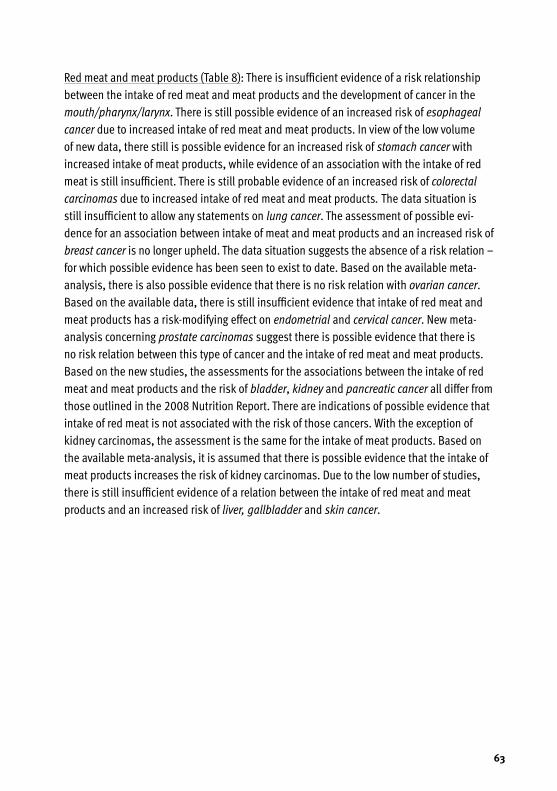
63
Red meat and meat products (Table 8): There is insufficient evidence of a risk relationship between the intake of red meat and meat products and the development of cancer in the mouth/pharynx/larynx. There is still possible evidence of an increased risk of esophageal cancer due to increased intake of red meat and meat products. In view of the low volume of new data, there still is possible evidence for an increased risk of stomach cancer with increased intake of meat products, while evidence of an association with the intake of red meat is still insufficient. There is still probable evidence of an increased risk of colorectal carcinomas due to increased intake of red meat and meat products. The data situation is still insufficient to allow any statements on lung cancer. The assessment of possible evi-dence for an association between intake of meat and meat products and an increased risk of breast cancer is no longer upheld. The data situation suggests the absence of a risk relation – for which possible evidence has been seen to exist to date. Based on the available meta-analysis, there is also possible evidence that there is no risk relation with ovarian cancer. Based on the available data, there is still insufficient evidence that intake of red meat and meat products has a risk-modifying effect on endometrial and cervical cancer. New meta-analysis concerning prostate carcinomas suggest there is possible evidence that there is no risk relation between this type of cancer and the intake of red meat and meat products. Based on the new studies, the assessments for the associations between the intake of red meat and meat products and the risk of bladder, kidney and pancreatic cancer all differ from those outlined in the 2008 Nutrition Report. There are indications of possible evidence that intake of red meat is not associated with the risk of those cancers. With the exception of kidney carcinomas, the assessment is the same for the intake of meat products. Based on the available meta-analysis, it is assumed that there is possible evidence that the intake of meat products increases the risk of kidney carcinomas. Due to the low number of studies, there is still insufficient evidence of a relation between the intake of red meat and meat products and an increased risk of liver, gallbladder and skin cancer.
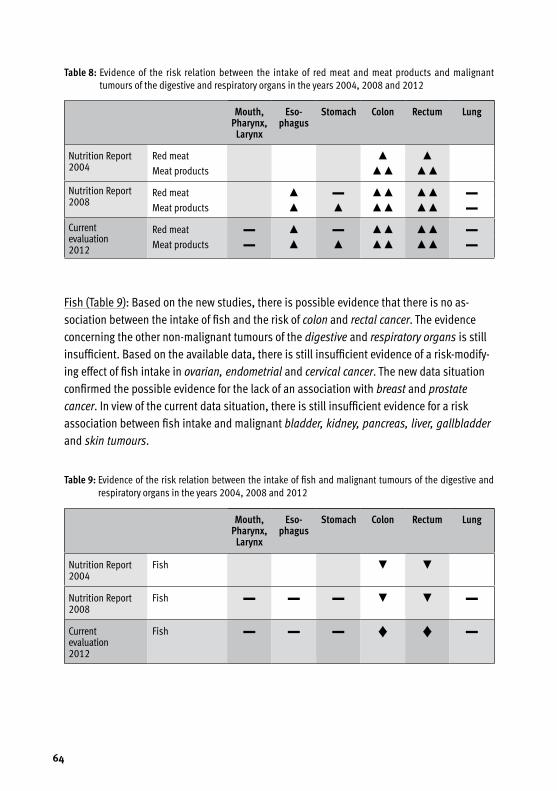
64
Fish (Table 9): Based on the new studies, there is possible evidence that there is no as-sociation between the intake of fish and the risk of colon and rectal cancer. The evidence concerning the other non-malignant tumours of the digestive and respiratory organs is still insufficient. Based on the available data, there is still insufficient evidence of a risk-modify-ing effect of fish intake in ovarian, endometrial and cervical cancer. The new data situation confirmed the possible evidence for the lack of an association with breast and prostate cancer. In view of the current data situation, there is still insufficient evidence for a risk association between fish intake and malignant bladder, kidney, pancreas, liver, gallbladder and skin tumours.
Table8: Evidence of the risk relation between the intake of red meat and meat products and malignant tumours of the digestive and respiratory organs in the years 2004, 2008 and 2012
Mouth,Pharynx,
Larynx
Eso-phagus
Stomach Colon Rectum Lung
Nutrition Report 2004
Red meat ▲ ▲Meat products ▲▲ ▲▲
Nutrition Report 2008
Red meat ▲ ▬ ▲▲ ▲▲ ▬Meat products ▲ ▲ ▲▲ ▲▲ ▬
Current evaluation 2012
Red meat ▬ ▲ ▬ ▲▲ ▲▲ ▬Meat products ▬ ▲ ▲ ▲▲ ▲▲ ▬
Table9: Evidence of the risk relation between the intake of fish and malignant tumours of the digestive and respiratory organs in the years 2004, 2008 and 2012
Mouth,Pharynx,
Larynx
Eso-phagus
Stomach Colon Rectum Lung
Nutrition Report 2004
Fish ▼ ▼
Nutrition Report 2008
Fish ▬ ▬ ▬ ▼ ▼ ▬
Current evaluation 2012
Fish ▬ ▬ ▬ ♦ ♦ ▬
65
Poultry: There is still insufficient evidence for an association between the intake of poultry and a risk of carcinomas in the mouth/pharynx/larynx and esophagus as well as stomach cancer and lung cancer. In the case of colon and rectal cancer, the high number of studies and their findings led to the assessment that there is possible evidence that there is no risk relation with the intake of poultry. Based on the available data, there is still insufficient evi-dence of a risk-modifying effect of poultry intake in ovarian, endometrial and cervical cancer. In the case of breast cancer and prostate cancer, the new data points to possible evidence that there is no association. There is still insufficient evidence for a risk relation between the intake of poultry and bladder, pancreatic, liver, gallbladder and skin cancer. The available meta-analysis on kidney cancer permits the conclusion that there is possible evidence that intake of poultry does not affect the risk of this type of cancer.
Milk and dairy products (Table 10): There is still insufficient evidence for a risk relation between the intake of milk and dairy products and carcinomas in mouth/pharynx/larynx, esophagus, stomach and lung. There is probable evidence that increased intake of milk and dairy products can reduce the risk of colon cancer and possible evidence that it can reduce the risk of rectal cancer. The evidence for a risk relation between the intake of milk and dairy products and malignant tumours in ovary, endometrium and cervix is still insufficient. The available meta-analysis forms the basis for the assessment that there is possible evidence that increased intake of milk and dairy products reduces the risk of breast cancer. Despite the further findings indicating increased risk, the evidence that the increased intake of milk and dairy products increases the risk of prostate cancer is still assessed as possible due to the still highly speculative biological mechanisms involved.
Based on the improved data situation, there is possible evidence that increased intake of milk and dairy products reduces the risk of bladder cancer. Evidence for a risk relation be-tween the intake of milk and dairy products and malignant tumours of the kidney, pancreas, liver, gallbladder and skin is still considered to be insufficient.
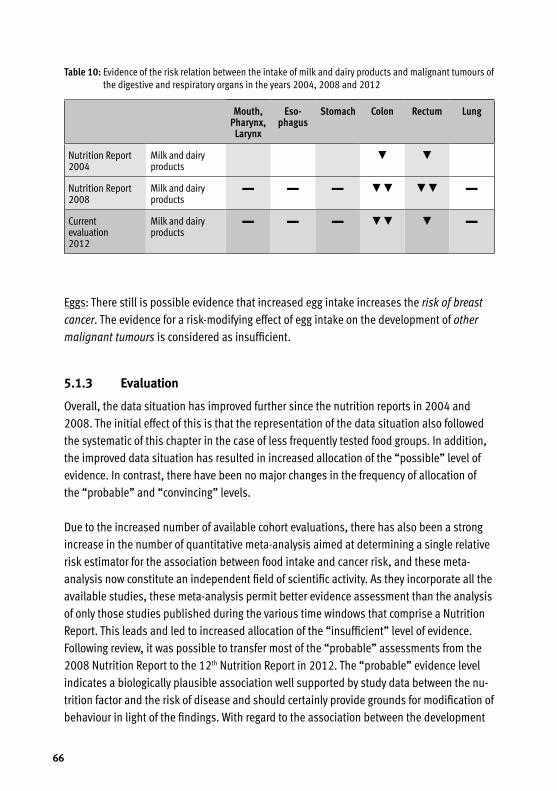
66
Eggs: There still is possible evidence that increased egg intake increases the risk of breast cancer. The evidence for a risk-modifying effect of egg intake on the development of other malignant tumours is considered as insufficient.
5.1.3 Evaluation
Overall, the data situation has improved further since the nutrition reports in 2004 and 2008. The initial effect of this is that the representation of the data situation also followed the systematic of this chapter in the case of less frequently tested food groups. In addition, the improved data situation has resulted in increased allocation of the “possible” level of evidence. In contrast, there have been no major changes in the frequency of allocation of the “probable” and “convincing” levels.
Due to the increased number of available cohort evaluations, there has also been a strong increase in the number of quantitative meta-analysis aimed at determining a single relative risk estimator for the association between food intake and cancer risk, and these meta -analysis now constitute an independent field of scientific activity. As they incorporate all the available studies, these meta-analysis permit better evidence assessment than the analysis of only those studies published during the various time windows that comprise a Nutrition Report. This leads and led to increased allocation of the “insufficient” level of evidence. Following review, it was possible to transfer most of the “probable” assessments from the 2008 Nutrition Report to the 12th Nutrition Report in 2012. The “probable” evidence level indicates a biologically plausible association well supported by study data between the nu-trition factor and the risk of disease and should certainly provide grounds for modification of behaviour in light of the findings. With regard to the association between the development
Table10: Evidence of the risk relation between the intake of milk and dairy products and malignant tumours of the digestive and respiratory organs in the years 2004, 2008 and 2012
Mouth,Pharynx,
Larynx
Eso-phagus
Stomach Colon Rectum Lung
Nutrition Report 2004
Milk and dairy products
▼ ▼
Nutrition Report 2008
Milk and dairy products
▬ ▬ ▬ ▼▼ ▼▼ ▬
Current evaluation 2012
Milk and dairy products
▬ ▬ ▬ ▼▼ ▼ ▬
67
of cancer and the nutrition factors that inhibit or promote this process, people are advised to change diet and include ample vegetables and fruit and moderate amounts of red meat and meat products (roughly 300 g to 600 g per week in line with the 10 dietary guidelines of the German Nutrition Society). What is additionally important for women is high-level intake of milk and dairy products to reduce the risk of colon cancer. Considering men, the “prob-able” reduced risk of colon cancer is tempered by the “possible” increased risk of prostate cancer. In addition, the evidence-based guideline on carbohydrate intake published by the German Nutrition Society indicates “probable” evidence that adequate amounts of cereal products with high dietary fibre content may reduce the risk of colon and rectal cancer.
5.2 Influence of phytochemicals on health
5.2.1 Methodology
In order to update the information in the 1996, 2004 and 2008 Nutrition Reports, a litera-ture search was performed for the last five years using the same key terms. The informa-tion outlines further developments with regard to carotenoids, phytosterols/phytostanols, glucosinolates, phytoestrogens and flavonoids. The report focuses on the presentation of updated and statistically verified data obtained from human studies.
5.2.2 Results
Carotenoids: Cross-sectional and prospective cohort studies provide numerous indications of a possible inverse relation between carotenoid intake and the occurrence of cancer and vascular changes. The available studies do not confirm any protective effect of carotenoids applied in isolation. This means there are still no data on the causal effect relationship and that it is therefore currently not possible to provide any definitive assessment of the health impacts of carotenoids as food ingredients.
Phytosterols: The regular intake of phytosterol-enriched foods increases the blood concen-tration of phytosterols by a factor of 1 to 2, but this is still within the physiological range. An intake of 0.5 g to 3 g of phytosterols a day significantly lowers the cholesterol concentration in the blood and is probably also associated with a reduced risk of cardiovascular disease.
The available human studies on the relationship between the phytosterol concentration in the blood and the risk of cardiovascular diseases paint a contradictory picture, however. All the studies on healthy persons indicate a risk-reducing effect of phytosterols. At the same time, several studies have found increased phytosterol concentrations in the blood
68
and in arteriosclerotic lesions precisely in people suffering from cardiovascular diseases. In the light of these findings, some scientists take a critical view of increased phytosterol in-take via enriched foods. In these patients, however, it might be the case that the increased phytosterol concentrations are due to the generally increased absorption of cholesterol and phytosterols. This means that phytosterols are not automatically associated with an increased risk of cardiovascular disease.
No study showed an increased risk of cardiovascular disease associated with the phyto-stanol concentration in the blood.
Glucosinolates: Epidemiological data indicate an inverse relation between glucosinolate intake and the risk of prostate, lung and colon cancer. Genetic factors relating to the meta-bolism of glucosinolates influence the protective potential of glucosinolates. The importance of glucosinolates for the prevention of cardiovascular diseases has not yet been sufficiently researched.
Phytoestrogens: A risk-reducing effect of an increased intake of soy isoflavones with regard to breast and prostate cancer has been verified in Asian countries but not in Western na-tions. Based on the effect on “biomarkers” like vascular endothelial function (FMD) and systolic blood pressure, the findings of the meta-analysis on the prevention of cardiovas-cular diseases indicate a protective effect of soy isoflavones. An effect on bone density and menopausal symptoms is still considered non-validated.
Flavonoids: On the basis of epidemiological studies it can be said that flavonoids ingested via food are associated with a reduced risk of cardiovascular disease and certain forms of cancer (lung, colon). However, the magnitude of this effect is determined by lifestyle fac-tors like smoking and obesity. The data stock from controlled intervention studies on the effect of individual flavonoids (e.g. on endothelial function, thrombocyte aggregation, blood pressure, blood lipid profile, anti-inflammatory effect) is still weak. Numerous intervention studies have been conducted using flavonoid-rich food (tea, chocolate, cocoa, grape seed extract, wine) but do not allow any statements on the causal effect of flavonoids. Overall, the studies conducted to date suggest a preventive potential of flavonoids, but no clear-cut assessment is possible due to the paucity of data from intervention studies.
69
5.2.3 Evaluation
Due to the broadly based findings of studies with different experimental approaches, it is today generally possible to assess the scientific data situation regarding the preventive effect of phytochemicals. One qualification, however, is that many data are from epide-miological studies in which the phytochemicals were ingested via conventional foods. The observed preventive effects may therefore have been mobilised by the complex spectrum of nutrients (energy-supplying nutrients, vitamins and minerals), dietary fibre and phyto-chemicals contained in food plants. This does not allow us to determine the extent to which the health-promoting effect is attributable to individual phytochemicals or certain patterns of phytochemicals. This requires intervention studies using isolated phytochemicals, and the number of such studies is inadequate to date. Up to the present, no single phytochemi-cal has been identified that, on its own and in physiologically relevant concentrations, influences the risk of disease. Although the EFSA Health Claims confirm that foods enriched with phytosterols and phytostanols reduce cholesterol concentration, there is still no scien-tific evidence that these substances reduce the risk of disease. Moreover, it is unclear from a scientific point of view whether the two substance groups have comparable effects or if phytosterols and phytostanols might not have opposite effects.
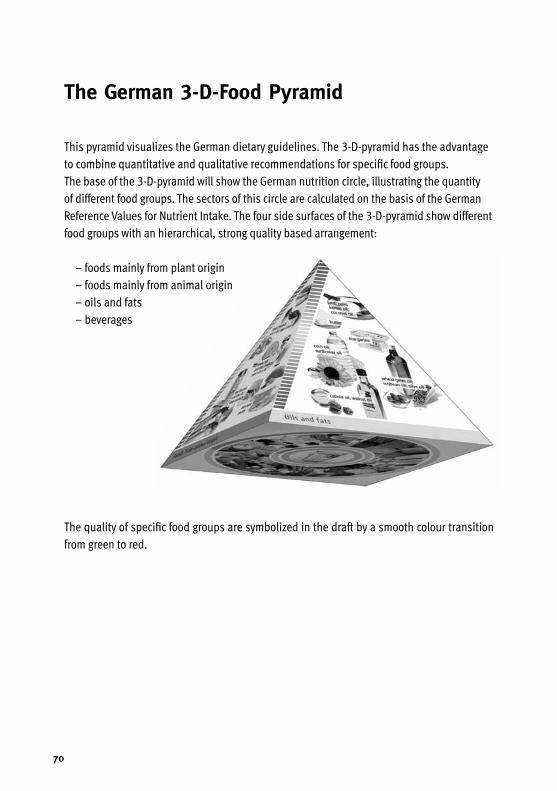
70
The German 3-D-Food Pyramid
This pyramid visualizes the German dietary guidelines. The 3-D-pyramid has the advantage to combine quantitative and qualitative recommendations for specific food groups.The base of the 3-D-pyramid will show the German nutrition circle, illustrating the quantity of different food groups. The sectors of this circle are calculated on the basis of the German Reference Values for Nutrient Intake. The four side surfaces of the 3-D-pyramid show different food groups with an hierarchical, strong quality based arrangement:
– foods mainly from plant origin– foods mainly from animal origin– oils and fats– beverages
The quality of specific food groups are symbolized in the draft by a smooth colour transition from green to red.

71
German Nutrition Societywww.dge.de

www.dge.de
![W J B C World Journal of · of lipid peroxidation[9]. At present, the German Society of Nutrition (Deutsche Gesellschaft für Ernährung) recommends a daily vitamin E intake of 12](https://img.pdfslide.us/doc/110x75/5e8fedf3b79f69146b75902d/w-j-b-c-world-journal-of-of-lipid-peroxidation9-at-present-the-german-society.jpg)