Embed Size (px)
DESCRIPTION
Â
Citation preview
Samuel A. Quinn and Nicholas P. Lapham
2012 Conservation Work Summary
P a g e | 1
0
10
20
30
40
50
60
EnvironmentalMonitoring
BiodiversityAssessment
ConservationManagement
Wild ProductSales
% o
f la
bo
r
2011 2012
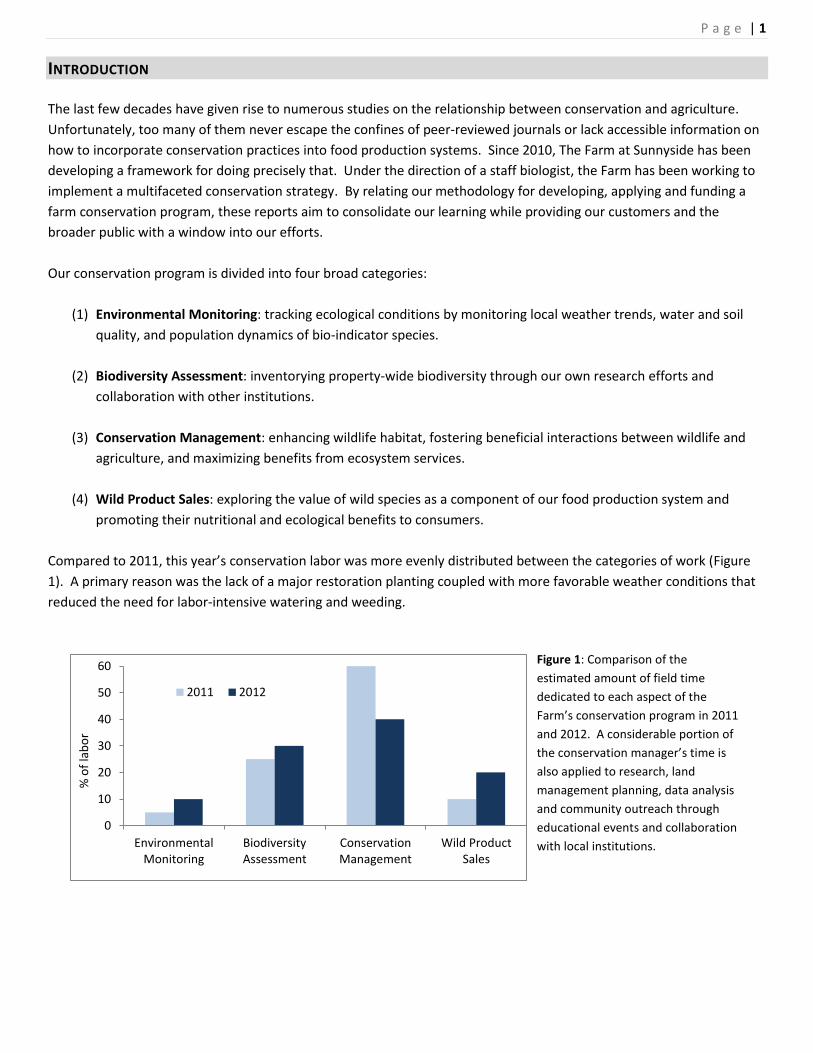
Figure 1: Comparison of the
estimated amount of field time
dedicated to each aspect of the
Farm’s conservation program in 2011
and 2012. A considerable portion of
the conservation manager’s time is
also applied to research, land
management planning, data analysis
and community outreach through
educational events and collaboration
with local institutions.
INTRODUCTION
The last few decades have given rise to numerous studies on the relationship between conservation and agriculture.
Unfortunately, too many of them never escape the confines of peer-reviewed journals or lack accessible information on
how to incorporate conservation practices into food production systems. Since 2010, The Farm at Sunnyside has been
developing a framework for doing precisely that. Under the direction of a staff biologist, the Farm has been working to
implement a multifaceted conservation strategy. By relating our methodology for developing, applying and funding a
farm conservation program, these reports aim to consolidate our learning while providing our customers and the
broader public with a window into our efforts.
Our conservation program is divided into four broad categories:
(1) Environmental Monitoring: tracking ecological conditions by monitoring local weather trends, water and soil
quality, and population dynamics of bio-indicator species.
(2) Biodiversity Assessment: inventorying property-wide biodiversity through our own research efforts and
collaboration with other institutions.
(3) Conservation Management: enhancing wildlife habitat, fostering beneficial interactions between wildlife and
agriculture, and maximizing benefits from ecosystem services.
(4) Wild Product Sales: exploring the value of wild species as a component of our food production system and
promoting their nutritional and ecological benefits to consumers.
Compared to 2011, this year’s conservation labor was more evenly distributed between the categories of work (Figure
1). A primary reason was the lack of a major restoration planting coupled with more favorable weather conditions that
reduced the need for labor-intensive watering and weeding.
P a g e | 2
BACKGROUND
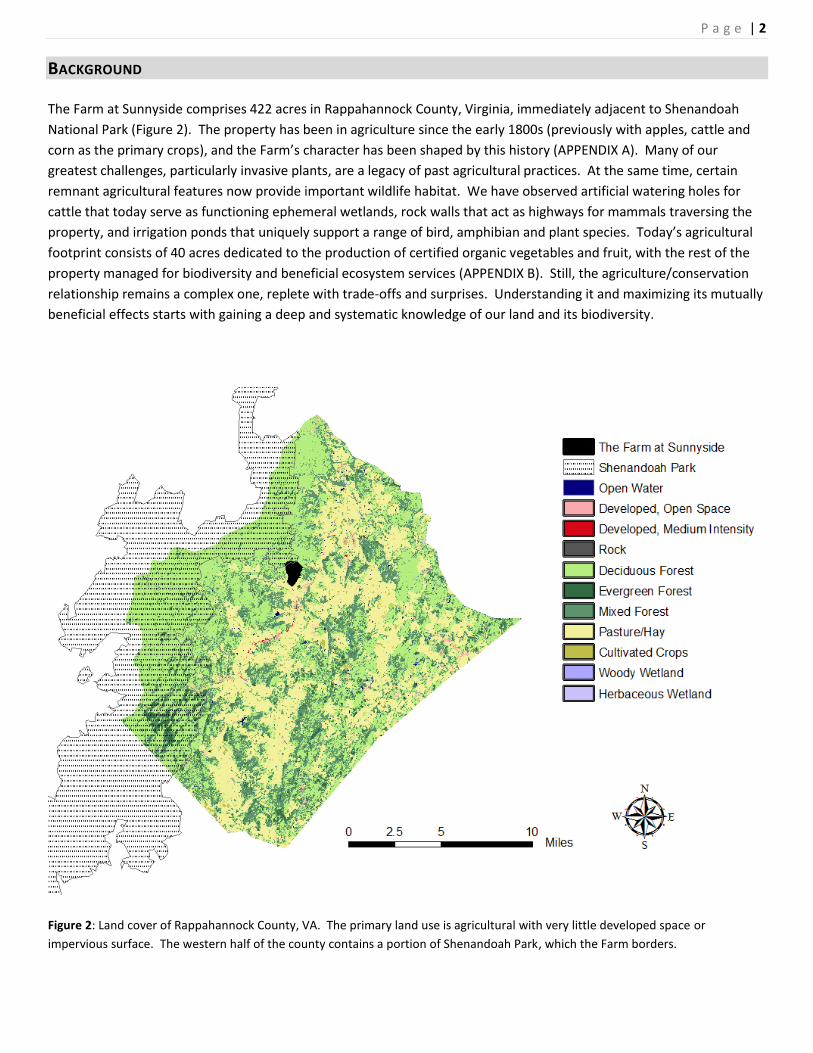
The Farm at Sunnyside comprises 422 acres in Rappahannock County, Virginia, immediately adjacent to Shenandoah
National Park (Figure 2). The property has been in agriculture since the early 1800s (previously with apples, cattle and
corn as the primary crops), and the Farm’s character has been shaped by this history (APPENDIX A). Many of our
greatest challenges, particularly invasive plants, are a legacy of past agricultural practices. At the same time, certain
remnant agricultural features now provide important wildlife habitat. We have observed artificial watering holes for
cattle that today serve as functioning ephemeral wetlands, rock walls that act as highways for mammals traversing the
property, and irrigation ponds that uniquely support a range of bird, amphibian and plant species. Today’s agricultural
footprint consists of 40 acres dedicated to the production of certified organic vegetables and fruit, with the rest of the
property managed for biodiversity and beneficial ecosystem services (APPENDIX B). Still, the agriculture/conservation
relationship remains a complex one, replete with trade-offs and surprises. Understanding it and maximizing its mutually
beneficial effects starts with gaining a deep and systematic knowledge of our land and its biodiversity.
Figure 2: Land cover of Rappahannock County, VA. The primary land use is agricultural with very little developed space or
impervious surface. The western half of the county contains a portion of Shenandoah Park, which the Farm borders.
P a g e | 3
ENVIRONMENTAL MONITORING
GOAL: To assess, analyze and monitor abiotic (e.g. water quality and weather patterns) and biotic
(e.g. bio-indicator populations) environmental conditions. Understanding and tracking such conditions
is fundamental to gauging the Farm’s ecological health and provides important data necessary to inform
and enhance agricultural activities.
Weather. We continued to monitor air temperature, precipitation, wind speed and other weather variables in 2012 and
post real time data at www.weatherlink.com/user/sunnyside. This year, we experienced an exceptionally warm and dry
winter and early spring with temperatures in February and March 7o F above average with just half the standard
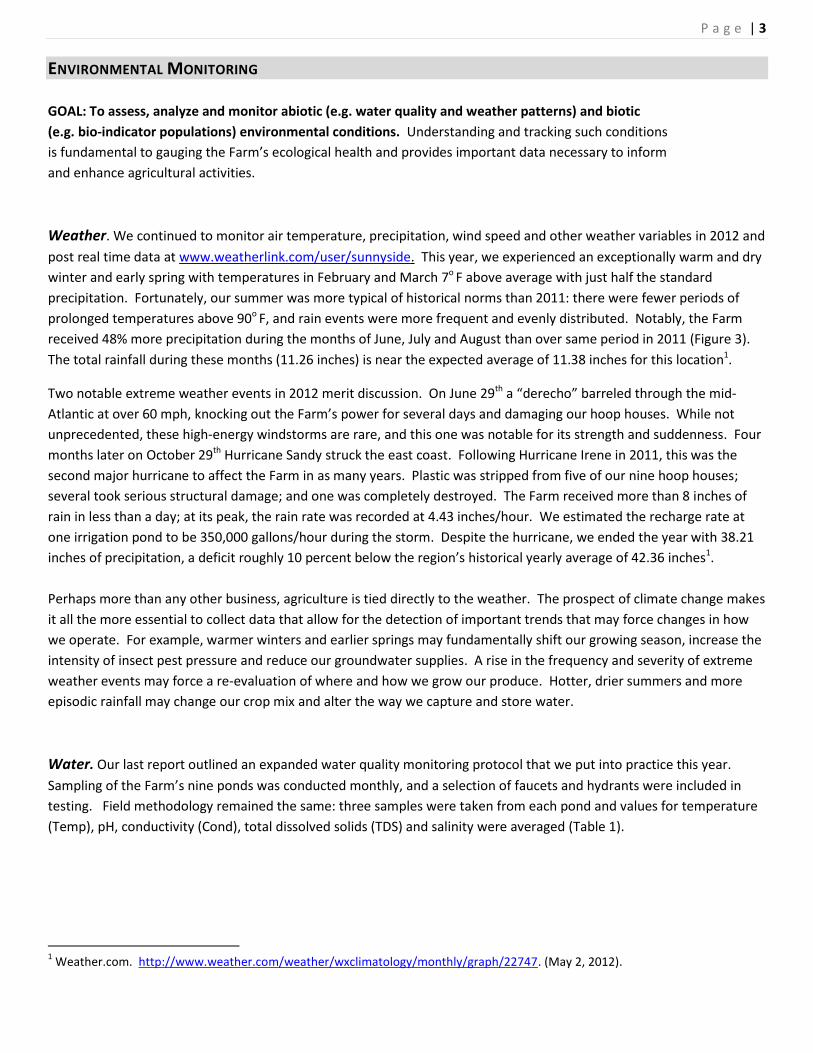
precipitation. Fortunately, our summer was more typical of historical norms than 2011: there were fewer periods of
prolonged temperatures above 90o F, and rain events were more frequent and evenly distributed. Notably, the Farm
received 48% more precipitation during the months of June, July and August than over same period in 2011 (Figure 3).
The total rainfall during these months (11.26 inches) is near the expected average of 11.38 inches for this location1.
Two notable extreme weather events in 2012 merit discussion. On June 29th a “derecho” barreled through the mid-
Atlantic at over 60 mph, knocking out the Farm’s power for several days and damaging our hoop houses. While not
unprecedented, these high-energy windstorms are rare, and this one was notable for its strength and suddenness. Four
months later on October 29th Hurricane Sandy struck the east coast. Following Hurricane Irene in 2011, this was the
second major hurricane to affect the Farm in as many years. Plastic was stripped from five of our nine hoop houses;
several took serious structural damage; and one was completely destroyed. The Farm received more than 8 inches of
rain in less than a day; at its peak, the rain rate was recorded at 4.43 inches/hour. We estimated the recharge rate at
one irrigation pond to be 350,000 gallons/hour during the storm. Despite the hurricane, we ended the year with 38.21
inches of precipitation, a deficit roughly 10 percent below the region’s historical yearly average of 42.36 inches1.
Perhaps more than any other business, agriculture is tied directly to the weather. The prospect of climate change makes
it all the more essential to collect data that allow for the detection of important trends that may force changes in how
we operate. For example, warmer winters and earlier springs may fundamentally shift our growing season, increase the
intensity of insect pest pressure and reduce our groundwater supplies. A rise in the frequency and severity of extreme
weather events may force a re-evaluation of where and how we grow our produce. Hotter, drier summers and more
episodic rainfall may change our crop mix and alter the way we capture and store water.
Water. Our last report outlined an expanded water quality monitoring protocol that we put into practice this year.
Sampling of the Farm’s nine ponds was conducted monthly, and a selection of faucets and hydrants were included in
testing. Field methodology remained the same: three samples were taken from each pond and values for temperature
(Temp), pH, conductivity (Cond), total dissolved solids (TDS) and salinity were averaged (Table 1).
1 Weather.com. http://www.weather.com/weather/wxclimatology/monthly/graph/22747. (May 2, 2012).
P a g e | 4
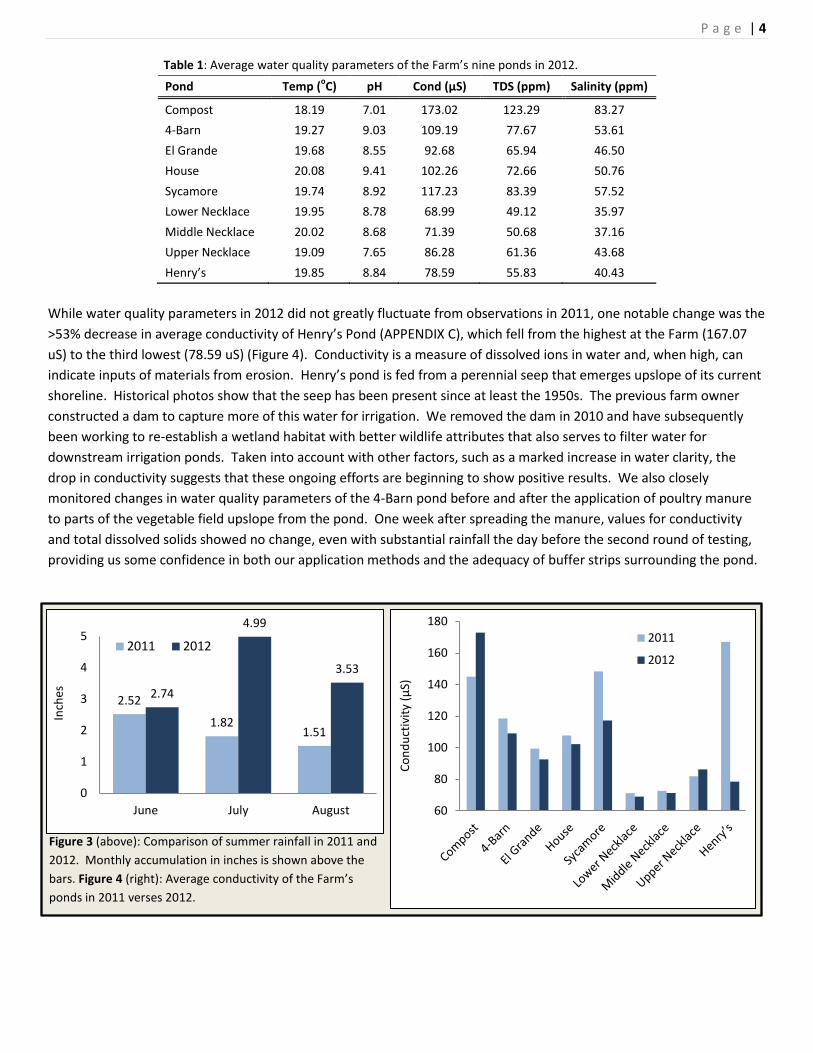
Table 1: Average water quality parameters of the Farm’s nine ponds in 2012.
Pond Temp (oC) pH Cond (µS) TDS (ppm) Salinity (ppm)
Compost 18.19 7.01 173.02 123.29 83.27
4-Barn 19.27 9.03 109.19 77.67 53.61
El Grande 19.68 8.55 92.68 65.94 46.50
House 20.08 9.41 102.26 72.66 50.76
Sycamore 19.74 8.92 117.23 83.39 57.52
Lower Necklace 19.95 8.78 68.99 49.12 35.97
Middle Necklace 20.02 8.68 71.39 50.68 37.16
Upper Necklace 19.09 7.65 86.28 61.36 43.68
Henry’s 19.85 8.84 78.59 55.83 40.43
While water quality parameters in 2012 did not greatly fluctuate from observations in 2011, one notable change was the
>53% decrease in average conductivity of Henry’s Pond (APPENDIX C), which fell from the highest at the Farm (167.07
uS) to the third lowest (78.59 uS) (Figure 4). Conductivity is a measure of dissolved ions in water and, when high, can
indicate inputs of materials from erosion. Henry’s pond is fed from a perennial seep that emerges upslope of its current
shoreline. Historical photos show that the seep has been present since at least the 1950s. The previous farm owner
constructed a dam to capture more of this water for irrigation. We removed the dam in 2010 and have subsequently
been working to re-establish a wetland habitat with better wildlife attributes that also serves to filter water for
downstream irrigation ponds. Taken into account with other factors, such as a marked increase in water clarity, the
drop in conductivity suggests that these ongoing efforts are beginning to show positive results. We also closely
monitored changes in water quality parameters of the 4-Barn pond before and after the application of poultry manure
to parts of the vegetable field upslope from the pond. One week after spreading the manure, values for conductivity
and total dissolved solids showed no change, even with substantial rainfall the day before the second round of testing,
providing us some confidence in both our application methods and the adequacy of buffer strips surrounding the pond.
2.52
1.82 1.51
2.74
4.99
3.53
0
1
2
3
4
5
June July August
Inch
es
2011 2012
60
80
100
120
140
160
180
Co
nd
uct
ivit
y (µ
S)
2011
2012
Figure 3 (above): Comparison of summer rainfall in 2011 and
2012. Monthly accumulation in inches is shown above the
bars. Figure 4 (right): Average conductivity of the Farm’s
ponds in 2011 verses 2012.
P a g e | 5
Bio-indicators. Some species, or assemblages of species, can be used to monitor the health of their environment. The
use of indicator species to assess ecosystem integrity, particularly in aquatic habitats, is in many ways superior to
tracking changes in abiotic chemical variables. Taxa such as benthic macro-invertebrates and salamanders are always
present in streams and are subject to any fluctuations in water quality throughout the year which may be missed by
periodic water sampling. Salamanders are strong bio-indicators of stream health because they are sensitive to
fluctuations in the environment, easy to sample and abundant enough to provide statistically meaningful data.
Stream salamander surveys were conducted in June and September at eight sites distributed across the two streams
that flow through the Farm (APPENDIX D). In total, 168 individuals were recorded among six species (Table 2). As in
2011, northern dusky salamanders (Desmognathus fuscus) were by far the most common, comprising 81.5% of all
captures. While survey data of green frogs (Lithobates clamitans), pickerel frogs (Lithobates palustris) and eastern
spotted newts (Notophthalmus viridescens) are included, these species are not considered to be bio-indicators of stream
health in this circumstance because of their ability to leave streams when conditions become unfavorable. A notable
change from last year was the observation of three stream salamanders at site 7, located at the southern end of the
Western Stream, and at site 8 in the Outlet Stream of the Lower Necklace Pond (APPENDIX C). Salamanders had not
previously been recorded at these sites in the last two years of surveys, and notably, one of the individuals found in the
Outlet Stream was a juvenile northern spring salamander (Gyrinophilus porphyriticus), a particularly habitat-sensitive
species that had to this point only been observed in the forested stream segments of the property.
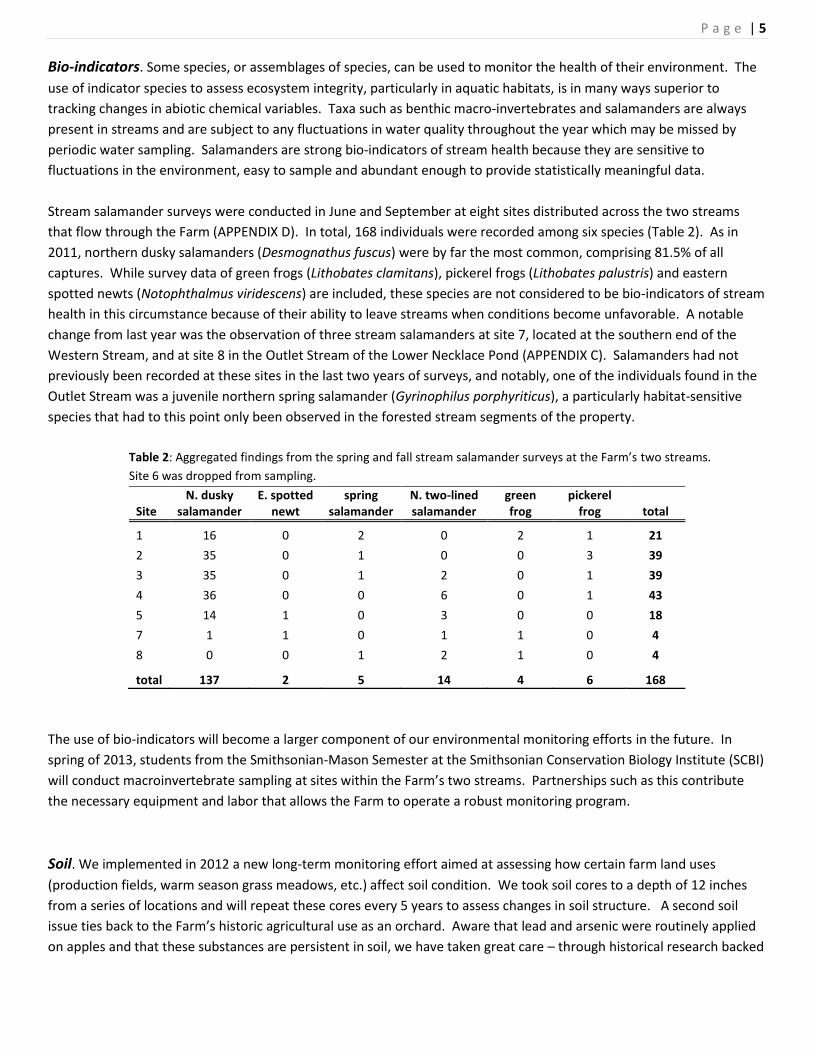
Table 2: Aggregated findings from the spring and fall stream salamander surveys at the Farm’s two streams.
Site 6 was dropped from sampling.
Site N. dusky
salamander E. spotted
newt spring
salamander N. two-lined salamander
green frog
pickerel frog total
1 16 0 2 0 2 1 21
2 35 0 1 0 0 3 39
3 35 0 1 2 0 1 39
4 36 0 0 6 0 1 43
5 14 1 0 3 0 0 18
7 1 1 0 1 1 0 4
8 0 0 1 2 1 0 4
total 137 2 5 14 4 6 168
The use of bio-indicators will become a larger component of our environmental monitoring efforts in the future. In
spring of 2013, students from the Smithsonian-Mason Semester at the Smithsonian Conservation Biology Institute (SCBI)
will conduct macroinvertebrate sampling at sites within the Farm’s two streams. Partnerships such as this contribute
the necessary equipment and labor that allows the Farm to operate a robust monitoring program.
Soil. We implemented in 2012 a new long-term monitoring effort aimed at assessing how certain farm land uses
(production fields, warm season grass meadows, etc.) affect soil condition. We took soil cores to a depth of 12 inches
from a series of locations and will repeat these cores every 5 years to assess changes in soil structure. A second soil
issue ties back to the Farm’s historic agricultural use as an orchard. Aware that lead and arsenic were routinely applied
on apples and that these substances are persistent in soil, we have taken great care – through historical research backed

P a g e | 6
up with rigorous soil testing – to ensure that our production areas were not sprayed with these materials and are free of
contamination. What we’ve determined is that the parts of the property potentially subject to such contamination are
no longer farmed and now largely in a state of early succession forest (APPENDICES A and B). While we are confident
that such contamination would therefore not present a health threat, we would still like to know if it exists and if so
whether it is having any localized ecological effects, e.g. on vegetative structure, amphibian populations, etc.
Accordingly, we plan to keep testing a few spots each year to see what we find.
P a g e | 7
BIODIVERSITY ASSESSMENT
GOAL: To comprehensively inventory the full range of biodiversity present on the Farm. In this way,
we aim to establish a robust baseline of species occurrence from which we can monitor change over
time, make certain assumptions about habitat diversity and quality and set conservation priorities.
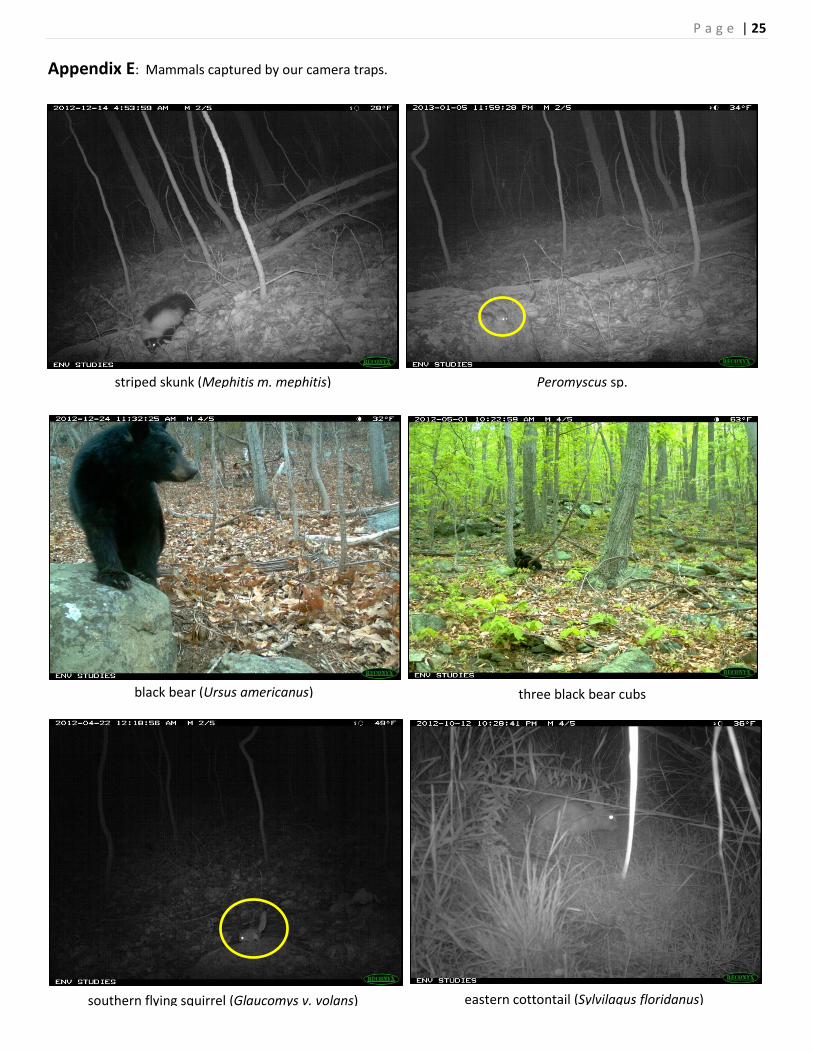
Mammals. We continued our camera trapping protocol to sample mammal diversity using the same methodology as
the previous year: with three stationary cameras2 and one mobile camera moved at regular intervals to different habitat
features on the property. Our camera trapping work is part of an initiative coordinated with Environmental Studies on
the Piedmont to sample mammal diversity on private lands throughout the region. As with last year, these cameras
have documented black bear (Ursus americanus), bobcat (Lynx rufus), coyote (Canis latrans), white-tailed deer
(Odocoileus virginianus), grey squirrel (Sciurus niger), opossum (Didelphis virginiana), and raccoon (Procyon lotor). Three
new species were photographed by the stationary cameras in 2012: southern flying squirrel (Glaucomys v. volans),
striped skunk (Mephitis m. mephitis) and a species of Peromyscus mouse (APPENDIX E).
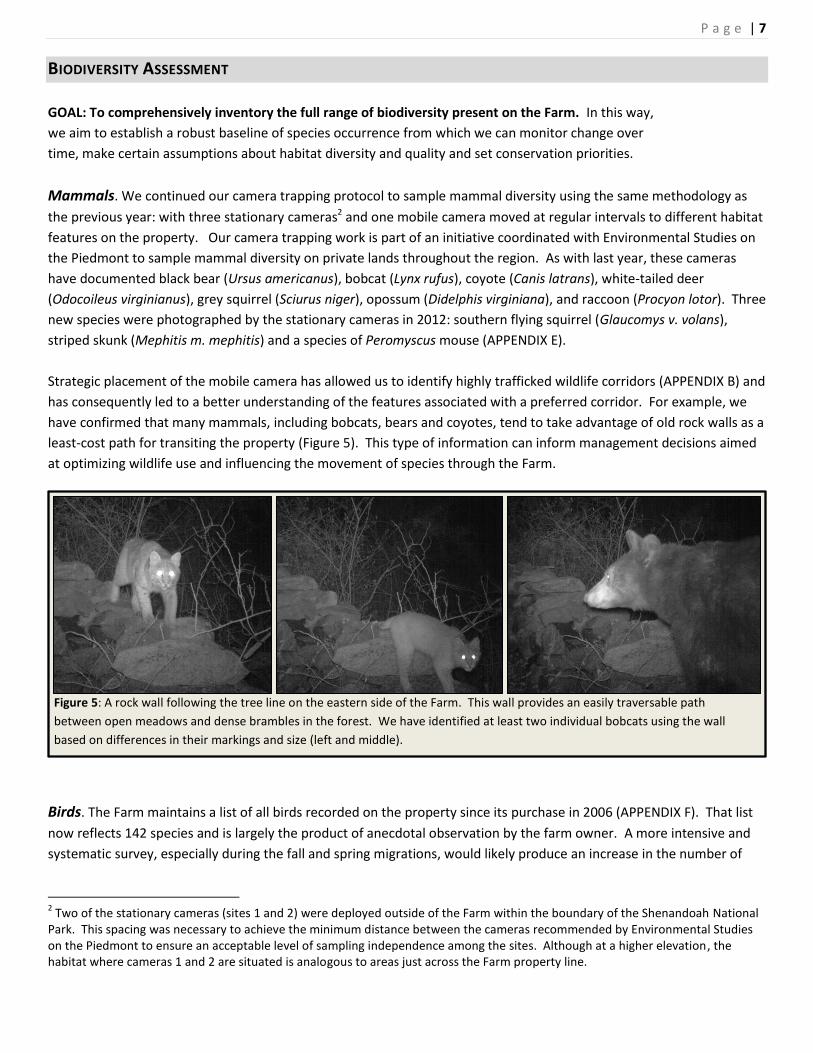
Strategic placement of the mobile camera has allowed us to identify highly trafficked wildlife corridors (APPENDIX B) and
has consequently led to a better understanding of the features associated with a preferred corridor. For example, we
have confirmed that many mammals, including bobcats, bears and coyotes, tend to take advantage of old rock walls as a
least-cost path for transiting the property (Figure 5). This type of information can inform management decisions aimed
at optimizing wildlife use and influencing the movement of species through the Farm.
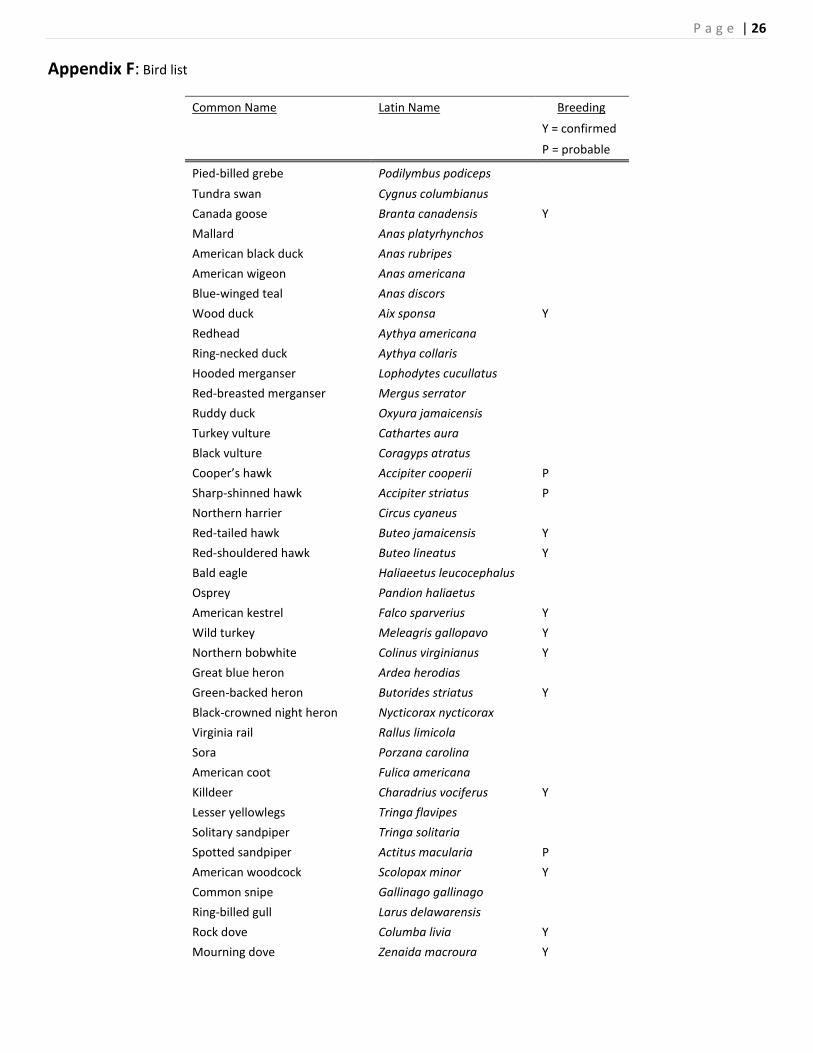
Birds. The Farm maintains a list of all birds recorded on the property since its purchase in 2006 (APPENDIX F). That list
now reflects 142 species and is largely the product of anecdotal observation by the farm owner. A more intensive and
systematic survey, especially during the fall and spring migrations, would likely produce an increase in the number of
2 Two of the stationary cameras (sites 1 and 2) were deployed outside of the Farm within the boundary of the Shenandoah National
Park. This spacing was necessary to achieve the minimum distance between the cameras recommended by Environmental Studies on the Piedmont to ensure an acceptable level of sampling independence among the sites. Although at a higher elevation, the habitat where cameras 1 and 2 are situated is analogous to areas just across the Farm property line.
Figure 5: A rock wall following the tree line on the eastern side of the Farm. This wall provides an easily traversable path
between open meadows and dense brambles in the forest. We have identified at least two individual bobcats using the wall
based on differences in their markings and size (left and middle).
P a g e | 8
wood warblers, flycatchers, thrushes and certain other species that could reasonably be expected to occur here. A few
highlights:
Northern bobwhite (Colinus virginianus) continue to expand their use of the Farm’s improved grasslands and
hedgerows. 2012 saw the largest number of singing males yet recorded (six).
The orchards have proven once again to be a favored spot for whip-poor-wills (Caprimulgus vociferus) and
American woodcock (Scolopax minor), demonstrating how production areas can also provide valuable habitat.
An adult and immature bald eagle (Haliaeetus leucocephalus) were observed feeding on deer gutpiles this fall,
reinforcing the Farm’s policy of mandating lead-free ammunition.
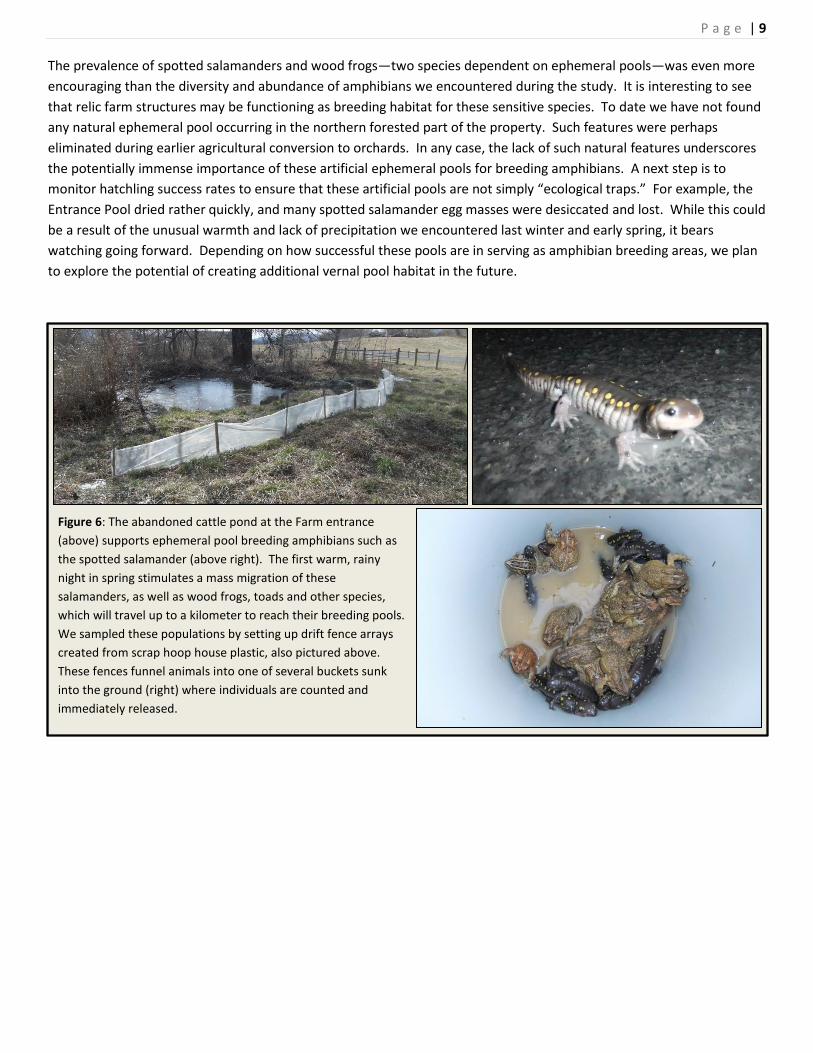
Amphibians. In the spring of 2011 we identified three locations at the Farm that appeared to be ephemeral pools—
temporarily flooded wetlands needed by many amphibians for reproduction (APPENDIX G). These features were all
artifacts from historic land uses at the Farm: abandoned cattle watering holes at the farm entrance and in the wooded
corridor west of the Stable Fields, and the third a shallow cistern around a natural spring. In February we established
drift fence arrays at each site to ascertain if amphibians were using the pools to breed (Figure 6). We constructed the
fences using waste from the farm: broken wooden stakes to frame the fence wall made from scrap greenhouse plastic.
At either end and in the center of each wall a 5 gallon bucket was buried to ground level so that amphibians attempting
to circumvent the wall would fall into the bucket to be easily counted. Buckets were left open on rainy or humid nights
above 45o.
In total, 284 individuals were captured among nine species over six trap nights (Table 3). Spotted salamanders
(Ambystoma maculatum) accounted for 44.4% (n = 126) of all captures, followed by wood frogs (Lithobates sylvatica) at
28.5% (n = 81) and American toads (Anaxyrus americanus) at 19% (n = 54). All other species’ capture rates were below
5%. Most of the individuals (183) were recorded at the Entrance Pool, and only five were observed at the Corridor Pool,
three of these being spotted salamanders. The Cistern Pool supported the greatest diversity of species with seven of the
nine recorded species present. We counted spotted salamander egg masses at each site on March 26th after the main
breeding period concluded and recorded 68 egg masses in the Entrance Pool, 45 in the Cistern Pool and none in the
Corridor Pool. Three egg masses were also found in a small, apparently natural ephemeral pool in a small wooded patch
east of the House Pond (APPENDIX G). Another two egg masses were found in Henry’s Pond for a total of 118 across the
property.
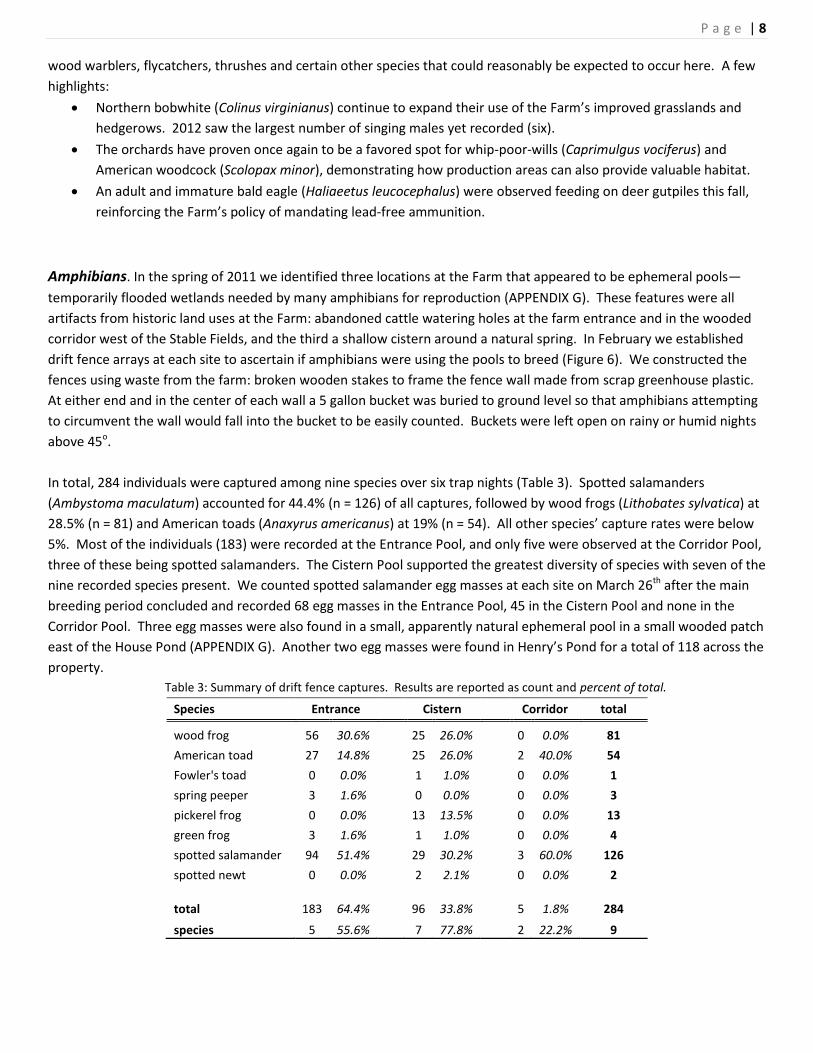
Table 3: Summary of drift fence captures. Results are reported as count and percent of total.
Species Entrance Cistern Corridor total
wood frog 56 30.6% 25 26.0% 0 0.0% 81
American toad 27 14.8% 25 26.0% 2 40.0% 54
Fowler's toad 0 0.0% 1 1.0% 0 0.0% 1
spring peeper 3 1.6% 0 0.0% 0 0.0% 3
pickerel frog 0 0.0% 13 13.5% 0 0.0% 13
green frog 3 1.6% 1 1.0% 0 0.0% 4
spotted salamander 94 51.4% 29 30.2% 3 60.0% 126
spotted newt 0 0.0% 2 2.1% 0 0.0% 2
total 183 64.4% 96 33.8% 5 1.8% 284
species 5 55.6% 7 77.8% 2 22.2% 9
P a g e | 9
The prevalence of spotted salamanders and wood frogs—two species dependent on ephemeral pools—was even more
encouraging than the diversity and abundance of amphibians we encountered during the study. It is interesting to see
that relic farm structures may be functioning as breeding habitat for these sensitive species. To date we have not found
any natural ephemeral pool occurring in the northern forested part of the property. Such features were perhaps
eliminated during earlier agricultural conversion to orchards. In any case, the lack of such natural features underscores
the potentially immense importance of these artificial ephemeral pools for breeding amphibians. A next step is to
monitor hatchling success rates to ensure that these artificial pools are not simply “ecological traps.” For example, the
Entrance Pool dried rather quickly, and many spotted salamander egg masses were desiccated and lost. While this could
be a result of the unusual warmth and lack of precipitation we encountered last winter and early spring, it bears
watching going forward. Depending on how successful these pools are in serving as amphibian breeding areas, we plan
to explore the potential of creating additional vernal pool habitat in the future.
Figure 6: The abandoned cattle pond at the Farm entrance
(above) supports ephemeral pool breeding amphibians such as
the spotted salamander (above right). The first warm, rainy
night in spring stimulates a mass migration of these
salamanders, as well as wood frogs, toads and other species,
which will travel up to a kilometer to reach their breeding pools.
We sampled these populations by setting up drift fence arrays
created from scrap hoop house plastic, also pictured above.
These fences funnel animals into one of several buckets sunk
into the ground (right) where individuals are counted and
immediately released.
P a g e | 10
Turtles. This year we greatly stepped up our efforts to monitor turtle populations. Of particular interest are eastern box
turtles (Terrapene carolina), rated Tier III (high conservation need) in the Virginia Wildlife Action Plan3, and aquatic
turtles, which can play a considerable role in the ecology of irrigation ponds. Due to the eastern box turtle’s
conservation significance, we feel that a long-term population study is warranted. This small, unassuming turtle is also
one of the longest-lived animals in our region with some individuals on record in excess of 100 years old4. As of August
2012, we have marked (or “notched”) eight eastern box turtles by filing a small, unique code into their shells. Several
turtles have been observed on multiple occasions, and we hope to eventually collect enough data to begin estimating
home range sizes, demographics and other population parameters.
Aquatic turtles are a key component of pond ecosystems and can significantly affect the ecology of ponds used for
agricultural purposes. The diet of a typical pond turtle such as the common snapping turtle (Chelydra serpentina) (Figure
7) or the eastern painted turtle (Chrysemys picta) is approximately 50% plant matter, much of this being detritus. These
species also eat carrion and may therefore help maintain water quality in irrigation ponds. Common snapping turtles
can also be significant predators on fledgling waterfowl. For these and other reasons, we felt it important to build a
more quantitative understanding of the Farm’s aquatic turtle populations.
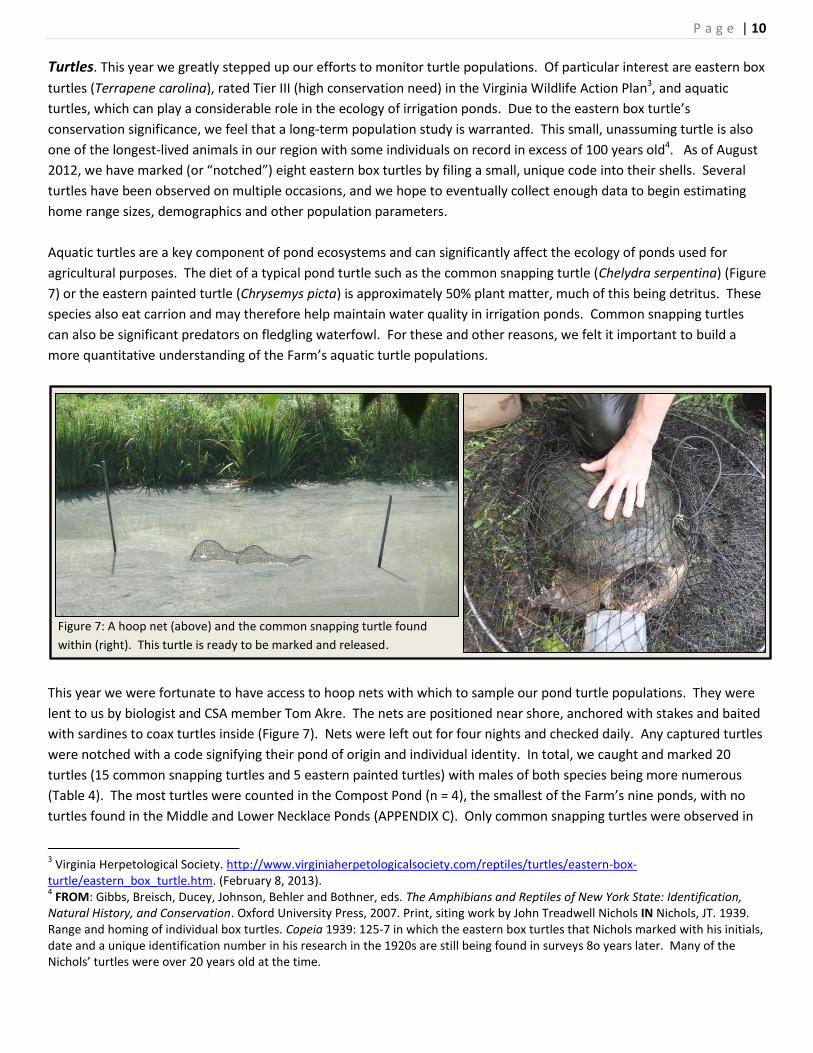
This year we were fortunate to have access to hoop nets with which to sample our pond turtle populations. They were
lent to us by biologist and CSA member Tom Akre. The nets are positioned near shore, anchored with stakes and baited
with sardines to coax turtles inside (Figure 7). Nets were left out for four nights and checked daily. Any captured turtles
were notched with a code signifying their pond of origin and individual identity. In total, we caught and marked 20
turtles (15 common snapping turtles and 5 eastern painted turtles) with males of both species being more numerous
(Table 4). The most turtles were counted in the Compost Pond (n = 4), the smallest of the Farm’s nine ponds, with no
turtles found in the Middle and Lower Necklace Ponds (APPENDIX C). Only common snapping turtles were observed in
3 Virginia Herpetological Society. http://www.virginiaherpetologicalsociety.com/reptiles/turtles/eastern-box-
turtle/eastern_box_turtle.htm. (February 8, 2013). 4 FROM: Gibbs, Breisch, Ducey, Johnson, Behler and Bothner, eds. The Amphibians and Reptiles of New York State: Identification,
Natural History, and Conservation. Oxford University Press, 2007. Print, siting work by John Treadwell Nichols IN Nichols, JT. 1939. Range and homing of individual box turtles. Copeia 1939: 125-7 in which the eastern box turtles that Nichols marked with his initials, date and a unique identification number in his research in the 1920s are still being found in surveys 8o years later. Many of the Nichols’ turtles were over 20 years old at the time.
Figure 7: A hoop net (above) and the common snapping turtle found
within (right). This turtle is ready to be marked and released.
P a g e | 11
the Compost Pond, which corresponds to this species’ preference for deep, mucky substrates. It is possible that eastern
painted turtles are limited by a lack of basking space, so we plan to create artificial basking areas next year.
Table 4: Summary of aquatic turtle captures at the Farm’s nine ponds.
Common Snapping Eastern Painted
Pond total M F total M F
Compost 4 2 2 0 0 0
4-Barn 2 2 0 1 1 0
El Grande 3 3 0 1 1 0
House 3 2 1 2 2 0
Sycamore 0 0 0 1 0 1
Lower Necklace 0 0 0 0 0 0
Middle Necklace 0 0 0 0 0 0
Upper Necklace 1 0 1 0 0 0
Henry's 2 2 0 0 0 0
total 15 11 4 5 4 1
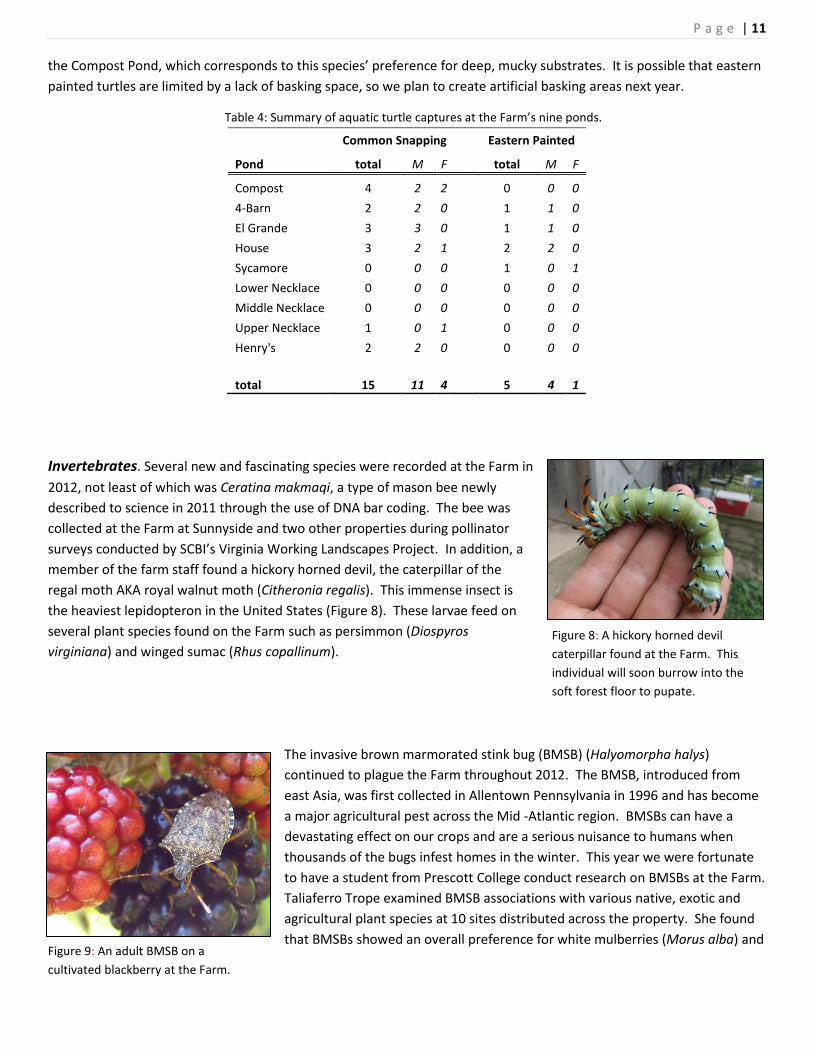
Invertebrates. Several new and fascinating species were recorded at the Farm in
2012, not least of which was Ceratina makmaqi, a type of mason bee newly
described to science in 2011 through the use of DNA bar coding. The bee was
collected at the Farm at Sunnyside and two other properties during pollinator
surveys conducted by SCBI’s Virginia Working Landscapes Project. In addition, a
member of the farm staff found a hickory horned devil, the caterpillar of the
regal moth AKA royal walnut moth (Citheronia regalis). This immense insect is
the heaviest lepidopteron in the United States (Figure 8). These larvae feed on
several plant species found on the Farm such as persimmon (Diospyros
virginiana) and winged sumac (Rhus copallinum).
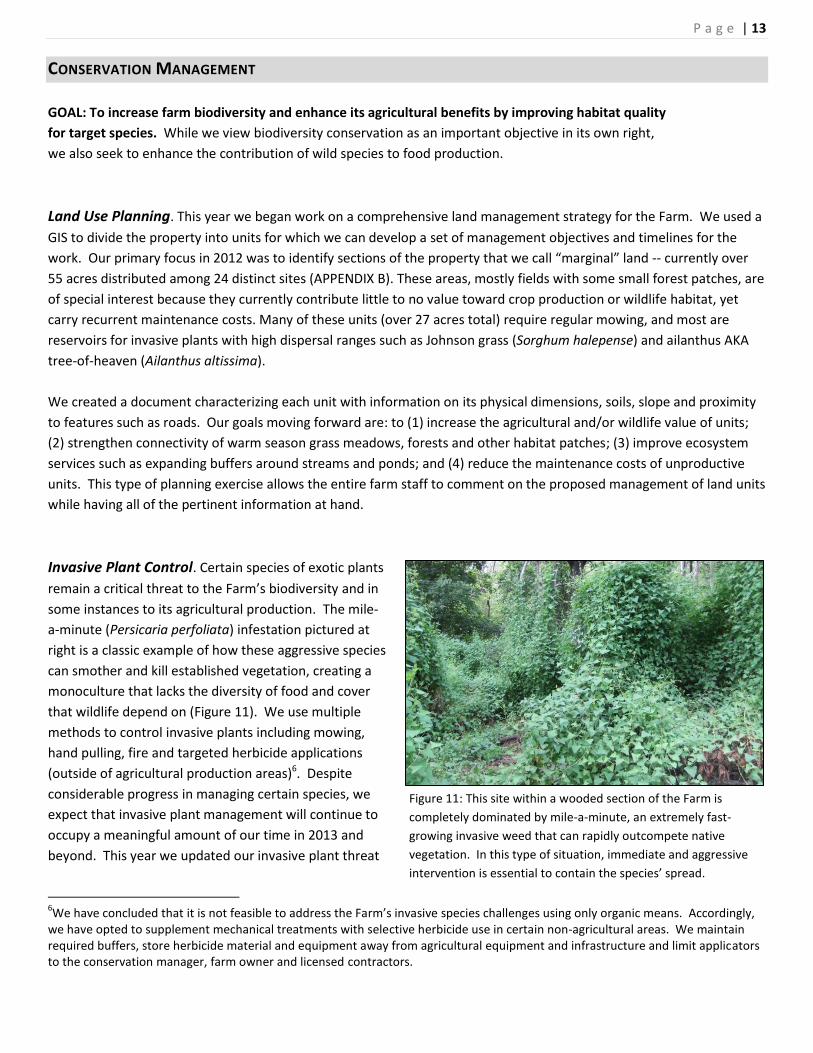
The invasive brown marmorated stink bug (BMSB) (Halyomorpha halys)
continued to plague the Farm throughout 2012. The BMSB, introduced from
east Asia, was first collected in Allentown Pennsylvania in 1996 and has become
a major agricultural pest across the Mid -Atlantic region. BMSBs can have a
devastating effect on our crops and are a serious nuisance to humans when
thousands of the bugs infest homes in the winter. This year we were fortunate
to have a student from Prescott College conduct research on BMSBs at the Farm.
Taliaferro Trope examined BMSB associations with various native, exotic and
agricultural plant species at 10 sites distributed across the property. She found
that BMSBs showed an overall preference for white mulberries (Morus alba) and
Figure 8: A hickory horned devil
caterpillar found at the Farm. This
individual will soon burrow into the
soft forest floor to pupate.
Figure 9: An adult BMSB on a
cultivated blackberry at the Farm.

P a g e | 12
both agricultural and native blackberries (Rubus spp.) (Figure 9). Notably, the bugs would move off of these species and
other orchard fruits onto native smooth sumac (Rhus glauca) when it was fruiting. The bugs also showed a strong
attraction to ailanthus AKA tree-of-heaven (Ailanthus altissima)5, a fellow east Asian invasive.
We continued periodic tick sampling around the property (see our 2011 report for a description of methodology). No
significant changes in tick species occurrence in different land cover types were found between years. We did, however,
expand our efforts to include forested areas of the Farm which incidentally supported the highest proportion of deer
ticks (Ixodes scapularis) of any land cover type on the property.
5 Trope, Taliaferro N. 2012. Host Plant Preference of the Brown Marmorated Stink Bug (Hemiptera: Pentatomidae) in Northern
Virginia on The Farm at Sunnyside. Prescott College.
P a g e | 13
CONSERVATION MANAGEMENT
GOAL: To increase farm biodiversity and enhance its agricultural benefits by improving habitat quality
for target species. While we view biodiversity conservation as an important objective in its own right,
we also seek to enhance the contribution of wild species to food production.
Land Use Planning. This year we began work on a comprehensive land management strategy for the Farm. We used a
GIS to divide the property into units for which we can develop a set of management objectives and timelines for the
work. Our primary focus in 2012 was to identify sections of the property that we call “marginal” land -- currently over
55 acres distributed among 24 distinct sites (APPENDIX B). These areas, mostly fields with some small forest patches, are
of special interest because they currently contribute little to no value toward crop production or wildlife habitat, yet
carry recurrent maintenance costs. Many of these units (over 27 acres total) require regular mowing, and most are
reservoirs for invasive plants with high dispersal ranges such as Johnson grass (Sorghum halepense) and ailanthus AKA
tree-of-heaven (Ailanthus altissima).
We created a document characterizing each unit with information on its physical dimensions, soils, slope and proximity
to features such as roads. Our goals moving forward are: to (1) increase the agricultural and/or wildlife value of units;
(2) strengthen connectivity of warm season grass meadows, forests and other habitat patches; (3) improve ecosystem
services such as expanding buffers around streams and ponds; and (4) reduce the maintenance costs of unproductive
units. This type of planning exercise allows the entire farm staff to comment on the proposed management of land units
while having all of the pertinent information at hand.
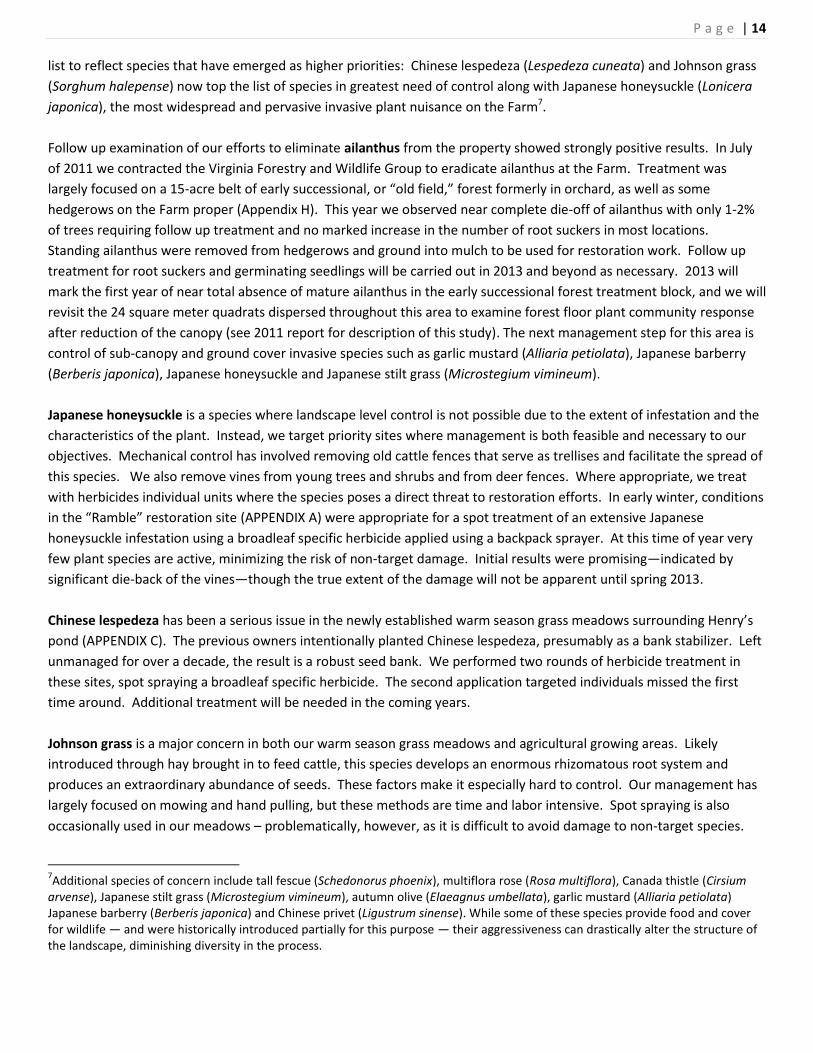
Invasive Plant Control. Certain species of exotic plants
remain a critical threat to the Farm’s biodiversity and in
some instances to its agricultural production. The mile-
a-minute (Persicaria perfoliata) infestation pictured at
right is a classic example of how these aggressive species
can smother and kill established vegetation, creating a
monoculture that lacks the diversity of food and cover
that wildlife depend on (Figure 11). We use multiple
methods to control invasive plants including mowing,
hand pulling, fire and targeted herbicide applications
(outside of agricultural production areas)6. Despite
considerable progress in managing certain species, we
expect that invasive plant management will continue to
occupy a meaningful amount of our time in 2013 and
beyond. This year we updated our invasive plant threat
6We have concluded that it is not feasible to address the Farm’s invasive species challenges using only organic means. Accordingly,
we have opted to supplement mechanical treatments with selective herbicide use in certain non-agricultural areas. We maintain required buffers, store herbicide material and equipment away from agricultural equipment and infrastructure and limit applicators to the conservation manager, farm owner and licensed contractors.
Figure 11: This site within a wooded section of the Farm is
completely dominated by mile-a-minute, an extremely fast-
growing invasive weed that can rapidly outcompete native
vegetation. In this type of situation, immediate and aggressive
intervention is essential to contain the species’ spread.
P a g e | 14
list to reflect species that have emerged as higher priorities: Chinese lespedeza (Lespedeza cuneata) and Johnson grass
(Sorghum halepense) now top the list of species in greatest need of control along with Japanese honeysuckle (Lonicera
japonica), the most widespread and pervasive invasive plant nuisance on the Farm7.
Follow up examination of our efforts to eliminate ailanthus from the property showed strongly positive results. In July
of 2011 we contracted the Virginia Forestry and Wildlife Group to eradicate ailanthus at the Farm. Treatment was
largely focused on a 15-acre belt of early successional, or “old field,” forest formerly in orchard, as well as some
hedgerows on the Farm proper (Appendix H). This year we observed near complete die-off of ailanthus with only 1-2%
of trees requiring follow up treatment and no marked increase in the number of root suckers in most locations.
Standing ailanthus were removed from hedgerows and ground into mulch to be used for restoration work. Follow up
treatment for root suckers and germinating seedlings will be carried out in 2013 and beyond as necessary. 2013 will
mark the first year of near total absence of mature ailanthus in the early successional forest treatment block, and we will
revisit the 24 square meter quadrats dispersed throughout this area to examine forest floor plant community response
after reduction of the canopy (see 2011 report for description of this study). The next management step for this area is
control of sub-canopy and ground cover invasive species such as garlic mustard (Alliaria petiolata), Japanese barberry
(Berberis japonica), Japanese honeysuckle and Japanese stilt grass (Microstegium vimineum).
Japanese honeysuckle is a species where landscape level control is not possible due to the extent of infestation and the
characteristics of the plant. Instead, we target priority sites where management is both feasible and necessary to our
objectives. Mechanical control has involved removing old cattle fences that serve as trellises and facilitate the spread of
this species. We also remove vines from young trees and shrubs and from deer fences. Where appropriate, we treat
with herbicides individual units where the species poses a direct threat to restoration efforts. In early winter, conditions
in the “Ramble” restoration site (APPENDIX A) were appropriate for a spot treatment of an extensive Japanese
honeysuckle infestation using a broadleaf specific herbicide applied using a backpack sprayer. At this time of year very
few plant species are active, minimizing the risk of non-target damage. Initial results were promising—indicated by
significant die-back of the vines—though the true extent of the damage will not be apparent until spring 2013.
Chinese lespedeza has been a serious issue in the newly established warm season grass meadows surrounding Henry’s
pond (APPENDIX C). The previous owners intentionally planted Chinese lespedeza, presumably as a bank stabilizer. Left
unmanaged for over a decade, the result is a robust seed bank. We performed two rounds of herbicide treatment in
these sites, spot spraying a broadleaf specific herbicide. The second application targeted individuals missed the first
time around. Additional treatment will be needed in the coming years.
Johnson grass is a major concern in both our warm season grass meadows and agricultural growing areas. Likely
introduced through hay brought in to feed cattle, this species develops an enormous rhizomatous root system and
produces an extraordinary abundance of seeds. These factors make it especially hard to control. Our management has
largely focused on mowing and hand pulling, but these methods are time and labor intensive. Spot spraying is also
occasionally used in our meadows – problematically, however, as it is difficult to avoid damage to non-target species.
7Additional species of concern include tall fescue (Schedonorus phoenix), multiflora rose (Rosa multiflora), Canada thistle (Cirsium
arvense), Japanese stilt grass (Microstegium vimineum), autumn olive (Elaeagnus umbellata), garlic mustard (Alliaria petiolata) Japanese barberry (Berberis japonica) and Chinese privet (Ligustrum sinense). While some of these species provide food and cover for wildlife — and were historically introduced partially for this purpose — their aggressiveness can drastically alter the structure of the landscape, diminishing diversity in the process.
P a g e | 15
Conservation plantings. The establishment of native warm season grass (WSG) and wildflower meadows has been a
primary focus of our conservation enhancement program. Such habitat, which has been highly degraded in our region,
supports a range of beneficial biodiversity (e.g., pollinating insects), improves soil health, reduces erosion, stores carbon
and requires minimal maintenance. We seeded our first meadow in 2008 and, with another 6.75 acres planted in 2012,
now have over 22 acres of WSG meadow and an additional 11.5 acres of land managed with fire to promote native
meadow plant communities (APPENDIX I; seed mixes are provided in APPENDIX J). All told, the Farm supports nearly 34
acres of natural meadow habitat that provides an unbroken belt of habitat from the forests of Shenandoah National
Park to the southern boundary of the property (APPENDIX B). These areas are managed for wildlife habitat with some
mowing in the first establishment season and subsequently with biannual burning. Early spring burning hurts undesired
invasive cool season grasses such as tall fescue (Schedonorus phoenix) while opening growing space for warm season
species. Rotational burning is also recommended so as not to fully eliminate meadow habitat from the property at any
one time. We have contracted the services of Sustainable Solutions, LLC to manage our prescribed burns since 2009. Of
note, the Farm has a naturally occurring and increasing population of northern bobwhite quail (Colinus virginianus), a
meadow specialist and high priority species for state and federal restoration efforts.
Another major initiative that we took on this year was to amend agricultural areas and ongoing restoration project sites
with mass plantings of species known to have high pollinator value. We configured these plantings to be highly
attractive to native pollinators. For example, large clusters of similar color flowers are search targets for native bees
foraging on the landscape8. By establishing mass plantings of this type near agricultural fields we hope to direct more
pollinator traffic to our crops and will assess the effectiveness of this initiative with sampling in 2013. All of our
materials were sourced locally from Hill House Farm and Nursery (APPENDIX K).
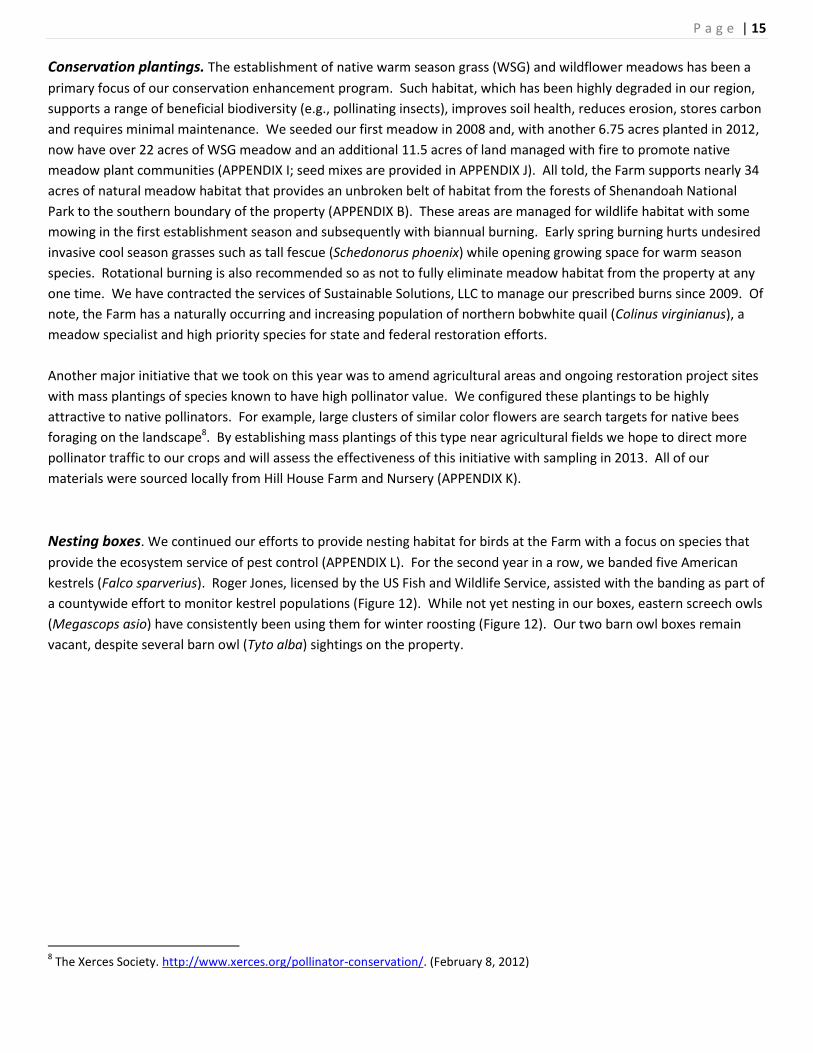
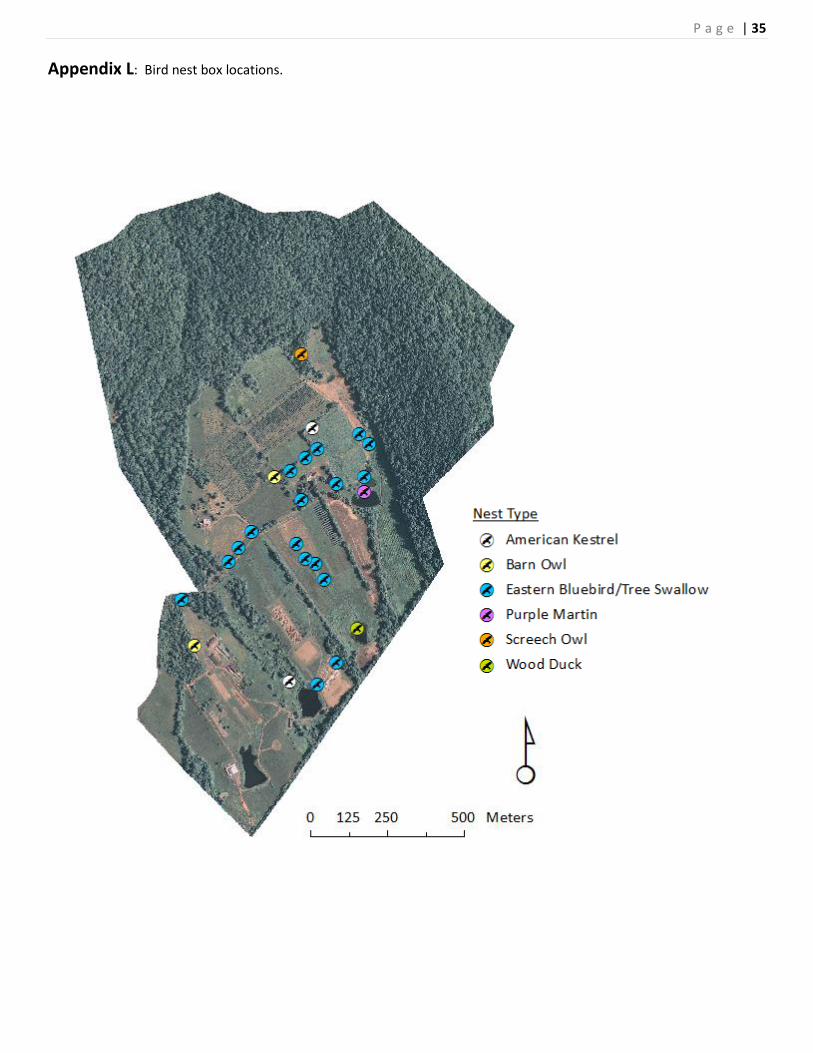
Nesting boxes. We continued our efforts to provide nesting habitat for birds at the Farm with a focus on species that
provide the ecosystem service of pest control (APPENDIX L). For the second year in a row, we banded five American
kestrels (Falco sparverius). Roger Jones, licensed by the US Fish and Wildlife Service, assisted with the banding as part of
a countywide effort to monitor kestrel populations (Figure 12). While not yet nesting in our boxes, eastern screech owls
(Megascops asio) have consistently been using them for winter roosting (Figure 12). Our two barn owl boxes remain
vacant, despite several barn owl (Tyto alba) sightings on the property.
8 The Xerces Society. http://www.xerces.org/pollinator-conservation/. (February 8, 2012)
P a g e | 16
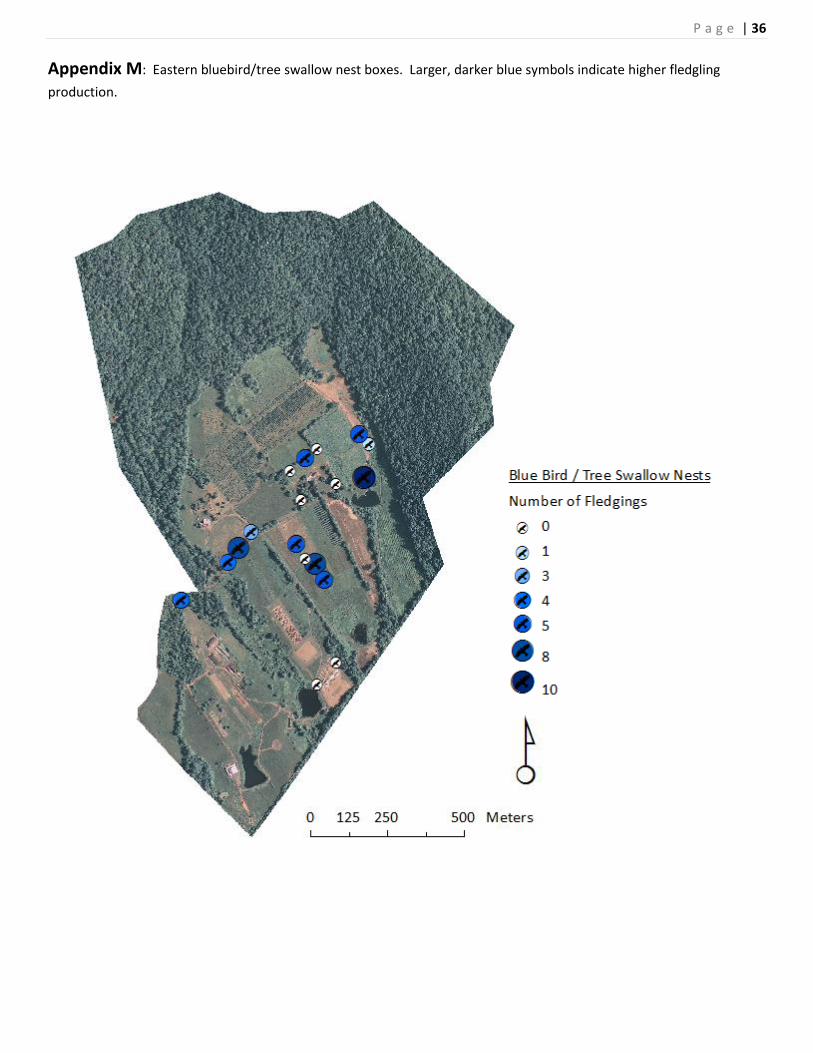
This year we added five more nest boxes designed for eastern bluebirds (Sialia sialis) and tree swallows (Tachycineta
bicolor) bringing the number of artificial nests of this type at the Farm to 18. A number of these boxes are positioned
within and adjacent to our vegetable production areas. In 2012, we began a more rigorous monitoring program for
tracking nestling success. In total, 58 chicks were fledged (30 eastern blue birds and 28 tree swallows) among 11 of the
nests (Table 5) (APPENDIX M). A clutch of Carolina chickadees had begun to fledge in one box but were smothered
when a tree swallow built a nest on top of them. We are experimenting with different nest box designs with the goal of
discouraging both invasive species (i.e., European starlings (Sturnus vulgaris) and house sparrows (Passer domesticus))
and predators. Slant-front, open top and conventional boxes are all currently in use. About half of our boxes have
protective baffles to deter snakes and raccoons. Last year, only one instance of predation was noted, though several
boxes were damaged by black bears.
Figure 12: Banding American kestrels with Roger Jones (left) and a screech owl resting in a nest box (right).
P a g e | 17
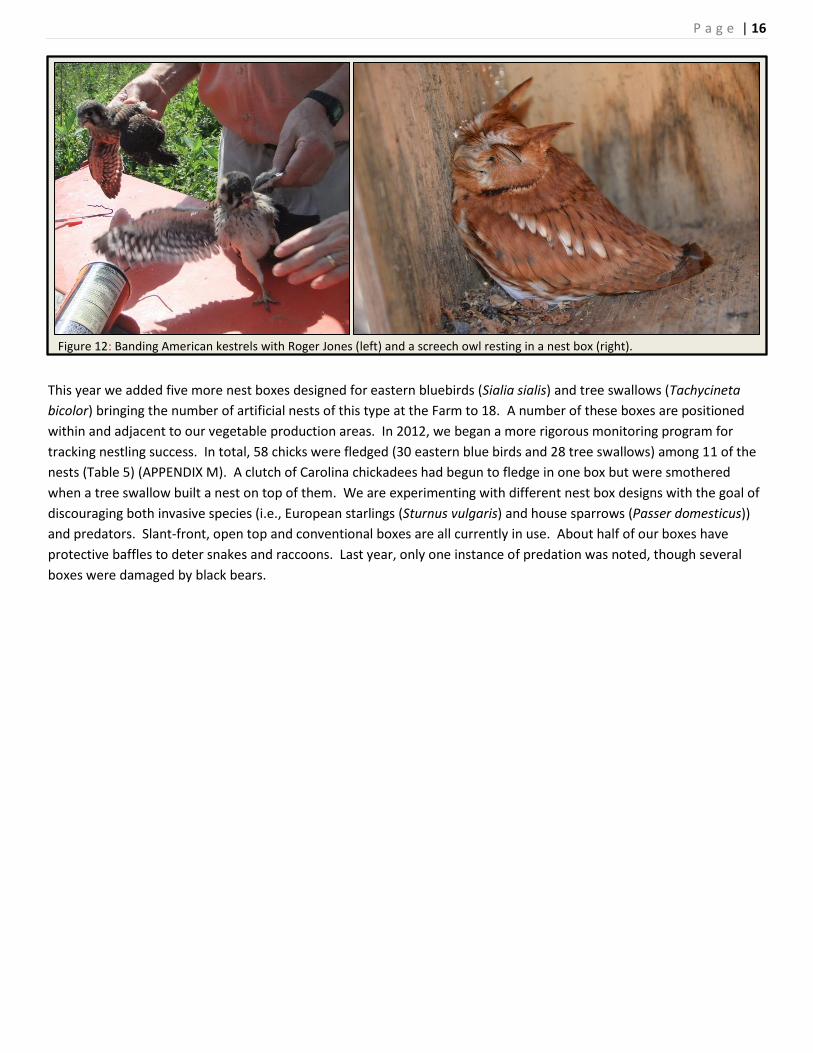
Table 5: Summary of hatchling success in nest boxes for eastern bluebirds and tree swallows.
nest est. year baffle? open roof? eastern blue bird tree swallow total fledged
1 date? no no 0 4 4
2 no no 3 0 3
3 yes yes 0 0 0
4 yes no 0 0 0
5 yes no 5 0 5
6 yes yes 0 0 0
7 yes yes 0 1 1
8 yes no 5 5 10
9 yes yes 0 0 0
10 no no 0 5 5
11 no no 0 8 8
12 2012 no no 4 0 4
13 2012 no no 8 0 8
14 2012 no no 0 5 5
15 2012 no no 5 0 5
16 2012 no no 0 0 0
17 no no 0 0 0
18 no no 0 0 0
total 30 28 58
Finally, we continue, so far without success, to try to attract wood ducks (Aix sponsa) to a box located on the House
Pond. While not an insect or rodent eater, wood ducks reflect good quality wetland habitat. We have seen evidence of
breeding on the Farm and hope that the species may begin to use our box, particularly as we continue to improve pond
conditions (e.g., by introducing aquatic vegetation).
P a g e | 18
WILD PRODUCT SALES
GOAL: To generate revenue and educate the public on the value of biodiversity by harvesting and selling fruits,
berries, flowers and other products from wild species on the Farm.
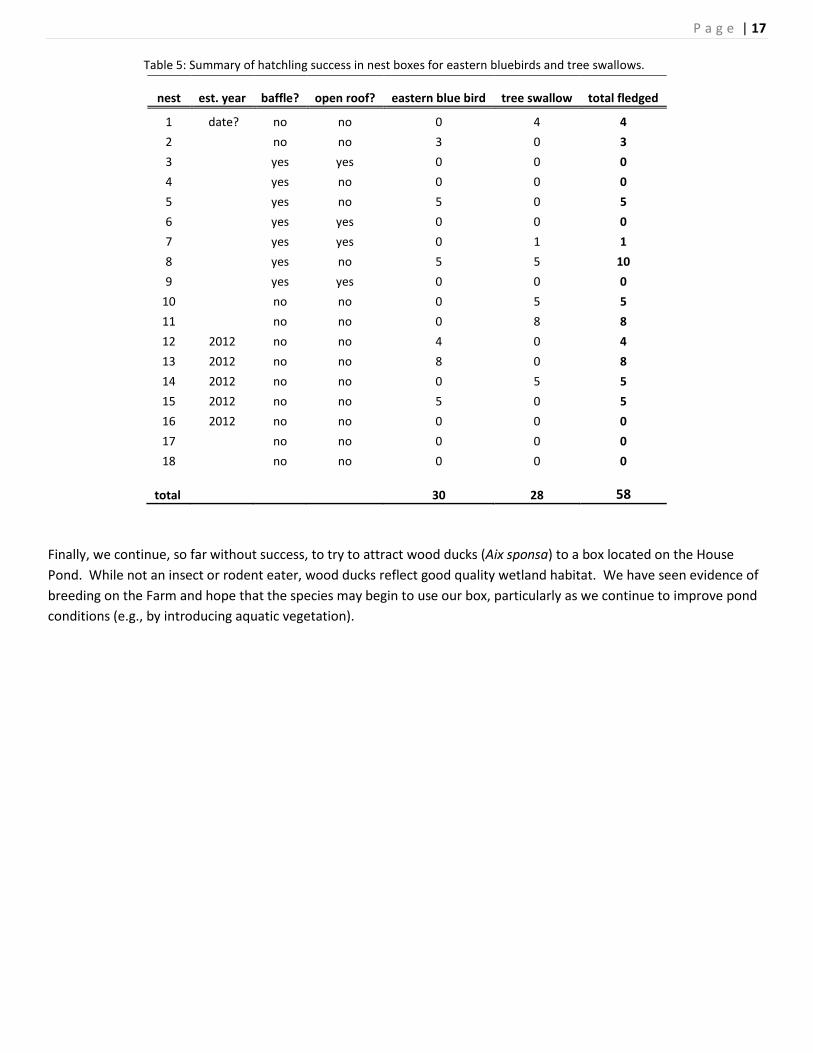
After promising findings from last year’s pilot study on wild product sales, we increased the diversity and volume of
items going to market in 2012. Our efforts to expand our wild crop inventory met with success: income from wild
products more than tripled from 2011 to 2012, increasing from $917 to $2,901.55 (Table 6). Thanks to lessons learned
from the previous year, we also refined our harvesting techniques to increase efficiency. Demand for wild products was
significantly higher at the Dupont Circle farmers’ market than it was at the market in Crystal City, suggesting that
demographics may be important in selling these items.
Table 6: Summary of wild product sales in 2011 and 2012.
product 2011 sales 2012 sales
paw-paws $349.00 $1,140.30
mixed wildflower bouquets $568.00 $782.00
coreopsis bouquets $0.00 $402.00
mojito mint $0.00 $231.25
spicebush berries $0.00 $144.00
honey* $0.00 $122.00
ornamental grasses $0.00 $80.00
total $917.00 $2,901.55
*Only reflects 2012 honey sales—the majority was sold in 2013.
Pawpaw fruits (Asimina triloba) continue to be a highly successful product at farmers’ markets. In total, we brought
over 100 pounds to market from late August through September and sold out every time. This year we were fortunate
to have a good mast in the wild groves from which we harvest. Building on this success with marketable wild fruit, we
harvested spicebush berries (Lindera benzoin) and sold them dehydrated in packets as a native spice. Spicebush berries
were a particularly attractive crop to us because a relatively large quantity could be harvested in a short time and stored
long-term through dehydration, allowing us to bring product to market every week with no additional labor needed.
Bunched wildflowers from our native meadows also continued to be popular. We began selling bouquets of coreopsis
(Coreopsis lanceolata and C. tinctoria) in mid-May. Later in the season, we mixed in black-eyed susans (Rudbeckia hirta),
purple coneflower (Echinacea purpurea), oxeye sunflower (Helianthus helianthoides), butterfly weed (Asclepias
tuberosa) and other species. In the fall, we experimented with bunched ornamental grasses including Indian grass
(Sorghastrum nutans), little bluestem (Schizachyrium scoparium) and Canada wild rye (Elymus canadensis). While sales
of these grasses were not terribly successful, we see potential in ornamental native plants and will continue to explore
this area.
While our emphasis in selling wild products is on native species, we also use other naturalized plants that exist on the
property as a legacy of past use. For example, we recently discovered a large patch of mojito mint (Mentha x villosa)
growing wild around an old home site. This type of mint, not commonly available in our region, has a distinctive aroma
and flavor. It required little time to harvest and sold quite well.
P a g e | 19
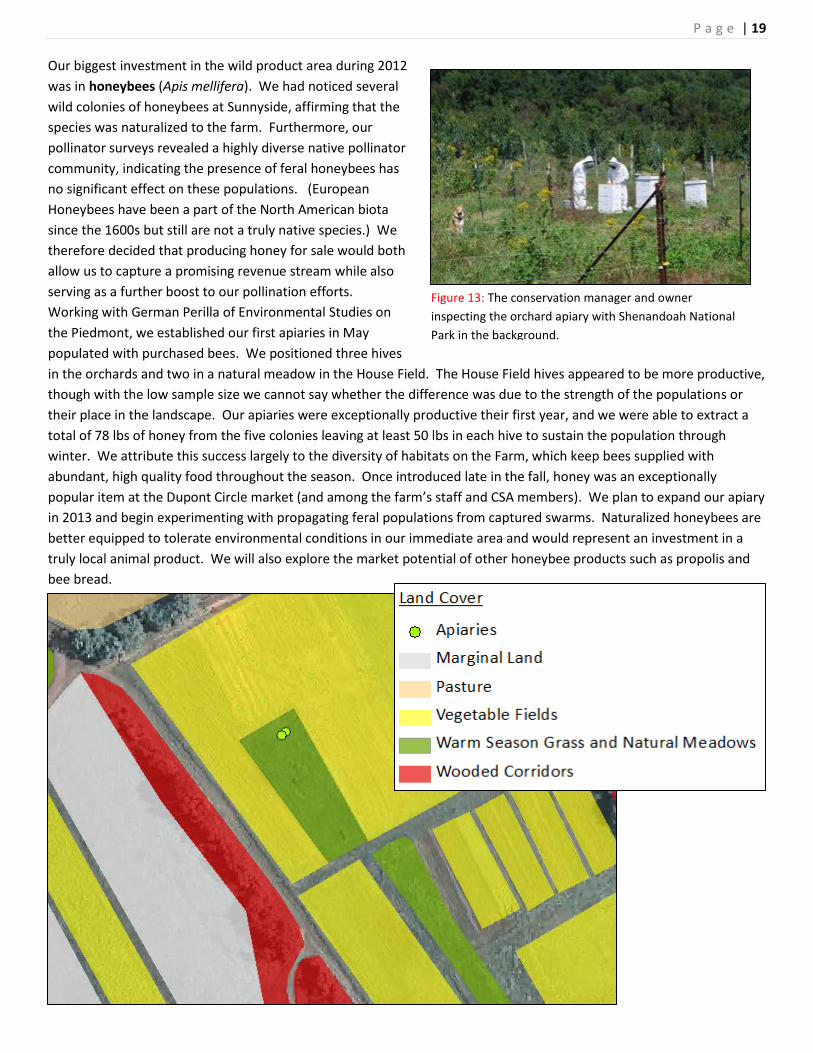
Our biggest investment in the wild product area during 2012
was in honeybees (Apis mellifera). We had noticed several
wild colonies of honeybees at Sunnyside, affirming that the
species was naturalized to the farm. Furthermore, our
pollinator surveys revealed a highly diverse native pollinator
community, indicating the presence of feral honeybees has
no significant effect on these populations. (European
Honeybees have been a part of the North American biota
since the 1600s but still are not a truly native species.) We
therefore decided that producing honey for sale would both
allow us to capture a promising revenue stream while also
serving as a further boost to our pollination efforts.
Working with German Perilla of Environmental Studies on
the Piedmont, we established our first apiaries in May
populated with purchased bees. We positioned three hives
in the orchards and two in a natural meadow in the House Field. The House Field hives appeared to be more productive,
though with the low sample size we cannot say whether the difference was due to the strength of the populations or
their place in the landscape. Our apiaries were exceptionally productive their first year, and we were able to extract a
total of 78 lbs of honey from the five colonies leaving at least 50 lbs in each hive to sustain the population through
winter. We attribute this success largely to the diversity of habitats on the Farm, which keep bees supplied with
abundant, high quality food throughout the season. Once introduced late in the fall, honey was an exceptionally
popular item at the Dupont Circle market (and among the farm’s staff and CSA members). We plan to expand our apiary
in 2013 and begin experimenting with propagating feral populations from captured swarms. Naturalized honeybees are
better equipped to tolerate environmental conditions in our immediate area and would represent an investment in a
truly local animal product. We will also explore the market potential of other honeybee products such as propolis and
bee bread.
Figure 13: The conservation manager and owner
inspecting the orchard apiary with Shenandoah National
Park in the background.
P a g e | 20
COMMUNITY OUTREACH AND COLLABORATION
The Farm’s partnerships with local non-profits, research institutions and ecological service providers continue to be
fruitful. Our work with Environmental Studies on the Piedmont’s camera trapping research was presented at the
Virginia Academy of Science with the conservation manager as a co-author, and we plan to publish the study in a peer-
reviewed journal. Participation in SCBI’s Virginia Working Landscapes Project has helped us develop inventories of birds,
pollinators and meadow plants, and access to the project’s data gives us the ability to contextualize the Farm’s
biodiversity with other similar properties throughout the region. Our relationship with SCBI also resulted in us receiving
the help of a student enrolled in the Smithsonian-Mason semester. The student, Elliot Lassiter, provided weekly
assistance to both the farm staff and conservation manager and brought his own expertise to help inform our research.
The conservation manager also sits on the board of two local environmental non-profits, RappFLOW
(http://www.rappflow.org/) and the Rappahannock League of Environmental Protection (http://www.rlep.org/). The
property owner chairs the Krebser Fund for Rappahannock County Conservation. Our work with these organizations has
strengthened our ability to affect environmental action in the county and share our work with the community.
Other key partners include:
Environmental Studies on the Piedmont: http://envstudies.org/
o camera trap research and apiary consultation
Hill House Farm and Nursery: http://hillhousenativeplants.com/
o plant materials
Jeff Wolinski, Consulting ecologist: http://jeffwolinski.com/
o warm season grass meadow management and invasive plant control
Old Rag Master Naturalists: http://www.oldragmasternaturalists.org/
o annual butterfly count
Nelson Byrd Woltz Landscape Architects: http://www.nbwla.com/
o restoration design
Piedmont Environmental Council: http://www.pecva.org/
o part of the Virginia Working Landscapes initiative
Roger Jones
o American kestrel banding
Smithsonian Conservation Biology Institute: http://nationalzoo.si.edu/scbi/default.cfm
o surveys of birds, pollinators and plants, and the Smithsonian-Mason semester internship program
Sustainable Solutions, LLC: http://www.sustainablesolutionsllc.net/
o prescribed burning
Taliaferro Trope
o brown marmorated stink bug research
The Nature Conservancy of Virginia
o forest management consultation
Virginia Forestry & Wildlife Group: http://vaforestwild.com/
o ailanthus and other invasive plant eradication, wildlife habitat management consultation
P a g e | 21
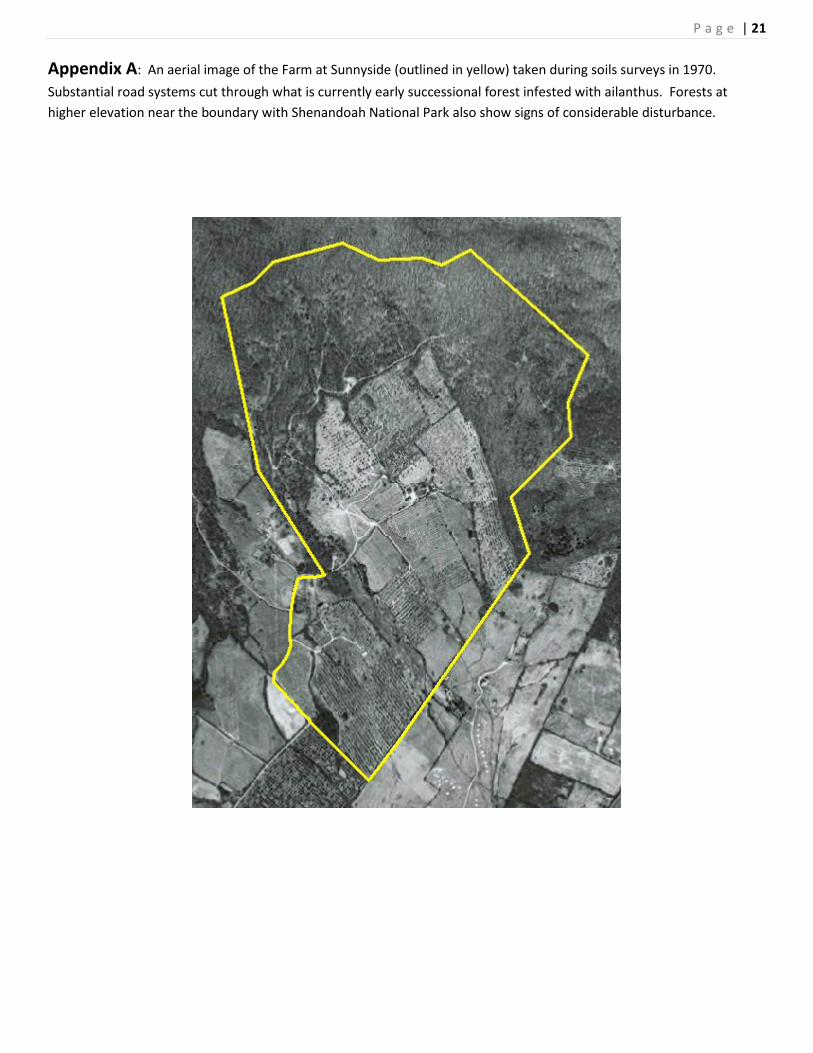
Appendix A: An aerial image of the Farm at Sunnyside (outlined in yellow) taken during soils surveys in 1970.
Substantial road systems cut through what is currently early successional forest infested with ailanthus. Forests at
higher elevation near the boundary with Shenandoah National Park also show signs of considerable disturbance.
P a g e | 22
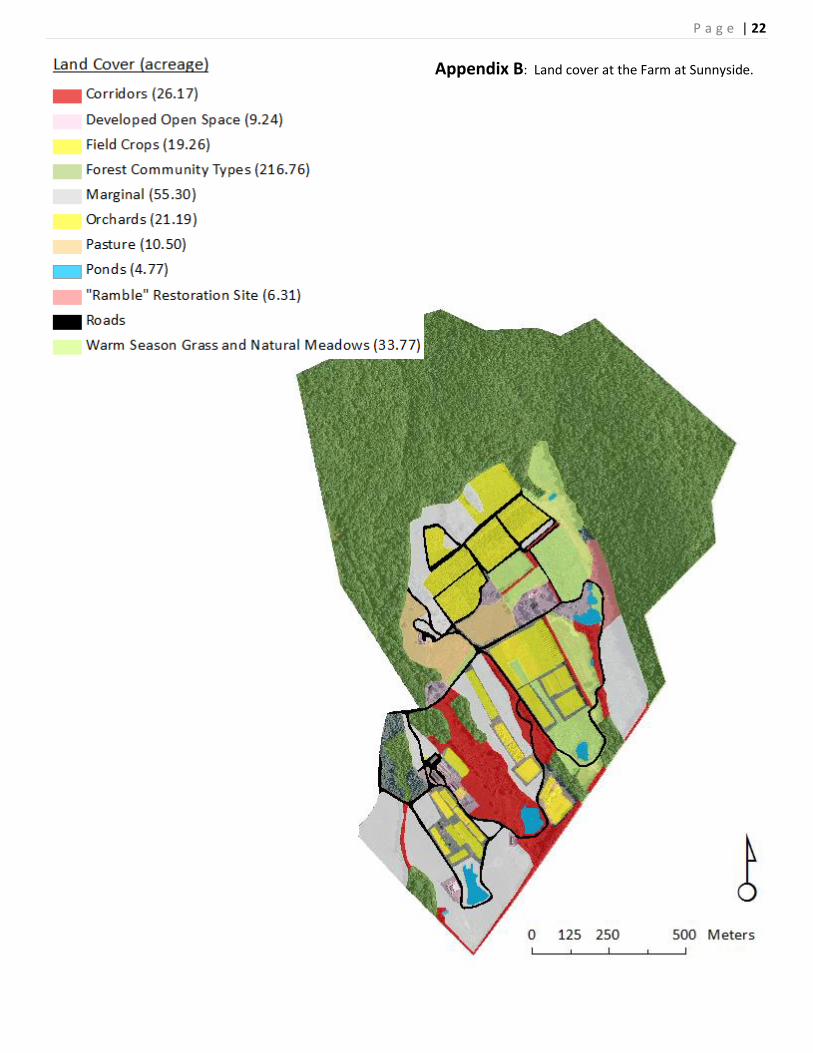
Appendix B: Land cover at the Farm at Sunnyside.
P a g e | 23
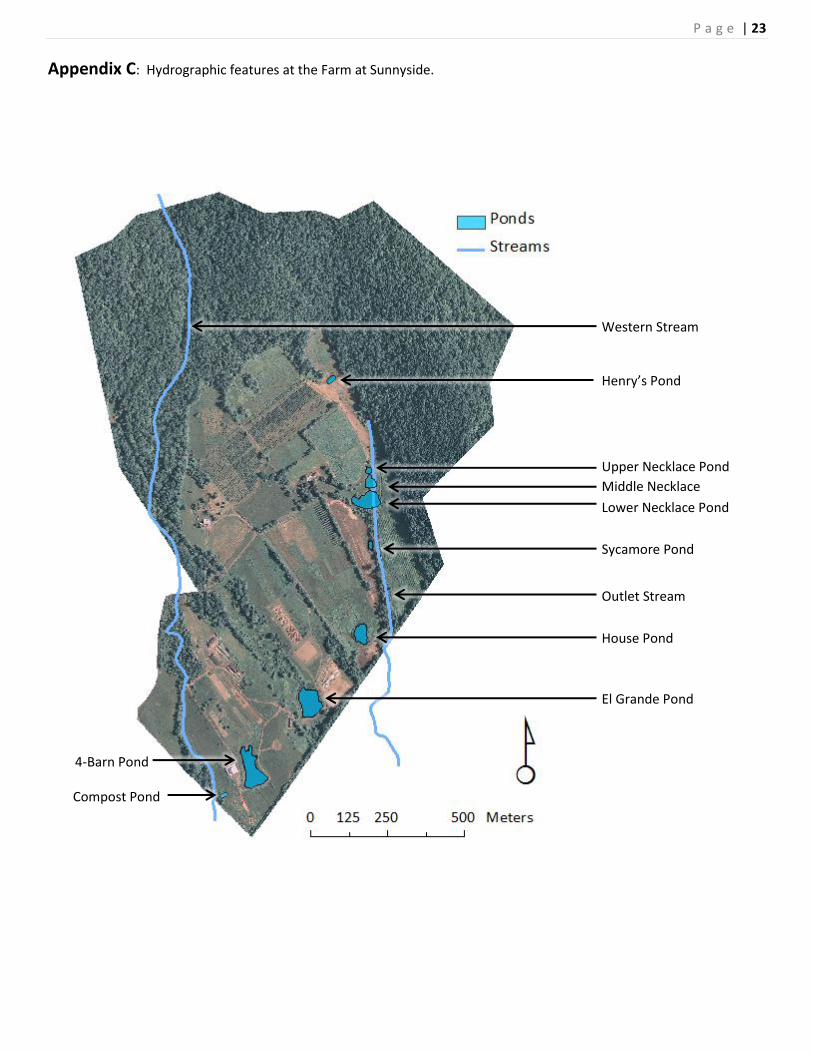
Appendix C: Hydrographic features at the Farm at Sunnyside.
Western Stream
El Grande Pond
Henry’s Pond
Outlet Stream
Middle Necklace
Pond
Sycamore Pond
House Pond
4-Barn Pond
Compost Pond
Lower Necklace Pond
Upper Necklace Pond
P a g e | 24
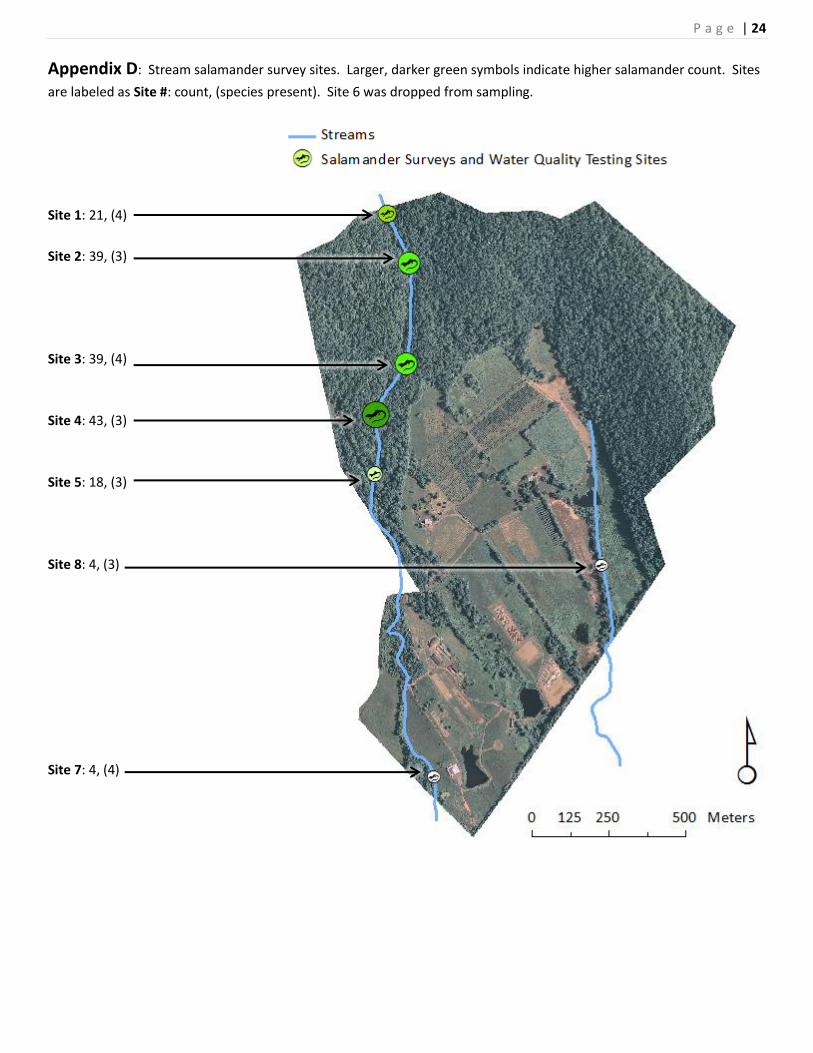
Appendix D: Stream salamander survey sites. Larger, darker green symbols indicate higher salamander count. Sites
are labeled as Site #: count, (species present). Site 6 was dropped from sampling.
Site 1: 21, (4)
Site 2: 39, (3)
Site 3: 39, (4)
Site 4: 43, (3)
Site 5: 18, (3)
Site 8: 4, (3)
Site 7: 4, (4)
P a g e | 25
Appendix E: Mammals captured by our camera traps.
striped skunk (Mephitis m. mephitis) Peromyscus sp.
black bear (Ursus americanus) three black bear cubs
southern flying squirrel (Glaucomys v. volans) eastern cottontail (Sylvilagus floridanus)
P a g e | 26
Appendix F: Bird list
Common Name Latin Name Breeding
Y = confirmed
P = probable
Pied-billed grebe Podilymbus podiceps
Tundra swan Cygnus columbianus
Canada goose Branta canadensis Y
Mallard Anas platyrhynchos
American black duck Anas rubripes
American wigeon Anas americana
Blue-winged teal Anas discors
Wood duck Aix sponsa Y
Redhead Aythya americana
Ring-necked duck Aythya collaris
Hooded merganser Lophodytes cucullatus
Red-breasted merganser Mergus serrator
Ruddy duck Oxyura jamaicensis
Turkey vulture Cathartes aura
Black vulture Coragyps atratus
Cooper’s hawk Accipiter cooperii P
Sharp-shinned hawk Accipiter striatus P
Northern harrier Circus cyaneus
Red-tailed hawk Buteo jamaicensis Y
Red-shouldered hawk Buteo lineatus Y
Bald eagle Haliaeetus leucocephalus
Osprey Pandion haliaetus
American kestrel Falco sparverius Y
Wild turkey Meleagris gallopavo Y
Northern bobwhite Colinus virginianus Y
Great blue heron Ardea herodias
Green-backed heron Butorides striatus Y
Black-crowned night heron Nycticorax nycticorax
Virginia rail Rallus limicola
Sora Porzana carolina
American coot Fulica americana
Killdeer Charadrius vociferus Y
Lesser yellowlegs Tringa flavipes
Solitary sandpiper Tringa solitaria
Spotted sandpiper Actitus macularia P
American woodcock Scolopax minor Y
Common snipe Gallinago gallinago
Ring-billed gull Larus delawarensis
Rock dove Columba livia Y
Mourning dove Zenaida macroura Y
P a g e | 27
Yellow-billed cuckoo Coccyzus americanus Y
Black-billed cuckoo Coccyzus erythropthalmus
Eastern screech owl Otus asio Y
Great-horned owl Bubo virginianus Y
Barn owl Tyto alba
Barred owl Strix varia P
Whip-poor-will Caprimulgus vociferus Y
Chimney swift Chaetura pelagica Y
Ruby-throated hummingbird Archilochus colubris Y
Belted kingfisher Ceryle alcyon P
Common flicker Colaptes auratus Y
Pileated woodpecker Dryocopus pileatus Y
Red-bellied woodpecker Melanerpes carolinus Y
Red-headed woodpecker Melanerpes erythrocephalus
Yellow-bellied sapsucker Sphyrapicus varius Y
Hairy woodpecker Picoides villosus Y
Downy woodpecker Picoides pubescens Y
Eastern kingbird Tyrannus tyrannus Y
Great-crested flycatcher Myiarchus crinitus Y
Eastern phoebe Sayornis phoebe Y
Acadian flycatcher Empidonax virescens Y
Eastern wood pewee Contopus virens Y
Barn swallow Hirundo rustica Y
Cliff swallow Hirundo pyrrhonota Y
Tree swallow Tachycineta bicolor Y
Northern rough-winged swallow
Stelgidopteryx serripennis
Purple martin Progne subis
Blue jay Cyanocitta cristata Y
Common raven Corvus corax P
American crow Corvus brachyrhynchos P
Carolina chickadee Parus carolinensis Y
Tufted titmouse Parus bicolor Y
White-breasted nuthatch Sitta carolinensis Y
Brown creeper Certhia americana
House wren Troglodytes aedon Y
Winter wren Troglodytes troglodytes
Carolina wren Thryothorus ludovicianus Y
Northern mockingbird Mimus polyglottos Y
Grey catbird Dumetella carolinensis Y
Brown thrasher Toxostoma rufum Y
American robin Turdus migratorius Y
Wood thrush Hylocichla mustelina Y
Hermit thrush Catharus guttatus
Eastern bluebird Sialia sialis Y
P a g e | 28
Blue-gray gnatcatcher Polioptila caerulea Y
Golden-crowned kinglet Regulus satrapa
Ruby-crowned kinglet Regulus calendula
American pipit Anthus rubescens
European starling Sturnus vulgaris Y
Cedar waxwing Bombycilla cedrorum P
White-eyed vireo Vireo griseus Y
Yellow-throated vireo Vireo flavifrons
Blue-headed vireo Vireo solitarius
Red-eyed vireo Vireo olivaceus Y
Warbling vireo Vireo gilvus Y
Blue-winged warbler Vermivora cyanoptera
Northern parula Setophaga americana Y
Yellow warbler Setophaga petechia Y
Chestnut-sided warbler Setophaga pensylvanica
Cape May warbler Setophaga tigrina
Black-throated blue warbler Setophaga caerulescens
Yellow-rumped warbler Setophaga coronata Y
Black-throated green warbler Setophaga virens
Palm warbler Setophaga palmarum
Prairie warbler Setophaga discolor P
Blackpoll warbler Setophaga striata Y
Black-and-white warbler Mniotilta varia
American redstart Setophaga ruticilla Y
Ovenbird Seiurus aurocapilla Y
Louisiana waterthrush Parkesia motacilla Y
Kentucky warbler Geothlypis formosa Y
Common yellowthroat Geothlypis trichas Y
Yellow-breasted chat Icteria virens Y
Scarlet tanager Piranga olivacea Y
Northern cardinal Cardinalis cardinalis Y
Rose-breasted grosbeak Pheucticus ludovicianus
Blue grosbeak Guiraca caerulea Y
Indigo bunting Passerina cyanea Y
Eastern meadowlark Sturnella magna Y
Bobolink Dolichonyx oryzivorus
Red-winged blackbird Agelaius phoeniceus Y
Common grackle Quiscalus quiscula
Brown-headed cowbird Molothrus ater Y
Orchard oriole Icterus spurius Y
Baltimore oriole Icterus galbula Y
House sparrow Passer domesticus Y
House finch Carpodacus mexicanus
American goldfinch Spinus tristis Y
Pine siskin Spinus pinus
P a g e | 29
Snow bunting Plectrophenax nivalis
Eastern towhee Pipilo erythrophthalmus Y
Field sparrow Spizella pusilla Y
Chipping sparrow Spizella passerina Y
Vesper sparrow Pooecetes gramineus
Savannah sparrow Passerculus sandwichensis
Grasshopper sparrow Ammodramus savannarum
Song sparrow Melospiza melodia Y
Swamp sparrow Melospiza georgiana Y
Fox sparrow Passerella iliaca
White-throated sparrow Zonotrichia albicollis
White-crowned sparrow Zonotrichia leucophrys
Dark-eyed junco Junco hyemalis
P a g e | 30
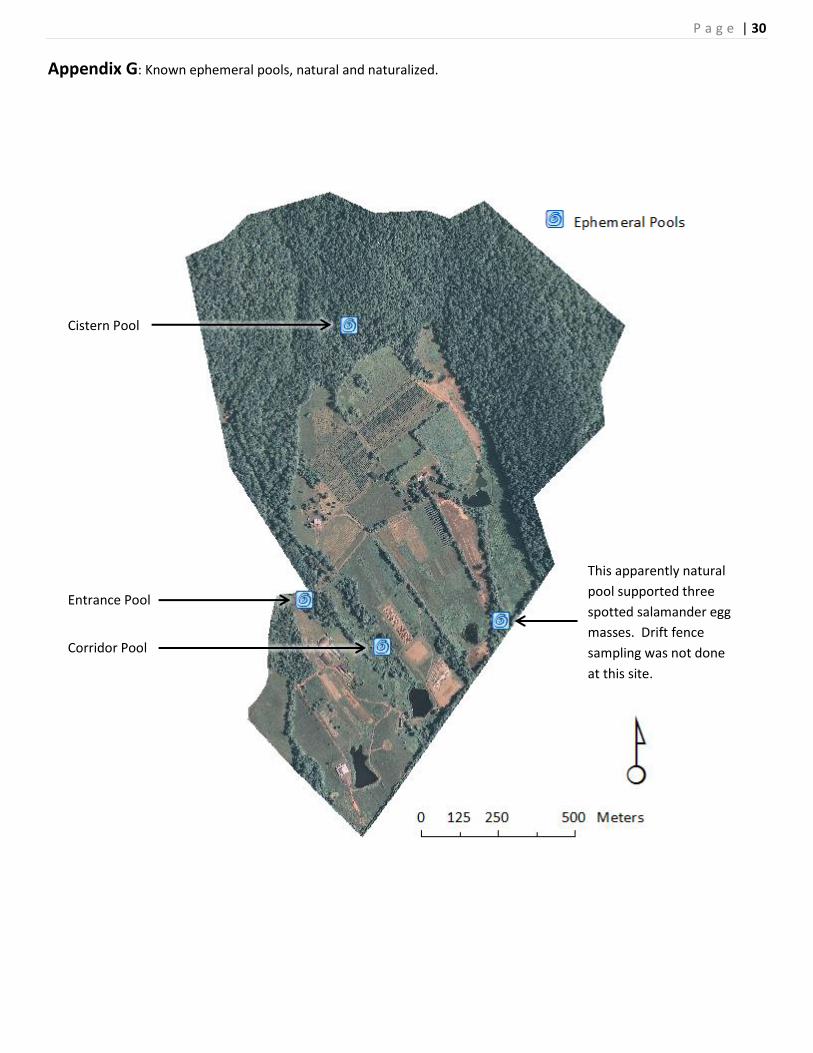
Appendix G: Known ephemeral pools, natural and naturalized.
Cistern Pool
Entrance Pool
Corridor Pool
This apparently natural
pool supported three
spotted salamander egg
masses. Drift fence
sampling was not done
at this site.
P a g e | 31
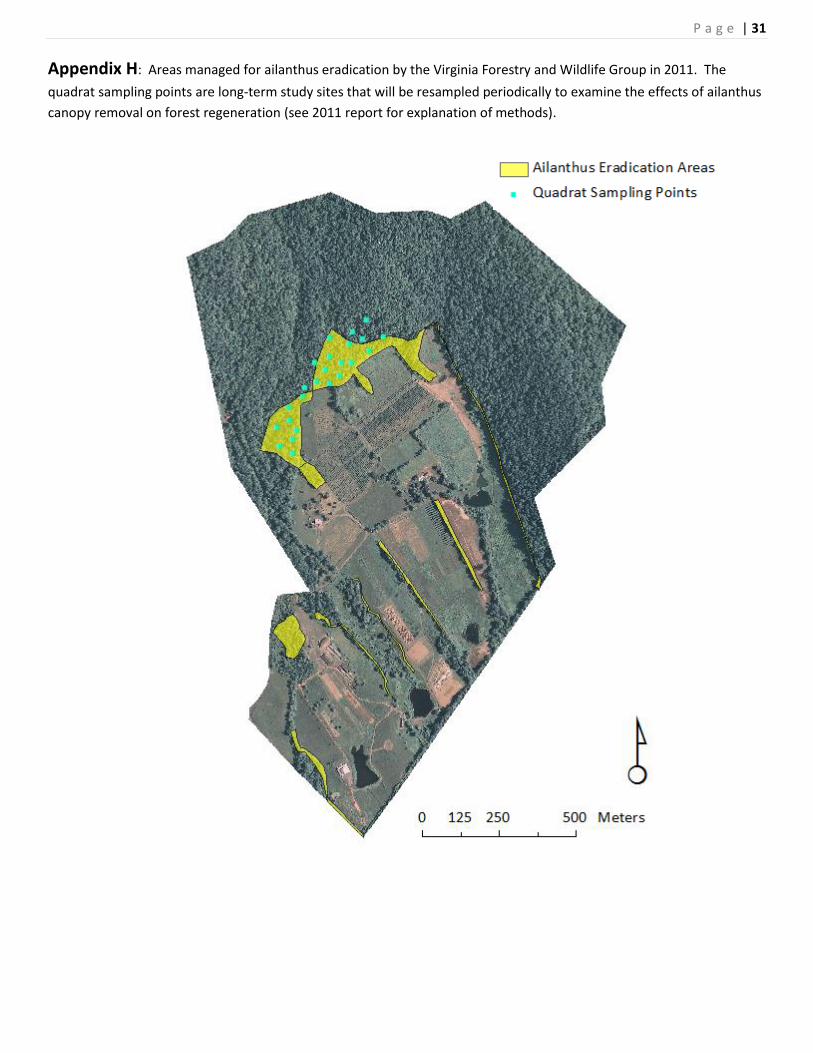
Appendix H: Areas managed for ailanthus eradication by the Virginia Forestry and Wildlife Group in 2011. The
quadrat sampling points are long-term study sites that will be resampled periodically to examine the effects of ailanthus
canopy removal on forest regeneration (see 2011 report for explanation of methods).
P a g e | 32
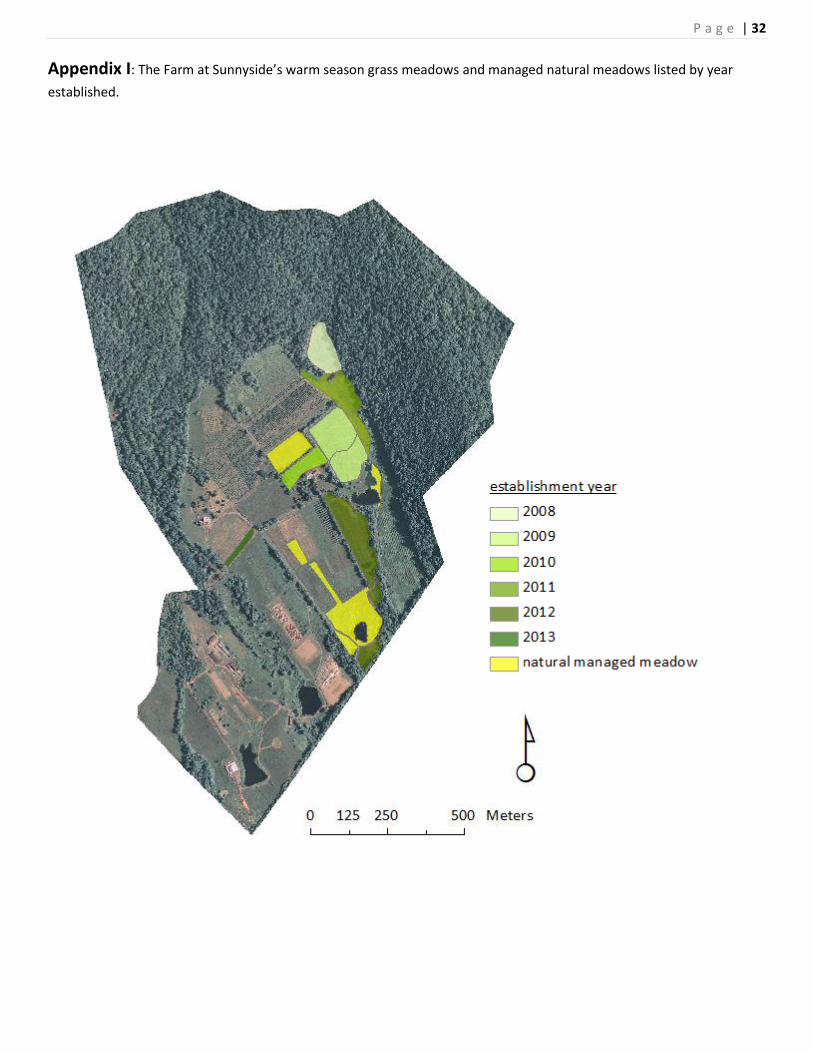
Appendix I: The Farm at Sunnyside’s warm season grass meadows and managed natural meadows listed by year
established.
P a g e | 33
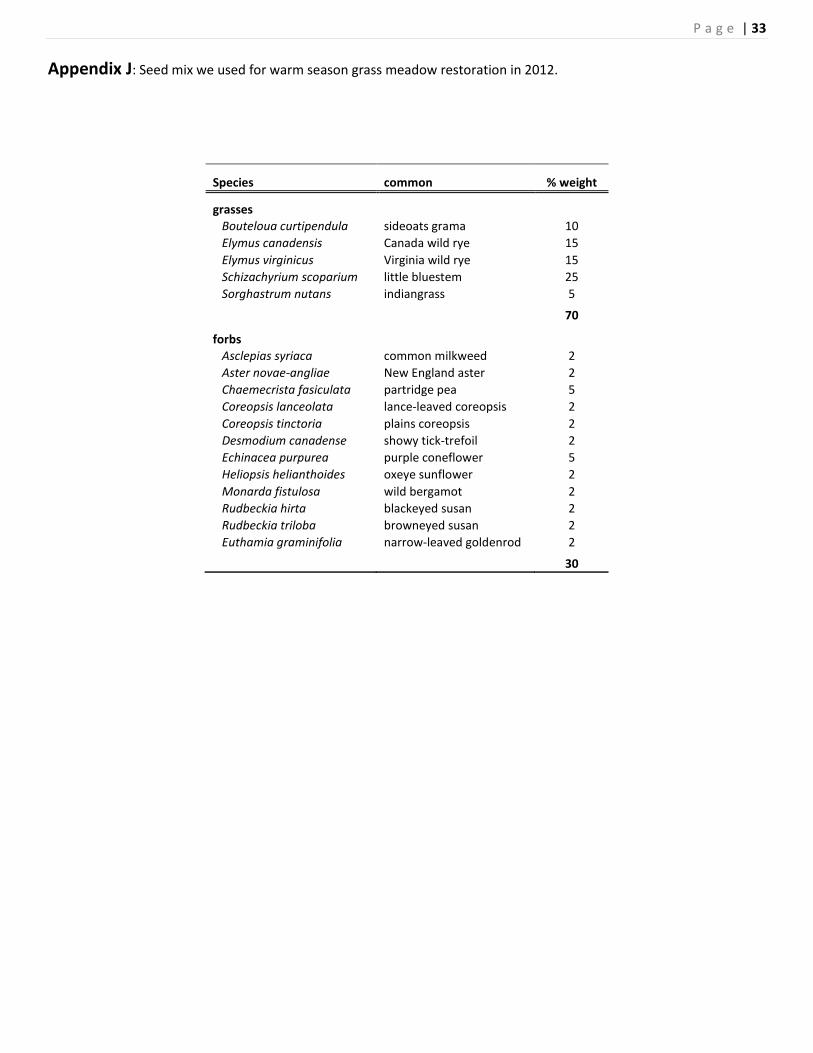
Appendix J: Seed mix we used for warm season grass meadow restoration in 2012.
Species common % weight
grasses
Bouteloua curtipendula sideoats grama 10
Elymus canadensis Canada wild rye 15
Elymus virginicus Virginia wild rye 15
Schizachyrium scoparium little bluestem 25
Sorghastrum nutans indiangrass 5
70
forbs
Asclepias syriaca common milkweed 2
Aster novae-angliae New England aster 2
Chaemecrista fasiculata partridge pea 5
Coreopsis lanceolata lance-leaved coreopsis 2
Coreopsis tinctoria plains coreopsis 2
Desmodium canadense showy tick-trefoil 2
Echinacea purpurea purple coneflower 5
Heliopsis helianthoides oxeye sunflower 2
Monarda fistulosa wild bergamot 2
Rudbeckia hirta blackeyed susan 2
Rudbeckia triloba browneyed susan 2
Euthamia graminifolia narrow-leaved goldenrod 2
30
P a g e | 34
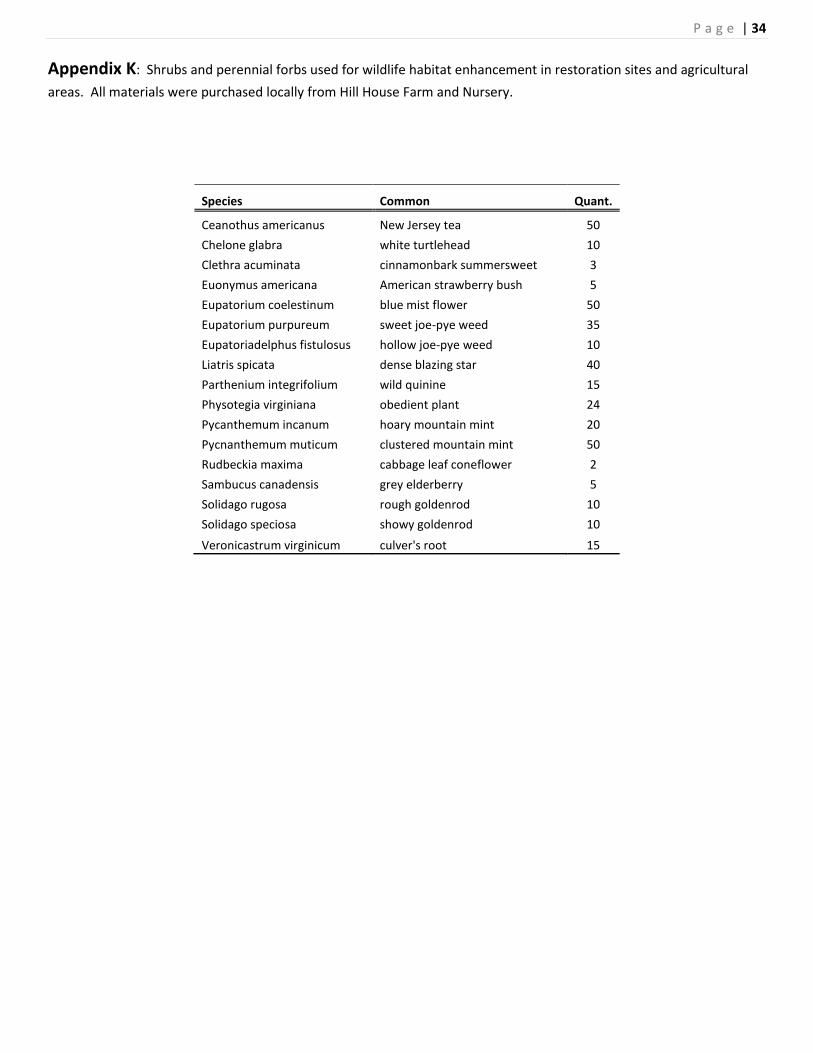
Appendix K: Shrubs and perennial forbs used for wildlife habitat enhancement in restoration sites and agricultural
areas. All materials were purchased locally from Hill House Farm and Nursery.
Species Common Quant.
Ceanothus americanus New Jersey tea 50
Chelone glabra white turtlehead 10
Clethra acuminata cinnamonbark summersweet 3
Euonymus americana American strawberry bush 5
Eupatorium coelestinum blue mist flower 50
Eupatorium purpureum sweet joe-pye weed 35
Eupatoriadelphus fistulosus hollow joe-pye weed 10
Liatris spicata dense blazing star 40
Parthenium integrifolium wild quinine 15
Physotegia virginiana obedient plant 24
Pycanthemum incanum hoary mountain mint 20
Pycnanthemum muticum clustered mountain mint 50
Rudbeckia maxima cabbage leaf coneflower 2
Sambucus canadensis grey elderberry 5
Solidago rugosa rough goldenrod 10
Solidago speciosa showy goldenrod 10
Veronicastrum virginicum culver's root 15
P a g e | 35
Appendix L: Bird nest box locations.
P a g e | 36
Appendix M: Eastern bluebird/tree swallow nest boxes. Larger, darker blue symbols indicate higher fledgling
production.