Embed Size (px)
Citation preview

2012 BUSINESS PLAN AND BUDGET
FINAL VERSION
RELIABILITYFIRST CORPORATION Draft: Version 1
Approved by ReliabilityFirst Board of Directors
Formatted: Font: 8 pt
Formatted: Font: 20 pt
Formatted: Font: 24 pt
Formatted: Font: 24 pt, Font color: Auto,Small caps
Formatted: Font color: Text 1
Introduction
2012 ReliabilityFirst Corporation Business Plan and Budget Approved by Board of Directors: April 22, 2011 for Stakeholder CommentJuly 8, 2011 2
Formatted: Font color: Text 1
April 22, 2011 for Stakeholder Comment July 8, 2011
Formatted: Font color: Text 1
Formatted: Font: (Default) Arial, Font color:Text 1
2012 ReliabilityFirst Corporation Business Plan and Budget Approved by Board of Directors: July 8, 2011 April 22, 2011 for Stakeholder Comment 3
Formatted: Font color: Auto
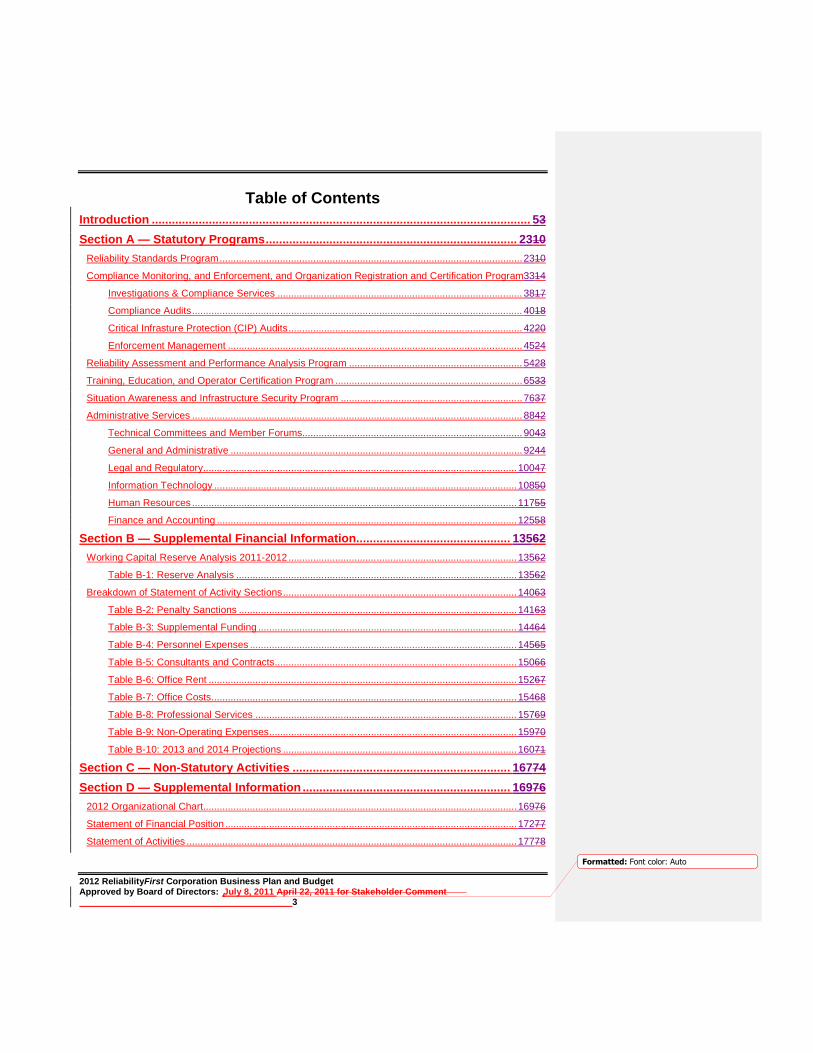
Table of Contents
Introduction ................................................................................................................. 53
Section A — Statutory Programs ........................................................................... 2310
Reliability Standards Program .............................................................................................................. 2310
Compliance Monitoring, and Enforcement, and Organization Registration and Certification Program 3314
Investigations & Compliance Services ......................................................................................... 3817
Compliance Audits ........................................................................................................................ 4018
Critical Infrasture Protection (CIP) Audits ..................................................................................... 4220
Enforcement Management ........................................................................................................... 4524
Reliability Assessment and Performance Analysis Program ............................................................... 5428
Training, Education, and Operator Certification Program .................................................................... 6533
Situation Awareness and Infrastructure Security Program .................................................................. 7637
Administrative Services ........................................................................................................................ 8842
Technical Committees and Member Forums................................................................................ 9043
General and Administrative .......................................................................................................... 9244
Legal and Regulatory .................................................................................................................. 10047
Information Technology .............................................................................................................. 10850
Human Resources ...................................................................................................................... 11755
Finance and Accounting ............................................................................................................. 12558
Section B — Supplemental Financial Information.............................................. 13562
Working Capital Reserve Analysis 2011-2012 ................................................................................... 13562
Table B-1: Reserve Analysis ...................................................................................................... 13562
Breakdown of Statement of Activity Sections ..................................................................................... 14063
Table B-2: Penalty Sanctions ..................................................................................................... 14163
Table B-3: Supplemental Funding .............................................................................................. 14464
Table B-4: Personnel Expenses ................................................................................................. 14565
Table B-5: Consultants and Contracts ........................................................................................ 15066
Table B-6: Office Rent ................................................................................................................ 15267
Table B-7: Office Costs ............................................................................................................... 15468
Table B-8: Professional Services ............................................................................................... 15769
Table B-9: Non-Operating Expenses .......................................................................................... 15970
Table B-10: 2013 and 2014 Projections ..................................................................................... 16071
Section C — Non-Statutory Activities ................................................................. 16774
Section D — Supplemental Information .............................................................. 16976
2012 Organizational Chart.................................................................................................................. 16976
Statement of Financial Position .......................................................................................................... 17277
Statement of Activities ........................................................................................................................ 17778

Introduction
2012 ReliabilityFirst Corporation Business Plan and Budget Approved by Board of Directors: April 22, 2011 for Stakeholder CommentJuly 8, 2011 4
Formatted: Font color: Text 1
Introduction ................................................................................................................. 33
Section A — Statutory Programs ........................................................................... 1010
Reliability Standards Program .............................................................................................................. 1010
Compliance Monitoring and Enforcement and Organization Registration and Certification Program . 1414
Investigations & Compliance Services ......................................................................................... 1717
Compliance Audits ........................................................................................................................ 1819
Critical Infrasture Protection (CIP) Audits ..................................................................................... 2021
Enforcement Management ........................................................................................................... 2424
Reliability Assessment and Performance Analysis Program ............................................................... 2828
Training, Education and Operator Certification .................................................................................... 3333
Situation Awareness and Infrastructure Security Program .................................................................. 3737
Administrative Services ........................................................................................................................ 4242
Technical Committees and Member Forums................................................................................ 4343
General and Administrative .......................................................................................................... 4444
Legal and Regulatory .................................................................................................................... 4747
Information Technology ................................................................................................................ 5050
Human Resources ........................................................................................................................ 5554
Finance and Accounting ............................................................................................................... 5857
Section B — Supplemental Financial Information................................................ 6261
Working Capital Reserve Analysis 2011-2012 ..................................................................................... 6261
Table B-1: Reserve Analysis ........................................................................................................ 6261
Breakdown of Statement of Activity Sections ....................................................................................... 6362
Table B-2: Penalty Sanctions ....................................................................................................... 6363
Table B-3: Supplemental Funding ................................................................................................ 6464
Table B-4: Personnel Expenses ................................................................................................... 6565
Table B-5: Consultants and Contracts .......................................................................................... 6666
Table B-6: Office Rent .................................................................................................................. 6767
Table B-7: Office Costs ................................................................................................................. 6868
Table B-8: Professional Services ................................................................................................. 6969
Table B-9: Non-Operating Expenses ............................................................................................ 7070
Table B-10: 2013 and 2014 Projections ....................................................................................... 7171
Section C — Non-Statutory Activities ................................................................... 7474
Section D — Supplemental Information ................................................................ 7676
2012 Organizational Chart.................................................................................................................... 7676
Statement of Financial Position ............................................................................................................ 7777
Statement of Activities .......................................................................................................................... 7878
Formatted: Default Paragraph Font
Formatted: Default Paragraph Font
Formatted: Default Paragraph Font
Formatted: Default Paragraph Font
Formatted: Default Paragraph Font
Formatted: Default Paragraph Font
Formatted: Default Paragraph Font
Formatted: Default Paragraph Font
Formatted: Default Paragraph Font
Formatted: Default Paragraph Font
Formatted: Default Paragraph Font
Formatted: Default Paragraph Font
Formatted: Default Paragraph Font
Formatted: Default Paragraph Font
Formatted: Default Paragraph Font
Formatted: Default Paragraph Font
Formatted: Default Paragraph Font
Formatted: Default Paragraph Font
Formatted: Default Paragraph Font
Formatted: Default Paragraph Font
Formatted: Default Paragraph Font
Formatted: Default Paragraph Font
Formatted: Default Paragraph Font
Formatted: Default Paragraph Font
Formatted: Default Paragraph Font
Formatted: Default Paragraph Font
Formatted: Default Paragraph Font
Formatted: Default Paragraph Font
Formatted: Default Paragraph Font
Formatted: Default Paragraph Font
Formatted: Default Paragraph Font
Formatted: Default Paragraph Font
Formatted: Default Paragraph Font
Formatted: Default Paragraph Font
Formatted: Default Paragraph Font
Formatted: Default Paragraph Font

Introduction
2012 ReliabilityFirst Corporation Business Plan and Budget Approved by Board of Directors: July 8, 2011 April 22, 2011 for Stakeholder Comment 5
Formatted: Font color: Auto
Introduction
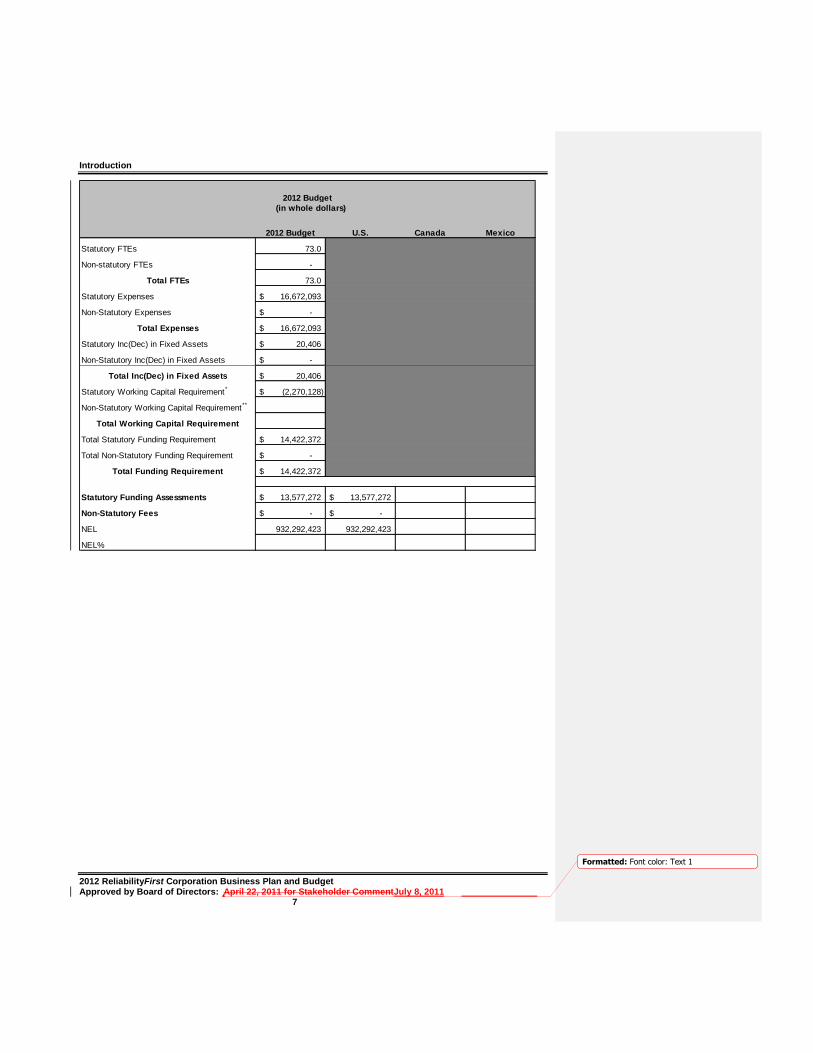
2012 Budget
(in whole dollars) 2012 Budget U.S. Canada Mexico
Statutory FTEs 73.0
Non-statutory FTEs -
Total FTEs 73.0
Statutory Expenses 16,668,321$
Non-Statutory Expenses -$
Total Expenses 16,668,321$
Statutory Inc(Dec) in Fixed Assets (11,822)$
Non-Statutory Inc(Dec) in Fixed Assets -$
Total Inc(Dec) in Fixed Assets (11,822)$
Statutory Working Capital Requirement* (2,270,128)$
Non-Statutory Working Capital Requirement** -$
Total Working Capital Requirement (2,270,128)$
Total Statutory Funding Requirement 14,386,372$
Total Non-Statutory Funding Requirement -$
Total Funding Requirement 14,386,372$
Statutory Funding Assessments 13,534,272$ 13,534,272$
Non-Statutory Fees -$ -$
NEL 932,292,423 932,292,423
NEL% - -
Field Code Changed
Formatted: Font: 6 pt

Introduction
2012 ReliabilityFirst Corporation Business Plan and Budget Approved by Board of Directors: April 22, 2011 for Stakeholder CommentJuly 8, 2011 6
Formatted: Font color: Text 1
2012 Budget U.S. Canada Mexico
Statutory FTEs 73.0
Non-statutory FTEs -
Total FTEs 73.0
Statutory Expenses 16,668,321$
Non-Statutory Expenses -$
Total Expenses 16,668,321$
Statutory Inc(Dec) in Fixed Assets (11,822)$
Non-Statutory Inc(Dec) in Fixed Assets -$
Total Inc(Dec) in Fixed Assets (11,822)$
Statutory Working Capital Requirement* (2,270,128)$
Non-Statutory Working Capital Requirement**
Total Working Capital Requirement
Total Statutory Funding Requirement 14,386,372$
Total Non-Statutory Funding Requirement -$
Total Funding Requirement 14,386,372$
Statutory Funding Assessments 13,541,272$ 13,541,272$
Non-Statutory Fees -$ -$
NEL 932,292,423 932,292,423
NEL%
2012 Budget
(in whole dollars)
Introduction
2012 ReliabilityFirst Corporation Business Plan and Budget Approved by Board of Directors: April 22, 2011 for Stakeholder CommentJuly 8, 2011 7
Formatted: Font color: Text 1
2012 Budget U.S. Canada Mexico
Statutory FTEs 73.0
Non-statutory FTEs -
Total FTEs 73.0
Statutory Expenses 16,672,093$
Non-Statutory Expenses -$
Total Expenses 16,672,093$
Statutory Inc(Dec) in Fixed Assets 20,406$
Non-Statutory Inc(Dec) in Fixed Assets -$
Total Inc(Dec) in Fixed Assets 20,406$
Statutory Working Capital Requirement* (2,270,128)$
Non-Statutory Working Capital Requirement**
Total Working Capital Requirement
Total Statutory Funding Requirement 14,422,372$
Total Non-Statutory Funding Requirement -$
Total Funding Requirement 14,422,372$
Statutory Funding Assessments 13,577,272$ 13,577,272$
Non-Statutory Fees -$ -$
NEL 932,292,423 932,292,423
NEL%
2012 Budget
(in whole dollars)

Introduction
2012 ReliabilityFirst Corporation Business Plan and Budget Approved by Board of Directors: April 22, 2011 for Stakeholder CommentJuly 8, 2011 8
Formatted: Font color: Text 1
2012 Budget U.S. Canada Mexico
Statutory FTEs 73.0
Non-statutory FTEs -
Total FTEs 73.0
Statutory Expenses 16,672,093$
Non-Statutory Expenses -$
Total Expenses 16,672,093$
Statutory Inc(Dec) in Fixed Assets 20,406$
Non-Statutory Inc(Dec) in Fixed Assets -$
Total Inc(Dec) in Fixed Assets 20,406$
Statutory Working Capital Requirement* (2,270,128)$
Non-Statutory Working Capital Requirement**
Total Working Capital Requirement
Total Statutory Funding Requirement 14,422,372$
Total Non-Statutory Funding Requirement -$
Total Funding Requirement 14,422,372$
Statutory Funding Assessments 13,577,272$ 13,577,272$
Non-Statutory Fees -$ -$
NEL 932,292,423 932,292,423
NEL%
2012 Budget
(in whole dollars)
`*Refer to Table B-1 on page 661 in Section B. **ReliabilityFirst does not perform any Non-Statutory Functions at this time.
Organizational Overview ReliabilityFirst Corporation (ReliabilityFirst) is a not-for-profit company incorporated in the State of Delaware and has been authorized by the Federal Energy Regulatory Commission (FERC) to operate as a Regional Entity. As a Regional Entity, ReliabilityFirst performs key reliability functions delegated to it by the Electric Reliability Organization (ERO) or North American Electric Reliability Corporation (NERC). These statutory functions include:
Active participation in the development of North American Reliability Standards for the Bulk Power Electric System (BPSES), and as needed, development of Reliability Standards applicable within the ReliabilityFirst Region.
Monitoring and enforcement of approved Reliability Standards, including the registration of responsible entities, and as needed, certification of such entities.
Assessment of the present and future reliability, adequacy, and security of the BPSBES.
Promoting effective training and education of personnel, and assisting in the certification of operating personnel.
Promoting situation awareness and the protection of critical infrastructure.
Formatted: Font: 10 pt
Formatted: Font: 6 pt

Introduction
2012 ReliabilityFirst Corporation Business Plan and Budget Approved by Board of Directors: April 22, 2011 for Stakeholder CommentJuly 8, 2011 9
Formatted: Font color: Text 1
ReliabilityFirst is responsible for overseeing the reliability of all or parts of the BPES in thirteen states and the District of Columbia. ReliabilityFirst performed only those statutory functions delegated to it by the ERO in 2011 and the organization does not intend to perform any functions outside its ERO delegated activities in 2012. This Business Plan and Budget reflects ReliabilityFirst’s best estimate of the costs it will incur in carrying out its delegated functions in support of the ERO in 2012-2015. The overall 2012 budget reflects a 79.4% increase over that of 2011, driven primarily by hiring five new Full Time Equivalents (FTEs) for 2012. In developing this Business Plan and Budget, ReliabilityFirst, NERC, and the other Regional Entities met and agreed upon common foundational and unique program assumptions. The common foundational assumptions can be found in the ReliabilityFirst NERC 2012 Business Plan and Budget, Attachment Exhibit A: 2012 – 2015 Shared Business Planning and Budget Assumptions (NERC and the Regional Entities) document;. tThese assumptions were used in the development of this plan.
Membership and Governance Members ReliabilityFirst has an open membership policy that permits full and fair participation of all industry stakeholders through their designated representatives. There is no annual fee for ongoing membership in ReliabilityFirst. As new members join, they are required to pay a nominal one-time fee to cover the costs of processing their membership application. This one-time fee currently ranges from $250 for associate and adjunct members to $1,000 for regular members and can be waived by the President and CEO of ReliabilityFirst for good cause.
There are six (6) Industry Sectors: Suppliers, Transmission Companies, Regional Transmission Organizations (RTOs), Small Load Serving Entities (LSEs), Medium LSEs, and Large LSEs.
There are three (3) Classes of Members: Regular Members, Associate Members, and Adjunct Members.
A Regular Member is any entity that has joined an Industry Sector that either (i) has no Affiliates or Related Parties that are Members or (ii) is the entity designated to be the Regular Member by any related group of Associate Members.
An Associate Member is any entity that has joined an Industry Sector and is an Affiliate or Related Party of a Regular Member.
An Adjunct Member is any entity that does not qualify to join an Industry Sector but has been approved for membership. Adjunct Members may include Regulatory Participants.
There are currently 75 members of ReliabilityFirst; 48 are Regular with voting rights, 22 are Associates, and 5 are Adjunct. ReliabilityFirst’s foundation has been and continues to be the broad, active participation of technical and policy experts representing
Introduction
2012 ReliabilityFirst Corporation Business Plan and Budget Approved by Board of Directors: April 22, 2011 for Stakeholder CommentJuly 8, 2011 10
Formatted: Font color: Text 1
electricity industry stakeholders within the Region who are committed to the reliability of the BPSBES. ReliabilityFirst believes that extensive use of industry expert resources, combined with a competent and independent ReliabilityFirst staff, provides a strong approach to reliability that is consistent with the industry self-regulatory model envisioned by Congress in the Energy Policy Act of 2005. Board of Directors ReliabilityFirst is governed by a hybrid, independent, and balanced stakeholder Board. The Board consists of fourteen (14) directors.
(a) Eight directors are elected by the Industry Sectors as follows: (i) Suppliers elect two (2) directors; (ii) Transmission Companies elect two (2) directors; (iii) RTOs elect one (1) director; (iv) Small LSEs elect one (1) director; (v) Medium LSEs elect one (1) director; and (vi) Large LSEs elect one (1) director.
(b) Three (3) directors are at-large. At-large directors are elected by all of the Industry Sectors voting together as a single class.
(c) Three (3) directors are independent from ReliabilityFirst, any Member, Affiliate or Related Party of any Member. Independent directors are elected by all of the Industry Sectors voting together as a single class.
Formatted: Indent: Left: 0.5", Hanging: 0.25", Tab stops: 0.75", Left
Formatted: Indent: Left: 1", Hanging: 0.38"
Formatted: Indent: Left: 1", Hanging: 0.38",Space After: 0 pt
Formatted: Space After: 0 pt, Tab stops: 1.31", Left
Formatted: Tab stops: 0.75", Left

Introduction
2012 ReliabilityFirst Corporation Business Plan and Budget Approved by Board of Directors: April 22, 2011 for Stakeholder CommentJuly 8, 2011 11
Formatted: Font color: Text 1
2012 Overview of Cost Impacts Overall, the ReliabilityFirst 2012 budget ($16.316,656,500M) increased 79.4% over the 2011 budget ($15,219,649)($15.2M). The 2012 assessment ($13.513,534,272M) represents a 665.78% increase over the 2011 assessments of $12.8M12,803,844. The labor costs ($12.912,974,285M) increased by 1454.7% over the 2011 budget ($11.3M($11,314,152). This increase is attributed to hiring five new FTEs, increased benefit costs, the impact of phased hiring from 2011, and an estimated projected 4% increase in personnel costssalary costs which include salary and market adjustments, and promotions. The non labornon-labor costs ($3.4M3,682,215) decreased by 1265.7% over compared to the 2011 budget ($3.9M3,905,497). The following budget variances are significant to the ReliabilityFirst bBusiness Pplan: and Budget:
The decrease in non-labor is primarily due to reductions in Meeting/s, Travel Expense, Contracts Consultants and ConsultantsContracts, Independent Board of Director Search fees, and gOutsideeneral l Legal fees.
The most significant increase in the budget is a result of increased staffing. Staff additions for 2012 represent 3.5 FTE’s in the Compliance Monitoring and Enforcement and Organization Registration and Certification Program, one (1) FTE in the Reliability Assessment and Performance Analysis Program, and one half (.5) FTE in Information Technology. These additions will increase the targeted staffing level to 73 FTE’s.
Summary of Costs
Program
Budget
2011
Projection
2011
Budget
2012
Variance
2012 Budget v
2011 Budget Variance %
Reliability Standards 321,353 342,969 360,227 38,874 12.1%
Compliance Enforcement and Organization Registration 11,376,594 11,169,527 12,351,183 974,589 8.6%
Reliability Assessments and Performance Analysis 2,349,950 2,616,311 2,773,720 423,770 18.0%
Training, Education and Operator Certification 820,513 811,321 873,935 53,422 6.5%
Situation Awareness and Infrastructure Security 311,241 332,360 237,435 (73,806) -23.7%
Formatted: No underline, Font color: Auto,Not Highlight
Field Code Changed

Introduction
2012 ReliabilityFirst Corporation Business Plan and Budget Approved by Board of Directors: April 22, 2011 for Stakeholder CommentJuly 8, 2011 12
Formatted: Font color: Text 1
Program
Budget
2011
Projection
2011
Budget
2012
Variance
2012 Budget v
2011 Budget Variance %
Reliability Standards 321,353 342,969 354,336 32,983 10.3%
Compliance Enforcement and Organization Registration 11,376,594 11,169,527 12,100,831 724,237 6.4%
Reliability Assessments and Performance Analysis 2,349,950 2,616,311 2,717,759 367,809 15.7%
Training, Education and Operator Certification 820,513 811,321 855,674 35,161 4.3%
Situation Awareness and Infrastructure Security 311,241 332,360 603,900 292,659 94.0%
Program
Budget
2011
Projection
2011
Budget
2012
Variance
2012 Budget v
2011 Budget Variance %
Reliability Standards 321,353 342,969 354,336 32,983 10.3%
Compliance Enforcement and Organization Registration 11,376,594 11,169,527 12,100,831 724,237 6.4%
Reliability Assessments and Performance Analysis 2,349,950 2,616,311 2,717,759 367,809 15.7%
Training, Education and Operator Certification 820,513 811,321 855,674 35,161 4.3%
Situation Awareness and Infrastructure Security 311,241 332,360 603,900 292,659 94.0% Theis table 2012 budget numbers does not include $60,000 of indirect overhead expenses, which are offset by interest income within the General and Administrative Program.
Formatted: Font: 6 pt
Formatted: Font: 6 pt

Introduction
2012 ReliabilityFirst Corporation Business Plan and Budget Approved by Board of Directors: April 22, 2011 for Stakeholder CommentJuly 8, 2011 13
Formatted: Font color: Text 1
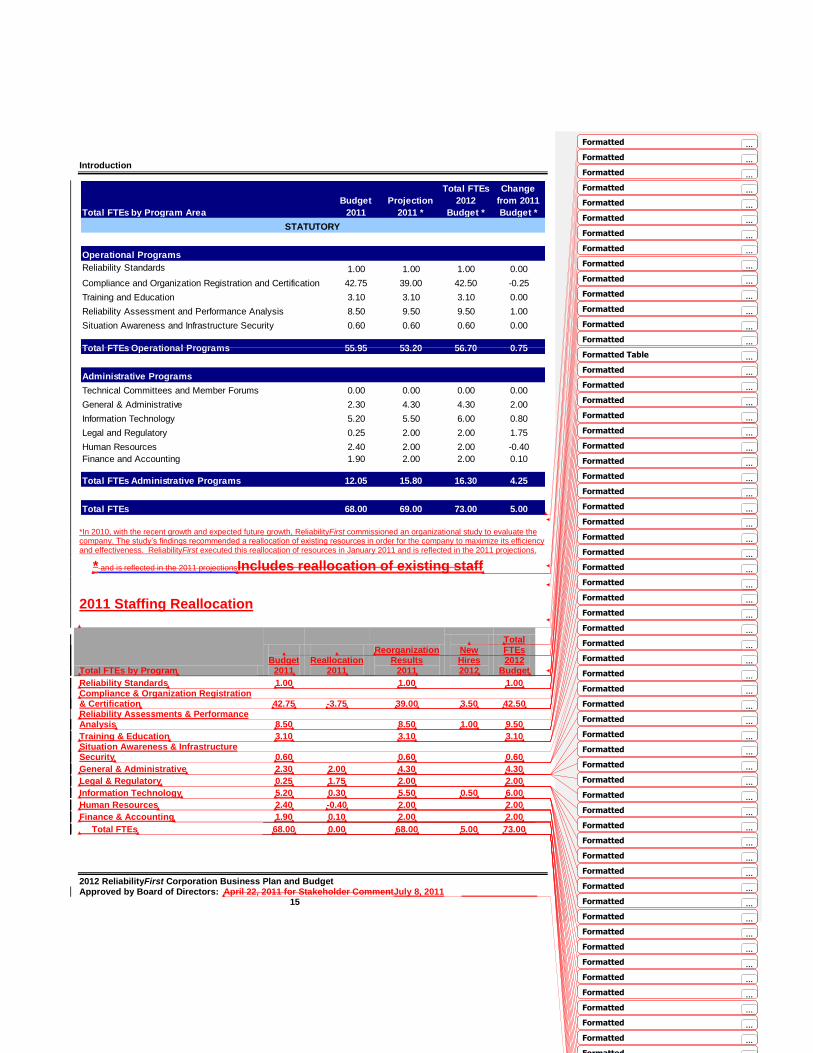
FTEs by Program Area
Total FTEs by Program Area
Budget
2011
Projection
2011 *
Total FTEs
2012
Budget *
Change
from 2011
Budget *
Operational Programs
Reliability Standards 1.00 1.00 1.00 0.00
Compliance and Organization Registration and Certification 42.75 39.00 42.50 -0.25
Reliability Assessment and Performance Analysis 8.50 9.50 9.50 1.00
Training and Education 3.10 3.10 3.10 0.00
Situation Awareness and Infrastructure Security 0.60 0.60 0.60 0.00
Total FTEs Operational Programs 55.95 53.20 56.70 0.75
Administrative Programs
Technical Committees and Member Forums 0.00 0.00 0.00 0.00
General & Administrative 2.30 4.30 4.30 2.00
Legal and Regulatory 0.25 2.00 2.00 1.75
Information Technology 5.20 5.50 6.00 0.80
Human Resources 2.40 2.00 2.00 -0.40
Finance and Accounting 1.90 2.00 2.00 0.10
Total FTEs Administrative Programs 12.05 15.80 16.30 4.25
Total FTEs 68.00 69.00 73.00 5.00
STATUTORY
Formatted: Tab stops: 0.19", Left + Not at 0.13"
Field Code Changed

Introduction
2012 ReliabilityFirst Corporation Business Plan and Budget Approved by Board of Directors: April 22, 2011 for Stakeholder CommentJuly 8, 2011 14
Formatted: Font color: Text 1
Total FTEs by Program Area
Budget
2011
Projection
2011 *
Total FTEs
2012
Budget *
Change
from 2011
Budget *
Operational Programs
Reliability Standards 1.00 1.00 1.00 0.00
Compliance and Organization Registration and Certification 42.75 39.00 42.50 -0.25
Reliability Assessment and Performance Analysis 8.50 9.50 9.50 1.00
Training and Education 3.10 3.10 3.10 0.00
Situation Awareness and Infrastructure Security 0.60 0.60 0.60 0.00
Total FTEs Operational Programs 55.95 53.20 56.70 0.75
Administrative Programs
Technical Committees and Member Forums 0.00 0.00 0.00 0.00
General & Administrative 2.30 4.30 4.30 2.00
Legal and Regulatory 0.25 2.00 2.00 1.75
Information Technology 5.20 5.50 6.00 0.80
Human Resources 2.40 2.00 2.00 -0.40
Finance and Accounting 1.90 2.00 2.00 0.10
Total FTEs Administrative Programs 12.05 15.80 16.30 4.25
Total FTEs 68.00 69.00 73.00 5.00
STATUTORY
Total FTEs by Program Area
Budget
2011
Projection
2011 *
Total FTEs
2012
Budget *
Change
from 2011
Budget *
Operational Programs
Reliability Standards 1.00 1.00 1.00 0.00
Compliance and Organization Registration and Certification 42.75 39.00 42.50 -0.25
Training and Education 3.10 3.10 3.10 0.00
Reliability Assessment and Performance Analysis 8.50 9.50 9.50 1.00
Situation Awareness and Infrastructure Security 0.60 0.60 0.60 0.00
Total FTEs Operational Programs 55.95 53.20 56.70 0.75
Administrative Programs
Technical Committees and Member Forums 0.00 0.00 0.00 0.00
General & Administrative 2.30 4.30 4.30 2.00
Information Technology 5.20 5.50 6.00 0.80
Legal and Regulatory 0.25 2.00 2.00 1.75
Human Resources 2.40 2.00 2.00 -0.40
Finance and Accounting 1.90 2.00 2.00 0.10
Total FTEs Administrative Programs 12.05 15.80 16.30 4.25
Total FTEs 68.00 69.00 73.00 5.00
STATUTORY
Introduction
2012 ReliabilityFirst Corporation Business Plan and Budget Approved by Board of Directors: April 22, 2011 for Stakeholder CommentJuly 8, 2011 15
Formatted ...
Total FTEs by Program Area
Budget
2011
Projection
2011 *
Total FTEs
2012
Budget *
Change
from 2011
Budget *
Operational Programs
Reliability Standards 1.00 1.00 1.00 0.00
Compliance and Organization Registration and Certification 42.75 39.00 42.50 -0.25
Training and Education 3.10 3.10 3.10 0.00
Reliability Assessment and Performance Analysis 8.50 9.50 9.50 1.00
Situation Awareness and Infrastructure Security 0.60 0.60 0.60 0.00
Total FTEs Operational Programs 55.95 53.20 56.70 0.75
Administrative Programs
Technical Committees and Member Forums 0.00 0.00 0.00 0.00
General & Administrative 2.30 4.30 4.30 2.00
Information Technology 5.20 5.50 6.00 0.80
Legal and Regulatory 0.25 2.00 2.00 1.75
Human Resources 2.40 2.00 2.00 -0.40
Finance and Accounting 1.90 2.00 2.00 0.10
Total FTEs Administrative Programs 12.05 15.80 16.30 4.25
Total FTEs 68.00 69.00 73.00 5.00
STATUTORY
*In 2010, with the recent growth and expected future growth, ReliabilityFirst commissioned an organizational study to evaluate the company. The study’s findings recommended a reallocation of existing resources in order for the company to maximize its efficiency and effectiveness. ReliabilityFirst executed this reallocation of resources in January 2011 and is reflected in the 2011 projections.
* and is reflected in the 2011 projectionsIncludes reallocation of existing staff
2011 Staffing Reallocation
Total FTEs by Program
Budget
2011
Reallocation
2011
Reorganization Results
2011
New Hires 2012
Total FTEs 2012
Budget
Reliability Standards 1.00
1.00
1.00 Compliance & Organization Registration & Certification 42.75 -3.75 39.00 3.50 42.50 Reliability Assessments & Performance Analysis 8.50
8.50 1.00 9.50
Training & Education 3.10
3.10
3.10 Situation Awareness & Infrastructure Security 0.60
0.60
0.60
General & Administrative 2.30 2.00 4.30
4.30
Legal & Regulatory 0.25 1.75 2.00
2.00
Information Technology 5.20 0.30 5.50 0.50 6.00
Human Resources 2.40 -0.40 2.00
2.00
Finance & Accounting 1.90 0.10 2.00
2.00
Total FTEs 68.00 0.00 68.00 5.00 73.00
Formatted ...
Formatted ...
Formatted ...
Formatted ...
Formatted ...
Formatted ...
Formatted ...
Formatted ...
Formatted ...
Formatted Table ...
Formatted ...
Formatted ...
Formatted ...
Formatted ...
Formatted ...
Formatted ...
Formatted ...
Formatted ...
Formatted ...
Formatted ...
Formatted ...
Formatted ...
Formatted ...
Formatted ...
Formatted ...
Formatted ...
Formatted ...
Formatted ...
Formatted ...
Formatted ...
Formatted ...
Formatted ...
Formatted ...
Formatted ...
Formatted ...
Formatted ...
Formatted ...
Formatted ...
Formatted ...
Formatted ...
Formatted ...
Formatted ...
Formatted ...
Formatted ...
Formatted ...
Formatted ...
Formatted ...
Formatted ...
Formatted ...
Formatted ...
Formatted ...
Formatted ...
Formatted ...
Formatted ...
Formatted ...
Formatted ...
Formatted ...
Formatted ...
Formatted ...
Formatted ...
Formatted ...
Formatted ...
Formatted ...
Formatted ...
Formatted ...
Formatted ...
Formatted ...
Formatted ...
Formatted ...
Formatted ...
Formatted ...

Introduction
2012 ReliabilityFirst Corporation Business Plan and Budget Approved by Board of Directors: April 22, 2011 for Stakeholder CommentJuly 8, 2011 16
Formatted: Font color: Text 1
Formatted: Font: Bold
Formatted: Normal
Formatted: Normal
Introduction
2012 ReliabilityFirst Corporation Business Plan and Budget Approved by Board of Directors: April 22, 2011 for Stakeholder CommentJuly 8, 2011 17
Formatted: Font color: Text 1
2011 Budget and Projection and 2012 Budget Comparisons

Introduction
2012 ReliabilityFirst Corporation Business Plan and Budget Approved by Board of Directors: April 22, 2011 for Stakeholder CommentJuly 8, 2011 18
Formatted: Font color: Text 1
Variance Variance
2011 Projection 2012 Budget
2011 2011 v 2011 Budget 2012 v 2011 Budget
Budget Projection Over(Under) Budget Over(Under)
Funding
ReliabilityFirst Funding
ReliabilityFirst Assessments 12,803,844$ 12,803,844$ -$ 13,534,272$ 730,428$
Penalty Sanctions 878,901 878,901 -$ 792,100 (86,801)
Total ReliabilityFirst Funding 13,682,745$ 13,682,745$ -$ 14,326,372$ 643,627$
Membership Dues -$ -$ -$ -$ -$
Federal Grants 0 - - - -
Services & Software 0 - - - -
Workshops 0 - - - -
Interest 40,000 40,000 - 60,000 20,000
Miscellaneous 0 - - - -
Total Funding 13,722,745$ 13,722,745$ -$ 14,386,372$ 663,627$
Expenses
Personnel Expenses
Salaries 8,307,760$ 8,564,518$ 256,758$ 9,637,622$ 1,329,862$
Payroll Taxes 560,486 561,888 1,402 581,453 20,967
Benefits 1,237,909 1,026,687 (211,222) 1,283,552 45,643
Retirement Costs 1,207,997 1,386,542 178,545 1,471,658 263,661
Total Personnel Expenses 11,314,152$ 11,539,635$ 225,483$ 12,974,285$ 1,660,133$
Meeting Expenses
Meetings 171,800$ 111,458$ (60,342)$ 144,630$ (27,170)$
Travel 728,200 689,481 (38,719) 686,950 (41,250)
Conference Calls 6,300 10,251 3,951 10,176 3,876
Total Meeting Expenses 906,300$ 811,190$ (95,110)$ 841,756$ (64,544)$
Operating Expenses
Consultants & Contracts 695,000$ 1,009,060$ 314,060$ 514,100$ (180,900)$
Office Rent 392,392 392,384 (8) 531,460 139,068
Office Costs 863,987 761,642 (102,345) 772,146 (91,841)
Professional Services 792,018 579,117 (212,901) 500,432 (291,586)
Miscellaneous 9,300 27,165 17,865 27,320 18,020
Depreciation 442,702 432,692 (10,010) 506,822 64,120
Total Operating Expenses 3,195,399$ 3,202,060$ 6,661$ 2,852,280$ (343,119)$
Total Direct Expenses 15,415,851$ 15,552,886$ 137,035$ 16,668,321$ 1,252,470$
Indirect Expenses -$ 0$ 0$ (0)$ (0)$
Other Non-Operating Expenses -$ -$ -$ -$ -$
Total Expenses 15,415,851$ 15,552,886$ 137,035$ 16,668,321$ 1,252,470$
Change in Assets (1,693,106)$ (1,830,141)$ (137,035)$ (2,281,949)$ (588,843)$
Fixed Assets
Depreciation (442,702) (432,692) 10,010 (506,822) (64,120)
Computer & Software CapEx 235,000 180,995 (54,005) 495,000 260,000
Furniture & Fixtures CapEx 11,500 10,100 (1,400) - (11,500)
Equipment CapEx - - - - -
Leasehold Improvements - 1,200 1,200 - -
(Incr)Dec in Fixed Assets 196,202$ 240,397$ 44,195$ 11,822$ (184,380)$
Allocation of Fixed Assets (2)$ (0)$ 2$ (0) 2$
Change in Fixed Assets 196,200$ 240,397$ 44,197$ 11,822$ (184,378)$
TOTAL CHANGE IN NET ASSETS (1,496,906)$ (1,589,743)$ (92,837)$ (2,270,128)$ (773,222)$
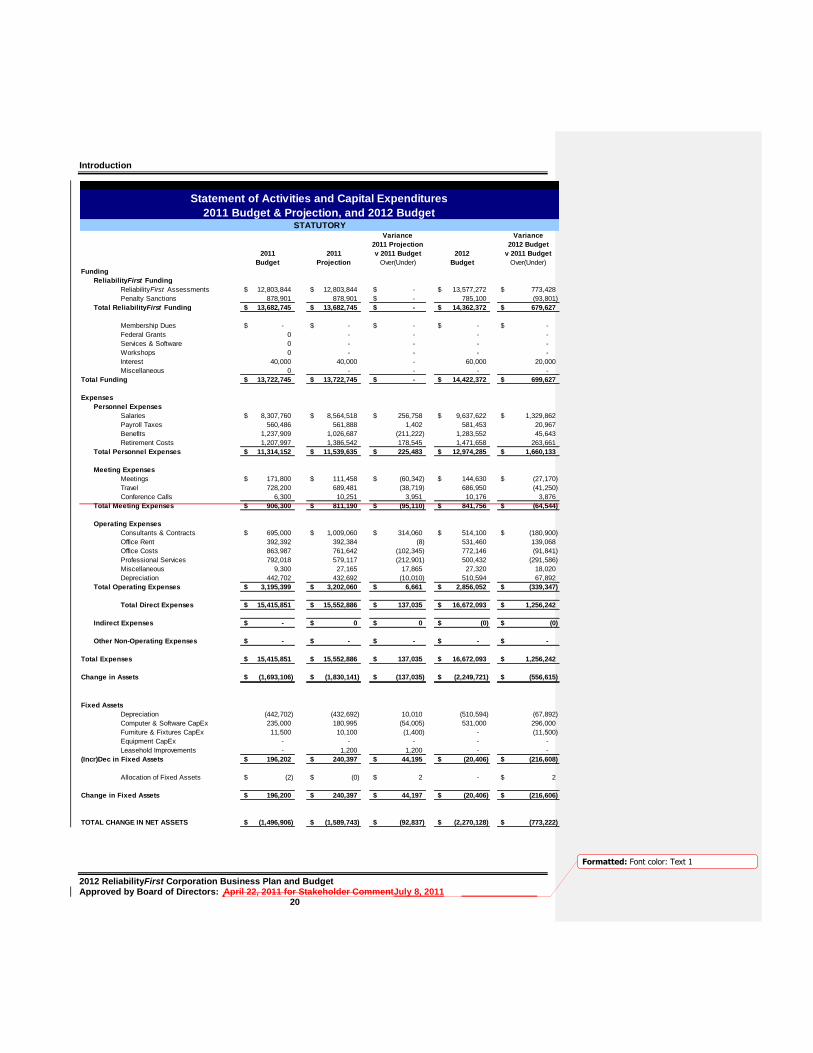
Statement of Activities and Capital Expenditures
2011 Budget & Projection, and 2012 BudgetSTATUTORY
Field Code Changed

Introduction
2012 ReliabilityFirst Corporation Business Plan and Budget Approved by Board of Directors: April 22, 2011 for Stakeholder CommentJuly 8, 2011 19
Formatted: Font color: Text 1
Variance Variance
2011 Projection 2012 Budget
2011 2011 v 2011 Budget 2012 v 2011 Budget
Budget Projection Over(Under) Budget Over(Under)
Funding
ReliabilityFirst Funding
ReliabilityFirst Assessments 12,803,844$ 12,803,844$ -$ 13,541,272$ 737,428$
Penalty Sanctions 878,901 878,901 -$ 785,100 (93,801)
Total ReliabilityFirst Funding 13,682,745$ 13,682,745$ -$ 14,326,372$ 643,627$
Membership Dues -$ -$ -$ -$ -$
Federal Grants 0 - - - -
Services & Software 0 - - - -
Workshops 0 - - - -
Interest 40,000 40,000 - 60,000 20,000
Miscellaneous 0 - - - -
Total Funding 13,722,745$ 13,722,745$ -$ 14,386,372$ 663,627$
Expenses
Personnel Expenses
Salaries 8,307,760$ 8,564,518$ 256,758$ 9,637,622$ 1,329,862$
Payroll Taxes 560,486 561,888 1,402 581,453 20,967
Benefits 1,237,909 1,026,687 (211,222) 1,283,552 45,643
Retirement Costs 1,207,997 1,386,542 178,545 1,471,658 263,661
Total Personnel Expenses 11,314,152$ 11,539,635$ 225,483$ 12,974,285$ 1,660,133$
Meeting Expenses
Meetings 171,800$ 111,458$ (60,342)$ 144,630$ (27,170)$
Travel 728,200 689,481 (38,719) 686,950 (41,250)
Conference Calls 6,300 10,251 3,951 10,176 3,876
Total Meeting Expenses 906,300$ 811,190$ (95,110)$ 841,756$ (64,544)$
Operating Expenses
Consultants & Contracts 695,000$ 1,009,060$ 314,060$ 514,100$ (180,900)$
Office Rent 392,392 392,384 (8) 531,460 139,068
Office Costs 863,987 761,642 (102,345) 772,146 (91,841)
Professional Services 792,018 579,117 (212,901) 500,432 (291,586)
Miscellaneous 9,300 27,165 17,865 27,320 18,020
Depreciation 442,702 432,692 (10,010) 506,822 64,120
Total Operating Expenses 3,195,399$ 3,202,060$ 6,661$ 2,852,280$ (343,119)$
Total Direct Expenses 15,415,851$ 15,552,886$ 137,035$ 16,668,321$ 1,252,470$
Indirect Expenses -$ 0$ 0$ (0)$ (0)$
Other Non-Operating Expenses -$ -$ -$ -$ -$
Total Expenses 15,415,851$ 15,552,886$ 137,035$ 16,668,321$ 1,252,470$
Change in Assets (1,693,106)$ (1,830,141)$ (137,035)$ (2,281,949)$ (588,843)$
Fixed Assets
Depreciation (442,702) (432,692) 10,010 (506,822) (64,120)
Computer & Software CapEx 235,000 180,995 (54,005) 495,000 260,000
Furniture & Fixtures CapEx 11,500 10,100 (1,400) - (11,500)
Equipment CapEx - - - - -
Leasehold Improvements - 1,200 1,200 - -
(Incr)Dec in Fixed Assets 196,202$ 240,397$ 44,195$ 11,822$ (184,380)$
Allocation of Fixed Assets (2)$ (0)$ 2$ (0) 2$
Change in Fixed Assets 196,200$ 240,397$ 44,197$ 11,822$ (184,378)$
TOTAL CHANGE IN NET ASSETS (1,496,906)$ (1,589,743)$ (92,837)$ (2,270,128)$ (773,222)$
Statement of Activities and Capital Expenditures
2011 Budget & Projection, and 2012 BudgetSTATUTORY
Introduction
2012 ReliabilityFirst Corporation Business Plan and Budget Approved by Board of Directors: April 22, 2011 for Stakeholder CommentJuly 8, 2011 20
Formatted: Font color: Text 1
Variance Variance
2011 Projection 2012 Budget
2011 2011 v 2011 Budget 2012 v 2011 Budget
Budget Projection Over(Under) Budget Over(Under)
Funding
ReliabilityFirst Funding
ReliabilityFirst Assessments 12,803,844$ 12,803,844$ -$ 13,577,272$ 773,428$
Penalty Sanctions 878,901 878,901 -$ 785,100 (93,801)
Total ReliabilityFirst Funding 13,682,745$ 13,682,745$ -$ 14,362,372$ 679,627$
Membership Dues -$ -$ -$ -$ -$
Federal Grants 0 - - - -
Services & Software 0 - - - -
Workshops 0 - - - -
Interest 40,000 40,000 - 60,000 20,000
Miscellaneous 0 - - - -
Total Funding 13,722,745$ 13,722,745$ -$ 14,422,372$ 699,627$
Expenses
Personnel Expenses
Salaries 8,307,760$ 8,564,518$ 256,758$ 9,637,622$ 1,329,862$
Payroll Taxes 560,486 561,888 1,402 581,453 20,967
Benefits 1,237,909 1,026,687 (211,222) 1,283,552 45,643
Retirement Costs 1,207,997 1,386,542 178,545 1,471,658 263,661
Total Personnel Expenses 11,314,152$ 11,539,635$ 225,483$ 12,974,285$ 1,660,133$
Meeting Expenses
Meetings 171,800$ 111,458$ (60,342)$ 144,630$ (27,170)$
Travel 728,200 689,481 (38,719) 686,950 (41,250)
Conference Calls 6,300 10,251 3,951 10,176 3,876
Total Meeting Expenses 906,300$ 811,190$ (95,110)$ 841,756$ (64,544)$
Operating Expenses
Consultants & Contracts 695,000$ 1,009,060$ 314,060$ 514,100$ (180,900)$
Office Rent 392,392 392,384 (8) 531,460 139,068
Office Costs 863,987 761,642 (102,345) 772,146 (91,841)
Professional Services 792,018 579,117 (212,901) 500,432 (291,586)
Miscellaneous 9,300 27,165 17,865 27,320 18,020
Depreciation 442,702 432,692 (10,010) 510,594 67,892
Total Operating Expenses 3,195,399$ 3,202,060$ 6,661$ 2,856,052$ (339,347)$
Total Direct Expenses 15,415,851$ 15,552,886$ 137,035$ 16,672,093$ 1,256,242$
Indirect Expenses -$ 0$ 0$ (0)$ (0)$
Other Non-Operating Expenses -$ -$ -$ -$ -$
Total Expenses 15,415,851$ 15,552,886$ 137,035$ 16,672,093$ 1,256,242$
Change in Assets (1,693,106)$ (1,830,141)$ (137,035)$ (2,249,721)$ (556,615)$
Fixed Assets
Depreciation (442,702) (432,692) 10,010 (510,594) (67,892)
Computer & Software CapEx 235,000 180,995 (54,005) 531,000 296,000
Furniture & Fixtures CapEx 11,500 10,100 (1,400) - (11,500)
Equipment CapEx - - - - -
Leasehold Improvements - 1,200 1,200 - -
(Incr)Dec in Fixed Assets 196,202$ 240,397$ 44,195$ (20,406)$ (216,608)$
Allocation of Fixed Assets (2)$ (0)$ 2$ - 2$
Change in Fixed Assets 196,200$ 240,397$ 44,197$ (20,406)$ (216,606)$
TOTAL CHANGE IN NET ASSETS (1,496,906)$ (1,589,743)$ (92,837)$ (2,270,128)$ (773,222)$
Statement of Activities and Capital Expenditures
2011 Budget & Projection, and 2012 BudgetSTATUTORY

Introduction
2012 ReliabilityFirst Corporation Business Plan and Budget Approved by Board of Directors: April 22, 2011 for Stakeholder CommentJuly 8, 2011 21
Formatted: Font color: Text 1
Variance Variance
2011 Projection 2012 Budget
2011 2011 v 2011 Budget 2012 v 2011 Budget
Budget Projection Over(Under) Budget Over(Under)
Funding
ReliabilityFirst Funding
ReliabilityFirst Assessments 12,803,844$ 12,803,844$ -$ 13,577,272$ 773,428$
Penalty Sanctions 878,901 878,901 -$ 785,100 (93,801)
Total ReliabilityFirst Funding 13,682,745$ 13,682,745$ -$ 14,362,372$ 679,627$
Membership Dues -$ -$ -$ -$ -$
Federal Grants 0 - - - -
Services & Software 0 - - - -
Workshops 0 - - - -
Interest 40,000 40,000 - 60,000 20,000
Miscellaneous 0 - - - -
Total Funding 13,722,745$ 13,722,745$ -$ 14,422,372$ 699,627$
Expenses
Personnel Expenses
Salaries 8,307,760$ 8,564,518$ 256,758$ 9,637,622$ 1,329,862$
Payroll Taxes 560,486 561,888 1,402 581,453 20,967
Benefits 1,237,909 1,026,687 (211,222) 1,283,552 45,643
Retirement Costs 1,207,997 1,386,542 178,545 1,471,658 263,661
Total Personnel Expenses 11,314,152$ 11,539,635$ 225,483$ 12,974,285$ 1,660,133$
Meeting Expenses
Meetings 171,800$ 111,458$ (60,342)$ 144,630$ (27,170)$
Travel 728,200 689,481 (38,719) 686,950 (41,250)
Conference Calls 6,300 10,251 3,951 10,176 3,876
Total Meeting Expenses 906,300$ 811,190$ (95,110)$ 841,756$ (64,544)$
Operating Expenses
Consultants & Contracts 695,000$ 1,009,060$ 314,060$ 514,100$ (180,900)$
Office Rent 392,392 392,384 (8) 531,460 139,068
Office Costs 863,987 761,642 (102,345) 772,146 (91,841)
Professional Services 792,018 579,117 (212,901) 500,432 (291,586)
Miscellaneous 9,300 27,165 17,865 27,320 18,020
Depreciation 442,702 432,692 (10,010) 510,594 67,892
Total Operating Expenses 3,195,399$ 3,202,060$ 6,661$ 2,856,052$ (339,347)$
Total Direct Expenses 15,415,851$ 15,552,886$ 137,035$ 16,672,093$ 1,256,242$
Indirect Expenses -$ 0$ 0$ (0)$ (0)$
Other Non-Operating Expenses -$ -$ -$ -$ -$
Total Expenses 15,415,851$ 15,552,886$ 137,035$ 16,672,093$ 1,256,242$
Change in Assets (1,693,106)$ (1,830,141)$ (137,035)$ (2,249,721)$ (556,615)$
Fixed Assets
Depreciation (442,702) (432,692) 10,010 (510,594) (67,892)
Computer & Software CapEx 235,000 180,995 (54,005) 531,000 296,000
Furniture & Fixtures CapEx 11,500 10,100 (1,400) - (11,500)
Equipment CapEx - - - - -
Leasehold Improvements - 1,200 1,200 - -
(Incr)Dec in Fixed Assets 196,202$ 240,397$ 44,195$ (20,406)$ (216,608)$
Allocation of Fixed Assets (2)$ (0)$ 2$ (0) 2$
Change in Fixed Assets 196,200$ 240,397$ 44,197$ (20,406)$ (216,606)$
TOTAL CHANGE IN NET ASSETS (1,496,906)$ (1,589,743)$ (92,837)$ (2,270,128)$ (773,222)$
Statement of Activities and Capital Expenditures
2011 Budget & Projection, and 2012 BudgetSTATUTORY
Formatted: Centered

2012 ReliabilityFirst Corporation Business Plan and Budget Approved by Board of Directors: April 22, 2011 for Stakeholder Comment 9
Formatted: Font color: Text 1
SSeeccttiioonn AA –– SSttaattuuttoorryy PPrrooggrraammss
22001122 BBuussiinneessss PPllaann aanndd BBuuddggeett
Section A — Statutory Programs Reliability Standards Program
2012 ReliabilityFirst Corporation Business Plan and Budget Approved by Board of Directors: April 22, 2011 for Stakeholder CommentJuly 8, 2011 23
Formatted: Font color: Text 1
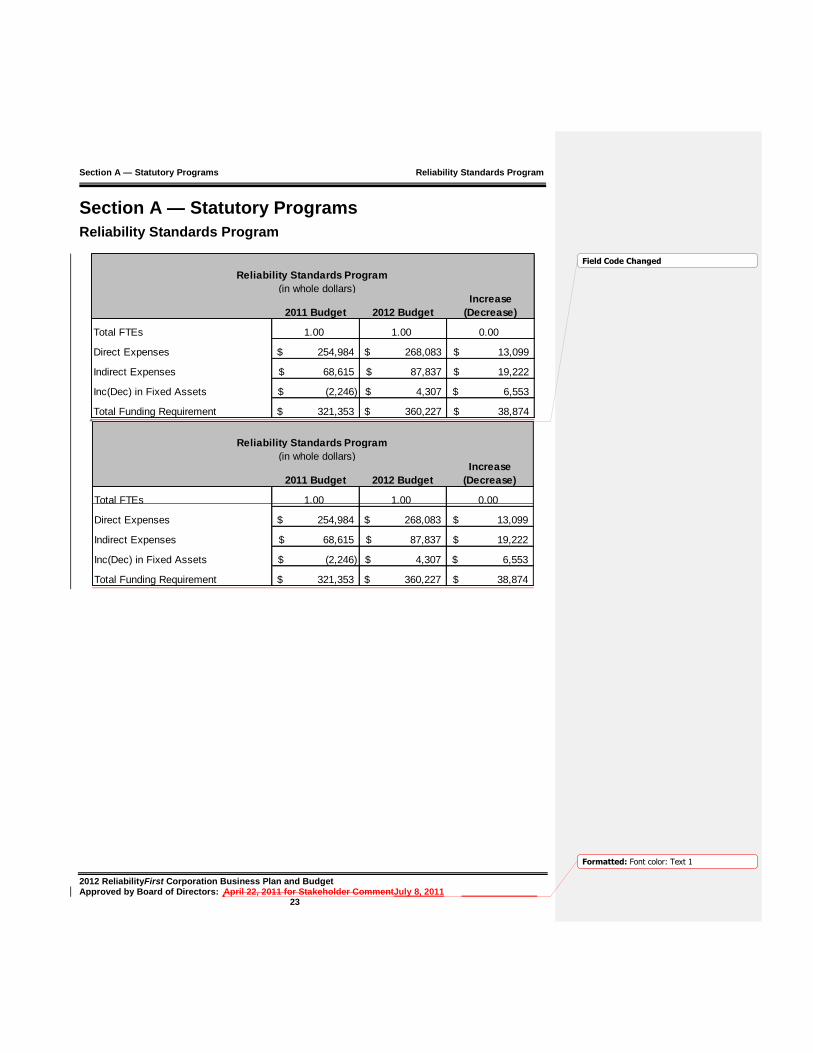
Section A — Statutory Programs
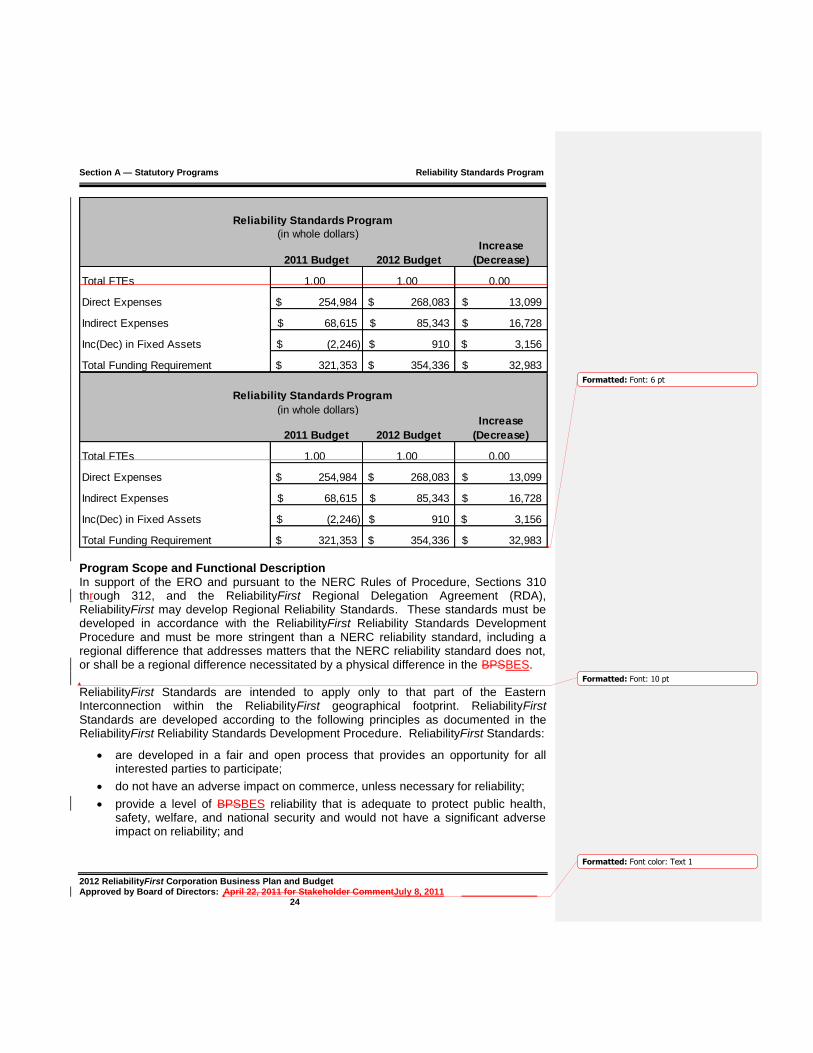
Reliability Standards Program
2011 Budget 2012 Budget
Increase
(Decrease)
Total FTEs 1.00 1.00 0.00
Direct Expenses 254,984$ 268,083$ 13,099$
Indirect Expenses 68,615$ 87,837$ 19,222$
Inc(Dec) in Fixed Assets (2,246)$ 4,307$ 6,553$
Total Funding Requirement 321,353$ 360,227$ 38,874$
Reliability Standards Program
(in whole dollars)
Field Code Changed
Section A — Statutory Programs Reliability Standards Program
2012 ReliabilityFirst Corporation Business Plan and Budget Approved by Board of Directors: April 22, 2011 for Stakeholder CommentJuly 8, 2011 24
Formatted: Font color: Text 1
2011 Budget 2012 Budget
Increase
(Decrease)
Total FTEs 1.00 1.00 0.00
Direct Expenses 254,984$ 268,083$ 13,099$
Indirect Expenses 68,615$ 85,343$ 16,728$
Inc(Dec) in Fixed Assets (2,246)$ 910$ 3,156$
Total Funding Requirement 321,353$ 354,336$ 32,983$
Reliability Standards Program
(in whole dollars)
Program Scope and Functional Description In support of the ERO and pursuant to the NERC Rules of Procedure, Sections 310 through 312, and the ReliabilityFirst Regional Delegation Agreement (RDA), ReliabilityFirst may develop Regional Reliability Standards. These standards must be developed in accordance with the ReliabilityFirst Reliability Standards Development Procedure and must be more stringent than a NERC reliability standard, including a regional difference that addresses matters that the NERC reliability standard does not, or shall be a regional difference necessitated by a physical difference in the BPSBES. ReliabilityFirst Standards are intended to apply only to that part of the Eastern Interconnection within the ReliabilityFirst geographical footprint. ReliabilityFirst Standards are developed according to the following principles as documented in the ReliabilityFirst Reliability Standards Development Procedure. ReliabilityFirst Standards:
are developed in a fair and open process that provides an opportunity for all interested parties to participate;
do not have an adverse impact on commerce, unless necessary for reliability;
provide a level of BPSBES reliability that is adequate to protect public health, safety, welfare, and national security and would not have a significant adverse impact on reliability; and
Formatted: Font: 6 pt
Formatted: Font: 10 pt

Section A — Statutory Programs Reliability Standards Program
2012 ReliabilityFirst Corporation Business Plan and Budget Approved by Board of Directors: April 22, 2011 for Stakeholder CommentJuly 8, 2011 25
Formatted: Font color: Text 1
are based on a justifiable difference between Regions or between sub-Regions within the Regional geographic area.
The standards staff will continue to provide the best direction and prioritization of Reliability Standards and the associated regional standards procedures by participating in NERC and other regional standard drafting efforts and related working groups and task forces.
1. Standards staff will continue to serve and volunteer to serve as members of NERC Standard Authorization Request (SAR) and Standard Drafting Teams, as appropriate.
2. Standards staff will continue to volunteer to participate on special NERC teams to develop plans and programs related to regional tasks. This will include special teams such as the Regional Standards Group (RSG), which facilitates the development of the regional standards process across regions.
The Standards Program relies on technical support from both the staff and stakeholder volunteers for standard drafting teams. The teams are facilitated by the Standards staff with program oversight directed through the ReliabilityFirst Standards Committee. The Standards staff will continue to keep the Standards Committee, Board of Directors, and all stakeholders informed of the progress in the development of ReliabilityFirst and NERC standards via public announcements, the corporate newsletter, webinars, and website postings. ReliabilityFirst anticipates that in 2012 the number of Regional standards related projects will be on the decline compared to previous years due to a number of standards projects nearing completion. In anticipation of approval of NERC continent wide standards in the 2011/2012 timeframe, weReliabilityFirst expects to revisit all associated ReliabilityFirst standards to remove all requirements that are duplicative and no longer needed for reliability. 2012 Key Assumptions The Reliability Standards Program incorporates regional specific common business planning assumptions as described in the ReliabilityFirst NERC 2012 Business Plan and Budget, Attachment Exhibit A: 2012 – 2015 Shared Business Planning and Budget Assumptions (NERC and the Regional Entities) document, including additional resources required for initiatives that support these shared ERO assumptions. There are no additional assumptions unique to ReliabilityFirst’s Reliability Standards Program. 2012 Key Deliverables
Submit to NERC, and subsequently file with FERC: any regional standards that are needed to support revised NERC
Reliability Standards, any regional standards that address reliability gaps not currently covered
by NERC Reliability Standards, and
Formatted: Space After: 10 pt
Formatted: Space After: 6 pt
Formatted: Font: 10 pt
Formatted: Font: 9 pt
Formatted: Font: 9 pt
Formatted: Font: 9 pt
Formatted: Font: 9 pt

Section A — Statutory Programs Reliability Standards Program
2012 ReliabilityFirst Corporation Business Plan and Budget Approved by Board of Directors: April 22, 2011 for Stakeholder CommentJuly 8, 2011 26
Formatted: Font color: Text 1
any regional standards that will be needed to provide an “interim” solution to reliability enhancement until replaced by revised NERC Reliability Standards.
Retire regional Reliability Standards that are duplicative with NERC Reliability Standards or no longer needed for reliability.
Prioritize the regional standards drafting effort to align with the timing of NERC Reliability Standards revisions.
Review and possibly modify the Reliability Standards Development Procedure to align with changing NERC and FERC requirements.
Initiate and coordinate revisions to regional Standards in any stage of development to align with NERC and FERC requirements.
Systematically extract requirements from legacy documents for developing regional Reliability Standards with subsequent retirement of the legacy documents.
Funding Sources and Requirements — Explanation of Variance Funding Source
Funding for this program in 2012 is provided through assessments to LSEs or designees (mandatory in the United States), as the Reliability sStandards pProgram is a statutory, delegated function.
Personnel Expenses
Salary, payroll taxes, benefits, savings, and retirement expenses costs for 2012 are budgeted for one FTE for this program area, consistent with 2011 levels. Therefore, with no change in the FTE level in this program the increase in personnelsalaries expenses is a result of budgeting for standard yearly increases. The decrease in payroll taxes, benefits and retirement costs is due to the use of more accurate data to establish better budget estimates.
Meeting Expenses
Meeting, travel, and conference call expenses in support of the ReliabilityFirst and NERC standard drafting teams will decrease due to downward trends of future standards related projects and the increased utilization of web-based media for virtual meetings.
Operating Expense
Operating expenses increased slightly due to increased office costs resulting from use of a company air card for internet and intranet access.
Indirect Expenses
Expenses related to indirect programs have been allocated proportionately based on FTE count to the direct programs for 2012. This method of accounting results in an increase compared to 2011. Because there is no change in FTEs in this program, the increase is due to higher Administrative Services expenditures allocated for 2012.
Formatted: Tab stops: Not at 0.5" + 0.75"
Formatted: Indent: Left: 0.5", No bullets ornumbering, Tab stops: Not at 0.75"

Section A — Statutory Programs Reliability Standards Program
2012 ReliabilityFirst Corporation Business Plan and Budget Approved by Board of Directors: April 22, 2011 for Stakeholder CommentJuly 8, 2011 27
Formatted: Font color: Text 1
Other Non-Operating Expenses
No other non-operating expenses are expected for 2012.
Fixed Asset Additions
No fixed asset additions are expected for 2012. Formatted: Space After: 0 pt

Section A — Statutory Programs Reliability Standards Program
2012 ReliabilityFirst Corporation Business Plan and Budget Approved by Board of Directors: April 22, 2011 for Stakeholder CommentJuly 8, 2011 28
Formatted: Font color: Text 1
Reliability Standards Program
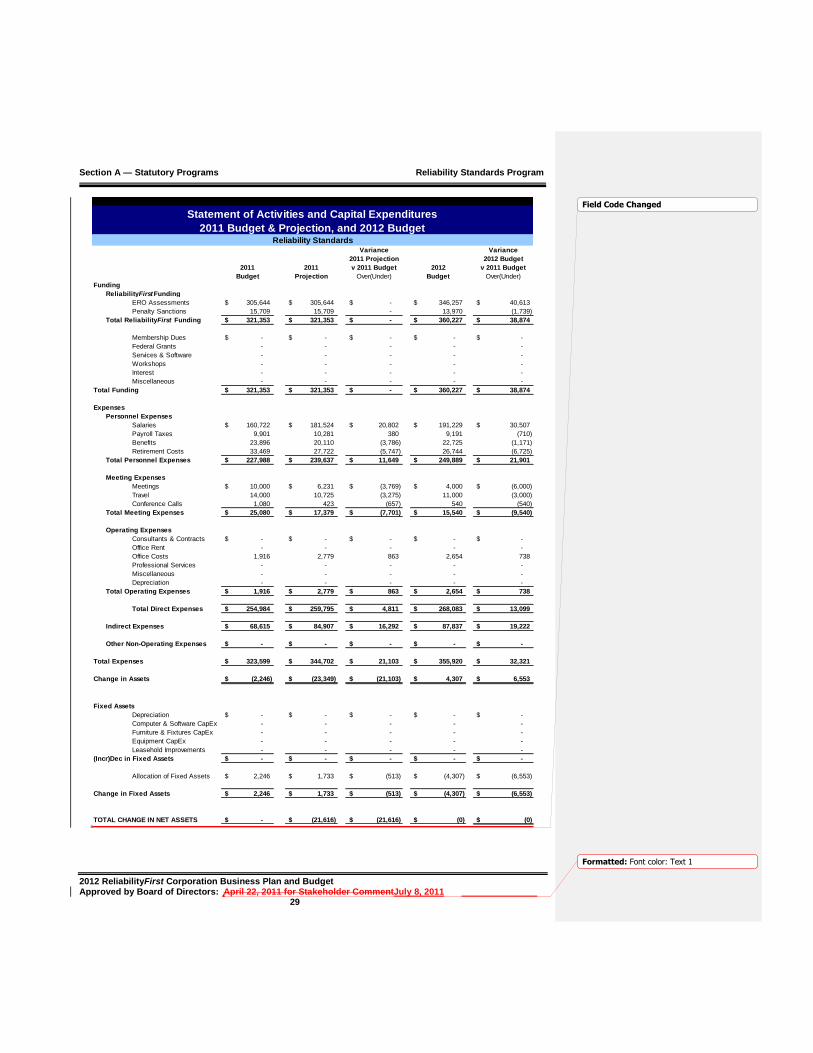
Funding sources and related expenses for the Reliability Standards section of the 2012 Business Plan and Budget are shown in the table below.
Section A — Statutory Programs Reliability Standards Program
2012 ReliabilityFirst Corporation Business Plan and Budget Approved by Board of Directors: April 22, 2011 for Stakeholder CommentJuly 8, 2011 29
Formatted: Font color: Text 1
Variance Variance
2011 Projection 2012 Budget
2011 2011 v 2011 Budget 2012 v 2011 Budget
Budget Projection Over(Under) Budget Over(Under)
Funding
ReliabilityFirstFunding
ERO Assessments 305,644$ 305,644$ -$ 346,257$ 40,613$
Penalty Sanctions 15,709 15,709 - 13,970 (1,739)
Total ReliabilityFirst Funding 321,353$ 321,353$ -$ 360,227$ 38,874$
Membership Dues -$ -$ -$ -$ -$
Federal Grants - - - - -
Services & Software - - - - -
Workshops - - - - -
Interest - - - - -
Miscellaneous - - - - -
Total Funding 321,353$ 321,353$ -$ 360,227$ 38,874$
Expenses
Personnel Expenses
Salaries 160,722$ 181,524$ 20,802$ 191,229$ 30,507$
Payroll Taxes 9,901 10,281 380 9,191 (710)
Benefits 23,896 20,110 (3,786) 22,725 (1,171)
Retirement Costs 33,469 27,722 (5,747) 26,744 (6,725)
Total Personnel Expenses 227,988$ 239,637$ 11,649$ 249,889$ 21,901$
Meeting Expenses
Meetings 10,000$ 6,231$ (3,769)$ 4,000$ (6,000)$
Travel 14,000 10,725 (3,275) 11,000 (3,000)
Conference Calls 1,080 423 (657) 540 (540)
Total Meeting Expenses 25,080$ 17,379$ (7,701)$ 15,540$ (9,540)$
Operating Expenses
Consultants & Contracts -$ -$ -$ -$ -$
Office Rent - - - - -
Office Costs 1,916 2,779 863 2,654 738
Professional Services - - - - -
Miscellaneous - - - - -
Depreciation - - - - -
Total Operating Expenses 1,916$ 2,779$ 863$ 2,654$ 738$
Total Direct Expenses 254,984$ 259,795$ 4,811$ 268,083$ 13,099$
Indirect Expenses 68,615$ 84,907$ 16,292$ 87,837$ 19,222$
Other Non-Operating Expenses -$ -$ -$ -$ -$
Total Expenses 323,599$ 344,702$ 21,103$ 355,920$ 32,321$
Change in Assets (2,246)$ (23,349)$ (21,103)$ 4,307$ 6,553$
Fixed Assets
Depreciation -$ -$ -$ -$ -$
Computer & Software CapEx - - - - -
Furniture & Fixtures CapEx - - - - -
Equipment CapEx - - - - -
Leasehold Improvements - - - - -
(Incr)Dec in Fixed Assets -$ -$ -$ -$ -$
Allocation of Fixed Assets 2,246$ 1,733$ (513)$ (4,307)$ (6,553)$
Change in Fixed Assets 2,246$ 1,733$ (513)$ (4,307)$ (6,553)$
TOTAL CHANGE IN NET ASSETS -$ (21,616)$ (21,616)$ (0)$ (0)$
Statement of Activities and Capital Expenditures
2011 Budget & Projection, and 2012 BudgetReliability Standards
Field Code Changed

Section A — Statutory Programs Reliability Standards Program
2012 ReliabilityFirst Corporation Business Plan and Budget Approved by Board of Directors: April 22, 2011 for Stakeholder CommentJuly 8, 2011 30
Formatted: Font color: Text 1
Variance Variance
2011 Projection 2012 Budget
2011 2011 v 2011 Budget 2012 v 2011 Budget
Budget Projection Over(Under) Budget Over(Under)
Funding
ReliabilityFirstFunding
ERO Assessments 305,644$ 305,644$ -$ 346,380$ 40,736$
Penalty Sanctions 15,709 15,709 - 13,847 (1,862)
Total ReliabilityFirst Funding 321,353$ 321,353$ -$ 360,227$ 38,874$
Membership Dues -$ -$ -$ -$ -$
Federal Grants - - - - -
Services & Software - - - - -
Workshops - - - - -
Interest - - - - -
Miscellaneous - - - - -
Total Funding 321,353$ 321,353$ -$ 360,227$ 38,874$
Expenses
Personnel Expenses
Salaries 160,722$ 181,524$ 20,802$ 191,229$ 30,507$
Payroll Taxes 9,901 10,281 380 9,191 (710)
Benefits 23,896 20,110 (3,786) 22,725 (1,171)
Retirement Costs 33,469 27,722 (5,747) 26,744 (6,725)
Total Personnel Expenses 227,988$ 239,637$ 11,649$ 249,889$ 21,901$
Meeting Expenses
Meetings 10,000$ 6,231$ (3,769)$ 4,000$ (6,000)$
Travel 14,000 10,725 (3,275) 11,000 (3,000)
Conference Calls 1,080 423 (657) 540 (540)
Total Meeting Expenses 25,080$ 17,379$ (7,701)$ 15,540$ (9,540)$
Operating Expenses
Consultants & Contracts -$ -$ -$ -$ -$
Office Rent - - - - -
Office Costs 1,916 2,779 863 2,654 738
Professional Services - - - - -
Miscellaneous - - - - -
Depreciation - - - - -
Total Operating Expenses 1,916$ 2,779$ 863$ 2,654$ 738$
Total Direct Expenses 254,984$ 259,795$ 4,811$ 268,083$ 13,099$
Indirect Expenses 68,615$ 84,907$ 16,292$ 87,837$ 19,222$
Other Non-Operating Expenses -$ -$ -$ -$ -$
Total Expenses 323,599$ 344,702$ 21,103$ 355,920$ 32,321$
Change in Assets (2,246)$ (23,349)$ (21,103)$ 4,307$ 6,553$
Fixed Assets
Depreciation -$ -$ -$ -$ -$
Computer & Software CapEx - - - - -
Furniture & Fixtures CapEx - - - - -
Equipment CapEx - - - - -
Leasehold Improvements - - - - -
(Incr)Dec in Fixed Assets -$ -$ -$ -$ -$
Allocation of Fixed Assets 2,246$ 1,733$ (513)$ (4,307)$ (6,553)$
Change in Fixed Assets 2,246$ 1,733$ (513)$ (4,307)$ (6,553)$
TOTAL CHANGE IN NET ASSETS -$ (21,616)$ (21,616)$ (0)$ (0)$
Statement of Activities and Capital Expenditures
2011 Budget & Projection, and 2012 BudgetReliability Standards

Section A — Statutory Programs Reliability Standards Program
2012 ReliabilityFirst Corporation Business Plan and Budget Approved by Board of Directors: April 22, 2011 for Stakeholder CommentJuly 8, 2011 31
Formatted: Font color: Text 1
Variance Variance
2011 Projection 2012 Budget
2011 2011 v 2011 Budget 2012 v 2011 Budget
Budget Projection Over(Under) Budget Over(Under)
Funding
ReliabilityFirstFunding
ERO Assessments 305,644$ 305,644$ -$ 340,490$ 34,846$
Penalty Sanctions 15,709 15,709 - 13,847 (1,862)
Total ReliabilityFirst Funding 321,353$ 321,353$ -$ 354,336$ 32,983$
Membership Dues -$ -$ -$ -$ -$
Federal Grants - - - - -
Services & Software - - - - -
Workshops - - - - -
Interest - - - - -
Miscellaneous - - - - -
Total Funding 321,353$ 321,353$ -$ 354,336$ 32,983$
Expenses
Personnel Expenses
Salaries 160,722$ 181,524$ 20,802$ 191,229$ 30,507$
Payroll Taxes 9,901 10,281 380 9,191 (710)
Benefits 23,896 20,110 (3,786) 22,725 (1,171)
Retirement Costs 33,469 27,722 (5,747) 26,744 (6,725)
Total Personnel Expenses 227,988$ 239,637$ 11,649$ 249,889$ 21,901$
Meeting Expenses
Meetings 10,000$ 6,231$ (3,769)$ 4,000$ (6,000)$
Travel 14,000 10,725 (3,275) 11,000 (3,000)
Conference Calls 1,080 423 (657) 540 (540)
Total Meeting Expenses 25,080$ 17,379$ (7,701)$ 15,540$ (9,540)$
Operating Expenses
Consultants & Contracts -$ -$ -$ -$ -$
Office Rent - - - - -
Office Costs 1,916 2,779 863 2,654 738
Professional Services - - - - -
Miscellaneous - - - - -
Depreciation - - - - -
Total Operating Expenses 1,916$ 2,779$ 863$ 2,654$ 738$
Total Direct Expenses 254,984$ 259,795$ 4,811$ 268,083$ 13,099$
Indirect Expenses 68,615$ 84,907$ 16,292$ 85,343$ 16,728$
Other Non-Operating Expenses -$ -$ -$ -$ -$
Total Expenses 323,599$ 344,702$ 21,103$ 353,426$ 29,827$
Change in Assets (2,246)$ (23,349)$ (21,103)$ 910$ 3,156$
Fixed Assets
Depreciation -$ -$ -$ -$ -$
Computer & Software CapEx - - - - -
Furniture & Fixtures CapEx - - - - -
Equipment CapEx - - - - -
Leasehold Improvements - - - - -
(Incr)Dec in Fixed Assets -$ -$ -$ -$ -$
Allocation of Fixed Assets 2,246$ 1,733$ (513)$ (910)$ (3,156)$
Change in Fixed Assets 2,246$ 1,733$ (513)$ (910)$ (3,156)$
TOTAL CHANGE IN NET ASSETS -$ (21,616)$ (21,616)$ (0)$ (0)$
Statement of Activities and Capital Expenditures
2011 Budget & Projection, and 2012 BudgetReliability Standards

Section A — Statutory Programs Reliability Standards Program
2012 ReliabilityFirst Corporation Business Plan and Budget Approved by Board of Directors: April 22, 2011 for Stakeholder CommentJuly 8, 2011 32
Formatted: Font color: Text 1
Variance Variance
2011 Projection 2012 Budget
2011 2011 v 2011 Budget 2012 v 2011 Budget
Budget Projection Over(Under) Budget Over(Under)
Funding
ReliabilityFirstFunding
ERO Assessments 305,644$ 305,644$ -$ 340,490$ 34,846$
Penalty Sanctions 15,709 15,709 - 13,847 (1,862)
Total ReliabilityFirst Funding 321,353$ 321,353$ -$ 354,336$ 32,983$
Membership Dues -$ -$ -$ -$ -$
Federal Grants - - - - -
Services & Software - - - - -
Workshops - - - - -
Interest - - - - -
Miscellaneous - - - - -
Total Funding 321,353$ 321,353$ -$ 354,336$ 32,983$
Expenses
Personnel Expenses
Salaries 160,722$ 181,524$ 20,802$ 191,229$ 30,507$
Payroll Taxes 9,901 10,281 380 9,191 (710)
Benefits 23,896 20,110 (3,786) 22,725 (1,171)
Retirement Costs 33,469 27,722 (5,747) 26,744 (6,725)
Total Personnel Expenses 227,988$ 239,637$ 11,649$ 249,889$ 21,901$
Meeting Expenses
Meetings 10,000$ 6,231$ (3,769)$ 4,000$ (6,000)$
Travel 14,000 10,725 (3,275) 11,000 (3,000)
Conference Calls 1,080 423 (657) 540 (540)
Total Meeting Expenses 25,080$ 17,379$ (7,701)$ 15,540$ (9,540)$
Operating Expenses
Consultants & Contracts -$ -$ -$ -$ -$
Office Rent - - - - -
Office Costs 1,916 2,779 863 2,654 738
Professional Services - - - - -
Miscellaneous - - - - -
Depreciation - - - - -
Total Operating Expenses 1,916$ 2,779$ 863$ 2,654$ 738$
Total Direct Expenses 254,984$ 259,795$ 4,811$ 268,083$ 13,099$
Indirect Expenses 68,615$ 84,907$ 16,292$ 85,343$ 16,728$
Other Non-Operating Expenses -$ -$ -$ -$ -$
Total Expenses 323,599$ 344,702$ 21,103$ 353,426$ 29,827$
Change in Assets (2,246)$ (23,349)$ (21,103)$ 910$ 3,156$
Fixed Assets
Depreciation -$ -$ -$ -$ -$
Computer & Software CapEx - - - - -
Furniture & Fixtures CapEx - - - - -
Equipment CapEx - - - - -
Leasehold Improvements - - - - -
(Incr)Dec in Fixed Assets -$ -$ -$ -$ -$
Allocation of Fixed Assets 2,246$ 1,733$ (513)$ (910)$ (3,156)$
Change in Fixed Assets 2,246$ 1,733$ (513)$ (910)$ (3,156)$
TOTAL CHANGE IN NET ASSETS -$ (21,616)$ (21,616)$ (0)$ (0)$
Statement of Activities and Capital Expenditures
2011 Budget & Projection, and 2012 BudgetReliability Standards

Section A — Statutory Programs Compliance Monitoring, and Enforcement, and Organization and Certification Program
2012 ReliabilityFirst Corporation Business Plan and Budget Approved by Board of Directors: April 22, 2011 for Stakeholder CommentJuly 8, 2011 33
Formatted: Font color: Text 1
Compliance Monitoring, and Enforcement, and Organization Registration and Certification Program
2011 Budget 2012 Budget
Increase
(Decrease)
Total FTEs 42.75 42.50 (0.25)
Direct Expenses 8,612,632$ 8,690,201$ 77,569$
Indirect Expenses 2,933,312$ 3,733,052$ 799,740$
Inc(Dec) in Fixed Assets (169,350)$ (72,069)$ 97,281$
Total Funding Requirement 11,376,594$ 12,351,183$ 974,589$
Compliance Monitoring, and Enforcement, and Organization Registration and
Certification Program
(in whole dollars)
2011 Budget 2012 Budget
Increase
(Decrease)
Total FTEs 42.75 42.50 (0.25)
Direct Expenses 8,612,632$ 8,690,201$ 77,569$
Indirect Expenses 2,933,312$ 3,733,052$ 799,740$
Inc(Dec) in Fixed Assets (169,350)$ (72,069)$ 97,281$
Total Funding Requirement 11,376,594$ 12,351,183$ 974,589$
Compliance Monitoring and Enforcement and Organization Registration and
Certification Program
(in whole dollars)
Field Code Changed

Section A — Statutory Programs Compliance Monitoring, and Enforcement, and Organization and Certification Program
2012 ReliabilityFirst Corporation Business Plan and Budget Approved by Board of Directors: April 22, 2011 for Stakeholder CommentJuly 8, 2011 34
Formatted: Font color: Text 1
2011 Budget 2012 Budget
Increase
(Decrease)
Total FTEs 42.75 42.50 (0.25)
Direct Expenses 8,612,632$ 8,690,373$ 77,741$
Indirect Expenses 2,933,312$ 3,627,064$ 693,752$
Inc(Dec) in Fixed Assets (169,350)$ (216,606)$ (47,256)$
Total Funding Requirement 11,376,594$ 12,100,831$ 724,237$
Compliance Monitoring and Enforcement and Organization Registration and
Certification Program
(in whole dollars)
Program Scope and Functional Description The Compliance Monitoring, and Enforcement, and Organization Registration and Certification Program is structured to establish and prepare staff to achieve maximum effectiveness, inter- and intra-regional consistency, and the requisite due diligence in monitoring, investigations and assessments, data and status reporting, enforcement actions, settlement activities, and hearing proceedings with regard to compliance to the Reliability Standards.
ReliabilityFirst will monitor compliance to Reliability Standards through a variety of processes including:
Compliance Audits of the registered owners, operators, and users of the BPSBES against standard requirements applicable to their respective functions. Spot checking of individual standard requirements as a planned assessment of compliance to selected standards. Validation of self-certifications, mitigation plans, and/or other follow-up activities.
Self-certification with associated verifications and sSelf-reporting by owners, operators, and users of the BPSBES.
Investigations of events and complaints received from owners, operators, and users of the BPSBES and other persons and entities interested in the reliable operation of the BPSBES, including government entities.
Section A — Statutory Programs Compliance Monitoring, and Enforcement, and Organization and Certification Program
2012 ReliabilityFirst Corporation Business Plan and Budget Approved by Board of Directors: April 22, 2011 for Stakeholder CommentJuly 8, 2011 35
Formatted: Font color: Text 1
Data sSubmittals for standards to support reporting requirements as indicated in the standards, studies, modeling, and seasonal assessments.
Exception Rreport monitoring to ensure entities are appropriately assessing compliance to Reliability Standards where routine monitoring is not in place.
Risk-based assessments conducted of Registered Entities to determine the scope of compliance monitoring.
Development of lessons learned, which requires a review of all aspects of the compliance monitoring processes and corrective action activities resulting from an entity’s performance.
Mitigation plan activities associated with violations including:
Review of mitigation plans for effective corrective action and acceptance.
Verification of mitigation plan completion through the evaluation of evidence provided by entities to demonstrate that appropriate actions have been implemented according to established milestones and to ensure the entity has returned to compliance.
Communication with enforcement case managers and the registered entity throughout the mitigation plan review process to ensure that corrective actions will prevent reoccurrence, mitigate the violation, and return the entity to compliance.
To facilitate compliance monitoring and enforcement activities, all owners, operators, and users of the BPS BES are required to register for the functions that are applicable to their organizations. ReliabilityFirst maintains organization registration information and regularly submits updated registration information to NERC, which maintains the official compliance registry. Certification of organizations performing reliability responsibilities will continue for entities required to satisfy the key operational registered functions. Organization registration and certification are ongoing activities. The industry has requested that all compliance personnel receive formal training and certification. To address this request, ReliabilityFirst has included in its manpower analysis three weeks of training for the entire compliance staff. The current workload, which exceeds the available resources, is not anticipated to diminish in future years, but remain the same or grow.
2012 Key Assumptions The Compliance Monitoring and Enforcement and Organization Registration and Certification Program incorporates regional specific common business planning assumptions as described in the ReliabilityFirst NERC 2012 Business Plan and Budget, Attachment Exhibit A: 2012 – 2015 Shared Business Planning and Budget Assumptions (NERC and the Regional Entities) document, including additional resources required for initiatives that support these shared ERO goals. The ReliabilityFirst Compliance
Formatted: Default, Left
Section A — Statutory Programs Compliance Monitoring, and Enforcement, and Organization and Certification Program
2012 ReliabilityFirst Corporation Business Plan and Budget Approved by Board of Directors: April 22, 2011 for Stakeholder CommentJuly 8, 2011 36
Formatted: Font color: Text 1
Monitoring and Enforcement and Organization and Certification Program include the following unique regional assumptions:
1. Compliance monitoring will transition to a risk and performance based process where monitoring of entities will be determined by an entity’s risk to BPSBES reliability. As a result of these assessments, audits may increase in depth and complexity with greater utilization of unscheduled audits or spot checks. While some audits will be more in-depth and of greater complexity, other audits may require less monitoring activities. This change in methodologymonitoring is not expected to result in a reduction in resource needs during the 2012 - 2015 timeframe.
2.1. Audits, which will continue under a schedule to complete BA, TOP, and RC audits every three years and other entities every six years, will focus on a risk and performance based review of the individual entity. Where necessary, audits will have an increase in depth and complexity, including an increased number of unscheduled audits. While some audits will be more in-depth and of greater complexity, other audits may require less resource allocation based on the risk-and performance-based assessment of each entity. ReliabilityFirst may nevertheless find it necessary to increase audit resources to satisfy these workload requirements.
3.2. ReliabilityFirst and NERC continue to collaborate and define ongoing training needs, priorities, and implementation schedules for the auditors, enforcement, and investigation staff. As part of the training effort, at least two auditor workshops and monthly auditor calls will occur to provide auditors with updates on compliance policies, actions, and requirements in order to promote consistency of audit practices and procedures. It is expected that this training and possible certification effort will have an impact on staffing needs and costs (e.g., travel and lodging) to participate and attend and participate in this training.
4.3. ReliabilityFirst has provided time for staff to maintain industry certifications, such as NERC System Operator Certification and Critical Infrastructure Protection (CIP) certifications, etc. Additional time to incorporate the appropriate audit and investigative skills is also included.
5.4. ReliabilityFirst will work with NERC to provide timely publication of lessons learned and recommendations and track responses to recommendations on compliance related issues and concerns.
6.5. ReliabilityFirst will work with NERC to place priority on developing educational materials for Registered Entities regarding expectations for new and existing Reliability Standards. ReliabilityFirst is anticipating the need to conduct or participate in training sessions, or workshops to provide guidance and instruction on the MOD standards in 2012 and 2013. Given the complexity and number of standards and requirements that are being enhanced, changed, etc., these will be required in the near term to develop guidance and training to the industry on all of the new and emerging enhanced standards.
7.1. ReliabilityFirst hosts a minimum of two reliability workshops each year and monthly “open” compliance calls.
Formatted: Font: 6 pt
Section A — Statutory Programs Compliance Monitoring, and Enforcement, and Organization and Certification Program
2012 ReliabilityFirst Corporation Business Plan and Budget Approved by Board of Directors: April 22, 2011 for Stakeholder CommentJuly 8, 2011 37
Formatted: Font color: Text 1
8.1. ReliabilityFirst will work with NERC and assist in implementing at least two workshops for Regional Auditors focusing on consistency issues, auditor performance, and related issues.
9.1. ReliabilityFirst will support the CIP audits with personnel from the operations and planning (OP/PLAN) area as means to share the OP/PLAN experience in performing audits and technical knowledge of the BPS. ReliabilityFirst has been cross training auditors in both areas and will continue to support the effort in 2012.
2012 Key Deliverables
Manage all compliance activities in an unbiased, fair, and consistent manner, affording all Registered Entities appropriate due process.
Ensure all auditors receive training and meet all NERC auditor training requirements.
Develop and enhance processes, databases, and reporting tools for accurate tracking and reporting of compliance activities including compliance audits, spot checks, self-certifications, alleged and confirmed violations of Reliability Standards, penalty and sanction actions, settlements, hearings, disposition of all violations, mitigation plans, and management of the compliance monitoring process records.
Maintain a reporting relationship with NERC and establish processes and procedures to report monitoring results, violations, levied penalties and sanctions, and track mitigation plans and settlement actions for violations. Also, develop trending information of compliance activities to identify any trends requiring action.
Manage all enforcement actions to ensure consistent application of penalties for violations of Reliability Standards.
Prepare and distribute notices of violations and penalty determinations associated with compliance violations.
Prepare and distribute all compliance monitoring process reports to NERC and Registered Entities.
Provide enhanced analysis reports of violations and violation trends of Reliability Standards to the ReliabilityFirst Board Compliance Committee and NERC.
Identify trends pertaining to problem areas, entities that may require additional follow-up review, and communicate any lessons learned to other Registered Entities while protecting confidentiality.
Support the development of the compliance elements for all new or revised Reliability Standards within the ReliabilityFirst and NERC Standards Program. Support NERC standards drafting teams as resources are available.
Increase efficiencies across all areas to reduce redundancy and increase productivity.
Formatted: Space After: 0 pt

Section A — Statutory Programs Compliance Monitoring, and Enforcement, and Organization and Certification Program
2012 ReliabilityFirst Corporation Business Plan and Budget Approved by Board of Directors: April 22, 2011 for Stakeholder CommentJuly 8, 2011 38
Formatted: Font color: Text 1
Investigations & Compliance Services
Program Scope and Functional Description The Investigations and Compliance Services functions include: compliance investigations, organization registration, organization certification, serving as a technical resource for the Corporation, event analysis compliance review, mitigation plan reviews, assessment of self-certifications and periodic data submittals, reviewing complaints, and developing lessons learned.
2012 Key Assumptions The Investigations and Compliance Services area incorporates regional specific common business planning assumptions as described in the ReliabilityFirst NERC 2012 Business Plan and Budget, Attachment Exhibit, A: 2012 – 2015 Shared Business Planning and Budget Assumptions (NERC and the Regional Entities) document, including additional resources required for initiatives that support these shared ERO goals. The ReliabilityFirst Investigations and Compliance Services area include the following unique regional assumptions:
1. ReliabilityFirst will refine the criteria and process to encourage prompt and complete compliance self-analysis of events and disturbances to promote continuous improvement and information sharing. The number of events requiring this review and analysis is expected to be significant.
2. ReliabilityFirst will work to streamline and improve the speed of compliance investigations and look for ways to establish meaningful linkages to event and disturbance analysis.
3. ReliabilityFirst expects to conduct at a minimum thirty new event reviews from a compliance perspective, initiate three new compliance investigations, and anticipates receiving three new complaints. New criteria being developed indicates that all unplanned, multiple-facility trips will be considered candidates for these reviews. If the criteria or process changes, this effort could significantly impact staffing requirements.
4. ReliabilityFirst assumes that a uniform Bulk Electric System (BES) definition will be implemented in 2012 and it will result in increased workload for ReliabilityFirst to handle exclusion requests in 2012 and 2013, along with other monitoring activity workload increases.
5. The numbers of Joint Registration Organization, Coordinated Functional Registration, and Multi-Regional Entity RegistrationRegistered Entity (MRRE) documents are expected to increase as entities better delineate shared responsibilities and seek to achieve efficiency and effectiveness in compliance. This increase will have a direct impact on the workload associated with registration within the Region.
6. ReliabilityFirst does not expect a significant number of registration challenges, with efforts in registration focusing on refining the current registries across the Region. However, with the continued business merging activities in the
Formatted: Space After: 0 pt
Formatted: Font: 6 pt
Formatted: Indent: Left: 0.25", Space After: 0 pt
Section A — Statutory Programs Compliance Monitoring, and Enforcement, and Organization and Certification Program
2012 ReliabilityFirst Corporation Business Plan and Budget Approved by Board of Directors: April 22, 2011 for Stakeholder CommentJuly 8, 2011 39
Formatted: Font color: Text 1
industry, registration changes are anticipated and will require administrative, technical, and legal reviews.
2012 Key Deliverables
Assist NERC in developing compliance processes for triage, analysis, and reporting of system events.
Develop criteria and a process to encourage prompt and complete compliance self-analysis of events and disturbances.
Work toward streamlining the compliance investigation process.
Develop material for Registered Entities regarding expectations for new and existing Reliability Standards.
Review all entity event analyses from a compliance perspective and make a timely decision whether additional compliance assessments are necessary.
Process the Joint Registration Organization, Coordinated Functional Registration, and Multi-Regional Entity RegistrationMRRE documents in a timely fashion.
Formatted: Space After: 0 pt

Section A — Statutory Programs Compliance Monitoring, and Enforcement, and Organization and Certification Program
2012 ReliabilityFirst Corporation Business Plan and Budget Approved by Board of Directors: April 22, 2011 for Stakeholder CommentJuly 8, 2011 40
Formatted: Font color: Text 1
Compliance Audits
Program Scope and Functional Description The Compliance Audit area is responsible for the completion of the operations and planning (OP/PLAN) audits and spot checks, which address the FERC Order 693 Reliability Standards, and spot checks, support for CIP aAudits, support for investigations and certifications, and provides technical resources and support as needed for mitigation plan reviews and other issues concerning the overall corporation or its Registered Entities. The Compliance Audit area is also responsible for the completion of risk-based assessments as part of the monitoring processes and ensuring consistency of the audit and spot check processes for the Reliability Standards.
2012 Key Assumptions The Compliance Audit area incorporates regional specific common business planning assumptions as described in the ReliabilityFirst NERC 2012 Business Plan and Budget, Attachment Exhibit A: 2012 – 2015 Shared Business Planning and Budget Assumptions document, including additional resources required for initiatives that support these shared ERO goals. The ReliabilityFirst Compliance Audit area includes the following unique regional assumptions:
1. The 2012 compliance audits are expected to include the new MOD Reliability Standards and the evolving TPL standards.
2.1. Audits will continue under a schedule to complete the BA, TOP, RC, or TOs identified as a local control center within PJM (TO/LCCs) every three years. All Registered Entities that are registered for other functions, (GO, GOP, LESE, etc.) will be audited every six years. Audits for Registered Entities of other functions may transition to a period more reflective of their risk profile of Registered Entities over the planning period.
3.2. Audits will focus on a risk- and performance based review of the individual entity. Where necessary, audits will have an increase in depth and complexity, including an increased number of unscheduled audits. While some audits will be more in-depth and of greater complexity, other audits may require less resource allocation based on the risk-and performance-based assessment of each entity. ReliabilityFirst may nevertheless find it necessary to increase audit resources to satisfy these workload requirements.Compliance
monitoring will transition to a risk and performance based process where monitoring
of entities will be determined by an entity’s risk to BPS reliability. As a result of
these assessments, audits may increase in depth and complexity with greater
utilization of unscheduled audits or spot checks. While some audits will be more in-
depth and of greater complexity, other audits may require less monitoring activities.
This change in methodology is not expected to result in a reduction in resource needs during the 2012- 2015 timeframe.
4.3. It is expected that spot checks will increase over the next three years in
conjunction with the implementation of a risk-based approach to compliance
monitoring. This may increase auditor time and resources, however appropriately
scoped spot checks based on entity risk and performance profiles should lead to
Formatted: Space After: 0 pt
Formatted: Font: 6 pt
Formatted: Indent: Left: 0.25"
Formatted: Font: Not Italic, No underline,Font color: Auto
Formatted: Font: (Default) Arial, No underline,Font color: Auto
Formatted: Font: (Default) Arial

Section A — Statutory Programs Compliance Monitoring, and Enforcement, and Organization and Certification Program
2012 ReliabilityFirst Corporation Business Plan and Budget Approved by Board of Directors: April 22, 2011 for Stakeholder CommentJuly 8, 2011 41
Formatted: Font color: Text 1
a focused and efficient monitoring program. Notwithstanding these
improvements in efficiency, ReliabilityFirst may be required to increase its audit
staff as a result.
5.4. Compliance Audit staff will support the NERC CIP Sufficiency Review
Program and CIP Audit Program as needed in 2012, which is an additional effort
supported by Compliance Audit staff. Per FERC, the Regional Entities should
support the CIP audits with personnel from the OP/PLAN area as a means to
share the OP/PLAN experience in performing audits and technical knowledge of
the BPSBES. ReliabilityFirst has been cross training auditors in both areas and
will continue to support the effort in 2012.
6.5. Compliance Audit staff will support investigations, organization registration
and certification, and other compliance processes as needed in 2012. As
identified above these activities are expected to increase in 2012.
7.6. Compliance Audit staff will continue to support NERC initiatives through
participation on NERC committees, support of NERC audits and other
monitoring processes, and existing communication processes to achieve the
global initiative of providing Registered Entities with consistency,
transparency and educational opportunities.
2012 Key Deliverables
Conduct thorough and formal compliance audits of the Reliability Standards on a three-year cycle for the RC, BA, and TOP functional entities and the TO/LCCs. Audit teams will consist of ReliabilityFirst staff supplemented as necessary by independent contractors. Industry volunteers will not serve on audit teams. Approximately 13 on-site audits will be performed annually, which will include monitoring nearly 160 total functions.
Conduct thorough and formal compliance audits of all other entities on a six-year cycle, which will include the functions listed below. These audits will be conducted off-site but may necessitate on-site review periodically. Approximately 70 entities will be reviewed annually with nearly 250 total functions evaluated.
GO – Generator Owner GOP – Generator Operator LSE – Load Serving Entity PSE – Purchasing-Selling Entity DP – Distribution Provider RP – Resource Planner PC – Planning Coordinator TP – Transmission Planner TSP – Transmission Service Provider IA – Interchange Authority TO – Transmission Owner TSP – Transmission Provider
Formatted: Indent: Left: 0.25", Space After: 0 pt

Section A — Statutory Programs Compliance Monitoring, and Enforcement, and Organization and Certification Program
2012 ReliabilityFirst Corporation Business Plan and Budget Approved by Board of Directors: April 22, 2011 for Stakeholder CommentJuly 8, 2011 42
Formatted: Font color: Text 1
Conduct spot checks to assess risk and performance on OP/PLAN standards as outlined in the Implementation Plan and determined by an assessment conducted by ReliabilityFirst. In 2011, two standards were identified for spot check monitoring. We expect this number to increase in 2012 and subsequent years as NERC moves toward the risk-and performance-based approach.
Conduct unscheduled audits or spot checks as risk issues identify the need during 2012. This type of monitoring is expected to rise in 2012 and in the years 2013 - 2015.
Conduct 120 risk-based assessments on those entities scheduled for an audit in 2012.
Provide efficiencies in audit and spot check processes through auditor training and system and process improvements.
Support two reliability workshops each year, monthly “open” compliance calls and “Assist Visits.”.
The current workload, which exceeds the 2011 available resources, is not anticipated to diminish in future years, but remain the same or grow. At this time, the addition of one FTE in 2012 is required to support the anticipated workload.
Critical Infrasture Protection (CIP) Audits
Program Scope and Functional Description The CIP Audit program scope includes the following major functional responsibilities:
Monitoring Compliance to the CIP Standards of ReliabilityFirst entities subject to CIP standards through scheduled and unscheduled (when necessary) compliance audits and/or spot checks ensuring that all pre-audit, onsite or offsite, and post audit activities are completed per the established process and timelines.
Management of Technical Feasibility Exceptions (TFEs), as outlined in Appendix 4D of the NERC Rules of Procedures, to ensure all Part A review, Part B review, and ongoing (quarterly & annual) reporting requirements are properly completed and managed per the process.
Participation in the NERC CIP-002 Sufficiency Review program. This program was started in 2010 and has been revised and expanded for 2011 based on lessons learned throughout the 2010 effort. It is expected that this program will continue to mature into 2012 and may be re-architected to address the CIP-002 Version 4 (V4) standard once approved.
2012 Key Assumptions The CIP Audit area incorporates regional specific common business planning assumptions as described in the ReliabilityFirst NERC 2012 Business Plan and Budget, Attachment Exhibit A: 2012 – 2015 Shared Business Planning and Budget Assumptions (NERC and the Regional Entities) document, including additional resources required for
Formatted: Indent: Left: 0.25", Tab stops:Not at 0.88"
Formatted: Indent: Left: 0.25", Tab stops: 0.5", List tab + Not at 0.88"
Section A — Statutory Programs Compliance Monitoring, and Enforcement, and Organization and Certification Program
2012 ReliabilityFirst Corporation Business Plan and Budget Approved by Board of Directors: April 22, 2011 for Stakeholder CommentJuly 8, 2011 43
Formatted: Font color: Text 1
initiatives that support these shared ERO goals. The ReliabilityFirst CIP Audit area includes the following unique regional assumptions:
1. In 2011, the full suite of 43 CIP requirements and associated sub-requirements are within an audit scope for all (3 year and 6 year) Registered Entities that have identified Critical Assets and Critical Cyber Assets. These audits are conducted onsite at the entity. Based on the 2011 Implementation Plan and Actively Monitored List, 36 CIP requirements and associated sub-requirements were identified to be actively monitored in 2011. It is believed that in 2012, all 43 CIP requirements and associated sub-requirements will be actively monitored. Based on recent audit experiences, the technical focus and comprehensiveness of these audits has expanded, thus resulting in larger audit teams (i.e. 2 teams of 3) and additional audit review time onsite to complete the audits. The larger audit teams are comprised of (approximately four) CIP staff members augmented with (approximately two) contractors. Two week pre-audit reviews have been instituted resulting in a more focused onsite audit review. In addition, a defined sampling methodology is being utilized which has increased sampling sizes and the confidence levels of samples. Another factor influencing the duration of an audit is an organization’s ability and preparedness in presenting their material in a comprehensive, organized, and direct manner.
2. The time required to complete the onsite review of a 43 -requirement CIP Audit may also increase due to site visits and field visits that may be warranted if initial evidence is not sufficient to substantiate that an entity meets compliance.
3. For Registered Entities subject to compliance to the CIP standards that have no Critical Cyber Assets, the audit scope focuses on five requirements (i.e. CIP-002 R1-R4 & CIP-003 R2) and are conducted offsite by one team of two auditors. Pre-audit reviews are conducted and the actual offsite audit is generally completed within one week followed by post audit report documentation.
4. Similar to the OpsOP/PlanLAN Audits, it is expected that CIP spot checks will increase over the next three years in conjunction with the implementation of a risk-based approach to compliance monitoring. This may increase auditor time and resources, however appropriately scoped audits based on entity risk and performance profiles should lead to a focused and efficient monitoring program. ReliabilityFirst may be required to increase the CIP Audit staff as a result.
5. The TFE program will continue to require considerable staffing resources to perform reviews and gauge compensating measures. TFE development, review, and approval will result in additional compensating measure validation checks, quarterly/annual report tracking, and change management. Experience gained through existing operations will be utilized to guide the development of resource recommendations. Any approved and terminated TFEs are to be audited as part of a scheduled CIP Audit according to Appendix 4D of the NERC Rules of Procedure. This is applicable to entities that have identified Critical Assets and Critical Cyber Assets and have such TFEs. The plan is to incorporate the review of these TFEs into the existing audit review schedule. The effort required to review these TFEs may extend the audit review schedule or result in a separate unscheduled audit review, resulting in additional time and/or resources required
Formatted: Font: 6 pt
Section A — Statutory Programs Compliance Monitoring, and Enforcement, and Organization and Certification Program
2012 ReliabilityFirst Corporation Business Plan and Budget Approved by Board of Directors: April 22, 2011 for Stakeholder CommentJuly 8, 2011 44
Formatted: Font color: Text 1
to complete the audit of such TFEs. Overall, the continued review and assessment of new TFEs and the tracking and updating of existing TFEs will continue to be a challenge.
6. Upon approval of the CIP-002 VV4 Standards, entities will be expected to utilize the new criteria to identify Critical Assets. With the integration of the new criteria, expectations are such that there will be a substantial increase in the number of entities and Critical Assets required to be monitored for CIP compliance in the near future. If this occurs, a significant resource impact is expected along with additional burden and workload added to the CIP audit program.
7. ReliabilityFirst will support the NERC CIP-002 Sufficiency Review Program in 2012.
7. 2012 Key Deliverables
CIP audits will be performed as separate audits from the OpsOP/PlanningLAN audits. The CIP audits can be categorized as medium and small sized audits as defined by NERC and the number of requirements defined within each category. The number of CIP audits targeted for 2012 is defined below and will be based on the number of entities that identify Critical Assets, which may change significantly when CIP-002 V4 is approved. For 2012, it is expected that the number of CIP audits will be at least the same or possibly greater than in 2011 resulting in approximately:
10-15 CIP medium audits of entities on the 3 year cycle (onsite).
Registered Entities are expected to be compliant with the 43 CIP requirements and typically have many Critical Assets and Critical Cyber Assets due to being registered for multiple functions.
5-10 CIP medium audits of entities on the 6 year cycle (onsite).
Registered Entities are expected to be compliant with the 43 CIP requirements, but typically have fewer Critical Cyber Assets as a result of being registered for fewer functions.
20-25 CIP Small Audits of entities on the 6 year cycle (offsite).
Registered Entities are expected to be compliant with five CIP requirements (i.e. CIP-002, R1-R4 & CIP-003, R2) because they have identified no Critical Cyber Assets.
CIP spot checks will be used to assess performance to selected CIP Standards as outlined in the annual Implementation Plan. The number of standards will be assessed each year, but may increase as risk assessment dictates. This monitoring process will also be performed to confirm self-certifications, self reports, and the status of mitigation plans or agreed to activities associated with settlement agreements.
Managing the completion of Part A reviews, Part B Reviews, and quarterly/annual reporting for the 14 requirements subject to TFEs processing, including Accepted, Amended, Approved, Disapproved, Final Rejection, Pending Review, Resubmitted and Terminated conditions. ReliabilityFirst has received
Formatted: Indent: Left: 0.5", No bullets ornumbering
Section A — Statutory Programs Compliance Monitoring, and Enforcement, and Organization and Certification Program
2012 ReliabilityFirst Corporation Business Plan and Budget Approved by Board of Directors: April 22, 2011 for Stakeholder CommentJuly 8, 2011 45
Formatted: Font color: Text 1
over 1,000 TFEs since the TFE program commenced in Q4-2009. The effort required to process TFEs will continue through 2012. The rate of TFE submittals in 2011 is expected to level off and remain constant for 2012, but ReliabilityFirst does not expect it to be reduced to zero in the next few years, due to technology changes, additional entities being identified with Critical Assets and Critical Cyber Assets, and the full understanding of the CIP Standards. For 2012, ReliabilityFirst expects approximately 120 new TFEs, 120 TFE amendments and 145 TFE Terminations will need to be processed through the applicable Part A and Part B reviews, followed by the quarterly and annual report tracking of all TFEs submitted. It is expected that one equivalent FTE will continuously be allocated to provide oversight and management of the TFE process.
Starting in 2011, compliance audits of CIP Standards are incorporating the review of Approved and Terminated TFEs. The plan is to incorporate the review of these TFEs into the existing audit review schedule for 2012 and beyond.
Participate in the 2012 NERC CIP-002 Sufficiency Review program. The expectation is that NERC will conduct 1 to 2 sufficiency reviews of entities registered in the ReliabilityFirst region. Each sufficiency review will be completed by a team consisting of NERC and ReliabilityFirst staff assigned from the CIP and OpsP/PlanningLAN Audit staff. As needed, resources from other departments may participate and if resource availability is limited, NERC may elect to use NERC resources exclusively.
Support NERC’s initiative in developing and supporting a training and implementation program for Registered Entities to successfully implement CIP-002 V4 Standards.
ReliabilityFirst will support NERC in the planning and development of a comprehensive cyber security training program that validates knowledge and technical competency of the CIP staff across the ERO.
Support NERC and contribute to the development of Compliance Application Notices to provide guidance across the ERO and industry as it relates to the CIP standards.
Augment audit teams with OpsP/PlanningLAN, CIP, and Support Staff in an effort to fulfill audit team resource needs and to support cross training of auditors in both CIP and OpsP/PlanningLAN audit practices.
Overall, the current workload is exceeding the available resources and this workload is not anticipated to diminish in the next few years, but instead remain the same or grow. For 2012, it is expected that the addition of one and a half (1.5) FTEs will be required to complete the anticipated workload related to the functional responsibilities and identified deliverables as well as any new ReliabilityFirst, ERO, and industry CIP related initiatives. Contractor support is expected to reduce somewhat, but still remain a necessity to provide staff coverage as required to meet the demands of the 2012 CIP audit schedule or any other responsibilities.
Enforcement Management
Section A — Statutory Programs Compliance Monitoring, and Enforcement, and Organization and Certification Program
2012 ReliabilityFirst Corporation Business Plan and Budget Approved by Board of Directors: April 22, 2011 for Stakeholder CommentJuly 8, 2011 46
Formatted: Font color: Text 1
Program Scope and Functional Description The current 2011 Enforcement Staff level accommodates the processing of 360 violations, or approximately 30 per month. For reference, 469 violations were received in 2010 and although the number of violations budgeted for in 2011 was 320, the current estimates project run rate after the first two months of 2011 put year-end numbers near nearly 440 500 violations for by the end of 2011. For 2012, the number of violations for budgeting purposes is estimated to be 400. With the reassignment of the actual time expended by staff attorneys on corporate matters to Legal & Regulatory Affairs, the addition of one CIP expertise FTE will allow for increased efficiency in processing CIP related violations. 2012 Key Assumptions The Enforcement Management Function incorporates regional specific common business planning assumptions as described in the ReliabilityFirst NERC 2012 Business Plan and Budget, Attachment Exhibit A: 2012 – 2015 Shared Business Planning and Budget Assumptions (NERC and the Regional Entities) document, including additional resources required for initiatives that support these shared ERO goals. The ReliabilityFirst Enforcement Management function includes the following unique regional assumptions:
1. The current upward trend of the number of violations to be processed will continue in 2012. The number of Nnon-CIP violations will remain steady as compared to 2011 levels, with approximately 200 expected in 2012. Estimation of the number of CIP violations expected in 2012 remains difficult. For budgeting and staffing purposes, it is assumed that 200 CIP violations will be processed by Enforcement in 2012 (for comparison purposes, CIP violations totaled 259 in 2010). The risk identified is that over the next few years a substantial upswing may occur in the number of possible CIP violations as CIP Audits continue to ramp up based on entities auditable compliance dates, increasing reach of new versions of the CIP Standards, and as the full understanding is reached for all CIP Standards across all applicable Registered Entities.
2. It is expected that the majority of possible violations will continue to be handled through the settlement process and the administrative citation process. Increased process efficiencies, institution of proportional effort in Enforcement, and gained experience offset the increased complexity of compliance cases and the level of effort and resources for a settlement continues to decrease.
3. Efforts to provide a tiered approach to enforcement process that is proportional to the level of potential risk to the reliability of the BES have been partially successful. It is assumed continued progress will be made within this area.
4. The number of hearings to be conducted in 2012 is unknown, and therefore no external legal resources have been budgeted.
2012 Key Deliverables
Identify all violations and continue to implement and staff a case management and workflow structure to manage each violation effectively and treat each entity involved professionally. Follow all due process requirements in a manner that
Formatted: Font: 6 pt
Formatted: Tab stops: Not at 0.55"
Section A — Statutory Programs Compliance Monitoring, and Enforcement, and Organization and Certification Program
2012 ReliabilityFirst Corporation Business Plan and Budget Approved by Board of Directors: April 22, 2011 for Stakeholder CommentJuly 8, 2011 47
Formatted: Font color: Text 1
promotes efficient, effective, thorough, and fair processing of all enforcement related issues.
Conduct initial violation fact and circumstance reviews and communicate with the entity through each step of the enforcement process. Manage all necessary activities of the enforcement process through final closure with NERC, including mitigation plans, settlements, hearings, and participate as necessary in any appeals to NERC or regulatory agencies for alleged violations that are contested.
Report all violations of Standards for which investigation, decision, and hearing processes have been completed, including the identity of the organizations involved in those violations.
Provide the necessary information regarding all financial penalties to support the collection and disbursement of the penalty funds.
Formatted: Font: 6 pt
Formatted: Indent: Left: 0.5", No bullets ornumbering

Section A — Statutory Programs Compliance Monitoring, and Enforcement, and Organization and Certification Program
2012 ReliabilityFirst Corporation Business Plan and Budget Approved by Board of Directors: April 22, 2011 for Stakeholder CommentJuly 8, 2011 48
Formatted: Font color: Text 1
Funding Sources and Requirements — Explanation of Variance
Funding Sources
Funding for this program in 2012 is provided through assessments to LSEs or designees (mandatory in the United States), as the Compliance Monitoring, and Enforcement, and Organization and Certification Program is a statutory, delegated function.
Personnel Expenses
Salary, payroll taxes, benefits, and savings anand retirement expensescosts for 2012 are budgeted for 42.50 FTEs, a decrease of .25 FTEs over 2011. The increase in personnel salaries and retirement costsexpenses is is a result of the addition of 3.5 new FTEs to the cCompliance Ddepartment and the reallocation of two FTEs to the General and Administrative Department and 1.75 FTE to the Legal and Regulatory Department, along with the budgeting for standard yearly increases for 2012. The decrease in payroll taxes and benefits is due to the use of more accurate data to establish better budget estimates.
Meeting Expenses
Meetings and, travel and conference call expenses in support of the implementation of the ReliabilityFirst Compliance Program decreased as a result of cost control and the increased utilization of web-based media for virtual meetings.
Operating Expenses
The decrease in operating expenses is a result of eliminating all legal expenses associated with compliance hearings. If ReliabilityFirst were to incur legal expenses associated with a hearing the company would utilize its contingency fund.
Indirect Expenses
Expenses related to indirect programs have been allocated proportionately based on FTE count to the direct programs for 2012. This method of accounting results in an increase compared to 2011, as a result of additional FTEs along with an increasewhich is mainly due to higher in total Administrative Services expenditures allocated for 2012.
Other Non-Operating Expenses
No other non-operating expenses are expected for 2012. Fixed Asset Additions
Decrease in fixed assets is due to a reduced need for additional fixed asset furniture and computer software for Compliance.
Formatted: Indent: Left: 0.5", No bullets ornumbering
Formatted: Space After: 0 pt
Formatted: Font: (Default) Arial, Italic, Nounderline, Font color: Black
Formatted: Font: (Default) Arial, Not Italic, Nounderline, Font color: Black
Formatted: Space After: 0 pt
Section A — Statutory Programs Compliance Monitoring, and Enforcement, and Organization and Certification Program
2012 ReliabilityFirst Corporation Business Plan and Budget Approved by Board of Directors: April 22, 2011 for Stakeholder CommentJuly 8, 2011 49
Formatted: Font color: Text 1
Compliance Monitoring, and Enforcement, and Organization Registration and Certification Program
Funding sources and related expenses for the Compliance Monitoring and Enforcement and Organization Registration and Certification section of the 2012 Business Plan and Budget are shown in the table below.
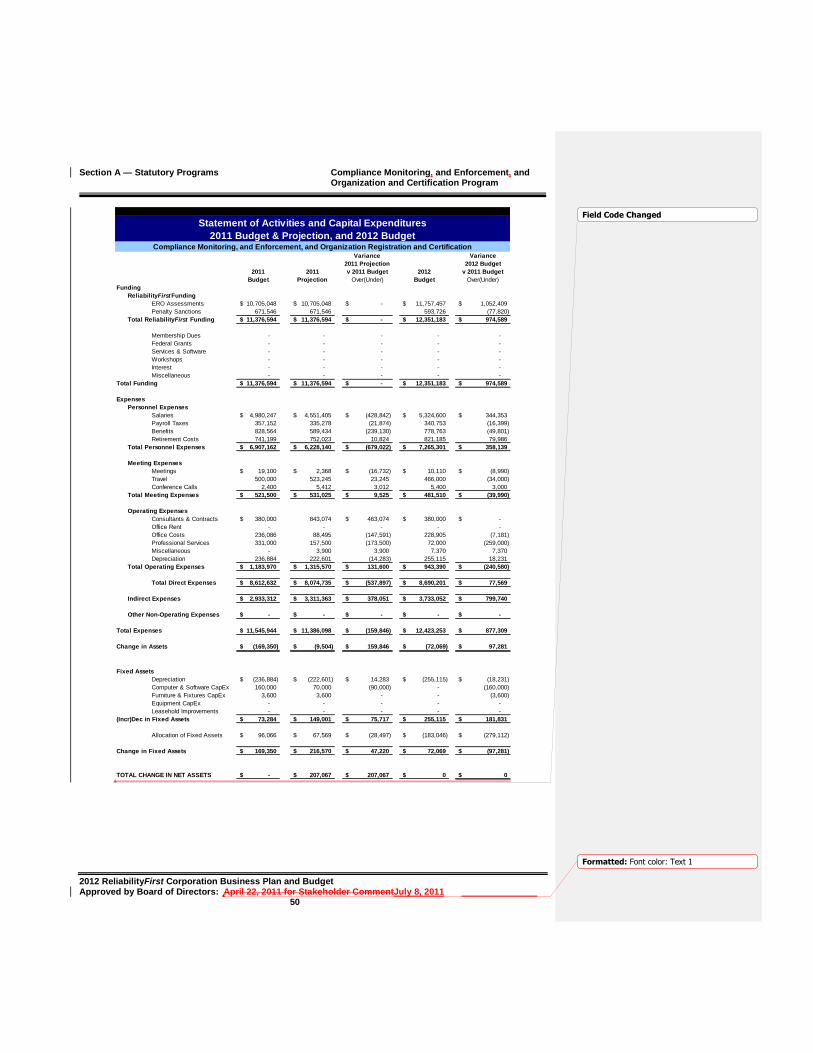
Section A — Statutory Programs Compliance Monitoring, and Enforcement, and Organization and Certification Program
2012 ReliabilityFirst Corporation Business Plan and Budget Approved by Board of Directors: April 22, 2011 for Stakeholder CommentJuly 8, 2011 50
Formatted: Font color: Text 1
Variance Variance
2011 Projection 2012 Budget
2011 2011 v 2011 Budget 2012 v 2011 Budget
Budget Projection Over(Under) Budget Over(Under)
Funding
ReliabilityFirstFunding
ERO Assessments 10,705,048$ 10,705,048$ -$ 11,757,457$ 1,052,409$
Penalty Sanctions 671,546 671,546 593,726 (77,820)
Total ReliabilityFirst Funding 11,376,594$ 11,376,594$ -$ 12,351,183$ 974,589$
Membership Dues - - - - -
Federal Grants - - - - -
Services & Software - - - - -
Workshops - - - - -
Interest - - - - -
Miscellaneous - - - - -
Total Funding 11,376,594$ 11,376,594$ -$ 12,351,183$ 974,589$
Expenses
Personnel Expenses
Salaries 4,980,247$ 4,551,405$ (428,842)$ 5,324,600$ 344,353$
Payroll Taxes 357,152 335,278 (21,874) 340,753 (16,399)
Benefits 828,564 589,434 (239,130) 778,763 (49,801)
Retirement Costs 741,199 752,023 10,824 821,185 79,986
Total Personnel Expenses 6,907,162$ 6,228,140$ (679,022)$ 7,265,301$ 358,139$
Meeting Expenses
Meetings 19,100$ 2,368$ (16,732)$ 10,110$ (8,990)$
Travel 500,000 523,245 23,245 466,000 (34,000)
Conference Calls 2,400 5,412 3,012 5,400 3,000
Total Meeting Expenses 521,500$ 531,025$ 9,525$ 481,510$ (39,990)$
Operating Expenses
Consultants & Contracts 380,000$ 843,074 463,074$ 380,000$ -$
Office Rent - - - - -
Office Costs 236,086 88,495 (147,591) 228,905 (7,181)
Professional Services 331,000 157,500 (173,500) 72,000 (259,000)
Miscellaneous - 3,900 3,900 7,370 7,370
Depreciation 236,884 222,601 (14,283) 255,115 18,231
Total Operating Expenses 1,183,970$ 1,315,570$ 131,600$ 943,390$ (240,580)$
Total Direct Expenses 8,612,632$ 8,074,735$ (537,897)$ 8,690,201$ 77,569$
Indirect Expenses 2,933,312$ 3,311,363$ 378,051$ 3,733,052$ 799,740$
Other Non-Operating Expenses -$ -$ -$ -$ -$
Total Expenses 11,545,944$ 11,386,098$ (159,846)$ 12,423,253$ 877,309$
Change in Assets (169,350)$ (9,504)$ 159,846$ (72,069)$ 97,281$
Fixed Assets
Depreciation (236,884)$ (222,601)$ 14,283$ (255,115)$ (18,231)$
Computer & Software CapEx 160,000 70,000 (90,000) - (160,000)
Furniture & Fixtures CapEx 3,600 3,600 - - (3,600)
Equipment CapEx - - - - -
Leasehold Improvements - - - - -
(Incr)Dec in Fixed Assets 73,284$ 149,001$ 75,717$ 255,115$ 181,831$
Allocation of Fixed Assets 96,066$ 67,569$ (28,497)$ (183,046)$ (279,112)$
Change in Fixed Assets 169,350$ 216,570$ 47,220$ 72,069$ (97,281)$
TOTAL CHANGE IN NET ASSETS -$ 207,067$ 207,067$ 0$ 0$
Statement of Activities and Capital Expenditures
2011 Budget & Projection, and 2012 BudgetCompliance Monitoring, and Enforcement, and Organization Registration and Certification
Field Code Changed

Section A — Statutory Programs Compliance Monitoring, and Enforcement, and Organization and Certification Program
2012 ReliabilityFirst Corporation Business Plan and Budget Approved by Board of Directors: April 22, 2011 for Stakeholder CommentJuly 8, 2011 51
Formatted: Font color: Text 1
Variance Variance
2011 Projection 2012 Budget
2011 2011 v 2011 Budget 2012 v 2011 Budget
Budget Projection Over(Under) Budget Over(Under)
Funding
ReliabilityFirstFunding
ERO Assessments 10,705,048$ 10,705,048$ -$ 11,762,704$ 1,057,656$
Penalty Sanctions 671,546 671,546 588,479 (83,067)
Total ReliabilityFirst Funding 11,376,594$ 11,376,594$ -$ 12,351,183$ 974,589$
Membership Dues - - - - -
Federal Grants - - - - -
Services & Software - - - - -
Workshops - - - - -
Interest - - - - -
Miscellaneous - - - - -
Total Funding 11,376,594$ 11,376,594$ -$ 12,351,183$ 974,589$
Expenses
Personnel Expenses
Salaries 4,980,247$ 4,551,405$ (428,842)$ 5,324,600$ 344,353$
Payroll Taxes 357,152 335,278 (21,874) 340,753 (16,399)
Benefits 828,564 589,434 (239,130) 778,763 (49,801)
Retirement Costs 741,199 752,023 10,824 821,185 79,986
Total Personnel Expenses 6,907,162$ 6,228,140$ (679,022)$ 7,265,301$ 358,139$
Meeting Expenses
Meetings 19,100$ 2,368$ (16,732)$ 10,110$ (8,990)$
Travel 500,000 523,245 23,245 466,000 (34,000)
Conference Calls 2,400 5,412 3,012 5,400 3,000
Total Meeting Expenses 521,500$ 531,025$ 9,525$ 481,510$ (39,990)$
Operating Expenses
Consultants & Contracts 380,000$ 843,074 463,074$ 380,000$ -$
Office Rent - - - - -
Office Costs 236,086 88,495 (147,591) 228,905 (7,181)
Professional Services 331,000 157,500 (173,500) 72,000 (259,000)
Miscellaneous - 3,900 3,900 7,370 7,370
Depreciation 236,884 222,601 (14,283) 255,115 18,231
Total Operating Expenses 1,183,970$ 1,315,570$ 131,600$ 943,390$ (240,580)$
Total Direct Expenses 8,612,632$ 8,074,735$ (537,897)$ 8,690,201$ 77,569$
Indirect Expenses 2,933,312$ 3,311,363$ 378,051$ 3,733,052$ 799,740$
Other Non-Operating Expenses -$ -$ -$ -$ -$
Total Expenses 11,545,944$ 11,386,098$ (159,846)$ 12,423,253$ 877,309$
Change in Assets (169,350)$ (9,504)$ 159,846$ (72,069)$ 97,281$
Fixed Assets
Depreciation (236,884)$ (222,601)$ 14,283$ (255,115)$ (18,231)$
Computer & Software CapEx 160,000 70,000 (90,000) - (160,000)
Furniture & Fixtures CapEx 3,600 3,600 - - (3,600)
Equipment CapEx - - - - -
Leasehold Improvements - - - - -
(Incr)Dec in Fixed Assets 73,284$ 149,001$ 75,717$ 255,115$ 181,831$
Allocation of Fixed Assets 96,066$ 67,569$ (28,497)$ (183,046)$ (279,112)$
Change in Fixed Assets 169,350$ 216,570$ 47,220$ 72,069$ (97,281)$
TOTAL CHANGE IN NET ASSETS -$ 207,067$ 207,067$ 0$ 0$
Statement of Activities and Capital Expenditures
2011 Budget & Projection, and 2012 BudgetCompliance and Organization Registration and Certification
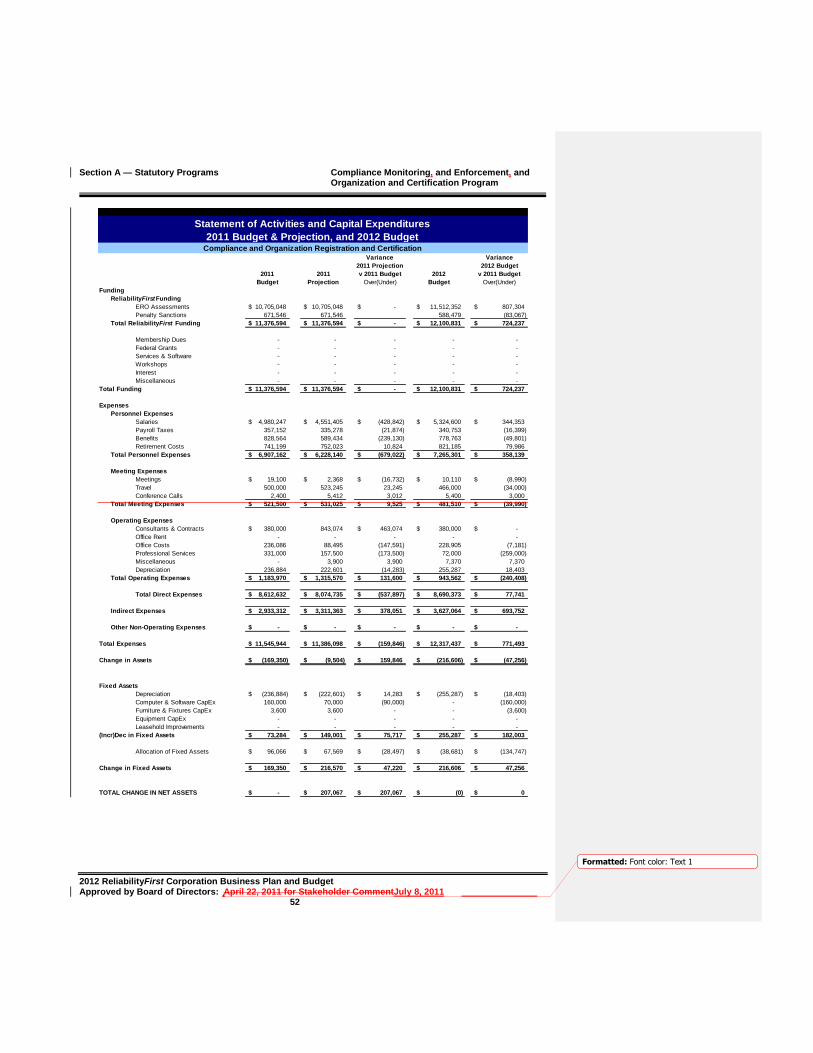
Section A — Statutory Programs Compliance Monitoring, and Enforcement, and Organization and Certification Program
2012 ReliabilityFirst Corporation Business Plan and Budget Approved by Board of Directors: April 22, 2011 for Stakeholder CommentJuly 8, 2011 52
Formatted: Font color: Text 1
Variance Variance
2011 Projection 2012 Budget
2011 2011 v 2011 Budget 2012 v 2011 Budget
Budget Projection Over(Under) Budget Over(Under)
Funding
ReliabilityFirstFunding
ERO Assessments 10,705,048$ 10,705,048$ -$ 11,512,352$ 807,304$
Penalty Sanctions 671,546 671,546 588,479 (83,067)
Total ReliabilityFirst Funding 11,376,594$ 11,376,594$ -$ 12,100,831$ 724,237$
Membership Dues - - - - -
Federal Grants - - - - -
Services & Software - - - - -
Workshops - - - - -
Interest - - - - -
Miscellaneous - - - - -
Total Funding 11,376,594$ 11,376,594$ -$ 12,100,831$ 724,237$
Expenses
Personnel Expenses
Salaries 4,980,247$ 4,551,405$ (428,842)$ 5,324,600$ 344,353$
Payroll Taxes 357,152 335,278 (21,874) 340,753 (16,399)
Benefits 828,564 589,434 (239,130) 778,763 (49,801)
Retirement Costs 741,199 752,023 10,824 821,185 79,986
Total Personnel Expenses 6,907,162$ 6,228,140$ (679,022)$ 7,265,301$ 358,139$
Meeting Expenses
Meetings 19,100$ 2,368$ (16,732)$ 10,110$ (8,990)$
Travel 500,000 523,245 23,245 466,000 (34,000)
Conference Calls 2,400 5,412 3,012 5,400 3,000
Total Meeting Expenses 521,500$ 531,025$ 9,525$ 481,510$ (39,990)$
Operating Expenses
Consultants & Contracts 380,000$ 843,074 463,074$ 380,000$ -$
Office Rent - - - - -
Office Costs 236,086 88,495 (147,591) 228,905 (7,181)
Professional Services 331,000 157,500 (173,500) 72,000 (259,000)
Miscellaneous - 3,900 3,900 7,370 7,370
Depreciation 236,884 222,601 (14,283) 255,287 18,403
Total Operating Expenses 1,183,970$ 1,315,570$ 131,600$ 943,562$ (240,408)$
Total Direct Expenses 8,612,632$ 8,074,735$ (537,897)$ 8,690,373$ 77,741$
Indirect Expenses 2,933,312$ 3,311,363$ 378,051$ 3,627,064$ 693,752$
Other Non-Operating Expenses -$ -$ -$ -$ -$
Total Expenses 11,545,944$ 11,386,098$ (159,846)$ 12,317,437$ 771,493$
Change in Assets (169,350)$ (9,504)$ 159,846$ (216,606)$ (47,256)$
Fixed Assets
Depreciation (236,884)$ (222,601)$ 14,283$ (255,287)$ (18,403)$
Computer & Software CapEx 160,000 70,000 (90,000) - (160,000)
Furniture & Fixtures CapEx 3,600 3,600 - - (3,600)
Equipment CapEx - - - - -
Leasehold Improvements - - - - -
(Incr)Dec in Fixed Assets 73,284$ 149,001$ 75,717$ 255,287$ 182,003$
Allocation of Fixed Assets 96,066$ 67,569$ (28,497)$ (38,681)$ (134,747)$
Change in Fixed Assets 169,350$ 216,570$ 47,220$ 216,606$ 47,256$
TOTAL CHANGE IN NET ASSETS -$ 207,067$ 207,067$ (0)$ 0$
Statement of Activities and Capital Expenditures
2011 Budget & Projection, and 2012 BudgetCompliance and Organization Registration and Certification
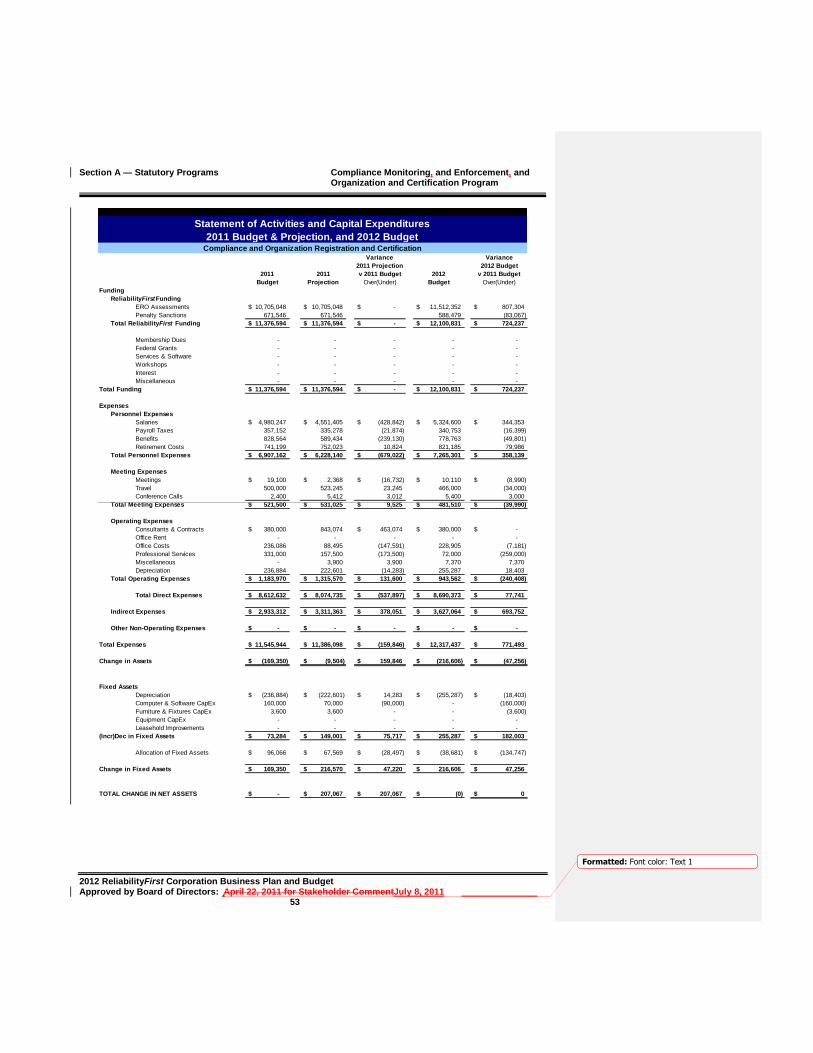
Section A — Statutory Programs Compliance Monitoring, and Enforcement, and Organization and Certification Program
2012 ReliabilityFirst Corporation Business Plan and Budget Approved by Board of Directors: April 22, 2011 for Stakeholder CommentJuly 8, 2011 53
Formatted: Font color: Text 1
Variance Variance
2011 Projection 2012 Budget
2011 2011 v 2011 Budget 2012 v 2011 Budget
Budget Projection Over(Under) Budget Over(Under)
Funding
ReliabilityFirstFunding
ERO Assessments 10,705,048$ 10,705,048$ -$ 11,512,352$ 807,304$
Penalty Sanctions 671,546 671,546 588,479 (83,067)
Total ReliabilityFirst Funding 11,376,594$ 11,376,594$ -$ 12,100,831$ 724,237$
Membership Dues - - - - -
Federal Grants - - - - -
Services & Software - - - - -
Workshops - - - - -
Interest - - - - -
Miscellaneous - - - - -
Total Funding 11,376,594$ 11,376,594$ -$ 12,100,831$ 724,237$
Expenses
Personnel Expenses
Salaries 4,980,247$ 4,551,405$ (428,842)$ 5,324,600$ 344,353$
Payroll Taxes 357,152 335,278 (21,874) 340,753 (16,399)
Benefits 828,564 589,434 (239,130) 778,763 (49,801)
Retirement Costs 741,199 752,023 10,824 821,185 79,986
Total Personnel Expenses 6,907,162$ 6,228,140$ (679,022)$ 7,265,301$ 358,139$
Meeting Expenses
Meetings 19,100$ 2,368$ (16,732)$ 10,110$ (8,990)$
Travel 500,000 523,245 23,245 466,000 (34,000)
Conference Calls 2,400 5,412 3,012 5,400 3,000
Total Meeting Expenses 521,500$ 531,025$ 9,525$ 481,510$ (39,990)$
Operating Expenses
Consultants & Contracts 380,000$ 843,074 463,074$ 380,000$ -$
Office Rent - - - - -
Office Costs 236,086 88,495 (147,591) 228,905 (7,181)
Professional Services 331,000 157,500 (173,500) 72,000 (259,000)
Miscellaneous - 3,900 3,900 7,370 7,370
Depreciation 236,884 222,601 (14,283) 255,287 18,403
Total Operating Expenses 1,183,970$ 1,315,570$ 131,600$ 943,562$ (240,408)$
Total Direct Expenses 8,612,632$ 8,074,735$ (537,897)$ 8,690,373$ 77,741$
Indirect Expenses 2,933,312$ 3,311,363$ 378,051$ 3,627,064$ 693,752$
Other Non-Operating Expenses -$ -$ -$ -$ -$
Total Expenses 11,545,944$ 11,386,098$ (159,846)$ 12,317,437$ 771,493$
Change in Assets (169,350)$ (9,504)$ 159,846$ (216,606)$ (47,256)$
Fixed Assets
Depreciation (236,884)$ (222,601)$ 14,283$ (255,287)$ (18,403)$
Computer & Software CapEx 160,000 70,000 (90,000) - (160,000)
Furniture & Fixtures CapEx 3,600 3,600 - - (3,600)
Equipment CapEx - - - - -
Leasehold Improvements - - - - -
(Incr)Dec in Fixed Assets 73,284$ 149,001$ 75,717$ 255,287$ 182,003$
Allocation of Fixed Assets 96,066$ 67,569$ (28,497)$ (38,681)$ (134,747)$
Change in Fixed Assets 169,350$ 216,570$ 47,220$ 216,606$ 47,256$
TOTAL CHANGE IN NET ASSETS -$ 207,067$ 207,067$ (0)$ 0$
Statement of Activities and Capital Expenditures
2011 Budget & Projection, and 2012 BudgetCompliance and Organization Registration and Certification

Section A - Statutory Programs Reliability Assessment and Performance Analysis Program
2012 ReliabilityFirst Corporation Business Plan and Budget Approved by Board of Directors: April 22, 2011 for Stakeholder CommentJuly 8, 2011 54
Formatted: Font color: Text 1
Reliability Assessment and Performance Analysis Program
2011 Budget 2012 Budget
Increase
(Decrease)
Total FTEs 8.50 9.50 1.00
Direct Expenses 1,785,819$ 1,898,357$ 112,538$
Indirect Expenses 583,232$ 834,447$ 251,215$
Inc(Dec) in Fixed Assets (19,101)$ 40,916$ 60,017$
Total Funding Requirement 2,349,950$ 2,773,720$ 423,770$
Reliability Assessments and Performance Analysis
(in whole dollars)
Formatted: Centered
Field Code Changed
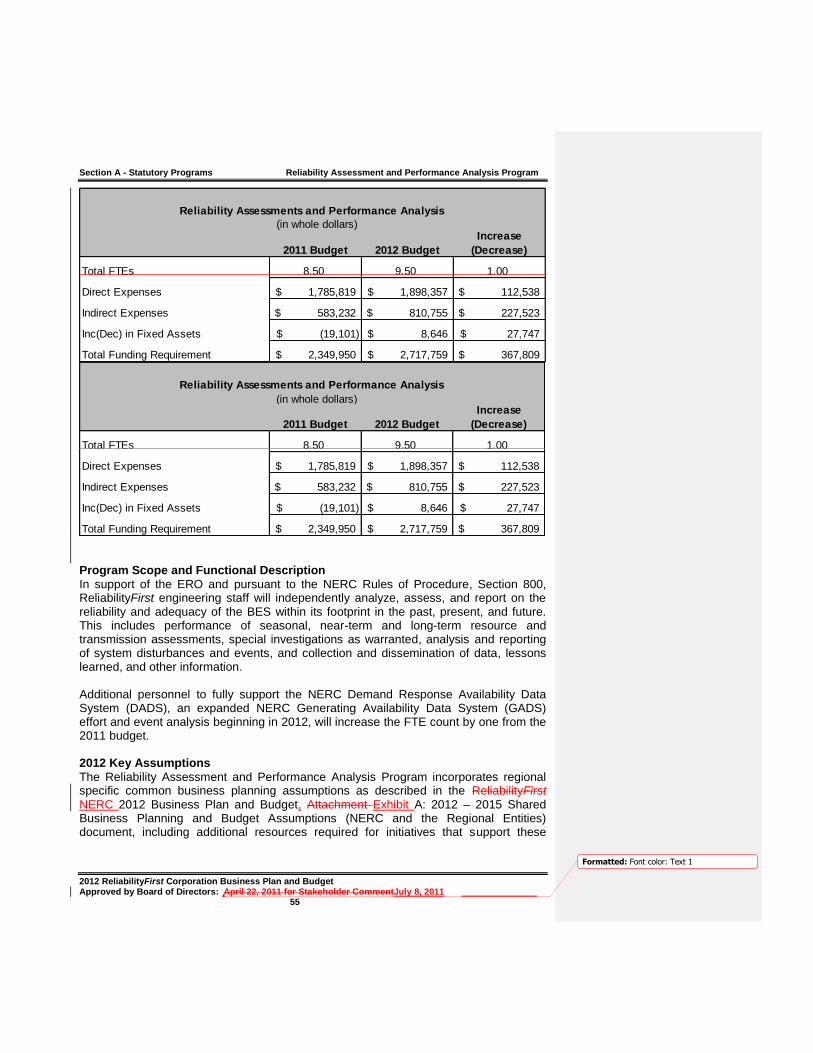
Section A - Statutory Programs Reliability Assessment and Performance Analysis Program
2012 ReliabilityFirst Corporation Business Plan and Budget Approved by Board of Directors: April 22, 2011 for Stakeholder CommentJuly 8, 2011 55
Formatted: Font color: Text 1
2011 Budget 2012 Budget
Increase
(Decrease)
Total FTEs 8.50 9.50 1.00
Direct Expenses 1,785,819$ 1,898,357$ 112,538$
Indirect Expenses 583,232$ 810,755$ 227,523$
Inc(Dec) in Fixed Assets (19,101)$ 8,646$ 27,747$
Total Funding Requirement 2,349,950$ 2,717,759$ 367,809$
Reliability Assessments and Performance Analysis
(in whole dollars)
Program Scope and Functional Description In support of the ERO and pursuant to the NERC Rules of Procedure, Section 800, ReliabilityFirst engineering staff will independently analyze, assess, and report on the reliability and adequacy of the BES within its footprint in the past, present, and future. This includes performance of seasonal, near-term and long-term resource and transmission assessments, special investigations as warranted, analysis and reporting of system disturbances and events, and collection and dissemination of data, lessons learned, and other information. Additional personnel to fully support the NERC Demand Response Availability Data System (DADS), an expanded NERC Generating Availability Data System (GADS) effort and event analysis beginning in 2012, will increase the FTE count by one from the 2011 budget. 2012 Key Assumptions The Reliability Assessment and Performance Analysis Program incorporates regional specific common business planning assumptions as described in the ReliabilityFirst NERC 2012 Business Plan and Budget, Attachment Exhibit A: 2012 – 2015 Shared Business Planning and Budget Assumptions (NERC and the Regional Entities) document, including additional resources required for initiatives that support these
Section A - Statutory Programs Reliability Assessment and Performance Analysis Program
2012 ReliabilityFirst Corporation Business Plan and Budget Approved by Board of Directors: April 22, 2011 for Stakeholder CommentJuly 8, 2011 56
Formatted: Font color: Text 1
shared ERO goals. There are no additional assumptions unique to the ReliabilityFirst Reliability Assessment and Performance Program. 2012 Key Deliverables Assessments of Reliability Performance
Perform ReliabilityFirst seasonal (summer and winter) resource adequacy assessments and a long-term resource adequacy assessment and produce reports per NERC Rules of Procedure Section 800 and NERC Standards MOD-016, TPL-005, and TPL-006.
Perform ReliabilityFirst seasonal (summer and winter) transmission assessment studies, a near-term (1 through 5 years into the future) transmission assessment, and a long-term (5 through 10 years into the future) transmission assessment and produce reports per Rules of Procedure Section 800 and NERC Standards TPL-005, and TPL-006.
Collect data and produce assessment reports for the NERC Reliability Assessment Subcommittee’s seasonal, long-term, and post-seasonal operational reports per NERC Rules of Procedure Section 800.
Work with neighboring Regional Entities in the Eastern Interconnection Reliability Assessment Group (ERAG) to perform seasonal, near-term, and long-term transmission assessment studies and produce reports per NERC Standards TPL-005, and TPL-006.
Model Development to Conduct Assessments
Develop a series of power flow base case models for ReliabilityFirst per NERC Standards MOD-011 and MOD-014 (Eastern Interconnection Reliability Assessment Group (ERAG)/Multiregional Modeling Working Group (MMWG) effort.
Develop power flow base case models for ReliabilityFirst per NERC Standards MOD-011 and MOD-014 (regional and interregional study efforts).
Develop a series of dynamic base case models for ReliabilityFirst per NERC Standards MOD-013 and MOD-015 (ERAG/MMWG effort).
Develop dynamic base case models for ReliabilityFirst per NERC Standards MOD-013 and MOD-015 (regional and interregional study efforts).
Event Analysis Activities
The ReliabilityFirst staff will analyze disturbances as described in the NERC Event Analysis process and cooperate with NERC and FERC staff and other Regional Entity staff, as needed. This also includes conducting system disturbance and post-mortem analyses.
Collecting and reviewing disturbance reports as required in NERC Standard EOP-004.
Collecting and reviewing disturbance reports as required by the Department of Energy in form OE-417.
Section A - Statutory Programs Reliability Assessment and Performance Analysis Program
2012 ReliabilityFirst Corporation Business Plan and Budget Approved by Board of Directors: April 22, 2011 for Stakeholder CommentJuly 8, 2011 57
Formatted: Font color: Text 1
Reporting Requirements
Submit ReliabilityFirst load, capacity, and transmission data and power flow base cases annually for the DOE EIA-411 report.
Assist NERC in the collection and validation of data for Transmission Availability Data System (TADS).
Assist NERC in the collection and validation of data for GADS, which is scheduled to be a mandatory data collection beginning in 2012. This effort is similar to the TADS.
Assist NERC in the collection and validation of data for DADS.
Submit ReliabilityFirst power flow data annually for the FERC 715 report.
Submit an assessment report to the Public Utilities Commission of Ohio as required by Ohio law.
Other Requirements and Activities
Publish lessons learned that are developed from system events, misoperation reporting, and other sources. These lessons will also be shared with NERC staff.
Continue to actively participate in the Eastern Interconnection Reliability Assessment GroupERAG, which includes the Management Committee, MMWG, and three study forums.
Analyze protective relay misoperation information and track corrective action plans as required in NERC Standard PRC-003.
Conduct initial and periodic Special Protection System (SPS) reviews as required in NERC Standards PRC-012, PRC-013, and PRC-014.
Conduct under-frequency load shed (UFLS) reviews as required in NERC Standard PRC-006.
Conduct under-voltage load shed (UVLS) reviews.
Coordinate disturbance monitoring equipment placement as required in NERC Standard PRC-002.
Develop and maintain a ReliabilityFirst BES facilities map.
Develop and maintain a linear contingency database for transmission assessment studies.
In support of the ERO Enterprise, actively participate in NERC committees, subcommittees, task forces and other technical groups, such as the Planning Committee and Operating Committee and associated subgroups.
Compliance Monitoring and Enforcement and Organization and Certification Program and Reliability Assessment and Performance Analysis Program will mManage the NERC BES definition exemption process within ReliabilityFirst and coordinate with NERC.
Section A - Statutory Programs Reliability Assessment and Performance Analysis Program
2012 ReliabilityFirst Corporation Business Plan and Budget Approved by Board of Directors: April 22, 2011 for Stakeholder CommentJuly 8, 2011 58
Formatted: Font color: Text 1
Continue to support stakeholder participation through various regional technical groups. The Reliability Committee is the primary technical advisory body to the ReliabilityFirst Board of Directors. Other technical subcommittees analyze and discuss technical issues related to reliability assessments, disturbance reporting, event analysis, and other activities.
Section A - Statutory Programs Reliability Assessment and Performance Analysis Program
2012 ReliabilityFirst Corporation Business Plan and Budget Approved by Board of Directors: April 22, 2011 for Stakeholder CommentJuly 8, 2011 59
Formatted: Font color: Text 1
Funding Sources and Requirements — Explanation of Variance Funding Sources
Funding for this program in 2012 is provided through assessments to LSEs or designees (mandatory in the United States), as the Reliability Assessment and Performance Analysis program is a statutory, delegated function.
Personnel Expenses
Salary, payroll taxes, benefits, and savings and retirement expenses costs for 2012 are budgeted for 9.5 FTEs, an increase of one FTE over 2011. The increase in personnel expenses is due to the addition of the one FTE, along with budgeting for standard yearly increases for 2012.
Meeting Expenses
Meeting and travel , staff travel, and conference call expeexpenses to support ReliabilityFirst and NERC committees, subcommittees, working groups, and task forces will decrease. This decrease is due to holding fewer ReliabilityFirst meetings, holding meetings at the ReliabilityFirst office or stakeholder office’s instead of at third party facilities, attending fewer NERC and other industry meetings, and increased utilization of web-based media for virtual meetings.
Operating Expenses
The decrease in operating expenses is a result of an amount included in the 2011 budget for the use of contractors to assist with the UFLS dynamic analysis, which ReliabilityFirst must complete every five years. This decrease is offset by an increase in office costs for assessment study software from 2011 to 2012.
Indirect Expenses
Expenses related to indirect programs have been allocated proportionately based on FTE count to the direct programs for 2012. This method of accounting results in an increase compared to 2011as a result of one additional FTE along with an increase in total Administrative Services expenditures allocated for 2012.
Other Non-Operating Expenses
No other non-operating expenses are expected for 2012. Fixed Asset Additions
No fixed asset additions are expected for 2012.

Section A - Statutory Programs Reliability Assessment and Performance Analysis Program
2012 ReliabilityFirst Corporation Business Plan and Budget Approved by Board of Directors: April 22, 2011 for Stakeholder CommentJuly 8, 2011 60
Formatted: Font color: Text 1
Reliability Assessment and Performance Analysis Program
Funding sources and related expenses for the Reliability Assessment and Performance Analysis section of the 2012 Business Plan and Budget are shown in the table below.

Section A - Statutory Programs Reliability Assessment and Performance Analysis Program
2012 ReliabilityFirst Corporation Business Plan and Budget Approved by Board of Directors: April 22, 2011 for Stakeholder CommentJuly 8, 2011 61
Formatted: Font color: Text 1
Variance Variance
2011 Projection 2012 Budget
2011 2011 v 2011 Budget 2012 v 2011 Budget
Budget Projection Over(Under) Budget Over(Under)
Funding
ReliabilityFirstFunding
ERO Assessments 2,216,426$ 2,216,426$ -$ 2,641,005$ 424,579$
Penalty Sanctions 133,524 133,524 132,715 (809)
Total ReliabilityFirst Funding 2,349,950$ 2,349,950$ -$ 2,773,720$ 423,770$
Membership Dues -$ -$ -$ -$
Federal Grants - - - - -
Services & Software - - - - -
Workshops - - - - -
Interest - - - - -
Miscellaneous - - - - -
Total Funding 2,349,950$ 2,349,950$ -$ 2,773,720$ 423,770$
Expenses
Personnel Expenses
Salaries 1,099,949$ 1,216,066$ 116,117$ 1,262,840$ 162,891$
Payroll Taxes 72,714 84,729 12,015 76,914 4,200
Benefits 126,811 124,513 (2,298) 144,124 17,313
Retirement Costs 155,845 207,005 51,160 198,595 42,750
Total Personnel Expenses 1,455,319$ 1,632,313$ 176,994$ 1,682,473$ 227,154$
Meeting Expenses
Meetings 28,000$ 2,974$ (25,026)$ 21,500$ (6,500)$
Travel 90,000 82,137 (7,863) 75,000 (15,000)
Conference Calls 2,400 3,330 930 3,120 720
Total Meeting Expenses 120,400$ 88,441$ (31,959)$ 99,620$ (20,780)$
Operating Expenses
Consultants & Contracts 175,000$ 46,165$ (128,835)$ 60,000$ (115,000)$
Office Rent - - - - -
Office Costs 35,000 59,137 24,137 56,214 21,214
Professional Services - - - - -
Miscellaneous 100 100 - 50 (50)
Depreciation - - - - -
Total Operating Expenses 210,100$ 105,402$ (104,698)$ 116,264$ (93,836)$
Total Direct Expenses 1,785,819$ 1,826,156$ 40,337$ 1,898,357$ 112,538$
Indirect Expenses 583,232$ 806,614$ 223,382$ 834,447$ 251,215$
Other Non-Operating Expenses -$ -$ -$ -$ -$
Total Expenses 2,369,051$ 2,632,770$ 263,719$ 2,732,804$ 363,753$
Change in Assets (19,101)$ (282,820)$ (263,719)$ 40,916$ 60,017$
Fixed Assets
Depreciation -$ -$ -$ -$ -$
Computer & Software CapEx - - - - -
Furniture & Fixtures CapEx - - - - -
Equipment CapEx - - - - -
Leasehold Improvements - - - - -
(Incr)Dec in Fixed Assets -$ -$ -$ -$ -$
Allocation of Fixed Assets 19,101$ 16,459$ (2,642)$ (40,916)$ (60,017)$
Change in Fixed Assets 19,101$ 16,459$ (2,642)$ (40,916)$ (60,017)$
TOTAL CHANGE IN NET ASSETS -$ (266,361)$ (266,361)$ -$ (0)$
Statement of Activities and Capital Expenditures
2011 Budget & Projection, and 2012 BudgetReliability Assessment and Performance Analysis
Field Code Changed

Section A - Statutory Programs Reliability Assessment and Performance Analysis Program
2012 ReliabilityFirst Corporation Business Plan and Budget Approved by Board of Directors: April 22, 2011 for Stakeholder CommentJuly 8, 2011 62
Formatted: Font color: Text 1
Variance Variance
2011 Projection 2012 Budget
2011 2011 v 2011 Budget 2012 v 2011 Budget
Budget Projection Over(Under) Budget Over(Under)
Funding
ReliabilityFirstFunding
ERO Assessments 2,216,426$ 2,216,426$ -$ 2,642,178$ 425,752$
Penalty Sanctions 133,524 133,524 131,542 (1,982)
Total ReliabilityFirst Funding 2,349,950$ 2,349,950$ -$ 2,773,720$ 423,770$
Membership Dues -$ -$ -$ -$
Federal Grants - - - - -
Services & Software - - - - -
Workshops - - - - -
Interest - - - - -
Miscellaneous - - - - -
Total Funding 2,349,950$ 2,349,950$ -$ 2,773,720$ 423,770$
Expenses
Personnel Expenses
Salaries 1,099,949$ 1,216,066$ 116,117$ 1,262,840$ 162,891$
Payroll Taxes 72,714 84,729 12,015 76,914 4,200
Benefits 126,811 124,513 (2,298) 144,124 17,313
Retirement Costs 155,845 207,005 51,160 198,595 42,750
Total Personnel Expenses 1,455,319$ 1,632,313$ 176,994$ 1,682,473$ 227,154$
Meeting Expenses
Meetings 28,000$ 2,974$ (25,026)$ 21,500$ (6,500)$
Travel 90,000 82,137 (7,863) 75,000 (15,000)
Conference Calls 2,400 3,330 930 3,120 720
Total Meeting Expenses 120,400$ 88,441$ (31,959)$ 99,620$ (20,780)$
Operating Expenses
Consultants & Contracts 175,000$ 46,165$ (128,835)$ 60,000$ (115,000)$
Office Rent - - - - -
Office Costs 35,000 59,137 24,137 56,214 21,214
Professional Services - - - - -
Miscellaneous 100 100 - 50 (50)
Depreciation - - - - -
Total Operating Expenses 210,100$ 105,402$ (104,698)$ 116,264$ (93,836)$
Total Direct Expenses 1,785,819$ 1,826,156$ 40,337$ 1,898,357$ 112,538$
Indirect Expenses 583,232$ 806,614$ 223,382$ 834,447$ 251,215$
Other Non-Operating Expenses -$ -$ -$ -$ -$
Total Expenses 2,369,051$ 2,632,770$ 263,719$ 2,732,804$ 363,753$
Change in Assets (19,101)$ (282,820)$ (263,719)$ 40,916$ 60,017$
Fixed Assets
Depreciation -$ -$ -$ -$ -$
Computer & Software CapEx - - - - -
Furniture & Fixtures CapEx - - - - -
Equipment CapEx - - - - -
Leasehold Improvements - - - - -
(Incr)Dec in Fixed Assets -$ -$ -$ -$ -$
Allocation of Fixed Assets 19,101$ 16,459$ (2,642)$ (40,916)$ (60,017)$
Change in Fixed Assets 19,101$ 16,459$ (2,642)$ (40,916)$ (60,017)$
TOTAL CHANGE IN NET ASSETS -$ (266,361)$ (266,361)$ -$ -$
Statement of Activities and Capital Expenditures
2011 Budget & Projection, and 2012 BudgetReliability Assessment and Performance Analysis

Section A - Statutory Programs Reliability Assessment and Performance Analysis Program
2012 ReliabilityFirst Corporation Business Plan and Budget Approved by Board of Directors: April 22, 2011 for Stakeholder CommentJuly 8, 2011 63
Formatted: Font color: Text 1
Variance Variance
2011 Projection 2012 Budget
2011 2011 v 2011 Budget 2012 v 2011 Budget
Budget Projection Over(Under) Budget Over(Under)
Funding
ReliabilityFirstFunding
ERO Assessments 2,216,426$ 2,216,426$ -$ 2,586,216$ 369,790$
Penalty Sanctions 133,524 133,524 131,542 (1,982)
Total ReliabilityFirst Funding 2,349,950$ 2,349,950$ -$ 2,717,759$ 367,809$
Membership Dues -$ -$ -$ -$
Federal Grants - - - - -
Services & Software - - - - -
Workshops - - - - -
Interest - - - - -
Miscellaneous - - - - -
Total Funding 2,349,950$ 2,349,950$ -$ 2,717,759$ 367,809$
Expenses
Personnel Expenses
Salaries 1,099,949$ 1,216,066$ 116,117$ 1,262,840$ 162,891$
Payroll Taxes 72,714 84,729 12,015 76,914 4,200
Benefits 126,811 124,513 (2,298) 144,124 17,313
Retirement Costs 155,845 207,005 51,160 198,595 42,750
Total Personnel Expenses 1,455,319$ 1,632,313$ 176,994$ 1,682,473$ 227,154$
Meeting Expenses
Meetings 28,000$ 2,974$ (25,026)$ 21,500$ (6,500)$
Travel 90,000 82,137 (7,863) 75,000 (15,000)
Conference Calls 2,400 3,330 930 3,120 720
Total Meeting Expenses 120,400$ 88,441$ (31,959)$ 99,620$ (20,780)$
Operating Expenses
Consultants & Contracts 175,000$ 46,165$ (128,835)$ 60,000$ (115,000)$
Office Rent - - - - -
Office Costs 35,000 59,137 24,137 56,214 21,214
Professional Services - - - - -
Miscellaneous 100 100 - 50 (50)
Depreciation - - - - -
Total Operating Expenses 210,100$ 105,402$ (104,698)$ 116,264$ (93,836)$
Total Direct Expenses 1,785,819$ 1,826,156$ 40,337$ 1,898,357$ 112,538$
Indirect Expenses 583,232$ 806,614$ 223,382$ 810,755$ 227,523$
Other Non-Operating Expenses -$ -$ -$ -$ -$
Total Expenses 2,369,051$ 2,632,770$ 263,719$ 2,709,113$ 340,062$
Change in Assets (19,101)$ (282,820)$ (263,719)$ 8,646$ 27,747$
Fixed Assets
Depreciation -$ -$ -$ -$ -$
Computer & Software CapEx - - - - -
Furniture & Fixtures CapEx - - - - -
Equipment CapEx - - - - -
Leasehold Improvements - - - - -
(Incr)Dec in Fixed Assets -$ -$ -$ -$ -$
Allocation of Fixed Assets 19,101$ 16,459$ (2,642)$ (8,646)$ (27,747)$
Change in Fixed Assets 19,101$ 16,459$ (2,642)$ (8,646)$ (27,747)$
TOTAL CHANGE IN NET ASSETS -$ (266,361)$ (266,361)$ (0)$ -$
Statement of Activities and Capital Expenditures
2011 Budget & Projection, and 2012 BudgetReliability Assessment and Performance Analysis

Section A - Statutory Programs Reliability Assessment and Performance Analysis Program
2012 ReliabilityFirst Corporation Business Plan and Budget Approved by Board of Directors: April 22, 2011 for Stakeholder CommentJuly 8, 2011 64
Formatted: Font color: Text 1
Variance Variance
2011 Projection 2012 Budget
2011 2011 v 2011 Budget 2012 v 2011 Budget
Budget Projection Over(Under) Budget Over(Under)
Funding
ReliabilityFirstFunding
ERO Assessments 2,216,426$ 2,216,426$ -$ 2,586,216$ 369,790$
Penalty Sanctions 133,524 133,524 131,542 (1,982)
Total ReliabilityFirst Funding 2,349,950$ 2,349,950$ -$ 2,717,759$ 367,809$
Membership Dues -$ -$ -$ -$
Federal Grants - - - - -
Services & Software - - - - -
Workshops - - - - -
Interest - - - - -
Miscellaneous - - - - -
Total Funding 2,349,950$ 2,349,950$ -$ 2,717,759$ 367,809$
Expenses
Personnel Expenses
Salaries 1,099,949$ 1,216,066$ 116,117$ 1,262,840$ 162,891$
Payroll Taxes 72,714 84,729 12,015 76,914 4,200
Benefits 126,811 124,513 (2,298) 144,124 17,313
Retirement Costs 155,845 207,005 51,160 198,595 42,750
Total Personnel Expenses 1,455,319$ 1,632,313$ 176,994$ 1,682,473$ 227,154$
Meeting Expenses
Meetings 28,000$ 2,974$ (25,026)$ 21,500$ (6,500)$
Travel 90,000 82,137 (7,863) 75,000 (15,000)
Conference Calls 2,400 3,330 930 3,120 720
Total Meeting Expenses 120,400$ 88,441$ (31,959)$ 99,620$ (20,780)$
Operating Expenses
Consultants & Contracts 175,000$ 46,165$ (128,835)$ 60,000$ (115,000)$
Office Rent - - - - -
Office Costs 35,000 59,137 24,137 56,214 21,214
Professional Services - - - - -
Miscellaneous 100 100 - 50 (50)
Depreciation - - - - -
Total Operating Expenses 210,100$ 105,402$ (104,698)$ 116,264$ (93,836)$
Total Direct Expenses 1,785,819$ 1,826,156$ 40,337$ 1,898,357$ 112,538$
Indirect Expenses 583,232$ 806,614$ 223,382$ 810,755$ 227,523$
Other Non-Operating Expenses -$ -$ -$ -$ -$
Total Expenses 2,369,051$ 2,632,770$ 263,719$ 2,709,113$ 340,062$
Change in Assets (19,101)$ (282,820)$ (263,719)$ 8,646$ 27,747$
Fixed Assets
Depreciation -$ -$ -$ -$ -$
Computer & Software CapEx - - - - -
Furniture & Fixtures CapEx - - - - -
Equipment CapEx - - - - -
Leasehold Improvements - - - - -
(Incr)Dec in Fixed Assets -$ -$ -$ -$ -$
Allocation of Fixed Assets 19,101$ 16,459$ (2,642)$ (8,646)$ (27,747)$
Change in Fixed Assets 19,101$ 16,459$ (2,642)$ (8,646)$ (27,747)$
TOTAL CHANGE IN NET ASSETS -$ (266,361)$ (266,361)$ (0)$ -$
Statement of Activities and Capital Expenditures
2011 Budget & Projection, and 2012 BudgetReliability Assessment and Performance Analysis

Section A — Statutory Programs Training, Education, and Operator Certification Program
2012 ReliabilityFirst Corporation Business Plan and Budget Approved by Board of Directors: April 22, 2011 for Stakeholder CommentJuly 8, 2011 65
Formatted: Font color: Text 1
Training, Education, and Operator Certification Program
2011 Budget 2012 Budget
Increase
(Decrease)
Total FTEs 3.10 3.10 0.00
Direct Expenses 614,771$ 588,290$ (26,481)$
Indirect Expenses 212,708$ 272,293$ 59,585$
Inc(Dec) in Fixed Assets (6,966)$ 13,352$ 20,318$
Total Funding Requirement 820,513$ 873,935$ 53,422$
Training, Education and Operator Certification
(in whole dollars)
Formatted: Centered
Field Code Changed

Section A — Statutory Programs Training, Education, and Operator Certification Program
2012 ReliabilityFirst Corporation Business Plan and Budget Approved by Board of Directors: April 22, 2011 for Stakeholder CommentJuly 8, 2011 66
Formatted: Font color: Text 1
2011 Budget 2012 Budget
Increase
(Decrease)
Total FTEs 3.10 3.10 0.00
Direct Expenses 614,771$ 588,290$ (26,481)$
Indirect Expenses 212,708$ 264,562$ 51,854$
Inc(Dec) in Fixed Assets (6,966)$ 2,821$ 9,787$
Total Funding Requirement 820,513$ 855,674$ 35,161$
Training, Education and Operator Certification
(in whole dollars)
Program Scope and Functional Description
The Training and Education staff assists in the development of training events for the stakeholders of ReliabilityFirst and participates in the NERC Training and Education Group (TEG) in identifying training needs of the industry. The Training, Education, and Operator Certification Program area focuses on providing relevant training to entities operating in the ReliabilityFirst region. This training is structured to provide timely information in a concise format to enable participation at all levels within an organization.
2012 Key Assumptions
The Training, Education, and Operator Certification Program area incorporates common business planning assumptions as described in the ReliabilityFirst NERC 2012 Business Plan and Budget, Attachment Exhibit A: 2012 – 2015 Shared Business Planning and Budget Assumptions (NERC and the Regional Entities) document, including additional resources required for initiatives that support these shared ERO goals. The ReliabilityFirst Training, Education and Operator Certification Program includesinclude the following unique regional assumption: ReliabilityFirst will provide timely publication of lessons learned and recommendations from event analysis and track responses to recommendations on compliance related issues and concerns.
Formatted: Font: 6 pt
Formatted: Space After: 0 pt
Formatted: Font: 6 pt
Section A — Statutory Programs Training, Education, and Operator Certification Program
2012 ReliabilityFirst Corporation Business Plan and Budget Approved by Board of Directors: April 22, 2011 for Stakeholder CommentJuly 8, 2011 67
Formatted: Font color: Text 1
2012 Key Deliverables
Board of Directors’ Training Per the Bylaws of ReliabilityFirst, the Board of Directors will receive training annually to keep current with activities within the ReliabilityFirst footprint and to stay abreast of changes affecting the industry.
In addition, ReliabilityFirst also has a requirement to conduct orientation training for newly elected Directors. This training is conducted soon after a new Director has been elected and provides an overview of ReliabilityFirst including our organization, governance, goals, and objectives.
Industry Education and Workshops In 2012, ReliabilityFirst will increase and add greater focus to its activities aimed at helping industry participants achieve excellence in reliability. These activities include:
The development and publication of lessons learned/best practices from system events.
Identification of common reasons why Reliability Standards are violated.
Efforts to better prepare entities for compliance audits and also for enforcement activities.
Increased focus on any lessons learned or trends in reliability assessments.
Continued workshops and forums to allow for free exchange of information between ReliabilityFirst and its stakeholders. Workshops to be conducted in 2012 include:
o A Compliance Monitoring and Enforcement Program workshop to promote an understanding of the program as it continues to evolve under the ERO.
o Open forums to provide insight into new standards developed and approved by the industry, both NERC and ReliabilityFirst, changes in the Compliance Monitoring and Enforcement Program, Infrastructure Protection issues, or other topics requested by members/Registered Entities.
o CIP Standards Webinars to provide insight into the evolution of these standards and to provide a forum for representatives of registered entities to share thoughts, problems, and solutions.
o Updates to the base case development process used for developing computer models used to perform reliability assessments.
Formatted: Space After: 0 pt
Section A — Statutory Programs Training, Education, and Operator Certification Program
2012 ReliabilityFirst Corporation Business Plan and Budget Approved by Board of Directors: April 22, 2011 for Stakeholder CommentJuly 8, 2011 68
Formatted: Font color: Text 1
NERC Training and Education Group In 2011, NERC organized the TEG, comprised of representatives of each of the eight Regional Entities and NERC training staff. The TEG focuses on three areas: coordinate, develop, and deliver quality training and education to NERC and Regional Entity staff; deliver consistent and effective training and education opportunities to stakeholders; and maximize the expertise of NERC and Regional Entity resources to control training and education costs.
Develop and post timely compliance-related lessons learned.
Assist NERC, as requested, in the development of educational materials for our Registered Entities.
Host a minimum of two reliability workshops each year and monthly “Open” compliance calls.

Section A — Statutory Programs Training, Education, and Operator Certification Program
2012 ReliabilityFirst Corporation Business Plan and Budget Approved by Board of Directors: April 22, 2011 for Stakeholder CommentJuly 8, 2011 69
Formatted: Font color: Text 1
Funding Sources and Requirements — Explanation of Variance
Funding Sources
Funding for this program in 2012 is provided through assessments to LSEs or designees (mandatory in the United States), as the Training, Education, and Operator Certification Program is a statutory, delegated function.
Personnel Expenses
Salary, payroll taxes, benefits, and savings and retirement expensescosts for 2012 are budgeted for 3.1 FTEs for this program area, consistent with 2011. Therefore, with no change in the FTE level in this program, the decrease in personnel salaries expenses is a result of using expenses data relateingd to specific employees instead of averages. The increase in payroll taxes, benefits and retirement costs is due to the use of more accurate data to establish better budget estimates.
Meeting Expenses
Meeting, staff tTravel, and conference call expenses to support the Training, Education and Operator Certification program will decrease for 2012. The decrease is a result of most training-related activities requiring travel being performed in conjunction with other travel, where these travel expenses have been budgeted in the respective program areas.
Operating Expenses
No other operating expenses are expected for 2012.
Indirect Expenses
Expenses related to indirect programs have been allocated proportionately based on FTE count to the direct programs for 2012. This method of accounting results in an increase compared to 2011, because there is no change in FTEs in this program, the increase is due to higher total Administrative Services expenditures allocated for 2012.
Other Non-Operating Expenses
No other non-operating expenses are expected for 2012.
Fixed Asset Additions
No fixed asset additions are expected for 2012.
Formatted: Space After: 0 pt
Formatted: Indent: Left: 0.5", No bullets ornumbering
Section A — Statutory Programs Training, Education, and Operator Certification Program
2012 ReliabilityFirst Corporation Business Plan and Budget Approved by Board of Directors: April 22, 2011 for Stakeholder CommentJuly 8, 2011 70
Formatted: Font color: Text 1
Training, Education, and Operator Certification Program
Funding sources and related expenses for the Training, Education, and Operator Certification section of the 2012 Business Plan and Budget are shown in the table below.
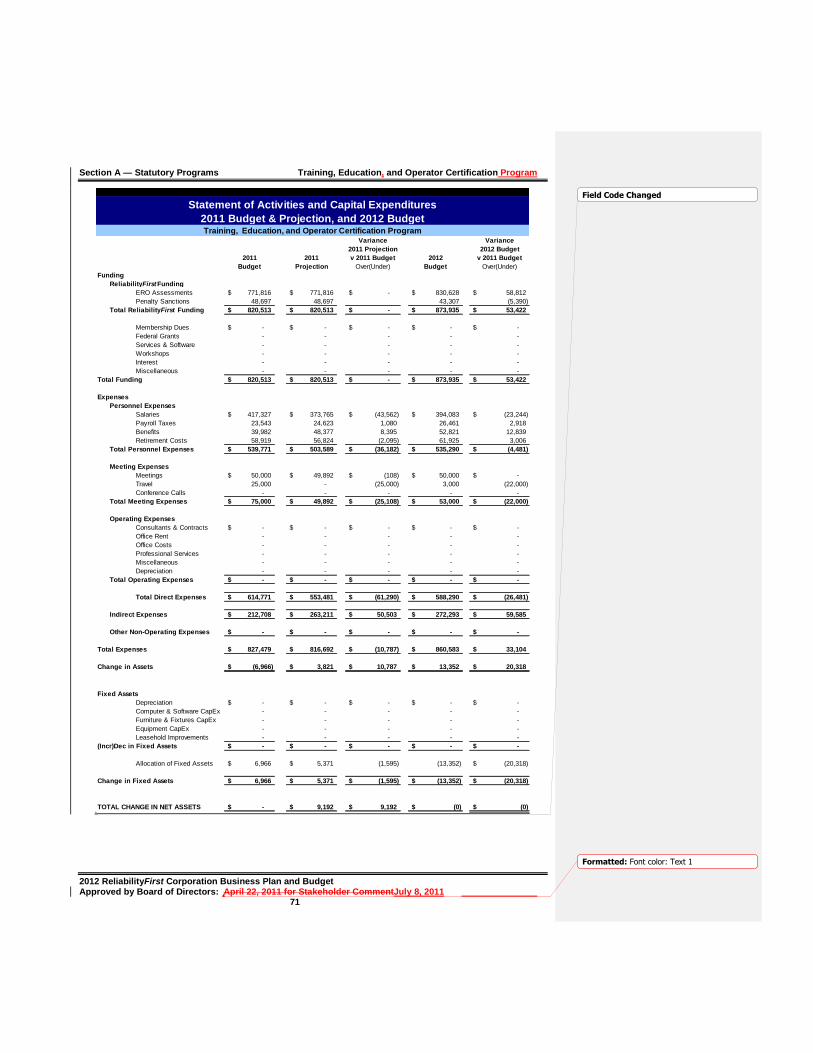
Section A — Statutory Programs Training, Education, and Operator Certification Program
2012 ReliabilityFirst Corporation Business Plan and Budget Approved by Board of Directors: April 22, 2011 for Stakeholder CommentJuly 8, 2011 71
Formatted: Font color: Text 1
Variance Variance
2011 Projection 2012 Budget
2011 2011 v 2011 Budget 2012 v 2011 Budget
Budget Projection Over(Under) Budget Over(Under)
Funding
ReliabilityFirstFunding
ERO Assessments 771,816$ 771,816$ -$ 830,628$ 58,812$
Penalty Sanctions 48,697 48,697 43,307 (5,390)
Total ReliabilityFirst Funding 820,513$ 820,513$ -$ 873,935$ 53,422$
Membership Dues -$ -$ -$ -$ -$
Federal Grants - - - - -
Services & Software - - - - -
Workshops - - - - -
Interest - - - - -
Miscellaneous - - - - -
Total Funding 820,513$ 820,513$ -$ 873,935$ 53,422$
Expenses
Personnel Expenses
Salaries 417,327$ 373,765$ (43,562)$ 394,083$ (23,244)$
Payroll Taxes 23,543 24,623 1,080 26,461 2,918
Benefits 39,982 48,377 8,395 52,821 12,839
Retirement Costs 58,919 56,824 (2,095) 61,925 3,006
Total Personnel Expenses 539,771$ 503,589$ (36,182)$ 535,290$ (4,481)$
Meeting Expenses
Meetings 50,000$ 49,892$ (108)$ 50,000$ -$
Travel 25,000 - (25,000) 3,000 (22,000)
Conference Calls - - - - -
Total Meeting Expenses 75,000$ 49,892$ (25,108)$ 53,000$ (22,000)$
Operating Expenses
Consultants & Contracts -$ -$ -$ -$ -$
Office Rent - - - - -
Office Costs - - - - -
Professional Services - - - - -
Miscellaneous - - - - -
Depreciation - - - - -
Total Operating Expenses -$ -$ -$ -$ -$
Total Direct Expenses 614,771$ 553,481$ (61,290)$ 588,290$ (26,481)$
Indirect Expenses 212,708$ 263,211$ 50,503$ 272,293$ 59,585$
Other Non-Operating Expenses -$ -$ -$ -$ -$
Total Expenses 827,479$ 816,692$ (10,787)$ 860,583$ 33,104$
Change in Assets (6,966)$ 3,821$ 10,787$ 13,352$ 20,318$
Fixed Assets
Depreciation -$ -$ -$ -$ -$
Computer & Software CapEx - - - - -
Furniture & Fixtures CapEx - - - - -
Equipment CapEx - - - - -
Leasehold Improvements - - - - -
(Incr)Dec in Fixed Assets -$ -$ -$ -$ -$
Allocation of Fixed Assets 6,966$ 5,371$ (1,595) (13,352) (20,318)$
Change in Fixed Assets 6,966$ 5,371$ (1,595)$ (13,352)$ (20,318)$
TOTAL CHANGE IN NET ASSETS -$ 9,192$ 9,192$ (0)$ (0)$
Statement of Activities and Capital Expenditures
2011 Budget & Projection, and 2012 BudgetTraining, Education, and Operator Certification Program
Field Code Changed
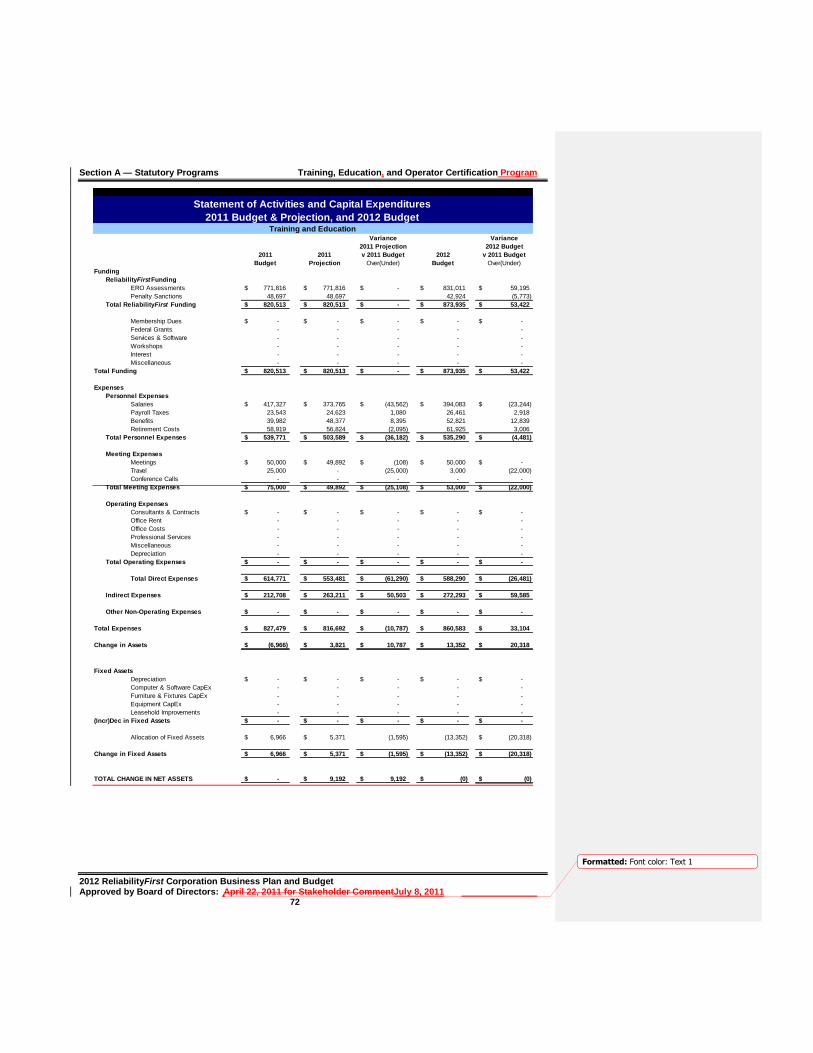
Section A — Statutory Programs Training, Education, and Operator Certification Program
2012 ReliabilityFirst Corporation Business Plan and Budget Approved by Board of Directors: April 22, 2011 for Stakeholder CommentJuly 8, 2011 72
Formatted: Font color: Text 1
Variance Variance
2011 Projection 2012 Budget
2011 2011 v 2011 Budget 2012 v 2011 Budget
Budget Projection Over(Under) Budget Over(Under)
Funding
ReliabilityFirstFunding
ERO Assessments 771,816$ 771,816$ -$ 831,011$ 59,195$
Penalty Sanctions 48,697 48,697 42,924 (5,773)
Total ReliabilityFirst Funding 820,513$ 820,513$ -$ 873,935$ 53,422$
Membership Dues -$ -$ -$ -$ -$
Federal Grants - - - - -
Services & Software - - - - -
Workshops - - - - -
Interest - - - - -
Miscellaneous - - - - -
Total Funding 820,513$ 820,513$ -$ 873,935$ 53,422$
Expenses
Personnel Expenses
Salaries 417,327$ 373,765$ (43,562)$ 394,083$ (23,244)$
Payroll Taxes 23,543 24,623 1,080 26,461 2,918
Benefits 39,982 48,377 8,395 52,821 12,839
Retirement Costs 58,919 56,824 (2,095) 61,925 3,006
Total Personnel Expenses 539,771$ 503,589$ (36,182)$ 535,290$ (4,481)$
Meeting Expenses
Meetings 50,000$ 49,892$ (108)$ 50,000$ -$
Travel 25,000 - (25,000) 3,000 (22,000)
Conference Calls - - - - -
Total Meeting Expenses 75,000$ 49,892$ (25,108)$ 53,000$ (22,000)$
Operating Expenses
Consultants & Contracts -$ -$ -$ -$ -$
Office Rent - - - - -
Office Costs - - - - -
Professional Services - - - - -
Miscellaneous - - - - -
Depreciation - - - - -
Total Operating Expenses -$ -$ -$ -$ -$
Total Direct Expenses 614,771$ 553,481$ (61,290)$ 588,290$ (26,481)$
Indirect Expenses 212,708$ 263,211$ 50,503$ 272,293$ 59,585$
Other Non-Operating Expenses -$ -$ -$ -$ -$
Total Expenses 827,479$ 816,692$ (10,787)$ 860,583$ 33,104$
Change in Assets (6,966)$ 3,821$ 10,787$ 13,352$ 20,318$
Fixed Assets
Depreciation -$ -$ -$ -$ -$
Computer & Software CapEx - - - - -
Furniture & Fixtures CapEx - - - - -
Equipment CapEx - - - - -
Leasehold Improvements - - - - -
(Incr)Dec in Fixed Assets -$ -$ -$ -$ -$
Allocation of Fixed Assets 6,966$ 5,371$ (1,595) (13,352) (20,318)$
Change in Fixed Assets 6,966$ 5,371$ (1,595)$ (13,352)$ (20,318)$
TOTAL CHANGE IN NET ASSETS -$ 9,192$ 9,192$ (0)$ (0)$
Statement of Activities and Capital Expenditures
2011 Budget & Projection, and 2012 BudgetTraining and Education

Section A — Statutory Programs Training, Education, and Operator Certification Program
2012 ReliabilityFirst Corporation Business Plan and Budget Approved by Board of Directors: April 22, 2011 for Stakeholder CommentJuly 8, 2011 73
Formatted: Font color: Text 1
Variance Variance
2011 Projection 2012 Budget
2011 2011 v 2011 Budget 2012 v 2011 Budget
Budget Projection Over(Under) Budget Over(Under)
Funding
ReliabilityFirstFunding
ERO Assessments 771,816$ 771,816$ -$ 812,750$ 40,934$
Penalty Sanctions 48,697 48,697 42,924 (5,773)
Total ReliabilityFirst Funding 820,513$ 820,513$ -$ 855,674$ 35,161$
Membership Dues -$ -$ -$ -$ -$
Federal Grants - - - - -
Services & Software - - - - -
Workshops - - - - -
Interest - - - - -
Miscellaneous - - - - -
Total Funding 820,513$ 820,513$ -$ 855,674$ 35,161$
Expenses
Personnel Expenses
Salaries 417,327$ 373,765$ (43,562)$ 394,083$ (23,244)$
Payroll Taxes 23,543 24,623 1,080 26,461 2,918
Benefits 39,982 48,377 8,395 52,821 12,839
Retirement Costs 58,919 56,824 (2,095) 61,925 3,006
Total Personnel Expenses 539,771$ 503,589$ (36,182)$ 535,290$ (4,481)$
Meeting Expenses
Meetings 50,000$ 49,892$ (108)$ 50,000$ -$
Travel 25,000 - (25,000) 3,000 (22,000)
Conference Calls - - - - -
Total Meeting Expenses 75,000$ 49,892$ (25,108)$ 53,000$ (22,000)$
Operating Expenses
Consultants & Contracts -$ -$ -$ -$ -$
Office Rent - - - - -
Office Costs - - - - -
Professional Services - - - - -
Miscellaneous - - - - -
Depreciation - - - - -
Total Operating Expenses -$ -$ -$ -$ -$
Total Direct Expenses 614,771$ 553,481$ (61,290)$ 588,290$ (26,481)$
Indirect Expenses 212,708$ 263,211$ 50,503$ 264,562$ 51,854$
Other Non-Operating Expenses -$ -$ -$ -$ -$
Total Expenses 827,479$ 816,692$ (10,787)$ 852,853$ 25,374$
Change in Assets (6,966)$ 3,821$ 10,787$ 2,821$ 9,787$
Fixed Assets
Depreciation -$ -$ -$ -$ -$
Computer & Software CapEx - - - - -
Furniture & Fixtures CapEx - - - - -
Equipment CapEx - - - - -
Leasehold Improvements - - - - -
(Incr)Dec in Fixed Assets -$ -$ -$ -$ -$
Allocation of Fixed Assets 6,966$ 5,371$ (1,595) (2,821) (9,787)$
Change in Fixed Assets 6,966$ 5,371$ (1,595)$ (2,821)$ (9,787)$
TOTAL CHANGE IN NET ASSETS -$ 9,192$ 9,192$ (0)$ 0$
Statement of Activities and Capital Expenditures
2011 Budget & Projection, and 2012 BudgetTraining and Education

Section A — Statutory Programs Training, Education, and Operator Certification Program
2012 ReliabilityFirst Corporation Business Plan and Budget Approved by Board of Directors: April 22, 2011 for Stakeholder CommentJuly 8, 2011 74
Formatted: Font color: Text 1
Variance Variance
2011 Projection 2012 Budget
2011 2011 v 2011 Budget 2012 v 2011 Budget
Budget Projection Over(Under) Budget Over(Under)
Funding
ReliabilityFirstFunding
ERO Assessments 771,816$ 771,816$ -$ 812,750$ 40,934$
Penalty Sanctions 48,697 48,697 42,924 (5,773)
Total ReliabilityFirst Funding 820,513$ 820,513$ -$ 855,674$ 35,161$
Membership Dues -$ -$ -$ -$ -$
Federal Grants - - - - -
Services & Software - - - - -
Workshops - - - - -
Interest - - - - -
Miscellaneous - - - - -
Total Funding 820,513$ 820,513$ -$ 855,674$ 35,161$
Expenses
Personnel Expenses
Salaries 417,327$ 373,765$ (43,562)$ 394,083$ (23,244)$
Payroll Taxes 23,543 24,623 1,080 26,461 2,918
Benefits 39,982 48,377 8,395 52,821 12,839
Retirement Costs 58,919 56,824 (2,095) 61,925 3,006
Total Personnel Expenses 539,771$ 503,589$ (36,182)$ 535,290$ (4,481)$
Meeting Expenses
Meetings 50,000$ 49,892$ (108)$ 50,000$ -$
Travel 25,000 - (25,000) 3,000 (22,000)
Conference Calls - - - - -
Total Meeting Expenses 75,000$ 49,892$ (25,108)$ 53,000$ (22,000)$
Operating Expenses
Consultants & Contracts -$ -$ -$ -$ -$
Office Rent - - - - -
Office Costs - - - - -
Professional Services - - - - -
Miscellaneous - - - - -
Depreciation - - - - -
Total Operating Expenses -$ -$ -$ -$ -$
Total Direct Expenses 614,771$ 553,481$ (61,290)$ 588,290$ (26,481)$
Indirect Expenses 212,708$ 263,211$ 50,503$ 264,562$ 51,854$
Other Non-Operating Expenses -$ -$ -$ -$ -$
Total Expenses 827,479$ 816,692$ (10,787)$ 852,853$ 25,374$
Change in Assets (6,966)$ 3,821$ 10,787$ 2,821$ 9,787$
Fixed Assets
Depreciation -$ -$ -$ -$ -$
Computer & Software CapEx - - - - -
Furniture & Fixtures CapEx - - - - -
Equipment CapEx - - - - -
Leasehold Improvements - - - - -
(Incr)Dec in Fixed Assets -$ -$ -$ -$ -$
Allocation of Fixed Assets 6,966$ 5,371$ (1,595) (2,821) (9,787)$
Change in Fixed Assets 6,966$ 5,371$ (1,595)$ (2,821)$ (9,787)$
TOTAL CHANGE IN NET ASSETS -$ 9,192$ 9,192$ (0)$ 0$
Statement of Activities and Capital Expenditures
2011 Budget & Projection, and 2012 BudgetTraining and Education
Section A — Statutory Programs Training, Education, and Operator Certification Program
2012 ReliabilityFirst Corporation Business Plan and Budget Approved by Board of Directors: April 22, 2011 for Stakeholder CommentJuly 8, 2011 75
Formatted: Font color: Text 1
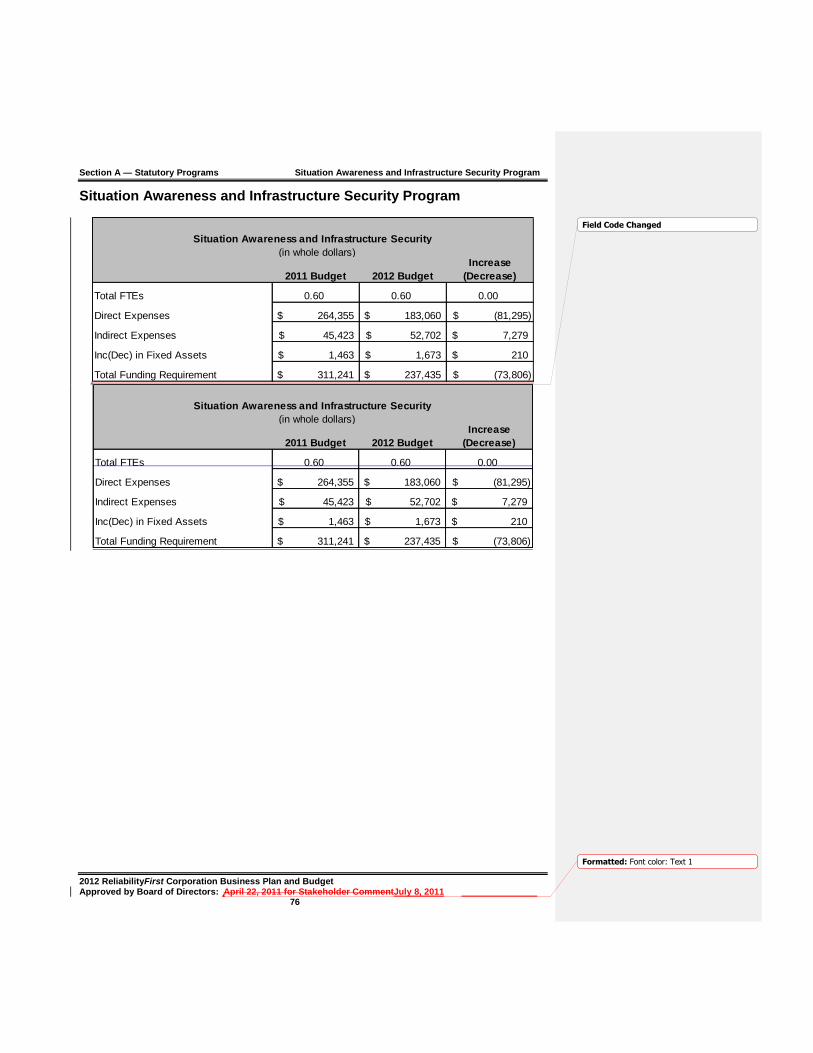
Section A — Statutory Programs Situation Awareness and Infrastructure Security Program
2012 ReliabilityFirst Corporation Business Plan and Budget Approved by Board of Directors: April 22, 2011 for Stakeholder CommentJuly 8, 2011 76
Formatted: Font color: Text 1
Situation Awareness and Infrastructure Security Program
2011 Budget 2012 Budget
Increase
(Decrease)
Total FTEs 0.60 0.60 0.00
Direct Expenses 264,355$ 183,060$ (81,295)$
Indirect Expenses 45,423$ 52,702$ 7,279$
Inc(Dec) in Fixed Assets 1,463$ 1,673$ 210$
Total Funding Requirement 311,241$ 237,435$ (73,806)$
Situation Awareness and Infrastructure Security
(in whole dollars)
Field Code Changed
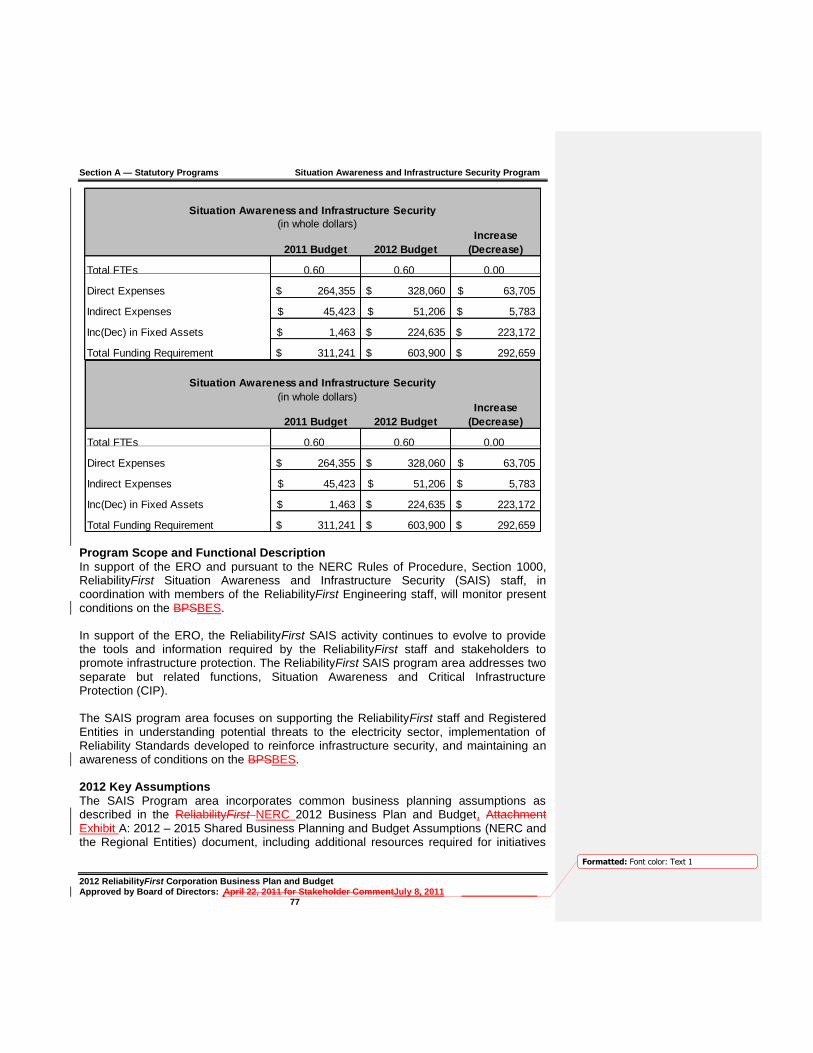
Section A — Statutory Programs Situation Awareness and Infrastructure Security Program
2012 ReliabilityFirst Corporation Business Plan and Budget Approved by Board of Directors: April 22, 2011 for Stakeholder CommentJuly 8, 2011 77
Formatted: Font color: Text 1
2011 Budget 2012 Budget
Increase
(Decrease)
Total FTEs 0.60 0.60 0.00
Direct Expenses 264,355$ 328,060$ 63,705$
Indirect Expenses 45,423$ 51,206$ 5,783$
Inc(Dec) in Fixed Assets 1,463$ 224,635$ 223,172$
Total Funding Requirement 311,241$ 603,900$ 292,659$
Situation Awareness and Infrastructure Security
(in whole dollars)
Program Scope and Functional Description In support of the ERO and pursuant to the NERC Rules of Procedure, Section 1000, ReliabilityFirst Situation Awareness and Infrastructure Security (SAIS) staff, in coordination with members of the ReliabilityFirst Engineering staff, will monitor present conditions on the BPSBES. In support of the ERO, the ReliabilityFirst SAIS activity continues to evolve to provide the tools and information required by the ReliabilityFirst staff and stakeholders to promote infrastructure protection. The ReliabilityFirst SAIS program area addresses two separate but related functions, Situation Awareness and Critical Infrastructure Protection (CIP). The SAIS program area focuses on supporting the ReliabilityFirst staff and Registered Entities in understanding potential threats to the electricity sector, implementation of Reliability Standards developed to reinforce infrastructure security, and maintaining an awareness of conditions on the BPSBES. 2012 Key Assumptions The SAIS Program area incorporates common business planning assumptions as described in the ReliabilityFirst NERC 2012 Business Plan and Budget, Attachment Exhibit A: 2012 – 2015 Shared Business Planning and Budget Assumptions (NERC and the Regional Entities) document, including additional resources required for initiatives

Section A — Statutory Programs Situation Awareness and Infrastructure Security Program
2012 ReliabilityFirst Corporation Business Plan and Budget Approved by Board of Directors: April 22, 2011 for Stakeholder CommentJuly 8, 2011 78
Formatted: Font color: Text 1
that support these shared ERO goals. The ReliabilityFirst SAIS Program includes the following unique regional assumption:
National level security exercises will be conducted to examine industry’s cyber security and physical security preparedness and response capabilities through simulation of coordinated cyber and physical attacks on industrial control system, System Control and AData Acquisition, and information technology assets. ReliabilityFirst will participate in these exercises as appropriate.
Formatted: Font: 6 pt
Formatted: Space After: 0 pt

Section A — Statutory Programs Situation Awareness and Infrastructure Security Program
2012 ReliabilityFirst Corporation Business Plan and Budget Approved by Board of Directors: April 22, 2011 for Stakeholder CommentJuly 8, 2011 79
Formatted: Font color: Text 1

Section A — Statutory Programs Situation Awareness and Infrastructure Security Program
2012 ReliabilityFirst Corporation Business Plan and Budget Approved by Board of Directors: April 22, 2011 for Stakeholder CommentJuly 8, 2011 80
Formatted: Font color: Text 1
2012 Key Deliverables
Support of the ReliabilityFirst Critical Infrastructure Protection Committee (CIPC)) The purpose of the ReliabilityFirst CIPC is to share information concerning CIP and to promote CIP within the ReliabilityFirst region. During 2012, SAIS will support the committee through scheduling and facilitation of committee meetings and Wwebinars and dissemination of messages, alerts, and warnings from NERC and DHS.
Support/Oversee ReliabilityFirst Staff Resources Compliance to the NERC Cyber Security Standards (CIP-002 – CIP-009) ReliabilityFirst is committed to complying with the NERC Cyber Security Standards. The SAIS program area will continue to provide training, guidance, and oversight to the ReliabilityFirst staff, particularly the Information Technology staff, in achieving compliance to these standards.
Provide Information on CIP-Related Issues This activity involves dissemination of information from agencies such as the Electricity Sector Information Sharing and Analysis Center (ES-ISAC), the U.S. Department of Homeland Security, and others containing information on events or suspected events representing potential threats to the electricity sector.
ReliabilityFirst staff will continue working with other members of the NERC CIPC and NERC staff to develop a robust messaging system for dissemination of CIP-related messages to the appropriate target audience. This will involve working with the Registered Entities within the ReliabilityFirst region to identify the appropriate individual(s) at each entity to receive these messages.
Monitor the Health of the BPSBES The use of situation awareness tools by ReliabilityFirst staff has been evolving over the last few years. ReliabilityFirst staff continues to participate in the Situation Awareness for FERC, NERC, and the Regional Entities SAFNR project and is making use of the SAFNR displays developed through this project. ReliabilityFirst is a signatory to the NERC Operating Reliability Data Confidentiality Agreement and as such staff has been using tools such as the Reliability Coordinator Information System (RCIS), System Data eXchange (SDX), Area Control Error (ACE), and Abnormal Frequency System Monitoring to monitor the health of the BPSBES within the ReliabilityFirst geographical area.
Maintain and Test Business Continuity/Disaster Recovery and Pandemic Plans for the ReliabilityFirst Office A business continuity plan deals with the ability to continue business functions in a degraded situation such as the loss of corporate assets including office space or computer assets. Disaster recovery deals with a more complete loss of access to corporate assets due to a large-scale event such as a tornado or blackout. A pandemic plan focuses on business continuity in the face of a declared pandemic.
Formatted: Indent: Left: 0.25", Space After: 6 pt
Formatted: Font: 6 pt
Formatted: Indent: Left: 0.5", Space After: 6pt, No bullets or numbering
Formatted: Indent: Left: 0.25", Space After: 6 pt

Section A — Statutory Programs Situation Awareness and Infrastructure Security Program
2012 ReliabilityFirst Corporation Business Plan and Budget Approved by Board of Directors: April 22, 2011 for Stakeholder CommentJuly 8, 2011 81
Formatted: Font color: Text 1
In 2011, ReliabilityFirst staff refined its Emergency Response plan to develop a true Business Continuity Plan and investigated the options for providing Disaster Recovery. In 2012, ReliabilityFirst will conduct tabletop exercises to test the plan and to identify areas of needed improvement.
Assist stakeholders in complying with NERC and ReliabilityFirst Standards Dealing with CIP The Standards currently addressing this issue continue to be the NERC Cyber Security Standards (CIP-002 – CIP-009). As these standards evolve, ReliabilityFirst stakeholders will continue to monitor and implement revisions to the standards as those revisions are completed and approved. ReliabilityFirst SAIS staff will be available to answer questions concerning these standards and will sponsor regional workshops and webinars as needed to foster the exchange of ideas and solutions developed by stakeholders.
Support the ReliabilityFirst Compliance Monitoring and Enforcement Program The SAIS program area will continue to support the ReliabilityFirst Compliance Monitoring and Enforcement program area by providing expertise on mitigation plans and settlements that include assessment of compliance to the NERC Cyber Security Standards (CIP-002 – CIP-009).
Section A — Statutory Programs Situation Awareness and Infrastructure Security Program
2012 ReliabilityFirst Corporation Business Plan and Budget Approved by Board of Directors: April 22, 2011 for Stakeholder CommentJuly 8, 2011 82
Formatted: Font color: Text 1
Funding Sources and Requirements — Explanation of Variance
Funding Sources
Funding for this program in 2012 is provided through assessments to LSEs or designees (mandatory in the United States), as it the Situation Awareness and Infrastructure Security Program is a statutory, delegated function.
Personnel Expenses
Salary, payroll taxes, benefits, and savings and retirement expenses costs for 2012 are budgeted for 0.60 FTEs for this program area, consistent with 2011. Therefore, with no change in the FTE level in this program the increase in personnel salaries and retirement costsexpenses is a result of budgeting for standard yearly increases.
Meeting Expenses
Meetings, and staff travel, and conference call expenses are budgeted in support of Regional committees/subcommittees and NERC committees and working groups in place to support the SAIS Program. This includes expenses for: four quarterly meetings of the ReliabilityFirst CIPC, four quarterly meetings of the NERC CIPC and NERC CIPC working group meetings, the NERC Board meetings, the North American SynchroPhasor Initiative (NASPI) meetings, and participation on the National Association of Regulatory Utility Commissioners (NARUC) Critical Infrastructure committee.
In 2011, Tthe ReliabilityFirst CIPC meetings were hosted by ReliabilityFirst and ReliabilityFirst member companies rather than being held at third party facilities. This practice will continued in 2012, therefore, budgeted meeting expenses for the SAIS program area are lower for 2012 than was budgeted for 2011.
Operating Expenses
Operating expenses decreased over 2011 levels due to decreased contractor costs. In 2011, ReliabilityFirst budgeted for a third party to perform vulnerability testing of its electronic infrastructure.
Indirect Expenses
Expenses related to indirect programs have been allocated proportionately based on FTE count to the direct programs for 2012. This method of accounting results in an increase compared to 2011. Since there is no change in FTEs in this program, the increase is due to higher Administrative Services expenditures allocated for 2012.
Other Non-Operating Expenses
No other non-operating expenses are expected for 2012. Fixed Asset Additions
No fixed asset additions are projected for 2012.

Section A — Statutory Programs Situation Awareness and Infrastructure Security Program
2012 ReliabilityFirst Corporation Business Plan and Budget Approved by Board of Directors: April 22, 2011 for Stakeholder CommentJuly 8, 2011 83
Formatted: Font color: Text 1
Situation Awareness and Infrastructure Security Program
Funding sources and related expenses for the Situation Awareness and Infrastructure Security section of the 2012 Business Plan and Budget are shown in the table below.
Formatted: Normal, Justified, Space After: 6pt

Section A — Statutory Programs Situation Awareness and Infrastructure Security Program
2012 ReliabilityFirst Corporation Business Plan and Budget Approved by Board of Directors: April 22, 2011 for Stakeholder CommentJuly 8, 2011 84
Formatted: Font color: Text 1
Variance Variance
2011 Projection 2012 Budget
2011 2011 v 2011 Budget 2012 v 2011 Budget
Budget Projection Over(Under) Budget Over(Under)
Funding
ReliabilityFirstFunding
ERO Assessments 301,815$ 301,815$ -$ 229,053$ (72,762)$
Penalty Sanctions 9,425 9,425 -$ 8,382 (1,043)
Total ReliabilityFirst Funding 311,240$ 311,240$ -$ 237,435$ (73,805)$
Membership Dues -$ -$ -$ -$ -$
Federal Grants - - - - -
Services & Software - - - - -
Workshops - - - - -
Interest - - - - -
Miscellaneous - - - - -
Total Funding 311,240$ 311,240$ -$ 237,435$ (73,805)$
Expenses
Personnel Expenses
Salaries 108,886$ 110,356$ 1,470$ 116,241$ 7,355$
Payroll Taxes 5,691 6,713 1,022 5,786 95
Benefits 9,790 4,780 (5,010) 7,393 (2,397)
Retirement Costs 14,891 19,167 4,276 18,381 3,490
Total Personnel Expenses 139,258$ 141,016$ 1,758$ 147,801$ 8,543$
Meeting Expenses
Meetings 10,000$ -$ (10,000)$ 1,000$ (9,000)$
Travel 31,200 22,539 (8,661) 30,000 (1,200)
Conference Calls 144 90 (54) 144 -
Total Meeting Expenses 41,344$ 22,629$ (18,715)$ 31,144$ (10,200)$
Operating Expenses
Consultants & Contracts 80,000$ 114,326$ 34,326$ -$ (80,000)$
Office Rent - - - - -
Office Costs 1,800 2,468 668 2,364 564
Professional Services - - - - -
Miscellaneous 1,364 816 (548) 840 (524)
Depreciation 589 425 (164) 911 322
Total Operating Expenses 83,753$ 118,035$ 34,282$ 4,115$ (79,638)$
Total Direct Expenses 264,355$ 281,680$ 17,325$ 183,060$ (81,295)$
Indirect Expenses 45,423$ 50,944$ 5,521$ 52,702$ 7,279$
Other Non-Operating Expenses -$ -$ -$ -$ -$
Total Expenses 309,778$ 332,624$ 22,846$ 235,761$ (74,017)$
Change in Assets 1,462$ (21,384)$ (22,846)$ 1,673$ 211$
Fixed Assets
Depreciation (589)$ (425)$ 164$ (911)$ (322)$
Computer & Software CapEx - - - - -
Furniture & Fixtures CapEx 3,400 - (3,400) - (3,400)
Equipment CapEx - - - - -
Leasehold Improvements - 1,200 1,200 - -
(Incr)Dec in Fixed Assets (2,811)$ (775)$ 2,036$ 911$ 3,722$
Allocation of Fixed Assets 1,348$ 1,040$ (308) (2,584)$ (3,932)$
Change in Fixed Assets (1,463)$ 265$ 1,728$ (1,673)$ (210)$
TOTAL CHANGE IN NET ASSETS (1)$ (21,120)$ (21,119)$ 0$ 1$
Statement of Activities and Capital Expenditures
2011 Budget & Projection, and 2012 BudgetSituation Awareness and Infrastructure Security
Field Code Changed

Section A — Statutory Programs Situation Awareness and Infrastructure Security Program
2012 ReliabilityFirst Corporation Business Plan and Budget Approved by Board of Directors: April 22, 2011 for Stakeholder CommentJuly 8, 2011 85
Formatted: Font color: Text 1
Variance Variance
2011 Projection 2012 Budget
2011 2011 v 2011 Budget 2012 v 2011 Budget
Budget Projection Over(Under) Budget Over(Under)
Funding
ReliabilityFirstFunding
ERO Assessments 301,815$ 301,815$ -$ 229,127$ (72,688)$
Penalty Sanctions 9,425 9,425 -$ 8,308 (1,117)
Total ReliabilityFirst Funding 311,240$ 311,240$ -$ 237,435$ (73,805)$
Membership Dues -$ -$ -$ -$ -$
Federal Grants - - - - -
Services & Software - - - - -
Workshops - - - - -
Interest - - - - -
Miscellaneous - - - - -
Total Funding 311,240$ 311,240$ -$ 237,435$ (73,805)$
Expenses
Personnel Expenses
Salaries 108,886$ 110,356$ 1,470$ 116,241$ 7,355$
Payroll Taxes 5,691 6,713 1,022 5,786 95
Benefits 9,790 4,780 (5,010) 7,393 (2,397)
Retirement Costs 14,891 19,167 4,276 18,381 3,490
Total Personnel Expenses 139,258$ 141,016$ 1,758$ 147,801$ 8,543$
Meeting Expenses
Meetings 10,000$ -$ (10,000)$ 1,000$ (9,000)$
Travel 31,200 22,539 (8,661) 30,000 (1,200)
Conference Calls 144 90 (54) 144 -
Total Meeting Expenses 41,344$ 22,629$ (18,715)$ 31,144$ (10,200)$
Operating Expenses
Consultants & Contracts 80,000$ 114,326$ 34,326$ -$ (80,000)$
Office Rent - - - - -
Office Costs 1,800 2,468 668 2,364 564
Professional Services - - - - -
Miscellaneous 1,364 816 (548) 840 (524)
Depreciation 589 425 (164) 911 322
Total Operating Expenses 83,753$ 118,035$ 34,282$ 4,115$ (79,638)$
Total Direct Expenses 264,355$ 281,680$ 17,325$ 183,060$ (81,295)$
Indirect Expenses 45,423$ 50,944$ 5,521$ 52,702$ 7,279$
Other Non-Operating Expenses -$ -$ -$ -$ -$
Total Expenses 309,778$ 332,624$ 22,846$ 235,761$ (74,017)$
Change in Assets 1,462$ (21,384)$ (22,846)$ 1,673$ 211$
Fixed Assets
Depreciation (589)$ (425)$ 164$ (911)$ (322)$
Computer & Software CapEx - - - - -
Furniture & Fixtures CapEx 3,400 - (3,400) - (3,400)
Equipment CapEx - - - - -
Leasehold Improvements - 1,200 1,200 - -
(Incr)Dec in Fixed Assets (2,811)$ (775)$ 2,036$ 911$ 3,722$
Allocation of Fixed Assets 1,348$ 1,040$ (308) (2,584)$ (3,932)$
Change in Fixed Assets (1,463)$ 265$ 1,728$ (1,673)$ (210)$
TOTAL CHANGE IN NET ASSETS (1)$ (21,120)$ (21,119)$ 0$ 1$
Statement of Activities and Capital Expenditures
2011 Budget & Projection, and 2012 BudgetSituation Awareness and Infrastructure Security

Section A — Statutory Programs Situation Awareness and Infrastructure Security Program
2012 ReliabilityFirst Corporation Business Plan and Budget Approved by Board of Directors: April 22, 2011 for Stakeholder CommentJuly 8, 2011 86
Formatted: Font color: Text 1
Variance Variance
2011 Projection 2012 Budget
2011 2011 v 2011 Budget 2012 v 2011 Budget
Budget Projection Over(Under) Budget Over(Under)
Funding
ReliabilityFirstFunding
ERO Assessments 301,815$ 301,815$ -$ 595,592$ 293,777$
Penalty Sanctions 9,425 9,425 -$ 8,308 (1,117)
Total ReliabilityFirst Funding 311,240$ 311,240$ -$ 603,900$ 292,660$
Membership Dues -$ -$ -$ -$ -$
Federal Grants - - - - -
Services & Software - - - - -
Workshops - - - - -
Interest - - - - -
Miscellaneous - - - - -
Total Funding 311,240$ 311,240$ -$ 603,900$ 292,660$
Expenses
Personnel Expenses
Salaries 108,886$ 110,356$ 1,470$ 116,241$ 7,355$
Payroll Taxes 5,691 6,713 1,022 5,786 95
Benefits 9,790 4,780 (5,010) 7,393 (2,397)
Retirement Costs 14,891 19,167 4,276 18,381 3,490
Total Personnel Expenses 139,258$ 141,016$ 1,758$ 147,801$ 8,543$
Meeting Expenses
Meetings 10,000$ -$ (10,000)$ 1,000$ (9,000)$
Travel 31,200 22,539 (8,661) 30,000 (1,200)
Conference Calls 144 90 (54) 144 -
Total Meeting Expenses 41,344$ 22,629$ (18,715)$ 31,144$ (10,200)$
Operating Expenses
Consultants & Contracts 80,000$ 114,326$ 34,326$ -$ (80,000)$
Office Rent - - - 120,000 120,000
Office Costs 1,800 2,468 668 2,364 564
Professional Services - - - - -
Miscellaneous 1,364 816 (548) 840 (524)
Depreciation 589 425 (164) 25,911 25,322
Total Operating Expenses 83,753$ 118,035$ 34,282$ 149,115$ 65,362$
Total Direct Expenses 264,355$ 281,680$ 17,325$ 328,060$ 63,705$
Indirect Expenses 45,423$ 50,944$ 5,521$ 51,206$ 5,783$
Other Non-Operating Expenses -$ -$ -$ -$ -$
Total Expenses 309,778$ 332,624$ 22,846$ 379,265$ 69,487$
Change in Assets 1,462$ (21,384)$ (22,846)$ 224,635$ 223,173$
Fixed Assets
Depreciation (589)$ (425)$ 164$ (25,911)$ (25,322)$
Computer & Software CapEx - - - 250,000 250,000
Furniture & Fixtures CapEx 3,400 - (3,400) - (3,400)
Equipment CapEx - - - - -
Leasehold Improvements - 1,200 1,200 - -
(Incr)Dec in Fixed Assets (2,811)$ (775)$ 2,036$ (224,089)$ (221,278)$
Allocation of Fixed Assets 1,348$ 1,040$ (308) (546)$ (1,894)$
Change in Fixed Assets (1,463)$ 265$ 1,728$ (224,635)$ (223,172)$
TOTAL CHANGE IN NET ASSETS (1)$ (21,120)$ (21,119)$ -$ 1$
Statement of Activities and Capital Expenditures
2011 Budget & Projection, and 2012 BudgetSituation Awareness and Infrastructure Security

Section A — Statutory Programs Situation Awareness and Infrastructure Security Program
2012 ReliabilityFirst Corporation Business Plan and Budget Approved by Board of Directors: April 22, 2011 for Stakeholder CommentJuly 8, 2011 87
Formatted: Font color: Text 1
Variance Variance
2011 Projection 2012 Budget
2011 2011 v 2011 Budget 2012 v 2011 Budget
Budget Projection Over(Under) Budget Over(Under)
Funding
ReliabilityFirstFunding
ERO Assessments 301,815$ 301,815$ -$ 595,592$ 293,777$
Penalty Sanctions 9,425 9,425 -$ 8,308 (1,117)
Total ReliabilityFirst Funding 311,240$ 311,240$ -$ 603,900$ 292,660$
Membership Dues -$ -$ -$ -$ -$
Federal Grants - - - - -
Services & Software - - - - -
Workshops - - - - -
Interest - - - - -
Miscellaneous - - - - -
Total Funding 311,240$ 311,240$ -$ 603,900$ 292,660$
Expenses
Personnel Expenses
Salaries 108,886$ 110,356$ 1,470$ 116,241$ 7,355$
Payroll Taxes 5,691 6,713 1,022 5,786 95
Benefits 9,790 4,780 (5,010) 7,393 (2,397)
Retirement Costs 14,891 19,167 4,276 18,381 3,490
Total Personnel Expenses 139,258$ 141,016$ 1,758$ 147,801$ 8,543$
Meeting Expenses
Meetings 10,000$ -$ (10,000)$ 1,000$ (9,000)$
Travel 31,200 22,539 (8,661) 30,000 (1,200)
Conference Calls 144 90 (54) 144 -
Total Meeting Expenses 41,344$ 22,629$ (18,715)$ 31,144$ (10,200)$
Operating Expenses
Consultants & Contracts 80,000$ 114,326$ 34,326$ -$ (80,000)$
Office Rent - - - 120,000 120,000
Office Costs 1,800 2,468 668 2,364 564
Professional Services - - - - -
Miscellaneous 1,364 816 (548) 840 (524)
Depreciation 589 425 (164) 25,911 25,322
Total Operating Expenses 83,753$ 118,035$ 34,282$ 149,115$ 65,362$
Total Direct Expenses 264,355$ 281,680$ 17,325$ 328,060$ 63,705$
Indirect Expenses 45,423$ 50,944$ 5,521$ 51,206$ 5,783$
Other Non-Operating Expenses -$ -$ -$ -$ -$
Total Expenses 309,778$ 332,624$ 22,846$ 379,265$ 69,487$
Change in Assets 1,462$ (21,384)$ (22,846)$ 224,635$ 223,173$
Fixed Assets
Depreciation (589)$ (425)$ 164$ (25,911)$ (25,322)$
Computer & Software CapEx - - - 250,000 250,000
Furniture & Fixtures CapEx 3,400 - (3,400) - (3,400)
Equipment CapEx - - - - -
Leasehold Improvements - 1,200 1,200 - -
(Incr)Dec in Fixed Assets (2,811)$ (775)$ 2,036$ (224,089)$ (221,278)$
Allocation of Fixed Assets 1,348$ 1,040$ (308) (546)$ (1,894)$
Change in Fixed Assets (1,463)$ 265$ 1,728$ (224,635)$ (223,172)$
TOTAL CHANGE IN NET ASSETS (1)$ (21,120)$ (21,119)$ -$ 1$
Statement of Activities and Capital Expenditures
2011 Budget & Projection, and 2012 BudgetSituation Awareness and Infrastructure Security
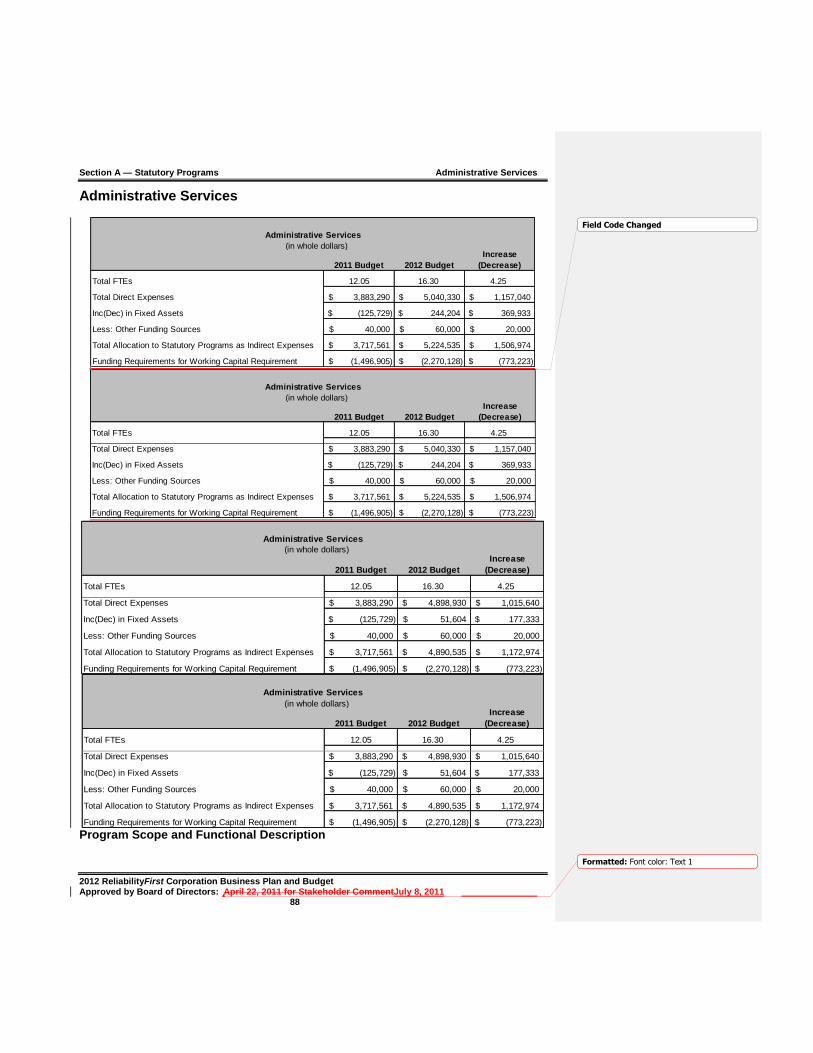
Section A — Statutory Programs Administrative Services
2012 ReliabilityFirst Corporation Business Plan and Budget Approved by Board of Directors: April 22, 2011 for Stakeholder CommentJuly 8, 2011 88
Formatted: Font color: Text 1
Administrative Services
2011 Budget 2012 Budget
Increase
(Decrease)
Total FTEs 12.05 16.30 4.25
Total Direct Expenses 3,883,290$ 5,040,330$ 1,157,040$
Inc(Dec) in Fixed Assets (125,729)$ 244,204$ 369,933$
Less: Other Funding Sources 40,000$ 60,000$ 20,000$
Total Allocation to Statutory Programs as Indirect Expenses 3,717,561$ 5,224,535$ 1,506,974$
Funding Requirements for Working Capital Requirement (1,496,905)$ (2,270,128)$ (773,223)$
Administrative Services
(in whole dollars)
2011 Budget 2012 Budget
Increase
(Decrease)
Total FTEs 12.05 16.30 4.25
Total Direct Expenses 3,883,290$ 4,898,930$ 1,015,640$
Inc(Dec) in Fixed Assets (125,729)$ 51,604$ 177,333$
Less: Other Funding Sources 40,000$ 60,000$ 20,000$
Total Allocation to Statutory Programs as Indirect Expenses 3,717,561$ 4,890,535$ 1,172,974$
Funding Requirements for Working Capital Requirement (1,496,905)$ (2,270,128)$ (773,223)$
Administrative Services
(in whole dollars)
Program Scope and Functional Description
Field Code Changed
Section A — Statutory Programs Administrative Services
2012 ReliabilityFirst Corporation Business Plan and Budget Approved by Board of Directors: April 22, 2011 for Stakeholder CommentJuly 8, 2011 89
Formatted: Font color: Text 1
Administrative Services is comprised of the following programs; Technical Committees and Member Forums, General and Administrative, Legal and Regulatory, Information Technology, Human Resources, and Finance and Accounting. Methodology for Allocation of Administrative Services Expenses to Programs
The ERO Assessment and penalty sanctions are only allocated across the delegated functionsdirect program areas, except that ERO assessments needed to fund working capital are reflected in the General and Administrative Program within Administrative Services.
The increase or decrease in assessments to achieve the desired working capital reserve balance is reflected as the Total Change in Assets.
All personnel and meeting expenses are accounted for within their associated department’s budget.
The majority of the Operating Expenses are accounted for within their related department’s budget. If an expense cannot be specifically linked to a department, it is included in one of the Administrative Services programs. All Eexpenses for the Administrative Services Programs, referred to as indirect expenses, are allocated to the delegated programdirect program areas by their respective FTEs. This allocation provides improved financial perspective for the delegated functions.direct program areas.
Capital expenditures are broken out as fixed assets at the end of each statement of activities rather than being included in their related lines in the operating expenses section.
Expenses include depreciation, which is a non cash item; therefore it has been deducted from the funding requirement for capital expenditures.
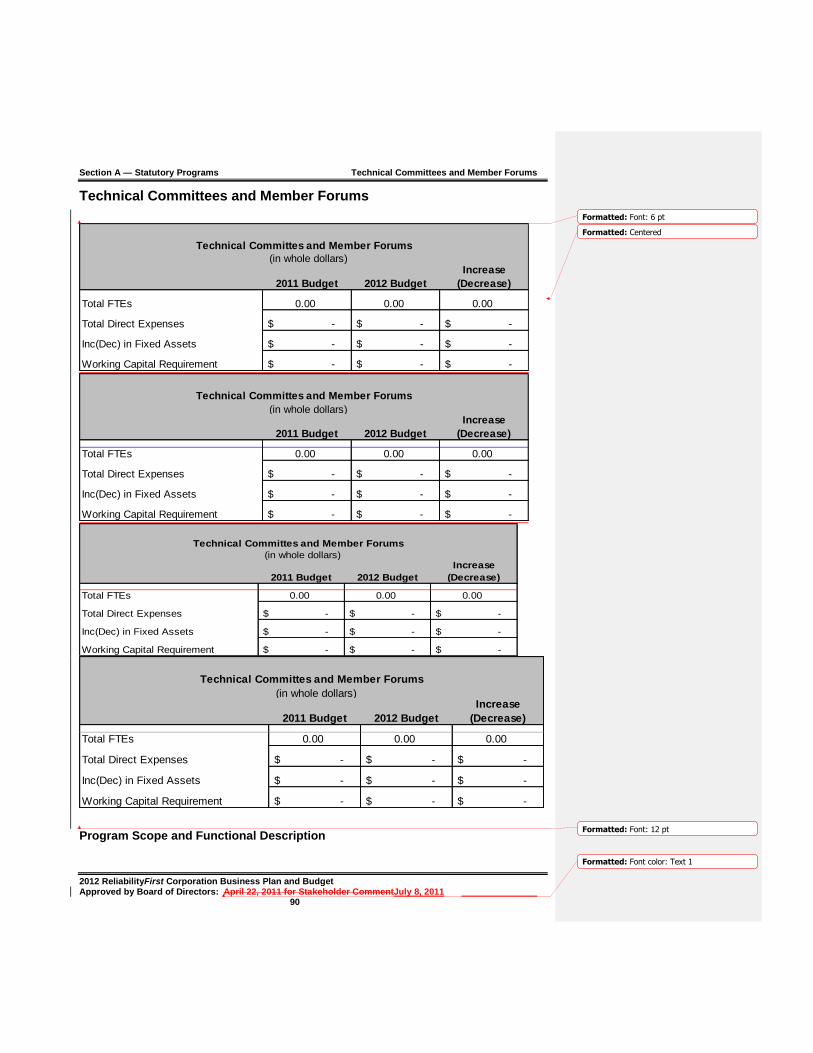
Section A — Statutory Programs Technical Committees and Member Forums
2012 ReliabilityFirst Corporation Business Plan and Budget Approved by Board of Directors: April 22, 2011 for Stakeholder CommentJuly 8, 2011 90
Formatted: Font color: Text 1
Technical Committees and Member Forums
2011 Budget 2012 Budget
Increase
(Decrease)
Total FTEs 0.00 0.00 0.00
Total Direct Expenses -$ -$ -$
Inc(Dec) in Fixed Assets -$ -$ -$
Working Capital Requirement -$ -$ -$
Technical Committes and Member Forums
(in whole dollars)
2011 Budget 2012 Budget
Increase
(Decrease)
Total FTEs 0.00 0.00 0.00
Total Direct Expenses -$ -$ -$
Inc(Dec) in Fixed Assets -$ -$ -$
Working Capital Requirement -$ -$ -$
Technical Committes and Member Forums
(in whole dollars)
2011 Budget 2012 Budget
Increase
(Decrease)
Total FTEs 0.00 0.00 0.00
Total Direct Expenses -$ -$ -$
Inc(Dec) in Fixed Assets -$ -$ -$
Working Capital Requirement -$ -$ -$
Technical Committes and Member Forums
(in whole dollars)
2011 Budget 2012 Budget
Increase
(Decrease)
Total FTEs 0.00 0.00 0.00
Total Direct Expenses -$ -$ -$
Inc(Dec) in Fixed Assets -$ -$ -$
Working Capital Requirement -$ -$ -$
Technical Committes and Member Forums
(in whole dollars)
Program Scope and Functional Description
Formatted: Font: 6 pt
Formatted: Centered
Formatted: Font: 12 pt
Section A — Statutory Programs Technical Committees and Member Forums
2012 ReliabilityFirst Corporation Business Plan and Budget Approved by Board of Directors: April 22, 2011 for Stakeholder CommentJuly 8, 2011 91
Formatted: Font color: Text 1
ReliabilityFirst has no forums similar to the North American Transmission Forum or Generator Forum, in which NERC uses this Member Forums program. For 2012, ReliabilityFirst allocated the budget and associated costs from the Technical Committees and Member Forums Program to the Reliability Assessment and Performance Analysis Program. The ReliabilityFirst technical committees and subcommittees continue to work exclusively on reliability assessment and performance analysis activities, and therefore, the staff support has been included totally within the Reliability Assessment and Performance Analysis Program.

Section A — Statutory Programs General and Administrative
2012 ReliabilityFirst Corporation Business Plan and Budget Approved by Board of Directors: April 22, 2011 for Stakeholder CommentJuly 8, 2011 92
Formatted: Font color: Text 1
General and Administrative
2011 Budget 2012 Budget
Increase
(Decrease)
Total FTEs 2.30 4.30 2.00
Total Direct Expenses 1,556,719$ 2,296,601$ 739,882$
Inc(Dec) in Fixed Assets (20,075)$ (46,315)$ (26,240)$
Working Capital Requirement (1,496,905)$ (2,270,128)$ (773,223)$
General and Administrative
(in whole dollars)
2011 Budget 2012 Budget
Increase
(Decrease)
Total FTEs 2.30 4.30 2.00
Total Direct Expenses 1,556,719$ 2,296,601$ 739,882$
Inc(Dec) in Fixed Assets (20,075)$ (46,315)$ (26,240)$
Working Capital Requirement (1,496,905)$ (2,270,128)$ (773,223)$
General and Administrative
(in whole dollars)
2011 Budget 2012 Budget
Increase
(Decrease)
Total FTEs 2.30 4.30 2.00
Total Direct Expenses 1,556,719$ 2,296,601$ 739,882$
Inc(Dec) in Fixed Assets (20,075)$ (46,315)$ (26,240)$
Working Capital Requirement (1,496,905)$ (2,270,128)$ (773,223)$
General and Administrative
(in whole dollars)
2011 Budget 2012 Budget
Increase
(Decrease)
Total FTEs 2.30 4.30 2.00
Total Direct Expenses 1,556,719$ 2,296,601$ 739,882$
Inc(Dec) in Fixed Assets (20,075)$ (46,315)$ (26,240)$
Working Capital Requirement (1,496,905)$ (2,270,128)$ (773,223)$
General and Administrative
(in whole dollars)
Formatted: Font: 6 pt
Formatted: Space After: 0 pt
Field Code Changed
Formatted: Font: 6 pt

Section A — Statutory Programs General and Administrative
2012 ReliabilityFirst Corporation Business Plan and Budget Approved by Board of Directors: April 22, 2011 for Stakeholder CommentJuly 8, 2011 93
Formatted: Font color: Text 1
Program Scope and Functional Description The General and Administrative Department consists of the President and CEO, Senior Vice President, Executive Assistant, Receptionist, and the Corporate Secretary. Responsibilities include leadership, oversight, and management of all ReliabilityFirst Corporation's activities, interaction with the Board of Directors, and other Regional Entity Management Groups, managing the relationships with governmental agencies, regulators, members, stakeholders, and other industry organizations. 2012 Key Assumptions The General and Administrative Program incorporates regional specific common business planning assumptions as described in the ReliabilityFirst NERC 2012 Business Plan and Budget, Attachment Exhibit A: 2012 – 2015 Shared Business Planning and Budget Assumptions (NERC and the Regional Entities) document, including additional resources required for initiatives that support these shared ERO goals. There are no additional assumptions unique to the ReliabilityFirst General and Administrative Program.
Section A — Statutory Programs General and Administrative
2012 ReliabilityFirst Corporation Business Plan and Budget Approved by Board of Directors: April 22, 2011 for Stakeholder CommentJuly 8, 2011 94
Formatted: Font color: Text 1
Funding Requirements — Explanation of Variance Funding Sources (Other than ERO Assessments)
In 2012, the expenses related to indirect program areas, including General and Administrative are being allocated entirely to the direct programs and therefore have no ERO assessment in 2012.
Personnel Expenses
Salary, payroll taxes, benefits, and savings and retirement expensescosts for 2012 are budgeted for 4.30 FTEs, an increase of two FTEs over 2011. The increase in personnel expenses is due to the reallocation of two FTEs from the Compliance Program, resulting from reorganization due to continued growth.
Meeting Expenses
An increase in meeting expenses comes from the travel expenses associated with the additional FTEs that were allocated to this program area.
Operating Expenses
Operating Expenses increased for 2012 as a result of budgeting for consultants to review and update the company’s strategic plan, along with estimated increases in amounts for utilities and commercial insurance rates.
Indirect Expenses
Expenses related to indirect programs, including General and Administrative have been allocated proportionately based on FTE count to the direct programs for 2012.
Other Non-Operating Expenses
There are no other non-operating expenses expected for 2012. Fixed Asset Additions
The decrease in fixed assets is due to the budgeting for furniture for new
offices in the 2011 budget. These amounts were not included in the 2012 budget.
There are no fixed asset additions expected for 2012.
Formatted: Font: 12 pt, Not Bold, Nounderline, Font color: Black, Check spelling andgrammar
Formatted: Font: 12 pt, Not Bold, Nounderline, Font color: Black, Check spelling andgrammar
Formatted: Indent: Left: 0.5", No bullets ornumbering

Section A — Statutory Programs General and Administrative
2012 ReliabilityFirst Corporation Business Plan and Budget Approved by Board of Directors: April 22, 2011 for Stakeholder CommentJuly 8, 2011 95
Formatted: Font color: Text 1
General and Administrative
Funding sources and related expenses for the General and Administrative section of the 2012 Business Plan and Budget are shown in the table below.

Section A — Statutory Programs General and Administrative
2012 ReliabilityFirst Corporation Business Plan and Budget Approved by Board of Directors: April 22, 2011 for Stakeholder CommentJuly 8, 2011 96
Formatted: Font color: Text 1
Variance Variance
2011 Projection 2012 Budget
2011 2011 v 2011 Budget 2012 v 2011 Budget
Budget Projection Over(Under) Budget Over(Under)
Funding
ReliabilityFirstFunding
ERO Assessments (1,496,905)$ (1,496,905)$ -$ (2,270,128)$ (773,223)$
Penalty Sanctions -
Total ReliabilityFirst Funding (1,496,905)$ (1,496,905)$ -$ (2,270,128)$ (773,223)$
Membership Dues -$ -$ -$ -$ -$
Federal Grants - - - - -
Services & Software - - - - -
Workshops - - - - -
Interest 40,000 40,000 - 60,000 20,000
Miscellaneous - - - - -
Total Funding (1,456,905)$ (1,456,905)$ -$ (2,210,128)$ (753,223)$
Expenses
Personnel Expenses
Salaries 589,540$ 1,024,447$ 434,907$ 1,069,758$ 480,218$
Payroll Taxes 19,904 21,884 1,980 36,901 16,997
Benefits 31,208 58,774 27,566 74,186 42,978
Retirement Costs 67,043 140,572 73,529 147,338 80,295
Total Personnel Expenses 707,695$ 1,245,677$ 537,982$ 1,328,183$ 620,488$
Meeting Expenses
Meetings 54,000$ 48,621$ (5,379)$ 57,200$ 3,200$
Travel 40,000 33,882 (6,118) 62,750 22,750
Conference Calls 276 996 720 972 696
Total Meeting Expenses 94,276$ 83,499$ (10,777)$ 120,922$ 26,646$
Operating Expenses
Consultants & Contracts -$ 5,495$ 5,495$ 15,000$ 15,000$
Office Rent 392,392 392,384 (8) 411,460 19,068
Office Costs 35,495 33,324 (2,171) 31,950 (3,545)
Professional Services 297,950 297,281 (669) 324,961 27,011
Miscellaneous 4,336 17,433 13,097 17,810 13,474
Depreciation 24,575 45,672 21,097 46,315 21,740
Total Operating Expenses 754,748$ 791,589$ 36,841$ 847,496$ 92,748$
Total Direct Expenses 1,556,719$ 2,120,765$ 564,046$ 2,296,601$ 739,882$
Indirect Expenses (1,516,719)$ (2,080,765)$ (564,046)$ (2,236,601)$ (719,882)$
Other Non-Operating Expenses -$ -$ -$ -$ -$
Total Expenses 40,000$ 40,000$ -$ 60,000$ 20,000$
Change in Assets (1,496,905)$ (1,496,905)$ -$ (2,270,128)$ (773,223)$
Fixed Assets
Depreciation (24,575)$ (45,672)$ (21,097)$ (46,315)$ (21,740)$
Computer & Software CapEx - - - - -
Furniture & Fixtures CapEx 4,500 3,000 (1,500) - (4,500)
Equipment CapEx - - - - -
Leasehold Improvements - - - - -
(Incr)Dec in Fixed Assets 20,075$ 42,672$ 22,597$ 46,315$ 26,240$
Allocation of Fixed Assets (20,075)$ (42,672)$ (22,597) (46,315)$ (26,240)$
Change in Fixed Assets -$ -$ -$ -$ -$
TOTAL CHANGE IN NET ASSETS (1,496,905)$ (1,496,905)$ -$ (2,270,128)$ (773,223)$
Statement of Activities and Capital Expenditures
2011 Budget & Projection, and 2012 BudgetGeneral and Administrative
Field Code Changed
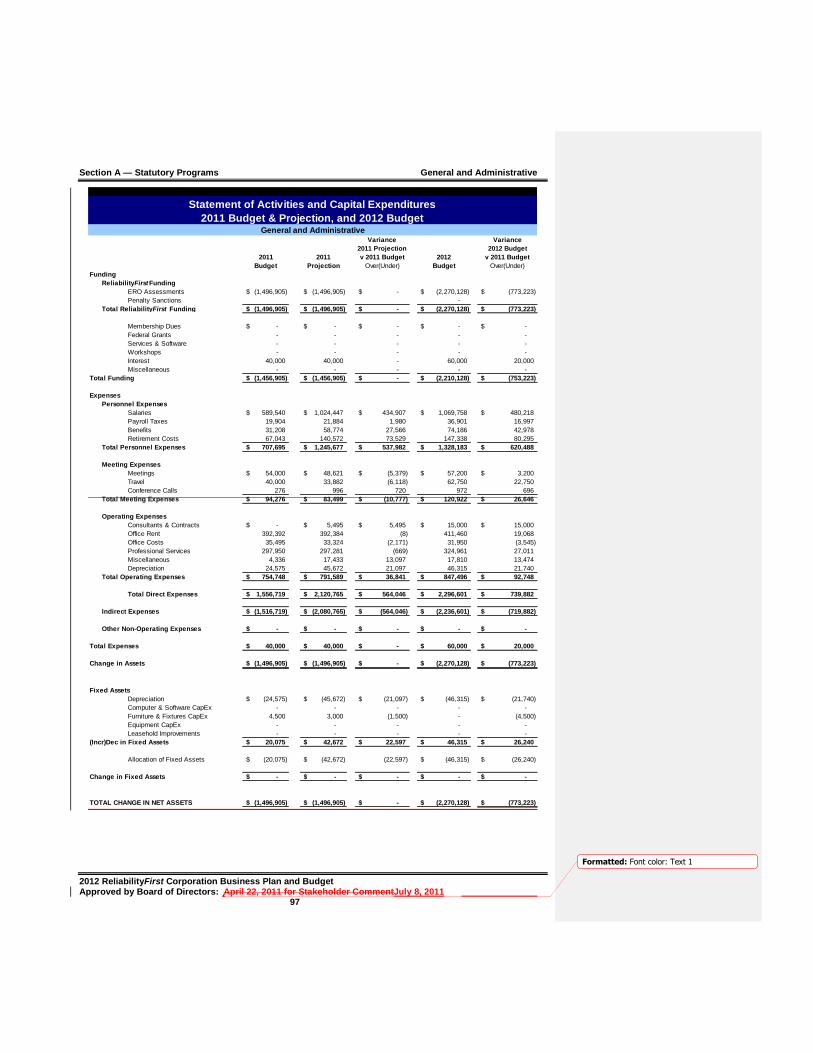
Section A — Statutory Programs General and Administrative
2012 ReliabilityFirst Corporation Business Plan and Budget Approved by Board of Directors: April 22, 2011 for Stakeholder CommentJuly 8, 2011 97
Formatted: Font color: Text 1
Variance Variance
2011 Projection 2012 Budget
2011 2011 v 2011 Budget 2012 v 2011 Budget
Budget Projection Over(Under) Budget Over(Under)
Funding
ReliabilityFirstFunding
ERO Assessments (1,496,905)$ (1,496,905)$ -$ (2,270,128)$ (773,223)$
Penalty Sanctions -
Total ReliabilityFirst Funding (1,496,905)$ (1,496,905)$ -$ (2,270,128)$ (773,223)$
Membership Dues -$ -$ -$ -$ -$
Federal Grants - - - - -
Services & Software - - - - -
Workshops - - - - -
Interest 40,000 40,000 - 60,000 20,000
Miscellaneous - - - - -
Total Funding (1,456,905)$ (1,456,905)$ -$ (2,210,128)$ (753,223)$
Expenses
Personnel Expenses
Salaries 589,540$ 1,024,447$ 434,907$ 1,069,758$ 480,218$
Payroll Taxes 19,904 21,884 1,980 36,901 16,997
Benefits 31,208 58,774 27,566 74,186 42,978
Retirement Costs 67,043 140,572 73,529 147,338 80,295
Total Personnel Expenses 707,695$ 1,245,677$ 537,982$ 1,328,183$ 620,488$
Meeting Expenses
Meetings 54,000$ 48,621$ (5,379)$ 57,200$ 3,200$
Travel 40,000 33,882 (6,118) 62,750 22,750
Conference Calls 276 996 720 972 696
Total Meeting Expenses 94,276$ 83,499$ (10,777)$ 120,922$ 26,646$
Operating Expenses
Consultants & Contracts -$ 5,495$ 5,495$ 15,000$ 15,000$
Office Rent 392,392 392,384 (8) 411,460 19,068
Office Costs 35,495 33,324 (2,171) 31,950 (3,545)
Professional Services 297,950 297,281 (669) 324,961 27,011
Miscellaneous 4,336 17,433 13,097 17,810 13,474
Depreciation 24,575 45,672 21,097 46,315 21,740
Total Operating Expenses 754,748$ 791,589$ 36,841$ 847,496$ 92,748$
Total Direct Expenses 1,556,719$ 2,120,765$ 564,046$ 2,296,601$ 739,882$
Indirect Expenses (1,516,719)$ (2,080,765)$ (564,046)$ (2,236,601)$ (719,882)$
Other Non-Operating Expenses -$ -$ -$ -$ -$
Total Expenses 40,000$ 40,000$ -$ 60,000$ 20,000$
Change in Assets (1,496,905)$ (1,496,905)$ -$ (2,270,128)$ (773,223)$
Fixed Assets
Depreciation (24,575)$ (45,672)$ (21,097)$ (46,315)$ (21,740)$
Computer & Software CapEx - - - - -
Furniture & Fixtures CapEx 4,500 3,000 (1,500) - (4,500)
Equipment CapEx - - - - -
Leasehold Improvements - - - - -
(Incr)Dec in Fixed Assets 20,075$ 42,672$ 22,597$ 46,315$ 26,240$
Allocation of Fixed Assets (20,075)$ (42,672)$ (22,597) (46,315)$ (26,240)$
Change in Fixed Assets -$ -$ -$ -$ -$
TOTAL CHANGE IN NET ASSETS (1,496,905)$ (1,496,905)$ -$ (2,270,128)$ (773,223)$
Statement of Activities and Capital Expenditures
2011 Budget & Projection, and 2012 BudgetGeneral and Administrative
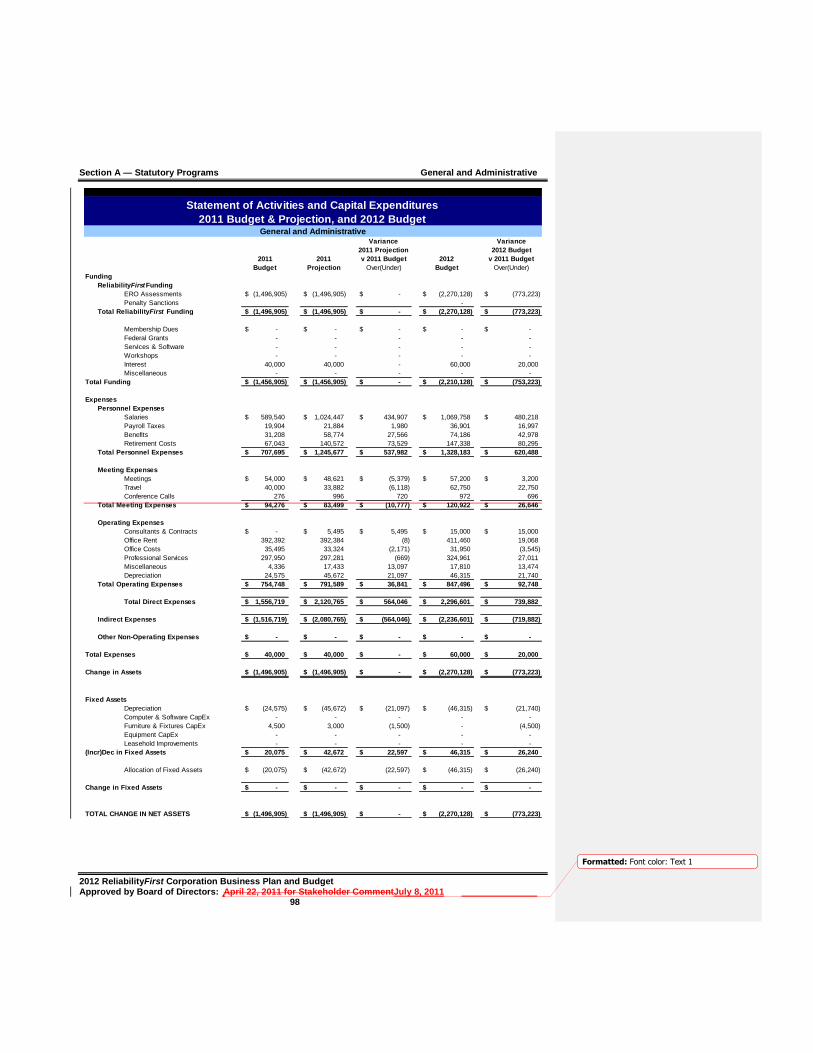
Section A — Statutory Programs General and Administrative
2012 ReliabilityFirst Corporation Business Plan and Budget Approved by Board of Directors: April 22, 2011 for Stakeholder CommentJuly 8, 2011 98
Formatted: Font color: Text 1
Variance Variance
2011 Projection 2012 Budget
2011 2011 v 2011 Budget 2012 v 2011 Budget
Budget Projection Over(Under) Budget Over(Under)
Funding
ReliabilityFirstFunding
ERO Assessments (1,496,905)$ (1,496,905)$ -$ (2,270,128)$ (773,223)$
Penalty Sanctions -
Total ReliabilityFirst Funding (1,496,905)$ (1,496,905)$ -$ (2,270,128)$ (773,223)$
Membership Dues -$ -$ -$ -$ -$
Federal Grants - - - - -
Services & Software - - - - -
Workshops - - - - -
Interest 40,000 40,000 - 60,000 20,000
Miscellaneous - - - - -
Total Funding (1,456,905)$ (1,456,905)$ -$ (2,210,128)$ (753,223)$
Expenses
Personnel Expenses
Salaries 589,540$ 1,024,447$ 434,907$ 1,069,758$ 480,218$
Payroll Taxes 19,904 21,884 1,980 36,901 16,997
Benefits 31,208 58,774 27,566 74,186 42,978
Retirement Costs 67,043 140,572 73,529 147,338 80,295
Total Personnel Expenses 707,695$ 1,245,677$ 537,982$ 1,328,183$ 620,488$
Meeting Expenses
Meetings 54,000$ 48,621$ (5,379)$ 57,200$ 3,200$
Travel 40,000 33,882 (6,118) 62,750 22,750
Conference Calls 276 996 720 972 696
Total Meeting Expenses 94,276$ 83,499$ (10,777)$ 120,922$ 26,646$
Operating Expenses
Consultants & Contracts -$ 5,495$ 5,495$ 15,000$ 15,000$
Office Rent 392,392 392,384 (8) 411,460 19,068
Office Costs 35,495 33,324 (2,171) 31,950 (3,545)
Professional Services 297,950 297,281 (669) 324,961 27,011
Miscellaneous 4,336 17,433 13,097 17,810 13,474
Depreciation 24,575 45,672 21,097 46,315 21,740
Total Operating Expenses 754,748$ 791,589$ 36,841$ 847,496$ 92,748$
Total Direct Expenses 1,556,719$ 2,120,765$ 564,046$ 2,296,601$ 739,882$
Indirect Expenses (1,516,719)$ (2,080,765)$ (564,046)$ (2,236,601)$ (719,882)$
Other Non-Operating Expenses -$ -$ -$ -$ -$
Total Expenses 40,000$ 40,000$ -$ 60,000$ 20,000$
Change in Assets (1,496,905)$ (1,496,905)$ -$ (2,270,128)$ (773,223)$
Fixed Assets
Depreciation (24,575)$ (45,672)$ (21,097)$ (46,315)$ (21,740)$
Computer & Software CapEx - - - - -
Furniture & Fixtures CapEx 4,500 3,000 (1,500) - (4,500)
Equipment CapEx - - - - -
Leasehold Improvements - - - - -
(Incr)Dec in Fixed Assets 20,075$ 42,672$ 22,597$ 46,315$ 26,240$
Allocation of Fixed Assets (20,075)$ (42,672)$ (22,597) (46,315)$ (26,240)$
Change in Fixed Assets -$ -$ -$ -$ -$
TOTAL CHANGE IN NET ASSETS (1,496,905)$ (1,496,905)$ -$ (2,270,128)$ (773,223)$
Statement of Activities and Capital Expenditures
2011 Budget & Projection, and 2012 BudgetGeneral and Administrative
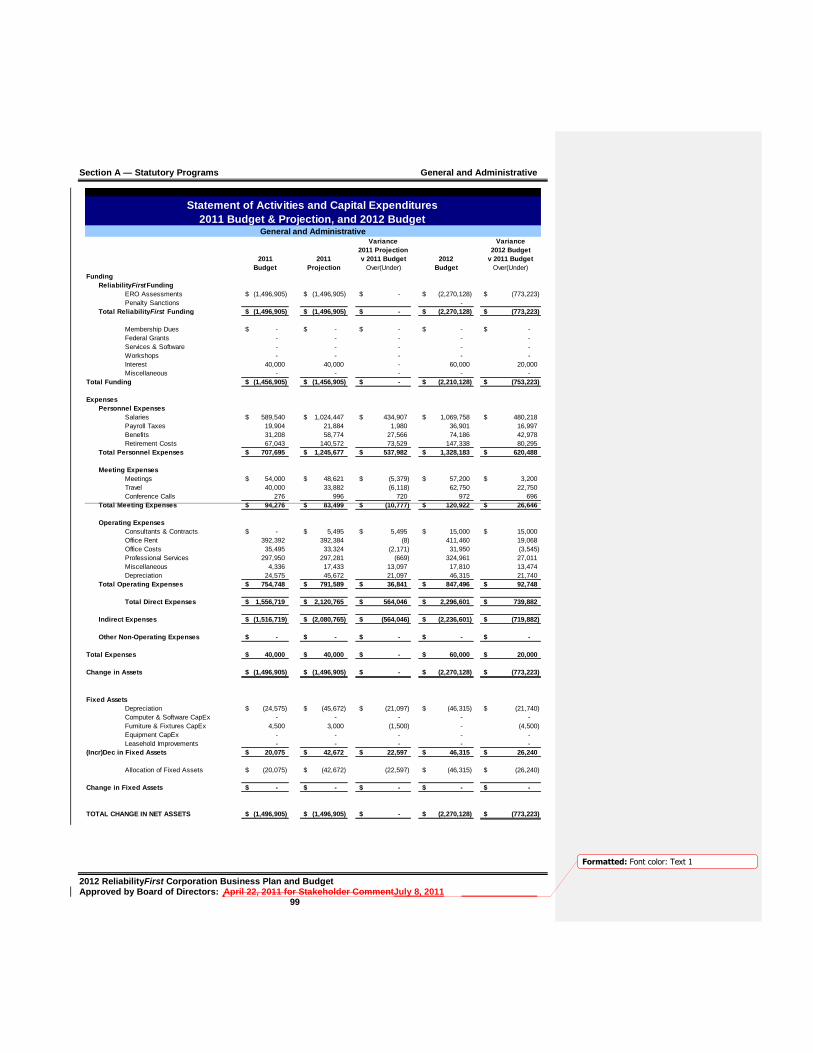
Section A — Statutory Programs General and Administrative
2012 ReliabilityFirst Corporation Business Plan and Budget Approved by Board of Directors: April 22, 2011 for Stakeholder CommentJuly 8, 2011 99
Formatted: Font color: Text 1
Variance Variance
2011 Projection 2012 Budget
2011 2011 v 2011 Budget 2012 v 2011 Budget
Budget Projection Over(Under) Budget Over(Under)
Funding
ReliabilityFirstFunding
ERO Assessments (1,496,905)$ (1,496,905)$ -$ (2,270,128)$ (773,223)$
Penalty Sanctions -
Total ReliabilityFirst Funding (1,496,905)$ (1,496,905)$ -$ (2,270,128)$ (773,223)$
Membership Dues -$ -$ -$ -$ -$
Federal Grants - - - - -
Services & Software - - - - -
Workshops - - - - -
Interest 40,000 40,000 - 60,000 20,000
Miscellaneous - - - - -
Total Funding (1,456,905)$ (1,456,905)$ -$ (2,210,128)$ (753,223)$
Expenses
Personnel Expenses
Salaries 589,540$ 1,024,447$ 434,907$ 1,069,758$ 480,218$
Payroll Taxes 19,904 21,884 1,980 36,901 16,997
Benefits 31,208 58,774 27,566 74,186 42,978
Retirement Costs 67,043 140,572 73,529 147,338 80,295
Total Personnel Expenses 707,695$ 1,245,677$ 537,982$ 1,328,183$ 620,488$
Meeting Expenses
Meetings 54,000$ 48,621$ (5,379)$ 57,200$ 3,200$
Travel 40,000 33,882 (6,118) 62,750 22,750
Conference Calls 276 996 720 972 696
Total Meeting Expenses 94,276$ 83,499$ (10,777)$ 120,922$ 26,646$
Operating Expenses
Consultants & Contracts -$ 5,495$ 5,495$ 15,000$ 15,000$
Office Rent 392,392 392,384 (8) 411,460 19,068
Office Costs 35,495 33,324 (2,171) 31,950 (3,545)
Professional Services 297,950 297,281 (669) 324,961 27,011
Miscellaneous 4,336 17,433 13,097 17,810 13,474
Depreciation 24,575 45,672 21,097 46,315 21,740
Total Operating Expenses 754,748$ 791,589$ 36,841$ 847,496$ 92,748$
Total Direct Expenses 1,556,719$ 2,120,765$ 564,046$ 2,296,601$ 739,882$
Indirect Expenses (1,516,719)$ (2,080,765)$ (564,046)$ (2,236,601)$ (719,882)$
Other Non-Operating Expenses -$ -$ -$ -$ -$
Total Expenses 40,000$ 40,000$ -$ 60,000$ 20,000$
Change in Assets (1,496,905)$ (1,496,905)$ -$ (2,270,128)$ (773,223)$
Fixed Assets
Depreciation (24,575)$ (45,672)$ (21,097)$ (46,315)$ (21,740)$
Computer & Software CapEx - - - - -
Furniture & Fixtures CapEx 4,500 3,000 (1,500) - (4,500)
Equipment CapEx - - - - -
Leasehold Improvements - - - - -
(Incr)Dec in Fixed Assets 20,075$ 42,672$ 22,597$ 46,315$ 26,240$
Allocation of Fixed Assets (20,075)$ (42,672)$ (22,597) (46,315)$ (26,240)$
Change in Fixed Assets -$ -$ -$ -$ -$
TOTAL CHANGE IN NET ASSETS (1,496,905)$ (1,496,905)$ -$ (2,270,128)$ (773,223)$
Statement of Activities and Capital Expenditures
2011 Budget & Projection, and 2012 BudgetGeneral and Administrative

Section A — Statutory Programs Legal and Regulatory
2012 ReliabilityFirst Corporation Business Plan and Budget Approved by Board of Directors: April 22, 2011 for Stakeholder CommentJuly 8, 2011 100
Formatted: Font color: Text 1
Legal and Regulatory
2011 Budget 2012 Budget
Increase
(Decrease)
Total FTEs 0.25 2.00 1.75
Total Direct Expenses 140,996.00$ 439,837$ 298,841$
Inc(Dec) in Fixed Assets -$ -$ -$
Legal and Regulatory
(in whole dollars)
2011 Budget 2012 Budget
Increase
(Decrease)
Total FTEs 0.25 2.00 1.75
Total Direct Expenses 140,996.00$ 439,837$ 298,841$
Inc(Dec) in Fixed Assets -$ -$ -$
Legal and Regulatory
(in whole dollars)
2011 Budget 2012 Budget
Increase
(Decrease)
Total FTEs 0.25 2.00 1.75
Total Direct Expenses 140,996.00$ 439,837$ 298,841$
Inc(Dec) in Fixed Assets -$ -$ -$
Legal and Regulatory
(in whole dollars)
2011 Budget 2012 Budget
Increase
(Decrease)
Total FTEs 0.25 2.00 1.75
Total Direct Expenses 140,996.00$ 439,837$ 298,841$
Inc(Dec) in Fixed Assets -$ -$ -$
Legal and Regulatory
(in whole dollars)
Program Scope and Functional Description ReliabilityFirst has in past years used outside counsel as the primary resource to assist with our legal and regulatory matters, as this was the most cost effective and efficient option at the time. With the addition of on-staff attorneys over the past three years, a shift occurred in the 2011 budget in leveragingto leverage those internal resources to
Formatted: Font: 6 pt
Field Code Changed

Section A — Statutory Programs Legal and Regulatory
2012 ReliabilityFirst Corporation Business Plan and Budget Approved by Board of Directors: April 22, 2011 for Stakeholder CommentJuly 8, 2011 101
Formatted: Font color: Text 1
achieve cost advantages and efficiencies by bringing some of the legal work in house. The 2012 budget continues that approach, resulting in significant reduction in outside legal costs. Legal activities will continue to include the areas of Corporate Governance, Contract Review, Employment Law, General Counsel Activities, FERC Filings, General Corporate Needs, and serving as Advisor to the President.
2012 Key Assumptions
The Legal and Regulatory Program incorporates regional specific common business planning assumptions as described in the ReliabilityFirst NERC 2012 Business Plan and Budget, Attachment Exhibit A: 2012 – 2015 Shared Business Planning and Budget Assumptions (NERC and the Regional Entities) document, including additional resources required for initiatives that support these shared ERO goals. There are no additional assumptions unique to the Legal and Regulatory Program. 2012 Key Deliverables Support all legal needs of the corporation.

Section A — Statutory Programs Legal and Regulatory
2012 ReliabilityFirst Corporation Business Plan and Budget Approved by Board of Directors: April 22, 2011 for Stakeholder CommentJuly 8, 2011 102
Formatted: Font color: Text 1
Funding Requirements — Explanation of Variance Funding Sources (Other than ERO Assessments)
In 2012, the expenses related to the indirect program areas, including Legal and Regulatory, are being allocated entirely to the direct programs and therefore have no ERO assessment in 2012.
Personnel Expenses
Salary, payroll taxes, benefits, and savings and retirement expenses costs for 2012 are budgeted for two FTEs, an increase of 1.75 FTEs from 2011. The increase in personnel expenses is a result of the reallocation of 1.75 FTEs from the Compliance Program along with the budgeting for standard yearly increases for 2012.
Meeting Expenses
Meeting, staff travel, and conference call expenses Travel expenses increased as a result of the additional FTEs that were added allocated to this program area.
Operating Expenses
The decrease in operating expenses is a result of hiring on staff attorneys for the purpose of handling corporate legal matters that were previously handled by outside counsel.
Indirect Expenses
Expenses related to indirect programs, including Legal and Regulatory, have been allocated proportionately based on FTE count to the direct programs for 2012.
Other Non-Operating Expenses
No other non-operating expenses are expected for 2012. Fixed Asset Additions
No fixed asset additions are expected for 2012.

Section A — Statutory Programs Legal and Regulatory
2012 ReliabilityFirst Corporation Business Plan and Budget Approved by Board of Directors: April 22, 2011 for Stakeholder CommentJuly 8, 2011 103
Formatted: Font color: Text 1
Legal and Regulatory
Funding sources and related expenses for the Legal and Regulatory section of the 2012 Business Plan and Budget are shown in the table below.

Section A — Statutory Programs Legal and Regulatory
2012 ReliabilityFirst Corporation Business Plan and Budget Approved by Board of Directors: April 22, 2011 for Stakeholder CommentJuly 8, 2011 104
Formatted: Font color: Text 1
Variance Variance
2011 Projection 2012 Budget
2011 2011 v 2011 Budget 2012 v 2011 Budget
Budget Projection Over(Under) Budget Over(Under)
Funding
ReliabilityFirstFunding
ERO Assessments -$ -$ -$ -$ -$
Penalty Sanctions -
Total ReliabilityFirst Funding -$ -$ -$ -$ -$
Membership Dues -$ -$ -$ -$ -$
Federal Grants - - - - -
Services & Software - - - - -
Workshops - - - - -
Interest - - - - -
Miscellaneous - - - - -
Total Funding -$ -$ -$ -$ -$
Expenses
Personnel Expenses
Salaries 47,424$ 176,495$ 129,071$ 329,791$ 282,367$
Payroll Taxes 2,402 6,934 4,532 18,449 16,047
Benefits 514 1,826 1,312 11,799 11,285
Retirement Costs 6,656 26,940 20,284 52,038 45,382
Total Personnel Expenses 56,996$ 212,195$ 155,199$ 412,077$ 355,081$
Meeting Expenses
Meetings -$ -$ -$ -$ -$
Travel - 8,448 8,448 12,000 12,000
Conference Calls - - - - -
Total Meeting Expenses -$ 8,448$ 8,448$ 12,000$ 12,000$
Operating Expenses
Consultants & Contracts -$ -$ -$ -$ -$
Office Rent - - - - -
Office Costs - - - 3,760 3,760
Professional Services 84,000 46,306 (37,694) 12,000 (72,000)
Miscellaneous - - - - -
Depreciation - - - - -
Total Operating Expenses 84,000$ 46,306$ (37,694)$ 15,760$ (68,240)$
Total Direct Expenses 140,996$ 266,949$ 125,953$ 439,837$ 298,841$
Indirect Expenses (140,996)$ (266,949)$ (125,953)$ (439,837)$ (298,841)$
Other Non-Operating Expenses -$ -$ -$ -$ -$
Total Expenses -$ -$ -$ -$ -$
Change in Assets -$ -$ -$ -$ -$
Fixed Assets
Depreciation -$ -$ -$ -$ -$
Computer & Software CapEx - - - - -
Furniture & Fixtures CapEx - - - - -
Equipment CapEx - - - - -
Leasehold Improvements - - - - -
(Incr)Dec in Fixed Assets -$ -$ -$ -$ -$
Allocation of Fixed Assets -$ -$ -$ -$ -$
Change in Fixed Assets -$ -$ -$ -$ -$
TOTAL CHANGE IN NET ASSETS -$ -$ -$ -$ -$
Statement of Activities and Capital Expenditures
2011 Budget & Projection, and 2012 BudgetLegal and Regulatory
Field Code Changed

Section A — Statutory Programs Legal and Regulatory
2012 ReliabilityFirst Corporation Business Plan and Budget Approved by Board of Directors: April 22, 2011 for Stakeholder CommentJuly 8, 2011 105
Formatted: Font color: Text 1
Variance Variance
2011 Projection 2012 Budget
2011 2011 v 2011 Budget 2012 v 2011 Budget
Budget Projection Over(Under) Budget Over(Under)
Funding
ReliabilityFirstFunding
ERO Assessments -$ -$ -$ -$ -$
Penalty Sanctions -
Total ReliabilityFirst Funding -$ -$ -$ -$ -$
Membership Dues -$ -$ -$ -$ -$
Federal Grants - - - - -
Services & Software - - - - -
Workshops - - - - -
Interest - - - - -
Miscellaneous - - - - -
Total Funding -$ -$ -$ -$ -$
Expenses
Personnel Expenses
Salaries 47,424$ 176,495$ 129,071$ 329,791$ 282,367$
Payroll Taxes 2,402 6,934 4,532 18,449 16,047
Benefits 514 1,826 1,312 11,799 11,285
Retirement Costs 6,656 26,940 20,284 52,038 45,382
Total Personnel Expenses 56,996$ 212,195$ 155,199$ 412,077$ 355,081$
Meeting Expenses
Meetings -$ -$ -$ -$ -$
Travel - 8,448 8,448 12,000 12,000
Conference Calls - - - - -
Total Meeting Expenses -$ 8,448$ 8,448$ 12,000$ 12,000$
Operating Expenses
Consultants & Contracts -$ -$ -$ -$ -$
Office Rent - - - - -
Office Costs - - - 3,760 3,760
Professional Services 84,000 46,306 (37,694) 12,000 (72,000)
Miscellaneous - - - - -
Depreciation - - - - -
Total Operating Expenses 84,000$ 46,306$ (37,694)$ 15,760$ (68,240)$
Total Direct Expenses 140,996$ 266,949$ 125,953$ 439,837$ 298,841$
Indirect Expenses (140,996)$ (266,949)$ (125,953)$ (439,837)$ (298,841)$
Other Non-Operating Expenses -$ -$ -$ -$ -$
Total Expenses -$ -$ -$ -$ -$
Change in Assets -$ -$ -$ -$ -$
Fixed Assets
Depreciation -$ -$ -$ -$ -$
Computer & Software CapEx - - - - -
Furniture & Fixtures CapEx - - - - -
Equipment CapEx - - - - -
Leasehold Improvements - - - - -
(Incr)Dec in Fixed Assets -$ -$ -$ -$ -$
Allocation of Fixed Assets -$ -$ -$ -$ -$
Change in Fixed Assets -$ -$ -$ -$ -$
TOTAL CHANGE IN NET ASSETS -$ -$ -$ -$ -$
Statement of Activities and Capital Expenditures
2011 Budget & Projection, and 2012 BudgetLegal and Regulatory

Section A — Statutory Programs Legal and Regulatory
2012 ReliabilityFirst Corporation Business Plan and Budget Approved by Board of Directors: April 22, 2011 for Stakeholder CommentJuly 8, 2011 106
Formatted: Font color: Text 1
Variance Variance
2011 Projection 2012 Budget
2011 2011 v 2011 Budget 2012 v 2011 Budget
Budget Projection Over(Under) Budget Over(Under)
Funding
ReliabilityFirstFunding
ERO Assessments -$ -$ -$ -$ -$
Penalty Sanctions -
Total ReliabilityFirst Funding -$ -$ -$ -$ -$
Membership Dues -$ -$ -$ -$ -$
Federal Grants - - - - -
Services & Software - - - - -
Workshops - - - - -
Interest - - - - -
Miscellaneous - - - - -
Total Funding -$ -$ -$ -$ -$
Expenses
Personnel Expenses
Salaries 47,424$ 176,495$ 129,071$ 329,791$ 282,367$
Payroll Taxes 2,402 6,934 4,532 18,449 16,047
Benefits 514 1,826 1,312 11,799 11,285
Retirement Costs 6,656 26,940 20,284 52,038 45,382
Total Personnel Expenses 56,996$ 212,195$ 155,199$ 412,077$ 355,081$
Meeting Expenses
Meetings -$ -$ -$ -$ -$
Travel - 8,448 8,448 12,000 12,000
Conference Calls - - - - -
Total Meeting Expenses -$ 8,448$ 8,448$ 12,000$ 12,000$
Operating Expenses
Consultants & Contracts -$ -$ -$ -$ -$
Office Rent - - - - -
Office Costs - - - 3,760 3,760
Professional Services 84,000 46,306 (37,694) 12,000 (72,000)
Miscellaneous - - - - -
Depreciation - - - - -
Total Operating Expenses 84,000$ 46,306$ (37,694)$ 15,760$ (68,240)$
Total Direct Expenses 140,996$ 266,949$ 125,953$ 439,837$ 298,841$
Indirect Expenses (140,996)$ (266,949)$ (125,953)$ (439,837)$ (298,841)$
Other Non-Operating Expenses -$ -$ -$ -$ -$
Total Expenses -$ -$ -$ -$ -$
Change in Assets -$ -$ -$ -$ -$
Fixed Assets
Depreciation -$ -$ -$ -$ -$
Computer & Software CapEx - - - - -
Furniture & Fixtures CapEx - - - - -
Equipment CapEx - - - - -
Leasehold Improvements - - - - -
(Incr)Dec in Fixed Assets -$ -$ -$ -$ -$
Allocation of Fixed Assets -$ -$ -$ -$ -$
Change in Fixed Assets -$ -$ -$ -$ -$
TOTAL CHANGE IN NET ASSETS -$ -$ -$ -$ -$
Statement of Activities and Capital Expenditures
2011 Budget & Projection, and 2012 BudgetLegal and Regulatory
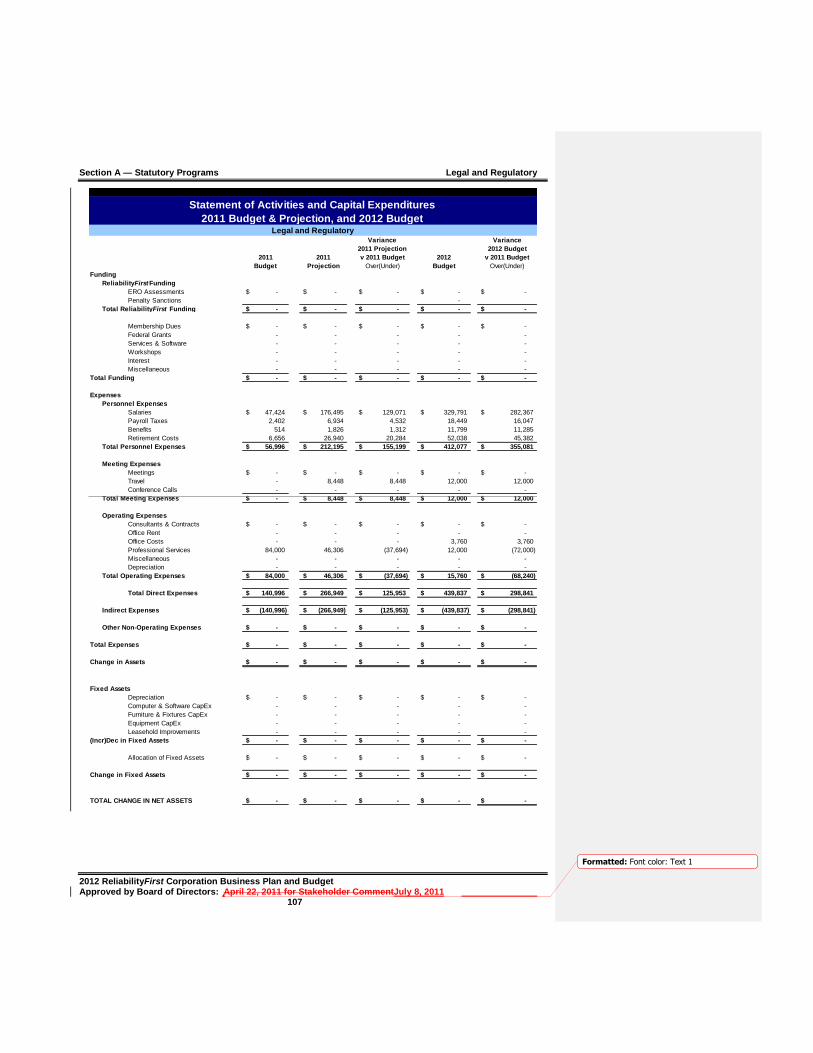
Section A — Statutory Programs Legal and Regulatory
2012 ReliabilityFirst Corporation Business Plan and Budget Approved by Board of Directors: April 22, 2011 for Stakeholder CommentJuly 8, 2011 107
Formatted: Font color: Text 1
Variance Variance
2011 Projection 2012 Budget
2011 2011 v 2011 Budget 2012 v 2011 Budget
Budget Projection Over(Under) Budget Over(Under)
Funding
ReliabilityFirstFunding
ERO Assessments -$ -$ -$ -$ -$
Penalty Sanctions -
Total ReliabilityFirst Funding -$ -$ -$ -$ -$
Membership Dues -$ -$ -$ -$ -$
Federal Grants - - - - -
Services & Software - - - - -
Workshops - - - - -
Interest - - - - -
Miscellaneous - - - - -
Total Funding -$ -$ -$ -$ -$
Expenses
Personnel Expenses
Salaries 47,424$ 176,495$ 129,071$ 329,791$ 282,367$
Payroll Taxes 2,402 6,934 4,532 18,449 16,047
Benefits 514 1,826 1,312 11,799 11,285
Retirement Costs 6,656 26,940 20,284 52,038 45,382
Total Personnel Expenses 56,996$ 212,195$ 155,199$ 412,077$ 355,081$
Meeting Expenses
Meetings -$ -$ -$ -$ -$
Travel - 8,448 8,448 12,000 12,000
Conference Calls - - - - -
Total Meeting Expenses -$ 8,448$ 8,448$ 12,000$ 12,000$
Operating Expenses
Consultants & Contracts -$ -$ -$ -$ -$
Office Rent - - - - -
Office Costs - - - 3,760 3,760
Professional Services 84,000 46,306 (37,694) 12,000 (72,000)
Miscellaneous - - - - -
Depreciation - - - - -
Total Operating Expenses 84,000$ 46,306$ (37,694)$ 15,760$ (68,240)$
Total Direct Expenses 140,996$ 266,949$ 125,953$ 439,837$ 298,841$
Indirect Expenses (140,996)$ (266,949)$ (125,953)$ (439,837)$ (298,841)$
Other Non-Operating Expenses -$ -$ -$ -$ -$
Total Expenses -$ -$ -$ -$ -$
Change in Assets -$ -$ -$ -$ -$
Fixed Assets
Depreciation -$ -$ -$ -$ -$
Computer & Software CapEx - - - - -
Furniture & Fixtures CapEx - - - - -
Equipment CapEx - - - - -
Leasehold Improvements - - - - -
(Incr)Dec in Fixed Assets -$ -$ -$ -$ -$
Allocation of Fixed Assets -$ -$ -$ -$ -$
Change in Fixed Assets -$ -$ -$ -$ -$
TOTAL CHANGE IN NET ASSETS -$ -$ -$ -$ -$
Statement of Activities and Capital Expenditures
2011 Budget & Projection, and 2012 BudgetLegal and Regulatory

Section A — Statutory Programs Information Technology
2012 ReliabilityFirst Corporation Business Plan and Budget Approved by Board of Directors: April 22, 2011 for Stakeholder CommentJuly 8, 2011 108
Formatted: Font color: Text 1
Information Technology
2011 Budget 2012 Budget
Increase
(Decrease)
Total FTEs 5.20 6.00 0.80
Total Direct Expenses 1,532,045$ 1,688,096$ 156,051$
Inc(Dec) in Fixed Assets (103,883)$ 296,009$ 399,892$
Information Technology
(in whole dollars)
2011 Budget 2012 Budget
Increase
(Decrease)
Total FTEs 5.20 6.00 0.80
Total Direct Expenses 1,532,045$ 1,688,096$ 156,051$
Inc(Dec) in Fixed Assets (103,883)$ 296,009$ 399,892$
Information Technology
(in whole dollars)
2011 Budget 2012 Budget
Increase
(Decrease)
Total FTEs 5.20 6.00 0.80
Total Direct Expenses 1,532,045$ 1,546,696$ 14,651$
Inc(Dec) in Fixed Assets (103,883)$ 103,409$ 207,292$
Information Technology
(in whole dollars)
2011 Budget 2012 Budget
Increase
(Decrease)
Total FTEs 5.20 6.00 0.80
Total Direct Expenses 1,532,045$ 1,546,696$ 14,651$
Inc(Dec) in Fixed Assets (103,883)$ 103,409$ 207,292$
Information Technology
(in whole dollars)
Program Scope and Functional Description The strategy of Information Technology (IT) is one of cost effectively providing users with information and proactively delivering enabling technologies to assist the departments in meeting their goals, objectives and deliverables. The IT department currently does not outsource any of the infrastructure services and as such must implement and manage controls to maintain a security posture that minimizes
Formatted: Font: 6 pt
Formatted: Space After: 0 pt
Field Code Changed
Formatted: Font: 12 pt

Section A — Statutory Programs Information Technology
2012 ReliabilityFirst Corporation Business Plan and Budget Approved by Board of Directors: April 22, 2011 for Stakeholder CommentJuly 8, 2011 109
Formatted: Font color: Text 1
ReliabilityFirst's risks. IT provides necessary technical services to cover the following categories:
Data Center Management
Website Hosting
VOIP Phone System
Web Conferencing
Desktop Support
Telecommuter Support
Application Support and Development
Business Analysis
Information Security Awareness and Monitoring (2012)
Business Continuity and Disaster Recovery (2012)
IT will continue to align itself to the departments so that the systems built, enhanced, and supported are done in response to our organization's changing needs. ReliabilityFirst must be active in the Regional Entity community by continuing to participate in discussions concerning current and future implementation of technology solutions within the ERO. 2012 Key Assumptions The IT Program incorporates regional specific common business planning assumptions as described in the ReliabilityFirst NERC 2012 Business Plan and Budget, Attachment Exhibit A: 2012 – 2015 Shared Business Planning and Budget Assumptions (NERC and the Regional Entities) document, including additional resources required for initiatives that support these shared ERO goals. The ReliabilityFirst IT Program includes the following unique regional assumptions:
1. IT will support the Enforcement department when performing reviews of alleged and confirmed violations, associated mitigation plans, and lessons learned processes. The number of violations to be processed in 2012 is predicted to increase.
2. IT will support all corporate functions to ensure efficient, effective performance.
3. IT will enhance the monitoring of the security posture across the company-wide data infrastructure and implement necessary solutions to protect sensitive data.
4. Per the NERC definition, ReliabilityFirst has no Critical Cyber Assets (CCAs), but voluntarily follows the NERC CIP Standards CIP-002 through CIP-009 for critical data storage. This will ensure that the integrity, security and confidentiality of our data are maintained.
Formatted: Font: 6 pt
Formatted: Font: 6 pt
Formatted: Font: 6 pt
Formatted: Space After: 6 pt
Formatted: Font: 6 pt
Formatted: Indent: Left: 0.5", Space After: 6pt, No bullets or numbering

Section A — Statutory Programs Information Technology
2012 ReliabilityFirst Corporation Business Plan and Budget Approved by Board of Directors: April 22, 2011 for Stakeholder CommentJuly 8, 2011 110
Formatted: Font color: Text 1
5. In 2012, ReliabilityFirst will implement a Disaster Recovery (DR) strategy. During 2011, ReliabilityFirst investigated options for implementing a DR strategy. Those options included implementing a DR strategy solely as a ReliabilityFirst endeavor and on an ERO-wide basis with NERC and the other Regional Entities. The 2012 ReliabilityFirst budget assumes ReliabilityFirst will implement a DR strategy solely as a ReliabilityFirst endeavor. Should an ERO-wide DR capability be available, total expenses budgeted for this activity in 2012 will be approximately $120,000 lower than shown.
4. 2012 Key Deliverables
Perform necessary software upgrades/ implement to newer software technologies.
Manage a hardware preventative maintenance program to replace aging hardware before end-of-life affects organizational productivity, such as phone and web conference system, and servers and disk arrays.
Enhance the development, integration, and expansion of databases and applications into a unified company-wide Information Management System.
Enhance the internal "intranet" website and related applications to further improve employee efficiency. Major target areas will continue to be Document Management System, Time Management System, and Report Management System.
Enhance the external "public" website to provide better navigation and informational discovery experience for end users.
Improve the external "secure" websites to enhance user experience. The external websites will all be structured to have cohesive and consistent appearance while improving user experience.
ImplementUsing the ReliabilityFirst Business Continuity definition, pPromote the development of a Disaster Recovery (DR) Plan plan. Once the DR plan is developed, tests will be performed on a recurring schedule.
Enhance security awareness of staff by providing training documents and/or seminars on existing "work-place" vulnerabilities.
The IT department staff workload has increased as the organization has grown. With the increase in non-IT staff (noting that many of these new hires are telecommuters) and the necessity to upgrade infrastructure software and hardware, the IT support has tended to be more reactionary than desired. As such, a detailed IT Plan will be developed to address the necessary actions to provide the appropriate level of support. A detailed manpower analysis has identified the need for additional resources. Along with the realignment of personnel and responsibilities, an additional 0.5 FTE will be required to bring the IT core responsibilities to at least a steady state posture. (The 0.5 FTE will be shared with the Compliance Enforcement FunctionArea.)
Formatted: Justified
Formatted: Indent: Left: 0.5", No bullets ornumbering

Section A — Statutory Programs Information Technology
2012 ReliabilityFirst Corporation Business Plan and Budget Approved by Board of Directors: April 22, 2011 for Stakeholder CommentJuly 8, 2011 111
Formatted: Font color: Text 1
Funding Sources and Requirements — Explanation of Variance Funding Sources (Other than ERO Assessments)
In 2012, the expenses related to the indirect program areas, including IT, are being allocated entirely to the direct programs and therefore have no ERO assessment in 2012.
Personnel Expenses
Salary, payroll taxes, benefits, and savings and retirement expensescosts for 2012 are budgeted for six FTEs, an increase of 0.8 FTEs from 2011. This increase is a result of the addition of 0.5 FTE and the reallocation of 0.3 FTE from the Human Resource Department. The increase in personnel expenses is due to the additional half 0.8 FTE along with budgeting for standard yearly increases for 2012.
Meeting Expenses
Expenses related to meetings and staff travel in support of NERC and Regional working groups will decrease. This decrease is due to continued use of voice and web conferencing technology to attend meetings remotely.
Operating Expenses
Operating expenses increased slightly over 2011 levels. The implementation of a DR strategy increased operating expenses. However, this increase is offset by a will decrease due toas a result of the reduction in office costs mainly due to the fact that user computer systems (laptops) were replaced in 2011 and only user computer systems for new hires are being budgeted for in 2012. There also will be a decrease in the computer service agreements area due to discontinuation of service agreements on products that are scheduled for replacement, including but not limited to the phone and web conferencing system, Security Event and Incident Management System (SEIM), Intrusion Prevention System (IPS) and Intrusion Detection System (IDS).
Indirect Expenses
Expenses related to indirect programs, including IT, have been allocated proportionately based on FTE count to the direct programs for 2012.
Other Non-Operating Expenses
No other non-operating expenses are expected for 2012. Fixed Asset Additions
The increase in fixed assets is due to the scheduled replacement of aging infrastructure server hardware, and the replacement of the IP phone and web conferencing systems, and the acquisition of hardware and software to support the implementation of a DR strategy. .

Section A — Statutory Programs Information Technology
2012 ReliabilityFirst Corporation Business Plan and Budget Approved by Board of Directors: April 22, 2011 for Stakeholder CommentJuly 8, 2011 112
Formatted: Font color: Text 1
Information Technology
Funding sources and related expenses for the Information Technology section of the 2012 Business Plan and Budget are shown in the table below.
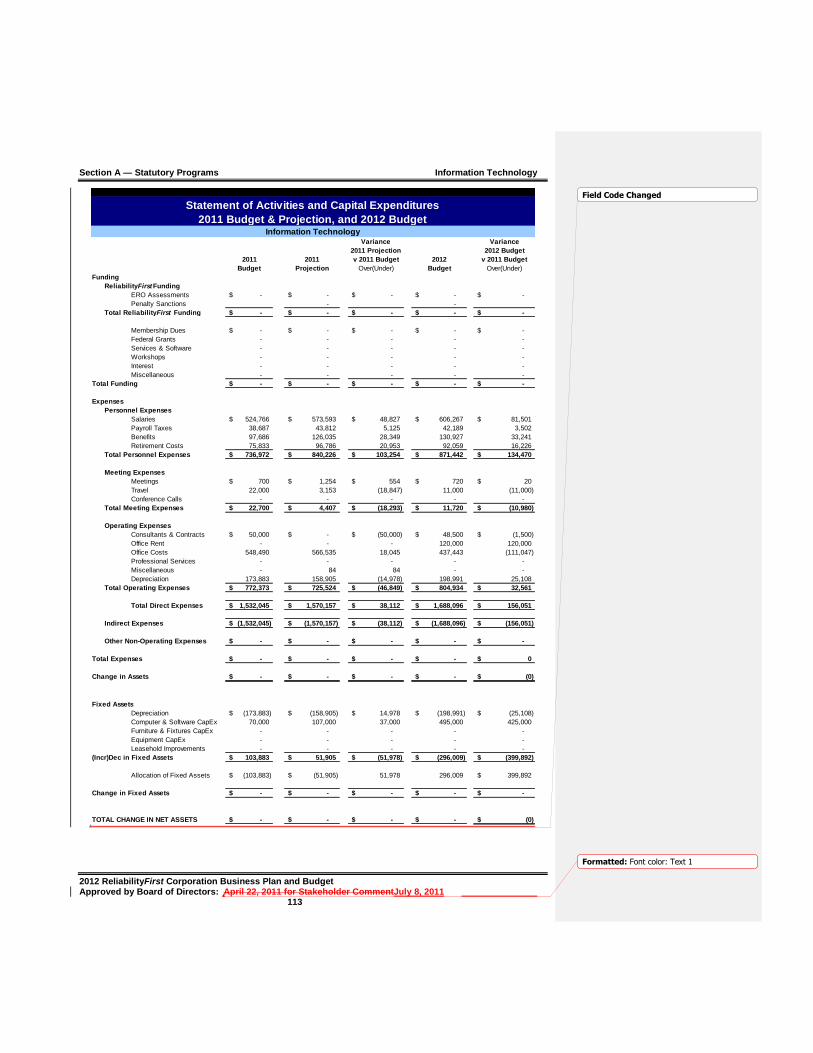
Section A — Statutory Programs Information Technology
2012 ReliabilityFirst Corporation Business Plan and Budget Approved by Board of Directors: April 22, 2011 for Stakeholder CommentJuly 8, 2011 113
Formatted: Font color: Text 1
Variance Variance
2011 Projection 2012 Budget
2011 2011 v 2011 Budget 2012 v 2011 Budget
Budget Projection Over(Under) Budget Over(Under)
Funding
ReliabilityFirstFunding
ERO Assessments -$ -$ -$ -$ -$
Penalty Sanctions - -
Total ReliabilityFirst Funding -$ -$ -$ -$ -$
Membership Dues -$ -$ -$ -$ -$
Federal Grants - - - - -
Services & Software - - - - -
Workshops - - - - -
Interest - - - - -
Miscellaneous - - - - -
Total Funding -$ -$ -$ -$ -$
Expenses
Personnel Expenses
Salaries 524,766$ 573,593$ 48,827$ 606,267$ 81,501$
Payroll Taxes 38,687 43,812 5,125 42,189 3,502
Benefits 97,686 126,035 28,349 130,927 33,241
Retirement Costs 75,833 96,786 20,953 92,059 16,226
Total Personnel Expenses 736,972$ 840,226$ 103,254$ 871,442$ 134,470$
Meeting Expenses
Meetings 700$ 1,254$ 554$ 720$ 20$
Travel 22,000 3,153 (18,847) 11,000 (11,000)
Conference Calls - - - - -
Total Meeting Expenses 22,700$ 4,407$ (18,293)$ 11,720$ (10,980)$
Operating Expenses
Consultants & Contracts 50,000$ -$ (50,000)$ 48,500$ (1,500)$
Office Rent - - - 120,000 120,000
Office Costs 548,490 566,535 18,045 437,443 (111,047)
Professional Services - - - - -
Miscellaneous - 84 84 - -
Depreciation 173,883 158,905 (14,978) 198,991 25,108
Total Operating Expenses 772,373$ 725,524$ (46,849)$ 804,934$ 32,561$
Total Direct Expenses 1,532,045$ 1,570,157$ 38,112$ 1,688,096$ 156,051$
Indirect Expenses (1,532,045)$ (1,570,157)$ (38,112)$ (1,688,096)$ (156,051)$
Other Non-Operating Expenses -$ -$ -$ -$ -$
Total Expenses -$ -$ -$ -$ 0$
Change in Assets -$ -$ -$ -$ (0)$
Fixed Assets
Depreciation (173,883)$ (158,905)$ 14,978$ (198,991)$ (25,108)$
Computer & Software CapEx 70,000 107,000 37,000 495,000 425,000
Furniture & Fixtures CapEx - - - - -
Equipment CapEx - - - - -
Leasehold Improvements - - - - -
(Incr)Dec in Fixed Assets 103,883$ 51,905$ (51,978)$ (296,009)$ (399,892)$
Allocation of Fixed Assets (103,883)$ (51,905)$ 51,978 296,009 399,892$
Change in Fixed Assets -$ -$ -$ -$ -$
TOTAL CHANGE IN NET ASSETS -$ -$ -$ -$ (0)$
Statement of Activities and Capital Expenditures
2011 Budget & Projection, and 2012 BudgetInformation Technology
Field Code Changed

Section A — Statutory Programs Information Technology
2012 ReliabilityFirst Corporation Business Plan and Budget Approved by Board of Directors: April 22, 2011 for Stakeholder CommentJuly 8, 2011 114
Formatted: Font color: Text 1
Variance Variance
2011 Projection 2012 Budget
2011 2011 v 2011 Budget 2012 v 2011 Budget
Budget Projection Over(Under) Budget Over(Under)
Funding
ReliabilityFirstFunding
ERO Assessments -$ -$ -$ -$ -$
Penalty Sanctions - -
Total ReliabilityFirst Funding -$ -$ -$ -$ -$
Membership Dues -$ -$ -$ -$ -$
Federal Grants - - - - -
Services & Software - - - - -
Workshops - - - - -
Interest - - - - -
Miscellaneous - - - - -
Total Funding -$ -$ -$ -$ -$
Expenses
Personnel Expenses
Salaries 524,766$ 573,593$ 48,827$ 606,267$ 81,501$
Payroll Taxes 38,687 43,812 5,125 42,189 3,502
Benefits 97,686 126,035 28,349 130,927 33,241
Retirement Costs 75,833 96,786 20,953 92,059 16,226
Total Personnel Expenses 736,972$ 840,226$ 103,254$ 871,442$ 134,470$
Meeting Expenses
Meetings 700$ 1,254$ 554$ 720$ 20$
Travel 22,000 3,153 (18,847) 11,000 (11,000)
Conference Calls - - - - -
Total Meeting Expenses 22,700$ 4,407$ (18,293)$ 11,720$ (10,980)$
Operating Expenses
Consultants & Contracts 50,000$ -$ (50,000)$ 48,500$ (1,500)$
Office Rent - - - 120,000 120,000
Office Costs 548,490 566,535 18,045 437,443 (111,047)
Professional Services - - - - -
Miscellaneous - 84 84 - -
Depreciation 173,883 158,905 (14,978) 198,991 25,108
Total Operating Expenses 772,373$ 725,524$ (46,849)$ 804,934$ 32,561$
Total Direct Expenses 1,532,045$ 1,570,157$ 38,112$ 1,688,096$ 156,051$
Indirect Expenses (1,532,045)$ (1,570,157)$ (38,112)$ (1,688,096)$ (156,051)$
Other Non-Operating Expenses -$ -$ -$ -$ -$
Total Expenses -$ -$ -$ -$ 0$
Change in Assets -$ -$ -$ -$ (0)$
Fixed Assets
Depreciation (173,883)$ (158,905)$ 14,978$ (198,991)$ (25,108)$
Computer & Software CapEx 70,000 107,000 37,000 495,000 425,000
Furniture & Fixtures CapEx - - - - -
Equipment CapEx - - - - -
Leasehold Improvements - - - - -
(Incr)Dec in Fixed Assets 103,883$ 51,905$ (51,978)$ (296,009)$ (399,892)$
Allocation of Fixed Assets (103,883)$ (51,905)$ 51,978 296,009 399,892$
Change in Fixed Assets -$ -$ -$ -$ -$
TOTAL CHANGE IN NET ASSETS -$ -$ -$ -$ (0)$
Statement of Activities and Capital Expenditures
2011 Budget & Projection, and 2012 BudgetInformation Technology

Section A — Statutory Programs Information Technology
2012 ReliabilityFirst Corporation Business Plan and Budget Approved by Board of Directors: April 22, 2011 for Stakeholder CommentJuly 8, 2011 115
Formatted: Font color: Text 1
Variance Variance
2011 Projection 2012 Budget
2011 2011 v 2011 Budget 2012 v 2011 Budget
Budget Projection Over(Under) Budget Over(Under)
Funding
ReliabilityFirstFunding
ERO Assessments -$ -$ -$ -$ -$
Penalty Sanctions - -
Total ReliabilityFirst Funding -$ -$ -$ -$ -$
Membership Dues -$ -$ -$ -$ -$
Federal Grants - - - - -
Services & Software - - - - -
Workshops - - - - -
Interest - - - - -
Miscellaneous - - - - -
Total Funding -$ -$ -$ -$ -$
Expenses
Personnel Expenses
Salaries 524,766$ 573,593$ 48,827$ 606,267$ 81,501$
Payroll Taxes 38,687 43,812 5,125 42,189 3,502
Benefits 97,686 126,035 28,349 130,927 33,241
Retirement Costs 75,833 96,786 20,953 92,059 16,226
Total Personnel Expenses 736,972$ 840,226$ 103,254$ 871,442$ 134,470$
Meeting Expenses
Meetings 700$ 1,254$ 554$ 720$ 20$
Travel 22,000 3,153 (18,847) 11,000 (11,000)
Conference Calls - - - - -
Total Meeting Expenses 22,700$ 4,407$ (18,293)$ 11,720$ (10,980)$
Operating Expenses
Consultants & Contracts 50,000$ -$ (50,000)$ 48,500$ (1,500)$
Office Rent - - - - -
Office Costs 548,490 566,535 18,045 437,443 (111,047)
Professional Services - - - - -
Miscellaneous - 84 84 - -
Depreciation 173,883 158,905 (14,978) 177,591 3,708
Total Operating Expenses 772,373$ 725,524$ (46,849)$ 663,534$ (108,839)$
Total Direct Expenses 1,532,045$ 1,570,157$ 38,112$ 1,546,696$ 14,651$
Indirect Expenses (1,532,045)$ (1,570,157)$ (38,112)$ (1,546,696)$ (14,651)$
Other Non-Operating Expenses -$ -$ -$ -$ -$
Total Expenses -$ -$ -$ -$ 0$
Change in Assets -$ -$ -$ -$ (0)$
Fixed Assets
Depreciation (173,883)$ (158,905)$ 14,978$ (177,591)$ (3,708)$
Computer & Software CapEx 70,000 107,000 37,000 281,000 211,000
Furniture & Fixtures CapEx - - - - -
Equipment CapEx - - - - -
Leasehold Improvements - - - - -
(Incr)Dec in Fixed Assets 103,883$ 51,905$ (51,978)$ (103,409)$ (207,292)$
Allocation of Fixed Assets (103,883)$ (51,905)$ 51,978 103,409 207,292$
Change in Fixed Assets -$ -$ -$ -$ -$
TOTAL CHANGE IN NET ASSETS -$ -$ -$ -$ (0)$
Statement of Activities and Capital Expenditures
2011 Budget & Projection, and 2012 BudgetInformation Technology

Section A — Statutory Programs Information Technology
2012 ReliabilityFirst Corporation Business Plan and Budget Approved by Board of Directors: April 22, 2011 for Stakeholder CommentJuly 8, 2011 116
Formatted: Font color: Text 1
Variance Variance
2011 Projection 2012 Budget
2011 2011 v 2011 Budget 2012 v 2011 Budget
Budget Projection Over(Under) Budget Over(Under)
Funding
ReliabilityFirstFunding
ERO Assessments -$ -$ -$ -$ -$
Penalty Sanctions - -
Total ReliabilityFirst Funding -$ -$ -$ -$ -$
Membership Dues -$ -$ -$ -$ -$
Federal Grants - - - - -
Services & Software - - - - -
Workshops - - - - -
Interest - - - - -
Miscellaneous - - - - -
Total Funding -$ -$ -$ -$ -$
Expenses
Personnel Expenses
Salaries 524,766$ 573,593$ 48,827$ 606,267$ 81,501$
Payroll Taxes 38,687 43,812 5,125 42,189 3,502
Benefits 97,686 126,035 28,349 130,927 33,241
Retirement Costs 75,833 96,786 20,953 92,059 16,226
Total Personnel Expenses 736,972$ 840,226$ 103,254$ 871,442$ 134,470$
Meeting Expenses
Meetings 700$ 1,254$ 554$ 720$ 20$
Travel 22,000 3,153 (18,847) 11,000 (11,000)
Conference Calls - - - - -
Total Meeting Expenses 22,700$ 4,407$ (18,293)$ 11,720$ (10,980)$
Operating Expenses
Consultants & Contracts 50,000$ -$ (50,000)$ 48,500$ (1,500)$
Office Rent - - - - -
Office Costs 548,490 566,535 18,045 437,443 (111,047)
Professional Services - - - - -
Miscellaneous - 84 84 - -
Depreciation 173,883 158,905 (14,978) 177,591 3,708
Total Operating Expenses 772,373$ 725,524$ (46,849)$ 663,534$ (108,839)$
Total Direct Expenses 1,532,045$ 1,570,157$ 38,112$ 1,546,696$ 14,651$
Indirect Expenses (1,532,045)$ (1,570,157)$ (38,112)$ (1,546,696)$ (14,651)$
Other Non-Operating Expenses -$ -$ -$ -$ -$
Total Expenses -$ -$ -$ -$ 0$
Change in Assets -$ -$ -$ -$ (0)$
Fixed Assets
Depreciation (173,883)$ (158,905)$ 14,978$ (177,591)$ (3,708)$
Computer & Software CapEx 70,000 107,000 37,000 281,000 211,000
Furniture & Fixtures CapEx - - - - -
Equipment CapEx - - - - -
Leasehold Improvements - - - - -
(Incr)Dec in Fixed Assets 103,883$ 51,905$ (51,978)$ (103,409)$ (207,292)$
Allocation of Fixed Assets (103,883)$ (51,905)$ 51,978 103,409 207,292$
Change in Fixed Assets -$ -$ -$ -$ -$
TOTAL CHANGE IN NET ASSETS -$ -$ -$ -$ (0)$
Statement of Activities and Capital Expenditures
2011 Budget & Projection, and 2012 BudgetInformation Technology
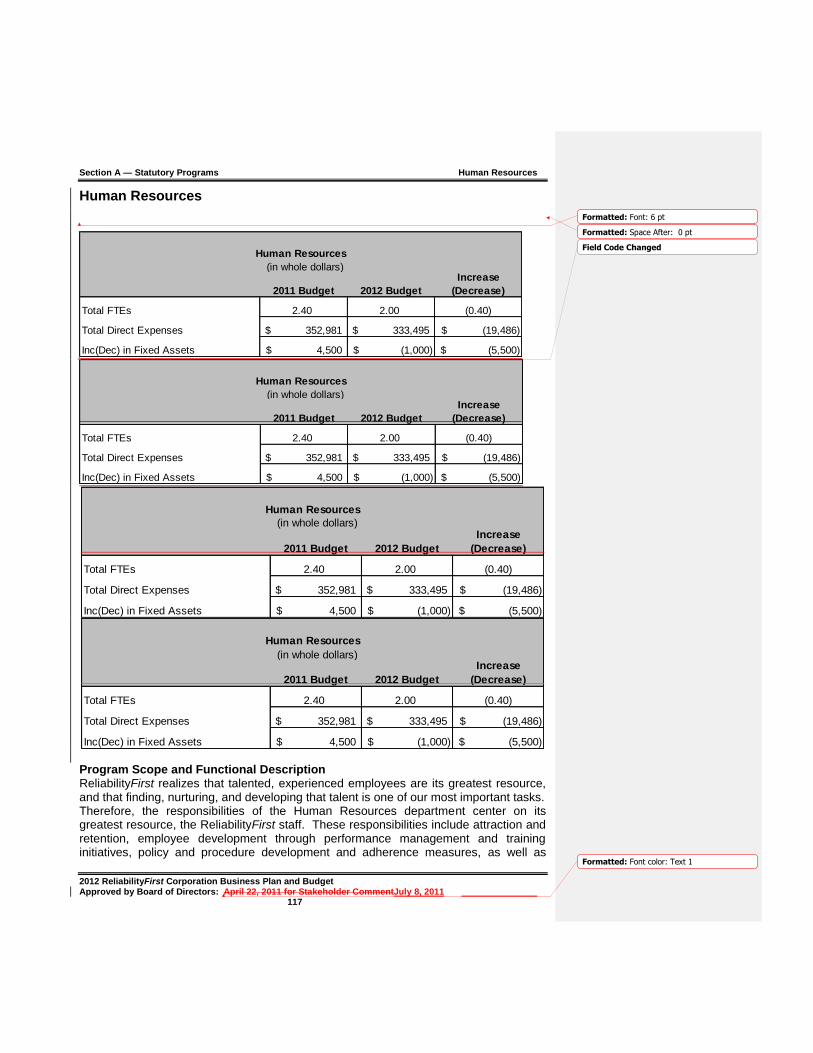
Section A — Statutory Programs Human Resources
2012 ReliabilityFirst Corporation Business Plan and Budget Approved by Board of Directors: April 22, 2011 for Stakeholder CommentJuly 8, 2011 117
Formatted: Font color: Text 1
Human Resources
2011 Budget 2012 Budget
Increase
(Decrease)
Total FTEs 2.40 2.00 (0.40)
Total Direct Expenses 352,981$ 333,495$ (19,486)$
Inc(Dec) in Fixed Assets 4,500$ (1,000)$ (5,500)$
Human Resources
(in whole dollars)
2011 Budget 2012 Budget
Increase
(Decrease)
Total FTEs 2.40 2.00 (0.40)
Total Direct Expenses 352,981$ 333,495$ (19,486)$
Inc(Dec) in Fixed Assets 4,500$ (1,000)$ (5,500)$
Human Resources
(in whole dollars)
2011 Budget 2012 Budget
Increase
(Decrease)
Total FTEs 2.40 2.00 (0.40)
Total Direct Expenses 352,981$ 333,495$ (19,486)$
Inc(Dec) in Fixed Assets 4,500$ (1,000)$ (5,500)$
Human Resources
(in whole dollars)
2011 Budget 2012 Budget
Increase
(Decrease)
Total FTEs 2.40 2.00 (0.40)
Total Direct Expenses 352,981$ 333,495$ (19,486)$
Inc(Dec) in Fixed Assets 4,500$ (1,000)$ (5,500)$
Human Resources
(in whole dollars)
Program Scope and Functional Description ReliabilityFirst realizes that talented, experienced employees are its greatest resource, and that finding, nurturing, and developing that talent is one of our most important tasks. Therefore, the responsibilities of the Human Resources department center on its greatest resource, the ReliabilityFirst staff. These responsibilities include attraction and retention, employee development through performance management and training initiatives, policy and procedure development and adherence measures, as well as
Formatted: Font: 6 pt
Formatted: Space After: 0 pt
Field Code Changed

Section A — Statutory Programs Human Resources
2012 ReliabilityFirst Corporation Business Plan and Budget Approved by Board of Directors: April 22, 2011 for Stakeholder CommentJuly 8, 2011 118
Formatted: Font color: Text 1
compensation and benefits administration. The Human Resources staff must be vigilant in understanding and complying both with Federal employment laws, as well as and state employment laws covering five (5) states and the respective reporting requirements for each. In 2012, ReliabilityFirst will have assembled a staff of 74, an increase of 5 employees from 2011. (This includes two part-time positions equaling one FTE, which brings the total to an equivalent of 73 FTEs.) The ReliabilityFirst staff is comprised of qualified management, professional, and technical employees with the expertise necessary to serve our stakeholders and to support the ERO by properly carrying out our delegated functions. 2012 Key Assumptions The Human Resource Program incorporates regional specific common business planning assumptions as described in the ReliabilityFirst NERC 2012 Business Plan and Budget, Attachment Exhibit A: 2012 – 2015 Shared Business Planning and Budget Assumptions (NERC and the Regional Entities) document, including additional resources required for initiatives that support these shared ERO goals. There are no additional assumptions unique to the ReliabilityFirst Human Resource Program.
2012 Key Deliverables
Recruit highly skilled and excellent employees.
Provide training programs and career development.
Review and manage employee benefits.
Review succession plans and employee retention plans.
Formatted: Space After: 0 pt
Section A — Statutory Programs Human Resources
2012 ReliabilityFirst Corporation Business Plan and Budget Approved by Board of Directors: April 22, 2011 for Stakeholder CommentJuly 8, 2011 119
Formatted: Font color: Text 1
Funding Sources and Requirements — Explanation of Variance Funding Sources (Other than ERO Assessments)
In 2012, the expenses related to the indirect program areas, including Human Resources, are being allocated entirely to the direct programs and therefore have no ERO assessment in 2012.
Personnel Expenses
Salary, payroll taxes, benefits, and savings and retirement expensescosts are for 2.0 FTEs. This is a decrease of 0.4 FTE from 2011 budget. Due to organization growth and expansion, ReliabilityFirst hired a full time Human Resources Manager during 2011 to manage and oversee the Human Resources department and its functions. The 0.4 FTE was maintained throughout 2011 to allow for a smooth transition period. With the transition period complete and the efficiencies being realized from the additional 1.0 FTE, the need for the 0.4 FTE is unnecessary at this time.
Meeting Expenses
An increase in meeting expenses comes from the travel expenses incurred for the Human Resources Manager to attend quarterly Board meetings, meetings with ReliabilityFirst telecommuters in their respective states and attendance to professional human resource meetings.
Operating Expenses
An increase in operating expenses is primarily due to increases in monthly payroll and retirement service fees.
Indirect Expenses
Expenses related to indirect programs, including Human Resources, have been allocated proportionately based on FTE count to the direct programs for 2012.
Other Non-Operating Expenses
No other non-operating expenses are expected for 2012.
Fixed Asset Additions
No fixed asset additions are expected for 2012.

Section A — Statutory Programs Human Resources
2012 ReliabilityFirst Corporation Business Plan and Budget Approved by Board of Directors: April 22, 2011 for Stakeholder CommentJuly 8, 2011 120
Formatted: Font color: Text 1
Human Resources
Funding sources and related expenses for the Human Resources section of the 2012 Business Plan and Budget are shown in the table below.

Section A — Statutory Programs Human Resources
2012 ReliabilityFirst Corporation Business Plan and Budget Approved by Board of Directors: April 22, 2011 for Stakeholder CommentJuly 8, 2011 121
Formatted: Font color: Text 1
Variance Variance
2011 Projection 2012 Budget
2011 2011 v 2011 Budget 2012 v 2011 Budget
Budget Projection Over(Under) Budget Over(Under)
Funding
ReliabilityFirstFunding
ERO Assessments -$ -$ -$ -$ -$
Penalty Sanctions -
Total ReliabilityFirst Funding -$ -$ -$ -$ -$
Membership Dues -$ -$ -$ -$ -$
Federal Grants - - - - -
Services & Software - - - - -
Workshops - - - - -
Interest - - - - -
Miscellaneous - - - - -
Total Funding -$ -$ -$ -$ -$
Expenses
Personnel Expenses
Salaries 213,934$ 170,213$ (43,721)$ 194,803$ (19,131)$
Payroll Taxes 17,639 14,481 (3,158) 14,622 (3,017)
Benefits 46,175 23,970 (22,205) 31,879 (14,296)
Retirement Costs 30,665 28,516 (2,149) 30,440 (225)
Total Personnel Expenses 308,413$ 237,180$ (71,233)$ 271,744$ (36,669)$
Meeting Expenses
Meetings -$ -$ -$ 100$ 100$
Travel - 2,655 2,655 9,000 9,000
Conference Calls - - - - -
Total Meeting Expenses -$ 2,655$ 2,655$ 9,100$ 9,100$
Operating Expenses
Consultants & Contracts -$ -$ -$ 600$ 600$
Office Rent - - - - -
Office Costs 1,400 5,693 4,293 4,230 2,830
Professional Services 39,168 35,493 (3,675) 45,671 6,503
Miscellaneous 3,500 4,832 1,332 1,150 (2,350)
Depreciation 500 599 99 1,000 500
Total Operating Expenses 44,568$ 46,617$ 2,049$ 52,651$ 8,083$
Total Direct Expenses 352,981$ 286,452$ (66,529)$ 333,495$ (19,486)$
Indirect Expenses (352,981)$ (286,452)$ 66,529$ (333,495)$ 19,486$
Other Non-Operating Expenses -$ -$ -$ -$ -$
Total Expenses -$ -$ -$ -$ (0)$
Change in Assets -$ -$ -$ -$ 0$
Fixed Assets
Depreciation (500)$ (599)$ (99)$ (1,000)$ (500)$
Computer & Software CapEx 5,000 3,995 (1,005) - (5,000)
Furniture & Fixtures CapEx - 3,500 3,500 - -
Equipment CapEx - - - - -
Leasehold Improvements - - - - -
(Incr)Dec in Fixed Assets (4,500)$ (6,896)$ (2,396)$ 1,000$ 5,500$
Allocation of Fixed Assets 4,500$ 6,896$ 2,396$ (1,000)$ (5,500)$
Change in Fixed Assets -$ -$ -$ -$ -$
TOTAL CHANGE IN NET ASSETS -$ -$ -$ -$ 0$
Statement of Activities and Capital Expenditures
2011 Budget & Projection, and 2012 BudgetHuman Resources
Field Code Changed

Section A — Statutory Programs Human Resources
2012 ReliabilityFirst Corporation Business Plan and Budget Approved by Board of Directors: April 22, 2011 for Stakeholder CommentJuly 8, 2011 122
Formatted: Font color: Text 1
Variance Variance
2011 Projection 2012 Budget
2011 2011 v 2011 Budget 2012 v 2011 Budget
Budget Projection Over(Under) Budget Over(Under)
Funding
ReliabilityFirstFunding
ERO Assessments -$ -$ -$ -$ -$
Penalty Sanctions -
Total ReliabilityFirst Funding -$ -$ -$ -$ -$
Membership Dues -$ -$ -$ -$ -$
Federal Grants - - - - -
Services & Software - - - - -
Workshops - - - - -
Interest - - - - -
Miscellaneous - - - - -
Total Funding -$ -$ -$ -$ -$
Expenses
Personnel Expenses
Salaries 213,934$ 170,213$ (43,721)$ 194,803$ (19,131)$
Payroll Taxes 17,639 14,481 (3,158) 14,622 (3,017)
Benefits 46,175 23,970 (22,205) 31,879 (14,296)
Retirement Costs 30,665 28,516 (2,149) 30,440 (225)
Total Personnel Expenses 308,413$ 237,180$ (71,233)$ 271,744$ (36,669)$
Meeting Expenses
Meetings -$ -$ -$ 100$ 100$
Travel - 2,655 2,655 9,000 9,000
Conference Calls - - - - -
Total Meeting Expenses -$ 2,655$ 2,655$ 9,100$ 9,100$
Operating Expenses
Consultants & Contracts -$ -$ -$ 600$ 600$
Office Rent - - - - -
Office Costs 1,400 5,693 4,293 4,230 2,830
Professional Services 39,168 35,493 (3,675) 45,671 6,503
Miscellaneous 3,500 4,832 1,332 1,150 (2,350)
Depreciation 500 599 99 1,000 500
Total Operating Expenses 44,568$ 46,617$ 2,049$ 52,651$ 8,083$
Total Direct Expenses 352,981$ 286,452$ (66,529)$ 333,495$ (19,486)$
Indirect Expenses (352,981)$ (286,452)$ 66,529$ (333,495)$ 19,486$
Other Non-Operating Expenses -$ -$ -$ -$ -$
Total Expenses -$ -$ -$ -$ (0)$
Change in Assets -$ -$ -$ -$ 0$
Fixed Assets
Depreciation (500)$ (599)$ (99)$ (1,000)$ (500)$
Computer & Software CapEx 5,000 3,995 (1,005) - (5,000)
Furniture & Fixtures CapEx - 3,500 3,500 - -
Equipment CapEx - - - - -
Leasehold Improvements - - - - -
(Incr)Dec in Fixed Assets (4,500)$ (6,896)$ (2,396)$ 1,000$ 5,500$
Allocation of Fixed Assets 4,500$ 6,896$ 2,396$ (1,000)$ (5,500)$
Change in Fixed Assets -$ -$ -$ -$ -$
TOTAL CHANGE IN NET ASSETS -$ -$ -$ -$ 0$
Statement of Activities and Capital Expenditures
2011 Budget & Projection, and 2012 BudgetHuman Resources
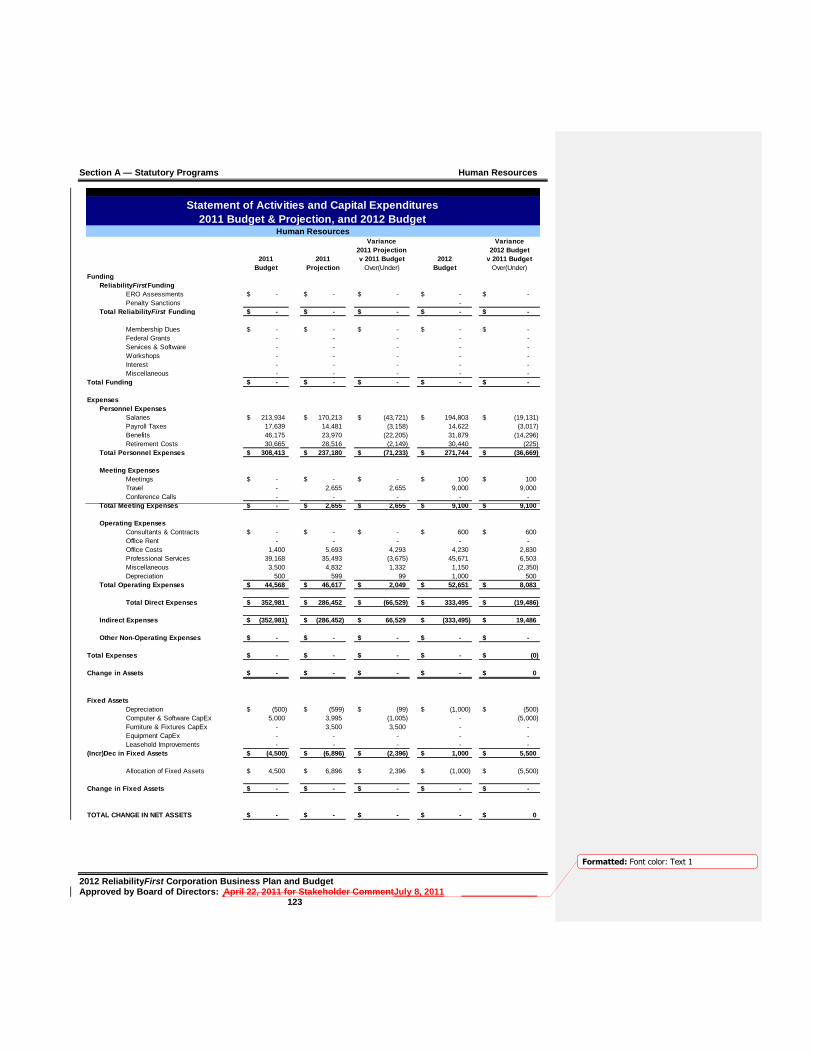
Section A — Statutory Programs Human Resources
2012 ReliabilityFirst Corporation Business Plan and Budget Approved by Board of Directors: April 22, 2011 for Stakeholder CommentJuly 8, 2011 123
Formatted: Font color: Text 1
Variance Variance
2011 Projection 2012 Budget
2011 2011 v 2011 Budget 2012 v 2011 Budget
Budget Projection Over(Under) Budget Over(Under)
Funding
ReliabilityFirstFunding
ERO Assessments -$ -$ -$ -$ -$
Penalty Sanctions -
Total ReliabilityFirst Funding -$ -$ -$ -$ -$
Membership Dues -$ -$ -$ -$ -$
Federal Grants - - - - -
Services & Software - - - - -
Workshops - - - - -
Interest - - - - -
Miscellaneous - - - - -
Total Funding -$ -$ -$ -$ -$
Expenses
Personnel Expenses
Salaries 213,934$ 170,213$ (43,721)$ 194,803$ (19,131)$
Payroll Taxes 17,639 14,481 (3,158) 14,622 (3,017)
Benefits 46,175 23,970 (22,205) 31,879 (14,296)
Retirement Costs 30,665 28,516 (2,149) 30,440 (225)
Total Personnel Expenses 308,413$ 237,180$ (71,233)$ 271,744$ (36,669)$
Meeting Expenses
Meetings -$ -$ -$ 100$ 100$
Travel - 2,655 2,655 9,000 9,000
Conference Calls - - - - -
Total Meeting Expenses -$ 2,655$ 2,655$ 9,100$ 9,100$
Operating Expenses
Consultants & Contracts -$ -$ -$ 600$ 600$
Office Rent - - - - -
Office Costs 1,400 5,693 4,293 4,230 2,830
Professional Services 39,168 35,493 (3,675) 45,671 6,503
Miscellaneous 3,500 4,832 1,332 1,150 (2,350)
Depreciation 500 599 99 1,000 500
Total Operating Expenses 44,568$ 46,617$ 2,049$ 52,651$ 8,083$
Total Direct Expenses 352,981$ 286,452$ (66,529)$ 333,495$ (19,486)$
Indirect Expenses (352,981)$ (286,452)$ 66,529$ (333,495)$ 19,486$
Other Non-Operating Expenses -$ -$ -$ -$ -$
Total Expenses -$ -$ -$ -$ (0)$
Change in Assets -$ -$ -$ -$ 0$
Fixed Assets
Depreciation (500)$ (599)$ (99)$ (1,000)$ (500)$
Computer & Software CapEx 5,000 3,995 (1,005) - (5,000)
Furniture & Fixtures CapEx - 3,500 3,500 - -
Equipment CapEx - - - - -
Leasehold Improvements - - - - -
(Incr)Dec in Fixed Assets (4,500)$ (6,896)$ (2,396)$ 1,000$ 5,500$
Allocation of Fixed Assets 4,500$ 6,896$ 2,396$ (1,000)$ (5,500)$
Change in Fixed Assets -$ -$ -$ -$ -$
TOTAL CHANGE IN NET ASSETS -$ -$ -$ -$ 0$
Statement of Activities and Capital Expenditures
2011 Budget & Projection, and 2012 BudgetHuman Resources

Section A — Statutory Programs Human Resources
2012 ReliabilityFirst Corporation Business Plan and Budget Approved by Board of Directors: April 22, 2011 for Stakeholder CommentJuly 8, 2011 124
Formatted: Font color: Text 1
Variance Variance
2011 Projection 2012 Budget
2011 2011 v 2011 Budget 2012 v 2011 Budget
Budget Projection Over(Under) Budget Over(Under)
Funding
ReliabilityFirstFunding
ERO Assessments -$ -$ -$ -$ -$
Penalty Sanctions -
Total ReliabilityFirst Funding -$ -$ -$ -$ -$
Membership Dues -$ -$ -$ -$ -$
Federal Grants - - - - -
Services & Software - - - - -
Workshops - - - - -
Interest - - - - -
Miscellaneous - - - - -
Total Funding -$ -$ -$ -$ -$
Expenses
Personnel Expenses
Salaries 213,934$ 170,213$ (43,721)$ 194,803$ (19,131)$
Payroll Taxes 17,639 14,481 (3,158) 14,622 (3,017)
Benefits 46,175 23,970 (22,205) 31,879 (14,296)
Retirement Costs 30,665 28,516 (2,149) 30,440 (225)
Total Personnel Expenses 308,413$ 237,180$ (71,233)$ 271,744$ (36,669)$
Meeting Expenses
Meetings -$ -$ -$ 100$ 100$
Travel - 2,655 2,655 9,000 9,000
Conference Calls - - - - -
Total Meeting Expenses -$ 2,655$ 2,655$ 9,100$ 9,100$
Operating Expenses
Consultants & Contracts -$ -$ -$ 600$ 600$
Office Rent - - - - -
Office Costs 1,400 5,693 4,293 4,230 2,830
Professional Services 39,168 35,493 (3,675) 45,671 6,503
Miscellaneous 3,500 4,832 1,332 1,150 (2,350)
Depreciation 500 599 99 1,000 500
Total Operating Expenses 44,568$ 46,617$ 2,049$ 52,651$ 8,083$
Total Direct Expenses 352,981$ 286,452$ (66,529)$ 333,495$ (19,486)$
Indirect Expenses (352,981)$ (286,452)$ 66,529$ (333,495)$ 19,486$
Other Non-Operating Expenses -$ -$ -$ -$ -$
Total Expenses -$ -$ -$ -$ (0)$
Change in Assets -$ -$ -$ -$ 0$
Fixed Assets
Depreciation (500)$ (599)$ (99)$ (1,000)$ (500)$
Computer & Software CapEx 5,000 3,995 (1,005) - (5,000)
Furniture & Fixtures CapEx - 3,500 3,500 - -
Equipment CapEx - - - - -
Leasehold Improvements - - - - -
(Incr)Dec in Fixed Assets (4,500)$ (6,896)$ (2,396)$ 1,000$ 5,500$
Allocation of Fixed Assets 4,500$ 6,896$ 2,396$ (1,000)$ (5,500)$
Change in Fixed Assets -$ -$ -$ -$ -$
TOTAL CHANGE IN NET ASSETS -$ -$ -$ -$ 0$
Statement of Activities and Capital Expenditures
2011 Budget & Projection, and 2012 BudgetHuman Resources
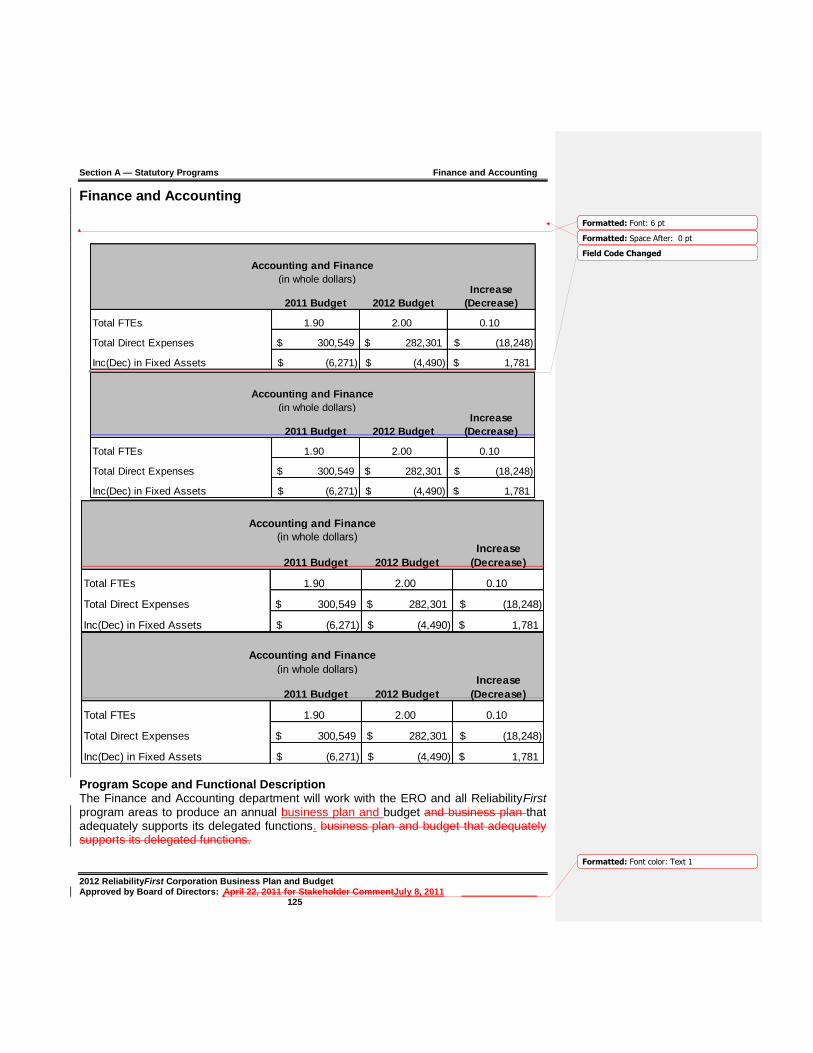
Section A — Statutory Programs Finance and Accounting
2012 ReliabilityFirst Corporation Business Plan and Budget Approved by Board of Directors: April 22, 2011 for Stakeholder CommentJuly 8, 2011 125
Formatted: Font color: Text 1
Finance and Accounting
2011 Budget 2012 Budget
Increase
(Decrease)
Total FTEs 1.90 2.00 0.10
Total Direct Expenses 300,549$ 282,301$ (18,248)$
Inc(Dec) in Fixed Assets (6,271)$ (4,490)$ 1,781$
Accounting and Finance
(in whole dollars)
2011 Budget 2012 Budget
Increase
(Decrease)
Total FTEs 1.90 2.00 0.10
Total Direct Expenses 300,549$ 282,301$ (18,248)$
Inc(Dec) in Fixed Assets (6,271)$ (4,490)$ 1,781$
Accounting and Finance
(in whole dollars)
2011 Budget 2012 Budget
Increase
(Decrease)
Total FTEs 1.90 2.00 0.10
Total Direct Expenses 300,549$ 282,301$ (18,248)$
Inc(Dec) in Fixed Assets (6,271)$ (4,490)$ 1,781$
Accounting and Finance
(in whole dollars)
2011 Budget 2012 Budget
Increase
(Decrease)
Total FTEs 1.90 2.00 0.10
Total Direct Expenses 300,549$ 282,301$ (18,248)$
Inc(Dec) in Fixed Assets (6,271)$ (4,490)$ 1,781$
Accounting and Finance
(in whole dollars)
Program Scope and Functional Description The Finance and Accounting department will work with the ERO and all ReliabilityFirst program areas to produce an annual business plan and budget and business plan that adequately supports its delegated functions. business plan and budget that adequately supports its delegated functions.
Formatted: Font: 6 pt
Formatted: Space After: 0 pt
Field Code Changed
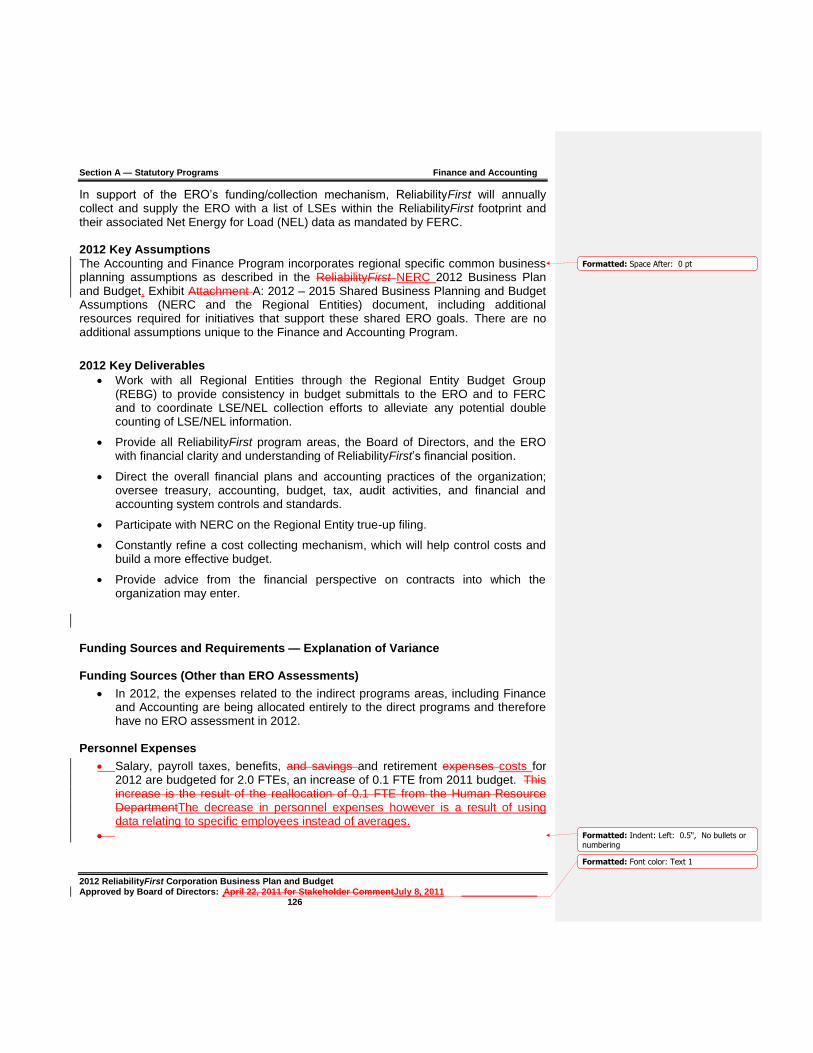
Section A — Statutory Programs Finance and Accounting
2012 ReliabilityFirst Corporation Business Plan and Budget Approved by Board of Directors: April 22, 2011 for Stakeholder CommentJuly 8, 2011 126
Formatted: Font color: Text 1
In support of the ERO’s funding/collection mechanism, ReliabilityFirst will annually collect and supply the ERO with a list of LSEs within the ReliabilityFirst footprint and their associated Net Energy for Load (NEL) data as mandated by FERC. 2012 Key Assumptions The Accounting and Finance Program incorporates regional specific common business planning assumptions as described in the ReliabilityFirst NERC 2012 Business Plan and Budget, Exhibit Attachment A: 2012 – 2015 Shared Business Planning and Budget Assumptions (NERC and the Regional Entities) document, including additional resources required for initiatives that support these shared ERO goals. There are no additional assumptions unique to the Finance and Accounting Program.
2012 Key Deliverables
Work with all Regional Entities through the Regional Entity Budget Group (REBG) to provide consistency in budget submittals to the ERO and to FERC and to coordinate LSE/NEL collection efforts to alleviate any potential double counting of LSE/NEL information.
Provide all ReliabilityFirst program areas, the Board of Directors, and the ERO with financial clarity and understanding of ReliabilityFirst’s financial position.
Direct the overall financial plans and accounting practices of the organization; oversee treasury, accounting, budget, tax, audit activities, and financial and accounting system controls and standards.
Participate with NERC on the Regional Entity true-up filing.
Constantly refine a cost collecting mechanism, which will help control costs and build a more effective budget.
Provide advice from the financial perspective on contracts into which the organization may enter.
Funding Sources and Requirements — Explanation of Variance Funding Sources (Other than ERO Assessments)
In 2012, the expenses related to the indirect programs areas, including Finance and Accounting are being allocated entirely to the direct programs and therefore have no ERO assessment in 2012.
Personnel Expenses
Salary, payroll taxes, benefits, and savings and retirement expenses costs for 2012 are budgeted for 2.0 FTEs, an increase of 0.1 FTE from 2011 budget. This increase is the result of the reallocation of 0.1 FTE from the Human Resource DepartmentThe decrease in personnel expenses however is a result of using data relating to specific employees instead of averages.
Formatted: Space After: 0 pt
Formatted: Indent: Left: 0.5", No bullets ornumbering

Section A — Statutory Programs Finance and Accounting
2012 ReliabilityFirst Corporation Business Plan and Budget Approved by Board of Directors: April 22, 2011 for Stakeholder CommentJuly 8, 2011 127
Formatted: Font color: Text 1
Meeting Expenses
An increase in meeting expenses comes from the increase in travel expenses incurred for the CFO to attend various budget meetings for coordinating the budget process with all of the regions and to attend the ReliabilityFirst quarterly Board meetings.
Operating Expenses
An increase in operating expenses is due to an increase in the yearly fees relating to the yearend financial audit.
Indirect Expenses
Expenses related to indirect programs, including Finance and Accounting, have been allocated proportionately based on FTE count to the direct programs for 2012.
Other Non-Operating Expenses
No other non-operating expenses are expected for 2012.
Fixed Asset Additions
No fixed asset additions are expected for 2012. Formatted: Heading 2, Justified
Section A — Statutory Programs Finance and Accounting
2012 ReliabilityFirst Corporation Business Plan and Budget Approved by Board of Directors: April 22, 2011 for Stakeholder CommentJuly 8, 2011 128
Formatted: Font color: Text 1
Formatted: Font: (Default) Arial, Bold, Nounderline, Font color: Auto
Formatted: Font: Bold

Section A — Statutory Programs Finance and Accounting
2012 ReliabilityFirst Corporation Business Plan and Budget Approved by Board of Directors: April 22, 2011 for Stakeholder CommentJuly 8, 2011 129
Formatted: Font color: Text 1
Finance and Accounting
Funding sources and related expenses for the Finance and Accounting section of the 2012 Business Plan and Budget are shown in the table below.
Formatted: Font: (Default) Arial, Bold, Nounderline, Font color: Auto
Formatted: Normal, Left
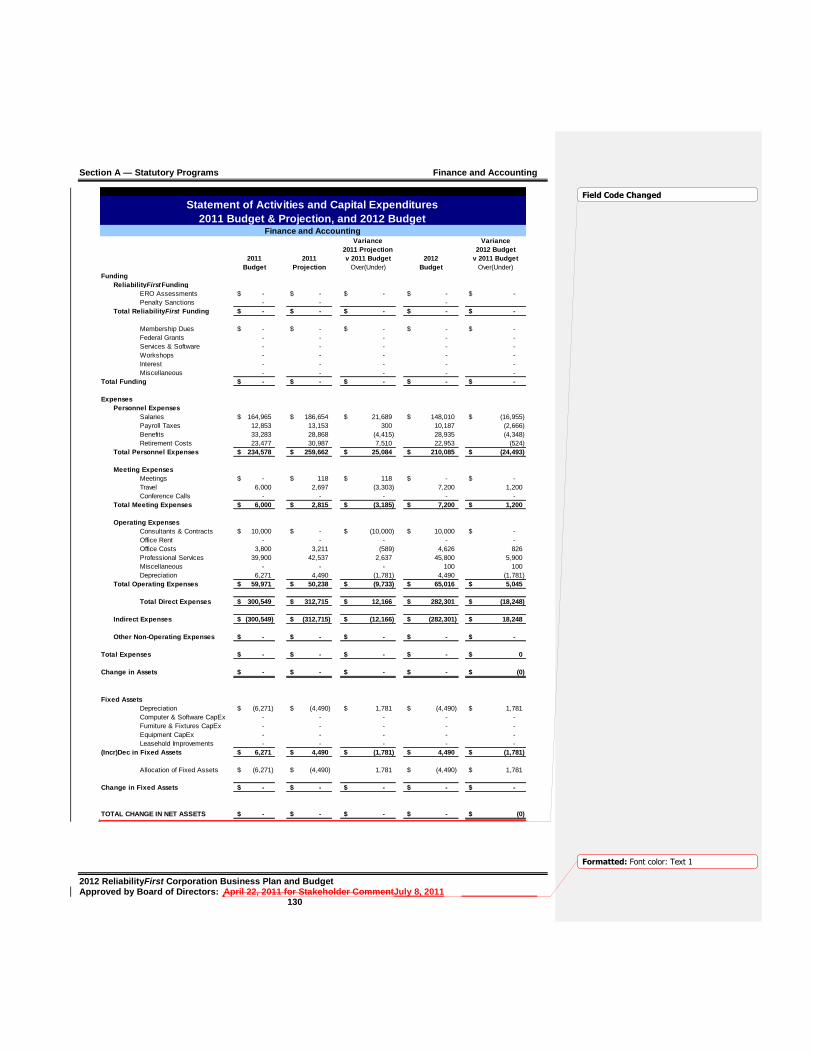
Section A — Statutory Programs Finance and Accounting
2012 ReliabilityFirst Corporation Business Plan and Budget Approved by Board of Directors: April 22, 2011 for Stakeholder CommentJuly 8, 2011 130
Formatted: Font color: Text 1
Variance Variance
2011 Projection 2012 Budget
2011 2011 v 2011 Budget 2012 v 2011 Budget
Budget Projection Over(Under) Budget Over(Under)
Funding
ReliabilityFirstFunding
ERO Assessments -$ -$ -$ -$ -$
Penalty Sanctions - - -
Total ReliabilityFirst Funding -$ -$ -$ -$ -$
Membership Dues -$ -$ -$ -$ -$
Federal Grants - - - - -
Services & Software - - - - -
Workshops - - - - -
Interest - - - - -
Miscellaneous - - - - -
Total Funding -$ -$ -$ -$ -$
Expenses
Personnel Expenses
Salaries 164,965$ 186,654$ 21,689$ 148,010$ (16,955)$
Payroll Taxes 12,853 13,153 300 10,187 (2,666)
Benefits 33,283 28,868 (4,415) 28,935 (4,348)
Retirement Costs 23,477 30,987 7,510 22,953 (524)
Total Personnel Expenses 234,578$ 259,662$ 25,084$ 210,085$ (24,493)$
Meeting Expenses
Meetings -$ 118$ 118$ -$ -$
Travel 6,000 2,697 (3,303) 7,200 1,200
Conference Calls - - - - -
Total Meeting Expenses 6,000$ 2,815$ (3,185)$ 7,200$ 1,200$
Operating Expenses
Consultants & Contracts 10,000$ -$ (10,000)$ 10,000$ -$
Office Rent - - - - -
Office Costs 3,800 3,211 (589) 4,626 826
Professional Services 39,900 42,537 2,637 45,800 5,900
Miscellaneous - - - 100 100
Depreciation 6,271 4,490 (1,781) 4,490 (1,781)
Total Operating Expenses 59,971$ 50,238$ (9,733)$ 65,016$ 5,045$
Total Direct Expenses 300,549$ 312,715$ 12,166$ 282,301$ (18,248)$
Indirect Expenses (300,549)$ (312,715)$ (12,166)$ (282,301)$ 18,248$
Other Non-Operating Expenses -$ -$ -$ -$ -$
Total Expenses -$ -$ -$ -$ 0$
Change in Assets -$ -$ -$ -$ (0)$
Fixed Assets
Depreciation (6,271)$ (4,490)$ 1,781$ (4,490)$ 1,781$
Computer & Software CapEx - - - - -
Furniture & Fixtures CapEx - - - - -
Equipment CapEx - - - - -
Leasehold Improvements - - - - -
(Incr)Dec in Fixed Assets 6,271$ 4,490$ (1,781)$ 4,490$ (1,781)$
Allocation of Fixed Assets (6,271)$ (4,490)$ 1,781 (4,490)$ 1,781$
Change in Fixed Assets -$ -$ -$ -$ -$
TOTAL CHANGE IN NET ASSETS -$ -$ -$ -$ (0)$
Statement of Activities and Capital Expenditures
2011 Budget & Projection, and 2012 BudgetFinance and Accounting
Field Code Changed
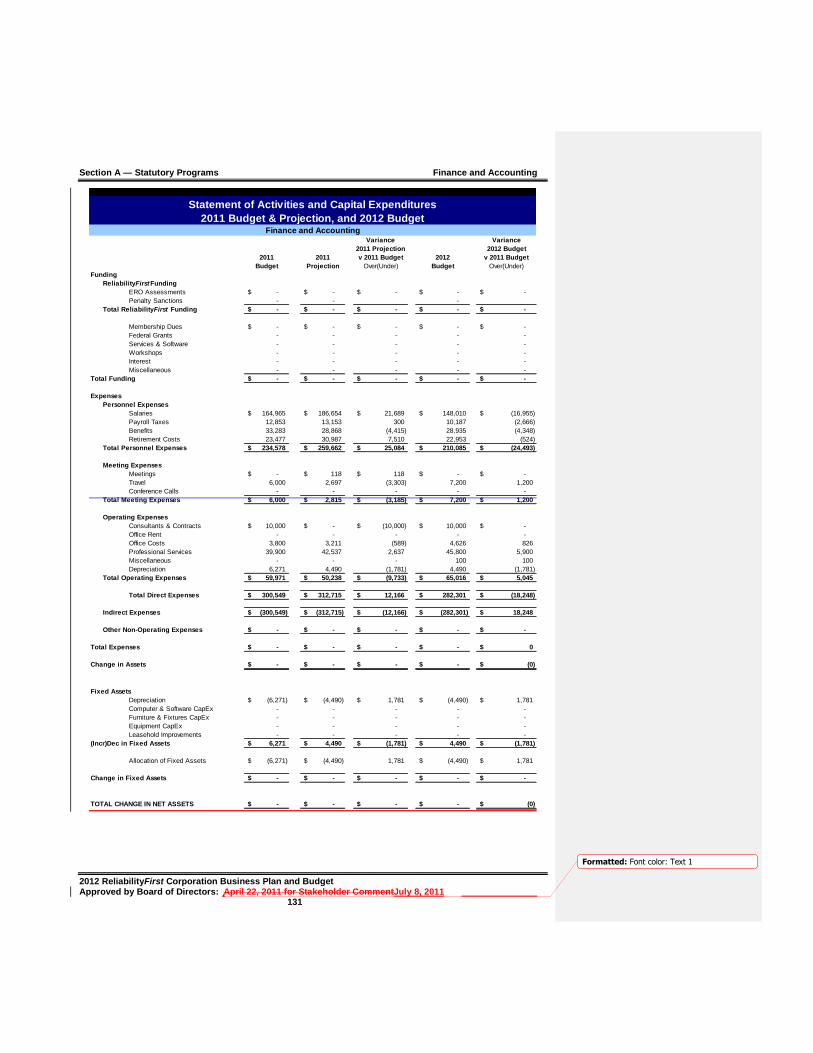
Section A — Statutory Programs Finance and Accounting
2012 ReliabilityFirst Corporation Business Plan and Budget Approved by Board of Directors: April 22, 2011 for Stakeholder CommentJuly 8, 2011 131
Formatted: Font color: Text 1
Variance Variance
2011 Projection 2012 Budget
2011 2011 v 2011 Budget 2012 v 2011 Budget
Budget Projection Over(Under) Budget Over(Under)
Funding
ReliabilityFirstFunding
ERO Assessments -$ -$ -$ -$ -$
Penalty Sanctions - - -
Total ReliabilityFirst Funding -$ -$ -$ -$ -$
Membership Dues -$ -$ -$ -$ -$
Federal Grants - - - - -
Services & Software - - - - -
Workshops - - - - -
Interest - - - - -
Miscellaneous - - - - -
Total Funding -$ -$ -$ -$ -$
Expenses
Personnel Expenses
Salaries 164,965$ 186,654$ 21,689$ 148,010$ (16,955)$
Payroll Taxes 12,853 13,153 300 10,187 (2,666)
Benefits 33,283 28,868 (4,415) 28,935 (4,348)
Retirement Costs 23,477 30,987 7,510 22,953 (524)
Total Personnel Expenses 234,578$ 259,662$ 25,084$ 210,085$ (24,493)$
Meeting Expenses
Meetings -$ 118$ 118$ -$ -$
Travel 6,000 2,697 (3,303) 7,200 1,200
Conference Calls - - - - -
Total Meeting Expenses 6,000$ 2,815$ (3,185)$ 7,200$ 1,200$
Operating Expenses
Consultants & Contracts 10,000$ -$ (10,000)$ 10,000$ -$
Office Rent - - - - -
Office Costs 3,800 3,211 (589) 4,626 826
Professional Services 39,900 42,537 2,637 45,800 5,900
Miscellaneous - - - 100 100
Depreciation 6,271 4,490 (1,781) 4,490 (1,781)
Total Operating Expenses 59,971$ 50,238$ (9,733)$ 65,016$ 5,045$
Total Direct Expenses 300,549$ 312,715$ 12,166$ 282,301$ (18,248)$
Indirect Expenses (300,549)$ (312,715)$ (12,166)$ (282,301)$ 18,248$
Other Non-Operating Expenses -$ -$ -$ -$ -$
Total Expenses -$ -$ -$ -$ 0$
Change in Assets -$ -$ -$ -$ (0)$
Fixed Assets
Depreciation (6,271)$ (4,490)$ 1,781$ (4,490)$ 1,781$
Computer & Software CapEx - - - - -
Furniture & Fixtures CapEx - - - - -
Equipment CapEx - - - - -
Leasehold Improvements - - - - -
(Incr)Dec in Fixed Assets 6,271$ 4,490$ (1,781)$ 4,490$ (1,781)$
Allocation of Fixed Assets (6,271)$ (4,490)$ 1,781 (4,490)$ 1,781$
Change in Fixed Assets -$ -$ -$ -$ -$
TOTAL CHANGE IN NET ASSETS -$ -$ -$ -$ (0)$
Statement of Activities and Capital Expenditures
2011 Budget & Projection, and 2012 BudgetFinance and Accounting

Section A — Statutory Programs Finance and Accounting
2012 ReliabilityFirst Corporation Business Plan and Budget Approved by Board of Directors: April 22, 2011 for Stakeholder CommentJuly 8, 2011 132
Formatted: Font color: Text 1
Variance Variance
2011 Projection 2012 Budget
2011 2011 v 2011 Budget 2012 v 2011 Budget
Budget Projection Over(Under) Budget Over(Under)
Funding
ReliabilityFirstFunding
ERO Assessments -$ -$ -$ -$ -$
Penalty Sanctions - - -
Total ReliabilityFirst Funding -$ -$ -$ -$ -$
Membership Dues -$ -$ -$ -$ -$
Federal Grants - - - - -
Services & Software - - - - -
Workshops - - - - -
Interest - - - - -
Miscellaneous - - - - -
Total Funding -$ -$ -$ -$ -$
Expenses
Personnel Expenses
Salaries 164,965$ 186,654$ 21,689$ 148,010$ (16,955)$
Payroll Taxes 12,853 13,153 300 10,187 (2,666)
Benefits 33,283 28,868 (4,415) 28,935 (4,348)
Retirement Costs 23,477 30,987 7,510 22,953 (524)
Total Personnel Expenses 234,578$ 259,662$ 25,084$ 210,085$ (24,493)$
Meeting Expenses
Meetings -$ 118$ 118$ -$ -$
Travel 6,000 2,697 (3,303) 7,200 1,200
Conference Calls - - - - -
Total Meeting Expenses 6,000$ 2,815$ (3,185)$ 7,200$ 1,200$
Operating Expenses
Consultants & Contracts 10,000$ -$ (10,000)$ 10,000$ -$
Office Rent - - - - -
Office Costs 3,800 3,211 (589) 4,626 826
Professional Services 39,900 42,537 2,637 45,800 5,900
Miscellaneous - - - 100 100
Depreciation 6,271 4,490 (1,781) 4,490 (1,781)
Total Operating Expenses 59,971$ 50,238$ (9,733)$ 65,016$ 5,045$
Total Direct Expenses 300,549$ 312,715$ 12,166$ 282,301$ (18,248)$
Indirect Expenses (300,549)$ (312,715)$ (12,166)$ (282,301)$ 18,248$
Other Non-Operating Expenses -$ -$ -$ -$ -$
Total Expenses -$ -$ -$ -$ 0$
Change in Assets -$ -$ -$ -$ (0)$
Fixed Assets
Depreciation (6,271)$ (4,490)$ 1,781$ (4,490)$ 1,781$
Computer & Software CapEx - - - - -
Furniture & Fixtures CapEx - - - - -
Equipment CapEx - - - - -
Leasehold Improvements - - - - -
(Incr)Dec in Fixed Assets 6,271$ 4,490$ (1,781)$ 4,490$ (1,781)$
Allocation of Fixed Assets (6,271)$ (4,490)$ 1,781 (4,490)$ 1,781$
Change in Fixed Assets -$ -$ -$ -$ -$
TOTAL CHANGE IN NET ASSETS -$ -$ -$ -$ (0)$
Statement of Activities and Capital Expenditures
2011 Budget & Projection, and 2012 BudgetFinance and Accounting

Section A — Statutory Programs Finance and Accounting
2012 ReliabilityFirst Corporation Business Plan and Budget Approved by Board of Directors: April 22, 2011 for Stakeholder CommentJuly 8, 2011 133
Formatted: Font color: Text 1
Variance Variance
2011 Projection 2012 Budget
2011 2011 v 2011 Budget 2012 v 2011 Budget
Budget Projection Over(Under) Budget Over(Under)
Funding
ReliabilityFirstFunding
ERO Assessments -$ -$ -$ -$ -$
Penalty Sanctions - - -
Total ReliabilityFirst Funding -$ -$ -$ -$ -$
Membership Dues -$ -$ -$ -$ -$
Federal Grants - - - - -
Services & Software - - - - -
Workshops - - - - -
Interest - - - - -
Miscellaneous - - - - -
Total Funding -$ -$ -$ -$ -$
Expenses
Personnel Expenses
Salaries 164,965$ 186,654$ 21,689$ 148,010$ (16,955)$
Payroll Taxes 12,853 13,153 300 10,187 (2,666)
Benefits 33,283 28,868 (4,415) 28,935 (4,348)
Retirement Costs 23,477 30,987 7,510 22,953 (524)
Total Personnel Expenses 234,578$ 259,662$ 25,084$ 210,085$ (24,493)$
Meeting Expenses
Meetings -$ 118$ 118$ -$ -$
Travel 6,000 2,697 (3,303) 7,200 1,200
Conference Calls - - - - -
Total Meeting Expenses 6,000$ 2,815$ (3,185)$ 7,200$ 1,200$
Operating Expenses
Consultants & Contracts 10,000$ -$ (10,000)$ 10,000$ -$
Office Rent - - - - -
Office Costs 3,800 3,211 (589) 4,626 826
Professional Services 39,900 42,537 2,637 45,800 5,900
Miscellaneous - - - 100 100
Depreciation 6,271 4,490 (1,781) 4,490 (1,781)
Total Operating Expenses 59,971$ 50,238$ (9,733)$ 65,016$ 5,045$
Total Direct Expenses 300,549$ 312,715$ 12,166$ 282,301$ (18,248)$
Indirect Expenses (300,549)$ (312,715)$ (12,166)$ (282,301)$ 18,248$
Other Non-Operating Expenses -$ -$ -$ -$ -$
Total Expenses -$ -$ -$ -$ 0$
Change in Assets -$ -$ -$ -$ (0)$
Fixed Assets
Depreciation (6,271)$ (4,490)$ 1,781$ (4,490)$ 1,781$
Computer & Software CapEx - - - - -
Furniture & Fixtures CapEx - - - - -
Equipment CapEx - - - - -
Leasehold Improvements - - - - -
(Incr)Dec in Fixed Assets 6,271$ 4,490$ (1,781)$ 4,490$ (1,781)$
Allocation of Fixed Assets (6,271)$ (4,490)$ 1,781 (4,490)$ 1,781$
Change in Fixed Assets -$ -$ -$ -$ -$
TOTAL CHANGE IN NET ASSETS -$ -$ -$ -$ (0)$
Statement of Activities and Capital Expenditures
2011 Budget & Projection, and 2012 BudgetFinance and Accounting
2012 ReliabilityFirst Corporation Business Plan and Budget Approved by Board of Directors: April 22, 2011 for Stakeholder Comment 60
Formatted: Font color: Text 1
SSeeccttiioonn BB –– SSuupppplleemmeennttaall FFiinnaanncciiaall IInnffoorrmmaattiioonn 22001122 BBuussiinneessss PPllaann aanndd BBuuddggeett
Section B — Supplemental Financial Information Working Capital Reserve Analysis
2012 ReliabilityFirst Corporation Business Plan and Budget Approved by Board of Directors: April 22, 2011 for Stakeholder CommentJuly 8, 2011 135
Formatted: Font color: Text 1
Section B — Supplemental Financial Information
Working Capital Reserve Analysis 2011-2012
Table B-1: Reserve Analysis

Section B — Supplemental Financial Information Working Capital Reserve Analysis
2012 ReliabilityFirst Corporation Business Plan and Budget Approved by Board of Directors: April 22, 2011 for Stakeholder CommentJuly 8, 2011 136
Formatted: Font color: Text 1
Beginning Working Capital Reserve (Deficit), December 31, 2010 5,986,772
Less: Penalty sanctions to be used as offset to 2012 assessments 1 (248,000)
Plus: 2011 ReliabilityFirst Funding (from LSEs or designees) 12,803,844
Plus: 2011 Other funding sources 40,000
Less: 2011 Projected expenses & capital expenditures (15,312,488)
Projected Working Capital Reserve (Deficit), December 31, 2011 3,270,128
Desired Working Capital Reserve, December 31, 2012 2 1,000,000
Less: Projected Working Capital Reserve, December 31, 2011 (3,270,128)
Increase(decrease) in assessments to achieve desired Working Capital Reserve (2,270,128)
2012 Expenses and Capital Expenditures 16,656,500
Less: Penalty Sanctions 3 (792,100)
Less: Other Funding Sources (60,000)
Adjustment to achieve desired Working Capital Reserve (2,270,128)
2012 ReliabilityFirst Assessment 13,534,272
1 Represents collections on or prior to December 31, 2010.
2 On April 22, 2011, the ReliabilityFirst Board of Directors approved a desired working capital reserve of $1,000,000
3 Represents collections on or prior to June 30, 2011.
Working Capital Reserve Analysis 2011-2012
STATUTORYField Code Changed
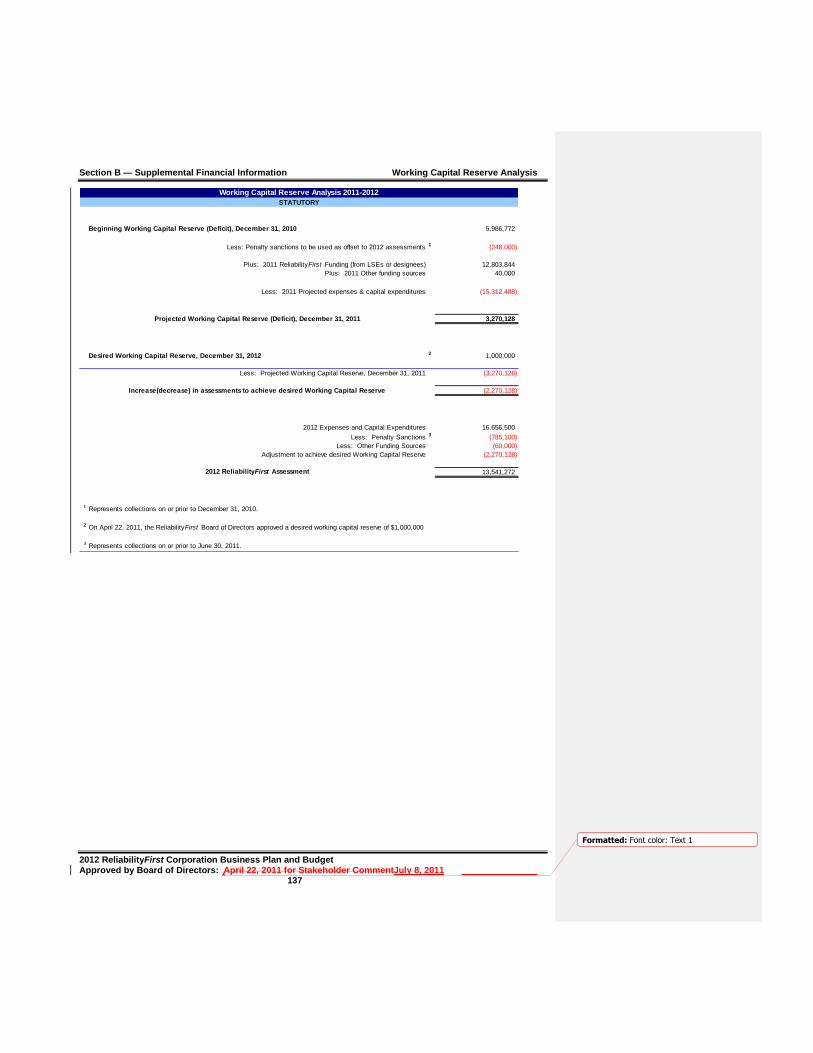
Section B — Supplemental Financial Information Working Capital Reserve Analysis
2012 ReliabilityFirst Corporation Business Plan and Budget Approved by Board of Directors: April 22, 2011 for Stakeholder CommentJuly 8, 2011 137
Formatted: Font color: Text 1
Beginning Working Capital Reserve (Deficit), December 31, 2010 5,986,772
Less: Penalty sanctions to be used as offset to 2012 assessments 1 (248,000)
Plus: 2011 ReliabilityFirst Funding (from LSEs or designees) 12,803,844
Plus: 2011 Other funding sources 40,000
Less: 2011 Projected expenses & capital expenditures (15,312,488)
Projected Working Capital Reserve (Deficit), December 31, 2011 3,270,128
Desired Working Capital Reserve, December 31, 2012 2 1,000,000
Less: Projected Working Capital Reserve, December 31, 2011 (3,270,128)
Increase(decrease) in assessments to achieve desired Working Capital Reserve (2,270,128)
2012 Expenses and Capital Expenditures 16,656,500
Less: Penalty Sanctions 3 (785,100)
Less: Other Funding Sources (60,000)
Adjustment to achieve desired Working Capital Reserve (2,270,128)
2012 ReliabilityFirst Assessment 13,541,272
1 Represents collections on or prior to December 31, 2010.
2 On April 22, 2011, the ReliabilityFirst Board of Directors approved a desired working capital reserve of $1,000,000
3 Represents collections on or prior to June 30, 2011.
Working Capital Reserve Analysis 2011-2012
STATUTORY
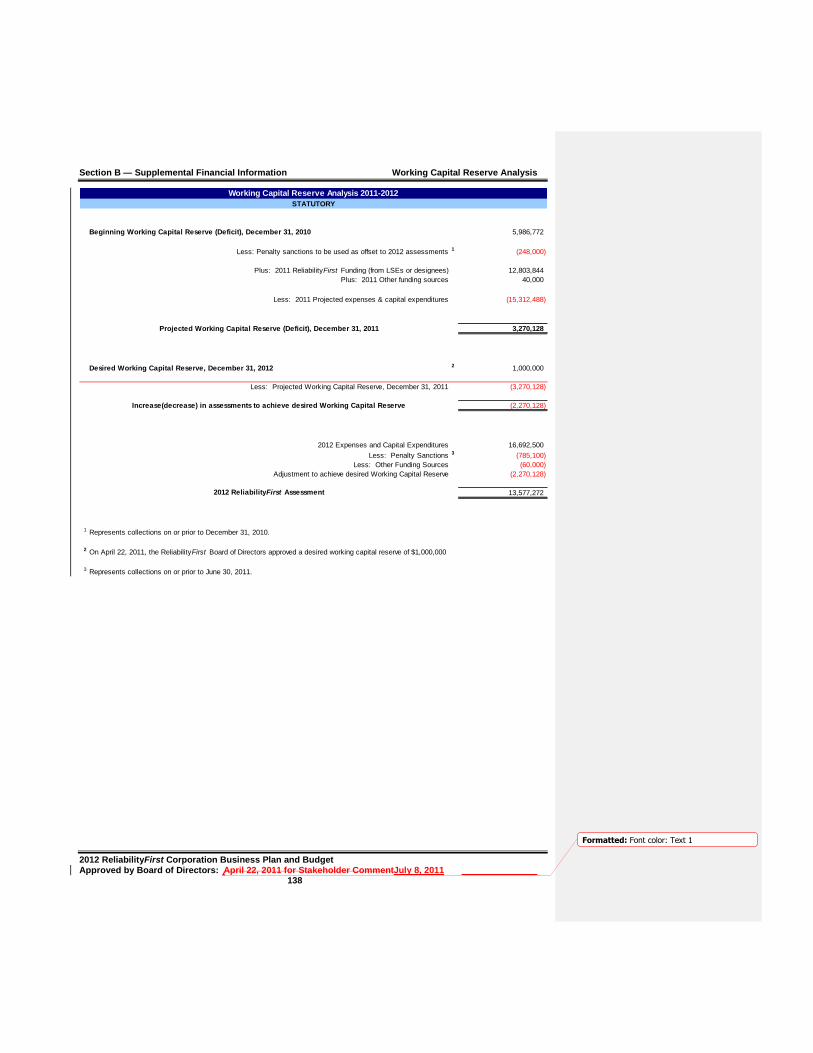
Section B — Supplemental Financial Information Working Capital Reserve Analysis
2012 ReliabilityFirst Corporation Business Plan and Budget Approved by Board of Directors: April 22, 2011 for Stakeholder CommentJuly 8, 2011 138
Formatted: Font color: Text 1
Beginning Working Capital Reserve (Deficit), December 31, 2010 5,986,772
Less: Penalty sanctions to be used as offset to 2012 assessments 1 (248,000)
Plus: 2011 ReliabilityFirst Funding (from LSEs or designees) 12,803,844
Plus: 2011 Other funding sources 40,000
Less: 2011 Projected expenses & capital expenditures (15,312,488)
Projected Working Capital Reserve (Deficit), December 31, 2011 3,270,128
Desired Working Capital Reserve, December 31, 2012 2 1,000,000
Less: Projected Working Capital Reserve, December 31, 2011 (3,270,128)
Increase(decrease) in assessments to achieve desired Working Capital Reserve (2,270,128)
2012 Expenses and Capital Expenditures 16,692,500
Less: Penalty Sanctions 3 (785,100)
Less: Other Funding Sources (60,000)
Adjustment to achieve desired Working Capital Reserve (2,270,128)
2012 ReliabilityFirst Assessment 13,577,272
1 Represents collections on or prior to December 31, 2010.
2 On April 22, 2011, the ReliabilityFirst Board of Directors approved a desired working capital reserve of $1,000,000
3 Represents collections on or prior to June 30, 2011.
Working Capital Reserve Analysis 2011-2012
STATUTORY
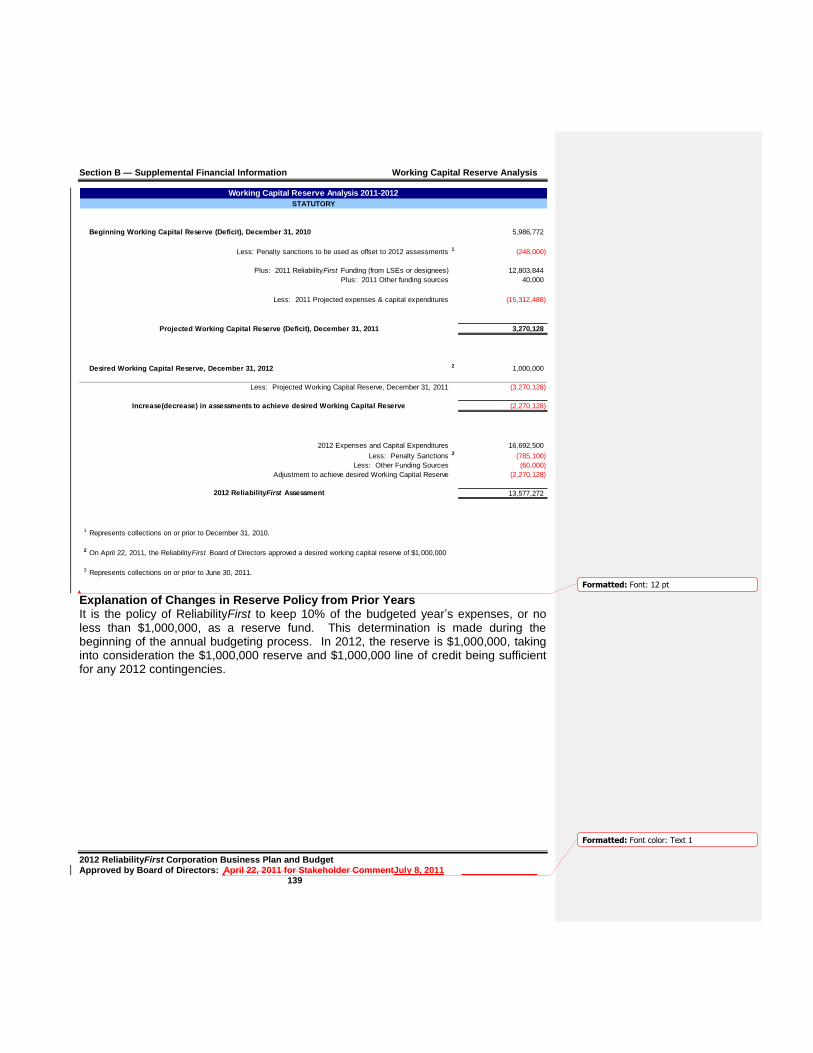
Section B — Supplemental Financial Information Working Capital Reserve Analysis
2012 ReliabilityFirst Corporation Business Plan and Budget Approved by Board of Directors: April 22, 2011 for Stakeholder CommentJuly 8, 2011 139
Formatted: Font color: Text 1
Beginning Working Capital Reserve (Deficit), December 31, 2010 5,986,772
Less: Penalty sanctions to be used as offset to 2012 assessments 1 (248,000)
Plus: 2011 ReliabilityFirst Funding (from LSEs or designees) 12,803,844
Plus: 2011 Other funding sources 40,000
Less: 2011 Projected expenses & capital expenditures (15,312,488)
Projected Working Capital Reserve (Deficit), December 31, 2011 3,270,128
Desired Working Capital Reserve, December 31, 2012 2 1,000,000
Less: Projected Working Capital Reserve, December 31, 2011 (3,270,128)
Increase(decrease) in assessments to achieve desired Working Capital Reserve (2,270,128)
2012 Expenses and Capital Expenditures 16,692,500
Less: Penalty Sanctions 3 (785,100)
Less: Other Funding Sources (60,000)
Adjustment to achieve desired Working Capital Reserve (2,270,128)
2012 ReliabilityFirst Assessment 13,577,272
1 Represents collections on or prior to December 31, 2010.
2 On April 22, 2011, the ReliabilityFirst Board of Directors approved a desired working capital reserve of $1,000,000
3 Represents collections on or prior to June 30, 2011.
Working Capital Reserve Analysis 2011-2012
STATUTORY
Explanation of Changes in Reserve Policy from Prior Years It is the policy of ReliabilityFirst to keep 10% of the budgeted year’s expenses, or no less than $1,000,000, as a reserve fund. This determination is made during the beginning of the annual budgeting process. In 2012, the reserve is $1,000,000, taking into consideration the $1,000,000 reserve and $1,000,000 line of credit being sufficient for any 2012 contingencies.
Formatted: Font: 12 pt

Section B — Supplemental Financial Information Breakdown of Statement of Activities
2012 ReliabilityFirst Corporation Business Plan and Budget Approved by Board of Directors: April 22, 2011 for Stakeholder CommentJuly 8, 2011 140
Formatted: Font color: Text 1
Breakdown of Statement of Activity Sections The following detailed schedules are in support of the Statement of Activities and Capital Expenditures Table (as seen on page 98) in the introduction Introduction sectionof the 2012 ReliabilityFirst Business Plan and Budget. All significant variances have been disclosed by program area in the preceding pages. Explanations are provided for variances equal to or greater than +/- 10%.
Formatted: Left, Don't adjust space betweenLatin and Asian text, Don't adjust spacebetween Asian text and numbers
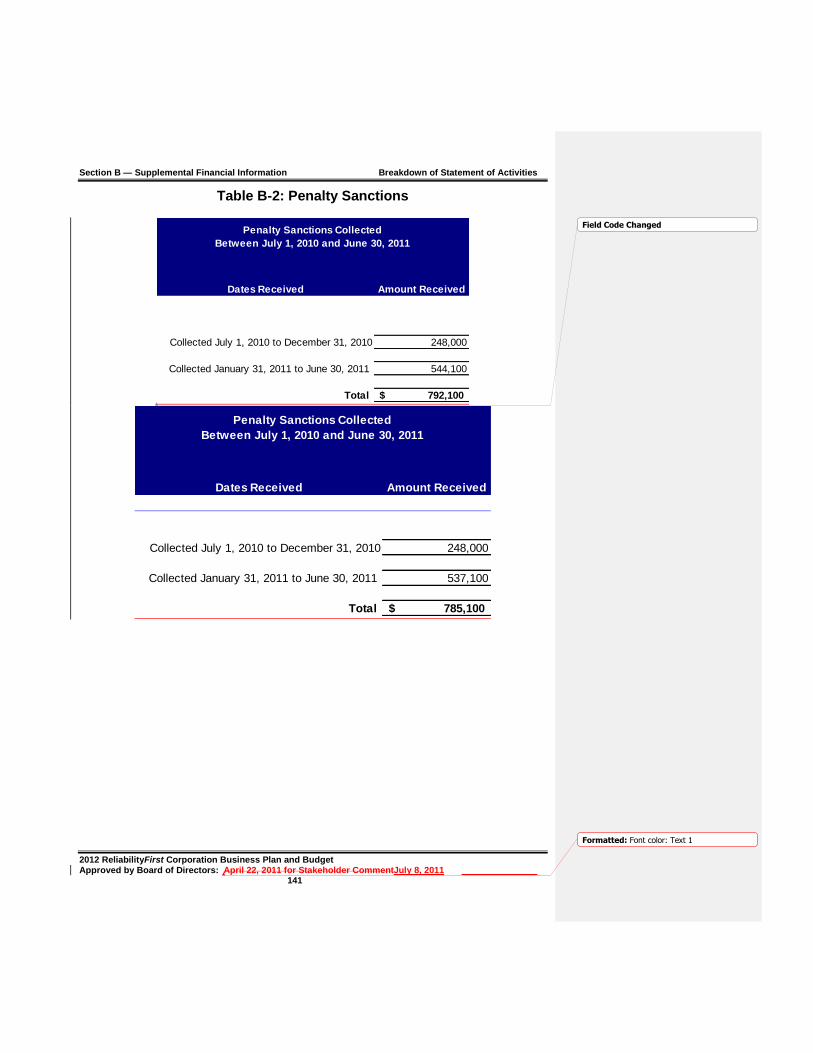
Section B — Supplemental Financial Information Breakdown of Statement of Activities
2012 ReliabilityFirst Corporation Business Plan and Budget Approved by Board of Directors: April 22, 2011 for Stakeholder CommentJuly 8, 2011 141
Formatted: Font color: Text 1
Table B-2: Penalty Sanctions
Dates Received Amount Received
Collected July 1, 2010 to December 31, 2010 248,000
Collected January 31, 2011 to June 30, 2011 544,100
Total 792,100$
Penalty Sanctions Collected
Between July 1, 2010 and June 30, 2011
Dates Received Amount Received
Collected July 1, 2010 to December 31, 2010 248,000
Collected January 31, 2011 to June 30, 2011 537,100
Total 785,100$
Penalty Sanctions Collected
Between July 1, 2010 and June 30, 2011
Field Code Changed

Section B — Supplemental Financial Information Breakdown of Statement of Activities
2012 ReliabilityFirst Corporation Business Plan and Budget Approved by Board of Directors: April 22, 2011 for Stakeholder CommentJuly 8, 2011 142
Formatted: Font color: Text 1
Dates Received Amount Received
Collected July 1, 2010 to December 31, 2010 248,000
Penalty Sanctions Collected
Between July 1, 2010 and June 30, 2011
Dates Received Amount Received
Collected July 1, 2010 to December 31, 2010 248,000
Collected January 31, 2011 to June 30, 2011 537,100
Total 785,100$
Penalty Sanctions Collected
Between July 1, 2010 and June 30, 2011
Penalty monies received between July 1, 2010 and June 30, 2011 are to be used to offset assessments in the 2012 Budget, as documented in the NERC Policy – “Accounting, Financial Statement and Budgetary Treatment of Penalties Imposed and Received for Violations of Reliability Standard.” Penalty monies received from July 1, 2011 through June 30, 2012 will be used to offset assessments in the 2013 Budget. All penalties received between July 1, 2010 and June 30, 2011 are totaled above. Allocation Method
Penalty monies received have been allocated to the following statutory direct programs to reduce assessments: Reliability Standards; Compliance Monitoring and Enforcement and Organization Registration and Certification; Reliability Assessments and Performance Analysis; Training, Education and Operator Certification; and Situation Awareness and Infrastructure Security.. Penalty
Formatted: Normal, Level 1
Formatted: Font: (Default) Arial, No underline,Font color: Auto

Section B — Supplemental Financial Information Breakdown of Statement of Activities
2012 ReliabilityFirst Corporation Business Plan and Budget Approved by Board of Directors: April 22, 2011 for Stakeholder CommentJuly 8, 2011 143
Formatted: Font color: Text 1
monies are allocated based upon the number of FTEs in the Program divided by the aggregate total FTEs in the Programs receiving the allocation.
Formatted: Space After: 6 pt

Section B — Supplemental Financial Information Breakdown of Statement of Activities
2012 ReliabilityFirst Corporation Business Plan and Budget Approved by Board of Directors: April 22, 2011 for Stakeholder CommentJuly 8, 2011 144
Formatted: Font color: Text 1
Table B-3: Supplemental Funding
Outside Funding Breakdown By Program
(excluding ReliabilityFirst Assessments & Penalty Sanctions)Budget
2011
Projection
2011
Budget
2012
Variance
2012 Budget v
2011 Budget
General and Administrative
Interest Income 40,000$ 40,000$ 60,000$ 20,000$
Total 40,000$ 40,000$ 60,000$ 20,000$
Total Outside Funding 40,000$ 40,000$ 60,000$ 20,000$
Explanation of Significant Variances – 2012 Budget versus 2011 Budget
An increase in Interest Income is due to the 2012 budget amount being a more accurate reflection of historical prior year actuals.
Field Code Changed
Formatted: Normal
Formatted: Space After: 6 pt
Section B — Supplemental Financial Information Breakdown of Statement of Activities
2012 ReliabilityFirst Corporation Business Plan and Budget Approved by Board of Directors: April 22, 2011 for Stakeholder CommentJuly 8, 2011 145
Formatted: Font color: Text 1
Table B-4: Personnel Expenses
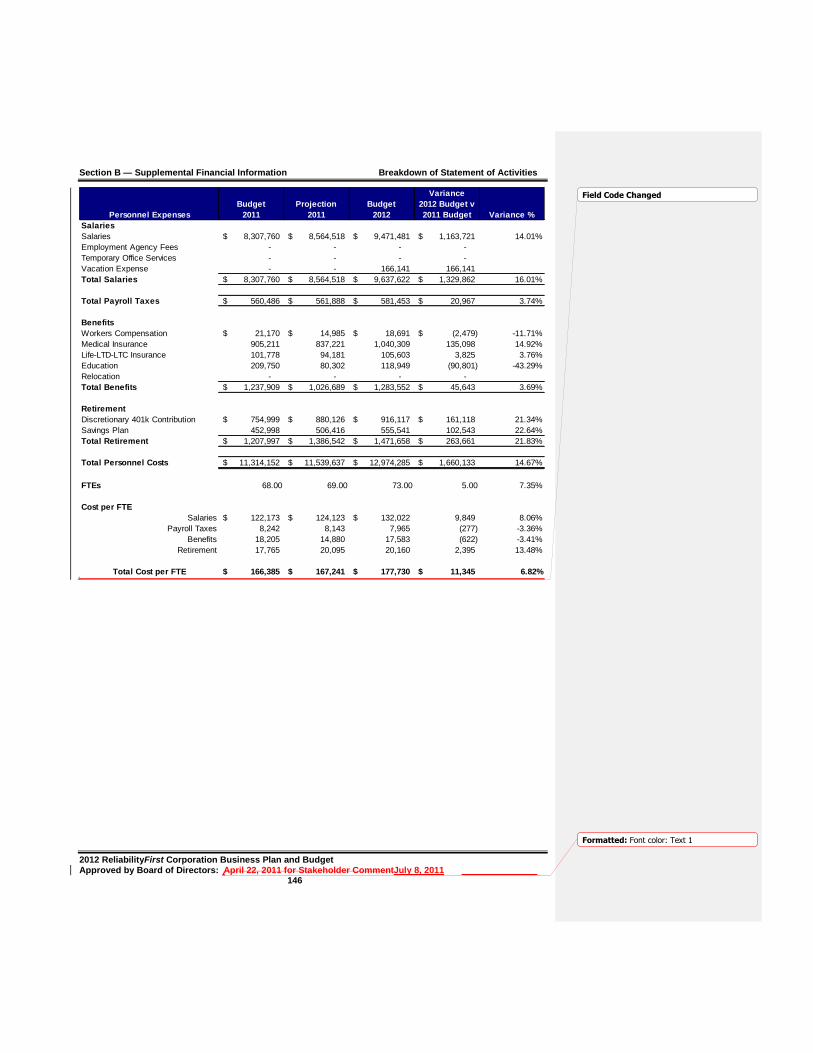
Section B — Supplemental Financial Information Breakdown of Statement of Activities
2012 ReliabilityFirst Corporation Business Plan and Budget Approved by Board of Directors: April 22, 2011 for Stakeholder CommentJuly 8, 2011 146
Formatted: Font color: Text 1
Personnel Expenses
Budget
2011
Projection
2011
Budget
2012
Variance
2012 Budget v
2011 Budget Variance %
Salaries
Salaries 8,307,760$ 8,564,518$ 9,471,481$ 1,163,721$ 14.01%
Employment Agency Fees - - - -
Temporary Office Services - - - -
Vacation Expense - - 166,141 166,141
Total Salaries 8,307,760$ 8,564,518$ 9,637,622$ 1,329,862$ 16.01%
Total Payroll Taxes 560,486$ 561,888$ 581,453$ 20,967$ 3.74%
Benefits
Workers Compensation 21,170$ 14,985$ 18,691$ (2,479)$ -11.71%
Medical Insurance 905,211 837,221 1,040,309 135,098 14.92%
Life-LTD-LTC Insurance 101,778 94,181 105,603 3,825 3.76%
Education 209,750 80,302 118,949 (90,801) -43.29%
Relocation - - - -
Total Benefits 1,237,909$ 1,026,689$ 1,283,552$ 45,643$ 3.69%
Retirement
Discretionary 401k Contribution 754,999$ 880,126$ 916,117$ 161,118$ 21.34%
Savings Plan 452,998 506,416 555,541 102,543 22.64%
Total Retirement 1,207,997$ 1,386,542$ 1,471,658$ 263,661$ 21.83%
Total Personnel Costs 11,314,152$ 11,539,637$ 12,974,285$ 1,660,133$ 14.67%
FTEs 68.00 69.00 73.00 5.00 7.35%
Cost per FTE
Salaries 122,173$ 124,123$ 132,022$ 9,849 8.06%
Payroll Taxes 8,242 8,143 7,965 (277) -3.36%
Benefits 18,205 14,880 17,583 (622) -3.41%
Retirement 17,765 20,095 20,160 2,395 13.48%
Total Cost per FTE 166,385$ 167,241$ 177,730$ 11,345$ 6.82%
Field Code Changed

Section B — Supplemental Financial Information Breakdown of Statement of Activities
2012 ReliabilityFirst Corporation Business Plan and Budget Approved by Board of Directors: April 22, 2011 for Stakeholder CommentJuly 8, 2011 147
Formatted: Font color: Text 1
Personnel Expenses
Budget
2011
Projection
2011
Budget
2012
Variance
2012 Budget v
2011 Budget Variance %
Salaries
Salaries 8,307,760$ 8,564,518$ 9,471,481$ 1,163,721$ 14.01%
Employment Agency Fees - - - -
Temporary Office Services - - - -
Vacation Expense - - 166,141 166,141
Total Salaries 8,307,760$ 8,564,518$ 9,637,622$ 1,329,862$ 16.01%
Total Payroll Taxes 560,486$ 561,888$ 581,453$ 20,967$ 3.74%
Benefits
Workers Compensation 21,170$ 14,985$ 18,691$ (2,479)$ -11.71%
Medical Insurance 905,211 837,221 1,040,309 135,098 14.92%
Life-LTD-LTC Insurance 101,778 94,181 105,603 3,825 3.76%
Education 209,750 80,302 118,949 (90,801) -43.29%
Relocation - - - -
Total Benefits 1,237,909$ 1,026,689$ 1,283,552$ 45,643$ 3.69%
Retirement
Discretionary 401k Contribution 754,999$ 880,126$ 916,117$ 161,118$ 21.34%
Savings Plan 452,998 506,416 555,541 102,543 22.64%
Total Retirement 1,207,997$ 1,386,542$ 1,471,658$ 263,661$ 21.83%
Total Personnel Costs 11,314,152$ 11,539,637$ 12,974,285$ 1,660,133$ 14.67%
FTEs 68.00 69.00 73.00 5.00 7.35%
Cost per FTE
Salaries 122,173$ 124,123$ 132,022$ 9,849 8.06%
Payroll Taxes 8,242 8,143 7,965 (277) -3.36%
Benefits 18,205 14,880 17,583 (622) -3.41%
Retirement 17,765 20,095 20,160 2,395 13.48%
Total Cost per FTE 166,385$ 167,241$ 177,730$ 11,345$ 6.82%
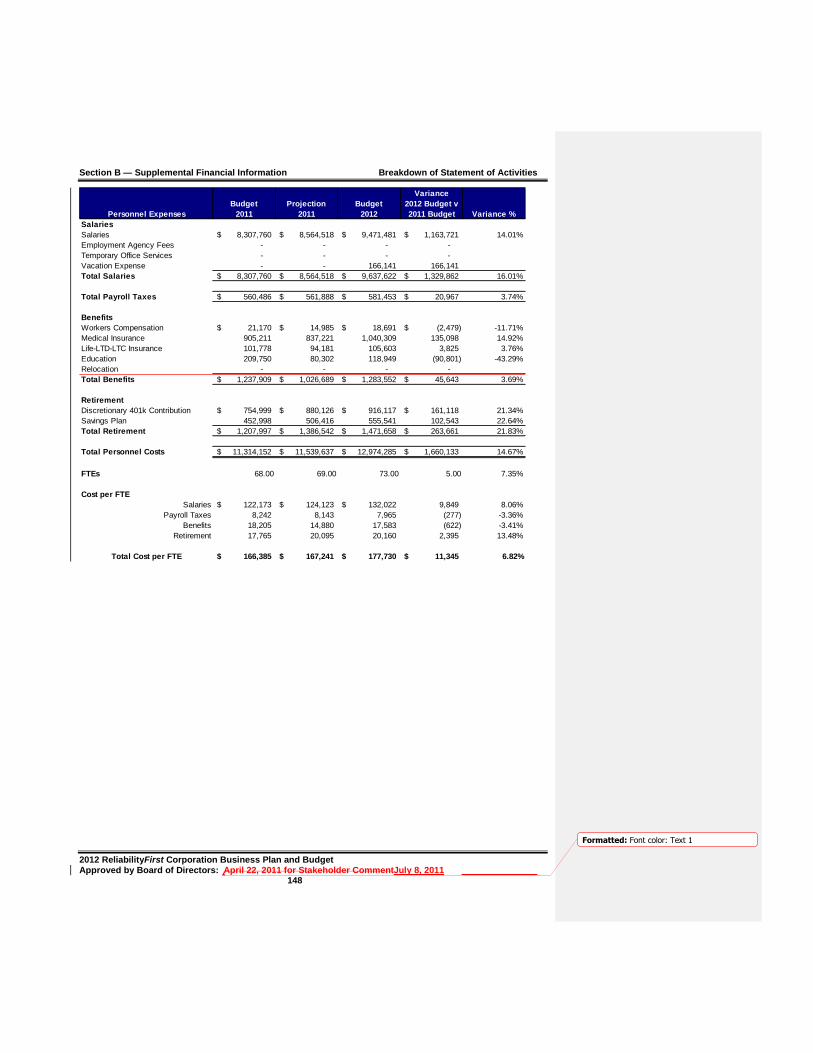
Section B — Supplemental Financial Information Breakdown of Statement of Activities
2012 ReliabilityFirst Corporation Business Plan and Budget Approved by Board of Directors: April 22, 2011 for Stakeholder CommentJuly 8, 2011 148
Formatted: Font color: Text 1
Personnel Expenses
Budget
2011
Projection
2011
Budget
2012
Variance
2012 Budget v
2011 Budget Variance %
Salaries
Salaries 8,307,760$ 8,564,518$ 9,471,481$ 1,163,721$ 14.01%
Employment Agency Fees - - - -
Temporary Office Services - - - -
Vacation Expense - - 166,141 166,141
Total Salaries 8,307,760$ 8,564,518$ 9,637,622$ 1,329,862$ 16.01%
Total Payroll Taxes 560,486$ 561,888$ 581,453$ 20,967$ 3.74%
Benefits
Workers Compensation 21,170$ 14,985$ 18,691$ (2,479)$ -11.71%
Medical Insurance 905,211 837,221 1,040,309 135,098 14.92%
Life-LTD-LTC Insurance 101,778 94,181 105,603 3,825 3.76%
Education 209,750 80,302 118,949 (90,801) -43.29%
Relocation - - - -
Total Benefits 1,237,909$ 1,026,689$ 1,283,552$ 45,643$ 3.69%
Retirement
Discretionary 401k Contribution 754,999$ 880,126$ 916,117$ 161,118$ 21.34%
Savings Plan 452,998 506,416 555,541 102,543 22.64%
Total Retirement 1,207,997$ 1,386,542$ 1,471,658$ 263,661$ 21.83%
Total Personnel Costs 11,314,152$ 11,539,637$ 12,974,285$ 1,660,133$ 14.67%
FTEs 68.00 69.00 73.00 5.00 7.35%
Cost per FTE
Salaries 122,173$ 124,123$ 132,022$ 9,849 8.06%
Payroll Taxes 8,242 8,143 7,965 (277) -3.36%
Benefits 18,205 14,880 17,583 (622) -3.41%
Retirement 17,765 20,095 20,160 2,395 13.48%
Total Cost per FTE 166,385$ 167,241$ 177,730$ 11,345$ 6.82%
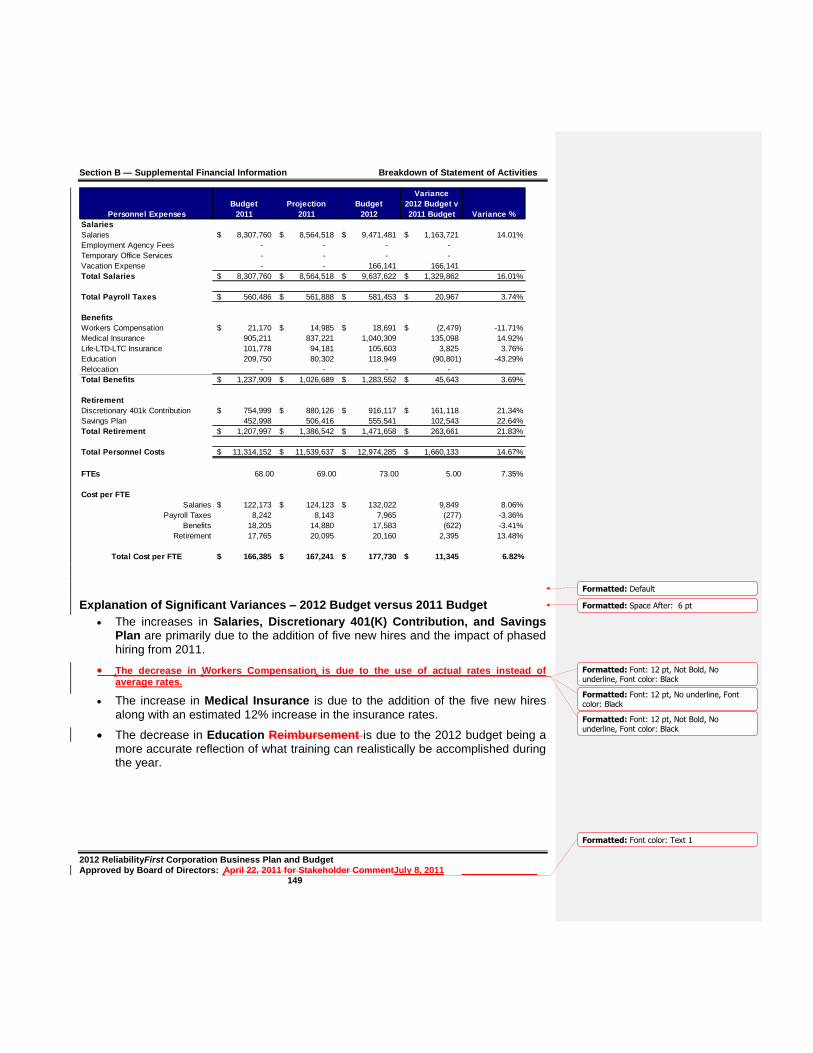
Section B — Supplemental Financial Information Breakdown of Statement of Activities
2012 ReliabilityFirst Corporation Business Plan and Budget Approved by Board of Directors: April 22, 2011 for Stakeholder CommentJuly 8, 2011 149
Formatted: Font color: Text 1
Personnel Expenses
Budget
2011
Projection
2011
Budget
2012
Variance
2012 Budget v
2011 Budget Variance %
Salaries
Salaries 8,307,760$ 8,564,518$ 9,471,481$ 1,163,721$ 14.01%
Employment Agency Fees - - - -
Temporary Office Services - - - -
Vacation Expense - - 166,141 166,141
Total Salaries 8,307,760$ 8,564,518$ 9,637,622$ 1,329,862$ 16.01%
Total Payroll Taxes 560,486$ 561,888$ 581,453$ 20,967$ 3.74%
Benefits
Workers Compensation 21,170$ 14,985$ 18,691$ (2,479)$ -11.71%
Medical Insurance 905,211 837,221 1,040,309 135,098 14.92%
Life-LTD-LTC Insurance 101,778 94,181 105,603 3,825 3.76%
Education 209,750 80,302 118,949 (90,801) -43.29%
Relocation - - - -
Total Benefits 1,237,909$ 1,026,689$ 1,283,552$ 45,643$ 3.69%
Retirement
Discretionary 401k Contribution 754,999$ 880,126$ 916,117$ 161,118$ 21.34%
Savings Plan 452,998 506,416 555,541 102,543 22.64%
Total Retirement 1,207,997$ 1,386,542$ 1,471,658$ 263,661$ 21.83%
Total Personnel Costs 11,314,152$ 11,539,637$ 12,974,285$ 1,660,133$ 14.67%
FTEs 68.00 69.00 73.00 5.00 7.35%
Cost per FTE
Salaries 122,173$ 124,123$ 132,022$ 9,849 8.06%
Payroll Taxes 8,242 8,143 7,965 (277) -3.36%
Benefits 18,205 14,880 17,583 (622) -3.41%
Retirement 17,765 20,095 20,160 2,395 13.48%
Total Cost per FTE 166,385$ 167,241$ 177,730$ 11,345$ 6.82%
Explanation of Significant Variances – 2012 Budget versus 2011 Budget
The increases in Salaries, Discretionary 401(K) Contribution, and Savings Plan are primarily due to the addition of five new hires and the impact of phased hiring from 2011.
The decrease in Workers Compensation is due to the use of actual rates instead of average rates.
The increase in Medical Insurance is due to the addition of the five new hires along with an estimated 12% increase in the insurance rates.
The decrease in Education Reimbursement is due to the 2012 budget being a more accurate reflection of what training can realistically be accomplished during the year.
Formatted: Default
Formatted: Space After: 6 pt
Formatted: Font: 12 pt, Not Bold, Nounderline, Font color: Black
Formatted: Font: 12 pt, No underline, Fontcolor: Black
Formatted: Font: 12 pt, Not Bold, Nounderline, Font color: Black
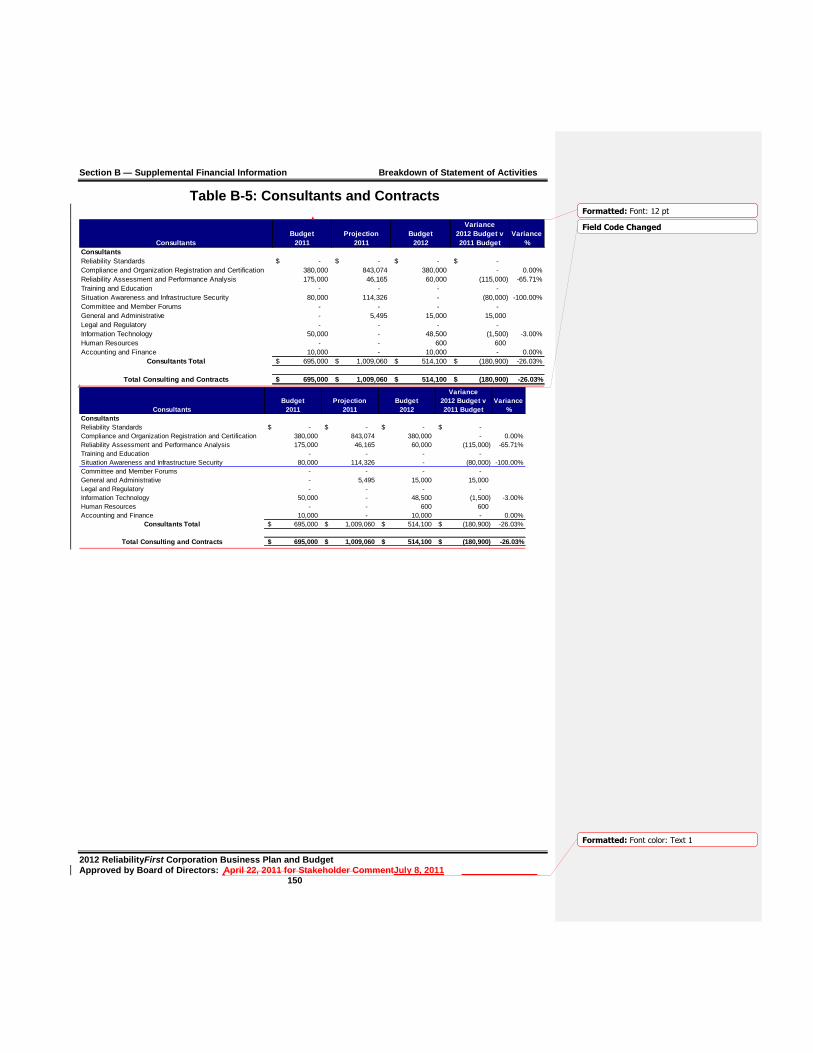
Section B — Supplemental Financial Information Breakdown of Statement of Activities
2012 ReliabilityFirst Corporation Business Plan and Budget Approved by Board of Directors: April 22, 2011 for Stakeholder CommentJuly 8, 2011 150
Formatted: Font color: Text 1
Table B-5: Consultants and Contracts
Consultants
Budget
2011
Projection
2011
Budget
2012
Variance
2012 Budget v
2011 Budget
Variance
%
Consultants
Reliability Standards -$ -$ -$ -$
Compliance and Organization Registration and Certification 380,000 843,074 380,000 - 0.00%
Reliability Assessment and Performance Analysis 175,000 46,165 60,000 (115,000) -65.71%
Training and Education - - - -
Situation Awareness and Infrastructure Security 80,000 114,326 - (80,000) -100.00%
Committee and Member Forums - - - -
General and Administrative - 5,495 15,000 15,000
Legal and Regulatory - - - -
Information Technology 50,000 - 48,500 (1,500) -3.00%
Human Resources - - 600 600
Accounting and Finance 10,000 - 10,000 - 0.00%
Consultants Total 695,000$ 1,009,060$ 514,100$ (180,900)$ -26.03%
Total Consulting and Contracts 695,000$ 1,009,060$ 514,100$ (180,900)$ -26.03%
Consultants
Budget
2011
Projection
2011
Budget
2012
Variance
2012 Budget v
2011 Budget
Variance
%
Consultants
Reliability Standards -$ -$ -$ -$
Compliance and Organization Registration and Certification 380,000 843,074 380,000 - 0.00%
Reliability Assessment and Performance Analysis 175,000 46,165 60,000 (115,000) -65.71%
Training and Education - - - -
Situation Awareness and Infrastructure Security 80,000 114,326 - (80,000) -100.00%
Committee and Member Forums - - - -
General and Administrative - 5,495 15,000 15,000
Legal and Regulatory - - - -
Information Technology 50,000 - 48,500 (1,500) -3.00%
Human Resources - - 600 600
Accounting and Finance 10,000 - 10,000 - 0.00%
Consultants Total 695,000$ 1,009,060$ 514,100$ (180,900)$ -26.03%
Total Consulting and Contracts 695,000$ 1,009,060$ 514,100$ (180,900)$ -26.03%
Formatted: Font: 12 pt
Field Code Changed

Section B — Supplemental Financial Information Breakdown of Statement of Activities
2012 ReliabilityFirst Corporation Business Plan and Budget Approved by Board of Directors: April 22, 2011 for Stakeholder CommentJuly 8, 2011 151
Formatted: Font color: Text 1
Consultants
Budget
2011
Projection
2011
Budget
2012
Variance
2012 Budget v
2011 Budget
Variance
%
Consultants
Reliability Standards -$ -$ -$ -$
Compliance and Organization Registration and Certification 380,000 843,074 380,000 - 0.00%
Reliability Assessment and Performance Analysis 175,000 46,165 60,000 (115,000) -65.71%
Training and Education - - - -
Situation Awareness and Infrastructure Security 80,000 114,326 - (80,000) -100.00%
Committee and Member Forums - - - -
General and Administrative - 5,495 15,000 15,000
Legal and Regulatory - - - -
Information Technology 50,000 - 48,500 (1,500) -3.00%
Human Resources - - 600 600
Accounting and Finance 10,000 - 10,000 - 0.00%
Consultants Total 695,000$ 1,009,060$ 514,100$ (180,900)$ -26.03%
Total Consulting and Contracts 695,000$ 1,009,060$ 514,100$ (180,900)$ -26.03%
Consultants
Budget
2011
Projection
2011
Budget
2012
Variance
2012 Budget v
2011 Budget
Variance
%
Consultants
Reliability Standards -$ -$ -$ -$
Compliance and Organization Registration and Certification 380,000 843,074 380,000 - 0.00%
Reliability Assessment and Performance Analysis 175,000 46,165 60,000 (115,000) -65.71%
Training and Education - - - -
Situation Awareness and Infrastructure Security 80,000 114,326 - (80,000) -100.00%
Committee and Member Forums - - - -
General and Administrative - 5,495 15,000 15,000
Legal and Regulatory - - - -
Information Technology 50,000 - 48,500 (1,500) -3.00%
Human Resources - - 600 600
Accounting and Finance 10,000 - 10,000 - 0.00%
Consultants Total 695,000$ 1,009,060$ 514,100$ (180,900)$ -26.03%
Total Consulting and Contracts 695,000$ 1,009,060$ 514,100$ (180,900)$ -26.03% Explanation of Significant Variances – 2012 Budget versus 2011 Budget
The decrease in Reliability Assessment and Performance Analysis costs is a result of an amount included in the 2011 budget for the use of contractors to assist with the UFLS dynamic analysis that is not applicable in 2012.
The decrease in Situational Awareness costs is due to a one-time fee included in the 2011 budget for vulnerability and penetration testing of ReliabilityFirst’s electronic infrastructure to ensure the company’s compliance with CIP Standards.
The increase in General and Administrative costs is due to the use of consultants to review and update the company’s strategic plan.
Formatted: Font: 6 pt

Section B — Supplemental Financial Information Breakdown of Statement of Activities
2012 ReliabilityFirst Corporation Business Plan and Budget Approved by Board of Directors: April 22, 2011 for Stakeholder CommentJuly 8, 2011 152
Formatted: Font color: Text 1
Table B-6: Office Rent
Office Rent
Budget
2011
Projection
2011
Budget
2012
Variance
2012 Budget
v 2011
Budget
Variance
%
Office Rent 327,592$ 327,584$ 454,135$ 126,543 38.63%
Utilities 64,800 64,800 77,325 12,525 19.33%
Maintenance - - - -
Security - - - -
- - -
Total Office Rent 392,392$ 392,384$ 531,460$ 139,068$ 35.44%
Explanation of Significant Variances – 2012 Budget versus 2011 Budget
Field Code Changed
Formatted: Font: 6 pt
Section B — Supplemental Financial Information Breakdown of Statement of Activities
2012 ReliabilityFirst Corporation Business Plan and Budget Approved by Board of Directors: April 22, 2011 for Stakeholder CommentJuly 8, 2011 153
Formatted: Font color: Text 1
The increase in Office Rent is due to the rental space needed to accommodate the computer equipment for the DR strategy.
The increase in Utilities is due to an additional year’s worth of historical data which allows a more accurate estimate to be calculated.
Formatted: Space After: 6 pt
Formatted: Font: Bold
Formatted: Font: 6 pt, Bold
Formatted: Indent: Left: 0.5", No bullets ornumbering
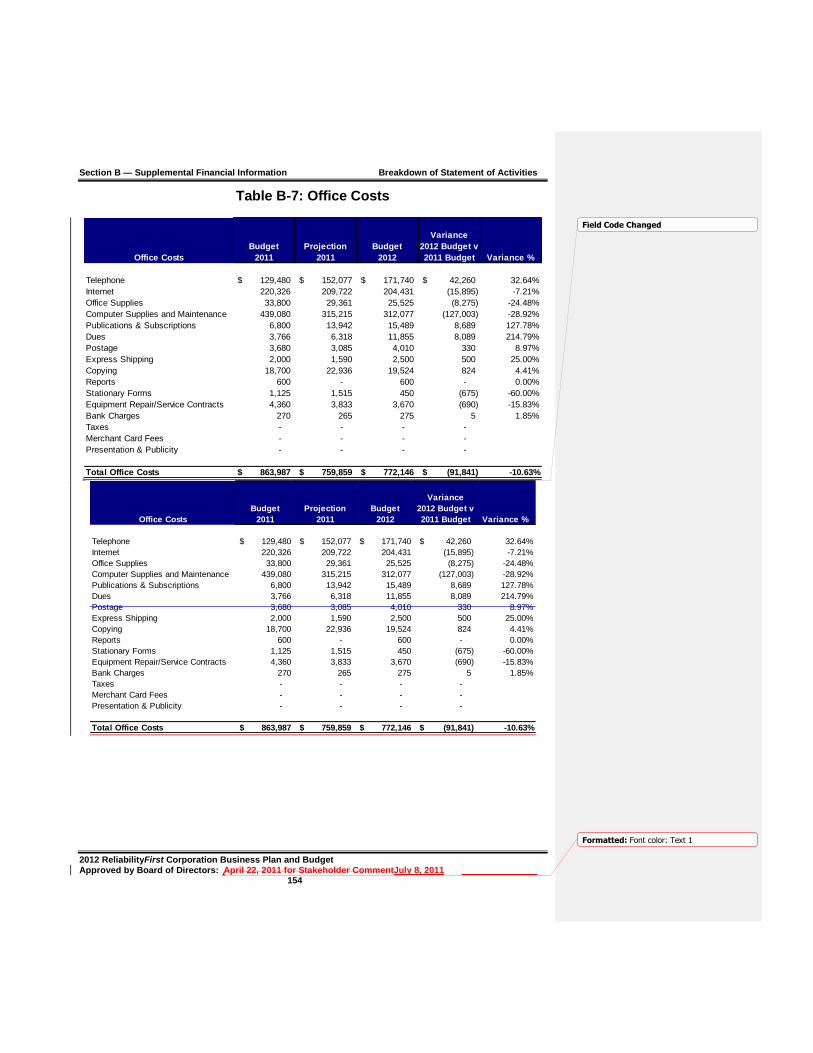
Section B — Supplemental Financial Information Breakdown of Statement of Activities
2012 ReliabilityFirst Corporation Business Plan and Budget Approved by Board of Directors: April 22, 2011 for Stakeholder CommentJuly 8, 2011 154
Formatted: Font color: Text 1
Table B-7: Office Costs
Office Costs
Budget
2011
Projection
2011
Budget
2012
Variance
2012 Budget v
2011 Budget Variance %
Telephone 129,480$ 152,077$ 171,740$ 42,260$ 32.64%
Internet 220,326 209,722 204,431 (15,895) -7.21%
Office Supplies 33,800 29,361 25,525 (8,275) -24.48%
Computer Supplies and Maintenance 439,080 315,215 312,077 (127,003) -28.92%
Publications & Subscriptions 6,800 13,942 15,489 8,689 127.78%
Dues 3,766 6,318 11,855 8,089 214.79%
Postage 3,680 3,085 4,010 330 8.97%
Express Shipping 2,000 1,590 2,500 500 25.00%
Copying 18,700 22,936 19,524 824 4.41%
Reports 600 - 600 - 0.00%
Stationary Forms 1,125 1,515 450 (675) -60.00%
Equipment Repair/Service Contracts 4,360 3,833 3,670 (690) -15.83%
Bank Charges 270 265 275 5 1.85%
Taxes - - - -
Merchant Card Fees - - - -
Presentation & Publicity - - - -
Total Office Costs 863,987$ 759,859$ 772,146$ (91,841)$ -10.63%
Field Code Changed
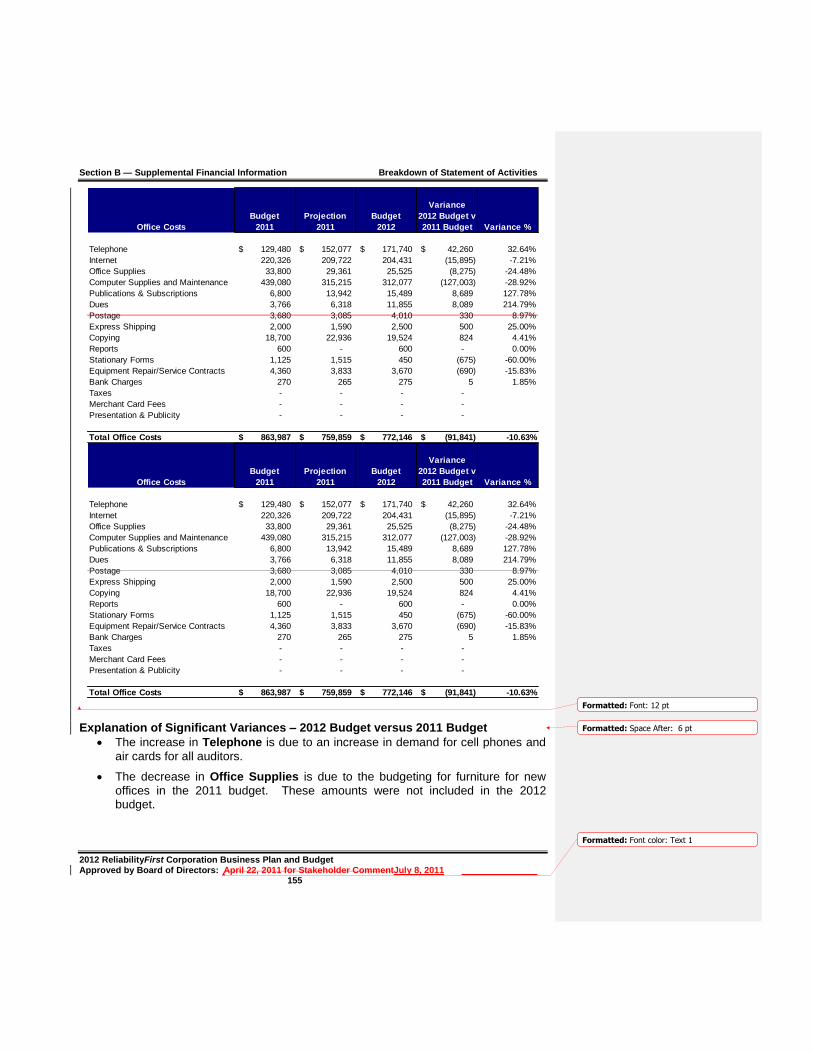
Section B — Supplemental Financial Information Breakdown of Statement of Activities
2012 ReliabilityFirst Corporation Business Plan and Budget Approved by Board of Directors: April 22, 2011 for Stakeholder CommentJuly 8, 2011 155
Formatted: Font color: Text 1
Office Costs
Budget
2011
Projection
2011
Budget
2012
Variance
2012 Budget v
2011 Budget Variance %
Telephone 129,480$ 152,077$ 171,740$ 42,260$ 32.64%
Internet 220,326 209,722 204,431 (15,895) -7.21%
Office Supplies 33,800 29,361 25,525 (8,275) -24.48%
Computer Supplies and Maintenance 439,080 315,215 312,077 (127,003) -28.92%
Publications & Subscriptions 6,800 13,942 15,489 8,689 127.78%
Dues 3,766 6,318 11,855 8,089 214.79%
Postage 3,680 3,085 4,010 330 8.97%
Express Shipping 2,000 1,590 2,500 500 25.00%
Copying 18,700 22,936 19,524 824 4.41%
Reports 600 - 600 - 0.00%
Stationary Forms 1,125 1,515 450 (675) -60.00%
Equipment Repair/Service Contracts 4,360 3,833 3,670 (690) -15.83%
Bank Charges 270 265 275 5 1.85%
Taxes - - - -
Merchant Card Fees - - - -
Presentation & Publicity - - - -
Total Office Costs 863,987$ 759,859$ 772,146$ (91,841)$ -10.63%
Explanation of Significant Variances – 2012 Budget versus 2011 Budget
The increase in Telephone is due to an increase in demand for cell phones and air cards for all auditors.
The decrease in Office Supplies is due to the budgeting for furniture for new offices in the 2011 budget. These amounts were not included in the 2012 budget.
Formatted: Font: 12 pt
Formatted: Space After: 6 pt
Section B — Supplemental Financial Information Breakdown of Statement of Activities
2012 ReliabilityFirst Corporation Business Plan and Budget Approved by Board of Directors: April 22, 2011 for Stakeholder CommentJuly 8, 2011 156
Formatted: Font color: Text 1
The decrease in Computer Supplies & Maintenance is due to discontinuation of service agreements on products that are scheduled for replacement, including but not limited to the phone and web conferencing, SEIM and IPS/IDS systems.
The increase in Publications & Subscriptions is due to a subscription to Westlaw Publications utilized by the Enforcement Staff.
The increase in Dues is due to hiring employees who have professional certifications.
The increase in Postage is a result of the growth in volume of mail being sent by the telecommuters to the office.
The increase in Express Shipping is due to the increase in the number of packages shipped via UPS/FEDEX.
The decrease in Stationary Forms is due to the budgeting for accounts payable checks and envelopes in the 2011 budget. These amounts were not included in the 2012 budget.
The decrease in Equipment Repair/Service Contracts is due to the use of more accurate data to establish a better budget estimate.
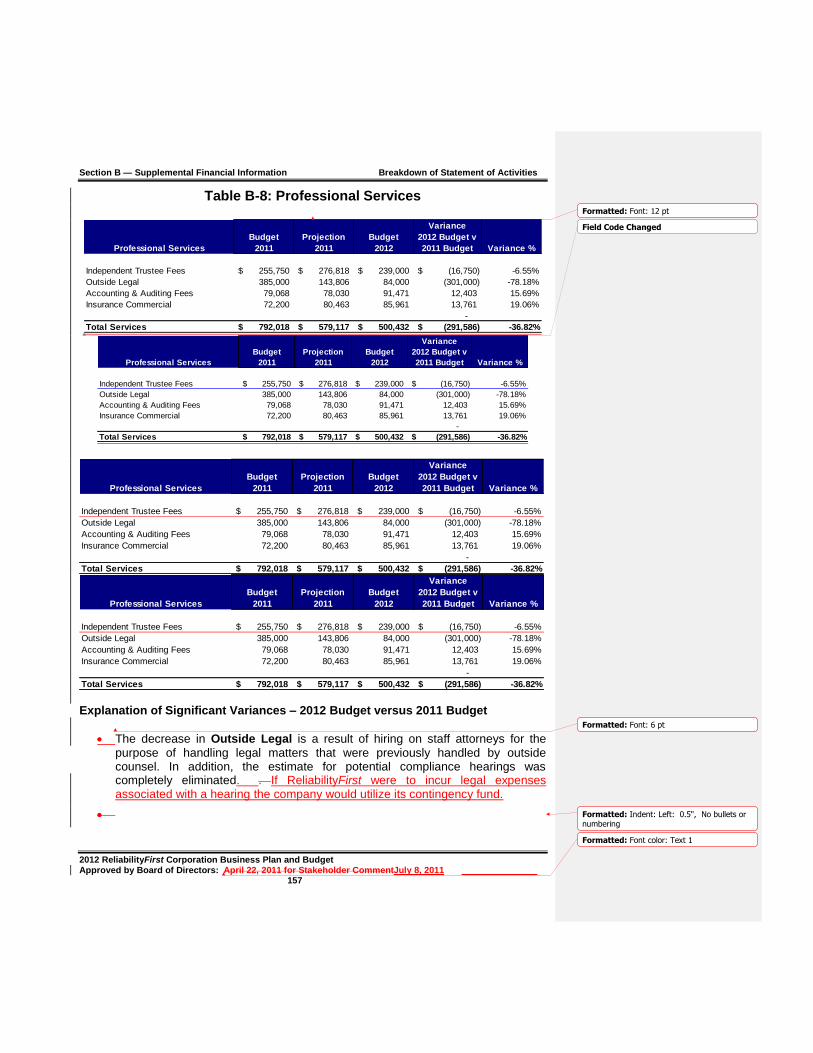
Section B — Supplemental Financial Information Breakdown of Statement of Activities
2012 ReliabilityFirst Corporation Business Plan and Budget Approved by Board of Directors: April 22, 2011 for Stakeholder CommentJuly 8, 2011 157
Formatted: Font color: Text 1
Table B-8: Professional Services
Professional Services
Budget
2011
Projection
2011
Budget
2012
Variance
2012 Budget v
2011 Budget Variance %
Independent Trustee Fees 255,750$ 276,818$ 239,000$ (16,750)$ -6.55%
Outside Legal 385,000 143,806 84,000 (301,000) -78.18%
Accounting & Auditing Fees 79,068 78,030 91,471 12,403 15.69%
Insurance Commercial 72,200 80,463 85,961 13,761 19.06%
-
Total Services 792,018$ 579,117$ 500,432$ (291,586)$ -36.82%
Explanation of Significant Variances – 2012 Budget versus 2011 Budget
The decrease in Outside Legal is a result of hiring on staff attorneys for the purpose of handling legal matters that were previously handled by outside counsel. In addition, the estimate for potential compliance hearings was completely eliminated. . If ReliabilityFirst were to incur legal expenses associated with a hearing the company would utilize its contingency fund.
Formatted: Font: 12 pt
Field Code Changed
Formatted: Font: 6 pt
Formatted: Indent: Left: 0.5", No bullets ornumbering

Section B — Supplemental Financial Information Breakdown of Statement of Activities
2012 ReliabilityFirst Corporation Business Plan and Budget Approved by Board of Directors: April 22, 2011 for Stakeholder CommentJuly 8, 2011 158
Formatted: Font color: Text 1
The increase in Accounting & Auditing Fees is due to the increase in monthly payroll and retirement service fees which are a direct correlation to the addition of new employees along with a slight increase in the yearly auditing fees.
The increase in Insurance Commercial is to account for the expected increase in insurance rate ofcosts for a growing company.
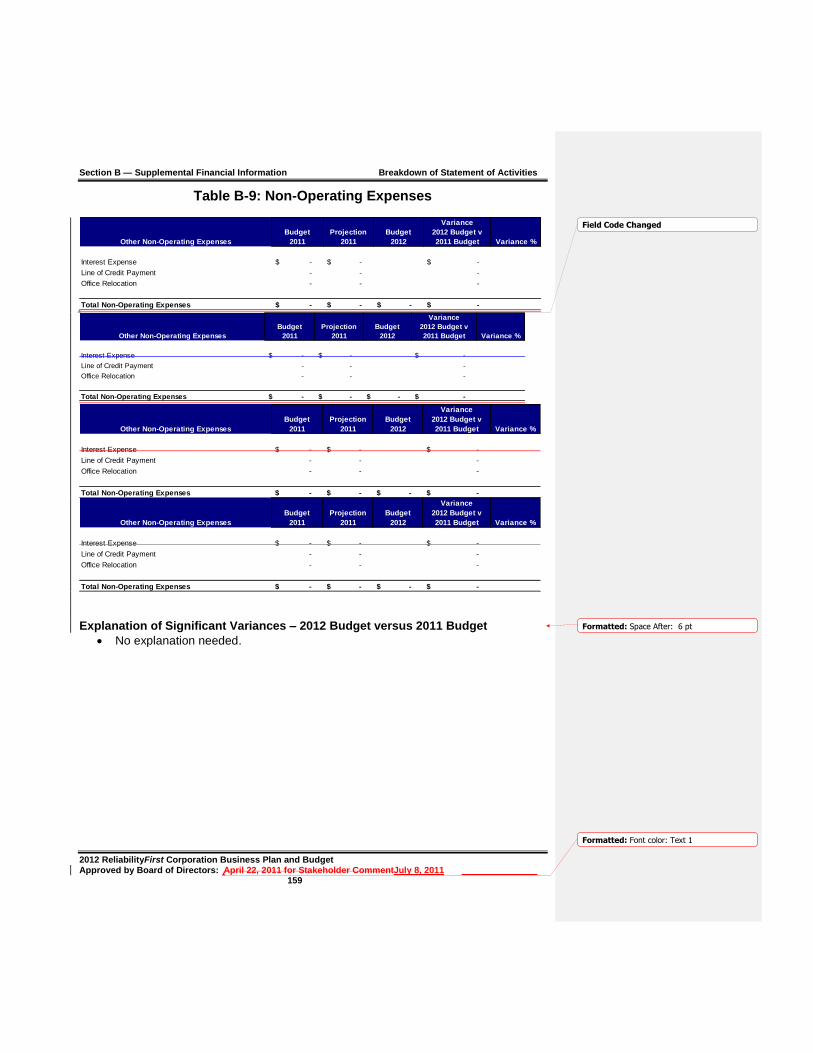
Section B — Supplemental Financial Information Breakdown of Statement of Activities
2012 ReliabilityFirst Corporation Business Plan and Budget Approved by Board of Directors: April 22, 2011 for Stakeholder CommentJuly 8, 2011 159
Formatted: Font color: Text 1
Table B-9: Non-Operating Expenses
Other Non-Operating Expenses
Budget
2011
Projection
2011
Budget
2012
Variance
2012 Budget v
2011 Budget Variance %
Interest Expense -$ -$ -$
Line of Credit Payment - - -
Office Relocation - - -
Total Non-Operating Expenses -$ -$ -$ -$
Other Non-Operating Expenses
Budget
2011
Projection
2011
Budget
2012
Variance
2012 Budget v
2011 Budget Variance %
Interest Expense -$ -$ -$
Line of Credit Payment - - -
Office Relocation - - -
Total Non-Operating Expenses -$ -$ -$ -$
Other Non-Operating Expenses
Budget
2011
Projection
2011
Budget
2012
Variance
2012 Budget v
2011 Budget Variance %
Interest Expense -$ -$ -$
Line of Credit Payment - - -
Office Relocation - - -
Total Non-Operating Expenses -$ -$ -$ -$
Other Non-Operating Expenses
Budget
2011
Projection
2011
Budget
2012
Variance
2012 Budget v
2011 Budget Variance %
Interest Expense -$ -$ -$
Line of Credit Payment - - -
Office Relocation - - -
Total Non-Operating Expenses -$ -$ -$ -$ Explanation of Significant Variances – 2012 Budget versus 2011 Budget
No explanation needed.
Field Code Changed
Formatted: Space After: 6 pt

Section B — Supplemental Financial Information Breakdown of Statement of Activities
2012 ReliabilityFirst Corporation Business Plan and Budget Approved by Board of Directors: April 22, 2011 for Stakeholder CommentJuly 8, 2011 160
Formatted: Font color: Text 1
Table B-10: 2013 and 2014 Projections

Section B — Supplemental Financial Information Breakdown of Statement of Activities
2012 ReliabilityFirst Corporation Business Plan and Budget Approved by Board of Directors: April 22, 2011 for Stakeholder CommentJuly 8, 2011 161
Formatted: Font color: Text 1
2012 2013 $ Change
%
Change 2014 $ Change
%
Change
Budget Projection 12 v 13 12 v 13 Projection 13 v 14 13 v 14
Funding
ERO Funding
ERO Assessments 13,534,272$ 18,407,868$ 4,873,595$ 36.0% 19,853,110$ 1,445,243$ 7.9%
Penalty Sanctions 792,100$ -$ (792,100) -100.0% -$ -
Total ERO Funding 14,326,372$ 18,407,868$ 4,081,495$ 28.5% 19,853,110$ 1,445,243$ 7.9%
Membership Dues - -$ - -$ -
Federal Grants - -$ - -$ -
Services & Software - -$ - -$ -
Workshops - -$ - -$ -
Interest 60,000 60,000$ - 0.0% 60,000$ - 0.0%
Miscellaneous - -$ - -$ -
Total Funding 14,386,372$ 18,467,868$ 4,081,495$ 28.4% 19,913,110$ 1,445,243$ 7.8%
Expenses
Personnel Expenses
Salaries 9,637,622 10,726,837$ 1,089,215 11.3% 11,795,469$ 1,068,632 10.0%
Payroll Taxes 581,453 654,257$ 72,804 12.5% 705,195$ 50,938 7.8%
Benefits 1,283,552 1,432,245$ 148,693 11.6% 1,686,525$ 254,280 17.8%
Retirement Costs 1,471,658 1,676,294$ 204,636 13.9% 1,839,275$ 162,981 9.7%
Total Personnel Expenses 12,974,285$ 14,489,633$ 1,515,348$ 11.7% 16,026,464$ 1,536,831$ 10.6%
Meeting Expenses
Meetings 144,630$ 151,862$ 7,232$ 5.0% 159,455$ 7,593 5.0%
Travel 686,950$ 721,298$ 34,348 5.0% 757,362$ 36,065 5.0%
Conference Calls 10,176$ 10,685$ 509 5.0% 11,219$ 534 5.0%
Total Meeting Expenses 841,756$ 883,844$ 42,088$ 5.0% 928,036$ 44,192$ 5.0%
Operating Expenses
Consultants & Contracts 514,100$ 539,805$ 25,705 5.0% 566,795$ 26,990 5.0%
Office Rent 531,460$ 697,542$ 166,081 31.3% 732,419$ 34,877 5.0%
Office Costs 772,146$ 972,904$ 200,758 26.0% 1,021,550$ 48,645 5.0%
Professional Services 500,432$ 525,454$ 25,022 5.0% 551,726$ 26,273 5.0%
Miscellaneous 27,320$ 28,686$ 1,366 5.0% 30,120$ 1,434 5.0%
Depreciation 506,822$ 552,436$ 45,614 9.0% 596,630$ 44,195 8.0%
Total Operating Expenses 2,852,280 3,316,826 464,546 16.3% 3,499,241 182,414 5.5%
Other Non-Operating Expenses -$ -$ -$ -$ -$
Total Expenses 16,668,321$ 18,690,303$ 2,021,982$ 12.1% 20,453,741$ 1,763,438 9.4%
Change in Assets (2,281,949)$ (222,436)$ 2,059,514$ -90.3% (540,630)$ (318,195)$ 143.1%
Fixed Assets
Depreciation (506,822)$ (552,436)$ (45,614) 9.0% (596,630)$ (44,195) 8.0%
Computer & Software CapEx 495,000$ 80,000$ (415,000) -83.8% 40,000$ (40,000) -50.0%
Furniture & Fixtures CapEx -$ 90,000$ 90,000 4,000$ (86,000) -95.6%
Equipment CapEx -$ 10,000$ 10,000 2,000$ (8,000) -80.0%
Leasehold Improvements -$ 150,000$ 150,000 10,000$ (140,000) -93.3%
Change in Fixed Assets 11,822$ 222,436$ 210,614$ 1781.6% 540,630$ 318,195$ 143.1%
TOTAL CHANGE IN ASSETS (2,270,128)$ $0 2,270,128$ -100.0% $0 -$
Statement of Activities
2013 and 2014 Projections
Field Code Changed

Section B — Supplemental Financial Information Breakdown of Statement of Activities
2012 ReliabilityFirst Corporation Business Plan and Budget Approved by Board of Directors: April 22, 2011 for Stakeholder CommentJuly 8, 2011 162
Formatted: Font color: Text 1
2012 2013 $ Change
%
Change 2014 $ Change
%
Change
Budget Projection 12 v 13 12 v 13 Projection 13 v 14 13 v 14
Funding
ERO Funding
ERO Assessments 13,541,272$ 18,407,868$ 4,866,595$ 35.9% 19,853,110$ 1,445,243$ 7.9%
Penalty Sanctions 785,100$ -$ (785,100) -100.0% -$ -
Total ERO Funding 14,326,372$ 18,407,868$ 4,081,495$ 28.5% 19,853,110$ 1,445,243$ 7.9%
Membership Dues - -$ - -$ -
Federal Grants - -$ - -$ -
Services & Software - -$ - -$ -
Workshops - -$ - -$ -
Interest 60,000 60,000$ - 0.0% 60,000$ - 0.0%
Miscellaneous - -$ - -$ -
Total Funding 14,386,372$ 18,467,868$ 4,081,495$ 28.4% 19,913,110$ 1,445,243$ 7.8%
Expenses
Personnel Expenses
Salaries 9,637,622 10,726,837$ 1,089,215 11.3% 11,795,469$ 1,068,632 10.0%
Payroll Taxes 581,453 654,257$ 72,804 12.5% 705,195$ 50,938 7.8%
Benefits 1,283,552 1,432,245$ 148,693 11.6% 1,686,525$ 254,280 17.8%
Retirement Costs 1,471,658 1,676,294$ 204,636 13.9% 1,839,275$ 162,981 9.7%
Total Personnel Expenses 12,974,285$ 14,489,633$ 1,515,348$ 11.7% 16,026,464$ 1,536,831$ 10.6%
Meeting Expenses
Meetings 144,630$ 151,862$ 7,232$ 5.0% 159,455$ 7,593 5.0%
Travel 686,950$ 721,298$ 34,348 5.0% 757,362$ 36,065 5.0%
Conference Calls 10,176$ 10,685$ 509 5.0% 11,219$ 534 5.0%
Total Meeting Expenses 841,756$ 883,844$ 42,088$ 5.0% 928,036$ 44,192$ 5.0%
Operating Expenses
Consultants & Contracts 514,100$ 539,805$ 25,705 5.0% 566,795$ 26,990 5.0%
Office Rent 531,460$ 697,542$ 166,081 31.3% 732,419$ 34,877 5.0%
Office Costs 772,146$ 972,904$ 200,758 26.0% 1,021,550$ 48,645 5.0%
Professional Services 500,432$ 525,454$ 25,022 5.0% 551,726$ 26,273 5.0%
Miscellaneous 27,320$ 28,686$ 1,366 5.0% 30,120$ 1,434 5.0%
Depreciation 506,822$ 552,436$ 45,614 9.0% 596,630$ 44,195 8.0%
Total Operating Expenses 2,852,280 3,316,826 464,546 16.3% 3,499,241 182,414 5.5%
Other Non-Operating Expenses -$ -$ -$ -$ -$
Total Expenses 16,668,321$ 18,690,303$ 2,021,982$ 12.1% 20,453,741$ 1,763,438 9.4%
Change in Assets (2,281,949)$ (222,436)$ 2,059,514$ -90.3% (540,630)$ (318,195)$ 143.1%
Fixed Assets
Depreciation (506,822)$ (552,436)$ (45,614) 9.0% (596,630)$ (44,195) 8.0%
Computer & Software CapEx 495,000$ 80,000$ (415,000) -83.8% 40,000$ (40,000) -50.0%
Furniture & Fixtures CapEx -$ 90,000$ 90,000 4,000$ (86,000) -95.6%
Equipment CapEx -$ 10,000$ 10,000 2,000$ (8,000) -80.0%
Leasehold Improvements -$ 150,000$ 150,000 10,000$ (140,000) -93.3%
Change in Fixed Assets 11,822$ 222,436$ 210,614$ 1781.6% 540,630$ 318,195$ 143.1%
TOTAL CHANGE IN ASSETS (2,270,128)$ $0 2,270,128$ -100.0% $0 -$
Statement of Activities
2013 and 2014 Projections

Section B — Supplemental Financial Information Breakdown of Statement of Activities
2012 ReliabilityFirst Corporation Business Plan and Budget Approved by Board of Directors: April 22, 2011 for Stakeholder CommentJuly 8, 2011 163
Formatted: Font color: Text 1
2012 2013 $ Change
%
Change 2014 $ Change
%
Change
Budget Projection 12 v 13 12 v 13 Projection 13 v 14 13 v 14
Funding
ERO Funding
ERO Assessments 13,577,272$ 18,407,868$ 4,830,595$ 35.6% 19,853,110$ 1,445,243$ 7.9%
Penalty Sanctions 785,100$ -$ (785,100) -100.0% -$ -
Total ERO Funding 14,362,372$ 18,407,868$ 4,045,495$ 28.2% 19,853,110$ 1,445,243$ 7.9%
Membership Dues - -$ - -$ -
Federal Grants - -$ - -$ -
Services & Software - -$ - -$ -
Workshops - -$ - -$ -
Interest 60,000 60,000$ - 0.0% 60,000$ - 0.0%
Miscellaneous - -$ - -$ -
Total Funding 14,422,372$ 18,467,868$ 4,045,495$ 28.1% 19,913,110$ 1,445,243$ 7.8%
Expenses
Personnel Expenses
Salaries 9,637,622 10,726,837$ 1,089,215 11.3% 11,795,469$ 1,068,632 10.0%
Payroll Taxes 581,453 654,257$ 72,804 12.5% 705,195$ 50,938 7.8%
Benefits 1,283,552 1,432,245$ 148,693 11.6% 1,686,525$ 254,280 17.8%
Retirement Costs 1,471,658 1,676,294$ 204,636 13.9% 1,839,275$ 162,981 9.7%
Total Personnel Expenses 12,974,285$ 14,489,633$ 1,515,348$ 11.7% 16,026,464$ 1,536,831$ 10.6%
Meeting Expenses
Meetings 144,630$ 151,862$ 7,232$ 5.0% 159,455$ 7,593 5.0%
Travel 686,950$ 721,298$ 34,348 5.0% 757,362$ 36,065 5.0%
Conference Calls 10,176$ 10,685$ 509 5.0% 11,219$ 534 5.0%
Total Meeting Expenses 841,756$ 883,844$ 42,088$ 5.0% 928,036$ 44,192$ 5.0%
Operating Expenses
Consultants & Contracts 514,100$ 539,805$ 25,705 5.0% 566,795$ 26,990 5.0%
Office Rent 531,460$ 697,542$ 166,081 31.3% 732,419$ 34,877 5.0%
Office Costs 772,146$ 972,904$ 200,758 26.0% 1,021,550$ 48,645 5.0%
Professional Services 500,432$ 525,454$ 25,022 5.0% 551,726$ 26,273 5.0%
Miscellaneous 27,320$ 28,686$ 1,366 5.0% 30,120$ 1,434 5.0%
Depreciation 510,594$ 556,547$ 45,953 9.0% 601,071$ 44,524 8.0%
Total Operating Expenses 2,856,052 3,320,938 464,885 16.3% 3,503,681 182,743 5.5%
Other Non-Operating Expenses -$ -$ -$ -$ -$
Total Expenses 16,672,093$ 18,694,414$ 2,022,321$ 12.1% 20,458,181$ 1,763,766 9.4%
Change in Assets (2,249,721)$ (226,547)$ 2,023,174$ -89.9% (545,071)$ (318,524)$ 140.6%
Fixed Assets
Depreciation (510,594)$ (556,547)$ (45,953) 9.0% (601,071)$ (44,524) 8.0%
Computer & Software CapEx 531,000$ 80,000$ (451,000) -84.9% 40,000$ (40,000) -50.0%
Furniture & Fixtures CapEx -$ 90,000$ 90,000 4,000$ (86,000) -95.6%
Equipment CapEx -$ 10,000$ 10,000 2,000$ (8,000) -80.0%
Leasehold Improvements -$ 150,000$ 150,000 10,000$ (140,000) -93.3%
Change in Fixed Assets (20,406)$ 226,547$ 246,953$ -1210.2% 545,071$ 318,524$ 140.6%
TOTAL CHANGE IN ASSETS (2,270,128)$ $0 2,270,128$ -100.0% $0 (0)$
Statement of Activities
2013 and 2014 Projections

Section B — Supplemental Financial Information Breakdown of Statement of Activities
2012 ReliabilityFirst Corporation Business Plan and Budget Approved by Board of Directors: April 22, 2011 for Stakeholder CommentJuly 8, 2011 164
Formatted: Font color: Text 1
2012 2013 $ Change
%
Change 2014 $ Change
%
Change
Budget Projection 12 v 13 12 v 13 Projection 13 v 14 13 v 14
Funding
ERO Funding
ERO Assessments 13,577,272$ 18,407,868$ 4,830,595$ 35.6% 19,853,110$ 1,445,243$ 7.9%
Penalty Sanctions 785,100$ -$ (785,100) -100.0% -$ -
Total ERO Funding 14,362,372$ 18,407,868$ 4,045,495$ 28.2% 19,853,110$ 1,445,243$ 7.9%
Membership Dues - -$ - -$ -
Federal Grants - -$ - -$ -
Services & Software - -$ - -$ -
Workshops - -$ - -$ -
Interest 60,000 60,000$ - 0.0% 60,000$ - 0.0%
Miscellaneous - -$ - -$ -
Total Funding 14,422,372$ 18,467,868$ 4,045,495$ 28.1% 19,913,110$ 1,445,243$ 7.8%
Expenses
Personnel Expenses
Salaries 9,637,622 10,726,837$ 1,089,215 11.3% 11,795,469$ 1,068,632 10.0%
Payroll Taxes 581,453 654,257$ 72,804 12.5% 705,195$ 50,938 7.8%
Benefits 1,283,552 1,432,245$ 148,693 11.6% 1,686,525$ 254,280 17.8%
Retirement Costs 1,471,658 1,676,294$ 204,636 13.9% 1,839,275$ 162,981 9.7%
Total Personnel Expenses 12,974,285$ 14,489,633$ 1,515,348$ 11.7% 16,026,464$ 1,536,831$ 10.6%
Meeting Expenses
Meetings 144,630$ 151,862$ 7,232$ 5.0% 159,455$ 7,593 5.0%
Travel 686,950$ 721,298$ 34,348 5.0% 757,362$ 36,065 5.0%
Conference Calls 10,176$ 10,685$ 509 5.0% 11,219$ 534 5.0%
Total Meeting Expenses 841,756$ 883,844$ 42,088$ 5.0% 928,036$ 44,192$ 5.0%
Operating Expenses
Consultants & Contracts 514,100$ 539,805$ 25,705 5.0% 566,795$ 26,990 5.0%
Office Rent 531,460$ 697,542$ 166,081 31.3% 732,419$ 34,877 5.0%
Office Costs 772,146$ 972,904$ 200,758 26.0% 1,021,550$ 48,645 5.0%
Professional Services 500,432$ 525,454$ 25,022 5.0% 551,726$ 26,273 5.0%
Miscellaneous 27,320$ 28,686$ 1,366 5.0% 30,120$ 1,434 5.0%
Depreciation 510,594$ 556,547$ 45,953 9.0% 601,071$ 44,524 8.0%
Total Operating Expenses 2,856,052 3,320,938 464,885 16.3% 3,503,681 182,743 5.5%
Other Non-Operating Expenses -$ -$ -$ -$ -$
Total Expenses 16,672,093$ 18,694,414$ 2,022,321$ 12.1% 20,458,181$ 1,763,766 9.4%
Change in Assets (2,249,721)$ (226,547)$ 2,023,174$ -89.9% (545,071)$ (318,524)$ 140.6%
Fixed Assets
Depreciation (510,594)$ (556,547)$ (45,953) 9.0% (601,071)$ (44,524) 8.0%
Computer & Software CapEx 531,000$ 80,000$ (451,000) -84.9% 40,000$ (40,000) -50.0%
Furniture & Fixtures CapEx -$ 90,000$ 90,000 4,000$ (86,000) -95.6%
Equipment CapEx -$ 10,000$ 10,000 2,000$ (8,000) -80.0%
Leasehold Improvements -$ 150,000$ 150,000 10,000$ (140,000) -93.3%
Change in Fixed Assets (20,406)$ 226,547$ 246,953$ -1210.2% 545,071$ 318,524$ 140.6%
TOTAL CHANGE IN ASSETS (2,270,128)$ $0 2,270,128$ -100.0% $0 (0)$
Statement of Activities
2013 and 2014 Projections

Section B — Supplemental Financial Information Breakdown of Statement of Activities
2012 ReliabilityFirst Corporation Business Plan and Budget Approved by Board of Directors: April 22, 2011 for Stakeholder CommentJuly 8, 2011 165
Formatted: Font color: Text 1
2013 and 2014 Projection Analysis The 2012 and 2013 projections are estimates based upon current projections of the 2012-13
workload and resource requirements. These projections will be reviewed / revised as necessary
when the requisite budgets are created for years 2012 and 2013 respectively, and more accurate
input assumptions become available. 2013 Assumptions: Personnel Expenses are expected to increase due to eight (8) additional FTEs to support the CIP version V4 standards assuming FERC approved. Also included is four percent (4%) increase in labor rates that include salary adjustments, market adjustments and promotions. Benefits will increase due to a twelve percent (12%) rise in health care premiums. All expenses not related to office space and personnel expenses are expected to increase five percent (5%). It is expected additional office space will be needed for new personnel, which includes office equipment and improvements. 2014 Assumptions: Personnel expenses are expected to increase due to four (4) additional FTEs. Also included is a four percent (4%) increase in labor rates that include salary adjustments, market adjustments and promotions. Benefits will increase due to a twelve percent (12%) rise in health care premiums. All expenses not related to personnel expenses are expected to increase five percent (5%), due to estimating for normal yearly increases.
Formatted: Font: (Default) Arial, Font color:Auto
Formatted: Font: Not Bold
2012 ReliabilityFirst Corporation Business Plan and Budget Approved by Board of Directors: April 22, 2011 for Stakeholder Comment 72
Formatted: Font color: Text 1
SSeeccttiioonn CC –– NNoonn--SSttaattuuttoorryy AAccttiivviittiieess
22001122 BBuussiinneessss PPllaann aanndd BBuuddggeett

Section C – Non – Statutory Activities
2012 ReliabilityFirst Corporation Business Plan and Budget Approved by Board of Directors: April 22, 2011 for Stakeholder CommentJuly 8, 2011 167
Formatted: Font color: Text 1
Section C — Non-Statutory Activities ReliabilityFirst performed only those functions delegated to it by the ERO in 2011 and the organization does not intend to perform any functions outside its ERO delegated activities in 2012, therefore Section C is not applicable.

2012 ReliabilityFirst Corporation Business Plan and Budget Approved by Board of Directors: April 22, 2011 for Stakeholder CommentJuly 8, 2011 168
Formatted: Font color: Text 1
SSeeccttiioonn DD –– SSuupppplleemmeennttaall IInnffoorrmmaattiioonn
22001122 BBuussiinneessss PPllaann aanndd BBuuddggeett

Section D — Supplemental Information
2012 ReliabilityFirst Corporation Business Plan and Budget
Approved by Board of Directors: April 22, 2011 for Stakeholder CommentJuly 8, 2011 169
Formatted: Space Before: 0 pt, Tab stops: 3", Centered + 6.38", Right + Not at 9.75"
Formatted: Space Before: 0 pt, Tab stops: 3", Centered + 6.38", Right + 9.88", Right +Not at 9.75"
Formatted: Font color: Text 1
Section D — Supplemental Information
2012 Organizational Chart
Formatted: Font: Times New Roman, Nounderline, Font color: Auto
Formatted: Centered
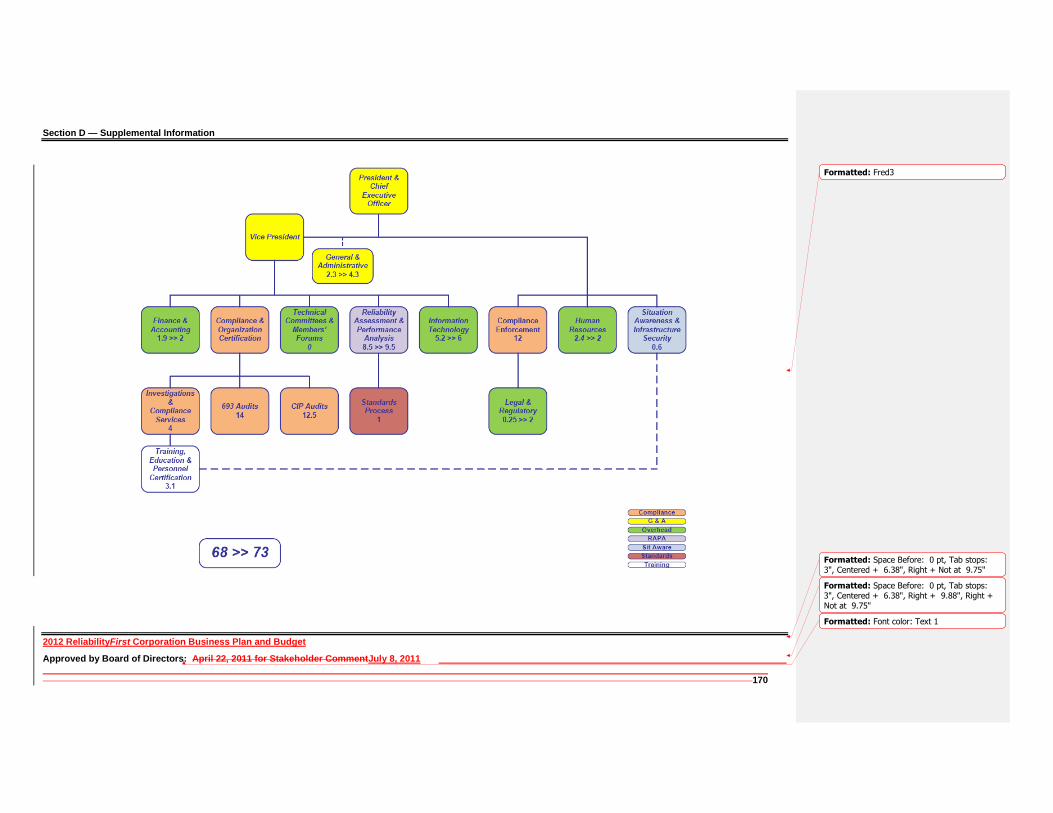
Section D — Supplemental Information
2012 ReliabilityFirst Corporation Business Plan and Budget
Approved by Board of Directors: April 22, 2011 for Stakeholder CommentJuly 8, 2011 170
Formatted: Space Before: 0 pt, Tab stops: 3", Centered + 6.38", Right + Not at 9.75"
Formatted: Space Before: 0 pt, Tab stops: 3", Centered + 6.38", Right + 9.88", Right +Not at 9.75"
Formatted: Font color: Text 1
Formatted: Fred3
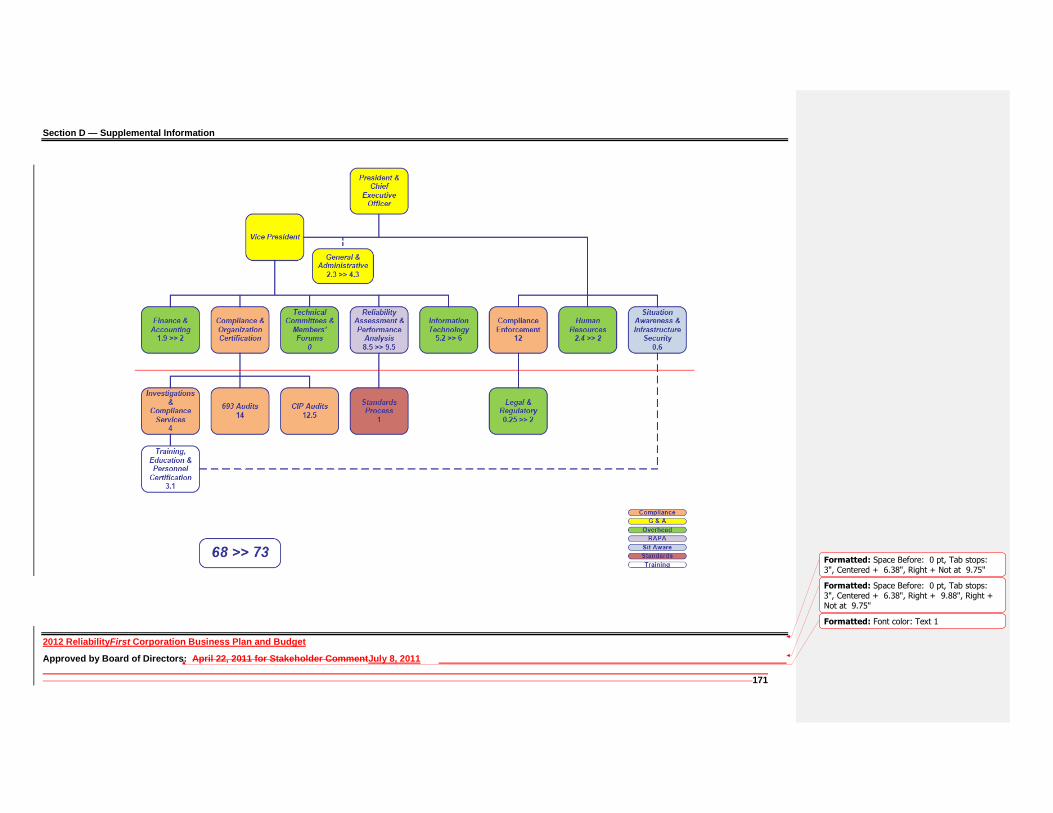
Section D — Supplemental Information
2012 ReliabilityFirst Corporation Business Plan and Budget
Approved by Board of Directors: April 22, 2011 for Stakeholder CommentJuly 8, 2011 171
Formatted: Space Before: 0 pt, Tab stops: 3", Centered + 6.38", Right + Not at 9.75"
Formatted: Space Before: 0 pt, Tab stops: 3", Centered + 6.38", Right + 9.88", Right +Not at 9.75"
Formatted: Font color: Text 1

Section D — Supplemental Information
2012 ReliabilityFirst Corporation Business Plan and Budget
Approved by Board of Directors: April 22, 2011 for Stakeholder Comment: July 8, 2011 172
Formatted: Space Before: 0 pt
Statement of Financial Position

Section D — Supplemental Information
2012 ReliabilityFirst Corporation Business Plan and Budget
Approved by Board of Directors: April 22, 2011 for Stakeholder CommentJuly 8, 2011 173
Formatted: Space Before: 0 pt, Tab stops: 3", Centered + 6.38", Right + Not at 9.75"
Formatted: Space Before: 0 pt, Tab stops: 3", Centered + 6.38", Right + 9.88", Right +Not at 9.75"
Formatted: Font color: Text 1
(Per Audit) Projected Budget
31-Dec-10 31-Dec-11 31-Dec-12
ASSETS
Cash 8,070,112 6,480,368 4,210,240
Accounts receivable, net of allowance for uncollectible accounts 74,247 40,000 40,000
Other receivables - - -
Prepaid expenses and other current assets 283,318 220,000 220,000
Security deposit - - -
Cash value of insurance policies - - -
Property and equipment 1,476,979 1,550,828 1,628,369
Total Assets 9,904,656 8,291,196 6,098,609
LIABILITIES AND NET ASSETS
Current Liabilities
Accounts payable and accrued expenses 2,440,905 2,500,000 2,500,000
Deferred income - - -
Regional assessments collected in advance - - -
Deferred compensation - - -
Accrued retirement liabilities - - -
Total Current Liabilities 2,440,905 2,500,000 2,500,000
Long Term Liabilities
Accrued expenses 190,046 166,388 288,852
Total Long Term Liabilities 190,046 166,388 288,852
Net Assets - unrestricted 6,083,805 5,717,645 3,309,758
Net Assets - restricted 1,189,900 618,100 -
Total Liabilities and Net Assets 9,904,656 8,384,033 6,098,610
Statement of Financial Position
2010 Audited, 2011 Projection, and 2012 Budget
STATUTORY and NON-STATUTORY
Field Code Changed
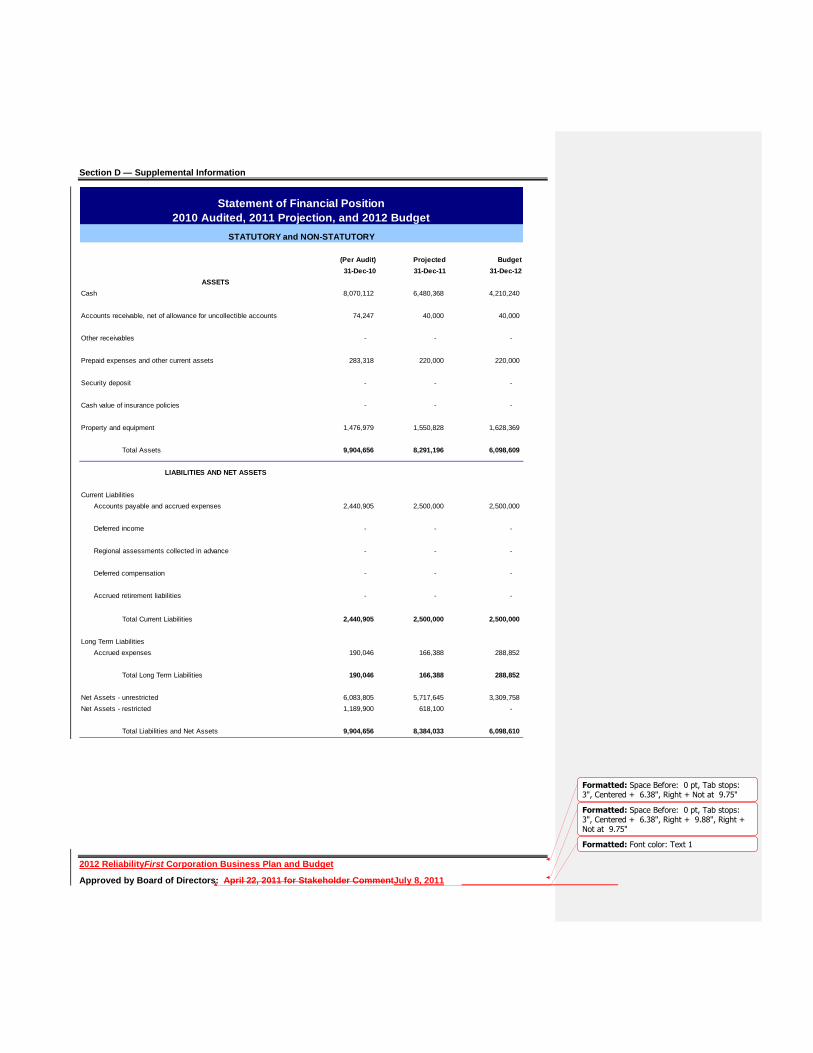
Section D — Supplemental Information
2012 ReliabilityFirst Corporation Business Plan and Budget
Approved by Board of Directors: April 22, 2011 for Stakeholder CommentJuly 8, 2011 174
Formatted: Space Before: 0 pt, Tab stops: 3", Centered + 6.38", Right + Not at 9.75"
Formatted: Space Before: 0 pt, Tab stops: 3", Centered + 6.38", Right + 9.88", Right +Not at 9.75"
Formatted: Font color: Text 1
(Per Audit) Projected Budget
31-Dec-10 31-Dec-11 31-Dec-12
ASSETS
Cash 8,070,112 6,480,368 4,210,240
Accounts receivable, net of allowance for uncollectible accounts 74,247 40,000 40,000
Other receivables - - -
Prepaid expenses and other current assets 283,318 220,000 220,000
Security deposit - - -
Cash value of insurance policies - - -
Property and equipment 1,476,979 1,550,828 1,628,369
Total Assets 9,904,656 8,291,196 6,098,609
LIABILITIES AND NET ASSETS
Current Liabilities
Accounts payable and accrued expenses 2,440,905 2,500,000 2,500,000
Deferred income - - -
Regional assessments collected in advance - - -
Deferred compensation - - -
Accrued retirement liabilities - - -
Total Current Liabilities 2,440,905 2,500,000 2,500,000
Long Term Liabilities
Accrued expenses 190,046 166,388 288,852
Total Long Term Liabilities 190,046 166,388 288,852
Net Assets - unrestricted 6,083,805 5,717,645 3,309,758
Net Assets - restricted 1,189,900 618,100 -
Total Liabilities and Net Assets 9,904,656 8,384,033 6,098,610
Statement of Financial Position
2010 Audited, 2011 Projection, and 2012 Budget
STATUTORY and NON-STATUTORY
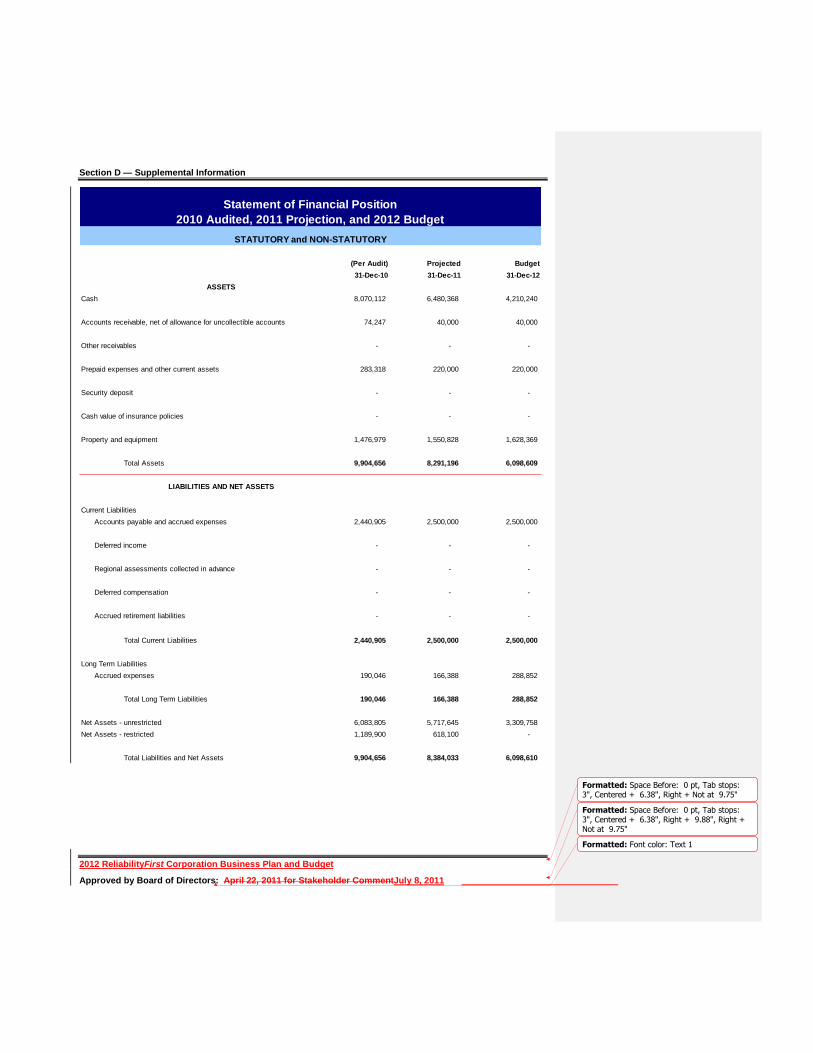
Section D — Supplemental Information
2012 ReliabilityFirst Corporation Business Plan and Budget
Approved by Board of Directors: April 22, 2011 for Stakeholder CommentJuly 8, 2011 175
Formatted: Space Before: 0 pt, Tab stops: 3", Centered + 6.38", Right + Not at 9.75"
Formatted: Space Before: 0 pt, Tab stops: 3", Centered + 6.38", Right + 9.88", Right +Not at 9.75"
Formatted: Font color: Text 1
(Per Audit) Projected Budget
31-Dec-10 31-Dec-11 31-Dec-12
ASSETS
Cash 8,070,112 6,480,368 4,210,240
Accounts receivable, net of allowance for uncollectible accounts 74,247 40,000 40,000
Other receivables - - -
Prepaid expenses and other current assets 283,318 220,000 220,000
Security deposit - - -
Cash value of insurance policies - - -
Property and equipment 1,476,979 1,550,828 1,628,369
Total Assets 9,904,656 8,291,196 6,098,609
LIABILITIES AND NET ASSETS
Current Liabilities
Accounts payable and accrued expenses 2,440,905 2,500,000 2,500,000
Deferred income - - -
Regional assessments collected in advance - - -
Deferred compensation - - -
Accrued retirement liabilities - - -
Total Current Liabilities 2,440,905 2,500,000 2,500,000
Long Term Liabilities
Accrued expenses 190,046 166,388 288,852
Total Long Term Liabilities 190,046 166,388 288,852
Net Assets - unrestricted 6,083,805 5,717,645 3,309,758
Net Assets - restricted 1,189,900 618,100 -
Total Liabilities and Net Assets 9,904,656 8,384,033 6,098,610
Statement of Financial Position
2010 Audited, 2011 Projection, and 2012 Budget
STATUTORY and NON-STATUTORY

Section D — Supplemental Information
2012 ReliabilityFirst Corporation Business Plan and Budget
Approved by Board of Directors: April 22, 2011 for Stakeholder CommentJuly 8, 2011 176
Formatted: Space Before: 0 pt, Tab stops: 3", Centered + 6.38", Right + Not at 9.75"
Formatted: Space Before: 0 pt, Tab stops: 3", Centered + 6.38", Right + 9.88", Right +Not at 9.75"
Formatted: Font color: Text 1
(Per Audit) Projected Budget
31-Dec-10 31-Dec-11 31-Dec-12
ASSETS
Cash 8,070,112 6,480,368 4,210,240
Accounts receivable, net of allowance for uncollectible accounts 74,247 40,000 40,000
Other receivables - - -
Prepaid expenses and other current assets 283,318 220,000 220,000
Security deposit - - -
Cash value of insurance policies - - -
Property and equipment 1,476,979 1,550,828 1,628,369
Total Assets 9,904,656 8,291,196 6,098,609
LIABILITIES AND NET ASSETS
Current Liabilities
Accounts payable and accrued expenses 2,440,905 2,500,000 2,500,000
Deferred income - - -
Regional assessments collected in advance - - -
Deferred compensation - - -
Accrued retirement liabilities - - -
Total Current Liabilities 2,440,905 2,500,000 2,500,000
Long Term Liabilities
Accrued expenses 190,046 166,388 288,852
Total Long Term Liabilities 190,046 166,388 288,852
Net Assets - unrestricted 6,083,805 5,717,645 3,309,758
Net Assets - restricted 1,189,900 618,100 -
Total Liabilities and Net Assets 9,904,656 8,384,033 6,098,610
Statement of Financial Position
2010 Audited, 2011 Projection, and 2012 Budget
STATUTORY and NON-STATUTORY
Section D — Supplemental Information
2012 ReliabilityFirst Corporation Business Plan and Budget
Approved by Board of Directors: April 22, 2011 for Stakeholder CommentJuly 8, 2011 177
Formatted: Space Before: 0 pt, Tab stops: 3", Centered + 6.38", Right + Not at 9.75"
Formatted: Space Before: 0 pt, Tab stops: 3", Centered + 6.38", Right + 9.88", Right +Not at 9.75"
Formatted: Font color: Text 1
Statement of Activities Formatted: Top: 0.75"
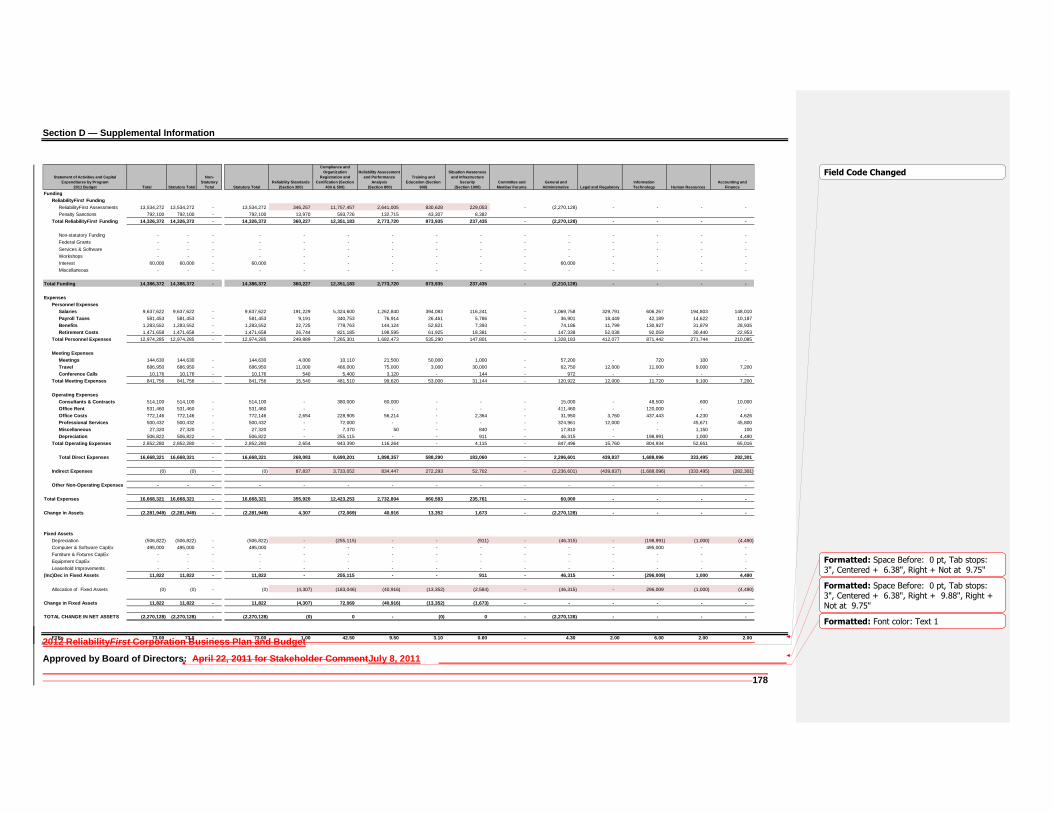
Section D — Supplemental Information
2012 ReliabilityFirst Corporation Business Plan and Budget
Approved by Board of Directors: April 22, 2011 for Stakeholder CommentJuly 8, 2011 178
Formatted: Space Before: 0 pt, Tab stops: 3", Centered + 6.38", Right + Not at 9.75"
Formatted: Space Before: 0 pt, Tab stops: 3", Centered + 6.38", Right + 9.88", Right +Not at 9.75"
Formatted: Font color: Text 1
Total Statutory Total
Non-
Statutory
Total Statutory Total
Reliability Standards
(Section 300)
Compliance and
Organization
Registration and
Certification (Section
400 & 500)
Reliability Assessment
and Performance
Analysis
(Section 800)
Training and
Education (Section
900)
Situation Awareness
and Infrastructure
Security
(Section 1000)
Committee and
Member Forums
General and
Administrative Legal and Regulatory
Information
Technology Human Resources
Accounting and
Finance
Funding
ReliabilityFirst Funding
ReliabilityFirst Assessments 13,534,272 13,534,272 - 13,534,272 346,257 11,757,457 2,641,005 830,628 229,053 - (2,270,128) - - - -
Penalty Sanctions 792,100 792,100 - 792,100 13,970 593,726 132,715 43,307 8,382
Total ReliabilityFirst Funding 14,326,372 14,326,372 - 14,326,372 360,227 12,351,183 2,773,720 873,935 237,435 - (2,270,128) - - - -
Non-statutory Funding - - - - - - - - - - - - - - -
Federal Grants - - - - - - - - - - - - - - -
Services & Software - - - - - - - - - - - - - - -
Workshops - - - - - - - - - - - - - - -
Interest 60,000 60,000 - 60,000 - - - - - - 60,000 - - - -
Miscellaneous - - - - - - - - - - - - - - -
Total Funding 14,386,372 14,386,372 - 14,386,372 360,227 12,351,183 2,773,720 873,935 237,435 - (2,210,128) - - - -
Expenses
Personnel Expenses
Salaries 9,637,622 9,637,622 - 9,637,622 191,229 5,324,600 1,262,840 394,083 116,241 - 1,069,758 329,791 606,267 194,803 148,010
Payroll Taxes 581,453 581,453 - 581,453 9,191 340,753 76,914 26,461 5,786 - 36,901 18,449 42,189 14,622 10,187
Benefits 1,283,552 1,283,552 - 1,283,552 22,725 778,763 144,124 52,821 7,393 - 74,186 11,799 130,927 31,879 28,935
Retirement Costs 1,471,658 1,471,658 - 1,471,658 26,744 821,185 198,595 61,925 18,381 - 147,338 52,038 92,059 30,440 22,953
Total Personnel Expenses 12,974,285 12,974,285 - 12,974,285 249,889 7,265,301 1,682,473 535,290 147,801 - 1,328,183 412,077 871,442 271,744 210,085
Meeting Expenses
Meetings 144,630 144,630 - 144,630 4,000 10,110 21,500 50,000 1,000 - 57,200 - 720 100 -
Travel 686,950 686,950 - 686,950 11,000 466,000 75,000 3,000 30,000 - 62,750 12,000 11,000 9,000 7,200
Conference Calls 10,176 10,176 - 10,176 540 5,400 3,120 - 144 - 972 - - - -
Total Meeting Expenses 841,756 841,756 - 841,756 15,540 481,510 99,620 53,000 31,144 - 120,922 12,000 11,720 9,100 7,200
Operating Expenses
Consultants & Contracts 514,100 514,100 - 514,100 - 380,000 60,000 - - - 15,000 - 48,500 600 10,000
Office Rent 531,460 531,460 - 531,460 - - - - - - 411,460 - 120,000 - -
Office Costs 772,146 772,146 - 772,146 2,654 228,905 56,214 - 2,364 - 31,950 3,760 437,443 4,230 4,626
Professional Services 500,432 500,432 - 500,432 - 72,000 - - - - 324,961 12,000 - 45,671 45,800
Miscellaneous 27,320 27,320 - 27,320 - 7,370 50 - 840 - 17,810 - - 1,150 100
Depreciation 506,822 506,822 - 506,822 - 255,115 - - 911 - 46,315 - 198,991 1,000 4,490
Total Operating Expenses 2,852,280 2,852,280 - 2,852,280 2,654 943,390 116,264 - 4,115 - 847,496 15,760 804,934 52,651 65,016
Total Direct Expenses 16,668,321 16,668,321 - 16,668,321 268,083 8,690,201 1,898,357 588,290 183,060 - 2,296,601 439,837 1,688,096 333,495 282,301
Indirect Expenses (0) (0) - (0) 87,837 3,733,052 834,447 272,293 52,702 - (2,236,601) (439,837) (1,688,096) (333,495) (282,301)
Other Non-Operating Expenses - - - - - - - - - - - - - - -
Total Expenses 16,668,321 16,668,321 - 16,668,321 355,920 12,423,253 2,732,804 860,583 235,761 - 60,000 - - - -
Change in Assets (2,281,949) (2,281,949) - (2,281,949) 4,307 (72,069) 40,916 13,352 1,673 - (2,270,128) - - - -
Fixed Assets
Depreciation (506,822) (506,822) - (506,822) - (255,115) - - (911) - (46,315) - (198,991) (1,000) (4,490)
Computer & Software CapEx 495,000 495,000 - 495,000 - - - - - - - - 495,000 - -
Furniture & Fixtures CapEx - - - - - - - - - - - - - - -
Equipment CapEx - - - - - - - - - - - - - - -
Leasehold Improvements - - - - - - - - - - - - - - -
(Inc)Dec in Fixed Assets 11,822 11,822 - 11,822 - 255,115 - - 911 - 46,315 - (296,009) 1,000 4,490
Allocation of Fixed Assets (0) (0) - (0) (4,307) (183,046) (40,916) (13,352) (2,584) - (46,315) - 296,009 (1,000) (4,490)
Change in Fixed Assets 11,822 11,822 - 11,822 (4,307) 72,069 (40,916) (13,352) (1,673) - - - - - -
TOTAL CHANGE IN NET ASSETS (2,270,128) (2,270,128) - (2,270,128) (0) 0 - (0) 0 - (2,270,128) - - - -
FTEs 73.00 73.0 - 73.00 1.00 42.50 9.50 3.10 0.60 - 4.30 2.00 6.00 2.00 2.00
Statement of Activities and Capital
Expenditures by Program
2011 Budget
Field Code Changed

Section D — Supplemental Information
2012 ReliabilityFirst Corporation Business Plan and Budget
Approved by Board of Directors: April 22, 2011 for Stakeholder CommentJuly 8, 2011 179
Formatted: Space Before: 0 pt, Tab stops: 3", Centered + 6.38", Right + Not at 9.75"
Formatted: Space Before: 0 pt, Tab stops: 3", Centered + 6.38", Right + 9.88", Right +Not at 9.75"
Formatted: Font color: Text 1
Total Statutory Total
Non-
Statutory
Total Statutory Total
Reliability Standards
(Section 300)
Compliance and
Organization
Registration and
Certification (Section
400 & 500)
Reliability Assessment
and Performance
Analysis
(Section 800)
Training and
Education (Section
900)
Situation Awareness
and Infrastructure
Security
(Section 1000)
Committee and
Member Forums
General and
Administrative Legal and Regulatory
Information
Technology Human Resources
Accounting and
Finance
Funding
ReliabilityFirst Funding
ReliabilityFirst Assessments 13,541,272 13,541,272 - 13,541,272 346,380 11,762,704 2,642,178 831,011 229,127 - (2,270,128) - - - -
Penalty Sanctions 785,100 785,100 - 785,100 13,847 588,479 131,542 42,924 8,308
Total ReliabilityFirst Funding 14,326,372 14,326,372 - 14,326,372 360,227 12,351,183 2,773,720 873,935 237,435 - (2,270,128) - - - -
Non-statutory Funding - - - - - - - - - - - - - - -
Federal Grants - - - - - - - - - - - - - - -
Services & Software - - - - - - - - - - - - - - -
Workshops - - - - - - - - - - - - - - -
Interest 60,000 60,000 - 60,000 - - - - - - 60,000 - - - -
Miscellaneous - - - - - - - - - - - - - - -
Total Funding 14,386,372 14,386,372 - 14,386,372 360,227 12,351,183 2,773,720 873,935 237,435 - (2,210,128) - - - -
Expenses
Personnel Expenses
Salaries 9,637,622 9,637,622 - 9,637,622 191,229 5,324,600 1,262,840 394,083 116,241 - 1,069,758 329,791 606,267 194,803 148,010
Payroll Taxes 581,453 581,453 - 581,453 9,191 340,753 76,914 26,461 5,786 - 36,901 18,449 42,189 14,622 10,187
Benefits 1,283,552 1,283,552 - 1,283,552 22,725 778,763 144,124 52,821 7,393 - 74,186 11,799 130,927 31,879 28,935
Retirement Costs 1,471,658 1,471,658 - 1,471,658 26,744 821,185 198,595 61,925 18,381 - 147,338 52,038 92,059 30,440 22,953
Total Personnel Expenses 12,974,285 12,974,285 - 12,974,285 249,889 7,265,301 1,682,473 535,290 147,801 - 1,328,183 412,077 871,442 271,744 210,085
Meeting Expenses
Meetings 144,630 144,630 - 144,630 4,000 10,110 21,500 50,000 1,000 - 57,200 - 720 100 -
Travel 686,950 686,950 - 686,950 11,000 466,000 75,000 3,000 30,000 - 62,750 12,000 11,000 9,000 7,200
Conference Calls 10,176 10,176 - 10,176 540 5,400 3,120 - 144 - 972 - - - -
Total Meeting Expenses 841,756 841,756 - 841,756 15,540 481,510 99,620 53,000 31,144 - 120,922 12,000 11,720 9,100 7,200
Operating Expenses
Consultants & Contracts 514,100 514,100 - 514,100 - 380,000 60,000 - - - 15,000 - 48,500 600 10,000
Office Rent 531,460 531,460 - 531,460 - - - - - - 411,460 - 120,000 - -
Office Costs 772,146 772,146 - 772,146 2,654 228,905 56,214 - 2,364 - 31,950 3,760 437,443 4,230 4,626
Professional Services 500,432 500,432 - 500,432 - 72,000 - - - - 324,961 12,000 - 45,671 45,800
Miscellaneous 27,320 27,320 - 27,320 - 7,370 50 - 840 - 17,810 - - 1,150 100
Depreciation 506,822 506,822 - 506,822 - 255,115 - - 911 - 46,315 - 198,991 1,000 4,490
Total Operating Expenses 2,852,280 2,852,280 - 2,852,280 2,654 943,390 116,264 - 4,115 - 847,496 15,760 804,934 52,651 65,016
Total Direct Expenses 16,668,321 16,668,321 - 16,668,321 268,083 8,690,201 1,898,357 588,290 183,060 - 2,296,601 439,837 1,688,096 333,495 282,301
Indirect Expenses (0) (0) - (0) 87,837 3,733,052 834,447 272,293 52,702 - (2,236,601) (439,837) (1,688,096) (333,495) (282,301)
Other Non-Operating Expenses - - - - - - - - - - - - - - -
Total Expenses 16,668,321 16,668,321 - 16,668,321 355,920 12,423,253 2,732,804 860,583 235,761 - 60,000 - - - -
Change in Assets (2,281,949) (2,281,949) - (2,281,949) 4,307 (72,069) 40,916 13,352 1,673 - (2,270,128) - - - -
Fixed Assets
Depreciation (506,822) (506,822) - (506,822) - (255,115) - - (911) - (46,315) - (198,991) (1,000) (4,490)
Computer & Software CapEx 495,000 495,000 - 495,000 - - - - - - - - 495,000 - -
Furniture & Fixtures CapEx - - - - - - - - - - - - - - -
Equipment CapEx - - - - - - - - - - - - - - -
Leasehold Improvements - - - - - - - - - - - - - - -
(Inc)Dec in Fixed Assets 11,822 11,822 - 11,822 - 255,115 - - 911 - 46,315 - (296,009) 1,000 4,490
Allocation of Fixed Assets (0) (0) - (0) (4,307) (183,046) (40,916) (13,352) (2,584) - (46,315) - 296,009 (1,000) (4,490)
Change in Fixed Assets 11,822 11,822 - 11,822 (4,307) 72,069 (40,916) (13,352) (1,673) - - - - - -
TOTAL CHANGE IN NET ASSETS (2,270,128) (2,270,128) - (2,270,128) (0) 0 - (0) 0 - (2,270,128) - - - -
FTEs 73.00 73.0 - 73.00 1.00 42.50 9.50 3.10 0.60 - 4.30 2.00 6.00 2.00 2.00
Statement of Activities and Capital
Expenditures by Program
2011 Budget

Section D — Supplemental Information
2012 ReliabilityFirst Corporation Business Plan and Budget
Approved by Board of Directors: April 22, 2011 for Stakeholder CommentJuly 8, 2011 180
Formatted: Space Before: 0 pt, Tab stops: 3", Centered + 6.38", Right + Not at 9.75"
Formatted: Space Before: 0 pt, Tab stops: 3", Centered + 6.38", Right + 9.88", Right +Not at 9.75"
Formatted: Font color: Text 1
Total Statutory Total
Non-
Statutory
Total Statutory Total
Reliability Standards
(Section 300)
Compliance and
Organization
Registration and
Certification (Section
400 & 500)
Reliability Assessment
and Performance
Analysis
(Section 800)
Training and
Education (Section
900)
Situation Awareness
and Infrastructure
Security
(Section 1000)
Committee and
Member Forums
General and
Administrative Legal and Regulatory
Information
Technology Human Resources
Accounting and
Finance
Funding
ReliabilityFirst Funding
ReliabilityFirst Assessments 13,541,272 13,541,272 - 13,541,272 346,380 11,762,704 2,642,178 831,011 229,127 - (2,270,128) - - - -
Penalty Sanctions 785,100 785,100 - 785,100 13,847 588,479 131,542 42,924 8,308
Total ReliabilityFirst Funding 14,326,372 14,326,372 - 14,326,372 360,227 12,351,183 2,773,720 873,935 237,435 - (2,270,128) - - - -
Non-statutory Funding - - - - - - - - - - - - - - -
Federal Grants - - - - - - - - - - - - - - -
Services & Software - - - - - - - - - - - - - - -
Workshops - - - - - - - - - - - - - - -
Interest 60,000 60,000 - 60,000 - - - - - - 60,000 - - - -
Miscellaneous - - - - - - - - - - - - - - -
Total Funding 14,386,372 14,386,372 - 14,386,372 360,227 12,351,183 2,773,720 873,935 237,435 - (2,210,128) - - - -
Expenses
Personnel Expenses
Salaries 9,637,622 9,637,622 - 9,637,622 191,229 5,324,600 1,262,840 394,083 116,241 - 1,069,758 329,791 606,267 194,803 148,010
Payroll Taxes 581,453 581,453 - 581,453 9,191 340,753 76,914 26,461 5,786 - 36,901 18,449 42,189 14,622 10,187
Benefits 1,283,552 1,283,552 - 1,283,552 22,725 778,763 144,124 52,821 7,393 - 74,186 11,799 130,927 31,879 28,935
Retirement Costs 1,471,658 1,471,658 - 1,471,658 26,744 821,185 198,595 61,925 18,381 - 147,338 52,038 92,059 30,440 22,953
Total Personnel Expenses 12,974,285 12,974,285 - 12,974,285 249,889 7,265,301 1,682,473 535,290 147,801 - 1,328,183 412,077 871,442 271,744 210,085
Meeting Expenses
Meetings 144,630 144,630 - 144,630 4,000 10,110 21,500 50,000 1,000 - 57,200 - 720 100 -
Travel 686,950 686,950 - 686,950 11,000 466,000 75,000 3,000 30,000 - 62,750 12,000 11,000 9,000 7,200
Conference Calls 10,176 10,176 - 10,176 540 5,400 3,120 - 144 - 972 - - - -
Total Meeting Expenses 841,756 841,756 - 841,756 15,540 481,510 99,620 53,000 31,144 - 120,922 12,000 11,720 9,100 7,200
Operating Expenses
Consultants & Contracts 514,100 514,100 - 514,100 - 380,000 60,000 - - - 15,000 - 48,500 600 10,000
Office Rent 531,460 531,460 - 531,460 - - - - - - 411,460 - 120,000 - -
Office Costs 772,146 772,146 - 772,146 2,654 228,905 56,214 - 2,364 - 31,950 3,760 437,443 4,230 4,626
Professional Services 500,432 500,432 - 500,432 - 72,000 - - - - 324,961 12,000 - 45,671 45,800
Miscellaneous 27,320 27,320 - 27,320 - 7,370 50 - 840 - 17,810 - - 1,150 100
Depreciation 510,594 510,594 - 510,594 - 255,287 - - 25,911 - 46,315 - 177,591 1,000 4,490
Total Operating Expenses 2,856,052 2,856,052 - 2,856,052 2,654 943,562 116,264 - 29,115 - 847,496 15,760 783,534 52,651 65,016
Total Direct Expenses 16,672,093 16,672,093 - 16,672,093 268,083 8,690,373 1,898,357 588,290 208,060 - 2,296,601 439,837 1,666,696 333,495 282,301
Indirect Expenses (0) (0) - (0) 87,459 3,717,011 830,861 271,123 52,475 - (2,236,601) (439,837) (1,666,696) (333,495) (282,301)
Other Non-Operating Expenses - - - - - - - - - - - - - - -
Total Expenses 16,672,093 16,672,093 - 16,672,093 355,542 12,407,384 2,729,218 859,413 260,535 - 60,000 - - - -
Change in Assets (2,285,721) (2,285,721) - (2,285,721) 4,684 (56,201) 44,502 14,522 (23,100) - (2,270,128) - - - -
Fixed Assets
Depreciation (510,594) (510,594) - (510,594) - (255,287) - - (25,911) - (46,315) - (177,591) (1,000) (4,490)
Computer & Software CapEx 495,000 495,000 - 495,000 - - - - - - - - 495,000 - -
Furniture & Fixtures CapEx - - - - - - - - - - - - - - -
Equipment CapEx - - - - - - - - - - - - - - -
Leasehold Improvements - - - - - - - - - - - - - - -
(Inc)Dec in Fixed Assets 15,594 15,594 - 15,594 - 255,287 - - 25,911 - 46,315 - (317,409) 1,000 4,490
Allocation of Fixed Assets 0 0 - 0 (4,684) (199,086) (44,502) (14,522) (2,811) - (46,315) - 317,409 (1,000) (4,490)
Change in Fixed Assets 15,594 15,594 - 15,594 (4,684) 56,201 (44,502) (14,522) 23,100 - - - - - -
TOTAL CHANGE IN NET ASSETS (2,270,128) (2,270,128) - (2,270,128) (0) 0 0 - - - (2,270,128) - - - -
FTEs 73.00 73.0 - 73.00 1.00 42.50 9.50 3.10 0.60 - 4.30 2.00 6.00 2.00 2.00
Statement of Activities and Capital
Expenditures by Program
2011 Budget
Functions in Delegation Agreement

Section D — Supplemental Information
2012 ReliabilityFirst Corporation Business Plan and Budget
Approved by Board of Directors: April 22, 2011 for Stakeholder CommentJuly 8, 2011 181
Formatted: Space Before: 0 pt, Tab stops: 3", Centered + 6.38", Right + Not at 9.75"
Formatted: Space Before: 0 pt, Tab stops: 3", Centered + 6.38", Right + 9.88", Right +Not at 9.75"
Formatted: Font color: Text 1
Total Statutory Total
Non-
Statutory
Total Statutory Total
Reliability Standards
(Section 300)
Compliance and
Organization
Registration and
Certification (Section
400 & 500)
Reliability Assessment
and Performance
Analysis
(Section 800)
Training and
Education (Section
900)
Situation Awareness
and Infrastructure
Security
(Section 1000)
Committee and
Member Forums
General and
Administrative Legal and Regulatory
Information
Technology Human Resources
Accounting and
Finance
Funding
ReliabilityFirst Funding
ReliabilityFirst Assessments 13,577,272 13,577,272 - 13,577,272 340,490 11,512,352 2,586,216 812,750 595,592 - (2,270,128) - - - -
Penalty Sanctions 785,100 785,100 - 785,100 13,847 588,479 131,542 42,924 8,308
Total ReliabilityFirst Funding 14,362,372 14,362,372 - 14,362,372 354,336 12,100,831 2,717,759 855,674 603,900 - (2,270,128) - - - -
Non-statutory Funding - - - - - - - - - - - - - - -
Federal Grants - - - - - - - - - - - - - - -
Services & Software - - - - - - - - - - - - - - -
Workshops - - - - - - - - - - - - - - -
Interest 60,000 60,000 - 60,000 - - - - - - 60,000 - - - -
Miscellaneous - - - - - - - - - - - - - - -
Total Funding 14,422,372 14,422,372 - 14,422,372 354,336 12,100,831 2,717,759 855,674 603,900 - (2,210,128) - - - -
Expenses
Personnel Expenses
Salaries 9,637,622 9,637,622 - 9,637,622 191,229 5,324,600 1,262,840 394,083 116,241 - 1,069,758 329,791 606,267 194,803 148,010
Payroll Taxes 581,453 581,453 - 581,453 9,191 340,753 76,914 26,461 5,786 - 36,901 18,449 42,189 14,622 10,187
Benefits 1,283,552 1,283,552 - 1,283,552 22,725 778,763 144,124 52,821 7,393 - 74,186 11,799 130,927 31,879 28,935
Retirement Costs 1,471,658 1,471,658 - 1,471,658 26,744 821,185 198,595 61,925 18,381 - 147,338 52,038 92,059 30,440 22,953
Total Personnel Expenses 12,974,285 12,974,285 - 12,974,285 249,889 7,265,301 1,682,473 535,290 147,801 - 1,328,183 412,077 871,442 271,744 210,085
Meeting Expenses
Meetings 144,630 144,630 - 144,630 4,000 10,110 21,500 50,000 1,000 - 57,200 - 720 100 -
Travel 686,950 686,950 - 686,950 11,000 466,000 75,000 3,000 30,000 - 62,750 12,000 11,000 9,000 7,200
Conference Calls 10,176 10,176 - 10,176 540 5,400 3,120 - 144 - 972 - - - -
Total Meeting Expenses 841,756 841,756 - 841,756 15,540 481,510 99,620 53,000 31,144 - 120,922 12,000 11,720 9,100 7,200
Operating Expenses
Consultants & Contracts 514,100 514,100 - 514,100 - 380,000 60,000 - - - 15,000 - 48,500 600 10,000
Office Rent 531,460 531,460 - 531,460 - - - - 120,000 - 411,460 - - - -
Office Costs 772,146 772,146 - 772,146 2,654 228,905 56,214 - 2,364 - 31,950 3,760 437,443 4,230 4,626
Professional Services 500,432 500,432 - 500,432 - 72,000 - - - - 324,961 12,000 - 45,671 45,800
Miscellaneous 27,320 27,320 - 27,320 - 7,370 50 - 840 - 17,810 - - 1,150 100
Depreciation 510,594 510,594 - 510,594 - 255,287 - - 25,911 - 46,315 - 177,591 1,000 4,490
Total Operating Expenses 2,856,052 2,856,052 - 2,856,052 2,654 943,562 116,264 - 149,115 - 847,496 15,760 663,534 52,651 65,016
Total Direct Expenses 16,672,093 16,672,093 - 16,672,093 268,083 8,690,373 1,898,357 588,290 328,060 - 2,296,601 439,837 1,546,696 333,495 282,301
Indirect Expenses (0) (0) - (0) 85,343 3,627,064 810,755 264,562 51,206 - (2,236,601) (439,837) (1,546,696) (333,495) (282,301)
Other Non-Operating Expenses - - - - - - - - - - - - - - -
Total Expenses 16,672,093 16,672,093 - 16,672,093 353,426 12,317,437 2,709,113 852,853 379,265 - 60,000 - - - -
Change in Assets (2,249,721) (2,249,721) - (2,249,721) 910 (216,606) 8,646 2,821 224,635 - (2,270,128) - - - -
Fixed Assets
Depreciation (510,594) (510,594) - (510,594) - (255,287) - - (25,911) - (46,315) - (177,591) (1,000) (4,490)
Computer & Software CapEx 531,000 531,000 - 531,000 - - - - 250,000 - - - 281,000 - -
Furniture & Fixtures CapEx - - - - - - - - - - - - - - -
Equipment CapEx - - - - - - - - - - - - - - -
Leasehold Improvements - - - - - - - - - - - - - - -
(Inc)Dec in Fixed Assets (20,406) (20,406) - (20,406) - 255,287 - - (224,089) - 46,315 - (103,409) 1,000 4,490
Allocation of Fixed Assets - - - - (910) (38,681) (8,646) (2,821) (546) - (46,315) - 103,409 (1,000) (4,490)
Change in Fixed Assets (20,406) (20,406) - (20,406) (910) 216,606 (8,646) (2,821) (224,635) - - - - - -
TOTAL CHANGE IN NET ASSETS (2,270,128) (2,270,128) - (2,270,128) (0) (0) (0) (0) - - (2,270,128) - - - -
FTEs 73.00 73.0 - 73.00 1.00 42.50 9.50 3.10 0.60 - 4.30 2.00 6.00 2.00 2.00
Statement of Activities and Capital
Expenditures by Program
2011 Budget