Embed Size (px)
Citation preview

lO
Bl
aw
CO
mPa
niE
S l
imit
ED
| 2012 an
nu
al
rE
PO
rt
2012 Annual Report

Loblaw’s mission is to be Canada’s best food, health and home retailer by exceeding customer expectations through innovative products at great prices.
taBlE OF COntEntS
2 Financial Highlights
4 Letter to Shareholders
6 Review of Operations
14 Corporate Social Responsibility
16 Corporate Governance Practices
18 Board of Directors
19 Leadership
20 Shareholder and Corporate Information

Live Life Well
As Canada’s largest retailer, we take pride and ownership in helping Canadians each and every day.
Offering Customers the Best in Food
Loblaw is changing the way that Canadians experience food. We’re sourcing the very best quality food – working with suppliers close to home and travelling the world to provide our customers with outstanding tastes and fresh food experiences, all available at great value.
We’re also expanding variety and selection in every department to ensure we offer more choice and convenience, along with competitive prices and services that keep our customers coming back for more.
Working Efficiently for Our Customers
The efficiency of our operations and supply chain is the foundation for delivering the right products, on time and at the right prices, in every Loblaw banner store.
Investments in systems and infrastructure will help us be more efficient and cost-effective in giving customers the products and services they want. Efficiency also frees up our colleagues to spend more time providing the service our customers deserve.
Innovations to Grow with Our Customers
We are building new capabilities and new ways of meeting the ever-changing needs of Canadian consumers.
From innovations in customer loyalty programs to expanded health-care services available right in our stores, Loblaw is responding to emerging trends and customer feedback to better reach Canadians where, when and how they want to shop.

With over 14 million shoppers each week, Loblaw is uniquely positioned to deliver on our purpose – Live Life Well – and to provide Canadians with products, services and experiences to enrich their lives. Every day, we connect with Canadians from coast to coast through our retail stores, our supplier relationships, our investor services, and our contact with Loblaw colleagues as one of Canada’s largest employers.
MD

Protein rich and fat -freeThere are 18 grams of protein in every 176 gram serving of PC 0% MF Plain Greek Yogurt.
No artificial flavour or colouringResponding to consumer trends toward heathier eating.
MD

pG 2 LobLaw companies Limited | 2012 annuaL report
Forward-LooKinG statements
This Annual Report for Loblaw Companies Limited contains forward-looking statements about the Company’s objectives, plans, goals, aspirations, strategies, prospects and opportunities. Forward-looking statements are typically identified by words such as “expect”, “anticipate”, “believe”, “foresee”, “could”, “estimate”, “goal”, “intend”, “plan”, “seek”, “strive”, “will”, “may” and “should” and similar expressions, as they relate to the Company and its management. Forward-looking statements reflect the Company’s current estimates, beliefs and assumptions, which are based on management’s perception of historical trends, current conditions and expected future developments, as well as other factors it believes are appropriate in the circumstances. The Company’s estimates, beliefs and assumptions are inherently subject to significant business, economic, competitive and other uncertainties and contingencies regarding future events and as such, are subject to change. The Company can give no assurance that such estimates, beliefs and assumptions will prove to be correct.
Numerous risks and uncertainties could cause the Company’s actual results to differ materially from the estimates, beliefs and assumptions expressed or implied in the forward-looking statements, including, but not limited to: those discussed in the forward-looking statements disclaimer found on pages 2 to 3 of the 2012 Annual Report – Financial Review, and the Enterprise Risks and Risk Management section of the Management’s Discussion and Analysis on pages 23 to 31 of the 2012 Annual Report – Financial Review. Other risks and uncertainties not presently known to the Company or that the Company presently believes are not material could also cause actual results or events to differ materially from those expressed in its forward-looking statements. Readers are cautioned not to place undue reliance on these forward-looking statements, which reflect the Company’s expectations only as of the date of this Annual Report. Except as required by law, the Company does not undertake to update or revise any forward-looking statements, whether as a result of new information, future events or otherwise.
Financial Highlights(1)
Same-store sales (decline) growth (%)
Operating income ($ millions)
Basic net earnings per share and dividend rate per common share ($)
1,347
1,196
1,384
2010 201220112010 201220112010 20122011
2.432.31
2.73
(0.6)
(0.2)
0.90.85Dividend rateper common share
0.84Dividend rate
per common share
LobLaw companies Limited | 2012 annuaL report pG 3
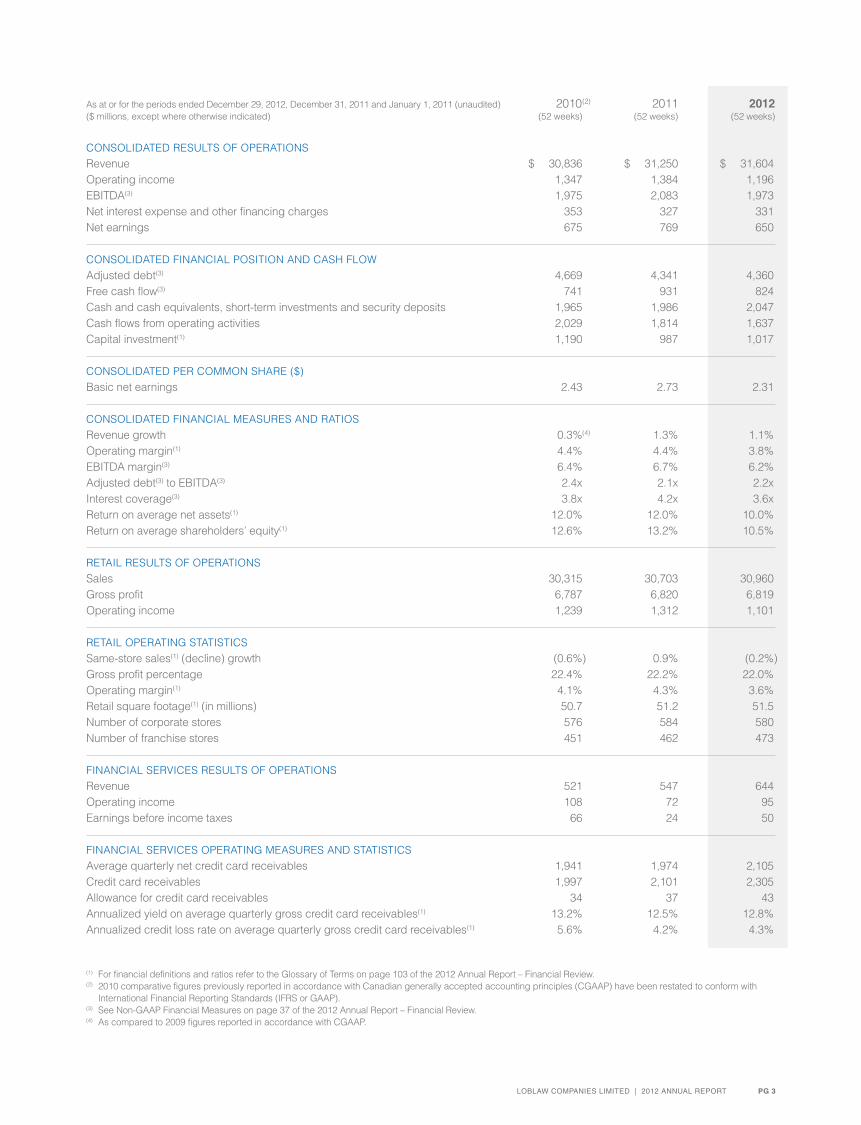
As at or for the periods ended December 29, 2012, December 31, 2011 and January 1, 2011 (unaudited) 2010(2) 2011 2012($ millions, except where otherwise indicated) (52 weeks) (52 weeks) (52 weeks)
CONSOLIDATED RESuLTS OF OpERATIONS Revenue $ 30,836 $ 31,250 $ 31,604Operating income 1,347 1,384 1,196EBITDA(3) 1,975 2,083 1,973Net interest expense and other financing charges 353 327 331Net earnings 675 769 650
CONSOLIDATED FINANCIAL pOSITION AND CASh FLOW Adjusted debt(3) 4,669 4,341 4,360Free cash flow(3) 741 931 824Cash and cash equivalents, short-term investments and security deposits 1,965 1,986 2,047Cash flows from operating activities 2,029 1,814 1,637Capital investment(1) 1,190 987 1,017
CONSOLIDATED pER COMMON ShARE ($) Basic net earnings 2.43 2.73 2.31
CONSOLIDATED FINANCIAL MEASuRES AND RATIOS Revenue growth 0.3%(4) 1.3% 1.1%Operating margin(1) 4.4% 4.4% 3.8%EBITDA margin(3) 6.4% 6.7% 6.2%Adjusted debt(3) to EBITDA(3) 2.4x 2.1x 2.2xInterest coverage(3) 3.8x 4.2x 3.6xReturn on average net assets(1) 12.0% 12.0% 10.0%Return on average shareholders’ equity(1) 12.6% 13.2% 10.5%
RETAIL RESuLTS OF OpERATIONS Sales 30,315 30,703 30,960Gross profit 6,787 6,820 6,819Operating income 1,239 1,312 1,101
RETAIL OpERATING STATISTICS Same-store sales(1) (decline) growth (0.6%) 0.9% (0.2%)Gross profit percentage 22.4% 22.2% 22.0%Operating margin(1) 4.1% 4.3% 3.6%Retail square footage(1) (in millions) 50.7 51.2 51.5Number of corporate stores 576 584 580Number of franchise stores 451 462 473
FINANCIAL SERvICES RESuLTS OF OpERATIONS Revenue 521 547 644Operating income 108 72 95Earnings before income taxes 66 24 50
FINANCIAL SERvICES OpERATING MEASuRES AND STATISTICS Average quarterly net credit card receivables 1,941 1,974 2,105Credit card receivables 1,997 2,101 2,305Allowance for credit card receivables 34 37 43Annualized yield on average quarterly gross credit card receivables(1) 13.2% 12.5% 12.8%Annualized credit loss rate on average quarterly gross credit card receivables(1) 5.6% 4.2% 4.3%
(1) For financial definitions and ratios refer to the Glossary of Terms on page 103 of the 2012 Annual Report – Financial Review.(2) 2010 comparative figures previously reported in accordance with Canadian generally accepted accounting principles (CGAAp) have been restated to conform with
International Financial Reporting Standards (IFRS or GAAp).(3) See Non-GAAp Financial Measures on page 37 of the 2012 Annual Report – Financial Review.(4) As compared to 2009 figures reported in accordance with CGAAp.
pG 4 LobLaw companies Limited | 2012 annuaL report
Shareholders:
Our Company has a strong foundation from which we continue to build: national scale; exceptional real estate; pre-eminent brands; leadership in fresh food; and powerful complementary products and services including apparel, in-store pharmacies and PC Financial services. With these
compelling competitive advantages and the incremental efficiencies we expect to be gained from our information technology (IT) and supply chain initiatives, we are confident in Loblaw’s ability to remain an industry leader in an increasingly competitive Canadian retail landscape.
2012 Was a pivotal Year for Our Company
In the last Annual Report we outlined our strategy to strengthen our customer proposition through improved competitiveness, better service and more compelling assortment; to complete our infrastructure upgrades and drive appropriate efficiencies; and to invest in growth areas that support long-term profitability. In 2012, we made significant progress against these priorities and delivered financial performance in line with our expectations.
STRATEGIC pILLAR 2012 hIGhLIGhT
customer-centric Improved Net promoter Score (NpS), our primary measure of customer satisfaction, by 300 basis points
best in Food Delivered sustained tonnage share growth in two key markets and improving trends in the rest
relentless efficiency Launched the first store and distribution centre on SAp, and reduced 700 office and administrative positions
Growth Expanded PC Financial customer base with more than one million new applications acquired
colleagues Named among the Top 100 Employers, Top Employers for Young people, Best Employers for New Canadians and Best Diversity Employers
Our revenues grew 1.1%, while investments in our business and the ongoing IT systems implementation were a drag on our basic earnings per share, which decreased about 15% to $2.31 per share. We continue to benefit from a strong balance sheet, with net assets of $12.2 billion and adjusted debt of $4.4 billion. Lying beneath top-line numbers are
some important trends and accomplishments that position us well in the future. In fact, through the year we have seen material, sustained positive trends in key areas of our business, which have accelerated during the last quarter of 2012 and through the first seven weeks of 2013.
Letter to Shareholders
Loblaw’s mission is to be Canada’s best food, health and home retailer by exceeding customer expectations through innovative products at great prices. That mission is brought to life through a simple and powerful consumer purpose – Live Life Well.

LobLaw companies Limited | 2012 annuaL report pG 5
This year, we began to see our retail strategy take hold, our confidence in the underlying fundamentals of the core business grew, and we took steps intended to unlock value for our shareholders. This included the 4.8% increase in our quarterly dividend payout, as well as the announcement of our intent to create one of Canada’s largest real estate investment trusts (REIT). Moving forward, as our core business strengthens we expect to continue this emphasis on long-term value creation.
In 2013, we will focus on rolling out our new IT system to distribution centres and stores, accelerating the improvements in our customer proposition, and effectively managing our expenses and operating costs.
Live Life Well
As the country’s largest food retailer, we sell more fresh food than anyone else. We offer Canadians a market-leading selection of healthy food and we are home to one of the largest pharmacy businesses in the country. We reach across Canada’s immense geography, as well as its social and economic diversity. With our ability to connect with so many Canadians through our stores, we take pride in helping people through our Live Life Well purpose every day.
Our Live Life Well purpose means many things. It is access to nutritious and delicious food through the largest produce departments in the country and through brands like PC Blue Menu; it also means more time spent with family and friends because full-service ATM banking is available in the same store as the weekly grocery shop; it is enjoying something truly indulgent with a PC black label gourmet product, or trying something new at T&T Supermarkets; and it’s extra money in someone’s pocket because nofrills stores’ Won’t be Beat price match program offers low prices; and it is feeling great about the way you look when you buy fashion or beauty from the Joe Fresh brand at incredible value. This combination of assets is unique in Canada and perfectly suited to the demographic trends and consumer tastes of the next decade.
Thinking about what we do and how we do it through the lens of our Live Life Well purpose will keep us firmly focused on our customers and giving them something they can’t get anywhere else. Success will deliver the financial results that create sustained shareholder value over the long term.
GaLen G. WeSton
Executive Chairman

pG 6 LobLaw companies Limited | 2012 annuaL reportpG 6 LobLaw companies Limited | 2012 annuaL report
Gluten-free and delicious customers with dietary restrictions can enjoy President’s Choice products certified gluten-free by the canadian celiac association.
From the fish counter to the deli, the bakery to the produce aisles, we offer nutritious and delicious foods that help our customers create exceptional meals at affordable prices and bring them into our stores again and again. Our goal is to be the shopping destination of choice for our customers with more selection across a variety of food and complementary categories, better service and value, and deeper product knowledge than any competitor.
Loblaw’s conventional stores delivered exceptional shopping experiences in 2012, led by fresh food, new
taste experiences, and more variety in every department. New layouts and displays showcase our expanded selection of fruits and vegetables with spotlights on locally grown produce, as well as exciting tropical and exotic flavours that offer new and fresh eating experiences. We also invested resources to ensure our conventional stores offered competitive pricing each week, and we added more training for colleagues through our innovative Learning Academy to expand their knowledge of the products and services we offer.
as part of our preferred language program, annamaria proudly has “italiano” on her name badge. customers who prefer to speak italian know that she can help them when they shop in our store.
annamaria SaLvaGio
Loblaws Richmond hill Richmond hill, Ontario

Over 250 different products our PC black label line helps customers indulge their inner foodie.
Showing the benefits of Blue Menuover 400 PC Blue Menu products were repackaged to make the nutritional information easier for customers to understand.

pG 8 LobLaw companies Limited | 2012 annuaL report
We believe that leading with fresh at the lowest prices is the key to winning with our customers in our discount stores. For this reason, our teams scour the globe for the best-tasting, quality products, building on the right assortment to meet Canadians’ tastes and lifestyle needs.
In 2012, discount customers enjoyed some of the most exceptional taste experiences. From poultry to produce, 22 President’s Choice and national brand items were promoted under the “Our Taste Favourite” program. Items featured undergo a rigorous selection process by our in-house Taste Council, and only the very best make the cut. Throughout the year, we also presented
12 national fresh food programs to showcase the best of fresh in a number of categories like citrus and seafood. The programs spanned multiple departments, from a freshly picked lemon in produce to the bakery department’s lemon pie to a household helper like the perfect lemon zester!
Our price match program offering low prices is equally important to our success. In order to deliver on this promise, the discount team is focused on optimizing our cost of operations and passing on these savings directly to the customer.
with over 40 years of service, France knows that by offering a wide variety of fresh products at the lowest price her store helps the local community make healthier choices.
France Zimmermann
Maxi & Cie Jean Talon Montreal, Quebec

Introducing new items like dragon fruitone way we’re helping customers discover new and exciting products from around the world.
Essentials our customers needFrom pillows to the oh-so-perfect shade of lipstick – all in one place.

pG 10 LobLaw companies Limited | 2012 annuaL report
Canada’s rich cultural diversity presents a wealth of opportunities for retailers. Loblaw has a strong foundation of merchandising and sourcing expertise and capability to serve Canadians’ expanding tastes and growing demand for international flavours and foods. In 2012, a collection of international control brand products was successfully piloted in select conventional and discount stores. under the trusted T&T brand, these new products gave customers greater choice of high-quality Asian fusion foods that add variety and diversity to mealtime. We will continue to expand the selection and availability of T&T branded products in our mainstream banners.
We’ve also responded to the growing demand for international food offerings by expanding our assortment with hundreds of new Asian products now available in our Wholesale Club stores. This channel provides competitive prices for restaurant and independent convenience store customers who serve the consumers’ growing demand for global taste and international ingredients in their local markets. Our knowledge and expertise in international foods, coupled with Loblaw’s insights into the changing trends and demographics of Canada, positions us well to further capitalize on future growth potential in international foods and distribution channels.
mary enjoys helping customers select the best beauty and personal care products from the familiar asian brands now available in canada as part of the T&T Be Beauty line.
mary Lai
T&T Supermarket unionville Markham, Ontario
A fresh-baked ideaenjoy the sights – and the delicious aroma – at the new T&T open concept bakery.

From pineapple cakes to shrimp dumplingsT&T control brand products are bringing the tastes of asia to canada.

pG 12 LobLaw companies Limited | 2012 annuaL report
helping Canadians simplify their lives and have more time for the things that matter most means providing the services they need at great value in convenient locations. What could be more convenient than having access to full-service ATM banking and mobile phone services in the same place you do your weekly grocery shop?
We provide customers with a convenient financial services experience from a name they trust. It’s a simple and straightforward service that offers value including loyalty rewards, low fees and no-hassle tools for banking in person, online or over the telephone. Over the past two years, we’ve invested in programs to raise awareness
of PC Financial MasterCard® benefits and experienced double-digit growth in our subscriber base, growth that has been profitable and well ahead of the industry.
With the rapid growth in mobile phone use, Loblaw is well positioned to seize opportunities in the wireless space through our PC telecom division and the growing number of self-serve and full-service kiosks located inside Loblaw banner stores. Technology will be a key factor in the way Canadians experience grocery shopping in the future, and Loblaw is ready to leverage technology and add another channel for connecting with our customers.
danny likes the variety of options at our full-service The Mobile Shop kiosk because he can help customers find the mobile solution that’s right for them.
Danny Lam
Loblaws Richmond hill Richmond hill, Ontario
Day-to-day banking making financial solutions convenient for our customers.
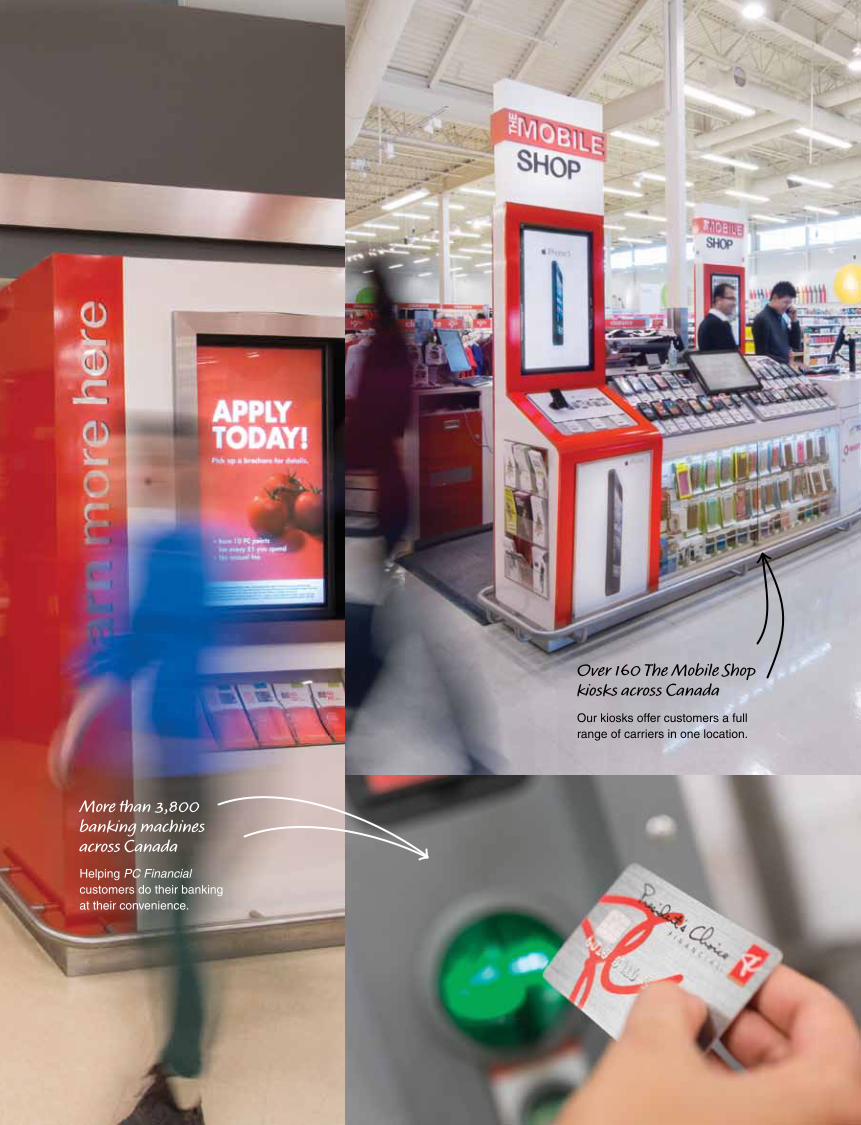
Over 160 The Mobile Shop kiosks across Canadaour kiosks offer customers a full range of carriers in one location.
More than 3,800 banking machines across Canada Helping PC Financial customers do their banking at their convenience.

pG 14 LobLaw companies Limited | 2012 annuaL report
Reducing electricity to date, we have converted more than 72,000 light fixtures in our corporate stores to fluorescent technology resulting in energy savings sufficient to power 9,923 homes for a year.
The way we do business is founded in our five CSR principles: Respect the Environment; Source with Integrity; Make a positive Difference in Our Community; Reflect Our Nation’s Diversity; and Be a Great place to Work. We made good progress on our commitments again this past year.
As of 2012, we have reduced the number of plastic shopping bags from our stores by more than five billion. We also generated significant electricity and fuel savings last year by converting standard lighting in our stores and distribution centres to new fluorescent technology and through various fuel efficiency initiatives throughout our truck fleet.
To help Canadians make healthier food and lifestyle choices, we continue to reduce sodium levels in control brand products, and we are in the process of
removing artificial flavours and artificial colours from all President’s Choice products. The Guiding Stars program was introduced in Loblaws banner stores in Ontario and 22 dietitians are available in 50 stores in the province to provide health education to consumers.
In keeping with our Canadian First approach, 30% of the produce sold in our stores year-round was sourced from Canadian growers. We also achieved our goal to source 100% fresh pork from Canada (excluding hard discount stores and sale items).
We took a stand on seafood in 2009, committing to source 100% of our seafood from sustainable sources by 2013. Today, we offer 108 Marine Stewardship Council (MSC)-certified wild-caught seafood products in our stores, more than any other Canadian food retailer.
To learn more, please see our CSR Report at loblaw.ca/csr.
Live Life Well
As the country’s largest food retailer, Loblaw has a unique opportunity to help Canadians through the products and services we offer and the strong commitment we make to Corporate Social Responsibility (CSR).

Local sourcing we are committed to offering customers more fresh choices from local growers.
Proud to be a Top Employerin 2012, Loblaw was named among the top 100 employers, top employers for Young people, best employers for new canadians and best diversity employers.
Granted more than $14 million in 2012 President’s Choice children’s charity supports children with special needs and nutrition programs that aim to fight childhood hunger across canada.
pG 16 LobLaw companies Limited | 2012 annuaL report
The Governance Committee regularly reviews the Company’s corporate governance practices and considers any changes necessary to maintain the Company’s high standards of corporate governance in a rapidly changing environment. The Company’s website, loblaw.ca, sets out additional governance information, including the Company’s Code of Conduct (the “Code”), its Disclosure policy and the Mandates of the Board of Directors (the “Board”) and its committees.
Director Independence
The Canadian Securities Administrators’ Corporate Governance Guidelines provide that a director is independent if he or she has no material relationship with the Company or its affiliates that could reasonably be expected to interfere with the exercise of the director’s independent judgment.
Two-thirds of the directors on the Board are independent. The independent directors meet separately following each Board meeting and on other occasions as required or desirable.
Information relating to each of the directors, including their independence, committee membership, other public company boards on which they serve, as well as their attendance record for all Board and committee meetings, can be found in the Company’s Management proxy Circular.
Board Leadership
Galen G. Weston is the Executive Chairman of the Board. The Executive Chairman directs the operations of the Board. he chairs each meeting of the Board, is responsible for the management and effective functioning of the Board generally and provides leadership to the Board in all matters. These and other key responsibilities of the Executive Chairman are set out in a position description established by the Board.
The Board has also appointed an independent director, Anthony S. Fell, to serve as lead director. The lead director provides leadership to the Board and particularly to the independent directors. he ensures that the Board operates independently of management and that directors have an independent leadership contact.
Board Responsibilities and Duties
The Board, directly and through its committees, supervises the management of the business and affairs of the Company. A copy of the Board’s mandate can be found at loblaw.ca. The Board reviews the Company’s strategic direction, assigns responsibility to management for the achievement of that direction, develops and approves major policy decisions, delegates to management the authority and responsibility of handling day-to-day affairs, and reviews management’s performance and effectiveness. The Board’s expectations of management are communicated to management directly and through committees of the Board.
The Board regularly receives reports on the operating results of the Company as well as reports on certain non-operational matters, including insurance, pensions, corporate governance, health and safety, legal and treasury matters. The Board also oversees the enterprise risk management (ERM) process, which is designed to assist all areas of the business in managing appropriate levels of risk tolerance by bringing a systematic approach, methodology and tools for evaluating, measuring and monitoring key risks. The results of the ERM program and other business planning processes are used to identify emerging risks to the Company, prioritize risk management activities and develop a risk-based internal audit plan.
corporate Governance practices
The Board of Directors and senior executives of Loblaw Companies Limited are committed to sound corporate governance practices and believe they contribute to the effective management of the Company and its achievement of strategic and operational objectives.

LobLaw companies Limited | 2012 annuaL report pG 17
Ethical Business Conduct
The Code reflects the Company’s long-standing commitment to high standards of ethical conduct and business practices. The Code is reviewed annually to ensure it is current and reflects best practices in the area of ethical business conduct. In 2012, the Code underwent a comprehensive review and re-draft to ensure it reflected industry best practices. All directors, officers and employees of the Company are required to comply with the Code and must acknowledge their commitment to abide by the Code on an annual basis.
The Company encourages the reporting of unethical behaviour and has established an Integrity Action Line, a toll-free number that any director, officer or employee may use to report conduct which he or she feels violates the Code or otherwise constitutes fraudulent or unethical conduct. A fraud reporting protocol has also been implemented to ensure that fraud is reported to senior management in a timely manner. In addition, the Audit Committee has endorsed procedures for the anonymous receipt, retention and handling of complaints regarding accounting, internal control or auditing matters. These procedures are available at loblaw.ca.
Board Committees
The following is a brief summary of some of the responsibilities of each committee of the Board.
audit committee
The Audit Committee is responsible for supporting the Board in overseeing the quality and integrity of the Company’s financial reporting and internal controls over financial reporting, disclosure controls, internal audit function and its compliance with legal and regulatory requirements.
Governance, empLoYee deveLopment, nominatinG and
compensation committee
The Governance Committee is responsible for the identification of new director nominees for the Board and for the oversight of compensation of directors and executive officers. The Governance Committee is also responsible for developing and maintaining governance practices consistent with high standards of corporate governance. The Chair of the Governance Committee, who is an independent director, has also been appointed by the Board to serve as lead director.
pension committee
The pension Committee is responsible for reviewing the performance and overseeing the administration of the Company’s and its subsidiaries’ pension plans and pension funds.
environmentaL, HeaLtH and saFetY committee
The Environmental, health and Safety Committee is responsible for reviewing and monitoring environmental, food safety and workplace health and safety policies, procedures, practices and compliance.
executive committee
The Executive Committee possesses all of the powers of the Board except the power to declare common dividends and certain other powers specifically reserved by applicable law to the Board. The Executive Committee acts only when it is not practicable for the full Board to meet.

pG 18 LobLaw companies Limited | 2012 annuaL report
GaLen G. WeSton, b.a., m.b.a.1*
Executive Chairman, Loblaw Companies Limited; Former Senior vice president, Loblaw Companies Limited; Director, Wittington Investments, Limited.
StepHen e. BacHanD, b.a., m.b.a.3
Corporate Director; Retired president and Chief Executive Officer, Canadian Tire Corporation, Limited; Former Director, Canadian pacific Railway Limited, George Weston Limited, Bank of Montreal.
pauL m. BeeSton, c.m., b.a., F.c.a.2
president and Chief Executive Officer, Toronto Blue Jays Baseball Team; Former president and Chief Executive Officer, Major League Baseball; Director, president’s Choice Bank, Gluskin Sheff & Associates Inc.; Trustee and Former Chairman, Centre for Addiction and Mental health; Former Director, Newport partners Income Fund.
cHriStie J.B. cLark,
b. comm., m.b.a., F.c.a.2*
Corporate Director; Former Chief Executive Officer and Senior partner, pricewaterhouseCoopers LLp; Director, Brookfield Office properties Inc., IGM Financial Inc.; Chair, Canadian partnership Against Cancer Corporation, Finance and Governance Committees of Alpine Canada.
GorDon a.m. currie, b.a., LL.b.4, 5
Executive vice president and Chief Legal Officer of the Company and George Weston Limited; Former Senior vice president and General Counsel, Direct Energy; Former partner, Blake, Cassels & Graydon LLp.
antHony S. FeLL, o.c.3*, 4*
Corporate Director; Former Chairman, RBC Capital Markets Inc.; Former Chairman and Chief Executive Officer, RBC Dominion Securities; Former Deputy Chairman, Royal Bank of Canada; Director, BCE Inc.; Former Chairman, Investment Dealers Association of Canada; Former Director, CAE Inc.
cHriStiane Germain, c.Q.5
Co-president and Co-Founder, Groupe Germain hospitalité; Director, Groupe Le Massif, Institute for Governance of private and public Organizations, The Banff Centre.
antHony r. GraHam1, 3, 4
president and Director, Wittington Investments, Limited; president, Selfridges Group Limited; president and Chief Executive Officer, Sumarria Inc.; Former vice-Chairman and Director, National Bank Financial; Chairman and Director, president’s Choice Bank; Director, George Weston Limited, Brown Thomas Group Limited, Graymont Limited, holt, Renfrew & Co., Limited, power Corporation of Canada, power Financial Corporation, Selfridges & Co. Ltd., Grupo Calidra, S.A. de C.v., de Bijenkorf B.v.
JoHn S. Lacey, b.a.1
Chairman of the Advisory Board, Brookfield private Equity Group; Consultant to the Board and to the Board of George Weston Limited; Former president and Chief Executive Officer, the Oshawa Group (now part of Sobeys Inc.); Director, George Weston Limited, Telus Corporation, Ainsworth Lumber Co. Ltd.; Former Chairman, Alderwoods Group, Inc.; Former Director, Canadian Imperial Bank of Commerce.
nancy H.o. LockHart, o. ont.3, 5*
Chief Administrative Officer, Frum Development Group; Former vice president, Shoppers Drug Mart Corporation; Former president, Canadian Club of Toronto; Director, Centre for Addiction and Mental health Foundation, The Canada Merit Scholarship Foundation; Member, Advisory Board of Belinda Stronach Foundation; Former Chair, Canadian Film Centre, Ontario Science Centre; Former Director, Canada Deposit Insurance Corporation.
tHomaS c. o’neiLL, b. comm., F.c.a.3
Corporate Director; Chairman, BCE Inc.; Retired Chairman, pricewaterhouseCoopers Consulting; Former Chief Executive Officer and Chief Operating Officer, pricewaterhouseCoopers LLp; vice-Chair, St. Michael’s hospital; Director, Adecco S.A., Nexen Inc., BCE Inc., The Bank of Nova Scotia; Former vice Chair, Board of Governors, Queen’s university; past Member, Advisory Council at Queen’s university School of Business.
JoHn D. Wetmore, b. matH.2, 4
Corporate Director; Former president and Chief Executive Officer, IBM Canada; Retired vice president, Contact Centre Development, IBM Americas; Director, Research In Motion Ltd. (also known as Blackberry); Former Director, Resolve Business Outsourcing Income Fund.
notes1 Executive Committee2 Audit Committee3 Governance, Employee Development,
Nominating and Compensation Committee4 pension Committee5 Environmental, health and Safety Committee* Chair of the Committee
Board of Directors
Our Board represents the interests of all Loblaw stakeholders. Through its oversight of the management of the Company and its affairs, the Board actively demonstrates Loblaw’s commitment to the principles of transparency, accountability and sound corporate governance.

GALEN G. WESTON
Executive Chairman
VICENTE TRIUS
President
SARAH R. DAVIS
Chief Financial Officer
MARK C. BUTLER
Executive Vice President, Conventional Division
ROBERT CHANT
Senior Vice President, Corporate Affairs and Communication
BARRY K. COLUMB
President, PC Bank
GORDON A.M. CURRIE
Executive Vice President and Chief Legal Officer
GRANT FROESE
Executive Vice President, Hard Discount and Superstore
S. JANE MARSHALL
Executive Vice President, Loblaw Properties Limited and Business Strategy
JUDY A. MCCRIE
Executive Vice President, Human Resources and Labour Relations
PETER MCLAUGHLIN
Executive Vice President, Emerging Business
PETER K. MCMAHON
Executive Vice President, Chief Operating Officer
GARRY SENECAL
Executive Vice President, Division Support and Brands
Leadership
LobLaw companies Limited | 2012 annuaL report PG 19
pG 20 LobLaw companies Limited | 2012 annuaL report
co
nc
ep
t a
nd
de
siG
n: T
hE
WO
RK
S D
ES
IGN
CO
MM
uN
ICAT
ION
S w
ww
.wor
ksd
esig
n.co
m
pr
int
inG
: Tra
nsco
ntin
enta
l pLM
p
rin
cip
aL
pH
ot
oG
ra
pH
Y: D
avid
Gra
ham
Whi
te
stocK excHanGe ListinG
and sYmboL
The Company’s common shares and second preferred shares are listed on the Toronto Stock Exchange and trade under the symbols “L” and “L.pR.A”, respectively.
common sHares
W. Galen Weston, directly and indirectly, including through his controlling interest in Weston, owns approximately 64% of the Company’s common shares.
During 2012, there were 718,544 common shares issued and at year end 281,680,157 outstanding common shares available for public trading.
The average daily trading volume of the Company’s common shares for 2012 was 499,774.
preFerred sHares
At year-end 2012, there were 9,000,000 second preferred shares issued and outstanding and available for public trading.
The average daily trading volume of the Company’s second preferred shares for 2012 was 7,941.
trademarKs
Loblaw Companies Limited and its subsidiaries own a number of trademarks.
Several subsidiaries are licensees of additional trademarks. These trademarks are the exclusive property of Loblaw Companies Limited or the licensor and where used in this report are in italics.
common dividend poLicY
During 2012, the Company amended its dividend policy to state: the declaration and payment of dividends and the amount thereof on the Company’s common shares are at the discretion of the Board which takes into account the Company’s financial results, capital requirements, available cash
flow, future prospects of the Company’s business and other factors considered relevant from time to time. Over the long term, it is the Company’s intention to increase the amount of the dividend while retaining appropriate free cash flow to finance future growth.
common dividend dates
The declaration and payment of quarterly dividends are made subject to approval by the Board. The anticipated record and payment dates for 2013 are:
RECORD DATE pAYMENT DATE
march 15 april 1 June 15 July 1 september 15 october 1 december 15 december 30
preFerred sHare
dividend dates
The declaration and payment of quarterly dividends are made subject to approval by the Board. The anticipated payment dates for 2013 are: January 31, April 30, July 31 and October 31.
normaL course issuer bid
The Company has a Normal Course Issuer Bid on the Toronto Stock Exchange.
vaLue oF common sHares
For capital gains purposes, the valuation day (December 22, 1971) cost base for the Company is $0.958 per common share. The value on February 22, 1994 was $7.67 per common share.
investor reLations
Shareholders, security analysts and investment professionals should direct their requests to Kim Lee, vice president, Investor Relations, at the Company’s National head Office or by e-mail at: [email protected]
reGistrar and transFer aGent
Computershare Investor Services Inc. 100 university Avenue Toronto, Canada M5J 2Y1 Toll-free: 1-800-564-6253 (Canada and u.S.) Fax: (416) 263-9394 Toll-free fax: 1-888-453-0330 International direct dial: (514) 982-7555
To change your address, eliminate multiple mailings, or for other shareholder account inquiries, please contact Computershare Investor Services Inc.
Additional financial information has been filed electronically with various securities regulators in Canada through the System for Electronic Document Analysis and Retrieval (SEDAR) and with the Office of The Superintendent of Financial Institutions (OSFI) as the primary regulator for the Company’s subsidiary, president’s Choice Bank.
independent auditors
KpMG LLp Chartered Accountants Toronto, Canada
annuaL meetinG
The 2013 Annual Meeting of Shareholders of Loblaw Companies Limited will be held on Thursday, May 2, 2013 at 11:00 am (EST), at the Mattamy Athletic Centre, 50 Carlton Street, Toronto, Canada M5B 1J2.
The Company holds an analyst call shortly following the release of its quarterly results. These calls are archived in the Investor Centre section of the Company’s website (loblaw.ca).
Shareholder and corporate information
nationaL Head oFFice and store support centre Loblaw Companies Limited 1 president’s Choice Circle, Brampton, Canada L6Y 5S5 Tel: (905) 459-2500 | Fax: (905) 861-2206 | Internet: loblaw.ca


lOBlaw.Ca
PC.Ca
JOEFrESH.Ca
PCFinanCial.Ca
lO
Bl
aw
CO
mPa
niE
S l
imit
ED
| 2012 an
nu
al
rE
PO
rt

2012 Annual Report Financial Review

Financial Highlights(1) As at or for the periods ended December 29, 2012, December 31, 2011 and January 1, 2011 2012 2011 2010(2)
(millions of Canadian dollars except where otherwise indicated) (52 weeks) (52 weeks) (52 weeks)
Consolidated Results of Operations Revenue $ 31,604 $ 31,250 $ 30,836 Operating income 1,196 1,384 1,347
EBITDA(3) 1,973 2,083 1,975 Net interest expense and other financing charges 331 327 353 Net earnings 650 769 675
Consolidated Financial Position and Cash Flow Adjusted debt(3) 4,360 4,341 4,669 Free cash flow(3) 824 931 741 Cash and cash equivalents, short term investments and security deposits 2,047 1,986 1,965 Cash flows from operating activities 1,637 1,814 2,029 Capital investment(1) 1,017 987 1,190
Consolidated Per Common Share ($) Basic net earnings 2.31 2.73 2.43 Consolidated Financial Measures and Ratios
Revenue growth 1.1% 1.3% 0.3%(4)
Operating margin(1) 3.8% 4.4% 4.4% EBITDA margin(3) 6.2% 6.7% 6.4% Adjusted debt(3) to EBITDA(3) 2.2x 2.1x 2.4x Interest coverage(3) 3.6x 4.2x 3.8x Return on average net assets(1) 10.0% 12.0% 12.0% Return on average shareholders’ equity(1) 10.5% 13.2% 12.6% Retail Results of Operations
Sales 30,960 30,703 30,315 Gross profit 6,819 6,820 6,787 Operating income 1,101 1,312 1,239 Retail Operating Statistics Same-store sales(1) (decline) growth (0.2%) 0.9% (0.6%) Gross profit percentage 22.0% 22.2% 22.4%
Operating margin(1) 3.6% 4.3% 4.1%
Retail square footage(1) (in millions) 51.5 51.2 50.7 Number of corporate stores 580 584 576 Number of franchise stores 473 462 451 Financial Services Results of Operations
Revenue 644 547 521 Operating income 95 72 108 Earnings before income taxes 50 24 66 Financial Services Operating Measures and Statistics Average quarterly net credit card receivables 2,105 1,974 1,941 Credit card receivables 2,305 2,101 1,997
Allowance for credit card receivables 43 37 34 Annualized yield on average quarterly gross credit card receivables(1) 12.8% 12.5% 13.2% Annualized credit loss rate on average quarterly gross credit card
receivables(1) 4.3% 4.2% 5.6%
(1) For financial definitions and ratios refer to the Glossary of Terms on page 103. (2) 2010 comparative figures previously reported in accordance with Canadian generally accepted accounting principles (“CGAAP”) have been restated to conform with International Financial
Reporting Standards (“IFRS” or “GAAP”). (3) See Non-GAAP Financial Measures on page 37. (4) As compared to 2009 figures reported in accordance with CGAAP.

2012 Annual Report – Financial Review 1
Management’s Discussion and Analysis
1. Forward-Looking Statements 2
2. Overview 3
3. Vision and Strategies 3
4. Key Financial Performance Indicators 5
5. Overall Financial Performance 5.1 Consolidated Results of Operations 5.2 Selected Financial Information
6 6 8
6. Reportable Operating Segments Results of Operations 6.1 Retail Segment 6.2 Financial Services Segment
9 9
10
7. Liquidity and Capital Resources 7.1 Cash Flows 7.2 Sources of Liquidity 7.3 Capital Structure 7.4 Financial Derivative Instruments 7.5 Contractual Obligations 7.6 Off-Balance Sheet Arrangements
11 11 12 14 15 16 16
8. Other Business Matters 17
9. Quarterly Results of Operations 9.1 Results by Quarter 9.2 Fourth Quarter Results
17 17 19
10. Disclosure Controls and Procedures 22
11. Internal Control over Financial Reporting 23
12. Enterprise Risks and Risk Management 12.1 Operating Risks and Risk Management 12.2 Financial Risks and Risk Management
23 24 29
13. Related Party Transactions 31
14. Critical Accounting Estimates and Judgments 14.1 Inventories 14.2 Impairment of Non-Financial Assets (Goodwill, Intangible Assets, Fixed Assets and Investment Properties) 14.3 Franchise Loans Receivable and Certain Other Financial Assets 14.4 Income and Other Taxes 14.5 Post-Employment and Other Long Term Employee Benefits 14.6 Allowance for Credit Card Receivables
32 32 33 33 33 33 33
15. Accounting Standards 15.1 Accounting Standards Implemented in 2012 15.2 Future Accounting Standards
34 34 34
16. Outlook 36
17. Non-GAAP Financial Measures 37
18. Additional Information 39
2012 Annual Report – Financial Review
Management’s Discussion and Analysis 2 Financial Results 40 Earnings Coverage Exhibit to the Audited Consolidated Financial Statements 101 Three Year Summary 102 Glossary of Terms 103

Management’s Discussion and Analysis
2 2012 Annual Report – Financial Review
The following Management’s Discussion and Analysis (“MD&A”) for Loblaw Companies Limited and its subsidiaries (collectively, the “Company” or “Loblaw”) should be read in conjunction with the annual audited consolidated financial statements and the accompanying notes on pages 43 to 100 of this Annual Report – Financial Review (“Annual Report”). The Company’s annual audited consolidated financial statements and accompanying notes for the year ended December 29, 2012 are prepared in accordance with International Financial Reporting Standards (“IFRS”) and include the accounts of the Company and other entities that the Company controls and are reported in millions of Canadian dollars, except where otherwise indicated. The information in this MD&A is current to February 20, 2013, unless otherwise noted. A glossary of terms used throughout this Annual Report can be found on page 103. 1. Forward-Looking Statements This Annual Report, including this MD&A, for Loblaw Companies Limited contains forward-looking statements about the Company’s objectives, plans, goals, aspirations, strategies, financial condition, results of operations, cash flows, performance, prospects and opportunities. Specific statements with respect to anticipated future results and planned capital expenditures are included in the Outlook section on page 36 of this MD&A and future plans are included in the Visions and Strategies section on page 3 of this MD&A. Forward-looking statements are typically identified by words such as “expect”, “anticipate”, “believe”, “foresee”, “could”, “estimate”, “goal”, “intend”, “plan”, “seek”, “strive”, “will”, “may” and “should” and similar expressions, as they relate to the Company and its management. Forward-looking statements reflect the Company's current estimates, beliefs and assumptions, which are based on management's perception of historical trends, current conditions and expected future developments, as well as other factors it believes are appropriate in the circumstances. The Company's expectation of operating and financial performance in 2013 is based on certain assumptions including assumptions about revenue growth, anticipated cost savings and operating efficiencies, no unanticipated changes in the effective income tax rates, the Company’s plan to increase net retail square footage by 1% and no unexpected adverse events or costs related to the Company’s investments in information technology (“IT”) and supply chain. The Company’s estimates, beliefs and assumptions are inherently subject to significant business, economic, competitive and other uncertainties and contingencies regarding future events and as such, are subject to change. The Company can give no assurance that such estimates, beliefs and assumptions will prove to be correct. Numerous risks and uncertainties could cause the Company’s actual results to differ materially from the estimates, beliefs and assumptions expressed or implied in the forward-looking statements, including, but not limited to: failure to realize anticipated results, including revenue growth, anticipated cost savings or operating efficiencies from the Company’s major
initiatives, including those from restructuring; failure to realize benefits from investments in the Company’s IT systems, including the Company’s IT systems implementation, or
unanticipated results from these initiatives; the inability of the Company’s IT infrastructure to support the requirements of the Company’s business; heightened competition, whether from current competitors or new entrants to the marketplace; changes in economic conditions including the rate of inflation or deflation, changes in interest and currency exchange rates and derivative
and commodity prices; public health events including those related to food safety; failure to achieve desired results in labour negotiations, including the terms of future collective bargaining agreements, which could lead to
work stoppages; the inability of the Company to manage inventory to minimize the impact of obsolete or excess inventory and to control shrink; the impact of potential environmental liabilities; failure to respond to changes in consumer tastes and buying patterns; reliance on the performance and retention of third-party service providers including those associated with the Company’s supply chain and
apparel business; supply and quality control issues with vendors; changes to the regulation of generic prescription drug prices and the reduction of reimbursement under public drug benefit plans and the
elimination or reduction of professional allowances paid by drug manufacturers;

2012 Annual Report – Financial Review 3
changes in the Company’s income, commodity, other tax and regulatory liabilities including changes in tax laws, regulations or future assessments;
any requirement of the Company to make contributions to its registered funded defined benefit pension plans or the multi-employer pension plans in which it participates in excess of those currently contemplated;
the risk that the Company would experience a financial loss if its counterparties fail to meet their obligations in accordance with the terms and conditions of their contracts with the Company;
the inability of the Company to collect on its credit card receivables; and failure to execute the Initial Public Offering (“IPO”) of the Company’s proposed Real Estate Investment Trust (“REIT”) could adversely affect
the reputation, operations and financial performance of the Company.
This is not an exhaustive list of the factors that may affect the Company’s forward-looking statements. Other risks and uncertainties not presently known to the Company or that the Company presently believes are not material could also cause actual results or events to differ materially from those expressed in its forward-looking statements. Additional risks and uncertainties are discussed in the Company’s materials filed with the Canadian securities regulatory authorities from time to time, including the Enterprise Risks and Risk Management section on pages 23 to 31 of this MD&A. Readers are cautioned not to place undue reliance on these forward-looking statements, which reflect the Company’s expectations only as of the date of this MD&A. Except as required by law, the Company does not undertake to update or revise any forward-looking statements, whether as a result of new information, future events or otherwise. 2. Overview The Company is a subsidiary of George Weston Limited (“Weston”) and is Canada’s largest food retailer and a leading provider of drugstore, general merchandise and financial products and services. The Company has two reportable operating segments: Retail and Financial Services. Loblaw and its franchisees together are among the largest private sector employers in Canada, employing approximately 134,000 full-time and part-time employees across more than 1,000 corporate and franchise stores from coast to coast. Through its portfolio of store formats, Loblaw is committed to providing Canadians with a wide range of products and services to meet the everyday household demands of Canadian consumers. Loblaw is known for the quality, innovation and value of its food offering. It offers one of Canada’s strongest control brand programs, including the unique President’s Choice, no name and Joe Fresh brands. In addition, through its subsidiaries, the Company makes available to consumers President’s Choice Financial services and offers the PC points loyalty program. 3. Vision and Strategies The Company’s mission is to be Canada’s best food, health and home retailer by exceeding customer expectations through innovative products at great prices. As one of the country’s leading retailers, reaching 14 million consumers each week, the Company is uniquely positioned to deliver on its purpose – Live Life Well – and to provide Canadians with products, services, value and experience to enrich their lives. The Company delivers on this purpose through its strategy to strengthen its competitive position with a winning customer proposition and efficient and cost-effective operations fueled by growth opportunities in emerging and complementary businesses. During 2012, the Company executed its plan to strengthen its competitive position. Targeted investments to improve the customer proposition delivered clear signs of progress, key milestones on IT systems initiatives were met and planned efficiencies were realized. To further enhance customers’ shopping experience, stores were renovated and the Company strategically invested in square footage with new stores. A number of important strategic initiatives were also announced during the year. Some of Loblaw’s key accomplishments in 2012 include: Invested in an expanded fresh product assortment and related colleague training to support an improved customer experience at
competitive prices; Completed the development and implementation of several comprehensive category reviews across both divisions to improve the
competitiveness, profitability and relevance of individual categories; Improved overall net promoter score, a measure of customer satisfaction, by 3 percentage points, through consistent execution of
initiatives to strengthen the customer proposition and competitive position of the Company; Rolled-out a national point of sale system in order to standardize the applications and infrastructure across the store network in
preparation for conversion to the Company’s new IT system and other new capabilities across the distribution centre and store network;
Management’s Discussion and Analysis
4 2012 Annual Report – Financial Review
Achieved a significant milestone in the implementation of the Company’s IT system, with the first distribution centre and first store going live on fully integrated systems with little to no impact on customers;
Continued to innovate its control brand products, including a T&T Supermarket Inc. private label pilot in a selection of the Company’s mainstream stores;
Reset the general merchandise section in 78 stores with differentiated product assortments that are complementary to a weekly food shop and have compelling value price points;
Invested strategically in its store network, renovating and revitalizing 103 stores and opening seven net new stores, expanding the Company’s retail square footage to 51.5 million square feet;
Grew the PC Financial services business by achieving one million new PC MasterCard® applicants and opening 87 additional Mobile Shop locations;
Purchased prescription files from 106 Zellers stores, contributing to prescription count growth; Announced a relationship with J.C. Penney Corporation, Inc. (“JC Penney”) to introduce Joe Fresh women’s apparel to almost 700 JC
Penney stores in the United States starting in March 2013; and Announced its intention to create a REIT, which will acquire a significant portion of Loblaw’s real estate assets and sell units by way of an
IPO. In 2013, the Company expects to continue to execute on its plan to strengthen the competitive position of its businesses. Key focus areas for the year include launching the roll-out program to convert its network of distribution centres and stores to the new IT system; accelerating business competitiveness with a more responsive and proactive culture to better serve customers; and managing expenses and operating costs to return efficiencies to customers. The Company’s plans for 2013 include: Integrating supply chain systems at each distribution centre to the new IT system in lock-step with store implementations; Implementing a staggered roll-out of the IT system to a significant number of corporate stores; Exceeding customer expectations and achieving improved customer feedback scores with the right assortment, improved customer in-store
experience and competitive prices; Offering customized assortment, compelling displays and delivering competitive value across banners through ongoing development and
implementation of strategic category reviews; Capitalizing on its established control brands across food and general merchandise; Expanding the financial services business by creating in-store customer awareness and expanding product offerings; Managing costs across the business with a focus on improved shrink, inventory turns, labour and administrative expenses to drive efficient
operations and provide customers greater value; Investing to improve standards and in-store experience through renovations and strategically investing in new square footage; and Completing the creation of a REIT by way of an IPO.
2012 Annual Report – Financial Review 5
4. Key Financial Performance Indicators The Company has identified specific key financial performance indicators to measure the progress of short and long term objectives. Key financial performance indicators are set out below:
As at or for the periods ended December 29, 2012 and December 31, 2011 2012 2011
(millions of Canadian dollars except where otherwise indicated) (52 weeks) (52 weeks)
Consolidated:
Revenue growth 1.1% 1.3% Operating income $ 1,196 $ 1,384
EBITDA(1) 1,973 2,083
EBITDA margin(1) 6.2% 6.7% Net earnings 650 769
Basic net earnings per common share ($) 2.31 2.73
Operating margin(2) 3.8% 4.4%
Cash and cash equivalents, short term investments and security deposits 2,047 1,986 Cash flows from operating activities 1,637 1,814
Adjusted debt(1) to EBITDA(1) 2.2x 2.1x
Free cash flow(1) 824 931
Interest coverage(1) 3.6x 4.2x
Return on average net assets(2) 10.0% 12.0%
Return on average shareholders’ equity(2) 10.5% 13.2%
Retail Segment: Same-store sales(2) (decline) growth (0.2%) 0.9%
Gross profit $ 6,819 $ 6,820
Gross profit percentage 22.0% 22.2%
Operating margin(2) 3.6% 4.3%
Financial Services Segment:
Earnings before income taxes $ 50 $ 24
Annualized yield on average quarterly gross credit card receivables(2) 12.8% 12.5%
Annualized credit loss rate on average quarterly gross credit card receivables(2) 4.3% 4.2%
(1) See Non-GAAP Financial Measures on page 37.
(2) For financial definitions and ratios refer to the Glossary of Terms on page 103.
Management’s Discussion and Analysis
6 2012 Annual Report – Financial Review
5. Overall Financial Performance In 2012, the Company invested to strengthen its customer proposition and at the same time continued with its ongoing IT infrastructure renewal program. With investments in the customer proposition, the Company made progress in delivering an improved price position, enhanced assortment and variety, particularly in fresh departments, and better in-store execution and customer service. The decline in net earnings was primarily due to incremental investments in the customer proposition and the IT infrastructure program that operations was not expected to cover, partially offset by improved earnings in the Financial Services segment. 5.1 Consolidated Results of Operations
For the periods ended December 29, 2012 and December 31, 2011 (millions of Canadian dollars except where otherwise indicated)
2012 (52 weeks)
2011 (52 weeks)
$ Change % Change
Revenue $ 31,604 $ 31,250 $ 354 1.1%
Operating income 1,196 1,384 (188) (13.6%)
Net interest expense and other financing charges 331 327 4 1.2%
Income taxes 215 288 (73) (25.3%)
Net earnings 650 769 (119) (15.5%)
Basic net earnings per common share ($) 2.31 2.73 (0.42) (15.4%)
Operating margin(1) 3.8% 4.4%
EBITDA(2) $ 1,973 $ 2,083 $ (110) (5.3%)
EBITDA margin(2) 6.2% 6.7%
Dividends declared per common share ($) 0.85 0.84 0.01 1.2%
Dividends declared on Second Preferred Share, Series A ($) 1.49 1.49 – –
During 2012, the Company announced a plan that reduced the number of head office and administrative positions. Focused primarily on management and office positions, the reductions affected approximately 700 jobs. The Company incurred a $61 million charge associated with this restructuring. For 2012, the Company incurred $55 million of incremental investment in its customer proposition that was not covered by operations. This amount was comprised of $20 million in price and $15 million in shrink, both of which were included in gross profit, and $20 million in labour. Revenue The $354 million increase in revenue compared to 2011 was driven by increases in both the Company’s Retail and Financial Services operating segments, as described below. Operating Income Operating income decreased by $188 million compared to 2011. Retail operating income decreased by $211 million, including the $61 million charge for restructuring, partially offset by an increase in Financial Services operating income of $23 million compared to 2011. In 2012, operating margin(1) was 3.8% compared to 4.4% in 2011. (1) For financial definitions and ratios refer to the Glossary of Terms on page 103.
(2) See Non-GAAP Financial Measures on page 37.
2012 Annual Report – Financial Review 7
Included in 2012 consolidated operating income were the following notable items: Incremental costs of $63 million related to investments in IT and supply chain. These costs included the following charges:
o $316 million (2011 – $266 million) related to IT costs; o $221 million (2011 – $172 million) related to depreciation and amortization; o $10 million (2011 – $34 million) related to other supply chain project costs; and o $11 million (2011 – $23 million) related to changes in the distribution network.
A $61 million charge associated with the reduction in head office and administrative positions; A $38 million charge (2011 – $35 million) related to the transition of certain Ontario conventional stores to the more cost effective and
efficient operating terms of collective agreements ratified in 2010; A $28 million charge (2011 – $27 million) related to the effect of share-based compensation net of equity forwards; and A $17 million charge (2011 – $5 million) related to fixed asset impairments, net of recoveries, related to asset carrying values in excess of
recoverable amounts for specific retail locations. Included in 2011 consolidated operating income were the following additional notable items: A $21 million charge related to start-up costs associated with the launch of the Joe Fresh brand in the United States; A $15 million charge related to certain prior years’ commodity tax matters; An $8 million charge related to an internal re-alignment of the Retail segment into a two division structure – conventional and discount; and A $14 million gain recognized related to the sale of a portion of a property in North Vancouver, British Columbia. Net Interest Expense and Other Financing Charges In 2012, net interest expense and other financing charges increased by $4 million, or 1.2%, to $331 million compared to 2011, primarily due to the maturity of interest rate swaps in the third quarter of 2011 and an increase in interest expense on long term debt, mainly driven by guaranteed investment certificate (“GIC”) issuances, partially offset by net repayments of borrowings related to credit card receivables in 2011. Income Taxes For 2012, income tax expense was $215 million (2011 – $288 million). The effective income tax rate was 24.9% (2011 – 27.2%). This decrease was primarily due to further reductions in the Federal and Ontario statutory income tax rates and a recovery on the revaluation of deferred tax assets on the enactment of the revised Ontario corporate income tax rate. Net Earnings Net earnings for 2012 decreased by $119 million, or 15.5%, compared to 2011. Basic net earnings per common share for 2012 decreased by 15.4%, to $2.31 from $2.73 in 2011. Basic net earnings per common share for 2012 were impacted by the following notable items: A $0.16 charge related to the incremental costs for the Company’s investment in IT and supply chain; A $0.16 charge related to the reduction in head office and administrative positions; A $0.10 charge (2011 – $0.09) related to the transition of certain Ontario conventional stores under collective agreements ratified
in 2010; A $0.09 charge (2011 – $0.09) for the effect of share-based compensation net of equity forwards; and A $0.05 charge (2011 – $0.01) related to the fixed asset impairments net of recoveries.
Basic net earnings per common share for 2011 were further impacted by the following notable items: A $0.05 charge related to the start-up costs associated with the launch of the Company’s Joe Fresh brand in the United States; A $0.04 charge related to certain prior years’ commodity tax matters; A $0.02 charge related to the internal re-alignment of the business; and Income of $0.04 related to the gain recognized on the sale of a portion of a property in North Vancouver, British Columbia.
Management’s Discussion and Analysis
8 2012 Annual Report – Financial Review
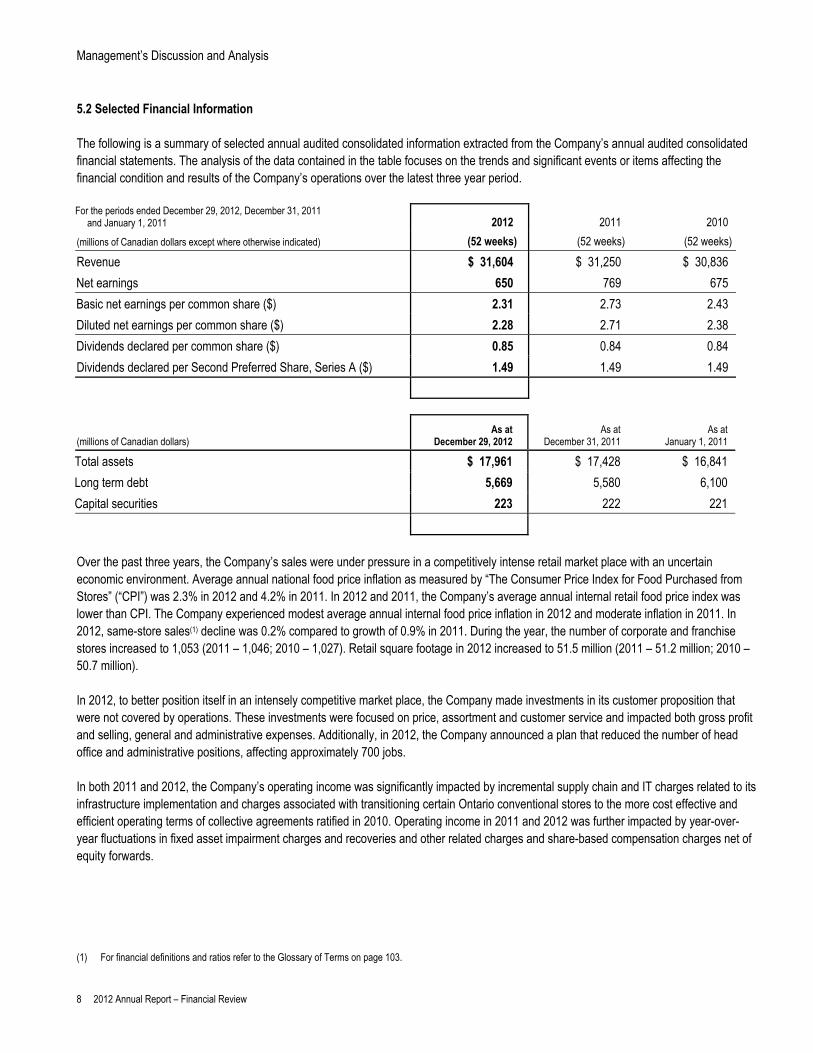
5.2 Selected Financial Information The following is a summary of selected annual audited consolidated information extracted from the Company’s annual audited consolidated financial statements. The analysis of the data contained in the table focuses on the trends and significant events or items affecting the financial condition and results of the Company’s operations over the latest three year period. For the periods ended December 29, 2012, December 31, 2011 and January 1, 2011 2012 2011 2010
(millions of Canadian dollars except where otherwise indicated) (52 weeks) (52 weeks) (52 weeks)
Revenue $ 31,604 $ 31,250 $ 30,836
Net earnings 650 769 675
Basic net earnings per common share ($) 2.31 2.73 2.43
Diluted net earnings per common share ($) 2.28 2.71 2.38
Dividends declared per common share ($) 0.85 0.84 0.84
Dividends declared per Second Preferred Share, Series A ($) 1.49 1.49 1.49
(millions of Canadian dollars) As at
December 29, 2012 As at
December 31, 2011 As at
January 1, 2011
Total assets $ 17,961 $ 17,428 $ 16,841
Long term debt 5,669 5,580 6,100
Capital securities 223 222 221
Over the past three years, the Company’s sales were under pressure in a competitively intense retail market place with an uncertain economic environment. Average annual national food price inflation as measured by “The Consumer Price Index for Food Purchased from Stores” (“CPI”) was 2.3% in 2012 and 4.2% in 2011. In 2012 and 2011, the Company’s average annual internal retail food price index was lower than CPI. The Company experienced modest average annual internal food price inflation in 2012 and moderate inflation in 2011. In 2012, same-store sales(1) decline was 0.2% compared to growth of 0.9% in 2011. During the year, the number of corporate and franchise stores increased to 1,053 (2011 – 1,046; 2010 – 1,027). Retail square footage in 2012 increased to 51.5 million (2011 – 51.2 million; 2010 – 50.7 million). In 2012, to better position itself in an intensely competitive market place, the Company made investments in its customer proposition that were not covered by operations. These investments were focused on price, assortment and customer service and impacted both gross profit and selling, general and administrative expenses. Additionally, in 2012, the Company announced a plan that reduced the number of head office and administrative positions, affecting approximately 700 jobs. In both 2011 and 2012, the Company’s operating income was significantly impacted by incremental supply chain and IT charges related to its infrastructure implementation and charges associated with transitioning certain Ontario conventional stores to the more cost effective and efficient operating terms of collective agreements ratified in 2010. Operating income in 2011 and 2012 was further impacted by year-over-year fluctuations in fixed asset impairment charges and recoveries and other related charges and share-based compensation charges net of equity forwards. (1) For financial definitions and ratios refer to the Glossary of Terms on page 103.
2012 Annual Report – Financial Review 9
In addition to changes in operating income, over the past two years, net earnings and basic net earnings per common share were positively impacted by a decline in net interest expense and other financing charges compared to 2010, driven primarily by reductions in long term debt. Net earnings and basic net earnings per common share were also positively impacted by lower income taxes, partially due to declines in statutory income tax rates. In the last two years, total assets increased by 6.7% mainly due to increases in cash and cash equivalents, accounts receivable and credit card receivables and the Company’s capital investment program, partially offset by declines in security deposits and other assets. In the last two years, long term debt and capital securities decreased by 6.8%. In 2011, the Company repaid $500 million of Eagle Credit Card Trust® (“Eagle”) medium term notes (“MTN”) and a $350 million, 6.5% MTN. These repayments were partially offset by an increase in President’s Choice Bank’s (“PC Bank”) GIC program, which was introduced in 2010, and increases in debt associated with the Company’s Independent Funding Trusts and finance lease obligations. Cash flows from operating activities covered the Company’s funding requirements and exceeded the capital investment program in both 2012 and 2011. 6. Reportable Operating Segments Results of Operations 6.1 Retail Segment
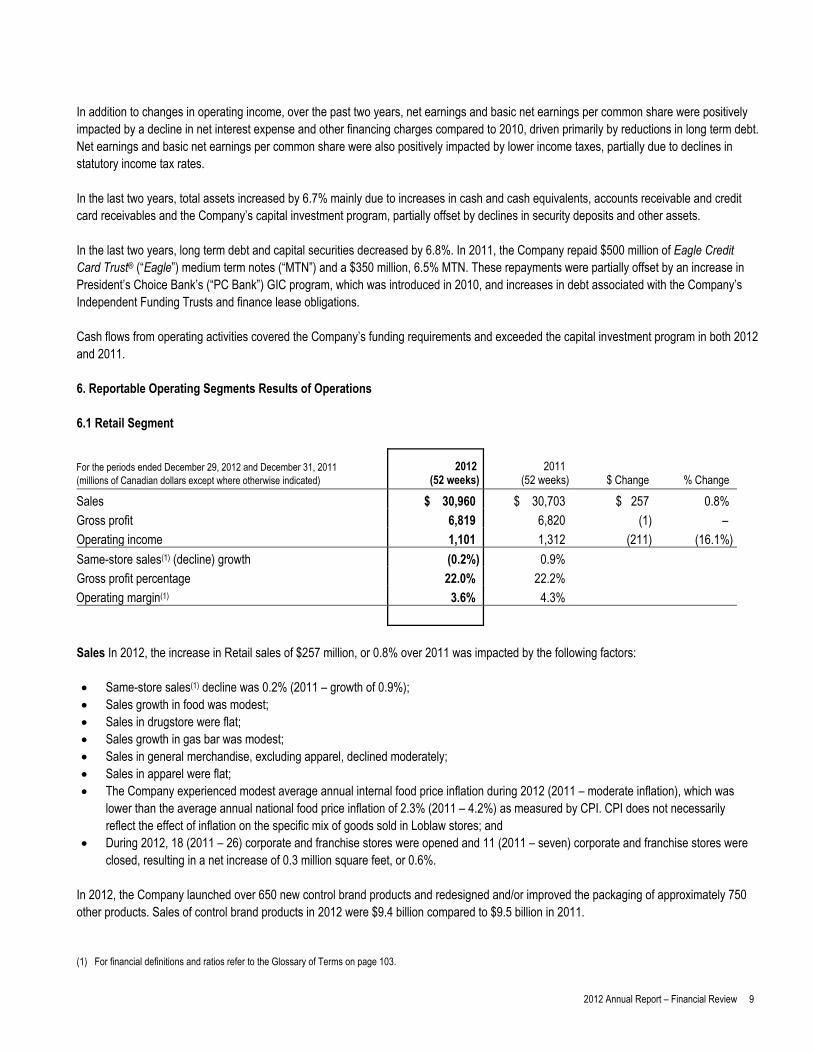
For the periods ended December 29, 2012 and December 31, 2011 (millions of Canadian dollars except where otherwise indicated)
2012 (52 weeks)
2011 (52 weeks)
$ Change % Change
Sales $ 30,960 $ 30,703 $ 257 0.8%
Gross profit 6,819 6,820 (1) –
Operating income 1,101 1,312 (211) (16.1%)
Same-store sales(1) (decline) growth (0.2%) 0.9%
Gross profit percentage 22.0% 22.2%
Operating margin(1) 3.6% 4.3%
Sales In 2012, the increase in Retail sales of $257 million, or 0.8% over 2011 was impacted by the following factors: Same-store sales(1) decline was 0.2% (2011 – growth of 0.9%); Sales growth in food was modest; Sales in drugstore were flat; Sales growth in gas bar was modest; Sales in general merchandise, excluding apparel, declined moderately; Sales in apparel were flat; The Company experienced modest average annual internal food price inflation during 2012 (2011 – moderate inflation), which was
lower than the average annual national food price inflation of 2.3% (2011 – 4.2%) as measured by CPI. CPI does not necessarily reflect the effect of inflation on the specific mix of goods sold in Loblaw stores; and
During 2012, 18 (2011 – 26) corporate and franchise stores were opened and 11 (2011 – seven) corporate and franchise stores were closed, resulting in a net increase of 0.3 million square feet, or 0.6%.
In 2012, the Company launched over 650 new control brand products and redesigned and/or improved the packaging of approximately 750 other products. Sales of control brand products in 2012 were $9.4 billion compared to $9.5 billion in 2011. (1) For financial definitions and ratios refer to the Glossary of Terms on page 103.
Management’s Discussion and Analysis
10 2012 Annual Report – Financial Review
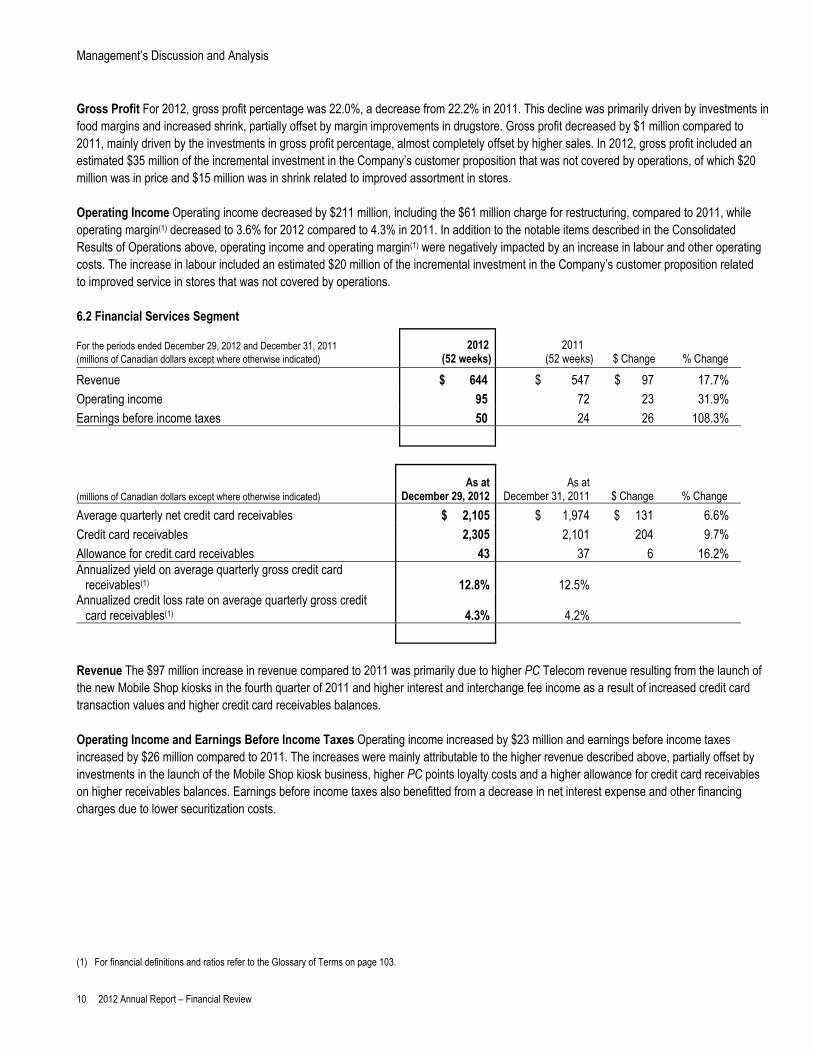
Gross Profit For 2012, gross profit percentage was 22.0%, a decrease from 22.2% in 2011. This decline was primarily driven by investments in food margins and increased shrink, partially offset by margin improvements in drugstore. Gross profit decreased by $1 million compared to 2011, mainly driven by the investments in gross profit percentage, almost completely offset by higher sales. In 2012, gross profit included an estimated $35 million of the incremental investment in the Company’s customer proposition that was not covered by operations, of which $20 million was in price and $15 million was in shrink related to improved assortment in stores. Operating Income Operating income decreased by $211 million, including the $61 million charge for restructuring, compared to 2011, while operating margin(1) decreased to 3.6% for 2012 compared to 4.3% in 2011. In addition to the notable items described in the Consolidated Results of Operations above, operating income and operating margin(1) were negatively impacted by an increase in labour and other operating costs. The increase in labour included an estimated $20 million of the incremental investment in the Company’s customer proposition related to improved service in stores that was not covered by operations. 6.2 Financial Services Segment
For the periods ended December 29, 2012 and December 31, 2011 (millions of Canadian dollars except where otherwise indicated)
2012 (52 weeks)
2011 (52 weeks)
$ Change % Change
Revenue $ 644 $ 547 $ 97 17.7%
Operating income 95 72 23 31.9%
Earnings before income taxes 50 24 26 108.3%
(millions of Canadian dollars except where otherwise indicated) As at
December 29, 2012 As at
December 31, 2011 $ Change % Change
Average quarterly net credit card receivables $ 2,105 $ 1,974 $ 131 6.6%
Credit card receivables 2,305 2,101 204 9.7%
Allowance for credit card receivables 43 37 6 16.2% Annualized yield on average quarterly gross credit card
receivables(1) 12.8% 12.5% Annualized credit loss rate on average quarterly gross credit
card receivables(1) 4.3% 4.2%
Revenue The $97 million increase in revenue compared to 2011 was primarily due to higher PC Telecom revenue resulting from the launch of the new Mobile Shop kiosks in the fourth quarter of 2011 and higher interest and interchange fee income as a result of increased credit card transaction values and higher credit card receivables balances. Operating Income and Earnings Before Income Taxes Operating income increased by $23 million and earnings before income taxes increased by $26 million compared to 2011. The increases were mainly attributable to the higher revenue described above, partially offset by investments in the launch of the Mobile Shop kiosk business, higher PC points loyalty costs and a higher allowance for credit card receivables on higher receivables balances. Earnings before income taxes also benefitted from a decrease in net interest expense and other financing charges due to lower securitization costs. (1) For financial definitions and ratios refer to the Glossary of Terms on page 103.

2012 Annual Report – Financial Review 11
7. Liquidity and Capital Resources 7.1 Cash Flows Major Cash Flow Components
For the periods ended December 29, 2012 and December 31, 2011 2012 2011
(millions of Canadian dollars except where otherwise indicated) (52 weeks) (52 weeks) $ Change % Change
Cash flows from (used in):
Operating activities $ 1,637 $ 1,814 $ (177) (9.8%)
Investing activities (989) (856) (133) (15.5%)
Financing activities (531) (853) 322 37.7%
Cash Flows from Operating Activities Cash flows from operating activities of $1,637 million, decreased by $177 million compared to $1,814 million in 2011. Cash flows from operating activities for 2012 included EBITDA(1) of $1,973 million and a net investment in non-cash working capital of $55 million, offset by income taxes paid of $232 million and a net increase in credit card receivables of $204 million. The lower cash flows from operations compared to 2011 were mainly due to a decrease in EBITDA(1) and increase in credit card receivables, partially offset by investment in non-cash working capital. Cash Flows used in Investing Activities Cash flows used in investing activities of $989 million, increased by $133 million compared to $856 million in 2011, primarily due to a reduction in security deposits as a result of the repayment of Eagle notes in 2011, increased fixed asset purchases and intangible asset additions in 2012, including the purchase of Zellers prescription files for approximately $31 million. Capital investment(2) in 2012 was $1.0 billion (2011 – $1.0 billion). Approximately 15% (2011 – 17%) of this investment was for new store developments, expansions and land, approximately 31% (2011 − 32%) was for store conversions and renovations, and approximately 54% (2011 − 51%) was for infrastructure investments. The 2012 corporate and franchise store capital investment program, which included the impact of store openings and closures, resulted in an increase in net retail square footage of 0.6% compared to 2011. During 2012, 18 (2011 – 26) corporate and franchise stores were opened and 11 (2011 – seven) corporate and franchise stores were closed, resulting in a net increase of 0.3 million square feet (2011 – 0.5 million square feet). In 2012, 181 (2011 – 121) corporate and franchise stores were renovated. As at December 29, 2012, the Company had committed approximately $60 million (2011 – $52 million) for the construction, expansion and renovation of buildings and the purchase of real property. The Company expects to invest approximately $1.0 billion in capital expenditures in 2013. Approximately 25% of these funds are expected to be dedicated to investing in the IT and supply chain projects, 65% will be spent on retail operations and 10% on other infrastructure. (1) See Non-GAAP Financial Measures on page 37 (2) For financial definitions and ratios refer to the Glossary of Terms on page 103.
Management’s Discussion and Analysis
12 2012 Annual Report – Financial Review
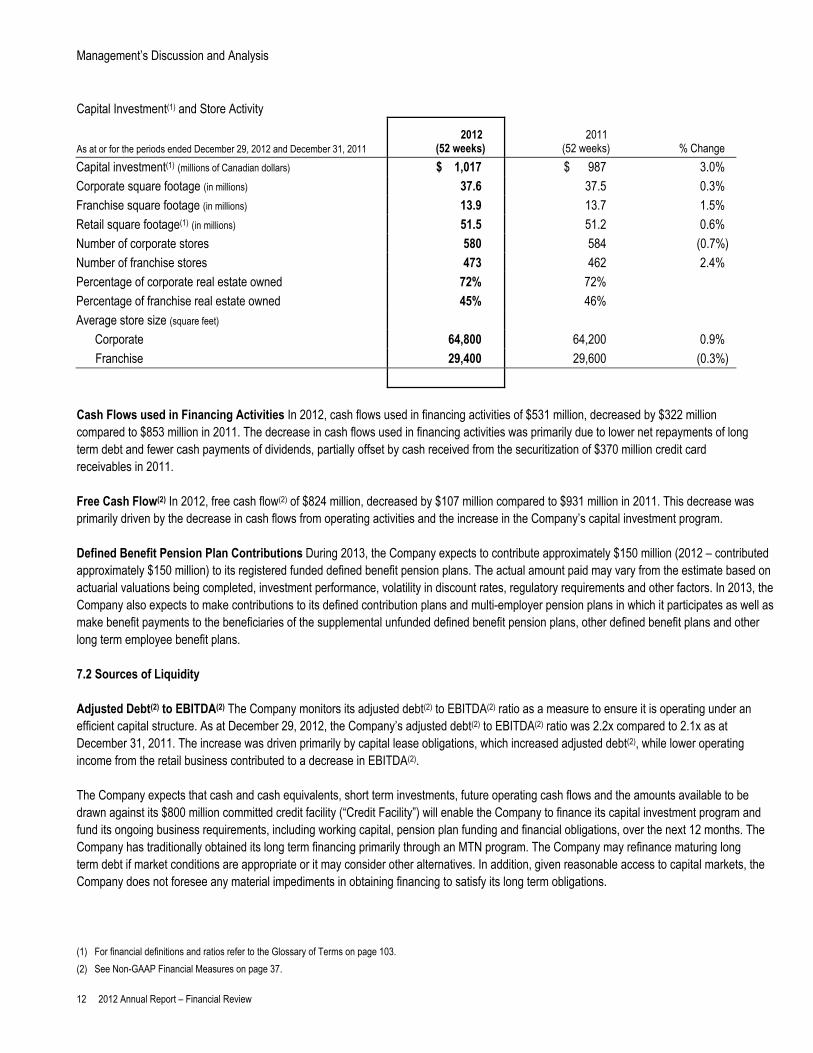
Capital Investment(1) and Store Activity
As at or for the periods ended December 29, 2012 and December 31, 2011 2012
(52 weeks) 2011
(52 weeks) % Change
Capital investment(1) (millions of Canadian dollars) $ 1,017 $ 987 3.0%
Corporate square footage (in millions) 37.6 37.5 0.3%
Franchise square footage (in millions) 13.9 13.7 1.5%
Retail square footage(1) (in millions) 51.5 51.2 0.6%
Number of corporate stores 580 584 (0.7%)
Number of franchise stores 473 462 2.4%
Percentage of corporate real estate owned 72% 72%
Percentage of franchise real estate owned 45% 46%
Average store size (square feet)
Corporate 64,800 64,200 0.9%
Franchise 29,400 29,600 (0.3%)
Cash Flows used in Financing Activities In 2012, cash flows used in financing activities of $531 million, decreased by $322 million compared to $853 million in 2011. The decrease in cash flows used in financing activities was primarily due to lower net repayments of long term debt and fewer cash payments of dividends, partially offset by cash received from the securitization of $370 million credit card receivables in 2011. Free Cash Flow(2) In 2012, free cash flow(2) of $824 million, decreased by $107 million compared to $931 million in 2011. This decrease was primarily driven by the decrease in cash flows from operating activities and the increase in the Company’s capital investment program. Defined Benefit Pension Plan Contributions During 2013, the Company expects to contribute approximately $150 million (2012 – contributed approximately $150 million) to its registered funded defined benefit pension plans. The actual amount paid may vary from the estimate based on actuarial valuations being completed, investment performance, volatility in discount rates, regulatory requirements and other factors. In 2013, the Company also expects to make contributions to its defined contribution plans and multi-employer pension plans in which it participates as well as make benefit payments to the beneficiaries of the supplemental unfunded defined benefit pension plans, other defined benefit plans and other long term employee benefit plans. 7.2 Sources of Liquidity Adjusted Debt(2) to EBITDA(2) The Company monitors its adjusted debt(2) to EBITDA(2) ratio as a measure to ensure it is operating under an efficient capital structure. As at December 29, 2012, the Company’s adjusted debt(2) to EBITDA(2) ratio was 2.2x compared to 2.1x as at December 31, 2011. The increase was driven primarily by capital lease obligations, which increased adjusted debt(2), while lower operating income from the retail business contributed to a decrease in EBITDA(2). The Company expects that cash and cash equivalents, short term investments, future operating cash flows and the amounts available to be drawn against its $800 million committed credit facility (“Credit Facility”) will enable the Company to finance its capital investment program and fund its ongoing business requirements, including working capital, pension plan funding and financial obligations, over the next 12 months. The Company has traditionally obtained its long term financing primarily through an MTN program. The Company may refinance maturing long term debt if market conditions are appropriate or it may consider other alternatives. In addition, given reasonable access to capital markets, the Company does not foresee any material impediments in obtaining financing to satisfy its long term obligations. (1) For financial definitions and ratios refer to the Glossary of Terms on page 103. (2) See Non-GAAP Financial Measures on page 37.
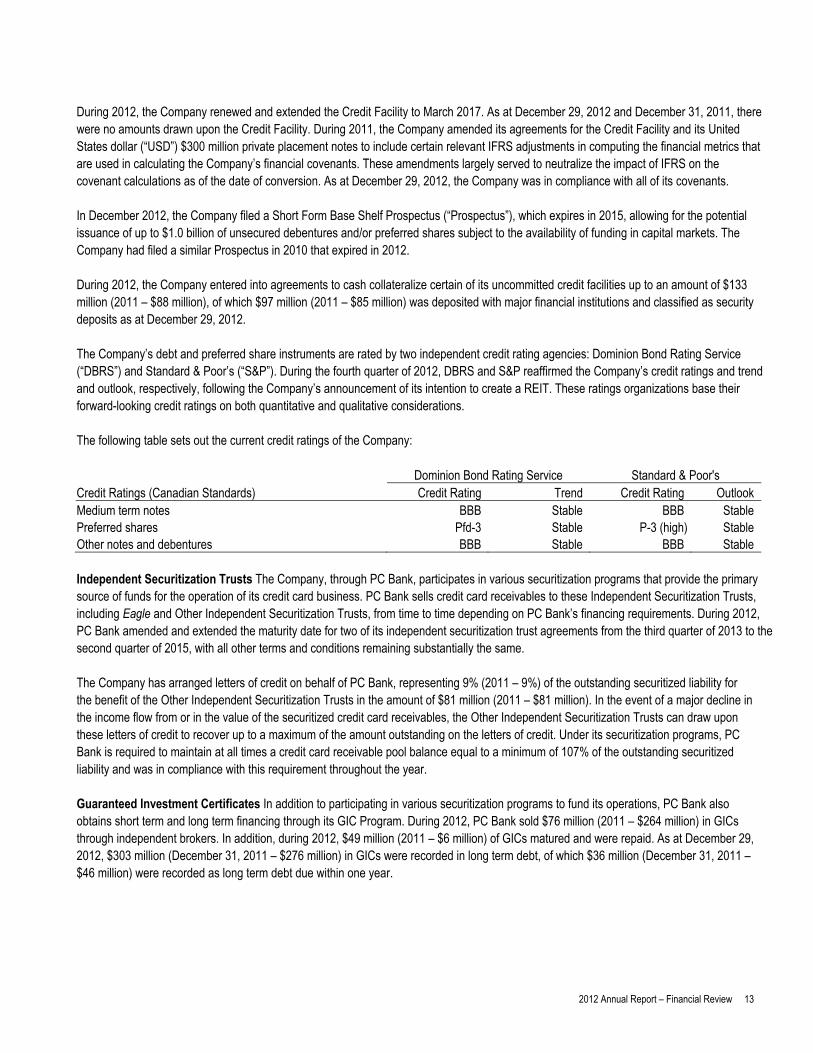
2012 Annual Report – Financial Review 13
During 2012, the Company renewed and extended the Credit Facility to March 2017. As at December 29, 2012 and December 31, 2011, there were no amounts drawn upon the Credit Facility. During 2011, the Company amended its agreements for the Credit Facility and its United States dollar (“USD”) $300 million private placement notes to include certain relevant IFRS adjustments in computing the financial metrics that are used in calculating the Company’s financial covenants. These amendments largely served to neutralize the impact of IFRS on the covenant calculations as of the date of conversion. As at December 29, 2012, the Company was in compliance with all of its covenants. In December 2012, the Company filed a Short Form Base Shelf Prospectus (“Prospectus”), which expires in 2015, allowing for the potential issuance of up to $1.0 billion of unsecured debentures and/or preferred shares subject to the availability of funding in capital markets. The Company had filed a similar Prospectus in 2010 that expired in 2012. During 2012, the Company entered into agreements to cash collateralize certain of its uncommitted credit facilities up to an amount of $133 million (2011 – $88 million), of which $97 million (2011 – $85 million) was deposited with major financial institutions and classified as security deposits as at December 29, 2012. The Company’s debt and preferred share instruments are rated by two independent credit rating agencies: Dominion Bond Rating Service (“DBRS”) and Standard & Poor’s (“S&P”). During the fourth quarter of 2012, DBRS and S&P reaffirmed the Company’s credit ratings and trend and outlook, respectively, following the Company’s announcement of its intention to create a REIT. These ratings organizations base their forward-looking credit ratings on both quantitative and qualitative considerations. The following table sets out the current credit ratings of the Company:
Dominion Bond Rating Service Standard & Poor's Credit Ratings (Canadian Standards) Credit Rating Trend Credit Rating Outlook Medium term notes BBB Stable BBB Stable Preferred shares Pfd-3 Stable P-3 (high) Stable Other notes and debentures BBB Stable BBB Stable Independent Securitization Trusts The Company, through PC Bank, participates in various securitization programs that provide the primary source of funds for the operation of its credit card business. PC Bank sells credit card receivables to these Independent Securitization Trusts, including Eagle and Other Independent Securitization Trusts, from time to time depending on PC Bank’s financing requirements. During 2012, PC Bank amended and extended the maturity date for two of its independent securitization trust agreements from the third quarter of 2013 to the second quarter of 2015, with all other terms and conditions remaining substantially the same. The Company has arranged letters of credit on behalf of PC Bank, representing 9% (2011 – 9%) of the outstanding securitized liability for the benefit of the Other Independent Securitization Trusts in the amount of $81 million (2011 – $81 million). In the event of a major decline in the income flow from or in the value of the securitized credit card receivables, the Other Independent Securitization Trusts can draw upon these letters of credit to recover up to a maximum of the amount outstanding on the letters of credit. Under its securitization programs, PC Bank is required to maintain at all times a credit card receivable pool balance equal to a minimum of 107% of the outstanding securitized liability and was in compliance with this requirement throughout the year. Guaranteed Investment Certificates In addition to participating in various securitization programs to fund its operations, PC Bank also obtains short term and long term financing through its GIC Program. During 2012, PC Bank sold $76 million (2011 – $264 million) in GICs through independent brokers. In addition, during 2012, $49 million (2011 – $6 million) of GICs matured and were repaid. As at December 29, 2012, $303 million (December 31, 2011 – $276 million) in GICs were recorded in long term debt, of which $36 million (December 31, 2011 – $46 million) were recorded as long term debt due within one year.
Management’s Discussion and Analysis
14 2012 Annual Report – Financial Review
Independent Funding Trusts Certain independent franchisees of the Company obtain financing through a structure involving independent funding trusts, which were created to provide loans to the independent franchisees to facilitate their purchase of inventory and fixed assets, consisting mainly of fixtures and equipment. These independent funding trusts are administered by a major financial institution. During 2012, the Company amended and increased the size of the revolving committed credit facility that is the source of funding to the independent funding trust from $475 million to $575 million. Other terms and conditions remain substantially the same. This facility bears interest at variable rates and expires in 2014. As at December 29, 2012, the independent funding trust had drawn $459 million (December 31, 2011 – $424 million) from this committed credit facility. The Company provides credit enhancement in the form of a standby letter of credit for the benefit of the independent funding trusts representing not less than 10% (2011 – 10%) of the principal amount of the loans outstanding. As at December 29, 2012, the Company had provided a letter of credit in the amount of $48 million (December 31, 2011 – $48 million). The credit enhancement allows the independent funding trusts to provide financing to the Company’s independent franchisees. As well, each franchisee provides security to the independent funding trusts for its obligations by way of a general security agreement. In the event that an independent franchisee defaults on its loan and the Company has not, within a specified time period, assumed the loan, or the default is not otherwise remedied, the independent funding trusts would assign the loan to the Company and draw upon this standby letter of credit. This standby letter of credit has never been drawn upon. The Company has agreed to reimburse the issuing bank for any amount drawn on the standby letter of credit. 7.3 Capital Structure First Preferred Shares 1.0 million non-voting First Preferred Shares are authorized, none of which were issued and outstanding at year end. Capital Securities 12.0 million non-voting Second Preferred Shares, Series A, are authorized, 9.0 million of which were outstanding at year end. These preferred shares are classified as capital securities and included in long term liabilities on the consolidated balance sheet. Common Share Capital An unlimited number of common shares are authorized, 281,680,157 of which were outstanding at year end. At year end, a total of 12,538,928 stock options were outstanding, representing 4.5% of the Company’s issued and outstanding common shares. Each stock option is exercisable into one common share of the Company at the price specified in the terms of the option agreement. At the Company’s Annual and Special Meeting of Shareholders on May 3, 2012, the shareholders approved an amendment to the Company’s employee stock option plan that increased the total number of common shares authorized for issuance under the plan by 14,428,484 to 28,137,162 common shares. This amendment increased the Company’s number of common shares authorized for issuance under the stock option plan from 5% to 10% of the total issued and outstanding common shares. Dividends The amount of cash dividends declared in 2012 and 2011 is as follows:
For the periods ended December 29, 2012 and December 31, 2011 2012 2011
Dividends declared per share ($):
Common share $ 0.85 $ 0.84
Second Preferred Share, Series A $ 1.49 $ 1.49
2012 Annual Report – Financial Review 15
During 2012, the Company amended its dividend policy to state: the declaration and payment of dividends on the Company’s common shares and the amount thereof are at the discretion of the Board of Directors (“Board”), which takes into account the Company’s financial results, capital requirements, available cash flow, future prospects of the Company’s business and other factors considered relevant from time to time. Over the long term, it is the Company’s intention to increase the amount of the dividend while retaining appropriate free cash flow to finance future growth. During the fourth quarter of 2012, the Board raised the quarterly dividend by approximately 4.8%, to $0.22 per common share. Subsequent to the end of the year, the Board declared a quarterly dividend of $0.22 per common share payable April 1, 2013 and a quarterly dividend of $0.37 per Second Preferred Share, Series A payable April 30, 2013. At the time dividends are declared, the Company identifies on its website (loblaw.ca) the designation of eligible and ineligible dividends in accordance with the administrative position of the Canada Revenue Agency. Normal Course Issuer Bid During 2012, the Company renewed its Normal Course Issuer Bid (“NCIB”) to purchase on the Toronto Stock Exchange (“TSX”), or to enter into equity derivatives to purchase, up to 14,070,352 (2011 – 14,096,437) of the Company’s common shares, representing approximately 5% of the common shares outstanding. In accordance with the rules and by-laws of the TSX, any purchases must be at the then market prices of such shares. During 2012, the Company purchased for cancellation 423,705 (2011 – 1,021,986) common shares under the NCIB, resulting in a charge to retained earnings of $14 million (2011 – $33 million) for the premium on the common shares and a reduction in common share capital of $2 million (2011 – $6 million). The Company intends to renew its NCIB in 2013. 7.4 Financial Derivative Instruments Cross Currency Swaps As at December 29, 2012, Glenhuron Bank Limited (“Glenhuron”) held cross currency swaps to exchange USD for $1,199 million (December 31, 2011 – $1,252 million) Canadian dollars. The swaps mature by 2019 and are financial derivatives classified as fair value through profit or loss. Currency adjustments receivable or payable arising from these swaps are settled in cash on maturity. As at December 29, 2012, a cumulative unrealized foreign currency exchange rate receivable of $93 million (December 31, 2011 – $89 million) was recorded in other assets, and a receivable of $20 million (December 31, 2011 – $48 million) was recorded in prepaid expenses and other assets. During 2012, a fair value gain of $25 million (2011 – loss of $29 million) was recognized in operating income relating to these cross currency swaps. Offsetting the fair value gain was a loss of $27 million (2011 – gain of $25 million) as a result of translating USD $1,113 million (December 31, 2011 – USD $1,073 million) cash and cash equivalents, short term investments and security deposits, which was also recognized in operating income. In 2008, the Company entered into fixed cross currency swaps to exchange $148 million Canadian dollars for USD $150 million, which mature in the second quarter of 2013 and entered into additional fixed cross currency swaps to exchange $148 million Canadian dollars for USD $150 million, which mature by 2015. A portion of these cross currency swaps was originally designated in a cash flow hedge to manage the foreign exchange variability related to part of the Company’s fixed rate US Private Placement (“USPP”) notes. In 2011, the designated swap was no longer classified as a cash flow hedge and as a result, fair value changes were recorded in operating income. As at December 29, 2012, a cumulative unrealized foreign currency exchange rate receivable of $5 million (December 31, 2011 – $14 million) was recorded in other assets and a receivable of $2 million (December 31, 2011 – nil) was recorded in prepaid expenses and other assets. During 2012, the Company recognized in operating income an unrealized fair value loss of $7 million (2011 – gain of $2 million) on these cross currency swaps. Offsetting the unrealized fair value loss was an unrealized foreign currency exchange gain of $6 million (2011 – loss of $6 million), which was also recognized in operating income, related to the translation of USD $300 million USPP. Interest Rate Swaps The Company maintains a notional $150 million (2011 − $150 million) in interest rate swaps that mature by the third quarter of 2013, on which it pays a fixed rate of 8.38%. At December 29, 2012, the fair value of these interest rate swaps of $5 million (December 31, 2011 – $16 million) was recorded in other liabilities. During 2012, the Company recognized a fair value gain of $11 million (2011 – gain of $8 million) in operating income related to these swaps. Interest rate swaps previously held by Glenhuron converted a notional $200 million of floating rate cash and cash equivalents, short term investments and security deposits to average fixed rate investments at 4.74%. These interest rate swaps matured in 2011. During 2012, no fair value loss (2011 – $7 million) was recognized on these interest rate swaps in operating income.

Management’s Discussion and Analysis
16 2012 Annual Report – Financial Review
Equity Forward Contracts As at December 29, 2012, Glenhuron had cumulative equity forward contracts to buy 1.1 million (December 31, 2011 – 1.1 million) of the Company’s common shares at an average forward price of $56.59 (December 31, 2011 – $56.38) including $0.16 interest expense (December 31, 2011 – $0.05 interest income) per common share. In 2012, Glenhuron recognized a $5 million gain (2011 – $2 million expense) in operating income in relation to these equity forwards. In addition, during 2011 Glenhuron paid $7 million to settle equity forwards representing 390,100 Loblaw common shares, which the Company purchased for cancellation for $15 million under its NCIB. As at December 29, 2012, the cumulative accrued interest and unrealized market loss of $16 million (December 31, 2011 – loss of $20 million) was included in trade payables and other liabilities. Subsequent to the end of 2012, these equity forwards were settled. Please refer to Section 8. Other Business Matters for further details. 7.5 Contractual Obligations The following illustrates certain of the Company’s significant contractual obligations and discusses other obligations as at December 29, 2012: Summary of Contractual Obligations
Payments due by year
(millions of Canadian dollars) 2013 2014 2015 2016 2017 Thereafter Total
Long term debt (including fixed interest payments(1)) $ 973 $ 1,237 $ 777 $ 640 $ 284 $ 5,925 $ 9,836
Operating leases(2) 202 185 162 132 108 442 1,231
Contracts for purchases of
Real property and Capital
Investment projects(3) 57 1 1 1 – – 60
Purchase obligations(4) 142 107 73 25 24 – 371
Total contractual obligations $ 1,374 $ 1,530 $ 1,013 $ 798 $ 416 $ 6,367 $ 11,498
(1) Fixed interest payments are based on the maturing face values and annual interest for each instrument, including GICs, long term independent securitization trusts and an independent funding trust, as well as annual payment obligations for Special Purpose Entities, mortgages and finance lease obligations.
(2) Represents the minimum or base rents payable. Amounts are not offset by any expected sub-lease income. (3) These obligations include agreements for the purchase of real property and capital commitments for construction, expansion and renovation of buildings. These agreements
may contain conditions that may or may not be satisfied. If the conditions are not satisfied, it is possible the Company will no longer have the obligation to proceed with the underlying transactions.
(4) Include contractual obligations to purchase goods or services of a material amount where the contract prescribes fixed or minimum volumes to be purchased or payments to be made within a fixed period of time for a set or variable price. These are only estimates of anticipated financial commitments under these arrangements and the amount of actual payments will vary. These purchase obligations do not include purchase orders issued or agreements made in the ordinary course of business which are solely for goods which are meant for resale, nor do they include any contracts which may be terminated on relatively short notice or with relatively insignificant cost or liability to the Company.
At year end, the Company had additional long term liabilities which included defined benefit plan and other long term employee benefit plan liabilities, deferred vendor allowances, share-based compensation liabilities and provisions, including insurance liabilities. These long term liabilities have not been included above as the timing and amount of future payments are uncertain. 7.6 Off-Balance Sheet Arrangements
In the normal course of business, the Company enters into off-balance sheet arrangements including: Letters of Credit Standby and documentary letters of credit are used in connection with certain obligations mainly related to real estate transactions, benefit programs, purchase orders and performance guarantees, securitization of PC Bank’s credit card receivables and third party financing made available to the Company’s independent franchisees. The aggregate gross potential liability related to the Company’s letters of credit is approximately $477 million (2011 – $443 million).
2012 Annual Report – Financial Review 17
Guarantees In addition to the letters of credit mentioned above, the Company has entered into various guarantee agreements including obligations to indemnify third parties in connection with leases, business dispositions and other transactions in the normal course of the Company’s business. Additionally, the Company has provided a guarantee on behalf of PC Bank to MasterCard® International Incorporated in the amount of USD $230 million (2011 – USD $180 million) for accepting PC Bank as a card member and licensee of MasterCard®. 8. Other Business Matters IT and Other Systems Implementations The Company is undertaking a major upgrade of its IT infrastructure that began in 2010. This project constitutes one of the largest technology infrastructure programs ever implemented by the Company and is fundamental to its long term growth strategies. During 2012, the Company continued to make progress on the implementation of the new IT system and successfully achieved two of its key milestones – the implementation at the first distribution centre and first store, with little to no impact to the Company’s customers. In addition, in 2012, as part of the implementation process, the Company added all of the supply chain master data to the system. This master data, including delivery schedules, replenishment and costing information, now originates in the new system. In 2013, the Company will roll-out the IT system to the remaining distribution centres and a portion of the store network. Real Estate Investment Trust In December 2012, the Company announced its intention to create a REIT, which will acquire a significant portion of Loblaw’s real estate assets and sell units by way of an IPO. The IPO of the REIT is expected to be completed by mid-2013, subject to prevailing market conditions and receipt of required regulatory approvals, including approval to list the units on the TSX. Restricted Share Unit and Performance Share Unit Plans Subsequent to the end of the year, the Company’s Restricted Share Unit (“RSU”) and Performance Share Unit (“PSU”) plans were amended to require settlement in equity. A trust has been established to facilitate the purchase of shares for future settlement for each of the RSU and PSU plans upon vesting. These trusts will be consolidated into the results of the Company on an ongoing basis. On January 7, 2013, Glenhuron paid $16 million to settle the remaining equity forwards representing 1,103,500 Loblaw common shares, which the Company purchased under its NCIB for $46 million, and placed them into the trusts. Pension Plan Changes Subsequent to the end of the year, the Company announced changes to certain of its defined benefit pension and post-employment benefits plans impacting certain employees retiring after January 1, 2015. These changes are expected to result in a one-time gain of approximately $51 million, which will be recorded in the first quarter of 2013. 9. Quarterly Results of Operations 9.1 Results by Quarter Under an accounting convention common in the food retail industry the Company follows a 52-week reporting cycle which periodically necessitates a fiscal year of 53 weeks. The 52-week reporting cycle is divided into four quarters of 12 weeks each except for the third quarter, which is 16 weeks in duration. The following is a summary of selected consolidated financial information derived from the Company’s unaudited interim period condensed consolidated financial statements for each of the eight most recently completed quarters.
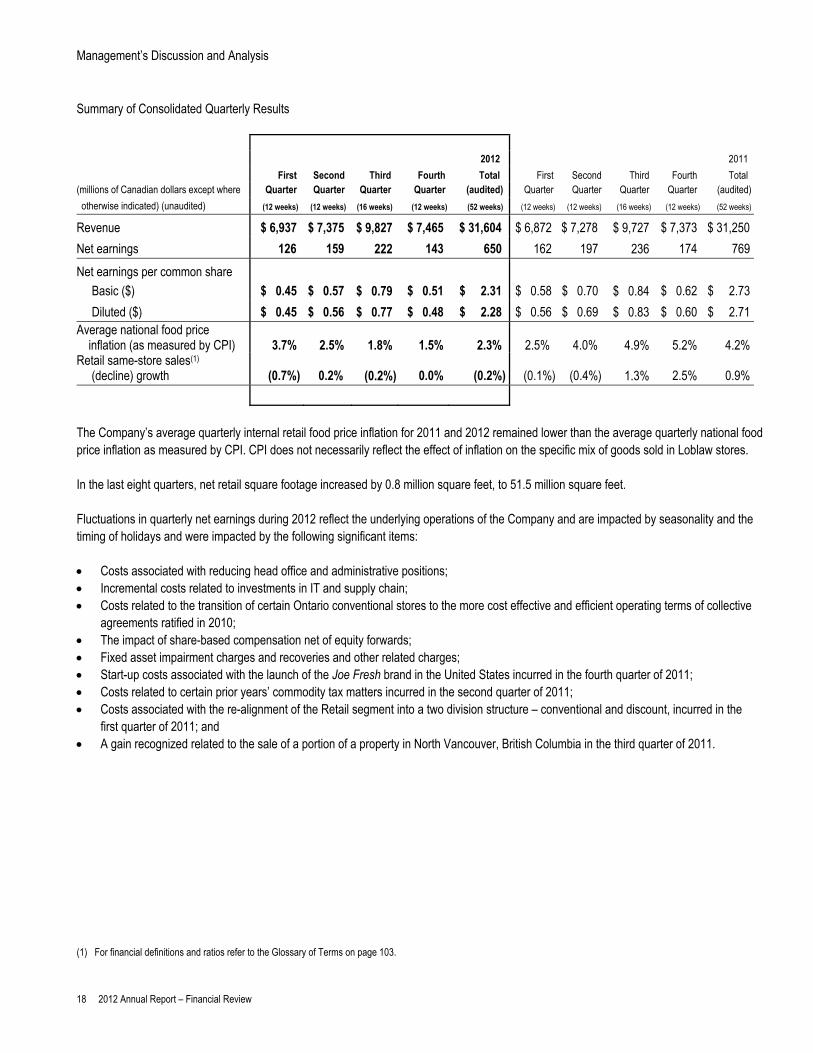
Management’s Discussion and Analysis
18 2012 Annual Report – Financial Review
Summary of Consolidated Quarterly Results
2012 2011
First Second Third Fourth Total First Second Third Fourth Total (millions of Canadian dollars except where Quarter Quarter Quarter Quarter (audited) Quarter Quarter Quarter Quarter (audited)
otherwise indicated) (unaudited) (12 weeks) (12 weeks) (16 weeks) (12 weeks) (52 weeks) (12 weeks) (12 weeks) (16 weeks) (12 weeks) (52 weeks)
Revenue $ 6,937 $ 7,375 $ 9,827 $ 7,465 $ 31,604 $ 6,872 $ 7,278 $ 9,727 $ 7,373 $ 31,250
Net earnings 126 159 222 143 650 162 197 236 174 769
Net earnings per common share
Basic ($) $ 0.45 $ 0.57 $ 0.79 $ 0.51 $ 2.31 $ 0.58 $ 0.70 $ 0.84 $ 0.62 $ 2.73
Diluted ($) $ 0.45 $ 0.56 $ 0.77 $ 0.48 $ 2.28 $ 0.56 $ 0.69 $ 0.83 $ 0.60 $ 2.71 Average national food price
inflation (as measured by CPI) 3.7% 2.5% 1.8% 1.5% 2.3% 2.5% 4.0% 4.9% 5.2% 4.2% Retail same-store sales(1)
(decline) growth (0.7%) 0.2% (0.2%) 0.0% (0.2%) (0.1%) (0.4%) 1.3% 2.5% 0.9%
The Company’s average quarterly internal retail food price inflation for 2011 and 2012 remained lower than the average quarterly national food price inflation as measured by CPI. CPI does not necessarily reflect the effect of inflation on the specific mix of goods sold in Loblaw stores. In the last eight quarters, net retail square footage increased by 0.8 million square feet, to 51.5 million square feet. Fluctuations in quarterly net earnings during 2012 reflect the underlying operations of the Company and are impacted by seasonality and the timing of holidays and were impacted by the following significant items: Costs associated with reducing head office and administrative positions; Incremental costs related to investments in IT and supply chain; Costs related to the transition of certain Ontario conventional stores to the more cost effective and efficient operating terms of collective
agreements ratified in 2010; The impact of share-based compensation net of equity forwards; Fixed asset impairment charges and recoveries and other related charges; Start-up costs associated with the launch of the Joe Fresh brand in the United States incurred in the fourth quarter of 2011; Costs related to certain prior years’ commodity tax matters incurred in the second quarter of 2011; Costs associated with the re-alignment of the Retail segment into a two division structure – conventional and discount, incurred in the
first quarter of 2011; and A gain recognized related to the sale of a portion of a property in North Vancouver, British Columbia in the third quarter of 2011. (1) For financial definitions and ratios refer to the Glossary of Terms on page 103.

2012 Annual Report – Financial Review 19
9.2 Fourth Quarter Results The following is a summary of selected consolidated unaudited financial information for the fourth quarter of 2012. Selected Consolidated Information for the Fourth Quarter
For the periods ended December 29, 2012 and December 31, 2011 (unaudited) 2012 2011
(millions of Canadian dollars except where otherwise indicated) (12 weeks) (12 weeks) $ Change % Change
Revenue $ 7,465 $ 7,373 $ 92 1.2%
Operating income 262 315 (53) (16.8%)
Interest expense and other financing charges 80 81 (1) (1.2%)
Income taxes 39 60 (21) (35.0%)
Net earnings 143 174 (31) (17.8%)
Basic net earnings per common share ($) 0.51 0.62 (0.11) (17.7%)
Operating margin(1) 3.5% 4.3%
EBITDA(2) 449 485 (36) (7.4%)
EBITDA margin(2) 6.0% 6.6%
Cash flows from (used in):
Operating activities 605 620 (15) (2.4%)
Investing activities (223) (414) 191 46.1%
Financing activities (54) (226) 172 76.1%
Dividends declared per common share ($) 0.22 0.21 0.01 4.8%
Dividends declared on Second Preferred Share, Series A ($) 0.37 0.37 – –
During the fourth quarter of 2012, the Company announced a plan that reduced the number of head office and administrative positions. Focused primarily on management and office positions, the plan affected approximately 700 jobs. In the fourth quarter of 2012, the Company incurred a $61 million charge associated with this restructuring. During the fourth quarter of 2012, the Company incurred a $15 million charge related to its incremental investment in its customer proposition that was not covered by operations. Of this amount, $10 million was in shrink, which was included in gross profit, and $5 million was in labour. The $92 million increase in revenue compared to the fourth quarter of 2011 was driven by increases in both the Company’s Retail and Financial Services operating segments, as described below. (1) For financial definitions and ratios refer to the Glossary of Terms on page 103. (2) See Non-GAAP Financial Measures on page 37.

Management’s Discussion and Analysis
20 2012 Annual Report – Financial Review
Operating income decreased by $53 million compared to the fourth quarter of 2011 as a result of a decrease in Retail operating income of $69 million partially offset by an increase in Financial Services operating income of $16 million. Consolidated operating income included the following notable items: A $61 million charge associated with the reduction in head office and administrative positions; Incremental costs of $19 million related to investments in IT and supply chain. These costs included the following charges:
o $79 million (2011 – $67 million) related to IT costs; o $53 million (2011 – $43 million) related to depreciation and amortization; o $2 million (2011 – nil) related to changes in the distribution network; and o $2 million (2011 – $7 million) related to other supply chain project costs.
A $17 million charge (2011 – $5 million) for fixed asset impairments net of recoveries, related to asset carrying values in excess of recoverable amounts for specific retail locations;
A $5 million charge (2011 – $23 million) related to the transition of certain Ontario conventional stores to the more cost effective and efficient operating terms of collective agreements ratified in 2010;
A $2 million charge (2011 – $4 million) related to the effect of share-based compensation net of equity forwards; and A nil charge (2011 – $16 million) related to start-up costs associated with the launch of the Company’s Joe Fresh brand in the United
States. Operating margin(1) was 3.5%, or 4.3% excluding the charge for restructuring, for the fourth quarter of 2012, compared to 4.3% in the same quarter in 2011. EBITDA(2) decreased by $36 million in the fourth quarter of 2012, including the $61 million charge for restructuring, compared to 2011. EBITDA margin(2) was 6.0%, or 6.8% excluding the charge for restructuring, compared to 6.6% in the fourth quarter of 2011. In the fourth quarter of 2012, net interest expense and other financing charges was consistent with the fourth quarter of 2011. The income tax expense for the fourth quarter 2012 was $39 million (2011 – $60 million). The effective income tax rate for the fourth quarter of 2012 was 21.4% (2011 – 25.6%). This decrease was primarily due to further reductions in the Federal and Ontario statutory income tax rates and a change in the proportion of taxable income earned across different tax jurisdictions. The decrease in net earnings of $31 million compared to the fourth quarter of 2011 was primarily due to the decrease in operating income, partially offset by the decline in the effective income tax rate.
Basic net earnings per common share were impacted by the following notable items: A $0.16 charge related to the reduction in head office and administrative positions; A $0.05 charge related to incremental investments in IT and supply chain; A $0.05 charge (2011 – $0.01) for fixed asset impairments net of recoveries; A $0.01 charge (2011 – $0.06) related to the transition of certain Ontario conventional stores to the operating terms under collective
agreements ratified in 2010; A nil charge (2011 – $0.01) related to the effect of share-based compensation net of equity forwards; and A nil charge (2011 – $0.04) related to the start-up costs associated with the launch of the Company’s Joe Fresh brand in the United
States. (1) For financial definitions and ratios refer to the Glossary of Terms on page 103. (2) See Non-GAAP Financial Measures on page 37.
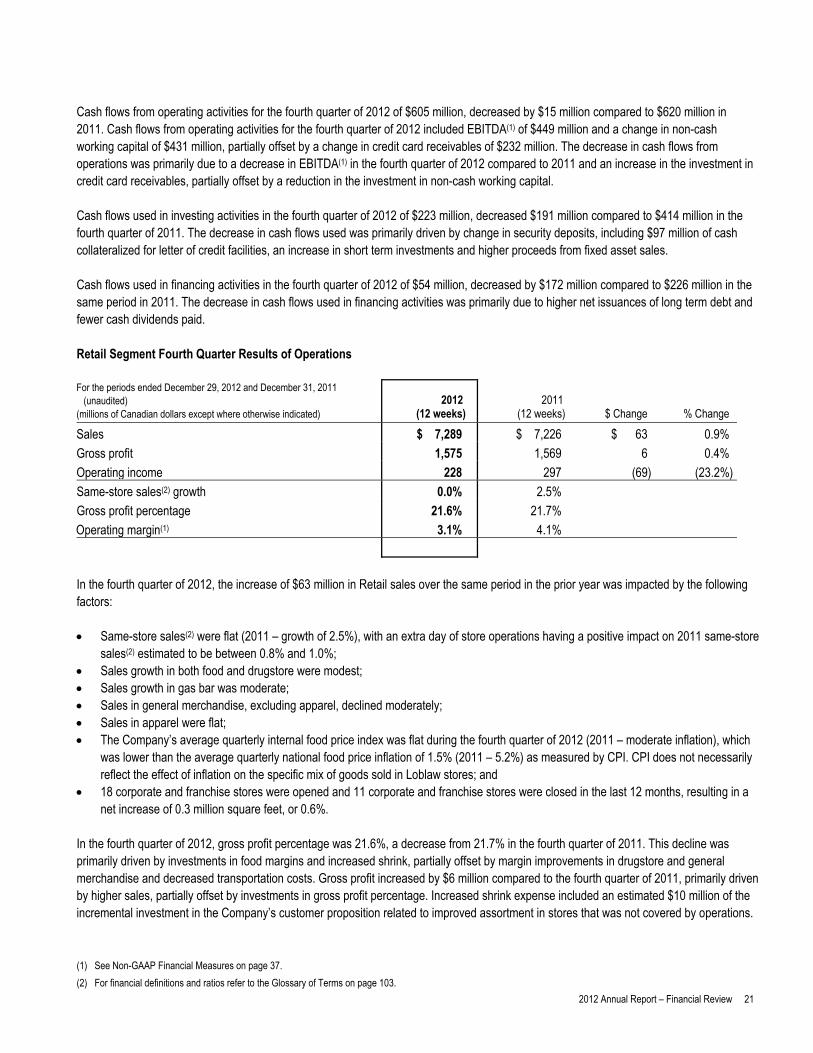
2012 Annual Report – Financial Review 21
Cash flows from operating activities for the fourth quarter of 2012 of $605 million, decreased by $15 million compared to $620 million in 2011. Cash flows from operating activities for the fourth quarter of 2012 included EBITDA(1) of $449 million and a change in non-cash working capital of $431 million, partially offset by a change in credit card receivables of $232 million. The decrease in cash flows from operations was primarily due to a decrease in EBITDA(1) in the fourth quarter of 2012 compared to 2011 and an increase in the investment in credit card receivables, partially offset by a reduction in the investment in non-cash working capital. Cash flows used in investing activities in the fourth quarter of 2012 of $223 million, decreased $191 million compared to $414 million in the fourth quarter of 2011. The decrease in cash flows used was primarily driven by change in security deposits, including $97 million of cash collateralized for letter of credit facilities, an increase in short term investments and higher proceeds from fixed asset sales. Cash flows used in financing activities in the fourth quarter of 2012 of $54 million, decreased by $172 million compared to $226 million in the same period in 2011. The decrease in cash flows used in financing activities was primarily due to higher net issuances of long term debt and fewer cash dividends paid. Retail Segment Fourth Quarter Results of Operations For the periods ended December 29, 2012 and December 31, 2011
(unaudited) (millions of Canadian dollars except where otherwise indicated)
2012 (12 weeks)
2011 (12 weeks) $ Change % Change
Sales $ 7,289 $ 7,226 $ 63 0.9%
Gross profit 1,575 1,569 6 0.4%
Operating income 228 297 (69) (23.2%)
Same-store sales(2) growth 0.0% 2.5%
Gross profit percentage 21.6% 21.7%
Operating margin(1) 3.1% 4.1% In the fourth quarter of 2012, the increase of $63 million in Retail sales over the same period in the prior year was impacted by the following factors: Same-store sales(2) were flat (2011 – growth of 2.5%), with an extra day of store operations having a positive impact on 2011 same-store
sales(2) estimated to be between 0.8% and 1.0%; Sales growth in both food and drugstore were modest; Sales growth in gas bar was moderate; Sales in general merchandise, excluding apparel, declined moderately; Sales in apparel were flat; The Company’s average quarterly internal food price index was flat during the fourth quarter of 2012 (2011 – moderate inflation), which
was lower than the average quarterly national food price inflation of 1.5% (2011 – 5.2%) as measured by CPI. CPI does not necessarily reflect the effect of inflation on the specific mix of goods sold in Loblaw stores; and
18 corporate and franchise stores were opened and 11 corporate and franchise stores were closed in the last 12 months, resulting in a net increase of 0.3 million square feet, or 0.6%.
In the fourth quarter of 2012, gross profit percentage was 21.6%, a decrease from 21.7% in the fourth quarter of 2011. This decline was primarily driven by investments in food margins and increased shrink, partially offset by margin improvements in drugstore and general merchandise and decreased transportation costs. Gross profit increased by $6 million compared to the fourth quarter of 2011, primarily driven by higher sales, partially offset by investments in gross profit percentage. Increased shrink expense included an estimated $10 million of the incremental investment in the Company’s customer proposition related to improved assortment in stores that was not covered by operations. (1) See Non-GAAP Financial Measures on page 37. (2) For financial definitions and ratios refer to the Glossary of Terms on page 103.
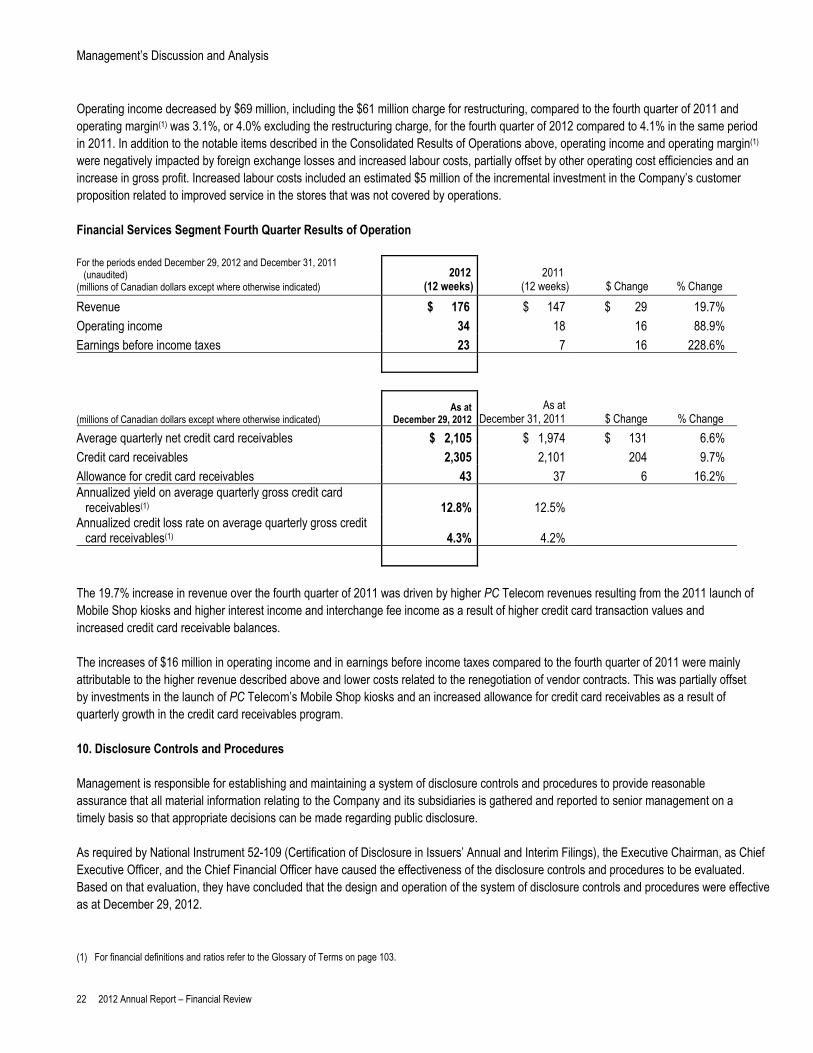
Management’s Discussion and Analysis
22 2012 Annual Report – Financial Review
Operating income decreased by $69 million, including the $61 million charge for restructuring, compared to the fourth quarter of 2011 and operating margin(1) was 3.1%, or 4.0% excluding the restructuring charge, for the fourth quarter of 2012 compared to 4.1% in the same period in 2011. In addition to the notable items described in the Consolidated Results of Operations above, operating income and operating margin(1) were negatively impacted by foreign exchange losses and increased labour costs, partially offset by other operating cost efficiencies and an increase in gross profit. Increased labour costs included an estimated $5 million of the incremental investment in the Company’s customer proposition related to improved service in the stores that was not covered by operations. Financial Services Segment Fourth Quarter Results of Operation For the periods ended December 29, 2012 and December 31, 2011
(unaudited) (millions of Canadian dollars except where otherwise indicated)
2012 (12 weeks)
2011 (12 weeks) $ Change % Change
Revenue $ 176 $ 147 $ 29 19.7%
Operating income 34 18 16 88.9%
Earnings before income taxes 23 7 16 228.6%
(millions of Canadian dollars except where otherwise indicated) As at
December 29, 2012 As at
December 31, 2011 $ Change % Change
Average quarterly net credit card receivables $ 2,105 $ 1,974 $ 131 6.6%
Credit card receivables 2,305 2,101 204 9.7%
Allowance for credit card receivables 43 37 6 16.2% Annualized yield on average quarterly gross credit card
receivables(1) 12.8% 12.5% Annualized credit loss rate on average quarterly gross credit
card receivables(1) 4.3% 4.2%
The 19.7% increase in revenue over the fourth quarter of 2011 was driven by higher PC Telecom revenues resulting from the 2011 launch of Mobile Shop kiosks and higher interest income and interchange fee income as a result of higher credit card transaction values and increased credit card receivable balances.
The increases of $16 million in operating income and in earnings before income taxes compared to the fourth quarter of 2011 were mainly attributable to the higher revenue described above and lower costs related to the renegotiation of vendor contracts. This was partially offset by investments in the launch of PC Telecom’s Mobile Shop kiosks and an increased allowance for credit card receivables as a result of quarterly growth in the credit card receivables program. 10. Disclosure Controls and Procedures Management is responsible for establishing and maintaining a system of disclosure controls and procedures to provide reasonable assurance that all material information relating to the Company and its subsidiaries is gathered and reported to senior management on a timely basis so that appropriate decisions can be made regarding public disclosure. As required by National Instrument 52-109 (Certification of Disclosure in Issuers’ Annual and Interim Filings), the Executive Chairman, as Chief Executive Officer, and the Chief Financial Officer have caused the effectiveness of the disclosure controls and procedures to be evaluated. Based on that evaluation, they have concluded that the design and operation of the system of disclosure controls and procedures were effective as at December 29, 2012. (1) For financial definitions and ratios refer to the Glossary of Terms on page 103.
2012 Annual Report – Financial Review 23
11. Internal Control over Financial Reporting Management is also responsible for establishing and maintaining adequate internal controls over financial reporting to provide reasonable assurance regarding the reliability of financial reporting and the preparation of consolidated financial statements for external purposes in accordance with IFRS. As required by National Instrument 52-109 (Certification of Disclosure in Issuers’ Annual and Interim Filings), the Executive Chairman, as Chief Executive Officer, and the Chief Financial Officer have caused the effectiveness of the internal controls over financial reporting to be evaluated using the framework established in ‘Internal Control – Integrated Framework (COSO Framework)’ published by The Committee of Sponsoring Organizations of the Treadway Commission (COSO). Based on that evaluation, they have concluded that the design and operation of the Company’s internal controls over financial reporting were effective as at December 29, 2012. It should be recognized that due to inherent limitations, any controls, no matter how well designed and operated, can provide only reasonable assurance of achieving the desired control objectives and may not prevent or detect misstatements. Projections of any evaluations of effectiveness to future periods are subject to the risk that controls may become inadequate because of changes in conditions, or that the degree of compliance with the policies or procedures may deteriorate. Additionally, management is required to use judgment in evaluating controls and procedures. Changes in Internal Control over Financial Reporting The Company successfully implemented the IT system in the fourth quarter of 2012 at one distribution centre and at one store. These implementations resulted in changes to the Company’s internal controls over financial reporting during the fourth quarter of 2012 impacting the store, the distribution centre and a significant number of legacy corporate, franchise, and affiliate stores that the distribution centre services. The changes in controls have materially affected the Company’s internal controls over financial reporting impacting the following key areas: (1) Accounts Payable, (2) Cash Management, (3) Order Processing and Billing, (4) Vendor Income, (5) Costing, (6) Inventory Management and Valuation and (7) Credit Management. Except for the preceding changes, there were no other changes in the Company’s internal controls over financial reporting during the fourth quarter of 2012 that materially affected, or are reasonably likely to materially affect, the Company’s internal control over financial reporting. 12. Enterprise Risks and Risk Management The Company is committed to establishing a framework that ensures risk management is an integral part of its activities. To ensure the continued growth and success of the Company, risks are identified and managed through an Enterprise Risk Management (“ERM”) program. The Board has approved an ERM policy and oversees the ERM program through approval of the Company’s risks and risk prioritization. The ERM program assists all areas of the business in managing appropriate levels of risk tolerance by bringing a systematic approach, methodology and tools for evaluating, measuring and monitoring key risks. The results of the ERM program and other business planning processes are used to identify emerging risks to the Company, prioritize risk management activities and develop a risk-based internal audit plan. Risks are not eliminated through the ERM program. Risks are identified and managed within understood risk tolerances. The ERM program is designed to: promote a culture of awareness of risk management and compliance within the Company; facilitate corporate governance by providing a consolidated view of risks across the Company and insight into the methodologies for
identification, assessment, measurement and monitoring of the risks; assist in developing consistent risk management methodologies and tools across the organization; and enable the Company to focus on its key risks in the business planning process and reduce harm to financial performance through
responsible risk management.
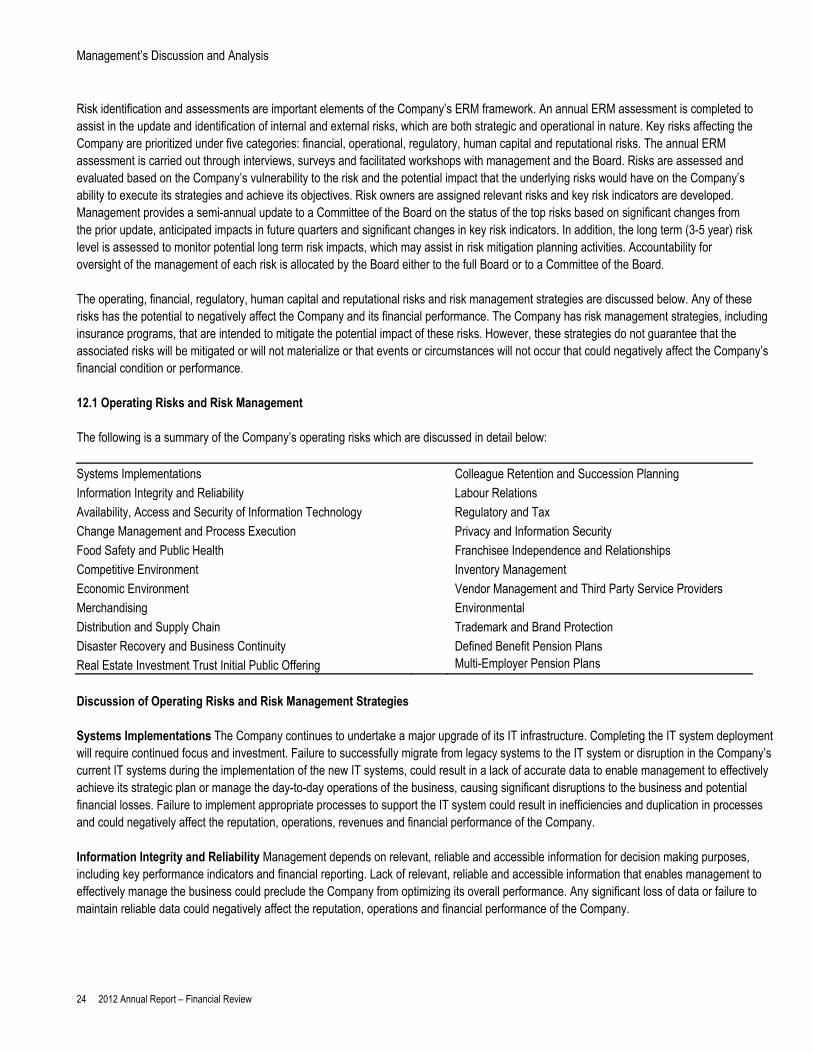
Management’s Discussion and Analysis
24 2012 Annual Report – Financial Review
Risk identification and assessments are important elements of the Company’s ERM framework. An annual ERM assessment is completed to assist in the update and identification of internal and external risks, which are both strategic and operational in nature. Key risks affecting the Company are prioritized under five categories: financial, operational, regulatory, human capital and reputational risks. The annual ERM assessment is carried out through interviews, surveys and facilitated workshops with management and the Board. Risks are assessed and evaluated based on the Company’s vulnerability to the risk and the potential impact that the underlying risks would have on the Company’s ability to execute its strategies and achieve its objectives. Risk owners are assigned relevant risks and key risk indicators are developed. Management provides a semi-annual update to a Committee of the Board on the status of the top risks based on significant changes from the prior update, anticipated impacts in future quarters and significant changes in key risk indicators. In addition, the long term (3-5 year) risk level is assessed to monitor potential long term risk impacts, which may assist in risk mitigation planning activities. Accountability for oversight of the management of each risk is allocated by the Board either to the full Board or to a Committee of the Board.
The operating, financial, regulatory, human capital and reputational risks and risk management strategies are discussed below. Any of these risks has the potential to negatively affect the Company and its financial performance. The Company has risk management strategies, including insurance programs, that are intended to mitigate the potential impact of these risks. However, these strategies do not guarantee that the associated risks will be mitigated or will not materialize or that events or circumstances will not occur that could negatively affect the Company’s financial condition or performance. 12.1 Operating Risks and Risk Management The following is a summary of the Company’s operating risks which are discussed in detail below:
Systems Implementations Colleague Retention and Succession Planning
Information Integrity and Reliability Labour Relations
Availability, Access and Security of Information Technology Regulatory and Tax
Change Management and Process Execution Privacy and Information Security
Food Safety and Public Health Franchisee Independence and Relationships
Competitive Environment Inventory Management
Economic Environment Vendor Management and Third Party Service Providers
Merchandising Environmental
Distribution and Supply Chain Trademark and Brand Protection
Disaster Recovery and Business Continuity Defined Benefit Pension Plans
Real Estate Investment Trust Initial Public Offering Multi-Employer Pension Plans
Discussion of Operating Risks and Risk Management Strategies Systems Implementations The Company continues to undertake a major upgrade of its IT infrastructure. Completing the IT system deployment will require continued focus and investment. Failure to successfully migrate from legacy systems to the IT system or disruption in the Company’s current IT systems during the implementation of the new IT systems, could result in a lack of accurate data to enable management to effectively achieve its strategic plan or manage the day-to-day operations of the business, causing significant disruptions to the business and potential financial losses. Failure to implement appropriate processes to support the IT system could result in inefficiencies and duplication in processes and could negatively affect the reputation, operations, revenues and financial performance of the Company. Information Integrity and Reliability Management depends on relevant, reliable and accessible information for decision making purposes, including key performance indicators and financial reporting. Lack of relevant, reliable and accessible information that enables management to effectively manage the business could preclude the Company from optimizing its overall performance. Any significant loss of data or failure to maintain reliable data could negatively affect the reputation, operations and financial performance of the Company.
2012 Annual Report – Financial Review 25
Availability, Access and Security of Information Technology The Company is reliant on the continuous and uninterrupted operations of information technology systems. Point of sale availability, 24/7 user access and security of all IT systems are critical elements to the operations of the Company. Any IT failure pertaining to availability, access or system security could result in disruption for the customer, lost revenue and could negatively impact the Company's operations, reputation or financial performance. Change Management and Process Execution Significant initiatives within the Company, including the execution of the IT infrastructure plan, are underway. Ineffective change management could result in disruptions to the operations of the business or affect the ability of the Company to implement and achieve its long term strategic objectives. Failure to properly integrate several large, complex initiatives in a timely manner will adversely impact the operations of the Company. If colleagues are not able to develop and perform new roles, processes and disciplines, the Company could not achieve the expected cost savings and other benefits of its initiatives. Failure to properly execute the various processes will increase the risk of customer dissatisfaction, which in turn could negatively affect the reputation, operations and financial performance of the Company. Food Safety and Public Health The Company is subject to risks associated with food safety and general merchandise product defects. These risks could arise as part of the procurement, distribution, preparation or display of products, including the Company’s control brand products. The Company could be adversely affected in the event of a significant outbreak of food-borne illness or other public health concerns related to food products. The occurrence of such events or incidents could result in harm to the Company’s customers, negative publicity or damage to the Company’s brands and could lead to unforeseen liabilities from legal claims or otherwise. In addition, failure to trace or locate any contaminated or defective products could affect the Company’s ability to be effective in a recall situation. Any of these events, as well as the failure to maintain the cleanliness and health standards at store level, could negatively affect the reputation, operations and financial performance of the Company. The Company has an incident management process in place to manage such events, should they occur. The existence of these procedures does not mean that the Company will, in all circumstances, be able to mitigate the underlying risks, and any event related to these matters has the potential to negatively affect the reputation, operations and financial performance of the Company. Competitive Environment The retail industry in Canada is highly competitive. If the Company is ineffective in responding to consumer trends or in executing its strategic plans its financial performance could be negatively affected. The Company’s competitors include traditional supermarket operators, as well as mass merchandisers, warehouse clubs, drugstores, limited assortment stores, discount stores, convenience stores and specialty stores. Many of these competitors now offer a selection of food, drugstore and general merchandise. Others remain focused on supermarket-type merchandise. The Company is subject to competitive pressures from new entrants into the marketplace and from the expansion or renovation of existing competitors, particularly those expanding into the grocery market. The Company’s inability to effectively predict market activity or compete effectively with its current or future competitors could result in, among other things, reduced market share and lower pricing in response to its competitors’ pricing activities. Failure by the Company to sustain its competitive position could negatively affect the financial performance of the Company. Economic Environment Economic factors that impact consumer spending patterns could deteriorate or remain unpredictable due to global, national or regional economic volatility. These factors include high levels of unemployment and household debt, increased interest rates, inflation, foreign exchange rates and commodity prices and access to consumer credit. Any of these factors could negatively affect the Company’s revenue and margins. Inflationary trends are unpredictable and changes in the rate of inflation or deflation will affect consumer prices, which in turn could negatively affect the financial performance of the Company. Merchandising The Company could have goods and services that customers do not want or need, are not reflective of current trends in customers’ tastes, habits, or regional preferences, are priced at a level customers are not willing to pay or are late in reaching the market. Innovation is critical if the Company is to respond to customer demands and stay competitive in the marketplace. If merchandising efforts are not effective or responsive to customer demand, the operations and financial performance of the Company could be negatively affected.
Management’s Discussion and Analysis
26 2012 Annual Report – Financial Review
Distribution and Supply Chain Failure to continue to invest in and improve the Company’s supply chain could adversely affect the Company’s capacity to effectively and efficiently attract and retain current and potential customers. Any delay or disruption in the flow of goods to stores, could negatively affect the operations and financial performance of the Company. Disaster Recovery and Business Continuity The Company’s ability to continue critical operations and processes could be negatively impacted by adverse events resulting from various incidents, including severe weather, work stoppages, prolonged IT failure, power failures, border closures or a pandemic or other national or international catastrophe. The Company has an enterprise wide business continuity program, which reduces, but does not completely mitigate, the risk of business interruptions, crises or potential disasters, which could negatively affect the reputation, operations and financial performance of the Company. Real Estate Investment Trust Initial Public Offering On December 6, 2012, the Company announced its intention to create a REIT to acquire a significant portion of the Company’s real estate assets and for the REIT to sell trust units to the public by way of an IPO. The Company estimates that it will initially sell to the REIT real estate with a current market value exceeding $7 billion and it intends to retain a significant majority interest in the REIT. The Company expects the IPO to be completed in mid-2013. However, completion of the IPO and the purchase of certain of the Company’s real estate assets will be subject to prevailing market conditions and receipt of required regulatory approvals, including approval to list the trust units on the TSX. In addition, the execution and implementation of the REIT’s IPO will have a significant impact on the Company’s management and operations as a result of the time and attention required of management to complete the offering. Failure to properly execute and implement the REIT’s IPO could adversely affect the reputation, operations and financial performance of the Company. Colleague Retention and Succession Planning Effective succession planning for senior management and colleague retention are essential to sustaining the growth and success of the Company. In addition, loss of talent to the competition can be a significant risk to the Company’s business strategy. If the Company is not effective in establishing appropriate succession planning processes and retention strategies, it could lead to a lack of requisite knowledge, skills and experience on the part of management. This, in turn, could adversely affect the Company’s ability to execute its strategies, and negatively affect its reputation, operations and financial performance. Labour Relations A majority of the Company’s store level and distribution centre workforce is unionized. Failure to renegotiate collective agreements could result in work stoppages or slowdowns, which could negatively affect the Company’s financial performance, depending on their nature and duration. There can be no assurance as to the outcome of these negotiations or the timing of their completion. Although the Company attempts to mitigate work stoppages and disputes through early negotiations, work stoppages or slowdowns remain possible, which could negatively affect the reputation, operations and financial performance of the Company. Regulatory and Tax Changes to any of the laws, rules, regulations or policies applicable to the Company’s business, including income, commodity and other taxes, and the production, processing, preparation, distribution, packaging and labelling of products, could have an adverse impact on the Company’s financial or operational performance. New accounting pronouncements introduced by appropriate authoritative bodies could also impact the Company’s financial results. In the course of complying with such changes, the Company could incur significant costs. Changing regulations or enhanced enforcement of existing regulations could restrict the Company’s operations or profitability and thereby threaten the Company’s competitive position and capacity to efficiently conduct business. Failure by the Company to comply with applicable laws, rules, regulations, orders and policies or comply with orders for records in a timely manner could subject it to civil or regulatory actions or proceedings, including fines, assessment, injunctions, recalls or seizures, which in turn could have an adverse effect on the Company’s financial results. PC Bank operates in a highly regulated environment and a failure by it to comply, understand, acknowledge and effectively respond to the regulators could result in monetary penalties, regulatory intervention and reputational damage.
2012 Annual Report – Financial Review 27
The Company is subject to tax audits from various government and regulatory agencies on an ongoing basis. As a result, from time to time, taxing authorities may disagree with the positions and conclusions taken by the Company in its tax filings or legislation could be amended, which could lead to reassessments. These reassessments could have a material impact on the Company in future periods. During 2012, the Company received indication from the Canada Revenue Agency that it intends to proceed with a reassessment with regard to the tax treatment of Glenhuron. At this early stage, it is not possible to quantify the amount of the proposed reassessment. Although the Company does not expect the ultimate outcome to be material, such matters cannot be predicted with certainty and could result in a material charge for the Company in future periods. During 2012, the majority of provincial governments announced or enacted amendments to the regulation of generic prescription drug prices paid by provincial governments pursuant to public drug benefit plans. Subsequent to the end of the year, all provinces and territories, with the exception of Quebec, announced that reimbursement rates on six common generic prescription drugs would be significantly reduced. All provinces have now announced various forms of amendments to regulation of generic drug pricing. Under these amendments, the prices paid by the provincial drug plans for generic drugs are being reduced. The amendments also reduce out-of-pocket and private employer drug plan payments for generic drugs. The amendments impact pharmacy sales and therefore could have an adverse effect on the financial performance of the Company. The Company continues to identify opportunities to mitigate the impact of these amendments, including the introduction of programs to add new services and enhance existing services to attract customers, but despite these efforts, the amendments could have an adverse effect on the financial performance of the Company. Privacy and Information Security The Company is subject to various laws regarding the protection of personal information of its customers, cardholders and colleagues and has adopted a Privacy Policy setting out guidelines for the handling of personal information. The Company’s information systems contain personal information of customers, cardholders and colleagues. Any failures or vulnerabilities in these security systems or non-compliance with regulations, including those in relation to personal information belonging to the Company’s customers and colleagues, could negatively affect the reputation, operations and financial performance of the Company. Franchisee Independence and Relationships A substantial portion of the Company’s revenues and earnings comes from amounts paid by franchisees. Franchisees are independent businesses and, as a result, their operations may be negatively affected by factors beyond the Company’s control which in turn could negatively affect the Company’s reputation, operations and financial performance. Revenues and earnings could also be negatively affected, and the Company’s reputation could be harmed, if a significant number of franchisees were to experience operational failures, health and safety exposures or were unable to pay the Company for products, rent or fees. The Company’s franchise system is also subject to franchise legislation enacted by a number of provinces. Any new legislation or failure to comply with existing legislation could negatively affect operations and could add administrative costs and burdens, any of which could affect the Company’s relationship with its franchisees. The Company provides various services to the franchisees to assist with management of store operations and dedicated personnel manage the Company’s obligations to its franchisees. Despite these efforts, relationships with franchisees could pose significant risks if they are disrupted, which could negatively affect the reputation, operations and financial performance of the Company. Supply chain or system changes by the Company could cause or be perceived to cause disruptions to franchise operations and could result in negative effects on franchisee financial performance. Reputational damage or adverse consequences for the Company, including litigation and disruption to revenue from franchise stores could result. Inventory Management Inappropriate inventory management could lead to excess inventory or a shortage of inventory, which may impact customer satisfaction and overall financial performance. The Company may experience excess inventory that cannot be sold profitably or which could increase levels of inventory shrink. The Company focuses on reducing inventory levels and early identification of inventory at risk and monitors demand, forecasting and the impact of customer trends. Despite these efforts, the Company could experience excess inventory that cannot be sold profitably, which could negatively affect the operations and financial performance of the Company. As part of its IT system upgrade implementation plan, the Company will be converting to a perpetual inventory system. Through the conversion process, the Company will determine the value of its retail store inventories using weighted average cost. As a result, valuation differences could arise which could negatively affect the carrying amount of the Company’s inventory.
Management’s Discussion and Analysis
28 2012 Annual Report – Financial Review
Vendor Management and Third Party Service Providers The Company relies on vendors, including offshore vendors, that provide the Company with goods and services. Although contractual arrangements, sourcing guidelines, supplier audits and Corporate Social Responsibility guidelines are in place, the Company has no direct influence over how the vendors are managed. Negative events affecting any vendors or inefficient, ineffective or incomplete vendor management strategies, policies and/or procedures could adversely impact the Company’s ability to meet customer needs or control costs and quality, which could in turn negatively affect the reputation, operations and financial performance of the Company. The Company also uses third party suppliers, carriers, logistic service providers and operators of warehouses and distribution facilities, including the product development, design and sourcing of the Company’s control brand apparel products. Ineffective selection, contract terms or relationship management could impact the Company’s ability to source control brand products, to have products available for customers, to market to customers or to operate efficiently and effectively. The Company maintains a strategy of multiple sources for logistics providers so that in the event of a disruption of service from one supplier another supplier can be used. However, disruption in these services is possible, which could interrupt the delivery of merchandise to stores, thereby negatively affecting the operations and financial performance of the Company. President’s Choice Financial banking services are provided by a major Canadian chartered bank. PC Bank uses third party service providers to process credit card transactions, operate call centres and operationalize certain risk management strategies for the President’s Choice Financial MasterCard®. PC Bank and the Company actively manage and monitor their relationships with all third party service providers and PC Bank has an outsourcing risk policy and a vendor governance team that provides regular reports on vendor governance and annual vendor risk assessments. Despite these activities, a significant disruption in the services provided by the chartered bank or by third party service providers would negatively affect the financial performance of PC Bank and the Company. The Company relies on third parties for investment management, custody and other services for its cash equivalents, short term investments, security deposits and pension assets. Any disruption in the services provided by these suppliers could adversely affect the return on these assets or liquidity of the Company. Environmental The Company maintains a large portfolio of real estate and other facilities and is subject to environmental risks associated with the contamination of such properties and facilities, whether by previous owners or occupants, neighbouring properties or by the Company itself. The Company has a number of underground storage tanks, the majority of which are used for the retailing of automotive fuel or for its supply chain transport fleets. Contamination resulting from leaks from these tanks is possible. The Company also operates refrigeration equipment in its stores and distribution centres to preserve perishable products as it passes through the supply chain and ultimately into the hands of the consumer. These systems contain refrigerant gases which could be released if equipment fails or leaks. A release of these gases could have adverse effects on the environment. The Company is subject to legislation that imposes liabilities on retailers, brand owners and importers for costs associated with recycling and disposal of consumer goods packaging and printed materials distributed to consumers. There is a risk that the Company will be subject to increased costs associated with these laws. The Company has environmental management programs and has established assessment, compliance, monitoring and reporting policies and procedures aimed at ensuring compliance with applicable environmental legislative requirements and protecting the environment. Despite these mitigation activities, the Company could be subject to increased or unexpected costs associated with environmental incidents and the related remediation activities, including litigation and regulatory related costs, all of which could negatively affect the reputation and financial performance of the Company. Consumer trends are increasingly demanding that retailers sell products with less impact on the environment and that their operations demonstrate environmentally responsible practices. As set out in its annual Corporate Social Responsibility Report, the Company sets environmental goals and monitors its progress towards their achievement. If the Company fails to meet consumer demand in this area or otherwise fails to adequately address the environmental impact of its business practices, its reputation and financial performance could be negatively affected.
2012 Annual Report – Financial Review 29
Trademark and Brand Protection A decrease in value of the Company’s trademarks, banners or control brands, as a result of adverse events, changes to the branding strategies or otherwise, could negatively affect the reputation, operations and financial performance of the Company. Defined Benefit Pension Plans The Company manages the assets in its registered funded defined benefit pension plans by engaging professional investment managers who operate under prescribed investment policies and procedures in respect of permitted investments and asset allocations. Future contributions to the Company’s registered funded defined benefit pension plans are impacted by a number of variables, including the investment performance of the plans’ assets and the discount rate used to value the liabilities of the plans. The Company regularly monitors and assesses plan performance and the impact of changes in participant demographics, changes in capital markets and other economic factors that may impact funding requirements, net defined benefit costs and actuarial assumptions. If capital market returns are below assumed levels, or if the discount rates do not increase, the Company could be required to make contributions to its registered funded defined benefit pension plans in excess of those currently expected, which in turn could negatively affect the financial performance of the Company. Multi-Employer Pension Plans In addition to the Company-sponsored pension plans, the Company participates in various multi-employer pension plans, providing pension benefits to union employees pursuant to provisions of collective bargaining agreements. Approximately 40% (2011 – 39%) of employees of the Company and of its independent franchisees participate in these plans. The administration of these plans and the investment of their assets are controlled by a board of trustees generally consisting of an equal number of union and employer representatives. In some circumstances, the Company has a representative on the board of trustees of these multi-employer pension plans. The Company’s responsibility to make contributions to these plans is limited by the amounts established pursuant to its collective agreements; however, poor performance of these plans could have an adverse impact on the Company’s employees and former employees who are members of these plans or could result in changes to the terms and conditions of participation in these plans, which could have a negative impact on the Company’s results of operations or financial condition. The Company, together with its independent franchisees, is the largest participating employer in the Canadian Commercial Workers Industry Pension Plan (“CCWIPP”), with approximately 54,000 (2011 – 53,000) employees as members. In 2012, the Company contributed $52 million (2011 – $49 million) to CCWIPP. At the end of 2012 and 2011, the CCWIPP actuarial accrued benefit obligations greatly exceeded the value of the assets held in trust. Further benefit reductions would negatively affect the retirement benefits of the Company’s employees, which in turn could negatively affect their morale and productivity and, in turn, could negatively affect the Company’s reputation. 12.2 Financial Risks and Risk Management The Company is exposed to a number of financial risks, including those associated with financial instruments, which have the potential to affect its operating and financial performance. The Company uses over-the-counter derivative instruments to offset certain of these risks. Policies and guidelines prohibit the use of any derivative instrument for trading or speculative purposes. The fair value of derivative instruments is subject to changing market conditions which could negatively impact the financial performance of the Company. The following is a summary of the Company’s financial risks which are discussed in detail below:
Liquidity and Capital Availability Foreign Currency Exchange Rates
Credit Commodity Prices
Interest Rates Common Share Price
Management’s Discussion and Analysis
30 2012 Annual Report – Financial Review
Discussion of Financial Risks and Risk Management Strategies Liquidity and Capital Availability Liquidity risk is the risk that the Company cannot meet its demand for cash or fund its obligations as they come due. Liquidity risk also includes the risk of not being able to liquidate assets in a timely manner at a reasonable price. Difficulty accessing capital markets could impair the Company’s capacity to grow, execute its business model or generate financial returns. Liquidity and capital availability risks are mitigated by maintaining appropriate levels of cash and cash equivalents and short term investments, actively monitoring market conditions, and by diversifying its sources of funding, including its Credit Facility and maintaining a well-diversified maturity profile of debt and capital obligations. Despite these mitigation strategies, if the Company’s or PC Bank’s financial performance and condition deteriorate or downgrades in the Company’s current credit ratings occur, the Company’s or PC Bank’s ability to obtain funding from external sources could be restricted. In addition, credit and capital markets are subject to inherent risks that could negatively affect the Company’s access and ability to fund its financial and other liabilities. Credit The Company is exposed to credit risk resulting from the possibility that counterparties could default on their financial obligations to the Company. Exposure to credit risk relates to derivative instruments, cash and cash equivalents, short term investments, security deposits, PC Bank’s credit card receivables, franchise loans receivable, accounts receivable from franchisees and other receivables from vendors, associated stores and independent accounts and pension assets held in the Company’s defined benefit plans. The risk related to derivative instruments, cash and cash equivalents, short term investments or security deposits is reduced by policies and guidelines that require that the Company enter into transactions only with counterparties or issuers that have a minimum long term “A-” credit rating from a recognized credit rating agency and place minimum and maximum limits for exposures to specific counterparties and instruments. PC Bank manages its credit card receivable risk by employing stringent credit scoring techniques and actively monitoring the credit card portfolio, and reviewing techniques and technology that can improve the effectiveness of the collection process. In addition, these receivables are dispersed among a large, diversified group of credit card customers. Franchise loans receivable, accounts receivable from franchisees and other receivables from vendors, associated stores and independent accounts are actively monitored on an ongoing basis and settled on a frequent basis in accordance with the terms specified in the applicable agreements. Credit risk associated with investments in the Company’s defined benefit pension plans is described in the Defined Benefit Pension Plan Contributions discussion in Section 12.1 Operating Risks and Risk Management. Despite the mitigation strategies described above, it is possible that the Company’s financial performance could be negatively impacted by the failure of a counterparty to fulfill its obligations. Interest Rates The Company is exposed to interest rate risk from fluctuations in interest rates on its floating rate debt and financial instruments, net of cash and cash equivalents, short term investments and security deposits. The Company manages interest rate risk by monitoring its respective mix of fixed and floating rate debt net of cash and cash equivalents, short term investments and security deposits, and by taking action as necessary to maintain an appropriate balance considering current market conditions. Despite these mitigations strategies, changes in interest rates could negatively affect the Company’s financial performance. Foreign Currency Exchange Rates The Company is exposed to foreign currency exchange rate variability, primarily on its USD denominated cash and cash equivalents, short term investments and security deposits held by Glenhuron, foreign denominated and foreign currency based purchases in trade payables and other liabilities, and USD private placement notes included in long term debt. The Company and Glenhuron have cross currency swaps and foreign currency forward contracts that partially offset their respective exposure to fluctuations in foreign currency exchange rates. Cross currency swaps are transactions in which interest payments and principal amounts in one currency are exchanged against receipt of interest payments and principal amounts in a second currency. Despite these mitigation strategies, the Company’s financial performance could be negatively impacted by foreign currency variability.

2012 Annual Report – Financial Review 31
Commodity Prices The Company is exposed to increases in the prices of commodities in operating its stores and distribution networks, as well as to the indirect link of commodities to consumer products and prices. To manage a portion of this exposure, the Company uses purchase commitments for a portion of its needs for certain consumer products that are commodities based. The Company enters into exchange traded futures contracts and forward contracts to minimize cost volatility relating to energy. Despite these mitigation strategies, rising commodity prices could negatively affect the Company’s financial performance. Common Share Price The Company is exposed to common share market price risk as a result of the issuance to certain employees of stock options, to the extent that they are repurchased by the Company on exercise, RSUs and PSUs. RSUs and PSUs negatively impact operating income when the common share price increases and positively impact operating income when the common share price declines. Glenhuron is a party to an equity forward contract, which allows for settlement in cash, common shares or net settlement. This forward contract changes in value as the market price of the Company’s common shares changes and provides a partial offset to fluctuations in the Company’s RSU and PSU plan expense or income. Despite this partial offset, increases in the common share price could negatively affect the Company’s financial performance. 13. Related Party Transactions The Company’s parent corporation is Weston, which owns, directly and indirectly, 177,299,889 of the Company’s common shares, representing approximately 63% of the Company’s 281,680,157 outstanding common shares. Mr. W. Galen Weston controls Weston, directly and indirectly through private companies which he controls, including Wittington Investments, Limited (“Wittington”) who owns a total of 80,724,599 of Weston’s common shares, representing approximately 63% of Weston’s 128,220,992 outstanding common shares. Mr. Weston also beneficially owns 3,753,789 of the Company’s common shares, representing approximately 1% (December 31, 2011 – 1%) of the Company’s outstanding common shares. The Company’s policy is to conduct all transactions and settle all balances with related parties on market terms and conditions. Transactions with Related Parties Transaction Value
(millions of Canadian dollars) 2012 2011
Cost of Merchandise Inventory Sold
Inventory purchases from a subsidiary of Weston $ 627 $ 646
Inventory purchases from a related party(1) 18 18
Operating Income
Cost sharing agreements with Parent(2) 12 10
Net administrative services provided by Parent(3) 17 17
Lease of office space from a subsidiary of Wittington 3 3
(1) Associated British Foods plc is a related party by virtue of Mr. W. Galen Weston being a director of such entity’s parent company. Total balance outstanding owing to
Associated British Foods plc as at December 29, 2012 was $2 million (December 31, 2011 – $2 million).
(2) Weston and the Company have each entered into certain contracts with third parties for administrative and corporate services, including telecommunication services and information technology related matters on behalf of itself and the related party. Through cost sharing agreements that have been established between the Company and Weston concerning these costs, the Company has agreed to be responsible to Weston for the Company’s proportionate share of the total costs incurred.
(3) The Company and Weston have entered into an agreement whereby certain administrative services are provided by one party to the other. The services to be provided under this agreement include those related to commodity management, pension and benefits, tax, medical, travel, information system, risk management, treasury and legal. Payments are made quarterly based on the actual costs of providing these services. Where services are provided on a joint basis for the benefit of the Company and Weston together, each party pays the appropriate proportion of the costs. Fees paid under this agreement are reviewed each year by the Audit Committee.
The net balances due to related parties are comprised as follows:
(millions of Canadian dollars)
As at
December 29, 2012
As at
December 31, 2011
Balance Sheets
Trade payables and other liabilities $ 25 $ 28
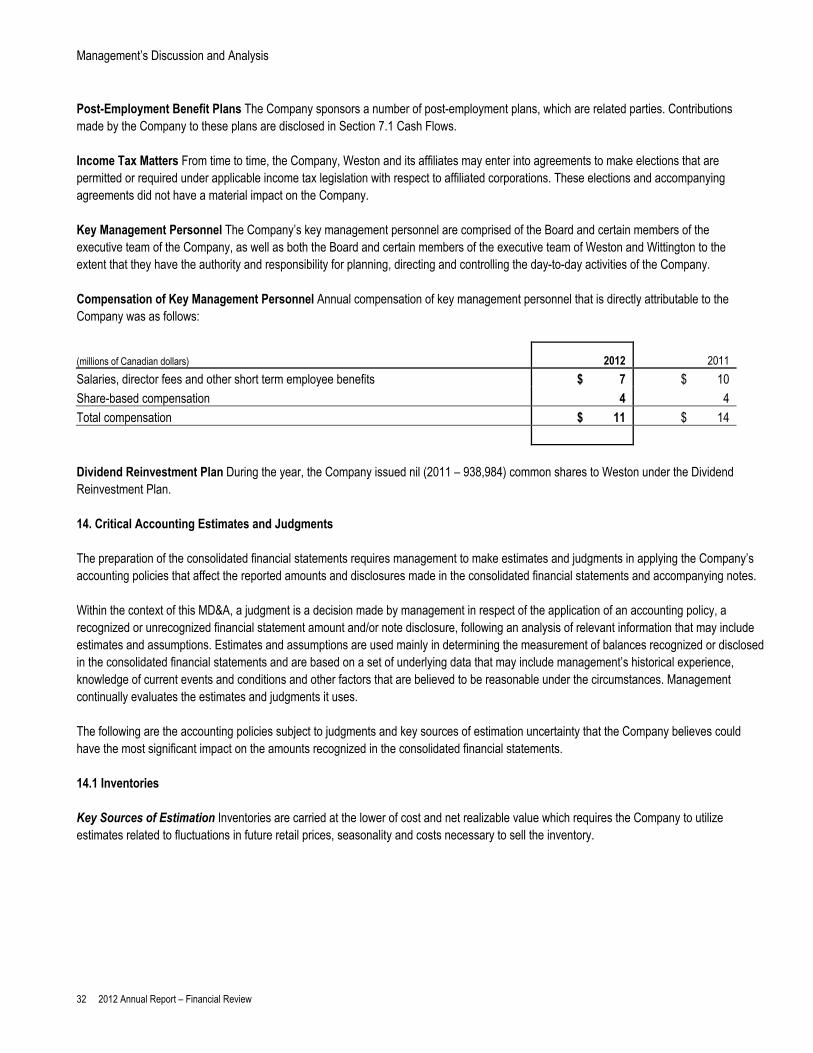
Management’s Discussion and Analysis
32 2012 Annual Report – Financial Review
Post-Employment Benefit Plans The Company sponsors a number of post-employment plans, which are related parties. Contributions made by the Company to these plans are disclosed in Section 7.1 Cash Flows. Income Tax Matters From time to time, the Company, Weston and its affiliates may enter into agreements to make elections that are permitted or required under applicable income tax legislation with respect to affiliated corporations. These elections and accompanying agreements did not have a material impact on the Company. Key Management Personnel The Company’s key management personnel are comprised of the Board and certain members of the executive team of the Company, as well as both the Board and certain members of the executive team of Weston and Wittington to the extent that they have the authority and responsibility for planning, directing and controlling the day-to-day activities of the Company. Compensation of Key Management Personnel Annual compensation of key management personnel that is directly attributable to the Company was as follows:
(millions of Canadian dollars) 2012 2011
Salaries, director fees and other short term employee benefits $ 7 $ 10
Share-based compensation 4 4
Total compensation $ 11 $ 14
Dividend Reinvestment Plan During the year, the Company issued nil (2011 – 938,984) common shares to Weston under the Dividend Reinvestment Plan. 14. Critical Accounting Estimates and Judgments The preparation of the consolidated financial statements requires management to make estimates and judgments in applying the Company’s accounting policies that affect the reported amounts and disclosures made in the consolidated financial statements and accompanying notes. Within the context of this MD&A, a judgment is a decision made by management in respect of the application of an accounting policy, a recognized or unrecognized financial statement amount and/or note disclosure, following an analysis of relevant information that may include estimates and assumptions. Estimates and assumptions are used mainly in determining the measurement of balances recognized or disclosed in the consolidated financial statements and are based on a set of underlying data that may include management’s historical experience, knowledge of current events and conditions and other factors that are believed to be reasonable under the circumstances. Management continually evaluates the estimates and judgments it uses. The following are the accounting policies subject to judgments and key sources of estimation uncertainty that the Company believes could have the most significant impact on the amounts recognized in the consolidated financial statements. 14.1 Inventories Key Sources of Estimation Inventories are carried at the lower of cost and net realizable value which requires the Company to utilize estimates related to fluctuations in future retail prices, seasonality and costs necessary to sell the inventory.

2012 Annual Report – Financial Review 33
14.2 Impairment of Non-Financial Assets (Goodwill, Intangible Assets, Fixed Assets and Investment Properties) Judgments Made in Relation to Accounting Policies Applied Management is required to use judgment in determining the grouping of assets to identify their cash generating units (“CGUs”) for the purposes of testing fixed assets for impairment. Judgment is further required to determine appropriate groupings of CGUs, for the level at which goodwill and intangible assets are tested for impairment. The Company has determined that each retail location and each investment property is a separate CGU for purposes of fixed asset impairment testing. For the purpose of goodwill and intangible impairment testing, CGUs are grouped at the lowest level at which goodwill and intangibles are monitored for internal management purposes. In addition, judgment is used to determine whether a triggering event has occurred requiring an impairment test to be completed. Key Sources of Estimation In determining the recoverable amount of a CGU or a group of CGUs, various estimates are employed. The Company determines fair value less costs to sell using such estimates as market rental rates for comparable properties, recoverable operating costs for leases with tenants, non-recoverable operating costs, discount rates, capitalization rates and terminal capitalization rates. The Company determines value in use by using estimates including projected future sales, earnings and capital investment consistent with strategic plans presented to the Board. Discount rates are consistent with external industry information reflecting the risk associated with the specific cash flows. 14.3 Franchise Loans Receivable and Certain Other Financial Assets Judgments Made in Relation to Accounting Policies Applied Management reviews franchise loans receivable, trade receivables and certain other assets relating to their franchise business at each balance sheet date utilizing judgment to determine whether a triggering event has occurred requiring an impairment test to be completed. Key Sources of Estimation Management determines the initial fair value of its franchise loans and certain other financial assets using discounted cash flow models corroborated by other valuation techniques. The process of determining these fair values requires management to make estimates of a long term nature regarding discount rates, projected revenues, and margins, as applicable, derived from past experience, actual operating results, budgets and the Company’s five year forecast. 14.4 Income and Other Taxes Judgments Made in Relation to Accounting Policies Applied The calculation of current and deferred income taxes requires management to make certain judgments regarding the tax rules in jurisdictions where the Company performs activities. Application of judgments is required regarding classification of transactions and in assessing probable outcomes of claimed deductions including expectations about future operating results, the timing and reversal of temporary differences and possible audits of income tax and other tax filings to the tax authorities. 14.5 Post-Employment and Other Long Term Employee Benefits Key Sources of Estimation Accounting for the costs of defined benefit pension plans and other applicable post-employment benefits is based on using a number of assumptions including estimates for expected return on plan assets. Expected returns on plan assets is based on current market conditions, the asset mix, the active management of defined benefit pension plan assets and historical returns. Other key assumptions for pension obligations are based in part on current market conditions. 14.6 Allowance for Credit Card Receivables Key Sources of Estimation The allowance for credit card receivables is measured based upon statistical analysis that includes estimates for past and current performance, aging, arrears status, the level of allowance already in place, and management’s interpretation of economic conditions and other trends specific to our customer base, including but not limited to bankruptcies. Changes in circumstances may cause future assessments of credit risk to be materially different from current assessments, which could require an increase or decrease in the allowance for credit receivables.
Management’s Discussion and Analysis
34 2012 Annual Report – Financial Review
15. Accounting Standards 15.1 Accounting Standards Implemented in 2012 Financial Instruments – Disclosures In 2010, the International Accounting Standards Board (“IASB”) issued amendments to IFRS 7, “Financial Instruments: Disclosures”, which increase the disclosure requirements for transactions involving transfers of financial assets to help users of the consolidated financial statements evaluate the risk exposures related to such transfers and the effect of those risks on an entity’s financial position. These amendments are effective and were implemented in the first quarter of 2012. Deferred Tax – Recovery of Underlying Assets In 2010, the IASB issued amendments to International Accounting Standard (“IAS”) 12, “Income Taxes” (“IAS 12”), that introduce an exception to the general measurement requirements of IAS 12 for investment properties measured at fair value. These amendments were effective in the first quarter of 2012. As part of its transition to IFRS, the Company elected to account for its investment properties at cost and as such, the amendments did not have an impact on the Company’s results of operations or financial condition. 15.2 Future Accounting Standards Unless otherwise indicated, the Company intends to adopt the following standards in its consolidated financial statements for fiscal 2013: Consolidated Financial Statements In 2011, the IASB issued IFRS 10, “Consolidated Financial Statements” (“IFRS 10”). This IFRS replaces portions of IAS 27, “Consolidated and Separate Financial Statements” and supersedes SIC-12, “Consolidation – Special Purpose Entities”. IFRS 10 defines principles of control and establishes the basis of determining when and how an entity should be included within a set of consolidated financial statements. The standard introduces a single control model that requires an entity to consolidate an investee when it has power, exposure to variability in returns and has the ability to use its power over the investee to affect its returns, regardless of whether voting rights are present. The adoption of IFRS 10 is not expected to have an impact on the Company’s consolidated financial statements. Disclosure of Interests in Other Entities In 2011, the IASB issued IFRS 12, “Disclosure of Interests in Other Entities” (“IFRS 12”). This IFRS requires extensive disclosures relating to a company’s interests in subsidiaries, joint arrangements, associates, and unconsolidated structured entities. IFRS 12 enables users of the consolidated financial statements to evaluate the nature and risks associated with a company’s interests in other entities and the effects of those interests on a company’s financial performance and position. The adoption of IFRS 12 is not expected to have a significant impact on the Company’s consolidated financial statements. Fair Value Measurement In 2011, the IASB issued IFRS 13, “Fair Value Measurement” (“IFRS 13”), which establishes a single framework for the fair value measurement and disclosure of financial and non-financial assets and liabilities. The new standard unifies the definition of fair value and also introduces new concepts including ‘highest and best use’ and ‘principle markets’ for non-financial assets and liabilities. There are additional disclosure requirements, including increased fair value disclosure for financial instruments for interim financial statements. Although the Company expects additional disclosure, it does not anticipate material measurement impacts on its consolidated financial statements as a result of the adoption of IFRS 13. Employee Benefits In 2011, the IASB revised IAS 19, “Employee Benefits” (“IAS 19”).The most significant amendments for the Company will be the requirement to immediately recognize all unvested past service costs and the replacement of interest cost and expected return on plan assets with a net interest amount that is calculated by applying a prescribed discount rate to the net defined benefit liability. Upon implementation of these amendments, the Company will restate its annual 2012 consolidated financial statements. The preliminary expected impact arising from the adoption of the amendments to IAS 19 is summarized as follows:

2012 Annual Report – Financial Review 35
Consolidated Statements of Earnings and Comprehensive Income Increase (Decrease)
(millions of Canadian dollars except where otherwise indicated) 52 Weeks Ended
December 29, 2012 Selling, General and Administrative Expenses $ 1
Operating Income $ (1)
Net interest expense and other financing charges 20
Earnings Before Income Taxes $ (21)
Income taxes (5) Net Earnings $ (16)
Other comprehensive income, net of taxes 15
Total Comprehensive Income $ (1) Basic net earnings per common share ($) $ (0.06) Consolidated Balance Sheets Increase (Decrease)
(millions of Canadian dollars) As at
December 29, 2012 Other long term liabilities $ (2) Shareholders' equity $ 2 As a result, in 2013, post-employment and other long term benefits expense will be accounted for on a consistent basis year-over-year. The amendments also require enhanced disclosures for defined benefit plans, including additional information on the characteristics and risks of those plans. Other Standards In addition to the above standards, the Company will be implementing the following standards and amendments effective January 1, 2013: IFRS 11, “Joint Arrangements”, IAS 28, “Investments in Associates” and IAS 1, “Presentation of Financial Statements”. The Company does not expect a significant impact as a result of these standards and amendments on its consolidated financial statements. Financial Instruments In 2011, the IASB issued amendments to IFRS 7, “Financial Instruments: Disclosures” and IAS 32, “Financial Instruments: Presentation”, these amendments are required to be applied for periods beginning on or after January 1, 2014. The Company does not expect any significant impacts on its consolidated financial statements as a result of these amendments. In 2010, the IASB issued a new standard, IFRS 9, “Financial Instruments” (“IFRS 9”), which will ultimately replace IAS 39, “Financial Instruments: Recognition and Measurement” (“IAS 39”). The replacement of IAS 39 is a three-phase project with the objective of improving and simplifying the reporting for financial instruments. The issuance of IFRS 9 is the first phase of the project, which provides guidance on the classification and measurement of financial assets and financial liabilities. This standard becomes effective on January 1, 2015, with early adoption permitted. The Company is currently assessing the impact of the new standard on its consolidated financial statements.
Management’s Discussion and Analysis
36 2012 Annual Report – Financial Review
16. Outlook(1) In 2012, the Company strengthened its customer proposition and made significant progress with its IT infrastructure implementation. These initiatives will continue in 2013, with investments in price, assortment and labour expected to be offset by operating efficiencies. Investment in infrastructure programs will continue as the IT system is rolled out to distribution centres and stores, with associated expenses flat to 2012. Sales growth in 2013 will be moderated by a competitive environment characterized by ongoing square footage expansions, a new competitor’s entry into the market and generic drug deflation. As a result, the Company expects modest growth in operating income in 2013, excluding the impact of the $61 million restructuring charge recorded in the fourth quarter of 2012 and the impact of the previously announced plan to launch an IPO of a new REIT. In addition, the Company expects the following for 2013: an effective tax rate in the range of 26% – 27%, compared to 24.9% in 2012; the adoption of amendments to the accounting standard related to employee benefits, which will result in a restatement of the 2012
consolidated financial statements to reflect a reduction in net earnings by approximately $16 million or $0.06 per share; and capital expenditures to be approximately $1 billion, unchanged from 2012, with net new retail square footage growth of approximately 1%. Over the long term, the Company still expects positive same-store sales(2), a decline in IT and supply chain costs, and a moderation of capital expenditures. This should result in growth in operating income, EBITDA(3) and an increase in free cash flow(3). (1) To be read in conjunction with “Forward-Looking Statements” on page 2.
(2) For financial definitions and ratios refer to the Glossary of Terms on page 103.
(3) See Non-GAAP Financial Measures on page 37.
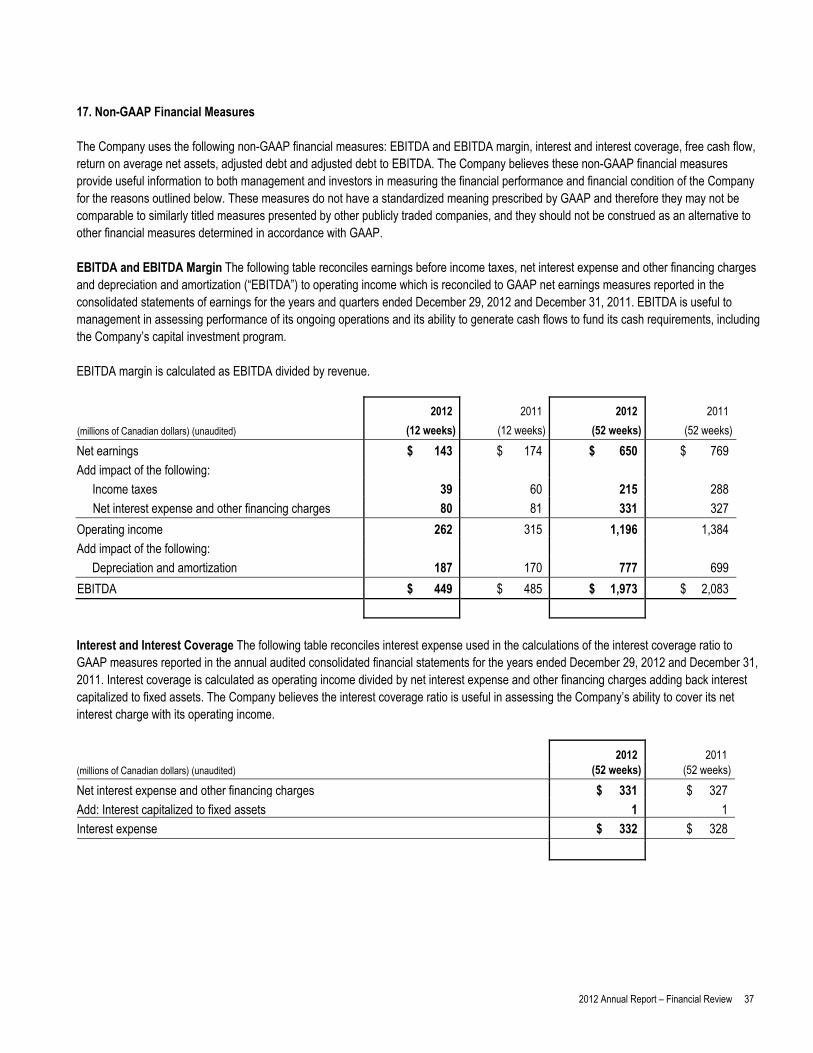
2012 Annual Report – Financial Review 37
17. Non-GAAP Financial Measures
The Company uses the following non-GAAP financial measures: EBITDA and EBITDA margin, interest and interest coverage, free cash flow, return on average net assets, adjusted debt and adjusted debt to EBITDA. The Company believes these non-GAAP financial measures provide useful information to both management and investors in measuring the financial performance and financial condition of the Company for the reasons outlined below. These measures do not have a standardized meaning prescribed by GAAP and therefore they may not be comparable to similarly titled measures presented by other publicly traded companies, and they should not be construed as an alternative to other financial measures determined in accordance with GAAP. EBITDA and EBITDA Margin The following table reconciles earnings before income taxes, net interest expense and other financing charges and depreciation and amortization (“EBITDA”) to operating income which is reconciled to GAAP net earnings measures reported in the consolidated statements of earnings for the years and quarters ended December 29, 2012 and December 31, 2011. EBITDA is useful to management in assessing performance of its ongoing operations and its ability to generate cash flows to fund its cash requirements, including the Company’s capital investment program. EBITDA margin is calculated as EBITDA divided by revenue.
2012 2011 2012 2011
(millions of Canadian dollars) (unaudited) (12 weeks) (12 weeks) (52 weeks) (52 weeks)
Net earnings $ 143 $ 174 $ 650 $ 769
Add impact of the following:
Income taxes 39 60 215 288
Net interest expense and other financing charges 80 81 331 327
Operating income 262 315 1,196 1,384
Add impact of the following:
Depreciation and amortization 187 170 777 699
EBITDA $ 449 $ 485 $ 1,973 $ 2,083
Interest and Interest Coverage The following table reconciles interest expense used in the calculations of the interest coverage ratio to GAAP measures reported in the annual audited consolidated financial statements for the years ended December 29, 2012 and December 31, 2011. Interest coverage is calculated as operating income divided by net interest expense and other financing charges adding back interest capitalized to fixed assets. The Company believes the interest coverage ratio is useful in assessing the Company’s ability to cover its net interest charge with its operating income.
2012 2011 (millions of Canadian dollars) (unaudited) (52 weeks) (52 weeks)
Net interest expense and other financing charges $ 331 $ 327
Add: Interest capitalized to fixed assets 1 1
Interest expense $ 332 $ 328

Management’s Discussion and Analysis
38 2012 Annual Report – Financial Review
Free Cash Flow The following table reconciles free cash flow used in assessing the Company’s financial condition to GAAP measures reported in the annual audited consolidated financial statements for the years ended December 29, 2012 and December 31, 2011. The Company believes that free cash flow is a useful measure in assessing the Company’s cash available for additional funding and investing activities. Free cash flow is calculated as cash flows from operating activities excluding the net change in credit card receivables, less fixed asset purchases.
2012 2011 (millions of Canadian dollars) (unaudited) (52 weeks) (52 weeks)
Cash flows from operating activities $ 1,637 $ 1,814
Net increase (decrease) in credit card receivables 204 104
Less: Fixed asset purchases 1,017 987
Free cash flow $ 824 $ 931
Net Assets The following table reconciles net assets used in the return on average net assets ratio to GAAP measures reported in the annual audited consolidated balance sheets as at the years ended December 29, 2012 and December 31, 2011. The Company believes the return on average net assets ratio is useful in assessing the return on productive assets. Return on average net assets is calculated as operating income for the year divided by average net assets.
As at As at (millions of Canadian dollars) (unaudited) December 29, 2012 December 31, 2011
Total assets $ 17,961 $ 17,428
Less: Cash and cash equivalents 1,079 966
Short term investments 716 754
Security deposits 252 266
Trade payables and other liabilities 3,720 3,677
Net assets $ 12,194 $ 11,765
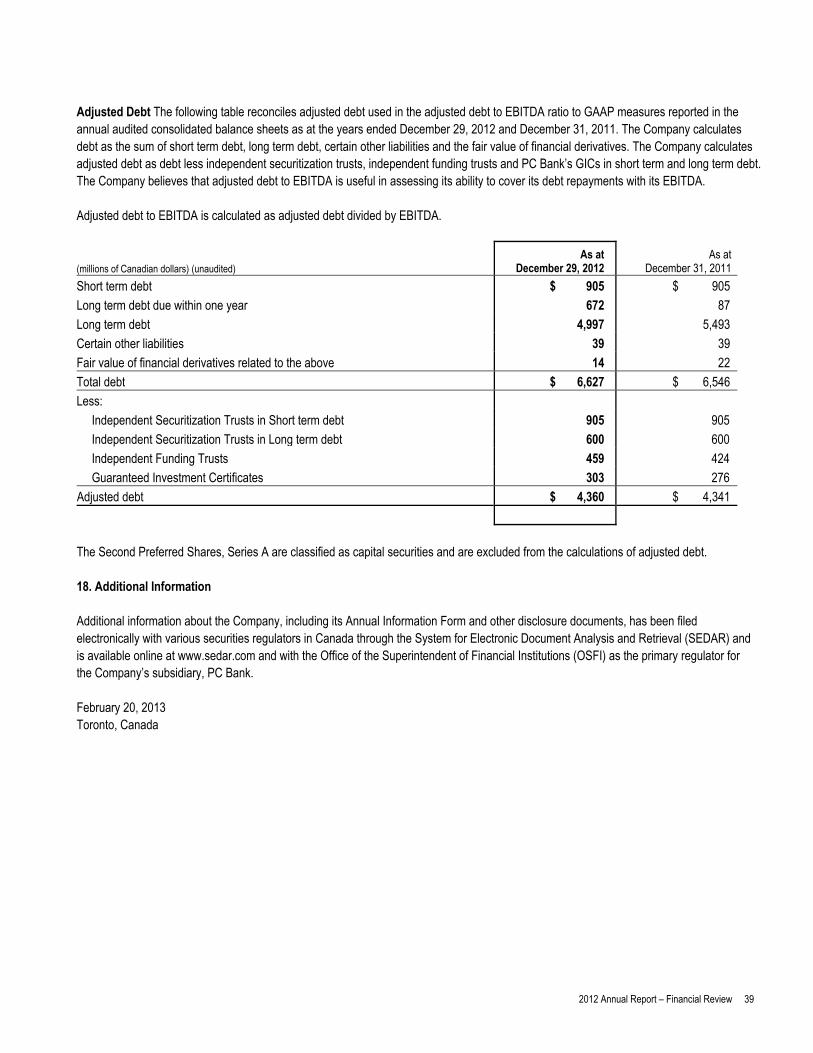
2012 Annual Report – Financial Review 39
Adjusted Debt The following table reconciles adjusted debt used in the adjusted debt to EBITDA ratio to GAAP measures reported in the annual audited consolidated balance sheets as at the years ended December 29, 2012 and December 31, 2011. The Company calculates debt as the sum of short term debt, long term debt, certain other liabilities and the fair value of financial derivatives. The Company calculates adjusted debt as debt less independent securitization trusts, independent funding trusts and PC Bank’s GICs in short term and long term debt. The Company believes that adjusted debt to EBITDA is useful in assessing its ability to cover its debt repayments with its EBITDA. Adjusted debt to EBITDA is calculated as adjusted debt divided by EBITDA.
(millions of Canadian dollars) (unaudited) As at
December 29, 2012 As at
December 31, 2011
Short term debt $ 905 $ 905
Long term debt due within one year 672 87
Long term debt 4,997 5,493
Certain other liabilities 39 39
Fair value of financial derivatives related to the above 14 22
Total debt $ 6,627 $ 6,546
Less:
Independent Securitization Trusts in Short term debt 905 905
Independent Securitization Trusts in Long term debt 600 600
Independent Funding Trusts 459 424
Guaranteed Investment Certificates 303 276
Adjusted debt $ 4,360 $ 4,341
The Second Preferred Shares, Series A are classified as capital securities and are excluded from the calculations of adjusted debt. 18. Additional Information Additional information about the Company, including its Annual Information Form and other disclosure documents, has been filed electronically with various securities regulators in Canada through the System for Electronic Document Analysis and Retrieval (SEDAR) and is available online at www.sedar.com and with the Office of the Superintendent of Financial Institutions (OSFI) as the primary regulator for the Company’s subsidiary, PC Bank. February 20, 2013 Toronto, Canada
Financial Results
40 2012 Annual Report – Financial Review
Management’s Statement of Responsibility for Financial Reporting 41 Independent Auditors’ Report 42 Consolidated Financial Statements
Consolidated Statements of Earnings 43
Consolidated Statements of Comprehensive Income 44
Consolidated Statements of Changes in Shareholders’ Equity 45
Consolidated Balance Sheets 46
Consolidated Statements of Cash Flow 47
Notes to the Consolidated Financial Statements 48 Note 1. Nature and Description of the Reporting Entity 48 Note 2. Significant Accounting Policies 48 Note 3. Critical Accounting Estimates and Judgments 57 Note 4. Future Accounting Standards 58 Note 5. Net Interest Expense and Other Financing Charges 60 Note 6. Income Taxes 60 Note 7. Basic and Diluted Net Earnings per Common Share 62 Note 8. Cash and Cash Equivalents, Short Term Investments and Security Deposits 62 Note 9. Accounts Receivable 63 Note 10. Credit Card Receivables 64 Note 11. Inventories 65 Note 12. Assets Held for Sale 65 Note 13. Fixed Assets 66 Note 14. Investment Properties 68 Note 15. Goodwill and Intangible Assets 69 Note 16. Other Assets 71 Note 17. Provisions 71 Note 18. Short Term Debt 72 Note 19. Long Term Debt 73 Note 20. Other Liabilities 74 Note 21. Share Capital 75 Note 22. Capital Management 76 Note 23. Share-Based Compensation 77 Note 24. Post-Employment and Other Long Term Employee Benefits 81 Note 25. Employee Costs 87 Note 26. Leases 88 Note 27. Financial Instruments 89 Note 28. Financial Risk Management 94 Note 29. Contingent Liabilities 96 Note 30. Financial Guarantees 96 Note 31. Related Party Transactions 97 Note 32. Subsequent Event 99 Note 33. Segment Information 99
Earnings Coverage Exhibit to the Audited Consolidated Financial Statements 101 Three Year Summary 102 Glossary of Terms 103
Management’s Statement of Responsibility for Financial Reporting
2012 Annual Report – Financial Review 41
The management of Loblaw Companies Limited is responsible for the preparation, presentation and integrity of the accompanying consolidated financial statements, Management’s Discussion and Analysis and all other information in the Annual Report – Financial Review (“Annual Report”). This responsibility includes the selection and consistent application of appropriate accounting principles and methods in addition to making the judgments and estimates necessary to prepare the consolidated financial statements in accordance with International Financial Reporting Standards (“IFRS”) as issued by the International Accounting Standards Board (“IASB”). It also includes ensuring that the financial information presented elsewhere in the Annual Report is consistent with that in the consolidated financial statements. Management is also responsible to provide reasonable assurance that assets are safeguarded and that relevant and reliable financial information is produced. Management is required to design a system of internal controls and certify as to the design and operating effectiveness of internal controls over financial reporting. A dedicated control compliance team reviews and evaluates internal controls, the results of which are shared with management on a quarterly basis. KPMG LLP, whose report follows, were appointed as independent auditors by a vote of the Company’s shareholders to audit the consolidated financial statements. The Board of Directors, acting through an Audit Committee comprised solely of directors who are independent, is responsible for determining that management fulfills its responsibilities in the preparation of the consolidated financial statements and the financial control of operations. The Audit Committee recommends the independent auditors for appointment by the shareholders. The Audit Committee meets regularly with senior and financial management, internal auditors and the independent auditors to discuss internal controls, auditing activities and financial reporting matters. The independent auditors and internal auditors have unrestricted access to the Audit Committee. These consolidated financial statements and Management’s Discussion and Analysis have been approved by the Board of Directors for inclusion in the Annual Report based on the review and recommendation of the Audit Committee. Toronto, Canada February 20, 2013 [signed] [signed] [signed] Galen G. Weston Vicente Trius Sarah R. Davis Executive Chairman President Chief Financial Officer

Independent Auditors’ Report
42 2012 Annual Report – Financial Review
To the Shareholders of Loblaw Companies Limited: We have audited the accompanying consolidated financial statements of Loblaw Companies Limited, which comprise the consolidated balance sheets as at December 29, 2012 and December 31, 2011, the consolidated statements of earnings, comprehensive income, changes in shareholders’ equity and cash flow for the 52 week years then ended, and notes, comprising a summary of significant accounting policies and other explanatory information. Management's Responsibility for the Consolidated Financial Statements Management is responsible for the preparation and fair presentation of these consolidated financial statements in accordance with International Financial Reporting Standards, and for such internal control as management determines is necessary to enable the preparation of consolidated financial statements that are free from material misstatement, whether due to fraud or error. Auditors’ Responsibility Our responsibility is to express an opinion on these consolidated financial statements based on our audits. We conducted our audits in accordance with Canadian generally accepted auditing standards. Those standards require that we comply with ethical requirements and plan and perform the audit to obtain reasonable assurance about whether the consolidated financial statements are free from material misstatement. An audit involves performing procedures to obtain audit evidence about the amounts and disclosures in the consolidated financial statements. The procedures selected depend on our judgment, including the assessment of the risks of material misstatement of the consolidated financial statements, whether due to fraud or error. In making those risk assessments, we consider internal control relevant to the entity’s preparation and fair presentation of the consolidated financial statements in order to design audit procedures that are appropriate in the circumstances, but not for the purpose of expressing an opinion on the effectiveness of the entity’s internal control. An audit also includes evaluating the appropriateness of accounting policies used and the reasonableness of accounting estimates made by management, as well as evaluating the overall presentation of the consolidated financial statements. We believe that the audit evidence we have obtained in our audits is sufficient and appropriate to provide a basis for our audit opinion. Opinion In our opinion, the consolidated financial statements present fairly, in all material respects, the consolidated financial position of Loblaw Companies Limited as at December 29, 2012 and December 31, 2011, and its consolidated financial performance and its consolidated cash flows for the 52 week years then ended in accordance with International Financial Reporting Standards. Toronto, Canada February 20, 2013 Chartered Accountants, Licensed Public Accountants
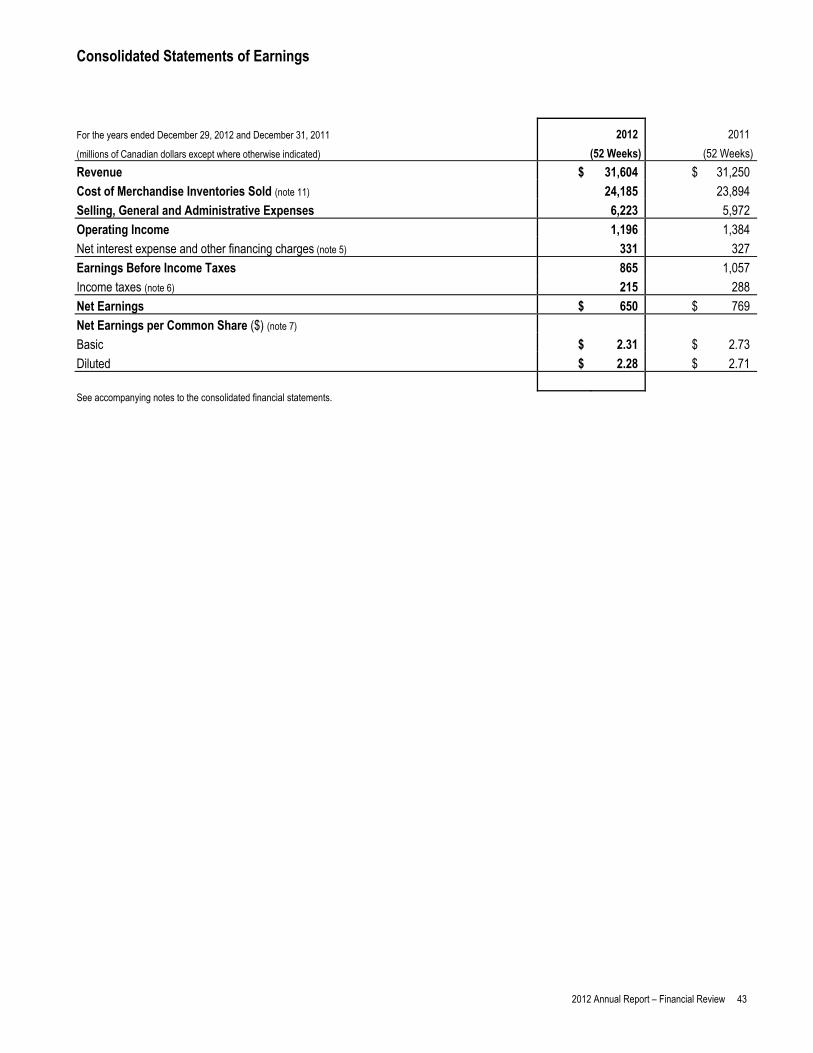
Consolidated Statements of Earnings
2012 Annual Report – Financial Review 43
For the years ended December 29, 2012 and December 31, 2011 2012 2011
(millions of Canadian dollars except where otherwise indicated) (52 Weeks) (52 Weeks)
Revenue $ 31,604 $ 31,250
Cost of Merchandise Inventories Sold (note 11) 24,185 23,894
Selling, General and Administrative Expenses 6,223 5,972
Operating Income 1,196 1,384
Net interest expense and other financing charges (note 5) 331 327
Earnings Before Income Taxes 865 1,057
Income taxes (note 6) 215 288
Net Earnings $ 650 $ 769
Net Earnings per Common Share ($) (note 7)
Basic $ 2.31 $ 2.73
Diluted $ 2.28 $ 2.71
See accompanying notes to the consolidated financial statements.
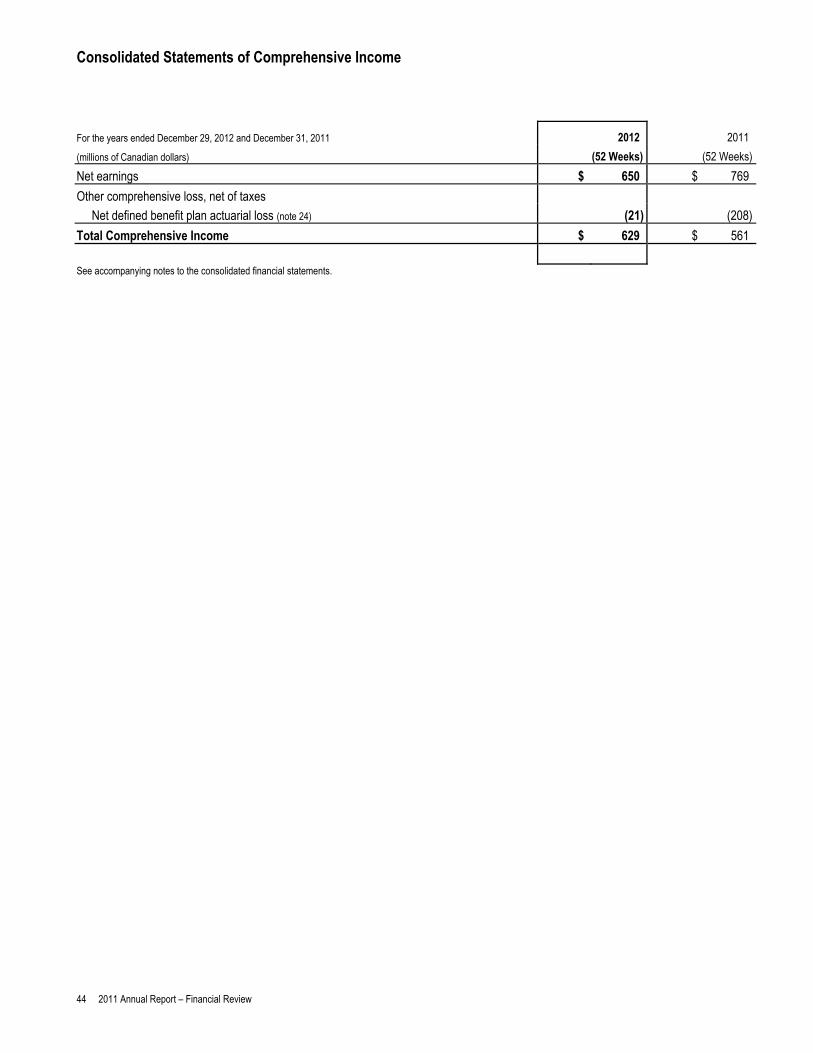
Consolidated Statements of Comprehensive Income
44 2011 Annual Report – Financial Review
For the years ended December 29, 2012 and December 31, 2011 2012 2011
(millions of Canadian dollars) (52 Weeks) (52 Weeks)
Net earnings $ 650 $ 769
Other comprehensive loss, net of taxes
Net defined benefit plan actuarial loss (note 24) (21) (208)
Total Comprehensive Income $ 629 $ 561
See accompanying notes to the consolidated financial statements.

Consolidated Statements of Changes in Shareholders’ Equity
2012 Annual Report – Financial Review 45
Accumulated Common Other Total
Share Retained Contributed Comprehensive Shareholders'
(millions of Canadian dollars except where otherwise indicated) Capital Earnings Surplus Income Equity
Balance at December 31, 2011 $ 1,540 $ 4,414 $ 48 $ 5 $ 6,007
Net earnings − 650 − − 650
Other comprehensive loss (note 24) − (21) − − (21)
Total Comprehensive Income − 629 − − 629
Net effect of share-based compensation (notes 21 and 23) 29 − 7 − 36
Common shares purchased for cancellation (note 21) (2) (14) − − (16)
Dividends declared per common share − $0.85 − (239) − − (239)
27 376 7 − 410
Balance at December 29, 2012 $ 1,567 $ 4,790 $ 55 $ 5 $ 6,417 See accompanying notes to the consolidated financial statements.
Accumulated
Common Other Total
Share Retained Contributed Comprehensive Shareholders'
(millions of Canadian dollars except where otherwise indicated) Capital Earnings Surplus Income Equity
Balance at January 1, 2011 $ 1,475 $ 4,122 $ 1 $ 5 $ 5,603
Net earnings − 769 − − 769
Other comprehensive loss (note 24) − (208) − − (208)
Total Comprehensive Income − 561 − − 561
Dividend reinvestment plan (note 21) 43 − − − 43
Net effect of share-based compensation (notes 21 and 23) 28 − 47 − 75
Common shares purchased for cancellation (note 21) (6) (33) − − (39)
Dividends declared per common share − $0.84 − (236) − − (236)
65 292 47 − 404
Balance at December 31, 2011 $ 1,540 $ 4,414 $ 48 $ 5 $ 6,007 See accompanying notes to the consolidated financial statements.

Consolidated Balance Sheets
46 2012 Annual Report – Financial Review
As at As at
(millions of Canadian dollars) December 29, 2012 December 31, 2011
Assets Current Assets Cash and cash equivalents (note 8) $ 1,079 $ 966 Short term investments (note 8) 716 754 Accounts receivable (note 9) 456 467 Credit card receivables (note 10) 2,305 2,101 Inventories (note 11) 2,007 2,025 Prepaid expenses and other assets 74 117 Assets held for sale (note 12) 30 32 Total Current Assets 6,667 6,462 Fixed Assets (note 13) 8,973 8,725 Investment Properties (note 14) 100 82 Goodwill and Intangible Assets (note 15) 1,057 1,029 Deferred Income Taxes (note 6) 260 232 Security Deposits (note 8) 252 266 Franchise Loans Receivable 363 331 Other Assets (note 16) 289 301 Total Assets $ 17,961 $ 17,428 Liabilities Current Liabilities Trade payables and other liabilities $ 3,720 $ 3,677 Provisions (note 17) 78 35 Income taxes payable 21 14 Short term debt (note 18) 905 905 Long term debt due within one year (note 19) 672 87 Total Current Liabilities 5,396 4,718 Provisions (note 17) 59 50 Long Term Debt (note 19) 4,997 5,493 Deferred Income Taxes (note 6) 18 21 Capital Securities (note 21) 223 222 Other Liabilities (note 20) 851 917 Total Liabilities 11,544 11,421 Shareholders' Equity Common Share Capital (note 21) 1,567 1,540 Retained Earnings 4,790 4,414 Contributed Surplus (note 23) 55 48 Accumulated Other Comprehensive Income 5 5 Total Shareholders' Equity 6,417 6,007 Total Liabilities and Shareholders' Equity $ 17,961 $ 17,428
Contingent liabilities (note 29). Leases (note 26). Financial guarantees (note 30).
See accompanying notes to the consolidated financial statements. Approved on Behalf of the Board [signed] [signed] Galen G. Weston Christie J. B. Clark Director Director
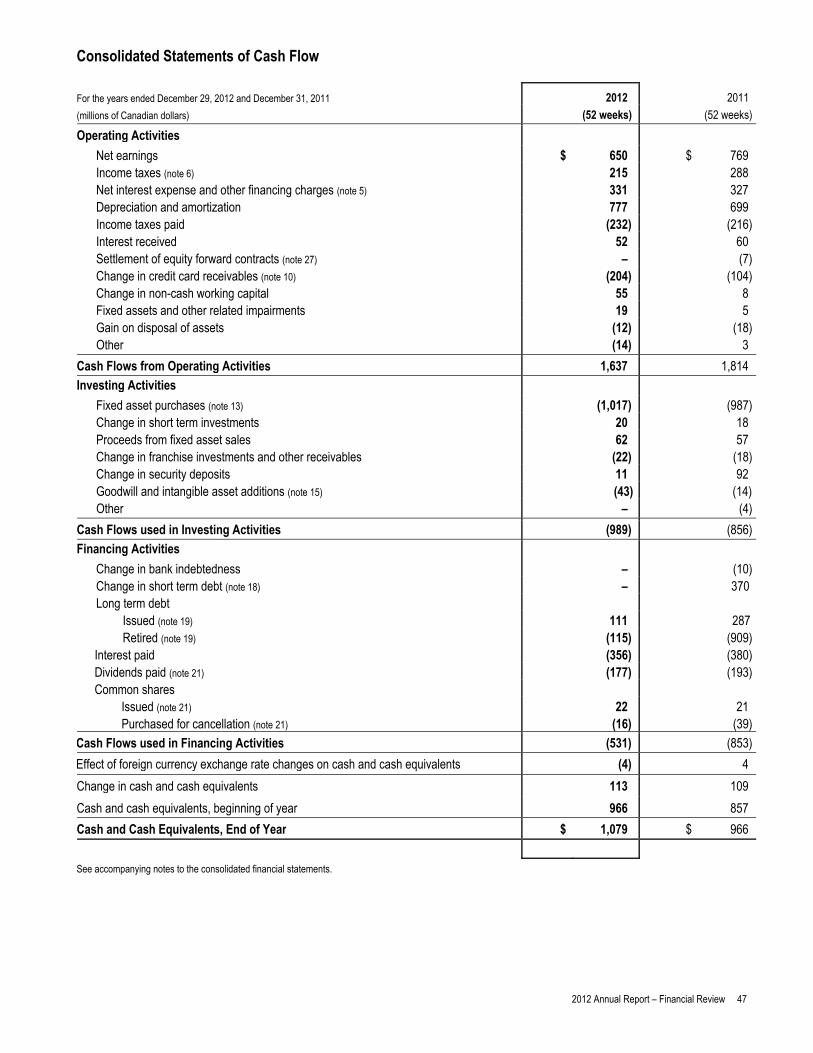
Consolidated Statements of Cash Flow
2012 Annual Report – Financial Review 47
For the years ended December 29, 2012 and December 31, 2011 2012 2011
(millions of Canadian dollars) (52 weeks) (52 weeks)
Operating Activities
Net earnings $ 650 $ 769 Income taxes (note 6) 215 288 Net interest expense and other financing charges (note 5) 331 327 Depreciation and amortization 777 699 Income taxes paid (232) (216) Interest received 52 60 Settlement of equity forward contracts (note 27) – (7) Change in credit card receivables (note 10) (204) (104) Change in non-cash working capital 55 8 Fixed assets and other related impairments 19 5 Gain on disposal of assets (12) (18) Other (14) 3
Cash Flows from Operating Activities 1,637 1,814
Investing Activities
Fixed asset purchases (note 13) (1,017) (987) Change in short term investments 20 18 Proceeds from fixed asset sales 62 57 Change in franchise investments and other receivables (22) (18) Change in security deposits 11 92 Goodwill and intangible asset additions (note 15) (43) (14) Other – (4)
Cash Flows used in Investing Activities (989) (856)
Financing Activities
Change in bank indebtedness – (10) Change in short term debt (note 18) – 370 Long term debt
Issued (note 19) 111 287 Retired (note 19) (115) (909)
Interest paid (356) (380) Dividends paid (note 21) (177) (193) Common shares
Issued (note 21) 22 21 Purchased for cancellation (note 21) (16) (39)
Cash Flows used in Financing Activities (531) (853)
Effect of foreign currency exchange rate changes on cash and cash equivalents (4) 4
Change in cash and cash equivalents 113 109
Cash and cash equivalents, beginning of year 966 857
Cash and Cash Equivalents, End of Year $ 1,079 $ 966
See accompanying notes to the consolidated financial statements.
Notes to the Consolidated Financial Statements
48 2012 Annual Report – Financial Review
For the years ended December 29, 2012 and December 31, 2011 (millions of Canadian dollars except where otherwise indicated)
Note 1. Nature and Description of the Reporting Entity Loblaw Companies Limited is a Canadian public company incorporated in 1956 and is Canada’s largest food retailer and a leading provider of drugstore, general merchandise and financial products and services. Its registered office is located at 22 St. Clair Avenue East, Toronto, Canada M4T 2S7. Loblaw Companies Limited and its subsidiaries are together referred to in these consolidated financial statements as “Loblaw” or the “Company”. The Company’s parent is George Weston Limited (“Weston”), which owns approximately 63% of the Company’s outstanding common shares. The Company’s ultimate parent is Wittington Investments, Limited (“Wittington”). The remaining common shares are widely held. The Company has two reportable operating segments: Retail and Financial Services (see note 33). In December 2012, the Company announced its intention to create a Real Estate Investment Trust (“REIT”), which will acquire a significant portion of Loblaw’s real estate assets and sell units by way of an Initial Public Offering (“IPO”). The IPO of the REIT is expected to be completed by mid-2013, subject to prevailing market conditions and receipt of required regulatory approvals, including approval to list the units on the Toronto Stock Exchange (“TSX”). Note 2. Significant Accounting Policies Statement of Compliance The consolidated financial statements have been prepared in accordance with International Financial Reporting Standards (“IFRS” or “GAAP”) as issued by the International Accounting Standards Board (“IASB”) and using the accounting policies described herein. The consolidated financial statements were authorized for issuance by the Company’s Board of Directors (“Board”) on February 20, 2013. Basis of Preparation The consolidated financial statements were prepared on a historical cost basis except for certain financial instruments carried at fair value. Liabilities for cash-settled share-based compensation arrangements are measured at fair value as described in note 23 and defined benefit plan assets are also recorded at fair value with the obligations related to these pension plans measured at their discounted present value as described in note 24. The significant accounting policies set out below have been applied consistently in the preparation of the consolidated financial statements for all periods presented. The consolidated financial statements are presented in Canadian dollars. Basis of Consolidation The consolidated financial statements include the accounts of the Company and other entities that the Company controls in accordance with IAS 27, “Consolidated and Separate Financial Statements” (“IAS 27”). Special Purpose Entities (“SPE”) are consolidated under Standing Interpretations Committee (“SIC”) Interpretation 12, “Consolidation – Special Purpose Entities”, (“SIC-12”), if, based on an evaluation of the substance of its relationship with the Company and the SPE’s risks and rewards, the Company concludes that it controls the SPE. SPEs controlled by the Company were established under terms that impose strict limitations on the decision-making powers of the SPE’s management and that results in the Company receiving the majority of the benefits related to the SPE’s operations and net assets, being exposed to the majority of risks incident to the SPE’s activities, and retaining the majority of the residual or ownership risks related to the SPEs or their assets. Fiscal Year The fiscal year of the Company ends on the Saturday closest to December 31. Under an accounting convention common in the food retail industry, the Company follows a 52-week reporting cycle which periodically necessitates a fiscal year of 53 weeks. The years ended December 29, 2012 and December 31, 2011 both contained 52 weeks. The next 53 week year will occur in fiscal 2014.
2012 Annual Report – Financial Review 49
Net Earnings per Common Share Basic net earnings per common share (“EPS”) is calculated by dividing the net earnings available to common shareholders by the weighted average number of common shares outstanding during the period. The diluted EPS calculation assumes that the weighted average number of outstanding stock options during the period with an exercise price below the average market price during the period is exercised and the assumed proceeds are used to purchase the Company’s common shares at the average market price during the period. Diluted EPS also takes into consideration the dilutive effect of the conversion options on the capital securities, equity forwards recorded in trade and other payables and certain other liabilities. Revenue Recognition Revenue includes sales, net of estimated returns, to customers through corporate stores operated by the Company, sales to and service fees from franchised stores, associated stores, independent account customers, and financial services, net of sales incentives offered by the Company. The Company recognizes revenue at the time the sale is made to its customers and at the time of delivery of inventory to its associated and franchise stores. Interest income on credit card loans, service fees and other revenue related to financial services are recognized on an accrual basis. Customer loyalty awards are accounted for as a separate component of the sales transaction in which they are granted. A portion of the consideration received in a transaction that includes the issuance of an award is deferred until the awards are ultimately redeemed. The allocation of the consideration to the award is based on an evaluation of the award’s estimated fair value at the date of the transaction using the residual fair value method. On the initial sale of a franchising arrangement, the Company offers products and services as part of a multiple deliverable arrangement which is recorded using a relative fair value approach. Taxation The asset and liability method of accounting is used for income taxes. Under the asset and liability method, deferred income tax assets and liabilities are recognized for the deferred income tax consequences attributable to temporary differences between the financial statement carrying values of existing assets and liabilities and their respective income tax bases. Current and deferred taxes are charged to or credited in the consolidated statement of earnings, except when it relates to a business combination, or items charged or credited directly to equity or to other comprehensive income (loss). Current tax is the expected tax payable or receivable on the taxable income or loss for the period, using tax rates enacted or substantively enacted at the reporting date, and any adjustment to tax payable in respect of previous years. Deferred tax is measured using enacted or substantively enacted income tax rates expected to apply in the years in which those temporary differences are expected to be recovered or settled. A deferred tax asset is recognized for unused tax losses and credits to the extent that it is probable that future taxable profits will be available against which they can be utilized. Deferred tax assets are reviewed at each reporting date and are reduced to the extent that it is no longer probable that the related tax benefit will be realized. Deferred tax assets and liabilities are offset when they relate to income taxes levied by the same taxation authority and the Company intends to settle its current tax assets and liabilities on a net basis. Deferred tax is provided on temporary differences arising on investments in subsidiaries, except where the timing of the reversal of the temporary difference is controlled by the Company and it is probable that the temporary difference will not reverse in the foreseeable future. Cash and Cash Equivalents Cash and cash equivalents consist of highly liquid marketable investments with an original maturity date of 90 days or less from the date of acquisition. Short Term Investments Short term investments primarily consist of government treasury bills, government agencies securities, corporate commercial paper and bankers’ acceptances. Security Deposits Security deposits consist primarily of cash, government treasury bills and government agencies securities, which are required to be placed with counterparties as collateral to enter into and maintain outstanding letters of credit, financial derivative contracts and equity forwards. The amount of the required security deposits will fluctuate primarily as a result of the change in market value of the derivatives. Accounts Receivable Accounts receivable, net of allowances for doubtful accounts, include amounts due from independent franchisees, associated stores, independent accounts and amounts owed from vendors.
Notes to the Consolidated Financial Statements
50 2012 Annual Report – Financial Review
Credit Card Receivables The Company, through President’s Choice Bank (“PC Bank”), a wholly owned subsidiary of the Company, has credit card receivables that are stated net of an allowance. Interest income is recorded in revenue and interest expense is recorded in net interest expense and other financing charges using the effective interest method. The effective interest rate is the rate that discounts the estimated future cash receipts through the expected life of the credit card receivable (or, where appropriate, a shorter period) to the carrying amount. When calculating the effective interest rate, the Company estimates future cash flows considering all contractual terms of the financial instrument, but not future credit losses. PC Bank considers evidence of impairment losses on a portfolio basis for which losses cannot be determined on an item-by-item basis. The allowance is based upon a statistical analysis of past and current performance, the level of allowance already in place and management’s judgment. The allowance for credit card receivables is deducted from the credit card receivables balance. Interest on the impaired asset continues to be recognized. The net credit loss experience for the year is recognized in operating income. Periodically, the Company transfers credit card receivables by selling them to and repurchasing them from independent securitization trusts. PC Bank is required to absorb a portion of the related credit losses. Accordingly, the Company continues to recognize these assets in credit card receivables and the transferred receivables are accounted for as secured financing transactions. The Company consolidates one of the independent securitization trusts, Eagle Credit Card Trust (“Eagle”), as a SPE. The associated liabilities secured by these assets are included in either short term debt or long term debt based on their characteristics and are carried at amortized cost. Franchise Loans Receivable Franchise loans receivable are comprised of amounts due from independent franchisees for loans issued through an independent funding trust that is consolidated under SIC-12. Each independent franchisee provides security to the independent funding trust for its obligations by way of a general security agreement. In the event that an independent franchisee defaults on its loan and the Company has not, within a specified time period, assumed the loan or the default is not otherwise remedied, the independent funding trust would assign the loan to the Company and draw upon a standby letter of credit. The Company has agreed to reimburse the issuing bank for any amount drawn on the standby letter of credit. Inventories The Company values merchandise inventories at the lower of cost and net realizable value. Cost includes the costs of purchases net of vendor allowances plus other costs, such as transportation, that are directly incurred to bring inventories to their present location and condition. Seasonal general merchandise and inventories at distribution centres are measured at weighted average cost. The Company uses the retail method to measure the cost of the majority of retail store inventories. The Company estimates net realizable value as the amount that inventories are expected to be sold taking into consideration fluctuations in retail prices due to seasonality less estimated costs necessary to make the sale. Inventories are written down to net realizable value when the cost of inventories is estimated to be unrecoverable due to obsolescence, damage or declining selling prices. When circumstances that previously caused inventories to be written down below cost no longer exist or when there is clear evidence of an increase in retail selling prices, the amount of the write-down previously recorded is reversed. Storage costs, indirect administrative overhead and certain selling costs related to inventories are expensed in the period that these costs are incurred. Vendor Allowances The Company receives allowances from certain of its vendors whose products it purchases for resale. These allowances are received for a variety of buying and/or merchandising activities, including vendor programs such as volume purchase allowances, purchase discounts, listing fees and exclusivity allowances. Allowances received from a vendor is a reduction in the cost of the vendor’s products and is recognized as a reduction in the cost of merchandise inventories sold and the related inventory when recognized in the consolidated statements of earnings and the consolidated balance sheets, respectively. Certain exceptions apply if the consideration is a payment for assets or services delivered to the vendor or for reimbursement of selling costs incurred to promote the vendor’s products. The consideration is then recognized as a reduction of the cost incurred in the consolidated statements of earnings. Fixed Assets Fixed assets are recognized and subsequently measured at cost less accumulated depreciation and any accumulated impairment losses. Cost includes expenditures that are directly attributable to the acquisition of the asset to prepare the asset for its intended use and capitalized borrowing costs. The commencement date for capitalization of costs occurs when the Company first incurs expenditures for the qualifying assets and undertakes the required activities to prepare the assets for their intended use.
2012 Annual Report – Financial Review 51
Depreciation commences when the assets are available for use and is expensed on a straight-line basis through operating income to depreciate the cost of these assets to their estimated residual value over their estimated useful lives. When significant parts of a fixed asset have different useful lives, they are accounted for as separate components of the asset and depreciated over their estimated useful lives. Depreciation methods, useful lives and residual values are reviewed at each financial year end and are adjusted if appropriate. Estimated useful lives are as follows: Buildings – 10 to 40 years Equipment and fixtures – 2 to 10 years Building improvements – up to 10 years Leasehold improvements are depreciated over the lesser of the lease term, which may include renewal options, and their estimated useful lives to a maximum of 25 years. Fixed assets held under finance leases are depreciated over the lesser of their expected useful lives, on the same basis as owned assets, or the term of the lease, unless it is reasonably certain that the Company will obtain ownership by the end of the lease term in which case it would be depreciated over the life of the asset. Fixed assets are reviewed at each balance sheet date to determine whether there is any indication of impairment. Refer to the Impairment of Non-Financial Assets policy below. Investment Properties Investment properties are properties owned by the Company that are held to either earn rental income, for capital appreciation, or both. The Company’s investment properties include single tenant properties held to earn rental income and certain multiple tenant properties. Land and buildings leased to franchisees are not accounted for as investment properties as these properties are related to the Company’s operating activities. Investment property assets are recognized at cost less accumulated depreciation and any accumulated impairment losses. The depreciation policies for investment properties are consistent with those described in the accounting policy for fixed assets. Investment properties are reviewed at each balance sheet date to determine whether there is any indication of impairment. Refer to the Impairment of Non-Financial Assets policy below. Borrowing Costs Borrowing costs directly attributable to the acquisition, construction or production of fixed assets that necessarily take a substantial period of time to prepare for their intended use and a proportionate share of general borrowings, are capitalized to the cost of those fixed assets, until such time as the fixed assets are substantially ready for their intended use, based on a quarterly weighted average cost of borrowing. Goodwill Goodwill arising in a business combination is recognized as an asset at the date that control is acquired. Goodwill is measured as the excess of the sum of the fair value of the consideration transferred over the fair value of the identifiable assets acquired less the fair value of the liabilities assumed. Goodwill is tested for impairment at least annually and whenever there is an indication that the asset may be impaired. Refer to the Impairment of Non-Financial Assets policy below. Intangible Assets The Company assesses intangible asset for legal, regulatory, contractual, competitive or other factors to determine if the useful life is definite. Acquired intangible assets that have definite useful lives are measured at cost less accumulated amortization and accumulated impairment losses. Intangible assets with a definite life are amortized on a straight-line basis through operating income over the related assets’ estimated useful lives, which range from 3 to 13 years. Indefinite life intangible assets are measured at cost less any accumulated impairment losses. Indefinite life intangible assets are tested for impairment at least annually and whenever there is an indication that the asset may be impaired. Refer to the Impairment of Non-Financial Assets policy below.
Notes to the Consolidated Financial Statements
52 2012 Annual Report – Financial Review
Impairment of Non-Financial Assets At each balance sheet date, the Company reviews the carrying amounts of its definite life non-financial assets, including fixed assets, investment properties and intangible assets to determine whether there is any indication of impairment. Goodwill and intangible assets with indefinite useful lives are tested for impairment at least annually, and whenever there is an indication that the asset may be impaired. If any such indication of impairment exists, the recoverable amount of the asset is estimated in order to determine the extent of the impairment loss, if any. For the purposes of reviewing definite life non-financial assets for impairment, asset groups are reviewed at their lowest level for which identifiable cash inflows are largely independent of cash inflows of other assets or groups of assets. This grouping is referred to as a cash generating unit (“CGU”). The Company has determined that each retail location and each investment property is a separate CGU for purposes of impairment testing. Various impairment indicators are used to determine the need to test a retail location for an impairment loss. Indicators include performance of a retail location below forecast and expectation of an adverse impact on future performance of a retail location from competitive activities. The Company’s corporate assets, which include the head office facilities and distribution centres, do not generate separate cash inflows. Corporate assets are tested for impairment at the minimum collection of CGUs to which the corporate asset can be allocated reasonably and consistently. The recoverable amount of a CGU is the greater of its value in current use and its fair value less costs to sell. The Company determines the value in use of its retail locations by discounting the expected cash flows that management estimates can be generated from continued use of the CGU. The process of determining the cash flows requires management to make estimates and assumptions including projected future sales, earnings and capital investment, and discount rates. The Company determines the fair value less costs to sell of its retail locations using various assumptions, including the market rental rates for properties located within the same geographical areas as the properties being valued, highest and best use of the property for the geographical area, recoverable operating costs for leases with tenants, non-recoverable operating costs, discount rates, capitalization rates and terminal capitalization rates for the purposes of determining the estimated net proceeds from the sale of the property. An impairment loss is recognized if the carrying amount of a CGU exceeds its recoverable amount. Impairment losses are recognized in operating income in the period in which they occur. If an impairment subsequently reverses, the carrying amount of the asset is increased to the extent that the carrying value of the underlying assets does not exceed the carrying amount, net of depreciation, that would have been determined if no impairment had been recognized. Impairment reversals are recognized in operating income in the period in which they occur. Goodwill and intangible assets with indefinite lives are assessed for impairment based on the group of CGUs expected to benefit from the synergies of the business combination, and the lowest level at which management monitors the goodwill. Any potential impairment is identified by comparing the recoverable amount of the CGU grouping to which the assets are allocated to its carrying value. If the recoverable amount, calculated as the higher of the fair value less costs to sell and the value in use, is less than its carrying amount, an impairment loss is recognized in operating income in the period in which it occurs. Impairment losses on goodwill are not subsequently reversed if conditions change. Provisions Provisions are recognized when there is a legal or constructive obligation for which it is probable that a transfer of resources will be required to settle the obligation. The amount recognized as a provision is the present value of the best estimate of the consideration required to settle the present obligation at the end of the reporting period, taking into account the risks and uncertainties surrounding the obligation.
2012 Annual Report – Financial Review 53
Financial Instruments Financial assets and liabilities are recognized when the Company becomes a party to the contractual provisions of the financial instrument. Financial assets are derecognized when the contractual rights to receive cash flows and benefits from the financial asset expire, or if the Company transfers the control or substantially all the risks and rewards of ownership of the financial asset to another party. Financial liabilities are derecognized when obligations under the contract expire, are discharged or cancelled. Financial instruments upon initial recognition are measured at fair value and classified as either financial assets or financial liabilities as fair value through profit or loss, held-to-maturity investments, loans and receivables or other financial liabilities. Financial instruments are included on the consolidated balance sheets and measured after initial recognition at fair value, except for loans and receivables, held-to-maturity financial assets and other financial liabilities, which are measured at amortized cost. Fair values are based on quoted market prices where available from active markets, otherwise fair values are estimated using valuation methodologies, primarily discounted cash flows taking into account external market inputs where possible. Gains and losses on fair value through profit or loss financial assets and financial liabilities are recognized in earnings before income taxes in the period in which they are incurred. Settlement date accounting is used to account for the purchase and sale of financial assets. Gains or losses between the trade date and settlement date on fair value through profit or loss financial assets are recorded in net earnings before income taxes and other comprehensive income, respectively. Transaction costs other than those related to financial instruments classified as fair value through profit or loss, which are expensed as incurred, are capitalized to the carrying amount of the instrument and amortized using the effective interest method. Impairment of Financial Instruments An assessment of whether there is objective evidence that a financial asset or a group of financial assets is impaired is performed at each balance sheet date. A financial asset or group of financial assets is considered to be impaired if one or more loss events that have an impact on the future cash flows of the financial asset or group of assets occur after initial recognition of the financial asset and the loss can be reliably measured. This assessment is performed on an individual financial asset basis or on a portfolio of financial assets basis. If there is objective evidence that an impairment loss on loans and receivables carried at amortized cost has occurred, the loss is based on the difference between the carrying amount of the financial asset, or portfolio of financial assets, and the respective estimated future cash flows discounted at the financial instruments’ original effective interest rate and is recorded as an allowance for losses. If, in a subsequent period, the impairment loss decreases, the previously recognized impairment is reversed to the extent of the impairment. Derivative Instruments Financial derivative instruments in the form of cross currency swaps, interest rate swaps, foreign exchange forwards and equity forwards, as well as non-financial derivatives in the form of futures contracts, options contracts and forward contracts, are recorded at fair value on the consolidated balance sheets. Any embedded derivative instruments that may be identified are separated from their host contract and recorded on the consolidated balance sheets at fair value. Fair values are based on quoted market prices where available from active markets otherwise, fair values are estimated using valuation methodologies, primarily discounted cash flows, taking into account external market inputs. Derivative instruments are recorded in current or non-current assets and liabilities based on their remaining terms to maturity. All changes in fair values of the derivative instruments are recorded in net earnings unless the derivative qualifies and is effective as a hedging instrument in a designated hedging relationship. Foreign Currency Translation The functional currency of the Company is the Canadian dollar. Assets and liabilities denominated in foreign currencies are translated into Canadian dollars at the foreign currency exchange rate in effect at the balance sheet date. Exchange gains or losses arising from the translation of these balances denominated in foreign currencies are recognized in operating income. Revenues and expenses denominated in foreign currencies are translated into Canadian dollars at foreign currency exchange rates that approximate the rates in effect at the dates when such items are transacted. Short term Employee Benefits Short term employee benefits include wages, salaries, compensated absences, profit-sharing and bonuses. Short term employee benefit obligations are measured on an undiscounted basis and are recognized in operating income as the related service is provided or capitalized if the service rendered is in connection with the creation of a tangible or intangible asset. A liability is recognized for the amount expected to be paid under short term cash bonus or profit sharing plans if the Company has a present legal or constructive obligation to pay this amount as a result of past service provided by the employee and the obligation can be estimated reliably.

Notes to the Consolidated Financial Statements
54 2012 Annual Report – Financial Review
Defined Benefit Plans The Company has a number of contributory and non-contributory defined benefit plans providing pension and other benefits to eligible employees. The defined benefit pension plans provide a pension based on length of service and eligible pay. The other defined benefits include health care, life insurance and dental benefits provided to eligible employees who retire at certain ages having met certain service requirements. The Company’s net obligation in respect of defined benefits is calculated separately for each plan. Defined benefit plan obligations are actuarially calculated by a qualified actuary at the balance sheet date using the projected unit credit method. The actuarial valuations are determined based on management’s best estimate of the discount rate, the expected long term rate of return on plan assets, the rate of compensation increase, retirement rates, termination rates, mortality rates and expected growth rate of health care costs. The discount rate used to value the defined benefit plan obligation for accounting purposes is based on the yield on a portfolio of Corporate AA bonds denominated in the same currency in which the benefits are expected to be paid and with terms to maturity that, on average, match the terms of the defined benefit plan obligations. The expected long term rate of return on plan assets is based on current market conditions, the asset mix, the active management of defined benefit pension plan assets and historical returns. The expected growth rate in health care costs is based on external data and the Company’s historical trends for health care costs. Unrecognized past service costs (see below) and the fair value of plan assets are deducted from the defined benefit plan obligations to arrive at the net defined benefit plan obligations. Past service costs arising from plan amendments are recognized in operating income in the year that they arise to the extent that the associated benefits are fully vested. Unvested past service costs are recognized in operating income on a straight-line basis over the vesting period of the associated benefits. The interest cost on the defined benefit plan obligation and the expected return on plan assets as determined by the actuarial valuations are recognized in net interest expense and other financing charges. For plans that resulted in a net defined benefit asset, the recognized asset is limited to the total of any unrecognized past service costs plus the present value of economic benefits available in the form of future refunds from the plan or reductions in future contributions to the plan (the “asset ceiling”). In order to calculate the present value of economic benefits, consideration is given to minimum funding requirements that apply to the plan. If it is anticipated that the Company will not be able to recover the value of the net defined benefit asset, after considering minimum funding requirements for future service, the net defined benefit asset is reduced to the amount of the asset ceiling. The effect of the asset ceiling is recognized in other comprehensive income or loss. When the payment in the future of minimum funding requirements related to past service would result in a net defined benefit surplus or an increase in a surplus, the minimum funding requirements are recognized as a liability to the extent that the surplus would not be fully available as a refund or a reduction in future contributions. Remeasurement of this liability is recognized in other comprehensive income or loss in the period in which the remeasurement occurs. At each balance sheet date, plan assets are measured at fair value and defined benefit plan obligations are measured using assumptions which approximate their fair values at the reporting date, with the resulting actuarial gains and losses from both of these measurements recognized in other comprehensive income or loss. Defined Contribution Plans The Company maintains a number of defined contribution pension plans for employees in which the Company pays fixed contributions for eligible employees into a registered plan and has no further significant obligation to pay any further amounts. The amount of the pension benefit is based on accumulated Company contributions and in most plans, employee contributions and investment gains and losses. The costs of benefits for defined contribution plans are expensed as contributions are due. Multi-Employer Pension Plans The Company participates in multi-employer pension plans which are accounted for as defined contribution plans. The Company’s responsibility to make contributions to these plans is established pursuant to its collective agreements. The Company does not administer these plans, but rather, the administration and the investment of their assets are controlled by a board of trustees generally consisting of an equal number of union and employer representatives. The contributions made by the Company to multi-employer plans are expensed as contributions are due.

2012 Annual Report – Financial Review 55
Other Long Term Employee Benefit Plans The Company offers other long term employee benefits including contributory long term disability benefits and non-contributory continuation of health care and dental benefits to employees who are on long term disability leave. As the amount of the long term disability benefit does not depend on length of service, the obligation is recognized when an event occurs that gives rise to an obligation to make payments. The amount of other long term employee benefits is actuarially calculated by a qualified actuary at the balance sheet date using the projected unit credit method. The discount rate used to value the other long term employee benefit plan obligations is based on the yield on a portfolio of Corporate AA bonds denominated in the same currency in which the benefits are expected to be paid and with terms to maturity that, on average, match the terms of the other long term employee benefit plan obligations. The interest cost on the other long term employee benefit plan obligations and the expected return on plan assets as determined by the actuarial valuations are recognized in net interest expense and other financing charges. At each balance sheet date, plan assets are measured at fair value and other long term employee benefit plan obligations are measured using assumptions which approximate their fair values at the reporting date, with the resulting actuarial gains and losses from both of these measurements recognized immediately in operating income. Past service costs are recognized immediately in operating income in the period in which they arise. Termination Benefits Termination benefits are recognized as an expense when the Company is demonstrably committed, without realistic possibility of withdrawal, to a formal detailed plan to either terminate employment before the normal retirement date, or to provide termination benefits as a result of an offer made to encourage voluntary redundancy. Termination benefits for voluntary redundancies are recognized as an expense if the Company has made an offer of voluntary redundancy, it is probable that the offer will be accepted and the number of acceptances can be estimated reliably. Benefits payable are discounted to their present value when the effect of the time value of money is material. Stock Option Plan Stock options issued by the Company are settled in common shares and are accounted for as equity-settled stock options. These stock options vest in tranches over a three to five year period. The fair value of each tranche of options granted to certain employees is measured separately at the grant date using a Black-Scholes option pricing model, and is recognized as an expense in operating income over the vesting period of each tranche, with a corresponding increase in contributed surplus. During the vesting period the amount recognized as an expense is adjusted to reflect revised expectations about the number of options expected to vest, such that the amount ultimately recognized as an expense is based on the number of awards that meet the vesting conditions. Upon exercise of vested options, the amount recognized in contributed surplus for the award plus the cash received upon exercise is recognized as an increase in share capital. Prior to February 22, 2011, stock options could be settled in shares or in the share appreciation value in cash at the option of the employee. These options were accounted for as cash-settled stock options and vested in tranches over a three to five year vesting period; accordingly, each tranche was valued separately using a Black-Scholes option pricing model. The fair value of the amount payable to employees in respect of these plans was re-measured at each balance sheet date, and a compensation expense was recognized in operating income over the vesting period for each tranche with a corresponding change in the liability. Forfeitures were estimated at the grant date and were revised to reflect a change in expected or actual forfeitures. Restricted Share Unit Plan Restricted Share Unit (“RSU”) grants entitle certain employees to a cash payment equal to the weighted average price of a Loblaw common share on the TSX in the five trading days after the end of a performance period ranging from three to five years following the date of the award multiplied by the number of units that vest. The Company recognizes a compensation expense in operating income for each RSU granted equal to the market value of a Loblaw common share less the net present value of the expected dividend stream at the date on which RSUs are awarded to each participant. The compensation expense is prorated over the performance period reflecting changes in the market value of a Loblaw common share until the end of the performance period. Forfeitures are estimated at the grant date and are revised to reflect a change in expected or actual forfeitures.
Notes to the Consolidated Financial Statements
56 2012 Annual Report – Financial Review
Performance Share Unit Plan Performance Share Unit (“PSU”) grants entitle certain employees to a cash payment equal to the weighted average price of a Loblaw common share on the TSX in the five trading days preceding the end of a three year performance period multiplied by the number of units that vest. The number of units that vest will vary based on the achievement of specified performance measures. The Company recognizes a compensation expense in operating income for each PSU expected to vest equal to the market value of a Loblaw common share less the net present value of the expected dividend stream at the date on which PSUs are awarded to each participant. The compensation expense is prorated over the performance period reflecting changes in the market value of a Loblaw common share and the number of PSUs expected to vest until the end of the performance period based on the achievement of the associated performance measures. Forfeitures are estimated at the grant date and are revised to reflect a change in expected or actual forfeitures. Director Deferred Share Unit Plan Members of the Board, who are not management of the Company, are required to hold a portion of their retainers and fees in the form of Director Deferred Share Units (“DSUs”) until they satisfy their required level of equity ownership. Holders of DSUs earn dividends in the form of additional fractional DSUs during the holding period. The fractional DSU issued during the holding period is treated as additional awards. The Company recognizes an expense in operating income for each DSU granted equal to the market value of a Loblaw common share at the date on which DSUs are awarded and records a corresponding liability. After the grant date, the DSU liability is re-measured for subsequent changes in the market value of a Loblaw common share. The DSU’s are settled upon termination of Board service. Executive Deferred Share Unit Plan Under this plan, eligible executives may elect to defer up to 100% of the Short Term Incentive Plan (“STIP”) earned in any year into the Executive Deferred Share Unit (“EDSU”) Plan, subject to an overall cap of three times the executive’s base salary. All EDSUs held by an executive will be paid out in cash by December 15 of the year following the year in which the executive’s employment ceases for any reason. An election to participate in the plan in any year must be made before the beginning of the year and is irrevocable. Each EDSU entitles the holder to receive the cash equivalent of a Loblaw common share. The number of EDSUs granted in respect of any year will be determined by dividing the STIP compensation that is subject to the EDSU plan election by the market value of the Company’s common shares on the date the STIP compensation would otherwise be payable. For this purpose, and for purposes of determining the value of an EDSU upon conversion of the EDSUs into cash, the value of the EDSUs will be calculated by using the weighted average of the trading prices of the Company’s common shares on the TSX for the five trading days prior to the valuation date. After the grant date, any change in fair value is recognized in operating income in the period of the change with a corresponding offset to the liability. Employee Share Ownership Plan The Company maintains an Employee Share Ownership Plan (“ESOP”) which allows employees to acquire the Company’s common shares through regular payroll deductions of up to 5% of their gross regular earnings. The Company contributes an additional 25% of each employee’s contribution to the plan and recognizes a compensation expense in operating income when the contribution is made. The ESOP is administered through a trust which purchases the Company’s common shares on the open market on behalf of its employees. Accounting Standards Implemented in 2012 Financial Instruments – Disclosures In 2010, the IASB issued amendments to IFRS 7, “Financial Instruments: Disclosures”, which increase the disclosure requirements for transactions involving transfers of financial assets to help users of the financial statements evaluate the risk exposures related to such transfers and the effect of those risks on an entity’s financial position. These amendments are effective and were implemented in the first quarter of 2012. For new disclosures, see note 27. Deferred Tax – Recovery of Underlying Assets In 2010, the IASB issued amendments to IAS 12, “Income Taxes” (“IAS 12”), that introduce an exception to the general measurement requirements of IAS 12 for investment properties measured at fair value. These amendments were effective in the first quarter of 2012. As part of its transition to IFRS, the Company elected to account for its investment properties at cost and as such, the amendments did not have an impact on the Company’s results of operations or financial condition.
2012 Annual Report – Financial Review 57
Note 3. Critical Accounting Estimates and Judgments The preparation of the consolidated financial statements requires management to make estimates and judgments in applying the Company’s accounting policies that affect the reported amounts and disclosures made in the consolidated financial statements and accompanying notes. Within the context of these consolidated financial statements, a judgment is a decision made by management in respect of the application of an accounting policy, a recognized or unrecognized financial statement amount and/or note disclosure, following an analysis of relevant information that may include estimates and assumptions. Estimates and assumptions are used mainly in determining the measurement of balances recognized or disclosed in the consolidated financial statements and are based on a set of underlying data that may include management’s historical experience, knowledge of current events and conditions and other factors that are believed to be reasonable under the circumstances. Management continually evaluates the estimates and judgments it uses. The following are the accounting policies subject to judgments and key sources of estimation uncertainty that the Company believes could have the most significant impact on the amounts recognized in the consolidated financial statements. The Company’s significant accounting policies are disclosed in note 2. Inventories Key Sources of Estimation Inventories are carried at the lower of cost and net realizable value which requires the Company to utilize estimates related to fluctuations in future retail prices, seasonality and costs necessary to sell the inventory. Impairment of Non-Financial Assets (Goodwill, Intangible Assets, Fixed Assets and Investment Properties) Judgments Made in Relation to Accounting Policies Applied Management is required to use judgment in determining the grouping of assets to identify their CGUs for the purposes of testing fixed assets for impairment. Judgment is further required to determine appropriate groupings of CGUs, for the level at which goodwill and intangible assets are tested for impairment. The Company has determined that each retail location and each investment property is a separate CGU for purposes of fixed asset impairment testing. For the purpose of goodwill and indefinite intangible impairment testing, CGUs are grouped at the lowest level at which goodwill and intangibles are monitored for internal management purposes. In addition, judgment is used to determine whether a triggering event has occurred requiring an impairment test to be completed. Key Sources of Estimation In determining the recoverable amount of a CGU or a group of CGUs, various estimates are employed. The Company determines fair value less costs to sell using such estimates as market rental rates for comparable properties, recoverable operating costs for leases with tenants, non-recoverable operating costs, discount rates, capitalization rates and terminal capitalization rates. The Company determines value in use by using estimates including projected future sales, earnings and capital investment consistent with strategic plans presented to the Board. Discount rates are consistent with external industry information reflecting the risk associated with the specific cash flows. Franchise Loan Receivable and Certain Other Financial Assets Judgments Made in Relation to Accounting Policies Applied Management reviews franchise loans receivable, trade receivables and certain other assets relating to their franchise business at each balance sheet date utilizing judgment to determine whether a triggering event has occurred requiring an impairment test to be completed. Key Sources of Estimation Management determines the initial fair value of its franchise loans and certain other financial assets using discounted cash flow models corroborated by other valuation techniques. The process of determining these fair values requires management to make estimates of a long term nature regarding discount rates, projected revenues, and margins, as applicable, derived from past experience, actual operating results, budgets and the Company’s five year forecast.

Notes to the Consolidated Financial Statements
58 2012 Annual Report – Financial Review
Income and Other Taxes Judgments Made in Relation to Accounting Policies Applied The calculation of current and deferred income taxes requires management to make certain judgments regarding the tax rules in jurisdictions where the Company performs activities. Application of judgments is required regarding classification of transactions and in assessing probable outcomes of claimed deductions including expectations about future operating results, the timing and reversal of temporary differences and possible audits of income tax and other tax filings to the tax authorities. Post-Employment and Other Long Term Employee Benefits Key Sources of Estimation Accounting for the costs of defined benefit pension plans and other applicable post-employment benefits is based on using a number of assumptions including estimates for expected return on plan assets. Expected returns on plan assets is based on current market conditions, the asset mix, the active management of defined benefit pension plan assets and historical returns. Other key assumptions for pension obligations are based in part on actuarial determined data and current market conditions. Allowance for Credit Card Receivables Key Sources of Estimation The allowance for credit card receivables is measured based upon statistical analysis that includes estimates for past and current performance, aging, arrears status, the level of allowance already in place, and management’s interpretation of economic conditions and other trends specific to our customer base, including but not limited to bankruptcies. Changes in circumstances may cause future assessments of credit risk to be materially different from current assessments, which could require an increase or decrease in the allowance for credit card receivables. Note 4. Future Accounting Standards Unless otherwise indicated, the Company intends to adopt the following standards in its consolidated financial statements for fiscal 2013: Consolidated Financial Statements In 2011, the IASB issued IFRS 10, “Consolidated Financial Statements” (“IFRS 10”). This IFRS replaces portions of IAS 27, and supersedes SIC-12. IFRS 10 defines principles of control and establishes the basis of determining when and how an entity should be included within a set of consolidated financial statements. The standard introduces a single control model that requires an entity to consolidate an investee when it has power, exposure to variability in returns and has the ability to use its power over the investee to affect its returns, regardless of whether voting rights are present. The adoption of IFRS 10 is not expected to have an impact on the Company’s consolidated financial statements. Disclosure of Interests in Other Entities In 2011, the IASB issued IFRS 12, “Disclosure of Interests in Other Entities” (“IFRS 12”). This IFRS requires extensive disclosures relating to a company’s interests in subsidiaries, joint arrangements, associates, and unconsolidated structured entities. IFRS 12 enables users of the financial statements to evaluate the nature and risks associated with a company’s interests in other entities and the effects of those interests on a company’s financial performance and position. The adoption of IFRS 12 is not expected to have a significant impact on the Company’s consolidated financial statements. Fair Value Measurement In 2011, the IASB issued IFRS 13, “Fair Value Measurement” (“IFRS 13”), which establishes a single framework for the fair value measurement and disclosure of financial and non-financial assets and liabilities. The new standard unifies the definition of fair value and also introduces new concepts including ‘highest and best use’ and ‘principle markets’ for non-financial assets and liabilities. There are additional disclosure requirements, including increased fair value disclosure for financial instruments for interim financial statements. Although the Company expects additional disclosure, it does not anticipate material measurement impacts on its consolidated financial statements as a result of the adoption of IFRS 13.
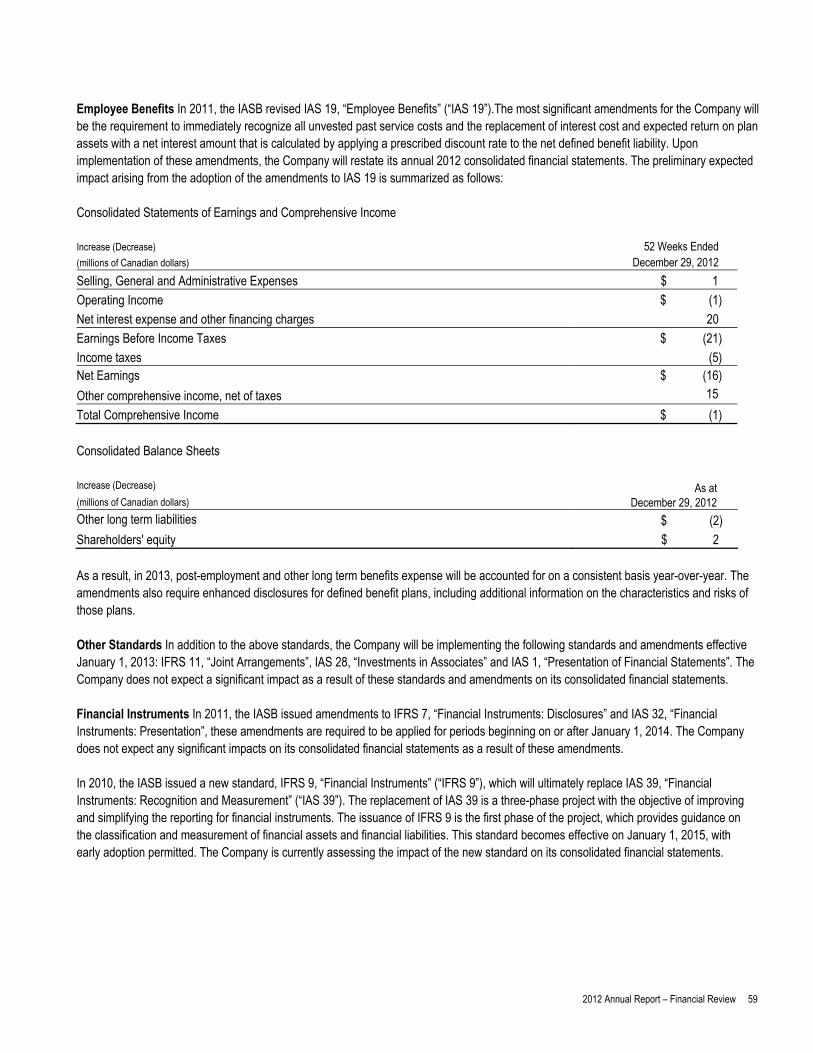
2012 Annual Report – Financial Review 59
Employee Benefits In 2011, the IASB revised IAS 19, “Employee Benefits” (“IAS 19”).The most significant amendments for the Company will be the requirement to immediately recognize all unvested past service costs and the replacement of interest cost and expected return on plan assets with a net interest amount that is calculated by applying a prescribed discount rate to the net defined benefit liability. Upon implementation of these amendments, the Company will restate its annual 2012 consolidated financial statements. The preliminary expected impact arising from the adoption of the amendments to IAS 19 is summarized as follows: Consolidated Statements of Earnings and Comprehensive Income Increase (Decrease)
(millions of Canadian dollars) 52 Weeks Ended
December 29, 2012 Selling, General and Administrative Expenses $ 1
Operating Income $ (1)
Net interest expense and other financing charges 20
Earnings Before Income Taxes $ (21)
Income taxes (5) Net Earnings $ (16)
Other comprehensive income, net of taxes 15
Total Comprehensive Income $ (1) Consolidated Balance Sheets Increase (Decrease)
(millions of Canadian dollars) As at
December 29, 2012 Other long term liabilities $ (2)
Shareholders' equity $ 2 As a result, in 2013, post-employment and other long term benefits expense will be accounted for on a consistent basis year-over-year. The amendments also require enhanced disclosures for defined benefit plans, including additional information on the characteristics and risks of those plans. Other Standards In addition to the above standards, the Company will be implementing the following standards and amendments effective January 1, 2013: IFRS 11, “Joint Arrangements”, IAS 28, “Investments in Associates” and IAS 1, “Presentation of Financial Statements”. The Company does not expect a significant impact as a result of these standards and amendments on its consolidated financial statements. Financial Instruments In 2011, the IASB issued amendments to IFRS 7, “Financial Instruments: Disclosures” and IAS 32, “Financial Instruments: Presentation”, these amendments are required to be applied for periods beginning on or after January 1, 2014. The Company does not expect any significant impacts on its consolidated financial statements as a result of these amendments. In 2010, the IASB issued a new standard, IFRS 9, “Financial Instruments” (“IFRS 9”), which will ultimately replace IAS 39, “Financial Instruments: Recognition and Measurement” (“IAS 39”). The replacement of IAS 39 is a three-phase project with the objective of improving and simplifying the reporting for financial instruments. The issuance of IFRS 9 is the first phase of the project, which provides guidance on the classification and measurement of financial assets and financial liabilities. This standard becomes effective on January 1, 2015, with early adoption permitted. The Company is currently assessing the impact of the new standard on its consolidated financial statements.
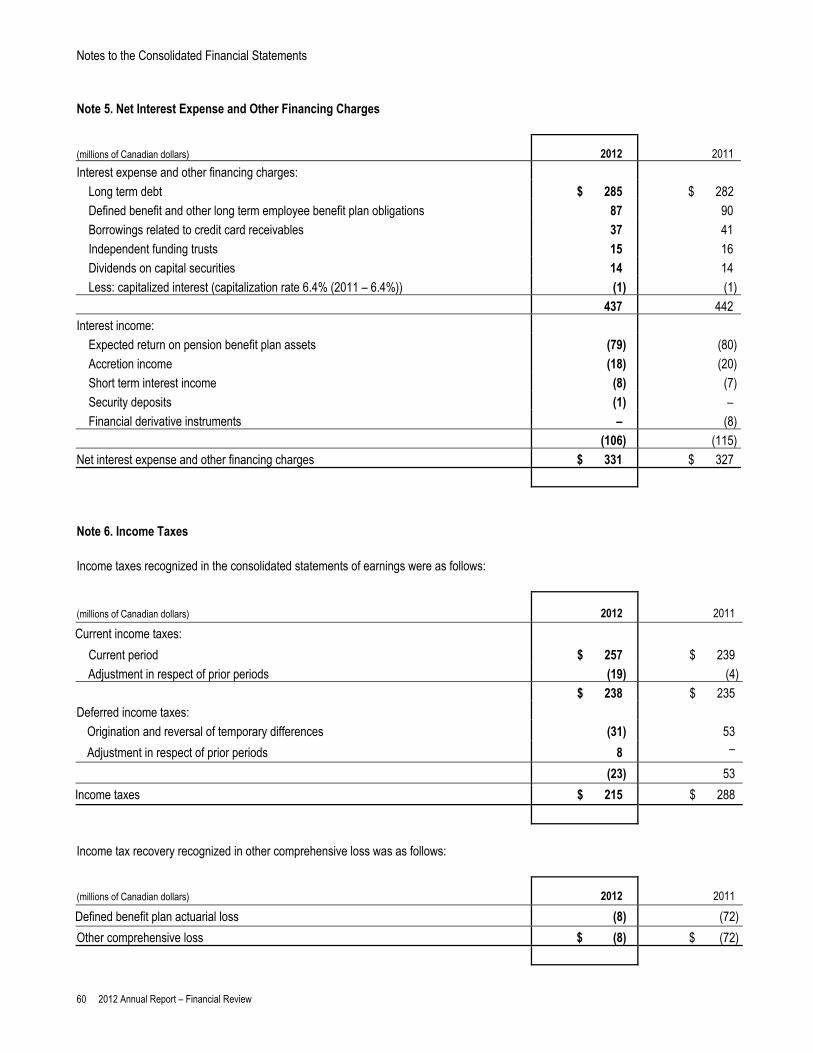
Notes to the Consolidated Financial Statements
60 2012 Annual Report – Financial Review
Note 5. Net Interest Expense and Other Financing Charges
(millions of Canadian dollars) 2012 2011
Interest expense and other financing charges:
Long term debt $ 285 $ 282
Defined benefit and other long term employee benefit plan obligations 87 90
Borrowings related to credit card receivables 37 41
Independent funding trusts 15 16
Dividends on capital securities 14 14
Less: capitalized interest (capitalization rate 6.4% (2011 – 6.4%)) (1) (1)
437 442
Interest income:
Expected return on pension benefit plan assets (79) (80)
Accretion income (18) (20)
Short term interest income (8) (7)
Security deposits (1) –
Financial derivative instruments – (8)
(106) (115)
Net interest expense and other financing charges $ 331 $ 327
Note 6. Income Taxes Income taxes recognized in the consolidated statements of earnings were as follows:
(millions of Canadian dollars) 2012 2011
Current income taxes:
Current period $ 257 $ 239
Adjustment in respect of prior periods (19) (4)
$ 238 $ 235
Deferred income taxes:
Origination and reversal of temporary differences (31) 53
Adjustment in respect of prior periods 8 –
(23) 53
Income taxes $ 215 $ 288
Income tax recovery recognized in other comprehensive loss was as follows:
(millions of Canadian dollars) 2012 2011
Defined benefit plan actuarial loss (8) (72)
Other comprehensive loss $ (8) $ (72)
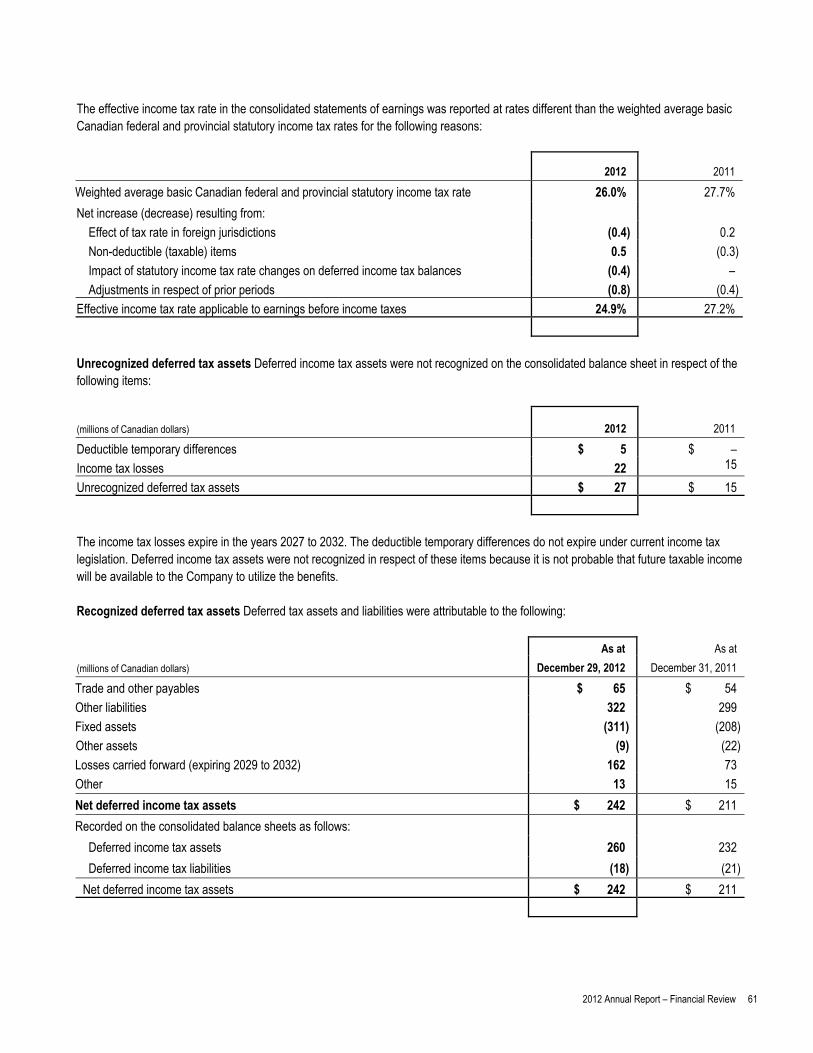
2012 Annual Report – Financial Review 61
The effective income tax rate in the consolidated statements of earnings was reported at rates different than the weighted average basic Canadian federal and provincial statutory income tax rates for the following reasons:
2012 2011
Weighted average basic Canadian federal and provincial statutory income tax rate 26.0% 27.7%
Net increase (decrease) resulting from:
Effect of tax rate in foreign jurisdictions (0.4) 0.2
Non-deductible (taxable) items 0.5 (0.3)
Impact of statutory income tax rate changes on deferred income tax balances (0.4) –
Adjustments in respect of prior periods (0.8) (0.4)
Effective income tax rate applicable to earnings before income taxes 24.9% 27.2%
Unrecognized deferred tax assets Deferred income tax assets were not recognized on the consolidated balance sheet in respect of the following items:
(millions of Canadian dollars) 2012 2011
Deductible temporary differences $ 5 $ –
Income tax losses 22 15
Unrecognized deferred tax assets $ 27 $ 15
The income tax losses expire in the years 2027 to 2032. The deductible temporary differences do not expire under current income tax legislation. Deferred income tax assets were not recognized in respect of these items because it is not probable that future taxable income will be available to the Company to utilize the benefits. Recognized deferred tax assets Deferred tax assets and liabilities were attributable to the following:
As at As at
(millions of Canadian dollars) December 29, 2012 December 31, 2011
Trade and other payables $ 65 $ 54
Other liabilities 322 299
Fixed assets (311) (208)
Other assets (9) (22)
Losses carried forward (expiring 2029 to 2032) 162 73
Other 13 15
Net deferred income tax assets $ 242 $ 211
Recorded on the consolidated balance sheets as follows:
Deferred income tax assets 260 232
Deferred income tax liabilities (18) (21)
Net deferred income tax assets $ 242 $ 211
Notes to the Consolidated Financial Statements
62 2012 Annual Report – Financial Review
Note 7. Basic and Diluted Net Earnings per Common Share
(millions of Canadian dollars except where otherwise indicated) 2012 2011
Net earnings for basic earnings per share $ 650 $ 769
Impact of dividends on capital securities − 14
Impact of equity forwards (3) −
Net earnings for diluted earnings per share $ 647 $ 783
Weighted average common shares outstanding (note 21) (in millions) 281.4 281.6
Dilutive effect of capital securities (in millions) − 6.2
Dilutive effect of share-based compensation (in millions) 0.3 0.7
Dilutive effect of equity forwards (in millions) 0.7 −
Dilutive effect of certain other liabilities (in millions) 0.8 0.9
Diluted weighted average common shares outstanding 283.2 289.4
Basic net earnings per common share ($) $ 2.31 $ 2.73
Diluted net earnings per common share ($) $ 2.28 $ 2.71
Excluded from the computation of diluted net EPS were 19,359,979 (2011 – 8,248,090) potentially dilutive instruments, as they were anti-dilutive. Note 8. Cash and Cash Equivalents, Short Term Investments and Security Deposits The components of cash and cash equivalents, short term investments and security deposits were as follows: Cash and Cash Equivalents
As at As at
(millions of Canadian dollars) December 29, 2012 December 31, 2011
Cash $ 185 $ 232
Cash equivalents:
Bankers’ acceptances 279 150
Government treasury bills 322 227
Bank term deposits − 170
Corporate commercial paper 238 132
Government agencies securities 11 −
Other 44 55
Total cash and cash equivalents $ 1,079 $ 966

2012 Annual Report – Financial Review 63
Short Term Investments
As at As at
(millions of Canadian dollars) December 29, 2012 December 31, 2011
Bankers’ acceptances $ 33 $ −
Government treasury bills 282 252
Corporate commercial paper 151 280
Government agencies securities 237 221
Other 13 1
Total short term investments $ 716 $ 754
Security Deposits
As at As at
(millions of Canadian dollars) December 29, 2012 December 31, 2011
Cash $ 90 $ 85
Government treasury bills 126 108
Government agencies securities 36 73
Total security deposits $ 252 $ 266
During 2012, the Company entered into agreements to cash collateralize certain of its uncommitted credit facilities up to an amount of $133 million (2011 – $88 million) of which $97 million (2011 – $85 million) was deposited with major financial institutions and classified as security deposits as at December 29, 2012 and December 31, 2011, respectively. Note 9. Accounts Receivable The following is an aging of the Company’s accounts receivable as at December 29, 2012 and December 31, 2011:
(millions of Canadian dollars) 2012 2011
Current > 30 days > 60 days Total Current > 30 days > 60 days Total
Accounts receivable 403 39 14 456 371 37 59 467
The following are continuities of the Company’s allowances for uncollectable accounts receivable:
(millions of Canadian dollars) 2012 2011
Allowance, beginning of year $ (112) $ (105)
Net reversals (additions) 2 (7)
Allowance, end of year $ (110) $ (112)
Of the balance of accounts receivable that are past due as at December 29, 2012, $16 million (December 31, 2011 – $19 million) were not classified as impaired as their past due status was reasonably expected to be remedied.

Notes to the Consolidated Financial Statements
64 2012 Annual Report – Financial Review
Note 10. Credit Card Receivables The components of credit card receivables were as follows: (millions of Canadian dollars)
As at
December 29, 2012
As at
December 31, 2011
Gross credit card receivables $ 2,348 $ 2,138
Allowance for credit card receivables (43) (37)
Credit card receivables 2,305 2,101
Securitized to Independent Securitization Trusts
Securitized to Eagle Credit Card Trust(1) 600 600
Securitized to Other Independent Securitization Trusts(2) 905 905
(1) The Company consolidates Eagle, as a SPE as defined in SIC-12. The associated liability of Eagle is recorded in long term debt and long term debt due within one year. (2) The associated liabilities of Other Independent Securitization Trusts are recorded in short term debt.
The Company, through PC Bank, participates in various securitization programs that provide the primary source of funds for the operation of its credit card business. PC Bank sells credit card receivables to these Independent Securitization Trusts, including Eagle and Other Independent Securitization Trusts, from time to time depending on PC Bank’s financing requirements. The credit card receivables associated with the Other Independent Securitization Trusts are not derecognized by the Company since PC Bank is required to absorb a portion of the related credit card losses. As a result, the Company has not transferred substantially all of the risks and rewards relating to these assets and continues to recognize these assets in credit card receivables. The associated liabilities are secured by the credit card receivables and are accounted for as financing transactions. The associated liabilities are included in short term debt based on their characteristics and are carried at amortized cost (see note 18). The Company has arranged letters of credit on behalf of PC Bank, representing 9% (2011 – 9%) of the outstanding securitized liability for the benefit of the Other Independent Securitization Trusts in the amount of $81 million (2011 – $81 million). In the event of a major decline in the income flow from or in the value of the securitized credit card receivables, the Other Independent Securitization Trusts can draw upon these letters of credit to recover up to a maximum of the amount outstanding on the letters of credit. Under its securitization programs, PC Bank is required to maintain at all times a credit card receivable pool balance equal to a minimum of 107% of the outstanding securitized liability and was in compliance with this requirement throughout the year. The following are continuities of the Company’s allowances for credit card receivables:
(millions of Canadian dollars) 2012 2011
Allowances, beginning of year $ (37) $ (34)
Provision for losses (98) (87)
Recoveries (12) (14)
Write-offs 104 98
Allowances, end of year $ (43) $ (37)
The allowance for credit card receivables recorded in credit card receivables on the consolidated balance sheets is maintained at a level which is considered adequate to absorb credit related losses on credit card receivables.
2012 Annual Report – Financial Review 65
The following is an aging of the Company’s gross credit card receivables as at December 29, 2012 and December 31, 2011:
(millions of Canadian dollars) 2012 2011
Current 1-90 days past due
> 90 days past due Total Current
1-90 days past due
> 90 days past due Total
Gross credit card receivables 2,213 113 22 2,348 2,024 93 21 2,138
Credit card receivables are considered past due when a cardholder has not made a payment by the contractual due date, taking into account a grace period. The amount of credit card receivables that fall within the grace period is considered current. Credit card receivables past due but not impaired are those receivables that are either less than 90 days past due or whose past due status is reasonably expected to be remedied. Any credit card receivables with a payment that is contractually 180 days in arrears, or where the likelihood of collection is considered remote, is written off. Note 11. Inventories For inventories recorded as at December 29, 2012, the Company recorded $14 million (2011 – $20 million) for the write-down of inventories below cost to net realizable value. The write-down was included in cost of merchandise inventories sold in the consolidated statements of earnings. There were no reversals of previously recorded write-downs of inventories during 2012 and 2011. Note 12. Assets Held for Sale The Company holds land and buildings that it intends to dispose of in the next 12 months as assets held for sale. These assets were previously used in the Company’s retail business segment. In 2012, impairment and other charges of $1 million were recognized (2011 – $3 million) on these properties. During 2012, the Company recorded a $4 million gain (2011 – $19 million gain) from the sale of these assets.

Notes to the Consolidated Financial Statements
66 2012 Annual Report – Financial Review
Note 13. Fixed Assets The following are continuities of the cost and accumulated depreciation of fixed assets for the years ended December 29, 2012 and December 31, 2011:
2012
(millions of Canadian dollars) Land Buildings Equipment
and Fixtures Leasehold
Improvements
Finance Leases - Land,
Buildings, Equipment
and Fixtures Assets Under Construction Total
Cost
Balance, beginning of year $ 1,658 $ 6,308 $ 5,410 $ 723 $ 510 $ 646 $ 15,255
Additions – 22 19 22 73 957 1,093
Disposals (8) (20) (83) (9) (28) – (148)
Transfer to assets held for sale (9) (25) – – – – (34) Transfer (to)/from investment
properties (3) 1 – – (1) – (3) Transfer from assets under
construction 12 269 604 54 – (939) –
Balance, end of year $ 1,650 $ 6,555 $ 5,950 $ 790 $ 554 $ 664 $ 16,163 Accumulated depreciation and
impairment losses
Balance, beginning of year $ 9 $ 2,132 $ 3,745 $ 392 $ 245 $ 7 $ 6,530
Depreciation – 177 489 46 43 – 755
Impairment losses 2 32 7 4 4 – 49
Reversal of impairment losses (3) (25) – – – – (28)
Disposals – (7) (65) (9) (24) – (105)
Transfer to assets held for sale – (15) – – – – (15) Transfer (to)/from investment
properties (1) 4 – – 1 – 4
Balance, end of year $ 7 $ 2,298 $ 4,176 $ 433 $ 269 $ 7 $ 7,190 Carrying amount as at: December 29, 2012 $ 1,643 $ 4,257 $ 1,774 $ 357 $ 285 $ 657 $ 8,973
2012 Annual Report – Financial Review 67
2011
(millions of Canadian dollars) Land Buildings Equipment
and Fixtures Leasehold
Improvements
Finance Leases - Land,
Buildings, Equipment
and Fixtures Assets Under Construction Total
Cost
Balance, beginning of year $ 1,537 $ 5,822 $ 4,815 $ 608 $ 435 $ 1,074 $ 14,291
Additions – 2 16 16 76 950 1,060
Disposals – (5) (75) (7) – – (87)
Transfer (to)/from assets held for sale 5 (9) – – – – (4)
Transfer to investment properties (1) (3) – – (1) – (5) Transfer from assets under
construction 117 501 654 106 – (1,378) –
Balance, end of year $ 1,658 $ 6,308 $ 5,410 $ 723 $ 510 $ 646 $ 15,255 Accumulated depreciation and
impairment losses
Balance, beginning of year $ 6 $ 1,957 $ 3,389 $ 350 $ 205 $ 7 $ 5,914
Depreciation – 179 429 38 37 – 683
Impairment losses 3 23 3 7 3 – 39
Reversal of impairment losses (3) (30) (1) – – – (34)
Disposals – (5) (58) (6) – – (69)
Transfer (to)/from assets held for sale 2 (3) – – – – (1)
Transfer to investment properties – (2) – – – – (2) Transfer to/(from) assets under
construction 1 13 (17) 3 – – –
Balance, end of year $ 9 $ 2,132 $ 3,745 $ 392 $ 245 $ 7 $ 6,530 Carrying amount as at: December 31, 2011 $ 1,649 $ 4,176 $ 1,665 $ 331 $ 265 $ 639 $ 8,725 Assets Held under Finance Leases The Company leases various land and buildings, and equipment and fixtures under a number of finance lease arrangements. As at December 29, 2012, the net carrying amount of leased land and buildings was $259 million (December 31, 2011 – $223 million), and the net carrying amount of leased equipment and fixtures was $26 million (December 31, 2011 – $42 million). Assets under Construction The cost of additions to properties under construction for the year ended December 29, 2012 was $957 million (December 31, 2011 – $950 million). Included in this amount are capitalized borrowing costs of $1 million (2011 – $1 million), with a weighted average capitalization rate of 6.4% (2011 – 6.4%). Security and Assets Pledged As at December 29, 2012, fixed assets with a carrying amount of $191 million (December 31, 2011 – $194 million) were encumbered by mortgages of $93 million (December 31, 2011 – $96 million). Fixed Asset Commitments As at December 29, 2012, the Company had entered into commitments of $60 million (2011 – $52 million) for the construction, expansion and renovation of buildings and the purchase of real property.

Notes to the Consolidated Financial Statements
68 2012 Annual Report – Financial Review
Impairment Losses For the year ended December 29, 2012, the Company recorded $49 million (2011 − $39 million) of impairment losses on fixed assets in respect of 17 CGUs (2011 − 21 CGUs) in the retail operating segment. Impairment losses are recorded where the carrying amount of the retail location exceeds its recoverable amount. The recoverable amount was based on the greater of the CGU’s fair value less costs to sell and its value in use. Approximately 35% (2011 − 52%) of impaired CGUs had carrying values which were $26 million (2011 − $24 million) greater than their fair value less costs to sell. The remaining 65% (2011 − 48%) of impaired CGUs had carrying values which were $23 million (2011 − $15 million) greater than their value in use. For the year ended December 29, 2012, the Company recorded $28 million (2011 − $34 million) of impairment reversals on fixed assets in respect of 11 CGUs (2011 − 17 CGUs) in the retail operating segment. Impairment reversals are recorded where the recoverable amount of the retail location exceeds its carrying amount. Approximately 55% (2011 − 71%) of CGUs with impairment reversals had fair value less costs to sell which were $15 million (2011 − $24 million) greater than their carrying values. The remaining 45% (2011 − 29%) of CGUs with impairment reversals had value in use which were $13 million (2011 − $10 million) greater than carrying values. When determining the value in use of a retail location, the Company develops a discounted cash flow model for each CGU. The duration of the cash flow projections for individual CGUs varies based on the remaining useful life of the significant asset within the CGU. Sales forecasts for cash flows are based on actual operating results, operating budgets, and long term growth rates that were consistent with industry averages, all of which is consistent with strategic plans presented to the Company’s Board. The estimate of the value in use of the relevant CGUs was determined using a pre-tax discount rate of 8.0% to 8.5% at December 29, 2012 (December 31, 2011 – 8.75% to 9.25%). Note 14. Investment Properties The following are continuities of investment properties:
(millions of Canadian dollars) 2012 2011
Cost
Balance, beginning of year $ 158 $ 151
Disposals – (1)
Transfer from fixed assets 3 5
Transfer from assets held for sale 8 3
Balance, end of year $ 169 $ 158
Accumulated depreciation and impairment losses
Balance, beginning of year $ 76 $ 77
Depreciation 2 1
Impairment losses 1 2
Reversal of impairment losses (4) (6)
Transfer (to)/from fixed assets (4) 2
Transfer to assets held for sale (2) –
Balance, end of year $ 69 $ 76
(millions of Canadian dollars) 2012 2011
Carrying amount $ 100 $ 82
Fair value $ 125 $ 109
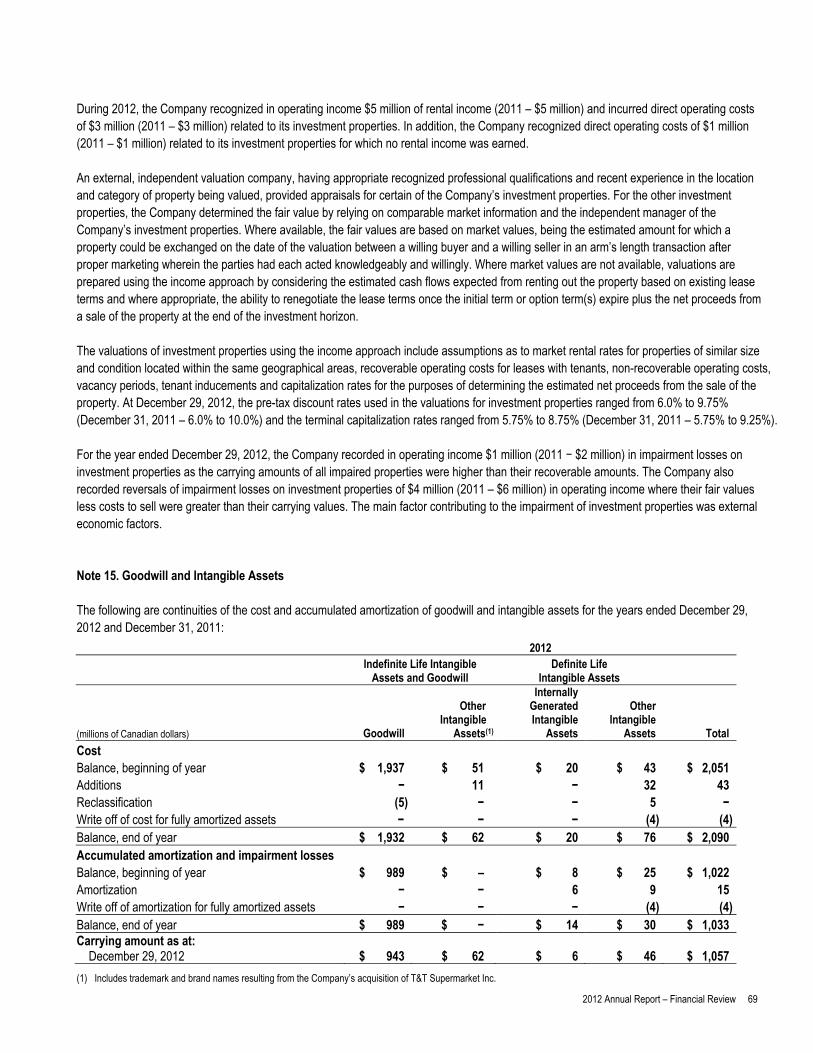
2012 Annual Report – Financial Review 69
During 2012, the Company recognized in operating income $5 million of rental income (2011 – $5 million) and incurred direct operating costs of $3 million (2011 – $3 million) related to its investment properties. In addition, the Company recognized direct operating costs of $1 million (2011 – $1 million) related to its investment properties for which no rental income was earned. An external, independent valuation company, having appropriate recognized professional qualifications and recent experience in the location and category of property being valued, provided appraisals for certain of the Company’s investment properties. For the other investment properties, the Company determined the fair value by relying on comparable market information and the independent manager of the Company’s investment properties. Where available, the fair values are based on market values, being the estimated amount for which a property could be exchanged on the date of the valuation between a willing buyer and a willing seller in an arm’s length transaction after proper marketing wherein the parties had each acted knowledgeably and willingly. Where market values are not available, valuations are prepared using the income approach by considering the estimated cash flows expected from renting out the property based on existing lease terms and where appropriate, the ability to renegotiate the lease terms once the initial term or option term(s) expire plus the net proceeds from a sale of the property at the end of the investment horizon. The valuations of investment properties using the income approach include assumptions as to market rental rates for properties of similar size and condition located within the same geographical areas, recoverable operating costs for leases with tenants, non-recoverable operating costs, vacancy periods, tenant inducements and capitalization rates for the purposes of determining the estimated net proceeds from the sale of the property. At December 29, 2012, the pre-tax discount rates used in the valuations for investment properties ranged from 6.0% to 9.75% (December 31, 2011 – 6.0% to 10.0%) and the terminal capitalization rates ranged from 5.75% to 8.75% (December 31, 2011 – 5.75% to 9.25%). For the year ended December 29, 2012, the Company recorded in operating income $1 million (2011 − $2 million) in impairment losses on investment properties as the carrying amounts of all impaired properties were higher than their recoverable amounts. The Company also recorded reversals of impairment losses on investment properties of $4 million (2011 – $6 million) in operating income where their fair values less costs to sell were greater than their carrying values. The main factor contributing to the impairment of investment properties was external economic factors. Note 15. Goodwill and Intangible Assets The following are continuities of the cost and accumulated amortization of goodwill and intangible assets for the years ended December 29, 2012 and December 31, 2011:
2012 Indefinite Life Intangible
Assets and Goodwill Definite Life
Intangible Assets
(millions of Canadian dollars) Goodwill
Other Intangible
Assets(1)
Internally Generated Intangible
Assets
Other Intangible
Assets Total
Cost Balance, beginning of year $ 1,937 $ 51 $ 20 $ 43 $ 2,051 Additions − 11 − 32 43 Reclassification (5) − − 5 − Write off of cost for fully amortized assets − − − (4) (4) Balance, end of year $ 1,932 $ 62 $ 20 $ 76 $ 2,090 Accumulated amortization and impairment losses Balance, beginning of year $ 989 $ – $ 8 $ 25 $ 1,022 Amortization − − 6 9 15 Write off of amortization for fully amortized assets − − − (4) (4) Balance, end of year $ 989 $ − $ 14 $ 30 $ 1,033 Carrying amount as at: December 29, 2012 $ 943 $ 62 $ 6 $ 46 $ 1,057
(1) Includes trademark and brand names resulting from the Company’s acquisition of T&T Supermarket Inc.
Notes to the Consolidated Financial Statements
70 2012 Annual Report – Financial Review
2011 Indefinite Life Intangible
Assets and Goodwill Definite Life
Intangible Assets
(millions of Canadian dollars) Goodwill
Other Intangible Assets(1)
Internally Generated
Intangible Assets
Other Intangible
Assets Total
Cost Balance, beginning of year $ 1,929 $ 51 $ 18 $ 42 $ 2,040 Additions 8 − 2 4 14 Write off of cost for fully amortized assets − − − (3) (3) Balance, end of year $ 1,937 $ 51 $ 20 $ 43 $ 2,051 Accumulated amortization and impairment losses Balance, beginning of year $ 989 $ – $ 2 $ 23 $ 1,014 Amortization − − 6 5 11 Write off of amortization for fully amortized assets − − − (3) (3) Balance, end of year $ 989 $ − $ 8 $ 25 $ 1,022 Carrying amount as at: December 31, 2011 $ 948 $ 51 $ 12 $ 18 $ 1,029
(1) Includes trademark and brand names resulting from the Company’s acquisition of T&T Supermarket Inc.
During 2012, the Company had $43 million (2011 – $14 million) of goodwill and intangible asset additions, including $31 million (2011 – nil) related to the purchase of prescription files from 106 Zellers Inc. stores, which were classified as definite life intangible assets. Indefinite Life Intangible Assets and Goodwill For purposes of goodwill impairment testing, the Company’s CGUs were grouped at the lowest level at which goodwill was monitored for internal management purposes. The carrying amount of goodwill attributed to each CGU grouping was as follows:
(millions of Canadian dollars) As at
December 29, 2012 As at
December 31, 2011
Quebec region $ 700 $ 700
T&T Supermarket Inc. 129 129
All other 114 119
Carrying amount of goodwill $ 943 $ 948
The Company completed its annual impairment tests for goodwill and indefinite life intangible assets and concluded that there was no impairment. Key Assumptions The key assumptions used to calculate the recoverable amount for the fair value less costs to sell are those regarding discount rates, growth rates and expected changes in margins. Cash flow projections have been discounted using a range of rates derived from the Company’s after-tax weighted average cost of capital adjusted for specific risks relating to each CGU. At December 29, 2012, the after-tax discount rates used in the recoverable amount calculations were approximately 9.5% (December 31, 2011 – 7.0% to 9.5%). The pre-tax discount rate ranged from 12.8% – 13.0% (December 31, 2011 – 9.4% to 12.8%). The Company included a minimum of five years of cash flows in its discounted cash flow model. The cash flow forecasts were extrapolated beyond the five year period using estimated long term growth rates ranging from 0.9% to 2.0% (December 31, 2011 – 1.5% to 2.0%). The budgeted EBITDA(2) growth is based on the Company’s five year strategic plan approved by the Board. (2) See Non-GAAP Financial Measures on page 37 of the Company’s Management’s Discussion & Analysis.

2012 Annual Report – Financial Review 71
Sensitivity to Changes in Key Assumptions For the T&T Supermarket Inc. (“T&T”) CGU, two key assumptions were identified that if changed could cause the carrying amount to exceed its recoverable amount. A change in the discount rate or terminal growth rate of approximately 75 basis points or 125 basis points respectively would cause the estimated recoverable amount to equal the carrying amount (December 31, 2011 – 75 basis points or 125 basis points). The values assigned to the key assumptions represent the Company’s assessment of the future performance of T&T and are based on both external and internal sources of information. The Company does not believe that any changes in key assumptions will have a significant impact on the determination of the recoverable amount of the Company’s other CGUs to which goodwill is allocated. Note 16. Other Assets
(millions of Canadian dollars)
As at December 29, 2012
As at December 31, 2011
Fair value of cross currency swaps (note 27) $ 98 $ 103
Sundry investments and other receivables 159 166
Other 32 32
Other assets $ 289 $ 301
Note 17. Provisions Provisions consist primarily of amounts recorded in respect of restructuring, self-insurance, commodity taxes, environmental and decommissioning liabilities and onerous lease arrangements. The following are continuities relating to the Company’s provisions:
(millions of Canadian dollars) 2012 2011
Provisions, beginning of year $ 85 $ 105
Additions 80 56
Payments (20) (50)
Reversals (8) (26)
Provisions, end of year $ 137 $ 85
(millions of Canadian dollars) 2012 2011
Recorded on the consolidated balance sheets as follows:
Current portion of provisions $ 78 $ 35
Non-current portion of provisions 59 50
Total provisions $ 137 $ 85
During 2012, the Company reduced a number of head office and administrative positions, affecting approximately 700 jobs. The Company recorded a charge of $61 million to reflect the costs of these reductions. As at December 29, 2012, $45 million was included in provisions and $6 million was included in other liabilities related to this charge.

Notes to the Consolidated Financial Statements
72 2012 Annual Report – Financial Review
Note 18. Short Term Debt The outstanding short term debt balances relate to the associated liabilities of the independent securitization trusts, excluding Eagle, which is included in long term debt (see note 19). During 2012, PC Bank amended and extended the maturity date for two of its independent securitization trust agreements from the third quarter of 2013 to the second quarter of 2015, with all other terms and conditions remaining substantially the same. During 2012, PC Bank did not securitize any credit card receivables (2011 – $370 million). In addition to PC Bank’s securitized credit card receivables, the independent securitization trusts’ recourse is limited to standby letters of credit arranged by the Company as at December 29, 2012 of $81 million (December 31, 2011 – $81 million) which is based on a portion of the securitized amount (see note 30).

2012 Annual Report – Financial Review 73
Note 19. Long Term Debt
As at As at
(millions of Canadian dollars) December 29, 2012 December 31, 2011
Loblaw Companies Limited Notes
5.40%, due 2013 $ 200 $ 200
6.00%, due 2014 100 100
4.85%, due 2014 350 350
7.10%, due 2016 300 300
5.22%, due 2020 350 350
6.65%, due 2027 100 100
6.45%, due 2028 200 200
6.50%, due 2029 175 175
11.40%, due 2031
Principal 151 151
Effect of coupon repurchase (76) (85)
6.85%, due 2032 200 200
6.54%, due 2033 200 200
8.75%, due 2033 200 200
6.05%, due 2034 200 200
6.15%, due 2035 200 200
5.90%, due 2036 300 300
6.45%, due 2039 200 200
7.00%, due 2040 150 150
5.86%, due 2043 55 55
US Private Placement Notes
6.48%, due 2013 (USD $150 million) 150 153
6.86%, due 2015 (USD $150 million) 150 153
Long Term Debt Secured by Mortgage
5.49%, due 2018 (note 13) 88 91 Guaranteed Investment Certificates Due 2013 – 2017 (0.85% – 3.78%) 303 276
Independent Securitization Trusts(1)
Eagle Credit Card Trust, 2.88%, due 2013 250 250
Eagle Credit Card Trust, 3.58%, due 2015 350 350
Independent Funding Trusts 459 424
Finance Lease Obligations (note 26) 366 334
Transaction costs and other (2) 3
Total long term debt 5,669 5,580
Less amount due within one year 672 87
Long Term Debt $ 4,997 $ 5,493
(1) The notes issued by Eagle are medium term notes which are collateralized by PC Bank’s credit card receivables (see note 10).

Notes to the Consolidated Financial Statements
74 2012 Annual Report – Financial Review
Loblaw Companies Limited Notes During 2011, a $350 million 6.50% medium term note (“MTN”) due January 19, 2011 matured and was repaid. Guaranteed Investment Certificates During 2012, PC Bank sold $76 million (2011 – $264 million) in guaranteed investment certificates (“GICs”) through independent brokers. In addition, during 2012, $49 million (2011 – $6 million) of GICs matured and were repaid. As at December 29, 2012, $303 million (December 31, 2011 – $276 million) of outstanding GICs were recorded in long term debt, of which $36 million (December 31, 2011 - $46 million) were recorded as long term debt due within one year. Independent Securitization Trusts During 2011, Eagle repaid $500 million senior and subordinated notes due March 17, 2011. Independent Funding Trusts During 2012, the Company amended and increased the size of the revolving committed credit facility that is the source of funding to the independent funding trusts from $475 million to $575 million. Other terms and conditions remain substantially the same. This facility bears interest at variable rates and expires in 2014. As at December 29, 2012, the independent funding trusts had drawn $459 million (December 31, 2011 – $424 million) from this committed credit facility. The Company provides credit enhancement in the form of a standby letter of credit for the benefit of the independent funding trusts representing not less than 10% (2011 – 10%) of the principal amount of the loans outstanding. As at December 29, 2012, the Company had provided a letter of credit in the amount of $48 million (December 31, 2011 – $48 million). Committed Credit Facility During 2012, the Company renewed and extended its existing $800 million committed credit facility to March 2017. Interest is based on a floating rate, primarily the bankers’ acceptance rate and an applicable margin based on the Company’s credit rating. As at December 29, 2012, the Company was in compliance with all of its covenants (see note 22). As at December 29, 2012, and December 31, 2011, there were no amounts drawn upon the Credit Facility. Schedule of Repayments The schedule of repayment of long term debt, based on maturity is as follows: 2013 − $672 million; 2014 − $979 million; 2015 − $545 million; 2016 − $432 million; 2017 − $96 million; thereafter − $2,951 million. See note 27 for disclosure of the fair value of long term debt. Note 20. Other Liabilities
(millions of Canadian dollars) As at
December 29, 2012 As at
December 31, 2011
Defined benefit plan liability (note 24) $ 531 $ 579
Other long term employee benefit liability 116 118
Deferred vendor allowances 24 32
Share-based compensation liability (note 23) 20 15
Other 160 173
Other liabilities $ 851 $ 917
2012 Annual Report – Financial Review 75
Note 21. Share Capital First Preferred Shares (authorized – 1.0 million shares) There were no non-voting First Preferred Shares outstanding at year end. Second Preferred Shares, Series A (authorized – 12.0 million shares) The Company has outstanding 9.0 million 5.95% non-voting Second Preferred Shares, Series A, with a face value of $225 million, which were issued for net proceeds of $218 million, and entitle the holder to a fixed cumulative preferred cash dividend of $1.4875 per share per annum which, if declared, will be payable quarterly. These preferred shares which are presented as capital securities on the consolidated balance sheets are classified as other financial liabilities, and measured using the effective interest method. During 2012, the Board declared dividends of $1.4875 (2011 – $1.4875) per Second Preferred Share, Series A which are included as a component of net interest expense and other financing charges on the consolidated statements of earnings (see note 5). Subsequent to year end, the Board declared a dividend of $0.37 per Second Preferred Share, Series A payable April 30, 2013. On and after July 31, 2013, 2014 and 2015 the Company may, at its option, redeem for cash, in whole or in part, these outstanding preferred shares for $25.75, $25.50 and $25.00 respectively. On and after July 31, 2013, the Company may, at its option, convert these preferred shares into that number of common shares of the Company determined by dividing the then applicable redemption price, together with all accrued and unpaid dividends to but excluding the date of conversion, by the greater of $2.00 and 95% of the then current market price of the common shares. On and after July 31, 2015, these outstanding preferred shares are convertible, at the option of the holder, into that number of common shares of the Company determined by dividing $25.00, together with accrued and unpaid dividends to but excluding the date of conversion, by the greater of $2.00 and 95% of the then current market price of the common shares. This option is subject to the Company’s right to redeem the preferred shares for cash or arrange for their sale to substitute purchasers. Common Shares (authorized – unlimited) Common shares issued are fully paid and have no par value. The activity in the common shares issued and outstanding during the year was as follows:
2012 2011
Number of
Common Shares Common
Share Capital Number of
Common Shares Common
Share Capital
Issued and outstanding, beginning of year 281,385,318 $ 1,540 280,578,130 $ 1,475
Common shares issued:
Dividend Reinvestment Plan – – 1,142,380 43
Stock options 718,544 29 686,794 28
Purchased for cancellation (423,705) (2) (1,021,986) (6)
Issued and outstanding, end of year 281,680,157 $ 1,567 281,385,318 $ 1,540
Weighted average outstanding 281,438,799 281,601,124
During 2012, the Company amended its dividend policy to state: the declaration and payment of dividends on the Company’s common shares and the amount thereof are at the discretion of the Board which takes into account the Company’s financial results, capital requirements, available cash flow, future prospects of the Company’s business and other factors considered relevant from time to time. Over the long term, it is the Company’s intention to increase the amount of the dividend while retaining appropriate free cash flow to finance future growth. During the fourth quarter of 2012, the Board raised the quarterly dividend by approximately 4.8% to $0.22 per common share. During 2012, the Board declared dividends of $0.85 (2011 – $0.84) per common share. Subsequent to year end, the Board declared a quarterly dividend of $0.22 per common share payable April 1, 2013.
Notes to the Consolidated Financial Statements
76 2012 Annual Report – Financial Review
Normal Course Issuer Bid During 2012, the Company renewed its Normal Course Issuer Bid (“NCIB”) to purchase on the TSX, or to enter into equity derivatives to purchase, up to 14,070,352 (2011 – 14,096,437) of the Company’s common shares, representing approximately 5% of the common shares outstanding. In accordance with the rules and by-laws of the TSX, the Company may purchase its shares at the then market price of such shares. During 2012, the Company purchased for cancellation 423,705 (2011 – 1,021,986) common shares under the NCIB, resulting in a charge to retained earnings of $14 million (2011 – $33 million) for the premium on the common shares and a reduction in common share capital of $2 million (2011 – $6 million). Dividend Reinvestment Plan During 2011, the Company issued 1,142,380 common shares from treasury under the Dividend Reinvestment Plan (“DRIP”) at a three percent (3%) discount to market resulting in incremental equity in the Company of $43 million. The Board approved the discontinuance of the DRIP after the dividend payment on April 1, 2011. The DRIP raised approximately $330 million total common share equity since 2009. Note 22. Capital Management In order to manage its capital structure, the Company, among other activities, may adjust the amount of dividends paid to shareholders, purchase shares for cancellation pursuant to its NCIB, issue new shares or issue or repay long term debt with the objective of: ensuring sufficient liquidity is available to support its financial obligations and to execute its operating and strategic plans; maintaining financial capacity and flexibility through access to capital to support future development of the business; minimizing the after-tax cost of its capital while taking into consideration current and future industry, market and economic risks and
conditions; utilizing short term funding sources to manage its working capital requirements and long term funding sources to manage the long
term capital expenditures of the business; and targeting credit rating metrics consistent with those of investment grade companies. The Company has policies in place which govern debt financing plans and risk management strategies for liquidity, interest rates and foreign exchange. These policies outline measures and targets for managing capital, including a range for leverage consistent with the desired credit rating. Management and the Audit Committee regularly review the Company’s compliance with, and performance against, these policies. In addition, Management regularly reviews these policies to ensure they remain consistent with the risk tolerance acceptable to the Company. In December 2012, the Company filed a Short Form Base Shelf Prospectus (“Prospectus”) which expires in 2015, allowing for the potential issuance of up to $1.0 billion of unsecured debentures and/or preferred shares subject to the availability of funding in capital markets. The Company had filed a similar Prospectus in 2010 that expired in 2012. The Company has not issued any instruments under either of the expired or new Prospectus.
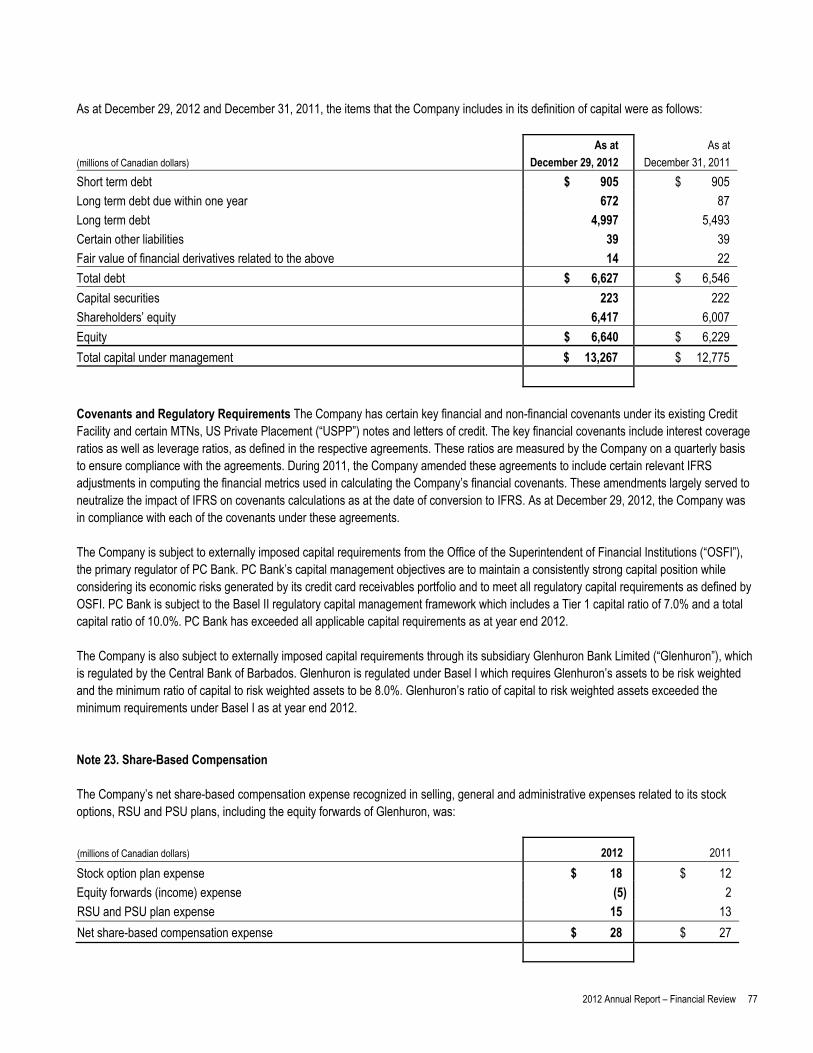
2012 Annual Report – Financial Review 77
As at December 29, 2012 and December 31, 2011, the items that the Company includes in its definition of capital were as follows:
(millions of Canadian dollars) As at
December 29, 2012
As at
December 31, 2011
Short term debt $ 905 $ 905
Long term debt due within one year 672 87
Long term debt 4,997 5,493
Certain other liabilities 39 39
Fair value of financial derivatives related to the above 14 22
Total debt $ 6,627 $ 6,546
Capital securities 223 222
Shareholders’ equity 6,417 6,007
Equity $ 6,640 $ 6,229
Total capital under management $ 13,267 $ 12,775
Covenants and Regulatory Requirements The Company has certain key financial and non-financial covenants under its existing Credit Facility and certain MTNs, US Private Placement (“USPP”) notes and letters of credit. The key financial covenants include interest coverage ratios as well as leverage ratios, as defined in the respective agreements. These ratios are measured by the Company on a quarterly basis to ensure compliance with the agreements. During 2011, the Company amended these agreements to include certain relevant IFRS adjustments in computing the financial metrics used in calculating the Company’s financial covenants. These amendments largely served to neutralize the impact of IFRS on covenants calculations as at the date of conversion to IFRS. As at December 29, 2012, the Company was in compliance with each of the covenants under these agreements. The Company is subject to externally imposed capital requirements from the Office of the Superintendent of Financial Institutions (“OSFI”), the primary regulator of PC Bank. PC Bank’s capital management objectives are to maintain a consistently strong capital position while considering its economic risks generated by its credit card receivables portfolio and to meet all regulatory capital requirements as defined by OSFI. PC Bank is subject to the Basel II regulatory capital management framework which includes a Tier 1 capital ratio of 7.0% and a total capital ratio of 10.0%. PC Bank has exceeded all applicable capital requirements as at year end 2012. The Company is also subject to externally imposed capital requirements through its subsidiary Glenhuron Bank Limited (“Glenhuron”), which is regulated by the Central Bank of Barbados. Glenhuron is regulated under Basel I which requires Glenhuron’s assets to be risk weighted and the minimum ratio of capital to risk weighted assets to be 8.0%. Glenhuron’s ratio of capital to risk weighted assets exceeded the minimum requirements under Basel I as at year end 2012. Note 23. Share-Based Compensation The Company’s net share-based compensation expense recognized in selling, general and administrative expenses related to its stock options, RSU and PSU plans, including the equity forwards of Glenhuron, was:
(millions of Canadian dollars) 2012 2011
Stock option plan expense $ 18 $ 12
Equity forwards (income) expense (5) 2
RSU and PSU plan expense 15 13
Net share-based compensation expense $ 28 $ 27
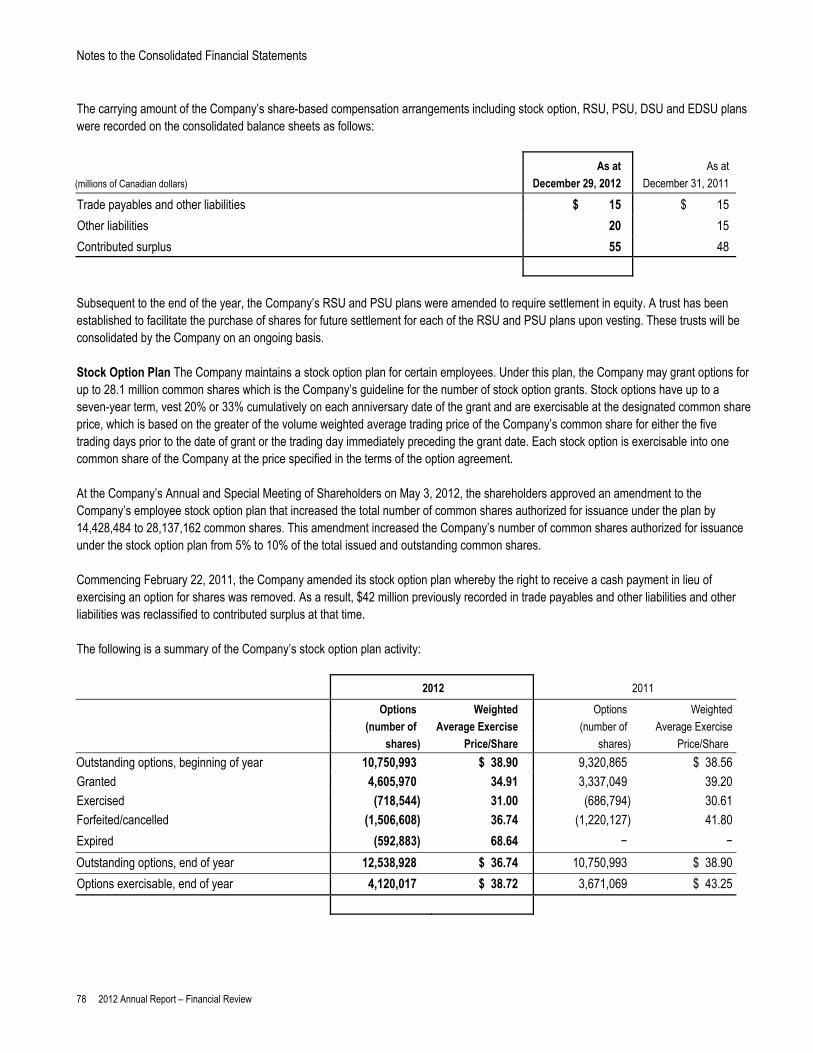
Notes to the Consolidated Financial Statements
78 2012 Annual Report – Financial Review
The carrying amount of the Company’s share-based compensation arrangements including stock option, RSU, PSU, DSU and EDSU plans were recorded on the consolidated balance sheets as follows:
(millions of Canadian dollars) As at
December 29, 2012
As at
December 31, 2011
Trade payables and other liabilities $ 15 $ 15
Other liabilities 20 15
Contributed surplus 55 48
Subsequent to the end of the year, the Company’s RSU and PSU plans were amended to require settlement in equity. A trust has been established to facilitate the purchase of shares for future settlement for each of the RSU and PSU plans upon vesting. These trusts will be consolidated by the Company on an ongoing basis. Stock Option Plan The Company maintains a stock option plan for certain employees. Under this plan, the Company may grant options for up to 28.1 million common shares which is the Company’s guideline for the number of stock option grants. Stock options have up to a seven-year term, vest 20% or 33% cumulatively on each anniversary date of the grant and are exercisable at the designated common share price, which is based on the greater of the volume weighted average trading price of the Company’s common share for either the five trading days prior to the date of grant or the trading day immediately preceding the grant date. Each stock option is exercisable into one common share of the Company at the price specified in the terms of the option agreement. At the Company’s Annual and Special Meeting of Shareholders on May 3, 2012, the shareholders approved an amendment to the Company’s employee stock option plan that increased the total number of common shares authorized for issuance under the plan by 14,428,484 to 28,137,162 common shares. This amendment increased the Company’s number of common shares authorized for issuance under the stock option plan from 5% to 10% of the total issued and outstanding common shares. Commencing February 22, 2011, the Company amended its stock option plan whereby the right to receive a cash payment in lieu of exercising an option for shares was removed. As a result, $42 million previously recorded in trade payables and other liabilities and other liabilities was reclassified to contributed surplus at that time. The following is a summary of the Company’s stock option plan activity:
2012 2011
Options Weighted Options Weighted
(number of Average Exercise (number of Average Exercise
shares) Price/Share shares) Price/Share
Outstanding options, beginning of year 10,750,993 $ 38.90 9,320,865 $ 38.56
Granted 4,605,970 34.91 3,337,049 39.20
Exercised (718,544) 31.00 (686,794) 30.61
Forfeited/cancelled (1,506,608) 36.74 (1,220,127) 41.80
Expired (592,883) 68.64 − −
Outstanding options, end of year 12,538,928 $ 36.74 10,750,993 $ 38.90
Options exercisable, end of year 4,120,017 $ 38.72 3,671,069 $ 43.25
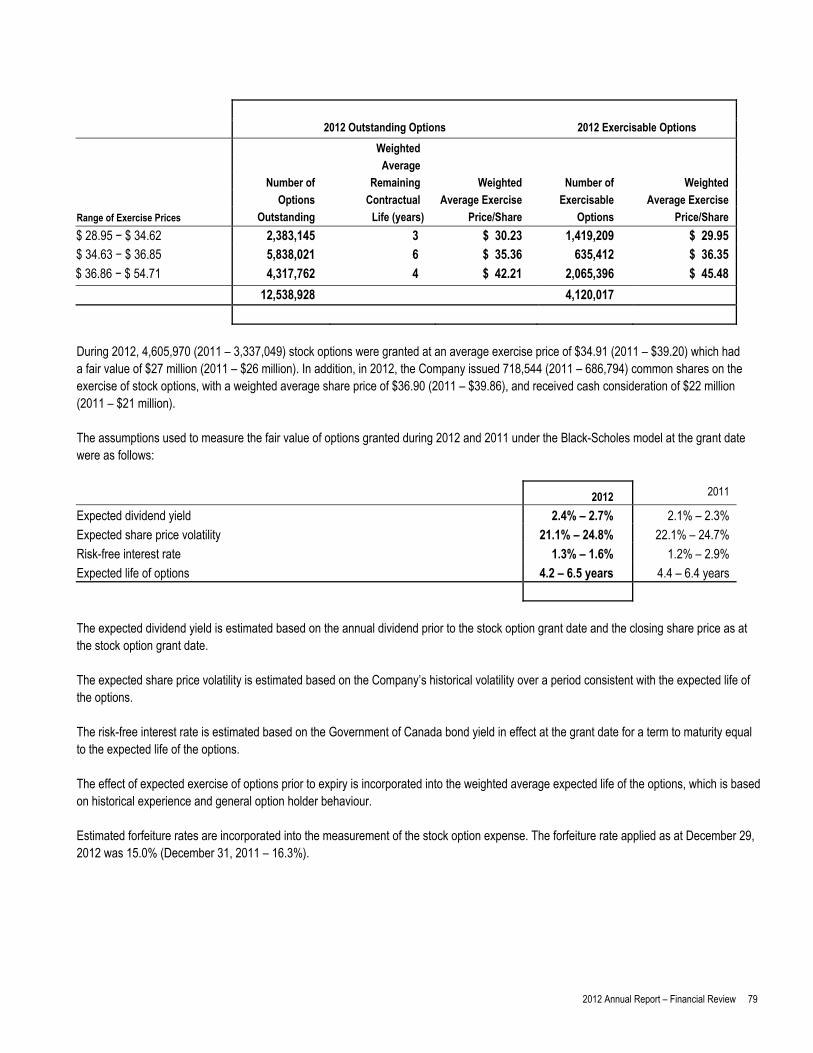
2012 Annual Report – Financial Review 79
2012 Outstanding Options 2012 Exercisable Options
Weighted Average Number of Remaining Weighted Number of Weighted
Options Contractual Average Exercise Exercisable Average Exercise
Range of Exercise Prices Outstanding Life (years) Price/Share Options Price/Share
$ 28.95 − $ 34.62 2,383,145 3 $ 30.23 1,419,209 $ 29.95 $ 34.63 − $ 36.85 5,838,021 6 $ 35.36 635,412 $ 36.35
$ 36.86 − $ 54.71 4,317,762 4 $ 42.21 2,065,396 $ 45.48
12,538,928 4,120,017
During 2012, 4,605,970 (2011 – 3,337,049) stock options were granted at an average exercise price of $34.91 (2011 – $39.20) which had a fair value of $27 million (2011 – $26 million). In addition, in 2012, the Company issued 718,544 (2011 – 686,794) common shares on the exercise of stock options, with a weighted average share price of $36.90 (2011 – $39.86), and received cash consideration of $22 million (2011 – $21 million). The assumptions used to measure the fair value of options granted during 2012 and 2011 under the Black-Scholes model at the grant date were as follows:
2012 2011
Expected dividend yield 2.4% – 2.7% 2.1% – 2.3%
Expected share price volatility 21.1% – 24.8% 22.1% – 24.7%
Risk-free interest rate 1.3% – 1.6% 1.2% – 2.9%
Expected life of options 4.2 – 6.5 years 4.4 – 6.4 years
The expected dividend yield is estimated based on the annual dividend prior to the stock option grant date and the closing share price as at the stock option grant date. The expected share price volatility is estimated based on the Company’s historical volatility over a period consistent with the expected life of the options. The risk-free interest rate is estimated based on the Government of Canada bond yield in effect at the grant date for a term to maturity equal to the expected life of the options. The effect of expected exercise of options prior to expiry is incorporated into the weighted average expected life of the options, which is based on historical experience and general option holder behaviour. Estimated forfeiture rates are incorporated into the measurement of the stock option expense. The forfeiture rate applied as at December 29, 2012 was 15.0% (December 31, 2011 – 16.3%).
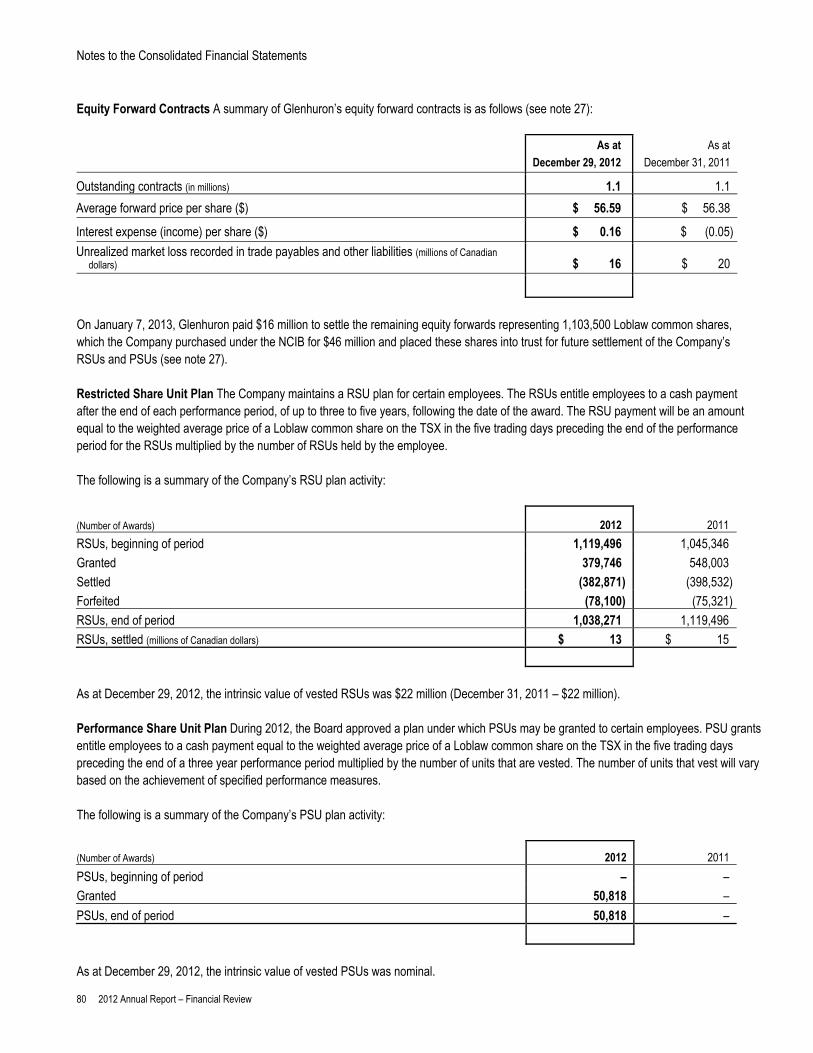
Notes to the Consolidated Financial Statements
80 2012 Annual Report – Financial Review
Equity Forward Contracts A summary of Glenhuron’s equity forward contracts is as follows (see note 27):
As at
December 29, 2012
As at
December 31, 2011
Outstanding contracts (in millions) 1.1 1.1
Average forward price per share ($) $ 56.59 $ 56.38
Interest expense (income) per share ($) $ 0.16 $ (0.05)
Unrealized market loss recorded in trade payables and other liabilities (millions of Canadian dollars) $ 16 $ 20
On January 7, 2013, Glenhuron paid $16 million to settle the remaining equity forwards representing 1,103,500 Loblaw common shares, which the Company purchased under the NCIB for $46 million and placed these shares into trust for future settlement of the Company’s RSUs and PSUs (see note 27).
Restricted Share Unit Plan The Company maintains a RSU plan for certain employees. The RSUs entitle employees to a cash payment after the end of each performance period, of up to three to five years, following the date of the award. The RSU payment will be an amount equal to the weighted average price of a Loblaw common share on the TSX in the five trading days preceding the end of the performance period for the RSUs multiplied by the number of RSUs held by the employee. The following is a summary of the Company’s RSU plan activity:
(Number of Awards) 2012 2011
RSUs, beginning of period 1,119,496 1,045,346
Granted 379,746 548,003
Settled (382,871) (398,532)
Forfeited (78,100) (75,321)
RSUs, end of period 1,038,271 1,119,496
RSUs, settled (millions of Canadian dollars) $ 13 $ 15
As at December 29, 2012, the intrinsic value of vested RSUs was $22 million (December 31, 2011 – $22 million). Performance Share Unit Plan During 2012, the Board approved a plan under which PSUs may be granted to certain employees. PSU grants entitle employees to a cash payment equal to the weighted average price of a Loblaw common share on the TSX in the five trading days preceding the end of a three year performance period multiplied by the number of units that are vested. The number of units that vest will vary based on the achievement of specified performance measures. The following is a summary of the Company’s PSU plan activity:
(Number of Awards) 2012 2011
PSUs, beginning of period – –
Granted 50,818 –
PSUs, end of period 50,818 –
As at December 29, 2012, the intrinsic value of vested PSUs was nominal.
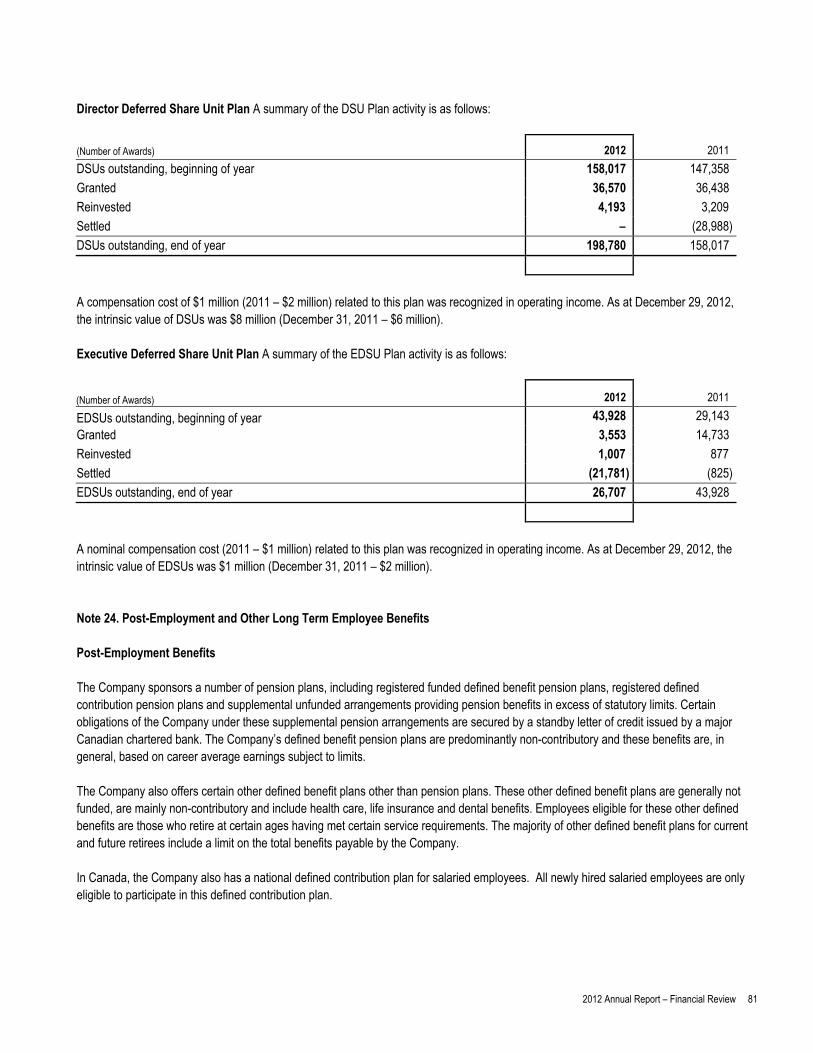
2012 Annual Report – Financial Review 81
Director Deferred Share Unit Plan A summary of the DSU Plan activity is as follows:
(Number of Awards) 2012 2011
DSUs outstanding, beginning of year 158,017 147,358
Granted 36,570 36,438
Reinvested 4,193 3,209
Settled – (28,988)
DSUs outstanding, end of year 198,780 158,017
A compensation cost of $1 million (2011 – $2 million) related to this plan was recognized in operating income. As at December 29, 2012, the intrinsic value of DSUs was $8 million (December 31, 2011 – $6 million). Executive Deferred Share Unit Plan A summary of the EDSU Plan activity is as follows:
(Number of Awards) 2012 2011
EDSUs outstanding, beginning of year 43,928 29,143
Granted 3,553 14,733
Reinvested 1,007 877
Settled (21,781) (825)
EDSUs outstanding, end of year 26,707 43,928
A nominal compensation cost (2011 – $1 million) related to this plan was recognized in operating income. As at December 29, 2012, the intrinsic value of EDSUs was $1 million (December 31, 2011 – $2 million). Note 24. Post-Employment and Other Long Term Employee Benefits Post-Employment Benefits The Company sponsors a number of pension plans, including registered funded defined benefit pension plans, registered defined contribution pension plans and supplemental unfunded arrangements providing pension benefits in excess of statutory limits. Certain obligations of the Company under these supplemental pension arrangements are secured by a standby letter of credit issued by a major Canadian chartered bank. The Company’s defined benefit pension plans are predominantly non-contributory and these benefits are, in general, based on career average earnings subject to limits. The Company also offers certain other defined benefit plans other than pension plans. These other defined benefit plans are generally not funded, are mainly non-contributory and include health care, life insurance and dental benefits. Employees eligible for these other defined benefits are those who retire at certain ages having met certain service requirements. The majority of other defined benefit plans for current and future retirees include a limit on the total benefits payable by the Company. In Canada, the Company also has a national defined contribution plan for salaried employees. All newly hired salaried employees are only eligible to participate in this defined contribution plan.
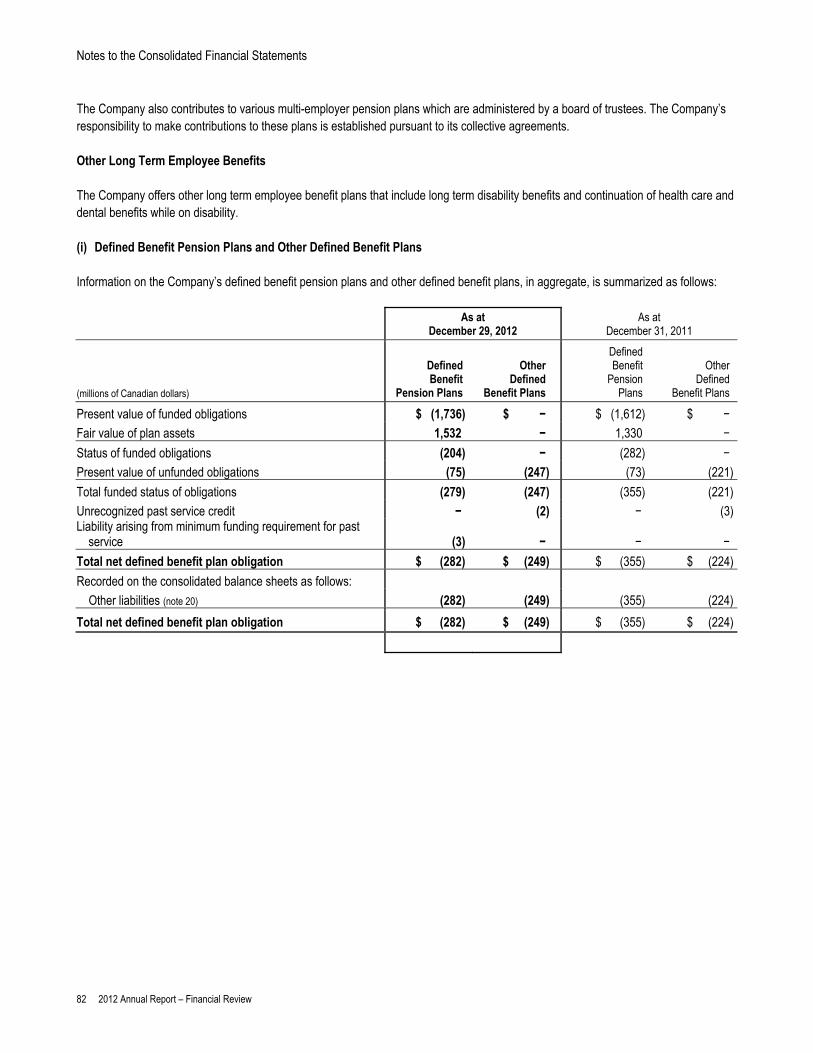
Notes to the Consolidated Financial Statements
82 2012 Annual Report – Financial Review
The Company also contributes to various multi-employer pension plans which are administered by a board of trustees. The Company’s responsibility to make contributions to these plans is established pursuant to its collective agreements. Other Long Term Employee Benefits The Company offers other long term employee benefit plans that include long term disability benefits and continuation of health care and dental benefits while on disability. (i) Defined Benefit Pension Plans and Other Defined Benefit Plans Information on the Company’s defined benefit pension plans and other defined benefit plans, in aggregate, is summarized as follows:
As at
December 29, 2012 As at
December 31, 2011
(millions of Canadian dollars)
Defined Benefit
Pension Plans
Other Defined
Benefit Plans
Defined Benefit
Pension Plans
Other Defined
Benefit Plans
Present value of funded obligations $ (1,736) $ − $ (1,612) $ −
Fair value of plan assets 1,532 − 1,330 −
Status of funded obligations (204) − (282) −
Present value of unfunded obligations (75) (247) (73) (221)
Total funded status of obligations (279) (247) (355) (221)
Unrecognized past service credit − (2) − (3) Liability arising from minimum funding requirement for past
service (3) − − −
Total net defined benefit plan obligation $ (282) $ (249) $ (355) $ (224)
Recorded on the consolidated balance sheets as follows:
Other liabilities (note 20) (282) (249) (355) (224)
Total net defined benefit plan obligation $ (282) $ (249) $ (355) $ (224)
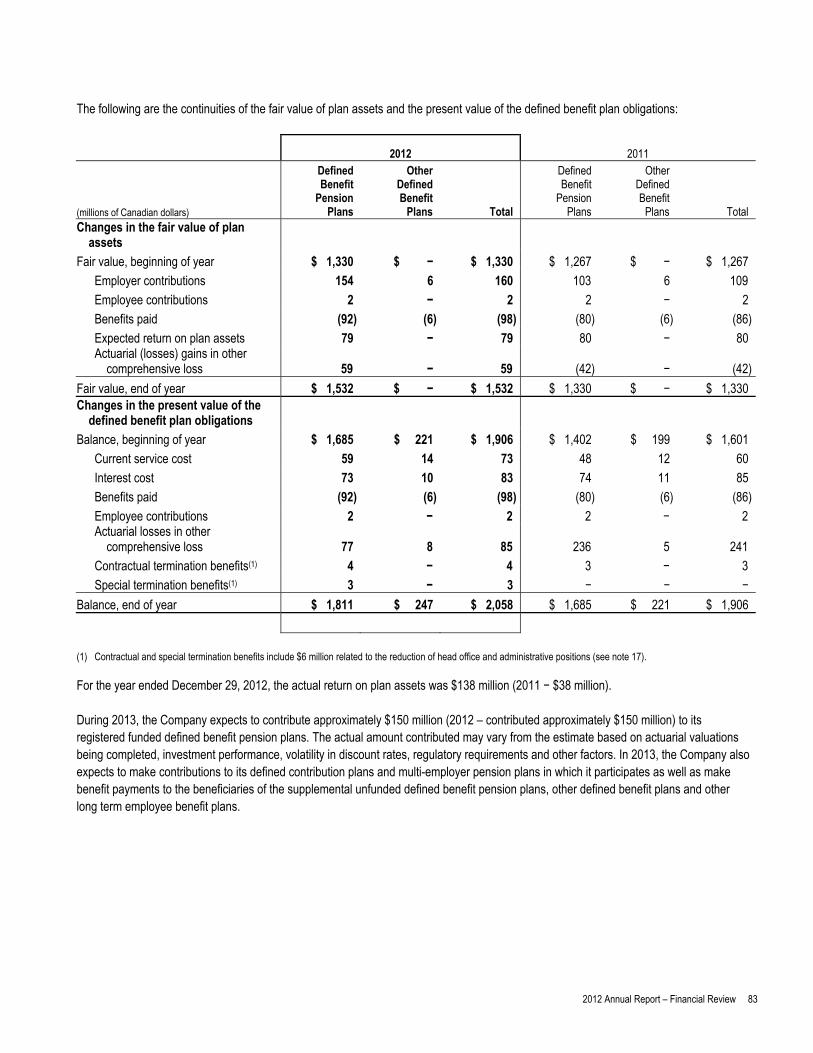
2012 Annual Report – Financial Review 83
The following are the continuities of the fair value of plan assets and the present value of the defined benefit plan obligations:
2012 2011
(millions of Canadian dollars)
Defined Benefit
Pension Plans
Other Defined Benefit
Plans Total
Defined Benefit
Pension Plans
Other Defined Benefit
Plans Total Changes in the fair value of plan
assets
Fair value, beginning of year $ 1,330 $ − $ 1,330 $ 1,267 $ − $ 1,267
Employer contributions 154 6 160 103 6 109
Employee contributions 2 − 2 2 − 2
Benefits paid (92) (6) (98) (80) (6) (86)
Expected return on plan assets 79 − 79 80 − 80 Actuarial (losses) gains in other
comprehensive loss 59 − 59 (42) − (42)
Fair value, end of year $ 1,532 $ − $ 1,532 $ 1,330 $ − $ 1,330 Changes in the present value of the
defined benefit plan obligations
Balance, beginning of year $ 1,685 $ 221 $ 1,906 $ 1,402 $ 199 $ 1,601
Current service cost 59 14 73 48 12 60
Interest cost 73 10 83 74 11 85
Benefits paid (92) (6) (98) (80) (6) (86)
Employee contributions 2 − 2 2 − 2 Actuarial losses in other
comprehensive loss 77 8 85 236 5 241
Contractual termination benefits(1) 4 − 4 3 − 3
Special termination benefits(1) 3 − 3 − − −
Balance, end of year $ 1,811 $ 247 $ 2,058 $ 1,685 $ 221 $ 1,906
(1) Contractual and special termination benefits include $6 million related to the reduction of head office and administrative positions (see note 17).
For the year ended December 29, 2012, the actual return on plan assets was $138 million (2011 − $38 million). During 2013, the Company expects to contribute approximately $150 million (2012 – contributed approximately $150 million) to its registered funded defined benefit pension plans. The actual amount contributed may vary from the estimate based on actuarial valuations being completed, investment performance, volatility in discount rates, regulatory requirements and other factors. In 2013, the Company also expects to make contributions to its defined contribution plans and multi-employer pension plans in which it participates as well as make benefit payments to the beneficiaries of the supplemental unfunded defined benefit pension plans, other defined benefit plans and other long term employee benefit plans.

Notes to the Consolidated Financial Statements
84 2012 Annual Report – Financial Review
Composition of Plan Assets The defined benefit pension plan assets are held in trust and consisted of the following asset categories:
Percentage of plan assets
As at
December 29, 2012
As at
December 31, 2011
Asset category: Equity securities 59% 55%
Debt securities 40% 44% Cash and cash equivalents 1% 1%
Total 100% 100%
As at December 29, 2012 and December 31, 2011, the defined benefit pension plans did not directly hold any securities issued by the Company. The cost recognized in other comprehensive loss for post-employment defined benefit plans is as follows:
2012 2011
(millions of Canadian dollars) Defined Benefit Pension Plans
Other Defined Benefit Plans
Defined Benefit Pension Plans
Other Defined Benefit Plans
Actuarial losses $ 18 $ 8 $ 278 $ 5
Change in liability arising from asset ceiling − − (1) – Change in liability arising from minimum funding
requirements for past service 3 − (2) – Total net actuarial losses recognized in other
comprehensive loss before tax $ 21 $ 8 $ 275 $ 5
Income tax recoveries on actuarial losses (note 6) (6) (2) (71) (1)
Actuarial losses net of income tax recoveries 15 6 204 4
The cumulative actuarial losses before tax recognized in retained earnings for the Company’s defined benefit plans are as follows:
2012 2011
(millions of Canadian dollars) Defined Benefit Pension Plans
Other Defined Benefit Plans
Defined Benefit Pension Plans
Other Defined Benefit Plans
Cumulative amount, beginning of year $ 379 $ 23 $ 104 $ 18
Net actuarial losses before tax recognized in the year 21 8 275 5
Cumulative amount, end of year $ 400 $ 31 $ 379 $ 23
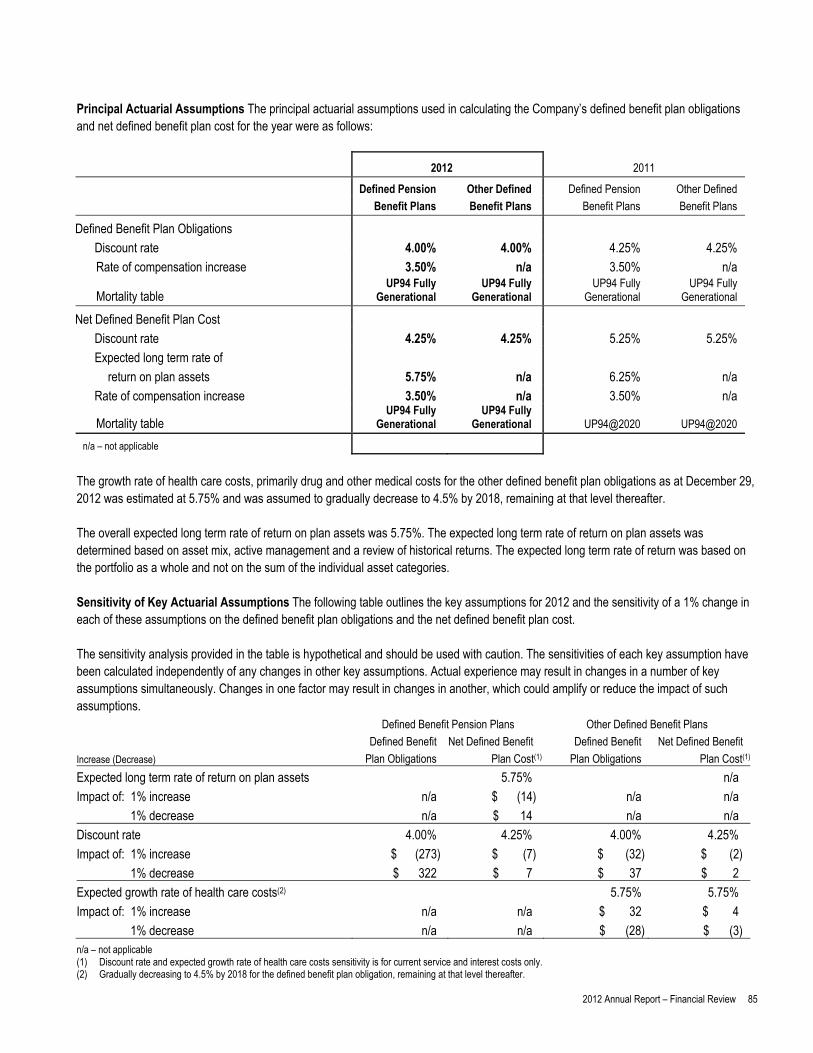
2012 Annual Report – Financial Review 85
Principal Actuarial Assumptions The principal actuarial assumptions used in calculating the Company’s defined benefit plan obligations and net defined benefit plan cost for the year were as follows:
2012 2011
Defined Pension Other Defined Defined Pension Other Defined Benefit Plans Benefit Plans Benefit Plans Benefit Plans
Defined Benefit Plan Obligations
Discount rate 4.00% 4.00% 4.25% 4.25%
Rate of compensation increase 3.50% n/a 3.50% n/a
Mortality table UP94 Fully
Generational UP94 Fully
Generational UP94 Fully
Generational UP94 Fully
Generational
Net Defined Benefit Plan Cost
Discount rate 4.25% 4.25% 5.25% 5.25%
Expected long term rate of
return on plan assets 5.75% n/a 6.25% n/a
Rate of compensation increase 3.50% n/a 3.50% n/a
Mortality table UP94 Fully
Generational UP94 Fully
Generational UP94@2020 UP94@2020
n/a – not applicable The growth rate of health care costs, primarily drug and other medical costs for the other defined benefit plan obligations as at December 29, 2012 was estimated at 5.75% and was assumed to gradually decrease to 4.5% by 2018, remaining at that level thereafter. The overall expected long term rate of return on plan assets was 5.75%. The expected long term rate of return on plan assets was determined based on asset mix, active management and a review of historical returns. The expected long term rate of return was based on the portfolio as a whole and not on the sum of the individual asset categories. Sensitivity of Key Actuarial Assumptions The following table outlines the key assumptions for 2012 and the sensitivity of a 1% change in each of these assumptions on the defined benefit plan obligations and the net defined benefit plan cost. The sensitivity analysis provided in the table is hypothetical and should be used with caution. The sensitivities of each key assumption have been calculated independently of any changes in other key assumptions. Actual experience may result in changes in a number of key assumptions simultaneously. Changes in one factor may result in changes in another, which could amplify or reduce the impact of such assumptions.
Defined Benefit Pension Plans Other Defined Benefit Plans
Defined Benefit Net Defined Benefit Defined Benefit Net Defined Benefit
Increase (Decrease) Plan Obligations Plan Cost(1) Plan Obligations Plan Cost(1)
Expected long term rate of return on plan assets 5.75% n/a
Impact of: 1% increase n/a $ (14) n/a n/a
1% decrease n/a $ 14 n/a n/a
Discount rate 4.00% 4.25% 4.00% 4.25%
Impact of: 1% increase $ (273) $ (7) $ (32) $ (2)
1% decrease $ 322 $ 7 $ 37 $ 2
Expected growth rate of health care costs(2) 5.75% 5.75%
Impact of: 1% increase n/a n/a $ 32 $ 4
1% decrease n/a n/a $ (28) $ (3) n/a – not applicable (1) Discount rate and expected growth rate of health care costs sensitivity is for current service and interest costs only. (2) Gradually decreasing to 4.5% by 2018 for the defined benefit plan obligation, remaining at that level thereafter.

Notes to the Consolidated Financial Statements
86 2012 Annual Report – Financial Review
Historical Information The history of defined benefit plans was as follows:
(millions of Canadian dollars) As at
December 29, 2012 As at
December 31, 2011 As at
January 1, 2011
As at
January 3, 2010
Fair value of plan assets $ 1,532 $ 1,330 $ 1,267 $ 1,119
Present value of defined benefit plan obligation (2,058) (1,906) (1,601) (1,375)
Deficit in the plans $ (526) $ (576) $ (334) $ (256)
Experience adjustments arising on plan assets 59 (42) 41 n/a
Experience adjustments arising on plan liabilities (85) (241) (167) n/a
n/a – not applicable
(ii) Post-Employment and Other Long Term Employee Benefit Cost The net cost recognized in earnings before income taxes for the Company’s post-employment and other long term employee benefit plans was as follows:
2012
(millions of Canadian dollars) Defined Benefit Pension Plans
Other Defined Benefit Plans
Total
Current service cost $ 59 $ 14 $ 73
Interest cost on defined benefit plan obligations(1) 73 10 83
Expected return on pension plan assets(1) (79) − (79)
Contractual and special termination benefits(2) 7 − 7
Net post-employment defined benefit cost $ 60 $ 24 $ 84
Defined contribution costs(3) 18
Multi-employer pension plan costs(3) 53
Total net post-employment benefit cost 155
Other long term employee benefit costs(1) 27
Net post-employment and other long term employee benefit costs $ 182
(1) Interest cost on defined benefit plan obligations, expected return on plan assets and $4 million of other long term employee benefit costs were recognized in net interest expense and other financing charges.
(2) Includes $6 million of contractual and special termination benefits related to the reduction in head office and administrative positions (see note 17). (3) Amounts represent the Company’s contribution made in connection with defined contribution plans and multi-employer pension plans.
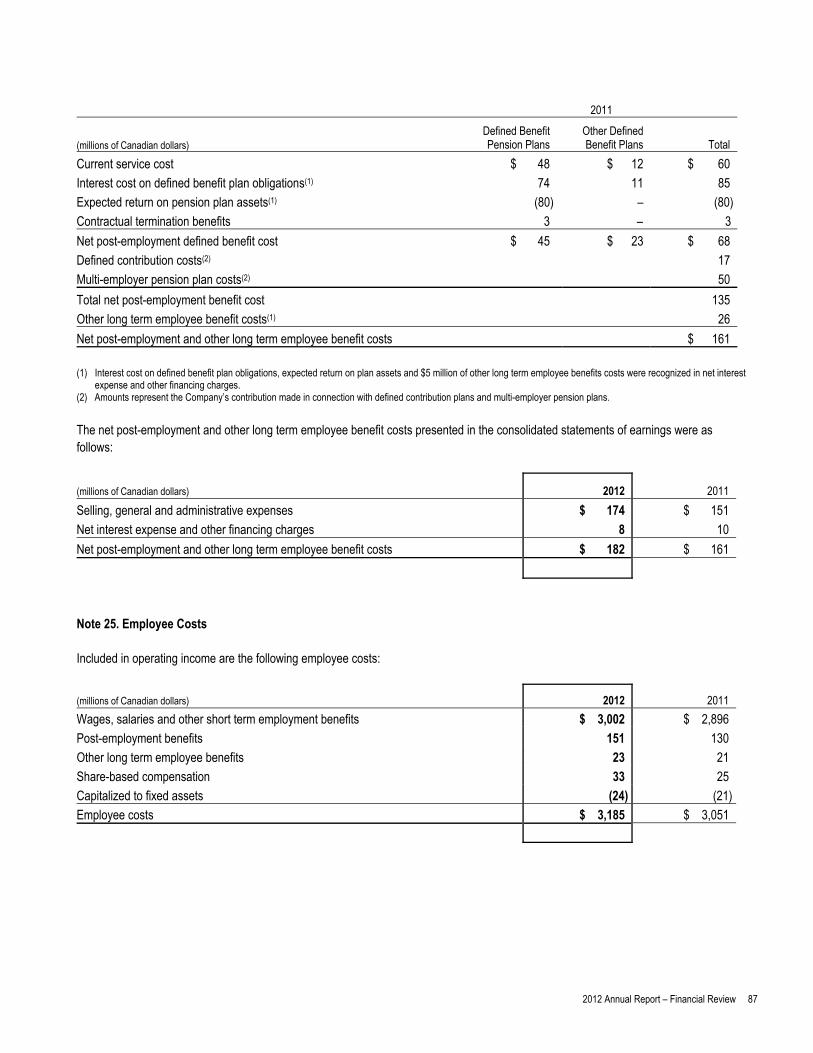
2012 Annual Report – Financial Review 87
2011
(millions of Canadian dollars) Defined Benefit Pension Plans
Other Defined Benefit Plans
Total
Current service cost $ 48 $ 12 $ 60
Interest cost on defined benefit plan obligations(1) 74 11 85
Expected return on pension plan assets(1) (80) – (80)
Contractual termination benefits 3 – 3
Net post-employment defined benefit cost $ 45 $ 23 $ 68
Defined contribution costs(2) 17
Multi-employer pension plan costs(2) 50
Total net post-employment benefit cost 135
Other long term employee benefit costs(1) 26
Net post-employment and other long term employee benefit costs $ 161
(1) Interest cost on defined benefit plan obligations, expected return on plan assets and $5 million of other long term employee benefits costs were recognized in net interest
expense and other financing charges. (2) Amounts represent the Company’s contribution made in connection with defined contribution plans and multi-employer pension plans.
The net post-employment and other long term employee benefit costs presented in the consolidated statements of earnings were as follows:
(millions of Canadian dollars) 2012 2011
Selling, general and administrative expenses $ 174 $ 151
Net interest expense and other financing charges 8 10
Net post-employment and other long term employee benefit costs $ 182 $ 161
Note 25. Employee Costs Included in operating income are the following employee costs:
(millions of Canadian dollars) 2012 2011
Wages, salaries and other short term employment benefits $ 3,002 $ 2,896
Post-employment benefits 151 130
Other long term employee benefits 23 21
Share-based compensation 33 25
Capitalized to fixed assets (24) (21)
Employee costs $ 3,185 $ 3,051

Notes to the Consolidated Financial Statements
88 2012 Annual Report – Financial Review
Note 26. Leases The Company leases certain of its retail stores, distribution centres, corporate offices, and other assets under operating or finance lease arrangements. Substantially all of the retail store leases have renewal options for additional terms. The contingent rents under certain of the retail store leases are based on a percentage of retail sales. The Company also has properties which are subleased to third parties. Determining whether a lease arrangement is classified as finance or operating requires judgment with respect to the fair value of the leased asset, the economic life of the lease, the discount rate and the allocation of leasehold interests between the land and building elements of property leases. Operating Leases – As Lessee Future minimum lease payments relating to the Company’s operating leases are as follows:
Payments due by year
As at
December 29, 2012 As at
December 31, 2011
(millions of Canadian dollars) 2013 2014 2015 2016 2017 Thereafter Total Total
Operating lease payments $ 202 $ 185 $ 162 $ 132 $ 108 $ 442 $ 1,231 $ 1,179 Sub-lease income (46) (39) (26) (16) (8) (10) (145) (181)
Net operating lease payments $ 156 $ 146 $ 136 $ 116 $ 100 $ 432 $ 1,086 $ 998
During 2012 the Company recorded $197 million (2011 – $187 million) as an expense in the statement of earnings in respect of operating leases. During that period, contingent rent recognized as an expense in respect of operating leases totaled $1 million (2011 – $1 million), while sub-lease income earned totaled $48 million (2011 – $46 million) which is recognized in operating income. Operating Leases - As Lessor As at December 29, 2012, the Company leased certain owned land and buildings with a cost of $2,037 million (December 31, 2011 – $1,681 million) and related accumulated depreciation of $539 million (December 31, 2011 – $408 million). For the year ended December 29, 2012, rental income was $132 million (2011 – $127 million) and contingent rent was $2 million (2011 – $1 million), both of which were recognized in operating income.
Payments to be received by year
As at
December 29, 2012 As at
December 31, 2011
(millions of Canadian dollars) 2013 2014 2015 2016 2017 Thereafter Total Total
Net operating lease income $ 153 $ 131 $ 110 $ 86 $ 58 $ 158 $ 696 $ 634
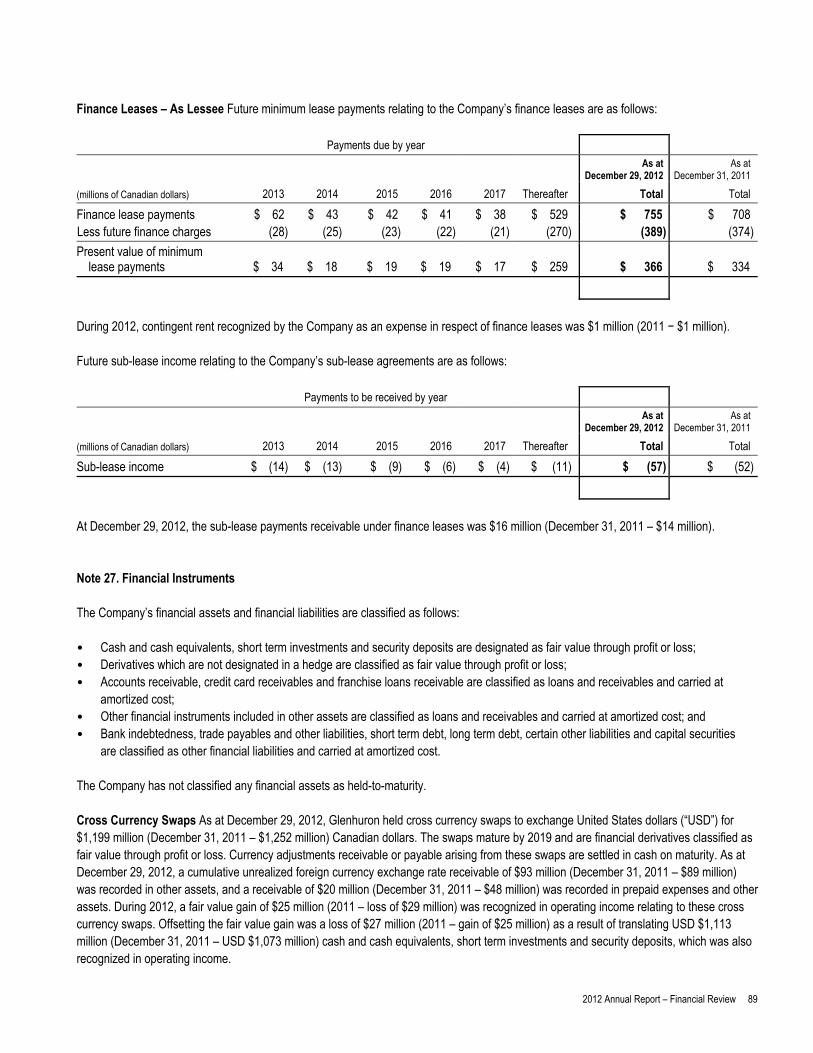
2012 Annual Report – Financial Review 89
Finance Leases – As Lessee Future minimum lease payments relating to the Company’s finance leases are as follows:
Payments due by year
As at
December 29, 2012 As at
December 31, 2011
(millions of Canadian dollars) 2013 2014 2015 2016 2017 Thereafter Total Total
Finance lease payments $ 62 $ 43 $ 42 $ 41 $ 38 $ 529 $ 755 $ 708 Less future finance charges (28) (25) (23) (22) (21) (270) (389) (374)
Present value of minimum lease payments $ 34 $ 18 $ 19 $ 19 $ 17 $ 259 $ 366 $ 334
During 2012, contingent rent recognized by the Company as an expense in respect of finance leases was $1 million (2011 − $1 million). Future sub-lease income relating to the Company’s sub-lease agreements are as follows:
Payments to be received by year
As at
December 29, 2012 As at
December 31, 2011
(millions of Canadian dollars) 2013 2014 2015 2016 2017 Thereafter Total Total
Sub-lease income $ (14) $ (13) $ (9) $ (6) $ (4) $ (11) $ (57) $ (52)
At December 29, 2012, the sub-lease payments receivable under finance leases was $16 million (December 31, 2011 – $14 million). Note 27. Financial Instruments The Company’s financial assets and financial liabilities are classified as follows: • Cash and cash equivalents, short term investments and security deposits are designated as fair value through profit or loss; • Derivatives which are not designated in a hedge are classified as fair value through profit or loss; • Accounts receivable, credit card receivables and franchise loans receivable are classified as loans and receivables and carried at
amortized cost; • Other financial instruments included in other assets are classified as loans and receivables and carried at amortized cost; and • Bank indebtedness, trade payables and other liabilities, short term debt, long term debt, certain other liabilities and capital securities
are classified as other financial liabilities and carried at amortized cost. The Company has not classified any financial assets as held-to-maturity. Cross Currency Swaps As at December 29, 2012, Glenhuron held cross currency swaps to exchange United States dollars (“USD”) for $1,199 million (December 31, 2011 – $1,252 million) Canadian dollars. The swaps mature by 2019 and are financial derivatives classified as fair value through profit or loss. Currency adjustments receivable or payable arising from these swaps are settled in cash on maturity. As at December 29, 2012, a cumulative unrealized foreign currency exchange rate receivable of $93 million (December 31, 2011 – $89 million) was recorded in other assets, and a receivable of $20 million (December 31, 2011 – $48 million) was recorded in prepaid expenses and other assets. During 2012, a fair value gain of $25 million (2011 – loss of $29 million) was recognized in operating income relating to these cross currency swaps. Offsetting the fair value gain was a loss of $27 million (2011 – gain of $25 million) as a result of translating USD $1,113 million (December 31, 2011 – USD $1,073 million) cash and cash equivalents, short term investments and security deposits, which was also recognized in operating income.

Notes to the Consolidated Financial Statements
90 2012 Annual Report – Financial Review
In 2008, the Company entered into fixed cross currency swaps to exchange $148 million Canadian dollars for USD $150 million, which mature in the second quarter of 2013 and entered into additional fixed cross currency swaps to exchange $148 million Canadian dollars for USD $150 million, which mature by 2015. A portion of these cross currency swaps was originally designated in a cash flow hedge to manage the foreign exchange variability related to part of the Company’s fixed rate USPP notes. In 2011, the designated swap was no longer classified as a cash flow hedge and as a result, fair value changes were recorded in operating income. As at December 29, 2012, a cumulative unrealized foreign currency exchange rate receivable of $5 million (December 31, 2011 – $14 million) was recorded in other assets and a receivable of $2 million (December 29, 2011 – nil) was recorded in prepaid expenses and other assets. During 2012, the Company recognized in operating income an unrealized fair value loss of $7 million (2011 – gain of $2 million) on these cross currency swaps. Offsetting the unrealized fair value loss was an unrealized foreign currency exchange gain of $6 million (2011 – loss of $6 million), which was also recognized in operating income, related to the translation of USD $300 million USPP. Interest Rate Swaps The Company maintains a notional $150 million (2011 − $150 million) in interest rate swaps that mature by the third quarter of 2013, on which it pays a fixed rate of 8.38%. At December 29, 2012, the fair value of these interest rate swaps of $5 million (December 31, 2011 – $16 million) was recorded in other liabilities (see note 20). During 2012, the Company recognized a fair value gain of $11 million (2011 – gain of $8 million) in operating income related to these swaps. Interest rate swaps previously held by Glenhuron converted a notional $200 million of floating rate cash and cash equivalents, short term investments and security deposits to average fixed rate investments at 4.74%. These interest rate swaps matured in 2011. During 2012, no fair value loss (2011 – $7 million) was recognized on these interest rate swaps in operating income. Equity Forward Contracts As at December 29, 2012, Glenhuron had cumulative equity forward contracts to buy 1.1 million (December 31, 2011 – 1.1 million) of the Company’s common shares at an average forward price of $56.59 (December 31, 2011 – $56.38) including $0.16 interest expense (December 31, 2011 – $0.05 interest income) per common share (see note 21). In 2012, Glenhuron recognized a $5 million gain (2011 – $2 million expense) in operating income in relation to these equity forwards. In addition, during 2011 Glenhuron paid $7 million to settle equity forwards representing 390,100 Loblaw shares, which the Company purchased for cancellation for $15 million under its NCIB. As at December 29, 2012, the cumulative accrued interest and unrealized market loss of $16 million (December 31, 2011 – loss of $20 million) was included in accounts payable and accrued liabilities. On January 7, 2013, Glenhuron paid $16 million to settle the remaining equity forwards representing 1,103,500 Loblaw common shares, which the Company purchased under the NCIB for $46 million and placed these shares into trust for future settlement of the Company’s RSUs and PSUs (see note 23). Other Derivatives The Company also maintains other financial derivatives including foreign exchange forwards, electricity forwards and fuel exchange traded futures and options. As at December 29, 2012, the Company recognized a nominal (December 31, 2011 – $1 million) cumulative unrealized gain receivable included in prepaid and other assets. Franchise Loans Receivable and Franchise Investments in Other Assets The value of franchise loans receivable of $363 million (December 31, 2011 – $331 million) was recorded on the consolidated balance sheets. During 2012, the Company recorded an impairment loss of $12 million (2011 –$11 million) in operating income related to these loan receivables. The value of franchise investments included in other assets recorded on the consolidated balance sheets was $64 million (December 31, 2011 – $53 million). During 2012, the Company recognized an impairment loss of $7 million (2011 – $4 million) in operating income related to these investments.
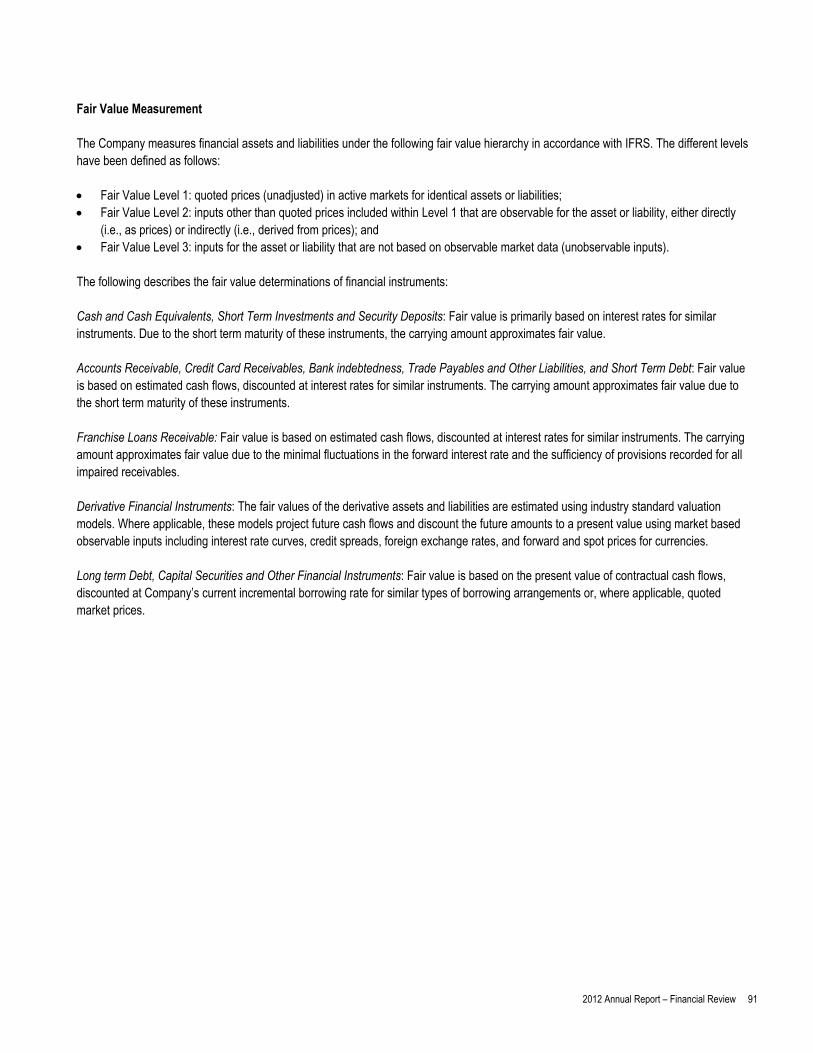
2012 Annual Report – Financial Review 91
Fair Value Measurement The Company measures financial assets and liabilities under the following fair value hierarchy in accordance with IFRS. The different levels have been defined as follows: Fair Value Level 1: quoted prices (unadjusted) in active markets for identical assets or liabilities; Fair Value Level 2: inputs other than quoted prices included within Level 1 that are observable for the asset or liability, either directly
(i.e., as prices) or indirectly (i.e., derived from prices); and Fair Value Level 3: inputs for the asset or liability that are not based on observable market data (unobservable inputs). The following describes the fair value determinations of financial instruments: Cash and Cash Equivalents, Short Term Investments and Security Deposits: Fair value is primarily based on interest rates for similar instruments. Due to the short term maturity of these instruments, the carrying amount approximates fair value. Accounts Receivable, Credit Card Receivables, Bank indebtedness, Trade Payables and Other Liabilities, and Short Term Debt: Fair value is based on estimated cash flows, discounted at interest rates for similar instruments. The carrying amount approximates fair value due to the short term maturity of these instruments. Franchise Loans Receivable: Fair value is based on estimated cash flows, discounted at interest rates for similar instruments. The carrying amount approximates fair value due to the minimal fluctuations in the forward interest rate and the sufficiency of provisions recorded for all impaired receivables. Derivative Financial Instruments: The fair values of the derivative assets and liabilities are estimated using industry standard valuation models. Where applicable, these models project future cash flows and discount the future amounts to a present value using market based observable inputs including interest rate curves, credit spreads, foreign exchange rates, and forward and spot prices for currencies. Long term Debt, Capital Securities and Other Financial Instruments: Fair value is based on the present value of contractual cash flows, discounted at Company’s current incremental borrowing rate for similar types of borrowing arrangements or, where applicable, quoted market prices.
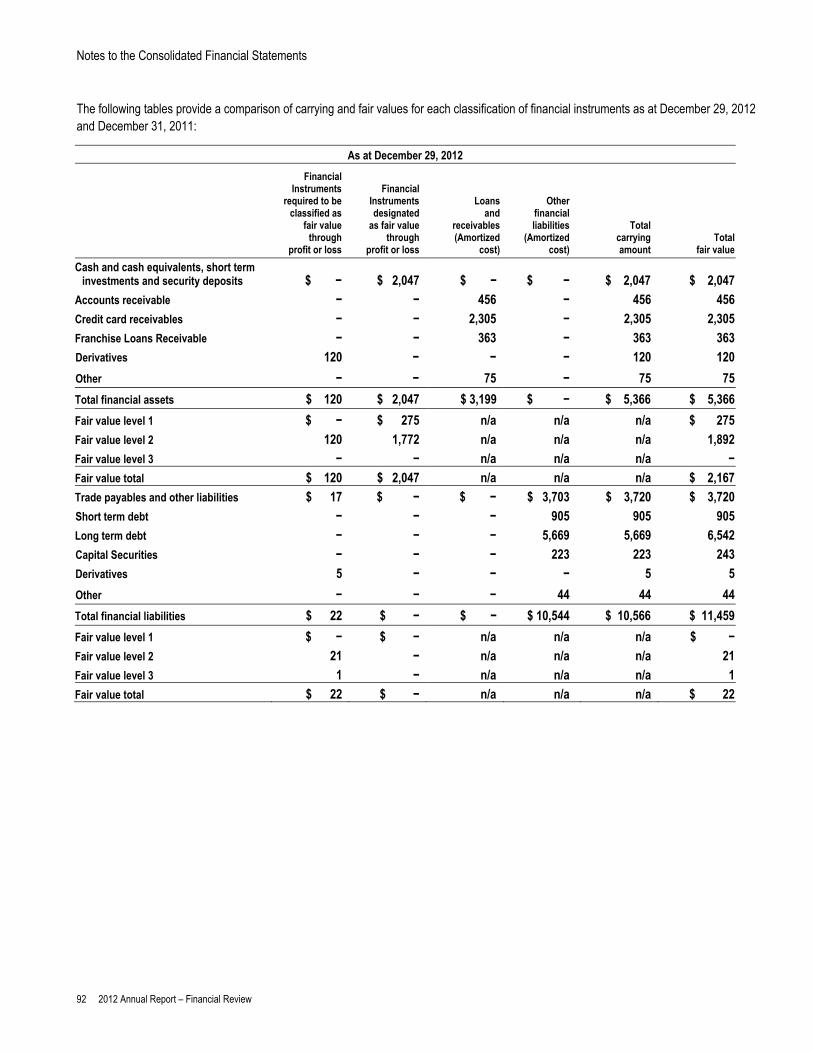
Notes to the Consolidated Financial Statements
92 2012 Annual Report – Financial Review
The following tables provide a comparison of carrying and fair values for each classification of financial instruments as at December 29, 2012 and December 31, 2011:
As at December 29, 2012
Financial Instruments
required to be classified as
fair value through
profit or loss
Financial Instruments designated
as fair value through
profit or loss
Loans and
receivables (Amortized
cost)
Other financial liabilities
(Amortized cost)
Total
carrying amount
Total fair value
Cash and cash equivalents, short term investments and security deposits $ − $ 2,047 $ − $ − $ 2,047 $ 2,047
Accounts receivable − − 456 − 456 456
Credit card receivables − − 2,305 − 2,305 2,305
Franchise Loans Receivable − − 363 − 363 363
Derivatives 120 − − − 120 120
Other − − 75 − 75 75
Total financial assets $ 120 $ 2,047 $ 3,199 $ − $ 5,366 $ 5,366
Fair value level 1 $ − $ 275 n/a n/a n/a $ 275
Fair value level 2 120 1,772 n/a n/a n/a 1,892
Fair value level 3 − − n/a n/a n/a −
Fair value total $ 120 $ 2,047 n/a n/a n/a $ 2,167
Trade payables and other liabilities $ 17 $ − $ − $ 3,703 $ 3,720 $ 3,720
Short term debt − − − 905 905 905
Long term debt − − − 5,669 5,669 6,542
Capital Securities − − − 223 223 243
Derivatives 5 − − − 5 5
Other − − − 44 44 44
Total financial liabilities $ 22 $ − $ − $ 10,544 $ 10,566 $ 11,459
Fair value level 1 $ − $ − n/a n/a n/a $ −
Fair value level 2 21 − n/a n/a n/a 21
Fair value level 3 1 − n/a n/a n/a 1
Fair value total $ 22 $ − n/a n/a n/a $ 22

2012 Annual Report – Financial Review 93
The fair value of the embedded foreign currency derivative classified as Level 3 included in other liabilities was $1 million (December 31, 2011 – $2 million), of which the fair value gain of $1 million (2011 – loss of $5 million) was recognized in operating income. A 1% increase (decrease) in foreign currency exchange rates would result in an additional $1 million gain (loss) in fair value. During the year ended December 29, 2012, the net loss on financial instruments designated as fair value through profit or loss recognized in net earnings before income taxes was $27 million (2011 – loss of $25 million). In addition, the net gain on financial instruments required to be classified as fair value through profit or loss, recognized in net earnings before income taxes was $38 million (2011 – loss of $29 million). During 2012, net interest expense of $332 million (2011 – expense of $332 million) was recorded related to financial instruments not classified or designated as fair value through profit and loss.
As at December 31, 2011
Financial Instruments
required to be classified as
fair value through
profit or loss
Financial Instruments designated
as fair value through
profit or loss
Loans and
receivables (Amortized cost)
Other financial liabilities
(Amortized cost)
Total
carrying amount
Total fair value
Cash and cash equivalents, short term investments and security deposits $ − $ 1,986 $ − $ − $ 1,986 $ 1,986
Accounts receivable − − 467 − 467 467
Credit card receivables − − 2,101 − 2,101 2,101
Franchise Loans Receivable − − 331 − 331 331
Derivatives 152 − − − 152 152
Other − − 64 − 64 64
Total financial assets $ 152 $ 1,986 $ 2,963 $ − $ 5,101 $ 5,101
Fair value level 1 $ − $ 317 n/a n/a n/a $ 317
Fair value level 2 152 1,669 n/a n/a n/a 1,821
Fair value level 3 − − n/a n/a n/a −
Fair value total $ 152 $ 1,986 n/a n/a n/a $ 2,138
Trade payables and other liabilities 22 − − 3,655 3,677 3,677
Short term debt − − − 905 905 905
Long term debt − − − 5,580 5,580 6,262
Capital Securities − − − 222 222 248
Derivatives 19 − − − 19 19
Other − − − 49 49 49
Total financial liabilities $ 41 $ − $ − $ 10,411 $ 10,452 $ 11,160
Fair value level 1 $ − $ − n/a n/a n/a $ −
Fair value level 2 39 − n/a n/a n/a 39
Fair value level 3 2 − n/a n/a n/a 2
Fair value total $ 41 $ − n/a n/a n/a $ 41
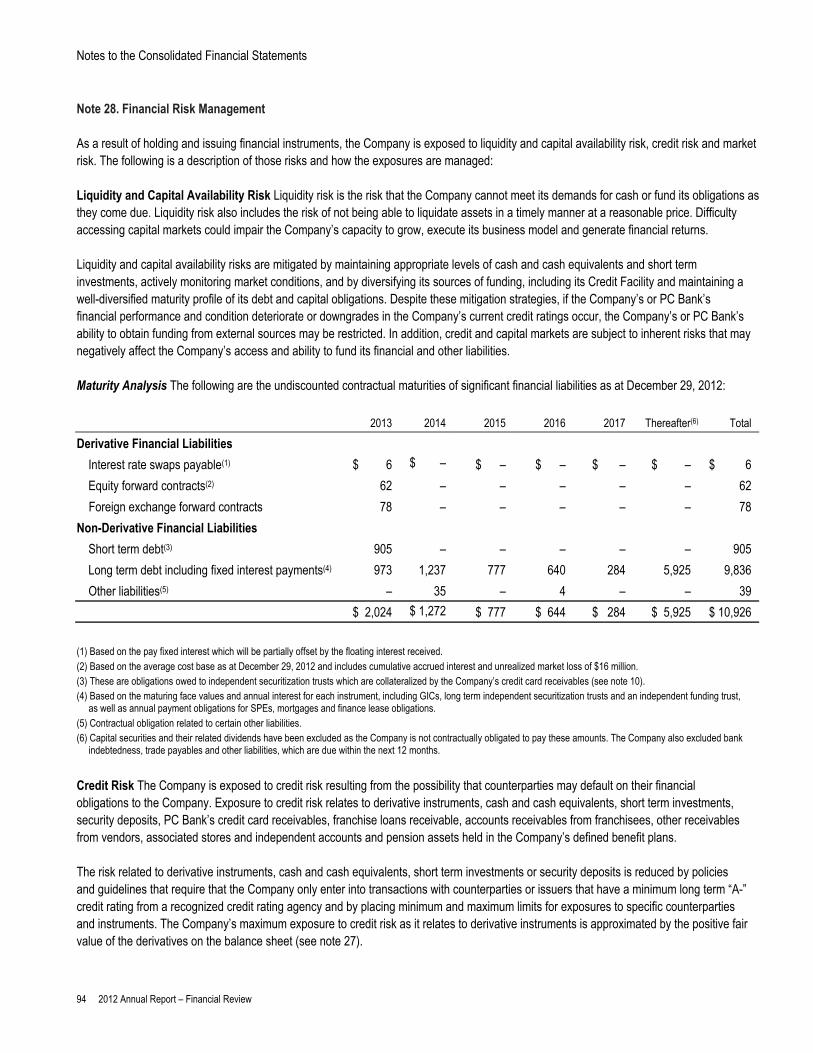
Notes to the Consolidated Financial Statements
94 2012 Annual Report – Financial Review
Note 28. Financial Risk Management As a result of holding and issuing financial instruments, the Company is exposed to liquidity and capital availability risk, credit risk and market risk. The following is a description of those risks and how the exposures are managed: Liquidity and Capital Availability Risk Liquidity risk is the risk that the Company cannot meet its demands for cash or fund its obligations as they come due. Liquidity risk also includes the risk of not being able to liquidate assets in a timely manner at a reasonable price. Difficulty accessing capital markets could impair the Company’s capacity to grow, execute its business model and generate financial returns. Liquidity and capital availability risks are mitigated by maintaining appropriate levels of cash and cash equivalents and short term investments, actively monitoring market conditions, and by diversifying its sources of funding, including its Credit Facility and maintaining a well-diversified maturity profile of its debt and capital obligations. Despite these mitigation strategies, if the Company’s or PC Bank’s financial performance and condition deteriorate or downgrades in the Company’s current credit ratings occur, the Company’s or PC Bank’s ability to obtain funding from external sources may be restricted. In addition, credit and capital markets are subject to inherent risks that may negatively affect the Company’s access and ability to fund its financial and other liabilities. Maturity Analysis The following are the undiscounted contractual maturities of significant financial liabilities as at December 29, 2012:
2013 2014 2015 2016 2017 Thereafter(6) Total
Derivative Financial Liabilities
Interest rate swaps payable(1) $ 6 $ – $ – $ – $ – $ – $ 6
Equity forward contracts(2) 62 – – – – – 62
Foreign exchange forward contracts 78 – – – – – 78
Non-Derivative Financial Liabilities
Short term debt(3) 905 – – – – – 905
Long term debt including fixed interest payments(4) 973 1,237 777 640 284 5,925 9,836
Other liabilities(5) – 35 – 4 – – 39
$ 2,024 $ 1,272 $ 777 $ 644 $ 284 $ 5,925 $ 10,926
(1) Based on the pay fixed interest which will be partially offset by the floating interest received. (2) Based on the average cost base as at December 29, 2012 and includes cumulative accrued interest and unrealized market loss of $16 million. (3) These are obligations owed to independent securitization trusts which are collateralized by the Company’s credit card receivables (see note 10). (4) Based on the maturing face values and annual interest for each instrument, including GICs, long term independent securitization trusts and an independent funding trust,
as well as annual payment obligations for SPEs, mortgages and finance lease obligations. (5) Contractual obligation related to certain other liabilities. (6) Capital securities and their related dividends have been excluded as the Company is not contractually obligated to pay these amounts. The Company also excluded bank
indebtedness, trade payables and other liabilities, which are due within the next 12 months.
Credit Risk The Company is exposed to credit risk resulting from the possibility that counterparties may default on their financial obligations to the Company. Exposure to credit risk relates to derivative instruments, cash and cash equivalents, short term investments, security deposits, PC Bank’s credit card receivables, franchise loans receivable, accounts receivables from franchisees, other receivables from vendors, associated stores and independent accounts and pension assets held in the Company’s defined benefit plans. The risk related to derivative instruments, cash and cash equivalents, short term investments or security deposits is reduced by policies and guidelines that require that the Company only enter into transactions with counterparties or issuers that have a minimum long term “A-” credit rating from a recognized credit rating agency and by placing minimum and maximum limits for exposures to specific counterparties and instruments. The Company’s maximum exposure to credit risk as it relates to derivative instruments is approximated by the positive fair value of the derivatives on the balance sheet (see note 27).

2012 Annual Report – Financial Review 95
PC Bank manages its credit card receivable risk by employing stringent credit scoring techniques and actively monitoring the credit card portfolio, and reviewing techniques and technology that can improve the effectiveness of the collection process. In addition, these receivables are dispersed among a large, diversified group of credit card customers. Franchise loans receivable, accounts receivable from franchisees and other receivables from vendors, associated stores and independent accounts are actively monitored on an ongoing basis and settled on a frequent basis in accordance with the terms specified in the applicable agreements. Refer to note 9 and note 10 for additional information on the credit quality performance of credit card receivables and other receivables from independent franchisees, associated stores and independent accounts. Market Risk Market risk is the loss that may arise from changes in factors such as interest rates, foreign currency exchange rates, commodity prices, common share price and the impact these factors may have on other counterparties. Interest Rate Risk The Company is exposed to fluctuations in interest rates on its floating rate debt and financial instruments net of cash and cash equivalents, short term investments and security deposits. The Company manages interest rate risk by monitoring its respective mix of fixed and floating rate debt, net of cash and cash equivalents, short term investments and security deposits, and taking action as necessary to maintain an appropriate balance considering current market conditions. The Company estimates that a 100 basis point increase (decrease) in short term interest rates, with all other variables held constant, would result in a decrease (increase) of $9 million to interest expense. Foreign Currency Exchange Rate Risk The Company is exposed to foreign currency exchange rate variability, primarily on its USD denominated cash and cash equivalents, short term investments and security deposits held by Glenhuron, foreign denominated and foreign currency based purchases in trade payables and other liabilities, and USPP notes included in long term debt. The Company and Glenhuron have cross currency swaps and foreign currency forward contracts that partially offset their respective exposure to fluctuations in foreign currency exchange rates. Cross currency swaps are transactions in which interest payments and principal amounts in one currency are exchanged against receipt of interest payments and principal amounts in a second currency. Refer to note 27 for the summary of the foreign exchange impact. Commodity Price Risk The Company is exposed to increases in the prices of commodities in operating its stores and distribution networks, as well as the indirect link of commodities to its consumer products. To manage a portion of this exposure, the Company uses purchase commitments for a portion of its needs for certain consumer products that may be commodities based and the Company expects to take delivery of these consumer products in the normal course of business. The Company enters into exchange traded futures contracts and forward contracts to minimize cost volatility relating to energy. The Company estimates that based on the outstanding derivative contracts held by the Company as at December 29, 2012, a 10% decrease in relevant energy prices, with all other variables held constant, would result in a net loss of $2 million on earnings before income taxes. Common Share Price Risk The Company is exposed to common share market price risk as a result of the issuance to certain employees of stock options, to the extent that they are repurchased by the Company on exercise. The Company is also exposed to common share market price risk from its RSU and PSU plans. Both RSUs and PSUs negatively impact operating income when the common share price increases and positively impact operating income when the common share price declines. Glenhuron is a party to an equity forward contract, which allows for settlement in cash, common shares or net settlement. This forward contract changes in value as the market price of the Company’s common shares changes and provides a partial offset to fluctuations in the Company’s RSU and PSU plan expense or income. The impact on the equity forwards of a one dollar increase (decrease) of the market value in the Company’s underlying common share, with all other variables held constant, would result in a $1 million gain (loss) on earnings before income taxes.
Notes to the Consolidated Financial Statements
96 2012 Annual Report – Financial Review
Note 29. Contingent Liabilities The Company is involved in and potentially subject to various claims by third parties arising out of the normal course and conduct of its business including product liability, labour and employment, regulatory and environmental claims. In addition, the Company is involved in and potentially subject to regular audits from federal and provincial tax authorities relating to income, capital and commodity taxes and as a result of these audits may receive assessments and reassessments. Although such matters cannot be predicted with certainty, management currently considers the Company’s exposure to such claims and litigation, to the extent not covered by the Company’s insurance policies or otherwise provided for, not to be material to the consolidated financial statements, but may have a material impact in future periods. Legal Proceedings The Company is the subject of various legal proceedings and claims that arise in the ordinary course of business. The outcome of all of these proceedings and claims is uncertain. However, based on information currently available, these proceedings and claims, individually and in the aggregate, are not expected to have a material impact on the Company. Tax and Regulatory The Company is involved in and potentially subject to tax audits from various governments and regulatory agencies relating to income, capital and commodity taxes on an ongoing basis. As a result, from time to time, taxing authorities may disagree with the positions and conclusions taken by the Company in its tax filings or legislation may be amended, which could lead to assessments and reassessments. These assessments and reassessments may have a material impact on the Company’s financial statements in future periods. During 2012, the Company received indication from the Canada Revenue Agency that it intends to proceed with a reassessment with regard to the tax treatment of the Company’s wholly owned subsidiary, Glenhuron. At this early stage, it is not possible to quantify the amount of the proposed reassessment. While the Company does not expect the ultimate outcome to be material, such matters cannot be predicted with certainty and could result in a material charge for the Company in future periods. Indemnification Provisions The Company from time to time enters into agreements in the normal course of its business, such as service and outsourcing arrangements and leases, in connection with business or asset acquisitions or dispositions. These agreements by their nature may provide for indemnification of counterparties. These indemnification provisions may be in connection with breaches of representation and warranty or with future claims for certain liabilities, including liabilities related to tax and environmental matters. The terms of these indemnification provisions vary in duration and may extend for an unlimited period of time. Given the nature of such indemnification provisions, the Company is unable to reasonably estimate its total maximum potential liability as certain indemnification provisions do not provide for a maximum potential amount and the amounts are dependent on the outcome of future contingent events, the nature and likelihood of which cannot be determined at this time. Historically, the Company has not made any significant payments in connection with these indemnification provisions. Note 30. Financial Guarantees The Company has provided to third parties the following significant guarantees: Independent Funding Trusts The full balance relating to the debt of the independent funding trusts has been consolidated on the balance sheet of the Company as at December 29, 2012 and December 31, 2011. The Company has agreed to provide a credit enhancement of $48 million (2011 – $48 million) in the form of a standby letter of credit for the benefit of the independent funding trusts representing not less than 10% (2011 − 10%) of the principal amount of the loans outstanding. This credit enhancement allows the independent funding trusts to provide financing to the Company’s independent franchisees. As well, each independent franchisee provides security to the independent funding trusts for its obligations by way of a general security agreement. In the event that an independent franchisee defaults on its loan and the Company has not, within a specified time period, assumed the loan, or the default is not otherwise remedied, the independent funding trusts would assign the loan to the Company and draw upon this standby letter of credit. This standby letter of credit has never been drawn upon. The Company has agreed to reimburse the issuing bank for any amount drawn on the standby letter of credit.
2012 Annual Report – Financial Review 97
Independent Securitization Trusts Letters of credit for the benefit of other independent securitization trusts with respect to the securitization programs of PC Bank have been issued by major financial institutions. These standby letters of credit could be drawn upon in the event of a major decline in the income flow from or in the value of the securitized credit card receivables. The Company has agreed to reimburse the issuing banks for any amount drawn on the standby letters of credit. The aggregate gross potential liability under these arrangements, which represents 9% (2011 – 9%) on a portion of the securitized credit card receivables amount, is approximately $81 million (December 31, 2011 – $81 million) (see note 18). The undrawn commitments on the independent securitization trusts as at December 29, 2012 was $120 million (December 31, 2011 – $120 million). Lease Obligations In connection with historical dispositions of certain of its assets, the Company has assigned leases to third parties. The Company remains contingently liable for these lease obligations in the event any of the assignees are in default of their lease obligations. The estimated amount for minimum rent, which does not include other lease related expenses such as property tax and common area maintenance charges, is in aggregate $13 million (December 31, 2011 – $14 million). Additionally, the Company has guaranteed lease obligations of a third party distributor in the amount of $19 million (December 31, 2011 – $17 million). President’s Choice Bank The Company has provided a guarantee on behalf of PC Bank to MasterCard® International Incorporated in the amount of USD $230 million (2011 – USD $180 million) for accepting PC Bank as a card member and licensee of MasterCard®. Other The Company establishes letters of credit used in connection with certain obligations mainly related to real estate transactions, benefit programs, purchase orders and performance guarantees. The aggregate gross potential liability related to these letters of credit, not including the standby letters of credit for the benefit of independent funding trusts and independent securitization trusts, is approximately $348 million (December 31, 2011 − $314 million). Note 31. Related Party Transactions The Company’s parent corporation is Weston, which owns, directly and indirectly, 177,299,889 of the Company’s common shares, representing approximately 63% of the Company’s 281,680,157 outstanding common shares. Mr. W. Galen Weston controls Weston, directly and indirectly through private companies which he controls, including Wittington who owns a total of 80,724,599 of Weston’s common shares, representing approximately 63% of Weston’s 128,220,992 outstanding common shares. Mr. Weston also beneficially owns 3,753,789 of the Company’s common shares, representing approximately 1% (December 31, 2011 – 1%) of the Company’s outstanding common shares. The Company’s policy is to conduct all transactions and settle all balances with related parties on market terms and conditions.
Notes to the Consolidated Financial Statements
98 2012 Annual Report – Financial Review
Transactions with Related Parties Transaction Value
(millions of Canadian dollars) 2012 2011
Cost of Merchandise Inventory Sold
Inventory purchases from a subsidiary of Weston $ 627 $ 646
Inventory purchases from a related party(1) 18 18
Operating Income
Cost sharing agreements with Parent2) 12 10
Net administrative services provided by Parent(3) 17 17
Lease of office space from a subsidiary of Wittington 3 3
(1) Associated British Foods plc is a related party by virtue of Mr. W. Galen Weston being a director of such entity’s parent company. Total balance outstanding owing to Associated
British Foods plc as at December 29, 2012 was $2 million (December 31, 2011 – $2 million).
(2) Weston and the Company have each entered into certain contracts with third parties for administrative and corporate services, including telecommunication services and information technology related matters on behalf of itself and the related party. Through cost sharing agreements that have been established between the Company and Weston concerning these costs, the Company has agreed to be responsible to Weston for the Company’s proportionate share of the total costs incurred.
(3) The Company and Weston have entered into an agreement whereby certain administrative services are provided by one party to the other. The services to be provided under this agreement include those related to commodity management, pension and benefits, tax, medical, travel, information system, risk management, treasury and legal. Payments are made quarterly based on the actual costs of providing these services. Where services are provided on a joint basis for the benefit of the Company and Weston together, each party pays the appropriate proportion of the costs. Fees paid under this agreement are reviewed each year by the Audit Committee.
The net balances due to related parties are comprised as follows:
(millions of Canadian dollars)
As at
December 29, 2012
As at
December 31, 2011
Balance Sheet
Trade payables and other liabilities $ 25 $ 28
Post-Employment Benefit Plans The Company sponsors a number of post-employment plans, which are related parties. Contributions made by the Company to these plans are disclosed in note 24. Income Tax Matters From time to time, the Company, Weston and its affiliates may enter into agreements to make elections that are permitted or required under applicable income tax legislation with respect to affiliated corporations. These elections and accompanying agreements did not have a material impact on the Company. Key Management Personnel The Company’s key management personnel are comprised of the Board and certain members of the executive team of the Company, as well as both the Board and certain members of the executive team of Weston and Wittington to the extent that they have the authority and responsibility for planning, directing and controlling the day-to-day activities of the Company. Compensation of Key Management Personnel Annual compensation of key management personnel that is directly attributable to the Company was as follows:
(millions of Canadian dollars) 2012 2011
Salaries, director fees and other short term employee benefits $ 7 $ 10
Share-based compensation 4 4
Total compensation $ 11 $ 14
Dividend Reinvestment Plan During the year, the Company issued nil (2011 – 938,984) common shares to Weston under the DRIP (see note 21).
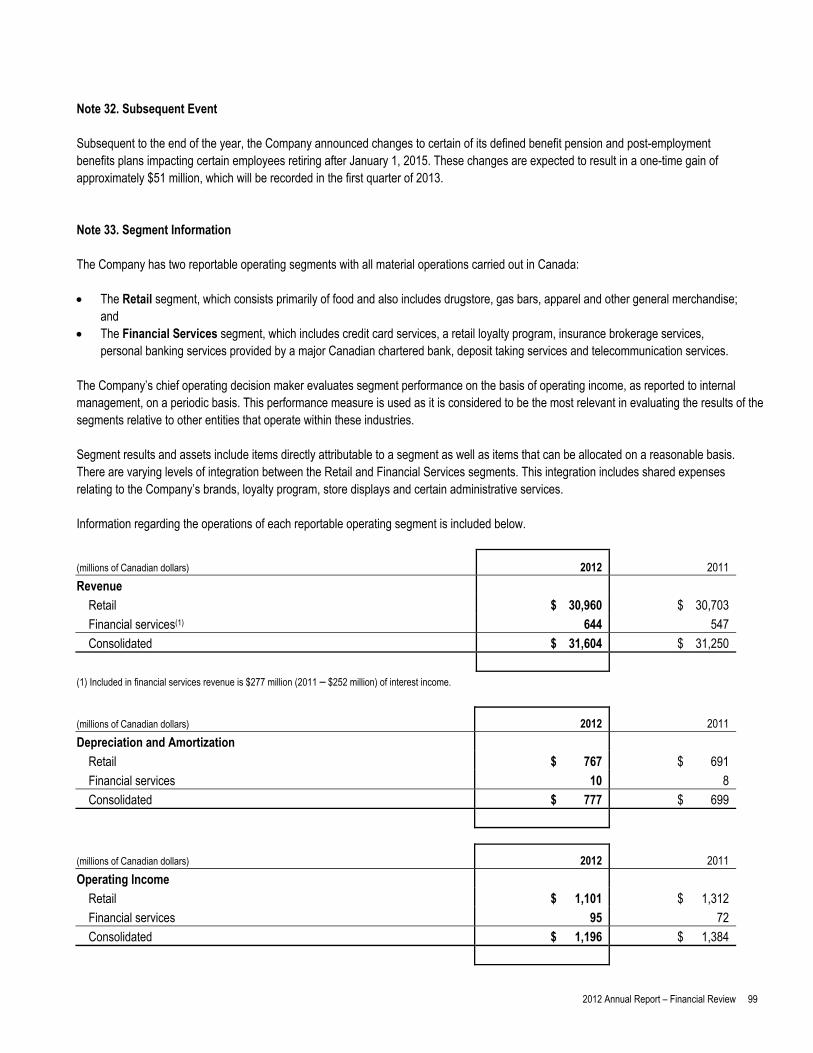
2012 Annual Report – Financial Review 99
Note 32. Subsequent Event Subsequent to the end of the year, the Company announced changes to certain of its defined benefit pension and post-employment benefits plans impacting certain employees retiring after January 1, 2015. These changes are expected to result in a one-time gain of approximately $51 million, which will be recorded in the first quarter of 2013. Note 33. Segment Information The Company has two reportable operating segments with all material operations carried out in Canada: The Retail segment, which consists primarily of food and also includes drugstore, gas bars, apparel and other general merchandise;
and The Financial Services segment, which includes credit card services, a retail loyalty program, insurance brokerage services,
personal banking services provided by a major Canadian chartered bank, deposit taking services and telecommunication services. The Company’s chief operating decision maker evaluates segment performance on the basis of operating income, as reported to internal management, on a periodic basis. This performance measure is used as it is considered to be the most relevant in evaluating the results of the segments relative to other entities that operate within these industries. Segment results and assets include items directly attributable to a segment as well as items that can be allocated on a reasonable basis. There are varying levels of integration between the Retail and Financial Services segments. This integration includes shared expenses relating to the Company’s brands, loyalty program, store displays and certain administrative services. Information regarding the operations of each reportable operating segment is included below.
(millions of Canadian dollars) 2012 2011
Revenue
Retail $ 30,960 $ 30,703
Financial services(1) 644 547
Consolidated $ 31,604 $ 31,250
(1) Included in financial services revenue is $277 million (2011 – $252 million) of interest income.
(millions of Canadian dollars) 2012 2011
Depreciation and Amortization
Retail $ 767 $ 691
Financial services 10 8
Consolidated $ 777 $ 699
(millions of Canadian dollars) 2012 2011
Operating Income
Retail $ 1,101 $ 1,312
Financial services 95 72
Consolidated $ 1,196 $ 1,384
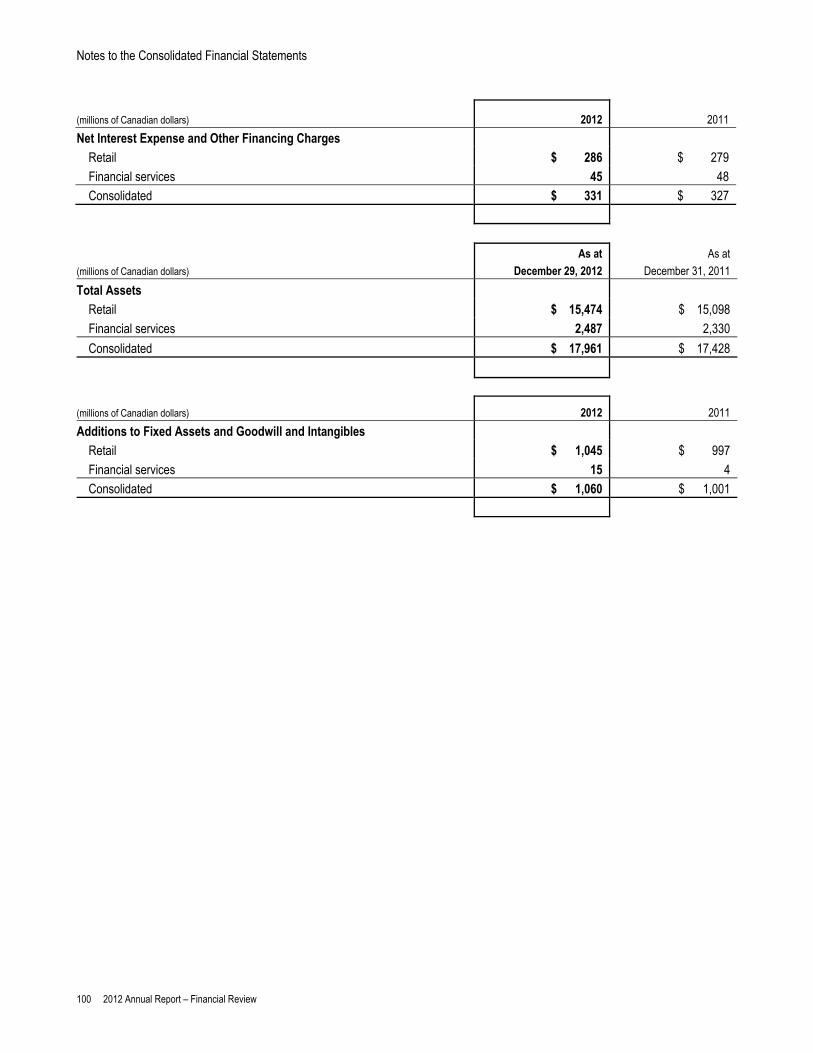
Notes to the Consolidated Financial Statements
100 2012 Annual Report – Financial Review
(millions of Canadian dollars) 2012 2011
Net Interest Expense and Other Financing Charges
Retail $ 286 $ 279
Financial services 45 48
Consolidated $ 331 $ 327
(millions of Canadian dollars) As at
December 29, 2012
As at
December 31, 2011
Total Assets
Retail $ 15,474 $ 15,098
Financial services 2,487 2,330
Consolidated $ 17,961 $ 17,428
(millions of Canadian dollars) 2012 2011
Additions to Fixed Assets and Goodwill and Intangibles
Retail $ 1,045 $ 997
Financial services 15 4
Consolidated $ 1,060 $ 1,001
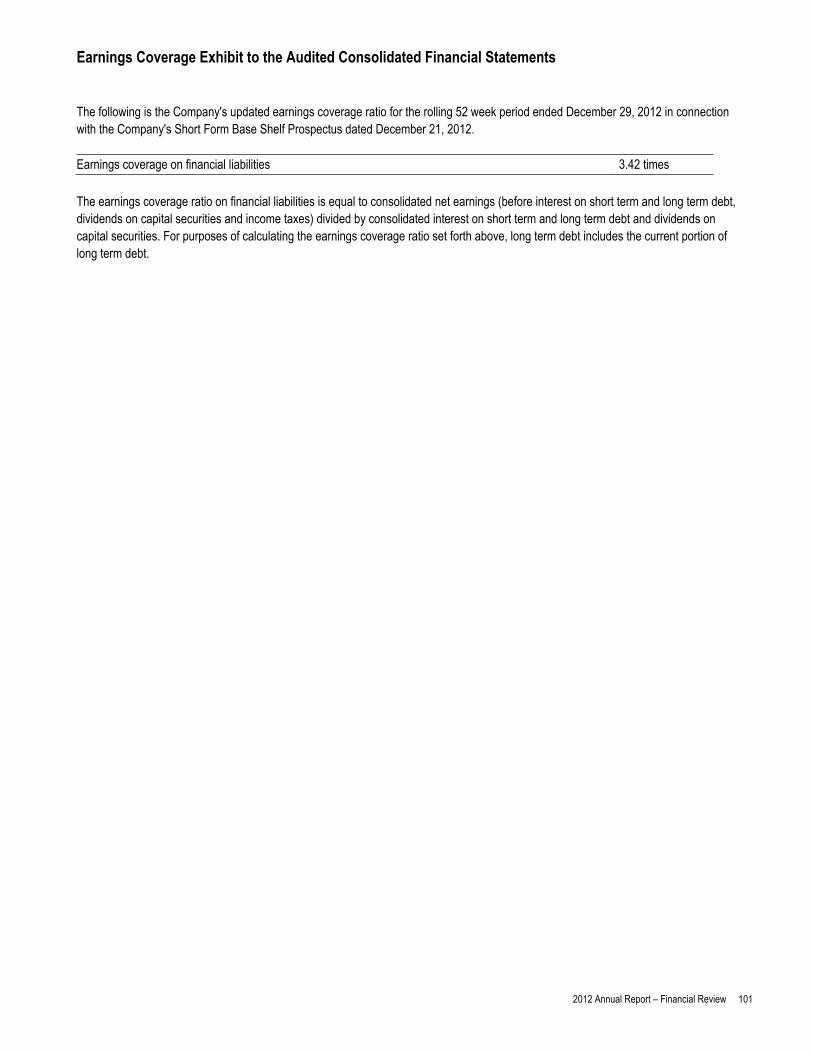
Earnings Coverage Exhibit to the Audited Consolidated Financial Statements
2012 Annual Report – Financial Review 101
The following is the Company's updated earnings coverage ratio for the rolling 52 week period ended December 29, 2012 in connection with the Company's Short Form Base Shelf Prospectus dated December 21, 2012. Earnings coverage on financial liabilities 3.42 times
The earnings coverage ratio on financial liabilities is equal to consolidated net earnings (before interest on short term and long term debt, dividends on capital securities and income taxes) divided by consolidated interest on short term and long term debt and dividends on capital securities. For purposes of calculating the earnings coverage ratio set forth above, long term debt includes the current portion of long term debt.

Three Year Summary(1)
102 2012 Annual Report – Financial Review
For the years ended December 29, 2012, December 31, 2011 and January 1, 2011 2012 2011 2010(2) (millions of Canadian dollars, except where otherwise indicated) (52 weeks) (52 weeks) (52 weeks)
Consolidated Results of Operations Revenue $ 31,604 $ 31,250 $ 30,836 Operating income 1,196 1,384 1,347 EBITDA(3) 1,973 2,083 1,975 Net interest and other financing charges 331 327 353 Net earnings 650 769 675
Consolidated Financial Position Fixed assets $ 8,973 $ 8,725 $ 8,377 Goodwill and intangible assets 1,057 1,029 1,026 Total assets 17,961 17,428 16,841 Adjusted debt(3) 4,360 4,341 4,669 Shareholders’ equity 6,417 6,007 5,603 Consolidated Cash Flow Cash and cash equivalents, short term investments and security deposits 2,047 1,986 1,965 Cash flows from operating activities 1,637 1,814 2,029 Free cash flow(3) 824 931 741 Capital investment(1) 1,017 987 1,190 Consolidated Per Common Share ($) Basic net earnings 2.31 2.73 2.43
Dividend rate at year end 0.85 0.84 0.84 Book value(1) 22.78 21.35 19.97 Market price at year end 42.05 38.48 40.37 Consolidated Financial Measures and Ratios Revenue growth (%) 1.1 1.3 0.3(4) Operating margin(1) (%) 3.8 4.4 4.4
EBITDA margin(3) (%) 6.2 6.7 6.4 Adjusted debt(3) to EBITDA(3) 2.2x 2.1x 2.4x Interest coverage(3) 3.6x 4.2x 3.8x Return on average net assets(1) (%) 10.0 12.0 12.0 Return on average shareholders’ equity(1) (%) 10.5 13.2 12.6 Price/net earnings ratio(1) at year end 18.2 14.1 16.6 Retail Results of Operations Sales 30,960 30,703 30,315 Gross profit 6,819 6,820 6,787 Operating income 1,101 1,312 1,239
Retail Operating Statistics Same-store sales(1) (decline) growth (%) (0.2) 0.9 (0.6) Gross profit percentage (%) 22.0 22.2 22.4 Operating margin(1) (%) 3.6 4.3 4.1 Retail square footage(1) (in millions) 51.5 51.2 50.7 Corporate square footage (in millions) 37.6 37.5 37.3 Franchise square footage (in millions) 13.9 13.7 13.4 Corporate stores sales per average square foot(1) ($) 563 564 563 Number of corporate stores 580 584 576 Number of franchised stores 473 462 451 Percentage of corporate real estate owned (%) 72 72 74 Percentage of franchise real estate owned (%) 45 46 46 Financial Services Results of Operations Revenue 644 547 521
Operating income 95 72 108
Earnings before income taxes 50 24 66
Financial Services Operating Measures and Statistics Average quarterly net credit card receivables 2,105 1,974 1,941 Credit card receivables 2,305 2,101 1,997 Allowance for credit card receivables 43 37 34 Annualized yield on average quarterly gross credit card receivables(1) (%) 12.8 12.5 13.2 Annualized credit loss rate on average quarterly gross credit card receivables(1) (%) 4.3 4.2 5.6
(1) For financial definitions and ratios refer to the Glossary of Terms on page 103.
(2) 2010 comparative figures previously reported in accordance with Canadian generally accepted accounting principles (“CGAAP”) have been restated to conform with International Financial Reporting Standards (“IFRS” or “GAAP”).
(3) See Non-GAAP Financial Measures on page 37 of the Company’s Management Discussion and Analysis.
(4) As compared to 2009 figures reported in accordance with CGAAP.
Glossary of Terms
2012 Annual Report – Financial Review 103
Term Definition
Adjusted debt to EBITDA
Adjusted debt divided by EBITDA (see Non-GAAP Financial Measures on page 37 of the Company’s Management’s Discussion and Analysis).
Adjusted debt
Adjusted debt (see Non-GAAP Financial Measures on page 37 of the Company’s Management’s Discussion and Analysis).
Annual Report
For 2012, the Annual Report consists of a Business Review and a Financial Review.
Annualized credit loss rate on average quarterly gross credit card receivables
Total credit card losses divided by the number of days in the quarter times 365 divided by average quarterly gross credit card receivables.
Annualized yield on average quarterly gross credit card receivables
Interest earned on credit card receivables divided by the number of days in the quarter times 365 divided by average quarterly gross credit card receivables.
Basic net earnings per common share
Net earnings available to common shareholders divided by the weighted average number of common shares outstanding during the year.
Book value per common share
Shareholders’ equity divided by the number of common shares outstanding at year end.
Capital Investment Fixed asset purchases.
Cash flows from operating activities per common share
Cash flows from operating activities divided by the weighted average number of common shares outstanding during the year.
Control label
A brand and associated trademark that is owned by the Company for use in connection with its own products and services.
Conversion
A store that changes from one Company banner to another Company banner.
Corporate stores sales per average square foot
Sales by corporate stores excluding gas bar sales divided by the average corporate stores’ square footage at year end.
Diluted net earnings per common share
Net earnings available to common shareholders divided by the weighted average number of common shares outstanding during the year minus the dilutive impact of outstanding stock option grants, certain other liabilities, equity forwards and capital securities at year end.
Dividend rate per common share at year end
Dividend per common share declared in the fourth quarter multiplied by four.
DRIP Dividend Reinvestment Plan.
EBITDA
Operating income before depreciation and amortization (see Non-GAAP Financial Measures on page 37 of the Company’s Management’s Discussion & Analysis).
EBITDA margin
EBITDA divided by sales (see Non-GAAP Financial Measures on page 37 of the Company’s Management’s Discussion & Analysis).
Free Cash Flow
Cash flows (used in) from operating activities excluding the net change in credit card receivables less fixed asset purchases (see Non-GAAP Financial Measures on page 37 of the Company’s Management’s Discussion and Analysis).
Term Definition Gross profit percentage
Sales less cost of sales including inventory shrink divided by sales.
Interest coverage
Operating income divided by net interest expense and other financing charges adding back interest capitalized to fixed assets (see Non-GAAP Financial Measures on page 37 of the Company’s Management’s Discussion and Analysis).
Major expansion
Expansion of a store that results in an increase in square footage that is greater than 25% of the square footage of the store prior to the expansion.
Minor expansion
Expansion of a store that results in an increase in square footage that is less than or equal to 25% of the square footage of the store prior to the expansion.
New store
A newly constructed store, conversion or major expansion.
Operating income Earnings before net interest expense and other financing
charges and income taxes.
Operating margin Operating income divided by sales. Price/net earnings ratio at year end
Market price per common share at year end divided by basic net earnings per common share for the year.
Renovation
A capital investment in a store resulting in no change to the store square footage.
Retail sales
Combined sales of stores owned by the Company and those owned by the Company’s independent franchisees.
Retail square footage
Retail square footage includes corporate and independent franchised stores.
Return on average net assets
Operating income divided by average total assets excluding cash and cash equivalents, short term investments, security deposits and accounts payable and accrued liabilities (see Non-GAAP Financial Measures on page 37 of the Company’s Management’s Discussion and Analysis).
Return on average shareholders’ equity
Net earnings available to common shareholders divided by average total common shareholders’ equity.
Same-store sales
Retail sales from the same physical location for Canadian stores in operation in that location in both periods being compared by excluding sales from a store that has undergone a conversion or major expansion in the period.
Weighted average common shares outstanding
The number of common shares outstanding determined by relating the portion of time within the year the common shares were outstanding to the total time in that year.
Year
The Company’s fiscal year ends on the Saturday closest to December 31 and is usually 52 weeks in duration, but includes 53 weeks every 5 to 6 years. The years ended December 29, 2012 and December 31, 2011 both contained 52 weeks.

National Head Office and Store Support Centre Loblaw Companies Limited 1 President’s Choice Circle Brampton, Canada L6Y 5S5 Tel: (905) 459-2500 Fax: (905) 861-2206 Internet: http://loblaw.ca Stock Exchange Listing and Symbol The Company’s common shares and second preferred shares are listed on the Toronto Stock Exchange and trade under the symbols “L” and “L.PR.A”, respectively. . Common Shares W. Galen Weston, directly and indirectly, including through his controlling interest in Weston, owns approximately 64% of the Company’s common shares. During 2012, there were 718,544 common shares issued and at year-end 2012, 281,680,157 outstanding common shares were available for public trading. The average daily trading volume of the Company’s common shares for 2012 was 499,774. Preferred Shares At year-end 2012, there were 9,000,000 second preferred shares issued and outstanding and available for public trading. The average daily trading volume of the Company’s second preferred shares for 2012 was 7,941. Trademarks Loblaw Companies Limited and its subsidiaries own a number of trademarks. Several subsidiaries are licensees of additional trademarks. These trademarks are the exclusive property of Loblaw Companies Limited or the licensor and where used in this report are in italics.
Common Dividend Policy During 2012, the Company amended its dividend policy to state: the declaration and payment of dividends and the amount thereof on the Company’s common shares are at the discretion of the Board which takes into account the Company’s financial results, capital requirements, available cash flow, future prospects of the Company’s business and other factors considered relevant from time to time. Common Dividend Dates The declaration and payment of quarterly dividends are made subject to approval by the Board. The anticipated record and payment dates for 2013 are: Record Date Payment Date March 15 April 1 June 15 July 1 September 15 October 1 December 15 December 30 Preferred Share Dividend Dates The declaration and payment of
quarterly dividends are made subject to approval by the Board. The anticipated payment dates for 2013 are: January 31, April 30
July 31 and October 31. Normal Course Issuer Bid The Company has a Normal Course Issuer Bid on the Toronto Stock Exchange. Value of Common Shares For capital gains purposes, the valuation day (December 22, 1971) cost base for the Company is $0.958 per common share. The value on February 22, 1994 was $7.67 per common share.
Investor Relations Shareholders, security analysts and investment professionals should direct their requests to Kim Lee, Vice President, Investor Relations at the Company’s National Head Office or by e-mail at [email protected]. Registrar and Transfer Agent Computershare Investor Services Inc. 100 University Avenue Toronto, Canada M5J 2Y1 Toll free: 1-800-564-6253 (Canada and U.S.) Fax: (416) 263-9394 Toll free fax: 1-888-453-0330 International direct dial: (514) 982-7555 To change your address, eliminate multiple mailings, or for other shareholder account inquiries, please contact Computershare Investor Services Inc.
Additional financial information has been filed electronically with various securities regulators in Canada through the System for Electronic Document Analysis and Retrieval (SEDAR) and with the Office of the Superintendent of Financial Institutions (OSFI) as the primary regulator for the Company’s subsidiary, President’s Choice Bank. Independent Auditors KPMG LLP
Chartered Accountants Toronto, Canada Annual Meeting The 2013 Annual Meeting of Shareholders of Loblaw Companies Limited will be held on Thursday, May 2, 2013 at 11:00am (EST), at the Mattamy Athletic Centre, 50 Carlton Street, Toronto, Canada M5B 1J2 The Company holds an analyst call shortly following the release of its quarterly results. These calls are archived in the Investor Centre section of the Company’s website (www.loblaw.ca).
Prin
ting:
Tra
nsco
ntin
enta
l PLM


LOBLAW.CA
PC.CA
JOEFRESH.CA
PCFINANCIAL.CA
Ce rapport est disponible en français.