Embed Size (px)
Citation preview
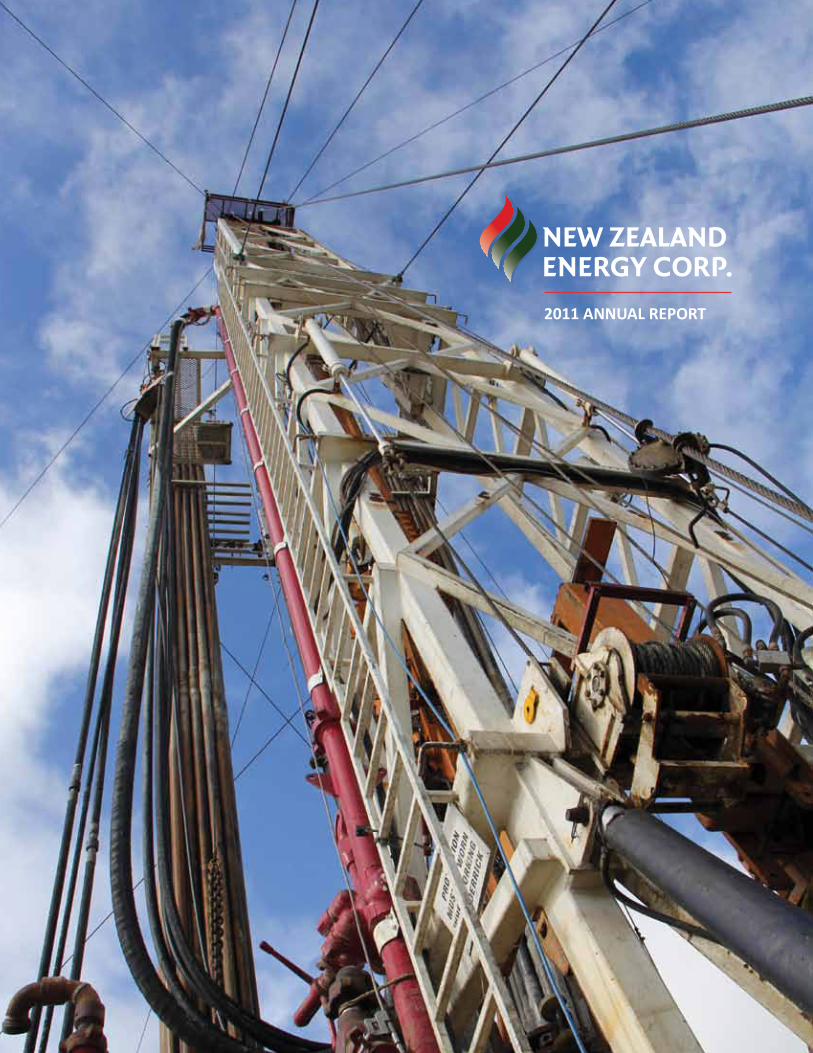
2011 ANNUAL REPORT
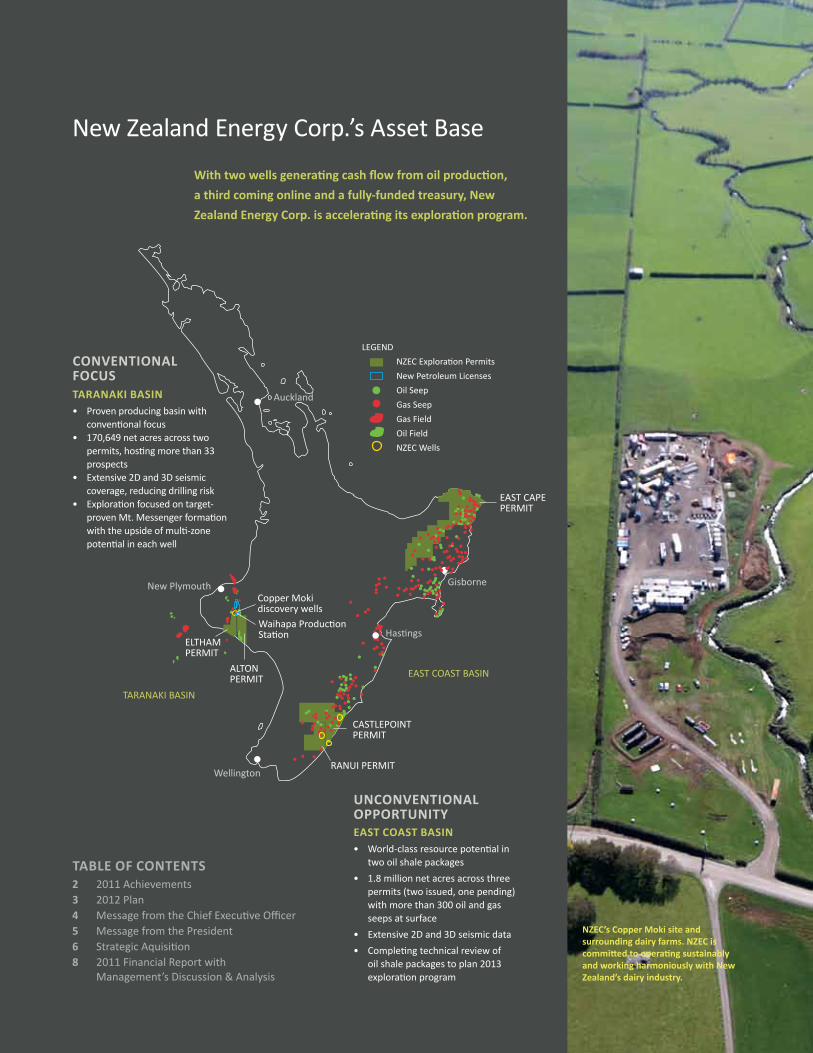
CONVENTIONAL FOCUSTARANAkI BASIN• Provenproducingbasinwith
conventionalfocus• 170,649netacresacrosstwo
permits,hostingmorethan33prospects
• Extensive2Dand3Dseismiccoverage,reducingdrillingrisk
• Explorationfocusedontarget-provenMt.Messengerformationwiththeupsideofmulti-zonepotentialineachwell
UNCONVENTIONAL OPPORTUNITYEAST COAST BASIN• World-classresourcepotentialin
twooilshalepackages
• 1.8millionnetacresacrossthreepermits(twoissued,onepending)withmorethan300oilandgasseepsatsurface
• Extensive2Dand3Dseismicdata
• Completingtechnicalreviewofoilshalepackagestoplan2013explorationprogram
LEGEND
NZECExplorationPermits
NewPetroleumLicenses
OilSeep
GasSeep
GasField
OilField
NZECWells
ELTHAMPERMIT
NewPlymouth
EASTCAPEPERMIT
ALTONPERMIT
CASTLEPOINTPERMIT
RANUIPERMIT
Auckland
Wellington
Hastings
Gisborne
EASTCOASTBASIN
TARANAKIBASIN
With two wells generating cash flow from oil production,
a third coming online and a fully-funded treasury, New
Zealand Energy Corp. is accelerating its exploration program.
NewZealandEnergyCorp.’sAssetBase
TABLE OF CONTENTS2 2011Achievements3 2012Plan4 MessagefromtheChiefExecutiveOfficer5 MessagefromthePresident6 StrategicAquisition8 2011FinancialReportwith
Management’sDiscussion&Analysis
CopperMokidiscoverywellsWaihapaProductionStation
NZEC’s Copper Moki site and surrounding dairy farms. NZEC is committed to operating sustainably and working harmoniously with New Zealand’s dairy industry.

NZEC is producing high-
quality oil from three wells, with the
expectation of bringing additional
wells online in 2012.
NZEC is exploring in a proven
basin with multi-zone potential, and plans to drill a
total of 12 exploration wells in 2012.
NZEC controls 2 million net acres of land across five permits with both
conventional and unconventional targets and a large prospective
reserve/resource base.
NZEC is focused on the growth of its portfolio, reserves, production,
cash flow and share price.
NZEC’s management team has decades
of exploration and operational
experience in the North
American oil and gas industry,
supported by the technical expertise and knowledge of
its in-country team.
NZEC is committed to delivering on milestones and bringing
long-term benefits to its shareholders
and community partners.
OpportunityExpertiseAchievement
LEGENDNZECExplorationPermitsNewPetroleumLicensesGasFieldsOilFieldsNZECWells
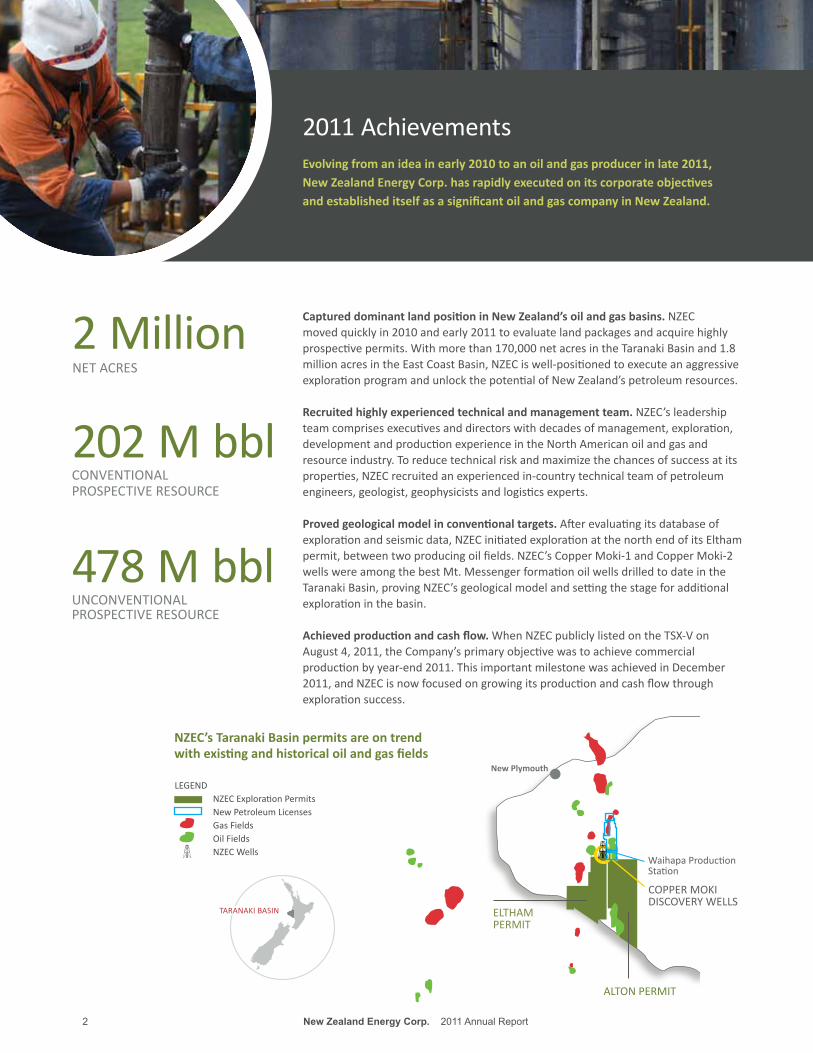
Captured dominant land position in New Zealand’s oil and gas basins. NZECmovedquicklyin2010andearly2011toevaluatelandpackagesandacquirehighlyprospectivepermits.Withmorethan170,000netacresintheTaranakiBasinand1.8millionacresintheEastCoastBasin,NZECiswell-positionedtoexecuteanaggressiveexplorationprogramandunlockthepotentialofNewZealand’spetroleumresources.
Recruited highly experienced technical and management team. NZEC’sleadershipteamcomprisesexecutivesanddirectorswithdecadesofmanagement,exploration,developmentandproductionexperienceintheNorthAmericanoilandgasandresourceindustry.Toreducetechnicalriskandmaximizethechancesofsuccessatitsproperties,NZECrecruitedanexperiencedin-countrytechnicalteamofpetroleumengineers,geologist,geophysicistsandlogisticsexperts.
Proved geological model in conventional targets.Afterevaluatingitsdatabaseofexplorationandseismicdata,NZECinitiatedexplorationatthenorthendofitsElthampermit,betweentwoproducingoilfields.NZEC’sCopperMoki-1andCopperMoki-2wellswereamongthebestMt.MessengerformationoilwellsdrilledtodateintheTaranakiBasin,provingNZEC’sgeologicalmodelandsettingthestageforadditionalexplorationinthebasin.
Achieved production and cash flow.WhenNZECpubliclylistedontheTSX-VonAugust4,2011,theCompany’sprimaryobjectivewastoachievecommercialproductionbyyear-end2011.ThisimportantmilestonewasachievedinDecember2011,andNZECisnowfocusedongrowingitsproductionandcashflowthroughexplorationsuccess.
2Million
202Mbbl
478Mbbl
NETACRES
CONVENTIONALPROSPECTIVERESOURCE
UNCONVENTIONALPROSPECTIVERESOURCE
2011AchievementsEvolving from an idea in early 2010 to an oil and gas producer in late 2011, New Zealand Energy Corp. has rapidly executed on its corporate objectives and established itself as a significant oil and gas company in New Zealand.
New Zealand Energy Corp. 2011 Annual Report 3 2 New Zealand Energy Corp. 2011 Annual Report
NZEC’s Taranaki Basin permits are on trend with existing and historical oil and gas fields
New Plymouth
ALTONPERMIT
ELTHAMPERMIT
COPPERMOKIDISCOVERyWELLS
TARANAKIBASIN
WaihapaProductionStation
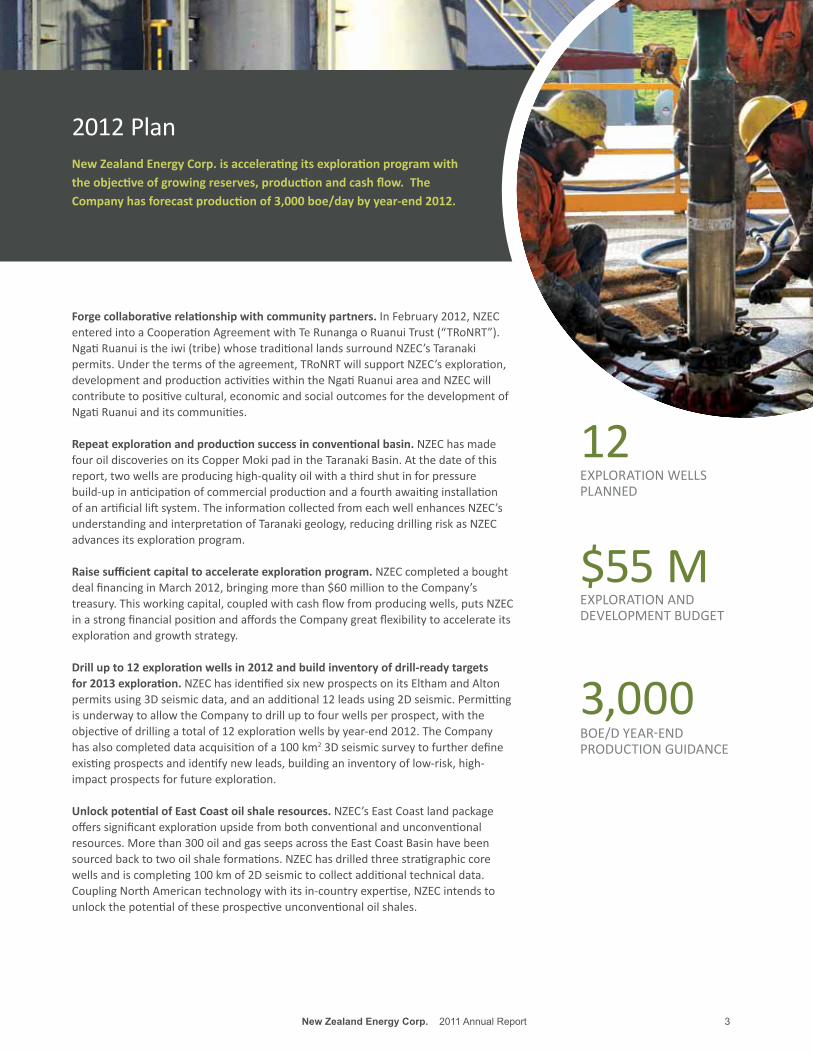
Forge collaborative relationship with community partners. InFebruary2012,NZECenteredintoaCooperationAgreementwithTeRunangaoRuanuiTrust(“TRoNRT”).NgatiRuanuiistheiwi(tribe)whosetraditionallandssurroundNZEC’sTaranakipermits.Underthetermsoftheagreement,TRoNRTwillsupportNZEC’sexploration,developmentandproductionactivitieswithintheNgatiRuanuiareaandNZECwillcontributetopositivecultural,economicandsocialoutcomesforthedevelopmentofNgatiRuanuianditscommunities.
Repeat exploration and production success in conventional basin. NZEChasmadefouroildiscoveriesonitsCopperMokipadintheTaranakiBasin.Atthedateofthisreport,twowellsareproducinghigh-qualityoilwithathirdshutinforpressurebuild-upinanticipationofcommercialproductionandafourthawaitinginstallationofanartificialliftsystem.TheinformationcollectedfromeachwellenhancesNZEC’sunderstandingandinterpretationofTaranakigeology,reducingdrillingriskasNZECadvancesitsexplorationprogram.
Raise sufficient capital to accelerate exploration program.NZECcompletedaboughtdealfinancinginMarch2012,bringingmorethan$60milliontotheCompany’streasury.Thisworkingcapital,coupledwithcashflowfromproducingwells,putsNZECinastrongfinancialpositionandaffordstheCompanygreatflexibilitytoaccelerateitsexplorationandgrowthstrategy.
Drill up to 12 exploration wells in 2012 and build inventory of drill-ready targets for 2013 exploration.NZEChasidentifiedsixnewprospectsonitsElthamandAltonpermitsusing3Dseismicdata,andanadditional12leadsusing2Dseismic.PermittingisunderwaytoallowtheCompanytodrilluptofourwellsperprospect,withtheobjectiveofdrillingatotalof12explorationwellsbyyear-end2012.TheCompanyhasalsocompleteddataacquisitionofa100km23Dseismicsurveytofurtherdefineexistingprospectsandidentifynewleads,buildinganinventoryoflow-risk,high-impactprospectsforfutureexploration.
Unlock potential of East Coast oil shale resources.NZEC’sEastCoastlandpackageofferssignificantexplorationupsidefrombothconventionalandunconventionalresources.Morethan300oilandgasseepsacrosstheEastCoastBasinhavebeensourcedbacktotwooilshaleformations.NZEChasdrilledthreestratigraphiccorewellsandiscompleting100kmof2Dseismictocollectadditionaltechnicaldata.CouplingNorthAmericantechnologywithitsin-countryexpertise,NZECintendstounlockthepotentialoftheseprospectiveunconventionaloilshales.
2012PlanNew Zealand Energy Corp. is accelerating its exploration program with the objective of growing reserves, production and cash flow. The Company has forecast production of 3,000 boe/day by year-end 2012.
New Zealand Energy Corp. 2011 Annual Report 3 2 New Zealand Energy Corp. 2011 Annual Report
COPPERMOKIDISCOVERyWELLS
12
3,000
$55M
EXPLORATIONWELLSPLANNED
BOE/DyEAR-ENDPRODUCTIONGUIDANCE
EXPLORATIONANDDEVELOPMENTBUDGET

MessagefromtheChiefExecutiveOfficer
Fellowshareholders,
Sincewelastreportedtoyouatour2010AGM,NZEChasmadefouroildiscoveries,initiatedcontinuousproductionfromtwowellswithathirdcomingonlineshortly,bookedaprofitablequarterandlaunchedanacquisitionthatisstrategicfrombothanexplorationandinfrastructureperspective.Theseachievementsunderscoretheexpertiseanddedicationofanexceptionallytalentedteamandhavesetthestageforcontinuedgrowthandsuccess.
NZECoffersinvestorsgrowthpotentialfrombothconventionalandunconventionaloilandgasresourcesinasafejurisdiction,atatimewhenresourcecompaniesareenteringincreasinglyriskyregimesintheirquesttoreplacereserves.TheopportunitythatNewZealandpresents,frombothanexplorationandabusinessstandpoint,isextraordinary.NewZealandispoliticallyandfiscallystablewithastrongeconomyandtalentedworkforce.Recognizingthelong-termsocialandeconomicbenefitsofresponsibleoilandgasdevelopment,theNewZealandgovernmenthasestablishedastraightforwardregulatoryenvironmentwithafavourabletaxandroyaltystructure.MillionsofyearsofgeologicalactivityhaveendowedNewZealandwithmultiplehydrocarbon-bearingzonesrichinbothoilandnaturalgas.MajoroilandgascompanieshavebeenexploringandproducinginNewZealandfordecades,yetthecountryremainsveryunderexplored,offeringanoutstandingexplorationopportunity.
NZECwasformedwiththevisionofbecomingaleaderinNewZealand’soilandgasindustry.Wearecommittedtousingindustrybestpracticesacrossallfacetsofourexplorationanddevelopmentprograms.Aspartofourcommitmenttocommunityengagementandsocialresponsibility,NZECforgedaCooperationAgreementwithTeRunangaoNgatiRuanuiTrust(“TRoNRT”),theiwi(tribe)whosetraditionallandssurroundNZEC’sTaranakipermits.TheagreementestablishesacollaborativeworkingrelationshipbetweenNZECandTRoNRT,ensuringsupportforNZEC’sexplorationanddevelopmentactivitieswhilebringinglong-termbenefitstoNgatiRuani’smemberswithtrainingandemploymentopportunities.
EstablishingopencommunicationandmutuallybeneficialrelationshipsisacornerstoneofNZEC’sstrategyforsuccessfulresourcedevelopment,justasenvironmentalresponsibilityisapriorityforthecompanyatallstagesofprojectdevelopment.Recognizingitsobligationtominimizeenvironmentalimpact,NZECintroducedleading-edgetechnologytoNewZealandwithitsrecentlycompleted100km23Dseismicsurvey.Usingindependentbattery-powerednodestocollectdata,insteadofthetraditionalcablenodesystem,significantlyreducedthesurvey’senvironmentalfootprint,reduceddisruptiontofarmersandlivestockandimprovedhealthandsafetyconditionsfortheseismiccrew.NZECwillcontinuetofindopportunitiestoestablishitselfasanindustryleaderforenvironmentallyandsociallyresponsibleresourcedevelopment.
Althoughthecompanyisstillyoung,wearelookingwellaheadtoourfutureandbuildingtheframeworktosupportastrong,profitableoilandgascompany.WecontinuetolookforopportunitiestogrowthecompanyandinMayannouncedplanstoacquirefourpetroleummininglicensesandafull-cycleproductionstationintheheartoftheTaranakiBasin.Thistransactionwillbehighlystrategicfrombothanexplorationandinfrastructurestandpoint,significantlyexpandingourdrillinginventory,allowingustobringwellson-linequicklyfollowingexplorationandcompletionsuccess,andsupportingthecompany’slonger-termgrowthplans.Byacquiringtheonlyopen-accessproductionstationintheTaranakiBasin,wehaveensuredthecapacitytoprocessourownoilandgasproductionatreducedcostswhilebringingbusinessopportunitiesandcashflowtothecompanythroughthird-partyprocessingagreements.Astheteamworkstoincorporatetheseassetsintoourexplorationandbusinessstrategy,IamconfidentwewilldiscoveradditionalsynergiesthatwillcontinuetoaddvalueforNZECshareholders.
WhenIreflectonwhatwehaveachievedinlessthanayear,Iambothproudofoursuccessandexcitedaboutthingsstilltocome.NZEC’ssuccesstodateisatestamenttotheexperienceandhardworkofaskilledanddedicatedteam.Throughdetermination,innovationandcollaboration,wehavebuiltthefoundationforwhatI’msurewillbeaworld-classoilandgascompany.IthankouremployeesfortheirdedicationandvisionandIthankourshareholdersfortheircontinuedsupport.Ilookforwardtoworkingtogethertobuildthefutureofthiscompany.
John ProustChiefExecutiveOfficer&Director
JOHNPROUSTCEO
New Zealand Energy Corp.’s achievements to date underscore the
expertise and dedication of an exceptionally talented team and have
set the stage for continued growth and success.
New Zealand Energy Corp. 2011 Annual Report 5 4 New Zealand Energy Corp. 2011 Annual Report

MessagefromthePresident
Dearshareholders,
WhenwecompletedourpublicofferinginAugust2011,ourprimarygoalwastobuildshareholdervaluebysuccessfullyexploringforoilandtakingthediscoveryintoproduction,anobjectiveachievedinDecember2011atourCopperMoki-1well.CopperMoki-1continuestoflowfromnaturalreservoirpressurefromtheMt.Messengerformation,producinghigh-quality,sweet,lightoilandsignificantamountsofliquids-richnaturalgas.TodatewehavemadethreeconsecutiveMt.Messengerdiscoveries,withtwowellsonproductionandathirdcomingonlinebytheendofJune.WemadeafourthoildiscoveryintheshallowerUrenuiformationandinthedeeperMokiformationconfirmedtwoofthethreeelementsrequiredforanoilandgasdiscovery,withhydrocarbonshowsandevidenceofreservoir-qualityrock.
InformationgainedfromourexplorationsuccesswillguideNZEC’sstrategyaswecontinuetofocusongrowingproductionandcashflowforthebenefitofourshareholders.NZEC’sstrategyistwo-fold,focusedonnear-termdrillingoflower-riskconventionaltargetsintheTaranakiBasincoupledwithfurthertechnicalworkandexploratorydrillingtounlockthepotentialoftheunconventionaloilshaleformationsintheEastCoastBasin.
IntheTaranakiBasin,NZEC’spermitsareon-trendwithmajoroilandgasfieldsthathaveyieldedsignificantproductionfromsixdistinctformations.NZEChasusedthismulti-zoneoptionalitytoestablishahigh-impact,lower-riskexplorationmodelthatprioritizestargetsidentifiedon3Dseismicofferingmulti-zonepotentialineachwell.FollowingthesuccessofourCopperMokidiscoveries,theMt.Messengerformationremainsourprimarytarget,butwefeelthereisgreatpotentialtofindcommerciallyproduciblehydrocarbonsintheshallowerUrenuiformationandthedeeperMokiandKapuniformations.
ExplorationanddevelopmentpotentialinboththeMt.MessengerandMokiformationswasasignificantdrivingforceinNZEC’sdecisiontoacquirefourpetroleummininglicensesfromOriginEnergy,asannouncedinMay.Apreliminaryreviewoflogdatafrom27wellscoupledwith93km2of3Dseismichasidentifiedmorethan30prospectsandleadsonthesefourpetroleumlicenses,significantlyexpandingourdrillinginventory.Withpermits,drillpadsandproductioninfrastructurealreadyinplaceandupholecompletionopportunitiesinexistingwells,thepetroleumlicensesprovidethepotentialforNZECtoaccelerateitsTaranakiexplorationprogram.
NZEChasprovidedproductionguidanceof3,000barrelsofoilequivalentperdaybytheendof2012.Withthreewellsinproductionbytheendthesecondquarterweshouldbeapproximatelyhalfwaytothatgoal.CompletingconstructionofanaturalgaspipelinefromtheCopperMokisitetotheWaihapaProductionStationattheendofJunewillallowNZECtodeliveritsnaturalgasandassociatedliquidstomarket,generatingadditionalcashflowtothecompany.AndinearlyAugustNZECwilllaunchitssecondexplorationcampaign,withtheexpectationofdrillingeightnewwellsbytheendof2012.
OntheEastCoastBasin,NZECiscompletinganextensivetechnicalreview,includingevaluationofthreecoreholesanddataacquisitionof100linekilometresof2Dseismic.NZEC’stechnicalteamcontinuestoincreaseitsunderstandingofthesehighlyprospectiveoilshaleformationstobuildanEastCoastexplorationprogramfor2013.Whilelower-riskconventionalwellsintheTaranakiBasinprovidethebestopportunitytoincreaseproductionandcashflowinthenearterm,webelievetheEastCoastoilshalesoffertremendousupsidetoourshareholders.
NZECoffersthediversityofbothconventionalandunconventionalopportunitiesforourshareholdersandiswellpositionedtounlockthepotentialofNewZealand’spetroleumresources.NZEC’stechnicalteamcontinuestoidentifynewexplorationprospectsonourpermits,expandingNZEC’sdrillinginventoryandprovidinggreatoptionalityforfutureexplorationanddevelopment.Ourobjectivesaretodemonstraterepeatabilityandtosignificantlygrowproductionandcashflow.WelookforwardtoreportingonoursuccessasNZEC’sexplorationprogramunfolds.
Bruce McIntyrePresident&Director
BRUCEMcINTyREPresident
New Zealand Energy Corp. offers the diversity of both conventional and
unconventional opportunities for its shareholders and is well-positioned
to unlock the potential of New Zealand’s petroleum resources.
New Zealand Energy Corp. 2011 Annual Report 5 4 New Zealand Energy Corp. 2011 Annual Report
When we completed our public offering in August 2011, our primary goal was to build shareholder value by successfully exploringfor oil and taking the discovery into production, an objective achieved in December 2011 at our Copper Moki-1 well. Copper Moki-1 continues to flow from natural reservoir pressure from the Mt. Messenger formation, producing high-quality, sweet, light oil andsignificant amounts of liquids-rich natural gas. To date we have made three consecutive Mt. Messenger discoveries, with two wellson production and a third coming online toward the end of June. We made a fourth oil discovery in the shallower Urenui formation and in the deeper Moki formation confirmed two of the three elements required for an oil and gas discovery, with hydrocarbon shows and evidence of reservoir-quality rock.
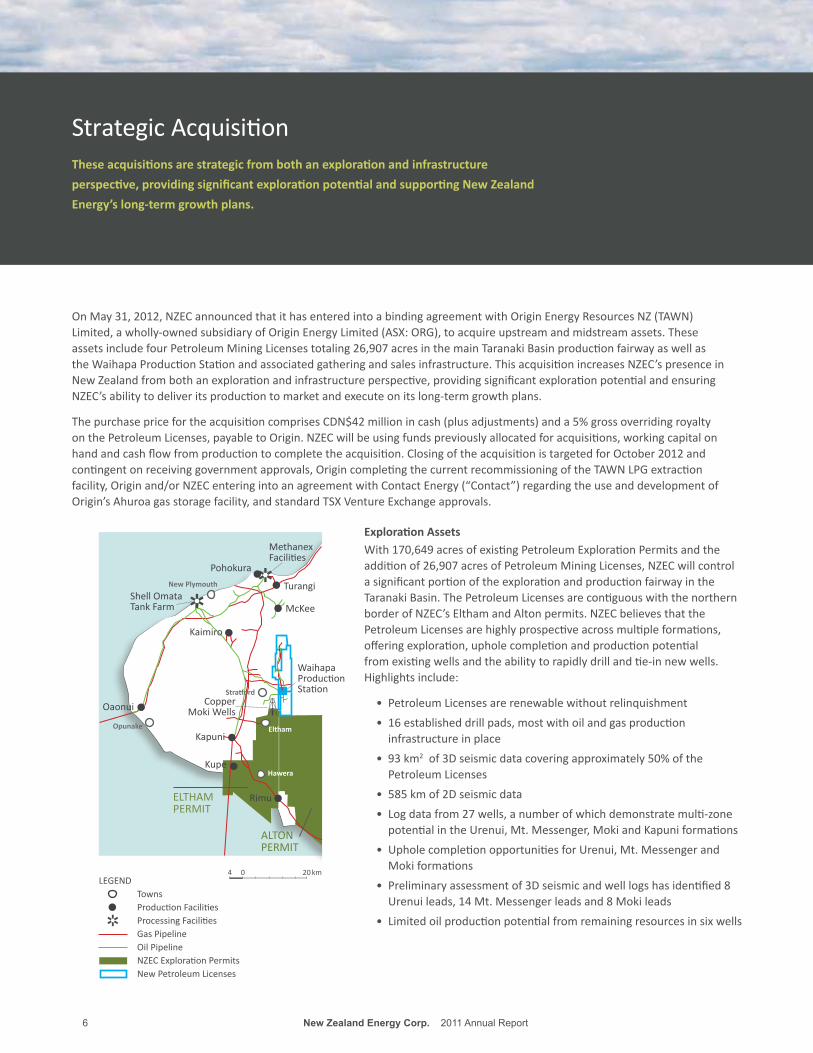
StrategicAcquisition
OnMay31,2012,NZECannouncedthatithasenteredintoabindingagreementwithOriginEnergyResourcesNZ(TAWN)Limited,awholly-ownedsubsidiaryofOriginEnergyLimited(ASX:ORG),toacquireupstreamandmidstreamassets.TheseassetsincludefourPetroleumMiningLicensestotaling26,907acresinthemainTaranakiBasinproductionfairwayaswellastheWaihapaProductionStationandassociatedgatheringandsalesinfrastructure.ThisacquisitionincreasesNZEC’spresenceinNewZealandfrombothanexplorationandinfrastructureperspective,providingsignificantexplorationpotentialandensuringNZEC’sabilitytodeliveritsproductiontomarketandexecuteonitslong-termgrowthplans.
ThepurchasepricefortheacquisitioncomprisesCDN$42millionincash(plusadjustments)anda5%grossoverridingroyaltyonthePetroleumLicenses,payabletoOrigin.NZECwillbeusingfundspreviouslyallocatedforacquisitions,workingcapitalonhandandcashflowfromproductiontocompletetheacquisition.ClosingoftheacquisitionistargetedforOctober2012andcontingentonreceivinggovernmentapprovals,OrigincompletingthecurrentrecommissioningoftheTAWNLPGextractionfacility,Originand/orNZECenteringintoanagreementwithContactEnergy(“Contact”)regardingtheuseanddevelopmentofOrigin’sAhuroagasstoragefacility,andstandardTSXVentureExchangeapprovals.
These acquisitions are strategic from both an exploration and infrastructure
perspective, providing significant exploration potential and supporting New Zealand
Energy’s long-term growth plans.
6 New Zealand Energy Corp. 2011 Annual Report New Zealand Energy Corp. 2011 Annual Report 7
Exploration AssetsWith170,649acresofexistingPetroleumExplorationPermitsandtheadditionof26,907acresofPetroleumMiningLicenses,NZECwillcontrolasignificantportionoftheexplorationandproductionfairwayintheTaranakiBasin.ThePetroleumLicensesarecontiguouswiththenorthernborderofNZEC’sElthamandAltonpermits.NZECbelievesthatthePetroleumLicensesarehighlyprospectiveacrossmultipleformations,offeringexploration,upholecompletionandproductionpotentialfromexistingwellsandtheabilitytorapidlydrillandtie-innewwells.Highlightsinclude:
• PetroleumLicensesarerenewablewithoutrelinquishment
• 16establisheddrillpads,mostwithoilandgasproductioninfrastructureinplace
• 93km2of3Dseismicdatacoveringapproximately50%ofthePetroleumLicenses
• 585kmof2Dseismicdata
• Logdatafrom27wells,anumberofwhichdemonstratemulti-zonepotentialintheUrenui,Mt.Messenger,MokiandKapuniformations
• UpholecompletionopportunitiesforUrenui,Mt.MessengerandMokiformations
• Preliminaryassessmentof3Dseismicandwelllogshasidentified8Urenuileads,14Mt.Messengerleadsand8Mokileads
• Limitedoilproductionpotentialfromremainingresourcesinsixwells
0 204 kmLEGEND
TownsProductionFacilitiesProcessingFacilitiesGasPipelineOilPipelineNZECExplorationPermitsNewPetroleumLicenses
Kapuni
Oaonui
McKee
Turangi
Pohokura
ShellOmataTankFarm
MethanexFacilities
Kupe
RimuELTHAMPERMIT
New Plymouth
Opunake
WaihapaProductionStation
ALTONPERMIT
Hawera
Eltham
Stratford
Kaimiro
CopperMokiWells
93 km2

6 New Zealand Energy Corp. 2011 Annual Report New Zealand Energy Corp. 2011 Annual Report 7
Production and Infrastructure AssetsOwningtheWaihapaProductionStationwillgiveNZECstrategiccontrolovergathering,processingandsalesinfrastructureintheTaranakiBasinandprovideNZECwiththeabilitytoquicklybringonnear-termproductionadditions,reducefull-cycledevelopmentleadtimesandexecuteonlonger-termgrowthplans.Inaddition,astheonlyopen-accessmidstreamfacilityintheTaranakiBasin,theWaihapaProductionStationoffersbusinessopportunitiesforprocessingthird-partygas,liquids,oilandwater.TheWaihapaProductionStationandassociatedinfrastructureincludes:
• a45mmcf/dgasprocessing,gascompressionandLPGextractionfacility
• a51-km8-inchgassalespipelinefromtheWaihapaProductionStationtotheStratfordGasPowerGenerationPlantthenterminatinginNewPlymouth
• 59kmofoil/gasmixedproductpipelinesincludinggasliftlines
• storagetanksforLNG,butaneandpropane
• a25,000bbl/doilprocessingfacility
• 7,800bbloilstoragecapacity
• a49-km15,500bbl/doilsalespipelinefromtheWaihapaProductionStationtotheShellOmataTankFarm
• an18,000bbl/dwaterdisposalprocessingsystem
• variouscontractsforoilandgasprocessing
• 100acresofbufferfieldssurroundingtheWaihapaProductionStation

2011FinancialReportwith Management’sDiscussion&Analysis
New Zealand Energy Corp.
Year Ended December 31, 2011Management’s Discussion and Analysis
(Expressed in Canadian Dollars)
Management’s Discussion & Analysis
10 New Zealand Energy Corp. Year Ended December 31, 2011
This Management’s Discussion and Analysis (“MD&A”) should be read in conjunction with the audited consolidated financial statements of New Zealand Energy Corp. (“NZEC” or the “Corporation”) for the year ended December 31, 2011, as publicly filed on the System for Electronic Document Analysis and Retrieval (“SEDAR”) website at www.sedar.com.
NZEC reports in accordance with International Financial Reporting Standards as issued by the International Accounting Standards Board (“IFRS”) and the following disclosure, and associated condensed consolidated interim financial statements, are presented in accordance with IFRS. This MD&A is prepared as of April 25, 2012 and includes certain statements that may be deemed “forward-looking statements”. All amounts are in Canadian dollars unless otherwise noted.
NZEC’s shares are listed on the TSX Venture Exchange under the symbol “NZ” and on the OTCQX International Exchange under the symbol “NZERF”. Additional information is available on SEDARand on the Corporation’s website at www.newzealandenergy.com.
DESCRIPTION OF BUSINESS
NZEC, through its wholly-owned subsidiaries (collectively “NZEC” or “the Corporation”) is engaged in the production, exploration and development of oil and natural gas resources in New Zealand’sNorth Island. The Corporation’s major assets (the “Properties”) consist of the following Petroleum Exploration Permits (“PEPs”): located in the Taranaki Basin, a 100% interest in PEP 51150 (the “Eltham Permit”) and a 50% interest in PEP 51151 (the “Alton Permit”) (NZEC has entered into an agreement with L&M Energy Limited (“L&M”) to increase its interest in the Alton permit from 50% to 65%, and expects to complete its obligations and earn the additional 15% interest in Q3-2012); and located in the East Coast Basin, a 100% interest in PEP 52694 (the “Castlepoint Permit”), a 100% interest in PEP 38342 (the “Ranui Permit”) and a 100% interest in PEP 52976 (the “East Cape Permit”) pending the grant of that permit by New Zealand’s Minister of Energy. The application for the East Cape Permit is uncontested and the Corporation expects the permit to be granted upon completion of Crown Minerals’ review of the application.
NZEC has drilled five exploration wells in the Taranaki Basin, one on the Alton Permit and four from the Copper Moki pad on the Eltham Permit. Copper Moki-1 and Copper Moki-2 are currently in production. Copper Moki-3 and Copper Moki-4 will be completed and tested in Q2-2012.
APPROACH TO BUSINESS
New Zealand offers a unique opportunity to develop hydrocarbon resources in multiple underexplored onshore and offshore sedimentary basins. All of the current production is derived from the Taranaki Basin in conventional targets using vertical wells and limited enhanced technology. Despite highly prospective geology, New Zealand remains vastly underexplored. All of the wells drilled in the past 60 years are equivalent in number to approximately two weeks of vigorous drilling activity in western Canada. With its stable geopolitical setting and supportive fiscal regime, favourable government policies and tremendous resource potential, New Zealand offers an exciting oil and gas development opportunity with the backdrop of strong crude oil prices.
NZEC has chosen to focus its activities in New Zealand and has developed a business model withfour main steps: identifying high-quality assets on trend with oil and gas producing fields and executing strategic acquisitions or farm-in agreements; developing local partnerships through open communication and collaboration; prioritizing exploration leads identified on 3D seismic with multiple prospective formations; growing reserves, production and cash flow with oil-focused exploration success.
Management’s Discussion & Analysis
New Zealand Energy Corp. Year Ended December 31, 2011 11
NZEC’s near-term exploration and production activities are focused in the Taranaki Basin, with two wells currently producing from the Mt. Messenger formation. NZEC’s Taranaki permits are on trend with numerous oil and gas producing fields, some of which have been producing for decades, and the Taranaki Basin offers multi-zone potential from drill-proven formations. NZEC’s Taranaki exploration strategy is to prioritize drilling of wells based on 3D seismic that have well-defined, lower-risk Mt. Messenger targets coupled with additional exploration potential from the Urenui, Moki, Tikorangi and Kapuni formations.
In the East Coast Basin, 300 oil and gas seeps have been sourced back to two oil shale formations, the Waipawa and the Whangai. Historical exploration in the basin has been focused on conventional Miocene sands sitting above the oil shales. NZEC’s goal is to unlock the potential of the oil shale formations using modern technology.
NZEC is committed to meeting the highest environmental standards and bringing long-term benefits to the communities in which it works.
FINANCIAL SNAPSHOT
For the year ended December 31, 2011
For the year ended December 31, 2010
ProductionSales
11,623 bbl*9,567 bbl
NilNil
PriceProduction costsRoyaltiesNet revenue
106.83 $/bbl23.44 $/bbl4.96 $/bbl
78.43 $/bbl
NilNilNilNil
RevenueTotal comprehensive lossInterest incomeLoss per share – basic and dilutedCurrent assetsTotal assetsTotal liabilitiesShareholders’ equity
$
$
974,517(6,655,829)
119,583(0.08)
19,293,34531,152,8041,383,376
29,769,428
$
$
Nil(10,338,136)
Nil(0.24)
6,229,6506,301,322
371,9585,929,364
* The abbreviation bbl means barrel or barrels.
On December 10, 2011, the Corporation commenced continuous production from its Copper Moki-1well and as such began to recognize revenue from this period. Incidental revenue generated during the start-up and testing phase of the well was treated as a cost recovery of the capitalized well development costs. During the period year December 31, 2011, the Corporation produced and sold 8,603 barrels of oil during the Copper Moki-1 start-up and testing phase for total recoveries of $950,440. The aggregate volume of oil produced during the year was 20,226 barrels.
During the start-up and testing for Copper Moki-1, the Corporation incurred various one-off costs to commission the well, resulting in a netback of $78.43/bbl for the initial production period to December 31,2011. First quarter 2012 netback numbers are in excess of $90.
Management’s Discussion & Analysis
12 New Zealand Energy Corp. Year Ended December 31, 2011
RECENT DEVELOPMENTS
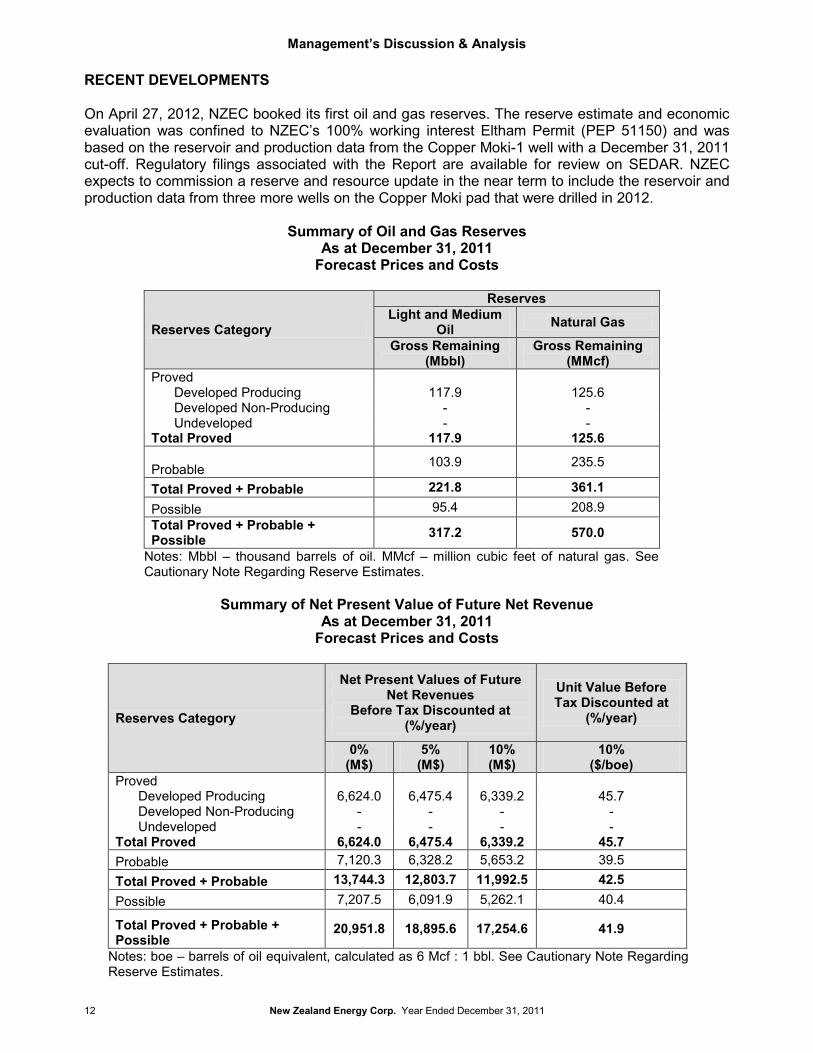
On April 27, 2012, NZEC booked its first oil and gas reserves. The reserve estimate and economic evaluation was confined to NZEC’s 100% working interest Eltham Permit (PEP 51150) and was based on the reservoir and production data from the Copper Moki-1 well with a December 31, 2011 cut-off. Regulatory filings associated with the Report are available for review on SEDAR. NZEC expects to commission a reserve and resource update in the near term to include the reservoir andproduction data from three more wells on the Copper Moki pad that were drilled in 2012.
Summary of Oil and Gas ReservesAs at December 31, 2011
Forecast Prices and Costs
Reserves Category
ReservesLight and Medium
Oil Natural Gas
Gross Remaining(Mbbl)
Gross Remaining(MMcf)
ProvedDeveloped Producing 117.9 125.6Developed Non-Producing - -Undeveloped - -
Total Proved 117.9 125.6
Probable 103.9 235.5
Total Proved + Probable 221.8 361.1Possible 95.4 208.9Total Proved + Probable + Possible 317.2 570.0
Notes: Mbbl – thousand barrels of oil. MMcf – million cubic feet of natural gas. See Cautionary Note Regarding Reserve Estimates.
Summary of Net Present Value of Future Net RevenueAs at December 31, 2011
Forecast Prices and Costs
Reserves Category
Net Present Values of Future Net Revenues
Before Tax Discounted at (%/year)
Unit Value Before Tax Discounted at
(%/year)
0%(M$)
5%(M$)
10%(M$)
10%($/boe)
ProvedDeveloped Producing 6,624.0 6,475.4 6,339.2 45.7Developed Non-Producing - - - -Undeveloped - - - -
Total Proved 6,624.0 6,475.4 6,339.2 45.7Probable 7,120.3 6,328.2 5,653.2 39.5Total Proved + Probable 13,744.3 12,803.7 11,992.5 42.5Possible 7,207.5 6,091.9 5,262.1 40.4
Total Proved + Probable +Possible
20,951.8 18,895.6 17,254.6 41.9
Notes: boe – barrels of oil equivalent, calculated as 6 Mcf : 1 bbl. See Cautionary Note Regarding Reserve Estimates.
Management’s Discussion & Analysis
New Zealand Energy Corp. Year Ended December 31, 2011 13
On April 24, 2012, NZEC entered into a drilling agreement with Ensign International Energy Services Pty Ltd (“Ensign”) pursuant to which Ensign has committed to drill three exploration wells for NZEC, with the option for up to five additional wells, in the second half of 2012.
On April 1, 2012, NZEC commenced continuous production from its Copper Moki-2 well. Copper Moki-2 flowed 14,825 barrels of oil and 15,352 thousand cubic feet (“Mcf”) of natural gas during a 16-day flow test in February and was subsequently shut-in for pressure build-up before commencing production in April. The well is currently producing from natural reservoir pressure out of the Mt. Messenger formation at an average rate of 581 barrels of oil per day (“bbl/d”) and 1,530Mcf of natural gas per day (“Mcf/d”) through a 24/64th inch choke.
On March 21, 2012, NZEC closed a bought deal financing and over-allotment for gross proceeds of $63,480,000. Through a syndicate of underwriters led by Canaccord Genuity Corp. and including Macquarie Capital Markets Canada Ltd., Mackie Research Capital Corporation, PI Financial Corp. and Haywood Securities Inc., NZEC issued 21,160,000 common shares at a price of $3.00 per common share. The Underwriters elected to exercise their over-allotment option in full. Net proceeds will be used to explore and develop NZEC’s oil and gas properties, for additional geologic and technical studies, and for other general corporate purposes.
On February 22, 2012, the Company provided year-end production guidance of 3,000 boe/d.
On February 22, 2012, NZEC entered into a Cooperation Agreement with Te Runanga o Ngati Ruanui Trust (“TRoNRT”), the iwi (tribe) located in South Taranaki near NZEC’s Alton and Eltham permits. Under the terms of the agreement, TRoNRT will support NZEC’s exploration, development and production activities within the Ngati Ruanui area and NZEC will contribute to positive cultural, economic and social outcomes for the development of Ngati Ruanui and its communities. NZEC and TRoNRT have agreed to establish clear process and communication protocols and to share relevant environmental and technical information. TRoNRT will provide relevant cultural advice and support as NZEC moves through the resource consent, permitting and development process. In addition, NZEC will provide a right of first opportunity to TRoNRT’s members for business, employment, educational and training opportunities in South Taranaki. The Cooperation Agreement outlines the parties’ desire to build a sustainable and enduring relationship that promotes the activities and prosperity of NZEC while developing a sustaining and prosperous environment for TRoNRT.
On February 21, 2012, NZEC entered into an agreement with L&M Energy Limited (“L&M”) to increase its interest in the Alton Permit from 50% to 65%. NZEC will earn the additional 15% by funding the collection and processing of 3D seismic data over approximately 50 km2 of the permit. NZEC is the operator of the permit.
On February 6, 2012, NZEC reached target depth of 1,441 metres in its Ranui-2 well on its 100%working interest Ranui Permit in the East Coast Basin, collecting open hole log data and coring the Whanghai shale formation across three intervals.
On December 20, 2011, NZEC commenced trading on the OTCQX International under the symbol “NZERF”.
On December 10, 2011, NZEC commenced continuous production from its Copper Moki-1 well in the Taranaki Basin. Copper Moki-1 continues to flow from natural reservoir pressure; production rates have averaged 424 bbl/d and 1,058 Mcf/d since commencing continuous production. Over the last 30 days, CM-1 has produced at an average rate of 309 bbl/d and 1,205 Mcf/d through a 24/64th inch choke.
Management’s Discussion & Analysis
14 New Zealand Energy Corp. Year Ended December 31, 2011
PROPERTY REVIEW
Taranaki Basin
The Taranaki Basin is situated on the west coast of the North Island and is currently New Zealand’s only oil and gas producing basin, producing approximately130,000 boe/day from 18 fields. Within the Taranaki Basin, NZEC has acquired the following PEPs:
• On March 3, 2011, New Zealand’s Minister of Energy granted an assignment of the Eltham Permit to NZEC. The Eltham Permit covers approximately 92,467 acres (374 km2) of which approximately 31,877 acres (129 km2) are offshore in shallow water.
• On June 24, 2011, NZEC entered into the Alton Agreement with AGL pursuant to which the Corporation agreed to acquire a 50% interest in the Alton Permit and associated joint venture with L&M, which owns the other 50% of the permit. Approval for the assignment of the 50% interest was granted on October 4, 2011. The Alton Permit is adjacent to the Eltham Permit and covers approximately 119,203 acres (482 km2). On February 21, 2012, NZEC entered into a subsequent agreement with L&M whereby NZEC can increase its interest in to the Alton Permit to 65% by funding the collection and processing 3D seismic data over approximately 50 km2 of the permit.
NZEC has drilled five exploration wells in the Taranaki Basin, one on the Alton Permit and four from the Copper Moki pad on the Eltham Permit. Copper Moki-1 and Copper Moki-2 are currently in production. Copper Moki-3 and Copper Moki-4 will be completed and tested in Q2-2012.
Production
NZEC’s Copper Moki-1 well has been flowing from natural reservoir pressure since December 10, 2011 and has produced more than 67,000 barrels of oil since it was first tested in August 2011. Production rates have averaged 424 bbl/d and 1,058 Mcf/d since commencing continuous production in December 2011. Over the last 30 production days, Copper Moki-1 has produced at an average rate of 309 bbl/d and 1,205 Mcf/d through a 24/64th inch choke.
Copper Moki-2 flowed 14,825 barrels of oil and 15,352 Mcf of natural gas during a 16-day flow test in February and was subsequently shut-in for pressure build-up. NZEC initiated continuous production from Copper Moki-2 on April 1, 2012. The well is currently producing from natural reservoir pressure out of the Mt. Messenger formation at an average rate of 581 bbl/d and 1,530Mcf/d through a 24/64th inch choke.
Natural gas and associated natural gas liquids are being flared until the Corporation completes a 2.6-km pipeline and associated production and sales agreements, with the pipeline scheduled for completion by the end of Q2-2012.
Exploration
Copper Moki-3 reached target depth at 3,167 metres in mid-March and is the Corporation’s first well drilled through to NZEC’s deeper exploration target, the Moki formation. After evaluation, the Corporation identified 12 metres of net pay within the Mt. Messenger formation and 15 metres of net pay within the Moki formation. NZEC brought a service rig to site and commenced completion of Copper Moki-3 on April 25, 2012.
Copper Moki-4 reached target depth of 2,125 metres on April 10, 2012. After evaluation, the Corporation has decided to perforate and test both the Urenui and Mt. Messenger formations, and will commence completion activities after perforating the Moki formation in Copper Moki-3.
Management’s Discussion & Analysis
New Zealand Energy Corp. Year Ended December 31, 2011 15
East Coast Basin
The East Coast Basin of New Zealand’s North Island hosts two highly prospective shale formations, the Waipawa and Whangai, which are the source of more than 300 oil and gas seeps. Within the East Coast Basin, the following PEPs have been, or are in the process of being, acquired:
• On September 3, 2010, NZEC applied to the Minister of Energy for the East Cape Permit. The application is uncontested and the Corporation expects the East Cape Permit to be granted to NZEC upon completion of Crown Mineral’s review of the application. The East Cape Permit covers approximately 1,067,495 onshore acres (4,320 km2) on the northeast tip of the North Island.
• On November 24, 2010, the Minister of Energy granted the Castlepoint Permit to NZEC. The Castlepoint Permit covers approximately 551,042 onshore acres (2,230 km2).
• On February 22, 2011, NZEC entered into a permit acquisition agreement with Discovery Geo, pursuant to which Discovery Geo agreed to assign its 100% interest in the Ranui Permit to NZEC upon completion of certain conditions. Those conditions have been completed and approval for assignment of the permit was granted on June 27, 2011. The Ranui Permit is adjacent to the Castlepoint Permit and covers approximately 223,087 acres (903 km2). The Corporation has completed the geophysical and geochemical studies required to re-enter the Ranui-1 well.
NZEC has completed the coring of two test holes on its 100% working interest Castlepoint Permit. The Orui (125 metres total depth) and Te Mai (195 metres total depth) collected data across the Waipawa and Whangai shales. NZEC also completed a test hole on its 100% working interest Ranui Permit. Ranui-2 was drilled to 1,440 metres, coring the Whangai shale across several intervals.
OUTLOOK
Taranaki Basin
With two wells in production, NZEC is focused on growing reserves, production and cash flow by testing Copper Moki-3 and Copper Moki-4 and executing an aggressive exploration program.
Since Copper Moki-3 is NZEC’s first well to be drilled to the Moki formation, the Corporation plans to thoroughly evaluate the characteristics of the formation in order to guide its exploration strategy for future Moki targets. Upon perforation, NZEC’s technical team will determine if the formation flows naturally. If further stimulation is required, additional time will be needed to allow for a comprehensive evaluation of the Moki formation. Once the Moki formation is fully assessed the Corporation will determine whether the Mt. Messenger formation will be tested in Copper Moki-3 or advanced through an additional well.
NZEC will complete and test Copper Moki-4 once the service rig has finished completion operations with respect to the Moki formation of Copper Moki-3. If successful, both wells will be tied into the existing production facilities at the Copper Moki pad.
NZEC will shortly begin construction of an approximately 2.6-km natural gas pipeline that will deliver natural gas from the Copper Moki site to a gas production facility. The pipeline is targeted for completion at the end of Q2-2012. NZEC is currently producing approximately 2,630 Mcf/d of natural gas.
Management’s Discussion & Analysis
16 New Zealand Energy Corp. Year Ended December 31, 2011
NZEC has identified six prospects on 3D seismic similar to Copper Moki, with the expectation of establishing one pad per prospect with two to four wells per pad. NZEC has also identified 12 leads on 2D seismic that will be further defined with the ongoing 3D seismic survey.
With a fully-funded treasury, NZEC is evaluating opportunities to accelerate its exploration program,including drilling additional wells which may target the deeper Tikorangi and Kapuni formations.While previous guidance was for six wells in the Taranaki Basin, NZEC has entered into a rig contract to drill up to eight wells in the second half of 2012. NZEC also has the ability to move quickly should the team identify a strategic acquisition, partnership or farm-in opportunity.
NZEC is completing a 100-km2 3D seismic program over the northern region of the Eltham and Alton permits. Preparation for the seismic survey is nearly complete and NZEC intends to initiate the 30-day data acquisition process in early May. Following data acquisition, NZEC’s technical team will take approximately four months to process and interpret the data and integrate the information into its technical database. The 3D seismic survey will further define existing targets and reduce drilling risk while potentially identifying new exploration targets and expanding NZEC’s inventory locations for its 2013 exploration program.
East Coast Basin
NZEC has drilled two stratigraphic holes on its 100% working interest Castlepoint Permit and one stratigraphic hole on its 100% working interest Ranui Permit. These three stratigraphic test wells will advance NZEC’s understanding of the Waipawa and Whangai formations. A review of the geochemical and physical properties of the two shale packages will help focus NZEC’s exploration strategy for the East Coast shales.
In addition, NZEC’s technical team will reprocess existing East Coast Basin seismic data and plans to shoot approximately 70 line kilometres of 2D seismic in the second half of 2012 and complete additional technical studies to further advance its understanding of the properties. The Corporation’s application for the East Cape Permit is uncontested and NZEC expects the permit to be granted upon the completion of Crown Minerals’ review of the application.
RESULTS OF OPERATIONS FOR THE YEAR ENDED DECEMBER 31, 2011
Revenue
During the year ended December 31, 2011, the Corporation commenced continuous production and as such began to recognize revenue during the period. Since December 10, 2011, the Corporation produced 11,623 barrels of oil and sold 9,567 barrels for total revenues of $1,022,009 or $106.83 per barrel sold. Total recorded gross production revenue was $974,517 after accounting for royalties of $47,492 or $4.96 per barrel sold. No revenues or royalties were recognized during the year ended December 31, 2010.
Expenses and Other Items
Production costs during the year ended December 31, 2011 totalled $224,219 or $23.44 per barrel.During the start-up and testing for Copper Moki-1, the Corporation incurred various one-off costs to commissioning costs for the well. Included in production costs are all site related expenditures, including applicable equipment rental fees, site services, overheads and labour; transportation and storage costs including trucking, testing, tank storage, processing and handling; and port dues as incurred prior to the sale of oil. No production costs were incurred during the year ended December 31, 2010.
Management’s Discussion & Analysis
New Zealand Energy Corp. Year Ended December 31, 2011 17
Depreciation and accretion costs incurred during the year ended December 31, 2011 totalled $246,540 or $25.77 per barrel sold. As a result of the Copper Moki-1 well deemed to have commenced commercial production during the year all the related costs to the well were reclassified from exploration and evaluation assets to property, plant and equipment and depreciated using the unit-of-production method by reference to the ratio of production in the period to the related total proved and probable reserves of oil and natural gas, taking into account estimated future development costs necessary to access those reserves. No depreciation and accretion costs were incurred during the year ended December 31, 2010.
During the year ended December 31, 2011, the drilling of the Talon-1 well was completed and total costs incurred amounted to $2,544,131. The Talon-1 well was drilled pursuant to an agreement to acquire the Corporation’s 50% interest in the permit. The well location was selected by the previous operator based on 2D seismic data. The well results were not positive and as such did not indicateany commercially viable reserves, and the well was plugged and abandoned. Furthermore, management determined that the well would not generate future economic benefits and decided to write-off all related Talon-1 well costs. No impairments were incurred or recognized in the year ended December 31, 2010.
Stock-based compensation for the year ended December 31, 2011 totalled $2,203,548 compared to $9,996,000 recognized in 2010. Of the total non-cash charge for the year ended December 31, 2011, $1,000,000 related to the IRBA asset purchase agreement, on the valuation of the shares issued, that was executed on February 21, 2011. The balance of $1,203,548 primarily related to the options granted to directors, officers and employees of the Company upon the completion of the Corporations initial public offering in August 2011. The entire balance of stock-based compensation recognized in 2010 related to the issuance and valuation of the Corporations founders shares upon its incorporation. The common shares were granted to some of the Corporation’s directors and officers in lieu of the services performed and substantial guarantees provided to assist in obtaining the legal rights to its resource properties.
General and administrative expenses for the year ended December 31, 2011 totalled $2,583,530compared to $338,469 incurred in 2010. The general and administrative expenses incurred during the year related to professional fees, management fees, consulting fees, travel and promotion, rent, overheads, filing and insurance costs. The increase over prior year was indicative of a growing and developing business over a twelve month period as compared to only a 60 day period being recognized in the prior year due to its the incorporation on October 29, 2010. The general and administrative costs specifically related to establishing an operational structure, setting up offices in Vancouver, British Columbia and Wellington, New Zealand, engaging key personnel and incurring the necessary professional fees associated with the formation, public listing, over-all business development of the Corporation.
Finance income for the year ended December 31, 2011 totalled $119,583 compared to $nil being recognized in 2010. Finance income relates to interest earned on the Corporations cash and cash equivalent balances held in treasury.
Foreign exchange gains for the year ended December 31, 2011 amounted to $134,934 compared to a foreign exchange loss of $3,667 being realized in 2010. Foreign exchange gains and losses are a result of currency exchange differences being recognized on transactions during the period.
Net Loss and Total Comprehensive Loss for the Year
Total expenses and other items for the year ended December 31, 2011 totalled $7,547,451 compared to $10,338,136 in 2010 representing an over-all decrease of $2,790,685 or 27%. Net loss for the year ended December 31, 2011 totalled $6,572,934, after taking into account gross net revenues of $974,517, which compared to a net loss for the year ended December 31, 2010 of
Management’s Discussion & Analysis
18 New Zealand Energy Corp. Year Ended December 31, 2011
$10,338,136 or an overall decrease of $3,765,202 or 36%. The Corporation did not recognize any gross revenues in 2010. After production revenues of $974,517, total comprehensive loss for the year ended December 31, 2011 totalled $6,655,829, after taking into account an exchange difference on translation of foreign currency of $82,895. This compared to a total comprehensive loss for the year ended December 31, 2010 of $10,338,136 for an over-all decrease of $3,682,307 or 36%.
Based on a weighted average shares outstanding balance of 85,122,879, the Corporation realized an $0.08 basic and diluted loss per share for the year ended December 31, 2011. During December 31, 2010, the Corporation realized a $0.24 basic and diluted loss per share on a weighted average share balance of 43,005,714.
SUMMARY OF QUARTERLY RESULTS
2011Q4
$
2011Q3
$
2011Q2
$
2011Q1
$
2010Q4
$
Total assets 31,152,804 33,566,611 10,683,239 11,491,806 6,301,322Resource properties 6,052,699 9,509,095 4,641,525 3,161,561 60,222Property, plant and equipment 5,509,511 63,421 68,366 65,721 -Working capital 18,030,398 18,699,022 5,333,999 7,596,329 5,857,692Accumulated deficit (16,911,070) (17,057,134) (13,258,649) (12,168,826) (10,338,136)Total comprehensive loss (1,258,314)1 (4,279,538) (773,524) (1,878,754) (10,338,136)Basic earning/(loss) per share 0.01 (0.04) (0.01) (0.03) (0.24)Diluted earning/(loss) per share 0.01 (0.04) (0.01) (0.03) (0.24)
1 During the fourth quarter, the Corporation reclassified various expenditures to exploration and evaluation assets.
New Zealand Energy Corporation was incorporated on October 29, 2010 under the Business Corporations Act of British Columbia. Upon incorporation, 40,000,000 common shares were granted to certain directors and officers of the Corporation in lieu of the services performed and substantial financial guarantees provided to assist in obtaining the legal rights to the Castlepoint and East Cape petroleum exploration permits within the East Coast Basin. The corporation then raised seed capital of $7,000,000 upon the subsequent issuance of 28,000,000 common shares in Q4-2010 and Q1-2011 to engage in the exploration, acquisition and development of petroleum and natural gas assets in New Zealand. This financing was followed by another private placement completed in Q1-2011 for gross proceeds of $5,257,500 on the issuance of 7,010,000 common shares. The Corporation entered into an agreement in Q1-2011 with IRBA Consulting pursuant to which it would acquire certain assets and provide employment to certain personnel in consideration for CDN $400,000 and the issuance of 2,000,000 common shares. Also in Q1-2011, upon satisfying the conditions of a deed of assignment, the Corporation took ownership of its Eltham permit. Further exploration and evaluation expenditures continued on the Eltham permit throughout fiscal 2011, which ultimately saw the commercialization of the Copper Moki-1 well in Q4-2011. All related costs to the Copper Moki-1 well were transferred to property, plant and equipment in Q4-2011. In Q2-2011, the Corporation agreed to acquire a 50% interest in the Alton permit for AUD2,000,000 and fund 100% of the Talon-1 well development costs, which totalled $2,544,131. The Talon-1 well development costs were written off in Q3-2011 due to management’s view that the well would not provide any future benefits. In Q2-2011, the Corporation completed the acquisition of its Ranui permit for USD1,000,000 and the issuance of 1,000,000 common shares. Since the Corporation’sinception, general and administrative costs have been incurred to assist in establishing the operating structure, setting up offices in both Canada and New Zealand, securing key personnel and general business development.
Management’s Discussion & Analysis
New Zealand Energy Corp. Year Ended December 31, 2011 19
RESULTS OF OPERATIONS FOR THE THREE-MONTH PERIOD ENDED DECEMBER 31, 2011
Revenue
During the period ended December 31, 2011, the Corporation commenced continuous production and began to recognize revenue in the statement of loss. The Corporation commercially produced 11,623 barrels of oil and sold 9,567 barrels of oil for total revenues of $1,022,009, or $106.83 per barrel. Total recorded gross production revenue was $974,517, which accounted for royalties of $47,492, or $4.96 per barrel sold. No revenues or royalties were recognized during the same period in fiscal 2010.
Expenses and Other Items
Production costs during the period ended December 31, 2011 totalled $224,219, or $23.44 per barrel. During the start-up and testing of Copper Moki-1, the Corporation incurred various one-off costs to commissioning costs for the well. Included in production costs are all site related expenditures, including applicable equipment rental fees, site services, overheads and labour; transportation and storage costs including trucking, testing, tank storage, processing and handling; and port dues as incurred prior to the sale of oil. No production costs were incurred during the same period in fiscal 2010.
Depreciation and accretion costs incurred during the period ended December 31, 2011 totalled $246,540, or $25.77 per barrel sold. As a result of the Copper Moki-1 well deemed to have commenced continuous production during the period, all the related costs to the well were reclassified from exploration and evaluation assets to property, plant and equipment and depreciated using the unit-of-production method by reference to the ratio of production in the period to the related total proved and probable reserves of oil and natural gas, taking into account estimated future development costs necessary to access those reserves. No depreciation and accretion costs were incurred during the same period in fiscal 2010.
Stock-based compensation for the period ended December 31, 2011 totalled $539,551 compared to $9,996,000 during the same period in 2010. The non-cash charge incurred during the period related to the options granted to directors, officers and employees of the Company upon the completion of the Corporation’s initial public offering in August 2011. The balance of stock-based compensation recognized in the same period ended December 31, 2010 related to the issuance and valuation of the Corporation’s founders shares upon its incorporation. The common shares were granted to some of the Corporation’s directors and officers in lieu of the services performed and substantial guarantees provided to assist in obtaining the legal rights to the Corporation’sresource properties.
During the period ended December 31, 2011, the Corporation recognized a further $17,358 upon the write down of the Talon-1 exploration well.
General and administrative expenses for the period ended December 31, 2011 totalled $620,359compared to $320,029 incurred in 2010. The general and administrative expenses incurred during the period related to professional fees, management fees, consulting fees, travel and promotion, rent, overheads, filing and insurance costs.Finance income for the period ended December 31, 2011 totalled $65,390 compared to $nil in 2010. Finance income relates to interest earned on the Corporation’s cash and cash-equivalent balances held in treasury.
Management’s Discussion & Analysis
20 New Zealand Energy Corp. Year Ended December 31, 2011
Foreign exchange gain for the period ended December 31, 2011 amounted to $121,823 compared to a foreign exchange loss of $3,667 realized in 2010. Foreign exchange gains and losses are a result of currency exchange differences being recognized on transactions during the period.
Total Comprehensive Loss for the Period
Total comprehensive loss for the period ended December 31, 2011 totalled $1,258,314, after taking into account an exchange difference on translation of foreign currency of $398,158, which compared to a total comprehensive loss for the period ended December 31, 2010 of $10,338,136.
Based on a weighted average shares outstanding balance of 100,609,105, the Corporation realized a $0.01 basic and diluted loss per share for the period ended December 31, 2011. During the period ended December 31, 2010, the Corporation realized a $0.24 basic and diluted loss per share on a weighted average share balance of 43,005,714.
PETROLEUM PROPERTY ACTIVITIES, OPERATIONS AND CAPITAL EXPENDITURES FOR YEAR ENDED DECEMBER 31, 2011
Taranaki Basin
During the year ended December 31, 2011, the Corporation recorded $11,521,715 in exploration and evaluation expenditures on its Taranaki Basin permits, which included those costs that the Corporation incurred to acquire its 100% interest in the Eltham permit and the associated costs to earn and acquire its 50% interest in the Alton permit. Of the total exploration and evaluation assets recorded during the year, $5,557,577 of accumulated expenditures, net of $950,440 in pre-production recoveries, was transferred to property, plant and equipment upon the commercialization of the Copper Moki-1 well in December 2011, and $2,544,131 was written downupon the impairment of the Talon-1 well, located on the Alton permit, which was drilled in August 2011. Upon review of the Talon-1 well results, management determined that no future benefits would be realized due to the geological assessment from the well. The well was therefore plugged and abandoned, with full reclamation planned in late 2012. The Talon-1 well was drilled pursuant to the agreement to acquire the Corporation’s 50% interest in the permit. The well location was selected by the previous operator based on 2D seismic data. Total recoveries recorded during the year, which offset the well development costs of the Copper Moki-1 well, related to incidental revenues realized on the sales of 8,603 barrels of oil during the well’s start-up and testing phase.Factoring the transfer of the Copper Moki-1 well costs ($5,557,577) and the impairment costs recorded for the Talon-1 well ($2,544,131) as described, total exploration and evaluation assets relating to the Taranaki Basin permits increased $2,469,567 year over year to a final balance of $2,477,835 as at December 31, 2011. Of the $2,469,567 increase recognized, $2,171,623 related to the acquisition costs associated with the 50% interest in the Alton permit, $283,837 related to additional exploration costs associated with the Eltham permit and $14,170 related to exploration costs associated with the 50% interest in the Alton permit.
The accumulated $5,557,577 in evaluation and exploration assets was transferred to property, plant and equipment in December 2011 as a result of the Corporation determining that the Copper Moki-1 well was technically feasible and commercially viable. Included in the accumulated expenditures were net well development costs of $4,390,216, which included the development of the Copper Moki pad; asset retirement costs of $110,621; allocated overheads, stock-based compensation and the associated foreign currency translation adjustment amounts; and technical study and consulting costs of $354,351, for an additional aggregate amount of $702,389. The pad development costs and technical study and consulting costs will provide benefit for Copper Moki-2, Copper Moki-3 and Copper Moki-4.
Management’s Discussion & Analysis
New Zealand Energy Corp. Year Ended December 31, 2011 21
East Coast Basin
During the year ended December 31, 2011, the Corporation incurred $1,144,217 in capitalized exploration costs on the Castlepoint Permit. Of the costs incurred during the year, $499,017 related to well development, $39,827 in geological technical studies, $229,445 recorded for stock-based compensation and $435,070 related to other overhead costs. Total expenditures incurred as of December 31, 2011 relating to the Castlepoint Permit amounted to $981,348.
In February 2011, the Corporation entered into the Ranui Assignment Agreement with Discovery Geo, pursuant to which Discovery Geo agreed to assign to NZEC its 100% interest in the Ranui Permit. Upon satisfaction of the conditions of assignment, NZEC paid Discovery Geo US$1,000,000 and issued 1,000,000 common shares to Discovery Geo. As of December 31, 2011, the Corporation had incurred $2,378,693 in capitalized acquisition costs relating to the Ranui Permit.
During the year ended December 31, 2011, the Corporation did not capitalize any exploration or acquisition costs relating to the East Cape Permit.
PERMIT EXPENDITURE REQUIREMENTS
The Corporation participates in oil and gas exploration and development and is contractually committed under various agreements to complete certain exploration activities. The Corporation’s management estimates that the total commitments for the balance of 2011 under its current permits held at December 31, 2011 are as follows:
Oil and Gas Property Working Interest
%
Work Commitment or Obligation to December 31, 2012
$Eltham PermitAlton Permit 1
Ranui Permit
10050
100
5,914,0002,485,0001,400,000
Castlepoint Permit 100 2,081,000Total 11,880,000
1 Subsequent to year end, the Corporation announced that it had entered into a farm-in agreement with L&M pursuant to which the Corporation will earn an additional 15% interest in the Alton permit, increasing the Corporation’s interest to 65%, by funding the collection and processing of 3D seismic data over approximately 50 km2 of the permit.
The Corporation may choose to alter the exploration programs, request extensions, reject development costs, relinquish certain permits or farm out its interest in permits, where practical.
The Corporation’s total commitments include those that are required to be incurred to maintain its permits in good standing during the current permit term, prior to the Corporation committing to the next stage of the permit term where additional expenditure would be required.
To complete the minimum work programs required to maintain its permits in good standing, the Corporation estimates that the following expenditures will be required in the five-year period commencing December 31, 2010 in relation to the Eltham Permit, the Alton Permit, the Castlepoint Permit, the Ranui Permit and the East Cape Permit (assuming that this PEP is granted to the Corporation):
Management’s Discussion & Analysis
22 New Zealand Energy Corp. Year Ended December 31, 2011
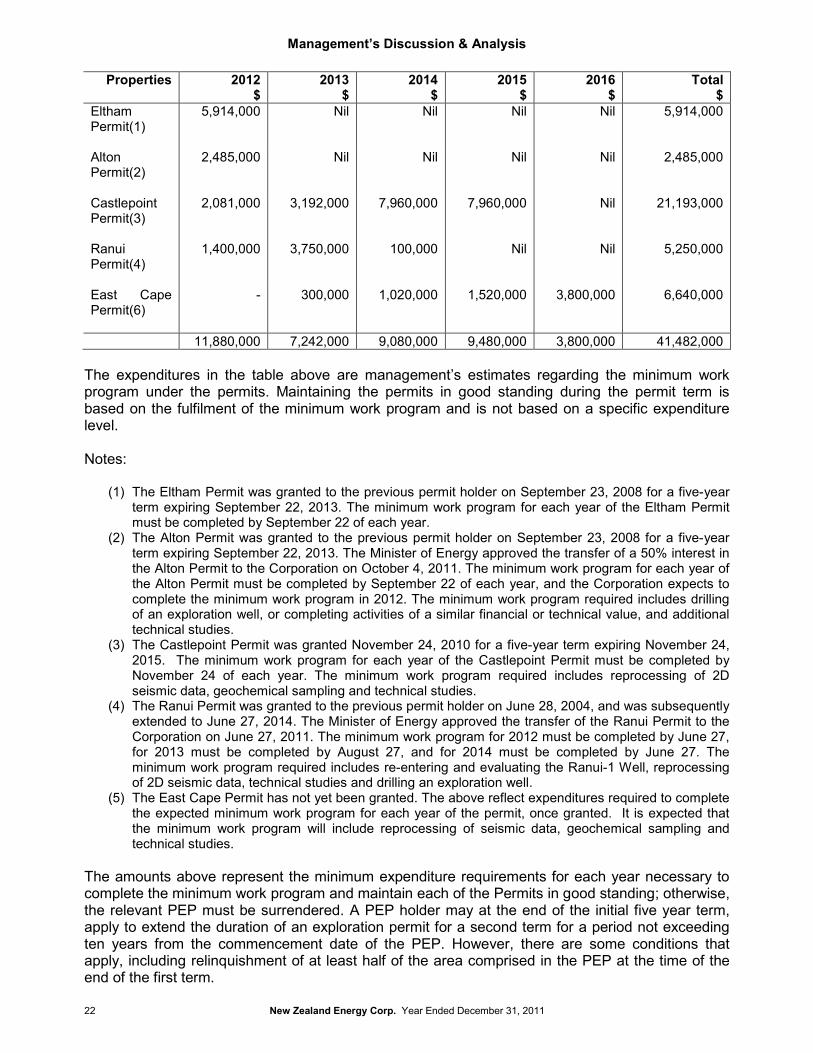
Properties 2012$
2013$
2014$
2015$
2016$
Total$
Eltham Permit(1)
5,914,000 Nil Nil Nil Nil 5,914,000
Alton Permit(2)
2,485,000 Nil Nil Nil Nil 2,485,000
Castlepoint Permit(3)
2,081,000 3,192,000 7,960,000 7,960,000 Nil 21,193,000
Ranui Permit(4)
1,400,000 3,750,000 100,000 Nil Nil 5,250,000
East Cape Permit(6)
- 300,000 1,020,000 1,520,000 3,800,000 6,640,000
11,880,000 7,242,000 9,080,000 9,480,000 3,800,000 41,482,000
The expenditures in the table above are management’s estimates regarding the minimum work program under the permits. Maintaining the permits in good standing during the permit term is based on the fulfilment of the minimum work program and is not based on a specific expenditure level.
Notes:
(1) The Eltham Permit was granted to the previous permit holder on September 23, 2008 for a five-year term expiring September 22, 2013. The minimum work program for each year of the Eltham Permit must be completed by September 22 of each year.
(2) The Alton Permit was granted to the previous permit holder on September 23, 2008 for a five-year term expiring September 22, 2013. The Minister of Energy approved the transfer of a 50% interest in the Alton Permit to the Corporation on October 4, 2011. The minimum work program for each year of the Alton Permit must be completed by September 22 of each year, and the Corporation expects to complete the minimum work program in 2012. The minimum work program required includes drilling of an exploration well, or completing activities of a similar financial or technical value, and additional technical studies.
(3) The Castlepoint Permit was granted November 24, 2010 for a five-year term expiring November 24, 2015. The minimum work program for each year of the Castlepoint Permit must be completed by November 24 of each year. The minimum work program required includes reprocessing of 2D seismic data, geochemical sampling and technical studies.
(4) The Ranui Permit was granted to the previous permit holder on June 28, 2004, and was subsequently extended to June 27, 2014. The Minister of Energy approved the transfer of the Ranui Permit to the Corporation on June 27, 2011. The minimum work program for 2012 must be completed by June 27, for 2013 must be completed by August 27, and for 2014 must be completed by June 27. The minimum work program required includes re-entering and evaluating the Ranui-1 Well, reprocessing of 2D seismic data, technical studies and drilling an exploration well.
(5) The East Cape Permit has not yet been granted. The above reflect expenditures required to complete the expected minimum work program for each year of the permit, once granted. It is expected that the minimum work program will include reprocessing of seismic data, geochemical sampling and technical studies.
The amounts above represent the minimum expenditure requirements for each year necessary to complete the minimum work program and maintain each of the Permits in good standing; otherwise, the relevant PEP must be surrendered. A PEP holder may at the end of the initial five year term, apply to extend the duration of an exploration permit for a second term for a period not exceeding ten years from the commencement date of the PEP. However, there are some conditions that apply, including relinquishment of at least half of the area comprised in the PEP at the time of the end of the first term.
Management’s Discussion & Analysis
New Zealand Energy Corp. Year Ended December 31, 2011 23
BASIS OF PREPARATION
The consolidated financial statements have been prepared in accordance with International Financial Reporting Standards (“IFRS”) as issued by the International Accounting Standards Board (“IASB”) and interpretations of the International Financial Reporting Interpretation Committee (“IFRIC”) and are expressed in Canadian dollars unless otherwise stated. The Corporation has adopted IFRS since inception. As a result, there was no conversion from Canadian General Accepted Principle and no transitional impact on the Corporation’s accounting practices. TheCorporation’s significant accounting policies are outlined in Note 2 in the notes to the audited consolidated financial statements for the year ended December 31, 2011.
CAPITAL SPENDING
During the year ended December 31, 2011, property, plant and equipment increased $5,509,511 net of accumulated depreciation of $315,166. Expenditures included computer equipment net of accumulated depreciation of $225,092, furniture net of accumulated depreciation of $24,825, and $5,259,594 in oil and gas properties net of accumulated depreciation. The computer equipment and furniture were acquired as part of an asset purchase agreement between the Corporation and IRBA Consulting Limited in February 2011. The oil and gas properties additions related to the accumulated exploration and evaluation expenditures for the Copper Moki-1 well incurred throughout the fiscal year and transferred to property, plant and equipment as a result of the Corporation determining the technical feasibility and commercial viability of the well in December 2011. Included in the accumulated balance transferred were net well development costs of $4,390,216, consulting costs of $354,351, asset retirement costs of $110,621, and allocated overheads, stock-based compensation and the associated foreign currency translation adjustment amounts for an additional aggregate amount of $702,389. The Copper Moki-1 well development costs were offset by $950,440 in recoveries as a result of the pre-production revenues recognized on the sale of 8,603 barrels of oil during the well’s start-up and testing phase.
During the year ended December 31, 2011, exploration and evaluation assets increased $5,992,477 to $6,052,699. The increase in the assets was a result of the Corporation incurring $4,550,316 in permit acquisition costs of which $2,171,623 related to the Alton Permit and $2,378,693 related to the Ranui Permit. In addition to the acquisition costs, the Corporation also incurred $1,442,161 during the year on exploration activities and associated overheads spread across all its permits.
LIQUIDITY AND CAPITAL RESOURCES
At December 31, 2011, the Corporation had $16,144,609 in cash and cash equivalents (December 31, 2010: $6,193,317) and $18,030,398 in positive working capital (December 31, 2010: $5,857,692). As at the date of this report the Corporation has sufficient capital to fund ongoing operations and planned capital expenditures for the next twelve months based on the current exploration and development programs, the current forecast cash flows from operations along with proceeds realized on the Corporations most recent financing completed in March 2012.
The Corporation does not have a credit facility; however, it is in the process of evaluating reserve-based borrowing facilities with potential lenders. There are no immediate requirements for a credit facility.
The Corporation’s policy is to maintain an adequate capital base for the objective of maintaining financial flexibility and investor confidence and to sustain the future development of the business.
Management’s Discussion & Analysis
24 New Zealand Energy Corp. Year Ended December 31, 2011
The Corporation’s capital includes share capital and the cumulative deficit. The Corporation’s objective when managing capital is to safeguard its ability to continue as a going concern, so that it can continue to provide returns for shareholders and benefits for other stakeholders. The Corporation manages its capital structure and makes adjustments to it in light of changes in economic conditions and the risk characteristics of the underlying assets. The Corporation’s objective is met by maintaining adequate equity and working capital to meet future capital expenditure requirements.
For the years ended December 31, 2011 and 2010, the Corporation had negative operating cash flow. To the extent required, the Corporation’s current treasury and funds raised in the March 2012 financing will be used to fund any negative operating cash flows in future periods. Due to the nature of the oil and natural gas industry, budgets are regularly reviewed in light of the success of the expenditures and other opportunities which may become available to the Corporation.
CASH FLOWS
Operating Activities
For the year ended December 31, 2011, the Corporation incurred a net loss of $6,572,934. Non-cash income statement amounts recorded during the period included $2,203,548 in stock-based compensation, $246,540 in depreciation and accretion, $2,544,131 resource property write-offs, and $134,934 in additional items factoring a foreign exchange gain. Total change to non-cash working capital items during the period amounted to $2,815,557 for an aggregate use of cash in operating activities of $4,529,206.
Investing Activities
For the year ended December 31, 2011, the Corporation incurred $11,056,200 on the continued acquisition and development of its properties. The majority of these costs included the acquisition of the Alton and Ranui permits and the drilling of the Copper Moki-1 and Talon-1 well. The Corporation incurred $326,927 on proprietary database and $262,397 on property, plant and equipment due to the negotiated acquisition on certain of the IRBA assets. Total cash used in investing activities for the period was $11,645,524.
Financing Activities
For the year ended December 31, 2011, financing activities provided for $26,479,876. Cash provided from financing activities was largely the result of issuing seed capital and the completion of the Corporation’s initial public offering for gross proceeds of $21,910,500.
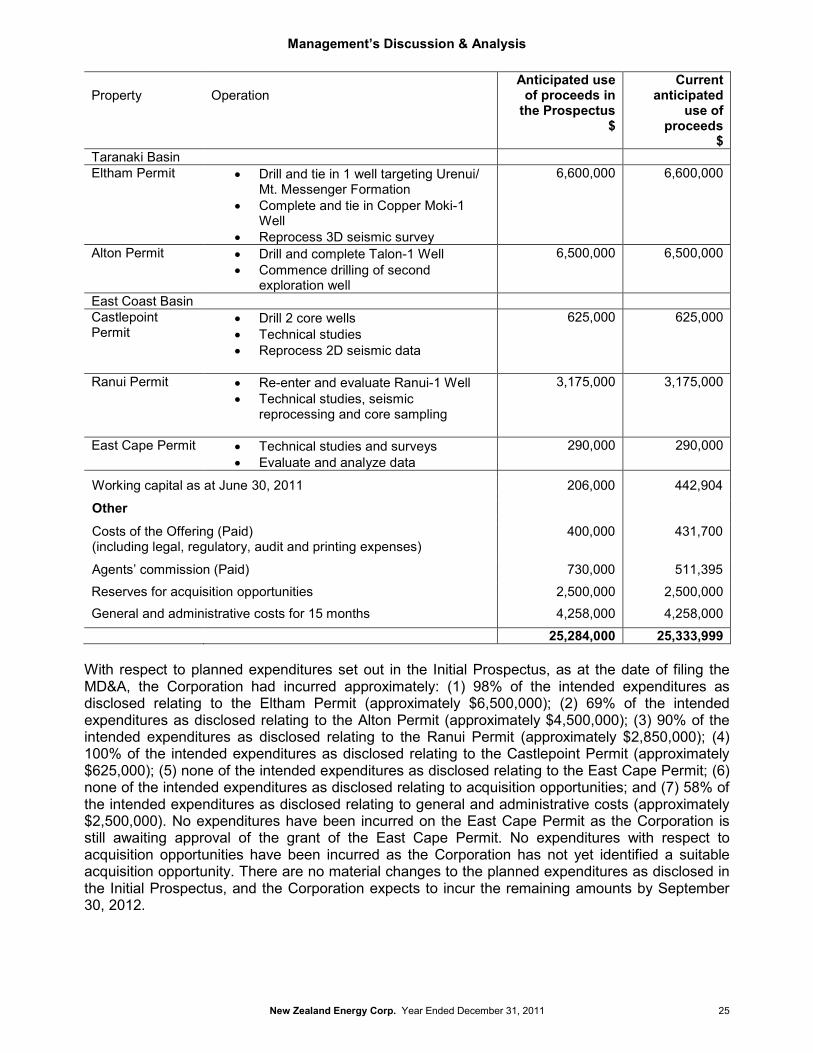
USE OF PROCEEDS
On August 3, 2011, NZEC closed its initial public offering for gross proceeds of $20,000,000, with a subsequent over-allotment for additional proceeds of $1,910,500. NZEC’s intended use of the net proceeds over the next 12 to 15 months, as compared to the anticipated use of proceeds as outlined in the July 2011 Prospectus, is shown below.
Management’s Discussion & Analysis
New Zealand Energy Corp. Year Ended December 31, 2011 25
Property OperationAnticipated use
of proceeds in the Prospectus
$
Current anticipated
use of proceeds
$Taranaki BasinEltham Permit • Drill and tie in 1 well targeting Urenui/
Mt. Messenger Formation• Complete and tie in Copper Moki-1
Well• Reprocess 3D seismic survey
6,600,000 6,600,000
Alton Permit • Drill and complete Talon-1 Well• Commence drilling of second
exploration well
6,500,000 6,500,000
East Coast BasinCastlepoint Permit
• Drill 2 core wells• Technical studies• Reprocess 2D seismic data
625,000 625,000
Ranui Permit • Re-enter and evaluate Ranui-1 Well• Technical studies, seismic
reprocessing and core sampling
3,175,000 3,175,000
East Cape Permit • Technical studies and surveys• Evaluate and analyze data
290,000 290,000
Working capital as at June 30, 2011 206,000 442,904
Other
Costs of the Offering (Paid)(including legal, regulatory, audit and printing expenses)
400,000 431,700
Agents’ commission (Paid) 730,000 511,395
Reserves for acquisition opportunities 2,500,000 2,500,000General and administrative costs for 15 months 4,258,000 4,258,000
25,284,000 25,333,999
With respect to planned expenditures set out in the Initial Prospectus, as at the date of filing the MD&A, the Corporation had incurred approximately: (1) 98% of the intended expenditures as disclosed relating to the Eltham Permit (approximately $6,500,000); (2) 69% of the intended expenditures as disclosed relating to the Alton Permit (approximately $4,500,000); (3) 90% of the intended expenditures as disclosed relating to the Ranui Permit (approximately $2,850,000); (4) 100% of the intended expenditures as disclosed relating to the Castlepoint Permit (approximately $625,000); (5) none of the intended expenditures as disclosed relating to the East Cape Permit; (6) none of the intended expenditures as disclosed relating to acquisition opportunities; and (7) 58% of the intended expenditures as disclosed relating to general and administrative costs (approximately $2,500,000). No expenditures have been incurred on the East Cape Permit as the Corporation is still awaiting approval of the grant of the East Cape Permit. No expenditures with respect to acquisition opportunities have been incurred as the Corporation has not yet identified a suitable acquisition opportunity. There are no material changes to the planned expenditures as disclosed in the Initial Prospectus, and the Corporation expects to incur the remaining amounts by September 30, 2012.
Management’s Discussion & Analysis
26 New Zealand Energy Corp. Year Ended December 31, 2011
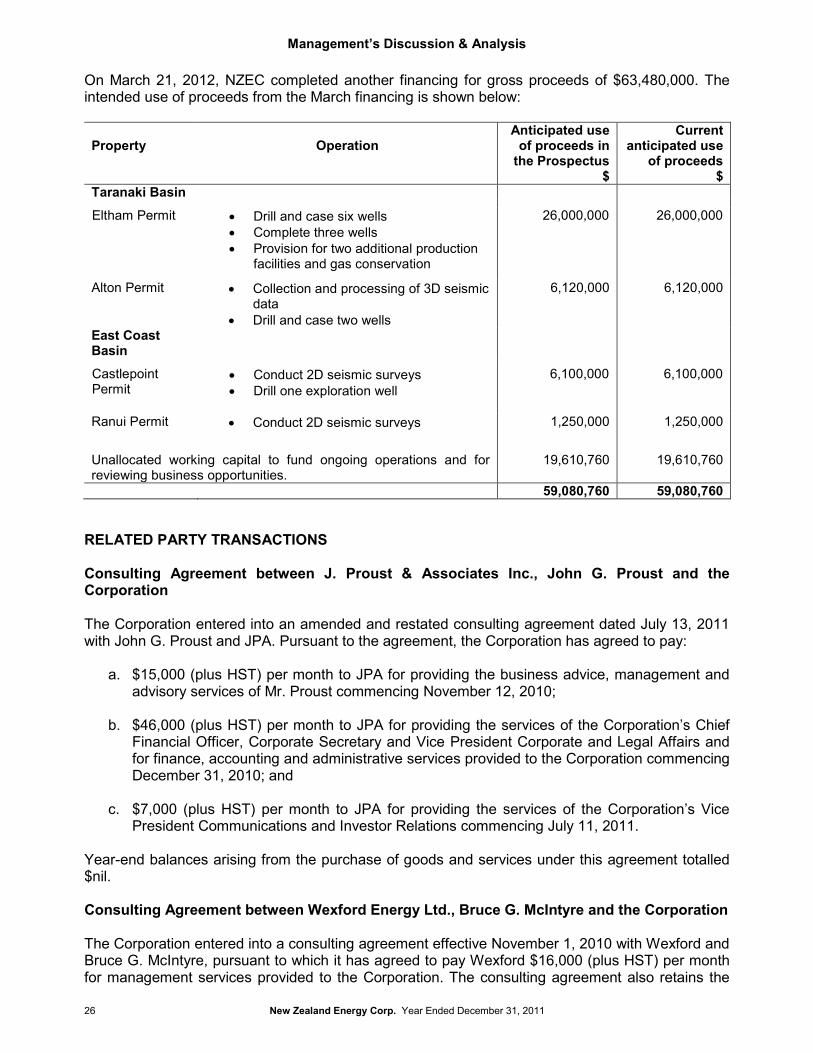
On March 21, 2012, NZEC completed another financing for gross proceeds of $63,480,000. The intended use of proceeds from the March financing is shown below:
Property OperationAnticipated use
of proceeds in the Prospectus
$
Current anticipated use
of proceeds$
Taranaki Basin
Eltham Permit • Drill and case six wells• Complete three wells• Provision for two additional production
facilities and gas conservation
26,000,000 26,000,000
Alton Permit • Collection and processing of 3D seismic data
• Drill and case two wells
6,120,000 6,120,000
East Coast Basin
Castlepoint Permit
• Conduct 2D seismic surveys• Drill one exploration well
6,100,000 6,100,000
Ranui Permit • Conduct 2D seismic surveys 1,250,000 1,250,000
Unallocated working capital to fund ongoing operations and for reviewing business opportunities.
19,610,760 19,610,760
59,080,760 59,080,760
RELATED PARTY TRANSACTIONS
Consulting Agreement between J. Proust & Associates Inc., John G. Proust and the Corporation
The Corporation entered into an amended and restated consulting agreement dated July 13, 2011 with John G. Proust and JPA. Pursuant to the agreement, the Corporation has agreed to pay:
a. $15,000 (plus HST) per month to JPA for providing the business advice, management and advisory services of Mr. Proust commencing November 12, 2010;
b. $46,000 (plus HST) per month to JPA for providing the services of the Corporation’s Chief Financial Officer, Corporate Secretary and Vice President Corporate and Legal Affairs and for finance, accounting and administrative services provided to the Corporation commencing December 31, 2010; and
c. $7,000 (plus HST) per month to JPA for providing the services of the Corporation’s Vice President Communications and Investor Relations commencing July 11, 2011.
Year-end balances arising from the purchase of goods and services under this agreement totalled $nil.
Consulting Agreement between Wexford Energy Ltd., Bruce G. McIntyre and the Corporation
The Corporation entered into a consulting agreement effective November 1, 2010 with Wexford and Bruce G. McIntyre, pursuant to which it has agreed to pay Wexford $16,000 (plus HST) per monthfor management services provided to the Corporation. The consulting agreement also retains the
Management’s Discussion & Analysis
New Zealand Energy Corp. Year Ended December 31, 2011 27
services of Mr. McIntyre as President of the Corporation. Period-end balances arising from thepurchase of goods and services under this agreement totalled $22,400. The consulting agreement was amended to increase the monthly consulting fee to $18,000 (plus HST). In December this contract was amended again to increase the fees to $20,000 a month (plus HST).
IRBA Agreement
NZEC entered into an asset purchase agreement with IRBA pursuant to which NZEC acquired certain of IRBA’s assets, including geological data, office equipment, personnel and an office lease in Wellington, New Zealand. In consideration for the transfer of the assets, NZEC paid $400,000 and issued 2,000,000 common shares to IRBA, at a deemed price of $0.50 per common share.
Employment Agreement between Ian R. Brown and NZEC Management Limited
NZEC entered into an employment agreement effective March 1, 2011 with Dr. Ian R. Brown, pursuant to which it has agreed to pay Dr. Brown $15,000 per month for providing his services as Chief Operating Officer of the Corporation.
Employment Agreement between Cliff P. Butchko and NZEC Management Limited
NZEC entered into an employment agreement effective December 1, 2011 with Cliff P. Butchko, pursuant to which the Corporation has agreed to pay Mr. Butchko $15,000 per month for providing his services as Senior Vice President of the Corporation.
The related party transactions incurred during the year were in the normal course of operations and were measured at the exchange value, which represented the amount of consideration established and agreed by the related parties.
ESCROWED SHARES AND TRADING SUMMARY
Escrowed Shares
In accordance with a lockup agreement, escrow agreement and pooling agreement, 46,394,334common shares owned or controlled by certain directors and officers of the Corporation were escrowed at the Listing Date. In conjunction with completing the March 2012 financing, all directors and officers entered into voluntary lock-up agreements whereby they agreed not to trade the Corporation’s securities on or before July 19, 2012, which is 120 days after the completion date of the March 2012 financing. The shares will be released over 36 months from the Listing Date as follows:
Release date Number of common sharesAugust 3, 2011 200,000 (released)February 3, 2012 300,000 (released)July 19, 2012 5,853,934August 3, 2012 6,773,400February 3, 2013 8,851,200August 3, 2013 8,851,200February 3, 2014 8,851,200August 3, 2014 6,713,400Total 46,394,334
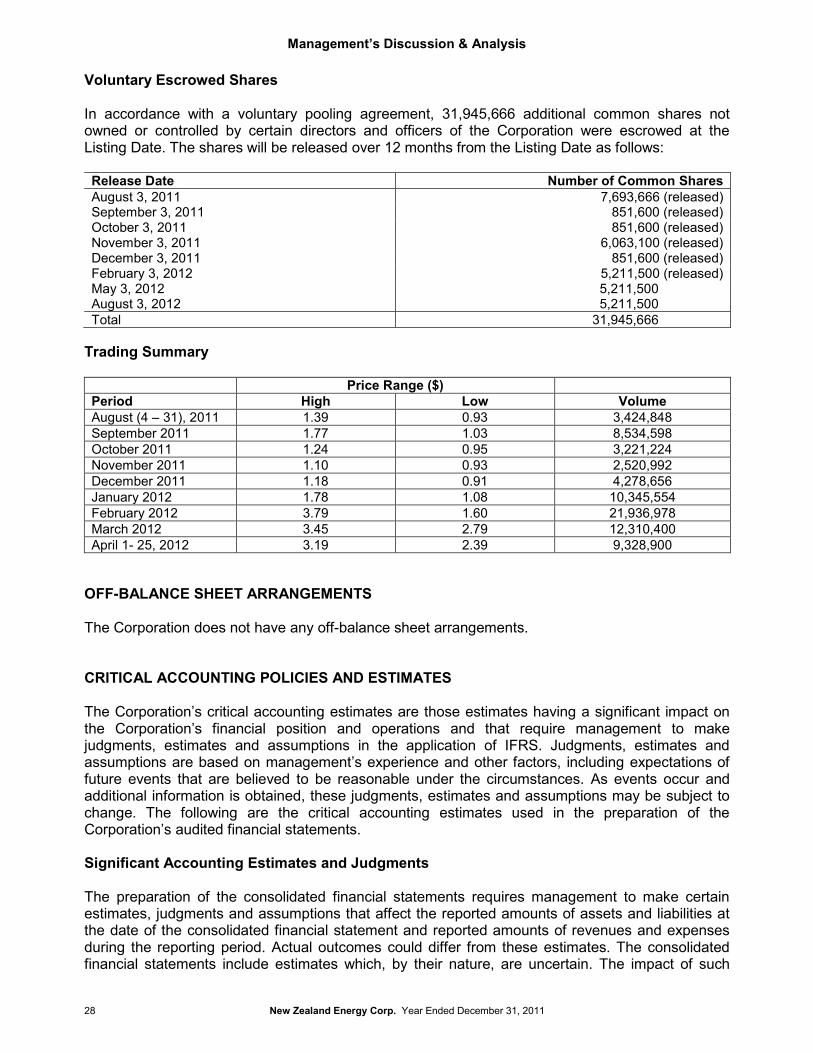
Management’s Discussion & Analysis
28 New Zealand Energy Corp. Year Ended December 31, 2011
Voluntary Escrowed Shares
In accordance with a voluntary pooling agreement, 31,945,666 additional common shares not owned or controlled by certain directors and officers of the Corporation were escrowed at the Listing Date. The shares will be released over 12 months from the Listing Date as follows:
Release Date Number of Common SharesAugust 3, 2011 7,693,666 (released)September 3, 2011 851,600 (released)October 3, 2011 851,600 (released)November 3, 2011 6,063,100 (released)December 3, 2011 851,600 (released)February 3, 2012 5,211,500 (released)May 3, 2012 5,211,500August 3, 2012 5,211,500Total 31,945,666
Trading Summary
Price Range ($)Period High Low VolumeAugust (4 – 31), 2011 1.39 0.93 3,424,848September 2011 1.77 1.03 8,534,598October 2011 1.24 0.95 3,221,224November 2011 1.10 0.93 2,520,992December 2011 1.18 0.91 4,278,656January 2012 1.78 1.08 10,345,554February 2012 3.79 1.60 21,936,978March 2012 3.45 2.79 12,310,400April 1- 25, 2012 3.19 2.39 9,328,900
OFF-BALANCE SHEET ARRANGEMENTS
The Corporation does not have any off-balance sheet arrangements.
CRITICAL ACCOUNTING POLICIES AND ESTIMATES
The Corporation’s critical accounting estimates are those estimates having a significant impact on the Corporation’s financial position and operations and that require management to make judgments, estimates and assumptions in the application of IFRS. Judgments, estimates and assumptions are based on management’s experience and other factors, including expectations of future events that are believed to be reasonable under the circumstances. As events occur and additional information is obtained, these judgments, estimates and assumptions may be subject to change. The following are the critical accounting estimates used in the preparation of the Corporation’s audited financial statements.
Significant Accounting Estimates and Judgments
The preparation of the consolidated financial statements requires management to make certain estimates, judgments and assumptions that affect the reported amounts of assets and liabilities at the date of the consolidated financial statement and reported amounts of revenues and expenses during the reporting period. Actual outcomes could differ from these estimates. The consolidated financial statements include estimates which, by their nature, are uncertain. The impact of such
Management’s Discussion & Analysis
New Zealand Energy Corp. Year Ended December 31, 2011 29
estimates is pervasive throughout the consolidated financial statements, and may require accounting adjustments based on future occurrences. Revisions to accounting estimates are recognized in the period in which the estimate is revised and future periods if the revision affects both current and future periods. These estimates are based on historical experience, current and future economic conditions and other factors, including expectations of future events that are believed to be reasonable under the circumstances.
The following discussion covers the most significant accounting judgments and estimates that the Company has made in the preparation of the consolidated financial statements.
i. Oil and gas reserve determination
Oil and gas properties are depreciated on a unit-of-production basis at a rate calculated by reference to the proved and probable reserves and incorporating the estimated future cost of development and extracting those reserves. The process of estimating reserves requires significant estimates based on available geological, geophysical, engineering and economic data. The estimate of the economically recoverable oil and natural gas reserves and related future net cash flows incorporates many factors and assumptions including the expected reservoir characteristics, future commodity prices and costs. Future development costs are estimated using assumptions as to the number of wells required to produce the reserves, the cost of such wells and associated production facilities and other capital costs.
ii. Exploration and evaluation assets
Costs incurred to acquire rights to explore for oil and natural gas may be grouped into either exploration and evaluation or property, plant and equipment, depending on facts and circumstances. Costs incurred in respect of properties that have been determined to have proved and probable reserves are classified as property, plant and equipment. In such circumstances, technical feasibility and commercial viability are considered to beestablished. Costs incurred in respect of new prospects with no nearby established development past or present and no proved or probable reserves assigned are classified as exploration and evaluation assets (Note 9).
iii. Determination of cash generating-units (“CGUs”)
Oil and gas properties, resources properties and other corporate assets are aggregated into CGUs based on their ability to generate largely independent cash flows and are used for impairment testing. CGUs are determined by similar geological structure, shared infrastructure, geographical proximity, commodity type, similar exposure to market risks and materiality and are subjected to management’s judgment.
iv. Impairment indicators and calculation of impairment
At each reporting date, the Corporation assesses whether or not there are circumstances that indicate a possibility that the carrying values of exploration and evaluation assets and property, plant and equipment are not recoverable, or impaired. Such circumstances include incidents of physical damage, deterioration of commodity prices, changes in the regulatory environment or a reduction in estimates of proved and probable reserves.
When management judges that circumstances indicate potential impairment, property, plant and equipment are tested for impairment by comparing the carrying values to their recoverable amounts. The recoverable amounts of CGUs are determined based on the higher of value-in-use calculations and fair values less costs to sell. These calculations require the use of estimates and assumptions that are subject to change as new information
Management’s Discussion & Analysis
30 New Zealand Energy Corp. Year Ended December 31, 2011
becomes available, including information on future commodity prices, expected production volumes, quantities of reserves, discount rates, future development costs and operating costs.
v. Asset retirement obligations
The calculation of asset retirement obligation includes estimates of the future costs to settle the liability, the timing of the cash flows to settle the liability, the risk-free rate and the future inflation rates. The impact of differences between actual and estimated costs, timing and inflation on the consolidated financial statements of future period may be material.
vi. Share-based compensation
The fair value of share-based compensation is determined using a Black-Scholes Option pricing model. Such option pricing models require the input of subjective assumptions including the expected price volatility and expected option life. Management considers all appropriate facts and circumstances in making its assessments including historical experience and comparisons to peers in the market. Changes in these assumptions may have a significant impact on the fair value calculation.
Provisions / Restoration Provisions
The Corporation recognizes liabilities for statutory, contractual, constructive or legal obligations associated with the retirement of long-lived assets in the period when the liability arises. The net present value of the asset retirement obligation is capitalized to the long-lived asset to which it relates with a corresponding increase to the liability in the period incurred.
Changes in the liability for an asset retirement obligation due to the passage of time will be measured by applying the effective interest rate method. The amount will be recognized as an increase in the liability and accretion expense in the statement of comprehensive loss. Changes resulting from revisions to the timing, discount rates, regulatory requirements or the amount of the original estimate of undiscounted cash flows are recognized as an increase or a decrease to the carrying amount of the liability and the related long-lived asset. The Corporation’s estimates are reviewed at the end of each reporting period for such changes.
The liability for the Corporation’s asset retirement obligation is recorded in the period in which it is incurred and discounted to its present value using a risk free rate of 3%, and the corresponding amount is recognized by increasing the carrying amount of the oil and gas resource properties. The liability is accreted each period with the accretion expense recognized in the statement of comprehensive loss, and the capitalized cost is depreciated over the useful life of the related asset when put into use using the unit-of-production method.
Income Taxes
Any income tax provided on profit or loss for the periods presented comprises current and deferred tax. Income tax is recognized in profit or loss except to the extent that it relates to items recognized directly in equity, in which case it is recognized in equity.
Deferred tax assets and liabilities are recognized for deferred tax consequences attributable to differences between the financial statement carrying amounts of existing assets and liabilities and their respective tax bases. Deferred tax assets and liabilities are measured using the enacted or substantively enacted tax rates expected to apply when the asset is realized or the liability settled. The effect on deferred tax assets and liabilities of a change in tax rates is recognized in income in the period that substantive enactment occurs.
Management’s Discussion & Analysis
New Zealand Energy Corp. Year Ended December 31, 2011 31
A deferred tax asset is recognized to the extent that it is probable that future taxable profits will be available against which the asset can be used. To the extent that the Corporation does not considerit probable that a deferred tax asset will be recovered, the deferred tax asset is reduced.
Share-based Payments
The share option plan allows the Corporation’s employees and consultants to acquire shares of the Corporation. The fair value of options granted is recognized as a share-based payment expense with a corresponding increase in equity settled share-based payments reserve in equity. An individual is classified as an employee when the individual is an employee for legal or tax purposes (direct employee) or provides services similar to those performed by a direct employee.
Equity-settled share-based payment transactions with non-employees are measured at the fair value of the goods or services received. However if the fair value cannot be estimated reliably, the share-based payment transaction is measured at the fair value of the equity instruments granted at the date the non-employee received the goods or the services.
The fair value is measured at grant date and each tranche is recognized on a graded-vesting basis over the period during which the options vest. The fair value of the options granted is measured using the Black-Scholes option pricing model taking into account the terms and conditions upon which the options were granted. At each financial position reporting date, the amount recognized as an expense is adjusted to reflect the actual number of share options that are expected to vest.
Accounting Pronouncements Not Yet Effective
The Corporation has not yet adopted certain new standards, amendments and interpretations to existing standards, which have been published but are only effective for the Corporation’s accounting periods beginning on or after January 1, 2013. These include:
• IFRS 9 – Financial Instruments: Classification and Measurement (effective after January 1, 2015)• IFRS 10 – Consolidated Financial Statements• IFRS 11 – Joint Arrangement• IFRS 12 – Disclosure of Interests in Other Entities• IFRS 13 – Fair Value Measurement
The Corporation is still in the process of assessing the impact of these standards on the financial statements.
FINANCIAL RISK MANAGEMENT
The Corporation’s activities expose it to a variety of financial risks, including credit risk, liquidity risk, foreign exchange risk, interest rate risk, price risk and fair value risk. The Corporation’s overall risk management program focuses on the unpredictability of financial markets and seeks to minimise potential adverse effects on the financial performance of the Corporation.
This note presents information about the Corporation’s exposure to each of these risks, the Corporation’s objectives and processes for measuring and managing risk, and the Corporation’s management of capital.
The Board of Directors has overall responsibility for the establishment and oversight of the Corporation’s risk management framework.
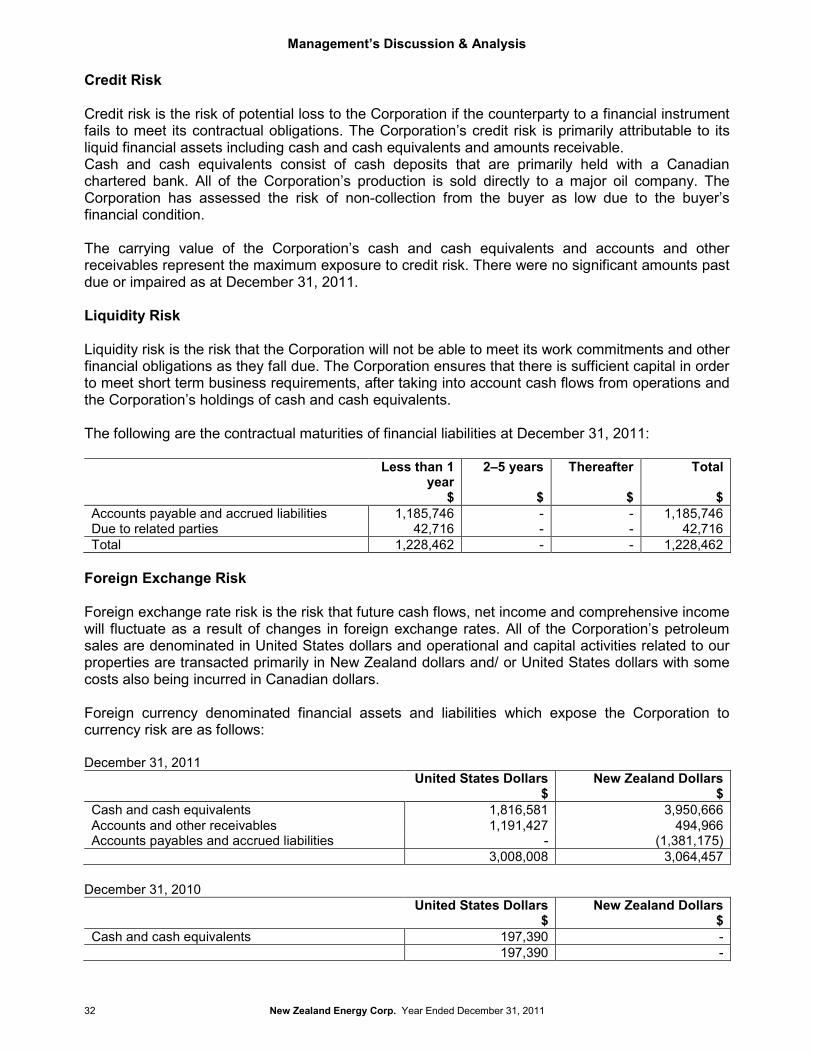
Management’s Discussion & Analysis
32 New Zealand Energy Corp. Year Ended December 31, 2011
Credit Risk
Credit risk is the risk of potential loss to the Corporation if the counterparty to a financial instrument fails to meet its contractual obligations. The Corporation’s credit risk is primarily attributable to its liquid financial assets including cash and cash equivalents and amounts receivable. Cash and cash equivalents consist of cash deposits that are primarily held with a Canadian chartered bank. All of the Corporation’s production is sold directly to a major oil company. The Corporation has assessed the risk of non-collection from the buyer as low due to the buyer’s financial condition.
The carrying value of the Corporation’s cash and cash equivalents and accounts and other receivables represent the maximum exposure to credit risk. There were no significant amounts past due or impaired as at December 31, 2011.
Liquidity Risk
Liquidity risk is the risk that the Corporation will not be able to meet its work commitments and other financial obligations as they fall due. The Corporation ensures that there is sufficient capital in order to meet short term business requirements, after taking into account cash flows from operations and the Corporation’s holdings of cash and cash equivalents.
The following are the contractual maturities of financial liabilities at December 31, 2011:
Less than 1 year
$
2–5 years
$
Thereafter
$
Total
$Accounts payable and accrued liabilities 1,185,746 - - 1,185,746Due to related parties 42,716 - - 42,716Total 1,228,462 - - 1,228,462
Foreign Exchange Risk
Foreign exchange rate risk is the risk that future cash flows, net income and comprehensive income will fluctuate as a result of changes in foreign exchange rates. All of the Corporation’s petroleum sales are denominated in United States dollars and operational and capital activities related to our properties are transacted primarily in New Zealand dollars and/ or United States dollars with some costs also being incurred in Canadian dollars.
Foreign currency denominated financial assets and liabilities which expose the Corporation to currency risk are as follows:
December 31, 2011United States Dollars
$New Zealand Dollars
$Cash and cash equivalents 1,816,581 3,950,666Accounts and other receivables 1,191,427 494,966Accounts payables and accrued liabilities - (1,381,175)
3,008,008 3,064,457
December 31, 2010United States Dollars
$New Zealand Dollars
$Cash and cash equivalents 197,390 -
197,390 -
Management’s Discussion & Analysis
New Zealand Energy Corp. Year Ended December 31, 2011 33
The impact on the net loss of a 10% increase or decrease in United States Dollars on the Corporation’s financial instruments based on balances at December 31, 2011 would be $322,000 ($20,000 at December 31, 2010). The impact on net loss of a 10% increase or decrease in New Zealand Dollars on the Corporation’s financial instruments based on balances at December 31, 2011 would be $234,000 ($nil at December 31, 2010).
Interest Rate Risk
Interest rate risk is the risk that future cash flows will fluctuate as a result of changes in market interest rates. The Corporation is exposed to interest rate fluctuations on its cash and cash equivalents, which bear a floating rate of interest. Sensitivity to a 1% increase or decrease in interest rate would affect the reported loss by approximately $161,000.
The Corporation has no debt that carries interest rate risk.
Price Risk
Price risk is the risk that future cash flows will fluctuate as a result of changes in commodity prices, affecting results of operations and cash generated from operating activities. Such prices may also affect the value of resources properties and the level of spending for future activities. Prices received by the Corporation for its production are largely beyond the Corporation’s control as petroleum prices are impacted by world economic events that dictate the levels of supply and demand. All of the Corporation’s oil production is sold at spot rates, exposing the Corporation to the risk of price movements.
Fair Value
The carrying value of cash and cash equivalents, amounts receivable, accounts payable and accrued liabilities and due to related parties are considered to be a reasonable approximation of fair value because of the short-term maturity of these instruments.
SHARE CAPITAL
The Corporation’s authorized share capital consists of an unlimited number of voting common shares. As at December 31, 2011, the Corporation had 100,609,105 common shares outstanding.
As of the date of this MD&A, the Corporation’s share capitalization included 121,769,105 common shares, 657,315 warrants and 5,946,000 stock options for a fully diluted capitalization of 128,372,420.
MANAGEMENT REPORT ON INTERNAL CONTROL OVER FINANCIAL REPORTING
Management is responsible for establishing and maintaining adequate internal controls over financial reporting. Any system of internal control over financial reporting, no matter how well designed, has inherent limitations. Therefore, even those systems determined to be effective can provide assurance with respect to financial statement preparation and presentation.Management have overseen the design and evaluation of internal controls over financial reporting and have concluded that the design and operation of these internal controls over financial reporting were effective in providing reasonable assurance regarding the reliability of financial reporting and the preparation of financial statements for external purposes in accordance with IFRS.
Management’s Discussion & Analysis
34 New Zealand Energy Corp. Year Ended December 31, 2011
RISK FACTORS
Natural resources exploration and development involves a number of risks and uncertainties, many of which are beyond management’s control. The Corporation’s business is subject to the risks normally encountered in the oil and natural gas industry such as the marketability of, and prices for, oil and natural gas, competition with companies having greater resources, acquisition, exploration and production risks, need for capital, fluctuations in the market price and demand for oil and natural gas, the regulation of the oil and natural gas industry by various levels of government and public protests. The success of further exploration or development projects cannot be assured. In addition, the Corporation’s operations are primarily outside of Canada and are subject to risksarising from foreign exchange and foreign regulatory regimes.
New Zealand Energy Corp.Consolidated Financial Statements
December 31, 2011
(Expressed in Canadian Dollars)
New Zealand Energy Corp.
36 New Zealand Energy Corp. Year Ended December 31, 2011
MANAGEMENT’S REPORT
Management of New Zealand Energy Corp. (the “Corporation”) is responsible for the reliability and integrity of the consolidated financial statements, and the notes to the consolidated financialstatements.
The consolidated financial statements were prepared by management in accordance with International Financial Reporting Standards as issued by the International Accounting Standards Board. Since a precise determination of many assets and liabilities is dependent on future events, the timely preparation of financial statements requires that management make estimates and assumptions and use judgment. When alternate accounting methods exist, management has chosen those that it deems most appropriate in the circumstances.
PricewaterhouseCoopers LLP, an independent firm of Chartered Accountants, were appointed by shareholders as the external auditor of the Corporation to express an audit opinion on the consolidated financial statements. Their examination included such tests and procedures as they considered necessary to provide reasonable assurance that the consolidated financial statements are in accordance with International Financial Reporting Standards.
The Board of Directors is responsible for ensuring that management fulfills its responsibilities for financial reporting and internal control. The Board exercises this responsibility through the Audit Committee. The Audit Committee recommends appointment of the external auditors to the Board, ensures their independence and approves their fees. The Audit Committee meets regularly with management and the external auditors to ensure that management’s responsibilities are properly discharged, to review the consolidated financial statements and recommend that the consolidated financial statements be presented to the Board for approval. The external auditors have full and unrestricted access to the Audit Committee to discuss their audit and their findings.
”John G. Proust” “Jeff Redmond"John G. Proust, Chief Executive Officer Jeff Redmond, Chief Financial Officer
New Zealand Energy Corp.
PricewaterhouseCoopers LLP Chartered AccountantsPricewaterhouseCoopers Place, 250 Howe Street, Suite 700, Vancouver, British Columbia, Canada V6C 3S7T: +1 604 806 7000, F: +1 604 806 7806, www.pwc.com/ca“PwC” refers to PricewaterhouseCoopers LLP, an Ontario limited liability partnership, which is a member firm of PricewaterhouseCoopers International Limited, each member firm of
which is a separate legal entity.
Independent Auditor’s Report
To the Shareholders of New Zealand Energy Corp.
We have audited the accompanying consolidated financial statements of New Zealand Energy Corp. (the “Company”), which comprise the consolidated balance sheets as at December 31, 2011 and December 31, 2010 and the consolidated statements of comprehensive loss, changes in equity and cash flows for the year and period ended December 31, 2011 and December 31, 2010 respectively, and the related notes, which comprise a summary of significant accounting policies and other explanatory information.
Management’s responsibility for the consolidated financial statementsManagement is responsible for the preparation and fair presentation of these consolidated financial statements in accordance with International Financial Reporting Standards, and for such internal control as management determines is necessary to enable the preparation of consolidated financial statements that are free from material misstatement, whether due to fraud or error.
Auditor’s responsibilityOur responsibility is to express an opinion on these consolidated financial statements based on our audits. We conducted our audits in accordance with Canadian generally accepted auditing standards. Those standards require that we comply with ethical requirements and plan and perform the audits to obtain reasonable assurance about whether the consolidated financial statements are free from material misstatement.
An audit involves performing procedures to obtain audit evidence about the amounts and disclosures in the consolidated financial statements. The procedures selected depend on the auditor’s judgment,including the assessment of the risks of material misstatement of the consolidated financial statements, whether due to fraud or error. In making those risk assessments, the auditor considers internal control relevant to the entity’s preparation and fair presentation of the consolidated financial statements in order to design audit procedures that are appropriate in the circumstances, but not for the purpose of expressing an opinion on the effectiveness of the entity’s internal control. An audit also includes evaluating the appropriateness of accounting policies used and the reasonableness of accounting estimates made by management, as well as evaluating the overall presentation of the consolidated financial statements.
We believe that the audit evidence we have obtained in our audits is sufficient and appropriate to provide a basis for our audit opinion.
OpinionIn our opinion, the consolidated financial statements present fairly, in all material respects, the financial position of the Company as at December 31, 2011 and December 31, 2010 and its financial performance and its cash flows for the year and period ended December 31, 2011 and December 31, 2010 respectively in accordance with International Financial Reporting Standards.
(signed) “PricewaterhouseCoopers LLP”
Chartered AccountantsVancouver, British ColumbiaApril 25, 2012
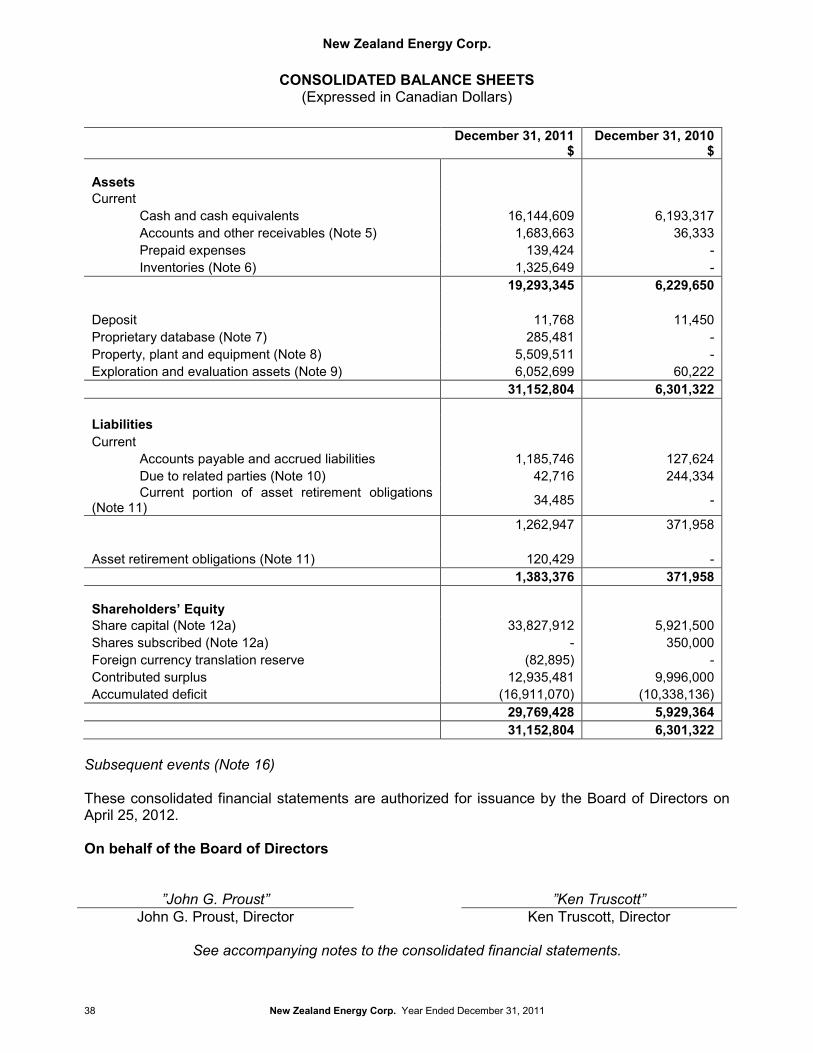
New Zealand Energy Corp.
38 New Zealand Energy Corp. Year Ended December 31, 2011
CONSOLIDATED BALANCE SHEETS(Expressed in Canadian Dollars)
Subsequent events (Note 16)
These consolidated financial statements are authorized for issuance by the Board of Directors on April 25, 2012.
On behalf of the Board of Directors
”John G. Proust” ”Ken Truscott” John G. Proust, Director Ken Truscott, Director
See accompanying notes to the consolidated financial statements.
December 31, 2011$
December 31, 2010$
AssetsCurrent
Cash and cash equivalents 16,144,609 6,193,317Accounts and other receivables (Note 5) 1,683,663 36,333Prepaid expenses 139,424 -Inventories (Note 6) 1,325,649 -
19,293,345 6,229,650
Deposit 11,768 11,450Proprietary database (Note 7) 285,481 -Property, plant and equipment (Note 8) 5,509,511 -Exploration and evaluation assets (Note 9) 6,052,699 60,222
31,152,804 6,301,322
LiabilitiesCurrent
Accounts payable and accrued liabilities 1,185,746 127,624Due to related parties (Note 10) 42,716 244,334Current portion of asset retirement obligations
(Note 11) 34,485 -
1,262,947 371,958
Asset retirement obligations (Note 11) 120,429 -1,383,376 371,958
Shareholders’ EquityShare capital (Note 12a) 33,827,912 5,921,500Shares subscribed (Note 12a) - 350,000Foreign currency translation reserve (82,895) -Contributed surplus 12,935,481 9,996,000Accumulated deficit (16,911,070) (10,338,136)
29,769,428 5,929,36431,152,804 6,301,322
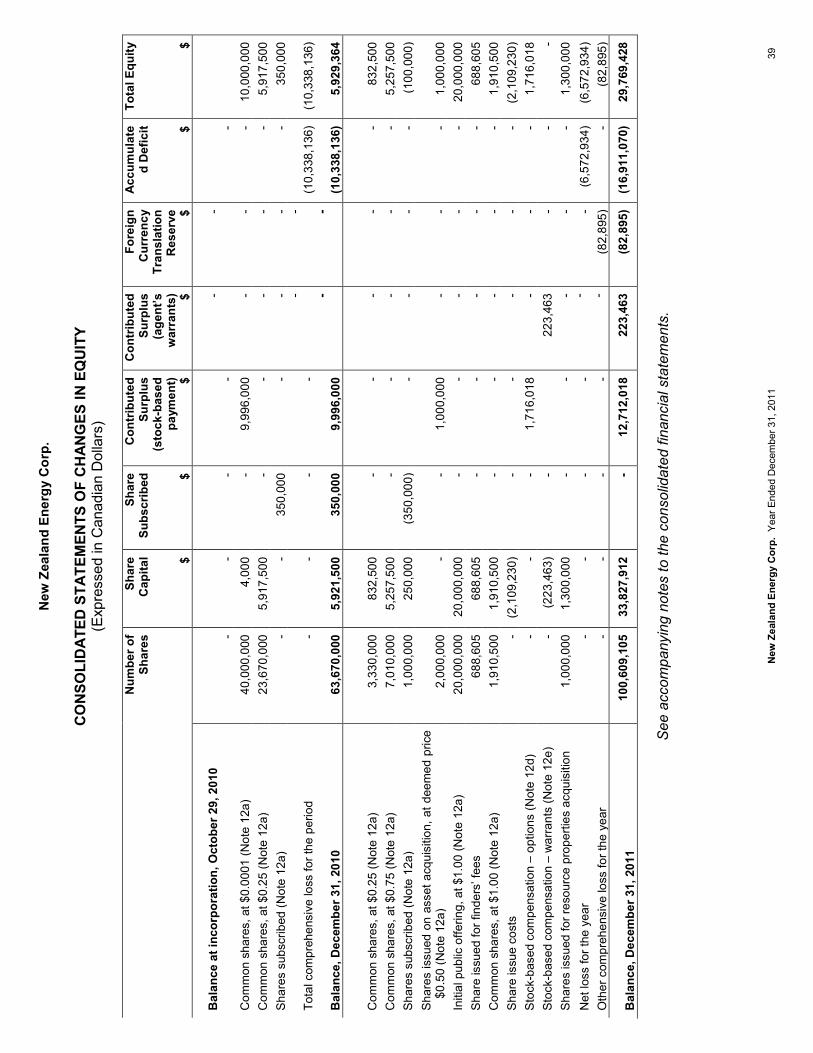
New
Zea
land
Ene
rgy
Cor
p.
New
Zea
land
Ene
rgy
Cor
p.Y
ear E
nded
Dec
embe
r 31,
201
139
CO
NSO
LID
ATED
STA
TEM
ENTS
OF
CH
ANG
ES IN
EQ
UIT
Y(E
xpre
ssed
in C
anad
ian
Dol
lars
)
See
acc
ompa
nyin
g no
tes
to th
e co
nsol
idat
ed fi
nanc
ial s
tate
men
ts.
Num
ber o
f Sh
ares
Shar
e C
apita
l $
Shar
e Su
bscr
ibed $
Con
trib
uted
Su
rplu
s(s
tock
-bas
ed
paym
ent) $
Con
trib
uted
Su
rplu
s(a
gent
’s
war
rant
s) $
Fore
ign
Cur
renc
y Tr
ansl
atio
n R
eser
ve $
Acc
umul
ate
d D
efic
it $
Tota
l Equ
ity $
Bal
ance
at i
ncor
pora
tion,
Oct
ober
29,
201
0-
--
--
--
Com
mon
sha
res,
at $
0.00
01 (N
ote
12a)
40,0
00,0
004,
000
-9,
996,
000
--
-10
,000
,000
Com
mon
sha
res,
at $
0.25
(Not
e 12
a)23
,670
,000
5,91
7,50
0-
--
--
5,91
7,50
0S
hare
s su
bscr
ibed
(Not
e 12
a)-
-35
0,00
0-
--
-35
0,00
0
Tota
l com
preh
ensi
ve lo
ss fo
r the
per
iod
--
--
--
(10,
338,
136)
(10,
338,
136)
Bal
ance
, Dec
embe
r 31,
201
063
,670
,000
5,92
1,50
035
0,00
09,
996,
000
--
(10,
338,
136)
5,92
9,36
4
Com
mon
sha
res,
at $
0.25
(Not
e 12
a)3,
330,
000
832,
500
--
--
-83
2,50
0C
omm
on s
hare
s, a
t $0.
75 (N
ote
12a)
7,01
0,00
05,
257,
500
--
--
-5,
257,
500
Sha
res
subs
crib
ed (N
ote
12a)
1,00
0,00
025
0,00
0(3
50,0
00)
--
--
(100
,000
)S
hare
s is
sued
on
asse
t acq
uisi
tion,
at d
eem
ed p
rice
$0.5
0 (N
ote
12a)
2,00
0,00
0-
-1,
000,
000
--
-1,
000,
000
Initi
al p
ublic
offe
ring,
at $
1.00
(Not
e 12
a)20
,000
,000
20,0
00,0
00-
--
--
20,0
00,0
00S
hare
issu
ed fo
r fin
ders
’ fee
s68
8,60
568
8,60
5-
--
--
688,
605
Com
mon
sha
res,
at $
1.00
(Not
e 12
a)1,
910,
500
1,91
0,50
0-
--
--
1,91
0,50
0S
hare
issu
e co
sts
-(2
,109
,230
)-
--
--
(2,1
09,2
30)
Sto
ck-b
ased
com
pens
atio
n –
optio
ns (N
ote
12d)
--
-1,
716,
018
--
-1,
716,
018
Sto
ck-b
ased
com
pens
atio
n –
war
rant
s (N
ote
12e)
-(2
23,4
63)
-22
3,46
3-
--
Sha
res
issu
ed fo
r res
ourc
e pr
oper
ties
acqu
isiti
on1,
000,
000
1,30
0,00
0-
--
--
1,30
0,00
0N
et lo
ss fo
r the
yea
r-
--
--
-(6
,572
,934
)(6
,572
,934
)O
ther
com
preh
ensi
ve lo
ss fo
r the
yea
r-
--
--
(82,
895)
-(8
2,89
5)
Bal
ance
, Dec
embe
r 31,
201
110
0,60
9,10
533
,827
,912
-12
,712
,018
223,
463
(82,
895)
(16,
911,
070)
29,7
69,4
28
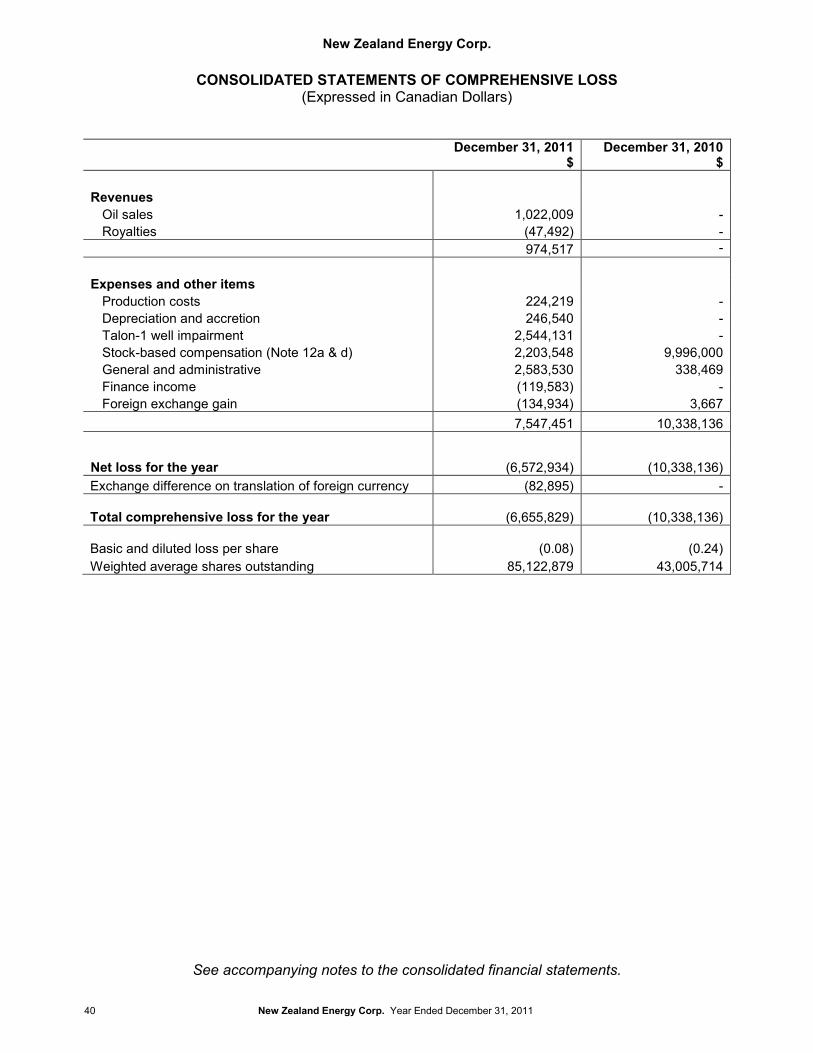
New Zealand Energy Corp.
40 New Zealand Energy Corp. Year Ended December 31, 2011
CONSOLIDATED STATEMENTS OF COMPREHENSIVE LOSS(Expressed in Canadian Dollars)
December 31, 2011$
December 31, 2010$
RevenuesOil sales 1,022,009 -Royalties (47,492) -
974,517 -
Expenses and other itemsProduction costs 224,219 -Depreciation and accretion 246,540 -Talon-1 well impairment 2,544,131 -Stock-based compensation (Note 12a & d) 2,203,548 9,996,000General and administrative 2,583,530 338,469Finance income (119,583) -Foreign exchange gain (134,934) 3,667
7,547,451 10,338,136
Net loss for the year (6,572,934) (10,338,136)Exchange difference on translation of foreign currency (82,895) -
Total comprehensive loss for the year (6,655,829) (10,338,136)
Basic and diluted loss per share (0.08) (0.24)Weighted average shares outstanding 85,122,879 43,005,714
See accompanying notes to the consolidated financial statements.
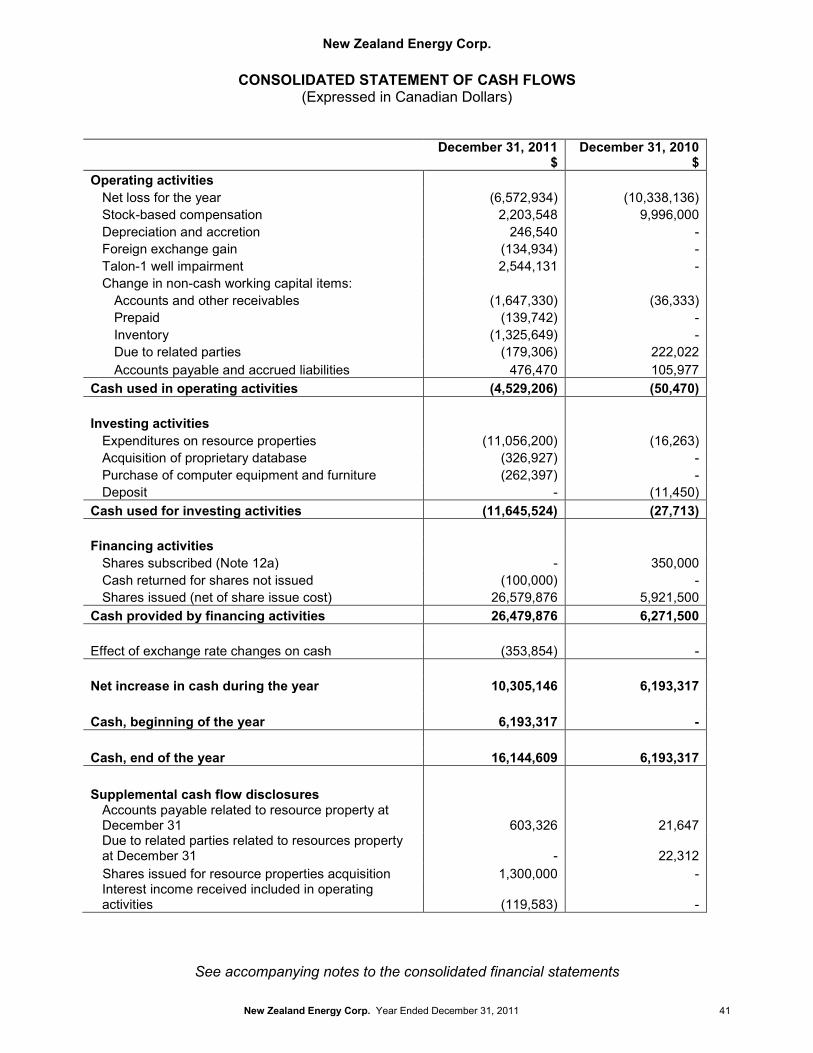
New Zealand Energy Corp.
New Zealand Energy Corp. Year Ended December 31, 2011 41
CONSOLIDATED STATEMENT OF CASH FLOWS(Expressed in Canadian Dollars)
December 31, 2011$
December 31, 2010$
Operating activitiesNet loss for the year (6,572,934) (10,338,136)Stock-based compensation 2,203,548 9,996,000Depreciation and accretion 246,540 -Foreign exchange gain (134,934) -Talon-1 well impairment 2,544,131 -Change in non-cash working capital items:
Accounts and other receivables (1,647,330) (36,333)Prepaid (139,742) -Inventory (1,325,649) -Due to related parties (179,306) 222,022Accounts payable and accrued liabilities 476,470 105,977
Cash used in operating activities (4,529,206) (50,470)
Investing activitiesExpenditures on resource properties (11,056,200) (16,263)Acquisition of proprietary database (326,927) -Purchase of computer equipment and furniture (262,397) -Deposit - (11,450)
Cash used for investing activities (11,645,524) (27,713)
Financing activitiesShares subscribed (Note 12a) - 350,000Cash returned for shares not issued (100,000) -Shares issued (net of share issue cost) 26,579,876 5,921,500
Cash provided by financing activities 26,479,876 6,271,500
Effect of exchange rate changes on cash (353,854) -
Net increase in cash during the year 10,305,146 6,193,317
Cash, beginning of the year 6,193,317 -
Cash, end of the year 16,144,609 6,193,317
Supplemental cash flow disclosuresAccounts payable related to resource property at December 31 603,326 21,647Due to related parties related to resources property at December 31 - 22,312Shares issued for resource properties acquisition 1,300,000 -Interest income received included in operating activities (119,583) -
See accompanying notes to the consolidated financial statements
New Zealand Energy Corp.Notes to Consolidated Financial Statements
December 31, 2011 (Expressed in Canadian Dollars)
42 New Zealand Energy Corp. Year Ended December 31, 2011
1. GENERAL INFORMATION
New Zealand Energy Corp. (“the Corporation”) commenced operations on April 19, 2010 through its now wholly-owned subsidiary, East Coast Energy Ventures Limited. The Corporation was subsequently incorporated under the name 0894134 B.C. Ltd. pursuant to the Business Corporation Act (British Columbia) on October 29, 2010. On November 10, 2010, 0894134 B.C. Ltd. changed its name to New Zealand Energy Corp.
The Corporation, through its subsidiaries, is engaged in the acquisition, exploration, development and production of conventional and unconventional oil and natural gas resources in New Zealand. Since incorporation, the Corporation has completed private placement financings, its Initial Public Offering (the “IPO”) (Note 12a.ii), established an operational structure, set up offices in Vancouver, British Columbia and Wellington, New Zealand, engaged key personnel and acquired its current oil and natural gas assets (Note 9).
The Corporation’s registered and records office is located at Suite 1200-750 West Pender Street, Vancouver, British Columbia, V6C 2T8. The Corporation’s head office is located at Suite 1500-885 West Georgia Street, Vancouver, British Columbia, V6C 3E8.
The Corporation’s shares are listed on the TSX Venture Exchange under the symbol “NZ” and on the OTCQX International Exchange under the symbol “NZERF”.
2. SUMMARY OF SIGNIFICANT ACCOUNTING POLICIES
Basis of Preparation
The consolidated financial statements have been prepared in accordance with International Financial Reporting Standards (“IFRS”) as issued by the International Accounting Standards Board (“IASB”).
These consolidated financial statements have been prepared on a historical cost basis. In addition, these consolidated financial statements have been prepared using the accrual basis of accounting, except for cash flow information.
Basis of Consolidation
The consolidated financial statements include the accounts of the Corporation and its wholly-owned subsidiaries, NZ Holdings Pte. Ltd., NZEC Management Limited, Taranaki Ventures Limited, East Coast Energy Ventures Limited, ECEV II Limited, ECEV III Limited, New Zealand Offshore Ventures Limited and Taranaki Venture II Limited (formerly NZOV II Limited). Control exists when the Corporation has the power, directly or indirectly, to govern the financial and operating policies of an entity so as to obtain benefits from its activities.
All intercompany balances and transactions, income and expenses have been eliminated upon consolidation.
Interest in Joint Venture
The Corporation owns a 50% working interest in a joint venture that conducts oil and gas exploration and development activities in the Alton Permit. The consolidated financial statements
New Zealand Energy Corp.Notes to Consolidated Financial Statements
December 31, 2011 (Expressed in Canadian Dollars)
New Zealand Energy Corp. Year Ended December 31, 2011 43
include the Corporation’s share of the assets, liabilities and cash flows of the joint venture. The Corporation combines its share of the joint ventures’ individual income and expenses, assets and liabilities and cash flows on a line-by-line basis with similar items in the Corporation’s financial statements. Income taxes are recorded based on the Corporation’s share of the joint venture’s activities.
Significant Accounting Estimates and Judgments
The preparation of the consolidated financial statements requires management to make certain estimates, judgments and assumptions that affect the reported amounts of assets and liabilities at the date of the consolidated financial statement and reported amounts of revenues and expenses during the reporting period. Actual outcomes could differ from these estimates. The consolidated financial statements include estimates which, by their nature, are uncertain. The impact of such estimates is pervasive throughout the consolidated financial statements, and may require accounting adjustments based on future occurrences. Revisions to accounting estimates are recognized in the period in which the estimate is revised and future periods if the revision affects both current and future periods. These estimates are based on historical experience, current and future economic conditions and other factors, including expectations of future events that are believed to be reasonable under the circumstances.
The following discussion covers the most significant accounting judgments and estimates that the Company has made in the preparation of the consolidated financial statements.
i. Oil and gas reserve determination
Oil and gas properties are depreciated on a unit-of-production basis at a rate calculated by reference to the proved and probable reserves and incorporating the estimated future cost of development and extracting those reserves. The process of estimating reserves requires significant estimates based on available geological, geophysical, engineering and economic data. The estimate of the economically recoverable oil and natural gas reserves and related future net cash flows incorporates many factors and assumptions including the expected reservoir characteristics, future commodity prices and costs. Future development costs are estimated using assumptions as to the number of wells required to produce the reserves, the cost of such wells and associated production facilities and other capital costs.
ii. Exploration and evaluation assets
Costs incurred to acquire rights to explore for oil and natural gas may be grouped into either exploration and evaluation or property, plant and equipment, depending on facts and circumstances. Costs incurred in respect of properties that have been determined to have proved and probable reserves are classified as property, plant and equipment. In such circumstances, technical feasibility and commercial viability are considered to be established. Costs incurred in respect of new prospects with no nearby established development past or present and no proved or probable reserves assigned are classified as exploration and evaluation assets (Note 9).
iii. Determination of cash generating-units (“CGUs”)
Oil and gas properties, resources properties and other corporate assets are aggregated into CGUs based on their ability to generate largely independent cash flows and are used for impairment testing. CGUs are determined by similar geological structure, shared
New Zealand Energy Corp.Notes to Consolidated Financial Statements
December 31, 2011 (Expressed in Canadian Dollars)
44 New Zealand Energy Corp. Year Ended December 31, 2011
infrastructure, geographical proximity, commodity type, similar exposure to market risks and materiality and are subjected to management’s judgment.
iv. Impairment indicators and calculation of impairment
At each reporting date, the Corporation assesses whether or not there are circumstances that indicate a possibility that the carrying values of exploration and evaluation assets and property, plant and equipment are not recoverable, or impaired. Such circumstances include incidents of physical damage, deterioration of commodity prices, changes in the regulatory environment or a reduction in estimates of proved and probable reserves.
When management judges that circumstances indicate potential impairment, property, plant and equipment are tested for impairment by comparing the carrying values to their recoverable amounts. The recoverable amounts of CGUs are determined based on the higher of value-in-use calculations and fair values less costs to sell. These calculations require the use of estimates and assumptions that are subject to change as new information becomes available, including information on future commodity prices, expected production volumes, quantities of reserves, discount rates, future development costs and operating costs.
v. Asset retirement obligations
The calculation of asset retirement obligation includes estimates of the future costs to settle the liability, the timing of the cash flows to settle the liability, the risk-free rate and the future inflation rates. The impact of differences between actual and estimated costs, timing and inflation on the consolidated financial statements of future period may be material.
vi. Share-based compensation
The fair value of share-based compensation is determined using a Black-Scholes Option pricing model. Such option pricing models require the input of subjective assumptions including the expected price volatility and expected option life. Management considers all appropriate facts and circumstances in making its assessments including historical experience and comparisons to peers in the market. Changes in these assumptions may have a significant impact on the fair value calculation.
Foreign Currency Translation
i. Functional and presentation currency
Items included in the financial statements of each of the Corporation and its subsidiaries are measured using the currency of the primary economic environment in which the entity operates (the “functional currency”).
The functional and reporting currency of the Corporation is the Canadian dollar.
Transactions in foreign currencies are initially recorded in the Corporation’s functional currency at the exchange rate prevailing at the date of the transaction. Monetary assets and liabilities of the Corporation that are denominated in foreign currencies are re-translated to the functional currency at the exchange rate prevailing at the end of each reporting period.
New Zealand Energy Corp.Notes to Consolidated Financial Statements
December 31, 2011 (Expressed in Canadian Dollars)
New Zealand Energy Corp. Year Ended December 31, 2011 45
Non-monetary assets and liabilities are measured in terms of historical cost in a foreign currency and are translated using the exchange rate at the date of the transaction.
ii. Subsidiaries
The Corporation has assessed and determined a change of functional currency of its subsidiaries from Canadian dollar to New Zealand dollar, as this is the principal currency of the economic environment in which they operate.
The results and financial position of subsidiaries that have a functional currency different from the presentation currency are translated into the presentation currency as follows:
• Assets and liabilities are translated at the closing rate at the reporting date;• Income and expenses for each income statement are translated at average exchange
rates for the period; and• All resulting exchange differences are recognized in other comprehensive income as
cumulative translation adjustments.
Cash and Cash Equivalents
Cash comprises cash on hand and deposits held at banks. Cash equivalents consists of short-term highly liquid investments with original maturities of three months or less that are readily convertible to known amounts of cash and which are subject to an insignificant risk of change in value.
Accounts and Other Receivables
Receivables are recognized initially at fair value and subsequently measured at amortized cost using the effective interest rate method less any provisions for uncollectible accounts.
Inventories
Material and supply inventories consist of wellheads, tubular and explosives purchased for use in oil and gas operations and are valued at the lower of cost, or net realizable value. The costs of purchase of material and supply inventories comprise the purchase price, import duties and other taxes, and transport, handling and other costs directly attributable to their acquisition.
Oil inventories are valued at the lower of the cost and net realizable value. Cost comprises operating expenses that have been incurred in bringing inventories to their present location and condition and the portion of depletion expense associated with the oil and condensate production. The cost of inventories is determined using the weighted average cost. Net realizable value is the estimated selling price in the ordinary course of business less the estimated costs necessary to make the sale.
Proprietary Database
The proprietary database is carried at cost and is amortized annually under the straight line method based on a useful life of five years for seismic models and geological data.
The cost of the proprietary database consists of the purchase price and any costs directly attributable to bringing the asset to the condition necessary for its intended use.
New Zealand Energy Corp.Notes to Consolidated Financial Statements
December 31, 2011 (Expressed in Canadian Dollars)
46 New Zealand Energy Corp. Year Ended December 31, 2011
The proprietary database is derecognized upon disposal or when no future economic benefits are expected to arise from the continued use of the asset. Any gain or loss arising from the disposal of the proprietary database shall be determined as the difference between the net disposal proceeds and the carrying amount of the asset, and is recognized as profit or loss within the consolidated statement of comprehensive income or loss.
Property, Plant and Equipment
i. Oil and gas properties
All costs directly associated with the development of oil and gas reserves are capitalized on an area-by-area basis. These costs include proved property acquisitions, development drillings, completion of wells, gathering facilities and infrastructure, asset retirement costs and transfers from exploration and evaluation assets where technical feasibility and commercial viability has been determined.
The net carrying value of oil and gas properties is depreciated using the unit-of-production method by reference to the ratio of production in the year to the related total proved and probable reserves of oil and natural gas, taking into account estimated future development costs necessary to bring those reserves into production.
ii. Computer equipment and furniture
Computer equipment and furniture are carried at cost, less accumulated depreciation. Cost includes expenditures that are directly attributable to the acquisition of the items. When parts of an item of property, plant and equipment have different useful lives, they are accounted for as separate items (major components) of property, plant and equipment.
Computer equipment and furniture are depreciated over the estimated useful life of the assets using the declining balance method at the following rates per annum:
Computer equipment 30%Furniture 20%
The Corporation reviews residual values, depreciation methods and useful lives annually. Any changes in estimates that arise from this review are accounted for prospectively.
Exploration and Evaluation Assets
All costs directly associated with the exploration and evaluation of oil and gas reserves are initially capitalized. Exploration and evaluation costs are those expenditures for an area where technical feasibility and commercial viability has not yet been determined. These costs include unproved property acquisition costs, exploration costs, geological and geophysical costs, asset retirement costs, exploration drilling, sampling and appraisals. When an area is determined to be technically feasible and commercially viable, the accumulated costs are transferred to property, plant and equipment. The decision to transfer exploration and evaluation assets to property, plant and equipment is based on management’s determination of an area’s technical feasibility and commercial viability based on proved and probable reserves.
Exploration and evaluation assets are assessed for impairment if sufficient data exist to determine technical feasibility and commercial viability, and facts and circumstances suggest that the carrying
New Zealand Energy Corp.Notes to Consolidated Financial Statements
December 31, 2011 (Expressed in Canadian Dollars)
New Zealand Energy Corp. Year Ended December 31, 2011 47
amount exceeds the recoverable amount. Exploration and evaluation assets are allocated to CGUs or groups of CGUs for the purposes of assessing such assets for impairment.
Revenue Recognition
Revenue from the sale of oil and natural gas is recorded when the significant risks and rewards of ownership of the product is transferred to the buyer, which is at the delivery point. Revenue is measured at the fair value of the consideration received or receivable. Revenue is presented net of royalties.
Impairment of Non-financial Assets
Assets that are subject to depreciation are reviewed for impairment at each reporting date to determine where there is any indication that the carrying amount may not be recoverable. An impairment loss is recognized for the amount by which the asset’s carrying amount exceeds its recoverable amount. The recoverable amount is the higher of an asset’s fair value less costs to sell and value in use. For the purposes of assessing impairment testing, development costs are allocated to CGUs to which the exploration activity relates.
For impairment losses identified based on a CGU, the loss is allocated on a pro rata basis to the assets within the CGU. The impairment loss is recognized as an expense in the statement of comprehensive income.
Where an impairment loss subsequently reverses, the carrying amount of the asset or CGU is increased to the revised estimate of its recoverable amount, but so that the increased carrying amount does not exceed the carrying amount that would have been determined had no impairmentloss been recognized for the asset or CGU in prior years. A reversal of an impairment loss is recognized immediately in profit or loss.
Accounts Payable and Accrued Liabilities
Trade and other payables represent liabilities for goods and services provided to the Corporation prior to the end of the financial year that are unpaid. The amounts are unsecured and are usually paid within 30 days of recognition. Trade payables are recognized initially at fair value and subsequently measured at amortized cost using the effective interest method.
Provisions / Restoration Provisions
The Corporation recognizes liabilities for statutory, contractual, constructive or legal obligations associated with the retirement of long-lived assets in the period when the liability arises. The net present value of the asset retirement obligation is capitalized to the long-lived asset to which it relates with a corresponding increase to the liability in the period incurred.
Changes in the liability for an asset retirement obligation due to the passage of time will be measured by applying the effective interest rate method. The amount will be recognized as an increase in the liability and accretion expense in the statement of comprehensive loss. Changes resulting from revisions to the timing, discount rates, regulatory requirements or the amount of the original estimate of undiscounted cash flows are recognized as an increase or a decrease to the carrying amount of the liability and the related long-lived asset. The Corporation’s estimates are reviewed at the end of each reporting period for such changes.
New Zealand Energy Corp.Notes to Consolidated Financial Statements
December 31, 2011 (Expressed in Canadian Dollars)
48 New Zealand Energy Corp. Year Ended December 31, 2011
The liability for the Corporation’s asset retirement obligation is recorded in the period in which it is incurred and discounted to its present value using a risk free rate of 3%, and the corresponding amount is recognized by increasing the carrying amount of the oil and gas resource properties. The liability is accreted each period with the accretion expense recognized in the statement of comprehensive loss, and the capitalized cost is depreciated over the useful life of the related asset when put into use using the unit-of-production method.
Share Capital
Common shares are classified as equity. Transaction costs directly attributable to the issue of common shares and share options are recognized as a deduction from equity, net of any tax effects.
Common shares issued for non-monetary consideration are recorded at their fair value on the measurement date. The measurement date is defined as the earliest of the date at which thecommitment for performance by the counterparty to earn the common shares is reached or the date at which the counterparty’s performance is complete.
Share-based Payments
The share option plan allows the Corporation’s employees and consultants to acquire shares of the Corporation. The fair value of options granted is recognized as a share-based payment expense with a corresponding increase in equity settled share-based payments reserve in equity. An individual is classified as an employee when the individual is an employee for legal or tax purposes (direct employee) or provides services similar to those performed by a direct employee.
Equity-settled share-based payment transactions with non-employees are measured at the fair value of the goods or services received. However if the fair value cannot be estimated reliably, the share-based payment transaction is measured at the fair value of the equity instruments granted at the date the non-employee received the goods or the services.
The fair value is measured at grant date and each tranche is recognized on a graded-vesting basis over the period during which the options vest. The fair value of the options granted is measured using the Black-Scholes option pricing model taking into account the terms and conditions upon which the options were granted. At each financial position reporting date, the amount recognized as an expense is adjusted to reflect the actual number of share options that are expected to vest.
Income Taxes
Any income tax provided on profit or loss for the periods presented comprises current and deferred tax. Income tax is recognized in profit or loss except to the extent that it relates to items recognized directly in equity, in which case it is recognized in equity.
Deferred tax assets and liabilities are recognized for deferred tax consequences attributable to differences between the financial statement carrying amounts of existing assets and liabilities and their respective tax bases. Deferred tax assets and liabilities are measured using the enacted or substantively enacted tax rates expected to apply when the asset is realized or the liability settled. The effect on deferred tax assets and liabilities of a change in tax rates is recognized in income in the period that substantive enactment occurs.
New Zealand Energy Corp.Notes to Consolidated Financial Statements
December 31, 2011 (Expressed in Canadian Dollars)
New Zealand Energy Corp. Year Ended December 31, 2011 49
A deferred tax asset is recognized to the extent that it is probable that future taxable profits will be available against which the asset can be used. To the extent that the Corporation does not consider it probable that a deferred tax asset will be recovered, the deferred tax asset is reduced.
Loss per Share
The Corporation presents basic and diluted loss per share data for its common shares, calculated by dividing the loss attributable to common shareholders of the Corporation by the weighted average number of common shares outstanding during the period. Diluted loss per share is determined by adjusting the loss attributable to common shareholders and the weighted average number of common shares outstanding for the effects of all dilutive potential common shares.
Segment Reporting
Operating segments are reported in a manner consistent with the internal reporting provided to the chief operating decision maker. The chief operating decision makers, who are responsible for allocating resources and assessing performance of the operating segment, have been identified as the President and Chief Executive Officer.
Accounting Pronouncements Not Yet Effective
The Corporation has not yet adopted certain new standards, amendments and interpretations to existing standards, which have been published but are only effective for the Corporation’s accounting periods beginning on or after January 1, 2013. These include:
• IFRS 9 – Financial Instruments: Classification and Measurement (effective after January 1, 2015)• IFRS 10 – Consolidated Financial Statements• IFRS 11 – Joint Arrangement• IFRS 12 – Disclosure of Interests in Other Entities• IFRS 13 – Fair Value Measurement
The Corporation is still in the process of assessing the impact of these standards on the financial statements.
3. FINANCIAL RISK MANAGEMENT
The Corporation’s activities expose it to a variety of financial risks, including credit risk, liquidity risk, foreign exchange risk, interest rate risk, price risk and fair value risk. The Corporation’s overall risk management program focuses on the unpredictability of financial markets and seeks to minimise potential adverse effects on the financial performance of the Corporation.
This note presents information about the Corporation’s exposure to each of these risks, the Corporation’s objectives and processes for measuring and managing risk, and the Corporation’s management of capital.
The Board of Directors has overall responsibility for the establishment and oversight of the Corporation’s risk management framework.
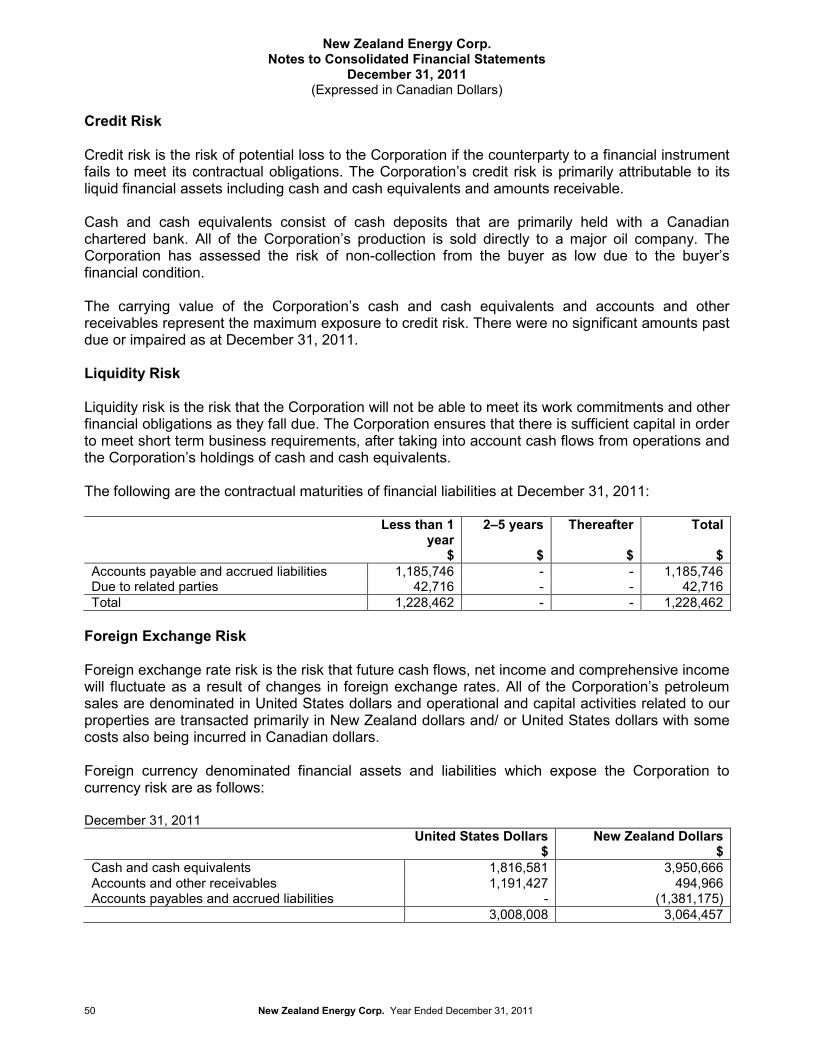
New Zealand Energy Corp.Notes to Consolidated Financial Statements
December 31, 2011 (Expressed in Canadian Dollars)
50 New Zealand Energy Corp. Year Ended December 31, 2011
Credit Risk
Credit risk is the risk of potential loss to the Corporation if the counterparty to a financial instrument fails to meet its contractual obligations. The Corporation’s credit risk is primarily attributable to its liquid financial assets including cash and cash equivalents and amounts receivable.
Cash and cash equivalents consist of cash deposits that are primarily held with a Canadian chartered bank. All of the Corporation’s production is sold directly to a major oil company. The Corporation has assessed the risk of non-collection from the buyer as low due to the buyer’s financial condition.
The carrying value of the Corporation’s cash and cash equivalents and accounts and other receivables represent the maximum exposure to credit risk. There were no significant amounts past due or impaired as at December 31, 2011.
Liquidity Risk
Liquidity risk is the risk that the Corporation will not be able to meet its work commitments and other financial obligations as they fall due. The Corporation ensures that there is sufficient capital in order to meet short term business requirements, after taking into account cash flows from operations and the Corporation’s holdings of cash and cash equivalents.
The following are the contractual maturities of financial liabilities at December 31, 2011:
Less than 1 year
$
2–5 years
$
Thereafter
$
Total
$Accounts payable and accrued liabilities 1,185,746 - - 1,185,746Due to related parties 42,716 - - 42,716Total 1,228,462 - - 1,228,462
Foreign Exchange Risk
Foreign exchange rate risk is the risk that future cash flows, net income and comprehensive income will fluctuate as a result of changes in foreign exchange rates. All of the Corporation’s petroleum sales are denominated in United States dollars and operational and capital activities related to our properties are transacted primarily in New Zealand dollars and/ or United States dollars with some costs also being incurred in Canadian dollars.
Foreign currency denominated financial assets and liabilities which expose the Corporation to currency risk are as follows:
December 31, 2011United States Dollars
$New Zealand Dollars
$Cash and cash equivalents 1,816,581 3,950,666Accounts and other receivables 1,191,427 494,966Accounts payables and accrued liabilities - (1,381,175)
3,008,008 3,064,457
New Zealand Energy Corp.Notes to Consolidated Financial Statements
December 31, 2011 (Expressed in Canadian Dollars)
New Zealand Energy Corp. Year Ended December 31, 2011 51
December 31, 2010United States Dollars
$New Zealand Dollars
$Cash and cash equivalents 197,390 -
197,390 -
The impact on the net loss of a 10% increase or decrease in United States Dollars on the Corporation’s financial instruments based on balances at December 31, 2011 would be $322,000 ($20,000 at December 31, 2010). The impact on net loss of a 10% increase or decrease in New Zealand Dollars on the Corporation’s financial instruments based on balances at December 31, 2011 would be $234,000 ($nil at December 31, 2010).
Interest Rate Risk
Interest rate risk is the risk that future cash flows will fluctuate as a result of changes in market interest rates. The Corporation is exposed to interest rate fluctuations on its cash and cash equivalents, which bear a floating rate of interest. Sensitivity to a 1% increase or decrease in interest rate would affect the reported loss by approximately $161,000.
The Corporation has no debt that carries interest rate risk.
Price Risk
Price risk is the risk that future cash flows will fluctuate as a result of changes in commodity prices, affecting results of operations and cash generated from operating activities. Such prices may also affect the value of resources properties and the level of spending for future activities. Prices received by the Corporation for its production are largely beyond the Corporation’s control as petroleum prices are impacted by world economic events that dictate the levels of supply and demand. All of the Corporation’s oil production is sold at spot rates, exposing the Corporation to the risk of price movements.
Fair Value
The carrying value of cash and cash equivalents, amounts receivable, accounts payable and accrued liabilities and due to related parties are considered to be a reasonable approximation of fair value because of the short-term maturity of these instruments.
4. CAPITAL RISK MANAGEMENT
The Corporation’s capital includes share capital, shares subscribed, contributed surplus and the cumulative deficit. The Corporation’s objectives when managing capital are to safeguard the entity’s ability to continue as a going concern, so that it can continue to provide returns for shareholders and benefits for other stakeholders. The Corporation manages the capital structure and makes adjustments to it in the light of changes in economic conditions and the risk characteristics of the underlying assets. The Corporation may issue new shares in order to meet its financial obligations.
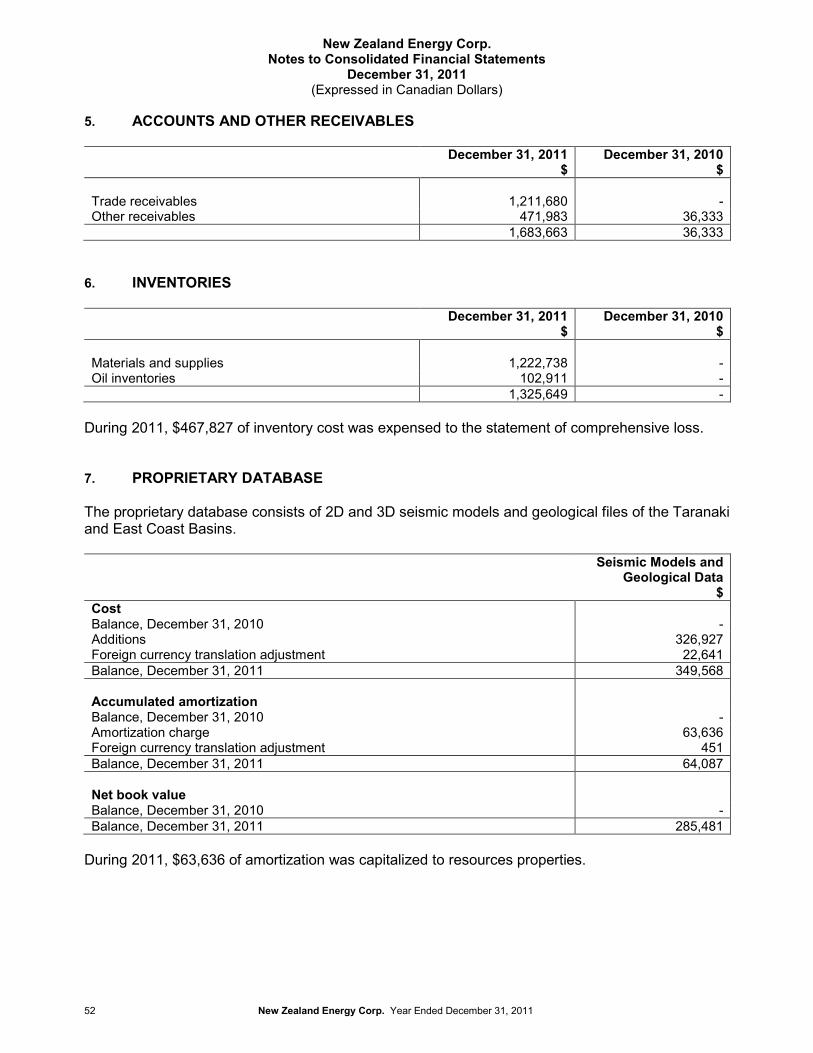
New Zealand Energy Corp.Notes to Consolidated Financial Statements
December 31, 2011 (Expressed in Canadian Dollars)
52 New Zealand Energy Corp. Year Ended December 31, 2011
5. ACCOUNTS AND OTHER RECEIVABLES
December 31, 2011$
December 31, 2010$
Trade receivables 1,211,680 -Other receivables 471,983 36,333
1,683,663 36,333
6. INVENTORIES
December 31, 2011$
December 31, 2010$
Materials and supplies 1,222,738 -Oil inventories 102,911 -
1,325,649 -
During 2011, $467,827 of inventory cost was expensed to the statement of comprehensive loss.
7. PROPRIETARY DATABASE
The proprietary database consists of 2D and 3D seismic models and geological files of the Taranaki and East Coast Basins.
Seismic Models and Geological Data
$CostBalance, December 31, 2010 -Additions 326,927Foreign currency translation adjustment 22,641Balance, December 31, 2011 349,568
Accumulated amortizationBalance, December 31, 2010 -Amortization charge 63,636Foreign currency translation adjustment 451Balance, December 31, 2011 64,087
Net book valueBalance, December 31, 2010 -Balance, December 31, 2011 285,481
During 2011, $63,636 of amortization was capitalized to resources properties.
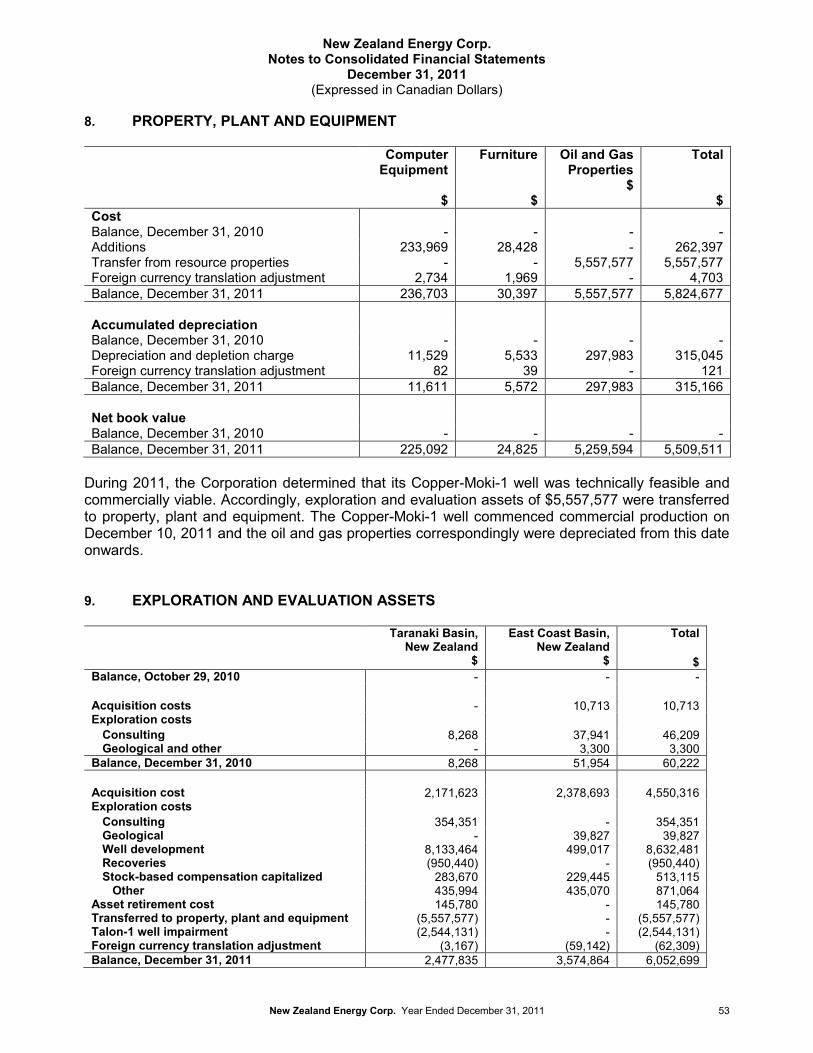
New Zealand Energy Corp.Notes to Consolidated Financial Statements
December 31, 2011 (Expressed in Canadian Dollars)
New Zealand Energy Corp. Year Ended December 31, 2011 53
8. PROPERTY, PLANT AND EQUIPMENT
Computer Equipment
$
Furniture
$
Oil and Gas Properties
$
Total
$CostBalance, December 31, 2010 - - - -Additions 233,969 28,428 - 262,397Transfer from resource properties - - 5,557,577 5,557,577Foreign currency translation adjustment 2,734 1,969 - 4,703Balance, December 31, 2011 236,703 30,397 5,557,577 5,824,677
Accumulated depreciationBalance, December 31, 2010 - - - -Depreciation and depletion charge 11,529 5,533 297,983 315,045Foreign currency translation adjustment 82 39 - 121Balance, December 31, 2011 11,611 5,572 297,983 315,166
Net book valueBalance, December 31, 2010 - - - -Balance, December 31, 2011 225,092 24,825 5,259,594 5,509,511
During 2011, the Corporation determined that its Copper-Moki-1 well was technically feasible and commercially viable. Accordingly, exploration and evaluation assets of $5,557,577 were transferred to property, plant and equipment. The Copper-Moki-1 well commenced commercial production on December 10, 2011 and the oil and gas properties correspondingly were depreciated from this date onwards.
9. EXPLORATION AND EVALUATION ASSETS
Taranaki Basin,New Zealand
$
East Coast Basin,New Zealand
$
Total
$Balance, October 29, 2010 - - -
Acquisition costs - 10,713 10,713 Exploration costs
Consulting 8,268 37,941 46,209Geological and other - 3,300 3,300
Balance, December 31, 2010 8,268 51,954 60,222
Acquisition cost 2,171,623 2,378,693 4,550,316 Exploration costs
Consulting 354,351 - 354,351 Geological - 39,827 39,827Well development 8,133,464 499,017 8,632,481Recoveries (950,440) - (950,440)Stock-based compensation capitalized 283,670 229,445 513,115
Other 435,994 435,070 871,064Asset retirement cost 145,780 - 145,780Transferred to property, plant and equipment (5,557,577) - (5,557,577)Talon-1 well impairment (2,544,131) - (2,544,131)Foreign currency translation adjustment (3,167) (59,142) (62,309)Balance, December 31, 2011 2,477,835 3,574,864 6,052,699
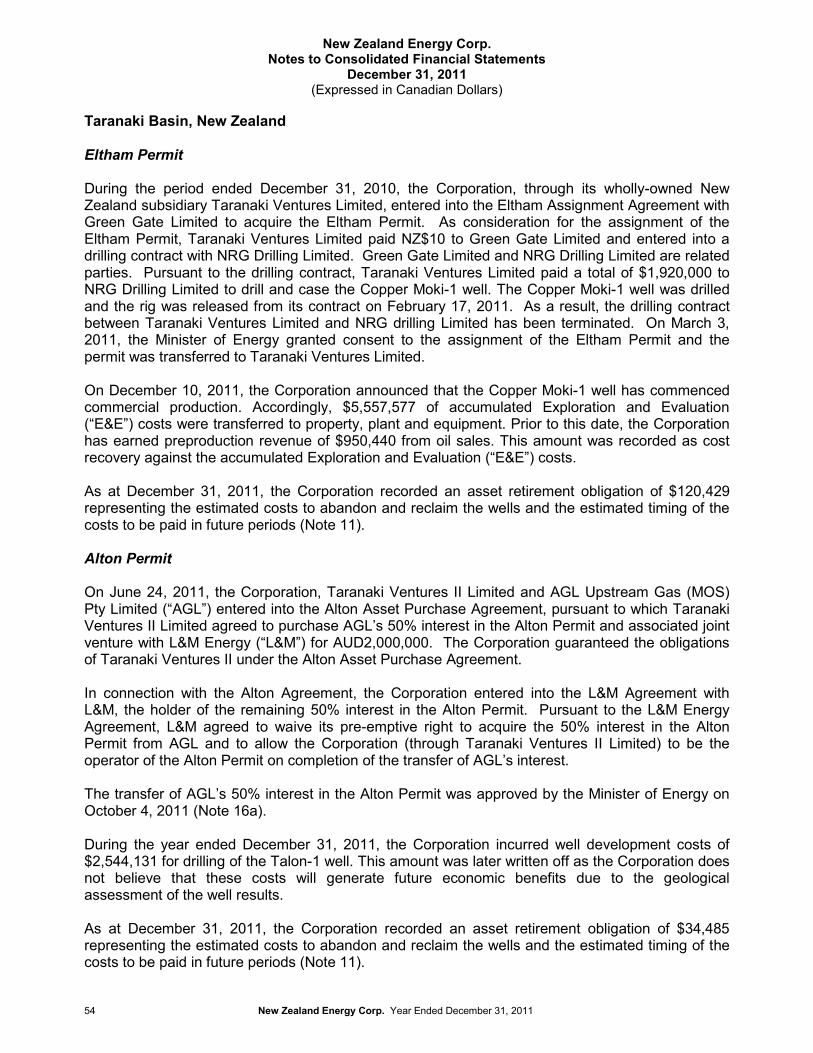
New Zealand Energy Corp.Notes to Consolidated Financial Statements
December 31, 2011 (Expressed in Canadian Dollars)
54 New Zealand Energy Corp. Year Ended December 31, 2011
Taranaki Basin, New Zealand
Eltham Permit
During the period ended December 31, 2010, the Corporation, through its wholly-owned New Zealand subsidiary Taranaki Ventures Limited, entered into the Eltham Assignment Agreement with Green Gate Limited to acquire the Eltham Permit. As consideration for the assignment of the Eltham Permit, Taranaki Ventures Limited paid NZ$10 to Green Gate Limited and entered into a drilling contract with NRG Drilling Limited. Green Gate Limited and NRG Drilling Limited are related parties. Pursuant to the drilling contract, Taranaki Ventures Limited paid a total of $1,920,000 to NRG Drilling Limited to drill and case the Copper Moki-1 well. The Copper Moki-1 well was drilled and the rig was released from its contract on February 17, 2011. As a result, the drilling contract between Taranaki Ventures Limited and NRG drilling Limited has been terminated. On March 3, 2011, the Minister of Energy granted consent to the assignment of the Eltham Permit and the permit was transferred to Taranaki Ventures Limited.
On December 10, 2011, the Corporation announced that the Copper Moki-1 well has commenced commercial production. Accordingly, $5,557,577 of accumulated Exploration and Evaluation (“E&E”) costs were transferred to property, plant and equipment. Prior to this date, the Corporation has earned preproduction revenue of $950,440 from oil sales. This amount was recorded as cost recovery against the accumulated Exploration and Evaluation (“E&E”) costs.
As at December 31, 2011, the Corporation recorded an asset retirement obligation of $120,429 representing the estimated costs to abandon and reclaim the wells and the estimated timing of the costs to be paid in future periods (Note 11).
Alton Permit
On June 24, 2011, the Corporation, Taranaki Ventures II Limited and AGL Upstream Gas (MOS) Pty Limited (“AGL”) entered into the Alton Asset Purchase Agreement, pursuant to which Taranaki Ventures II Limited agreed to purchase AGL’s 50% interest in the Alton Permit and associated joint venture with L&M Energy (“L&M”) for AUD2,000,000. The Corporation guaranteed the obligations of Taranaki Ventures II under the Alton Asset Purchase Agreement.
In connection with the Alton Agreement, the Corporation entered into the L&M Agreement with L&M, the holder of the remaining 50% interest in the Alton Permit. Pursuant to the L&M Energy Agreement, L&M agreed to waive its pre-emptive right to acquire the 50% interest in the Alton Permit from AGL and to allow the Corporation (through Taranaki Ventures II Limited) to be the operator of the Alton Permit on completion of the transfer of AGL’s interest.
The transfer of AGL’s 50% interest in the Alton Permit was approved by the Minister of Energy on October 4, 2011 (Note 16a).
During the year ended December 31, 2011, the Corporation incurred well development costs of $2,544,131 for drilling of the Talon-1 well. This amount was later written off as the Corporation does not believe that these costs will generate future economic benefits due to the geological assessment of the well results.
As at December 31, 2011, the Corporation recorded an asset retirement obligation of $34,485 representing the estimated costs to abandon and reclaim the wells and the estimated timing of the costs to be paid in future periods (Note 11).
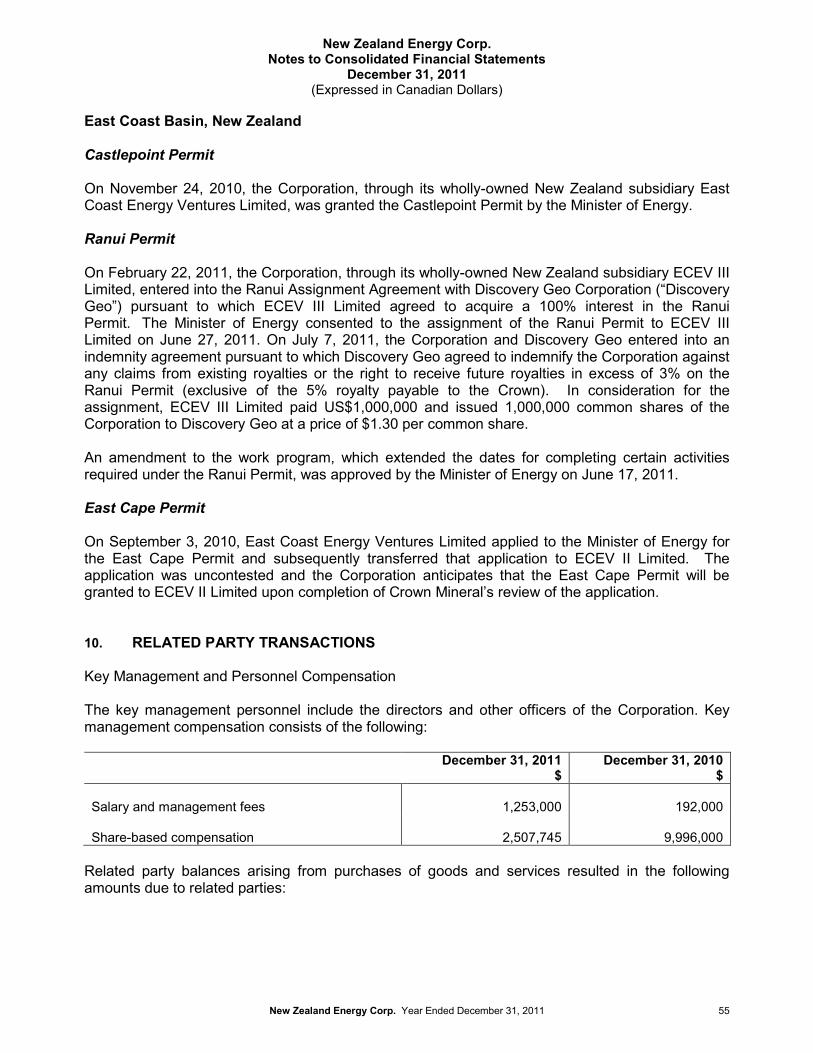
New Zealand Energy Corp.Notes to Consolidated Financial Statements
December 31, 2011 (Expressed in Canadian Dollars)
New Zealand Energy Corp. Year Ended December 31, 2011 55
East Coast Basin, New Zealand
Castlepoint Permit
On November 24, 2010, the Corporation, through its wholly-owned New Zealand subsidiary East Coast Energy Ventures Limited, was granted the Castlepoint Permit by the Minister of Energy.
Ranui Permit
On February 22, 2011, the Corporation, through its wholly-owned New Zealand subsidiary ECEV III Limited, entered into the Ranui Assignment Agreement with Discovery Geo Corporation (“Discovery Geo”) pursuant to which ECEV III Limited agreed to acquire a 100% interest in the Ranui Permit. The Minister of Energy consented to the assignment of the Ranui Permit to ECEV III Limited on June 27, 2011. On July 7, 2011, the Corporation and Discovery Geo entered into an indemnity agreement pursuant to which Discovery Geo agreed to indemnify the Corporation against any claims from existing royalties or the right to receive future royalties in excess of 3% on the Ranui Permit (exclusive of the 5% royalty payable to the Crown). In consideration for the assignment, ECEV III Limited paid US$1,000,000 and issued 1,000,000 common shares of the Corporation to Discovery Geo at a price of $1.30 per common share.
An amendment to the work program, which extended the dates for completing certain activities required under the Ranui Permit, was approved by the Minister of Energy on June 17, 2011.
East Cape Permit
On September 3, 2010, East Coast Energy Ventures Limited applied to the Minister of Energy for the East Cape Permit and subsequently transferred that application to ECEV II Limited. The application was uncontested and the Corporation anticipates that the East Cape Permit will be granted to ECEV II Limited upon completion of Crown Mineral’s review of the application.
10. RELATED PARTY TRANSACTIONS
Key Management and Personnel Compensation
The key management personnel include the directors and other officers of the Corporation. Key management compensation consists of the following:
December 31, 2011$
December 31, 2010$
Salary and management fees 1,253,000 192,000
Share-based compensation 2,507,745 9,996,000
Related party balances arising from purchases of goods and services resulted in the following amounts due to related parties:
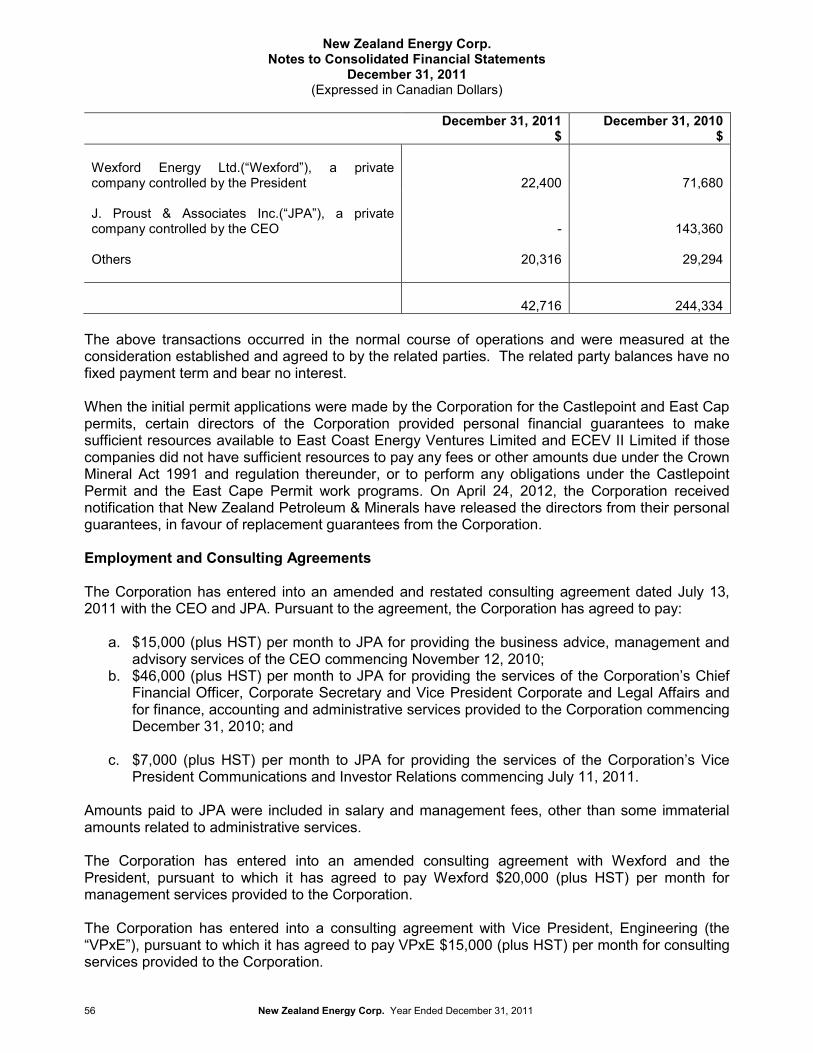
New Zealand Energy Corp.Notes to Consolidated Financial Statements
December 31, 2011 (Expressed in Canadian Dollars)
56 New Zealand Energy Corp. Year Ended December 31, 2011
December 31, 2011$
December 31, 2010$
Wexford Energy Ltd.(“Wexford”), a private company controlled by the President 22,400 71,680
J. Proust & Associates Inc.(“JPA”), a private company controlled by the CEO - 143,360
Others 20,316 29,294
42,716 244,334
The above transactions occurred in the normal course of operations and were measured at the consideration established and agreed to by the related parties. The related party balances have no fixed payment term and bear no interest.
When the initial permit applications were made by the Corporation for the Castlepoint and East Cap permits, certain directors of the Corporation provided personal financial guarantees to make sufficient resources available to East Coast Energy Ventures Limited and ECEV II Limited if those companies did not have sufficient resources to pay any fees or other amounts due under the Crown Mineral Act 1991 and regulation thereunder, or to perform any obligations under the Castlepoint Permit and the East Cape Permit work programs. On April 24, 2012, the Corporation received notification that New Zealand Petroleum & Minerals have released the directors from their personal guarantees, in favour of replacement guarantees from the Corporation.
Employment and Consulting Agreements
The Corporation has entered into an amended and restated consulting agreement dated July 13, 2011 with the CEO and JPA. Pursuant to the agreement, the Corporation has agreed to pay:
a. $15,000 (plus HST) per month to JPA for providing the business advice, management and advisory services of the CEO commencing November 12, 2010;
b. $46,000 (plus HST) per month to JPA for providing the services of the Corporation’s Chief Financial Officer, Corporate Secretary and Vice President Corporate and Legal Affairs and for finance, accounting and administrative services provided to the Corporation commencing December 31, 2010; and
c. $7,000 (plus HST) per month to JPA for providing the services of the Corporation’s Vice President Communications and Investor Relations commencing July 11, 2011.
Amounts paid to JPA were included in salary and management fees, other than some immaterial amounts related to administrative services.
The Corporation has entered into an amended consulting agreement with Wexford and the President, pursuant to which it has agreed to pay Wexford $20,000 (plus HST) per month for management services provided to the Corporation.
The Corporation has entered into a consulting agreement with Vice President, Engineering (the “VPxE”), pursuant to which it has agreed to pay VPxE $15,000 (plus HST) per month for consulting services provided to the Corporation.
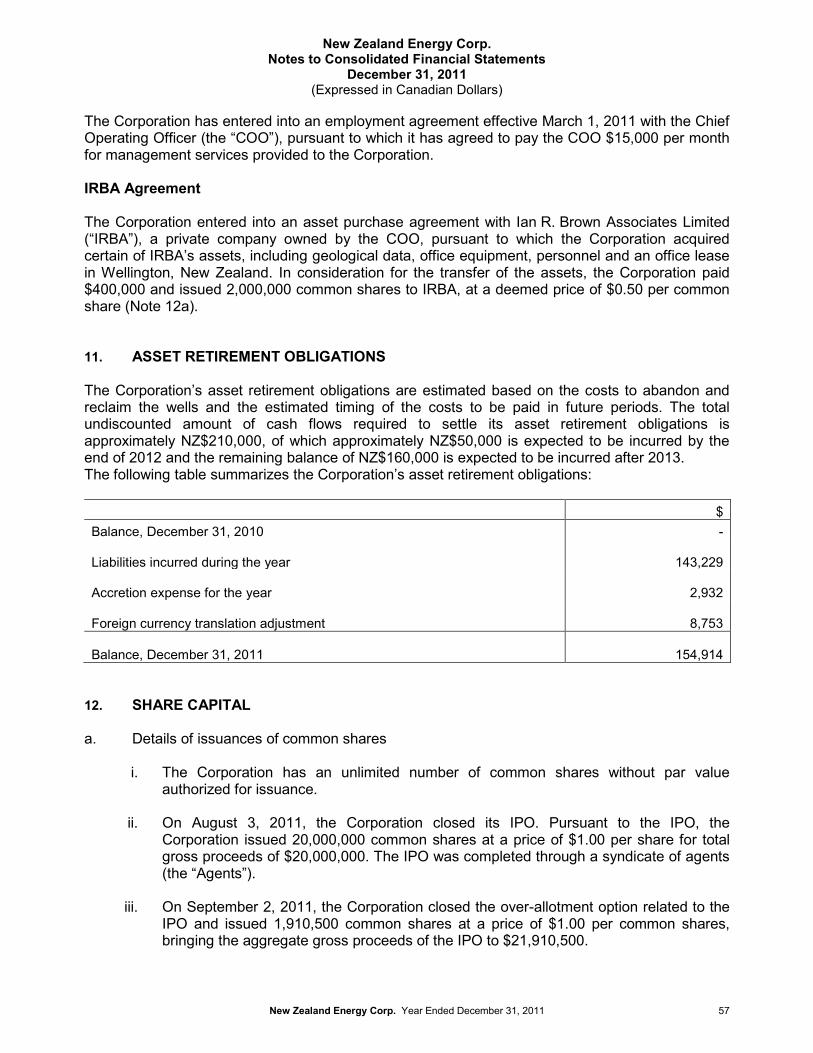
New Zealand Energy Corp.Notes to Consolidated Financial Statements
December 31, 2011 (Expressed in Canadian Dollars)
New Zealand Energy Corp. Year Ended December 31, 2011 57
The Corporation has entered into an employment agreement effective March 1, 2011 with the Chief Operating Officer (the “COO”), pursuant to which it has agreed to pay the COO $15,000 per month for management services provided to the Corporation.
IRBA Agreement
The Corporation entered into an asset purchase agreement with Ian R. Brown Associates Limited (“IRBA”), a private company owned by the COO, pursuant to which the Corporation acquired certain of IRBA’s assets, including geological data, office equipment, personnel and an office lease in Wellington, New Zealand. In consideration for the transfer of the assets, the Corporation paid $400,000 and issued 2,000,000 common shares to IRBA, at a deemed price of $0.50 per common share (Note 12a).
11. ASSET RETIREMENT OBLIGATIONS
The Corporation’s asset retirement obligations are estimated based on the costs to abandon and reclaim the wells and the estimated timing of the costs to be paid in future periods. The total undiscounted amount of cash flows required to settle its asset retirement obligations is approximately NZ$210,000, of which approximately NZ$50,000 is expected to be incurred by the end of 2012 and the remaining balance of NZ$160,000 is expected to be incurred after 2013.The following table summarizes the Corporation’s asset retirement obligations:
$Balance, December 31, 2010 -
Liabilities incurred during the year 143,229
Accretion expense for the year 2,932
Foreign currency translation adjustment 8,753
Balance, December 31, 2011 154,914
12. SHARE CAPITAL
a. Details of issuances of common shares
i. The Corporation has an unlimited number of common shares without par value authorized for issuance.
ii. On August 3, 2011, the Corporation closed its IPO. Pursuant to the IPO, the Corporation issued 20,000,000 common shares at a price of $1.00 per share for total gross proceeds of $20,000,000. The IPO was completed through a syndicate of agents (the “Agents”).
iii. On September 2, 2011, the Corporation closed the over-allotment option related to the IPO and issued 1,910,500 common shares at a price of $1.00 per common shares, bringing the aggregate gross proceeds of the IPO to $21,910,500.
New Zealand Energy Corp.Notes to Consolidated Financial Statements
December 31, 2011 (Expressed in Canadian Dollars)
58 New Zealand Energy Corp. Year Ended December 31, 2011
iv. In connection to the IPO and the over-allotment option related to the IPO, the Corporation paid its Agents $626,565 and issued 688,605 common shares of the Corporation as a finders’ fee. The Corporation also issued 657,315 share purchase warrants to the Agent, exercisable at $1.00 until February 3, 2013.
v. During the year ended December 31, 2011, the Corporation incurred $286,805 of professional fees related to the IPO and recorded them as share issue costs within equity.
vi. During the year ended December 31, 2011, the Corporation issued 1,000,000 common shares at $1.30 per common share for a resource property acquisition.
vii. On February 11, 2011, the Corporation issued 4,330,000 common shares at a price of $0.25 per share and 7,010,000 common shares at a price of $0.75 per share by way of private placements. The Corporation also issued 2,000,000 common shares, in escrow shares, to IRBA at a deemed price of $0.50 per share pursuant to an asset purchase agreement dated February 21, 2011. As a result, $1,000,000 of stock-based compensation was expensed during the year ended December 31, 2011.
viii. During the period ended December 31, 2010, the Corporation completed seed financings composed of 40,000,000 common shares issued at a price of $0.0001 and 23,670,000 common shares issued at a price of $0.25 per share. The Corporation also received $350,000 in advance for future share issuances, $100,000 of which was returned during the year ended December 31, 2011.
ix. The fair value of the 40,000,000 common shares, issued at $0.0001 per share, in escrow shares issued to the founders of the Corporation was determined to be $10,000,000, or $0.25 per share. As a result, $9,996,000 of stock-based compensation was expensed in the period ended December 31, 2010.
b. Escrowed shares
In accordance with a lockup agreement, an escrow agreement and a pooling agreement, 46,394,334 common shares owned or controlled by certain directors and officers of the Corporation were escrowed at August 3, 2011. Subsequent to year end, all officers and directors entered into voluntary lock-up agreements, in conjunction with the March 2012 financing, whereby they agreed not to deal in the Corporation securities on or before July 19, 2012 or 120 days after the completion of the March 2012 financing (Note 16b). The shares will be released over 36 months from August 3, 2011 as follows:
Release date Number of common sharesAugust 3, 2011 200,000 (released)February 3, 2012 300,000 (released)July 19, 2012 5,853,934August 3, 2012 6,773,400February 3, 2013 8,851,200August 3, 2013 8,851,200February 3, 2014 8,851,200August 3, 2014 6,713,400Total 46,394,334
New Zealand Energy Corp.Notes to Consolidated Financial Statements
December 31, 2011 (Expressed in Canadian Dollars)
New Zealand Energy Corp. Year Ended December 31, 2011 59
c. Supplementary escrowed shares
In accordance with a supplementary pooling agreement, 31,945,666 additional common shares not owned or controlled by certain directors and officers of the Corporation were escrowed at the August 3, 2011. The shares will be released over 12 months from the August 3, 2011 as follows:
Release date Number of common sharesAugust 3, 2011 7,693,266 (released)September 3, 2011 851,600 (released)October 3, 2011 851,600 (released)November 3, 2011 6,063,100 (released)December 3, 2011 851,600 (released)February 3, 2012 5,211,500 (released)May 3, 2012 5,211,500August 3, 2012 5,211,500Total 31,945,666
d. Share purchase option
The Corporation has adopted a stock option plan which provides that the Board of Directors of the Corporation may from time to time, at their discretion, and in accordance with TSX Venture Exchange requirements, grant to its directors, officers, employees and consultants non-transferable options to purchase common shares, provided that the number of common shares reserved for issue does not exceed 10% of the number of then outstanding common shares. Such options can be exercisable for a maximum of five years from the date of grant. The exercise price of each share option is set by the Board of Directors at the time of grant but cannot be less than the market price. Vesting of share options is at the discretion of the Board of Directors at the time the options are granted.
A continuity of share purchase options for the year ended December 31, 2011 is as follows:
Expiry date Exercise price
December 31, 2010
Granted (Cancelled) December 31, 2011
Exercisable
August 3, 2016 $1.00 - 4,828,000 - 4,828,000 -October 16,2016 $1.00 - 20,000 - 20,000 -December 1, 2016 $1.00 - 450,000 - 450,000 -
Total - 5,298,000 - 5,298,000 -
Weighted average exercise price $1.00 - $1.00 -Weighted average remaining contractual life (years ) - 4.55
The total expense relating to share purchase options incurred for the year ended December 31, 2011 was $1,716,018 of which $1,203,548 has been expensed in the statement of comprehensive loss and $512,470 has been capitalized to resources properties.
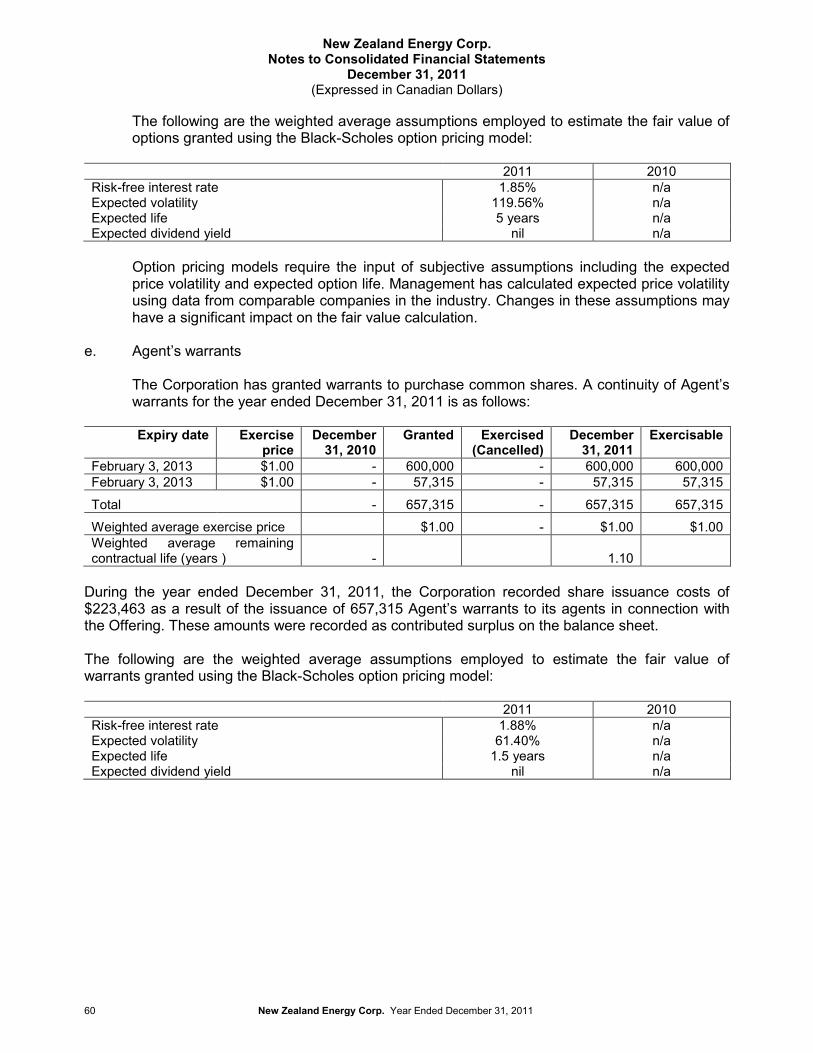
New Zealand Energy Corp.Notes to Consolidated Financial Statements
December 31, 2011 (Expressed in Canadian Dollars)
60 New Zealand Energy Corp. Year Ended December 31, 2011
The following are the weighted average assumptions employed to estimate the fair value of options granted using the Black-Scholes option pricing model:
2011 2010Risk-free interest rate 1.85% n/aExpected volatility 119.56% n/aExpected life 5 years n/aExpected dividend yield nil n/a
Option pricing models require the input of subjective assumptions including the expected price volatility and expected option life. Management has calculated expected price volatility using data from comparable companies in the industry. Changes in these assumptions may have a significant impact on the fair value calculation.
e. Agent’s warrants
The Corporation has granted warrants to purchase common shares. A continuity of Agent’s warrants for the year ended December 31, 2011 is as follows:
Expiry date Exercise price
December 31, 2010
Granted Exercised (Cancelled)
December 31, 2011
Exercisable
February 3, 2013 $1.00 - 600,000 - 600,000 600,000February 3, 2013 $1.00 - 57,315 - 57,315 57,315
Total - 657,315 - 657,315 657,315
Weighted average exercise price $1.00 - $1.00 $1.00Weighted average remaining contractual life (years ) - 1.10
During the year ended December 31, 2011, the Corporation recorded share issuance costs of $223,463 as a result of the issuance of 657,315 Agent’s warrants to its agents in connection with the Offering. These amounts were recorded as contributed surplus on the balance sheet.
The following are the weighted average assumptions employed to estimate the fair value of warrants granted using the Black-Scholes option pricing model:
2011 2010Risk-free interest rate 1.88% n/aExpected volatility 61.40% n/aExpected life 1.5 years n/aExpected dividend yield nil n/a
New Zealand Energy Corp.Notes to Consolidated Financial Statements
December 31, 2011 (Expressed in Canadian Dollars)
New Zealand Energy Corp. Year Ended December 31, 2011 61
13. INCOME TAX
A reconciliation of the income tax benefit determined by applying the Canadian income tax rates to the consolidated loss for the year ended December 31, 2011 and 2010 has been prepared as follows:
2011$
2010$
Loss before income taxes 6,572,934 10,338,136
Income tax recovery at statutory rates (1,741,828) (2,946,369)Permanent difference – stock-based compensation 719,744Effect of tax rates in other jurisdictions 426,977 92Change in statutory tax rateUnrecognized tax assetsOthers -Deferred income tax expense - -
The significant components of the Corporation’s deferred income tax assets and liabilities are as follows:
December 31, 2011$
December 31, 2010$
Deferred income tax assets (liabilities)Non-capital losses available for future periods 4,004,535 100,590Resources property (1,551,171) (15,056)Property, plant and equipment (1,347,938) -Share issue costs 421,346 -
Unrecognized deferred tax assets (1,526,772) (85,534)- -
The above losses available for future years have been determined by applying a Canadian income tax rate of 26.5% and a New Zealand tax rate of 28%. These tax benefits have not been recognized in the consolidated financial statements, as the benefits are not, more likely than not, going to be realized.
Subject to certain restrictions, the Corporation has operating losses available to reduce future taxable income as follows:
Canada Foreign$
Total$
Expiring – 2030 to 2031 3,090,153 - 3,090,153Carry-forward indefinitely - 12,927,986 12,927,986Total 3,090,153 12,927,986 16,018,139
14. SEGMENTED INFORMATION
The Corporation conducts its business as a single operating segment being the acquisition, exploration, development and production of conventional and unconventional oil and natural gas resources in New Zealand. All resource properties are situated in New Zealand.
New Zealand Energy Corp.Notes to Consolidated Financial Statements
December 31, 2011 (Expressed in Canadian Dollars)
62 New Zealand Energy Corp. Year Ended December 31, 2011
15. COMMITMENTS
a. The Corporation participates in oil and gas acquisition, exploration, development and production activities and is contractually committed under various agreements to complete certain exploration programs. The Corporation’s management estimates that the total commitments for fiscal 2012 under its current permits held at December 31, 2011 are as follows:
Oil and Gas Property Working Interest % Work Commitment or Obligation to December 31, 2012
$PEP 51150 Eltham 100 5,914,000PEP 52694 Castlepoint 100 2,081,000PEP 38342 Ranui 100 1,400,000PEP 51551 Alton 50 2,485,000Total 11,880,000
In addition to the above estimated commitments for the year ending December 31, 2012, the Corporation will be required to incur further expenditures over the 5 year period which commenced during the period ended December 31, 2010 in order to maintain its permits in good standing.
The Corporation may choose to alter the exploration programs, request extensions, and reject development costs, relinquish certain permits or farm out its interest in permits where practical.
The Corporation’s total commitments include those that are required to be incurred to maintain its permits in good standing during the current permit term, prior to the Corporation’s committing to the next stage of the permit term where additional expenditure would be required.
16. SUBSEQUENT EVENTS
a. On February 21, 2012, the Corporation announced that it had entered into a farm-in agreement with L&M pursuant to which the Corporation will earn an additional 15% interest in the Alton Permit, increasing the Corporation’s interest to 65%, by funding the collection and processing of 3D seismic data over approximately 50km2 of the permit.
b. On March 24, 2012, the Corporation closed a bought deal financing and overallotment of 21,160,000 common shares at a price of $3.00 per common share for gross proceeds of $63,480,000. The Corporation paid its Agent a finder’s fee of $3,808,800.
c. The Corporation granted share purchase options to officers, employees and consultants to purchase an aggregate of 648,000 common shares exercisable at $1.30 to $3.00 for aperiod of five years.
d. On April 24, 2012, the Corporation entered into a drilling agreement with Ensign International Energy Services Pty Ltd. (“Ensign”) pursuant to which Ensign has committed to drill three exploration wells in the second half of 2012, with the option for up to five additional wells.
New Zealand Energy Corp.Notes to Consolidated Financial Statements
December 31, 2011 (Expressed in Canadian Dollars)
New Zealand Energy Corp. Year Ended December 31, 2011 63
FORWARD-LOOKING INFORMATION
This MD&A contains certain forward-looking information and forward-looking statements within the meaning of applicable securities legislation (collectively “forward-looking statements”). The use of any of the words “anticipate”, “continue”, “estimate”, “expect”, “may”, “will”, “project”, “propose”, “should”, “believe”, “initiate”, “with the objective of”, “plan”, and similar expressions are intended to identify forward-looking statements. These statements involve known and unknown risks, uncertainties and other factors that may cause actual results or events to differ materially from those anticipated in such forward-looking statements, including without limitation, the speculative nature of exploration, appraisal and development of oil and natural gas properties; uncertainties associated with estimating oil and natural gas resources; changes in the cost of operations, including cots of extracting and delivering oil and natural gas to market, that affect potential profitability of oil and natural gas exploration; operating hazards and risks inherent in oil and natural gas operations; volatility in market prices for oil and natural gas; market conditions that prevent the Corporation from raising the funds necessary for exploration and development on acceptable terms or at all; global financial market events that cause significant volatility in commodity prices; unexpected costs or liabilities for environmental matters; competition for, among other things, capital, acquisitions of resources, skilled personnel, and access to equipment and services required for exploration, development and production; changes in exchange rates, laws of New Zealand or laws of Canada affecting foreign trade, taxation and investment; failure to realize the anticipated benefits of acquisitions; and other factors discussed under “Risk Factors” in NZEC’s Prospectus dated July 19, 2011. NZEC believes the expectations reflected in those forward-looking statements are reasonable, but no assurance can be given that these expectations will prove to be correct. Such forward-looking statements included in this news release should not be unduly relied upon. These statements speak only as of the date of this MD&A and NZEC does not undertake to update any forward-looking statements that are contained in this MD&A, except in accordance with applicable securities laws.
CAUTIONARY NOTE REGARDING RESERVE ESTIMATES
The oil and gas reserves calculations and income projections, upon which the Report was based, were estimated in accordance with the Canadian Oil and Gas Evaluation Handbook (“COGEH”) and National Instrument 51-101 (“NI 51-101”). The term barrels of oil equivalent (“boe”) may be misleading, particularly if used in isolation. A boe conversion ratio of six Mcf: one bbl was used by NZEC. This conversion ratio is based on an energy equivalency conversion method primarily applicable at the burner tip and does not represent a value equivalency at the wellhead.
Reserves are estimated remaining quantities of oil and natural gas and related substances anticipated to be recoverable from known accumulations, as of a given date, based on: the analysis of drilling, geological, geophysical, and engineering data; the use of established technology; and specified economic conditions, which are generally accepted as being reasonable. Reserves are classified according to the degree of certainty associated with the estimates. Proved Reserves are those reserves that can be estimated with a high degree of certainty to be recoverable. It is likely that the actual remaining quantities recovered will exceed the estimated proved reserves. Probable Reserves are those additional reserves that are less certain to be recovered than proved reserves. It is equally likely that the actual remaining quantities recovered will be greater or less than the sum of the estimated proved plus probable reserves. Possible Reserves are those additional reserves that are less certain to be recovered than probable reserves. There is a 10% probability that the actual remaining quantities recovered will exceed the sum of the estimated proved plus probable plus possible reserves.
New Zealand Energy Corp.Notes to Consolidated Financial Statements
December 31, 2011 (Expressed in Canadian Dollars)
64 New Zealand Energy Corp. Year Ended December 31, 2011
Revenue projections presented in the Report are based in part on forecasts of market prices, current exchange rates, inflation, market demand and government policy which are subject to uncertainties and may in future differ materially from the forecasts above. Present values of future net revenues documented in the Report do not necessarily represent the fair market value of the reserves evaluated in the Report.
The Report also contains forward-looking statements including expectations of future production and capital expenditures. Information concerning reserves may also be deemed to be forward looking as estimates imply that the reserves described can be profitably produced in the future. These statements are based on current expectations that involve a number of risks and uncertainties, which could cause the actual results to differ from those anticipated.
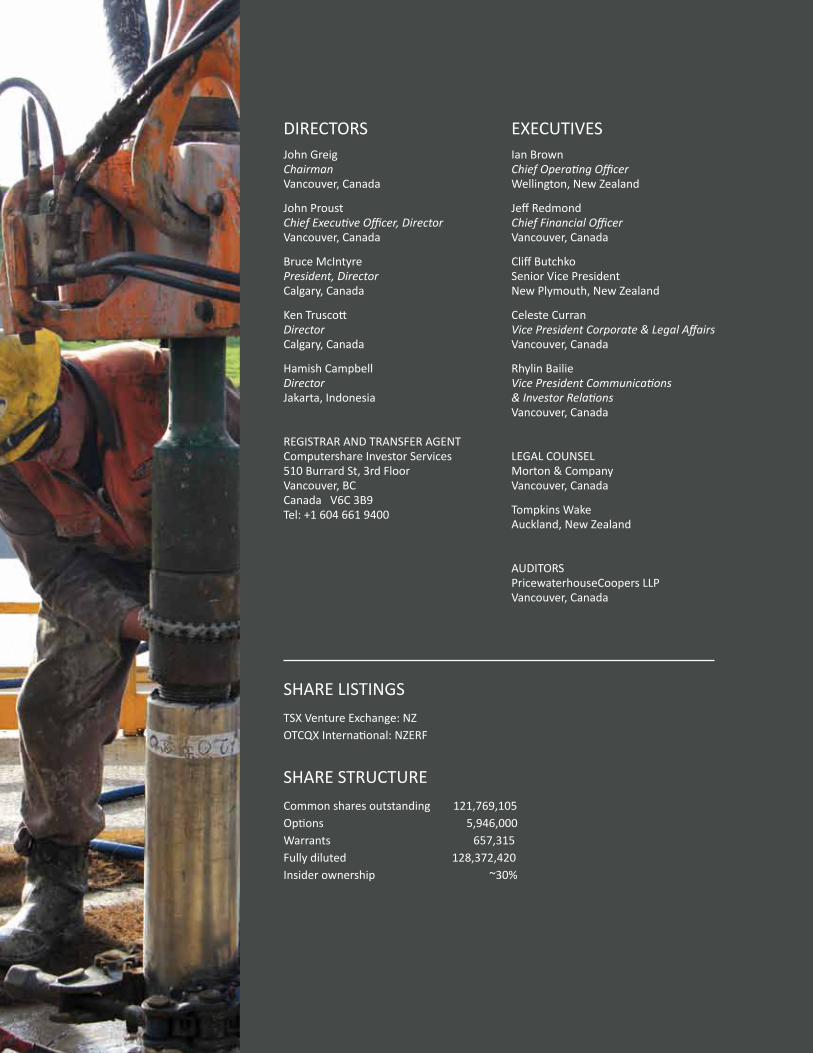
SHARELISTINGS
TSXVentureExchange:NZOTCQXInternational:NZERF
DIRECTORSJohnGreigChairmanVancouver,Canada
JohnProustChief Executive Officer, DirectorVancouver,Canada
BruceMcIntyrePresident, DirectorCalgary,Canada
KenTruscottDirectorCalgary,Canada
HamishCampbellDirectorJakarta,Indonesia
REGISTRARANDTRANSFERAGENTComputershareInvestorServices510BurrardSt,3rdFloorVancouver,BCCanadaV6C3B9Tel:+16046619400
EXECUTIVESIanBrownChief Operating OfficerWellington,NewZealand
JeffRedmondChief Financial OfficerVancouver,Canada
CliffButchkoSeniorVicePresidentNewPlymouth,NewZealand
CelesteCurranVice President Corporate & Legal AffairsVancouver,Canada
RhylinBailieVice President Communications & Investor RelationsVancouver,Canada
LEGALCOUNSELMorton&CompanyVancouver,Canada
TompkinsWakeAuckland,NewZealand
AUDITORSPricewaterhouseCoopersLLPVancouver,Canada
SHARESTRUCTURE
Commonsharesoutstanding121,769,105Options5,946,000Warrants657,315Fullydiluted128,372,420Insiderownership~30%

CONTACT INFORMATION
Corporate Head OfficeSuite1500,885WestGeorgiaStVancouver,BCCanadaV6C3E8Tel:+16046012010Fax:+16044880319NATF:18556012010
TSX-V: NZOTCQX: NZERF
Technical OfficeL2,86-96VictoriaStWellingtonNewZealand6011Tel:+6444711464Fax:+6444711745NZTF:0800469363
Operational Office5DevonStEastNewPlymouthNewZealand4310Tel:+6467574470Fax:+6467574470NZTF:0800469363
Email:[email protected]:www.NewZealandEnergy.com