Embed Size (px)
Citation preview

Real Estate Investment Research
National Apartment Report2011
SURGE SUSTAINABLE OPPORTUNITY FORECAST OUTLOOK SIGNS CAPITAL NEW CONSTRUCTION INFLATION TRENDS HIGH UNEMPLOYMENT GROWTH SPENDING STABILIZED INVESTMENT VACANCIES SHADOW MARKET SINGLE-FAMILY OVER-SUPPLY INCREASE SALES DISTRESSED RANK RESILIENCE INVENTORY POPULATION PENT-UP DEMAND REVENUES BUYER ACTIVITY INTEREST DECLINE CONCESSIONS BURN SELLER RECOVERY CONDOS FOR RENT FUTURE OF FANNIE MAE RETURNS YEAREND LOW COMPLETIONS QE2 STRATEGY LIMIT FISCAL PROFORMA ECONOMY DELIVER CAP RATES QE2 RENT GROWTH VELOCITY MOMENTUM DISCOUNTS RATE REBOUND SUBMARKET RENT GROWTH PERCENT ABSORPTION EXPANSION PRICING PROPERTY AVERAGE BID ASK MAXIMIZE FOCUS HEADWINDS ROLLOVER POTENTIAL FUNDAMENTALS URBAN DEVELOPMENT INCOME NATIONWIDE STRENGTH PROJECTED FREDDIE MAC LOCAL EXCEEDING CONDOS FOR RENT INVESTOR TRENDS EMERGING GAINS RISK SLUMP DRIVERS ASSETS CASH FLOW RECESSION UNCERTAINTY RENT GROWTH ACQUISITIONS POTENTIAL UPTURN FORECLOSURE MODERATE JOB GROWTH SURGE SUSTAINABLE OPPORTUNITY FORECAST OUTLOOK SIGNS CAPITAL NEW CONSTRUCTION INFLATION TRENDS HIGH UNEMPLOYMENT GROWTH SPENDING STABILIZED INVESTMENT VACANCIES SHADOW MARKET SINGLE-FAMILY OVER-SUPPLY INCREASE SALES DISTRESSED RANK RESILIENCE INVENTORY POPULATION PENT-UP DEMAND REVENUES BUYER EMERGING INTEREST DECLINE CONCESSIONS BURN SELLER RECOVERY CONDOS FOR RENT FUTURE OF FANNIE MAE RETURNS YEAREND LOW COMPLETIONS QE2 STRATEGY LIMIT FISCAL PROFORMA ECONOMY DELIVER CAP RATES QE2 RENT GROWTH VELOCITY MOMENTUM DISCOUNTS RATE VELOCITY SUBMARKET RENT GROWTH PERCENT ABSORPTION EXPANSION PRICING PROPERTY AVERAGE BID ASK MAXIMIZE FOCUS HEADWINDS ROLLOVER POTENTIAL FUNDAMENTALS URBAN DEVELOPMENT INCOME NATIONWIDE STRENGTH PROJECTED FREDDIE MAC LOCAL EXCEEDING CONDOS FOR RENT INVESTOR TRENDS EMERGING GAINS RISK SLUMP DRIVERS ASSETS CASH FLOW RECESSION UNCERTAINTY RENT GROWTH ACQUISITIONS POTENTIAL UPTURN FORECLOSURE MODERATE JOB GROWTH SURGE SUSTAINABLE OPPORTUNITY FORECAST OUTLOOK SIGNS CAPITAL NEW CONSTRUCTION INFLATION TRENDS HIGH UNEMPLOYMENT GROWTH SPENDING STABILIZED INVESTMENT VACANCIES SHADOW MARKET SINGLE-FAMILY OVER-SUPPLY INCREASE SALES DISTRESSED RANK RESILIENCE INVENTORY POPULATION PENT-UP DEMAND REVENUES BUYER EMERGING INTEREST DECLINE CONCESSIONS BURN SELLER RECOVERY CONDOS FOR RENT FUTURE OF FANNIE MAE RETURNS YEAREND LOW COMPLETIONS QE2 STRATEGY LIMIT FISCAL PROFORMA ECONOMY DELIVER CAP RATES QE2 RENT GROWTH VELOCITY MOMENTUM DISCOUNTS RATE LEGISLATIVE GRIDLOCK SUBMARKET RENT GROWTH PERCENT ABSORPTION EXPANSION PRICING ECHO BOOMERS AVERAGE BID ASK MAXIMIZE FOCUS HEADWINDS ROLLOVER POTENTIAL FUNDAMENTALS URBAN DEVELOPMENT INCOME NATIONWIDE STRENGTH PROJECTED FREDDIE MAC EXCEEDING CONDOS FOR RENT INVESTOR TRENDS EMERGING GAINS RISK SLUMP DRIVERS ASSETS CASH FLOW RECESSION UNCERTAINTY RENT GROWTH LOCAL ACQUISITIONS POTENTIAL UPTURN APARTMENT FORECLOSURE MODERATE JOB GROWTH SURGE SUSTAINABLE OPPORTUNITY FORECAST OUTLOOK SIGNS CAPITAL NEW CONSTRUCTION INFLATION TRENDS HIGH UNEMPLOYMENT GROWTH SPENDING STABILIZED INVESTMENT VACANCIES SHADOW MARKET SINGLE-FAMILY OVER-SUPPLY SALES INCREASE DISTRESSED RANK RESILIENCE INVENTORY POPULATION PENT-UP DEMAND REVENUES BUYER EMERGING INTEREST CONCESSIONS BURN SELLER RECOVERY CONDOS FOR RENT FUTURE OF FANNIE MAE RETURNS YEAREND LOW COMPLETIONS QE2 STRATEGY LIMIT FISCAL PROFORMA ECONOMY DELIVER CAP RATES QE2 RENT GROWTH HEADWINDS VELOCITY MOMENTUM SUBMARKET DISCOUNTS RATE RENT GROWTH MARKET PERCENT ABSORPTION EXPANSION PRICING PROPERTY AVERAGE BID ASK MAXIMIZE FOCUS REBOUND ROLLOVER POTENTIAL FUNDAMENTALS URBAN DEVELOPMENT INCOME NATIONWIDE STRENGTH PROJECTED FREDDIE MAC LOCAL QE2 EXCEEDING CONDOS FOR RENT INVESTOR TRENDS EMERGING GAINS RISK SLUMP DRIVERS ASSETS CASH FLOW RECESSION UNCERTAINTY RENT GROWTH ACQUISITIONS POTENTIAL UPTURN FORECLOSURE MODERATE JOB GROWTH SUSTAINABLE FORECAST OUTLOOK SIGNS CAPITAL NEW CONSTRUCTION INFLATION TRENDS HIGH UNEMPLOYMENT GROWTH SPENDING STABILIZED INVESTMENT VACANCIES SINGLE-FAMILY OVER-SUPPLY SALES DISTRESSED RANK RESILIENCE INVENTORY POPULATION PENT-UP DEMAND TRENDS REVENUES BUYER EMERGING INTEREST DECLINE CONCESSIONS BURN SELLER CONDOS FOR RENT FUTURE OF FANNIE MAE RETURNS YEAREND LOW COMPLETIONS QE2 STRATEGY FISCAL PROFORMA ECONOMY DELIVER CAP RATES VELOCITY MOMENTUM DISCOUNTS CONCESSIONS BURN SUBMARKET RECOVERY ABSORPTION EXPANSION PRICING PROPERTY AVERAGE SHADOW BID ASK MARKET MAXIMIZE FOCUS ROLLOVER POTENTIAL FUNDAMENTALS URBAN DEVELOPMENT NATIONWIDE STRENGTH PROJECTED FREDDIE MAC LOCAL EXCEEDING CONDOS FOR RENT INVESTOR TRENDS EMERGING GAINS HEADWINDS SLUMP DRIVERS ASSETS CASH FLOW RECESSION UNCERTAINTY RENT GROWTH ACQUISITIONS POTENTIAL UPTURN FORECLOSURE MODERATE JOB GROWTH HEADWINDS SURGE SUSTAINABLE OPPORTUNITY FORECAST OUTLOOK SIGNS CAPITAL NEW CONSTRUCTION ROLLOVER RESILIENCE SPENDING INVESTMENT VACANCIES SHADOW MARKET SINGLE-FAMILY OVER-SUPPLY INCREASE SALES DISTRESSED RANK POPULATION PENT-UP DEMAND REVENUES BUYER EMERGING LOW COMPLETIONS INTEREST DECLINE CONCESSIONS BURN SELLER SPENDING FUTURE OF FANNIE MAE RETURNS YEAREND LOW COMPLETIONS QE2 STRATEGY LIMIT FISCAL PROFORMA ECONOMY DELIVER CAP RATES DISTRESSED QE2 VELOCITY RENT GROWTH MOMENTUM DISCOUNTS RATE LEGISLATIVE GRIDLOCK SUBMARKET RENT GROWTH PERCENT ABSORPTION EXPANSION PRICING PROPERTY AVERAGE BID ASK MAXIMIZE FOCUS HEADWINDS ROLLOVER POTENTIAL FUNDAMENTALS URBAN DEVELOPMENT INCOME NATIONWIDE STRENGTH PROJECTED FREDDIE MAC LOCAL EXCEEDING CONDOS FOR RENT INVESTOR TRENDS EMERGING GAINS RISK SLUMP DRIVERS ASSETS CASH FLOW RECESSION UNCERTAINTY RENT GROWTH ACQUISITIONS POTENTIAL UPTURN FORECLOSURE MODERATE JOB GROWTH SURGE SUSTAINABLE OPPORTUNITY FORECAST OUTLOOK SIGNS CAPITAL NEW CONSTRUCTION INFLATION TRENDS HIGH UNEMPLOYMENT GROWTH SPENDING STABILIZED INVESTMENT VACANCIES SHADOW MARKET SINGLE-FAMILY OVER-SUPPLY SALES DISTRESSED RANK RESILIENCE INVENTORY POPULATION PENT-UP DEMAND REVENUES BUYER INTEREST DECLINE CONCESSIONS BURN SELLER RECOVERY CONDOS FOR RENT FUTURE OF FANNIE MAE RETURNS YEAREND LOW COMPLETIONS QE2 STRATEGY LIMIT FISCAL PROFORMA ECONOMY DELIVER CAP RATES QE2 RENT GROWTH VELOCITY MOMENTUM DISCOUNTS RATE LEGISLATIVE GRIDLOCK SUBMARKET RENT GROWTH PERCENT ABSORPTION EXPANSION PRICING PROPERTY AVERAGE BID ASK MAXIMIZE FOCUS HEADWINDS ROLLOVER POTENTIAL FUNDAMENTALS URBAN DEVELOPMENT INCOME NATIONWIDE STRENGTH ECHO BOOMERS FREDDIE MAC LOCAL EXCEEDING CONDOS FOR RENT INVESTOR TRENDS EMERGING GAINS RISK SLUMP DRIVERS ASSETS CASH FLOW RECESSION UNCERTAINTY RENT GROWTH ACQUISITIONS POTENTIAL UPTURN FORECLOSURE MODERATE JOB GROWTH SURGE SUSTAINABLE OPPORTUNITY FORECAST OUTLOOK SIGNS CAPITAL NEW CONSTRUCTION INFLATION TRENDS HIGH UNEMPLOYMENT GROWTH SPENDING STABILIZED INVESTMENT VACANCIES SHADOW MARKET SINGLE-FAMILY OVER-SUPPLY INCREASE SALES DISTRESSED RANK RESILIENCE INVENTORY POPULATION PENT-UP DEMAND REVENUES BUYER EMERGING INTEREST DECLINE CONCESSIONS BURN SELLER RECOVERY CONDOS FOR RENT FUTURE OF FANNIE MAE RETURNS YEAREND LOW COMPLETIONS QE2 STRATEGY LIMIT FISCAL PROFORMA ECONOMY DELIVER CAP RATES QE2 RENT GROWTH VELOCITY MOMENTUM DISCOUNTS RATE LEGISLATIVE GRIDLOCK SUBMARKET RENT GROWTH PERCENT ABSORPTION EXPANSION PRICING PROPERTY AVERAGE BID ASK MAXIMIZE FOCUS HEADWINDS ROLLOVER POTENTIAL FUNDAMENTALS URBAN DEVELOPMENT INCOME NATIONWIDE STRENGTH PROJECTED FREDDIE MAC LOCAL EXCEEDING CONDOS FOR RENT INVESTOR TRENDS EMERGING GAINS RISK SLUMP DRIVERS ASSETS CASH FLOW RECESSION UNCERTAINTY RENT GROWTH ACQUISITIONS POTENTIAL UPTURN FORECLOSURE MODERATE JOB GROWTH SURGE SUSTAINABLE OPPORTUNITY FORECAST OUTLOOK SIGNS CAPITAL NEW CONSTRUCTION INFLATION TRENDS HIGH UNEMPLOYMENT GROWTH SPENDING STABILIZED INVESTMENT VACANCIES SHADOW MARKET SINGLE-FAMILY OVER-SUPPLY INCREASE SALES DISTRESSED RANK RESILIENCE INVENTORY POPULATION PENT-UP DEMAND REVENUES BUYER EMERGING INTEREST DECLINE CONCESSIONS BURN SELLER RECOVERY CONDOS FOR RENT FUTURE OF FANNIE MAE RETURNS YEAREND LOW COMPLETIONS QE2 STRATEGY LIMIT FISCAL PROFORMA ECONOMY DELIVER CAP RATES QE2 RENT GROWTH VELOCITY MOMENTUM DISCOUNTS RATE LEGISLATIVE GRIDLOCK SUBMARKET RENT GROWTH PERCENT ABSORPTION EXPANSION PRICING PROPERTY AVERAGE BID ASK MAXIMIZE FOCUS HEADWINDS ROLLOVER POTENTIAL FUNDAMENTALS URBAN DEVELOPMENT INCOME NATIONWIDE STRENGTH PROJECTED FREDDIE MAC LOCAL EXCEEDING CONDOS FOR RENT INVESTOR TRENDS EMERGING GAINS RISK SLUMP DRIVERS ASSETS CASH FLOW RECESSION
COVER – 2011 NATIONAL APARTMENT RESEARCH REPORT: 16” X 10¾” (8” X 10¾” FOLDED); PMS 540 SPOT + C M Y K
Research Services:2398 E. Camelback RoadSuite 550Phoenix, AZ 85016(602) 687-6700
Offices Throughout the United States
www.MarcusMillichap.com
2011

2011 National Apartment Report
To our valued clients:
The economy weathered numerous challenges and setbacks as it made slow progress toward recovery last year. Cautious consumers and cash-heavy, but guarded, U.S. companies refl ected a pervasive negative psychology, which hampered economic momentum. To be sure, profound concerns and economic risks will linger well into 2011, par-ticularly high unemployment, record private- and public-sector debt, and the potential for sovereign debt contagion. The gravity of these issues, however, should not overshadow key indicators that affi rm a solid footing for the U.S. economy, including the return of core retail sales and corporate earnings to pre-recession levels and the creation of more than 1.2 million private-sector jobs in 2010. While job creation last year was tepid, especially in light of the 8.4 mil-lion jobs cut during the Great Recession, it is a solid start and better than the early stages of the last two recovery cycles.
Consumers, though hampered by high unemployment and limited credit, will make positive contributions to the recovery this year, but they still lack the wherewithal to propel the economy forward as they have in previous recoveries. In this cycle, businesses must assume the lead, a trend that will slowly manifest over the course of 2011 as companies gain suffi cient confi dence to expand capital expenditures and long-term hiring. In the near term, they will continue to rely on temporary employment to keep expenses low and options open, though easing uncertainty and strengthening demand by midyear will encourage business spending and job creation in the second half.
The Fed’s latest round of quantitative easing signals a continued willingness by the government to mitigate defl a-tion and other near-term risks to the recovery. The extension of the Bush-era tax cuts, which were scheduled to sunset at the end of 2010, will stimulate the economy and bring badly needed clarity to the markets. Like many policy deci-sions developed along the learning curve of the Great Recession, the economic benefi t and effi cacy of these efforts in achieving the stated goals, and even unintended consequences, may not emerge for some time.
The apartment sector will continue to lead the recovery in commercial real estate fundamentals through 2011 as owners capitalize on lower vacancies to raise rents and scale back concessions. In addition, historically light construc-tion levels in most markets over the next two to three years will help owners more than recover the ground lost through the recession. These factors, along with broad-based, though limited, job growth, will propel all 44 markets covered in this report toward falling apartment vacancies in 2011, together with climbing rents. The unprecedented breadth of this strengthening in apartment fundamentals, coupled with low-cost debt, will continue to fuel higher apartment investment activity. REITs and institutional investors, who led the charge in the buying surge last year, will look be-yond top-tier assets in the best markets, which are now priced to perfection, in search of yield. Private and opportunity investors, frustrated by the limited inventory of distressed sales, are adjusting their yield expectations and appear poised to become more active.
To assist you in planning and executing a successful investment strategy, we are pleased to present our 2011 Na-tional Apartment Report. Included is our National Apartment Index (NAI), a forward-looking ranking of 44 markets based upon forecast economic, supply and demand conditions. We hope you will fi nd this report helpful, and our investment professionals look forward to assisting you in meeting your goals.
Sincerely,
John J. Kerin Hessam NadjiPresident and Managing DirectorChief Executive Offi cer Research and Advisory Services

2011 National Apartment Report
2011 Annual Report
NATIONAL PERSPECTIVE Executive Summary .......................................................................................... 3 National Apartment Index ................................................................................ 4-5 National Economy ............................................................................................ 6 National Apartment Overview .............................................................................. 7 Capital Markets ............................................................................................... 8 Apartment Investment Outlook ............................................................................ 9
MARKET OVERVIEWS Atlanta ........................................................................................................ 10 Austin ......................................................................................................... 11 Boston ......................................................................................................... 12 Charlotte ..................................................................................................... 13 Chicago ....................................................................................................... 14 Cincinnati..................................................................................................... 15 Cleveland ..................................................................................................... 16 Columbus ..................................................................................................... 17 Dallas/Fort Worth ........................................................................................... 18 Denver ........................................................................................................ 19 Detroit ........................................................................................................ 20 Fort Lauderdale ............................................................................................. 21 Houston ....................................................................................................... 22 Indianapolis .................................................................................................. 23 Jacksonville .................................................................................................. 24 Kansas City ................................................................................................... 25 Las Vegas ..................................................................................................... 26 Los Angeles ................................................................................................... 27 Louisville ..................................................................................................... 28 Miami .......................................................................................................... 29 Milwaukee .................................................................................................... 30 Minneapolis-St. Paul ........................................................................................ 31 Statistical Summary Table ............................................................................. 32-33 New Haven ................................................................................................... 34 New Jersey ................................................................................................... 35 New York City ................................................................................................ 36 Oakland ....................................................................................................... 37 Orange County ............................................................................................... 38 Orlando ....................................................................................................... 39 Philadelphia .................................................................................................. 40 Phoenix ....................................................................................................... 41 Portland ....................................................................................................... 42 Riverside-San Bernardino .................................................................................. 43 Sacramento .................................................................................................. 44 Salt Lake City ................................................................................................ 45 San Antonio ................................................................................................... 46 San Diego ..................................................................................................... 47 San Francisco ................................................................................................ 48 San Jose ...................................................................................................... 49 Seattle ........................................................................................................ 50 St. Louis ...................................................................................................... 51 Tampa ......................................................................................................... 52 Tucson ......................................................................................................... 53 Washington, D.C. ............................................................................................ 54 West Palm Beach ............................................................................................ 55
CLIENT SERVICES Research Services ........................................................................................... 56 Contacts, Sources and Defi nitions ........................................................................ 57 Offi ce Locations ......................................................................................... 58-59
Written by John Chang, Vice President, Research Services, and edited by Hessam Nadji, Managing Director. The Capital Markets section was co-authored by William E. Hughes, Managing Director, Marcus & Millichap Capital Corporation. Additional contributions were made by Marcus & Millichap market analysts and investment brokerage professionals nationwide.

Executive Summary
2011 Annual Report page 3
National Apartment Index (NAI)◆ Healthy employment growth expectations and tight vacancies advanced New York City two places to the #1 spot in the NAI,
bumping Washington, D.C., to #2. California markets also fared well in the index due to perennial supply constraints that will keep vacancy steady and generate some of the strongest effective rent gains.
◆ Tech-heavy markets led advances in the 2011 NAI, with Austin (#9), Denver (#14) and Seattle (#15) all climbing seven spots. Fellow tech titans Boston (#3) and San Jose (#4) gained fi ve and six positions, respectively. Other Texas markets achieved strong momentum due to healthy job gains, favorable demographics and revenue growth prospects; Dallas/Fort Worth (#18) and Houston (#24) rose fi ve and four spots, respectively.
◆ Midwestern markets remain stable but slipped in the NAI, as coastal and dynamic markets offer greater growth potential this year. Declines were led by Cleveland (#40) and Milwaukee (#25), both of which lost eight positions, while Detroit (#42) and Columbus (#37) each dropped six spots. Minneapolis-St. Paul (#8) slipped four places but maintained a top 10 ranking.
National Economy◆ The U.S. economy will add 2 million jobs in 2011, double the amount created in 2010. The extension of Bush-era tax cuts and
the addition of new incentives for businesses should stimulate hiring driven by export-related industries, a cyclical rebound in technology goods and services, and the business and professional services sector.
◆ Several trends suggest the recovery will gain more traction, including moderate private-sector job growth, improving consump-tion, stabilizing initial unemployment claims, robust temporary hiring, strong and sustained corporate profi tability, and easing bond spreads. Recent government actions signal a willingness to take strong, albeit controversial, steps to reinforce the recovery.
◆ The Fed will have to tread carefully to recalibrate monetary policy in response to stronger economic expansion to keep infl a-tion at bay. Many housing markets will also continue to struggle as foreclosures make their way through the pipeline, and concerns will loom over solvency and trade implications as risks of sovereign debt defaults roll across the eurozone.
National Apartment Overview◆ All 44 markets will post employment growth, vacancy declines and effective rent gains in 2011, confi rming a sweeping recov-
ery and expansion in the U.S. apartment sector above expectations. This year will mark the fi rst across-the-board reduction in vacancy since at least 1990. This is driven by the release of pent-up demand in the aftermath of the Great Recession, lower turnover rates, falling homeownership and job growth.
◆ Apartment completions will total 53,000 units this year, 46 percent fewer than delivered in 2010. New supply will again fall critically short of demand, which is expected to reach 158,000 units. U.S. apartment vacancy will decrease 110 basis points in 2011 to 5.8 percent as a result, matching the decline recorded in 2010.
◆ As vacancy in 2011 aligns closely to pre-recession levels, owners will regain pricing power. Asking rents will rise 3.5 percent to $1,067 per month, while effective rates will increase 4.5 percent to $1,002 per month.
Capital Markets◆ Fannie Mae and Freddie Mac provide apartments a fi nancing advantage relative to other property types, but more com-
mercial banks and life insurance companies are stepping up with competitive terms. The agencies registered a healthy delin-quency rate of 1 percent in their multifamily portfolios, a strong indication of their continued involvement in the sector.
◆ Debt availability increased dramatically from the trough two years ago, but the overall supply remains limited and selective. Sales of $5 million to $20 million in the Class B-minus to C-quality range face fewer fi nancing prospects than top-tier assets.
◆ Seller fi nancing and loan assumptions accounted for nearly 30 percent of all commercial real estate transactions last year and will remain common in 2011. Life insurance companies and CMBS are poised to extend recent gains in volume.
Apartment Investment Outlook◆ Dollar volume will rise further this year as the economy gains momentum, apartment fundamentals improve, debt markets
loosen, and REITs and institutions increase acquisitions. During 2010, apartment sales volume totaled an estimated $40 bil-lion, up nearly 65 percent from the cyclical low in 2009 but less than one-third of the 2006 peak.
◆ Institutional investors led the surge in sales in 2010, with dollar volume more than doubling in the $20 million-plus segment. Improving occupancy and rising rents, along with low-cost debt, will help assuage investors’ and lenders’ lingering trepida-tion about values. As the year progresses, investors will move down the quality chain in search of stronger yields, resulting in more sales in the Class B and B- categories.
◆ The average cap rate will decline in 2011 after slipping 20 basis points in 2010 to 7.2 percent, led by recompression of the most sought-after deals. Since peaking in 2009, cap rates for top-quality properties have fallen by as much as 100 basis points.

National Apartment Index
page 4 2011 Annual Report
Vaca
ncy
Rate
Markets with the LowestExpected 2011 Employment Growth
Nonfarm Employment (Y-O-Y Change)
Markets with the LowestExpected 2011 Vacancy Rates
New Yo
rk C
ity
San
Jose
Minne
apoli
s-St.
Paul
San
Diego
New Je
rsey
Phila
delph
ia
San
Fran
cisco
New H
aven
Portl
and
Washi
ngto
n, D
.C.
Unite
d Sta
tes
Markets with the HighestExpected 2011 Employment Growth
Nonfarm Employment (Y-O-Y Change)
0% 1% 2% 3% 4%United StatesNew York City
OrlandoWest Palm Beach
San AntonioSan JoseHouston
Orange CountyDallas/Fort WorthWashington, D.C.
Austin
0% 0.4% 0.8% 1.2% 1.6%United States
Fort LauderdaleKansas CityCincinnati
ChicagoLouisville
SacramentoCleveland
PhiladelphiaDetroit
New Jersey
2%
3%
4%
5%
6%
Vaca
ncy
Rate
Markets with the HighestExpected 2011 Vacancy Rates
Jack
sonv
ille
Housto
n
Las V
egas
Tucs
on
Phoe
nix
Atlan
ta
Orland
o
Colu
mbus
Kans
as C
ity
Char
lotte
Unite
d Sta
tes
4%
6%
8%
10%
12%
Markets with the HighestExpected 2011 Completions
Uni
ts (
thou
sand
s)
Dalla
s/For
t Wor
th
Housto
n
Washi
ngto
n, D
.C.
Austi
n
Phoe
nix
San A
nton
io
Seat
tle
New Yo
rk C
ity
Los A
ngele
s
New Je
rsey
0
1.5
3.0
4.5
6.0
2011 National Apartment Index
Strengthening Economy Fuels Tech Markets, Texas and Florida
A cyclical recovery of the technology sector will continue to lend strength to the national economy, benefi ting tech-heavy employment markets. These metros led advances in the 2011 National Apartment In-dex (NAI), with Austin (#9), Denver (#14) and Seattle (#15) rising seven places, supported by growing hardware companies, software publishing and commercial aircraft manufacturing. Fellow tech titans Boston (#3) and San Jose (#4) gained fi ve and six positions, respectively.
Texas markets achieved strong momentum, generally due to healthy job gains, population and migration trends, and revenue growth pros-pects. The four major Texas MSAs lead U.S. employment growth fore-casts for 2011, refl ecting the state’s linkages to global trade, energy, tech-nology, and business and professional services. Dallas/Fort Worth (#18) and Houston (#24) rose fi ve and four spots, respectively. San Antonio (#13) slipped one notch this year behind markets with tighter vacancies. If Texas holds true to form, the next few years will present a good window for superior performance before the hyper-supply cycle begins again.
While Florida markets rank near the bottom of the NAI, all refl ect a broad-based regional vacancy rate recovery. Both central and coastal Florida metro areas strengthened in the ranking; Orlando (#30) and Fort Lauderdale (#34) advanced fi ve positions, while Miami (#21) and Tampa (#36) improved four spots. Jacksonville ranked last in the index, unchanged from 2010. Despite a strong rebound in occupancies, Jack-sonville posts a vacancy rate in double digits, and its 2011 rent growth forecast falls well below the national average. Supported by trends simi-lar to those in the Florida markets, the Phoenix (#27) apartment recovery built momentum last year that will carry into 2011, advancing the market seven places in the 2011 ranking.
New York City Edges Out Washington, D.C., for Top Spot
With healthy employment expected for 2011, combined with already tight vacancies, New York City advanced two places in the NAI this year to claim the #1 spot, bumping Washington, D.C., to #2. Three other New England markets retreated, however; New Jersey (#12) and New Haven (#20) fell six places, while Philadelphia (#10) slipped fi ve spots, primar-ily on weak employment forecasts. Philadelphia and New Jersey’s lower ranking stems from other markets posting stronger recoveries, and each will likely improve as their lagging labor markets recover.

National Apartment Index
2011 Annual Report page 5
Growth Markets Bypass Stable Midwestern Metros; Coastal California Maintains Ranking in Top Quartile
Midwestern markets fell in the 2011 NAI, largely due to being sup-planted by core, coastal and dynamic markets with greater growth poten-tial. Cleveland (#40) and Milwaukee (#25) declined eight positions, while Detroit (#42) and Columbus (#37) dropped six spots. Minneapolis-St. Paul (#8) slipped four places but remained in the top one-third due to tight and declining vacancy and solid rent growth prospects. Chicago (#23) receded three spots in the ranking but should move up next year as employment gains momentum and vacancies tighter further.
Perennial supply constraints throughout much of California have kept vacancies among the tightest in the country while generating some of the highest-ranked effective rents. These factors drove most markets in the state toward the top of the NAI this year. Orange County (#5) and Los Angeles (#11) advanced two spots in the 2011 ranking, while San Fran-cisco (#7) also moved up two positions on a job growth projection above that of the nation and strong momentum in asking rents. San Diego (#6), however, dropped four notches as top employment growth markets sur-passed it.
Index Methodology
The NAI is a snapshot analysis that ranks 44 major apartment mar-kets based upon a series of 12-month forward-looking economic and sup-ply and demand variables. Markets are ranked based on their cumula-tive weighted-average scores for various indicators, including forecast employment growth, vacancy, construction, housing affordability and rents. Taking into account both the forecast level and incremental change over the next year, the index is designed to indicate relative supply and demand conditions at the metro level.
Users of the index are cautioned to keep several important points in mind. First, the NAI is not designed to predict the performance of indi-vidual investments. A carefully chosen property in the bottom-ranked market could easily outperform a poor choice in the top-ranked market. Second, the index ranking is a snapshot of a one-year time horizon. A market facing diffi culties in the near term may provide excellent long-term prospects, and vice versa. Third, a market’s ranking may fall from one year to the next even if its fundamentals are strengthening.
The NAI is an ordinal index, and differences in specifi c rankings should be carefully interpreted. A top-ranked market is not necessarily twice as good as the second-ranked market, for example, nor is it 10 times better than the 10th-ranked market.
Markets with the HighestExpected 2011 Absorption
Uni
ts (
thou
sand
s)
Dalla
s/For
t Wor
th
Housto
n
Atlan
ta
Washi
ngto
n, D
.C.
Los A
ngele
s
New Je
rsey
Phoe
nix
Austi
n
Phila
delph
ia
San A
nton
io2
4
6
8
10
Rank Rank 10-11MSA 2011 20101 Change
New York City 1 3 ▲ 2
Washington, D.C. 2 1 ▼ 1
Boston 3 8 ▲ 5
San Jose 4 10 ▲ 6
Orange County 5 7 ▲ 2
San Diego 6 2 ▼ 4
San Francisco 7 9 ▲ 2
Minneapolis-St. Paul 8 4 ▼ 4
Austin 9 16 ▲ 7
Philadelphia 10 5 ▼ 5
Los Angeles 11 13 ▲ 2
New Jersey 12 6 ▼ 6
San Antonio 13 12 ▼ 1
Denver 14 21 ▲ 7
Seattle 15 22 ▲ 7
Portland 16 19 ▲ 3
Oakland 17 18 ▲ 1
Dallas/Fort Worth 18 23 ▲ 5
Salt Lake City 19 11 ▼ 8
New Haven 20 14 ▼ 6
Miami 21 25 ▲ 4
Louisville 22 15 ▼ 7
Chicago 23 20 ▼ 3
Houston 24 28 ▲ 4
Milwaukee 25 17 ▼ 8
Kansas City 26 24 ▼ 2
Phoenix 27 34 ▲ 7
Charlotte 28 29 ▲ 1
St. Louis 29 26 ▼ 3
Orlando 30 35 ▲ 5
Indianapolis 31 27 ▼ 4
Riverside-San Bernardino 32 37 ▲ 5
Cincinnati 33 30 ▼ 3
Fort Lauderdale 34 39 ▲ 5
Sacramento 35 33 ▼ 2
Tampa 36 40 ▲ 4
Columbus 37 31 ▼ 6
West Palm Beach 38 41 ▲ 3
Atlanta 39 42 ▲ 3
Cleveland 40 32 ▼ 8
Tucson 41 38 ▼ 3
Detroit 42 36 ▼ 6
Las Vegas 43 43 ■ 0
Jacksonville 44 44 ■ 0
1 See National Apartment Index Note on page 57.

National Economy
page 6 2011 Annual Report
Ann
ualiz
ed Q
uart
erly
Cha
nge
in G
DP
-10%
-5%
0%
5%
10%
11**10*050095908580
U.S. GDP
Retail Sales and UnemploymentUnemployment RateRetail Sales, Excluding Auto & Gas
Une
mpl
oym
ent
Rate
Year-over-Year Change in Retail Sales-10%
-5%
0%
5%
10%
0%
3%
6%
9%
12%
10****09080706050403020100
Fallen Yield Curve Sign of Slow Growth;Level Still Above Recessionary Point
Tem
pora
ry E
mpl
oym
ent
(Y-O
-Y C
hg.) N
onfarm Em
ployment (Y-O
-Y Chg.)-30%
-15%
0%
15%
30%
10***09070503019997959391-6%
-3%
0%
3%
6%
Recessions
Temporary vs. Nonfarm EmploymentTemporary Employment Nonfarm Employment
Spre
ad B
etw
een
10-Y
ear
Not
e &
Thre
e-M
onth
Bill
-6
-3
0
3
6
10***050095908580757068
Recessions
The U.S. economic recovery has unfolded in anything but a linear fash-ion, as tenuous, and occasionally erratic, economic growth has tested the durability of the recovery and sparked concerns of a double-dip
recession. This scenario remains improbable, however, as today’s low in-terest rate and minimal infl ation environment differs from conditions 30 years ago, when the U.S. experienced its last double-dip recession. Further-more, recent government actions, such as the extension of Bush-era tax cuts and the resumption of quantitative easing by the Fed, signal a willingness to take strong, albeit controversial, measures to reinforce economic recov-ery. Several trends suggest the recovery will gain more traction, including moderate private-sector job growth, improving consumption, lower initial unemployment claims, robust temporary hiring, strong and sustained cor-porate profi tability, and easing bond spreads.
While overall employment growth disappointed through the lat-ter half of 2010, job creation among the prime renter age cohort of 20- to 34-year-olds signifi cantly outpaced the broader market. This trend helped jump-start a recovery in the apartment market, boosting absorption to lev-els unseen since 2000, when job growth and household formations boomed, a sharp contrast to current conditions. Both employment and household growth will accelerate in 2011, but the rate of gains depends on improving corporate confi dence, which is essential to increasing investment and hir-ing. The Fed’s ability to keep infl ation at bay by recalibrating monetary pol-icy in response to economic expansion may not be fully tested in 2011 but remains paramount to the recovery staying on course. The housing market, saddled with foreclosures, will not be a contributor to the expansion until 2012. Concerns about solvency and trade implications also loom as risks of sovereign debt defaults roll across the eurozone.
2011 National Economic Outlook
◆ Employment Growth to Accelerate. The U.S. economy will add 2 million jobs in 2011, double the amount created in 2010. The extension of Bush-era tax cuts and the addition of new incentives for businesses should stimulate hiring driven by export-related industries, a cyclical rebound in technology goods and services, and the business and professional ser-vices sector. Tax-cut extensions will add 50 basis points to 75 basis points to GDP.
◆ U.S. Economy Transitioning to Private Sector. GDP will rise by between 2.5 percent and 3.0 percent this year as growth shifts from government initiatives and inventory restocking to the still-wary private sector. Cor-porations will likely utilize a share of their cash stockpiles on new equip-ment and software, lending a boost to the headline rate of growth.
◆ Elevated Unemployment, Weak Housing Create Drag. While foreclo-sures will slow as irregularities in the process are examined, distress sales will remain an enduring theme, holding down prices in harder-hit markets. At the same time, unemployment will stay elevated, hovering in the high-9 percent range through at least the fi rst half of the year.
◆ Commercial Mortgage Maturities Pose Risk. Five-year loans made at the peak of the commercial real estate market in 2006 will ma-ture in 2011, creating risk for lenders holding high-leverage notes on underperforming assets. Banks hold approximately $1.5 trillion in com-mercial real estate loans, or roughly 45 percent of the total, while CMBS accounts for 20 percent.
Choppy Recovery Gradually Gains Steam as Private Sector Cautiously Takes Lead
* Estimate ** Forecast *** Through November**** Unemployment through Nov.; retail sales through Oct.

National Apartment Overview
2011 Annual Report page 7
Apartment Rent and Vacancy Trends
Aver
age
Effe
ctiv
e Re
nt
Vacancy Rate
Effective RentVacancy Rate
$700
$800
$900
$1,000
$1,100
11**10*0908070605040302012%
4%
6%
8%
10%
Completions vs. Units AbsorbedUnits CompletedNet Absorption
Employment in thePrime Renter Demographic
Vaca
ncy
Rate
Employm
ent Change (millions of jobs)
Employment Change - Ages 20-34Vacancy Rate
-1.0
-0.5
0
0.5
1.0
Apartment Revenue and Concessions
Reve
nue
per
Uni
t
Concessions as a % of Asking Rents
Revenue per UnitConcessions as a Percentageof Asking Rents
$750
$800
$850
$900
$950
10*0908070605040302010%
3%
6%
9%
12%
Uni
ts C
ompl
eted
(th
ousa
nds) U
nits Absorbed (thousands)
0
80
160
240
11**10*08060402009896949290-80
0
80
160
240
2%
4%
6%
8%
10%
10*090807060504030201
Apartments staged a strong recovery in 2010 well ahead of expecta-tions, despite modest job creation and stubbornly high unemploy-ment. Net absorption surged, with occupied stock rising by nearly
200,000 units, double the number of apartments constructed and the high-est level on record since 2000. Several factors contributed to high levels of absorption, including the release of pent-up renter demand as households de-bundled in the wake of the recession. In addition, apartments benefi ted from private-sector job growth in the critical 20- to 34-year-old cohort, ex-piration of the homebuyer tax credit, displaced foreclosed homeowners en-tering the renter pool, immigration and lower unit turnover. Renting also became a lifestyle and economic choice for many households as the effects of the housing collapse and recession persisted. Continued recovery in 2011 depends more heavily on improvements in the job market, which should gain momentum as the year progresses.
All 44 markets in the Marcus & Millichap National Apartment Index will post employment growth, vacancy declines and effective rent gains in 2011, confi rming a sweeping recovery and expansion in the U.S. apartment sector above expectations. This year will mark the fi rst across-the-board reduction in vacancy recorded since at least 1990; the strongest previous performance played out in 2005, when all but three apartment markets reg-istered declining vacancy rates. The last time all markets exhibited positive employment trends occurred in 1999, and not since 2006 have all markets posted effective rent growth. Further, new apartment supply will decline in all but six markets in 2011, the fi rst time such broad-based reductions have emerged in 20 years. At the national level, new supply dropped to sub-trend levels last year and completions will slip further in 2011, as tight cred-it conditions stalled construction projects and delayed new starts through much of the past few years.
2011 National Apartment Outlook
◆ Demand Outstrips New Supply. Apartment completions will total 53,000 units this year, 46 percent fewer than delivered in 2010. New sup-ply will again fall critically short of demand, which is expected to reach 158,000 units.
◆ Surging Demand Drives Vacancies Lower. U.S. apartment vacancy will decrease 110 basis points in 2011 to 5.8 percent, matching the decline recorded in 2010. Strong demand drivers and expectations for increased availability of debt this year, however, elevate the likelihood of a con-struction cycle ramping up in 2012.
◆ Rents Rise, Concession Ease. With vacancy in 2011 expected to align closely with pre-recession levels, owners will regain pricing power, par-ticularly in tight core markets. At the national level, asking rents will rise 3.5 percent to $1,067 per month, while effective rates will increase 4.5 percent to $1,002 per month. Last year, asking and effective rents gained 1.5 percent and 2.3 percent, respectively.
◆ Demographic Trends Support Positive Outlook. Stronger job growth will spur new household formation over the next few years, as will the progression of echo boomers into their prime renter years. Over the next fi ve years, the 20- to 34-year-old cohort will expand by 3.2 million in-dividuals. Rising interest rates, large downpayment requirements and tight lending standards will bias young households toward renting.
Apartment Recovery Surges Past Expectations; Strong Momentum for Coming Year
* Estimate ** Forecast

Capital Markets
page 8 2011 Annual Report
Commercial Mortgage Delinquency Rates
Del
inqu
ency
Rat
e
CMBS (30+ days and REO)Life Companies (60+ days)Fannie Mae (60+ days)Freddie Mac (60+ days)Banks & Thrifts (90+ days)
0%
2%
4%
6%
8%
10%
3Q10
4Q09
4Q08
4Q07
4Q06
4Q05
4Q04
4Q03
4Q02
4Q01
4Q00
4Q99
4Q98
CMBS, CDO & Other ABS, 13%
GSEs & Ginnie Mae, 36%
Other, 5%Life Insurance
Companies, 6%
SavingsInstitutions, 7%
State & Local Governments, 9%
Commercial Banks, 24%
Multifamily Mortgage Debt Outstanding
2010
2011
2012
2013
2014
2015
2016
2017
2018
2019
Mat
urin
g Ba
lanc
e (b
illio
ns)
$0
$25
$50
$75
$100
Estimated Multifamily DebtMaturities by Vintage
Pre-20012001-2004
2005-20072008
All-in Rates Trend Lower, FollowDeclining 10-Year Treasury Yield
Rate
10-Year Treasury YieldFannie Mae All-in Rate (Tier 2)
0%
2%
4%
6%
8%
10090807
Debt availability has increased dramatically from the trough two years ago, but the overall supply remains limited and selective. Institutional debt sources share a preference for low-risk, higher-quality assets in
top-tier markets with strong sponsors. This mandate leaves the majority of the transaction bell-curve, which includes sales of $5 million to $20 million in the B-minus to C-quality range, with fewer fi nancing options. Transactions of this type can get funding, but the process and qualifi cations are more chal-lenging, with a signifi cant focus on sponsorship. A large number of proper-ties remain in limbo with respect to refi nancing without recapitalization or lender writedowns. An estimated $77 billion of maturing multifamily mort-gages will weigh on the market in 2011 as reduced market values in the B- to C- categories and higher loan-to-values (LTVs) create shortfalls for owners in need of refi nancing. This may result in more acquisition opportunities as many owners opt for a quick sale over additional equity contributions.
Fannie Mae and Freddie Mac provide apartments a fi nancing advan-tage relative to other property types, though more commercial banks and life insurance companies are stepping up with competitive terms. Lending by life insurance companies increased nearly 150 percent last year, while GSE volume declined 55 percent. In perspective, the GSEs currently hold 37 percent of the $843 billion in total multifamily mortgage debt outstanding, while life companies account for 6 percent. Multifamily delinquencies held in the GSEs’ portfolios remain below 1 percent, supporting expectations for the agencies to remain active, despite talk of reform in Washington, D.C. CMBS apartment loans continue to post high levels of distress, with delin-quency in this sector hovering around 8.5 percent. Economic growth and increases in apartment property values, particularly for high-quality assets, will relieve some pressure and lead to more sales and refi nancing. Some level of distress at the local- and regional-bank level with high exposure to lower-quality assets and construction loans will persist into 2013.
2011 Capital Markets Outlook
◆ 10-Year Treasury Yields Remain Low. The extension of quantitative eas-ing by the Fed will help restrain interest rates in the near term, holding the 10-year Treasury yield in the 3.4 percent to 4.0 percent range through most of 2011.
◆ All-in Rates Attractive; Lender Requirement Hurdles Remain. All-in rates for smaller apartment loans range from 3.75 percent to 4.5 percent for fi ve-year terms, with 10-year notes pricing 100 basis points higher. For larger, high-quality deals, the GSEs quote all-in rates of 3.75 percent to 4.6 percent, 100 basis points to 200 basis points lower than portfolio lenders. While rates are relatively low, stringent credit qualifi cations and higher LTVs will remain challenges for many potential borrowers.
◆ Seller Financing, Assumable Loans Prevalent. Seller fi nancing and loan as-sumptions accounted for nearly 30 percent of all commercial real estate transac-tions last year and will remain common in 2011. For more broad-based easing in traditional lending sources to occur, the economy will need to post several consecutive quarters of solid employment growth and overall expansion.
◆ Life Companies Ramp up; CMBS Re-Emerges. Motivated life insurance companies will offer low all-in rates on top-tier assets with good credit charac-teristics this year, regardless of asset size. CMBS issuance will continue to rise, but its next iteration will include new regulation, oversight of ratings’ agencies and more conservative underwriting than at the peak of CMBS dominance.
Access to Debt Capital DramaticallyImproving, Though Favoring Top-Tier Assets

Apartment Investment Outlook
2011 Annual Report page 9
Apartment Price and Cap Rate Trends
Aver
age
Pric
e pe
r U
nit
(tho
usan
ds)
Average Cap Rate
Average Price per UnitAverage Cap Rate
$0
$30
$60
$90
$120
10**090807060504030201005%
6%
7%
8%
9%
Tota
l Tra
nsac
tion
s (t
hous
ands
)
0
1
2
3
4
10**09080706
U.S. Apartment Transactions by Quarter
Yields in Primary Markets Recompress;Secondary, Tertiary Trends Stabilizing
Aver
age
Cap
Rate
Primary Secondary Tertiary
5%
6%
7%
8%
9%
10**090807060504
Apartment Cap Rate TrendsApartment Cap Rate 10-Year Treasury Rate
Sales $1M and above
Ave
rage
Rat
e
2%
4%
6%
8%
10%
10*08060402009896949290
380 bps
400 bps
430 bps
410 bps
Cap Rate Long-Term Avg.
10-Year TreasuryLong-Term Avg.
90 bps
400 bps
Pricing for quality apartment assets in primary markets turned aggres-sive in 2010, leapfrogging property fundamentals. As REIT and insti-tutional activity fueled momentum in the $20 million-plus category,
the average price per unit increased and cap rates fell, though both mea-sures are still down from levels achieved at the market’s peak. A prevailing fl ight to quality and attractive returns over other investment alternatives prompted buyers to compete more intensely for top-quality deals. Last year, the spread between the average cap rate in the apartment sector and the 10-year Treasury yield widened to the largest gap on record in at least 20 years before edging back to 400 basis points. For comparison, the differ-ence between the long-term average cap rate and 10-year Treasury yield is 290 basis points.
Improving occupancies and rising rents, along with stabilized cash fl ows and strong demand for quality income-producing properties, will continue to lend support to market pricing this year, helping assuage lin-gering trepidation about values. Yield compression and limited inventory in the upper end of the market will lead to more sales of Class B and B- properties in 2011, spurring greater activity among private and opportuni-ty investors. As the year progresses, more buyers will move down the qual-ity chain in search of stronger yields, encouraging price discovery in the lower tiers and in secondary/tertiary markets. At the end of 2010, cap rates for mid-tier assets in tertiary markets exceeded those in primary markets by approximately 200 basis points, with secondary markets falling in the middle. This arbitrage offers attractive return spreads when viewed with properly assessed risks and a longer, fi ve-plus-year investment horizon.
2011 Investment Outlook
◆ Sales Volume Rising, Still Well Below Peak Levels. Dollar volume will rise further this year as the economy gains momentum, apartment fun-damentals improve and debt markets loosen. During 2010, apartment sales volume totaled an estimated $40 billion, up nearly 65 percent from the cyclical low in 2009 but less than one-third of the 2006 peak.
◆ Apartment Buyer Composition Shifting. REITs and institutions will increase acquisitions in 2011. Last year, approximately 80 percent of all transactions fell below $10 million, refl ecting a highly active private-buyer segment; however, public and institutional investors nearly qua-drupled their share of transactions, while equity funds tripled their share.
◆ Cap Rates Recompress. The average cap rate will decline in 2011 after slipping 20 basis points in 2010 to 7.2 percent, led by recompression of the most sought-after deals. Since peaking in 2009, cap rates for top-quality properties have fallen by as much as 100 basis points. Additional sup-port for prices derives from historically light construction and emerging demographic shifts that favor rental housing.
◆ Distress Creating Opportunities — in Moderation. Distressed-property sales increased dramatically in recent quarters, led by gains in deals over $20 million, but distressed activity still accounts for just 12 percent of all apartment sales. While demand for high-quality distress deals will con-tinue to outpace supply, a shortage of apartment construction, combined with a positive demand-side outlook and fi rming values, may turn more investor attention to unfi nished multifamily developments.
Low-Cost Debt, Rent Growth toIncrease Sales, Broaden Buyer Demand
* Estimate ** Through 3QSources: Marcus & Millichap Research Services, CoStar Group, Inc., RCA

page 10 2011 Annual Report
* Estimate ** ForecastSources: Marcus & Millichap Research Services, CoStar Group, Inc., RCA
Demand Surge Sparks Performance Gains,Though Distress Lingers in Atlanta
-150
-100
-50
0
50
Tota
l Non
farm
Job
s (t
hous
ands
)
Absolute Change Y-O-Y % Change
Employment Trends
08 09 10* 11**07
Year-over-Year Change
Uni
ts (
thou
sand
s)
Completions Vacancy
Supply and Demand
Vacancy Rate
$30
$40
$50
$60
$70
Med
ian
Pric
e pe
r U
nit
(tho
usan
ds)
Sales Trends
07 08 09 10*06
Year
-ove
r-Ye
ar C
hang
e
Asking Rents Effective Rents
Rent Trends
08 09 10* 11**07
0
2
4
6
8
08 09 10* 11**076%
8%
10%
12%
14%
-6%
-4%
-2%
0%
2%
-6%
-3%
0%
3%
6%
Atlanta Up 3 Places 2011 Rank: 39 2010 Rank: 42
Market Forecast Employment: 1.6% ▲ Construction: 3,900 ▼ Vacancy: 150 bps ▼ Effective Rents: 3.1% ▲
Renter demand will continue to improve in Atlanta during 2011 as hiring accelerates, providing a foundation for property owners to raise rents more aggressively as the year progresses. Asking rents in the Class A
segment, especially, appear poised to grow faster than the 1 percent increase posted last year. Submarkets such as Buckhead, Marietta and South Gwin-nett County, each with a large stock of upper-tier rentals, will record some of the greatest rent gains as availability tightens in these established core areas . Asking rents at Class B/C complexes will also rise more signifi cantly as hiring in lower-paying sectors boosts demand for lower-tier rental s . In another posi-tive trend in the market, completions will decrease this year. As demand-side conditions strengthen, however, developers will advance projects through the pipeline, initiating a new building cycle after 2011. Potential supply growth remains greatest in the Midtown and Cherokee County submarkets, where planned projects equal 19 percent and 12 percent of existing stock, respectively.
Although property operations will gain ground this year, the improve-ments may arrive too late to avert distress for many owners who purchased assets at the peak of the market under aggressive rent growth and occu-pancy assumptions. Sales of lender-owned properties accounted for more than 75 percent of Atlanta-area deals last year and will command a sizable proportion again in the year ahead. Potential buyers include owners of sta-bilized assets who have met return objectives and can redeploy capital into properties with greater upside potential. In addition to distressed assets, stabilized complexes that can be obtained with agency debt will draw the greatest interest, with cap rates expected to vary from 8 percent to 9 per-cent. More intense competition for well-performing Class A complexes will compress cap rates to less than 6 percent as a result.
2011 Market Outlook
◆ 2011 NAI Rank: 39, Up 3 Places. Below-average rent gains limited At-lanta’s rise in the NAI to just three spots this year.
◆ Employment Forecast: Employers will create 37,000 positions in 2011, a 1.6 percent increase. Last year, 21,700 jobs were added.
◆ Construction Forecast: Deliveries will subside to 1,000 units this year, compared with 4,900 units in 2010 and the fi ve-year average completion of 5,700 rentals annually.
◆ Vacancy Forecast: Following a 140 basis point decline last year, vacancy will fall 150 basis points in 2011 to 8.8 percent. Stronger job creation in the service sectors will reduce the Class B/C vacancy rate by 140 basis points to 11.1 percent.
◆ Rent Forecast: Driven by a 3.4 percent increase in the Class A segment, marketwide average asking rents will rise 2.5 percent this year to $853 per month; Class B/C asking rents will advance 1.4 percent. Marketwide effective rents will jump 3.1 percent to $770 per month.
◆ Investment Forecast: Distressed lower-quality assets will continue to at-tract buyers able to take a considerable equity portion in deals. Prices of approximately $20,000 per unit remain an attractive entry point for investors seeking to expand local portfolios.

2011 Annual Report page 11
* Estimate ** ForecastSources: Marcus & Millichap Research Services, CoStar Group, Inc., RCA
-30
-15
0
15
30
Tota
l Non
farm
Job
s (t
hous
ands
)
Absolute Change Y-O-Y % Change
Employment Trends
08 09 10* 11**07
Year-over-Year Change
Uni
ts (
thou
sand
s)
Completions Vacancy
Supply and Demand
Vacancy Rate
$40
$45
$50
$55
$60
Med
ian
Pric
e pe
r U
nit
(tho
usan
ds)
Sales Trends
07 08 09 10*06
Year
-ove
r-Ye
ar C
hang
e
Asking Rents Effective Rents
Rent Trends
08 09 10* 11**07
0
3
6
9
12
08 09 10* 11**074%
6%
8%
10%
12%
-4%
-2%
0%
2%
4%
-8%
-4%
0%
4%
8%
Market Forecast Employment: 3.6% ▲ Construction: 1,100 ▼ Vacancy: 140 bps ▼ Effective Rents: 5.6% ▲
Austin Apartment Demand to Outstrip New Supply, Driving Above-Average Rent Growth
Healthy job and population growth will combine with reduced con-struction to set the stage for a potential shortage of apartments by late 2011. Throughout the economic downturn, absorption remained
positive in Austin, with rising vacancy largely a product of surging con-struction as opposed to sagging demand. Many of the complexes brought online in 2009 have since stabilized, with vacancy declining substantially through 2010; however, construction has commenced on just a handful of projects. As vacancy slips to a 10-year low in 2011, supporting stronger rent gains and concession burn, some planned and postponed projects will move off the sidelines. This likely includes a few large master-planned commu-nities just outside the metro’s boundaries along Highway 130. It will take time for developers to fully reboot, though, and Austin property owners will benefi t from the lull in completions over the next 12 to 18 months.
Austin apartment prices declined to a lesser degree than anticipated during the downturn and even began to recover last year, rising 3 percent. Limited discounting has driven many local investors to other Texas metros, a trend likely to persist through 2011 as prices edge up, particularly for bet-ter-quality assets. Opportunities for local investors will center around small properties in some level of distress, while most larger deals will be targeted by REITs, syndicates and out-of-state, private investors. Strong competition has already driven down cap rates for best-of-class assets to the low-5 per-cent range, while fi rst-year returns on well-located Class B properties fall in the high-6 percent range. As a result of compression, cap rates today may be comparable to some coastal markets, but investors in Austin anticipate outsized rent gains over the next few years as new apartment supply falls short of demand.
2011 Market Outlook
◆ 2011 NAI Rank: 9, Up 7 Places. The strongest rate of job growth in the nation fueled Austin’s seven-place jump in the index into the top 10.
◆ Employment Forecast: Job growth will reach 3.6 percent, or 28,000 posi-tions, in 2011. Last year, local employment rose by 3 percent.
◆ Construction Forecast: Construction will continue to wind down this year, with 1,800 units slated for delivery. In 2009 and 2010, developers completed 10,400 units and 2,900 units, respectively.
◆ Vacancy Forecast: Vacancy in Austin will decline 140 basis points in 2011 to 6.2 percent, the lowest level since 2001. Last year, vacancy plummeted 250 basis points.
◆ Rent Forecast: This year, average asking rents will rise 4.2 percent to an average of $901 per month, and effective rents will climb 5.6 percent to $824 per month.
◆ Investment Forecast: More Class A product will likely become available this year as projects completed in 2009 and early 2010 achieve suffi cient occupancy to support a sale. Proceeds from these deals will likely be put toward new development as higher rents and occupancy justify con-struction costs.
AustinUp 7 Places 2011 Rank: 9 2010 Rank: 16

page 12 2011 Annual Report
* Estimate ** ForecastSources: Marcus & Millichap Research Services, CoStar Group, Inc., RCA
Market Forecast Employment: 2.0% ▲ Construction: 410 ▼ Vacancy: 100 bps ▼ Effective Rents: 4.5% ▲
-90
-45
0
45
90
Tota
l Non
farm
Job
s (t
hous
ands
)
Absolute Change Y-O-Y % Change
Employment Trends
08 09 10* 11**07
Year-over-Year Change
Uni
ts (
thou
sand
s)
Completions Vacancy
Supply and Demand
Vacancy Rate
$60
$80
$100
$120
$140
Med
ian
Pric
e pe
r U
nit
(tho
usan
ds)
Sales Trends
07 08 09 10*06
Year
-ove
r-Ye
ar C
hang
e
Asking Rents Effective Rents
Rent Trends
08 09 10* 11**07
0
2
4
6
8
08 09 10* 11**073%
4%
5%
6%
7%
-4%
-2%
0%
2%
4%
-6%
-3%
0%
3%
6%
A faster pace of job growth, a decline in rental construction, and im-proving vacancy and rent trends will place Boston among the top performing apartment markets in the country in 2011. Following a
solid rebound in hiring last year, employers will step up the pace as de-mand for goods and services strengthens in the months ahead. Job gains will occur in most employment segments, with the professional and busi-ness services and education and health services sectors expected to each grow nearly 3 percent. Demand for rental housing will improve with the employment market. Vacancy will decrease to the low-3 percent range in core urban submarkets, down from more than 5 percent during the reces-sion. In the suburbs, where more than 60 percent of jobs in the metro exist, vacancy will dip below 6 percent, enabling operators to signifi cantly reduce concessions by the second half of 2011.
As Boston remains a large, primary market with diverse demand driv-ers, local apartments will generate considerable interest when listed. Gener-ally, cap rates ranged from about 6.2 percent to 7.0 percent at the end of last year. Low interest rates and intensifi ed bidding will maintain downward pressure on cap rates throughout the fi rst half of 2011, encouraging owners to explore sales. Local investors will leverage price adjustments to expand portfolios, focusing on small properties in the city of Boston and near-in suburbs. Institutions and REITs, which increased activity in the second half of 2010, will target large, high-quality properties in the suburbs. The prob-ability that more intense bidding for these assets will drive up prices as the year progresses may compel many of these investors to seek lower-priced opportunities in other markets.
2011 Market Outlook
◆ 2011 NAI Rank: 3, Up 5 Places. Low housing affordability and above-average employment growth pushed Boston to the third position in this year’s NAI.
◆ Employment Forecast: In 2011, employment will expand 2 percent, or by 49,000 positions, compared with a 1.5 percent increase nationwide. Last year, local employers created 37,500 jobs.
◆ Construction Forecast: Rental stock will grow only 0.3 percent in 2011 as 600 units are completed, one of the lowest totals in the past 10 years. Slightly more than 1,000 rentals were delivered in 2010.
◆ Vacancy Forecast: Waning construction and accelerated job growth will support a 100 basis point decline in vacancy this year to 4.5 percent. The release of pent-up demand generated a 90 basis point decrease in the vacancy rate during 2010.
◆ Rent Forecast: In 2011, asking rents will climb 3.5 percent to $1,777 per month, while concessions will burn as effective rents advance 4.5 percent to $1,697 per month.
◆ Investment Forecast: Additional loosening of the capital markets will support strong bids among local buyers for small properties in the city of Boston. Investors seeking stable suburban assets will focus on the Mass Pike and Route 9 corridors.
Vacancy Decline Persists, Rents to RiseFollowing Strong Rebound Last Year
Boston Up 5 Places 2011 Rank: 3 2010 Rank: 8

2011 Annual Report page 13
* Estimate ** ForecastSources: Marcus & Millichap Research Services, CoStar Group, Inc., RCA
-50
-25
0
25
50
Tota
l Non
farm
Job
s (t
hous
ands
)
Absolute Change Y-O-Y % Change
Employment Trends
08 09 10* 11**07
Year-over-Year Change
Uni
ts (
thou
sand
s)
Completions Vacancy
Supply and Demand
Vacancy Rate
$30
$40
$50
$60
$70
Med
ian
Pric
e pe
r U
nit
(tho
usan
ds)
Sales Trends
07 08 09 10*06
Year
-ove
r-Ye
ar C
hang
e
Asking Rents Effective Rents
Rent Trends
08 09 10* 11**07
0
1
2
3
4
08 09 10* 11**074%
6%
8%
10%
12%
-6%
-3%
0%
3%
6%
-6%
-3%
0%
3%
6%
Market Forecast Employment: 2.1% ▲ Construction: 860 ▼ Vacancy: 100 bps ▼ Effective Rents: 3.6% ▲
A projected decrease in apartment completions this year will under-pin a further reduction in vacancy and enable Charlotte property operators to implement more signifi cant rent increases. In a market
characterized by periods of substantial development, the slowdown in construction and permitting constitute important trends that will infl u-ence apartment operations for the next several quarters. Beyond the effects of minimal completions during 2011, permitting fell to one of the lowest annual totals on record last year, assuring the construction cycle will not accelerate until late 2012. The gap in the cycle provides owners the oppor-tunity to leverage this year’s expected improvements in rental demand and tenant turnover into higher rents and reduced concessions on new leases. In areas where vacancy has already fallen well below the marketwide aver-age, such as the Carmel and North Pineville submarkets, rent growth will signifi cantly outpace the metrowide average.
After two years of subdued activity, improving fi nancing capacity, a large stock of new properties and prices below pre-recession levels will re-attract investors back to the metro in 2011. Initially, most buyers will con-centrate on assets located within the boundaries formed by interstates 85 and 485, along with areas with easy access to major employment nodes. As the year progresses, though, activity will shift gradually to more suburban areas as the recovery in property operations gains momentum. Assets in Gaston County and communities along the Interstate 77 and I-85 corridors north of the downtown area may offer considerable upside for investors skilled in operating suburban, garden-style properties.
2011 Market Outlook
◆ 2011 NAI Rank: 28, Up 1 Place. Charlotte remained near the middle of the index due to below-average rent growth and high vacancy.
◆ Employment Forecast: Employers will create 17,000 jobs in the metro this year, a 2.1 percent increase and up from 2010, when 10,300 new hires were made.
◆ Construction Forecast: Projects totaling 900 units will come online in 2011, down from 1,760 units last year.
◆ Vacancy Forecast: A decrease in construction and projected positive net absorption of 1,800 units will reduce the vacancy rate 100 basis points to 7.6 percent this year. Vacancy fell 270 basis points in 2010.
◆ Rent Forecast: Driven by signifi cant rent growth in low-vacancy areas such as the Harris Boulevard and East Charlotte submarkets, marketwide asking rents will rise 2.7 percent this year to $789 per month. Effective rents will increase 3.6 percent to $717 per month.
◆ Investment Forecast: Attractive investment opportunities will emerge in several potential high-growth areas of the metro as property operations strengthen. Complexes that serve the growing employment base at the North Carolina Research Park in Kannapolis, for example, will garner increased attention.
Reduced Construction Supports Operations,Draws Investors to Charlotte
CharlotteUp 1 Place 2011 Rank: 28 2010 Rank: 29

page 14 2011 Annual Report
* Estimate ** ForecastSources: Marcus & Millichap Research Services, CoStar Group, Inc., RCA
Market Forecast Employment: 1.3% ▲ Construction: 1,720 ▼ Vacancy: 60 bps ▼ Effective Rents: 3.2% ▲
-240
-160
-80
0
80
Tota
l Non
farm
Job
s (t
hous
ands
)
Absolute Change Y-O-Y % Change
Employment Trends
08 09 10* 11**07
Year-over-Year Change
Uni
ts (
thou
sand
s)
Completions Vacancy
Supply and Demand
Vacancy Rate
$50
$60
$70
$80
$90
Med
ian
Pric
e pe
r U
nit
(tho
usan
ds)
Sales Trends
07 08 09 10*06
Year
-ove
r-Ye
ar C
hang
e
Asking Rents Effective Rents
Rent Trends
08 09 10* 11**07
0
1
2
3
4
08 09 10* 11**074%
5%
6%
7%
8%
-6%
-4%
-2%
0%
2%
-6%
-3%
0%
3%
6%
Operating conditions in the Chicago apartment market will strength-en considerably this year, building on improvements in vacancy and rents recorded in 2010. Apartment construction will sink to one of
the lowest levels in the past decade, minimizing competition for tenants at a time when renewed job growth will accelerate the formation of rental households. A 2 percent increase in fi nancial services and professional and business services employment will spur demand for apartments in higher-priced city submarkets such as the Gold Coast and the Loop. As vacancy in the city falls closer to the 5 percent threshold in 2011 , rent growth and a more rapid burn-off of concessions will commence in the second half. The performance of properties in inner-ring suburbs also will strengthen this year, as apartments in these areas draw both residents from outlying sections of the metro who desire housing closer to workplaces and those renters shut out of tighter in-city submarkets .
Driven by low interest rates and the expanded availability of acquisi-tion fi nancing, the investment market will gain momentum in 2011. Buyers will bid aggressively on high-quality properties in the city and fi rst-ring sub-urbs, encouraging an increasing number of owners to list assets. Cap rates fell across the market in 2010 but will likely remain near their current ranges through this year. High-quality assets in city locations often command fi rst-year returns of less than 6 percent, while noncore city assets and properties in the suburbs primarily trade from 6.5 percent to 8.0 percent based upon current operations. Distressed listings received considerable attention in 2010, but deals involving these assets will diminish as the year progresses and owners facing diffi culties begin to restore property operations.
2011 Market Outlook
◆ 2011 NAI Rank: 23, Down 3 Places. Chicago’s lagging employment mar-ket and modest rent growth dropped the metro three spots in the index.
◆ Employment Forecast: Expansion of the trade and professional and busi-ness services sectors will contribute signifi cantly to the creation of 52,500 jobs this year, a 1.3 percent increase in total employment. Approximately 20,000 positions were eliminated in 2010.
◆ Construction Forecast: Only 700 new rentals will come online in 2011, down considerably from the completion of 2,420 units last year.
◆ Vacancy Forecast: The metrowide vacancy rate will decrease 60 basis points this year to 5.5 percent on resurgent demand and minimal con-struction; vacancy also fell 60 basis points in 2010.
◆ Rent Forecast: Asking rents will rise 2.3 percent to $1,070 per month in 2011, following a 1.3 percent increase last year. Concessions will decline to 6.1 percent of asking rents as effective rents climb 3.2 percent to $1,005 per month; in 2010, effective rents advanced 2.4 percent.
◆ Investment Forecast: Investors seeking distressed assets will continue to fi nd opportunities on the southern and western sides of the city. Prospec-tive buyers will require a long-term outlook for rehabilitating properties, restoring stable operations and implementing rent increases.
Resurgent Demand BoostsOperations, Pressing Prices Upward
Chicago Down 3 Places 2011 Rank: 23 2010 Rank: 20

2011 Annual Report page 15
* Estimate ** ForecastSources: Marcus & Millichap Research Services, CoStar Group, Inc., RCA
Major Development Projects GenerateJobs, Support Apartment Demand
CincinnatiDown 3 Places 2011 Rank: 33 2010 Rank: 30
Spurred by an economic recovery in the city core and marketwide job growth , apartment operations in Cincinnati will strengthen further in 2011. The fi rst phase of the mixed-use Banks development, located be-
tween the Great American Ballpark and Paul Brown Stadium on the Ohio River, will open in the second quarter of this year, expanding rental inven-tory in the Downtown submarket by 3 percent. Nevertheless, high-paying job growth in the area will outpace new supply. Metrowide, employers will add more than 5,600 positions in the professional and business services and education and health services sectors this year, boosting Class A demand near major employment centers. Operations at Class B/C complexes will also improve as employment gains rise in lower-paying industries. De-velopment of the Broadway Commons Casino, for instance, will generate 2,100 construction jobs during 2011 and 2,800 permanent positions by year-end 2012. As a result, vacancy will retreat to a 10-year low in Cincinnati.
Apartment sales activity in the metro will increase this year as local investors leave the sidelines and out-of-state syndicates explore new op-portunities. In the lower tiers, buyers will target older REO complexes with turnaround potential. Many of these properties were purchased by out-of-state investors at the height of the market and have since been foreclosed due to weakening operations and banks’ reluctance to refi nance. Two in-vestment strategies are emerging with these deals. Local buyers are pur-chasing at low per-door prices, addressing deferred maintenance issues and stabilizing the property for long-term revenue potential. Syndicates, however, are re-listing assets shortly after building and occupancy condi-tions improve. Top-tier investment activity remains focused on complexes in the Downtown and Blue Ash/Amberley submarkets due to their high barriers to entry and historically stable NOIs. Cap rates for assets in pre-mium locations currently average in the mid- to high-6 percent range and could compress further if institutions and REITs become active.
2011 Market Outlook
◆ 2011 NAI Rank: 33, Down 3 Places. Below-average job growth and high home affordability dropped Cincinnati three positions in this year’s NAI.
◆ Employment Forecast: Approximately 13,200 jobs will be added to the work force this year, a 1.3 percent increase. In 2010, employers created 700 positions.
◆ Construction Forecast: Following the completion of 350 units last year, developers will deliver 700 apartments in 2011.
◆ Vacancy Forecast: Vacancy will tick down 60 basis points this year to 6.3 percent. In 2010, the average vacancy rate retreated 110 basis points.
◆ Rent Forecast: Asking rents will increase 1.9 percent during 2011 to $715 per month, and effective rents will climb 2.4 percent to $683 per month.
◆ Investment Forecast: Financing standards in Cincinnati remain slightly more stringent than in some other markets , creating opportunities for cash-heavy investors to purchase quality assets in a relatively stable met-ro without competing with highly leveraged buyers.
-40
-20
0
20
40
Tota
l Non
farm
Job
s (t
hous
ands
)
Absolute Change Y-O-Y % Change
Employment Trends
08 09 10* 11**07
Year-over-Year Change
Uni
ts
Completions Vacancy
Supply and Demand
Vacancy Rate
$30
$32
$34
$36
$38
Med
ian
Pric
e pe
r U
nit
(tho
usan
ds)
Sales Trends
07 08 09 10*06
Year
-ove
r-Ye
ar C
hang
e
Asking Rents Effective Rents
Rent Trends
08 09 10* 11**07
0
250
500
750
1,000
08 09 10* 11**075%
6%
7%
8%
9%
-4%
-2%
0%
2%
4%
-4%
-2%
0%
2%
4%
Market Forecast Employment: 1.3% ▲ Construction: 350 ▲ Vacancy: 60 bps ▼ Effective Rents: 2.4% ▲

page 16 2011 Annual Report
* Estimate ** ForecastSources: Marcus & Millichap Research Services, CoStar Group, Inc., RCA
Market Forecast Employment: 1.1% ▲ Construction: 210 ▼ Vacancy: 40 bps ▼ Effective Rents: 2.2% ▲
-75
-50
-25
0
25
Tota
l Non
farm
Job
s (t
hous
ands
)
Absolute Change Y-O-Y % Change
Employment Trends
08 09 10* 11**07
Year-over-Year Change
Uni
ts
Completions Vacancy
Supply and Demand
Vacancy Rate
$25
$30
$35
$40
$45
Med
ian
Pric
e pe
r U
nit
(tho
usan
ds)
Sales Trends
07 08 09 10*06
Year
-ove
r-Ye
ar C
hang
e
Asking Rents Effective Rents
Rent Trends
08 09 10* 11**07
0
150
300
450
600
08 09 10* 11**074%
5%
6%
7%
8%
-6%
-4%
-2%
0%
2%
-6%
-3%
0%
3%
6%
During 2011, healthy hiring in the local professional and business ser-vices sector will drive Class A vacancies in Cleveland below those in lower-tier properties for the fi rst time in nearly a decade. Last year,
white-collar payrolls expanded at the fastest pace since 1999, and continued gains this year will fuel stronger Class A leasing activity. This trend will help top-tier owners regain control over rents, especially in upscale areas like the Beachwood and Strongsville/Berea submarkets, where vacancies will settle below 3 percent in 2011. The recovery of Class B/C operations will continue to lag until lower-paying industries post several consecutive quarters of sustainable growth and unemployment levels retract. Close-in areas, including the East Cleveland submarket, will record metro-high va-cancies as a result, hindering owners’ ability raise rents this year.
With low interest rates improving investor motivation in Cleveland, many owners who held assets through the downturn will begin to divest, spurring increased deal fl ow. Sales involving performing, higher-end as-sets will account for a larger share of closings, though competition from regional, high-net-worth buyers will remain fi erce. The availability of up-scale, stabilized assets will fall short of buyer demand, potentially com-pressing cap rates for best-in-class properties below their current average in the low- to mid-7 percent range. Distressed-asset sales will also play a role as local buyers with extended outlooks target underperforming Class B/C properties, despite some near-term challenges. Attractive per-unit prices for assets in hard-hit areas such as Euclid may provide investors with an opportunity to achieve healthy long-term returns once operations stabilize.
2011 Market Outlook
◆ 2011 NAI Rank: 40, Down 8 Places. Cleveland fell eight spots in the in-dex due to below-average rent growth, slowing payroll expansion and high home affordability.
◆ Employment Forecast: Employers will add 11,000 jobs this year, a 1.1 percent increase. During 2010 , the work force grew by 17,000 positions, marking the end of four consecutive years of payroll contractions.
◆ Construction Forecast: After 290 units were added to inventory last year, fewer than 80 units will come online in 2011.
◆ Vacancy Forecast: The vacancy rate in Cleveland will improve 40 basis points this year to 5.6 percent, after dropping 90 basis points in 2010.
◆ Rent Forecast: In 2011, asking rents will tick up 1.7 percent to $733 per month. Effective rents will appreciate 2.2 percent to $699 per month, pulling concessions below the 10-year average.
◆ Investment Forecast: This year, cap rates for stabilized Class B assets will average in the low- to high-8 percent range, while fully occupied Class C properties will trade with initial yields between 9 percent and 10 percent, providing healthy returns for buyers.
Cleveland Apartment MarketTightens on Strength of Class A Sector
Cleveland Down 8 Places 2011 Rank: 40 2010 Rank: 32

2011 Annual Report page 17
* Estimate ** ForecastSources: Marcus & Millichap Research Services, CoStar Group, Inc., RCA
Columbus Apartment Investments toAttract Yield-Seeking Buyers in 2011
ColumbusDown 6 Places 2011 Rank: 37 2010 Rank: 31
-40
-20
0
20
40
Tota
l Non
farm
Job
s (t
hous
ands
)
Absolute Change Y-O-Y % Change
Employment Trends
08 09 10* 11**07
Year-over-Year Change
Uni
ts (
thou
sand
s)
Completions Vacancy
Supply and Demand
Vacancy Rate
$20
$30
$40
$50
$60
Med
ian
Pric
e pe
r U
nit
(tho
usan
ds)
Sales Trends
07 08 09 10*06
Year
-ove
r-Ye
ar C
hang
e
Asking Rents Effective Rents
Rent Trends
08 09 10* 11**07
0
0.4
0.8
1.2
1.6
08 09 10* 11**076%
7%
8%
9%
10%
-4%
-2%
0%
2%
4%
-6%
-3%
0%
3%
6%
White-collar employment expansion will boost top-tier apartment demand in Columbus early this year, while lagging blue-collar job gains will limit improvement among Class B/C properties until
late 2011. The professional and business services and fi nancial services sec-tors will create nearly 6,000 jobs, reclaiming half the positions lost during the recession. Additions at fi nance companies, including the Westerville offi ce of Chase, are particularly encouraging, considering the fi nancial ser-vices sector entered the recession early due to the credit crisis. While lower-tier conditions will not improve signifi cantly until the second half, some ar-eas, including Hilliard, will begin to recover sooner. Developers will break ground in 2011 on the Hollywood Casino in the Hilliard submarket, gen-erating 3,500 construction jobs. When completed in 2012, the project will create 2,000 permanent positions, providing long-term demand for local apartment operators.
As cap rates compress in major metros during the fi rst half of 2011, yield-seeking buyers will gravitate toward the relative safety of the Colum-bus apartment market to take advantage of initial returns that meet their investment goals. In addition to traditional sales, some buyers will target high-vacancy, value-add opportunities as prices for these assets dip to a market-clearing level. Healthy job growth and a slow-moving single-family housing market will enable owners to improve occupancy more quickly this year. Stabilized Class B/C properties, meanwhile, will trade in the mid- to high-9 percent range. Out-of-state investors interested in these complexes will fi nd opportunities in the Northeast and Southeast submarkets. Grow-ing apartment demand and limited competition from new supply in these areas provide long-term revenue potential for owners.
2011 Market Outlook
◆ 2011 NAI Rank: 37, Down 6 Places. Below-average employment and rent growth pushed down Columbus six places in the NAI.
◆ Employment Forecast: Employers will increase payrolls by 15,000 posi-tions this year, or 1.7 percent. In 2010, only 500 jobs were created.
◆ Construction Forecast: After nearly 900 apartments came online last year, development will slow to 785 units in 2011, expanding marketwide inventory by just 0.6 percent.
◆ Vacancy Forecast: Vacancy will decline 70 basis points this year to 8.3 percent on positive net absorption of more than 1,550 units. In 2010, va-cancy fell 20 basis points.
◆ Rent Forecast: Marketwide asking rents will climb 1.8 percent in 2011 to $675 per month, and effective rents will spike 2.4 percent to $636 per month. Last year, asking and effective rents rose 0.6 percent and 1.3 per-cent, respectively.
◆ Investment Forecast: Distressed and REO listings will become avail-able over the next several months as banks clear assets from their books. Lower per-door prices for these properties will interest investors with a penchant for improving operations and realizing upside potential.
Market Forecast Employment: 1.7% ▲ Construction: 100 ▼ Vacancy: 70 bps ▼ Effective Rents: 2.4% ▲

page 18 2011 Annual Report
* Estimate ** ForecastSources: Marcus & Millichap Research Services, CoStar Group, Inc., RCA
Market Forecast Employment: 2.7% ▲ Construction: 3,580 ▼ Vacancy: 80 bps ▼ Effective Rents: 3.4% ▲
-100
-50
0
50
100
Tota
l Non
farm
Job
s (t
hous
ands
)
Absolute Change Y-O-Y % Change
Employment Trends
08 09 10* 11**07
Year-over-Year Change
Uni
ts (
thou
sand
s)
Completions Vacancy
Supply and Demand
Vacancy Rate
$30
$35
$40
$45
$50
Med
ian
Pric
e pe
r U
nit
(tho
usan
ds)
Sales Trends
07 08 09 10*06
Year
-ove
r-Ye
ar C
hang
e
Asking Rents Effective Rents
Rent Trends
08 09 10* 11**07
0
5
10
15
20
08 09 10* 11**074%
6%
8%
10%
12%
-4%
-2%
0%
2%
4%
-6%
-3%
0%
3%
6%
The apartment market recovery exhibited greater strength in the Dal-las side of the Metroplex last year but will spread throughout the market during 2011 as job growth materializes across multiple sec-
tors. In 2010, employment gains in the professional and business services and education and health services sectors disproportionately benefi ted Dal-las apartment complexes. While these vital segments will each add more than 10,000 positions this year, manufacturers and government employers, industries particularly important to Fort Worth apartment operators, will join them. As a result, the vacancy gap between the two cities will narrow and rent growth will accelerate across the Metroplex. Supply-side pressure will continue to abate and center in Dallas suburbs. The 4,200 apartments that come online this year will fall far short of the demand generated from the estimated 50,000 new households that will form in the Metroplex by year end, supporting net absorption well above the fi ve-year average.
A wide range of buyers are attracted to the Dallas/Fort Worth apartment market, which should buoy deal fl ow again this year. Private, out-of-state syn-dicates, in particular, will boost their presence to acquire smaller properties. Af-ter stabilizing and fi nancing these complexes, these buyers will redeploy the capital to create portfolios. Local investors with a penchant for improving op-erations and doing light renovations can generate upside by purchasing Class C or lower-end Class B properties in blue-collar areas, where job growth will accelerate this year. REITs and institutions will also remain active, targeting re-cently stabilized properties completed immediately before the recession. In 2008 and 2009, builders delivered nearly 28,000 apartments in large complexes, many of which now qualify for agency fi nancing. Cap rates for these deals have fallen to the low-6 percent range, 50 basis points below the previous cyclical low.
2011 Market Outlook
◆ 2011 NAI Rank: 18, Up 5 Places. Dallas/Fort Worth jumped fi ve spots in the index behind strong household formation and limited construction.
◆ Employment Forecast: Employers will add 77,000 positions in the Metroplex this year as every sector expands. The pace of job growth will reach 2.7 percent, after payrolls increased 1.2 percent during 2010.
◆ Construction Forecast: Only 4,200 apartments will come online this year, a minor 0.7 percent rise to stock. Household growth of 2.3 percent will far outpace the number of new single- and multifamily homes built in 2011.
◆ Vacancy Forecast: Average vacancy will dip to 6.7 percent by year end, 80 basis points below the rate at the beginning of the year. In 2010, va-cancy plummeted 220 basis points.
◆ Rent Forecast: Asking rents will climb 3.1 percent this year to $804 per month as effective rents jump 3.4 percent to $722 per month. Leasing incentives will fall by two days of free rent.
◆ Investment Forecast: The market’s large inventory provides investors with plenty of distressed opportunities. At the end of last year, over $850 million of apartment properties were in some level of distress. Improv-ing fundamentals and renewed lender enthusiasm to clear books will reduce that fi gure signifi cantly by year-end 2011.
Household Formation Outpaces Construction, Firms Operating Conditions
Dallas/Fort Worth Up 5 Places 2011 Rank: 18 2010 Rank: 23

2011 Annual Report page 19
* Estimate ** ForecastSources: Marcus & Millichap Research Services, CoStar Group, Inc., RCA
Apartment Operators Regain Pricing Power as Vacancy Recedes to 10-Year Low
DenverUp 7 Places 2011 Rank: 14 2010 Rank: 21
-60
-30
0
30
60
Tota
l Non
farm
Job
s (t
hous
ands
)
Absolute Change Y-O-Y % Change
Employment Trends
08 09 10* 11**07
Year-over-Year Change
Uni
ts (
thou
sand
s)
Completions Vacancy
Supply and Demand
Vacancy Rate
$50
$55
$60
$65
$70
Med
ian
Pric
e pe
r U
nit
(tho
usan
ds)
Sales Trends
07 08 09 10*06
Year
-ove
r-Ye
ar C
hang
e
Asking Rents Effective Rents
Rent Trends
08 09 10* 11**07
0
1
2
3
4
08 09 10* 11**072%
4%
6%
8%
10%
-6%
-3%
0%
3%
6%
-6%
-3%
0%
3%
6%
By year-end 2011, apartment vacancy in Denver will slip to the lowest level in a decade, allowing owners to raise rents and scale back conces-sions. The local apartment market recovery began in 2010, fueled by
pent-up renter demand for close-in units near employment hubs and light-rail stations. This year, however, accelerating job growth and reduced construc-tion should begin to spread improvements throughout the metro. Owners in the Denver-Downtown, Denver-Central, Denver-North and Lakewood-South submarkets, where vacancy already falls below 5 percent, will leverage tighter conditions by trimming concessions at an above-average pace. Op-erations in hard-hit areas like Aurora will also improve, with vacancy rates declining from the peak levels reached in late 2009. A signifi cant reduction in leasing incentives in these areas will not occur until the second half of 2011, though, when job creation intensifi es in typically lower-paying sectors, in-cluding leisure and hospitality and trade, transportation and utilities.
Investor demand for distressed listings remains strong, but the short-age of available supply is encouraging more investors to bid on perform-ing assets in traditionally sturdy locations. The limited number of distressed properties on the market will also curb price discounting as fi erce competi-tion for short sales and REO listings pushes values to well above initial list prices. Only a few newer, higher-quality distressed properties traded recent-ly, and banks will wait for more signifi cant improvement in occupancy and rents to dispose of these reclaimed assets. As unsatisfi ed demand for these deals migrates to the traditional apartment investment market, cap rates for strong-performing properties, particularly those in close-in locations or proximate to public transportation, have begun to decline. The most sought-after high-quality assets will close at cap rates in the 6 percent range early this year, considerably lower than the marketwide average of 7.5 percent.
2011 Market Outlook
◆ 2011 NAI Rank: 14, Up 7 Places. Tight vacancy and healthy employment gains helped push up Denver seven places in the 2011 ranking.
◆ Employment Forecast: Denver payrolls will rise by 24,000 positions in 2011, a 2 percent gain. Growth resumed in 2010 after two years of con-traction, with local employment expanding by 0.5 percent.
◆ Construction Forecast: Only 800 units are slated for completion in 2011, down from 2,550 units last year.
◆ Vacancy Forecast: Reduced construction and accelerating job growth will support an 80 basis point decrease in vacancy to 5 percent this year. During 2010, vacancy declined 220 basis points.
◆ Rent Forecast: Asking rents will rise 3.1 percent in 2011 to $906 per month, while effective rents will climb 4.1 percent to $816 per month.
◆ Investment Forecast: With investors focusing on distressed deals and high-quality performing assets, many Class B/C properties in secondary and tertiary locations could be overlooked. These complexes may pres-ent strong acquisition opportunities for buyers with longer-term hold strategies, as some owners with maturing debt will need to adjust prices in order to minimize marketing times.
Market Forecast Employment: 2.0% ▲ Construction: 1,750 ▼ Vacancy: 80 bps ▼ Effective Rents: 4.1% ▲

page 20 2011 Annual Report
* Estimate ** ForecastSources: Marcus & Millichap Research Services, CoStar Group, Inc., RCA
Market Forecast Employment: 0.5% ▲ Construction: 0 ■ Vacancy: 40 bps ▼ Effective Rents: 1.4% ▲
-150
-100
-50
0
50
Tota
l Non
farm
Job
s (t
hous
ands
)
Absolute Change Y-O-Y % Change
Employment Trends
08 09 10* 11**07
Year-over-Year Change
Uni
ts
Completions Vacancy
Supply and Demand
Vacancy Rate
$30
$35
$40
$45
$50
Med
ian
Pric
e pe
r U
nit
(tho
usan
ds)
Sales Trends
07 08 09 10*06
Year
-ove
r-Ye
ar C
hang
e
Asking Rents Effective Rents
Rent Trends
08 09 10* 11**07
0
100
200
300
400
08 09 10* 11**075%
6%
7%
8%
9%
-9%
-6%
-3%
0%
3%
-6%
-3%
0%
3%
6%
Following years of volatility, the Detroit economy will transition into a period of relative stability as local manufacturers increase output and employment expands for the fi rst time in a decade. Aided by
state grants totaling more than $2 billion and the strengthening national economy, the Big Three will ramp up production in 2011, bolstering the need for additional manpower. Ford, for instance, plans to hire nearly 1,000 workers early this year at its Sterling Heights assembly plant, generating renter demand in Macomb County. As improving apartment demand marketwide faces a lack of new supply for the second consecutive year, average vacancy will fall to a four-year low. Occupancy gains will be most pronounced in higher-priced communities in Oakland County, includ-ing Troy, Farmington Hills and Pontiac/Waterford, where elevated home prices preclude residents from ownership. Still, years of deep job cuts will continue to weigh on hard-hit blue-collar areas in Wayne County, particu-larly the Midtown/West Detroit submarket, where vacancy will stay above 11 percent this year.
Improving investor sentiment and elevated cap rates will fuel an up-tick in sales activity in 2011. Lender-owned assets remain the focal point for most buyers, and as 2010 came to a close, rental properties in distress amounted to more than $300 million. Depending on location and buyer motivation, initial yields for these assets will reach as high as 13 percent, while most stabilized apartments will trade at average cap rates around 10 percent . With the local economy on the cusp of recovery, yield-driven in-vestors will perceive these returns as suffi cient to offset market challenges. Risk-averse buyers, meanwhile, will target Ann Arbor for seldom-traded assets that come to market. Strong student demand for off-campus housing, though, will keep cap rates for such assets well below metrowide averages.
2011 Market Outlook
◆ 2011 NAI Rank: 42, Down 6 Places. A stagnant employment market and limited improvement in vacancy pushed down Detroit six spots in the 2011 NAI.
◆ Employment Forecast: Local employers will resume payroll expansion this year, adding 8,400 jobs, a 0.5 percent gain. Last year, cuts totaled 9,000 positions.
◆ Construction Forecast: Rental stock growth will remain minimal this year; approximately 30 units will come online, matching the number of new apartments added in 2010.
◆ Vacancy Forecast: Following a 120 basis drop last year, vacancy will im-prove 40 basis points in 2011 to 6.5 percent.
◆ Rent Forecast: Asking rents will advance 1.1 percent this year to $815 per month, and effective rents will gain 1.4 percent to $736 per month.
◆ Investment Forecast: Midwestern investors with a fi ve- to 10-year out-look will seek to capitalize on the metro’s higher cash-on-cash returns. Given the availability of deeply discounted assets and early signs of re-covery, these investors may be well positioned to achieve healthy long-term returns.
Signs of Economic Stabilization Emerge;Modest Job Growth Expected
Detroit Down 6 Places 2011 Rank: 42 2010 Rank: 36

2011 Annual Report page 21
* Estimate ** ForecastSources: Marcus & Millichap Research Services, CoStar Group, Inc., RCA
Recovery in Broward County Continues;Declining Cap Rates to Spur Listing Activity
Fort LauderdaleUp 5 Places 2011 Rank: 34 2010 Rank: 39
-50
-25
0
25
50
Tota
l Non
farm
Job
s (t
hous
ands
)
Absolute Change Y-O-Y % Change
Employment Trends
08 09 10* 11**07
Year-over-Year Change
Uni
ts (
thou
sand
s)
Completions Vacancy
Supply and Demand
Vacancy Rate
$0
$30
$60
$90
$120
Med
ian
Pric
e pe
r U
nit
(tho
usan
ds)
Sales Trends
07 08 09 10*06
Year
-ove
r-Ye
ar C
hang
e
Asking Rents Effective Rents
Rent Trends
08 09 10* 11**07
0
0.5
1.0
1.5
2.0
08 09 10* 11**072%
4%
6%
8%
10%
-8%
-4%
0%
4%
8%
-8%
-4%
0%
4%
8%
Renter demand in Broward County spiked during 2010, and an addi-tional reduction in vacancy will occur this year as job creation stimu-lates rental household formation. Even as vacancy edges closer to 5.5
percent, the rate recorded at the start of the recession, property owners will face challenges in restoring rents and withdrawing concessions for a few more quarters . Effective rents have fallen sharply since the recession began due to waning tenant demand in most submarkets . The Deerfi eld Beach and West Hollywood submarkets will be an exception this year, however, as apartment operators will leverage improvements in demand to steadily reclaim some of the steepest rent declines recorded during the recession. Only modest rent increases are projected countywide, though, and a recov-ery to pre-recession levels in many submarkets may not occur until 2012.
Cap rates compressed throughout 2010 as investors bid aggressively on the limited number of quality properties available, and downward pres-sure on fi rst-year returns will persist this year. With the volume of assets listed remaining low, owners contemplating a near-term disposition will in-creasingly take advantage of the keen bidding climate to capture premium pricing before listed competition grows. Currently, cap rates on genuine Class A properties vary from 5.5 percent to 6.0 percent. Initial yields among lower-tier assets range between 7.5 percent and 8.0 percent, with greater fi nancing capacity from local banks and Fannie Mae continuing to revital-ize the market for such properties. Overall, improving occupancy will help stabilize cash fl ows at many complexes in the months ahead, though rising expenses could begin to pressure bottom lines. Property taxes will likely increase as many municipalities seek to raise revenues to cover projected budget shortfalls; utilities and insurance rates also may climb.
2011 Market Outlook
◆ 2011 NAI Rank: 34, Up 5 Places. Fort Lauderdale improved fi ve places in the index, as improving demand will be met with few new apartments.
◆ Employment Forecast: Eight of 10 primary employment sectors should add jobs in 2011 due to rising demand for goods and services. During the year, total employment will expand by 1.4 percent, or 9,500 positions; in 2010, employers created 1,000 jobs.
◆ Construction Forecast: New rentals will provide limited competition in 2011, as only 200 units will come online. Last year, two projects contain-ing an aggregate 740 units were delivered.
◆ Vacancy Forecast: Countywide vacancy will decline 80 basis points this year to 5.8 percent. In 2010, the rate decreased 200 basis points.
◆ Rent Forecast: Asking rents will advance 2.1 percent in 2011 to $1,080 per month, and effective rents will gain 3 percent to $1,021 per month.
◆ Investment Forecast: The possibility of foreclosed single-family homes purchased by investors entering the shadow rental market may elevate competition for tenants and impede the restoration of healthy operations at many apartment properties.
Market Forecast Employment: 1.4% ▲ Construction: 540 ▼ Vacancy: 80 bps ▼ Effective Rents: 3.0% ▲

page 22 2011 Annual Report
* Estimate ** ForecastSources: Marcus & Millichap Research Services, CoStar Group, Inc., RCA
Market Forecast Employment: 2.6% ▲ Construction: 5,520 ▼ Vacancy: 130 bps ▼ Effective Rents: 4.9% ▲
As companies consolidate operations in major offi ce districts, employ-ees will continue to migrate closer to workplaces, a trend that will remain the most prevalent force behind Houston apartment leasing
activity during the fi rst several months of 2011 . These well-paid profession-als have already begun to seek out new units as their leases expire, pushing the gap between Class A and Class B/C vacancy to an all-time high. This disparity will persist through the spring, but sparse additions to inventory and healthy household growth will enable operators of Class B/C proper-ties to begin closing the vacancy gap by midyear. Although improvement in lower-tier vacancy will be robust during the second half, overall occupancy in predominately Class B/C areas will continue to lag. In the Heights, Bay-town and San Jacinto/Galena Park submarkets, for example, vacancy will improve by an average of 350 basis points, though all three areas will report overall vacancy above 13 percent at the end of 2011.
Investors will move into the Houston apartment market in greater numbers during the fi rst half, taking advantage of increased acquisition prospects. The market’s late entry into the recession delayed the weaken-ing of apartment operations and subsequently suppressed the volume of distressed listings. More opportunities to acquire complexes with deferred maintenance and low occupancies will emerge in early 2011 as some of the nearly $1.5 billion in distressed apartment assets in the metro start to clear the market. Buyers will have to deploy considerable cash to execute deals, however, encouraging the formation of syndicates that include strong op-erators. After stabilizing these properties, which currently trade at per-door prices in the $10,000 to $20,000 range, syndicate-owners will be able to re-list or refi nance through Freddie Mac or Fannie Mae.
2011 Market Outlook
◆ 2011 NAI Rank: 24, Up 4 Places. Job growth supported Houston’s four-position improvement in the NAI.
◆ Employment Forecast: Recovery of the Houston employment market will gather speed this year as payrolls expand by 65,000 positions, or 2.6 percent. In 2010, only 18,000 jobs were added.
◆ Construction Forecast: After delivering 7,600 apartments last year, de-velopers will bring online just 2,100 units in 2011, the lowest amount in 20 years. Permitting activity accelerated in late 2010, an indication con-struction will pick up in 2012.
◆ Vacancy Forecast: Vacancy will fall 130 basis points in 2011 to 9.8 percent, driven by Class A improvements early in the year and stronger Class B/C demand in the second half. In 2010, vacancy declined 120 basis points.
◆ Rent Forecast: This year, asking rents will climb to $792 per month and effective rents will reach $732 per month, annual gains of 3.5 percent and 4.9 percent, respectively. Concessions will fall to 28 days of free rent.
◆ Investment Forecast: Stabilized apartments will continue to attract bids from large buyers, trading in the high-7 percent range during the begin-ning of the year, while properties within the Loop can achieve 150 basis point premiums.
-100
-50
0
50
100
Tota
l Non
farm
Job
s (t
hous
ands
)
Absolute Change Y-O-Y % Change
Employment Trends
08 09 10* 11**07
Year-over-Year Change
Uni
ts (
thou
sand
s)
Completions Vacancy
Supply and Demand
Vacancy Rate
$35
$40
$45
$50
$55
Med
ian
Pric
e pe
r U
nit
(tho
usan
ds)
Sales Trends
07 08 09 10*06
Year
-ove
r-Ye
ar C
hang
e
Asking Rents Effective Rents
Rent Trends
08 09 10* 11**07
0
5
10
15
20
08 09 10* 11**076%
8%
10%
12%
14%
-4%
-2%
0%
2%
4%
-6%
-3%
0%
3%
6%
Top-Tier Apartments Attract Renters; Class B Assets Lure Syndicated Buyers
Houston Up 4 Places 2011 Rank: 24 2010 Rank: 28

2011 Annual Report page 23
* Estimate ** ForecastSources: Marcus & Millichap Research Services, CoStar Group, Inc., RCA
Low Interest Rates Motivate Investor Acquisitions; Class A Deal Flow to Surge
IndianapolisDown 4 Places 2011 Rank: 31 2010 Rank: 27
-40
-20
0
20
40
Tota
l Non
farm
Job
s (t
hous
ands
)
Absolute Change Y-O-Y % Change
Employment Trends
08 09 10* 11**07
Year-over-Year Change
Uni
ts (
thou
sand
s)
Completions Vacancy
Supply and Demand
Vacancy Rate
$30
$35
$40
$45
$50
Med
ian
Pric
e pe
r U
nit
(tho
usan
ds)
Sales Trends
07 08 09 10*06
Year
-ove
r-Ye
ar C
hang
e
Asking Rents Effective Rents
Rent Trends
08 09 10* 11**07
0
0.5
1.0
1.5
2.0
08 09 10* 11**074%
6%
8%
10%
12%
-6%
-3%
0%
3%
6%
-6%
-3%
0%
3%
6%
The Indianapolis apartment market will continue to improve in 2011, with an employment-generated increase in renter demand pushing vacancy below pre-recession levels. Offi ce-using sectors will lead job
gains, helping Class A assets near offi ce corridors outperform as young professionals lease units. In the Central submarket, owners of top-tier complexes will report vacancies in the extremely tight low-3 percent range in 2011. Class B/C leasing activity will also gain momentum downtown, where development of the new Clarian Health neuroscience facility will create more than 1,000 construction jobs early this year. Property perfor-mance will vary outside of the core, though, with a less robust recovery ex-pected in overbuilt pockets of Hamilton County. Ongoing development in the county will keep vacancy near 10 percent in the fi rst half before improv-ing gradually through year end. Owners will also continue to face chal-lenges restoring operations in the Far Northeast submarket, which includes the city of Lawrence, where years of job cuts drove vacancy in the lower tiers to above 15 percent last year. As a result, several periods of blue-collar job growth in the area will be required to return more households to the local rental market.
Indianapolis apartment buildings will trade more frequently in 2011, fueled by increased fi nancing availability and low interest rates. While dis-tressed listings will remain present and trade at cap rates in the low- to mid-9 percent range, loan modifi cations will moderate the number of these assets coming to market. More listings of stabilized properties will be the impetus for strong deal fl ow as owners attempt to capitalize on heightened investor interest. Institutions, in particular, will bring seldom-listed assets to market to raise capital for redeployment into other major metros, pre-senting long-awaited investment opportunities for private buyers. Compe-tition from high-net-worth investors to acquire these complexes will inten-sify, pushing down cap rates for larger mid- and top-tier properties to the low- to mid-8 percent range, though cap rates for some best-in-class assets may dip below 8 percent.
2011 Market Outlook
◆ 2011 NAI Rank: 31, Down 4 Places. Indianapolis slipped four spots in the ranking due to high housing affordability and slow rent growth.
◆ Employment Forecast: Payrolls will grow by 16,000 jobs, or 1.8 percent, in 2011, up from the addition of 8,400 workers last year.
◆ Construction Forecast: Construction output will total 950 units this year, modestly lower than the 1,030 apartments completed in 2010.
◆ Vacancy Forecast: Resumed employment growth will push down va-cancy 80 basis points in 2011 to 7.1 percent, 160 basis points below the metro’s fi ve-year average. Vacancy improved 220 basis points last year.
◆ Rent Forecast: Asking rents will appreciate 2.7 percent this year to $680 per month, and effective rents will gain 3.4 percent to $641 per month.
◆ Investment Forecast: The availability of distressed assets will dissipate as the year progresses, but a few opportunities will emerge. As 2010 came to a close, $150 million of apartment properties were in some level of distress.
Market Forecast Employment: 1.8% ▲ Construction: 80 ▼ Vacancy: 80 bps ▼ Effective Rents: 3.4% ▲

page 24 2011 Annual Report
* Estimate ** ForecastSources: Marcus & Millichap Research Services, CoStar Group, Inc., RCA
Market Forecast Employment: 1.5% ▲ Construction: 290 ▼ Vacancy: 50 bps ▼ Effective Rents: 1.8% ▲
-30
-15
0
15
30
Tota
l Non
farm
Job
s (t
hous
ands
)
Absolute Change Y-O-Y % Change
Employment Trends
08 09 10* 11**07
Year-over-Year Change
Uni
ts (
thou
sand
s)
Completions Vacancy
Supply and Demand
Vacancy Rate
$0
$20
$40
$60
$80
Med
ian
Pric
e pe
r U
nit
(tho
usan
ds)
Sales Trends
07 08 09 10*06
Year
-ove
r-Ye
ar C
hang
e
Asking Rents Effective Rents
Rent Trends
08 09 10* 11**07
0
1
2
3
4
08 09 10* 11**078%
10%
12%
14%
16%
-6%
-3%
0%
3%
6%
-4%
-2%
0%
2%
4%
Jacksonville will retain one of the highest vacancy rates in the coun-try during 2011, but operating conditions will improve as demand strengthens and development subsides. Vacancy plummeted last year
as households de-bundled and single-family foreclosures shifted many owner-occupied households to the rental sector. As a result, the number of occupied rentals in the market rose an unprecedented 4.4 percent in 2010, compared with a 2 percent increase nationwide. While ongoing fore-closures will expand the renter pool, a healthier pace of job creation will become the dominant driver of demand in the months ahead. The most signifi cant trend, however, will be another decline in completions. Limited supply constraints have historically emboldened developers, but projects slated for delivery in 2011 represent one of the lowest annual totals in the past 15 years. Although the improving economy will encourage developers to refi ll the construction pipeline, still-high vacancy will restrain supply growth for the next two years.
Many sales late last year involved large, lender-owned properties, and additional sales of this type will occur in the fi rst half of 2011 while the re-covery in property operations gains momentum. Distressed assets typically sell for less than $30,000 per unit, providing investors an attractive entry point and an opportunity to raise the value of a property through improv-ing occupancy. In addition, stabilized, cash-fl owing complexes will come to market more frequently this year as owners record several months of strengthening operations. Properties in the Southside/Baymeadows area will attract attention, but revitalized service-sector hiring will also help sta-bilize operations in older sections of the market. Cap rates can vary widely, but for many Class B/C properties, fi rst-year returns of 9 percent or more will garner interest.
2011 Market Outlook
◆ 2011 NAI Rank: 44, No Change. The nation’s highest vacancy rate kept Jacksonville at the bottom of this year’s NAI.
◆ Employment Forecast: Local employers will add 9,000 positions this year, a 1.5 percent increase and an improvement from 2010, when only 1,200 jobs were created. The greatest gains will occur in the trade and education and health services sectors.
◆ Construction Forecast: Supply growth will wane for the second consecu-tive year, as developers will complete 500 units in 2011, down from 790 rentals last year.
◆ Vacancy Forecast: Easing construction will support a 50 basis point drop in vacancy to 10.9 percent this year, after the average rate declined 300 basis points in 2010.
◆ Rent Forecast: During 2011, marketwide asking rents will advance 1.4 percent to $783 per month, accompanied by a 1.8 percent bump in effec-tive rents to $746 per month.
◆ Investment Forecast: Class A property investors will continue to focus on new complexes in areas of southeastern Duval and northern St. Johns counties, where supply growth was strongest over the past several years.
Late Emergence from RecessionCreating Distressed-Asset Opportunities
Jacksonville No Change 2011 Rank: 44 2010 Rank: 44

2011 Annual Report page 25
* Estimate ** ForecastSources: Marcus & Millichap Research Services, CoStar Group, Inc., RCA
Stabilizing Class A Sector to Drive Concession Burn in 2011
Kansas CityDown 2 Places 2011 Rank: 26 2010 Rank: 24
-40
-20
0
20
40
Tota
l Non
farm
Job
s (t
hous
ands
)
Absolute Change Y-O-Y % Change
Employment Trends
08 09 10* 11**07
Year-over-Year Change
Uni
ts (
thou
sand
s)
Completions Vacancy
Supply and Demand
Vacancy Rate
$40
$45
$50
$55
$60
Med
ian
Pric
e pe
r U
nit
(tho
usan
ds)
Sales Trends
07 08 09 10*06
Year
-ove
r-Ye
ar C
hang
e
Asking Rents Effective Rents
Rent Trends
08 09 10* 11**07
0
0.4
0.8
1.2
1.6
08 09 10* 11**076%
7%
8%
9%
10%
-4%
-2%
0%
2%
4%
-6%
-3%
0%
3%
6%
The Kansas City apartment market will approach equilibrium in 2011 as job growth intensifi es leasing activity and development slows. During 2010, foreclosure activity lowered the homeownership rate
and pushed up occupancy despite the absence of job gains. This year, though, payroll expansion will take the reins of the local apartment re-covery, particularly in the southwestern suburbs. In Johnson County, a diverse mix of companies will begin to rehire, attracting previously un-employed residents to primarily one-bedroom units. As a result, Class B/C vacancies in Overland Park will fall well below the marketwide av-erage this year. The Class A segment, meanwhile, will build on the 200 basis point vacancy improvement registered in 2010 as recently completed complexes stabilize. At the close of last year, vacancy in newer apartment buildings exceeded 20 percent, encouraging owners to offer high leasing incentives. An uptick in renter demand and decline in construction should accelerate occupancy gains in properties built after 2009, enabling opera-tors to withdraw concessions.
Investment activity will increase in 2011 as lower-tier property owners divest ahead of refi nance deadlines and more buyers resurface to secure low-cost debt. Deal fl ow accelerated last year in several areas, including the Midtown submarket. When vacancy in Midtown jumped above 17 percent at the height of the recession, cap rates far exceeded the metrowide aver-age. Now that property operations in the submarket have improved for a few quarters, buyers are seeking value-add offerings at fi rst-year yields in the mid-9 percent range, still 100 basis points above the overall aver-age. Investors also continue to seek underperforming assets, though most of these are small, vintage properties. As operations improve, the number of distressed assets available will diminish, limiting this strategy to the fi rst half of the year.
2011 Market Outlook
◆ 2011 NAI Rank: 26, Down 2 Places. Below-average employment growth and rent gains drove down Kansas City two positions in the ranking.
◆ Employment Forecast: After shedding 2,200 positions in 2010, employ-ers will create 13,000 jobs this year, a 1.3 percent gain.
◆ Construction Forecast: Apartment stock will expand 0.5 percent during 2011 as 600 units come online. Last year, 990 rentals were completed.
◆ Vacancy Forecast: Metrowide vacancy will fall 70 basis points this year to 7.7 percent, matching the improvement registered in 2010.
◆ Rent Forecast: By year-end 2011, asking rents will appreciate 2 percent to $707 per month, after advancing 1.2 percent last year. Effective rents will rise 2.8 percent to $662 per month.
◆ Investment Forecast: Cap rates will vary greatly by age and location this year. Class A properties will trade in the mid-6 percent range, while mid-tier properties will average yields in the low- to high-7 percent range. Stabilized Class C assets will continue to change hands with fi rst-year returns above 8 percent.
Market Forecast Employment: 1.3% ▲ Construction: 390 ▼ Vacancy: 70 bps ▼ Effective Rents: 2.8% ▲

page 26 2011 Annual Report
* Estimate ** ForecastSources: Marcus & Millichap Research Services, CoStar Group, Inc., RCA
Market Forecast Employment: 1.8% ▲ Construction: 650 ▼ Vacancy: 80 bps ▼ Effective Rents: 0.9% ▲
Gradual recovery in the local gaming industry will strengthen apart-ment operations in Las Vegas this year. As the national economy re-covers, stronger consumer spending will help elevate tourist activity
in the metro. During 2011, the number of visitors to Las Vegas will increase by 2 percent, supporting a 3 percent gain in the leisure and hospitality sec-tor, a key driver of local apartment operations. A large number of these typically low-paying positions will be created by the Cosmopolitan Hotel and Casino, which opened last December at the southern end of the Strip. The new facility will generate 5,000 jobs into 2011, potentially resulting in the absorption of more than 1,000 units in the University, Spring Valley and North Central submarkets. Net absorption metrowide also will receive a boost by the formation of 10,000 new households this year; positive net absorption in 2011 is projected to total nearly 2,000 apartments, after 3,100 units were absorbed last year.
Over the past several quarters, Las Vegas apartments changed hands at extremely sharp discounts, making banks hesitant to consider moving properties off their books. In 2011, however, stabilizing operations and low interest rates will draw investors into the metro, helping close the buyer/seller expectation gap and encouraging lenders to list assets that qualify for agency fi nancing. Class A cap rates will need to average in the mid-6 per-cent range for banks to list, however, and mid-tier properties will not come to market until yields average in the mid-7 percent range. Class C complex-es currently trade with cap rates in the double digits, a larger-than-average spread from the two higher tiers. Most of these listings have high vacancy and deferred maintenance, making fi nancing exceptionally diffi cult to ob-tain. As a result, out-of-state buyers targeting these value-add plays may form syndicates to raise capital.
2011 Market Outlook
◆ 2011 NAI Rank: 43, No Change. Las Vegas remained near the bottom of the NAI due to high vacancy and modest rent growth forecasts.
◆ Employment Forecast: Employers will expand payrolls by 14,000 work-ers this year, a gain of 1.8 percent. In 2010, companies cut 8,900 jobs.
◆ Construction Forecast: Developers will complete 900 multifamily units in 2011, an increase to local inventory of 0.7 percent and down from the delivery of nearly 1,550 apartments last year.
◆ Vacancy Forecast: Apartment vacancy in the metro will retreat 80 basis points this year to 9.1 percent. In 2010, the vacancy rate fell 130 basis points as pent-up demand was released.
◆ Rent Forecast: Owners will raise asking rents 0.5 percent in 2011 to $808 per month, the fi rst annual increase in three years. Effective rents will climb 0.9 percent to $756 per month.
◆ Investment Forecast: A limited portion of the $140 million in local dis-tressed properties will become available this year. Assets in the Univer-sity submarket will remain the most sought after due to steady renter demand generated by casinos and the University of Nevada, Las Vegas.
-90
-60
-30
0
30
Tota
l Non
farm
Job
s (t
hous
ands
)
Absolute Change Y-O-Y % Change
Employment Trends
08 09 10* 11**07
Year-over-Year Change
Uni
ts (
thou
sand
s)
Completions Vacancy
Supply and Demand
Vacancy Rate
$20
$40
$60
$80
$100
Med
ian
Pric
e pe
r U
nit
(tho
usan
ds)
Sales Trends
07 08 09 10*06
Year
-ove
r-Ye
ar C
hang
e
Asking Rents Effective Rents
Rent Trends
08 09 10* 11**07
0
1
2
3
4
08 09 10* 11**074%
6%
8%
10%
12%
-9%
-6%
-3%
0%
3%
-10%
-5%
0%
5%
10%
Accelerating Tourism SparksHospitality Sector; Apartments to Benefi t
Las Vegas No Change 2011 Rank: 43 2010 Rank: 43

2011 Annual Report page 27
* Estimate ** ForecastSources: Marcus & Millichap Research Services, CoStar Group, Inc., RCA
Los AngelesUp 2 Places 2011 Rank: 11 2010 Rank: 13
Job Gains Strengthen Operations inCore Areas; Outer Locations Lag
-300
-200
-100
0
100
Tota
l Non
farm
Job
s (t
hous
ands
)
Absolute Change Y-O-Y % Change
Employment Trends
08 09 10* 11**07
Year-over-Year Change
Uni
ts
Completions Vacancy
Supply and Demand
Vacancy Rate
$110
$120
$130
$140
$150
Med
ian
Pric
e pe
r U
nit
(tho
usan
ds)
Sales Trends
07 08 09 10*06
Year
-ove
r-Ye
ar C
hang
e
Asking Rents Effective Rents
Rent Trends
08 09 10* 11**07
0
1.5
3.0
4.5
6.0
08 09 10* 11**072%
3%
4%
5%
6%
-6%
-4%
-2%
0%
2%
-8%
-4%
0%
4%
8%
Recovery in the Los Angeles County apartment market will gain trac-tion in 2011 as rehiring efforts boost rental household formation and completions fall to a 16-year low. Core submarkets will register the
strongest operational improvements as below-peak rents encourage resi-dents to relocate. Newly re-employed workers returning to the apartment market will migrate to premier communities in the Westside Cities, South Bay and close-in parts of San Fernando Valley, primarily along Ventura Boulevard, facilitating more signifi cant concession burn this year. In the Greater Downtown area, offi ce-using job growth early this year will sup-port a drop in vacancy to historical levels by late summer and a reduction in leasing incentives by the fourth quarter. The pace of recovery will not be uniform, however, with locations farthest from job centers, including the San Gabriel Valley, the northern portion of the San Fernando Valley and some infi ll, lower-tier complexes downtown, expected to struggle with above-trend vacancies through 2011 .
Deal fl ow will increase this year as low interest rates encourage inves-tors to restructure portfolios, though strategies will remain concentrated at either end of the cap rate spectrum. Risk-averse, high-net-worth buyers will target high-end properties in supply-constrained locations such as the Westside Cities and South Bay, where minimal future development will drive sizable rent gains through the recovery. This fl ight-to-safety trend pushed down cap rates for Class A and well-located Class B product to the high-5 percent to low-6 percent range last year, with further compression likely in 2011 as operations strengthen . Favorable interest rates will encour-age private buyers to consider properties with greater risk, and many of these investors will circle the metro for value-add deals. Cap rates for as-sets with some level of distress and located in perimeter areas will average above 7 percent in the early part of 2011. As increased investment activity and renter demand spills into periphery locations, however, cap rates for these properties will start to fall.
2011 Market Outlook
◆ 2011 NAI Rank: 11, Up 2 Places. Low vacancy and limited supply growth nearly pushed Los Angeles into the top 10 of this year’s NAI.
◆ Employment Forecast: Following the loss of 21,100 jobs in 2010, payrolls will expand by 56,000 positions this year, a 1.5 percent gain.
◆ Construction Forecast: Developers will bring online 1,200 units in 2011, down signifi cantly from the 3,300 units completed last year.
◆ Vacancy Forecast: The average vacancy rate will fall 50 basis points to 4.4 percent this year; vacancy improved 40 basis points in 2010.
◆ Rent Forecast: Asking rents will reach $1,395 per month by year end, up 1.8 percent from last year, while effective rents will advance 2.7 percent to $1,354 per month.
◆ Investment Forecast: As buyers seek to execute deals before healthier operational improvements drive strong revenue gains, bidding activity will accelerate, encouraging many owners who retained assets through the downturn to begin selling.
Market Forecast Employment: 1.5% ▲ Construction: 2,100 ▼ Vacancy: 50 bps ▼ Effective Rents: 2.7% ▲

page 28 2011 Annual Report
* Estimate ** ForecastSources: Marcus & Millichap Research Services, CoStar Group, Inc., RCA
Market Forecast Employment: 1.2% ▲ Construction: 100 ▲ Vacancy: 60 bps ▼ Effective Rents: 2.3% ▲
Strong employment growth and a dearth of new inventory will help solidify apartment operations in Louisville this year. A large portion of job gains will be associated with the recently completed KFC Yum!
Center, located near the University of Louisville. Staff additions around the center will help contribute to expanding the leisure and hospitality sector by 6 percent during 2011 as hotels ramp up hiring. Moreover, the signifi -cant rise in traffi c to the area during events will generate hundreds of retail-sector jobs at local shops and restaurants, a strong driver of apartment demand. White-collar payrolls will also expand in Louisville this year, es-pecially at the site of the old Haymarket in the West Central submarket. A life sciences center has cleared construction and fi nancing hurdles; devel-opment is commencing on the fi rst phase of the project. These high-paying jobs will contribute to an overall increase of 5,700 offi ce-using positions marketwide, supporting a jump in Class A occupancy. With these jobs largely concentrated in the city core, the apartment vacancy rate in the area will dip below 4 percent by year end. Vacancy will also trend lower at the metro level as the 5,500 new households created this year surpass the pro-jected addition of 2,500 single- and multifamily homes.
As institutions pull out of Louisville to redeploy capital in larger, coastal markets, some rarely traded apartment assets will be listed, allow-ing private buyers and syndicates to acquire properties with long-term stability. Cash-heavy investors will target assets in the core, specifi cally near the main campus of the University of Louisville, which houses 20,000 students. Northeastern Jefferson County, which will post one of the low-est suburban vacancy rates in the metro this year, will remain attractive to risk-averse buyers. As private investors compete for quality, stabilized properties, Class A cap rates will dip into the mid-7 percent range. Lower-tier complexes will trade 100 basis points to 150 basis points above that rate.
2011 Market Outlook
◆ 2011 NAI Rank: 22, Down 7 Places. Louisville remained near the middle of the NAI as low vacancy was offset by below-average rent growth.
◆ Employment Forecast: Employment in Louisville will increase by 7,000 positions in 2011, a 1.2 percent gain. Last year, cuts totaled 3,400 jobs.
◆ Construction Forecast: This year, developers will deliver 200 new apart-ment units, a 0.5 percent addition to inventory and up from 2010, when just 100 units came online.
◆ Vacancy Forecast: The average vacancy rate will decrease 60 basis points in 2011 to 5 percent, after sliding 140 basis points last year.
◆ Rent Forecast: Asking rents will rise 2.2 percent this year to $664 per month as effective rents advance 2.3 percent to $632 per month. In 2010, asking rents grew 1.7 percent, while effective rents increased 2.1 percent.
◆ Investment Forecast: Redevelopment in downtown Louisville and re-cent expansions to the university will continue to entice syndicates and private buyers to the area.
-20
-10
0
10
20
Tota
l Non
farm
Job
s (t
hous
ands
)
Absolute Change Y-O-Y % Change
Employment Trends
08 09 10* 11**07
Year-over-Year Change
Uni
ts
Completions Vacancy
Supply and Demand
Vacancy Rate
$30
$35
$40
$45
$50
Med
ian
Pric
e pe
r U
nit
(tho
usan
ds)
Sales Trends
07 08 09 10*06
Year
-ove
r-Ye
ar C
hang
e
Asking Rents Effective Rents
Rent Trends
08 09 10* 11**07
0
150
300
450
600
08 09 10* 11**074%
5%
6%
7%
8%
-4%
-2%
0%
2%
4%
-6%
-3%
0%
3%
6%
Private Investors Target Emerging Opportunities as Employment Stages Recovery
Louisville Down 7 Places 2011 Rank: 22 2010 Rank: 15

2011 Annual Report page 29
* Estimate ** ForecastSources: Marcus & Millichap Research Services, CoStar Group, Inc., RCA
Negligible Completions, Demand RevivalDrive Miami-Dade Apartment Strengthening
MiamiUp 4 Places 2011 Rank: 21 2010 Rank: 25
-50
-25
0
25
50
Tota
l Non
farm
Job
s (t
hous
ands
)
Absolute Change Y-O-Y % Change
Employment Trends
08 09 10* 11**07
Year-over-Year Change
Uni
ts
Completions Vacancy
Supply and Demand
Vacancy Rate
$70
$80
$90
$100
$110
Med
ian
Pric
e pe
r U
nit
(tho
usan
ds)
Sales Trends
07 08 09 10*06
Year
-ove
r-Ye
ar C
hang
e
Asking Rents Effective Rents
Rent Trends
08 09 10* 11**07
0
250
500
750
1,000
08 09 10* 11**073%
4%
5%
6%
7%
-8%
-4%
0%
4%
8%
-8%
-4%
0%
4%
8%
The Miami-Dade apartment market will record additional improve-ments in vacancy and rents in 2011, confi rming its status as the top performing market in Florida. Completions will remain minimal,
while a lack of affordable housing alternatives for blue-collar residents and an accelerating pace of employment growth will generate strong renter de-mand. Class B/C rentals in typically robust submarkets such as Hialeah and Kendall East/Coral Gables will continue to recover as hiring rebounds. Vacancy in each area will fall to the high-3 percent range this year, after rising to more than 5 percent at the peak of the recession. Elsewhere, opera-tors in the Miami and South Beach submarkets continue to face competition from shadow rentals, but demand for Class A apartments surged last year due to elevated concessions. As a recovery in the for-sale market progresses and shadow stock dissipates, owners will withdraw leasing incentives.
Strengthening operating conditions will improve investor optimism for Miami-Dade apartment assets. The availability of Fannie Mae and Fred-die Mac fi nancing, plus a greater willingness to lend by local and communi-ty banks, will support an intense bidding climate, facilitating sellers’ efforts to dispose of properties. Class A listings are already attracting investors, helping drive down cap rates to less than 6 percent in some cases. First-year yields for lower-quality assets are also compressing to pre-conversion-era ranges from approximately 7 percent to 8 percent. In areas with supply constraints, including Hialeah and waterfront locations, initial returns can be 100 basis points lower, as properties in these areas generally attract mul-tiple bids when listed.
2011 Market Outlook
◆ 2011 NAI Rank: 21, Up 4 Places. Florida’s tightest vacancy rate and above-average employment growth supported Miami’s four-place rise in the ranking.
◆ Employment Forecast: Total employment in Miami-Dade County will expand 1.8 percent in 2011 with the addition of 18,000 jobs. Hiring re-sumed last year, when 7,500 positions were created.
◆ Construction Forecast: This year, developers will complete only 200 units, representing a meager 0.2 percent addition to rental stock; 660 rentals came online in 2010.
◆ Vacancy Forecast: The release of pent-up demand contributed to a 40 basis point decrease in the vacancy rate last year. In 2011, job growth will help push down vacancy 110 basis points to 4.6 percent.
◆ Rent Forecast: Asking rents will rise 3.3 percent this year to $1,089 per month, and effective rents will advance 4.1 percent to $1,032 per month. In 2010, asking rents ticked up 1.2 percent, while effective rents gained 2.3 percent.
◆ Investment Forecast: Miami’s stature as an international gateway, plus the devaluation of the U.S. dollar relative to foreign currencies, will at-tract increasing foreign investment to the market in the quarters ahead.
Market Forecast Employment: 1.8% ▲ Construction: 460 ▼ Vacancy: 110 bps ▼ Effective Rents: 4.1% ▲

page 30 2011 Annual Report
* Estimate ** ForecastSources: Marcus & Millichap Research Services, CoStar Group, Inc., RCA
Market Forecast Employment: 1.8% ▲ Construction: 110 ▼ Vacancy: 50 bps ▼ Effective Rents: 3.3% ▲
-60
-40
-20
0
20
Tota
l Non
farm
Job
s (t
hous
ands
)
Absolute Change Y-O-Y % Change
Employment Trends
08 09 10* 11**07
Year-over-Year Change
Uni
ts
Completions Vacancy
Supply and Demand
Vacancy Rate
$30
$40
$50
$60
$70
Med
ian
Pric
e pe
r U
nit
(tho
usan
ds)
Sales Trends
07 08 09 10*06
Year
-ove
r-Ye
ar C
hang
e
Asking Rents Effective Rents
Rent Trends
08 09 10* 11**07
0
200
400
600
800
08 09 10* 11**072%
3%
4%
5%
6%
-6%
-4%
-2%
0%
2%
-6%
-3%
0%
3%
6%
Following a relatively mild softening, the Milwaukee apartment mar-ket will improve steadily in 2011. Property operations began to re-cover early last year on modest employment gains, despite above-
trend supply growth. As the rate of job growth increases nearly threefold this year and builders ease deliveries, vacancy will retreat to pre-recession levels in the low-4 percent range. The degree of strengthening will vary by property class and location, however, with densely populated suburban submarkets such as Wauwatosa/West Allis posting the most signifi cant occupancy and rent gains. In the City East submarket, the resumption of white-collar payroll expansion will help upscale complexes stage a healthy recovery as stock additions slow. Class B/C apartments in the City West submarket will continue to face headwinds until job additions in lower-paying sectors gain steam. While weak pockets exist within the metro, tight conditions overall will support owners in lease negotiations, facilitating a cut in concessions to a 10-year low.
Improved sales momentum during the last half of 2010 will carry into this year as fi rming operations and low interest rates encourage both buy-ers and sellers to reset portfolios. Investors seeking REO listings will be dis-appointed, however, as the Greater Milwaukee area has fewer distressed properties than any other major Midwestern market. Demand for perform-ing assets will intensify as buyers take advantage of low interest rates, which should persuade some owners to list quality complexes in affl uent suburban areas and near dense offi ce districts. Although for-sale stock will expand, listings will fall short of investor demand, driving down cap rates for performing top-tier assets from their current average in the mid- to high-7 percent range. Initial yields for lower-tier listings will average in the mid-8 percent range through the fi rst half of the year.
2011 Market Outlook
◆ 2011 NAI Rank: 25, Down 8 Places. Milwaukee’s eight-position drop was the result of stronger improvement in other index markets. Condi-tions in the metro remain tight and the economy is gaining momentum.
◆ Employment Forecast: Job creation will total 14,600 positions this year, a 1.8 percent gain. In 2010, employers hired 5,500 workers.
◆ Construction Forecast: Approximately 450 units will come online by year end, following the addition of 560 apartments last year.
◆ Vacancy Forecast: After retreating 30 basis points in 2010, vacancy will decrease 50 basis points to 4.3 percent this year.
◆ Rent Forecast: Asking rents will rise 2.5 percent during 2011 to $833 per month, while effective rents will advance 3.3 percent to $806 per month. Marketwide concessions will slip to just 3.2 percent of asking rents.
◆ Investment Forecast: With the pipeline of distressed assets remaining small, buyers seeking value-add plays will target poorly managed mid-tier complexes with deferred maintenance. Properties in affl uent areas of Waukesha County will command the most attention, limiting the achiev-able yield premium for these listings.
Milwaukee Apartments Staged forContinued Strengthening
Milwaukee Down 8 Places 2011 Rank: 25 2010 Rank: 17

2011 Annual Report page 31
* Estimate ** ForecastSources: Marcus & Millichap Research Services, CoStar Group, Inc., RCA
Minneapolis-St. PaulDown 4 Places 2011 Rank: 8 2010 Rank: 4
Stabilizing Operations in Urban Core toSpill into Outlying Neighborhoods
-90
-60
-30
0
30
Tota
l Non
farm
Job
s (t
hous
ands
)
Absolute Change Y-O-Y % Change
Employment Trends
08 09 10* 11**07
Year-over-Year Change
Uni
ts (
thou
sand
s)
Completions Vacancy
Supply and Demand
Vacancy Rate
$60
$62
$64
$66
$68
Med
ian
Pric
e pe
r U
nit
(tho
usan
ds)
Sales Trends
07 08 09 10*06
Year
-ove
r-Ye
ar C
hang
e
Asking Rents Effective Rents
Rent Trends
08 09 10* 11**07
0
0.5
1.0
1.5
2.0
08 09 10* 11**072%
3%
4%
5%
6%
-6%
-4%
-2%
0%
2%
-6%
-3%
0%
3%
6%
The Twin Cities apartment market will outperform most other Mid-western metros in 2011 as the combination of payroll expansion and minimal supply growth drives vacancy to a 10-year low. The region’s
recent economic turnaround and comparatively low unemployment rate fu-eled operational improvements in each quarter of 2010, led by the Southwest submarket. The area will continue to outperform the metro in gains this year as renter demand generated by the relocation of US Bancorp occurs during the seventh consecutive year of virtually zero completions. The Fortune 500 company transferred approximately 1,600 jobs from St. Paul to Richfi eld at the start of 2011, strengthening demand for nearby units. As a result, the aver-age vacancy rate in the submarket will fall below 3 percent for the fi rst time since 2000, enabling area owners to post the largest rent gains in the metro this year. Elsewhere, job growth will benefi t properties within the interstate belt as re-employed individuals in the prime renter age cohorts lease units in dense, urban areas. With nearly every employment sector on the mend and former homeowners returning to rentals, outlying suburban communities also will begin to stabilize, with rents rising modestly as the year progresses.
Sales velocity will improve throughout the Twin Cities in 2011 as sellers reluctant to list properties last year seek to capitalize on rising demand. Low interest rates will encourage more investors to redeploy capital into either high-end properties or higher-yielding assets, resulting in some seldom-listed complexes coming to market. These listings will receive multiple offers, and buyers looking to utilize low interest rates may need to stretch for top-tier deals. Ongoing operational improvements and strong investor demand for these assets will compress cap rates, with initial yields for well-located com-plexes in the Uptown, Southwest and West areas projected to average in the low- to mid-7 percent range. Metrowide, though, cap rates for assets contain-ing fewer than 50 units will still average in the low- to mid-8 percent range.
2011 Market Outlook
◆ 2011 NAI Rank: 8, Down 4 Places. Very tight vacancy kept Minneapolis-St. Paul from falling out of the top 10, despite average improvement in the local employment market.
◆ Employment Forecast: Employers will hire 25,500 workers in 2011, a 1.5 percent gain. Last year, 13,000 jobs were added.
◆ Construction Forecast: After 330 units came online in 2010, rental inven-tory will expand by 500 units, or 0.3 percent, this year. During the past fi ve years, completions averaged 660 units annually.
◆ Vacancy Forecast: In 2011, limited construction and accelerating job growth will drive down vacancy 50 basis points to 3.6 percent; vacancy declined 130 basis points in 2010.
◆ Rent Forecast: Asking rents will advance 3.1 percent to $965 per month this year, while effective rents will increase 3.9 percent to $915 per month.
◆ Investment Forecast: With cap rates already compressing for most well-located assets, investors seeking to acquire properties with considerable upside under still-favorable interest rates will have to venture farther into the suburbs or step down the quality ladder.
Market Forecast Employment: 1.5% ▲ Construction: 170 ▲ Vacancy: 50 bps ▼ Effective Rents: 3.9% ▲

MSA Name Atlanta Austin Boston Charlotte Chicago Cincinnati Cleveland Columbus Dallas/Fort Worth Denver Detroit Fort Lauderdale Houston Indianapolis Jacksonville Kansas City Las Vegas Los Angeles Louisville Miami Milwaukee Minneapolis-St. Paul New Haven New Jersey New York City Oakland Orange County Orlando Philadelphia Phoenix Portland Riverside-San Bernardino Sacramento Salt Lake City San Antonio San Diego San Francisco San Jose Seattle St. Louis Tampa Tucson Washington, D.C. West Palm Beach
2011 National Apartment Report
page 32 2011 Annual Report
Statistical
* Estimate ** Forecast 2 See Statistical Summary Note on page 57.
Employment Vacancy Asking Rent Growth2 (Year-End)2 (Year-End)2
08 09 10* 11** -3.5% -5.0% 1.0% 1.6% 0.6% -2.4% 3.0% 3.6% -0.8% -3.5% 1.6% 2.0% -2.8% -5.6% 1.3% 2.1% -2.7% -5.3% -0.5% 1.3% -2.4% -3.6% 0.1% 1.3% -3.0% -5.1% 1.7% 1.1% -1.7% -3.6% 0.1% 1.7% -1.2% -3.0% 1.2% 2.7% -1.3% -4.5% 0.5% 2.0% -5.3% -7.9% -0.5% 0.5% -6.1% -5.3% 0.1% 1.4% 0.7% -3.8% 0.7% 2.6% -2.6% -4.2% 1.0% 1.8% -3.9% -4.3% 0.2% 1.5% -1.2% -3.2% -0.2% 1.3% -6.0% -8.0% -1.1% 1.8% -3.5% -5.5% -0.6% 1.5% -2.4% -2.8% -0.6% 1.2% -4.6% -4.2% 0.8% 1.8% -1.8% -5.8% 0.7% 1.8% -2.0% -4.6% 0.8% 1.5% -2.6% -5.6% 0.1% 1.5% -2.8% -2.9% -1.1% 0.5% -0.3% -3.5% 2.0% 2.3% -4.0% -6.0% -1.3% 1.4% -4.8% -6.7% 2.0% 2.6% -4.7% -4.8% 0.6% 2.3% -1.4% -3.6% 0.5% 1.0% -5.7% -6.4% 1.5% 2.1% -3.2% -5.5% 0.2% 1.9% -6.3% -6.8% -1.4% 1.5% -4.0% -5.8% -1.5% 1.2% -1.9% -4.2% -0.2% 2.0% 0.3% -2.4% 0.9% 2.4% -2.5% -5.4% 0.6% 1.9% -1.5% -6.1% -0.7% 2.2% -2.2% -6.2% 1.7% 2.5% -1.8% -5.4% 1.0% 2.2% -2.5% -3.4% 1.0% 1.7% -5.1% -4.8% 0.9% 2.1% -2.8% -4.7% 0.8% 2.2% -0.7% -1.7% 2.4% 2.8% -5.4% -6.0% 1.5% 2.4%
08 09 10* 11** $862 $825 $832 $853 $870 $844 $865 $901 $1,742 $1,670 $1,717 $1,777 $798 $761 $768 $789 $1,071 $1,033 $1,046 $1,070 $710 $692 $702 $715 $739 $715 $721 $733 $677 $659 $663 $675 $786 $765 $780 $804 $887 $853 $879 $906 $835 $808 $806 $815 $1,115 $1,054 $1,058 $1,080 $769 $746 $765 $792 $675 $649 $662 $680 $799 $779 $772 $783 $701 $685 $693 $707 $865 $821 $804 $808 $1,463 $1,374 $1,370 $1,395 $646 $639 $650 $664 $1,104 $1,041 $1,054 $1,089 $841 $803 $813 $833 $957 $929 $936 $965 $1,593 $1,521 $1,551 $1,606 $1,308 $1,268 $1,290 $1,325 $2,879 $2,688 $2,833 $3,010 $1,385 $1,265 $1,274 $1,305 $1,571 $1,463 $1,480 $1,535 $890 $842 $845 $864 $1,023 $1,002 $1,019 $1,055 $777 $751 $752 $773 $825 $803 $818 $844 $1,058 $1,006 $1,008 $1,025 $939 $893 $900 $916 $752 $732 $735 $758 $701 $685 $711 $744 $1,344 $1,306 $1,316 $1,370 $1,934 $1,757 $1,795 $1,884 $1,589 $1,401 $1,445 $1,505 $1,014 $955 $989 $1,026 $729 $708 $716 $731 $843 $797 $806 $828 $651 $632 $642 $660 $1,364 $1,332 $1,372 $1,435 $1,109 $1,061 $1,081 $1,111
08 09 10* 11** 10.3% 11.7% 10.3% 8.8% 7.7% 10.1% 7.6% 6.2% 6.0% 6.4% 5.5% 4.5% 8.2% 11.3% 8.6% 7.6% 5.4% 6.7% 6.1% 5.5% 6.8% 8.0% 6.9% 6.3% 6.1% 6.9% 6.0% 5.6% 8.1% 9.2% 9.0% 8.3% 7.3% 9.7% 7.5% 6.7% 7.9% 8.0% 5.8% 5.0% 6.9% 8.1% 6.9% 6.5% 6.9% 8.6% 6.6% 5.8% 10.1% 12.3% 11.1% 9.8% 7.8% 10.1% 7.9% 7.1% 12.3% 14.4% 11.4% 10.9% 7.8% 9.1% 8.4% 7.7% 8.2% 11.2% 9.9% 9.1% 4.5% 5.3% 4.9% 4.4% 7.0% 7.0% 5.6% 5.0% 5.1% 6.1% 5.7% 4.6% 3.7% 5.1% 4.8% 4.3% 4.4% 5.4% 4.1% 3.6% 4.0% 4.6% 4.5% 4.1% 4.0% 4.9% 4.8% 3.9% 2.3% 2.9% 3.8% 3.0% 4.7% 5.8% 4.7% 4.3% 5.1% 6.4% 5.7% 4.4% 10.0% 11.2% 9.6% 8.4% 5.7% 6.5% 5.5% 3.9% 11.1% 12.3% 10.1% 8.9% 5.2% 6.9% 4.8% 4.1% 7.0% 8.0% 7.0% 6.3% 5.8% 7.3% 6.3% 5.7% 5.0% 7.2% 7.0% 5.8% 9.0% 10.2% 9.0% 7.6% 4.1% 4.9% 4.3% 3.6% 3.6% 4.8% 4.7% 3.9% 4.4% 5.1% 3.8% 3.4% 5.8% 7.5% 6.5% 5.7% 7.8% 9.2% 7.9% 7.0% 8.7% 10.7% 8.5% 7.5% 11.0% 12.2% 10.1% 9.1% 5.5% 6.3% 5.1% 4.3% 7.9% 9.2% 7.8% 6.9%

MSA NameAtlantaAustinBoston
CharlotteChicago
CincinnatiClevelandColumbus
Dallas/Fort WorthDenverDetroit
Fort LauderdaleHouston
IndianapolisJacksonvilleKansas City
Las VegasLos Angeles
LouisvilleMiami
MilwaukeeMinneapolis-St. Paul
New HavenNew Jersey
New York CityOakland
Orange CountyOrlando
PhiladelphiaPhoenixPortland
Riverside-San BernardinoSacramento
Salt Lake CitySan Antonio
San DiegoSan Francisco
San JoseSeattle
St. LouisTampaTucson
Washington, D.C.West Palm Beach
2011 National Apartment Report
2011 Annual Report page 33
Summary
* Estimate ** Forecast 2 See Statistical Summary Note on page 57.
Median Sales Price Completionsper Unit2 (Units)2
08 09 10* 11** 6,802 7,116 4,900 1,000 4,836 10,337 2,900 1,800 4,099 3,973 1,005 600 2,373 3,623 1,763 900 2,195 1,850 2,421 700 170 644 348 700 144 280 286 75 204 1,143 884 785 10,674 17,050 7,775 4,200 2,035 2,770 2,550 800 280 297 28 30 1,131 862 741 200 14,225 13,956 7,616 2,100 452 1,639 1,031 950 2,138 2,489 792 500 1,069 866 988 600 3,771 3,081 1,549 900 5,608 1,799 3,300 1,200 240 584 100 200 861 0 664 200 91 460 558 450 1,091 688 333 500 511 363 1,123 912 1,446 2,177 2,357 1,100 2,097 1,377 7,600 1,451 1,972 1,210 450 422 1,343 3,643 2,300 300 3,714 2,176 1,328 700 1,323 442 1,187 500 4,660 6,181 2,675 1,500 1,764 2,034 660 120 440 1,499 1,015 600 168 81 430 125 369 1,960 3,036 800 1,663 4,771 2,681 1,500 935 918 1,281 500 281 452 867 76 861 491 560 472 2,780 3,614 4,900 1,500 228 267 38 600 2,646 1,814 1,626 500 176 288 96 0 6,239 5,440 6,300 2,000 205 494 217 300
08 09 10* $62,600 $45,800 $37,800 $53,068 $48,664 $50,085 $117,000 $102,500 $93,300 $49,419 $41,667 $38,454 $75,594 $72,857 $78,212 $35,556 $32,826 $32,333 $34,028 $33,119 $34,694 $41,896 $34,596 $29,662 $40,205 $39,246 $38,364 $61,235 $62,150 $64,796 $36,219 $32,460 $36,741 $85,500 $77,925 $46,500 $45,448 $49,700 $51,974 $39,946 $37,212 $34,913 $48,400 $34,100 $24,200 $47,750 $51,891 $53,950 $66,333 $56,281 $47,808 $135,897 $124,826 $127,483 $40,779 $39,980 $41,887 $87,800 $79,300 $75,000 $54,564 $50,464 $45,529 $64,529 $63,990 $66,178 $75,732 $76,181 $76,111 $83,000 $85,000 $75,889 $126,611 $112,041 $117,500 $126,000 $117,000 $120,000 $145,948 $143,259 $137,778 $55,000 $53,100 $30,600 $72,600 $81,193 $76,667 $57,446 $51,162 $47,200 $73,438 $70,083 $64,776 $90,769 $74,104 $68,750 $94,660 $68,649 $57,789 $72,377 $70,446 $66,563 $49,338 $50,000 $50,091 $122,411 $115,000 $115,948 $210,948 $183,043 $180,882 $169,811 $148,850 $145,833 $114,321 $102,877 $105,723 $52,793 $48,834 $48,834 $61,800 $54,600 $43,800 $45,923 $40,505 $37,359 $93,800 $92,800 $107,800 $77,300 $55,900 $66,500

page 34 2011 Annual Report
* Estimate ** ForecastSources: Marcus & Millichap Research Services, CoStar Group, Inc., RCA
-60
-40
-20
0
20
Tota
l Non
farm
Job
s (t
hous
ands
)
Absolute Change Y-O-Y % Change
Employment Trends
08 09 10* 11**07
Year-over-Year Change
Uni
ts (
thou
sand
s)
Completions Vacancy
Supply and Demand
Vacancy Rate
$60
$65
$70
$75
$80
Med
ian
Pric
e pe
r U
nit
(tho
usan
ds)
Sales Trends
07 08 09 10*06
Year
-ove
r-Ye
ar C
hang
e
Asking Rents Effective Rents
Rent Trends
08 09 10* 11**07
0
0.5
1.0
1.5
2.0
08 09 10* 11**072%
3%
4%
5%
6%
-6%
-4%
-2%
0%
2%
-8%
-4%
0%
4%
8%
Market Forecast Employment: 1.5% ▲ Construction: 210 ▼ Vacancy: 40 bps ▼ Effective Rents: 4.7% ▲
A strengthening economy will push vacancy lower in New Haven and Fairfi eld counties this year, solidifying the area’s status as one of the top performing markets on the East Coast. Despite minimal employ-
ment growth, property performance in the two counties improved notably last year as households that merged during the recession de-bundled. Job growth in New York City and Westchester County also bolstered rental property performance, especially in Fairfi eld County. Additional strength-ening will occur in the county this year as completions fall to 460 units and projects delivered last year stabilize further. As a result, vacancy in Fairfi eld will decrease 70 basis points to below 5 percent, the lowest level in more than three years. In New Haven County, vacancy was an extremely low 2.3 percent at the end of last year but will rise modestly in 2011 as newly completed units lease up only gradually.
Investment activity in the counties lags improvements in property performance thus far, but the continuation of low interest rates will gen-erate additional transactions. Besides the projected reduction in vacancy and increase in rents, other factors will support strong and profi table property operations this year and next. After 2011, construction will slow considerably, minimizing the competitive pressures posed by new units. In addition, the renter base will remain sizable as tougher mortgage un-derwriting standards discourage the movement of younger households to homeownership; empty nesters will also constitute a large share of renters. Capable investors who purchase properties in the near term will face the prospect of steady income gains and the potential for asset appreciation . Cap rates vary from less than 5 percent for Class A product to the low-6 percent range for stabilized Class B assets.
2011 Market Outlook
◆ 2011 NAI Rank: 20, Down 6 Places. Despite overall healthy conditions, limited improvement in the local vacancy rank pushed down New Ha-ven six positions in the index.
◆ Employment Forecast: Payrolls will expand 1.5 percent, or by 11,700 jobs, in 2011, following a gain of only 500 positions last year. Hiring in the fi nancial services sector will support the creation of 6,800 jobs in Fair-fi eld County, a 1.7 percent increase.
◆ Construction Forecast: Builders will complete 900 units in 2011, down from more than 1,100 units last year. The 452-unit 360 State Street in New Haven constitutes the largest project slated for completion.
◆ Vacancy Forecast: During 2011, the marketwide vacancy rate will de-crease 40 basis points to 4.1 percent. Despite signifi cant completions in 2010, vacancy ticked down 10 basis points.
◆ Rent Forecast: This year, asking rents will rise 3.5 percent to $1,606 per month. Effective rents will climb 4.7 percent to $1,560 per month.
◆ Investment Forecast: Local investors will continue to dominate the trans-action market. Class A properties with convenient access to commuter-rail stations will generate the greatest interest.
Local, Regional Hiring SustainsPerformance in New Haven, Fairfi eld
New Haven Down 6 Places 2011 Rank: 20 2010 Rank: 14

2011 Annual Report page 35
* Estimate ** ForecastSources: Marcus & Millichap Research Services, CoStar Group, Inc., RCA
Market Forecast Employment: 0.5% ▲ Construction: 1,260 ▼ Vacancy: 90 bps ▼ Effective Rents: 3.8% ▲
-120
-80
-40
0
40
Tota
l Non
farm
Job
s (t
hous
ands
)
Absolute Change Y-O-Y % Change
Employment Trends
08 09 10* 11**07
Year-over-Year Change
Uni
ts (
thou
sand
s)
Completions Vacancy
Supply and Demand
Vacancy Rate
$60
$70
$80
$90
$100
Med
ian
Pric
e pe
r U
nit
(tho
usan
ds)
Sales Trends
07 08 09 10*06
Year
-ove
r-Ye
ar C
hang
e
Asking Rents Effective Rents
Rent Trends
08 09 10* 11**07
0
1
2
3
4
08 09 10* 11**072%
3%
4%
5%
6%
-6%
-4%
-2%
0%
2%
-6%
-3%
0%
3%
6%
New JerseyDown 6 Places 2011 Rank: 12 2010 Rank: 6
Strong Operations, Tightening Vacancies Draw Investor Interest
Apartment vacancy will continue to fall in New Jersey this year, with the most signifi cant improvements anticipated in the northern and southern sections of the state. Private-sector employers will add
28,000 jobs during 2011, spurring the creation of new rental households, while deliveries will slow further from last year. In Northern New Jersey, where more than 2,100 units came online in 2010, construction will virtu-ally cease this year, while hiring will pick up in Essex, Hudson and Bergen counties, as well as in nearby New York City. As a result, vacancy in this section of the state will fall to the lowest level in three years. Elsewhere, only one project remains slated for completion in Southern New Jersey. Renter demand in this part of the state will continue to improve due to tightening occupancies in neighboring Philadelphia and its close-in sub-urbs. In Central New Jersey, where conditions were tight as 2011 began, vacancy will fall 60 basis points this year to 3.4 percent, the lowest rate among the three sections of the state.
The resumption of job growth in New Jersey will support greater in-vestment activity, providing encouragement to buyers awaiting additional indications of a sustainable recovery in property operations. Financing also continues to improve, with community banks becoming more active and offering historically low rates and favorable terms to qualifi ed borrowers. Low interest rates and investor demand for properties in densely populated areas near major employment centers will maintain average statewide cap rates in the low-7 percent range through the fi rst half of 2011. Interest in properties in Hudson County will intensify as recently completed rentals stabilize . In the central and southern regions of the state, strengthening ten-ant demand will sustain investors’ interest in local complexes. Average cap rates in these areas will range from about 7.3 percent to 7.8 percent this year.
2011 Market Outlook
◆ 2011 NAI Rank: 12, Down 6 Places. New Jersey slipped six spots in the NAI due to slow employment growth and state budget woes.
◆ Employment Forecast: In 2011, statewide employment will increase 0.5 per-cent, or by 18,500 jobs, led by an acceleration in private-sector hiring. Last year, 44,000 positions were eliminated, primarily in the government sector.
◆ Construction Forecast: Projects containing an aggregate 1,100 units will come online this year, down from nearly 2,400 units in 2010. More than half of the rentals due in 2011 will be delivered in Central New Jersey.
◆ Vacancy Forecast: Fueled by a 110 basis point drop in vacancy in North-ern New Jersey, statewide vacancy will decline 90 basis points this year to 3.9 percent. In 2010, vacancy fell 10 basis points.
◆ Rent Forecast: Asking rents in New Jersey will advance 2.7 percent in 2011 to $1,325 per month, and effective rents will increase 3.8 percent to $1,270 per month.
◆ Investment Forecast: Investors will bid aggressively, as the current lull in construction and a thin pipeline of planned projects across the state will provide an opportunity to rebuild robust property operations before the development cycle accelerates.

page 36 2011 Annual Report
* Estimate ** ForecastSources: Marcus & Millichap Research Services, CoStar Group, Inc., RCA
Market Forecast Employment: 2.3% ▲ Construction: 6,150 ▼ Vacancy: 80 bps ▼ Effective Rents: 6.9% ▲
-140
-70
0
70
140
Tota
l Non
farm
Job
s (t
hous
ands
)
Absolute Change Y-O-Y % Change
Employment Trends
08 09 10* 11**07
Year-over-Year Change
Uni
ts (
thou
sand
s)
Completions Vacancy
Supply and Demand
Vacancy Rate
$90
$100
$110
$120
$130
Med
ian
Pric
e pe
r U
nit
(tho
usan
ds)
Sales Trends
07 08 09 10*06
Year
-ove
r-Ye
ar C
hang
e
Asking Rents Effective Rents
Rent Trends
08 09 10* 11**07
0
2
4
6
8
08 09 10* 11**071%
2%
3%
4%
5%
-4%
-2%
0%
2%
4%
-10%
-5%
0%
5%
10%
Vacancy at large market-rate rental properties in New York City will decline in 2011 as tenant demand intensifi es and construction activity subsides, following a substantial surge in completions last year. His-
torically, more than half of new market-rate properties delivered annually stabilize within the fi rst year of operation, but the proportion fell to about 30 percent in 2010 as the pipeline of new units overwhelmed demand. Stronger job growth will accelerate the stabilization of new properties this year, contributing to a decrease in vacancy in each borough. In Manhattan, completions totaled more than 4,900 units last year but will fall to approxi-mately 1,200 units in 2011, helping market-rate vacancy improve 120 basis points to 3 percent. Vacancy will decline 40 basis points and 20 basis points in Brooklyn and Queens, respectively, as construction slows and demand for less expensive rentals strengthens amid a recovering economy.
Investment activity in the city will continue to accelerate through the fi rst half of 2011, fueled by the low cost of capital and healthy growth in the local economy. Institutions will increase their activity in Manhattan as large-property operations improve and the need to place cash intensi-fi es. Average cap rates in the borough rose to the high-5 percent range last year, refl ecting sales of smaller properties, but some compression is likely in 2011 as institutions and REITs aggressively value large assets. In the other boroughs, cap rates generally average from 6.0 percent to 6.5 percent for most stable and performing properties. Local investors, the dominant buyer group, will increase activity in these areas as fi nancing capacity ex-pands. Interest in rent-stabilized properties remains constant among less risk-tolerant investors. New guidelines for rent increases on these units will be issued at midyear and guide underwriting assumptions.
2011 Market Outlook
◆ 2011 NAI Rank: 1, Up 2 Places. The nation’s lowest vacancy rate and strong forecast employment growth helped New York City claim the top spot in the 2011 NAI.
◆ Employment Forecast: This year, employers in the city will add 84,000 positions, a 2.3 percent gain and up from the creation of 71,000 jobs in 2010.
◆ Construction Forecast: The inventory of market-rate apartments in the city will expand 0.9 percent in 2011 with the completion of 1,450 units. Last year, 7,600 units were added, the most in the past decade.
◆ Vacancy Forecast: Vacancy at large properties will decline 80 basis points this year to 3 percent. The vacancy rate rose 90 basis points in 2010.
◆ Rent Forecast: In 2011, asking rents at large, market-rate complexes will advance 6.2 percent to $3,010 per month, while effective rents will climb 6.9 percent to $2,901 per month.
◆ Investment Forecast: Foreign ownership will increase in the city, as the low value of the dollar will enable well-capitalized investors from over-seas to aggressively pursue high-quality, well-located properties.
Institutions Eye Manhattan;Interest in Outer Boroughs Intensifi es
New York City Up 2 Places 2011 Rank: 1 2010 Rank: 3

2011 Annual Report page 37
* Estimate ** ForecastSources: Marcus & Millichap Research Services, CoStar Group, Inc., RCA
Market Forecast Employment: 1.4% ▲ Construction: 30 ▼ Vacancy: 40 bps ▼ Effective Rents: 2.6% ▲
Another year of minimal construction activity in the East Bay, along with the resumption of job growth, will reinforce the under way re-covery in apartment operations. With vacancy in the mid-4 percent
range, property owners in the region will continue to regain pricing power through 2011, placing upward pressure on rents and allowing for further concession burn. While improving operations may encourage developers to plan new projects or pull postponed apartments from the sidelines, rents will need to increase considerably before any large-scale construction be-comes feasible. Even after accounting for anticipated growth in 2011, effec-tive rents in the East Bay will remain more than 6 percent below the cyclical high levels achieved in late 2008. Rent reductions over the past two years have resulted in a recent surge in demand for Class A units, however, as many renters can now afford to upgrade.
The combination of improving property operations and low interest rates will drive stronger transaction velocity this year, though limited high-quality, for-sale inventory will hamper gains. Overall, average cap rates in the East Bay have settled into the low-7 percent range and could contract further as more investors re-enter the marketplace and buyer demand in-tensifi es. First-year yields will continue to vary sharply by property quality and location, however, with deals involving performing assets in supply-constrained locations likely to trade at cap rates of 6 percent or less.
2011 Market Outlook
◆ 2011 NAI Rank: 17, Up 1 Place. Slower-than-average job growth and low housing affordability combined to keep Oakland near the middle of the 2011 NAI.
◆ Employment Forecast: Employment growth will reach 1.4 percent in 2011 with the addition of 13,400 jobs, driven by expansion in the professional and business services and trade, transportation and utilities sectors.
◆ Construction Forecast: Approximately 420 apartments will come online in 2011, just shy of the 2010 total but well below the 10-year annual av-erage of 975 units. The largest project slated for completion this year, a 256-unit downtown high-rise, was originally planned as condos.
◆ Vacancy Forecast: Vacancy will decline 40 basis points in 2011 to 4.3 per-cent. Improvement began last year, with the release of pent-up demand and de-bundling of households driving a 110 basis point reduction in the vacancy rate.
◆ Rent Forecast: Rent growth resumed in mid-2010 and will continue this year. Asking rents will rise 2.4 percent to $1,305 per month, while effec-tive rents will gain 2.6 percent to $1,234 per month.
◆ Investment Forecast: Investors will remain focused on assets in commu-nities along the Interstate 580 and Interstate 880 corridors. Apartment rental operations in these areas will benefi t signifi cantly this year from increased demand stemming from strengthening job creation in Oakland and across the bay.
East Bay Apartment Market Recovering, Remains Well Below Recent Cyclical Peak
-90
-60
-30
0
30
Tota
l Non
farm
Job
s (t
hous
ands
)
Absolute Change Y-O-Y % Change
Employment Trends
08 09 10* 11**07
Year-over-Year Change
Uni
ts (
thou
sand
s)
Completions Vacancy
Supply and Demand
Vacancy Rate
$100
$110
$120
$130
$140
Med
ian
Pric
e pe
r U
nit
(tho
usan
ds)
Sales Trends
07 08 09 10*06
Year
-ove
r-Ye
ar C
hang
e
Asking Rents Effective Rents
Rent Trends
08 09 10* 11**07
0
0.5
1.0
1.5
2.0
08 09 10* 11**073%
4%
5%
6%
7%
-6%
-4%
-2%
0%
2%
-12%
-6%
0%
6%
12%
OaklandUp 1 Place 2011 Rank: 17 2010 Rank: 18

page 38 2011 Annual Report
* Estimate ** ForecastSources: Marcus & Millichap Research Services, CoStar Group, Inc., RCA
Market Forecast Employment: 2.6% ▲ Construction: 2,000 ▼ Vacancy: 130 bps ▼ Effective Rents: 4.5% ▲
-120
-80
-40
0
40
Tota
l Non
farm
Job
s (t
hous
ands
)
Absolute Change Y-O-Y % Change
Employment Trends
08 09 10* 11**07
Year-over-Year Change
Uni
ts (
thou
sand
s)
Completions Vacancy
Supply and Demand
Vacancy Rate
$130
$140
$150
$160
$170
Med
ian
Pric
e pe
r U
nit
(tho
usan
ds)
Sales Trends
07 08 09 10*06
Year
-ove
r-Ye
ar C
hang
e
Asking Rents Effective Rents
Rent Trends
08 09 10* 11**07
0
1
2
3
4
08 09 10* 11**070%
2%
4%
6%
8%
-9%
-6%
-3%
0%
3%
-8%
-4%
0%
4%
8%
Job creation in Orange County will outpace other major California markets for the second consecutive year, fueling considerable occu-pancy gains as completions slip to historic lows. Broad-based hiring
and a lack of housing options for lower-income workers will accelerate leasing activity for Class B/C complexes, particularly to the north. In Ful-lerton and Buena Park, for example, Class B/C vacancies will fall into the low-3 percent range as residents return to the work force and households de-bundle . White-collar employment growth will reinforce absorption in Class A properties, building on the 100 basis point vacancy improvement already achieved thus far in the recovery. Rising occupancy across all prop-erty classes will enable owners to withdraw concessions. In the South Ana-heim submarket, however, a 15 percent expansion in Class A rental inven-tory over the past two years will keep operations soft through 2011 and force owners to maintain concessions at nearly twice the metro average.
Following a rebound in bidding activity last year, low interest rates and improving economic conditions will facilitate an increase in sales vol-ume in 2011 as investors reset their strategies and reposition equity. Fa-vorable interest rates are pulling buyers into the market, and owners who weathered the downturn are poised to divest while investor enthusiasm is strong. Realistically priced Class B/C assets will garner multiple offers, a trend that emerged in the second half of 2010 and dropped cap rates into the low- to mid-6 percent range. As buyer competition intensifi es, initial yields will compress modestly this year, barring any signifi cant interest rate spikes. Top-tier complexes and coastal properties will command siz-able premiums, trading at cap rates more than 100 basis points below the metro average.
2011 Market Outlook
◆ 2011 NAI Rank: 5, Up 2 Places. Orange County claimed the highest po-sition among Southern California markets due to healthy employment projections and very low home affordability.
◆ Employment Forecast: After 27,000 jobs were added last year, payrolls will expand by 36,000 positions in 2011, a 2.6 percent gain.
◆ Construction Forecast: This year, developers will deliver just 300 units, down signifi cantly from the 2,300 rentals completed in 2010.
◆ Vacancy Forecast: The average vacancy rate will fall 130 basis points in 2011 to 4.4 percent, in line with the 10-year average. Last year, vacancy decreased 70 basis points.
◆ Rent Forecast: Owners will raise asking rents 3.7 percent this year to $1,535 per month, while effective rents will advance 4.5 percent to $1,482 per month, resulting in a concession pullback to 13 days of free rent.
◆ Investment Forecast: Last year, multifamily permit issuance fell 80 per-cent below 2007 peak levels, indicating subdued completions in the near term. With tourism-related job growth to accelerate going forward and minimal future completions to create a supply/demand imbalance, in-vestors able to secure currently low interest rates will be well positioned to achieve signifi cant revenue growth as rents appreciate.
Rising Job Growth, Minimal Development Fuel Broad-Based Strengthening
Orange County Up 2 Places 2011 Rank: 5 2010 Rank: 7

2011 Annual Report page 39
* Estimate ** ForecastSources: Marcus & Millichap Research Services, CoStar Group, Inc., RCA
Market Forecast Employment: 2.3% ▲ Construction: 630 ▼ Vacancy: 120 bps ▼ Effective Rents: 2.8% ▲
Lingering uncertainty in the Orlando housing market and a rebound in tourism will accelerate the recovery in apartment operations that began last year . During 2010, ongoing single-family foreclosures low-
ered the homeownership rate from approximately 72 percent to 68 percent, initiating the movement of many former homeowners into the renter pool . The likelihood of additional foreclosures will further expand the renter base throughout 2011. Also, hiring trends in services sectors will serve as an indicator of future leasing traffi c and unit absorption. Approximately 8,000 leisure and hospitality jobs will be created this year as theme park atten-dance continues to recover and foreign tourist volume increases as a result of the weaker dollar. Additionally, the expansion of local medical facilities will support the hiring of 4,400 education and health services workers dur-ing 2011, generating Class A apartment demand.
The decline in property prices stemming from the cessation of conver-sion activity and subsequent erosion of operating income due to the re-cession will present opportunities for investors . Sales of lender-owned or distressed assets will continue in the fi rst half of 2011, although expected improvements in vacancy and rents may enable some owners to avert fur-ther diffi culties. Prices for distressed assets can drop to less than $30,000 per unit, providing an attractive entry point for investors capable of executing value-add strategies. Well-located, stabilized properties will also generate intense bidding, as the lack of rental construction will enable operators to raise rents without concern for newer assets in lease-up. Areas of interest will include the southern part of the metro near tourist attractions, as well as properties that will benefi t from steady enrollment at the University of Central Florida.
2011 Market Outlook
◆ 2011 NAI Rank: 30, Up 5 Places. Orlando’s fi ve-spot jump in the ranking is supported by above-average job growth and healthy absorption.
◆ Employment Forecast: Employers will create 23,500 jobs this year, a 2.3 percent increase to payrolls and an improvement from 2010, when 6,000 jobs were added.
◆ Construction Forecast: Developers will complete only 700 units in 2011, down from 1,300 units last year and well below the fi ve-year average of 2,000 rentals.
◆ Vacancy Forecast: Projected net absorption of 2,100 units will push down vacancy 120 basis points this year to 8.4 percent; the vacancy rate decreased 160 basis points in 2010.
◆ Rent Forecast: During 2011, asking rents will rise 2.2 percent to $864 per month. Concessions will decline 50 basis points to 7.8 percent of asking rents as effective rents grow 2.8 percent to $797 per month.
◆ Investment Forecast: Cap rates higher than the national average will support strong out-of-state bidding for Orlando properties. Lower per-unit prices will also enable investors to build scale relatively quickly.
-60
-30
0
30
60
Tota
l Non
farm
Job
s (t
hous
ands
)
Absolute Change Y-O-Y % Change
Employment Trends
08 09 10* 11**07
Year-over-Year Change
Uni
ts (
thou
sand
s)
Completions Vacancy
Supply and Demand
Vacancy Rate
$0
$20
$40
$60
$80
Med
ian
Pric
e pe
r U
nit
(tho
usan
ds)
Sales Trends
07 08 09 10*06
Year
-ove
r-Ye
ar C
hang
e
Asking Rents Effective Rents
Rent Trends
08 09 10* 11**07
0
1
2
3
4
08 09 10* 11**074%
6%
8%
10%
12%
-6%
-3%
0%
3%
6%
-9%
-6%
-3%
0%
3%
Recovery Tourism, Service SectorsSpark Performance Improvements
OrlandoUp 5 Places 2011 Rank: 30 2010 Rank: 35

page 40 2011 Annual Report
* Estimate ** ForecastSources: Marcus & Millichap Research Services, CoStar Group, Inc., RCA
Market Forecast Employment: 1.0% ▲ Construction: 690 ▼ Vacancy: 160 bps ▼ Effective Rents: 4.1% ▲
-120
-80
-40
0
40
Tota
l Non
farm
Job
s (t
hous
ands
)
Absolute Change Y-O-Y % Change
Employment Trends
08 09 10* 11**07
Year-over-Year Change
Uni
ts (
thou
sand
s)
Completions Vacancy
Supply and Demand
Vacancy Rate
$50
$60
$70
$80
$90
Med
ian
Pric
e pe
r U
nit
(tho
usan
ds)
Sales Trends
07 08 09 10*06
Year
-ove
r-Ye
ar C
hang
e
Asking Rents Effective Rents
Rent Trends
08 09 10* 11**07
0
0.5
1.0
1.5
2.0
08 09 10* 11**073%
4%
5%
6%
7%
-6%
-4%
-2%
0%
2%
-6%
-3%
0%
3%
6%
The Philadelphia apartment market staged a solid turnaround last year and will continue to settle into its traditional pattern of limited development, steady tenant demand and rising rents in 2011. Follow-
ing two years of depressed multifamily permitting, deliveries of new rent-als will drop to one of the lowest annual totals in the past decade. Permit-ting will remain subdued as the challenging process of advancing projects from conception to completion deters all but the most capable develop-ers. The current lull in construction will magnify improvements in tenant demand in the months ahead. Nearly every submarket recorded positive net absorption last year, and additional gains will occur in 2011. Stronger job growth will drive greater demand in Center City and the New Jersey submarkets, areas where positive trends have slightly lagged improve-ments in marketwide conditions . A signifi cant reduction in vacancy will also occur in New Castle County as the creation of 6,000 jobs spurs rental housing demand.
Strong operations will continue to lure some out-of-area buyers, but Philadelphia will remain dominated by local investors. Many owners will utilize low interest rates to refi nance and improve properties, while oth-ers will dispose assets to reinvest in others with greater upside potential . Interest in properties in prime central locations will remain intense, while lower-quality assets in secondary locations will garner greater interest as operations strengthen. Cap rates compressed in 2010 but will likely stay near current levels as long. Assuming that low interest rates persist, top Class A assets will trade in the 5.5 percent to 6.0 percent range, while com-plexes in strong suburban locations will sell from 6.5 percent to 7.5 percent.
2011 Market Outlook
◆ 2011 NAI Rank: 10, Down 5 Places. Philadelphia retained a top 10 posi-tion in the NAI due to a rapidly falling vacancy rate.
◆ Employment Forecast: Expansion of the trade and education and health services sectors will increase total employment 1 percent in 2011 with the creation of 28,000 jobs. Last year, 13,000 positions were added.
◆ Construction Forecast: Approximately 1,200 units were completed in 2010, but developers will deliver just 500 units this year.
◆ Vacancy Forecast: The vacancy rate will dip 160 basis points in 2011 to 3.9 percent due to the slowdown in construction and continued strength-ening of demand. Last year, vacancy fell 100 basis points.
◆ Rent Forecast: Following a 1.7 percent increase in 2010, asking rents will surge 3.5 percent during the year ahead to $1,055 per month. Effective rents will advance 4.1 percent to $1,011 per month, compared with a 2.6 percent gain last year.
◆ Investment Forecast: The low 10-year Treasury rate continues to raise prepayment penalties and yield maintenance requirements as a potential impediment in transactions involving properties with existing fi nancing. Nonetheless, improved fi nancing capacity will drive robust sales activity.
Apartments Post Positive Trends asJob Growth Returns
Philadelphia Down 5 Places 2011 Rank: 10 2010 Rank: 5

2011 Annual Report page 41
* Estimate ** ForecastSources: Marcus & Millichap Research Services, CoStar Group, Inc., RCA
Market Forecast Employment: 2.1% ▲ Construction: 1,180 ▼ Vacancy: 120 bps ▼ Effective Rents: 3.7% ▲
Apartment operations in Phoenix will improve further in 2011 as job creation doubles from last year’s pace, construction falls to the lowest level in more than 15 years and single-family foreclosures push many
former homeowners into rentals. An estimated two-thirds of homeowners with mortgages in the metro area owe more than their homes are worth, which will continue to encourage strategic defaults and expand the renter pool. Demand for apartments surged in 2010, especially in the North Scotts-dale/Fountain Hills, North Tempe, Peoria/Sun City/Surprise and Chandler submarkets. Class A units accounted for most of the absorption last year, due in part to renewed job growth in the typically higher-paying professional and business services sector. At the beginning of 2011, Class A vacancy was around 8 percent, only slightly higher than the levels recorded prior to the recession. Class B/C vacancy, meanwhile, remained in the double digits, a trend likely to persist until blue-collar industries, including construction and manufacturing, begin to post stronger growth in late 2011 or early 2012.
Many large investors have re-entered the Phoenix market, targeting both REO listings and well-located, high-quality assets offered at attractive prices compared to just a few years ago. Marketwide, the median price per unit has slipped 35 percent from the 2007 peak. While more lenders have started to clear their books of reclaimed assets, many will stabilize high-vacancy properties and address deferred maintenance ahead of taking them to mar-ket. This trend may become more pronounced this year in light of expecta-tions for above-average job growth and declines in vacancy rates, limiting the degree of price discounting . Increased buyer interest in the market has compressed cap rates for Class A and well-located Class B properties, with top-tier complexes changing hands in the high-5 percent to high-6 percent range. Cap rates for mid-tier apartments have remained relatively steady, with assets typically trading at yields between 7.25 percent and 7.75 percent.
2011 Market Outlook
◆ 2011 NAI Rank: 27, Up 7 Places. Phoenix’s seven-place rise in the NAI is attributed to the rapidly improving employment situation and projected household growth.
◆ Employment Forecast: Total employment in Phoenix will increase by 2.1 percent in 2011 with the addition of 36,000 jobs. After contracting in 2008 and 2009, payrolls expanded by 1.5 percent last year.
◆ Construction Forecast: Builders will complete 1,500 units this year, down from 2,675 units in 2010 and the lightest year for new supply since 1994.
◆ Vacancy Forecast: Apartment vacancy will decline 120 basis points in 2011 to 8.9 percent, approaching levels last reported in early 2008. In 2010, vacancy dropped 220 basis points on net absorption of 8,000 units.
◆ Rent Forecast: Asking rents will rise 2.8 percent this year to $773 per month, while effective rents will gain 3.7 percent to $705 per month.
◆ Investment Forecast: Investors may need to move down the quality scale to achieve the most attractive returns. Opportunities will likely arise for Class B/C properties priced under $5 million, where buyer demand re-mains limited.
Residential Foreclosures ExpandRenter Pool, Boost Apartment Absorption
-150
-100
-50
0
50
Tota
l Non
farm
Job
s (t
hous
ands
)
Absolute Change Y-O-Y % Change
Employment Trends
08 09 10* 11**07
Year-over-Year Change
Uni
ts (
thou
sand
s)
Completions Vacancy
Supply and Demand
Vacancy Rate
$40
$50
$60
$70
$80
Med
ian
Pric
e pe
r U
nit
(tho
usan
ds)
Sales Trends
07 08 09 10*06
Year
-ove
r-Ye
ar C
hang
e
Asking Rents Effective Rents
Rent Trends
08 09 10* 11**07
0
2
4
6
8
08 09 10* 11**076%
8%
10%
12%
14%
-9%
-6%
-3%
0%
3%
-6%
-3%
0%
3%
6%
PhoenixUp 7 Places 2011 Rank: 27 2010 Rank: 34

page 42 2011 Annual Report
* Estimate ** ForecastSources: Marcus & Millichap Research Services, CoStar Group, Inc., RCA
Market Forecast Employment: 1.9% ▲ Construction: 540 ▼ Vacancy: 70 bps ▼ Effective Rents: 4.3% ▲
-60
-40
-20
0
20
Tota
l Non
farm
Job
s (t
hous
ands
)
Absolute Change Y-O-Y % Change
Employment Trends
08 09 10* 11**07
Year-over-Year Change
Uni
ts (
thou
sand
s)
Completions Vacancy
Supply and Demand
Vacancy Rate
$60
$65
$70
$75
$80
Med
ian
Pric
e pe
r U
nit
(tho
usan
ds)
Sales Trends
07 08 09 10*06
Year
-ove
r-Ye
ar C
hang
e
Asking Rents Effective Rents
Rent Trends
08 09 10* 11**07
0
1
2
3
4
08 09 10* 11**072%
4%
6%
8%
10%
-6%
-4%
-2%
0%
2%
-8%
-4%
0%
4%
8%
Accelerating employment gains and historically low rental stock growth will generate strong absorption activity in Portland this year, enabling apartment owners to quicken the pace of rent increases.
Leasing of lower-tier units in the Beaverton/Aloha submarket will pick up considerably early in 2011 as the development of the new Intel Corp. research facility in Hillsboro creates thousands of construction jobs. Ad-ditionally, completion of the site in 2013 will help boost demand for area Class A units, as hundreds of skilled permanent workers will be needed to staff the location. Elsewhere, continued white-collar job growth will fur-ther align the supply/demand imbalance in the Northwest/Downtown submarket, a process that already improved top-tier vacancy rates from the 20 percent range recorded at the height of the recession to single-digit terri-tory. As renter demand builds in the area, Class A vacancy will settle at its long-term average, resulting in considerable concession burn. Blue-collar employment will also pick up through the year, helping lower-tier com-plexes in East County record sustainable absorption by midyear and laying the groundwork for modest rent gains in the second half.
With interest rates low and economic conditions improving, more lo-cal investors will re-enter the metro to execute deals during the early stages of recovery . Rising occupancies and rents signaled a turning point for the Portland apartment market late last year, and a sharp deceleration in con-struction activity in 2011 will attract buyers seeking to capitalize on future revenue gains . This shift in investor confi dence will intensify bidding ac-tivity for best-in-class assets in historically strong areas like Hillsboro and Beaverton. Cap rates for Class A and Class B assets in these locations edged down to the low-6 percent range in 2010, and greater availability of list-ings this year will sustain initial yields for these high-end complexes in that range. Marketwide, cap rates will average in the low-7 percent range.
2011 Market Outlook
◆ 2011 NAI Rank: 16, Up 3 Places. Limited supply growth and tight over-all conditions boosted Portland three spots in the ranking.
◆ Employment Forecast: Led by additions in the professional and business services sector, metrowide payrolls will expand by 18,500 positions, or 1.9 percent, this year. In 2010, total employment grew by 1,500 jobs.
◆ Construction Forecast: Developers will deliver 120 units in 2011, a 0.1 percent inventory increase. Last year, 660 apartments came online.
◆ Vacancy Forecast: After improving 210 basis points in 2010, vacancy will fall 70 basis points this year to 4.1 percent, a rate 140 basis points below the 10-year average.
◆ Rent Forecast: Asking rents will rise 3.2 percent to $844 per month in 2011 as effective rents climb 4.3 percent to $775 per month.
◆ Investment Forecast: While cap rates among well-located properties de-clined modestly in 2010, lower-tier complexes farther from downtown amenities, particularly those on the eastern edges of the metro, will likely require yields above 7.5 percent to clear the market this year due to the availability of Class C listings.
Expansion of Major Employers, Below-Trend Deliveries Reinforce Apartment Recovery
Portland Up 3 Places 2011 Rank: 16 2010 Rank: 19

2011 Annual Report page 43
* Estimate ** ForecastSources: Marcus & Millichap Research Services, CoStar Group, Inc., RCA
Market Forecast Employment: 1.5% ▲ Construction: 420 ▼ Vacancy: 70 bps ▼ Effective Rents: 2.2% ▲
Inland Empire apartment operations will strengthen in 2011 as payroll ex-pansion resumes and the pace of new construction remains constrained. The surge in apartment demand late last year stemmed from single-
family residential foreclosures and the de-bundling of households. In 2011, however, job gains will become a primary driver of renter demand growth. Total employment will post net gains for the fi rst time since 2006, and occu-pancies will continue to rise, led by strong absorption near dense job centers along the western boundary, like Ontario and Chino. As a result, conces-sions in properties near coastal counties will burn faster than in other parts of the Inland Empire as rents continue to recover . Elsewhere, large-scale commercial projects in Moreno Valley, including the 6 million-square foot March LifeCare campus and 1.8 million-square foot Skechers distribution facility, will add thousands of construction jobs in 2011 and boost renter de-mand for nearby complexes. Challenges will linger, however, particularly in far-reaching communities like Hemet, Victorville and Perris, where the threat of shadow rentals continues to moderate the pace of recovery.
Investment activity in the region will continue to improve in 2011 as long-term hold buyers purchase bank-owned assets. Opportunities to acquire REO listings and value-add properties will remain prevalent to the east and north, where the effects of the downturn were most signifi cant, making apart-ment operations in both areas weaker than elsewhere in the metro. Cap rates for these assets will average in the mid-7 percent to low-8 percent range this year, 175 basis points above fi rst-year returns for close-in, stabilized proper-ties in the west. Demand for assets closer to Los Angeles County employment centers will outstrip supply, which, barring a dramatic uptick in interest rates, will likely place downward pressure on yields as the year progresses.
2011 Market Outlook
◆ 2011 NAI Rank: 32, Up 5 Places. The Inland Empire gained fi ve positions in the NAI, though above-average vacancy kept the market in the bottom half of the ranking.
◆ Employment Forecast: Total employment in the two-county region will expand by 16,300 positions this year, or 1.5 percent. In 2010, employers shed 15,000 workers.
◆ Construction Forecast: Apartment stock will increase by 600 units in 2011, down from 1,000 units last year and nearly 70 percent below the fi ve-year average.
◆ Vacancy Forecast: The average vacancy rate will fall 70 basis points this year to 6.3 percent. Vacancy improved 100 basis points in 2010.
◆ Rent Forecast: Asking rents will end the year at $1,025 per month, while effective rents will reach $975 per month, gains of 1.7 percent and 2.2 percent, respectively.
◆ Investment Forecast: Although REO and top-tier deals will dominate sales this year, some unique opportunities will emerge for buyers willing to explore middle-market properties. With the recovery taking shape, however, the window to acquire traditional listings with signifi cant up-side will last only a few quarters.
Apartment Recovery Gains Momentum,Led by Western Submarkets
-90
-60
-30
0
30
Tota
l Non
farm
Job
s (t
hous
ands
)
Absolute Change Y-O-Y % Change
Employment Trends
08 09 10* 11**07
Year-over-Year Change
Uni
ts (
thou
sand
s)
Completions Vacancy
Supply and Demand
Vacancy Rate
$40
$60
$80
$100
$120
Med
ian
Pric
e pe
r U
nit
(tho
usan
ds)
Sales Trends
07 08 09 10*06
Year
-ove
r-Ye
ar C
hang
e
Asking Rents Effective Rents
Rent Trends
08 09 10* 11**07
0
1
2
3
4
08 09 10* 11**075%
6%
7%
8%
9%
-9%
-6%
-3%
0%
3%
-8%
-4%
0%
4%
8%
Riverside-San BernardinoUp 5 Places 2011 Rank: 32 2010 Rank: 37

page 44 2011 Annual Report
* Estimate ** ForecastSources: Marcus & Millichap Research Services, CoStar Group, Inc., RCA
Market Forecast Employment: 1.2% ▲ Construction: 310 ▼ Vacancy: 60 bps ▼ Effective Rents: 2.3% ▲
-60
-40
-20
0
20
Tota
l Non
farm
Job
s (t
hous
ands
)
Absolute Change Y-O-Y % Change
Employment Trends
08 09 10* 11**07
Year-over-Year Change
Uni
ts
Completions Vacancy
Supply and Demand
Vacancy Rate
$25
$50
$75
$100
$125
Med
ian
Pric
e pe
r U
nit
(tho
usan
ds)
Sales Trends
07 08 09 10*06
Year
-ove
r-Ye
ar C
hang
e
Asking Rents Effective Rents
Rent Trends
08 09 10* 11**07
0
200
400
600
800
08 09 10* 11**074%
5%
6%
7%
8%
-6%
-4%
-2%
0%
2%
-9%
-6%
-3%
0%
3%
Apartment property operations will continue to improve in 2011 as employment growth resumes and construction slips to a 15-year low. Recovery began in the second half of 2010 despite persistent job
losses through most of the year, as individuals who doubled up or moved in with family during the recession started to lease apartments. Absorption also remains driven by a surge in Class A demand, as a 6 percent reduc-tion in top-tier effective rents through the downturn encouraged renters to upgrade to higher-quality units. Recent occupancy gains were strongest in higher-priced submarkets, such as Downtown Sacramento, Orangevale/Folsom and Roseville, where owners have successfully attracted tenants with above-average rent reductions and concessions. Demand may shift in 2011, however, as rents tick up and the resumption of job creation in predominantly blue-collar sectors, including construction and trade, trans-portation and utilities, spurs additional demand for more affordable Class B/C units.
Smaller, private investors will dominate sales activity in 2011, target-ing properties with 50 units or fewer. Assets in central, high-density areas will account for a signifi cant portion of transactions and remain attractively priced, with cap rates averaging around 8 percent. While institutions and REITs have re-focused on acquisitions in major markets, limited for-sale inventory of newer, garden-style complexes in near-in suburbs, such as Fol-som, Roseville and Rocklin, has restricted Class A deal fl ow. Strong com-petition for the relatively few large, high-quality properties that become available over the next few quarters will keep cap rates in this segment under 6 percent.
2011 Market Outlook
◆ 2011 NAI Rank: 35, Down 2 Places. Ongoing budget concerns in Califor-nia pushed down its state capital two places in the index.
◆ Employment Forecast: Payrolls will rise by 9,500 jobs in 2011, a 1.2 per-cent gain. This year’s performance will mark the fi rst annual increase in head counts recorded since 2006.
◆ Construction Forecast: Only 125 units are slated for completion in 2011, down from 430 units last year. With a recovery in operations anticipated, however, construction could proceed on some projects postponed dur-ing the downturn.
◆ Vacancy Forecast: Vacancy will decline 60 basis points this year to 5.7 percent. In 2010, vacancy fell 100 basis points, largely due to the release of pent-up demand.
◆ Rent Forecast: In 2011, asking rents will increase 1.8 percent to $916 per month. Effective rents will grow at a faster clip of 2.3 percent to $855 per month as owners trim concessions in response to tighter conditions.
◆ Investment Forecast: REO sales will rise in Sacramento as improving fundamentals encourage lenders to dispose of reclaimed assets. Similar to 2010, most bank-owned sales will involve small, older properties, pre-senting investment opportunities in the $1.5 million or less range.
Discounted REO Listings Provide Opportunities for Smaller Investors
Sacramento Down 2 Places 2011 Rank: 35 2010 Rank: 33

2011 Annual Report page 45
* Estimate ** ForecastSources: Marcus & Millichap Research Services, CoStar Group, Inc., RCA
Market Forecast Employment: 2.0% ▲ Construction: 2,240 ▼ Vacancy: 120 bps ▼ Effective Rents: 4.4% ▲
Recovery of the Salt Lake City apartment market will resume during 2011, following a temporary setback late last year. Vacancy rates de-clined through most of 2010 but rose during the fourth quarter due
to a surge in new supply, particularly in West Jordan. Developers will slow the pace of deliveries dramatically in 2011, however, providing time for owners to fi ll new, vacant units as job growth gains momentum. At the metro level, rents will recover some of the ground lost in recent quarters, and concessions will retreat from record-high levels. Improvements will vary signifi cantly by submarket; close-in areas will take the lead as West Jordan lags, with concessions in the submarket likely to remain near fi ve weeks of free rent through at least the fi rst half of 2011.
Transaction velocity will rise moderately this year after slowing in 2010, as improving apartment fundamentals and fi rming values will prompt more owners to list properties. Last year’s deceleration was due largely to a dearth of quality for-sale inventory as opposed to low buyer demand. In fact, many investors stepped back into the marketplace after realizing a wave of deeply discounted REO deals was unlikely to emerge. Cap rates for stabilized, top-tier complexes have compressed as a result of strong demand and will likely slip into the mid-6 percent to 7 percent range in 2011. Demand for lower-quality deals remains slower, holding ini-tial yields in the Class B/C sector within the mid-7 percent to low-8 percent range throughout most of this year.
2011 Market Outlook
◆ 2011 NAI Rank: 19, Down 8 Places. Despite healthy indicators, eight markets with stronger prospects pushed ahead of Salt Lake City in the index this year.
◆ Employment Forecast: After three consecutive years of declining em-ployment, payrolls in the Salt Lake City metro area will rise by 2 percent, or 12,000 jobs, in 2011.
◆ Construction Forecast: Developers will deliver only 800 units this year, after 3,000 units came online in 2010.
◆ Vacancy Forecast: In 2011, vacancy will decline 120 basis points to 5.8 percent. Last year, vacancy improved just 20 basis points, as strong gains in the fi rst nine months of the year were offset by a supply-related in-crease in the fourth quarter.
◆ Rent Forecast: Rent growth will accelerate this year. Asking rents will rise 3.1 percent to $758 per month, while effective rates will climb 4.4 percent to $706 per month. In 2010, asking rents ticked up 0.4 percent, while effective rents inched 0.2 percent higher.
◆ Investment Forecast: Owners of large, high-quality properties will lever-age current market conditions to command healthy prices. Demand for complexes of 100 units or more remains particularly strong relative to available supply, which, along with low interest rates, has placed down-ward pressure on cap rates and elevated values.
Apartment Listings to Increase, Fall Short of Buyer Demand
-30
-15
0
15
30
Tota
l Non
farm
Job
s (t
hous
ands
)
Absolute Change Y-O-Y % Change
Employment Trends
08 09 10* 11**07
Year-over-Year Change
Uni
ts (
thou
sand
s)
Completions Vacancy
Supply and Demand
Vacancy Rate
$60
$65
$70
$75
$80
Med
ian
Pric
e pe
r U
nit
(tho
usan
ds)
Sales Trends
07 08 09 10*06
Year
-ove
r-Ye
ar C
hang
e
Asking Rents Effective Rents
Rent Trends
08 09 10* 11**07
0
1
2
3
4
08 09 10* 11**072%
4%
6%
8%
10%
-6%
-3%
0%
3%
6%
-6%
-3%
0%
3%
6%
Salt Lake CityDown 8 Places 2011 Rank: 19 2010 Rank: 11

page 46 2011 Annual Report
* Estimate ** ForecastSources: Marcus & Millichap Research Services, CoStar Group, Inc., RCA
Market Forecast Employment: 2.4% ▲ Construction: 1,180 ▼ Vacancy: 140 bps ▼ Effective Rents: 5.1% ▲
-30
-15
0
15
30
Tota
l Non
farm
Job
s (t
hous
ands
)
Absolute Change Y-O-Y % Change
Employment Trends
08 09 10* 11**07
Year-over-Year Change
Uni
ts (
thou
sand
s)
Completions Vacancy
Supply and Demand
Vacancy Rate
$35
$40
$45
$50
$55
Med
ian
Pric
e pe
r U
nit
(tho
usan
ds)
Sales Trends
07 08 09 10*06
Year
-ove
r-Ye
ar C
hang
e
Asking Rents Effective Rents
Rent Trends
08 09 10* 11**07
0
2
4
6
8
08 09 10* 11**074%
6%
8%
10%
12%
-4%
-2%
0%
2%
4%
-6%
-3%
0%
3%
6%
Apartment operations in the San Antonio market will build on demand generated by the slow nature of corporate expansion amid concerns over future business expenses. Nonfi nancial companies’ coffers are
25 percent above pre-recession levels and corporate payroll expansion is proceeding cautiously at best. These trends are benefi ting San Antonio, which holds a large concentration of back-offi ce call centers due to its cen-tral location and bilingual work force. Several companies, including West Corp., Kohl’s, Chase and Allstate, are adding thousands of low-paying cus-tomer support positions, which typically bolster apartment demand. Areas where supply growth was particularly robust over the past two years, such as the Far North Central and Far West submarkets, will post the largest job growth-related improvements in vacancy. Owners in these locations uti-lized aggressive leasing incentives to pull renters into new units, leaving plenty of empty Class B/C units for newly employed workers to occupy.
Optimism about the recovery in local apartment conditions has spilled into the investment arena, with long-term hold buyers moving into the market to acquire stabilized assets. Class B properties, in particular, remain sought after by local and national syndicates targeting highly occupied complexes at cap rates in the low- to mid-7 percent range. Many of these buyers have been priced out of the national Class A apartment market by REITs and institutions seeking to place capital and willing to bid aggres-sively for best-in-class offerings. Top-tier properties that trade in San An-tonio this year will be offered at fi rst-year yields near 6 percent, and REITs will remain interested in the area when listings arise . A thin pipeline of developer-owned Class A properties will limit the number of deals that come to market, however, forcing most buyers to consider mid-tier assets.
2011 Market Outlook
◆ 2011 NAI Rank: 13, Down 1 Place. San Antonio’s above-average vacan-cy rate resulted in a one-spot drop in the NAI, despite one of the highest rates of job growth.
◆ Employment Forecast: Payrolls will expand 2.4 percent this year as met-ro employers hire 20,000 workers. Last year, additions totaled 7,500 jobs.
◆ Construction Forecast: After 2,700 apartments came online in 2010, de-velopment will slow to 1,500 units this year, a modest 1 percent increase in stock.
◆ Vacancy Forecast: Marketwide vacancy will fall to 7.6 percent in 2011, a 140 basis point improvement from last year. Apartment demand will rise 2.6 percent .
◆ Rent Forecast: Asking rents will reach $744 per month this year as effec-tive rents climb to $697 per month, annual gains of 4.6 percent and 5.1 percent, respectively.
◆ Investment Forecast: The military’s planned consolidation of medical training at Fort Sam Houston will support apartment operations in the Northeast and adjacent submarkets. When the moves are completed this year, 5,000 permanent jobs and 4,000 students will be located in the area.
Investor Demand for Class B Apartments Intensifi es in the Alamo City
San Antonio Down 1 Place 2011 Rank: 13 2010 Rank: 12

* Estimate ** ForecastSources: Marcus & Millichap Research Services, CoStar Group, Inc., RCA
2011 Annual Report page 47
Market Forecast Employment: 1.9% ▲ Construction: 780 ▼ Vacancy: 70 bps ▼ Effective Rents: 4.7% ▲
Recovery in the local apartment market will gain ground this year, helping San Diego remain one of the strongest performing markets in the nation. As business activity and biotech employment accelerates ,
the addition of higher-paying jobs will fuel an uptick in Class A absorp-tion, especially near the downtown area. One of the primary catalysts for renter demand, however, stems from the more than $1 billion in military-related development projects under way. The 500,000-square foot hospital at Camp Pendleton, for instance, will create up to 1,000 construction jobs during build-out, underpinning demand for Class B/C complexes near the site. As a result, lower-tier vacancy in the Oceanside submarket will fall into the low-3 percent range this year, enabling area owners to raise rents considerably. Additionally, the local concentration of military personnel will expand by an estimated 4,000 Marines and 7,000 sailors in the coming years, aiding absorption near military installations, especially Naval Base San Diego and Camp Pendleton. Owners metrowide, though, will benefi t from the thinning development pipeline, which will bolster a recovery in operations by facilitating vacancy improvements in each submarket.
Investor demand will outstrip the supply of marketed properties this year, but velocity will gain momentum as private buyers widen their range of acceptable assets to expand portfolios. In addition, improving operations and low interest rates will encourage nondistressed owners to reposition portfolios, driving more to list mid-tier assets in an effort to redeploy capital toward higher-yielding Class C properties poised for operational improve-ment. As more investors target lower-quality complexes in communities viewed as less desirable in 2010, such as those in eastern San Diego County, yields for vintage Class C assets in these areas will steady in the mid-7 per-cent range . Demand for top-tier properties that come to market will remain intense, and cap rates for best-in-class assets near Balboa Park will further compress from the current average in the low- to mid-6 percent range.
2011 Market Outlook
◆ 2011 NAI Rank: 6, Down 4 Places. One of the nation’s tightest vacancy rates helped San Diego retain a top 10 ranking in the NAI.
◆ Employment Forecast: Employers will add 23,400 jobs this year, a 1.9 percent increase. In 2010, roughly 7,000 positions were created.
◆ Construction Forecast: Deliveries will shrink to just 500 units in 2011, the lowest level of completions since 1997. Last year, 1,280 units came online.
◆ Vacancy Forecast: As employers restaff and construction slows, vacancy will slide 70 basis points this year to 3.6 percent, after falling 60 basis points in 2010.
◆ Rent Forecast: During 2011, asking rents will gain 4.1 percent to $1,370 per month, and effective rents will rise 4.7 percent to $1,327 per month.
◆ Investment Forecast: Many investors will focus on Class B/C proper-ties proximate to military installations catering to government person-nel . Long-term growth at these sites, along with minimal new apartment development, will benefi t nearby operations, with local owners likely to achieve outsized rent gains through the coming years .
Investors Venture Down Class Spectrum to Expand Holdings in San Diego
-90
-60
-30
0
30
Tota
l Non
farm
Job
s (t
hous
ands
)
Absolute Change Y-O-Y % Change
Employment Trends
08 09 10* 11**07
Year-over-Year Change
Uni
ts (
thou
sand
s)
Completions Vacancy
Supply and Demand
Vacancy Rate
$100
$110
$120
$130
$140
Med
ian
Pric
e pe
r U
nit
(tho
usan
ds)
Sales Trends
07 08 09 10*06
Year
-ove
r-Ye
ar C
hang
e
Asking Rents Effective Rents
Rent Trends
08 09 10* 11**07
0
0.4
0.8
1.2
1.6
08 09 10* 11**072%
3%
4%
5%
6%
-6%
-4%
-2%
0%
2%
-6%
-3%
0%
3%
6%
San DiegoDown 4 Places 2011 Rank: 6 2010 Rank: 2

page 48 2011 Annual Report
* Estimate ** ForecastSources: Marcus & Millichap Research Services, CoStar Group, Inc., RCA
Market Forecast Employment: 2.2% ▲ Construction: 790 ▼ Vacancy: 80 bps ▼ Effective Rents: 5.4% ▲
-90
-60
-30
0
30
Tota
l Non
farm
Job
s (t
hous
ands
)
Absolute Change Y-O-Y % Change
Employment Trends
08 09 10* 11**07
Year-over-Year Change
Uni
ts
Completions Vacancy
Supply and Demand
Vacancy Rate
$160
$180
$200
$220
$240
Med
ian
Pric
e pe
r U
nit
(tho
usan
ds)
Sales Trends
07 08 09 10*06
Year
-ove
r-Ye
ar C
hang
e
Asking Rents Effective Rents
Rent Trends
08 09 10* 11**07
0
250
500
750
1,000
08 09 10* 11**072%
3%
4%
5%
6%
-9%
-6%
-3%
0%
3%
-12%
-6%
0%
6%
12%
A strong resurgence in San Francisco’s key technology industry will re-vitalize Class A renter demand in the city through 2011 as relocating and expanding companies, including Zynga and Twitter, bring an
infl ux of young professionals to the area. Other tech companies will follow suit, helping the metro recoup 25 percent of the offi ce-using jobs lost during the recession and driving down in-city apartment vacancy rates consider-ably. Complexes near offi ce districts and desirable northern neighborhoods will lead absorption early in the year, fueled by renters upgrading into high-end units offered at discounts nearly 10 percent below peak levels . In premier districts such as the Russian Hills/Embarcadero and Marina/Pacifi c Heights submarkets, vacancy will fall close to pre-recession levels in the high-2 percent range, generating rent growth surpassing 7 percent . By midyear, lower-paying, population-serving job gains will resume, support-ing leasing activity in Class B/C complexes throughout the metro.
Transaction volume will continue to accelerate in 2011 as experienced local investors capitalize on low interest rates to expand holdings. Improv-ing rents and vacancies have diminished buyers’ concerns over eroding NOIs, leaving more investors willing to deploy large amounts of cash to-ward deals . High-net-worth buyers are looking to reposition portfolios, tar-geting high-profi le assets in the city’s northern neighborhoods, where cap rates for premier properties average in the mid-4 percent to low-5 percent range. Although sales activity in the city will build momentum as the year progresses, closings in periphery communities will remain constrained as buyers focus on performing assets in the core. First-year returns for com-plexes in outlying areas will average between 5.5 percent and 6.0 percent in 2011.
2011 Market Outlook
◆ 2011 NAI Rank: 7, Up 2 Places. Low housing affordability and a rebound in job growth pushed up San Francisco two spots in the index.
◆ Employment Forecast: In 2011, employers will add 20,400 jobs, a 2.2 per-cent gain and a reversal from last year, when 6,500 positions were cut.
◆ Construction Forecast: Developers will complete fewer than 80 units this year, down from 870 rentals in 2010.
◆ Vacancy Forecast: After declining 10 basis points last year, vacancy will retreat 80 basis points in 2011 to 3.9 percent.
◆ Rent Forecast: Occupancy gains will facilitate a 5 percent increase in ask-ing rents this year to $1,884 per month. Effective rents will advance 5.4 percent to $1,802 per month.
◆ Investment Forecast: Distressed deals will remain limited in the mar-ket, minimizing their impact on investment activity and driving buyers to performing assets. Stronger investor demand will encourage more owners to list, and traditional-asset transactions will account for a larger share of deals.
Tech Renaissance Gains Momentum,Fuels Demand for High-End Rentals
San Francisco Up 2 Places 2011 Rank: 7 2010 Rank: 9

2011 Annual Report page 49
* Estimate ** ForecastSources: Marcus & Millichap Research Services, CoStar Group, Inc., RCA
Market Forecast Employment: 2.5% ▲ Construction: 90 ▼ Vacancy: 40 bps ▼ Effective Rents: 4.9% ▲
As employers restaff this year and low housing affordability relegates a sizable share of residents to the rental market, South Bay apartment vacancy will fall to one of the lowest levels in a decade. Tech fi rms,
crucial to the local economy, are especially well positioned to begin adding to payrolls after posting strong profi ts and stockpiling cash in 2010. As the national economy continues to strengthen and corporations move forward with delayed information-technology spending, a pick-up in job growth will spur apartment absorption across the region. Complexes near major employment hubs in the Sunnyvale and Santa Clara submarkets will fi eld the bulk of leasing activity, and projected demand growth of more than 5 percent will pull vacancies below 3 percent in these areas . As these trends manifest, owners will withdraw concessions and raise rents at a faster clip than the metrowide average. While backfi lling Class C units will take a while longer, especially in periphery communities, a shortage of affordable housing will propel a recovery starting in the second half as job growth broadens across nearly all sectors.
Sustainable economic growth will improve investor sentiment for San Jose apartment properties, and some sellers who delayed dispositions through the downturn will divest, intensifying deal fl ow. Premier assets in Mountain View, Sunnyvale and Santa Clara will remain prime targets for REITs, a trend that emerged late last year and compressed cap rates for best-in-class listings to the low- to mid-5 percent range. Private buyers also will re-emerge to account for a greater share of activity. These investors will transition capital from low-yielding, non-real estate investments into income-producing apartment complexes containing 20 units or fewer. As bidding activity intensifi es for these smaller assets, cap rates will stabilize in the low- to high-6 percent range.
2011 Market Outlook
◆ 2011 NAI Rank: 4, Up 6 Places. The second lowest vacancy rate in the nation and robust rent growth carried San Jose into the top fi ve.
◆ Employment Forecast: Following the creation of 14,000 positions last year, Silicon Valley employers will expand head counts by 21,000 work-ers in 2011, a gain of 2.5 percent.
◆ Construction Forecast: Completions will total 470 units this year, a 0.4 percent rental stock increase and down from 2010, when 560 units were placed into service.
◆ Vacancy Forecast: Payroll expansion helped push down the vacancy rate by 130 basis points last year and will further bolster improvements through 2011. This year, vacancy will slide 40 basis points to 3.4 percent, a rate 140 basis points below the 10-year average.
◆ Rent Forecast: In 2011, asking rents will advance 4.2 percent to $1,505 per month, and effective rents will increase 4.9 percent to $1,417 per month.
◆ Investment Forecast: Cash-heavy private buyers will fi nd opportunities this year to purchase lower-tier properties in densely populated, blue-collar communities, including East San Jose, ahead of a more robust up-swing in rents .
-75
-50
-25
0
25
Tota
l Non
farm
Job
s (t
hous
ands
)
Absolute Change Y-O-Y % Change
Employment Trends
08 09 10* 11**07
Year-over-Year Change
Uni
ts
Completions Vacancy
Supply and Demand
Vacancy Rate
$130
$140
$150
$160
$170
Med
ian
Pric
e pe
r U
nit
(tho
usan
ds)
Sales Trends
07 08 09 10*06
Year
-ove
r-Ye
ar C
hang
e
Asking Rents Effective Rents
Rent Trends
08 09 10* 11**07
0
250
500
750
1,000
08 09 10* 11**072%
3%
4%
5%
6%
-9%
-6%
-3%
0%
3%
-16%
-8%
0%
8%
16%
Pent-up Corporate Demand for Tech Goods to Benefi t Local Firms, Spur Strong Job Gains
San JoseUp 6 Places 2011 Rank: 4 2010 Rank: 10

page 50 2011 Annual Report
* Estimate ** ForecastSources: Marcus & Millichap Research Services, CoStar Group, Inc., RCA
Market Forecast Employment: 2.2% ▲ Construction: 3,400 ▼ Vacancy: 80 bps ▼ Effective Rents: 4.4% ▲
-100
-50
0
50
100
Tota
l Non
farm
Job
s (t
hous
ands
)
Absolute Change Y-O-Y % Change
Employment Trends
08 09 10* 11**07
Year-over-Year Change
Uni
ts (
thou
sand
s)
Completions Vacancy
Supply and Demand
Vacancy Rate
$90
$100
$110
$120
$130
Med
ian
Pric
e pe
r U
nit
(tho
usan
ds)
Sales Trends
07 08 09 10*06
Year
-ove
r-Ye
ar C
hang
e
Asking Rents Effective Rents
Rent Trends
08 09 10* 11**07
0
2
4
6
8
08 09 10* 11**072%
4%
6%
8%
10%
-6%
-3%
0%
3%
6%
-8%
-4%
0%
4%
8%
Puget Sound apartment vacancy will tighten further in 2011 as employ-ment gains surpass the national average and completions slow to one of the lowest levels on record. Last year, declining homeownership
rates and the resumption of job growth fueled a surge in apartment de-mand, pulling the vacancy rate in line with the 10-year average, despite the infl ux in deliveries. During 2011, operations will improve as stock ad-ditions decelerate and re-employed young professionals migrate to neigh-borhoods near major employment hubs such as Capitol Hill, Queen Anne, Ballard and downtown Tacoma. As conditions strengthen in these Class A-heavy areas through the fi rst half, owners will begin pushing rents higher and easing concessions. In the Bellevue/Issaquah submarket, however, the 13 percent jump in top-tier stock last year will limit operators’ ability to cut leasing incentives dramatically in 2011. As for the metro’s lower-tier complexes, renter demand will build momentum this year as blue-collar employers, including manufacturers, add to payrolls.
Seller-fi nanced and all-cash deals will account for a large share of clos-ings in 2011, but improving lender fi nancing capacity will broaden the in-vestor pool and help spur activity. Private buyers will utilize low-interest-rate loans to acquire properties capable of achieving outsized revenue gains as rents increase. Value-add sales activity will center on smaller assets in suburban communities within southern King and Pierce counties, where cap rates will stabilize in the high-7 percent to low-8 percent range. Inves-tor interest in top-tier assets in areas such as Queen Anne and Capitol Hill also will intensify, and institutions will look to purchase newer buildings reclaimed by lenders. Complexes in these core areas will trade with yields in the high-5 percent to low-6 percent range this year.
2011 Market Outlook
◆ 2011 NAI Rank: 15, Up 7 Places. Slowing construction and impressive revenue gains raised the Puget Sound seven positions in the NAI.
◆ Employment Forecast: Total employment will increase by 36,000 posi-tions in 2011, or 2.2 percent, double last year’s pace.
◆ Construction Forecast: Development will slow to just 1,500 units this year, down from 4,900 units in 2010 and below the fi ve-year average of 3,200 units annually.
◆ Vacancy Forecast: As newly completed buildings fi ll, the average va-cancy rate will fall 80 basis points this year to 5.7 percent. During 2010, vacancy decreased 100 basis points.
◆ Rent Forecast: Asking rents will advance 3.7 percent to $1,026 per month in 2011, while effective rents will rise 4.4 percent to $966 per month.
◆ Investment Forecast: With rising occupancies and rents restoring rev-enue streams, the distressed-asset pipeline will thin, narrowing the gap between buyers’ and sellers’ expectations. Troubled-asset sales will re-main present, however, as properties amounting to more than $300 mil-lion were in some level of distress at the close of 2010.
Operational Improvements to GainMomentum as Building Cycle Winds Down
Seattle Up 7 Places 2011 Rank: 15 2010 Rank: 22

2011 Annual Report page 51
* Estimate ** ForecastSources: Marcus & Millichap Research Services, CoStar Group, Inc., RCA
Market Forecast Employment: 1.7% ▲ Construction: 560 ▲ Vacancy: 90 bps ▼ Effective Rents: 2.7% ▲
A drop-off in apartment construction in 2010, along with the resump-tion of job growth, initiated the ongoing recovery of the St. Louis apartment market. While completions will rise dramatically in 2011
compared to last year, job growth will also accelerate, generating suffi cient renter demand to draw down the vacancy rate. Property performance, how-ever, will vary widely based on quality and location. The Class A segment and historically tight pockets of the metro, such as the South submarket and St. Charles County, will lead in occupancy and rent growth this year, while recovery in the St. Louis City South submarket, home to the majority of new construction, will lag. Other areas, such as St. Louis City North and Clayton/Mid-County will post vacancy near 10 percent, keeping condi-tions weak until the region regains a more signifi cant share of the jobs lost through the downturn.
More investors, particularly local, private owners, will return to St. Louis this year. Many of these prospective buyers recognize operations have stabilized or begun to recover and the fi nancing climate in the metro has become more favorable in recent quarters. Stronger demand for high-quality, performing assets will likely compress Class A cap rates modestly, while returns will rise for some lower-tier properties, especially those in underperforming areas like downtown or North City/North County. As Class B/C cap rates push past 9 percent, less risk-averse investors may fi nd strong acquisition opportunities by moving down the quality spectrum.
2011 Market Outlook
◆ 2011 NAI Rank: 29, Down 3 Places. St. Louis slipped three spots in the ranking due to high vacancy and an increase in construction.
◆ Employment Forecast: Nonfarm employment in St. Louis will climb by 22,000 jobs in 2011, a 1.7 percent gain. Last year, local payrolls increased by 1 percent.
◆ Construction Forecast: Approximately 600 apartments will come online in the metro this year, up dramatically from 2010, when just 38 units were delivered.
◆ Vacancy Forecast: Following a decline of 130 basis points last year, the vacancy rate will slip 90 basis points to 7 percent in 2011. Recovery will be uneven, however, with the strongest gains expected in more desirable submarkets and among higher-quality properties.
◆ Rent Forecast: In 2011, asking will rise 2.1 percent to $731 per month, while effective rents will increase 2.7 percent to $687 per month. Last year, asking and effective rents both ticked up 1.1 percent.
◆ Investment Forecast: Cap rates in the lower tiers could rise further through 2011 as values decline modestly, creating a more challenging en-vironment for owners in need of refi nancing or a quick sale. As a result, owners of lower-quality properties with debt maturing over the next few years may want to consider listing in the near term.
Top-Quality Properties, Desirable AreasMaintain Lead in Apartment Recovery
-50
-25
0
25
50
Tota
l Non
farm
Job
s (t
hous
ands
)
Absolute Change Y-O-Y % Change
Employment Trends
08 09 10* 11**07
Year-over-Year Change
Uni
ts
Completions Vacancy
Supply and Demand
Vacancy Rate
$30
$40
$50
$60
$70
Med
ian
Pric
e pe
r U
nit
(tho
usan
ds)
Sales Trends
07 08 09 10*06
Year
-ove
r-Ye
ar C
hang
e
Asking Rents Effective Rents
Rent Trends
08 09 10* 11**07
0
200
400
600
800
08 09 10* 11**076%
7%
8%
9%
10%
-4%
-2%
0%
2%
4%
-4%
-2%
0%
2%
4%
St. LouisDown 3 Places 2011 Rank: 29 2010 Rank: 26

page 52 2011 Annual Report
* Estimate ** ForecastSources: Marcus & Millichap Research Services, CoStar Group, Inc., RCA
Market Forecast Employment: 2.1% ▲ Construction: 1,130 ▼ Vacancy: 100 bps ▼ Effective Rents: 3.4% ▲
-90
-60
-30
0
30
Tota
l Non
farm
Job
s (t
hous
ands
)
Absolute Change Y-O-Y % Change
Employment Trends
08 09 10* 11**07
Year-over-Year Change
Uni
ts (
thou
sand
s)
Completions Vacancy
Supply and Demand
Vacancy Rate
$40
$50
$60
$70
$80
Med
ian
Pric
e pe
r U
nit
(tho
usan
ds)
Sales Trends
07 08 09 10*06
Year
-ove
r-Ye
ar C
hang
e
Asking Rents Effective Rents
Rent Trends
08 09 10* 11**07
0
1
2
3
4
08 09 10* 11**074%
6%
8%
10%
12%
-9%
-6%
-3%
0%
3%
-8%
-4%
0%
4%
8%
An accelerated pace of job creation and a depleted construction pipe-line will drive improvements in Tampa apartment operating condi-tions during 2011. Last year marked a transition in the market, as
modest employment growth and the release of pent-up demand sparked the absorption of nearly 5,000 apartments. Effective rents in most of the 17 submarkets, however, remained substantially less than when the recession began. As 2011 progresses, restoring effective rents to those levels will re-main a challenge for many owners. For investors who purchased properties at peak pricing and must manage signifi cant monthly debt service, a slight increase in tenant demand this year will provide an opportunity to bolster income and avert loan-related diffi culties. The ability for all owners to re-gain pricing power, though, rests upon a successful spring and summer leasing season that greatly boosts occupancies and supports more substan-tial rent growth.
Minimal multifamily rental development and improving NOIs this year will provide a solid foundation for the next signifi cant upswing in the market and boost investment activity. Distress will linger, with well-located properties under fi nancial or operational diffi culty presenting via-ble value-add opportunities for capable operators. Institutional-grade Class A assets in the Hillsborough or Pinellas County submarkets will also garner interest. Cap rates for these properties fell to about 6 percent last year and may compress slightly more in 2011 while low interest rates persist. Own-ers contemplating a sale will increasingly take advantage of the competitive bidding climate for top-grade properties and seek to dispose assets in the year ahead. Lower-quality properties will also continue to sell, with cap rates ranging up to 10 percent on the lowest-quality Class C/D buildings.
2011 Market Outlook
◆ 2011 NAI Rank: 36, Up 4 Places. Above-average employment growth boosted Tampa four places in the ranking, though high vacancy kept the market in the bottom half of the index.
◆ Employment Forecast: Total employment will expand 2.1 percent, or by 24,000 positions, in 2011. Last year, 10,000 jobs were created in the metro.
◆ Construction Forecast: Developers will complete only 500 units this year, one of the lowest annual totals on record. In 2010, approximately 1,600 rent-als were delivered in projects located primarily in Hillsborough County.
◆ Vacancy Forecast: During 2011, marketwide vacancy will decline 100 ba-sis points to 7.5 percent on minimal supply growth and steady improve-ment in demand; vacancy dropped 220 basis points in 2010. Hillsborough County vacancy will fall 100 basis points this year to 7.5 percent, while an 80 basis point decline to 7.2 percent will occur in Pinellas County.
◆ Rent Forecast: In 2011, asking rents will rise 2.7 percent to $828 per month, while effective rents will increase 3.4 percent to $784 per month.
◆ Investment Forecast: Investors will focus on properties in established core areas, such as the neighborhoods surrounding the University of South Florida and employment nodes like downtown Tampa, St. Peters-burg, Clearwater and Westshore.
Rents Make Headway TowardRecovery as Development Falls
Tampa Up 4 Places 2011 Rank: 36 2010 Rank: 40
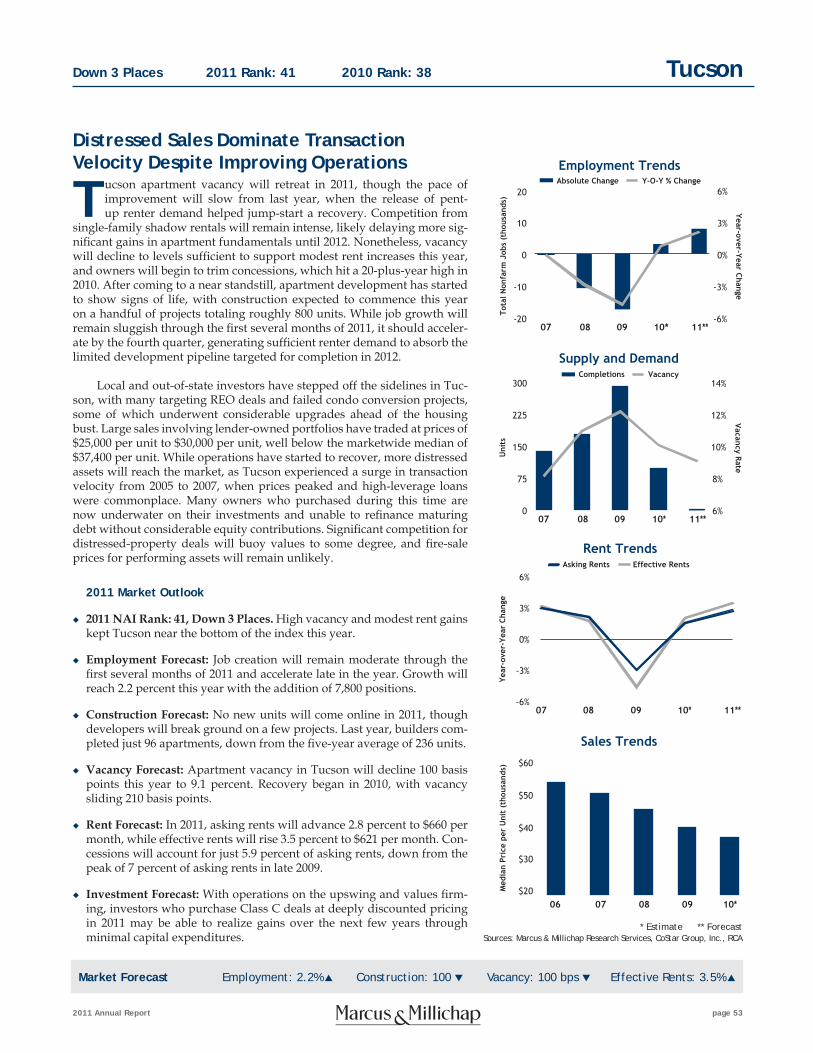
2011 Annual Report page 53
* Estimate ** ForecastSources: Marcus & Millichap Research Services, CoStar Group, Inc., RCA
Market Forecast Employment: 2.2% ▲ Construction: 100 ▼ Vacancy: 100 bps ▼ Effective Rents: 3.5% ▲
Tucson apartment vacancy will retreat in 2011, though the pace of improvement will slow from last year, when the release of pent-up renter demand helped jump-start a recovery. Competition from
single-family shadow rentals will remain intense, likely delaying more sig-nifi cant gains in apartment fundamentals until 2012. Nonetheless, vacancy will decline to levels suffi cient to support modest rent increases this year, and owners will begin to trim concessions, which hit a 20-plus-year high in 2010. After coming to a near standstill, apartment development has started to show signs of life, with construction expected to commence this year on a handful of projects totaling roughly 800 units. While job growth will remain sluggish through the fi rst several months of 2011, it should acceler-ate by the fourth quarter, generating suffi cient renter demand to absorb the limited development pipeline targeted for completion in 2012.
Local and out-of-state investors have stepped off the sidelines in Tuc-son, with many targeting REO deals and failed condo conversion projects, some of which underwent considerable upgrades ahead of the housing bust. Large sales involving lender-owned portfolios have traded at prices of $25,000 per unit to $30,000 per unit, well below the marketwide median of $37,400 per unit. While operations have started to recover, more distressed assets will reach the market, as Tucson experienced a surge in transaction velocity from 2005 to 2007, when prices peaked and high-leverage loans were commonplace. Many owners who purchased during this time are now underwater on their investments and unable to refi nance maturing debt without considerable equity contributions. Signifi cant competition for distressed-property deals will buoy values to some degree, and fi re-sale prices for performing assets will remain unlikely.
2011 Market Outlook
◆ 2011 NAI Rank: 41, Down 3 Places. High vacancy and modest rent gains kept Tucson near the bottom of the index this year.
◆ Employment Forecast: Job creation will remain moderate through the fi rst several months of 2011 and accelerate late in the year. Growth will reach 2.2 percent this year with the addition of 7,800 positions.
◆ Construction Forecast: No new units will come online in 2011, though developers will break ground on a few projects. Last year, builders com-pleted just 96 apartments, down from the fi ve-year average of 236 units.
◆ Vacancy Forecast: Apartment vacancy in Tucson will decline 100 basis points this year to 9.1 percent. Recovery began in 2010, with vacancy sliding 210 basis points.
◆ Rent Forecast: In 2011, asking rents will advance 2.8 percent to $660 per month, while effective rents will rise 3.5 percent to $621 per month. Con-cessions will account for just 5.9 percent of asking rents, down from the peak of 7 percent of asking rents in late 2009.
◆ Investment Forecast: With operations on the upswing and values fi rm-ing, investors who purchase Class C deals at deeply discounted pricing in 2011 may be able to realize gains over the next few years through minimal capital expenditures .
Distressed Sales Dominate Transaction Velocity Despite Improving Operations
-20
-10
0
10
20
Tota
l Non
farm
Job
s (t
hous
ands
)
Absolute Change Y-O-Y % Change
Employment Trends
08 09 10* 11**07
Year-over-Year Change
Uni
ts
Completions Vacancy
Supply and Demand
Vacancy Rate
$20
$30
$40
$50
$60
Med
ian
Pric
e pe
r U
nit
(tho
usan
ds)
Sales Trends
07 08 09 10*06
Year
-ove
r-Ye
ar C
hang
e
Asking Rents Effective Rents
Rent Trends
08 09 10* 11**07
0
75
150
225
300
08 09 10* 11**076%
8%
10%
12%
14%
-6%
-3%
0%
3%
6%
-6%
-3%
0%
3%
6%
TucsonDown 3 Places 2011 Rank: 41 2010 Rank: 38

page 54 2011 Annual Report
* Estimate ** ForecastSources: Marcus & Millichap Research Services, CoStar Group, Inc., RCA
Market Forecast Employment: 2.8% ▲ Construction: 4,300 ▼ Vacancy: 80 bps ▼ Effective Rents: 5.5% ▲
-100
-50
0
50
100
Tota
l Non
farm
Job
s (t
hous
ands
)
Absolute Change Y-O-Y % Change
Employment Trends
08 09 10* 11**07
Year-over-Year Change
Uni
ts (
thou
sand
s)
Completions Vacancy
Supply and Demand
Vacancy Rate
$80
$90
$100
$110
$120
Med
ian
Pric
e pe
r U
nit
(tho
usan
ds)
Sales Trends
07 08 09 10*06
Year
-ove
r-Ye
ar C
hang
e
Asking Rents Effective Rents
Rent Trends
08 09 10* 11**07
0
2
4
6
8
08 09 10* 11**073%
4%
5%
6%
7%
-4%
-2%
0%
2%
4%
-6%
-3%
0%
3%
6%
Robust job growth and limited construction will support an improve-ment in operations across the Washington, D.C., metro this year, though future supply concerns could re-emerge as early as 2012 . In
the district, strong tenant demand will push down vacancy 30 basis points to 4.5 percent. With the recovery in full swing, the local construction pipeline will fi ll, although developers will likely concentrate on condo projects due to an expected shortage of owner-occupied housing over the next two years. The construction pipeline also constitutes an important reference point in Virginia, where an aggressive pace of building persisted through the reces-sion. Completions will fall this year, but the steady climb in rents will en-courage builders to accelerate development timelines beyond 2011 to fulfi ll robust demand. In Maryland, resurgent tenant demand for Class B/C units in Prince George’s County late last year indicates the recovery in property operations has started to spill over from the district and Montgomery Coun-ty. Additional improvement will occur as job creation picks up momentum.
The security and stability of local apartment properties will sustain intense investment activity throughout 2011. As 2010 concluded, most quality, well-located properties were receiving multiple offers, driving up pricing and placing downward pressure on cap rates. Prospective investors continue to come in with strong offers under assumptions for signifi cant improvements in property performance over projected holding periods. For owners planning to sell within the next three to fi ve years, the current climate provides an opportunity to capture premium pricing before inves-tors shift their attention to other markets and interest rates rise. In early 2011, buyers will underwrite cap rates varying from about 5 percent in the district to the low-6 percent range for most assets in close-in areas. Proper-ties located in the outer reaches of the metro received little attention from investors last year, and prospective buyers will continue to demand higher fi rst-year returns.
2011 Market Outlook
◆ 2011 NAI Rank: 2, Down 1 Place. Supported by the most new jobs in the nation, Washington, D.C., claimed the second spot in the index.
◆ Employment Forecast: Employers will add 85,300 positions in 2011, a 2.8 percent increase. Last year, 70,000 workers were hired.
◆ Construction Forecast: This year, 2,000 rentals will come online, down from 6,300 units in 2010. Approximately 1,000 units will be delivered in Virginia, compared with 3,700 units in 2010.
◆ Vacancy Forecast: The metrowide average vacancy rate will fall 80 ba-sis points to 4.3 percent in 2011 on positive net absorption of more than 5,000 units. Last year, vacancy declined 120 basis points.
◆ Rent Forecast: Asking rents will advance 4.6 percent this year to $1,435 per month, while effective rents will gain 5.5 percent to $1,375 per month.
◆ Investment Forecast: Buoyed by expectations of a strong condo market in 2012 and 2013, converters will continue to take a prominent role as bidders on properties with less than 100 units in the Northwest District, Montgomery County and Virginia suburbs.
Apartments Continue to Strengthen asEmployment Gains Mount, Construction Falls
Washington, D.C. Down 1 Place 2011 Rank: 2 2010 Rank: 1

* Estimate ** ForecastSources: Marcus & Millichap Research Services, CoStar Group, Inc., RCA
2011 Annual Report page 55
Property Owners Set to WithdrawConcessions in Palm Beach County
Apartment operations in the Palm Beach County market will further stabilize this year as strengthening demand and limited construction push vacancy below the 10-year average of 7.6 percent. In 2010, a re-
covery in demand in the southern half of the county fueled the marketwide reduction in vacancy. More than 70 percent of the units absorbed in the county were in Boynton Beach, Delray Beach and Boca Raton. Demand for rental housing in these areas will remain strong due to the presence of ma-jor employers and desirable neighborhoods, enabling owners to withdraw leasing incentives. An accelerated pace of hiring, plus the gradual resump-tion of in-migration from other areas of the country, will also help to reduce vacancy in the northern half of the county, which has lagged in the recovery thus far.
Conditions in the investment market continue to improve, as velocity picked up at the end of last year. The ability of buyers to put a consider-able amount of cash into deals will ensure quick execution in the early part of 2011, although fi nancing capacity has expanded, especially for qualifi ed operators. Investors will remain focused on either quality, turnkey assets or properly priced turnaround opportunities. In fact, the projected improve-ment in demand and concession burn stemming from an expanded tenant base will enhance the probability of value-add strategies succeeding. While many investors will evaluate opportunities on a price-per-unit basis, others seeking properties with stable cash fl ows will respond to listings offered at cap rates from 8.0 percent to 8.5 percent.
2011 Market Outlook
◆ 2011 NAI Rank: 38, Up 3 Places. A healthy rate of payroll expansion pulled West Palm Beach three places higher in the NAI.
◆ Employment Forecast: Total employment will expand 2.4 percent in 2011 through the creation of 12,000 jobs, after 7,400 positions were added last year. The education and health services and leisure and hospitality sectors will post the largest gains, hiring a combined 5,000 workers.
◆ Construction Forecast: Supply pressures will remain limited for the next two years. Only 300 units will come online in 2011, following the comple-tion of 220 rentals in 2010.
◆ Vacancy Forecast: After declining 140 basis points last year, marketwide vacancy will decrease 90 basis points in 2011 to 6.9 percent, the lowest rate in four years. Renter demand in the northern half of the county will strengthen as job growth accelerates.
◆ Rent Forecast: This year, asking rents will increase 2.8 percent to $1,111 per month, accompanied by a 3.7 percent jump in effective rents to $1,039 per month. Average concessions will fall to 6.5 percent of asking rents as a result.
◆ Investment Forecast: Properties in primary areas such as Boca Raton, Delray Beach, Boynton Beach and Lake Worth will continue to attract interest when listed at realistic prices and cap rates in the 7 percent to 8 percent range .
Market Forecast Employment: 2.4% ▲ Construction: 80 ▲ Vacancy: 90 bps ▼ Effective Rents: 3.7% ▲
West Palm BeachUp 3 Places 2011 Rank: 38 2010 Rank: 41
-36
-18
0
18
36
Tota
l Non
farm
Job
s (t
hous
ands
)
Absolute Change Y-O-Y % Change
Employment Trends
08 09 10* 11**07
Year-over-Year Change
Uni
ts
Completions Vacancy
Supply and Demand
Vacancy Rate
$0
$30
$60
$90
$120
Med
ian
Pric
e pe
r U
nit
(tho
usan
ds)
Sales Trends
07 08 09 10*06
Year
-ove
r-Ye
ar C
hang
e
Asking Rents Effective Rents
Rent Trends
08 09 10* 11**07
0
125
250
375
500
08 09 10* 11**076%
7%
8%
9%
10%
-8%
-4%
0%
4%
8%
-6%
-3%
0%
3%
6%

2011 National Apartment Report
Marcus & Millichap’s Research Services group utilizes a two-tiered approach of combining local mar-ket research with national economic and real estate analysis to develop premier research services for real estate investors. Marcus & Millichap’s research capabilities are customized by property
type to service the unique needs of owners and investors in various property sectors. Market reports are produced on a regular basis in addition to specifi c submarket and area analyses to support clients’ invest-ment decisions.
Fact-Based Investment Strategies
Multifamily Demand Analysis
■ Extensive demographic analyses are performed, including studies of population, age, employment, edu-cation, income and traffi c volume. Housing affordability, household formation and housing value trends are tracked and analyzed for their impact on renter demand. Customized maps and reports are produced for submarket and property comparisons.
■ Comprehensive economic analysis and forecasts are produced based on data provided by respected pri-vate, academic and government sources. Indicators such as job formation, growth by industry, major employers and income trends are monitored constantly.
Multifamily Property Analysis
■ Marcus & Millichap Research Services routinely updates and analyzes rents, vacancies, sales and construc-tion activity locally and nationally.
Financial Analysis
■ Our team works closely with clients to create fi nancial analysis scenarios supporting acquisition, disposi-tion, portfolio analysis, pricing strategies and market selection.
Customized Research and Consulting Services
■ In addition to multifamily publications and reports, we provide customized market studies, property and portfolio analysis, and development feasibility studies. These services are designed to help clients formu-late strategies ranging from acquisitions and dispositions to maximizing returns during the hold period.
Research Services
page 56 2011 Annual Report

2011 National Apartment Report
Prepared by:Hessam Nadji, Senior Vice President, Managing Director,Research and Advisory ServicesTel: (925) 953-1700 | [email protected]
John Chang, Vice President, Research ServicesTel: (602) 687-6700 | [email protected]
National Research TeamJohn Chang, Vice President, Research ServicesSteve Hovland, National Publications ManagerSarah Brewer, Research AdministratorJustin Britto, Research AssociateMichael Brown, Research AnalystAmber Bryan, Assistant EditorArt Gering, Senior Market AnalystErica Linn, Senior AnalystPaul Sammis, Research AssociatePhillip Solano, Research AssociateJarrod Thuener, Data AnalystMichael Yeager, Research Associate
Communications/Graphic DesignMichelle Cocagne, First Vice President,
Corporate CommunicationsStacey Corso, Public Relations Manager
Contact:John ChangVice President, Research Services2398 E. Camelback Road, Suite 550Phoenix, Arizona 85016Tel: (602) 687-6700, ext. 6803Fax: (602) [email protected]
Senior Management TeamJohn J. Kerin, President and Chief Executive Offi cerTel: (818) 212-2700 | [email protected]
Gary R. Lucas, Senior Vice President, Managing DirectorTel: (415) 963-3000 | [email protected]
Hessam Nadji, Senior Vice President, Managing Director,Research and Advisory ServicesTel: (925) 953-1700 | [email protected]
William E. Hughes, Senior Vice President, Managing DirectorMarcus & Millichap Capital CorporationTel: (949) 419-3200 | [email protected]
Paul S. Mudrich, Senior Vice President, Managing Director,Chief Legal Offi cerTel: (650) 391-1700 | [email protected]
Gene A. Berman, Senior Vice President, Managing DirectorTel: (954) 245-3400 | [email protected]
Alan L. Pontius, Senior Vice President, Managing DirectorCommercial Property GroupsTel: (415) 963-3000 | [email protected]
Steven R. Chaben, Senior Vice President, Managing DirectorTel: (248) 415-2600 | [email protected]
Kent R. Williams, Senior Vice President, Managing DirectorTel: (858) 373-3100 | [email protected]
Marty Louie, Chief Financial Offi cerTel: (818) 212-2700 | [email protected]
National Apartment Index Note: Employment and apartment data forecasts for 2011 are based on the most up-to-date information available as of Octo-ber 2010 and are subject to change.
Statistical Summary Note: Metro-level employment, vacancy, and annual asking and effective rents are year-end fi gures and are based on the most up-to-date information available as of November 2010. Effective rent is equal to asking rent less concessions. Median prices and cap rates are a function of the age, class and geographic area of the properties trading and therefore may not be representative of the market as a whole. Forecasts for employment and apartment data are made during the fourth quarter and represent estimates of future performance. No representation, warranty or guarantee, express of implied may be made as to the accuracy or reliability of the information contained herein.
Sources: Marcus & Millichap Research Services, American Council of Life Insurers, Blue Chip Economic Indicators, Bureau of Economic Analysis, Califor-nia Association of Realtors, California Employment Development Department, Commercial Mortgage Alert, CoStar Group Inc., Deutsche Bank, Dupre + Scott Apartment Advisors Inc., Economy.com, Fannie Mae, Federal Reserve, Foresight Analytics, Freddie Mac, Morgan Stanley, Mortgage Bankers Asso-ciation, National Association of Realtors, National Council of Real Estate Investment Fiduciaries, National Real Estate Index, Real Capital Analytics, Real Data, Real Estate Center at Texas A&M University, RealFacts, RealPoint, Reis, Standard & Poor’s, The Conference Board, Trepp, TWR/Dodge Pipeline, U.S. Bureau of Labor Statistics, U.S. Census Bureau, U.S. Securities and Exchange Commission, U.S. Treasury Department.
© Marcus & Millichap 2010
2011 Annual Report page 57

2011 National Apartment Report
page 58 2011 Annual Report
Corporate HeadquartersMarcus & MillichapFirst Financial Plaza16830 Ventura BoulevardSuite 352Encino, CA 91436Tel: (818) 212-2700www.MarcusMillichap.com
Atlanta500 Northpark Town Center1100 Abernathy Road, N.E.Building 500, Suite 600Atlanta, GA 30328Tel: (678) 808-2700John M. Leonard
Austin8310 N. Capital of Texas HighwaySuite 150Austin, TX 78731Tel: (512) 338-7800J. Michael Watson
Baltimore1720 Belt StreetBaltimore, MD 21230Tel: (410) 878-2062Gary R. Lucas
Birmingham3535 Grandview ParkwaySuite 425Birmingham, AL 35243Tel: (205) 747-3700Matthew M. Fitzgerald
Boise950 W. Bannock StreetSuite 1100Boise, ID 83702Tel: (208) 319-3549Gary R. Lucas
Boston400 Fifth AvenueSuite 105Waltham, MA 02451Tel: (781) 373-7100Gary R. Lucas
Brooklyn16 Court StreetFloor 2ABrooklyn, NY 11241Tel: (718) 475-4300J.D. Parker
Charlotte405 Eagle Bend DriveWaxhaw, NC 28173Tel: (704) 443-0600Gary R. Lucas
Charlotte Uptown101 S. Tryon StreetSuite 2460Charlotte, NC 28280Tel: (704) 831-4600Gary R. Lucas
Chicago8750 W. Bryn Mawr AvenueSuite 650Chicago, IL 60631Tel: (773) 867-1500Gregory A. LaBerge
Chicago Downtown333 W. Wacker DriveSuite 200Chicago, IL 60606Tel: (312) 327-5400John M. Przybyla
Cincinnati201 E. Fifth StreetSuite 2050Cincinnati, OH 45202Tel: (513) 878-7700Joshua Caruana
Cleveland5005 Rockside RoadSuite 1100Independence, OH 44131Tel: (216) 264-2000Michael L. Glass
Clinton4104 Highway 56 SouthClinton, SC 29325Tel: (864) 833-9090John M. Leonard
Columbia1201 Main StreetSuite 1480Columbia, SC 29201Tel: (803) 678-4900Gary R. Lucas
Columbus21 E. State StreetSuite 2300Columbus, OH 43215Tel: (614) 360-9800Michael L. Glass
DallasCentura Tower14185 N. Dallas ParkwaySuite 650Dallas, TX 75254Tel: (972) 755-5200Tim A. Speck
Denver1225 17th StreetSuite 1800Denver, CO 80202Tel: (303) 328-2000Michael E. Hoffman
Des Moines1011 Offi ce Park RoadSuite 1West Des Moines, IA 50265Tel: (515) 645-3200Matthew M. Fitzgerald
Detroit28411 Northwestern HighwaySuite 750Southfi eld, MI 48034Tel: (248) 415-2600Jonathan Dwoskin
EncinoFirst Financial Plaza16830 Ventura BoulevardSuite 100Encino, CA 91436Tel: (818) 212-2700Adam P. Christofferson
Fort CollinsFirst Community Bank Plaza3711 JFK ParkwaySuite 320Fort Collins, CO 80525Tel: (970) 267-3300Michael E. Hoffman
Fort Lauderdale5900 N. Andrews AvenueSuite 100Fort Lauderdale, FL 33309Tel: (954) 245-3400Gregory Matus
Fort Worth500 Throckmorton StreetSuite 325Fort Worth, TX 76102Tel: (682) 478-1200David Luther
Grand Rapids156 Campau Circle N.W.Grand Rapids, MI 49503Tel: (616) 482-1600 Jonathan Dwoskin
Honolulu970 N. Kalaheo AvenueSuite C-202Kailua, HI 96734Tel: (808) 695-2470Gary R. Lucas
Houston777 Post Oak BoulevardSuite 900Houston, TX 77056Tel: (713) 452-4200Brent Smith
Indianapolis900 E. 96th StreetSuite 150Indianapolis, IN 46240Tel: (317) 218-5300Joshua Caruana
Jackson617 Renaissance WaySuite 200Ridgeland, MS 39157Tel: (601) 790-3300Matthew M. Fitzgerald
Jacksonville5220 Belfort RoadSuite 120 Jacksonville, FL 32256 Tel: (904) 672-1400Richard Matricaria
Kansas City2 Emanuel Cleaver II BoulevardSuite 410Kansas City, MO 64112Tel: (816) 410-1010Gary R. Lucas
Lafayette140 Rue BeauregardSuite ALafayette, LA 70508Tel: (337) 231-5174Brent Smith
Las Vegas3993 Howard Hughes ParkwaySuite 300Las Vegas, NV 89169Tel: (702) 215-7100Kent R. Williams
Little Rock5507 Ranch DriveSuite 201Little Rock, AR 72223Tel: (501) 228-9600Matthew M. Fitzgerald
Long BeachOne World Trade CenterSuite 2100Long Beach, CA 90831-2100Tel: (562) 257-1200John F. Rodiles
Los Angeles915 Wilshire BoulevardSuite 1700Los Angeles, CA 90017Tel: (213) 943-1800Stephen D. Stein
Louisville9300 Shelbyville RoadSuite 1012Louisville, KY 40222Tel: (502) 329-5900Gary R. Lucas
Madison121 S. Pinckney StreetSuite 500Madison, WI 53703Tel: (608) 819-7800Matthew M. Fitzgerald
Manhattan270 Madison AvenueSeventh FloorNew York, NY 10016Tel: (212) 430-5100J.D. Parker
Offi ce Locations

2011 National Apartment Report
2011 Annual Report page 59
Memphis5050 Poplar AvenueSuite 1028Memphis, TN 38157Tel: (901) 620-3600Matthew M. Fitzgerald
Miami5201 Blue Lagoon DriveSuite 100Miami, FL 33126Tel: (786) 522-7000Kirk A. Felici
Milwaukee13845 Bishop’s DriveSuite 150Brookfi eld, WI 53005Tel: (262) 364-1900Matthew M. Fitzgerald
Minneapolis8300 Norman Center DriveSuite 810Bloomington, MN 55437Tel: (952) 852-9700H. Solomon Poretsky
Nashville6 Cadillac DriveSuite 245 Brentwood, TN 37027 Tel: (615) 371-1645Gary R. Lucas
New Haven265 Church StreetSuite 210New Haven, CT 06510Tel: (203) 672-3300J.D. Parker
New JerseyRiver Drive Center 3611 River DriveFourth FloorElmwood Park, NJ 07407Tel: (201) 582-1000Michael J. Fasano
New Mexico4801 Lang AvenueSuite 110Albuquerque, NM 87109Tel: (505) 286-2060Gary R. Lucas
Newport Beach19800 MacArthur BoulevardSuite 150Irvine, CA 92612-2420Tel: (949) 419-3200Joseph V. Cesta
Oak BrookOne Mid America PlazaSuite 200Oakbrook Terrace, IL 60181Tel: (630) 570-2200Steven D. Weinstock
Oakland500 12th StreetSuite 260Oakland, CA 94607Tel: (510) 379-1200Steven J. Seligman
Oklahoma City5609 N. Classen BoulevardSuite 100Oklahoma City, OK 73118Tel: (405) 254-2200Gary R. Lucas
Omaha10050 Regency CircleSuite 515 Omaha, NE 68114Tel: (402) 343-9700Matthew M. Fitzgerald
OntarioOne Lakeshore Center3281 E. Guasti RoadSuite 800Ontario, CA 91761Tel: (909) 456-3400Douglas J. McCauley
Orlando1900 Summit Tower BoulevardSuite 650Orlando, FL 32810Tel: (407) 557-3800Richard Matricaria
Palo Alto2626 Hanover StreetPalo Alto, CA 94304Tel: (650) 391-1700Steven J. Seligman
Philadelphia8 Penn Center1628 John F. Kennedy BoulevardSuite 1200Philadelphia, PA 19103Tel: (215) 531-7000Spencer I. Yablon
Phoenix2398 E. Camelback RoadSuite 550 Phoenix, AZ 85016Tel: (602) 687-6700David A. Guido
Portland101 S.W. Main StreetSuite 1850Portland, OR 97204Tel: (503) 200-2000Tony W. Cassie
Providence136 Peckham RoadLittle Compton, RI 02837Tel: (401) 592-0199Gary R. Lucas
Raleigh101 J Morris Commons LaneSuite 130Morrisville, NC 27560Tel: (919) 388-1278Gary R. Lucas
Reno255 W. Moana LaneSuite 209Reno, NV 89509Tel: (775) 827-5700Robert B. Hicks
Reston11710 Plaza America DriveSuite 2000Reston, VA 20190Tel: (703) 871-5396David Feldman
Sacramento3741 Douglas BoulevardSuite 200Roseville, CA 95661Tel: (916) 724-1400Robert B. Hicks
Salt Lake City50 West BroadwaySuite 100Salt Lake City, UT 84101Tel: (801) 736-2600Richard A. Bird
San Antonio100 N.E. Loop 410Suite 600San Antonio, TX 78216Tel: (210) 343-7800J. Michael Watson
San Diego9255 Towne Centre DriveSuite 700San Diego, CA 92121Tel: (858) 373-3100Kent R. Williams
San Francisco750 Battery StreetFifth FloorSan Francisco, CA 94111Tel: (415) 963-3000Jeffrey M. Mishkin
Seattle1420 Fifth AvenueSuite 1600Seattle, WA 98101Tel: (206) 826-5700Gregory S. Wendelken
Southern Virginia5360 Discovery Park BoulevardSuite 101-BWilliamsburg, VA 23188Tel: (757) 253-1861Gary R. Lucas
St. Louis120 S. Central AvenueSuite 1100St. Louis, MO 63105Tel: (314) 889-2500Stephen P. Maulden
Tampa7650 Courtney Campbell CausewaySuite 920Tampa, FL 33607Tel: (813) 387-4700 Bryn D. Merrey
Tucson4031 E. Sunrise DriveSuite 151Tucson, AZ 85718Tel: (520) 202-2900David A. Guido
Vero Beach1701 Highway A1ASuite 214Vero Beach, FL 32963Tel: (772) 453-2400Gregory Matus
Washington, D.C.7200 Wisconsin AvenueSuite 1101Bethesda, MD 20814Tel: (202) 536-3700David Feldman
West Los Angeles12100 W. Olympic BoulevardSuite 350Los Angeles, CA 90064Tel: (310) 909-5500Stephen D. Stein

[This page is intentionally left blank.]

Real Estate Investment Research
National Apartment Report2011
SURGE SUSTAINABLE OPPORTUNITY FORECAST OUTLOOK SIGNS CAPITAL NEW CONSTRUCTION INFLATION TRENDS HIGH UNEMPLOYMENT GROWTH SPENDING STABILIZED INVESTMENT VACANCIES SHADOW MARKET SINGLE-FAMILY OVER-SUPPLY INCREASE SALES DISTRESSED RANK RESILIENCE INVENTORY POPULATION PENT-UP DEMAND REVENUES BUYER ACTIVITY INTEREST DECLINE CONCESSIONS BURN SELLER RECOVERY CONDOS FOR RENT FUTURE OF FANNIE MAE RETURNS YEAREND LOW COMPLETIONS QE2 STRATEGY LIMIT FISCAL PROFORMA ECONOMY DELIVER CAP RATES QE2 RENT GROWTH VELOCITY MOMENTUM DISCOUNTS RATE REBOUND SUBMARKET RENT GROWTH PERCENT ABSORPTION EXPANSION PRICING PROPERTY AVERAGE BID ASK MAXIMIZE FOCUS HEADWINDS ROLLOVER POTENTIAL FUNDAMENTALS URBAN DEVELOPMENT INCOME NATIONWIDE STRENGTH PROJECTED FREDDIE MAC LOCAL EXCEEDING CONDOS FOR RENT INVESTOR TRENDS EMERGING GAINS RISK SLUMP DRIVERS ASSETS CASH FLOW RECESSION UNCERTAINTY RENT GROWTH ACQUISITIONS POTENTIAL UPTURN FORECLOSURE MODERATE JOB GROWTH SURGE SUSTAINABLE OPPORTUNITY FORECAST OUTLOOK SIGNS CAPITAL NEW CONSTRUCTION INFLATION TRENDS HIGH UNEMPLOYMENT GROWTH SPENDING STABILIZED INVESTMENT VACANCIES SHADOW MARKET SINGLE-FAMILY OVER-SUPPLY INCREASE SALES DISTRESSED RANK RESILIENCE INVENTORY POPULATION PENT-UP DEMAND REVENUES BUYER EMERGING INTEREST DECLINE CONCESSIONS BURN SELLER RECOVERY CONDOS FOR RENT FUTURE OF FANNIE MAE RETURNS YEAREND LOW COMPLETIONS QE2 STRATEGY LIMIT FISCAL PROFORMA ECONOMY DELIVER CAP RATES QE2 RENT GROWTH VELOCITY MOMENTUM DISCOUNTS RATE VELOCITY SUBMARKET RENT GROWTH PERCENT ABSORPTION EXPANSION PRICING PROPERTY AVERAGE BID ASK MAXIMIZE FOCUS HEADWINDS ROLLOVER POTENTIAL FUNDAMENTALS URBAN DEVELOPMENT INCOME NATIONWIDE STRENGTH PROJECTED FREDDIE MAC LOCAL EXCEEDING CONDOS FOR RENT INVESTOR TRENDS EMERGING GAINS RISK SLUMP DRIVERS ASSETS CASH FLOW RECESSION UNCERTAINTY RENT GROWTH ACQUISITIONS POTENTIAL UPTURN FORECLOSURE MODERATE JOB GROWTH SURGE SUSTAINABLE OPPORTUNITY FORECAST OUTLOOK SIGNS CAPITAL NEW CONSTRUCTION INFLATION TRENDS HIGH UNEMPLOYMENT GROWTH SPENDING STABILIZED INVESTMENT VACANCIES SHADOW MARKET SINGLE-FAMILY OVER-SUPPLY INCREASE SALES DISTRESSED RANK RESILIENCE INVENTORY POPULATION PENT-UP DEMAND REVENUES BUYER EMERGING INTEREST DECLINE CONCESSIONS BURN SELLER RECOVERY CONDOS FOR RENT FUTURE OF FANNIE MAE RETURNS YEAREND LOW COMPLETIONS QE2 STRATEGY LIMIT FISCAL PROFORMA ECONOMY DELIVER CAP RATES QE2 RENT GROWTH VELOCITY MOMENTUM DISCOUNTS RATE LEGISLATIVE GRIDLOCK SUBMARKET RENT GROWTH PERCENT ABSORPTION EXPANSION PRICING ECHO BOOMERS AVERAGE BID ASK MAXIMIZE FOCUS HEADWINDS ROLLOVER POTENTIAL FUNDAMENTALS URBAN DEVELOPMENT INCOME NATIONWIDE STRENGTH PROJECTED FREDDIE MAC EXCEEDING CONDOS FOR RENT INVESTOR TRENDS EMERGING GAINS RISK SLUMP DRIVERS ASSETS CASH FLOW RECESSION UNCERTAINTY RENT GROWTH LOCAL ACQUISITIONS POTENTIAL UPTURN APARTMENT FORECLOSURE MODERATE JOB GROWTH SURGE SUSTAINABLE OPPORTUNITY FORECAST OUTLOOK SIGNS CAPITAL NEW CONSTRUCTION INFLATION TRENDS HIGH UNEMPLOYMENT GROWTH SPENDING STABILIZED INVESTMENT VACANCIES SHADOW MARKET SINGLE-FAMILY OVER-SUPPLY SALES INCREASE DISTRESSED RANK RESILIENCE INVENTORY POPULATION PENT-UP DEMAND REVENUES BUYER EMERGING INTEREST CONCESSIONS BURN SELLER RECOVERY CONDOS FOR RENT FUTURE OF FANNIE MAE RETURNS YEAREND LOW COMPLETIONS QE2 STRATEGY LIMIT FISCAL PROFORMA ECONOMY DELIVER CAP RATES QE2 RENT GROWTH HEADWINDS VELOCITY MOMENTUM SUBMARKET DISCOUNTS RATE RENT GROWTH MARKET PERCENT ABSORPTION EXPANSION PRICING PROPERTY AVERAGE BID ASK MAXIMIZE FOCUS REBOUND ROLLOVER POTENTIAL FUNDAMENTALS URBAN DEVELOPMENT INCOME NATIONWIDE STRENGTH PROJECTED FREDDIE MAC LOCAL QE2 EXCEEDING CONDOS FOR RENT INVESTOR TRENDS EMERGING GAINS RISK SLUMP DRIVERS ASSETS CASH FLOW RECESSION UNCERTAINTY RENT GROWTH ACQUISITIONS POTENTIAL UPTURN FORECLOSURE MODERATE JOB GROWTH SUSTAINABLE FORECAST OUTLOOK SIGNS CAPITAL NEW CONSTRUCTION INFLATION TRENDS HIGH UNEMPLOYMENT GROWTH SPENDING STABILIZED INVESTMENT VACANCIES SINGLE-FAMILY OVER-SUPPLY SALES DISTRESSED RANK RESILIENCE INVENTORY POPULATION PENT-UP DEMAND TRENDS REVENUES BUYER EMERGING INTEREST DECLINE CONCESSIONS BURN SELLER CONDOS FOR RENT FUTURE OF FANNIE MAE RETURNS YEAREND LOW COMPLETIONS QE2 STRATEGY FISCAL PROFORMA ECONOMY DELIVER CAP RATES VELOCITY MOMENTUM DISCOUNTS CONCESSIONS BURN SUBMARKET RECOVERY ABSORPTION EXPANSION PRICING PROPERTY AVERAGE SHADOW BID ASK MARKET MAXIMIZE FOCUS ROLLOVER POTENTIAL FUNDAMENTALS URBAN DEVELOPMENT NATIONWIDE STRENGTH PROJECTED FREDDIE MAC LOCAL EXCEEDING CONDOS FOR RENT INVESTOR TRENDS EMERGING GAINS HEADWINDS SLUMP DRIVERS ASSETS CASH FLOW RECESSION UNCERTAINTY RENT GROWTH ACQUISITIONS POTENTIAL UPTURN FORECLOSURE MODERATE JOB GROWTH HEADWINDS SURGE SUSTAINABLE OPPORTUNITY FORECAST OUTLOOK SIGNS CAPITAL NEW CONSTRUCTION ROLLOVER RESILIENCE SPENDING INVESTMENT VACANCIES SHADOW MARKET SINGLE-FAMILY OVER-SUPPLY INCREASE SALES DISTRESSED RANK POPULATION PENT-UP DEMAND REVENUES BUYER EMERGING LOW COMPLETIONS INTEREST DECLINE CONCESSIONS BURN SELLER SPENDING FUTURE OF FANNIE MAE RETURNS YEAREND LOW COMPLETIONS QE2 STRATEGY LIMIT FISCAL PROFORMA ECONOMY DELIVER CAP RATES DISTRESSED QE2 VELOCITY RENT GROWTH MOMENTUM DISCOUNTS RATE LEGISLATIVE GRIDLOCK SUBMARKET RENT GROWTH PERCENT ABSORPTION EXPANSION PRICING PROPERTY AVERAGE BID ASK MAXIMIZE FOCUS HEADWINDS ROLLOVER POTENTIAL FUNDAMENTALS URBAN DEVELOPMENT INCOME NATIONWIDE STRENGTH PROJECTED FREDDIE MAC LOCAL EXCEEDING CONDOS FOR RENT INVESTOR TRENDS EMERGING GAINS RISK SLUMP DRIVERS ASSETS CASH FLOW RECESSION UNCERTAINTY RENT GROWTH ACQUISITIONS POTENTIAL UPTURN FORECLOSURE MODERATE JOB GROWTH SURGE SUSTAINABLE OPPORTUNITY FORECAST OUTLOOK SIGNS CAPITAL NEW CONSTRUCTION INFLATION TRENDS HIGH UNEMPLOYMENT GROWTH SPENDING STABILIZED INVESTMENT VACANCIES SHADOW MARKET SINGLE-FAMILY OVER-SUPPLY SALES DISTRESSED RANK RESILIENCE INVENTORY POPULATION PENT-UP DEMAND REVENUES BUYER INTEREST DECLINE CONCESSIONS BURN SELLER RECOVERY CONDOS FOR RENT FUTURE OF FANNIE MAE RETURNS YEAREND LOW COMPLETIONS QE2 STRATEGY LIMIT FISCAL PROFORMA ECONOMY DELIVER CAP RATES QE2 RENT GROWTH VELOCITY MOMENTUM DISCOUNTS RATE LEGISLATIVE GRIDLOCK SUBMARKET RENT GROWTH PERCENT ABSORPTION EXPANSION PRICING PROPERTY AVERAGE BID ASK MAXIMIZE FOCUS HEADWINDS ROLLOVER POTENTIAL FUNDAMENTALS URBAN DEVELOPMENT INCOME NATIONWIDE STRENGTH ECHO BOOMERS FREDDIE MAC LOCAL EXCEEDING CONDOS FOR RENT INVESTOR TRENDS EMERGING GAINS RISK SLUMP DRIVERS ASSETS CASH FLOW RECESSION UNCERTAINTY RENT GROWTH ACQUISITIONS POTENTIAL UPTURN FORECLOSURE MODERATE JOB GROWTH SURGE SUSTAINABLE OPPORTUNITY FORECAST OUTLOOK SIGNS CAPITAL NEW CONSTRUCTION INFLATION TRENDS HIGH UNEMPLOYMENT GROWTH SPENDING STABILIZED INVESTMENT VACANCIES SHADOW MARKET SINGLE-FAMILY OVER-SUPPLY INCREASE SALES DISTRESSED RANK RESILIENCE INVENTORY POPULATION PENT-UP DEMAND REVENUES BUYER EMERGING INTEREST DECLINE CONCESSIONS BURN SELLER RECOVERY CONDOS FOR RENT FUTURE OF FANNIE MAE RETURNS YEAREND LOW COMPLETIONS QE2 STRATEGY LIMIT FISCAL PROFORMA ECONOMY DELIVER CAP RATES QE2 RENT GROWTH VELOCITY MOMENTUM DISCOUNTS RATE LEGISLATIVE GRIDLOCK SUBMARKET RENT GROWTH PERCENT ABSORPTION EXPANSION PRICING PROPERTY AVERAGE BID ASK MAXIMIZE FOCUS HEADWINDS ROLLOVER POTENTIAL FUNDAMENTALS URBAN DEVELOPMENT INCOME NATIONWIDE STRENGTH PROJECTED FREDDIE MAC LOCAL EXCEEDING CONDOS FOR RENT INVESTOR TRENDS EMERGING GAINS RISK SLUMP DRIVERS ASSETS CASH FLOW RECESSION UNCERTAINTY RENT GROWTH ACQUISITIONS POTENTIAL UPTURN FORECLOSURE MODERATE JOB GROWTH SURGE SUSTAINABLE OPPORTUNITY FORECAST OUTLOOK SIGNS CAPITAL NEW CONSTRUCTION INFLATION TRENDS HIGH UNEMPLOYMENT GROWTH SPENDING STABILIZED INVESTMENT VACANCIES SHADOW MARKET SINGLE-FAMILY OVER-SUPPLY INCREASE SALES DISTRESSED RANK RESILIENCE INVENTORY POPULATION PENT-UP DEMAND REVENUES BUYER EMERGING INTEREST DECLINE CONCESSIONS BURN SELLER RECOVERY CONDOS FOR RENT FUTURE OF FANNIE MAE RETURNS YEAREND LOW COMPLETIONS QE2 STRATEGY LIMIT FISCAL PROFORMA ECONOMY DELIVER CAP RATES QE2 RENT GROWTH VELOCITY MOMENTUM DISCOUNTS RATE LEGISLATIVE GRIDLOCK SUBMARKET RENT GROWTH PERCENT ABSORPTION EXPANSION PRICING PROPERTY AVERAGE BID ASK MAXIMIZE FOCUS HEADWINDS ROLLOVER POTENTIAL FUNDAMENTALS URBAN DEVELOPMENT INCOME NATIONWIDE STRENGTH PROJECTED FREDDIE MAC LOCAL EXCEEDING CONDOS FOR RENT INVESTOR TRENDS EMERGING GAINS RISK SLUMP DRIVERS ASSETS CASH FLOW RECESSION
COVER – 2011 NATIONAL APARTMENT RESEARCH REPORT: 16” X 10¾” (8” X 10¾” FOLDED); PMS 540 SPOT + C M Y K
Research Services:2398 E. Camelback RoadSuite 550Phoenix, AZ 85016(602) 687-6700
Offices Throughout the United States
www.MarcusMillichap.com
2011