Embed Size (px)
Citation preview

2011, in partnership with ourclients.
Annual Report
Change
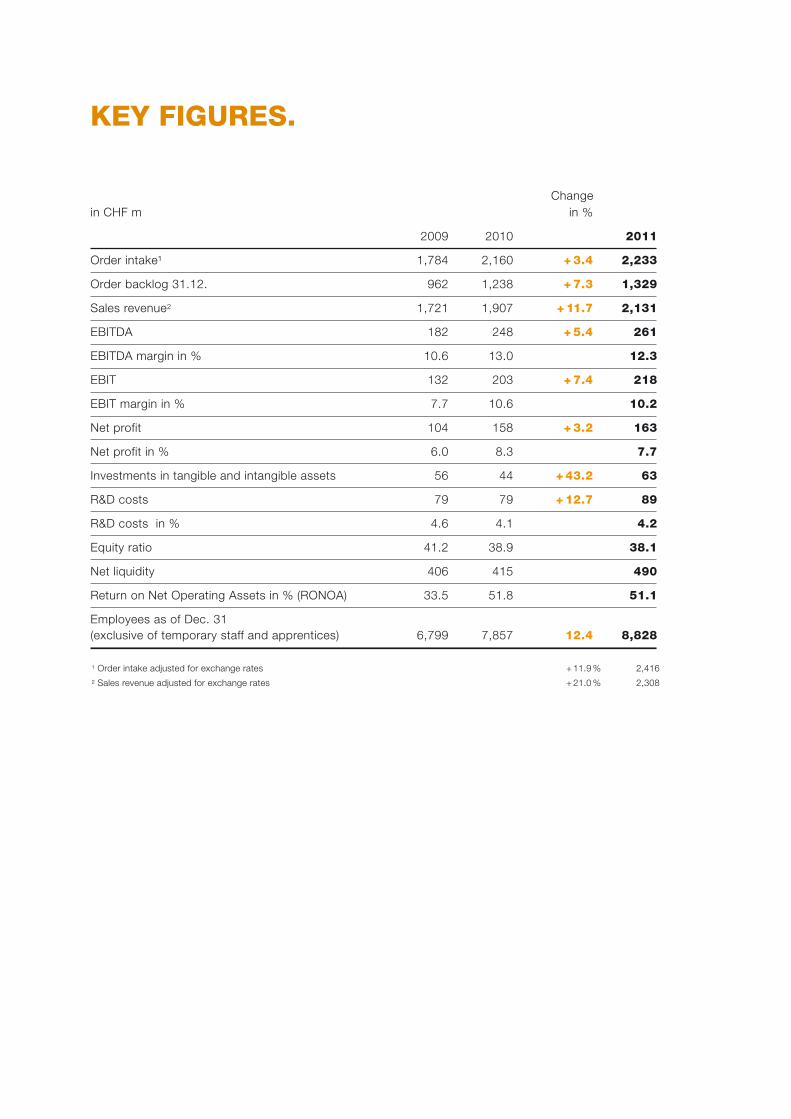
in CHF m in %
2009 2010 2011
Order intake¹ 1,784 2,160 + 3.4 2,233
Order backlog 31.12. 962 1,238 + 7.3 1,329
Sales revenue2 1,721 1,907 + 11.7 2,131
EBITDA 182 248 + 5.4 261
EBITDA margin in % 10.6 13.0 12.3
EBIT 132 203 + 7.4 218
EBIT margin in % 7.7 10.6 10.2
Net profit 104 158 + 3.2 163
Net profit in % 6.0 8.3 7.7
Investments in tangible and intangible assets 56 44 + 43.2 63
R&D costs 79 79 + 12.7 89
R&D costs in % 4.6 4.1 4.2
Equity ratio 41.2 38.9 38.1
Net liquidity 406 415 490
Return on Net Operating Assets in % (RONOA) 33.5 51.8 51.1
Employees as of Dec. 31
(exclusive of temporary staff and apprentices) 6,799 7,857 12.4 8,828
1 Order intake adjusted for exchange rates + 11.9 % 2,416
2 Sales revenue adjusted for exchange rates + 21.0 % 2,308
KEY FIGURES.
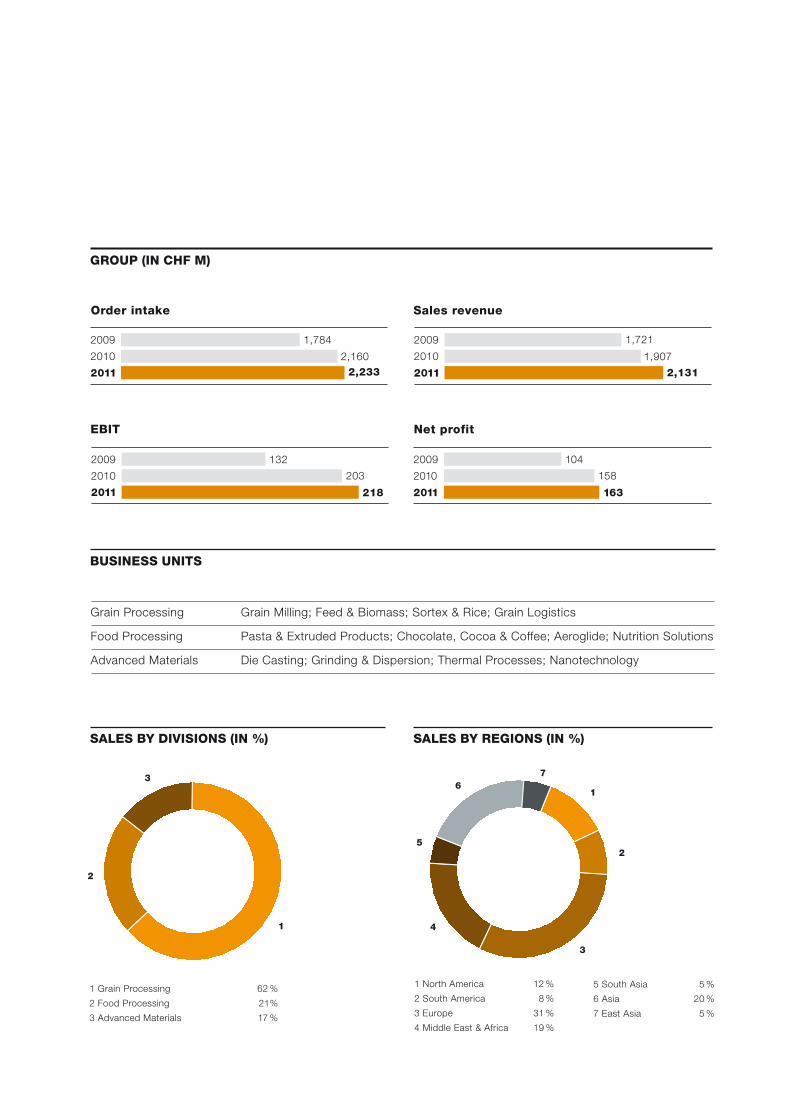
GROUP (IN CHF M)
Sales revenue
1,9072010
2,1312011
1,7212009
EBIT
203
218
132
2010
2011
2009
Order intake
2,160
2,233
1,784
2010
2011
2009
Net profit
158
163
104
2010
2011
2009
Grain Processing Grain Milling; Feed & Biomass; Sortex & Rice; Grain Logistics
Food Processing Pasta & Extruded Products; Chocolate, Cocoa & Coffee; Aeroglide; Nutrition Solutions
Advanced Materials Die Casting; Grinding & Dispersion; Thermal Processes; Nanotechnology
BUSINESS UNITS
SALES BY DIVISIONS (IN %)
1 Grain Processing 62 %
2 Food Processing 21%
3 Advanced Materials 17 %
SALES BY REGIONS (IN %)
1 North America 12 %
2 South America 8 %
3 Europe 31 %
4 Middle East & Africa 19 %
5 South Asia 5 %
6 Asia 20 %
7 East Asia 5 %
2
3
1
1
2
3
4
5
67


CORPORATE PROFILE.
Bühler is the specialist and technology partner for plant, equipment, and
services for processing foods and for manufacturing advanced materials.
The organization holds leading market positions worldwide in the
fields of technology as well as processes for transforming grain into flour
and animal feeds, producing pasta and chocolate, and manufacturing
die cast components.
The Group’s core technologies are in the areas of mechanical and thermal
process engineering. With its expertise and over 150 years of experience,
Bühler time and again rolls out unique and innovative solutions for its
customers, enabling their success in the marketplace. Over the decades,
Bühler has acquired a reputation as a reliable partner, thanks to its
declared commitment to quality and its global presence.
Bühler Group operates in over 140 countries, has a global payroll of
8,800, and generated sales (turnover) of CHF 2,131 million in fiscal 2011.
2 Bühler Annual Report 2011
4 Foreword, Chairman of the Board and CEO
8 Global Presence
10 Food Safety
14 Smart Processing
18 Energy Saving
22 Grain Processing
24 Nestlé, Nigeria
32 Food Processing
34 Läderach, Switzerland
42 Advanced Materials
44 Hongbang Die Casting, China
50 Human Resources
52 Substainability
54 Corporate Governance
55 Executive Board
56 Organization chart
58 Board of Directors
61 Financial report
62 Financial commentary
64 Financial report Bühler Group
103 Financial report Bühler Holding AG
CONTENT.
3Content.
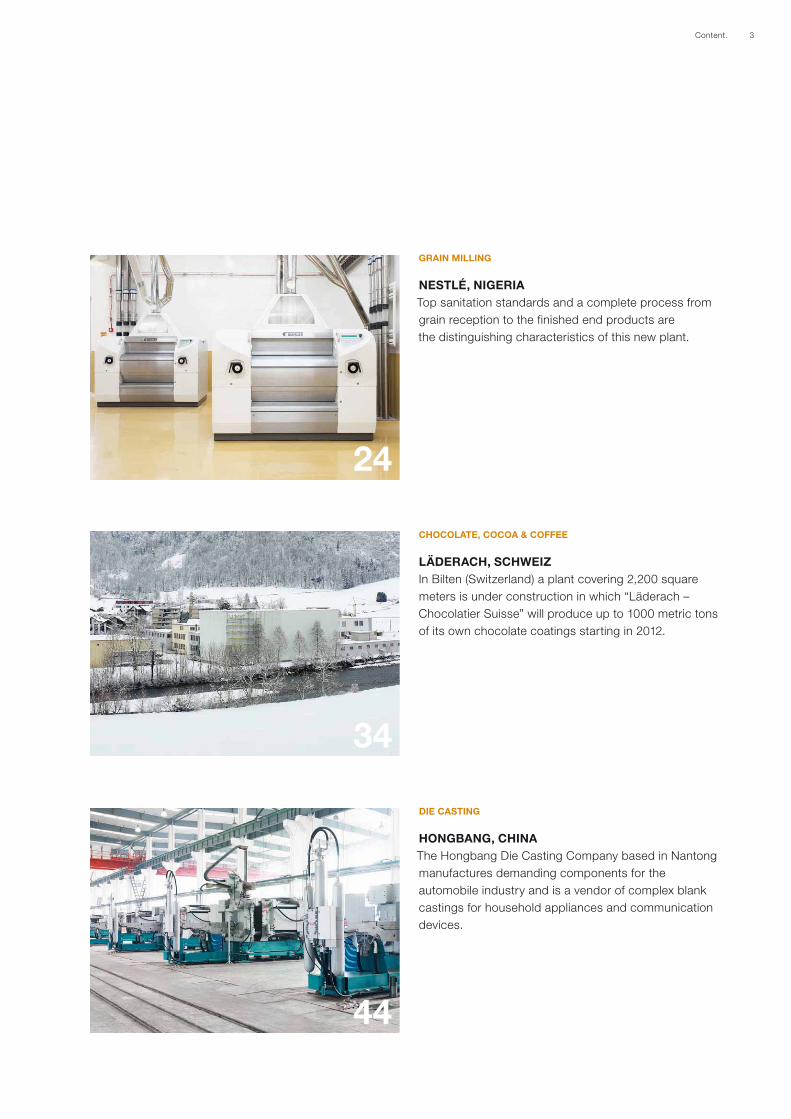
CHOCOLATE, COCOA & COFFEE
LÄDERACH, SCHWEIZ
In Bilten (Switzerland) a plant covering 2,200 square
meters is under construction in which “Läderach –
Chocolatier Suisse” will produce up to 1000 metric tons
of its own chocolate coatings starting in 2012.
DIE CASTING
HONGBANG, CHINA
The Hongbang Die Casting Company based in Nantong
manufactures demanding components for the
automobile industry and is a vendor of complex blank
castings for household appliances and communication
devices.
GRAIN MILLING
NESTLÉ, NIGERIA
Top sanitation standards and a complete process from
grain reception to the finished end products are
the distinguishing characteristics of this new plant.
34
24
44
4 Bühler Annual Report 2011
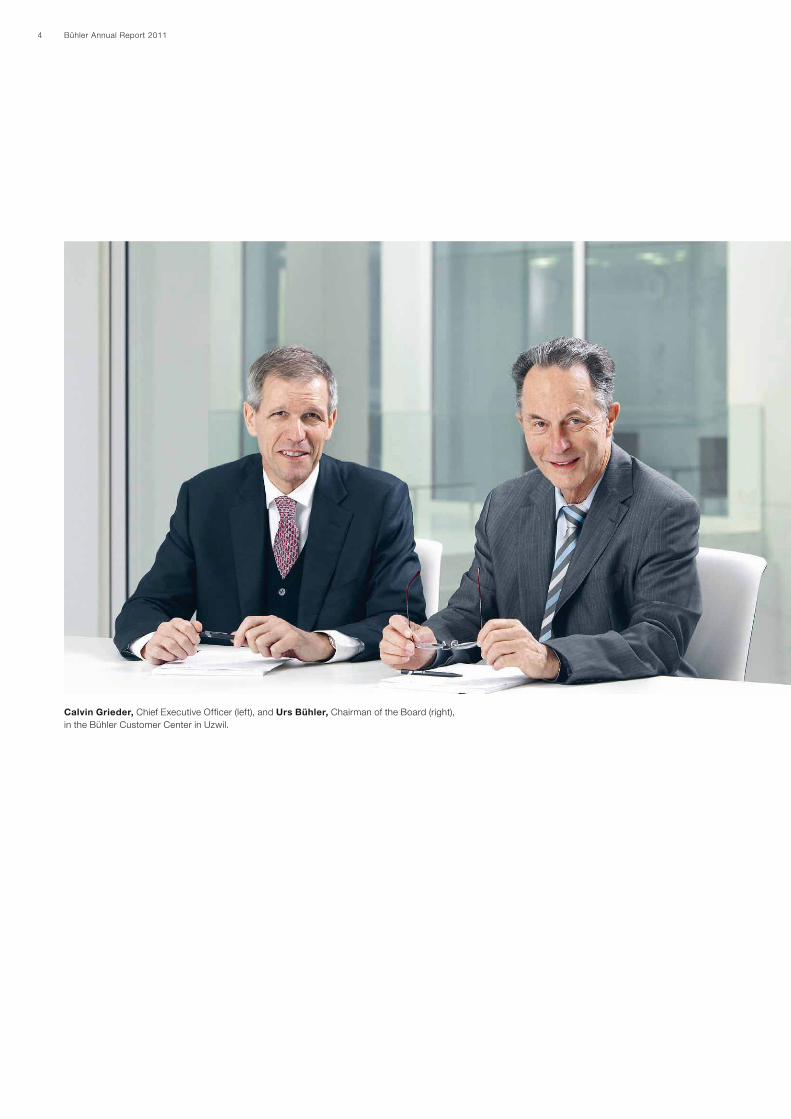
Calvin Grieder, Chief Executive Officer (left), and Urs Bühler, Chairman of the Board (right),
in the Bühler Customer Center in Uzwil.
5Foreword.
SUCCESSFUL YEAR IN AN ADVERSE ENVIRONMENT.
DEAR SIR, DEAR MADAM
Following the record results of the previous year, we were justified in starting fiscal 2011 with high
expectations. At that time, we could not have any idea that conditions in the year under review
would deteriorate substantially in various respects. The earthquake in Japan, the political upheavals
in the Middle East and in North Africa, and the exceptional appreciation of the Swiss franc all
had an impact on the development of our business. The fact that we held out against this adverse
environment and are now in a position to present very promising figures proves two things: On
the one hand that our efforts to enhance our efficiency are bearing fruit, and on the other hand that
our substantial capital investments in our global market presence and innovation over the past
years are paying off.
Sales for the first time exceed two billion Swiss francs.
With annual sales (turnover) in 2011 amounting to CHF 2,131 million or almost 12 % more than a year
ago, Bühler for the first time in its history passed the mark of two billion Swiss francs. Adjusted
for exchange rates, the increase was 21 %. Order intake rose by more than 3 % to CHF 2,233 million
and adjusted for exchange rates by 12 % in the year under review. The Grain Processing division
boosted its order intake by 11 %, and Advanced Materials even by 35 %. Only the Food Processing
division slipped slightly by 2 %.
The increase in orders received is primarily due to Asia and Europe. With a plus of 28 %, especially
China and Europe stand out with 21 %. In Europe, the acquisition of Schmidt-Seeger accounts
for about half of this growth. Europe and Asia are thus the main sales regions of Bühler, with shares
of about 30 % of total sales revenue each. The splitting of our product range into a Top-Line
for our demanding applications and a lower-cost Standard-Line contributed substantially to this
success.
All three divisions contributed to this considerable growth in sales. Grain Processing increased its
turnover by 8 %, Food Processing by 10 %, and Advanced Materials by even 28 %, driven by the
exceptional success of its Die Casting business unit (+50 %). The development of order intake is also
roughly reflected in geographical terms: Asia increased by 45 % (China alone plus 64 % thanks
to our strong local presence), South Asia by 16 %, Europe by 15 %, South America by 8 %, and the
Middle East including Africa by 3 %. On the other hand, declines were suffered in North America
due to the heavy exchange rate turbulence (–6 %) and East Asia as a result of the earthquake
(–13 %). The three strongest business units in terms of sales revenue – Grain Milling; Chocolate,
Cocoa & Coffee; and Feed & Biomass – together generated 53 % of total corporate sales.
Sustainable profitability.
The appreciation of the Swiss franc was a great challenge. We countered it by taking various
measures, including primarily price adjustments, intensified outsourcing of purchases to the euro
and dollar regions, an increase in weekly work hours in Switzerland, and a rise in productivity
in all divisions. In addition, project controlling was further optimized. With an EBIT margin of 10.2 %
(previous year 10.6 %), Bühler once again achieved a high operating margin in the double-digit
range despite the challenging environment. The corporate result of CHF 163 million exceeded the
value of a year ago by a little more than 3 %. Thus, profitability was again within our long-term
target bandwidth.
6 Bühler Annual Report 2011
In spite of substantial capital investments in additional production capacities, Bühler once again
generated a substantial operating cash flow of CHF 197.4 million. The balance sheet shows
high solidity also in the year under review. The net working capital remained at a low 15 % of sales,
and the equity ratio of 38.1 % was almost at the level of the previous year (38.9 %). The return
on net operating assets (RONOA) was maintained at the same high level of 51.1 %.
Continued optimization and strengthening at all fronts.
Regardless of the gloomier environment that prevailed in the year under review, we systematically
adhered to our strategic thrust. This is borne out, among other things, by the unchanged high
innovation rate. Spending on research and development throughout Bühler Group amounted to CHF
89 million or a respectable 4.2 sales percentage points. These funds were used for the new and
further development of products with a focus on nutrition, safe foods, and energy efficiency. Further-
more, we strengthened our local presence, one of Bühler’s most valuable assets, by adding five
more bases to our international service network. We are thus satisfying a proven market need, as
was demonstrated in a recent customer survey that we conducted. Also the marked increase in
capital spending on tangible assets by 43 % to CHF 63 million must be considered under this aspect.
These funds primarily flowed into additional production capacities in India, China, South Africa,
and Brazil.
With the acquisition of a production facility in the Czech Republic as of January 2012, we added to
our capacities in Eastern Europe. As for the site in Switzerland, a total of about CHF 70 million
have been earmarked for modernizing the factory at our headquarters during the years 2011 through
2015. This will create the basis required for the optimal implementation of “Total Synchro” – the
flow-manufacturing principle – which slashes handling distances and as a consequence cycle times
and disentangles the flow of goods. This project – a strategic undertaking of Bühler aimed at
achieving substantial and sustainable productivity increases – was launched locally four years ago
and extended in the year under review to all business units worldwide.
Sharp rise in headcount.
As in the years before, we continued our systematic and targeted employee development efforts also
in 2011. Our global payroll increased once again by almost 1,000 or a little more than 12 % to 8,830
employees. China accounted for half the increase, and the acquisition of Schmidt-Seeger for most
of the balance. Thus, in the past two years, we created over 1,500 additional jobs.
New member of the Board of Directors.
Effective December 15, 2011, Ms. Ruth Metzler was appointed as a new member of the Board of
Directors. In her capacity as an attorney at law and a federally certified auditor, she will add further
competencies in the fields of strategy, finance, and auditing to the supervisory body of Bühler.
Cautiously optimistic for 2012.
Our Group started the current fiscal year with a more than 7 % higher order backlog than at the
beginning of 2011, which provides a solid foundation. But in view of the uncertain economic
situation, we do not expect more than a moderate increase in volume.
7Foreword.
Also for 2012, we must assume that the macro-economic environment will be characterized by
continued volatility and many imponderables, for example in the field of exchange rates.
To these short-term factors, we must add long-term global challenges such as fiercer competition
for natural resources and, as a consequence, rising raw commodity prices. In the past years,
Bühler has proved that success is also possible in an adverse environment – thanks to continuous
product innovations and substantial capital investments in local market presence directed to
the outside and flexibilization of the organization and improvement of productivity to the inside.
We have thus laid excellent foundations that allow us to look forward with quite some confidence
beyond the short-term horizon.
Thanks.
Our success would never have been possible without our loyal and highly qualified workforce.
We therefore extend our warmest thanks to all our employees the world over for their tireless
and enormous dedication, which is carried by a high level of motivation. We thank our customers
and other business partners for their great trust in our organization and for their inspiring and
highly appreciated collaboration.
Urs Bühler
Chairman of the Board
Calvin Grieder
Chief Executive Officer
8 Bühler Annual Report 2011
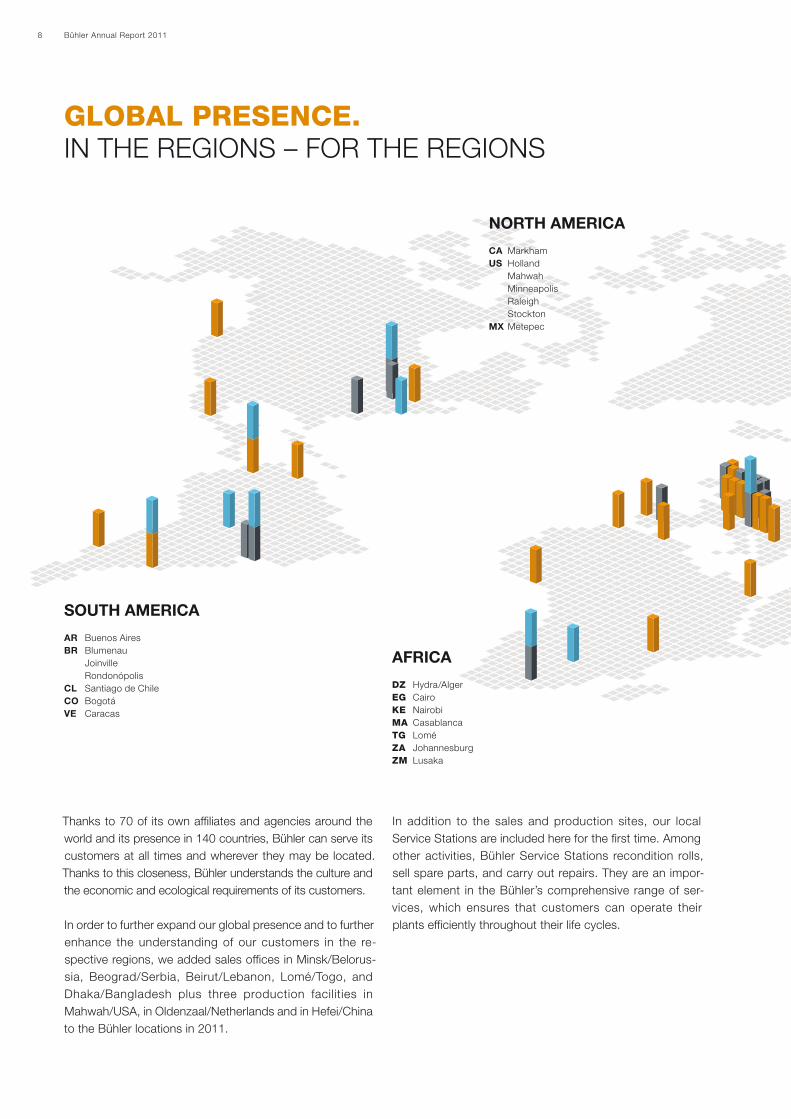
Thanks to 70 of its own affiliates and agencies around the
world and its presence in 140 countries, Bühler can serve its
customers at all times and wherever they may be located.
Thanks to this closeness, Bühler understands the culture and
the economic and ecological requirements of its customers.
In order to further expand our global presence and to further
enhance the understanding of our customers in the re-
spective regions, we added sales offices in Minsk/Belorus-
sia, Beograd/Serbia, Beirut/Lebanon, Lomé/Togo, and
Dhaka/Bangladesh plus three production facilities in
Mahwah/USA, in Oldenzaal/Netherlands and in Hefei/ China
to the Bühler locations in 2011.
In addition to the sales and production sites, our local
Service Stations are included here for the first time. Among
other activities, Bühler Service Stations recondition rolls,
sell spare parts, and carry out repairs. They are an impor-
tant element in the Bühler’s comprehensive range of ser-
vices, which ensures that customers can operate their
plants efficiently throughout their life cycles.
AFRICA DZ Hydra/Alger
EG Cairo
KE Nairobi
MA Casablanca
TG Lomé
ZA Johannesburg
ZM Lusaka
SOUTH AMERICA
AR Buenos Aires
BR Blumenau
Joinville
Rondonópolis
CL Santiago de Chile
CO Bogotá
VE Caracas
NORTH AMERICA
CA Markham
US Holland
Mahwah
Minneapolis
Raleigh
Stockton
MX Metepec
GLOBAL PRESENCE. IN THE REGIONS – FOR THE REGIONS
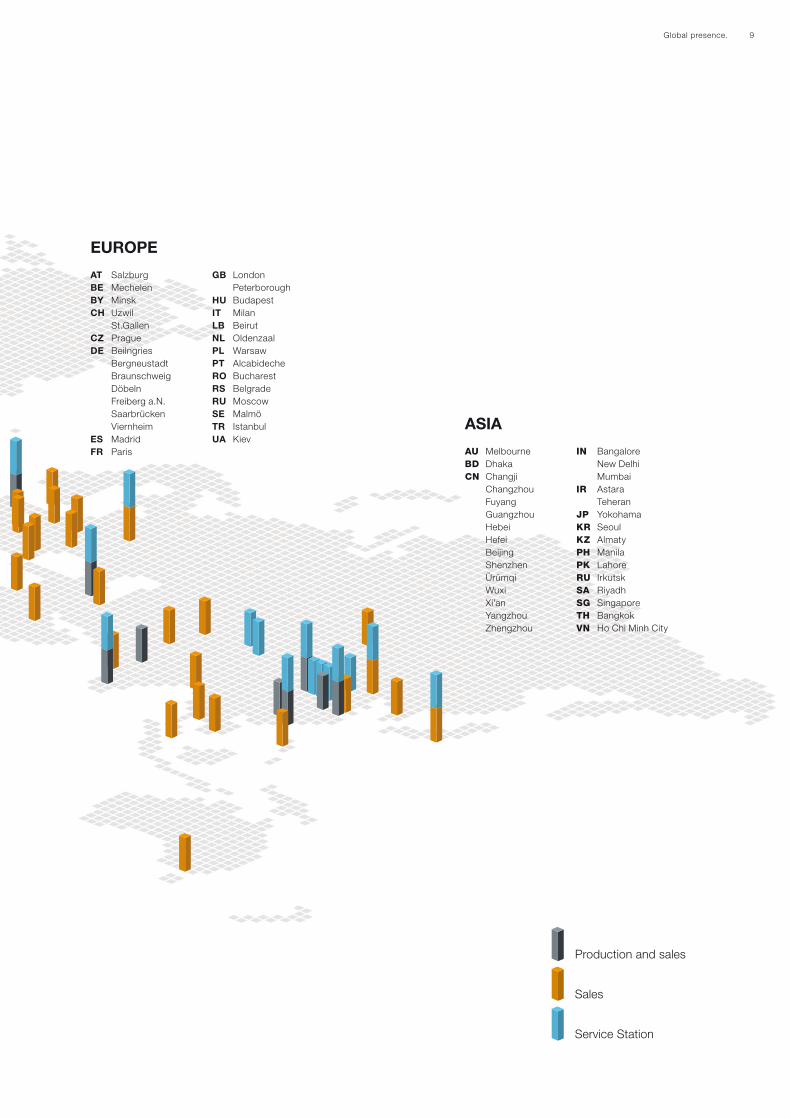
9Global presence.
ASIA AU Melbourne
BD Dhaka
CN Changji
Changzhou
Fuyang
Guangzhou
Hebei
Hefei
Beijing
Shenzhen
Ürümqi
Wuxi
Xi’an
Yangzhou
Zhengzhou
IN Bangalore
New Delhi
Mumbai
IR Astara
Teheran
JP Yokohama
KR Seoul
KZ Almaty
PH Manila
PK Lahore
RU Irkutsk
SA Riyadh
SG Singapore
TH Bangkok
VN Ho Chi Minh City
EUROPE
AT Salzburg
BE Mechelen
BY Minsk
CH Uzwil
St.Gallen
CZ Prague
DE Beilngries
Bergneustadt
Braunschweig
Döbeln
Freiberg a.N.
Saarbrücken
Viernheim
ES Madrid
FR Paris
GB London
Peterborough
HU Budapest
IT Milan
LB Beirut
NL Oldenzaal
PL Warsaw
PT Alcabideche
RO Bucharest
RS Belgrade
RU Moscow
SE Malmö
TR Istanbul
UA Kiev
Production and sales
Sales
Service Station
10 Bühler Annual Report 2011

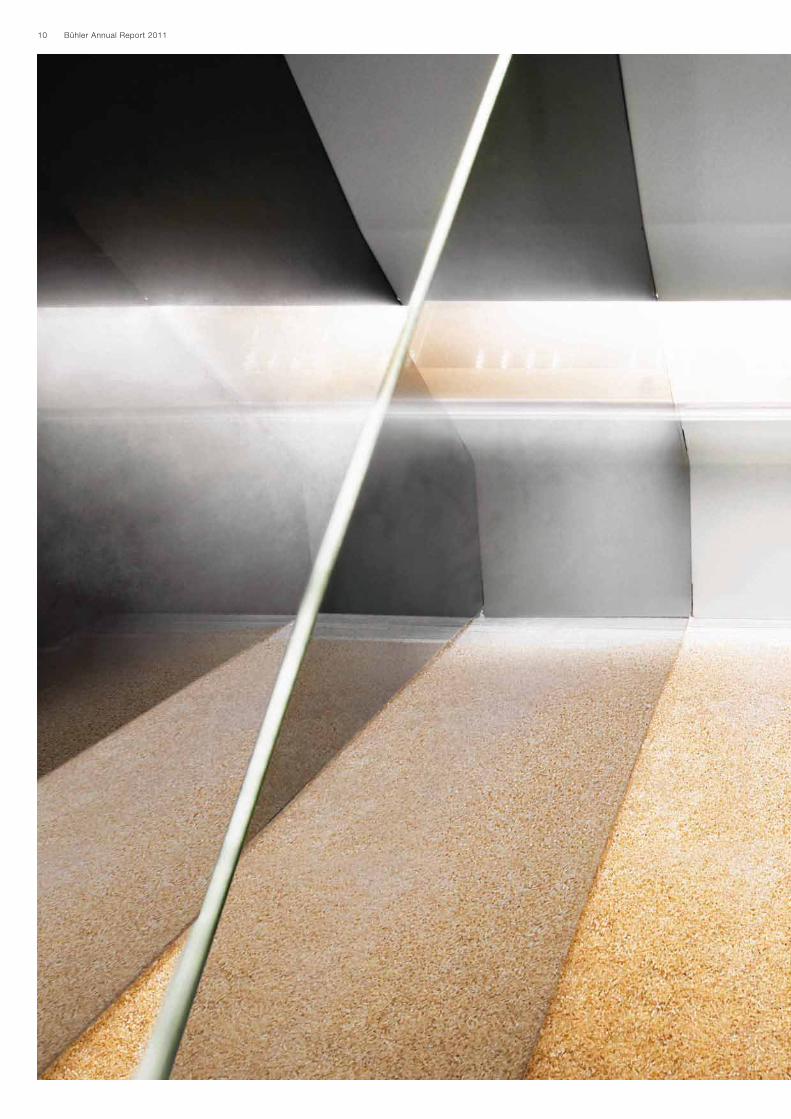
11Food Safety.
FOOD SAFETY.
For Bühler and its customers, food safety is essential. In
recent years, this topic has come under considerable public
scrutiny. Consumers want to know where their food comes
from and under which conditions it has been produced.
Our machines are designed in accordance with the most
exacting standards of food hygiene. Nevertheless, as a
market leader, Bühler collaborates with customers, research
institutes, and hygiene experts on continual improvement
of these standards.
Safe and ergonomic workplaces designed in cooperation
with specialists in food processing ensure hygienic
operations. Compliance with future safety standards entails
a stronger focus on validation methods for food production
processes.

MATCHING FOOD SAFETY AND EFFICIENCY.Kubex T allows clean profits.
Its efficiency and compact design would be enough to
make the Kubex T the pellet mill of choice for animal feed;
but its compliance with rigorous hygienic standards
gives it an edge in a contested market where the safety
of the feed is at a premium.
The hallmarks of the Kubex T’s direct drive system, which
does without gearbox or belts, are maximum energy
efficiency and even lower maintenance requirements.
A number of other sophisticated features make the
machine very easy to clean. Large sliding doors on each
side provide convenient access to the machine’s
interior for cleaning and maintenance. While in operation,
the power unit is slightly pressurized, which prevents
dust settlement. Hygienic design, both inside and outside,
further impedes settlement of product particles of any
kind. In addition, surfaces are heated to prevent conden-
sation.
This combination of efficiency and hygienic, easy-mainte-
nance design is another example of how operational
efficiency and food safety complement each other
in Bühler machines. The bottom line is a robust and
energy-efficient feed mill with an output of up to 80 metric
tons per hour. The Kubex T sets new benchmarks.
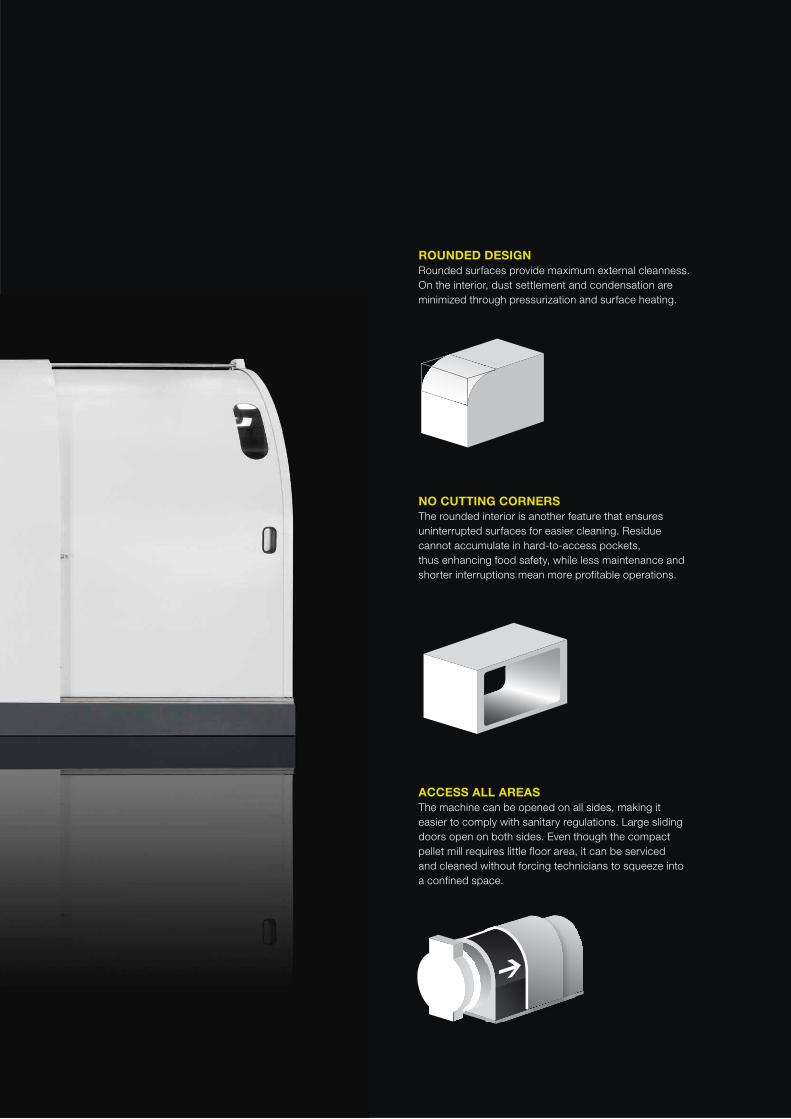
ROUNDED DESIGN
Rounded surfaces provide maximum external cleanness.
On the interior, dust settlement and condensation are
minimized through pressurization and surface heating.
NO CUTTING CORNERS
The rounded interior is another feature that ensures
uninterrupted surfaces for easier cleaning. Residue
cannot accumulate in hard-to-access pockets,
thus enhancing food safety, while less maintenance and
shorter interruptions mean more profitable operations.
ACCESS ALL AREAS
The machine can be opened on all sides, making it
easier to comply with sanitary regulations. Large sliding
doors open on both sides. Even though the compact
pellet mill requires little floor area, it can be serviced
and cleaned without forcing technicians to squeeze into
a confined space.

14 Bühler Annual Report 2011
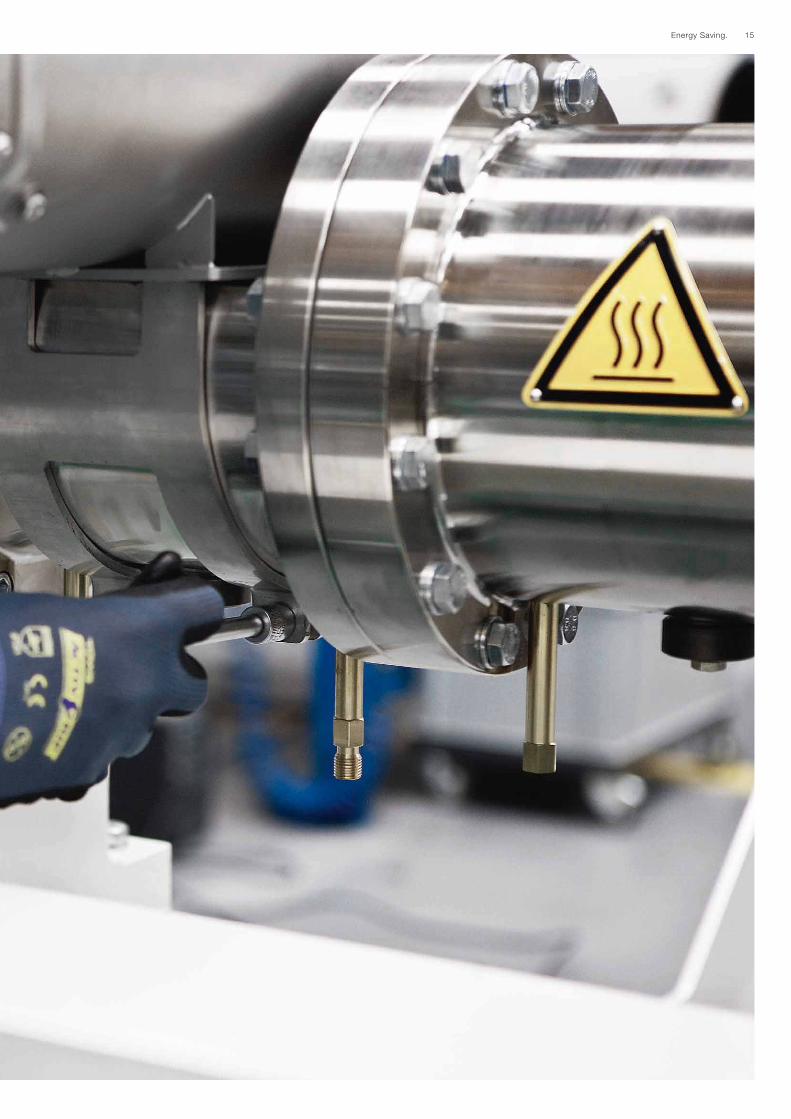
ENERGY SAVING.
Bühler continuously offers its clients the most sophisticated
and efficient solutions. This also holds true for energy
consumption and optimized processes. In order to give them
an economic as well as ecological advantage, we’re taking
a very close look at the energy balance. Bühler’s energy
management system meticulously records all consumption
data. For our clients, detailed analysis will highlight possible
steps for economization. Being able to precisely record
cost accounting leads to a more conscious use of energy.
Our innovative technologies and experience flow into every
Bühler-equipped machine.
15Energy Saving.
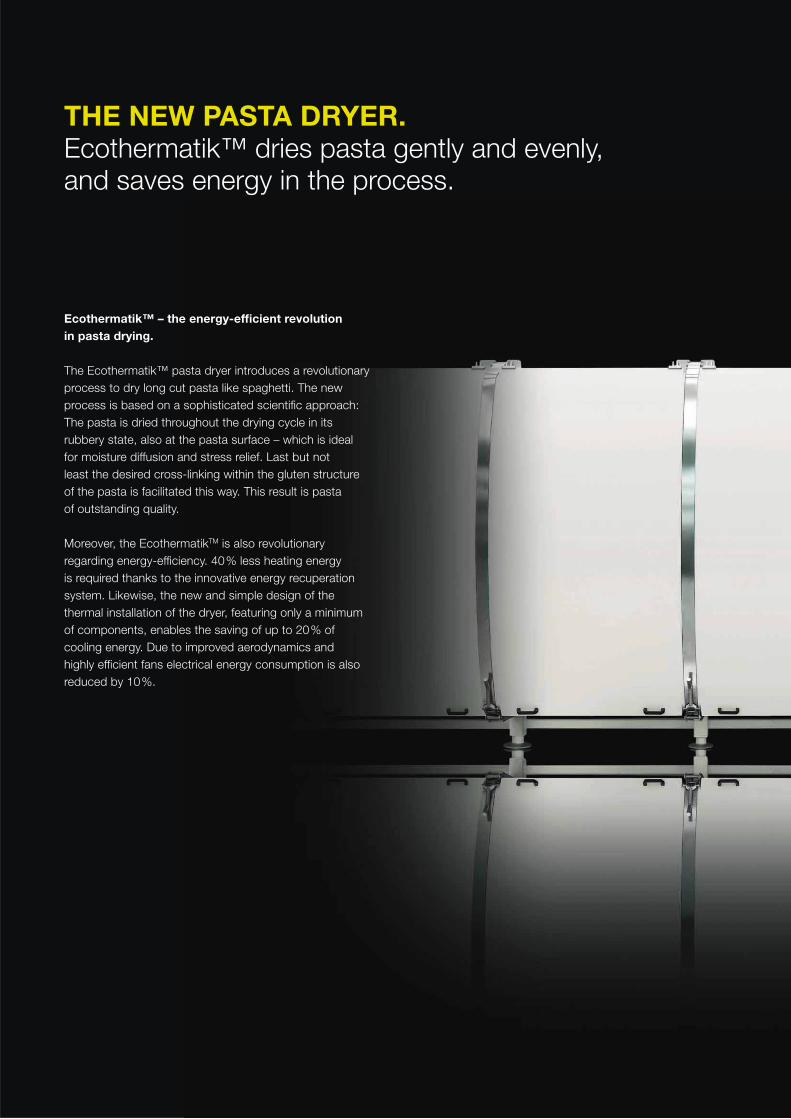
Ecothermatik™ – the energy-efficient revolution
in pasta drying.
The Ecothermatik™ pasta dryer introduces a revolutionary
process to dry long cut pasta like spaghetti. The new
process is based on a sophisticated scientific approach:
The pasta is dried throughout the drying cycle in its
rubbery state, also at the pasta surface – which is ideal
for moisture diffusion and stress relief. Last but not
least the desired cross-linking within the gluten structure
of the pasta is facilitated this way. This result is pasta
of outstanding quality.
Moreover, the EcothermatikTM is also revolutionary
regarding energy-efficiency. 40 % less heating energy
is required thanks to the innovative energy recuperation
system. Likewise, the new and simple design of the
thermal installation of the dryer, featuring only a minimum
of components, enables the saving of up to 20 % of
cooling energy. Due to improved aerodynamics and
highly efficient fans electrical energy consumption is also
reduced by 10 %.
THE NEW PASTA DRYER.Ecothermatik™ dries pasta gently and evenly, and saves energy in the process.
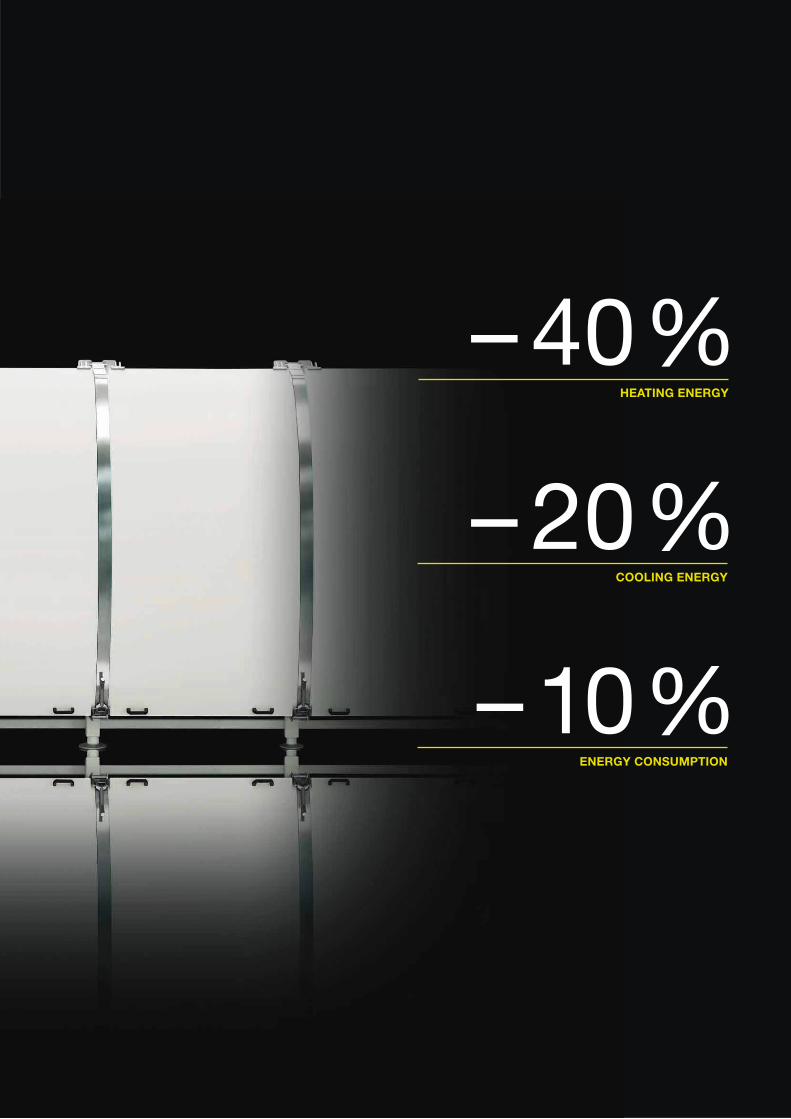
– 40%HEATING ENERGY
– 10%ENERGY CONSUMPTION
– 20%COOLING ENERGY
18 Bühler Annual Report 2011
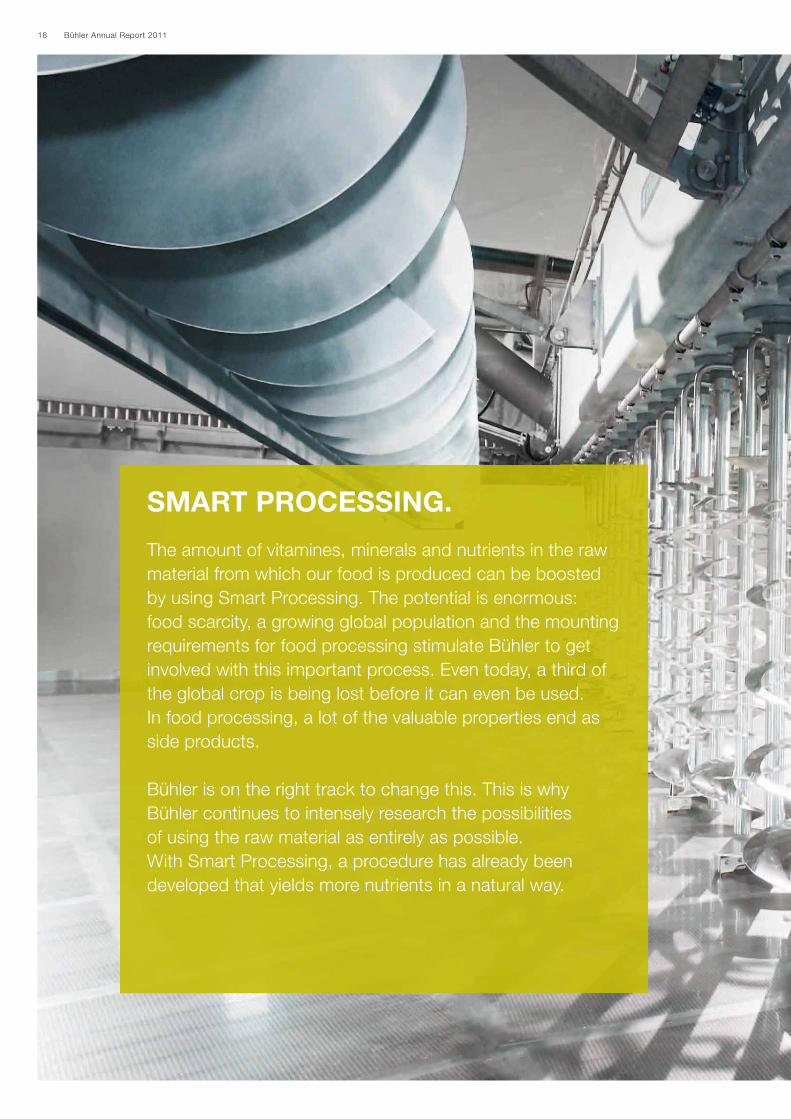
SMART PROCESSING.
The amount of vitamines, minerals and nutrients in the raw
material from which our food is produced can be boosted
by using Smart Processing. The potential is enormous:
food scarcity, a growing global population and the mounting
requirements for food processing stimulate Bühler to get
involved with this important process. Even today, a third of
the global crop is being lost before it can even be used.
In food processing, a lot of the valuable properties end as
side products.
Bühler is on the right track to change this. This is why
Bühler continues to intensely research the possibilities
of using the raw material as entirely as possible.
With Smart Processing, a procedure has already been
developed that yields more nutrients in a natural way.
19Smart Processing.
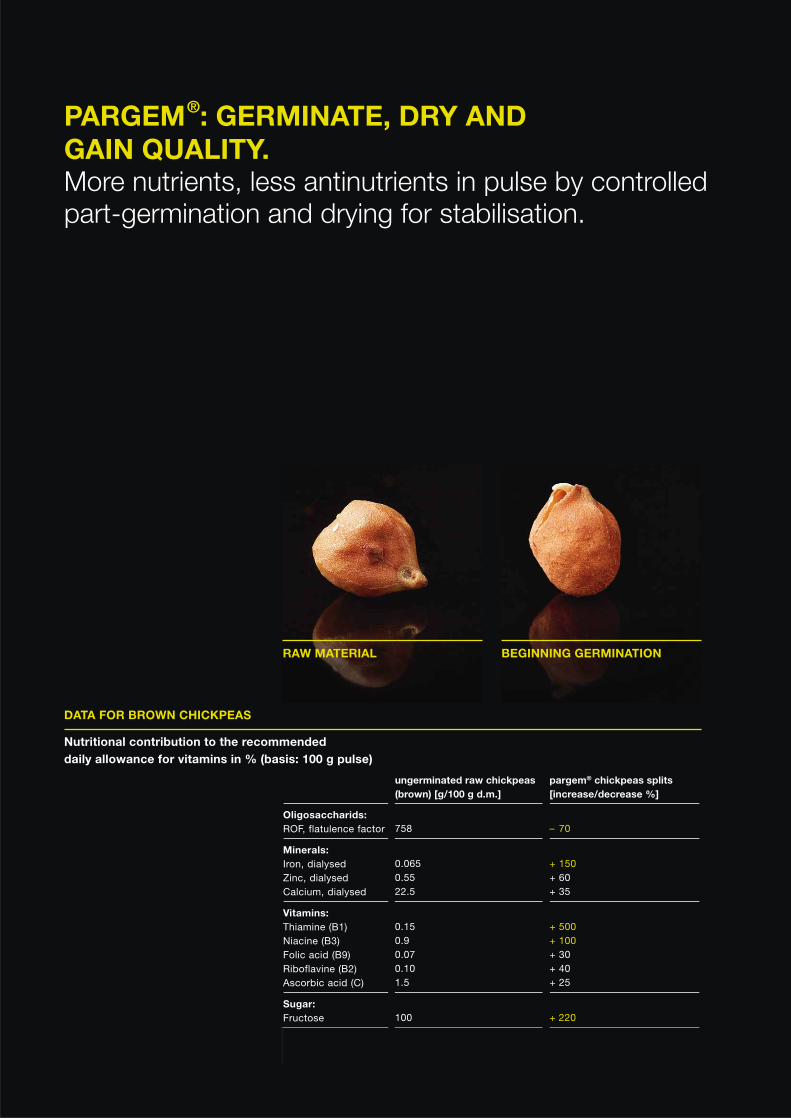
Nutritional contribution to the recommended
daily allowance for vitamins in % (basis: 100 g pulse)
DATA FOR BROWN CHICKPEAS
BEGINNING GERMINATIONRAW MATERIAL
PARGEM®: GERMINATE, DRY AND
GAIN QUALITY.More nutrients, less antinutrients in pulse by controlled part-germination and drying for stabilisation.
ungerminated raw chickpeas
(brown) [g/100 g d.m.]
pargem® chickpeas splits
[increase/decrease %]
Oligosaccharids:
ROF, flatulence factor 758 – 70
Minerals:
Iron, dialysed
Zinc, dialysed
Calcium, dialysed
0.065
0.55
22.5
+ 150
+ 60
+ 35
Vitamins:
Thiamine (B1)
Niacine (B3)
Folic acid (B9)
Riboflavine (B2)
Ascorbic acid (C)
0.15
0.9
0.07
0.10
1.5
+ 500
+ 100
+ 30
+ 40
+ 25
Sugar:
Fructose 100 + 220
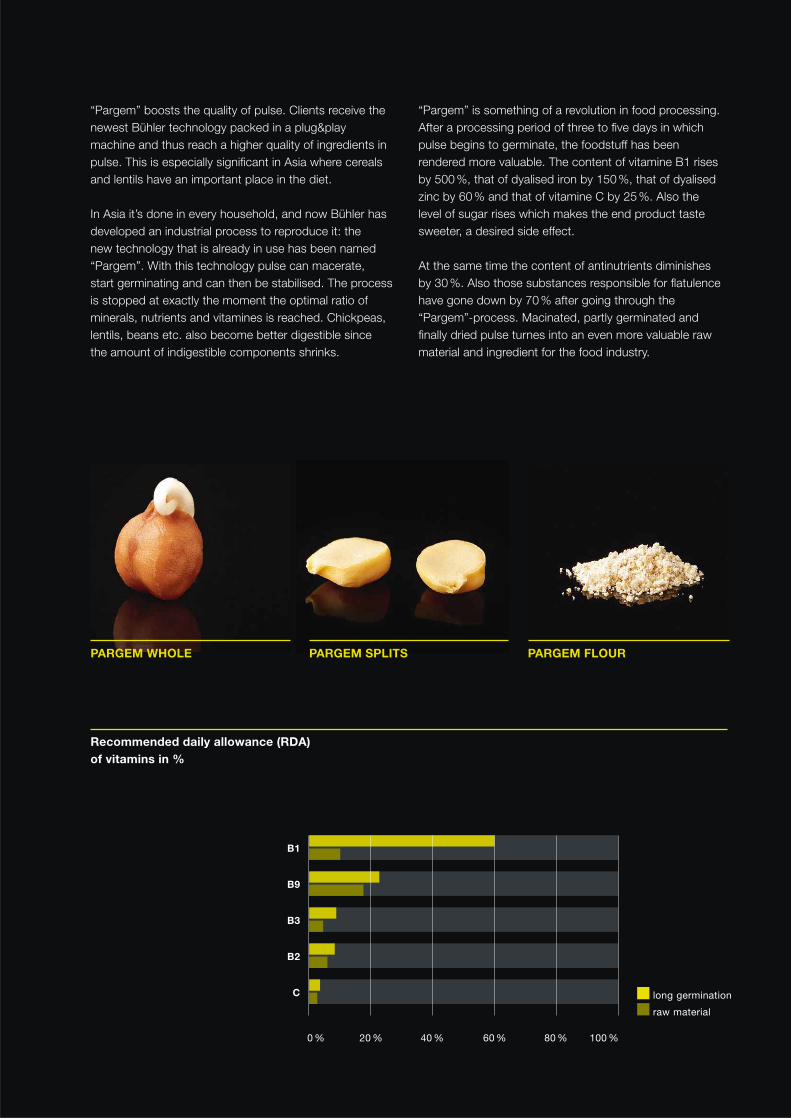
Recommended daily allowance (RDA)
of vitamins in %
PARGEM WHOLE PARGEM SPLITS PARGEM FLOUR
“Pargem” boosts the quality of pulse. Clients receive the
newest Bühler technology packed in a plug&play
machine and thus reach a higher quality of ingredients in
pulse. This is especially significant in Asia where cereals
and lentils have an important place in the diet.
In Asia it’s done in every household, and now Bühler has
developed an industrial process to reproduce it: the
new technology that is already in use has been named
“Pargem”. With this technology pulse can macerate,
start germinating and can then be stabilised. The process
is stopped at exactly the moment the optimal ratio of
minerals, nutrients and vitamines is reached. Chickpeas,
lentils, beans etc. also become better digestible since
the amount of indigestible components shrinks.
“Pargem” is something of a revolution in food processing.
After a processing period of three to five days in which
pulse begins to germinate, the foodstuff has been
rendered more valuable. The content of vitamine B1 rises
by 500 %, that of dyalised iron by 150 %, that of dyalised
zinc by 60 % and that of vitamine C by 25 %. Also the
level of sugar rises which makes the end product taste
sweeter, a desired side effect.
At the same time the content of antinutrients diminishes
by 30 %. Also those substances responsible for flatulence
have gone down by 70 % after going through the
“Pargem”-process. Macinated, partly germinated and
finally dried pulse turnes into an even more valuable raw
material and ingredient for the food industry.
long germination
raw material
0 % 20 % 40 % 60 % 80 % 100 %
B1
B9
B3
B2
C
22 Bühler Annual Report 2011
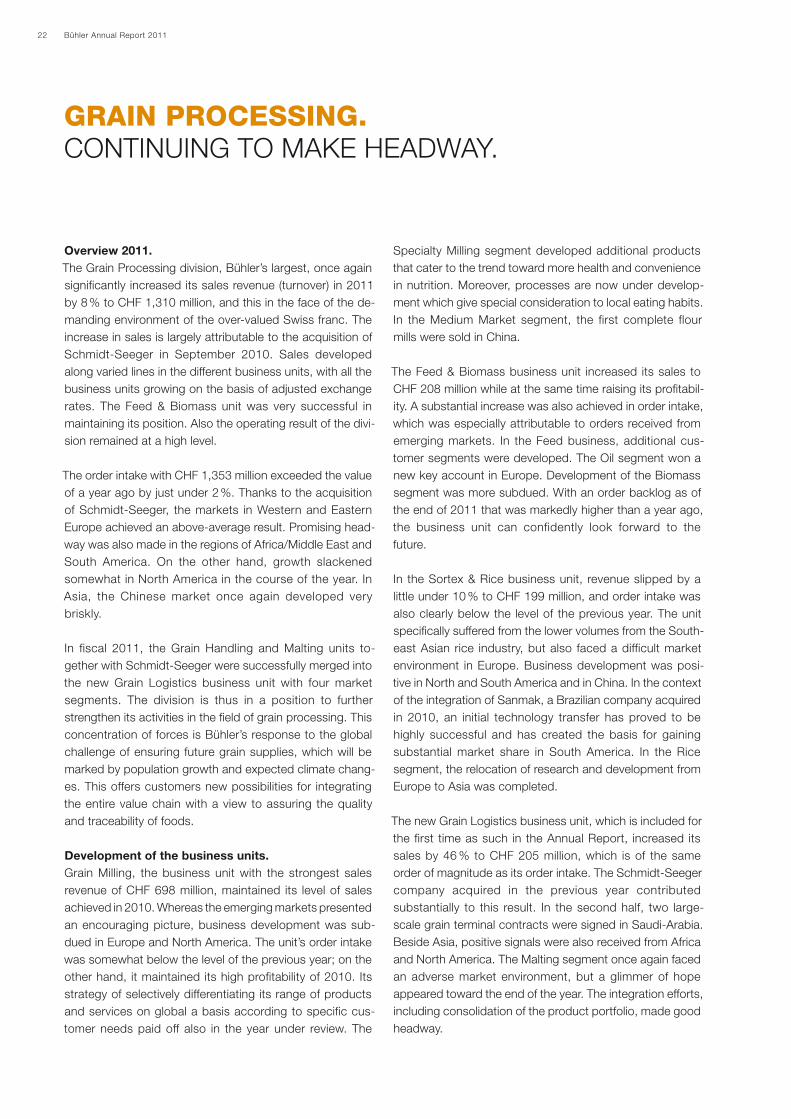
GRAIN PROCESSING. CONTINUING TO MAKE HEADWAY.
Overview 2011.
The Grain Processing division, Bühler’s largest, once again
significantly increased its sales revenue (turnover) in 2011
by 8 % to CHF 1,310 million, and this in the face of the de-
manding environment of the over-valued Swiss franc. The
increase in sales is largely attributable to the acquisition of
Schmidt-Seeger in September 2010. Sales developed
along varied lines in the different business units, with all the
business units growing on the basis of adjusted exchange
rates. The Feed & Biomass unit was very successful in
maintaining its position. Also the operating result of the divi-
sion remained at a high level.
The order intake with CHF 1,353 million exceeded the value
of a year ago by just under 2 %. Thanks to the acquisition
of Schmidt-Seeger, the markets in Western and Eastern
Europe achieved an above-average result. Promising head-
way was also made in the regions of Africa/Middle East and
South America. On the other hand, growth slackened
somewhat in North America in the course of the year. In
Asia, the Chinese market once again developed very
briskly.
In fiscal 2011, the Grain Handling and Malting units to-
gether with Schmidt-Seeger were successfully merged into
the new Grain Logistics business unit with four market
segments. The division is thus in a position to further
strengthen its activities in the field of grain processing. This
concentration of forces is Bühler’s response to the global
challenge of ensuring future grain supplies, which will be
marked by population growth and expected climate chang-
es. This offers customers new possibilities for integrating
the entire value chain with a view to assuring the quality
and traceability of foods.
Development of the business units.
Grain Milling, the business unit with the strongest sales
revenue of CHF 698 million, maintained its level of sales
achieved in 2010. Whereas the emerging markets presented
an encouraging picture, business development was sub-
dued in Europe and North America. The unit’s order intake
was somewhat below the level of the previous year; on the
other hand, it maintained its high profitability of 2010. Its
strategy of selectively differentiating its range of products
and services on global a basis according to specific cus-
tomer needs paid off also in the year under review. The
Specialty Milling segment developed additional products
that cater to the trend toward more health and convenience
in nutrition. Moreover, processes are now under develop-
ment which give special consideration to local eating habits.
In the Medium Market segment, the first complete flour
mills were sold in China.
The Feed & Biomass business unit increased its sales to
CHF 208 million while at the same time raising its profitabil-
ity. A substantial increase was also achieved in order intake,
which was especially attributable to orders received from
emerging markets. In the Feed business, additional cus-
tomer segments were developed. The Oil segment won a
new key account in Europe. Development of the Biomass
segment was more subdued. With an order backlog as of
the end of 2011 that was markedly higher than a year ago,
the business unit can confidently look forward to the
future.
In the Sortex & Rice business unit, revenue slipped by a
little under 10 % to CHF 199 million, and order intake was
also clearly below the level of the previous year. The unit
specifically suffered from the lower volumes from the South-
east Asian rice industry, but also faced a difficult market
environment in Europe. Business development was posi-
tive in North and South America and in China. In the context
of the integration of Sanmak, a Brazilian company acquired
in 2010, an initial technology transfer has proved to be
highly successful and has created the basis for gaining
substantial market share in South America. In the Rice
segment, the relocation of research and development from
Europe to Asia was completed.
The new Grain Logistics business unit, which is included for
the first time as such in the Annual Report, increased its
sales by 46 % to CHF 205 million, which is of the same
order of magnitude as its order intake. The Schmidt-Seeger
company acquired in the previous year contributed
substantially to this result. In the second half, two large-
scale grain terminal contracts were signed in Saudi-Arabia.
Beside Asia, positive signals were also received from Africa
and North America. The Malting segment once again faced
an adverse market environment, but a glimmer of hope
appeared toward the end of the year. The integration efforts,
including consolidation of the product portfolio, made good
headway.
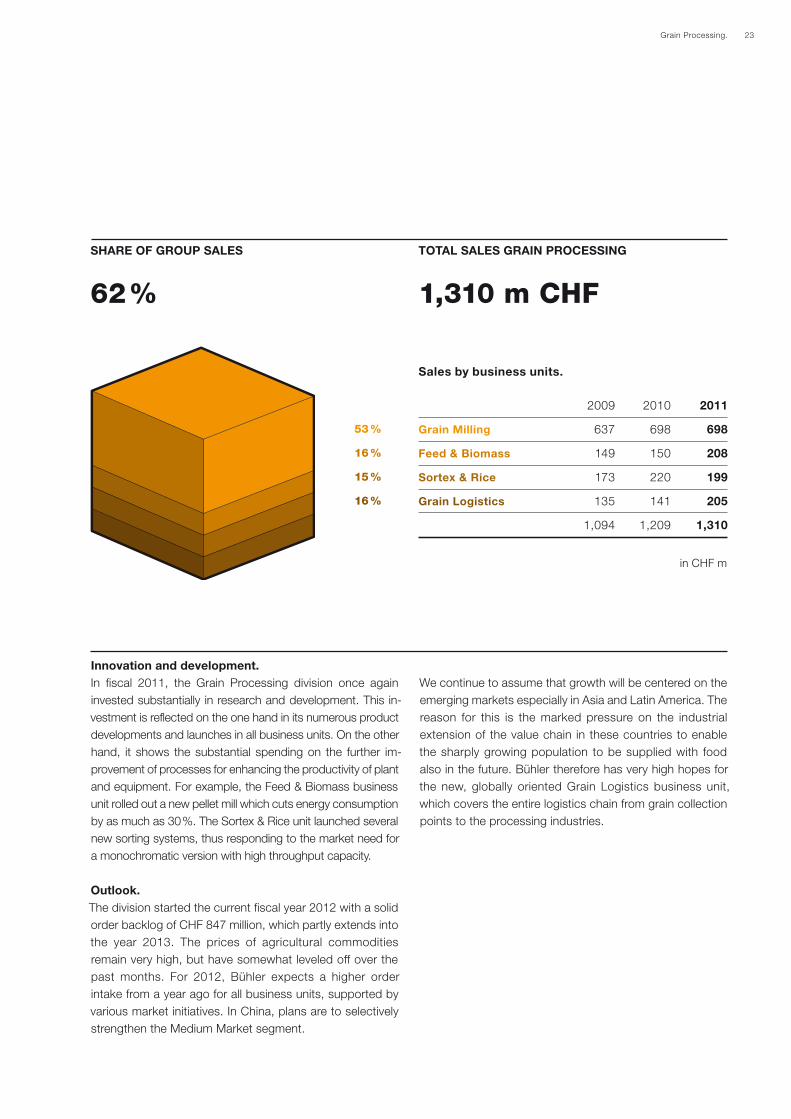
23Grain Processing.
2009 2010 2011
Grain Milling 637 698 698
Feed & Biomass 149 150 208
Sortex & Rice 173 220 199
Grain Logistics 135 141 205
1,094 1,209 1,310
53 %
16 %
15 %
16 %
1,310 m CHF62 %
SHARE OF GROUP SALES TOTAL SALES GRAIN PROCESSING
Innovation and development.
In fiscal 2011, the Grain Processing division once again
invested substantially in research and development. This in-
vestment is reflected on the one hand in its numerous product
developments and launches in all business units. On the other
hand, it shows the substantial spending on the further im-
provement of processes for enhancing the productivity of plant
and equipment. For example, the Feed & Biomass business
unit rolled out a new pellet mill which cuts energy consumption
by as much as 30 %. The Sortex & Rice unit launched several
new sorting systems, thus responding to the market need for
a monochromatic version with high throughput capacity.
Outlook.
The division started the current fiscal year 2012 with a solid
order backlog of CHF 847 million, which partly extends into
the year 2013. The prices of agricultural commodities
remain very high, but have somewhat leveled off over the
past months. For 2012, Bühler expects a higher order
intake from a year ago for all business units, supported by
various market initiatives. In China, plans are to selectively
strengthen the Medium Market segment.
We continue to assume that growth will be centered on the
emerging markets especially in Asia and Latin America. The
reason for this is the marked pressure on the industrial
extension of the value chain in these countries to enable
the sharply growing population to be supplied with food
also in the future. Bühler therefore has very high hopes for
the new, globally oriented Grain Logistics business unit,
which covers the entire logistics chain from grain collection
points to the processing industries.
in CHF m
Sales by business units.
24
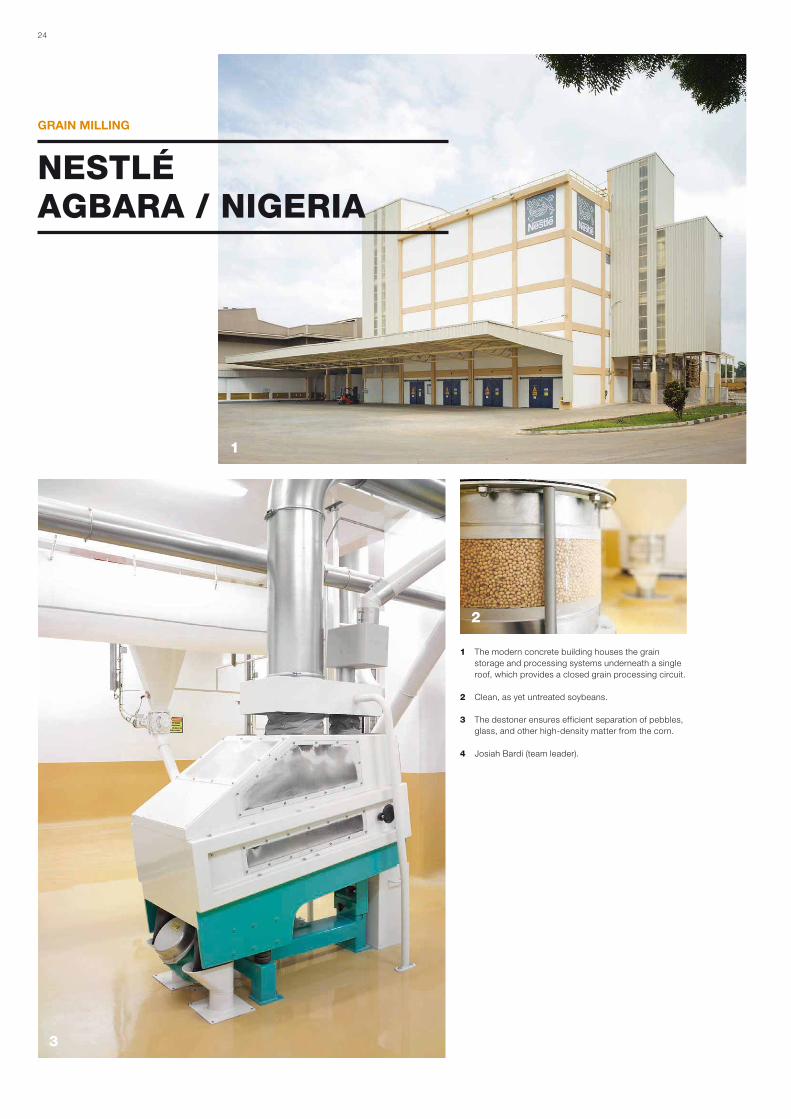
NESTLÉ AGBARA / NIGERIA
GRAIN MILLING
1 The modern concrete building houses the grain
storage and processing systems underneath a single
roof, which provides a closed grain processing circuit.
2 Clean, as yet untreated soybeans.
3 The destoner ensures efficient separation of pebbles,
glass, and other high-density matter from the corn.
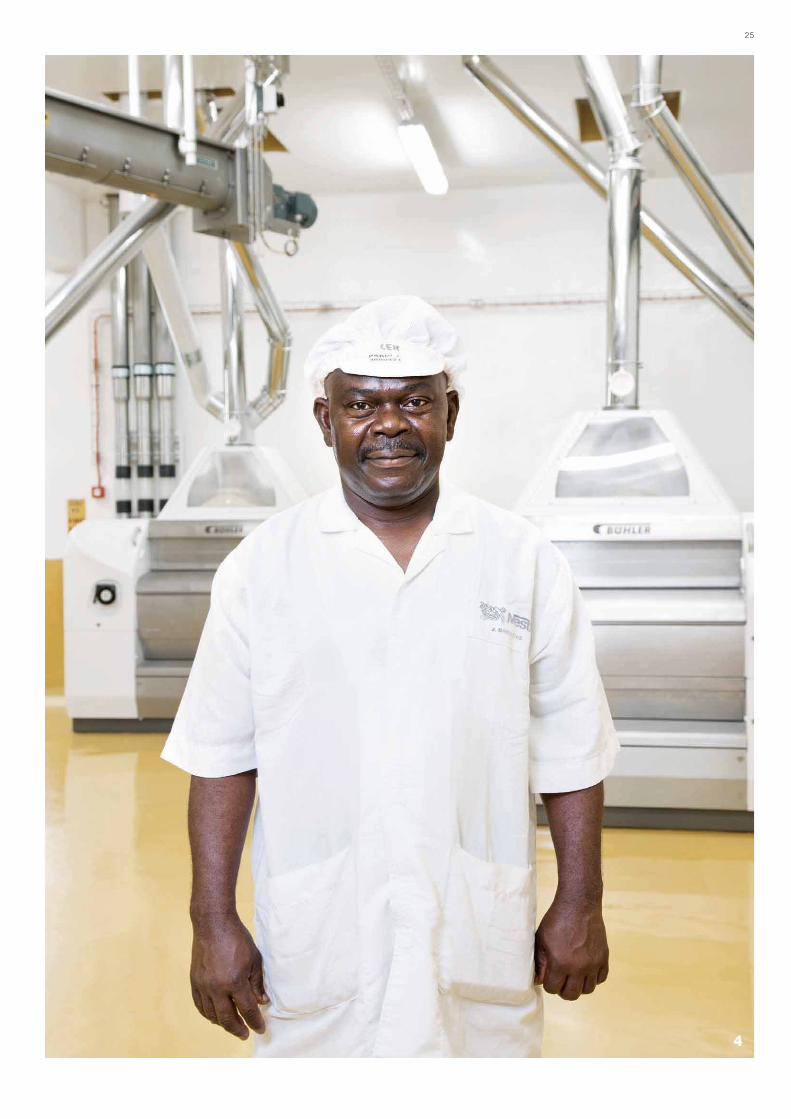
4 Josiah Bardi (team leader).
1
2
3
25
4
26
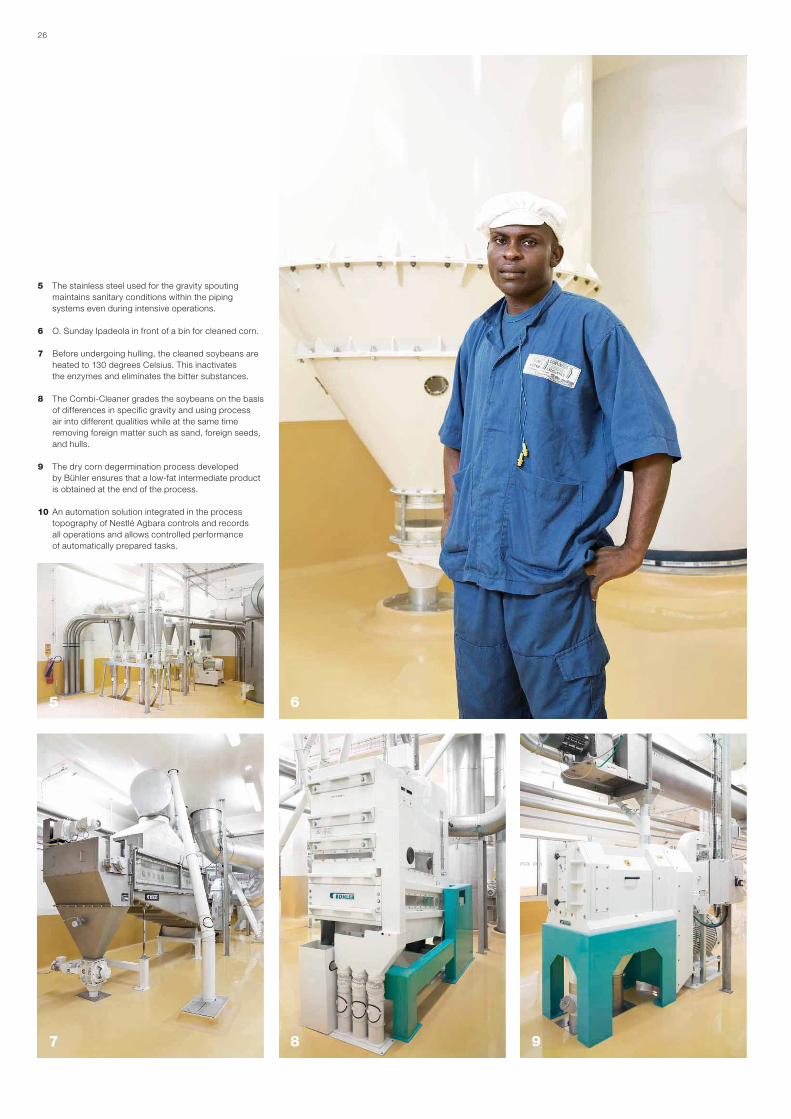
5 The stainless steel used for the gravity spouting
maintains sanitary conditions within the piping
systems even during intensive operations.
6 O. Sunday Ipadeola in front of a bin for cleaned corn.
7 Before undergoing hulling, the cleaned soybeans are
heated to 130 degrees Celsius. This inactivates
the enzymes and eliminates the bitter substances.
8 The Combi-Cleaner grades the soybeans on the basis
of differences in specific gravity and using process
air into different qualities while at the same time
removing foreign matter such as sand, foreign seeds,
and hulls.
9 The dry corn degermination process developed
by Bühler ensures that a low-fat intermediate product
is obtained at the end of the process.
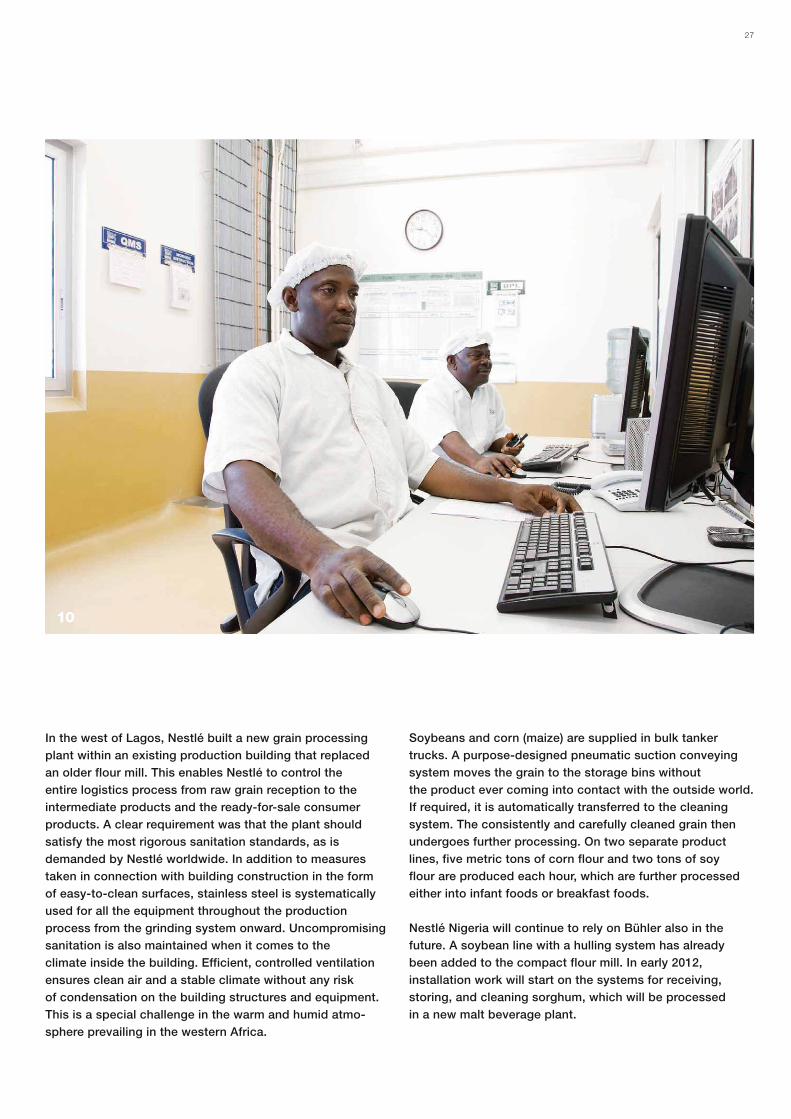
10 An automation solution integrated in the process
topography of Nestlé Agbara controls and records
all operations and allows controlled performance
of automatically prepared tasks.
5 6
7 8 9
27
In the west of Lagos, Nestlé built a new grain processing
plant within an existing production building that replaced
an older flour mill. This enables Nestlé to control the
entire logistics process from raw grain reception to the
intermediate products and the ready-for-sale consumer
products. A clear requirement was that the plant should
satisfy the most rigorous sanitation standards, as is
demanded by Nestlé worldwide. In addition to measures
taken in connection with building construction in the form
of easy-to-clean surfaces, stainless steel is systematically
used for all the equipment throughout the production
process from the grinding system onward. Uncompromising
sanitation is also maintained when it comes to the
climate inside the building. Efficient, controlled ventilation
ensures clean air and a stable climate without any risk
of condensation on the building structures and equipment.
This is a special challenge in the warm and humid atmo-
sphere prevailing in the western Africa.
Soybeans and corn (maize) are supplied in bulk tanker
trucks. A purpose-designed pneumatic suction conveying
system moves the grain to the storage bins without
the product ever coming into contact with the outside world.
If required, it is automatically transferred to the cleaning
system. The consistently and carefully cleaned grain then
undergoes further processing. On two separate product
lines, five metric tons of corn flour and two tons of soy
flour are produced each hour, which are further processed
either into infant foods or breakfast foods.
Nestlé Nigeria will continue to rely on Bühler also in the
future. A soybean line with a hulling system has already
been added to the compact flour mill. In early 2012,
installation work will start on the systems for receiving,
storing, and cleaning sorghum, which will be processed
in a new malt beverage plant.
10
28
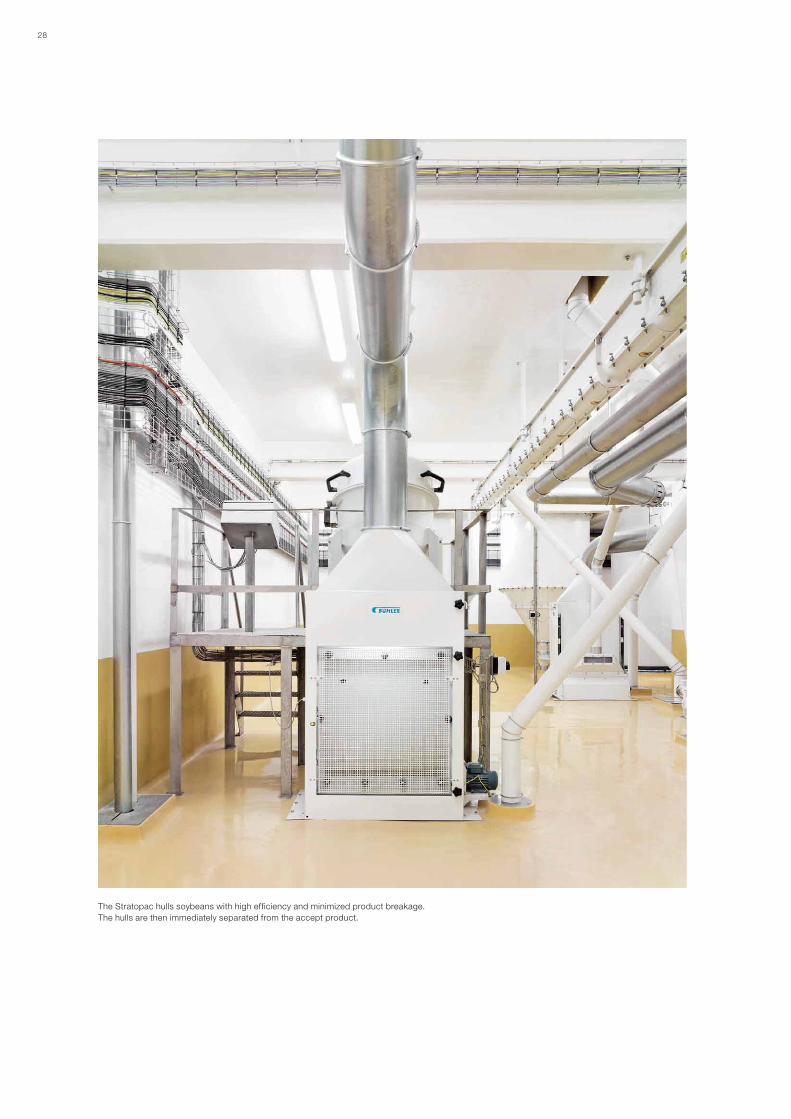
The Stratopac hulls soybeans with high efficiency and minimized product breakage.
The hulls are then immediately separated from the accept product.
29
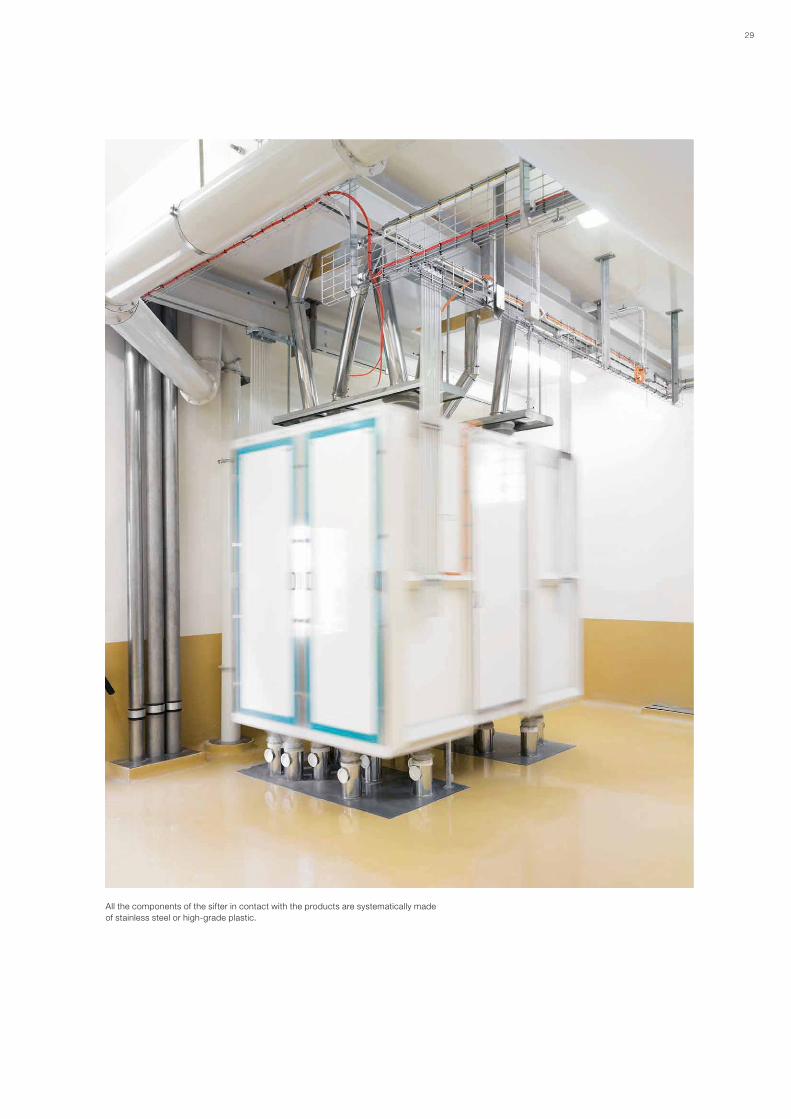
All the components of the sifter in contact with the products are systematically made
of stainless steel or high-grade plastic.
30
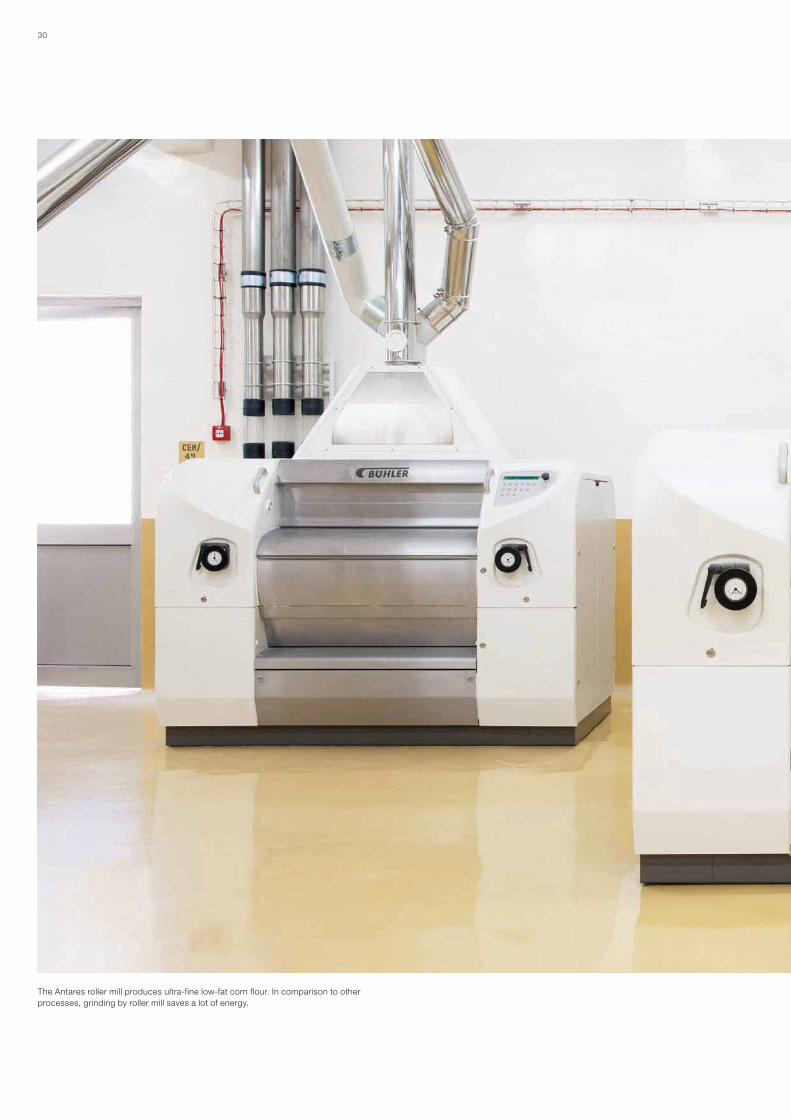
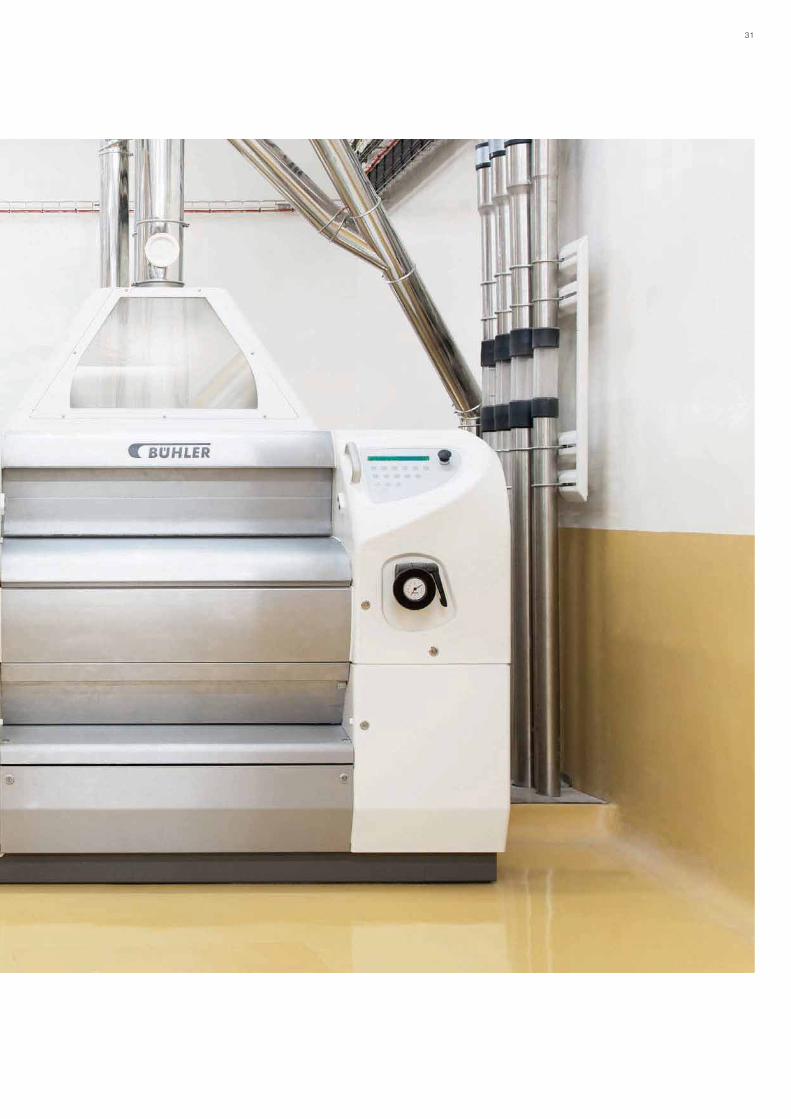
The Antares roller mill produces ultra-fine low-fat corn flour. In comparison to other
processes, grinding by roller mill saves a lot of energy.
31
32 Bühler Annual Report 2011
FOOD PROCESSING. GROWTH GENERATED BY INNOVATION AND SERVICE.
Overview of 2011.
Rapid changes in general political and economic conditions
in conjunction with breathtaking shifts in the markets call for
an early assessment of trends and quick, bold action. For
the Food Processing division, the year 2011 was character-
ized by the targeted expansion of its global customer
service and by innovations in the field of healthy nutrition
and safe food. Despite the unfavorable development of
exchange rates and political instability in certain regions,
the division returned to the path of growth after seeing a
decline in sales in the previous year. The sales revenue
(turnover) was boosted by 10% to CHF 450 million (in local
currencies: +19%). All the business units made a substan-
tial contribution to this uplifting increase.
Whereas order intake in local currencies was maintained at
a virtually constant level in 2011, the appreciation of the
Swiss franc caused it to slip to CHF 445 million, 9% below
the level of a year ago; however, toward the end of the year,
the trend was reversed again. Setbacks were suffered in
East Asia, which can primarily be explained by the natural
disaster and the nuclear reactor accident in Japan. The
same holds true for the Middle East and Africa, which were
affected by political upheavals. On the other hand, business
in China and India grew substantially. This also applies to
Europe as the most significant sales region. In response to
the development of exchange rates relative to the Swiss
franc, a major part of the procurement volume was out-
sourced to the euro region in the course of the year, and
the production sites in Europe, Asia, and the United States
were expanded.
Development of the business units.
The Pasta & Extruded Products business unit achieved
sales of CHF 161 million or 16% more than in the previous
year (in local currencies +24%). The unit further expanded
its position as the global market leader in breakfast cereals
production technology. The new system approach taken
with integrated product lines and application support con-
vinced the markets. The exploitation of synergies using the
drying technology of Bühler Aeroglide was successfully
further pushed. Unlike the past year, the Pasta segment
was characterized by customers’ restraint to make capital
investments. This was reinforced by the political uncertain-
ties in North Africa and the Middle East.
The Chocolate, Cocoa & Coffee business unit increased its
sales by 8% to CHF 227 million in a confectionery market
environment that was again clearly picking up momentum
(in local currencies +16%). Order intake also increased by
15% in local currencies. With the presentation of ten new
process solutions and products at the Interpack 2011 trade
show, Bühler underscored its leadership in the Cocoa,
Chocolate, Nut, and Coffee processing segments. The
positive market environment, supported by a sharp decline
in cocoa prices, animated numerous customers to make
new capital investments. In the unit’s new factory in
Germany, a production line went into service for the manu-
facture of conches.
The sales revenue of the Aeroglide business unit, which
provides drying systems for the Food and selected
Non-Food industries, amounted in the year under review to
CHF 55 million. This is slightly below the level of 2010, but
in local currencies 11% higher than a year ago. The unit
boosted its order intake to a new record level, an accom-
plishment to which also initial successes in the Medium
Market segment contributed. In-house orders placed by
other organizational units of Bühler accounted for another
significant share, among them primarily the Extrusion seg-
ment, with which an extremely fruitful collaboration has
now evolved. The drying technology has been optimally
integrated in system solutions at customers’ sites, enabling
the Aeroglide business unit to expand its market share in
the Food segment. In the course of 2011, the Grain Drying
activities were transferred to the new, global Grain Logistics
business unit of the Grain Processing division.
The as yet still young Nutrition Solutions segment generated
sales of CHF 7 million in 2011 (previous year: CHF 4 million).
With its two concepts of Leuron (services and ingredients
extracted from wheat grains) and Nutri Rice (fortified rice
products), Bühler made clear progress. The new Bakery
Innovation Center opened in Uzwil in the previous year was
extremely well received by customers. Integral consulting on
optimizing the development of new end products for the
customers of our customers generates substantial added
value.
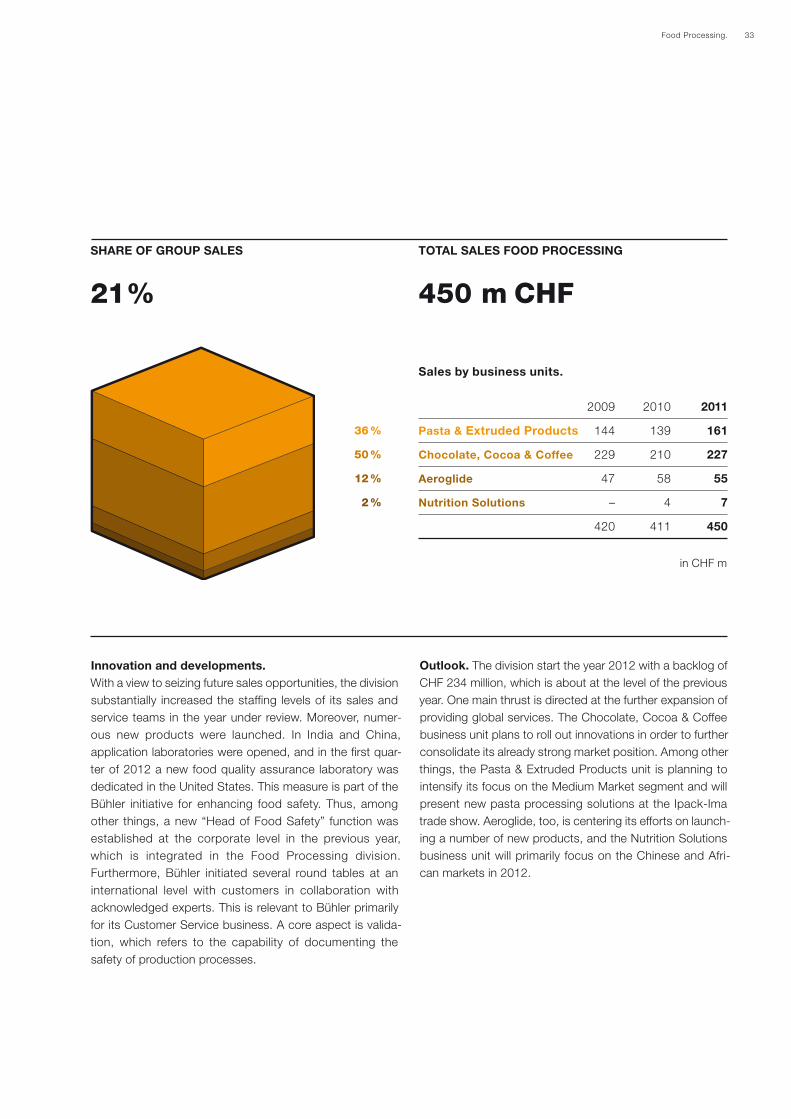
33Food Processing.
2009 2010 2011
Pasta & Extruded Products 144 139 161
Chocolate, Cocoa & Coffee 229 210 227
Aeroglide 47 58 55
Nutrition Solutions – 4 7
420 411 450
36 %
50 %
12 %
2 %
Sales by business units.
450 m CHF21%
SHARE OF GROUP SALES TOTAL SALES FOOD PROCESSING
Innovation and developments.
With a view to seizing future sales opportunities, the division
substantially increased the staffing levels of its sales and
service teams in the year under review. Moreover, numer-
ous new products were launched. In India and China,
application laboratories were opened, and in the first quar-
ter of 2012 a new food quality assurance laboratory was
dedicated in the United States. This measure is part of the
Bühler initiative for enhancing food safety. Thus, among
other things, a new “Head of Food Safety” function was
established at the corporate level in the previous year,
which is integrated in the Food Processing division.
Furthermore, Bühler initiated several round tables at an
international level with customers in collaboration with
acknowledged experts. This is relevant to Bühler primarily
for its Customer Service business. A core aspect is valida-
tion, which refers to the capability of documenting the
safety of production processes.
Outlook. The division start the year 2012 with a backlog of
CHF 234 million, which is about at the level of the previous
year. One main thrust is directed at the further expansion of
providing global services. The Chocolate, Cocoa & Coffee
business unit plans to roll out innovations in order to further
consolidate its already strong market position. Among other
things, the Pasta & Extruded Products unit is planning to
intensify its focus on the Medium Market segment and will
present new pasta processing solutions at the Ipack-Ima
trade show. Aeroglide, too, is centering its efforts on launch-
ing a number of new products, and the Nutrition Solutions
business unit will primarily focus on the Chinese and Afri-
can markets in 2012.
in CHF m
34
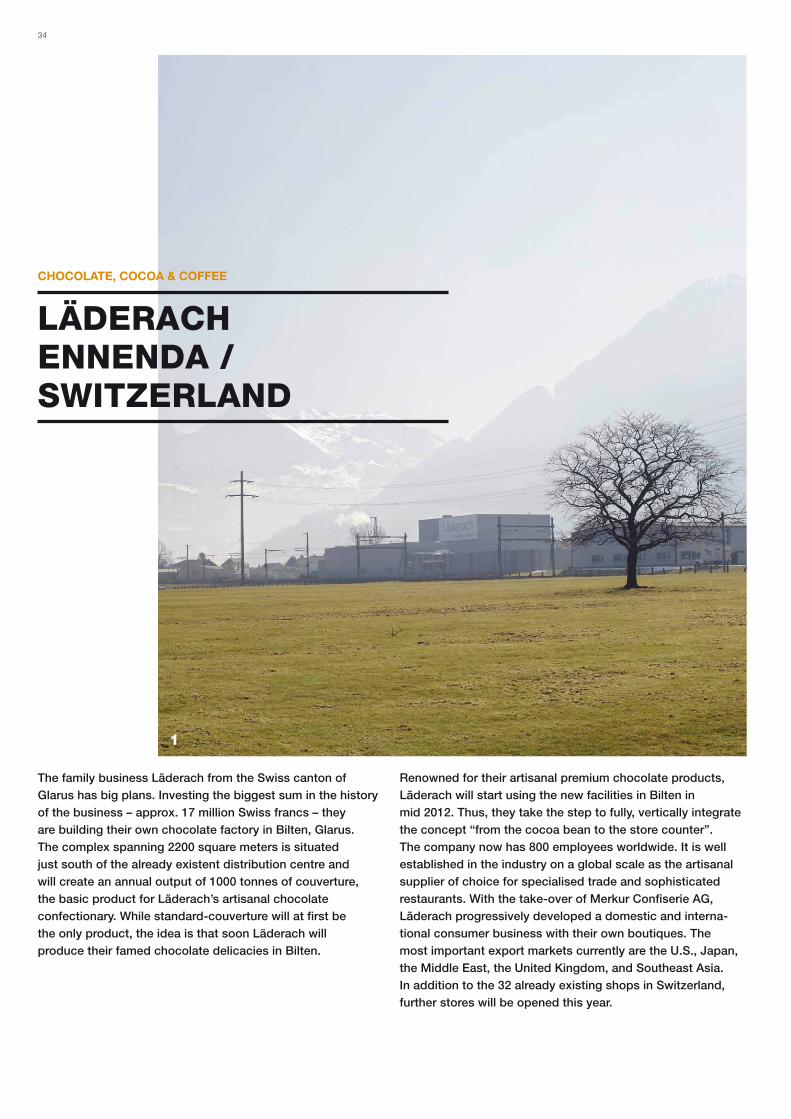
LÄDERACH ENNENDA / SWITZERLAND
CHOCOLATE, COCOA & COFFEE
The family business Läderach from the Swiss canton of
Glarus has big plans. Investing the biggest sum in the history
of the business – approx. 17 million Swiss francs – they
are building their own chocolate factory in Bilten, Glarus.
The complex spanning 2200 square meters is situated
just south of the already existent distribution centre and
will create an annual output of 1000 tonnes of couverture,
the basic product for Läderach’s artisanal chocolate
confectionary. While standard-couverture will at first be
the only product, the idea is that soon Läderach will
produce their famed chocolate delicacies in Bilten.
Renowned for their artisanal premium chocolate products,
Läderach will start using the new facilities in Bilten in
mid 2012. Thus, they take the step to fully, vertically integrate
the concept “from the cocoa bean to the store counter”.
The company now has 800 employees worldwide. It is well
established in the industry on a global scale as the artisanal
supplier of choice for specialised trade and sophisticated
restaurants. With the take-over of Merkur Confiserie AG,
Läderach progressively developed a domestic and interna-
tional consumer business with their own boutiques. The
most important export markets currently are the U.S., Japan,
the Middle East, the United Kingdom, and Southeast Asia.
In addition to the 32 already existing shops in Switzerland,
further stores will be opened this year.
1
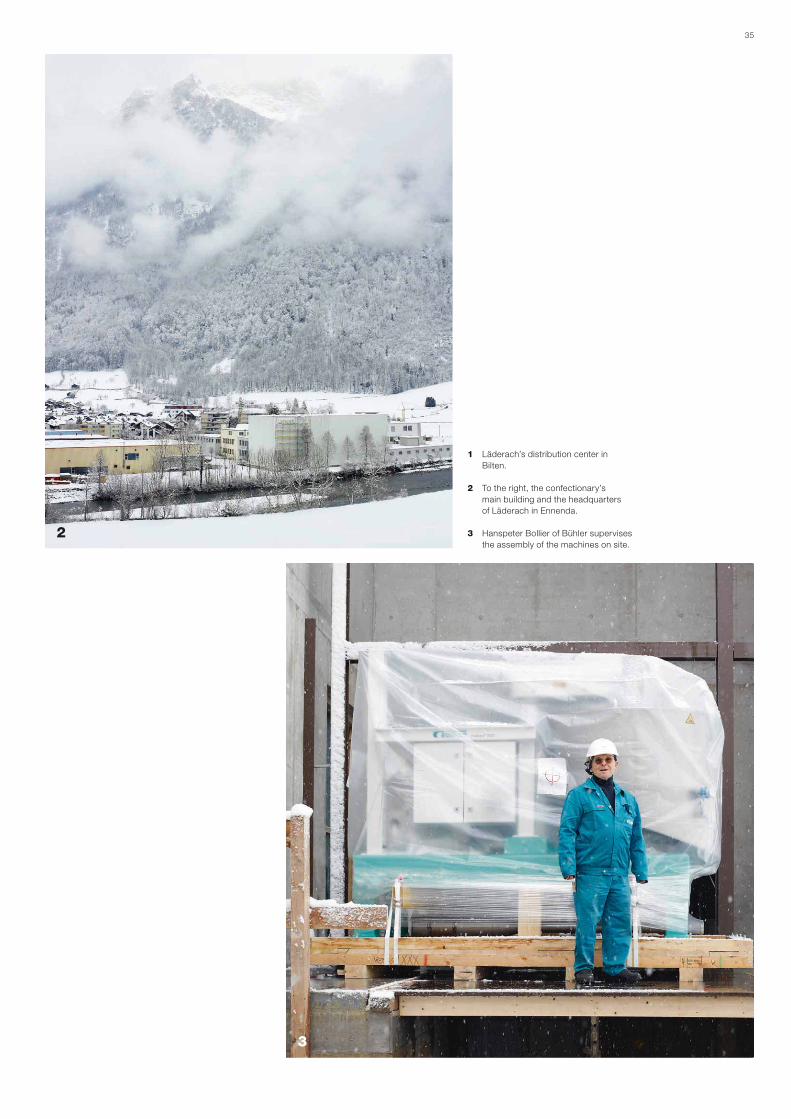
35
1 Läderach’s distribution center in
Bilten.
2 To the right, the confectionary’s
main building and the headquarters
of Läderach in Ennenda.
3 Hanspeter Bollier of Bühler supervises
the assembly of the machines on site.2
3
36
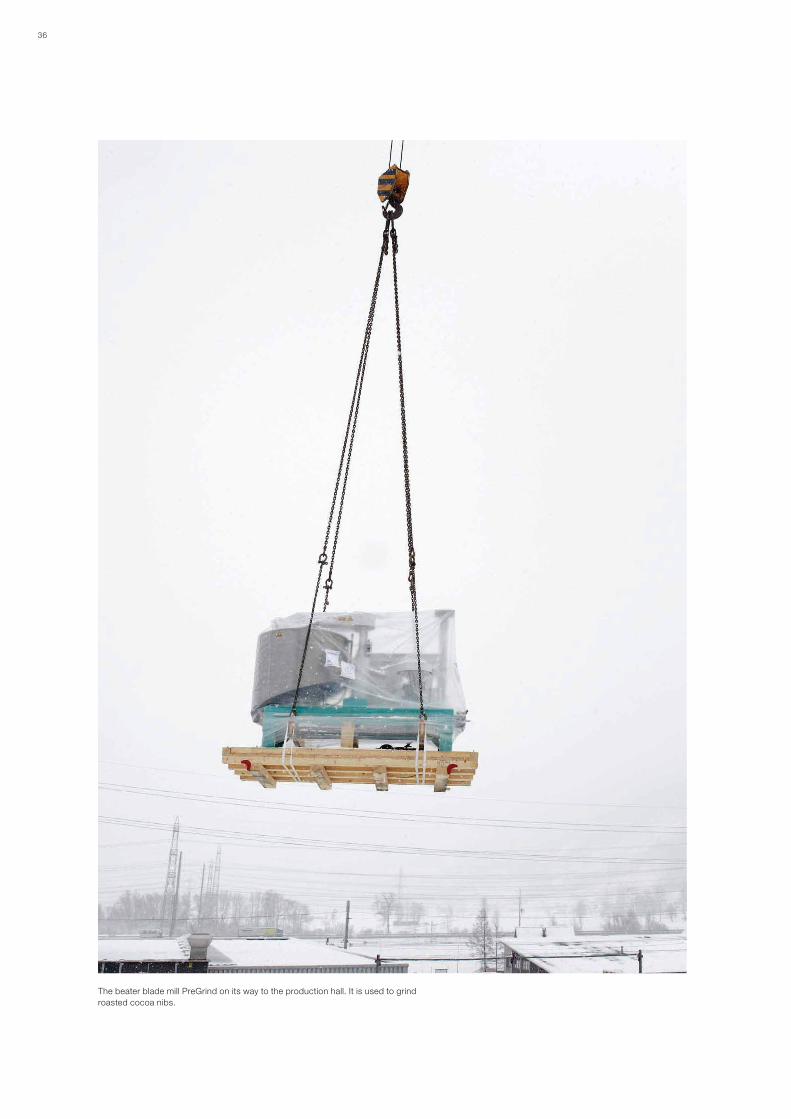
The beater blade mill PreGrind on its way to the production hall. It is used to grind
roasted cocoa nibs.
37
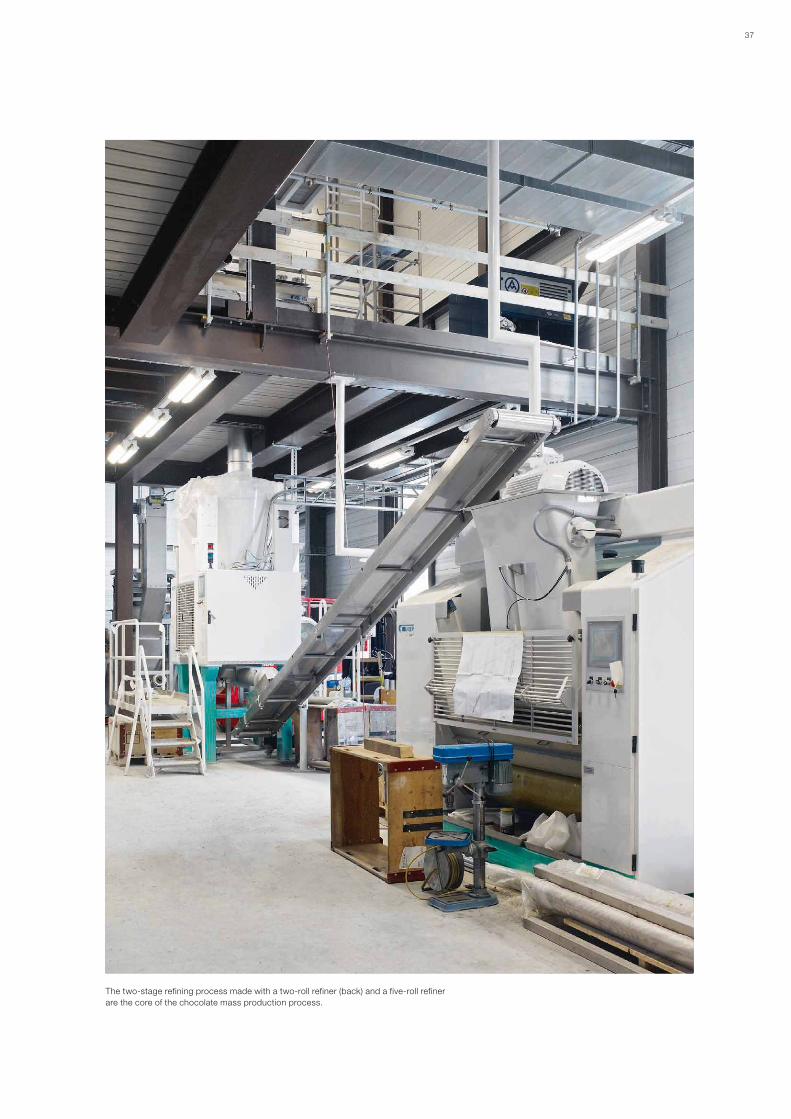
The two-stage refining process made with a two-roll refiner (back) and a five-roll refiner
are the core of the chocolate mass production process.
38
2
6
39
4
Mister Läderach, why are you so interested in chocolate?
Jürg Läderach I literally grew up with the business. Our family
lived in the production building. When my Dad entered the
flat, he used to carry the sweet scent of chocolate – as a kid
I simply adored it. This is why chocolate translates to me
as happiness. You can create joy for others – and yourself!
Chocolate is my declared passion, and I am passionate about
innovating the business.
Why do you invest millions into processing your own cocoa?
Jürg Läderach We strive to assume full responsibility for our
product – all the way from the cocoa bean to the sales counter.
Cocoa is our most important resource. By controlling the
cocoa production we can guarantee the very highest quality.
And we also get to know our cocoa farmers. By building
commercial and social relationships we welcome them into the
Läderach family. Families are important to us – the producers’
as well as the consumers’ families. Indeed, family is one of our
brand values.
Do you see any similarities between the companies Bühler
and Läderach?
Jürg Läderach Läderach’s core values are freshness, craftsman-
ship, Switzerland, individuality and family. Valuing Swiss origin
means that our products are created exclusively in Switzerland.
At this point we’re definitely on the same wavelength with
Bühler. Staff from Bühler were already involved in the planning
stage of our new chocolate factory. Consequentially, we
employed Bühler to implement the plans and build the factory.
Is this cooperation a clear win-win situation?
Jürg Läderach We definitely profited from the cooperation with
Bühler. We are a very small manufacturing company whose
production has to be flexible. Bühler has proven that flexibility is
exactly what they can deliver.
With the construction of a new chocolate factory you’re lay-
ing foundations for the future.
Jürg Läderach Exactly. Our company will continue to be run by
our family. Two of my six children are already involved in the
business. They were also consulted prior to the investment.
Läderach will remain an independent family business: not only
financially autonomous but in the future also independent
on an operational level with our own factory.
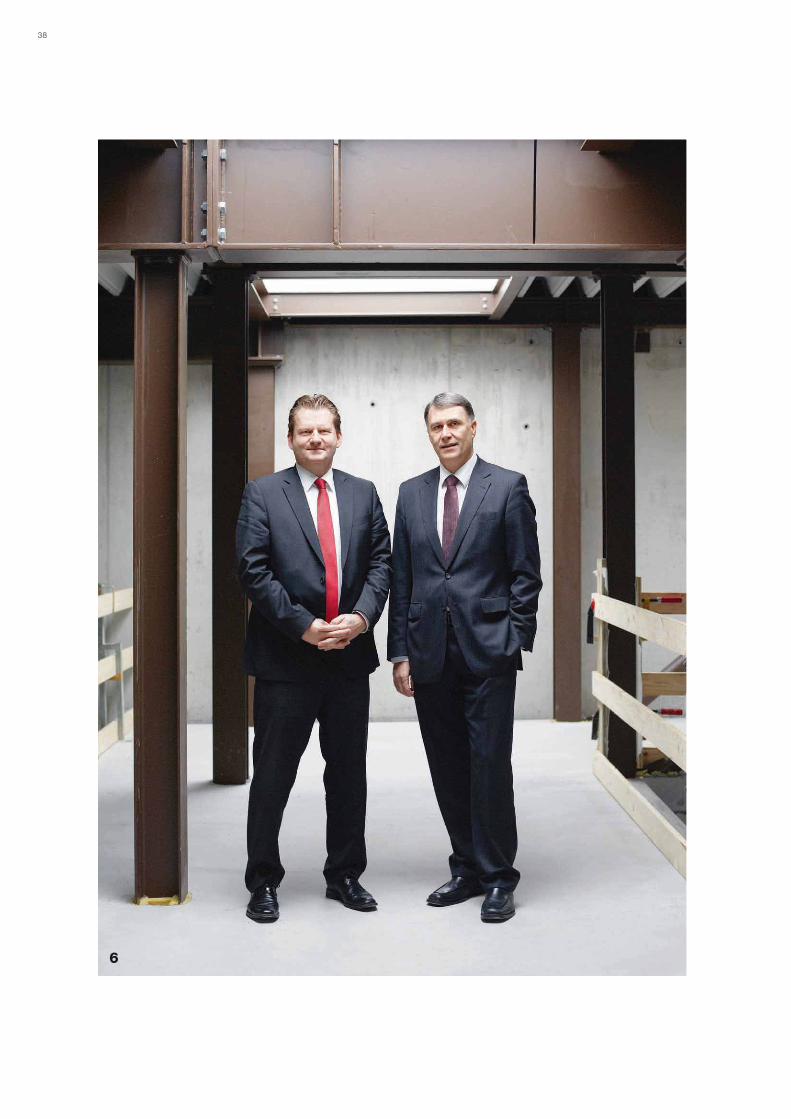
6 Ralph Siegl, CEO, and Jürg Läderach, chairman of the
board, on the construction site of the new factory in
Bilten.
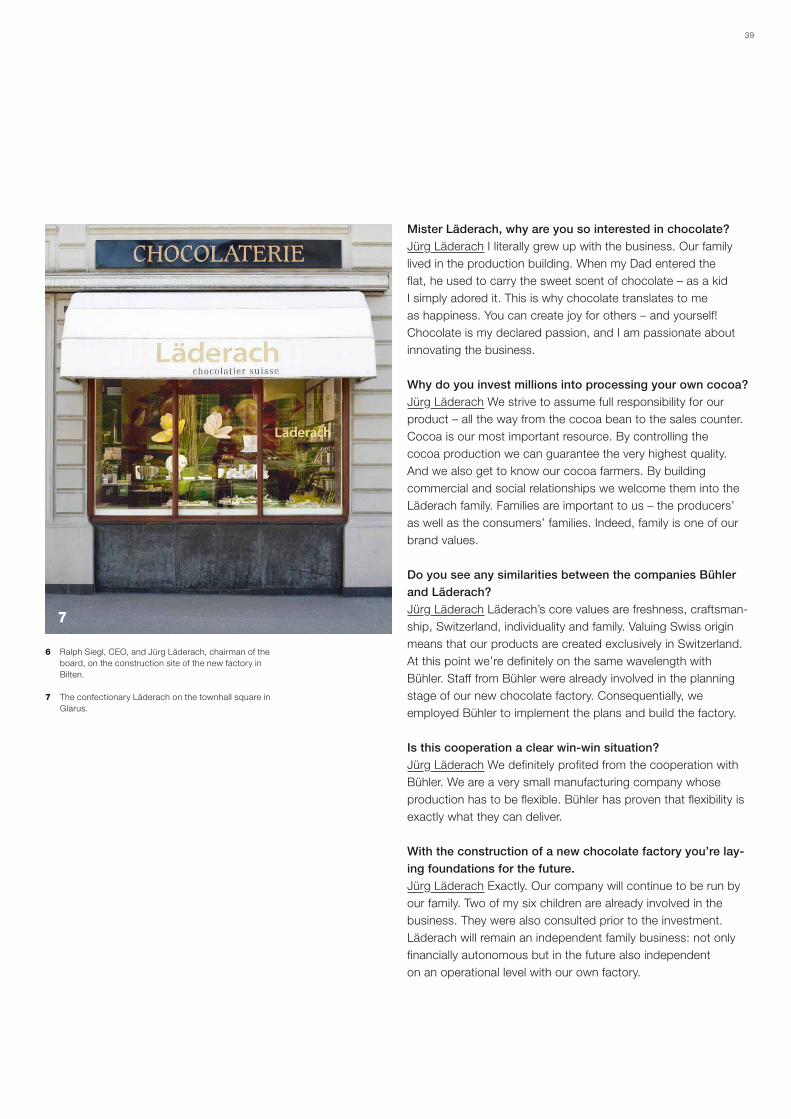
7 The confectionary Läderach on the townhall square in
Glarus.
7
40
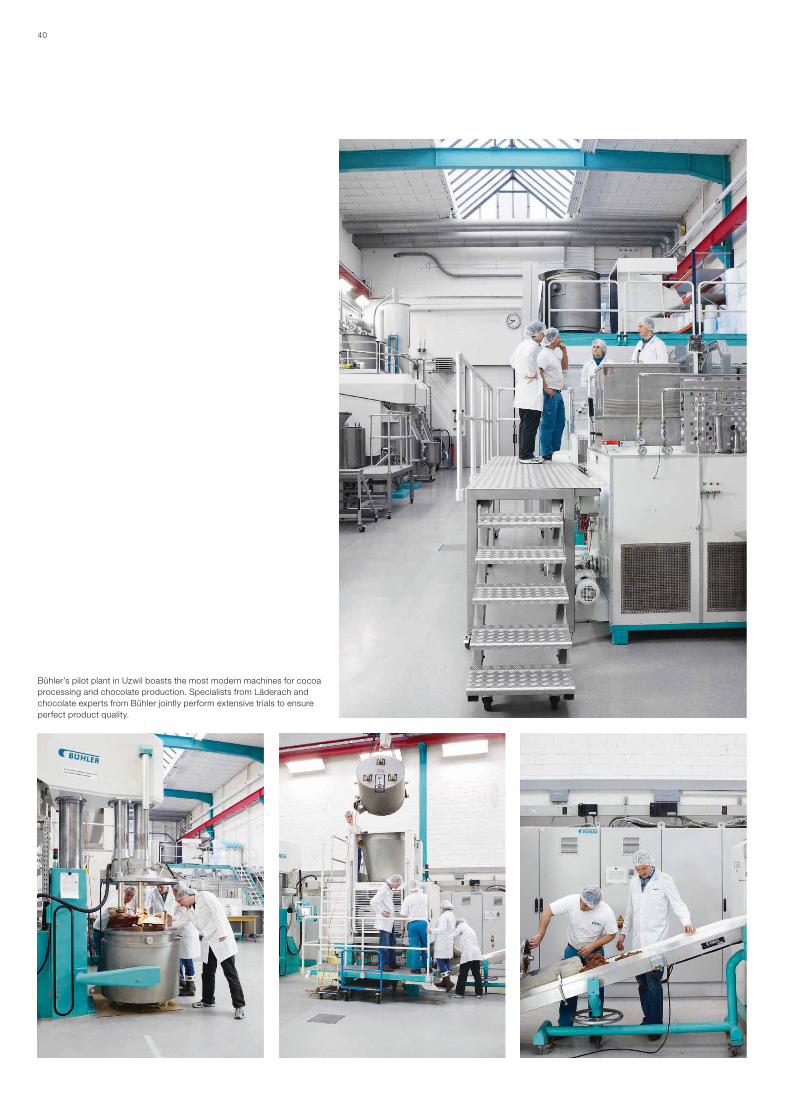
Bühler’s pilot plant in Uzwil boasts the most modern machines for cocoa
processing and chocolate production. Specialists from Läderach and
chocolate experts from Bühler jointly perform extensive trials to ensure
perfect product quality.
41
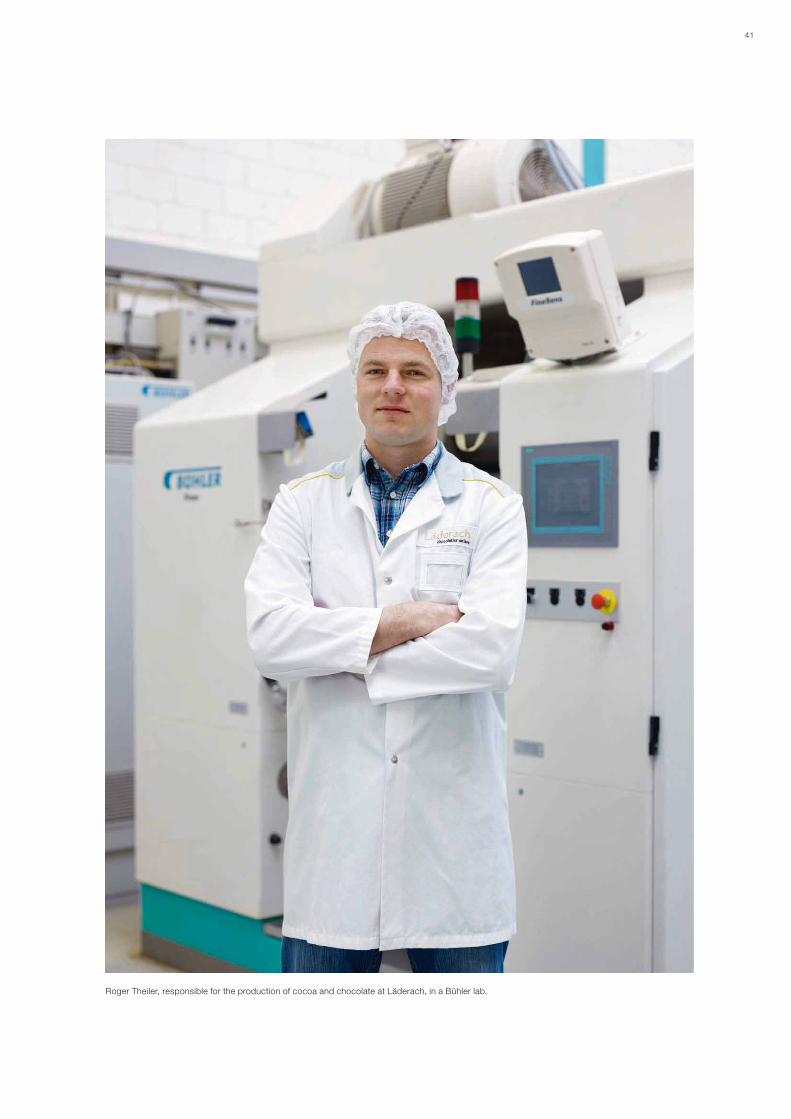
Roger Theiler, responsible for the production of cocoa and chocolate at Läderach, in a Bühler lab.
42 Bühler Annual Report 2011
ADVANCED MATERIALS. NEW PEAKS ACHIEVED.
Overview 2011.
After the Advanced Materials division had impressively
restored its growth in the previous year, considerable
growth rates were achieved also in 2011, both in terms of
sales revenue (turnover) and order intake. Sales increased
by 28% to CHF 353 million, in local currencies the rise was
even 35%. This success is primarily due to the Die Casting
business unit, which benefited from the boom in the auto-
motive industry. The order intake of CHF 415 million or 28%
more than a year ago presented a highly promising picture.
In local currencies, growth amounted to 35%. Here too, the
Die Casting business unit, which generates the highest
sales in the division, accounted for the lion’s share.
Development of the business units.
Die Casting as the largest business unit continued its string
of outstanding years up to 2008 by achieving revenues of
CHF 200 million or a plus of 50%. This success is especially
due to the sales achieved with the Ecoline series die casting
machines for the Medium Market segment and various
existing and new key accounts in the car manufacturing
industry. Geographically speaking, China, Germany, and
the United States and Canada made above-average strides,
whereas Eastern Europe and Russia showed some weak-
ness. On a global scale, China advanced for the first time
ever in 2011 to the position of the largest single market
for this business unit; in Europe, this continued to be
Germany.
As for order intake, a historical peak was achieved in the
year under review, with occasionally almost tumultuous
developments subsiding toward the end of the year. This
highly uplifting market development called for an increase
in the division’s headcount, especially in Purchasing and
Logistics. Customers’ capital investments continue to be
driven by their demand for structural components for
reducing the weight of cars, their quest for new drive sys-
tems, and the development of new engine blocks.
In the Grinding & Dispersion business unit, sales slipped
from the level of the exceptionally strong previous year by
3% to CHF 85 million. The volatile exchange rate situation
was particularly felt as a result of the depreciation of the
U.S. dollar. In Europe, the challenge was met by targeted
outsourcing of purchases to the euro region. The gloomier
business prospects occasionally prompted customers to
postpone projects. Due to signs of emerging excess
capacities, especially the solar industry showed a certain
restraint in its capital spending. On the other hand, signals
were positive from the area of printed electronic applica-
tions. Powerful momentum was generated in the traditional
Ink segment particularly in the Chinese market, which
opens up bright prospects for Bühler also for the coming
years. Generally speaking, the business unit shifted its
product mix further toward high-tech applications, in
particular display panels and electronics. The integration of
Draiswerke Inc., a U.S. company acquired in 2011, was
completed in the year under review.
The Thermal Processes business unit increased its sales by
26% to the new record level of CHF 67 million. Order intake
even grew by 44% to CHF 90 million. As was already
perceived toward the end of 2010, the PET industry showed
a marked tendency toward making new investments. As a
result of this impressive development of business, addi-
tional specialists had to be hired in the field of engineering.
The young Nanotechnology business unit slightly increased
its sales revenue and focused its efforts on the further
development of the market for Oxylink additives, which are
used in environmentally friendly water-based coatings.
Innovation and developments.
In the year under review, the division invested substantially
in research and development. In the Die Casting business
unit, the priority was set on the further development of the
two-platen Carat line and the Ecoline series, which was
launched in 2009 and which has met with huge success in
the marketplace. The Grinding & Dispersion business unit
generated encouraging sales with its new and further
developed machines for the Medium Market – Cenomic
and Trinomic. The Trias three-roll mill, which was developed
two years ago, continued its success of the previous year.
The Thermal Processes business unit successfully tested
different innovations, which are to be incorporated in
marketable products in the near future.
43Advanced Materials.
Outlook.
The division expects a sound business development also in
2012, which however is likely to be somewhat quieter be-
cause of the slowing of the business cycle. What fills the
division with confidence is the order backlog of CHF 235
million at the start of 2012. In particular the Die Casting and
Thermal Processes business units started the current fiscal
year with a comfortable backlog of orders. The necessity of
investing in die casting technology to meet demand for
new-generation engines, in conjunction with an increase in
the use of structural components, is expected to continue
to bolster up business. The Grinding & Dispersion business
unit expects successes with its Medium Market products
to continue also in 2012. In view of the sustained global
intensification of efforts to recycle PET bottles, the Thermal
Processes business unit faces the mid-term future with
some confidence. This is so even if producers’ capital
spending is likely to be lower in the current fiscal year be-
cause of added capacities, which were far above the aver-
age in 2011.
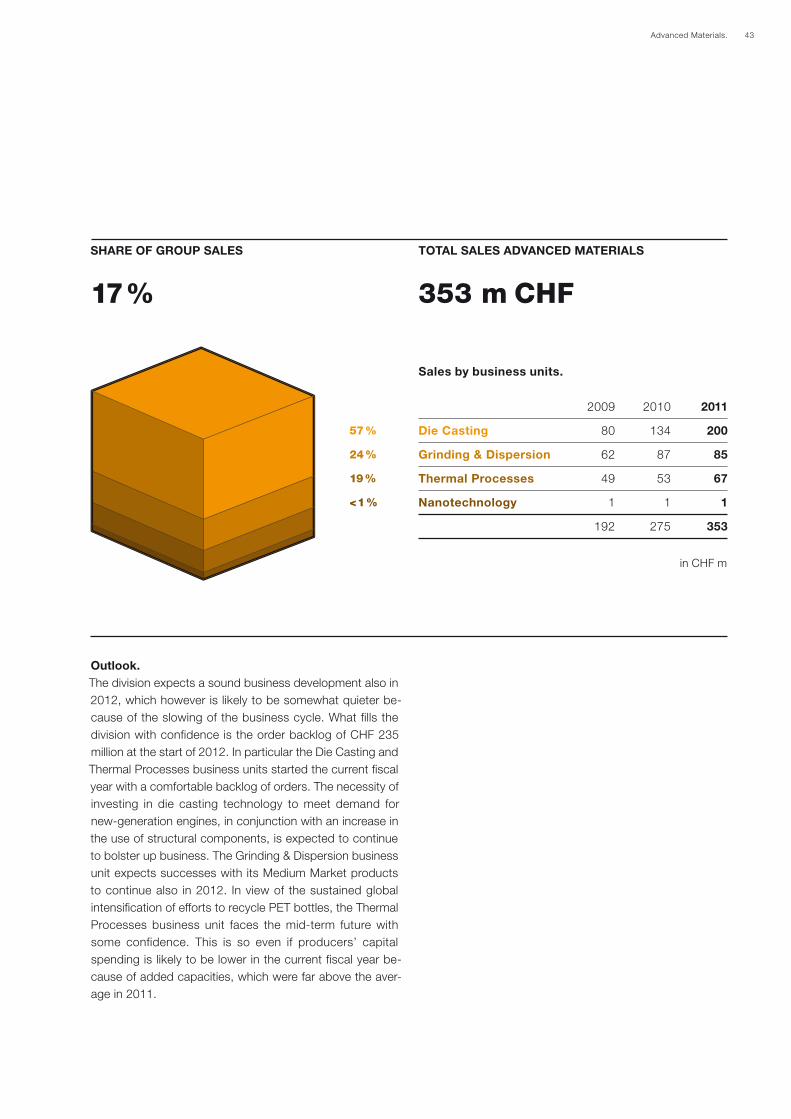
Sales by business units.
353 m CHF17 %
SHARE OF GROUP SALES TOTAL SALES ADVANCED MATERIALS
2009 2010 2011
Die Casting 80 134 200
Grinding & Dispersion 62 87 85
Thermal Processes 49 53 67
Nanotechnology 1 1 1
192 275 353
in CHF m
57 %
24 %
19 %
< 1 %
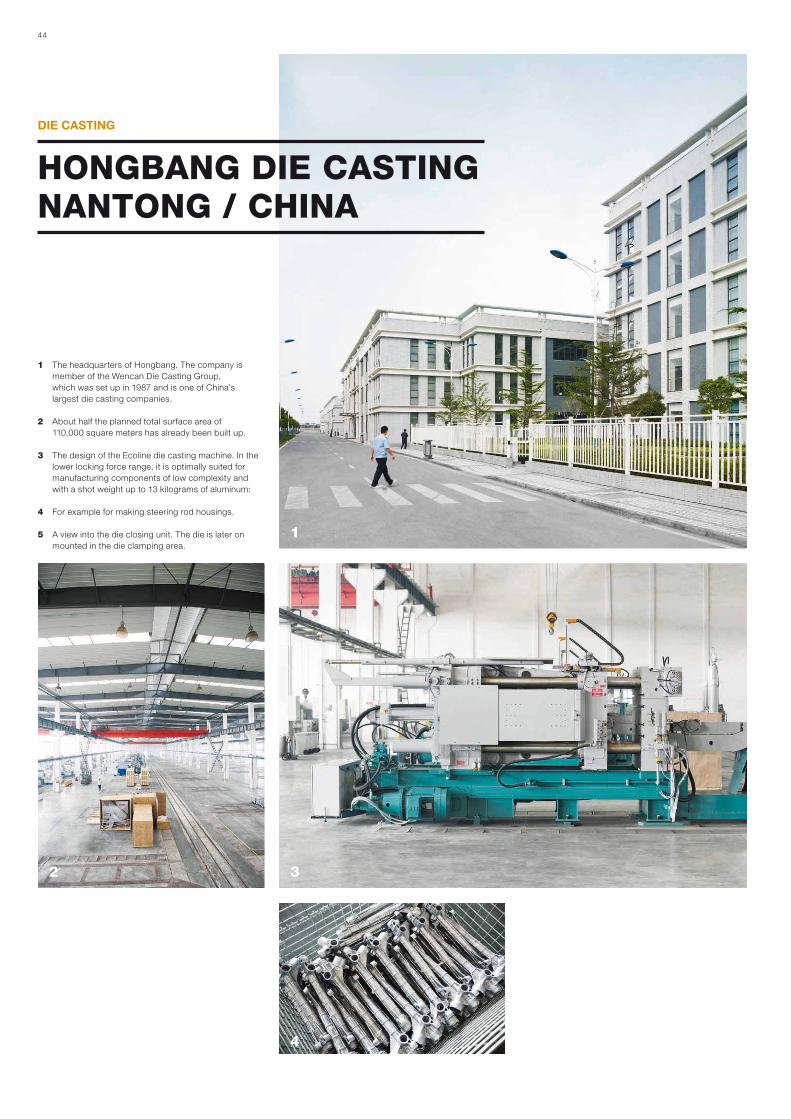
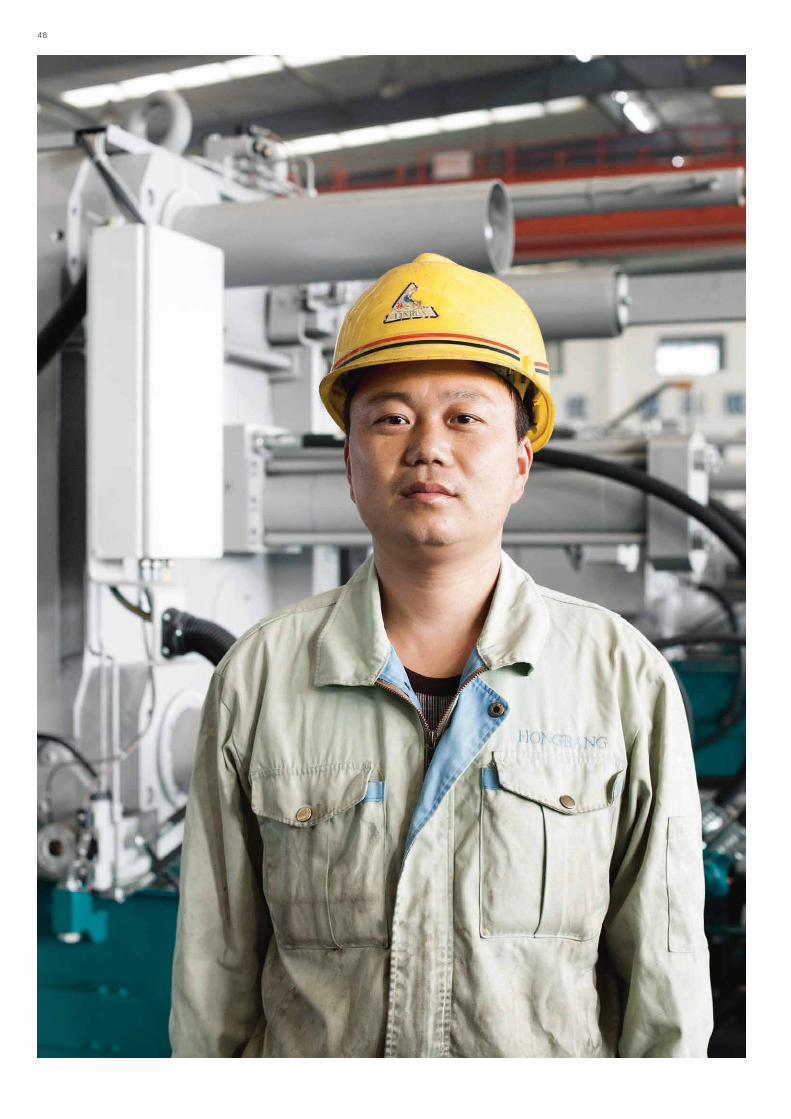
44
HONGBANG DIE CASTING NANTONG / CHINA
DIE CASTING
3
1 The headquarters of Hongbang. The company is
member of the Wencan Die Casting Group,
which was set up in 1987 and is one of China’s
largest die casting companies.
2 About half the planned total surface area of
110,000 square meters has already been built up.
3 The design of the Ecoline die casting machine. In the
lower locking force range, it is optimally suited for
manufacturing components of low complexity and
with a shot weight up to 13 kilograms of aluminum:
4 For example for making steering rod housings.
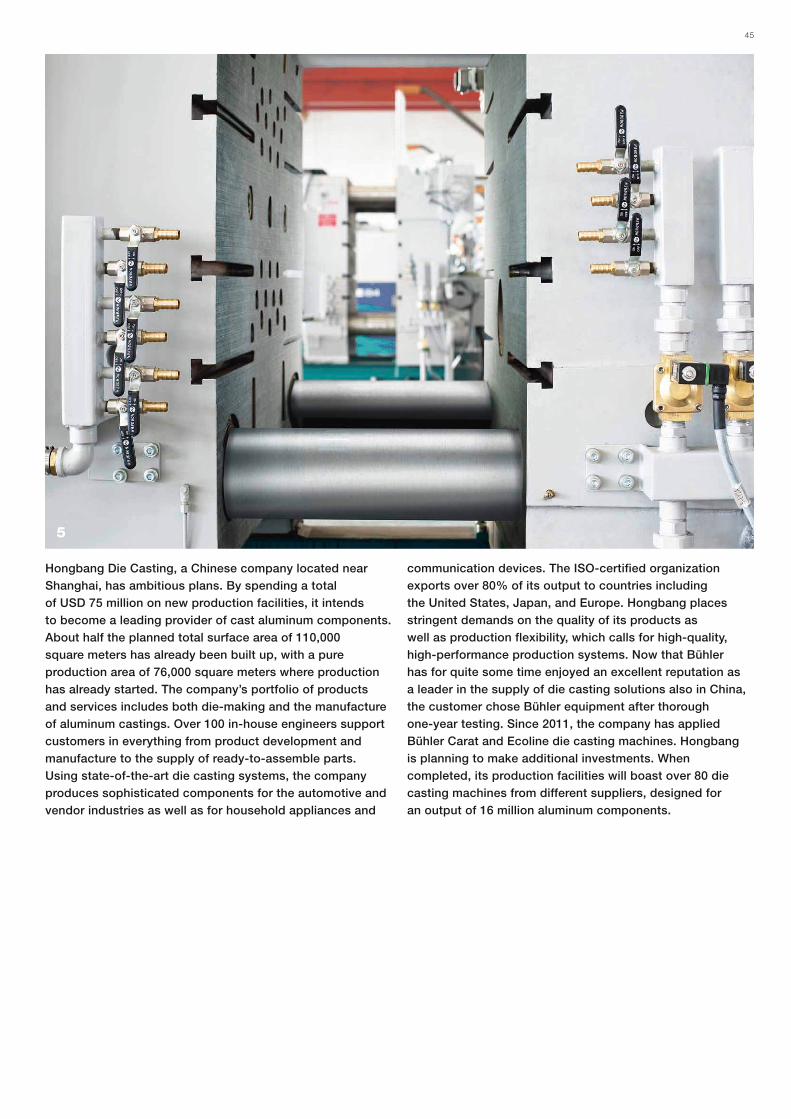
5 A view into the die closing unit. The die is later on
mounted in the die clamping area.
1
2 3
4
45
Hongbang Die Casting, a Chinese company located near
Shanghai, has ambitious plans. By spending a total
of USD 75 million on new production facilities, it intends
to become a leading provider of cast aluminum components.
About half the planned total surface area of 110,000
square meters has already been built up, with a pure
production area of 76,000 square meters where production
has already started. The company’s portfolio of products
and services includes both die-making and the manufacture
of aluminum castings. Over 100 in-house engineers support
customers in everything from product development and
manufacture to the supply of ready-to-assemble parts.
Using state-of-the-art die casting systems, the company
produces sophisticated components for the automotive and
vendor industries as well as for household appliances and
communication devices. The ISO-certified organization
exports over 80% of its output to countries including
the United States, Japan, and Europe. Hongbang places
stringent demands on the quality of its products as
well as production flexibility, which calls for high-quality,
high-performance production systems. Now that Bühler
has for quite some time enjoyed an excellent reputation as
a leader in the supply of die casting solutions also in China,
the customer chose Bühler equipment after thorough
one-year testing. Since 2011, the company has applied
Bühler Carat and Ecoline die casting machines. Hongbang
is planning to make additional investments. When
completed, its production facilities will boast over 80 die
casting machines from different suppliers, designed for
an output of 16 million aluminum components.
5
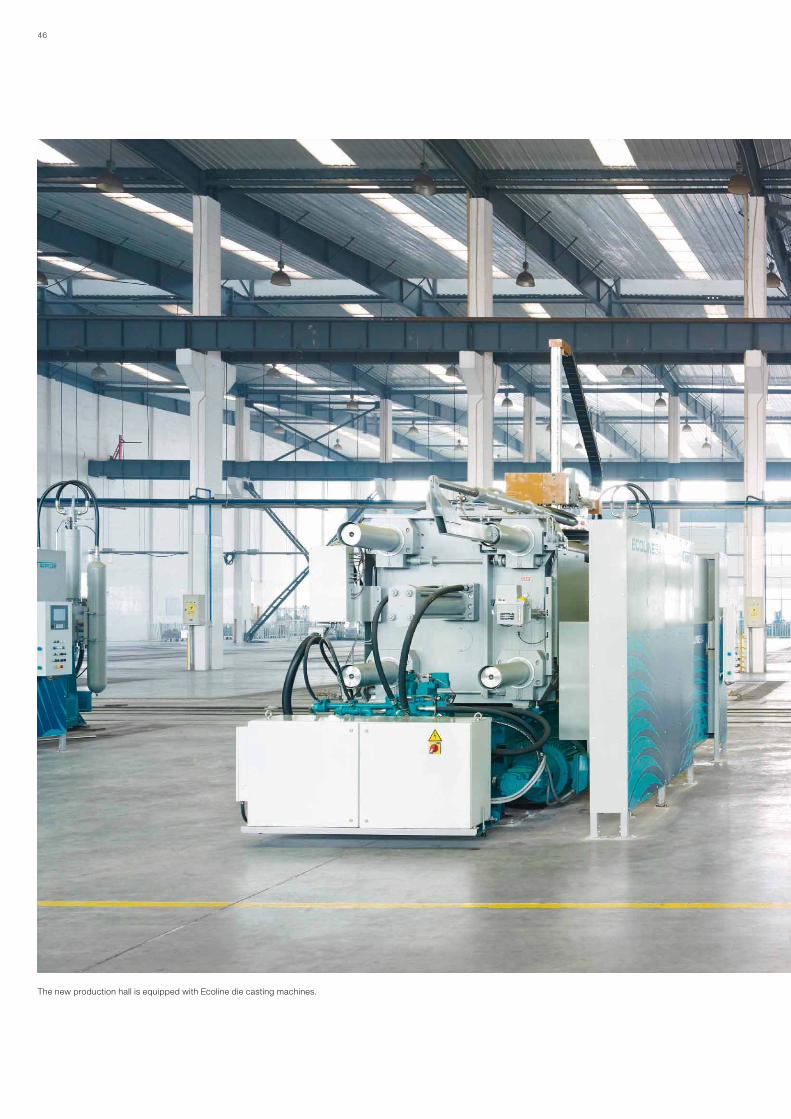
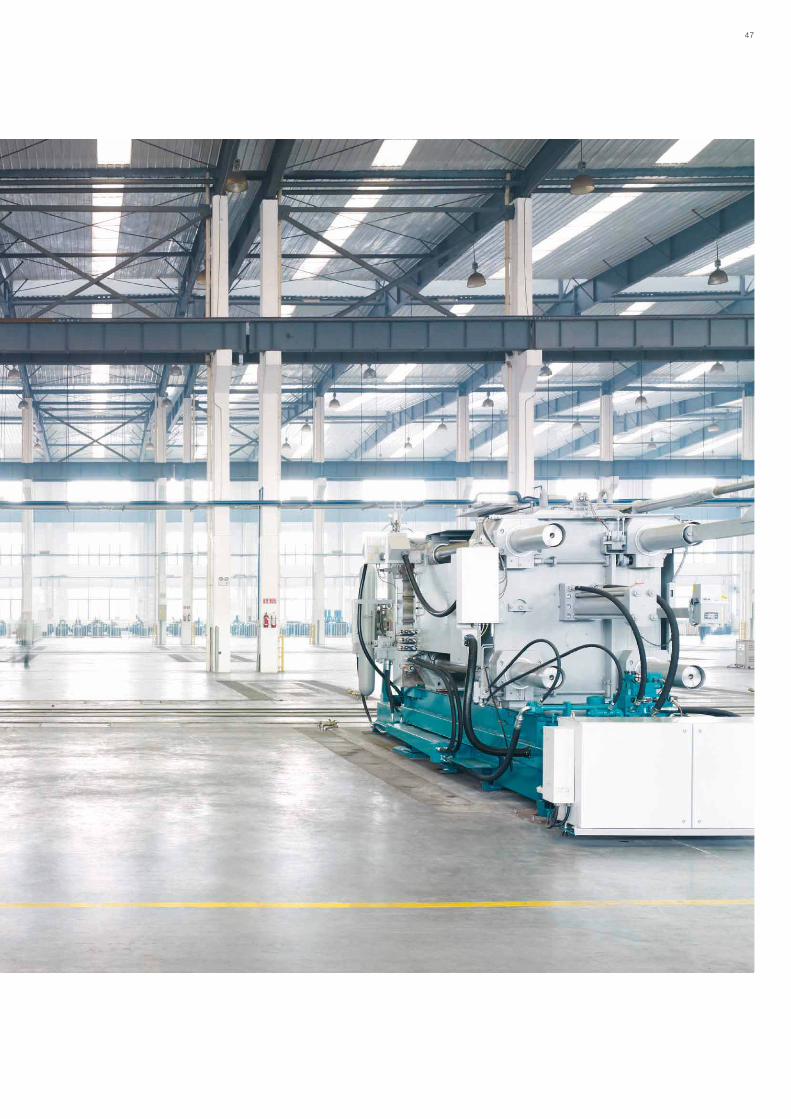
46
The new production hall is equipped with Ecoline die casting machines.
47
48
49
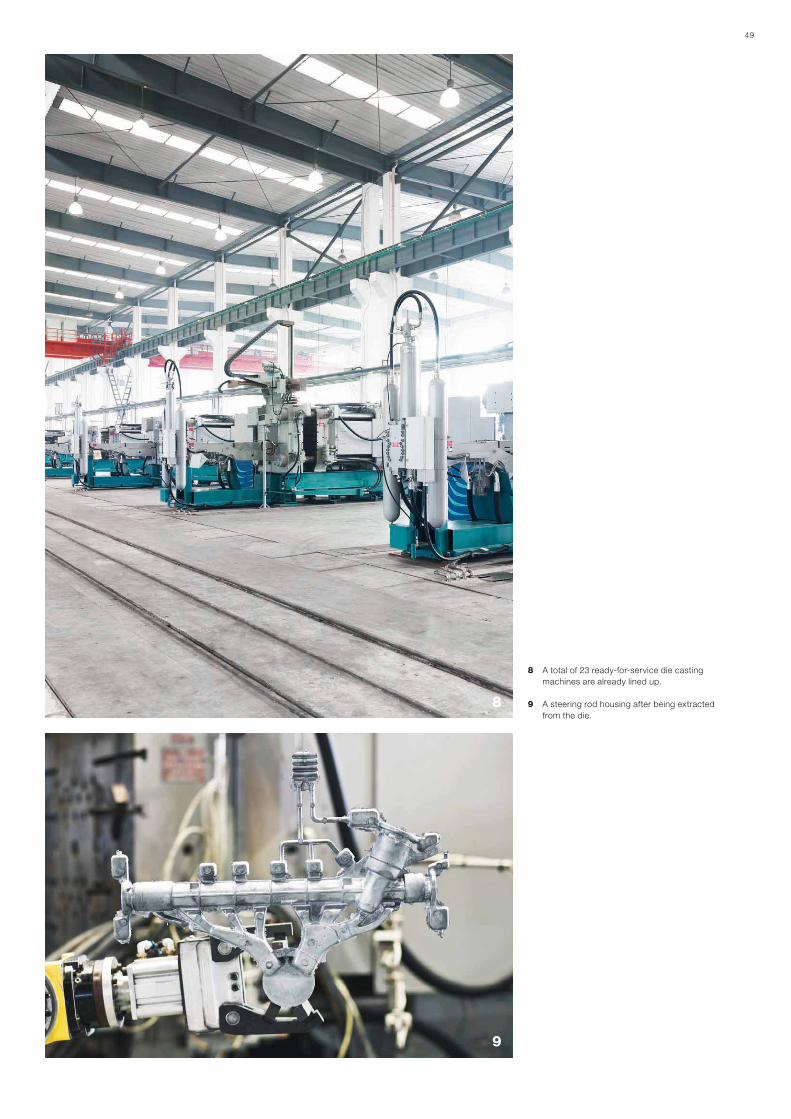
8 A total of 23 ready-for-service die casting
machines are already lined up.
9 A steering rod housing after being extracted
from the die.
9
8
50 Bühler Annual Report 2011
HUMAN RESOURCES.SYSTEMATIC FURTHER DEVELOPMENT.
Facts and figures.
At the end of 2011, Bühler had a global payroll of 8,800,
including some 500 apprentices. Of this total, European
sites accounted for half and Asian locations for just under
one third. The average age of employees was 40 years.
The staff turnover rate in Europe of 5% remained at the
level of a year ago. In the competitive labor markets in Asia,
it varies widely and may be as high as 12%. Average
seniority of 11 years worldwide and 14 years in Europe
stands for the valuable know-how that can be applied for
the benefit of customers. The employment of temporary
staff enhanced flexibility in the field of human resources
throughout the Group.
Productivity increase in an adverse market
environment.
The increasing indebtedness of numerous countries and
the massive appreciation of the Swiss franc also affected
Bühler, especially at its location in Switzerland. In this
exceptional situation, a number of measures were taken to
control costs. The management together with the Group’s
employees took actions for enhancing productivity, includ-
ing an increase in work hours limited to June 2013. Beside
the financial aspect, this measure is also designed to
sharpen the employees’ awareness and to foster their self-
responsibility. Moreover, the headcount in Switzerland will
for the time being be maintained at the level of the end of
2010. On the other hand, the number of employees in Asia
rose markedly in the year under review, partly as a result of
acquisitions.
Capacity management further refined.
The corporate capacity management project launched two
years ago was systematically continued in 2011. The focus
in the year under review was to categorize the skills existing
in Bühler Group, with a difference being made between
productive and supportive functions. In the future, this
classification will substantially facilitate growth and produc-
tivity planning. The refined capacity management system
enables the required human resources capacities to be
provided with the necessary skills in the respective Group
companies at the right point of time and at costs that are in
line with market conditions.
Creation of a global human resources organization.
By grouping the different local companies in seven regions
– Asia, East Asia, South East Asia, Europe, North America,
South America, and Middle East/Africa – Bühler has laid
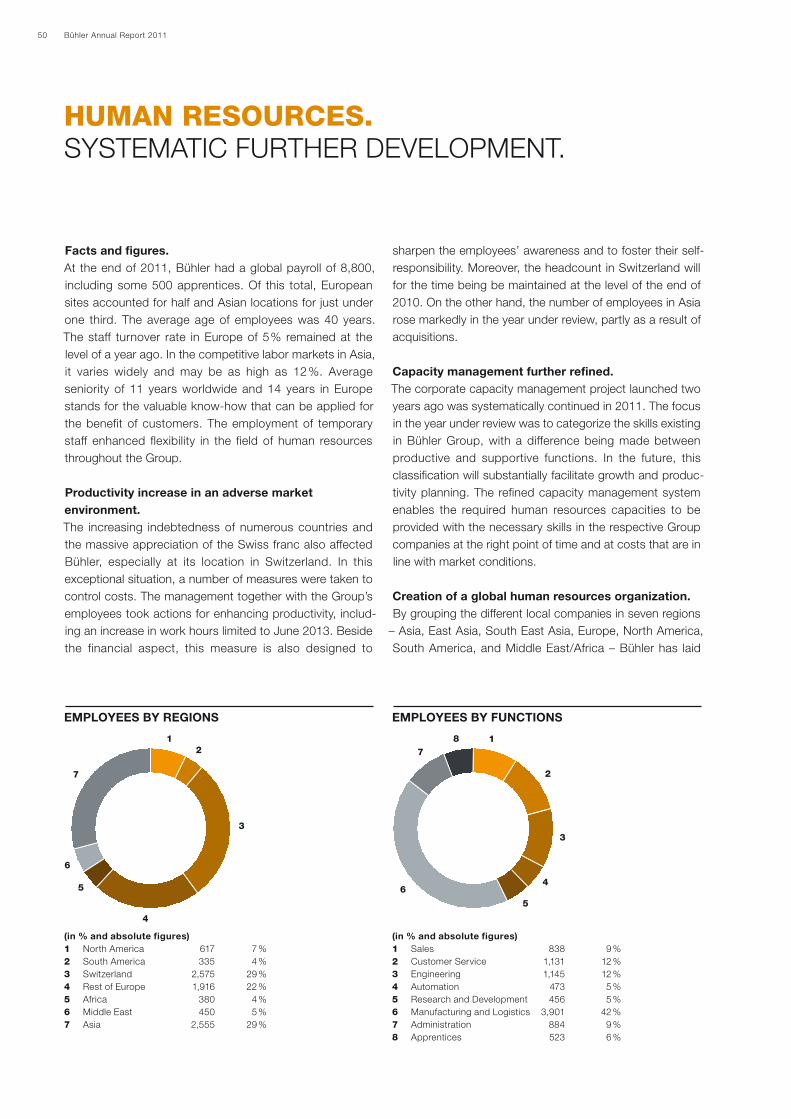
EMPLOYEES BY FUNCTIONS EMPLOYEES BY REGIONS
(in % and absolute figures)
1 North America 617 7 %
2 South America 335 4 %
3 Switzerland 2,575 29 %
4 Rest of Europe 1,916 22 %
5 Africa 380 4 %
6 Middle East 450 5 %
7 Asia 2,555 29 %
(in % and absolute figures)
1 Sales 838 9 %
2 Customer Service 1,131 12 %
3 Engineering 1,145 12 %
4 Automation 473 5 %
5 Research and Development 456 5 %
6 Manufacturing and Logistics 3,901 42 %
7 Administration 884 9 %
8 Apprentices 523 6 %
12
5
6
7
3
4
1
2
5
78
6
3
4
51Human Resources.
the foundations for creating a global, efficient Human
Resources organization. This measure improves the flow of
information between all the different locations, and global
projects can in the future be executed with higher effi-
ciency.
Employee performance management process (EPM).
International collaboration, which is a fact in everyday life at
Bühler, requires a shared understanding of goals, compe-
tencies, and performance. For this purpose, Bühler has
rolled out the EPM process, which applies to all employees
throughout the world. The new performance assessment
system is made up of five steps: Self-appraisal, Manager
Appraisal, Performance Board, Appraisal Talk, and Midyear
Coaching. It thus ensures the sustainable further develop-
ment of managers and employees alike. The global rollout
including training of all HR specialists and managers
involved was completed in the year under review so that all
performance appraisal talks were based on the new system
starting in November 2011.
Customized “Master of Bühler Management”
Program (MBM).
In collaboration with CEIBS (China-European International
Business School) in Shanghai, Bühler China has rolled out
a training program for developing globally active manage-
ment staff in Asia as well as in India and Indonesia. Its
focus is on Bühler-specific subjects, and the lecturers use
Bühler case studies. The program is addressed to regional
managers who wish to acquire leadership skills and to
middle managers at headquarters with defined responsi-
bilities in Asia or an option to assume a management
function. Training will start in April/May 2012. Bühler will
concurrently initiate an identical training program for
Europe.
Fair and equal standards for all employees.
Bühler as a global organization considers the cultural diver-
sity of its employees as one of its major assets. Regardless
of their origins, nationality, religion, or gender, all employees
have equal rights, and any discrimination is banned. For a
given function, no difference is made between the basic
salaries of men and women. Bühler offers all employees a
safe and healthy work environment and respects the safety
regulations of each location in accordance with the specific
requirements and the legal situation. In order to define how
we treat one another inside and outside our organization,
we created the “Bühler Essentials” in the year under review.
These guidelines of conduct are based on our five core cor-
porate values (Trust, Recognition, Respect, Involvement,
Passion) and also give consideration to the insights gained
in the two global employee surveys conducted in 2009 and
2010.
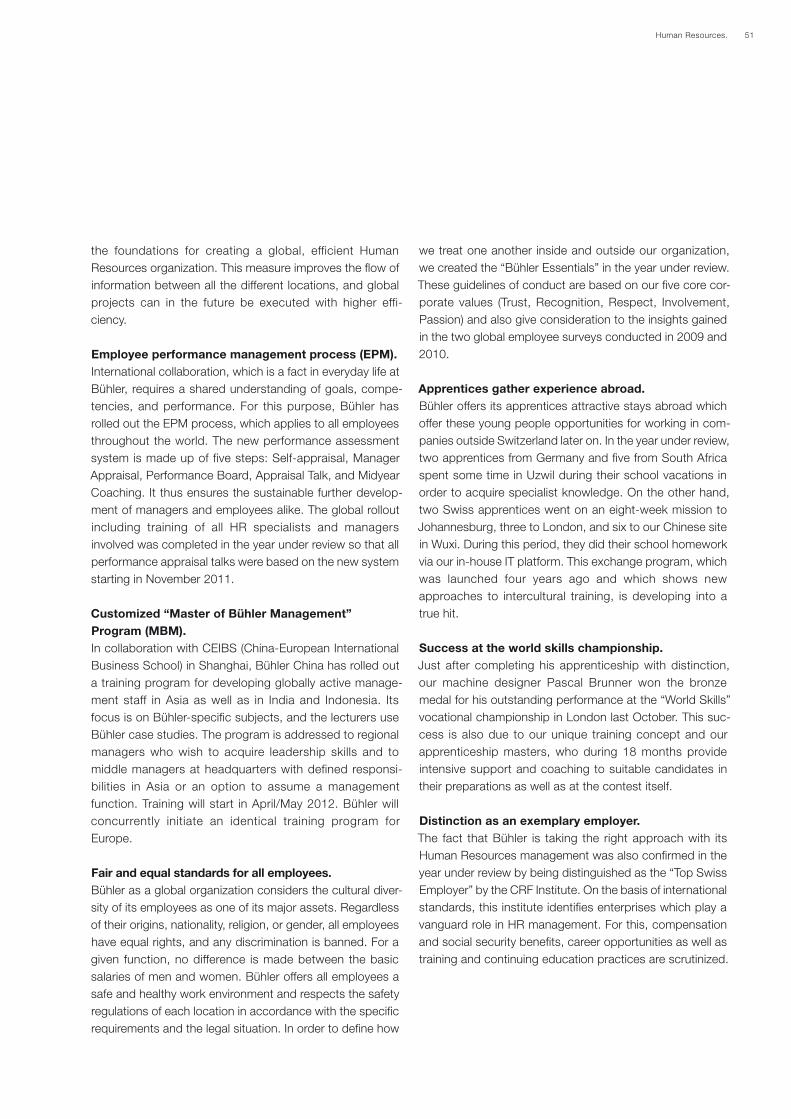
Apprentices gather experience abroad.
Bühler offers its apprentices attractive stays abroad which
offer these young people opportunities for working in com-
panies outside Switzerland later on. In the year under review,
two apprentices from Germany and five from South Africa
spent some time in Uzwil during their school vacations in
order to acquire specialist knowledge. On the other hand,
two Swiss apprentices went on an eight-week mission to
Johannesburg, three to London, and six to our Chinese site
in Wuxi. During this period, they did their school homework
via our in-house IT platform. This exchange program, which
was launched four years ago and which shows new
approaches to intercultural training, is developing into a
true hit.
Success at the world skills championship.
Just after completing his apprenticeship with distinction,
our machine designer Pascal Brunner won the bronze
medal for his outstanding performance at the “World Skills”
vocational championship in London last October. This suc-
cess is also due to our unique training concept and our
apprenticeship masters, who during 18 months provide
intensive support and coaching to suitable candidates in
their preparations as well as at the contest itself.
Distinction as an exemplary employer.
The fact that Bühler is taking the right approach with its
Human Resources management was also confirmed in the
year under review by being distinguished as the “Top Swiss
Employer” by the CRF Institute. On the basis of international
standards, this institute identifies enterprises which play a
vanguard role in HR management. For this, compensation
and social security benefits, career opportunities as well as
training and continuing education practices are scrutinized.
52 Bühler Annual Report 2011
SUSTAINABILITY.ON THE RIGHT TRACK.
Comprehensive approach.
Bühler understands the term “Sustainability” in a compre-
hensive sense. As a consequence, business considerations
and decisions at the strategic and executive levels give due
consideration to the three dimensions of Economy, Envi-
ronment, and Social. Bühler is committed to sustainability
and will progressively introduce GRI reporting across the
company in the coming three years. This will mark a major
step forward in our sustainability tracking.
As a major market player in the value chain of staple foods
such as grain, corn (maize) and rice; processed foods; and
the automobile industry, the global impact of our activities
is significant. Reducing food spoilage in emerging markets
through improved logistics management, storage, and
cleaning has a significant effect on food safety. New, more
efficient technologies that reduce the energy consumption
of pasta dryers not only drive energy efficiency, but also
make our customers’ businesses more sustainable. The
weight reductions made possible by die cast structural car
components support our customers in the automobile in-
dustry in meeting emission targets. Starting in fiscal 2012,
our future reporting on sustainability will extend beyond our
own manufacturing operations to include the plants we
have installed across the globe.
The foundation is set.
The Bühler “Total Quality Management” system, which is bind-
ing throughout the organization and comprises the areas of
Quality, Environmental Protection, and Industrial Safety. Apart
from the introduction of sustainability standards, it also regu-
lates measurement, controlling, and reporting aspects. In the
regular audits of our management system, we successfully
passed all recertifications according to ISO 9001 (Quality
Management) and ISO 14001 (Environmental Management)
at our site in Uzwil in the year under review.
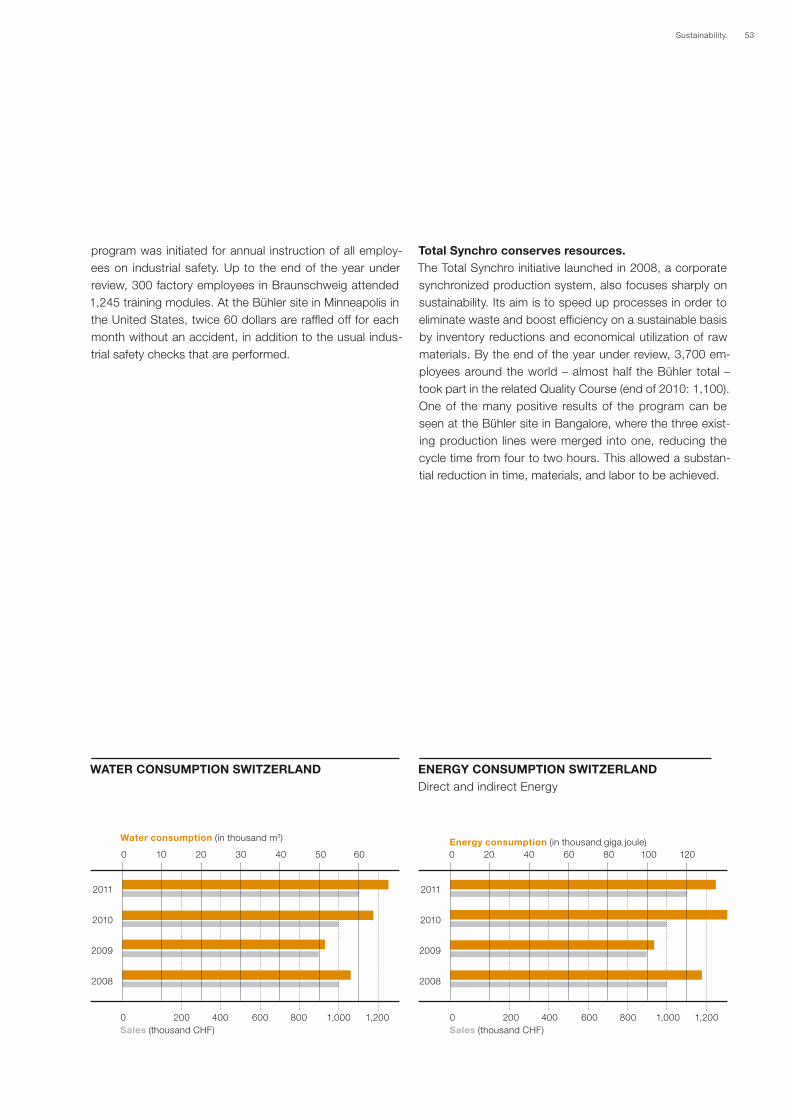
Proving environmental awareness.
Taking ecological aspects into account is part of Bühler’s
understanding of its identity as a business. On the basis of
an environmental management concept, concrete ecologi-
cal measures have been defined, for example with regard
to resource consumption. In fiscal 2011, energy consump-
tion (electric power, wood, gas, and oil) at the Swiss head-
quarters have been reduced from a year ago despite an
increase in sales.
In the year under review, Bühler took additional environ-
mentally-related measures. At its German location in Braun-
schweig, the washing tables which hitherto used solvents
were replaced by units operating on the basis of water and
microorganisms. This allowed solvent consumption to be
reduced by over 400 liters, which also fully eliminated the
occurrence of volatile organic compounds (VOC). In the
surface treatment shop, replacement of the vaporizer cut
the volume of contaminated water from 334 to 120 metric
tons a year, associated with savings of 80,000 euros annu-
ally. In addition, Bühler in an initial stage installed a solar
system generating peak power of 30 kilowatts on the fac-
tory roof in Uzwil, based on three different panel technolo-
gies. In the second half of 2011, they produced 14,710 kil-
owatt-hours of natural power, which cut carbon emissions
by 10.29 metric tons.
Our proactive commitment was also proven by those em-
ployees who took part with their “SolarMobil” – a solar-
powered vehicle that they themselves developed and built
– in the World Solar Challenge in Australia. In this grueling
race across 3,000 kilometers, the team won the “New-
comer Award” and in the “Production Class” category
achieved the excellent third place. In this category, only
such vehicles are allowed which are equipped with com-
mercially available components such as tires approved for
use on normal roads instead of special-purpose solar rac-
ing tires. In the overall classification, the team ranked 16 th.
Finally, in the year under review, Bühler sponsored a five-
digit sum for “Plant for the Planet”. In this global project
designed for enhancing climate awareness, children around
the world plant trees. Bühler’s contribution was intended to
offset the emissions caused by its participation in the Inter-
pack trade show in Düsseldorf.
Industrial safety and health protection.
The health and safety of employees and their protection
against physical and mental impairment is a core concern
of Bühler, with consideration being given to regional needs
and customs. Thus, in the year under review, the works
council at Bühler’s German site in Braunschweig together
with the factory physician established a social integration
management program. Its purpose is to reintegrate em-
ployees in the work process who have been disabled over
an extended period of time. In addition, a computer-aided
53Sustainability.
program was initiated for annual instruction of all employ-
ees on industrial safety. Up to the end of the year under
review, 300 factory employees in Braunschweig attended
1,245 training modules. At the Bühler site in Minneapolis in
the United States, twice 60 dollars are raffled off for each
month without an accident, in addition to the usual indus-
trial safety checks that are performed.
Total Synchro conserves resources.
The Total Synchro initiative launched in 2008, a corporate
synchronized production system, also focuses sharply on
sustainability. Its aim is to speed up processes in order to
eliminate waste and boost efficiency on a sustainable basis
by inventory reductions and economical utilization of raw
materials. By the end of the year under review, 3,700 em-
ployees around the world – almost half the Bühler total –
took part in the related Quality Course (end of 2010: 1,100).
One of the many positive results of the program can be
seen at the Bühler site in Bangalore, where the three exist-
ing production lines were merged into one, reducing the
cycle time from four to two hours. This allowed a substan-
tial reduction in time, materials, and labor to be achieved.
ENERGY CONSUMPTION SWITZERLAND
Direct and indirect Energy
0 20 40 60 80 100 120
WATER CONSUMPTION SWITZERLAND
2011
2010
2009
2008
2011
2010
2009
2008
0 10 20 30 40 50 60
0 200 400 600 800 1,000 1,200 0 200 400 600 800 1,000 1,200
Energy consumption (in thousand giga joule)Water consumption (in thousand m3)
Sales (thousand CHF) Sales (thousand CHF)
54 Bühler Annual Report 2011
CORPORATE GOVERNANCE AND CODE OF CONDUCT.
Bühler considers good Corporate Governance to be a
prerequisite for ensuring the long-term and sustainable
growth of its corporate value. In this, we base our activities
on the principles of the Swiss Code of Best Practice and
the OECD Principles of Corporate Governance. Bühler’s
organization and conduct of business are oriented toward
the interests of its stakeholders. These include customers,
employees, suppliers, and local communities. Observance
of environmental and social standards is also covered. As a
Swiss company with international operations, strict compli-
ance with laws and continuous monitoring of compliance
are non-negotiable for Bühler, be this in mature or emerging
markets. In this sense, we do everything to avert opera-
tional and reputational damage that would arise as a result
of infringement of compliance and might severely harm the
company. Up to the present point of time, the organization
has never faced any legally effective complaints concerning
noise, the environment, or industrial safety.
Bühler regularly reviews the principles of Corporate Gov-
ernance and further develops internal processes and
directives where necessary or appropriate. In fiscal 2011,
we rolled out the new Code of Conduct as announced in
last year’s Annual Report. It is binding upon all Bühler
companies worldwide. The Code is part of the so-called
Bühler Essentials. It serves as a yardstick for all employees,
showing them how to live by the core values of Bühler in
day-to-day business: Trust, Respect, Recognition, Involve-
ment, and Passion. The Code expresses the expectations
to be fulfilled by employees and business partners, defines
the standards of compliance with laws and regulations, and
states the rules of communication, employees’ rights,
health and safety, and financial integrity. Bühler also expects
its suppliers and other business partners to apply these
standards.
Furthermore, Bühler redefined the so-called ABC (Anti
Bribery & Corruption) rules in the year under review. They
highlight in a clear and easy-to-understand manner that
there is no room for bribery and corruption within Bühler
Group. In particular, they refer to collaboration with consult-
ers and agents. An online training program has been devel-
oped for roll-out and familiarization which it is mandatory for
all Purchasing and Sales staff to complete.
Internal Audit Group.
Internal Audit Group performs the internal auditing function
for the entire Group. Internal Audit Group supports the
Board of Directors and the Board Committee in discharging
their governance responsibility by evaluating the internal
control system and the compliance with internal directives,
legal and regulatory requirements.
On the basis of the corporate wide risk analysis, the audits
to be conducted are determined and approved by the
Board Committee. The audit results are discussed with the
CEO, the CFO and the Management of the audited organi-
zations and presented to the Board Committee.
Internal Audit supports the worldwide implementation of
the Code of Conduct and will check compliance and regu-
larly report to the Board Committee as the final authority.
55Corporate Governance und Code of Conduct.Executive Board.
EXECUTIVE BOARD.
CALVIN GRIEDER Chief Executive Officer
(1955, American and Swiss)
Graduated in process engineering from the Swiss
Federal Institute of Technology (ETH) in Zürich. He then
held various management positions in Swiss and German
companies in the fields of control engineering, auto-
mation, and plant design, in charge of building and
expanding international business. In 2001, he changed
from Swisscom to Bühler Group as CEO. Member of the
board of Metall Zug AG and Model AG.
ANDREAS R. HERZOG Chief Financial Officer
(1957, Swiss)
Graduated in business administration and continued his
education in marketing and financial management. Held
management positions in finance, controlling, audit, and
logistics at Ciba-Geigy, Swatch, and last as Vice Presi-
dent Finance at Swarovski in Switzerland, Latin America,
West Africa, and Germany. Has been with Bühler since
2002.
ACHIM KLOTZ Advanced Materials
(1960, German)
Graduated in mechanical engineering from the University
of Engineering in Darmstadt; degree in marketing and
business administration from the European Business
School. After a position at Schenk in Darmstadt, he
switched to Balzers AG in 1989, where he was in charge
of sales and later on joined executive management. With
Bühler since 1998 as head of the Die Casting division
and from 2009 of the Advanced Materials division.
Concurrently headed the organization Bühler North
America from 2001 through 2005.
BRUNO MENDLER Grain Processing
(1954, Swiss)
Graduated in mechanical engineering from the Zurich
University of Applied Science in Winterthur. Obtained an
Executive MBA postgraduate degree from the University
of St.Gallen. Held various management positions in the
SIG Technology Group during 20 years, of which manag-
ing director of SIG Pack Systems AG from 1999 through
2003. With Bühler since 2003, from 2004 as head of the
Grain Processing division.
MARTIN MENRATH Manufacturing & Logistics
(1955, German)
Graduated in aerospace engineering from the University
of Engineering in Munich and obtained a doctorate in the
field of aircraft propulsion systems. Has accumulated
vast industrial management experience in production,
development, and logistics in companies such as MTU;
Rolls-Royce Germany – last as speaker of executive
management; and member of the executive management
of Krauss-Maffei Wegmann. Has headed the Manufac-
turing & Logistics division since 2008.
STEFAN SCHEIBER Food Processing
(1965, Swiss)
Graduated in business administration from the University
of Applied Science in St.Gallen and continued his
education at the IMD in Lausanne. With Bühler since
1988 in various management functions in East and South
Africa, Eastern Europe, Germany, and other countries.
Appointed head of the Brewing and Rice business units
in 1999, then assumed overall responsibility for Bühler in
Germany. From 2005 head of the Sales & Services
division and from 2009 of the Food Processing division.
CHRISTOF OSWALD* Human Resources
(1961, Swiss)
Served an apprenticeship with Bühler, continued his
education in commerce, held various functions in devel-
opment and customer projects for all divisions, broad
management experience, IT project manager, Controlling
unit manager, from 1993 through 2005 commercial
manager of the Manufacturing & Logistics division, from
2006 head of Corporate Human Resources.
IAN ROBERTS* Corporate Technology
(1970, British)
Studied chemical engineering and obtained a Ph.D. in
process engineering from the University of Wales, Great
Britain. Held various management positions at Nestlé
from 1997 through 2009, acting among other things as
internal Management Consultant at Swiss headquarters,
as Director of Innovation for Nestlé Mexico, and as Direc-
tor of the Chocolate Centre of Excellence in Switzerland.
With Bühler since 2010 as head of Corporate Technology.
*Members of the extended Executive Board
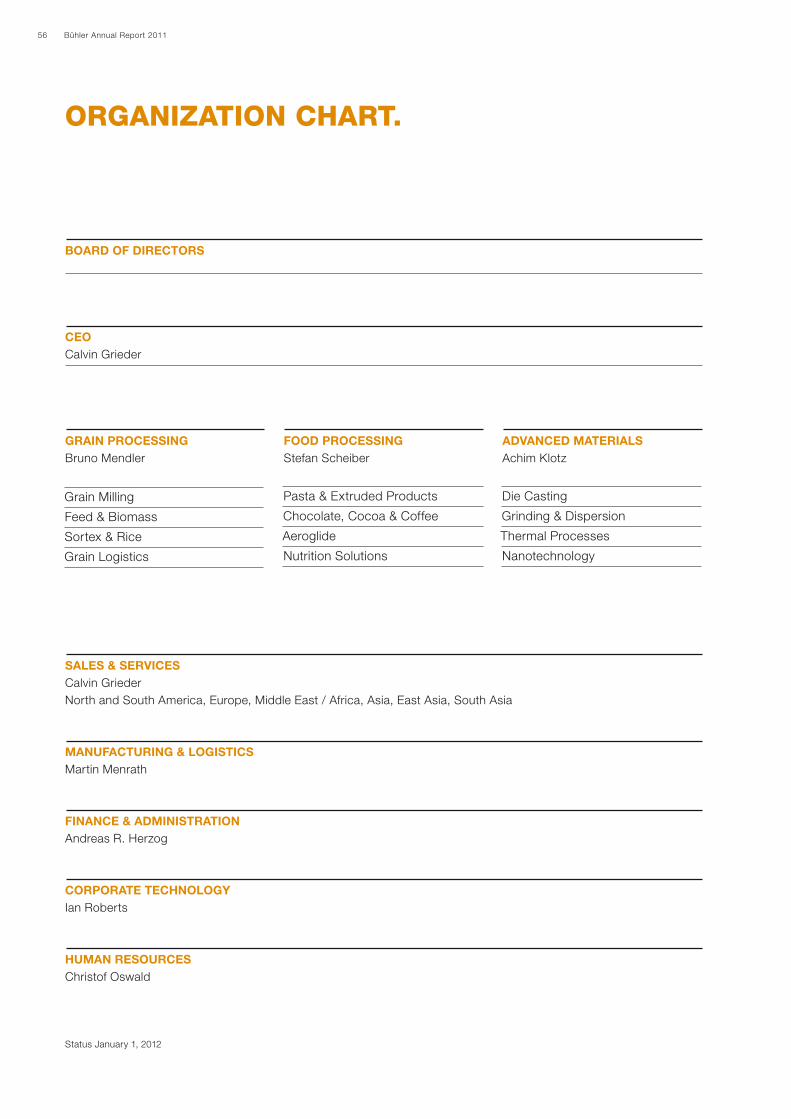
56 Bühler Annual Report 2011
ORGANIZATION CHART.
CEO
Calvin Grieder
BOARD OF DIRECTORS
SALES & SERVICES
Calvin Grieder
North and South America, Europe, Middle East / Africa, Asia, East Asia, South Asia
MANUFACTURING & LOGISTICS
Martin Menrath
FINANCE & ADMINISTRATION
Andreas R. Herzog
CORPORATE TECHNOLOGY
Ian Roberts
HUMAN RESOURCES
Christof Oswald
Grain Milling
Feed & Biomass
Sortex & Rice
Grain Logistics
Pasta & Extruded Products
Chocolate, Cocoa & Coffee
Aeroglide
Nutrition Solutions
Die Casting
Grinding & Dispersion
Thermal Processes
Nanotechnology
GRAIN PROCESSING
Bruno Mendler
FOOD PROCESSING
Stefan Scheiber
ADVANCED MATERIALS
Achim Klotz
Status January 1, 2012
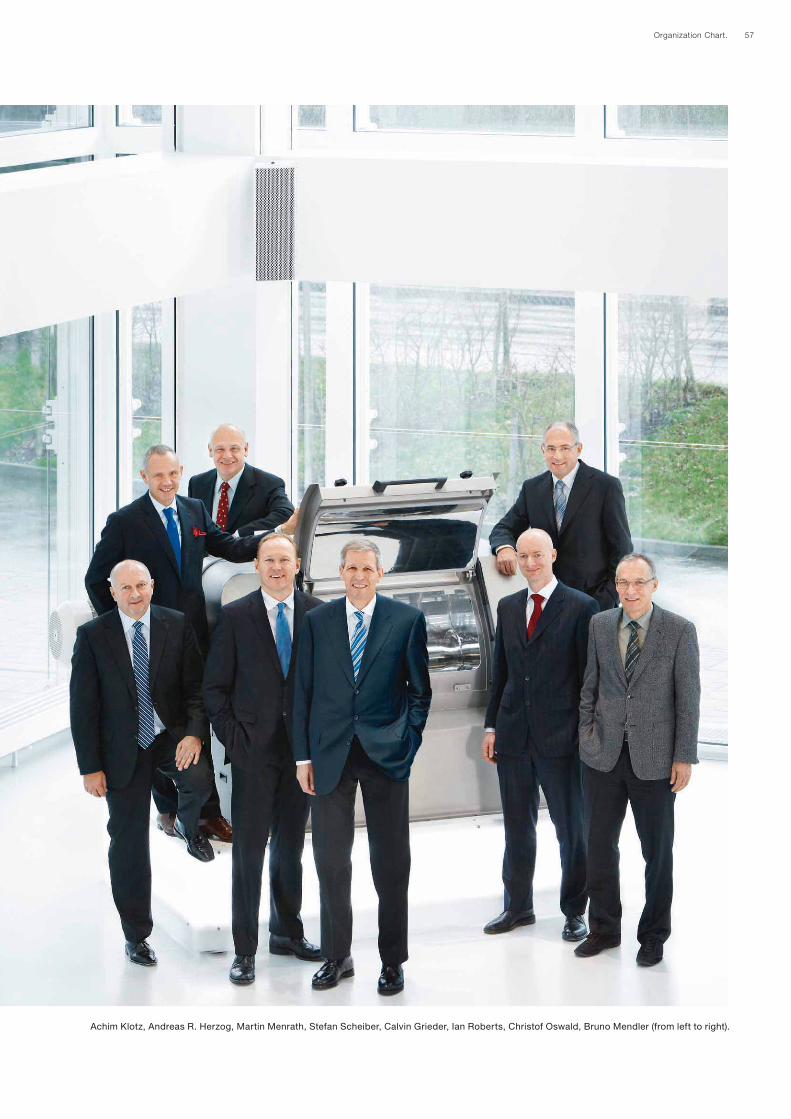
57Organization Chart.
Achim Klotz, Andreas R. Herzog, Martin Menrath, Stefan Scheiber, Calvin Grieder, Ian Roberts, Christof Oswald, Bruno Mendler (from left to right).
58 Bühler Annual Report 2011
URS BÜHLER *
(1943, Swiss)
Chairman
Graduate mechanical engineer from
the Swiss Federal Institute of Tech-
nology Zurich (ETH). After a number
of positions inside and outside
Switzerland, he was appointed to the
corporate management of Bühler AG
in 1975, in charge of sales and devel-
opment. From 1980 to 1984, he was
president of Bühler GmbH, Braun-
schweig. In 1986, Urs Bühler was
appointed CEO of Bühler, Uzwil. He
handed over the executive manage-
ment duties of the company to Calvin
Grieder at the start of 2001. Urs
Bühler has been a member of the
board since 1981, from 1991 as its
vice-chairman and since June 1994
as its chairman.
DR. BENNO SCHNEIDER *
(1942, Swiss)
Vice-Chairman
Obtained his doctorate in Law
(Dr. iur.) from the University of Berne
and became an attorney at law. After
filling various management functions
in law and administration, he was
appointed secretary general of the
Swiss Federal Department of Justice
and Police (EJPD) in 1976. In 1985,
he retired from this function to open
his own attorney’s office in St.Gallen,
which specializes in business and
corporate law. Beside his activity as
an attorney, Dr. Benno Schneider
is also an entrepreneur in the plastics
and construction industries. He
has been a member of the board
since 1992 and its vice-chairman
since 1994.
THE BOARD OF DIRECTORS.
The Board of Directors of Bühler Holding AG and Bühler AG includes eight
members. They are elected for a period of three years. The age limit is 70
years.
In 2011, the Board of Directors convened four times. The main items
discussed were strategic planning and review of risk management. The main
decisions concerned the acquisition of a company in Oldenzaal (Netherlands)
producing high-grade pelleting dies and rollers for the feed industries.
Furthermore, the Board of Directors decided to expand the existing production
site in Wuxi (China) and to acquire a new production site in Zamberk
(Czech Republic).
The Board Committee, which has three members, met five times, discussing
especially the internal audits and the introduction of a code of conduct.
* Board Committee
** Calvin Grieder is executive member of the board.
The other members are non-executive members of the board.
59The Board of Directors. 59
CALVIN GRIEDER **
(1955, American and Swiss)
Chief Executive Officer
He graduated in process engineering
from the Swiss Federal Institute of
Technology Zurich (ETH Zurich).
Then he occupied a number of
management positions in Swiss and
German companies engaged in the
fields of control engineering, automa-
tion, and plant construction. In these
functions, he was primarily in charge
of establishing and expanding inter-
national business. In 2001, Calvin
Grieder switched from Swisscom to
Bühler Group, which he has headed
as CEO since then. He is member of
the board of the companies Metall
Zug AG and Model AG.
HANS J. LÖLIGER *
(1943, Swiss)
Studied business administration in
London and Philadelphia. After ten
years in the storage and materials
handling equipment business, he
joined the Crown Cork & Seal Com-
pany, Philadelphia in 1977. For Crown
Holdings, he was active in various
international functions up to 1996, for
the last six years as President Global
Plastics Packaging and member of the
Group Executive Board. From 1996
to 2000, he was President and CEO
of the SICPA Group in Lausanne, the
global leader in the security inks busi-
ness. Since 2001 he has served on the
boards of several Swiss and interna-
tional companies. Hans J. Löliger has
been a member of the board of Bühler
since 2004.
PETER QUADRI
(1945, Swiss)
Graduated in 1969 in economy and
business administration from the
University of Zurich as lic. oec. publ.
In 1970, he joined IBM as a systems
engineer and specialist for software
and operating systems. Following
various positions in the U.S.,
Denmark, and Switzerland, he was
president of IBM Switzerland from
1998 to April 2006. Peter Quadri was
appointed member of the board of
Bühler in 2006.
JOSEF M. MÜLLER
(1947, Swiss)
With a degree in business adminis-
tration, he joined the Nestlé Group in
1972, with subsequent assignments
in Switzerland, Europe, the U.S., and
South Africa. He then spent several
years as a sales and marketing
manager in the Far East. From 1992
to 1995, he headed Nestlé Pakistan
and from 1995 to 1998 Nestlé Korea.
In mid-1998, Josef M. Müller took
charge of Nestlé China, and from
mid-2000 to 2007 of the Nestlé
Greater China Region. Josef M.
Müller has been a member of the
board of Bühler since 2007.
DR. KONRAD HUMMLER
(1953, Swiss)
He graduated in Law from the
University of Zurich and in Economic
Science from the U.S. University
of Rochester. In 1989, he moved
to Wegelin & Co. Private Bankers,
St.Gallen, where he has been partner
with unlimited liability since 1991.
In addition to his bank activities, he
is Member of the Board of various
companies, including Neue Zürcher
Zeitung (NZZ) and the German Stock
Exchange. Dr. Konrad Hummler was
appointed member of the board of
Bühler in 2010.
RUTH METZLER-ARNOLD
(1964, Swiss)
Studied legal science at the University
of Freiburg i. Ue. and is a Federally
Certified Auditor. From 1990 through
1999, she was active for Pricewater-
houseCoopers in St.Gallen. In addition,
she was Member of the Cantonal
Government of Appenzell IR (Director
of Finance) during three years. From
1999 through 2003, she headed the
Federal Department of Justice and
Police as Swiss Federal Councilor. Ruth
Metzler then held leading positions at
Novartis and was Member of the Board
and of the Audit Committee of SIX
Group. Today, she has her own consul-
tancy and is Chairperson of the Board
of Directors of OSEC, Zürich and Vice
Chairperson of the Board of Directors of
the Hospital Association AR. In Decem-
ber 2011, she was elected as Member
of the Board of Bühler.

61
FINANCIAL REPORT.
62 Financial commentary
64 Financial statements Bühler Group
65 Consolidated statement of income
66 Consolidated statement of comprehensive income
67 Consolidated statement of financial position
68 Consolidated statement of changes in equity
70 Consolidated statement of cash flows
71 Notes to the financial statements
102 Report of the statutory auditor
103 Financial statements Bühler Holding AG
104 Income statement Bühler Holding AG
105 Balance sheet Bühler Holding AG
106 Notes to the financial statements Bühler Holding AG
108 Group companies Bühler Holding AG
111 Report of the statutory auditor
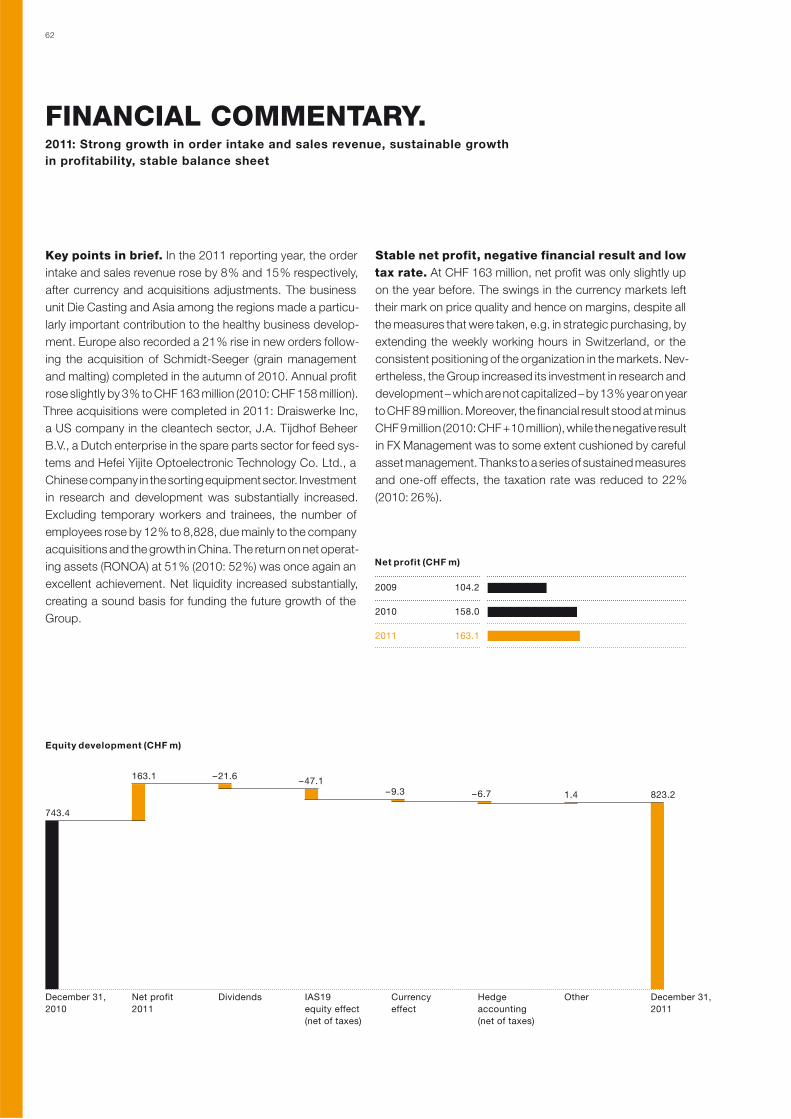
62
Key points in brief. In the 2011 reporting year, the order
intake and sales revenue rose by 8 % and 15 % respectively,
after currency and acquisitions adjustments. The business
unit Die Casting and Asia among the regions made a particu-
larly important contribution to the healthy business develop-
ment. Europe also recorded a 21 % rise in new orders follow-
ing the acquisition of Schmidt-Seeger (grain management
and malting) completed in the autumn of 2010. Annual profit
rose slightly by 3 % to CHF 163 million (2010: CHF 158 million).
Three acquisitions were completed in 2011: Draiswerke Inc,
a US company in the cleantech sector, J.A. Tijdhof Beheer
B.V., a Dutch enterprise in the spare parts sector for feed sys-
tems and Hefei Yijite Optoelectronic Technology Co. Ltd., a
Chinese company in the sorting equipment sector. Investment
in research and development was substantially increased.
Excluding temporary workers and trainees, the number of
employees rose by 12 % to 8,828, due mainly to the company
acquisitions and the growth in China. The return on net operat-
ing assets (RONOA) at 51 % (2010: 52 %) was once again an
excellent achievement. Net liquidity increased substantially,
creating a sound basis for funding the future growth of the
Group.
Stable net profit, negative financial result and low tax rate. At CHF 163 million, net profit was only slightly up
on the year before. The swings in the currency markets left
their mark on price quality and hence on margins, despite all
the measures that were taken, e.g. in strategic purchasing, by
extending the weekly working hours in Switzerland, or the
consistent positioning of the organization in the markets. Nev-
ertheless, the Group increased its investment in research and
development – which are not capitalized – by 13 % year on year
to CHF 89 million. Moreover, the financial result stood at minus
CHF 9 million (2010: CHF + 10 million), while the negative result
in FX Management was to some extent cushioned by careful
asset management. Thanks to a series of sustained measures
and one-off effects, the taxation rate was reduced to 22 %
(2010: 26 %).
Net profit (CHF m)
2009 104.2
2010 158.0
2011 163.1
FINANCIAL COMMENTARY. 2011: Strong growth in order intake and sales revenue, sustainable growth
in profitability, stable balance sheet
Equity development (CHF m)
December 31,
2010
Net profit
2011
Dividends IAS19
equity effect
(net of taxes)
Currency
effect
Hedge
accounting
(net of taxes)
Other December 31,
2011
– 47.1
743.4
163.1
– 9.3 – 6.7 1.4 823.2
– 21.6
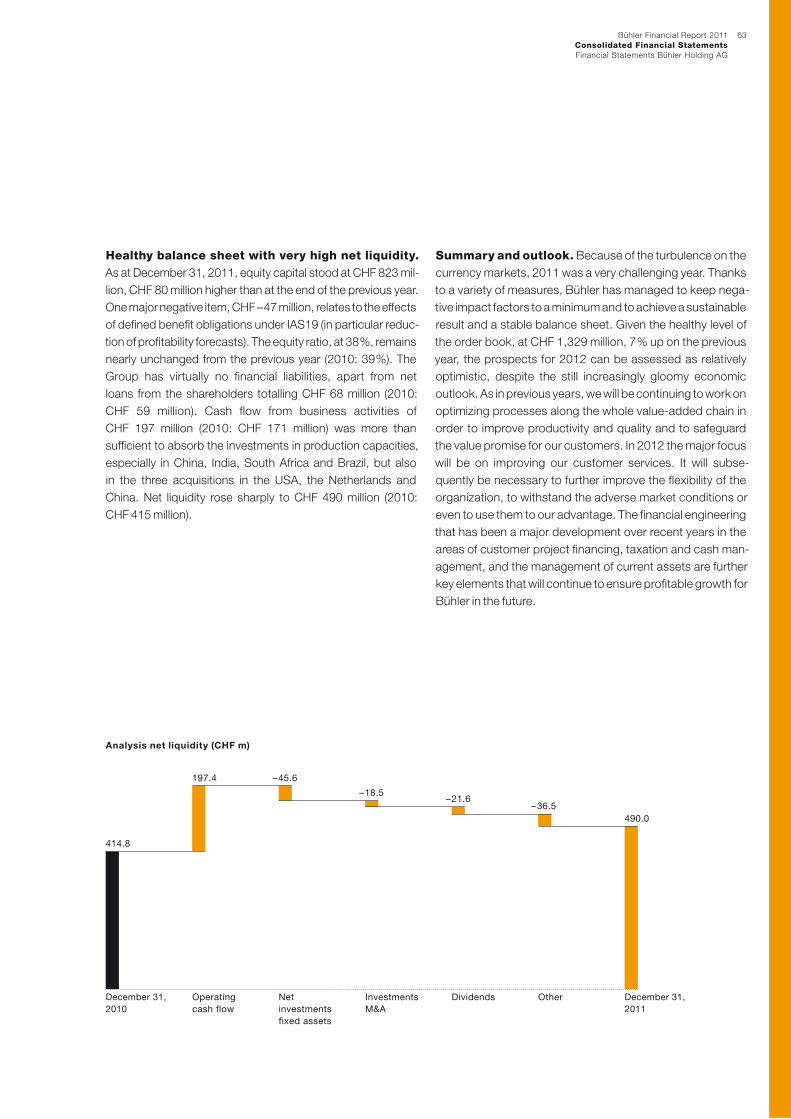
Bühler Financial Report 2011
Consolidated Financial StatementsFinancial Statements Bühler Holding AG
63
Healthy balance sheet with very high net liquidity. As at December 31, 2011, equity capital stood at CHF 823 mil-
lion, CHF 80 million higher than at the end of the previous year.
One major negative item, CHF – 47 million, relates to the effects
of defined benefit obligations under IAS19 (in particular reduc-
tion of profitability forecasts). The equity ratio, at 38 %, remains
nearly unchanged from the previous year (2010: 39 %). The
Group has virtually no financial liabilities, apart from net
loans from the shareholders totalling CHF 68 million (2010:
CHF 59 million). Cash flow from business activities of
CHF 197 million (2010: CHF 171 million) was more than
sufficient to absorb the investments in production capacities,
especially in China, India, South Africa and Brazil, but also
in the three acquisitions in the USA, the Netherlands and
China. Net liquidity rose sharply to CHF 490 million (2010:
CHF 415 million).
Summary and outlook. Because of the turbulence on the
currency markets, 2011 was a very challenging year. Thanks
to a variety of measures, Bühler has managed to keep nega-
tive impact factors to a minimum and to achieve a sustainable
result and a stable balance sheet. Given the healthy level of
the order book, at CHF 1,329 million, 7 % up on the previous
year, the prospects for 2012 can be assessed as relatively
optimistic, despite the still increasingly gloomy economic
outlook. As in previous years, we will be continuing to work on
optimizing processes along the whole value-added chain in
order to improve productivity and quality and to safeguard
the value promise for our customers. In 2012 the major focus
will be on improving our customer services. It will subse-
quently be necessary to further improve the flexibility of the
organization, to withstand the adverse market conditions or
even to use them to our advantage. The financial engineering
that has been a major development over recent years in the
areas of customer project financing, taxation and cash man-
agement, and the management of current assets are further
key elements that will continue to ensure profitable growth for
Bühler in the future.
Analysis net liquidity (CHF m)
December 31,
2010
Operating
cash flow
Net
investments
fixed assets
Investments
M&A
Dividends Other December 31,
2011
197.4
414.8
– 18.5– 21.6
– 36.5
490.0
– 45.6

64
FINANCIAL REPORT BÜHLER GROUP.
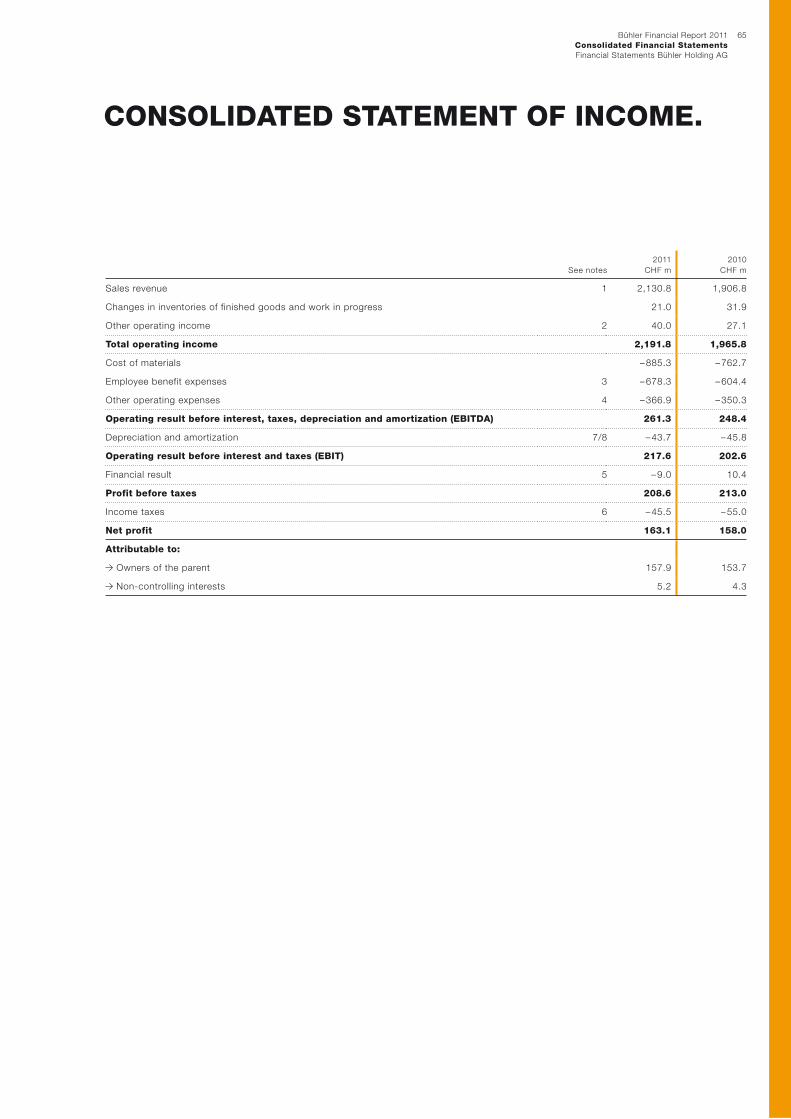
Bühler Financial Report 2011
Consolidated Financial StatementsFinancial Statements Bühler Holding AG
65
See notes
2011
CHF m
2010
CHF m
Sales revenue 1 2,130.8 1,906.8
Changes in inventories of finished goods and work in progress 21.0 31.9
Other operating income 2 40.0 27.1
Total operating income 2,191.8 1,965.8
Cost of materials – 885.3 – 762.7
Employee benefit expenses 3 – 678.3 – 604.4
Other operating expenses 4 – 366.9 – 350.3
Operating result before interest, taxes, depreciation and amortization (EBITDA) 261.3 248.4
Depreciation and amortization 7/8 – 43.7 – 45.8
Operating result before interest and taxes (EBIT) 217.6 202.6
Financial result 5 – 9.0 10.4
Profit before taxes 208.6 213.0
Income taxes 6 – 45.5 – 55.0
Net profit 163.1 158.0
Attributable to:
Owners of the parent 157.9 153.7
Non-controlling interests 5.2 4.3
CONSOLIDATED STATEMENT OF INCOME.
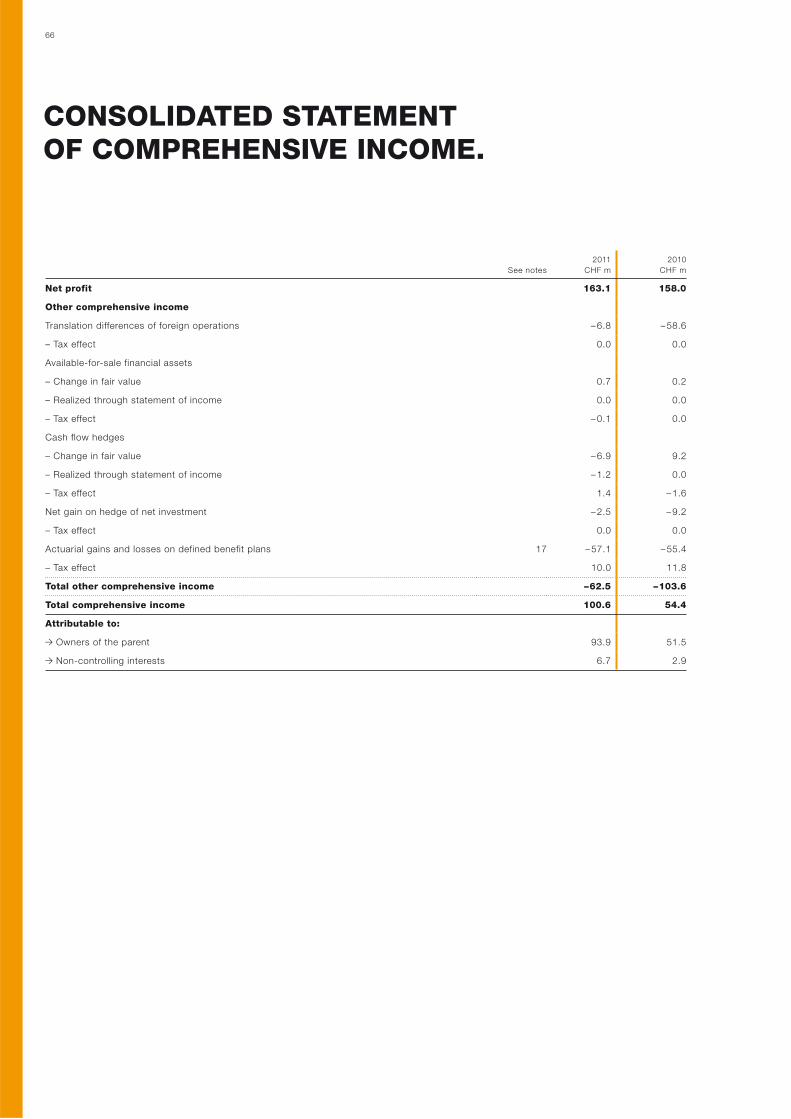
66
CONSOLIDATED STATEMENT OF COMPREHENSIVE INCOME.
See notes
2011
CHF m
2010
CHF m
Net profit 163.1 158.0
Other comprehensive income
Translation differences of foreign operations – 6.8 – 58.6
– Tax effect 0.0 0.0
Available-for-sale financial assets
– Change in fair value 0.7 0.2
– Realized through statement of income 0.0 0.0
– Tax effect – 0.1 0.0
Cash flow hedges
– Change in fair value – 6.9 9.2
– Realized through statement of income – 1.2 0.0
– Tax effect 1.4 – 1.6
Net gain on hedge of net investment – 2.5 – 9.2
– Tax effect 0.0 0.0
Actuarial gains and losses on defined benefit plans 17 – 57.1 – 55.4
– Tax effect 10.0 11.8
Total other comprehensive income – 62.5 – 103.6
Total comprehensive income 100.6 54.4
Attributable to:
Owners of the parent 93.9 51.5
Non-controlling interests 6.7 2.9
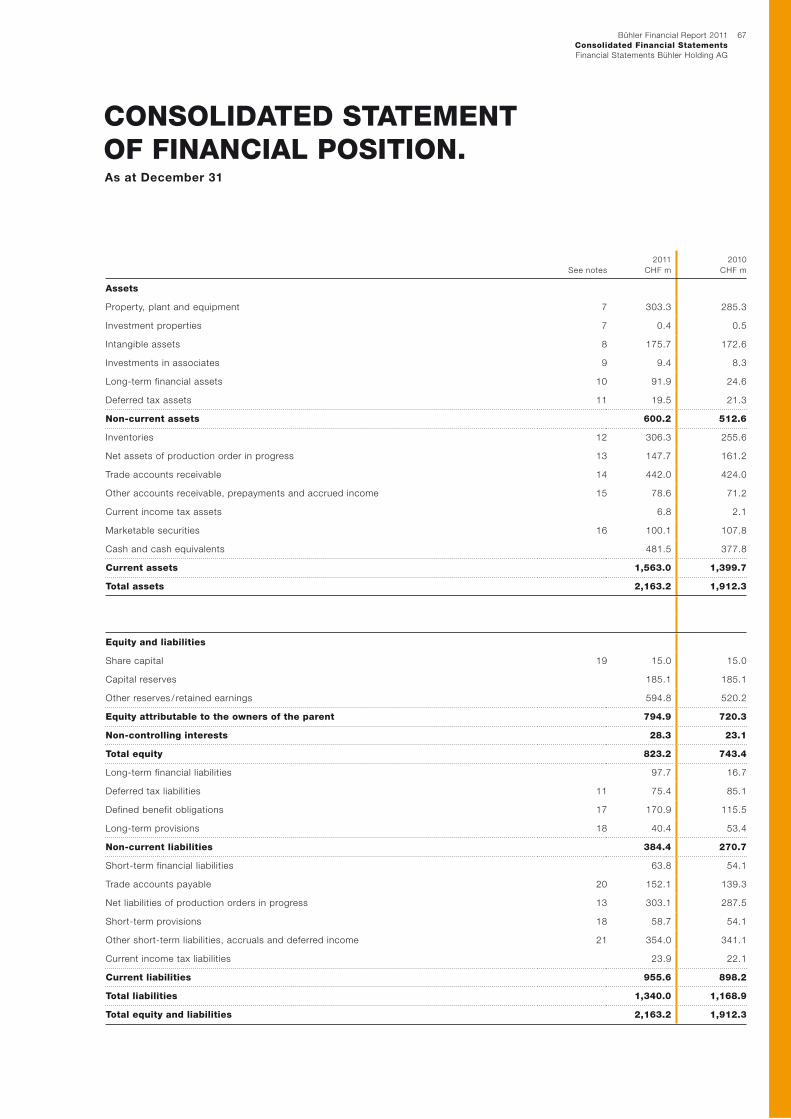
Bühler Financial Report 2011
Consolidated Financial StatementsFinancial Statements Bühler Holding AG
67
As at December 31
See notes
2011
CHF m
2010
CHF m
Assets
Property, plant and equipment 7 303.3 285.3
Investment properties 7 0.4 0.5
Intangible assets 8 175.7 172.6
Investments in associates 9 9.4 8.3
Long-term financial assets 10 91.9 24.6
Deferred tax assets 11 19.5 21.3
Non-current assets 600.2 512.6
Inventories 12 306.3 255.6
Net assets of production order in progress 13 147.7 161.2
Trade accounts receivable 14 442.0 424.0
Other accounts receivable, prepayments and accrued income 15 78.6 71.2
Current income tax assets 6.8 2.1
Marketable securities 16 100.1 107.8
Cash and cash equivalents 481.5 377.8
Current assets 1,563.0 1,399.7
Total assets 2,163.2 1,912.3
Equity and liabilities
Share capital 19 15.0 15.0
Capital reserves 185.1 185.1
Other reserves / retained earnings 594.8 520.2
Equity attributable to the owners of the parent 794.9 720.3
Non-controlling interests 28.3 23.1
Total equity 823.2 743.4
Long-term financial liabilities 97.7 16.7
Deferred tax liabilities 11 75.4 85.1
Defined benefit obligations 17 170.9 115.5
Long-term provisions 18 40.4 53.4
Non-current liabilities 384.4 270.7
Short-term financial liabilities 63.8 54.1
Trade accounts payable 20 152.1 139.3
Net liabilities of production orders in progress 13 303.1 287.5
Short-term provisions 18 58.7 54.1
Other short-term liabilities, accruals and deferred income 21 354.0 341.1
Current income tax liabilities 23.9 22.1
Current liabilities 955.6 898.2
Total liabilities 1,340.0 1,168.9
Total equity and liabilities 2,163.2 1,912.3
CONSOLIDATED STATEMENT OF FINANCIAL POSITION.
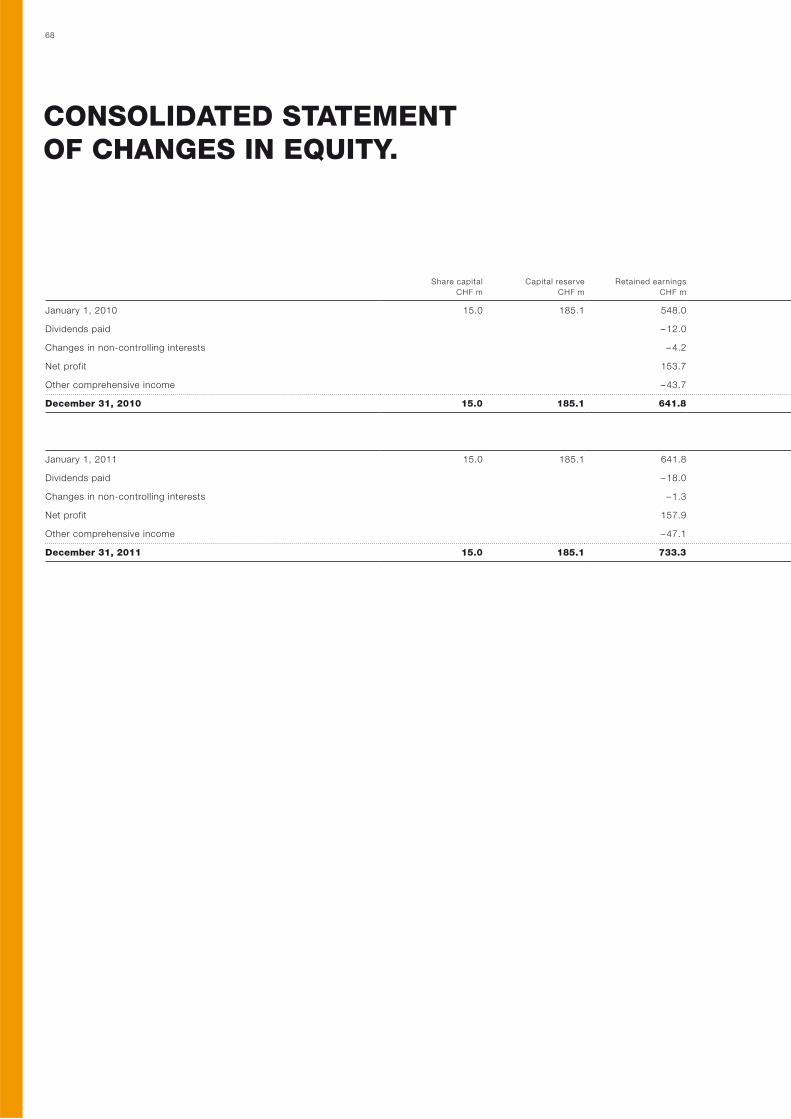
68
CONSOLIDATED STATEMENT OF CHANGES IN EQUITY.
Share capital
CHF m
Capital reserve
CHF m
Retained earnings
CHF m
January 1, 2010 15.0 185.1 548.0
Dividends paid – 12.0
Changes in non-controlling interests – 4.2
Net profit 153.7
Other comprehensive income – 43.7
December 31, 2010 15.0 185.1 641.8
January 1, 2011 15.0 185.1 641.8
Dividends paid – 18.0
Changes in non-controlling interests – 1.3
Net profit 157.9
Other comprehensive income – 47.1
December 31, 2011 15.0 185.1 733.3
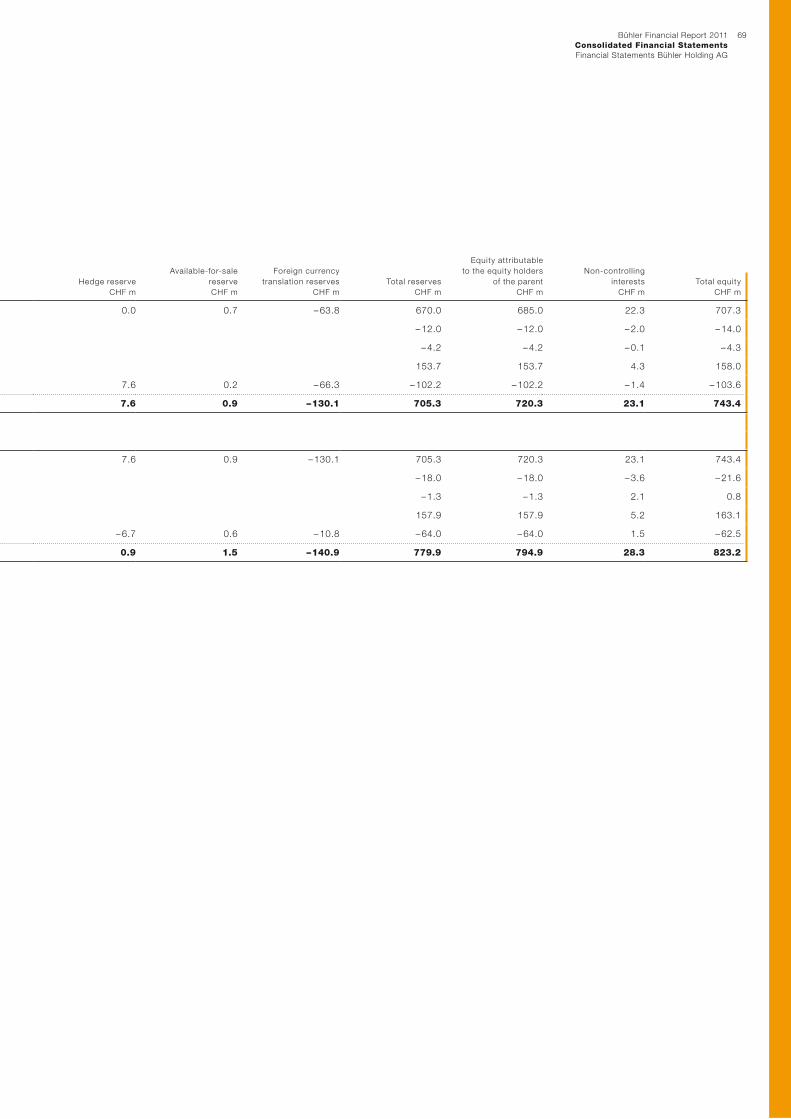
Bühler Financial Report 2011
Consolidated Financial StatementsFinancial Statements Bühler Holding AG
69
Hedge reserve
CHF m
Available-for-sale
reserve
CHF m
Foreign currency
translation reserves
CHF m
Total reserves
CHF m
Equity attr ibutable
to the equity holders
of the parent
CHF m
Non-controll ing
interests
CHF m
Total equity
CHF m
0.0 0.7 – 63.8 670.0 685.0 22.3 707.3
– 12.0 – 12.0 – 2.0 – 14.0
– 4.2 – 4.2 – 0.1 – 4.3
153.7 153.7 4.3 158.0
7.6 0.2 – 66.3 – 102.2 – 102.2 – 1.4 – 103.6
7.6 0.9 – 130.1 705.3 720.3 23.1 743.4
7.6 0.9 – 130.1 705.3 720.3 23.1 743.4
– 18.0 – 18.0 – 3.6 – 21.6
– 1.3 – 1.3 2.1 0.8
157.9 157.9 5.2 163.1
– 6.7 0.6 – 10.8 – 64.0 – 64.0 1.5 – 62.5
0.9 1.5 – 140.9 779.9 794.9 28.3 823.2
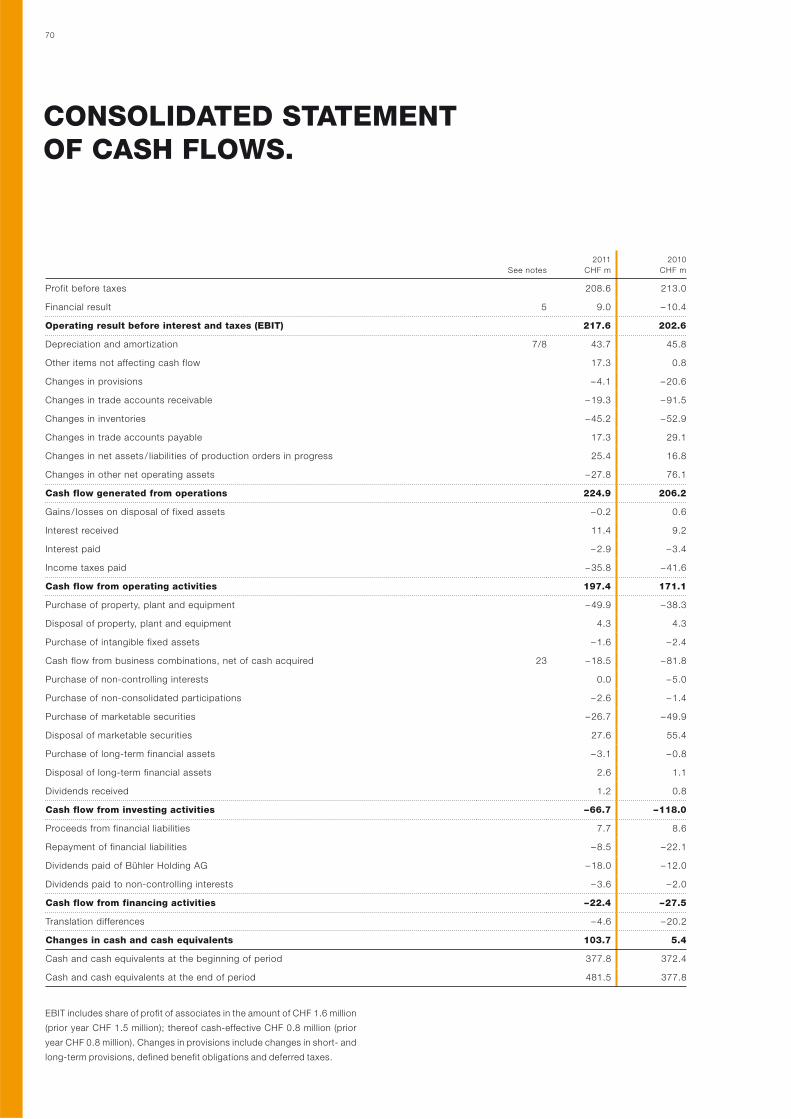
70
See notes
2011
CHF m
2010
CHF m
Profit before taxes 208.6 213.0
Financial result 5 9.0 – 10.4
Operating result before interest and taxes (EBIT) 217.6 202.6
Depreciation and amortization 7/8 43.7 45.8
Other items not affecting cash flow 17.3 0.8
Changes in provisions – 4.1 – 20.6
Changes in trade accounts receivable – 19.3 – 91.5
Changes in inventories – 45.2 – 52.9
Changes in trade accounts payable 17.3 29.1
Changes in net assets / liabilities of production orders in progress 25.4 16.8
Changes in other net operating assets – 27.8 76.1
Cash flow generated from operations 224.9 206.2
Gains / losses on disposal of fixed assets – 0.2 0.6
Interest received 11.4 9.2
Interest paid – 2.9 – 3.4
Income taxes paid – 35.8 – 41.6
Cash flow from operating activities 197.4 171.1
Purchase of property, plant and equipment – 49.9 – 38.3
Disposal of property, plant and equipment 4.3 4.3
Purchase of intangible fixed assets – 1.6 – 2.4
Cash flow from business combinations, net of cash acquired 23 – 18.5 – 81.8
Purchase of non-controlling interests 0.0 – 5.0
Purchase of non-consolidated participations – 2.6 – 1.4
Purchase of marketable securities – 26.7 – 49.9
Disposal of marketable securities 27.6 55.4
Purchase of long-term financial assets – 3.1 – 0.8
Disposal of long-term financial assets 2.6 1.1
Dividends received 1.2 0.8
Cash flow from investing activities – 66.7 – 118.0
Proceeds from financial liabilities 7.7 8.6
Repayment of financial liabilities – 8.5 – 22.1
Dividends paid of Bühler Holding AG – 18.0 – 12.0
Dividends paid to non-controlling interests – 3.6 – 2.0
Cash flow from financing activities – 22.4 – 27.5
Translation differences – 4.6 – 20.2
Changes in cash and cash equivalents 103.7 5.4
Cash and cash equivalents at the beginning of period 377.8 372.4
Cash and cash equivalents at the end of period 481.5 377.8
EBIT includes share of profit of associates in the amount of CHF 1.6 million
(prior year CHF 1.5 million); thereof cash-effective CHF 0.8 million (prior
year CHF 0.8 million). Changes in provisions include changes in short- and
long-term provisions, defined benefit obligations and deferred taxes.
CONSOLIDATED STATEMENT OF CASH FLOWS.
71Bühler Financial Report 2011
Consolidated Financial StatementsFinancial Statements Bühler Holding AG
NOTES TO THE FINANCIAL STATEMENTS.
Accounting policies
Basis of preparation. The consolidated financial statements of the
Bühler Group have been prepared in accordance with the International
Financial Reporting Standards (IFRS) and comply with the Swiss law.
The consolidated financial statements are based on the audited single-
entity financial statements of the Group companies, which are prepared
in accordance with consistent accounting principles.
The consolidated financial statements are prepared under the historical
cost convention. Any exceptions to this general rule are outlined in the
following accounting policies.
Adoption of revised and new IFRS and new interpretations. The
accounting policies adopted are consistent with those of previous fiscal
year, except for the following new and amended IFRS and IFRIC interpre-
tations effective as of January 1, 2011:
IAS 24 Related Party Disclosures (amendment). The definition of
a related party has been clarified to simplify the identification of related
party relationships, particularly in relation to significant influence and
joint control. A partial exemption from the disclosures has been included
for government-related entities, whereby the general disclosure require-
ments of IAS 24 will not apply.
IAS 32 Financial Instruments: Presentation (amendment). The defini-
tion of a financial liability has been amended to classify rights issues (and
certain options and warrants) as equity instruments if the rights are given
pro-rata to all of the existing owners of the same class of an entity’s non-
derivative equity instruments and the rights are to acquire a fixed number
of the entity’s own equity instruments for a fixed amount in any currency.
IFRIC 14 Prepayments of a Minimum Funding Requirement (amend-
ment). The amendment of IFRIC 14 provides further guidance on assess-
ing the recoverable amount of a net pension asset. The amendment per-
mits an entity to treat the prepayment of a minimum funding requirement
as an asset.
Improvements to IFRSs. The improvements to IFRSs were primarily is-
sued to remove inconsistencies and to clarify the wording. The adoption
of the following improvements resulted in changes to accounting policies,
but had no impact on the financial position or performance of the Group:
IFRS 3 Business Combinations – the measurement options available for
non-controlling interest (NCI) were amended. Only components of NCI
that constitute a present ownership interest that entitles their holder to
a proportionate share of the entity’s net assets in the event of liquidation
should be measured at either fair value or at the present ownership instru-
ments’ proportionate share of the acquiree’s identifiable net assets.
IAS 1 Presentation of Financial Statements – the amendment clarifies
that an entity may present an analysis of each component of other com-
prehensive income maybe either in the statement of changes in equity or
in the notes to the financial statements.
The adoption of the above stated revised and new IFRS and new interpre-
tations did not have any impact on the financial position or performance
of the Group.
Standards, interpretations, and amendments published but not
yet applied. Standards, interpretations, and amendments published
but not yet applied up to the date of issuance of the Group’s financial
statements are listed below. The Group intends to adopt these stan-
dards when they become effective.
IFRS 7 Financial Instruments: Disclosures (amendment). The
amendment requires additional quantitative and qualitative disclosures
relating to transfers of financial assets, when: a) financial assets are
derecognized in their entirety, but when the entity has continuing involve-
ment in them (e.g., options or guarantees on the transferred assets) or
when b) financial assets are not derecognized in their entirety. The
amendment becomes effective for annual periods beginning on or after
July 1, 2011.
IFRS 9 Financial Instruments: Classification and Measurement.
IFRS 9 as issued reflects the first phase of the IASBs work on the replace-
ment of IAS 39 and applies to classification and measurement of financial
assets and financial liabilities as defined in IAS 39. The standard is effec-
tive for annual periods beginning on or after January 1, 2013. In subse-
quent phases, the IASB will address hedge accounting and impairment of
financial assets. The Group is currently assessing the impact that IFRS 9
as issued (i.e. the first phase of the IFRS 9 project) will have on the finan-
cial position and performance.
IFRS 10 Consolidated Financial Statements. IFRS 10 establishes
a single control model that applies to all entities including special purpose
entities and replaces the portion of IAS 27 Consolidated and Separate
Financial Statements that addresses the accounting for consolidated fi-
nancial statements as well as SIC-12 Consolidation – Special Purpose
Entities. The changes introduced by IFRS 10 will require management to
exercise significant judgment to determine which entities are controlled,
and therefore are required to be consolidated by a parent. The applica-
tion of this new standard is not expected to impact the financial position
of the Group. This standard becomes effective for annual periods begin-
ning on or after January 1, 2013.
IFRS 11 Joint Arrangements. IFRS 11 replaces IAS 31 Interests in Joint
Ventures and SIC-13 Jointly-controlled Entities – Non-monetary Contri-
butions by Venturers. IFRS 11 removes the option to account for jointly
controlled entities (JCEs) using proportionate consolidation. Instead,
JCEs that meet the definition of a joint venture must be accounted for
using the equity method. The application of this new standard is not ex-
pected to impact the financial position of the Group. This standard be-
comes effective for annual periods beginning on or after January 1, 2013.
IFRS 12 Disclosure of Involvement with Other Entities. IFRS 12 in-
cludes all of the disclosures that were previously included in IAS 27 re-
lated to consolidated financial statements, as well as all of the disclo-
sures that were previously included in IAS 31 and IAS 28. These
disclosures relate to an entity’s interests in subsidiaries, joint arrange-
72
ments, associates and structured entities. A number of new disclosures
are also required. This standard becomes effective for annual periods
beginning on or after January 1, 2013.
IFRS 13 Fair Value Measurement. IFRS 13 establishes a single source
of guidance under IFRS for all fair value measurements. IFRS 13 does not
change when an entity is required to use fair value, but rather provides
guidance on how to measure fair value under IFRS when fair value is
required or permitted. The Group is currently assessing the impact that
this standard will have on the financial position and performance. This
standard becomes effective for annual periods beginning on or after
January 1, 2013.
IAS 1 Financial Statement Presentation: Presentation of Items of
Other Comprehensive Income (amendment). The amendments to
IAS 1 change the grouping of items presented in OCI. Items that could be
reclassified (or “recycled”) to profit or loss at a future point in time (for
example, upon derecognition or settlement) would be presented sepa-
rately from items that will never be reclassified. The amendment affects
presentation only and has therefore no impact on the Group’s financial
position or performance. The amendment becomes effective for annual
periods beginning on or after July 1, 2012.
IAS 12 Income Taxes: Recovery of Underlying Assets (amendment).
The amendment introduces a rebuttable presumption that deferred tax
on investment properties measured at fair value will be recognized on
a sale basis, unless an entity has a business model that would indicate
the investment property will be consumed in the business; if consumed,
an own use basis must be adopted. The amendment also introduces the
requirement that deferred tax on non-depreciable assets measured us-
ing the revaluation model in IAS 16 should always be measured on a sale
basis. The amendment is not expected to impact significantly the finan-
cial position of the Group and becomes effective for annual periods be-
ginning on or after January 1, 2012.
IAS 19 Employee Benefits (amendment). The IASB has issued numer-
ous amendments to IAS 19. These range from fundamental changes
such as removing the corridor mechanism and the concept of expected
returns on plan assets to simple clarifications and re-wording. The Group
has been already recognizing actuarial gains and losses directly in other
comprehensive income. The Group is currently assessing the full impact
of the remaining amendments. The amendment becomes effective for
annual periods beginning on or after January 1, 2013.
IAS 27 Separate Financial Statements (as revised in 2011). As a con-
sequence of the new IFRS 10 and IFRS 12, what remains of IAS 27 is
limited to accounting for subsidiaries, jointly controlled entities, and as-
sociates in separate financial statements. The Group does not present
separate financial statements. The amendment becomes effective for
annual periods beginning on or after January 1, 2013.
IAS 28 Investments in Associates and Joint Ventures (as revised in
2011). As a consequence of the new IFRS 11 and IFRS 12, IAS 28 has
been renamed IAS 28 Investments in Associates and Joint Ventures, and
describes the application of the equity method to investments in joint
ventures in addition to associates. The amendment becomes effective for
annual periods beginning on or after January 1, 2013 and will not have an
impact on the financial position and performance.
Use of estimates. The preparation of the consolidated financial state-
ments in accordance with IFRS requires management to make estimates
and assumptions that affect the reported amounts of revenue, expenses,
assets and liabilities, and the related disclosures at the date of the finan-
cial statements. These estimates are based on management’s best
knowledge of current events and possible future measures. However,
actual results could differ from those estimates.
If in future such estimates and assumptions, which are based on man-
agement’s best knowledge at the date of the financial statements,
deviate from the actual circumstances, the original estimates and as-
sumptions will be modified as appropriate in the year in which the circum-
stances change.
The estimates and assumptions that may have a higher risk of causing
a material adjustment to the carrying amounts of assets and liabilities
within the next financial periods relate primarily to long-term construction
contracts, goodwill, and to a lesser extent defined benefit obligations,
deferred tax assets, provisions and disclosure of contingent liabilities at
the end of the reporting period.
The Group accounts long-term construction contracts using the percent-
age-of-completion method. Revenue (including a carefully estimated
share of the outcome of the contract) is recognized by reference to the
stage of completion. The stage of completion is determined according to
the cost-to-cost method. The percentage-of-completion method in-
volves the use of estimates and forecasts concerning future costs; actual
costs may differ from these estimates. The forecasts are reviewed on
a regular basis and adapted where necessary. These changes affect costs,
the stage of completion, and both realized and anticipated profits. Any
changes in estimates are recognized in the period in which they occur.
Losses identified on long-term construction contracts are recognized as
an expense immediately. Losses on long-term construction contracts
occur when the expected contract costs exceed the expected revenue.
The Group tests annually whether goodwill has suffered any impairment
in accordance with its accounting policy. The recoverable amounts of
cash generating units have been determined based on value-in-use cal-
culations. These calculations require the use of estimates.
The cost of defined benefit pension plans and other long-term employee
benefits is determined using actuarial valuations. Actuarial valuations
involve making assumptions about discount rates, expected rates of re-
turn on plan assets, future salary increases, mortality rates and future
pension increases. Due to the long-term nature of these plans, such esti-
mates are subject to significant uncertainty.
The Group recognizes a collective valuation allowance based on its past
experience of warranty costs on projects with similar conditions. Other
known risks and risks related to projects with special conditions are esti-
mated on a case-by-case basis and measured individually. The actual
warranty costs incurred may differ from the costs provided for.
73Bühler Financial Report 2011
Consolidated Financial StatementsFinancial Statements Bühler Holding AG
All estimates mentioned above are further detailed in the corresponding
disclosures.
Scope of consolidation. These financial statements are the consoli-
dated financial statements of Bühler Holding AG, a company registered
in Uzwil, Switzerland and its subsidiaries. The list of subsidiaries is pre-
sented in the section “Group companies Bühler Holding AG”.
Principles of consolidation. Subsidiaries, which are those entities in
which the Group has an interest of more than one half of the voting rights
or otherwise has the power to exercise control over the operations, are
consolidated. Business combinations occurring on or after January 1,
2010, are accounted for using the acquisition method. The cost of an
acquisition is measured at the fair value of the consideration given at the
date of exchange. For each business combination, the acquirer mea-
sures the non-controlling interest in the acquiree either at fair value or at
the proportionate share of the acquiree’s identifiable net assets. Acquisi-
tion costs incurred are expensed in the statement of income. Identifiable
assets acquired and liabilities assumed in a business combination are
measured initially at fair value at the date of acquisition, irrespective of
the extent of any non-controlling interest assumed. When the Bühler
Group acquires a business, it assesses the financial assets and liabilities
assumed for appropriate classification and designation in accordance
with the contractual terms, economic circumstances and pertinent con-
ditions as at the acquisition date.
If the business combination is achieved in stages, the acquisition date fair
value of the Bühler Group’s previously held equity interest in the acquiree
is remeasured to fair value as at the acquisition date in the statement of
income.
Any contingent consideration to be transferred by the Group is recog-
nized at fair value at the acquisition date. Subsequent changes to the fair
value of the contingent consideration are recognized in the statement of
income.
Subsidiaries are consolidated from the date on which control is trans-
ferred to the Group and are no longer consolidated from the date that
control ceases.
All intercompany transactions and balances between Group companies
are eliminated in full.
Investments in associated companies are accounted for using the equity
method of accounting. These are companies over which the Group gen-
erally holds between 20 and 50 percent of the voting rights and has sig-
nificant influence but does not exercise control. Goodwill arising on the
acquisition is included in the carrying amount of the investment in associ-
ated companies. Equity accounting is discontinued when the carrying
amount of the investment together with any long-term interest in an as-
sociated company reaches zero, unless the Group has in addition either
incurred or guaranteed additional obligations in respect to the associat-
ed company.
Investments below 20 % are recognized at fair value and presented as
non-current financial assets. Changes in fair value are recognized di-
rectly in other comprehensive income.
Changes in the scope of consolidation. In the reporting period the
scope of consolidation changed as follows:
Additions.
Draiswerke Inc., United States of America
Buhler Asia Pte Ltd., Singapore
Buhler (Thailand) Ltd., Thailand
J.A. Tijdhof Beheer B.V., The Netherlands
Hefei Yijiete Optoelectronic Technology Co. Ltd, China
Foreign currency translation. The individual financial statements of the
Group companies are measured using the currency of the primary eco-
nomic environment in which the entity operates (“the functional currency”)
and are translated into Swiss francs for consolidation. Year-end exchange
rates are used for the statements of financial position and annual average
exchange rates for the statements of income. The consolidated statement
of cash flows is also translated at annual average exchange rates.
Differences resulting from the application of these different exchange
rates for the statement of financial position and the statement of income
and from equity transactions are recognized directly in the consolidated
statement of comprehensive income.
Goodwill arising on the acquisition of a foreign entity is expressed in the
functional currency of the foreign operation and is translated at the clos-
ing rate.
Foreign currency transactions translated into the functional currency are
accounted for at the exchange rates prevailing at the date of the transac-
tions; gains and losses resulting from the settlement of such transactions
and from the translation of monetary assets and liabilities denominated in
foreign currencies are recognized in the statement of income, except
when deferred outside the statement of income as qualifying cash flow
hedges.
Foreign exchange differences arising on monetary items that form part of
a company’s net investment in a foreign operation are reclassified to eq-
uity (currency translation adjustment) in the consolidated financial state-
ments and are only fully recycled to the statement of income when Bühler
Group loses control of a subsidiary or loses significant influence in an
associate.
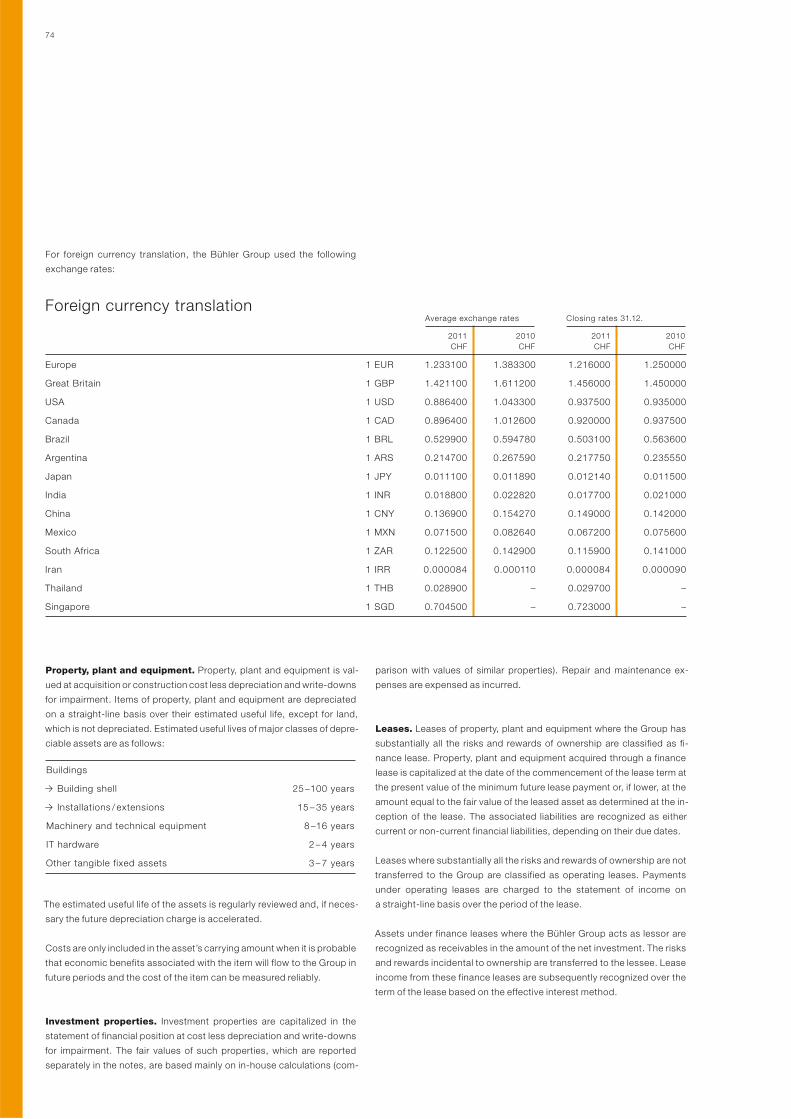
74
For foreign currency translation, the Bühler Group used the following
exchange rates:
2011 2010 2011 2010
CHF CHF CHF CHF
Europe 1 EUR 1.233100 1.383300 1.216000 1.250000
Great Britain 1 GBP 1.421100 1.611200 1.456000 1.450000
USA 1 USD 0.886400 1.043300 0.937500 0.935000
Canada 1 CAD 0.896400 1.012600 0.920000 0.937500
Brazil 1 BRL 0.529900 0.594780 0.503100 0.563600
Argentina 1 ARS 0.214700 0.267590 0.217750 0.235550
Japan 1 JPY 0.011100 0.011890 0.012140 0.011500
India 1 INR 0.018800 0.022820 0.017700 0.021000
China 1 CNY 0.136900 0.154270 0.149000 0.142000
Mexico 1 MXN 0.071500 0.082640 0.067200 0.075600
South Africa 1 ZAR 0.122500 0.142900 0.115900 0.141000
Iran 1 IRR 0.000084 0.000110 0.000084 0.000090
Thailand 1 THB 0.028900 – 0.029700 –
Singapore 1 SGD 0.704500 – 0.723000 –
Foreign currency translationClosing rates 31.12.Average exchange rates
Property, plant and equipment. Property, plant and equipment is val-
ued at acquisition or construction cost less depreciation and write-downs
for impairment. Items of property, plant and equipment are depreciated
on a straight-line basis over their estimated useful life, except for land,
which is not depreciated. Estimated useful lives of major classes of depre-
ciable assets are as follows:
Buildings
Building shell 25 –100 years
Installations / extensions 15 – 35 years
Machinery and technical equipment 8 –16 years
IT hardware 2 – 4 years
Other tangible fixed assets 3 – 7 years
The estimated useful life of the assets is regularly reviewed and, if neces-
sary the future depreciation charge is accelerated.
Costs are only included in the asset’s carrying amount when it is probable
that economic benefits associated with the item will flow to the Group in
future periods and the cost of the item can be measured reliably.
Investment properties. Investment properties are capitalized in the
statement of financial position at cost less depreciation and write-downs
for impairment. The fair values of such properties, which are reported
separately in the notes, are based mainly on in-house calculations (com-
parison with values of similar properties). Repair and maintenance ex-
penses are expensed as incurred.
Leases. Leases of property, plant and equipment where the Group has
substantially all the risks and rewards of ownership are classified as fi-
nance lease. Property, plant and equipment acquired through a finance
lease is capitalized at the date of the commencement of the lease term at
the present value of the minimum future lease payment or, if lower, at the
amount equal to the fair value of the leased asset as determined at the in-
ception of the lease. The associated liabilities are recognized as either
current or non-current financial liabilities, depending on their due dates.
Leases where substantially all the risks and rewards of ownership are not
transferred to the Group are classified as operating leases. Payments
under operating leases are charged to the statement of income on
a straight-line basis over the period of the lease.
Assets under finance leases where the Bühler Group acts as lessor are
recognized as receivables in the amount of the net investment. The risks
and rewards incidental to ownership are transferred to the lessee. Lease
income from these finance leases are subsequently recognized over the
term of the lease based on the effective interest method.
75Bühler Financial Report 2011
Consolidated Financial StatementsFinancial Statements Bühler Holding AG
Intangible assets. Goodwill represents the excess of the aggregate of
the consideration transferred and the amount recognized for the non-
controlling interest over the fair value of the net identifiable assets ac-
quired and liabilities assumed. Goodwill on acquisitions of subsidiaries
and interests in joint ventures is included in intangible assets. Goodwill
on acquisitions of associates is included in investments in associates.
Goodwill is tested annually for impairment or whenever there are impair-
ment indicators and is carried at cost less accumulated impairment
losses.
If the consideration transferred is less than the fair value of the net assets
of the subsidiary acquired, the difference is recognized directly in the
statement of income.
On disposal of a subsidiary, associate or joint venture, the related good-
will is included in the determination of profit or loss on disposal.
Goodwill on acquisitions of subsidiaries and interests in joint ventures
is allocated to cash generating units for the purpose of impairment test-
ing. Impairment losses relating to goodwill cannot be reversed in future
periods.
Acquired patents, licenses, trademarks, and similar rights are initially re-
corded at cost and amortized on a straight-line basis over their estimated
useful life or a period not exceeding 15 years. Intangible assets acquired
through business combinations are carried in the statement of financial
position at the fair value allocated in the acquisition accounting and am-
ortized over their estimated useful life.
Impairment of assets. At each reporting date, the Group assesses
whether there is any indication that an asset may be impaired. If any such
indication exists, the recoverable amount of the asset is estimated in order
to determine the extent of the impairment loss, if any. Where it is not pos-
sible to estimate the recoverable amount of an individual asset, the Group
estimates the recoverable amount of the smallest cash generating unit to
which the asset belongs. The recoverable amount is the higher of an as-
set’s or cash generating unit’s fair value less costs to sell and its value in
use. If the recoverable amount of an asset or cash generating unit is esti-
mated to be less than its carrying amount, the carrying amount of the as-
set or cash generating unit is reduced to its recoverable amount. Impair-
ment losses are recognized immediately in the statement of income.
Where an impairment loss subsequently reverses, the carrying amount of
the asset or cash generating unit is increased to the revised estimate of
its recoverable amount. However, this increased amount cannot exceed
the carrying amount that would have been determined had no impairment
loss been recognized for that asset or cash generating unit in prior peri-
ods. A reversal of an impairment loss is recognized immediately in the
statement of income.
Financial assets and liabilities. A distinction is made between the fol-
lowing four categories:
Financial assets “at fair value through profit or loss” are generally
acquired with the intention of generating a profit from short-term
fluctuations in price.
“Held to maturity” investments are those with a fixed maturity
that the Bühler Group has the positive intention and ability to hold
to maturity.
“Loans and receivables” include loans granted and accounts
receivable.
All other financial assets are classified as “available for sale”.
Financial assets “at fair value through profit or loss” are recognized on
acquisition at cost and subsequently at fair value, with fair value changes
recognized in the financial result in the period in which they arise.
“Held to maturity” investments as well as “Loans and receivables” are
measured at amortized costs using the effective interest method.
“Available for sale” financial assets are measured subsequent to their
initial recognition at fair value, with unrealized gains and losses recog-
nized in other comprehensice income. When the financial asset is either
impaired or disposed of, the cumulative gain or loss previously recog-
nized in the other comprehensive income is reclassified from equity to
the statement of income.
Purchases and sales are recognized at the trade date rather than at the
settlement date.
The fair values of financial assets that are traded in an active market are
based on the fair values at the end of the reporting period. The fair values
of financial assets that are not traded in an active market are determined
using established valuation techniques.
Financial liabilities consist mainly of borrowings, which are recognized
initially at the proceeds received, net of transaction cost incurred. Subse-
quently, the borrowings are measured at amortized cost using the effec-
tive interest method with any difference between net proceeds and the
principal value due on redemption being recognized in the statement of
income over the term of the borrowings.
Financial assets are derecognized when the Bühler Group relinquishes
control over them, that is when the contractual cash flows from the asset
are sold or expire. Financial liabilities are derecognized when its contrac-
tual obligations are discharged, cancelled or expired.
Derivative financial instruments and hedging accounting. Deriva-
tive financial instruments are initially recognized at cost and subsequent-
ly at fair value (replacement cost). The method applied in recognizing the
resulting profits or losses depends on whether a derivative was desig-
nated as being used for hedging purposes, and if so, on the type of posi-
tion being hedged. Certain derivatives may be used to hedge foreign
currency risks in connection with a transaction that is highly likely to take
place in future, or to hedge a fixed commitment (hedging of cash flows).
When the hedge is implemented, the Group documents the relationship
between the hedging instrument and the risk being hedged, as well as
76
setting out risk management objectives and strategies. Furthermore, the
Group records its assessment of the effectiveness of the hedging instru-
ment with respect to the hedged cash flows, both when the hedging
transaction is concluded and on an ongoing basis.
The full fair value of a hedging derivative is classified as a non-current
asset or liability when the remaining maturity of the hedged item is more
than twelve months; it is classified as a current asset or liability when the
remaining maturity of the hedged item is less than twelve months. Trading
derivatives are classified as a current asset or liability.
The hedging of cash flows is undertaken for certain anticipated Group-
internal transactions as well as for the foreign currency risk of firm com-
mitments. The effective portion of the change in fair value of derivatives
used for the hedging of cash flows is recognized in other comprehensive
income. The ineffective portion of the hedging instrument is immediately
recognized as financial result in the statement of income.
Amounts accumulated in other comprehensive income are recycled in
the statement of income in the periods when the hedged item affects
profit or loss. When a forecasted transaction is no longer expected to
occur, the cumulative gain or loss that was recorded in other comprehen-
sive income is immediately transferred to the statement of income.
Derivatives not designated as hedging instruments are accounted for at
fair value through profit or loss. Changes in the fair value of these deriva-
tive instruments are recognized immediately as financial result in the
statement of income.
Non-current assets (or disposal groups) classified as held for sale.
Any non-current assets held for sale and discontinued operations are
presented under this item. This includes all those assets associated with
the discontinuation of entire lines of business or geographical areas of
operation, which are to be realized through a sale transaction rather than
through continued use. Reclassifications are only made if management is
committed to the sale and has started seeking buyers. In addition, the
asset or disposal group must be available for sale in its current condition
and its sale must be highly probable within one year. Non-current assets
or disposal groups classified as held for sale are no longer depreciated. If
necessary, they are written down for impairment.
The income and expenses of discontinued operations are separated from
ordinary income and expenses in the statement of income for both the
reporting period and the prior-year down to the “profit after tax” level. The
resulting gain or loss (after taxes) is presented separately in the state-
ment of income.
Inventories. Inventories are carried at the lower cost and net realizable
value. The cost of finished goods, semi-finished goods and work in prog-
ress includes raw materials, direct labor and other directly attributable
costs and overheads based on the normal capacity of production facili-
ties; excluding borrowing costs. Cost is determined using the weighted
average method. Net realizable value is the estimated selling price less
cost to completion and selling expenses. Obsolete inventories and
goods with a low rate of inventory turnover are written down.
Advance payments to suppliers are also included in inventories.
Accounts receivable. Trade and other accounts receivable are carried
at the original invoice amount less allowances made for doubtful ac-
counts, trade discounts, volume rebates and similar items. Extended
customer finance refinanced using the Group’s own funds as part of its
treasury strategy is included in this item.
Marketable securities. Marketable securities include those that are
held for trading without participation features. Securities included in fi-
nancial assets are categorized as available for sale.
Cash and cash equivalents. Cash and cash equivalents include cash on
hand, time, call and current balances with banks and similar institutions.
Cash and cash equivalents are carried at nominal amount. Such balances
are only reported as cash and cash equivalents if they are readily convert-
ible to known amounts of cash, are subject to insignificant risk of changes
in value and have a maturity of three months or less from the date of acqui-
sition.
Employee benefits – defined benefit plans. Some Group companies
provide defined benefit pension plans for employees. Independent actu-
aries value the defined benefit obligations on a regular basis. The obliga-
tion and expenses of pension benefits are determined using the projected
unit credit method. The projected unit credit method considers each pe-
riod of service as giving rise to an additional unit of benefit entitlement
and measures each unit separately to build up the final obligation. Past
service costs are recognized on a straight-line basis over the average
period until the amended benefits become vested. Gains or losses on the
curtailment or settlement of pension benefits are recognized when the
curtailment or settlement occurs.
Actuarial gains or losses, which consist of differences between assump-
tions and actual experiences and the effects of changes in actuarial as-
sumptions, are recorded in the other comprehensive income.
The pension obligation is measured at the present value of estimated fu-
ture cash flows using a discount rate that is similar to the interest rate on
high quality corporate bonds where the currency and terms of the corpo-
rate bonds are consistent with the currency and estimated terms of the
defined benefit obligation.
A net pension asset is recorded only to the extent that it does not exceed
the present value of any economic benefits available in the form of re-
funds from the plan or reductions in future contributions to the plan.
Pension assets and pension liabilities in different defined benefit plans
are not offset unless the Group has a legally enforceable right to use the
surplus in one plan to settle obligations in the other plan.
77Bühler Financial Report 2011
Consolidated Financial StatementsFinancial Statements Bühler Holding AG
Employee benefits – defined contribution plans. In addition to the
defined benefit plans described above, some Group companies sponsor
defined contribution plans based on local practices and regulations. The
Group’s contributions to defined contribution plans are charged to the
statement of income in the period to which the contributions relate.
Employee benefits – other long-term employment benefits. Other
long-term employment benefits include jubilee, early retirement or other
long service benefits, as well as deferred compensation, if not due to be
settled within twelve months after the year end.
The Bühler Group operates deferred compensation plans for members of
the management. The deferred compensation plans comprise a vesting
period of three years and an execution period of ten years from the grant
date. The amounts are charged to the statement of income over the rel-
evant vesting periods and are adjusted to reflect actual and expected
levels of vesting. The value of the deferred compensation is determined
annually based on the Group’s annual profit for the three preceding years
and equity at year end.
The obligations for other long-term employment benefits are disclosed as
provisions for personnel expenses. The measurement of these obliga-
tions differs from defined benefit plans in that all actuarial gains and
losses are recognized immediately in the statement of income.
Provisions. Provisions are recognized when Bühler has a legal or con-
structive obligation arising from past events, an outflow of resources em-
bodying economic benefits to settle the obligation is probable, and a reli-
able estimate can be made of this amount.
Taxes. Income taxes comprise the tax expense in respect of all recog-
nized profits for the reporting period. They include current and deferred
income taxes. Current income taxes are calculated on taxable profit.
Provisions for deferred taxes are calculated according to the liability
method. Deferred taxes are recognized for temporary differences be-
tween the carrying amounts of assets and liabilities in the consolidated
statement of financial position and their tax base taking into account ac-
tual or expected local tax rates. Changes in deferred tax balances are
recognized in the statement of income, except when they relate to items
recognized outside the statement of income, in which case the deferred
tax is treated accordingly.
Deferred tax assets are only recognized for temporary differences and
unused tax loss carry-forwards to the extent that it is probable that future
taxable profit will be available against which temporary differences or
unused tax losses can be utilized.
Borrowing costs. Borrowing costs which are directly attributable to the
acquisition, construction or production of a qualified asset are capitalized
as part of the cost of that asset.
Research and development costs. Research costs are recognized in
the statement of income in the period in which they are incurred. Develop-
ment costs are capitalized only if, and to the extent that, the IFRS criteria
are met and it is highly probable that the present value of the expected
returns will exceed the development costs. Capitalized development
costs are amortized on a systematic basis over the period in which the
returns are expected to flow to the Group.
Construction contracts, revenue and profit recognition. Revenue is
recognized when it is probable that the economic benefits associated
with the transaction will flow to the entity and the amount of the revenue
can be measured reliably. Revenue is measured at the fair value of the
consideration received net of sales taxes and discounts. Revenue from
the sale of goods is recognized when delivery has taken place and the
transfer of risks and rewards of ownership has been completed.
Long-term construction contracts are accounted for using the percent-
age-of-completion method. The stage of completion is determined using
the cost-to-cost method. The costs include a risk premium. The consoli-
dated statement of income includes the pro-rata revenue and a carefully
estimated share of the outcome of the contract; the consolidated state-
ment of financial position includes the relevant assets or liabilities after
offsetting advance payments.
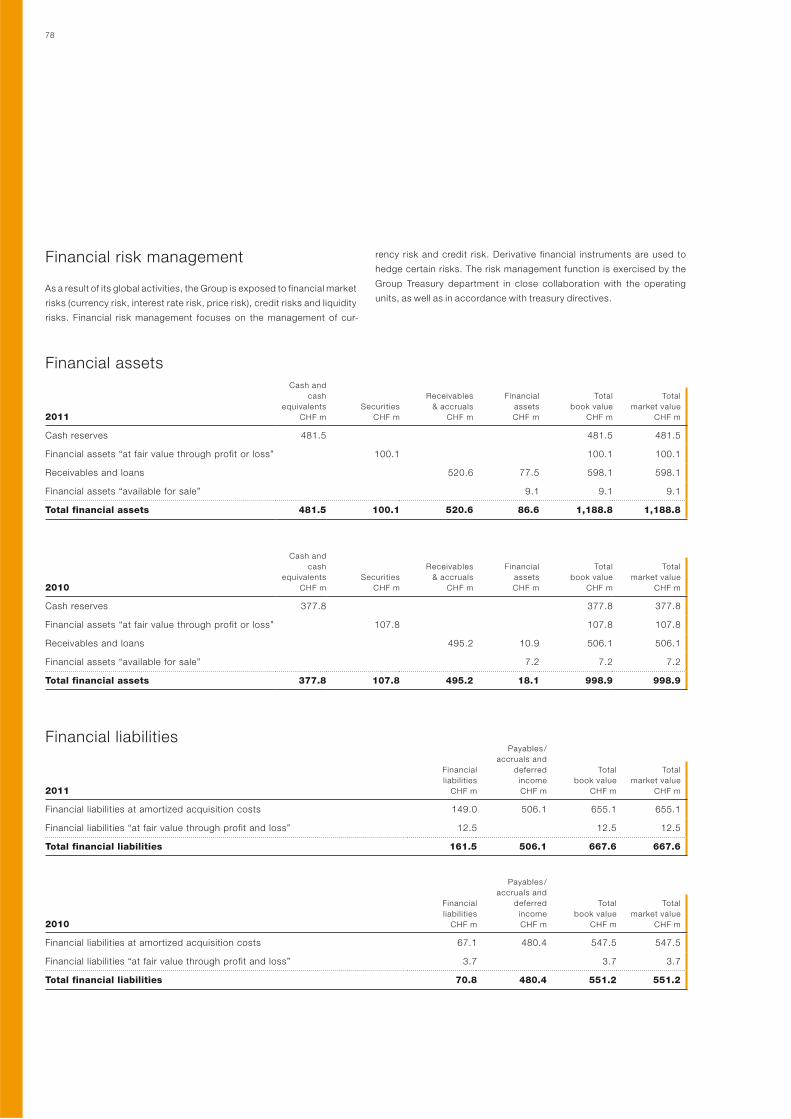
78
Financial assets
Cash and
cash
equivalents
CHF m
Securities
CHF m
Receivables
& accruals
CHF m
Financial
assets
CHF m
Total
book value
CHF m
2011
Total
market value
CHF m
Cash reserves 481.5 481.5 481.5
Financial assets “at fair value through profit or loss” 100.1 100.1 100.1
Receivables and loans 520.6 77.5 598.1 598.1
Financial assets “available for sale” 9.1 9.1 9.1
Total financial assets 481.5 100.1 520.6 86.6 1,188.8 1,188.8
Cash and
cash
equivalents
CHF m
Securities
CHF m
Receivables
& accruals
CHF m
Financial
assets
CHF m
Total
book value
CHF m
2010
Total
market value
CHF m
Cash reserves 377.8 377.8 377.8
Financial assets “at fair value through profit or loss” 107.8 107.8 107.8
Receivables and loans 495.2 10.9 506.1 506.1
Financial assets “available for sale” 7.2 7.2 7.2
Total financial assets 377.8 107.8 495.2 18.1 998.9 998.9
Financial liabilities
Financial
l iabil ities
CHF m
Payables /
accruals and
deferred
income
CHF m
Total
book value
CHF m2011
Total
market value
CHF m
Financial liabilities at amortized acquisition costs 149.0 506.1 655.1 655.1
Financial liabilities “at fair value through profit and loss” 12.5 12.5 12.5
Total financial liabilities 161.5 506.1 667.6 667.6
Financial
l iabil ities
CHF m
Payables /
accruals and
deferred
income
CHF m
Total
book value
CHF m2010
Total
market value
CHF m
Financial liabilities at amortized acquisition costs 67.1 480.4 547.5 547.5
Financial liabilities “at fair value through profit and loss” 3.7 3.7 3.7
Total financial liabilities 70.8 480.4 551.2 551.2
Financial risk management
As a result of its global activities, the Group is exposed to financial market
risks (currency risk, interest rate risk, price risk), credit risks and liquidity
risks. Financial risk management focuses on the management of cur-
rency risk and credit risk. Derivative financial instruments are used to
hedge certain risks. The risk management function is exercised by the
Group Treasury department in close collaboration with the operating
units, as well as in accordance with treasury directives.
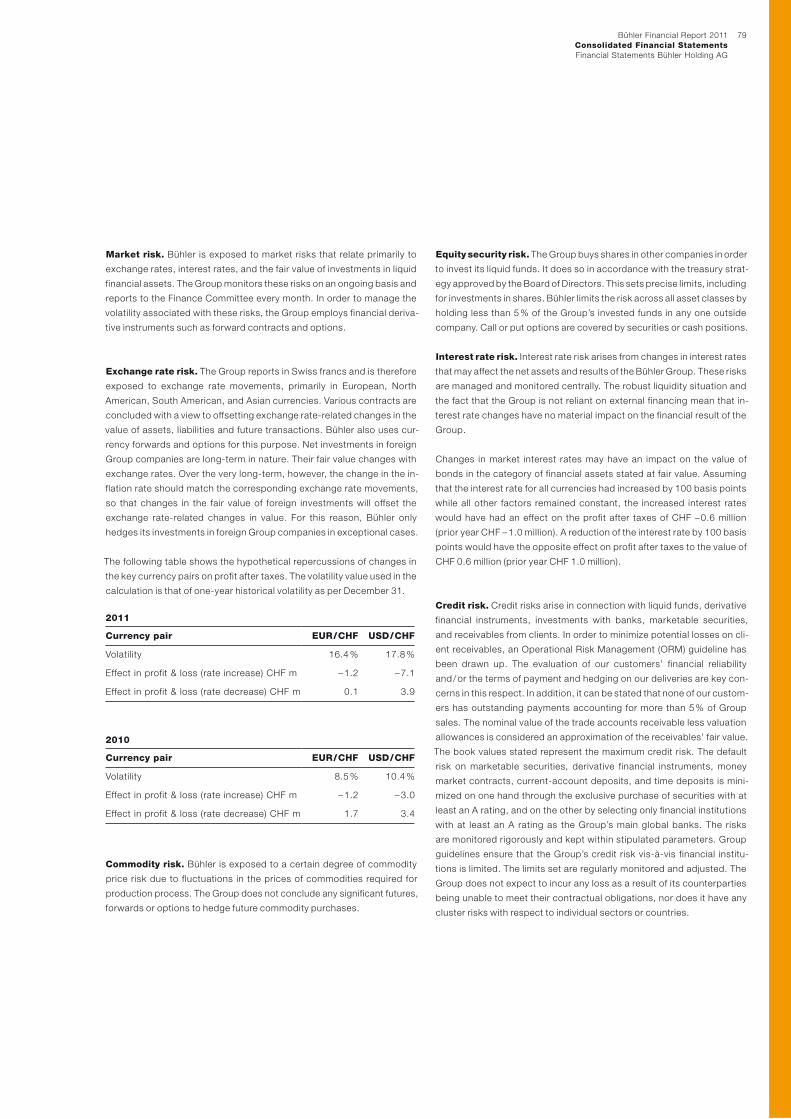
79Bühler Financial Report 2011
Consolidated Financial StatementsFinancial Statements Bühler Holding AG
Market risk. Bühler is exposed to market risks that relate primarily to
exchange rates, interest rates, and the fair value of investments in liquid
financial assets. The Group monitors these risks on an ongoing basis and
reports to the Finance Committee every month. In order to manage the
volatility associated with these risks, the Group employs financial deriva-
tive instruments such as forward contracts and options.
Exchange rate risk. The Group reports in Swiss francs and is therefore
exposed to exchange rate movements, primarily in European, North
American, South American, and Asian currencies. Various contracts are
concluded with a view to offsetting exchange rate-related changes in the
value of assets, liabilities and future transactions. Bühler also uses cur-
rency forwards and options for this purpose. Net investments in foreign
Group companies are long-term in nature. Their fair value changes with
exchange rates. Over the very long-term, however, the change in the in-
flation rate should match the corresponding exchange rate movements,
so that changes in the fair value of foreign investments will offset the
exchange rate-related changes in value. For this reason, Bühler only
hedges its investments in foreign Group companies in exceptional cases.
The following table shows the hypothetical repercussions of changes in
the key currency pairs on profit after taxes. The volatility value used in the
calculation is that of one-year historical volatility as per December 31.
2011
Currency pair EUR / CHF USD / CHF
Volatility 16.4 % 17.8 %
Effect in profit & loss (rate increase) CHF m – 1.2 – 7.1
Effect in profit & loss (rate decrease) CHF m 0.1 3.9
2010
Currency pair EUR / CHF USD / CHF
Volatility 8.5 % 10.4 %
Effect in profit & loss (rate increase) CHF m – 1.2 – 3.0
Effect in profit & loss (rate decrease) CHF m 1.7 3.4
Commodity risk. Bühler is exposed to a certain degree of commodity
price risk due to fluctuations in the prices of commodities required for
production process. The Group does not conclude any significant futures,
forwards or options to hedge future commodity purchases.
Equity security risk. The Group buys shares in other companies in order
to invest its liquid funds. It does so in accordance with the treasury strat-
egy approved by the Board of Directors. This sets precise limits, including
for investments in shares. Bühler limits the risk across all asset classes by
holding less than 5 % of the Group’s invested funds in any one outside
company. Call or put options are covered by securities or cash positions.
Interest rate risk. Interest rate risk arises from changes in interest rates
that may affect the net assets and results of the Bühler Group. These risks
are managed and monitored centrally. The robust liquidity situation and
the fact that the Group is not reliant on external financing mean that in-
terest rate changes have no material impact on the financial result of the
Group.
Changes in market interest rates may have an impact on the value of
bonds in the category of financial assets stated at fair value. Assuming
that the interest rate for all currencies had increased by 100 basis points
while all other factors remained constant, the increased interest rates
would have had an effect on the profit after taxes of CHF – 0.6 million
(prior year CHF – 1.0 million). A reduction of the interest rate by 100 basis
points would have the opposite effect on profit after taxes to the value of
CHF 0.6 million (prior year CHF 1.0 million).
Credit risk. Credit risks arise in connection with liquid funds, derivative
financial instruments, investments with banks, marketable securities,
and receivables from clients. In order to minimize potential losses on cli-
ent receivables, an Operational Risk Management (ORM) guideline has
been drawn up. The evaluation of our customers’ financial reliability
and / or the terms of payment and hedging on our deliveries are key con-
cerns in this respect. In addition, it can be stated that none of our custom-
ers has outstanding payments accounting for more than 5 % of Group
sales. The nominal value of the trade accounts receivable less valuation
allowances is considered an approximation of the receivables’ fair value.
The book values stated represent the maximum credit risk. The default
risk on marketable securities, derivative financial instruments, money
market contracts, current-account deposits, and time deposits is mini-
mized on one hand through the exclusive purchase of securities with at
least an A rating, and on the other by selecting only financial institutions
with at least an A rating as the Group’s main global banks. The risks
are monitored rigorously and kept within stipulated parameters. Group
guide lines ensure that the Group’s credit risk vis-à-vis financial institu-
tions is limited. The limits set are regularly monitored and adjusted. The
Group does not expect to incur any loss as a result of its counterparties
being unable to meet their contractual obligations, nor does it have any
cluster risks with respect to individual sectors or countries.
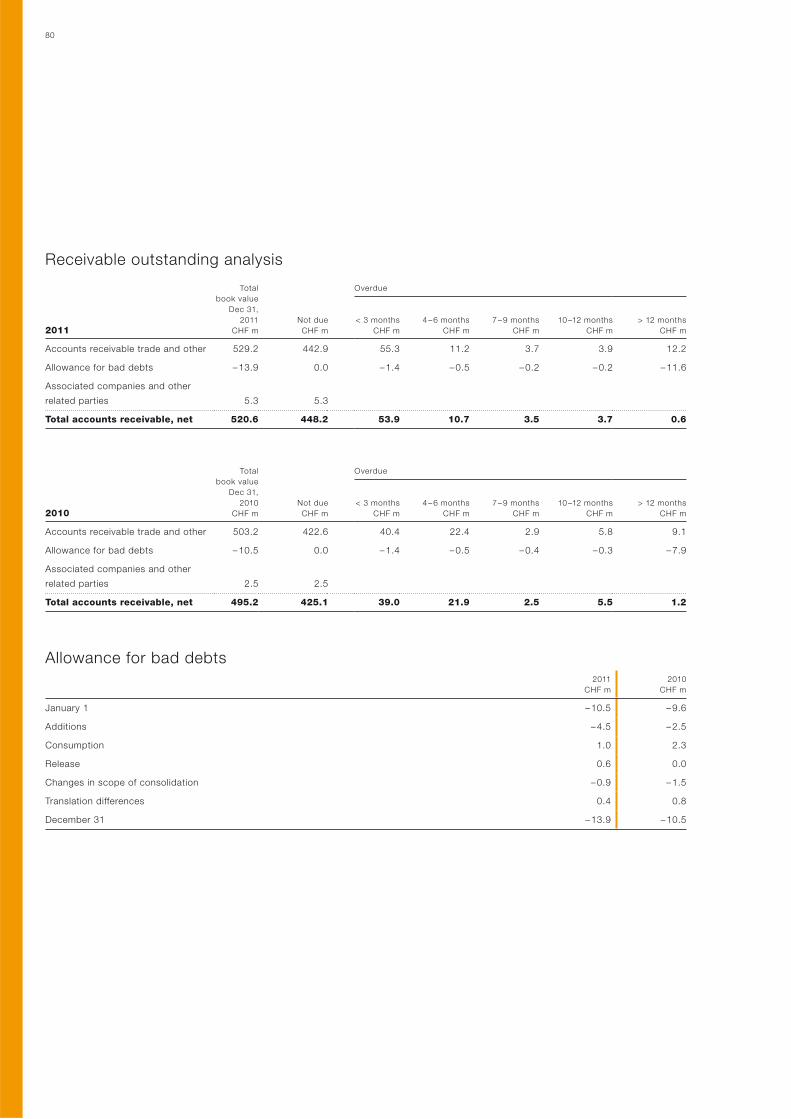
80
Receivable outstanding analysis
Total
book value
Dec 31,
2011
CHF m
Not due
CHF m
Overdue
2011< 3 months
CHF m
4 – 6 months
CHF m
7 – 9 months
CHF m
10 –12 months
CHF m
> 12 months
CHF m
Accounts receivable trade and other 529.2 442.9 55.3 11.2 3.7 3.9 12.2
Allowance for bad debts – 13.9 0.0 – 1.4 – 0.5 – 0.2 – 0.2 – 11.6
Associated companies and other
related parties 5.3 5.3
Total accounts receivable, net 520.6 448.2 53.9 10.7 3.5 3.7 0.6
Total
book value
Dec 31,
2010
CHF m
Not due
CHF m
Overdue
2010< 3 months
CHF m
4 – 6 months
CHF m
7 – 9 months
CHF m
10 –12 months
CHF m
> 12 months
CHF m
Accounts receivable trade and other 503.2 422.6 40.4 22.4 2.9 5.8 9.1
Allowance for bad debts – 10.5 0.0 – 1.4 – 0.5 – 0.4 – 0.3 – 7.9
Associated companies and other
related parties 2.5 2.5
Total accounts receivable, net 495.2 425.1 39.0 21.9 2.5 5.5 1.2
Allowance for bad debts2011
CHF m
2010
CHF m
January 1 – 10.5 – 9.6
Additions – 4.5 – 2.5
Consumption 1.0 2.3
Release 0.6 0.0
Changes in scope of consolidation – 0.9 – 1.5
Translation differences 0.4 0.8
December 31 – 13.9 – 10.5
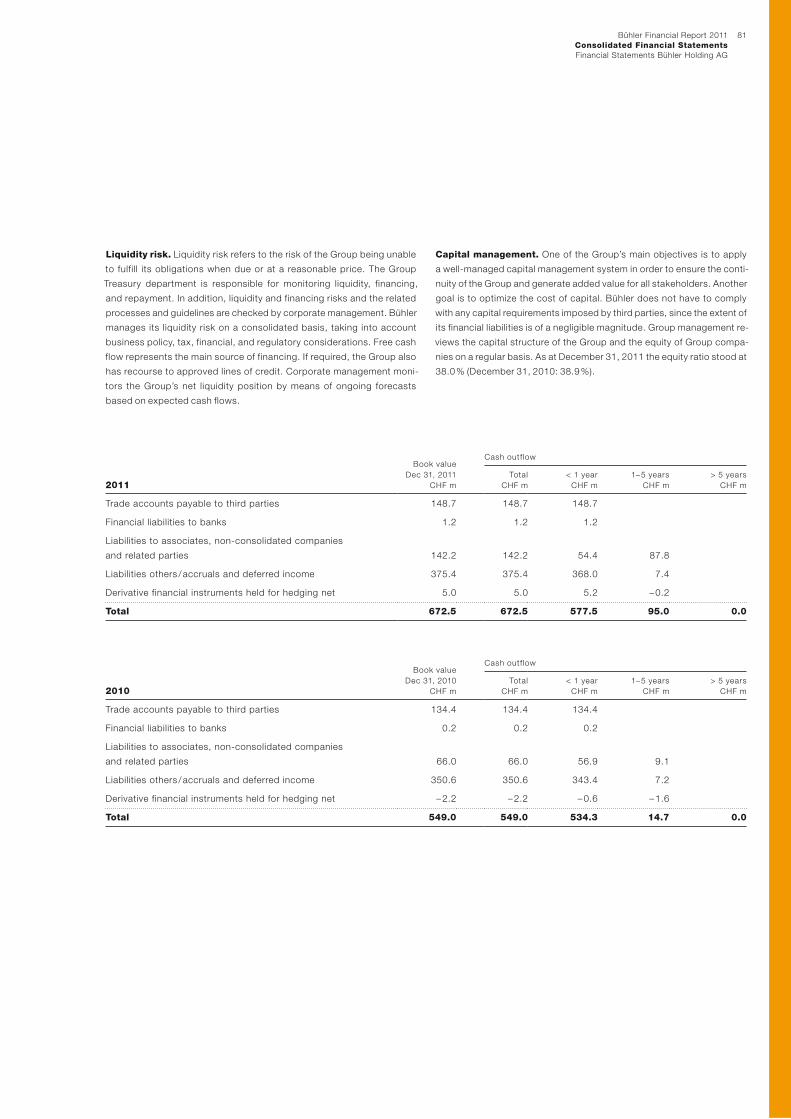
81Bühler Financial Report 2011
Consolidated Financial StatementsFinancial Statements Bühler Holding AG
Liquidity risk. Liquidity risk refers to the risk of the Group being unable
to fulfill its obligations when due or at a reasonable price. The Group
Treasury department is responsible for monitoring liquidity, financing,
and repayment. In addition, liquidity and financing risks and the related
processes and guidelines are checked by corporate management. Bühler
manages its liquidity risk on a consolidated basis, taking into account
business policy, tax, financial, and regulatory considerations. Free cash
flow represents the main source of financing. If required, the Group also
has recourse to approved lines of credit. Corporate management moni-
tors the Group’s net liquidity position by means of ongoing forecasts
based on expected cash flows.
Book value
Dec 31, 2011
CHF m
Cash outf low
2011Total
CHF m
< 1 year
CHF m
1– 5 years
CHF m
> 5 years
CHF m
Trade accounts payable to third parties 148.7 148.7 148.7
Financial liabilities to banks 1.2 1.2 1.2
Liabilities to associates, non-consolidated companies
and related parties 142.2 142.2 54.4 87.8
Liabilities others / accruals and deferred income 375.4 375.4 368.0 7.4
Derivative financial instruments held for hedging net 5.0 5.0 5.2 – 0.2
Total 672.5 672.5 577.5 95.0 0.0
Book value
Dec 31, 2010
CHF m
Cash outf low
2010Total
CHF m
< 1 year
CHF m
1– 5 years
CHF m
> 5 years
CHF m
Trade accounts payable to third parties 134.4 134.4 134.4
Financial liabilities to banks 0.2 0.2 0.2
Liabilities to associates, non-consolidated companies
and related parties 66.0 66.0 56.9 9.1
Liabilities others / accruals and deferred income 350.6 350.6 343.4 7.2
Derivative financial instruments held for hedging net – 2.2 – 2.2 – 0.6 – 1.6
Total 549.0 549.0 534.3 14.7 0.0
Capital management. One of the Group’s main objectives is to apply
a well-managed capital management system in order to ensure the conti-
nuity of the Group and generate added value for all stakeholders. Another
goal is to optimize the cost of capital. Bühler does not have to comply
with any capital requirements imposed by third parties, since the extent of
its financial liabilities is of a negligible magnitude. Group management re-
views the capital structure of the Group and the equity of Group compa-
nies on a regular basis. As at December 31, 2011 the equity ratio stood at
38.0 % (December 31, 2010: 38.9 %).
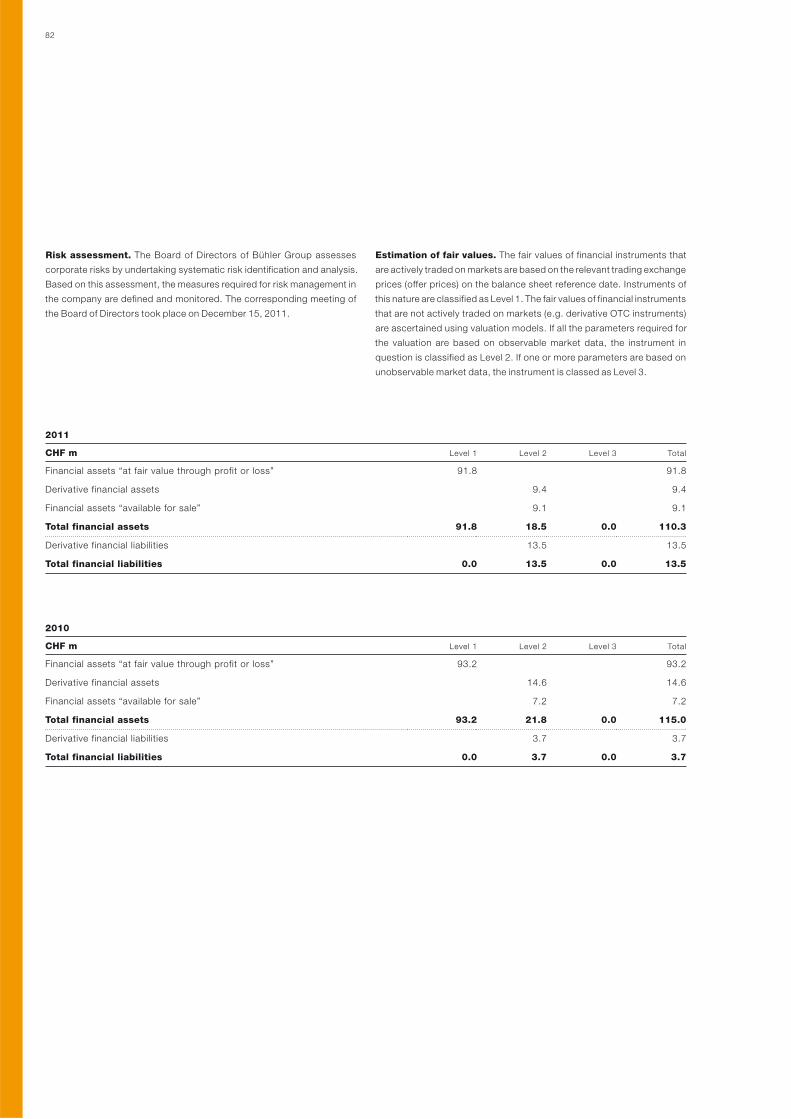
82
Risk assessment. The Board of Directors of Bühler Group assesses
corporate risks by undertaking systematic risk identification and analysis.
Based on this assessment, the measures required for risk management in
the company are defined and monitored. The corresponding meeting of
the Board of Directors took place on December 15, 2011.
Estimation of fair values. The fair values of financial instruments that
are actively traded on markets are based on the relevant trading exchange
prices (offer prices) on the balance sheet reference date. Instruments of
this nature are classified as Level 1. The fair values of financial instruments
that are not actively traded on markets (e.g. derivative OTC instruments)
are ascertained using valuation models. If all the parameters required for
the valuation are based on observable market data, the instrument in
question is classified as Level 2. If one or more parameters are based on
unobservable market data, the instrument is classed as Level 3.
2011
CHF m Level 1 Level 2 Level 3 Total
Financial assets “at fair value through profit or loss” 91.8 91.8
Derivative financial assets 9.4 9.4
Financial assets “available for sale” 9.1 9.1
Total financial assets 91.8 18.5 0.0 110.3
Derivative financial liabilities 13.5 13.5
Total financial liabilities 0.0 13.5 0.0 13.5
2010
CHF m Level 1 Level 2 Level 3 Total
Financial assets “at fair value through profit or loss” 93.2 93.2
Derivative financial assets 14.6 14.6
Financial assets “available for sale” 7.2 7.2
Total financial assets 93.2 21.8 0.0 115.0
Derivative financial liabilities 3.7 3.7
Total financial liabilities 0.0 3.7 0.0 3.7
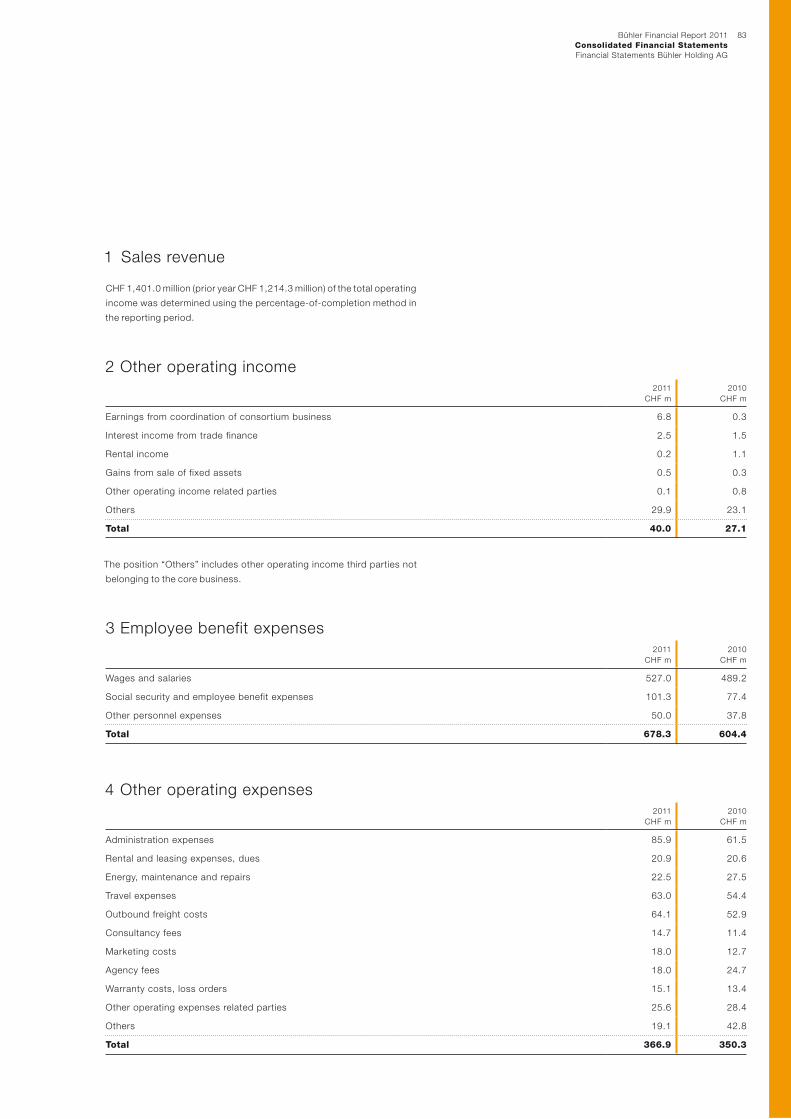
83Bühler Financial Report 2011
Consolidated Financial StatementsFinancial Statements Bühler Holding AG
1 Sales revenue
CHF 1,401.0 million (prior year CHF 1,214.3 million) of the total operating
income was determined using the percentage-of-completion method in
the reporting period.
2 Other operating income2011
CHF m
2010
CHF m
Earnings from coordination of consortium business 6.8 0.3
Interest income from trade finance 2.5 1.5
Rental income 0.2 1.1
Gains from sale of fixed assets 0.5 0.3
Other operating income related parties 0.1 0.8
Others 29.9 23.1
Total 40.0 27.1
The position “Others” includes other operating income third parties not
belonging to the core business.
3 Employee benefit expenses2011
CHF m
2010
CHF m
Wages and salaries 527.0 489.2
Social security and employee benefit expenses 101.3 77.4
Other personnel expenses 50.0 37.8
Total 678.3 604.4
4 Other operating expenses2011
CHF m
2010
CHF m
Administration expenses 85.9 61.5
Rental and leasing expenses, dues 20.9 20.6
Energy, maintenance and repairs 22.5 27.5
Travel expenses 63.0 54.4
Outbound freight costs 64.1 52.9
Consultancy fees 14.7 11.4
Marketing costs 18.0 12.7
Agency fees 18.0 24.7
Warranty costs, loss orders 15.1 13.4
Other operating expenses related parties 25.6 28.4
Others 19.1 42.8
Total 366.9 350.3
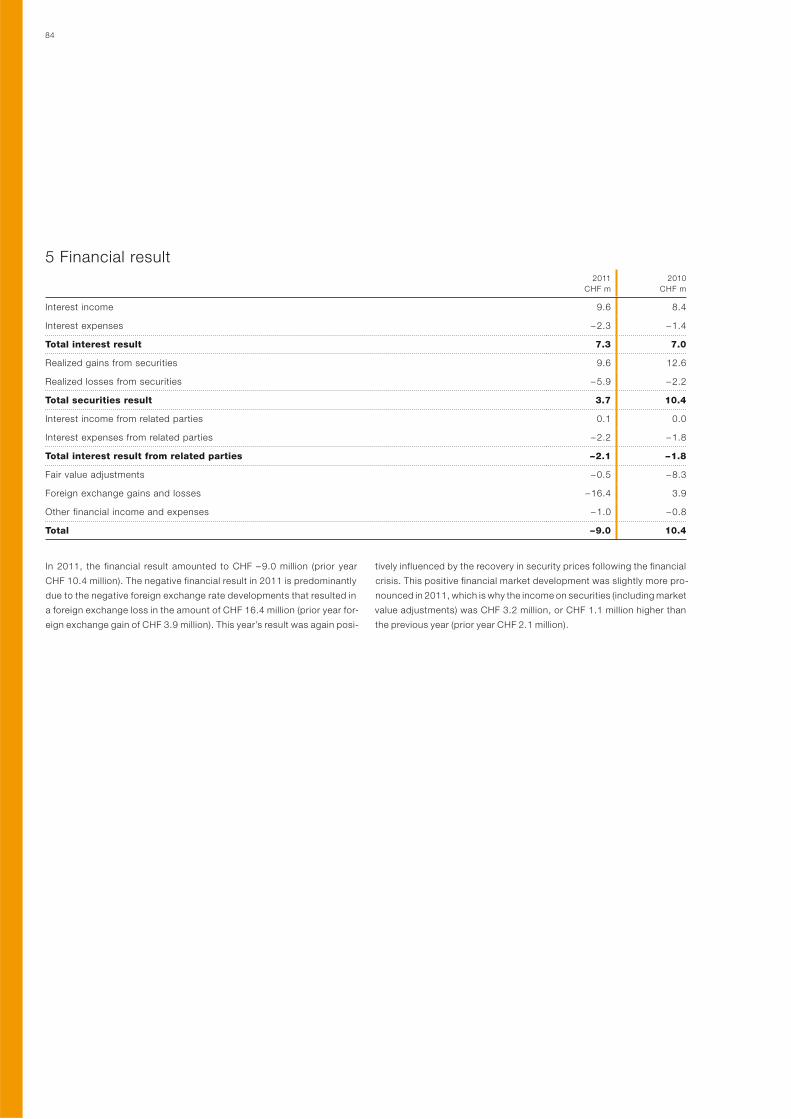
84
5 Financial result2011
CHF m
2010
CHF m
Interest income 9.6 8.4
Interest expenses – 2.3 – 1.4
Total interest result 7.3 7.0
Realized gains from securities 9.6 12.6
Realized losses from securities – 5.9 – 2.2
Total securities result 3.7 10.4
Interest income from related parties 0.1 0.0
Interest expenses from related parties – 2.2 – 1.8
Total interest result from related parties – 2.1 – 1.8
Fair value adjustments – 0.5 – 8.3
Foreign exchange gains and losses – 16.4 3.9
Other financial income and expenses – 1.0 – 0.8
Total – 9.0 10.4
In 2011, the financial result amounted to CHF – 9.0 million (prior year
CHF 10.4 million). The negative financial result in 2011 is predominantly
due to the negative foreign exchange rate developments that resulted in
a foreign exchange loss in the amount of CHF 16.4 million (prior year for-
eign exchange gain of CHF 3.9 million). This year’s result was again posi-
tively influenced by the recovery in security prices following the financial
crisis. This positive financial market development was slightly more pro-
nounced in 2011, which is why the income on securities (including market
value adjustments) was CHF 3.2 million, or CHF 1.1 million higher than
the previous year (prior year CHF 2.1 million).
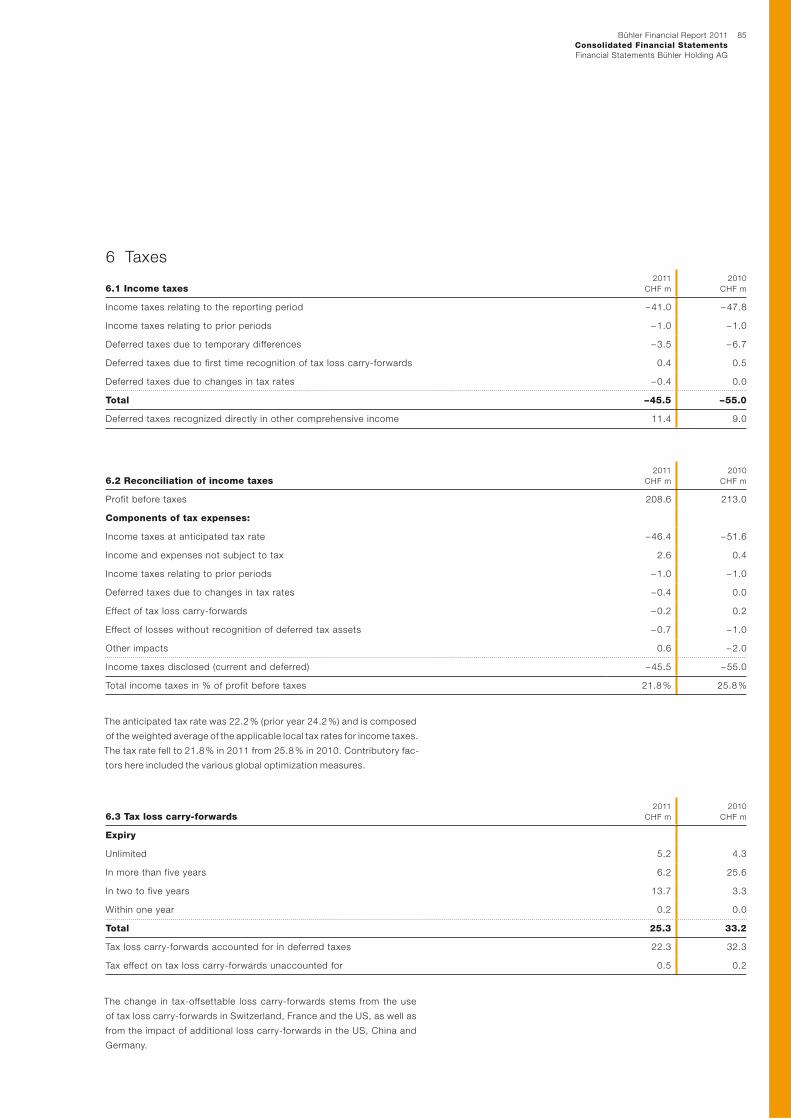
85Bühler Financial Report 2011
Consolidated Financial StatementsFinancial Statements Bühler Holding AG
6 Taxes
6.1 Income taxes2011
CHF m
2010
CHF m
Income taxes relating to the reporting period – 41.0 – 47.8
Income taxes relating to prior periods – 1.0 – 1.0
Deferred taxes due to temporary differences – 3.5 – 6.7
Deferred taxes due to first time recognition of tax loss carry-forwards 0.4 0.5
Deferred taxes due to changes in tax rates – 0.4 0.0
Total – 45.5 – 55.0
Deferred taxes recognized directly in other comprehensive income 11.4 9.0
6.2 Reconciliation of income taxes2011
CHF m
2010
CHF m
Profit before taxes 208.6 213.0
Components of tax expenses:
Income taxes at anticipated tax rate – 46.4 – 51.6
Income and expenses not subject to tax 2.6 0.4
Income taxes relating to prior periods – 1.0 – 1.0
Deferred taxes due to changes in tax rates – 0.4 0.0
Effect of tax loss carry-forwards – 0.2 0.2
Effect of losses without recognition of deferred tax assets – 0.7 – 1.0
Other impacts 0.6 – 2.0
Income taxes disclosed (current and deferred) – 45.5 – 55.0
Total income taxes in % of profit before taxes 21.8 % 25.8 %
The anticipated tax rate was 22.2 % (prior year 24.2 %) and is composed
of the weighted average of the applicable local tax rates for income taxes.
The tax rate fell to 21.8 % in 2011 from 25.8 % in 2010. Contributory fac-
tors here included the various global optimization measures.
6.3 Tax loss carry-forwards2011
CHF m
2010
CHF m
Expiry
Unlimited 5.2 4.3
In more than five years 6.2 25.6
In two to five years 13.7 3.3
Within one year 0.2 0.0
Total 25.3 33.2
Tax loss carry-forwards accounted for in deferred taxes 22.3 32.3
Tax effect on tax loss carry-forwards unaccounted for 0.5 0.2
The change in tax-offsettable loss carry-forwards stems from the use
of tax loss carry-forwards in Switzerland, France and the US, as well as
from the impact of additional loss carry-forwards in the US, China and
Germany.
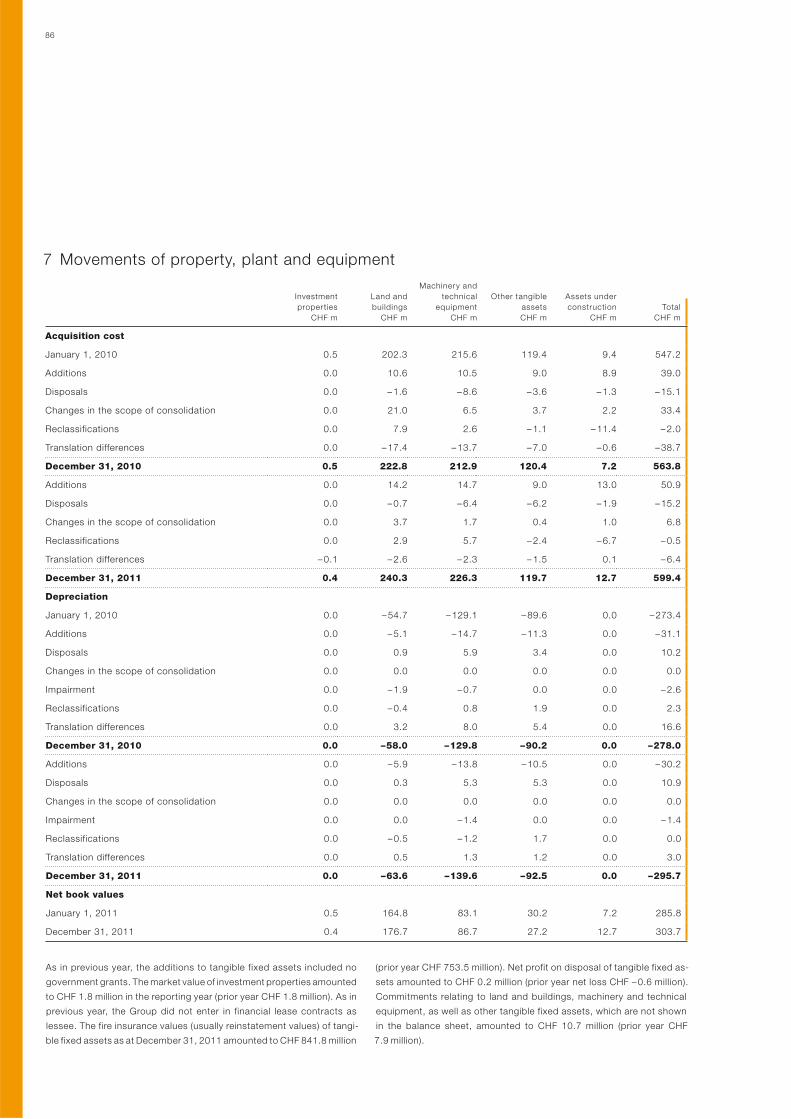
86
7 Movements of property, plant and equipment
Investment
properties
CHF m
Land and
buildings
CHF m
Machinery and
technical
equipment
CHF m
Other tangible
assets
CHF m
Assets under
construction
CHF m
Total
CHF m
Acquisition cost
January 1, 2010 0.5 202.3 215.6 119.4 9.4 547.2
Additions 0.0 10.6 10.5 9.0 8.9 39.0
Disposals 0.0 – 1.6 – 8.6 – 3.6 – 1.3 – 15.1
Changes in the scope of consolidation 0.0 21.0 6.5 3.7 2.2 33.4
Reclassifications 0.0 7.9 2.6 – 1.1 – 11.4 – 2.0
Translation differences 0.0 – 17.4 – 13.7 – 7.0 – 0.6 – 38.7
December 31, 2010 0.5 222.8 212.9 120.4 7.2 563.8
Additions 0.0 14.2 14.7 9.0 13.0 50.9
Disposals 0.0 – 0.7 – 6.4 – 6.2 – 1.9 – 15.2
Changes in the scope of consolidation 0.0 3.7 1.7 0.4 1.0 6.8
Reclassifications 0.0 2.9 5.7 – 2.4 – 6.7 – 0.5
Translation differences – 0.1 – 2.6 – 2.3 – 1.5 0.1 – 6.4
December 31, 2011 0.4 240.3 226.3 119.7 12.7 599.4
Depreciation
January 1, 2010 0.0 – 54.7 – 129.1 – 89.6 0.0 – 273.4
Additions 0.0 – 5.1 – 14.7 – 11.3 0.0 – 31.1
Disposals 0.0 0.9 5.9 3.4 0.0 10.2
Changes in the scope of consolidation 0.0 0.0 0.0 0.0 0.0 0.0
Impairment 0.0 – 1.9 – 0.7 0.0 0.0 – 2.6
Reclassifications 0.0 – 0.4 0.8 1.9 0.0 2.3
Translation differences 0.0 3.2 8.0 5.4 0.0 16.6
December 31, 2010 0.0 – 58.0 – 129.8 – 90.2 0.0 – 278.0
Additions 0.0 – 5.9 – 13.8 – 10.5 0.0 – 30.2
Disposals 0.0 0.3 5.3 5.3 0.0 10.9
Changes in the scope of consolidation 0.0 0.0 0.0 0.0 0.0 0.0
Impairment 0.0 0.0 – 1.4 0.0 0.0 – 1.4
Reclassifications 0.0 – 0.5 – 1.2 1.7 0.0 0.0
Translation differences 0.0 0.5 1.3 1.2 0.0 3.0
December 31, 2011 0.0 – 63.6 – 139.6 – 92.5 0.0 – 295.7
Net book values
January 1, 2011 0.5 164.8 83.1 30.2 7.2 285.8
December 31, 2011 0.4 176.7 86.7 27.2 12.7 303.7
As in previous year, the additions to tangible fixed assets included no
government grants. The market value of investment properties amounted
to CHF 1.8 million in the reporting year (prior year CHF 1.8 million). As in
previous year, the Group did not enter in financial lease contracts as
lessee. The fire insurance values (usually reinstatement values) of tangi-
ble fixed assets as at December 31, 2011 amounted to CHF 841.8 million
(prior year CHF 753.5 million). Net profit on disposal of tangible fixed as-
sets amounted to CHF 0.2 million (prior year net loss CHF – 0.6 million).
Commitments relating to land and buildings, machinery and technical
equipment, as well as other tangible fixed assets, which are not shown
in the balance sheet, amounted to CHF 10.7 million (prior year CHF
7.9 million).
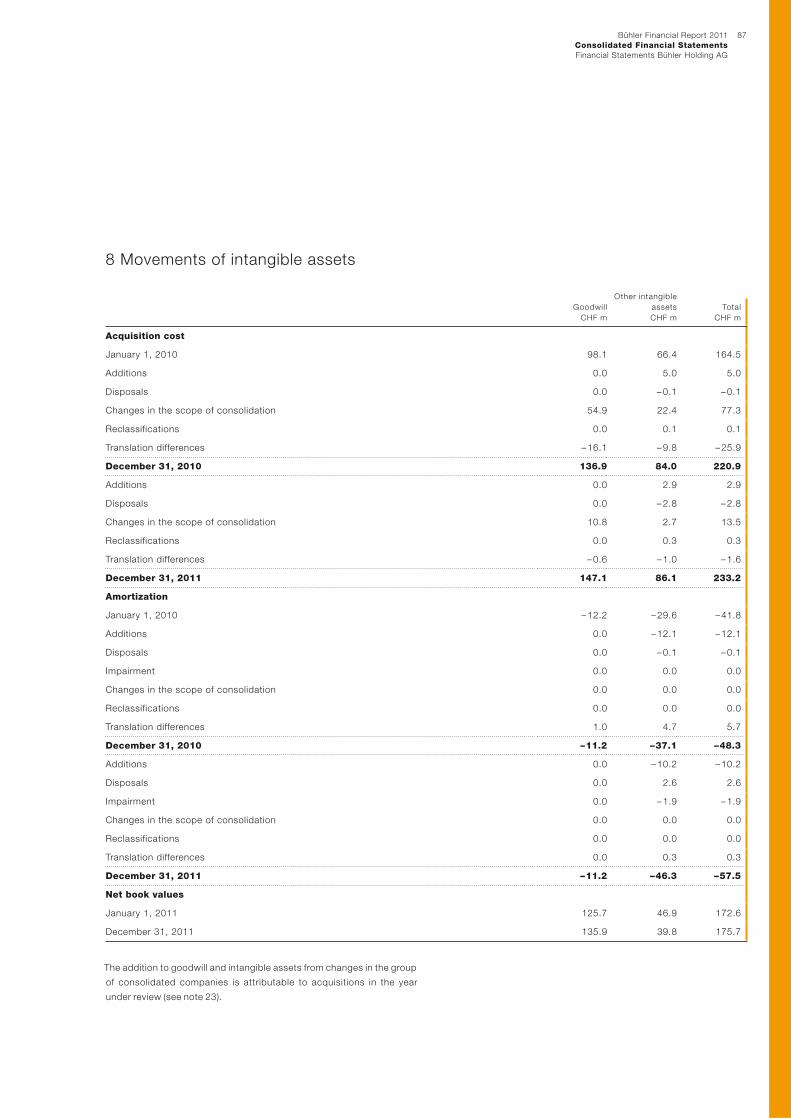
87Bühler Financial Report 2011
Consolidated Financial StatementsFinancial Statements Bühler Holding AG
8 Movements of intangible assets
Goodwill
CHF m
Other intangible
assets
CHF m
Total
CHF m
Acquisition cost
January 1, 2010 98.1 66.4 164.5
Additions 0.0 5.0 5.0
Disposals 0.0 – 0.1 – 0.1
Changes in the scope of consolidation 54.9 22.4 77.3
Reclassifications 0.0 0.1 0.1
Translation differences – 16.1 – 9.8 – 25.9
December 31, 2010 136.9 84.0 220.9
Additions 0.0 2.9 2.9
Disposals 0.0 – 2.8 – 2.8
Changes in the scope of consolidation 10.8 2.7 13.5
Reclassifications 0.0 0.3 0.3
Translation differences – 0.6 – 1.0 – 1.6
December 31, 2011 147.1 86.1 233.2
Amortization
January 1, 2010 – 12.2 – 29.6 – 41.8
Additions 0.0 – 12.1 – 12.1
Disposals 0.0 – 0.1 – 0.1
Impairment 0.0 0.0 0.0
Changes in the scope of consolidation 0.0 0.0 0.0
Reclassifications 0.0 0.0 0.0
Translation differences 1.0 4.7 5.7
December 31, 2010 – 11.2 – 37.1 – 48.3
Additions 0.0 – 10.2 – 10.2
Disposals 0.0 2.6 2.6
Impairment 0.0 – 1.9 – 1.9
Changes in the scope of consolidation 0.0 0.0 0.0
Reclassifications 0.0 0.0 0.0
Translation differences 0.0 0.3 0.3
December 31, 2011 – 11.2 – 46.3 – 57.5
Net book values
January 1, 2011 125.7 46.9 172.6
December 31, 2011 135.9 39.8 175.7
The addition to goodwill and intangible assets from changes in the group
of consolidated companies is attributable to acquisitions in the year
under review (see note 23).
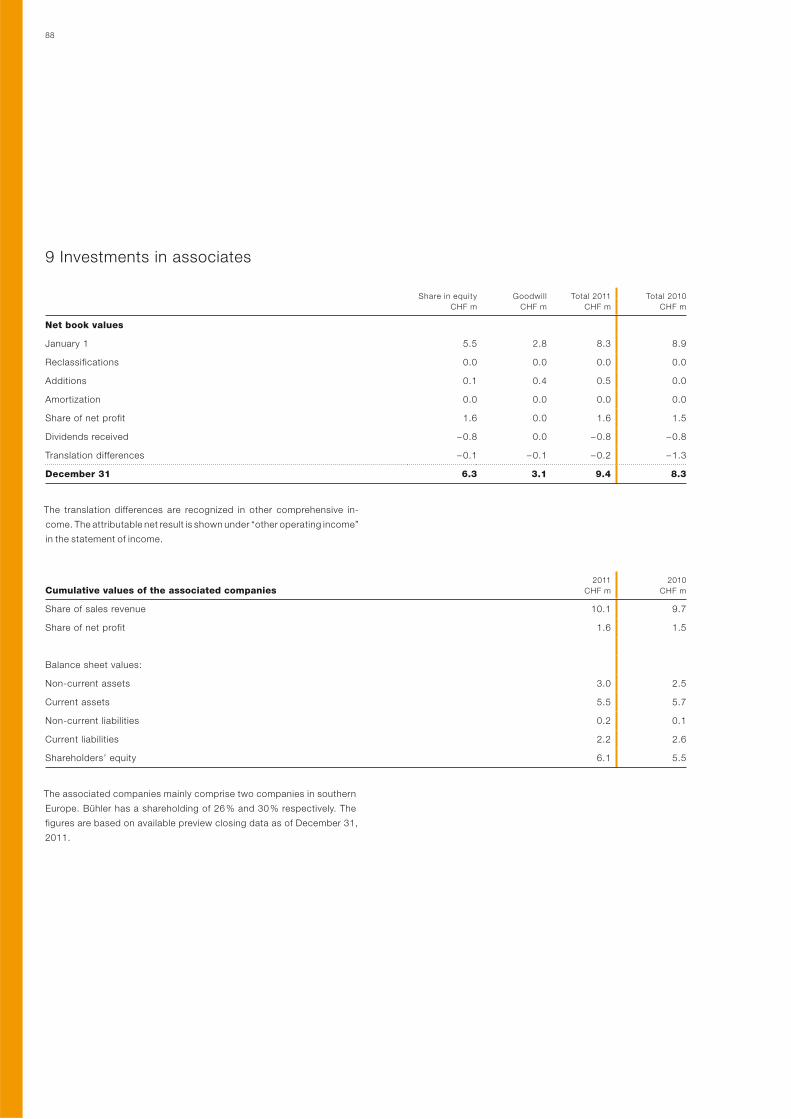
88
9 Investments in associates
Share in equity
CHF m
Goodwill
CHF m
Total 2011
CHF m
Total 2010
CHF m
Net book values
January 1 5.5 2.8 8.3 8.9
Reclassifications 0.0 0.0 0.0 0.0
Additions 0.1 0.4 0.5 0.0
Amortization 0.0 0.0 0.0 0.0
Share of net profit 1.6 0.0 1.6 1.5
Dividends received – 0.8 0.0 – 0.8 – 0.8
Translation differences – 0.1 – 0.1 – 0.2 – 1.3
December 31 6.3 3.1 9.4 8.3
The translation differences are recognized in other comprehensive in-
come. The attributable net result is shown under “other operating income”
in the statement of income.
Cumulative values of the associated companies2011
CHF m
2010
CHF m
Share of sales revenue 10.1 9.7
Share of net profit 1.6 1.5
Balance sheet values:
Non-current assets 3.0 2.5
Current assets 5.5 5.7
Non-current liabilities 0.2 0.1
Current liabilities 2.2 2.6
Shareholders’ equity 6.1 5.5
The associated companies mainly comprise two companies in southern
Europe. Bühler has a shareholding of 26 % and 30 % respectively. The
figures are based on available preview closing data as of December 31,
2011.
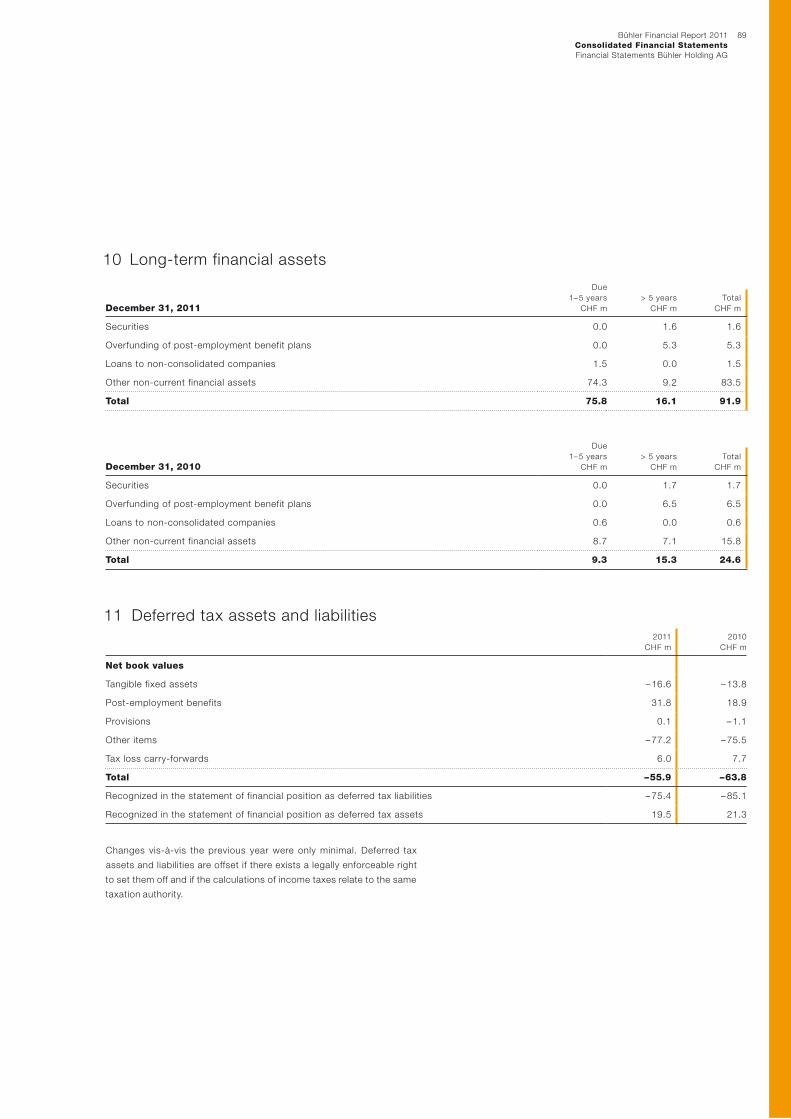
89Bühler Financial Report 2011
Consolidated Financial StatementsFinancial Statements Bühler Holding AG
10 Long-term financial assets
Due
1– 5 years
CHF m
> 5 years
CHF mDecember 31, 2011Total
CHF m
Securities 0.0 1.6 1.6
Overfunding of post-employment benefit plans 0.0 5.3 5.3
Loans to non-consolidated companies 1.5 0.0 1.5
Other non-current financial assets 74.3 9.2 83.5
Total 75.8 16.1 91.9
Due
1– 5 years
CHF m
> 5 years
CHF mDecember 31, 2010Total
CHF m
Securities 0.0 1.7 1.7
Overfunding of post-employment benefit plans 0.0 6.5 6.5
Loans to non-consolidated companies 0.6 0.0 0.6
Other non-current financial assets 8.7 7.1 15.8
Total 9.3 15.3 24.6
11 Deferred tax assets and liabilities2011
CHF m
2010
CHF m
Net book values
Tangible fixed assets – 16.6 – 13.8
Post-employment benefits 31.8 18.9
Provisions 0.1 – 1.1
Other items – 77.2 – 75.5
Tax loss carry-forwards 6.0 7.7
Total – 55.9 – 63.8
Recognized in the statement of financial position as deferred tax liabilities – 75.4 – 85.1
Recognized in the statement of financial position as deferred tax assets 19.5 21.3
Changes vis-à-vis the previous year were only minimal. Deferred tax
assets and liabilities are offset if there exists a legally enforceable right
to set them off and if the calculations of income taxes relate to the same
taxation authority.
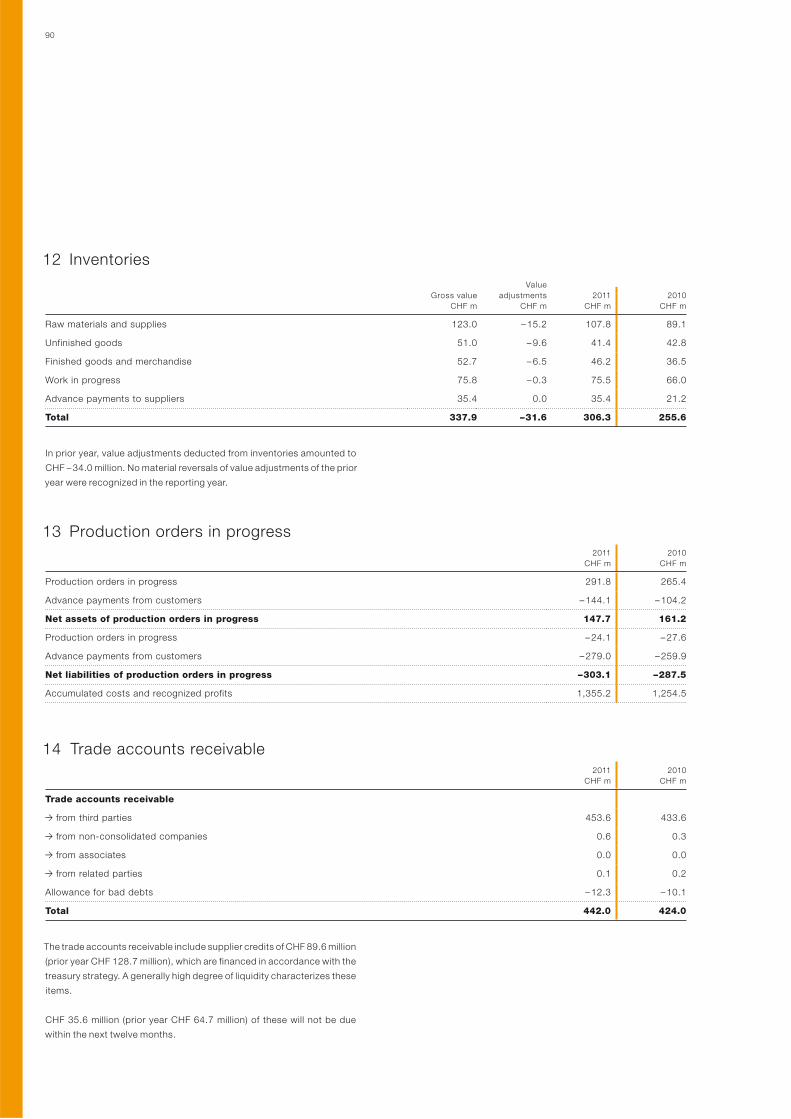
90
12 Inventories
Gross value
CHF m
Value
adjustments
CHF m
2011
CHF m
2010
CHF m
Raw materials and supplies 123.0 – 15.2 107.8 89.1
Unfinished goods 51.0 – 9.6 41.4 42.8
Finished goods and merchandise 52.7 – 6.5 46.2 36.5
Work in progress 75.8 – 0.3 75.5 66.0
Advance payments to suppliers 35.4 0.0 35.4 21.2
Total 337.9 – 31.6 306.3 255.6
In prior year, value adjustments deducted from inventories amounted to
CHF – 34.0 million. No material reversals of value adjustments of the prior
year were recognized in the reporting year.
13 Production orders in progress2011
CHF m
2010
CHF m
Production orders in progress 291.8 265.4
Advance payments from customers – 144.1 – 104.2
Net assets of production orders in progress 147.7 161.2
Production orders in progress – 24.1 – 27.6
Advance payments from customers – 279.0 – 259.9
Net liabilities of production orders in progress – 303.1 – 287.5
Accumulated costs and recognized profits 1,355.2 1,254.5
14 Trade accounts receivable2011
CHF m
2010
CHF m
Trade accounts receivable
from third parties 453.6 433.6
from non-consolidated companies 0.6 0.3
from associates 0.0 0.0
from related parties 0.1 0.2
Allowance for bad debts – 12.3 – 10.1
Total 442.0 424.0
The trade accounts receivable include supplier credits of CHF 89.6 million
(prior year CHF 128.7 million), which are financed in accordance with the
treasury strategy. A generally high degree of liquidity characterizes these
items.
CHF 35.6 million (prior year CHF 64.7 million) of these will not be due
within the next twelve months.
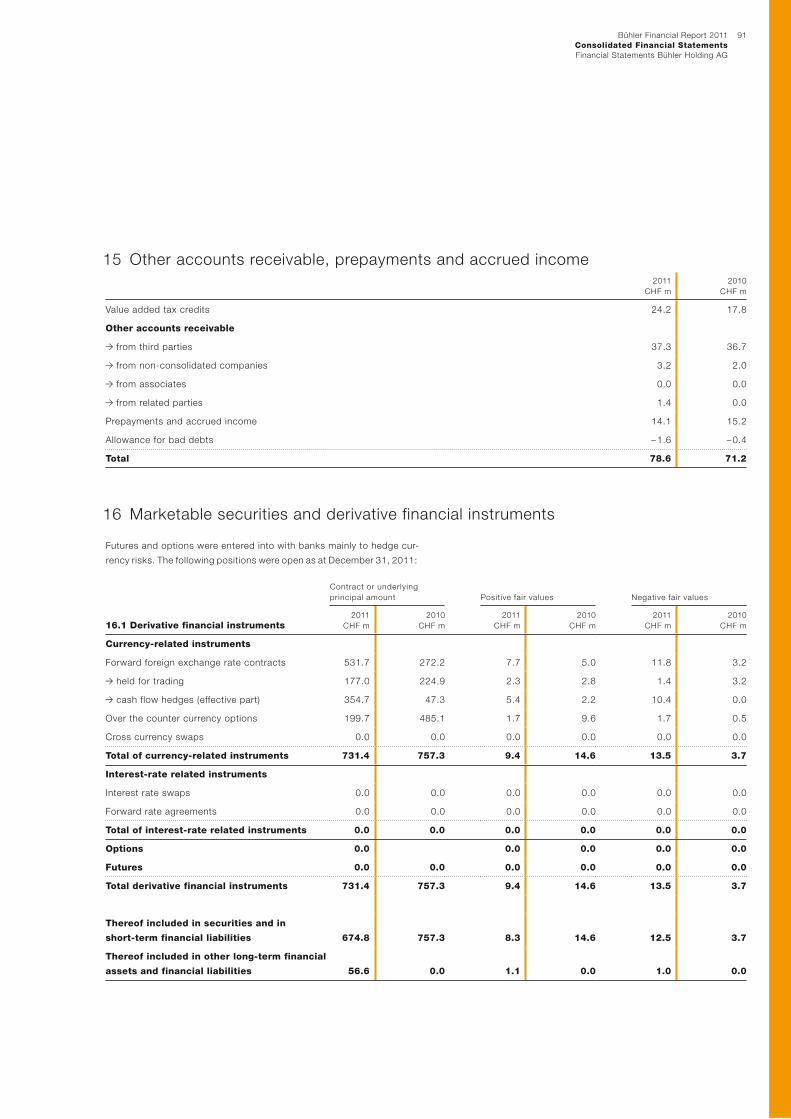
91Bühler Financial Report 2011
Consolidated Financial StatementsFinancial Statements Bühler Holding AG
15 Other accounts receivable, prepayments and accrued income2011
CHF m
2010
CHF m
Value added tax credits 24.2 17.8
Other accounts receivable
from third parties 37.3 36.7
from non-consolidated companies 3.2 2.0
from associates 0.0 0.0
from related parties 1.4 0.0
Prepayments and accrued income 14.1 15.2
Allowance for bad debts – 1.6 – 0.4
Total 78.6 71.2
16 Marketable securities and derivative financial instruments
Futures and options were entered into with banks mainly to hedge cur-
rency risks. The following positions were open as at December 31, 2011:
Contract or underlying
principal amount Positive fair values Negative fair values
16.1 Derivative financial instruments2011
CHF m
2010
CHF m
2011
CHF m
2010
CHF m
2011
CHF m
2010
CHF m
Currency-related instruments
Forward foreign exchange rate contracts 531.7 272.2 7.7 5.0 11.8 3.2
held for trading 177.0 224.9 2.3 2.8 1.4 3.2
cash flow hedges (effective part) 354.7 47.3 5.4 2.2 10.4 0.0
Over the counter currency options 199.7 485.1 1.7 9.6 1.7 0.5
Cross currency swaps 0.0 0.0 0.0 0.0 0.0 0.0
Total of currency-related instruments 731.4 757.3 9.4 14.6 13.5 3.7
Interest-rate related instruments
Interest rate swaps 0.0 0.0 0.0 0.0 0.0 0.0
Forward rate agreements 0.0 0.0 0.0 0.0 0.0 0.0
Total of interest-rate related instruments 0.0 0.0 0.0 0.0 0.0 0.0
Options 0.0 0.0 0.0 0.0 0.0
Futures 0.0 0.0 0.0 0.0 0.0 0.0
Total derivative financial instruments 731.4 757.3 9.4 14.6 13.5 3.7
Thereof included in securities and in
short-term financial liabilities 674.8 757.3 8.3 14.6 12.5 3.7
Thereof included in other long-term financial
assets and financial liabilities 56.6 0.0 1.1 0.0 1.0 0.0
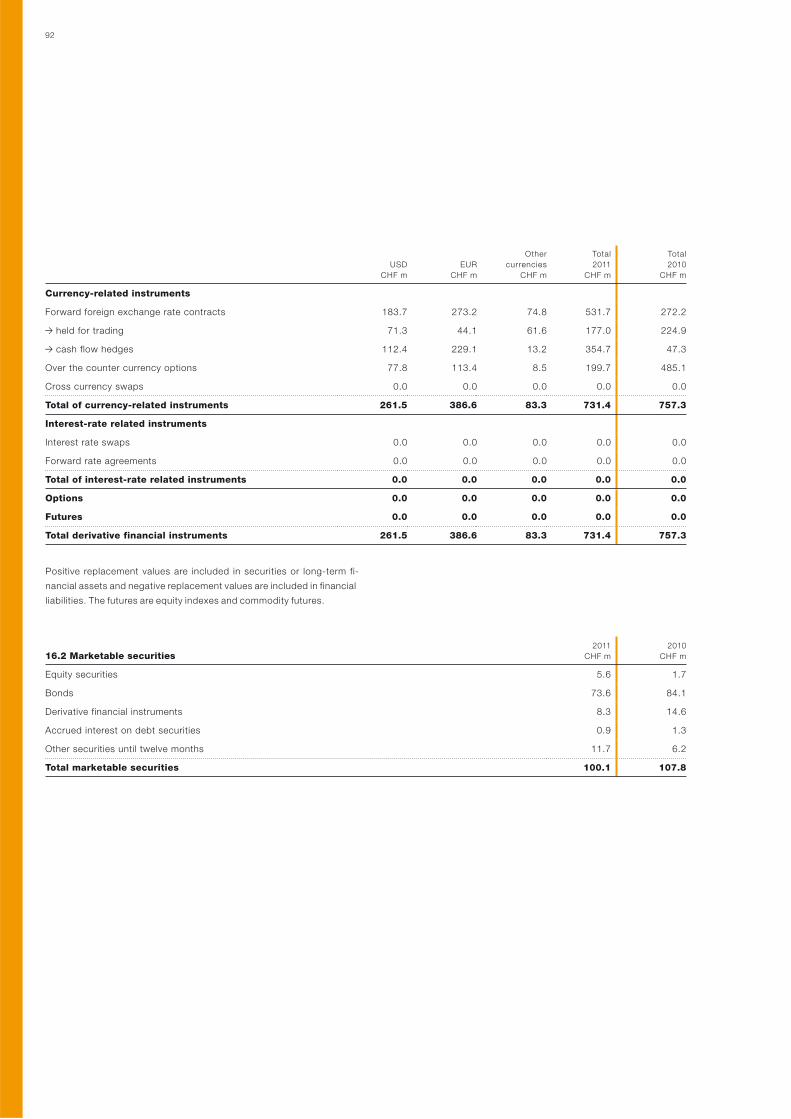
92
USD
CHF m
EUR
CHF m
Other
currencies
CHF m
Total
2011
CHF m
Total
2010
CHF m
Currency-related instruments
Forward foreign exchange rate contracts 183.7 273.2 74.8 531.7 272.2
held for trading 71.3 44.1 61.6 177.0 224.9
cash flow hedges 112.4 229.1 13.2 354.7 47.3
Over the counter currency options 77.8 113.4 8.5 199.7 485.1
Cross currency swaps 0.0 0.0 0.0 0.0 0.0
Total of currency-related instruments 261.5 386.6 83.3 731.4 757.3
Interest-rate related instruments
Interest rate swaps 0.0 0.0 0.0 0.0 0.0
Forward rate agreements 0.0 0.0 0.0 0.0 0.0
Total of interest-rate related instruments 0.0 0.0 0.0 0.0 0.0
Options 0.0 0.0 0.0 0.0 0.0
Futures 0.0 0.0 0.0 0.0 0.0
Total derivative financial instruments 261.5 386.6 83.3 731.4 757.3
Positive replacement values are included in securities or long-term fi-
nancial assets and negative replacement values are included in financial
liabilities. The futures are equity indexes and commodity futures.
16.2 Marketable securities2011
CHF m
2010
CHF m
Equity securities 5.6 1.7
Bonds 73.6 84.1
Derivative financial instruments 8.3 14.6
Accrued interest on debt securities 0.9 1.3
Other securities until twelve months 11.7 6.2
Total marketable securities 100.1 107.8
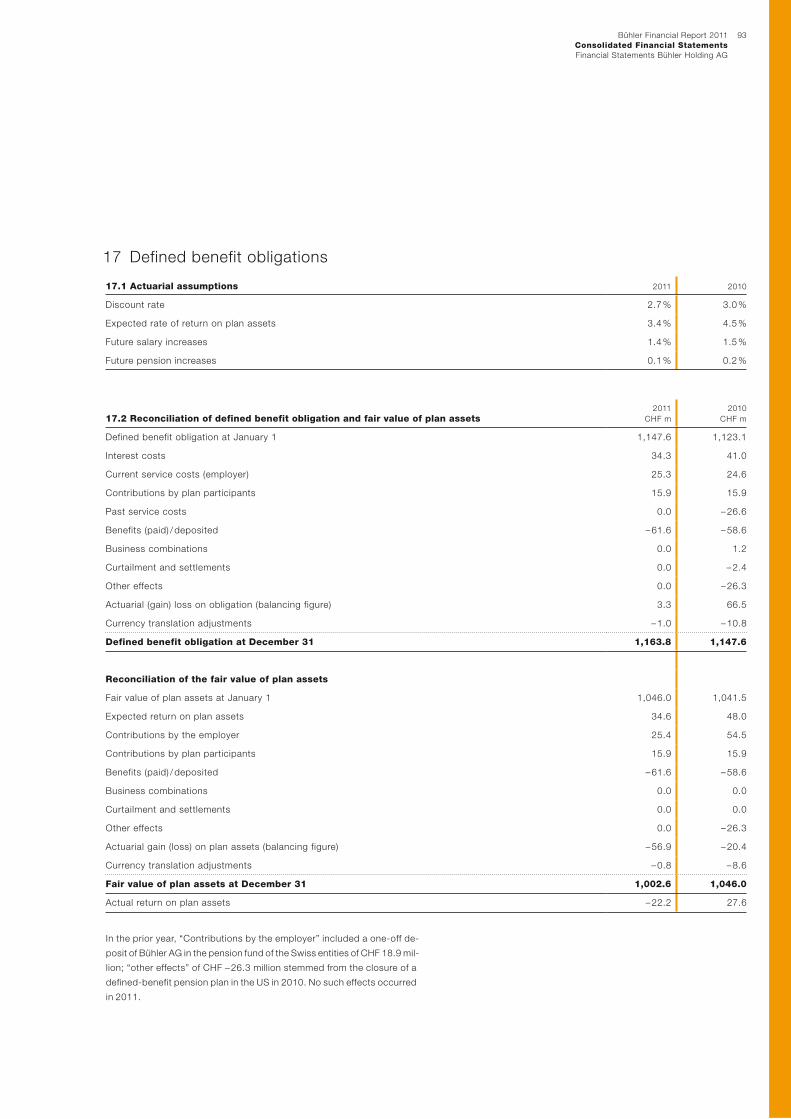
93Bühler Financial Report 2011
Consolidated Financial StatementsFinancial Statements Bühler Holding AG
17 Defined benefit obligations
17.1 Actuarial assumptions 2011 2010
Discount rate 2.7 % 3.0 %
Expected rate of return on plan assets 3.4 % 4.5 %
Future salary increases 1.4 % 1.5 %
Future pension increases 0.1 % 0.2 %
17.2 Reconciliation of defined benefit obligation and fair value of plan assets2011
CHF m
2010
CHF m
Defined benefit obligation at January 1 1,147.6 1,123.1
Interest costs 34.3 41.0
Current service costs (employer) 25.3 24.6
Contributions by plan participants 15.9 15.9
Past service costs 0.0 – 26.6
Benefits (paid) / deposited – 61.6 – 58.6
Business combinations 0.0 1.2
Curtailment and settlements 0.0 – 2.4
Other effects 0.0 – 26.3
Actuarial (gain) loss on obligation (balancing figure) 3.3 66.5
Currency translation adjustments – 1.0 – 10.8
Defined benefit obligation at December 31 1,163.8 1,147.6
Reconciliation of the fair value of plan assets
Fair value of plan assets at January 1 1,046.0 1,041.5
Expected return on plan assets 34.6 48.0
Contributions by the employer 25.4 54.5
Contributions by plan participants 15.9 15.9
Benefits (paid) / deposited – 61.6 – 58.6
Business combinations 0.0 0.0
Curtailment and settlements 0.0 0.0
Other effects 0.0 – 26.3
Actuarial gain (loss) on plan assets (balancing figure) – 56.9 – 20.4
Currency translation adjustments – 0.8 – 8.6
Fair value of plan assets at December 31 1,002.6 1,046.0
Actual return on plan assets – 22.2 27.6
In the prior year, “Contributions by the employer” included a one-off de-
posit of Bühler AG in the pension fund of the Swiss entities of CHF 18.9 mil-
lion; “other effects” of CHF – 26.3 million stemmed from the closure of a
defined-benefit pension plan in the US in 2010. No such effects occurred
in 2011.
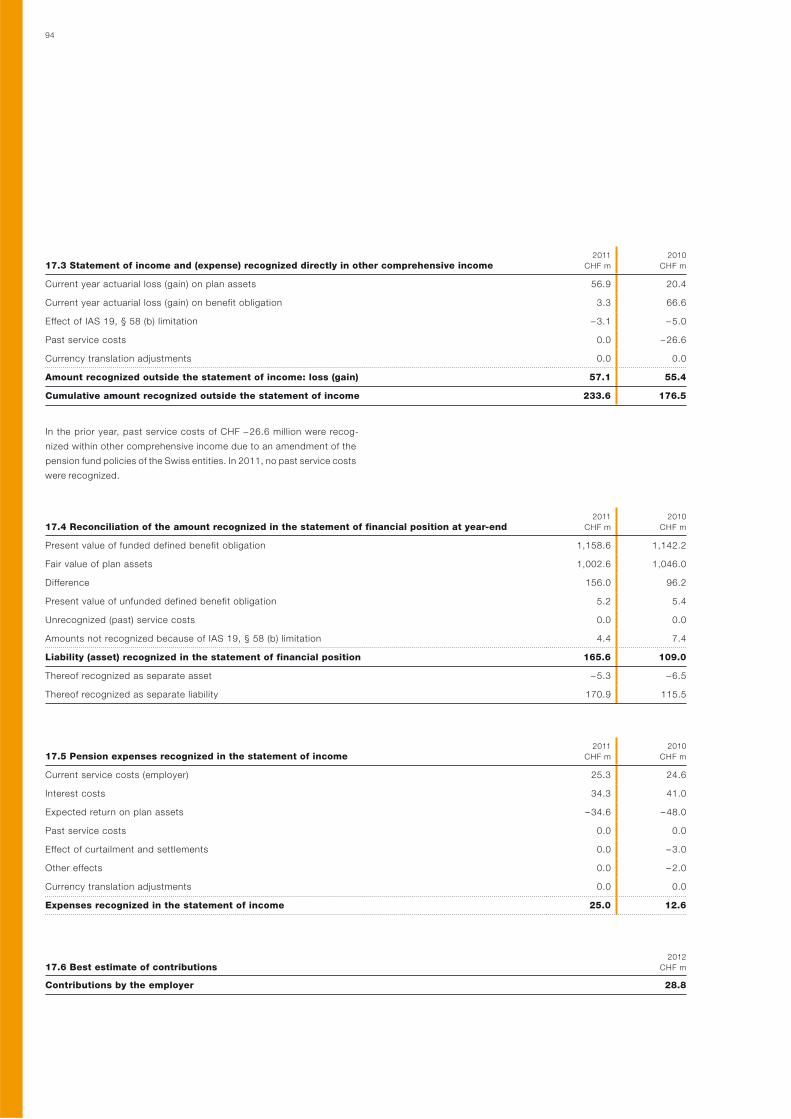
94
17.3 Statement of income and (expense) recognized directly in other comprehensive income 2011
CHF m
2010
CHF m
Current year actuarial loss (gain) on plan assets 56.9 20.4
Current year actuarial loss (gain) on benefit obligation 3.3 66.6
Effect of IAS 19, § 58 (b) limitation – 3.1 – 5.0
Past service costs 0.0 – 26.6
Currency translation adjustments 0.0 0.0
Amount recognized outside the statement of income: loss (gain) 57.1 55.4
Cumulative amount recognized outside the statement of income 233.6 176.5
In the prior year, past service costs of CHF – 26.6 million were recog-
nized within other comprehensive income due to an amendment of the
pension fund policies of the Swiss entities. In 2011, no past service costs
were recognized.
17.4 Reconciliation of the amount recognized in the statement of financial position at year-end2011
CHF m
2010
CHF m
Present value of funded defined benefit obligation 1,158.6 1,142.2
Fair value of plan assets 1,002.6 1,046.0
Difference 156.0 96.2
Present value of unfunded defined benefit obligation 5.2 5.4
Unrecognized (past) service costs 0.0 0.0
Amounts not recognized because of IAS 19, § 58 (b) limitation 4.4 7.4
Liability (asset) recognized in the statement of financial position 165.6 109.0
Thereof recognized as separate asset – 5.3 – 6.5
Thereof recognized as separate liability 170.9 115.5
17.5 Pension expenses recognized in the statement of income 2011
CHF m
2010
CHF m
Current service costs (employer) 25.3 24.6
Interest costs 34.3 41.0
Expected return on plan assets – 34.6 – 48.0
Past service costs 0.0 0.0
Effect of curtailment and settlements 0.0 – 3.0
Other effects 0.0 – 2.0
Currency translation adjustments 0.0 0.0
Expenses recognized in the statement of income 25.0 12.6
17.6 Best estimate of contributions2012
CHF m
Contributions by the employer 28.8
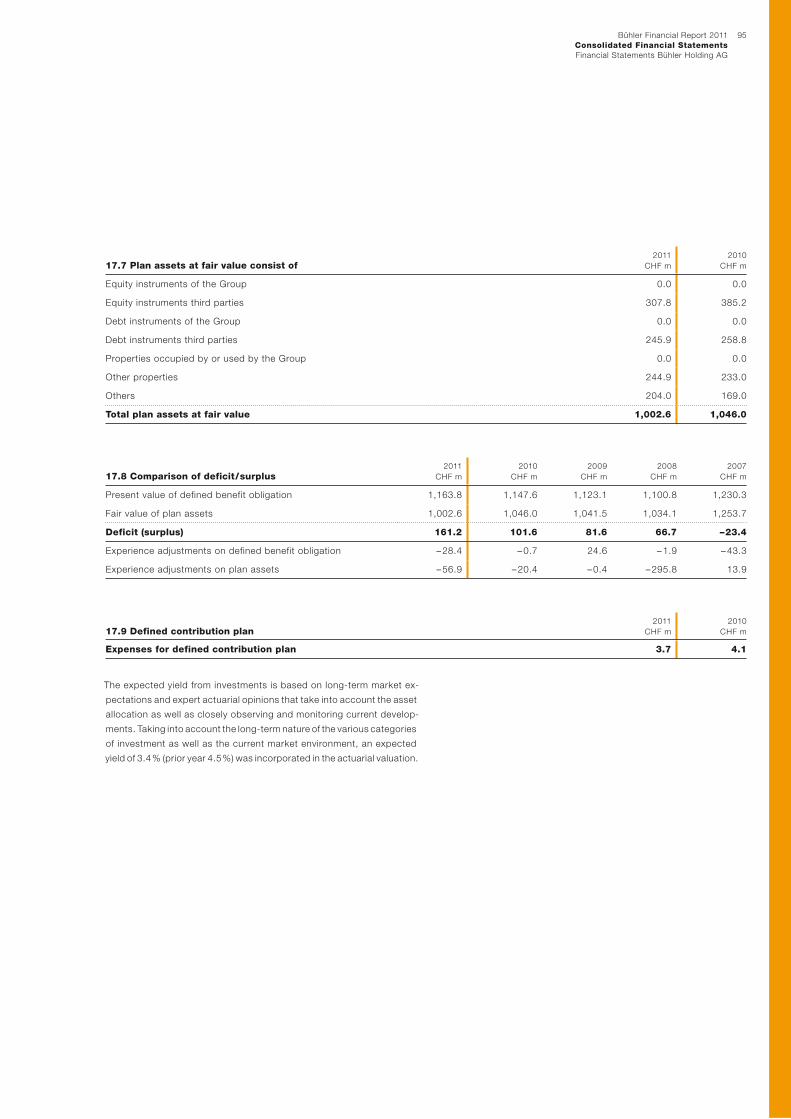
95Bühler Financial Report 2011
Consolidated Financial StatementsFinancial Statements Bühler Holding AG
17.7 Plan assets at fair value consist of2011
CHF m
2010
CHF m
Equity instruments of the Group 0.0 0.0
Equity instruments third parties 307.8 385.2
Debt instruments of the Group 0.0 0.0
Debt instruments third parties 245.9 258.8
Properties occupied by or used by the Group 0.0 0.0
Other properties 244.9 233.0
Others 204.0 169.0
Total plan assets at fair value 1,002.6 1,046.0
17.8 Comparison of deficit / surplus2011
CHF m
2010
CHF m
2009
CHF m
2008
CHF m
2007
CHF m
Present value of defined benefit obligation 1,163.8 1,147.6 1,123.1 1,100.8 1,230.3
Fair value of plan assets 1,002.6 1,046.0 1,041.5 1,034.1 1,253.7
Deficit (surplus) 161.2 101.6 81.6 66.7 – 23.4
Experience adjustments on defined benefit obligation – 28.4 – 0.7 24.6 – 1.9 – 43.3
Experience adjustments on plan assets – 56.9 – 20.4 – 0.4 – 295.8 13.9
17.9 Defined contribution plan2011
CHF m
2010
CHF m
Expenses for defined contribution plan 3.7 4.1
The expected yield from investments is based on long-term market ex-
pectations and expert actuarial opinions that take into account the asset
allocation as well as closely observing and monitoring current develop-
ments. Taking into account the long-term nature of the various categories
of in vestment as well as the current market environment, an expected
yield of 3.4 % (prior year 4.5 %) was incorporated in the actuarial valuation.
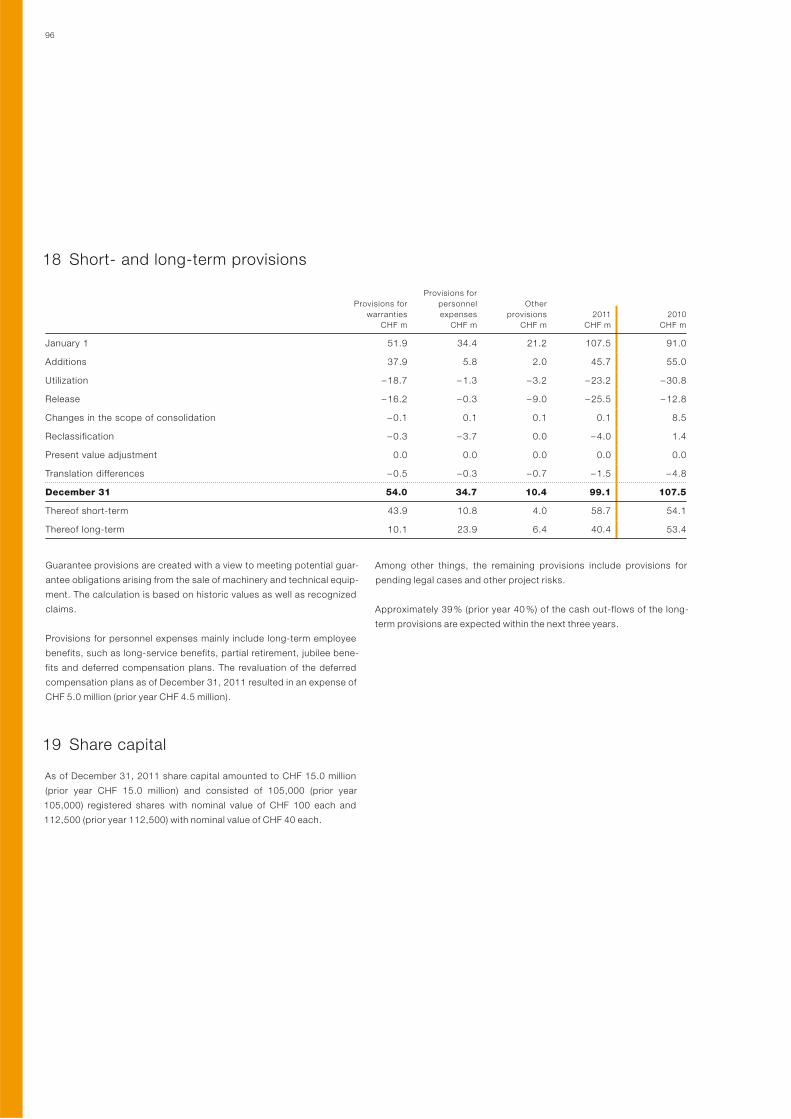
96
18 Short- and long-term provisions
Provisions for
warranties
CHF m
Provisions for
personnel
expenses
CHF m
Other
provisions
CHF m
2011
CHF m
2010
CHF m
January 1 51.9 34.4 21.2 107.5 91.0
Additions 37.9 5.8 2.0 45.7 55.0
Utilization – 18.7 – 1.3 – 3.2 – 23.2 – 30.8
Release – 16.2 – 0.3 – 9.0 – 25.5 – 12.8
Changes in the scope of consolidation – 0.1 0.1 0.1 0.1 8.5
Reclassification – 0.3 – 3.7 0.0 – 4.0 1.4
Present value adjustment 0.0 0.0 0.0 0.0 0.0
Translation differences – 0.5 – 0.3 – 0.7 – 1.5 – 4.8
December 31 54.0 34.7 10.4 99.1 107.5
Thereof short-term 43.9 10.8 4.0 58.7 54.1
Thereof long-term 10.1 23.9 6.4 40.4 53.4
Guarantee provisions are created with a view to meeting potential guar-
antee obligations arising from the sale of machinery and technical equip-
ment. The calculation is based on historic values as well as recognized
claims.
Provisions for personnel expenses mainly include long-term employee
benefits, such as long-service benefits, partial retirement, jubilee bene-
fits and deferred compensation plans. The revaluation of the deferred
compensation plans as of December 31, 2011 resulted in an expense of
CHF 5.0 million (prior year CHF 4.5 million).
Among other things, the remaining provisions include provisions for
pending legal cases and other project risks.
Approximately 39 % (prior year 40 %) of the cash out-flows of the long-
term provisions are expected within the next three years.
19 Share capital
As of December 31, 2011 share capital amounted to CHF 15.0 million
(prior year CHF 15.0 million) and consisted of 105,000 (prior year
105,000) registered shares with nominal value of CHF 100 each and
112,500 (prior year 112,500) with nominal value of CHF 40 each.
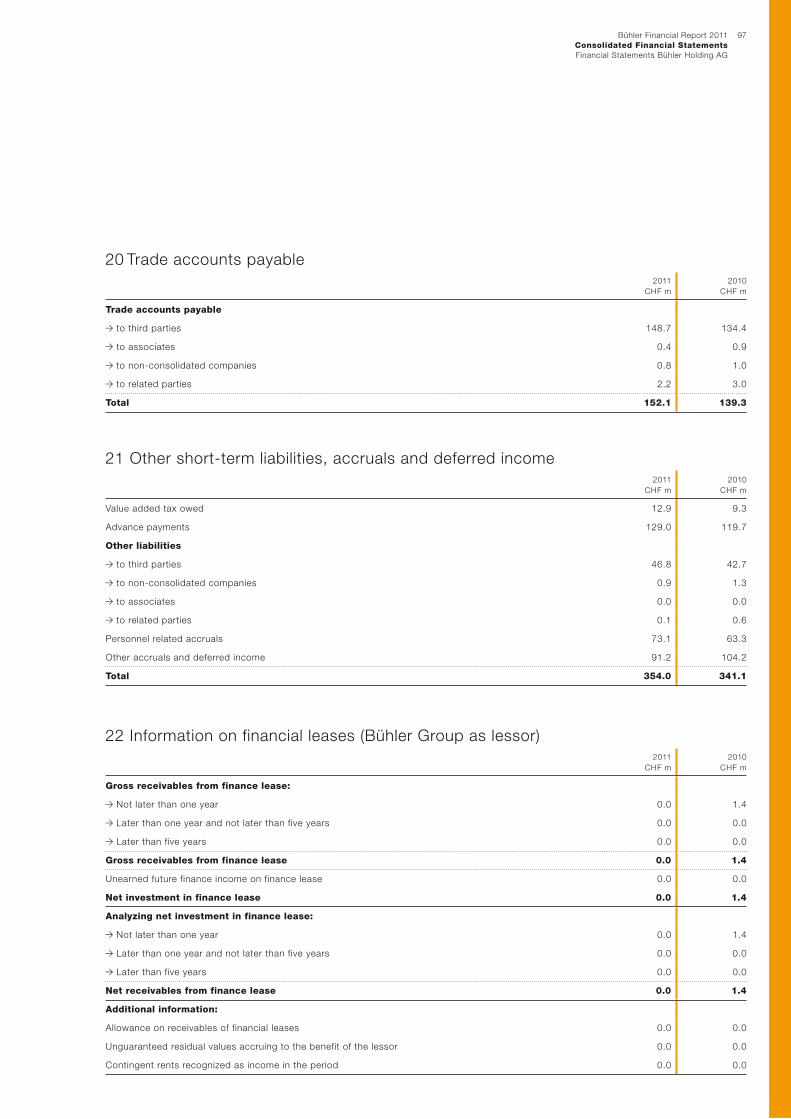
97Bühler Financial Report 2011
Consolidated Financial StatementsFinancial Statements Bühler Holding AG
20 Trade accounts payable2011
CHF m
2010
CHF m
Trade accounts payable
to third parties 148.7 134.4
to associates 0.4 0.9
to non-consolidated companies 0.8 1.0
to related parties 2.2 3.0
Total 152.1 139.3
21 Other short-term liabilities, accruals and deferred income2011
CHF m
2010
CHF m
Value added tax owed 12.9 9.3
Advance payments 129.0 119.7
Other liabilities
to third parties 46.8 42.7
to non-consolidated companies 0.9 1.3
to associates 0.0 0.0
to related parties 0.1 0.6
Personnel related accruals 73.1 63.3
Other accruals and deferred income 91.2 104.2
Total 354.0 341.1
22 Information on financial leases (Bühler Group as lessor)2011
CHF m
2010
CHF m
Gross receivables from finance lease:
Not later than one year 0.0 1.4
Later than one year and not later than five years 0.0 0.0
Later than five years 0.0 0.0
Gross receivables from finance lease 0.0 1.4
Unearned future finance income on finance lease 0.0 0.0
Net investment in finance lease 0.0 1.4
Analyzing net investment in finance lease:
Not later than one year 0.0 1.4
Later than one year and not later than five years 0.0 0.0
Later than five years 0.0 0.0
Net receivables from finance lease 0.0 1.4
Additional information:
Allowance on receivables of financial leases 0.0 0.0
Unguaranteed residual values accruing to the benefit of the lessor 0.0 0.0
Contingent rents recognized as income in the period 0.0 0.0
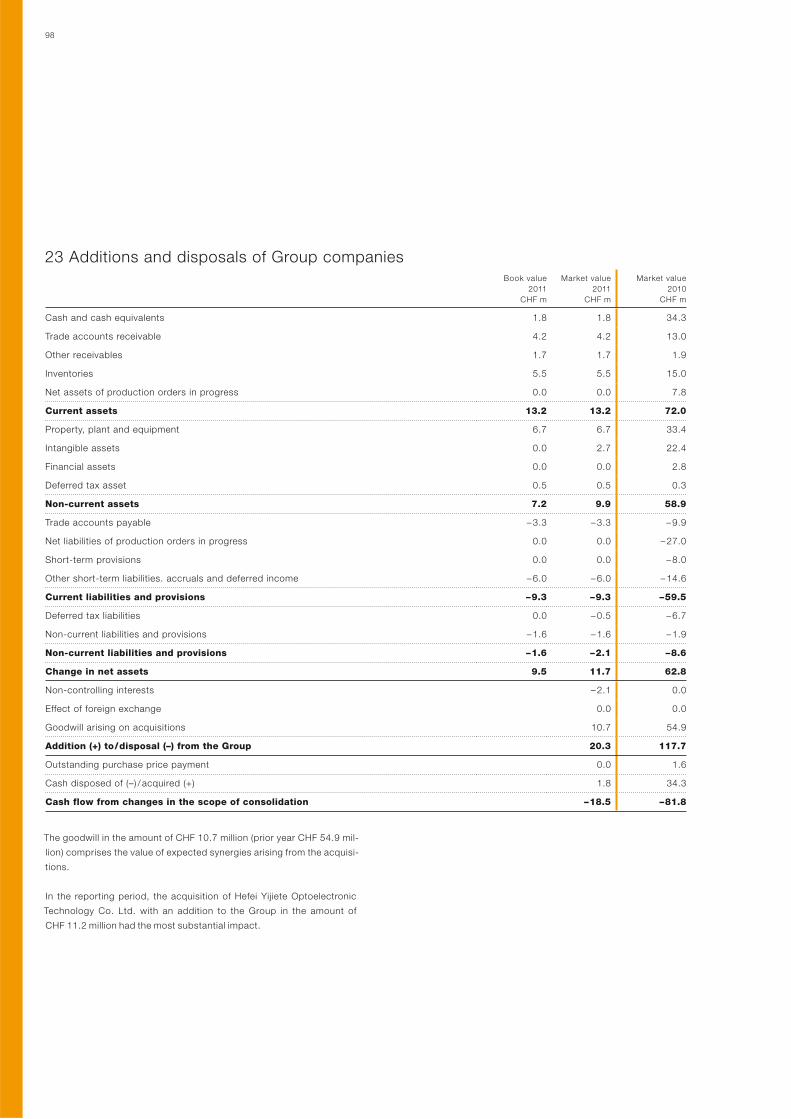
98
23 Additions and disposals of Group companiesBook value
2011
CHF m
Market value
2011
CHF m
Market value
2010
CHF m
Cash and cash equivalents 1.8 1.8 34.3
Trade accounts receivable 4.2 4.2 13.0
Other receivables 1.7 1.7 1.9
Inventories 5.5 5.5 15.0
Net assets of production orders in progress 0.0 0.0 7.8
Current assets 13.2 13.2 72.0
Property, plant and equipment 6.7 6.7 33.4
Intangible assets 0.0 2.7 22.4
Financial assets 0.0 0.0 2.8
Deferred tax asset 0.5 0.5 0.3
Non-current assets 7.2 9.9 58.9
Trade accounts payable – 3.3 – 3.3 – 9.9
Net liabilities of production orders in progress 0.0 0.0 – 27.0
Short-term provisions 0.0 0.0 – 8.0
Other short-term liabilities. accruals and deferred income – 6.0 – 6.0 – 14.6
Current liabilities and provisions – 9.3 – 9.3 – 59.5
Deferred tax liabilities 0.0 – 0.5 – 6.7
Non-current liabilities and provisions – 1.6 – 1.6 – 1.9
Non-current liabilities and provisions – 1.6 – 2.1 – 8.6
Change in net assets 9.5 11.7 62.8
Non-controlling interests – 2.1 0.0
Effect of foreign exchange 0.0 0.0
Goodwill arising on acquisitions 10.7 54.9
Addition (+) to / disposal (–) from the Group 20.3 117.7
Outstanding purchase price payment 0.0 1.6
Cash disposed of (–) / acquired (+) 1.8 34.3
Cash flow from changes in the scope of consolidation – 18.5 – 81.8
The goodwill in the amount of CHF 10.7 million (prior year CHF 54.9 mil-
lion) comprises the value of expected synergies arising from the acquisi-
tions.
In the reporting period, the acquisition of Hefei Yijiete Optoelectronic
Technology Co. Ltd. with an addition to the Group in the amount of
CHF 11.2 million had the most substantial impact.
99Bühler Financial Report 2011
Consolidated Financial StatementsFinancial Statements Bühler Holding AG
2011
Acquisition of Draiswerke Inc., United States of America. On Janu-
ary 1, 2011 the Group acquired 100 % of the shares in Draiswerke Inc.,
Mahwah, NJ, United States of America. The company develops, manu-
factures and sells cleantech products that enable productivity and effi-
ciency to be increased while conserving natural resources and cutting
energy consumption at the same time. In addition, Draiswerke Inc. main-
tains a testing center and provides process engineering as well as cus-
tomer services.
Establishment of Buhler Asia Pte Ltd. Singapore. On January 1, 2011
Buhler Asia Pte Ltd. started to operate as a sales, service and engineering
company in Singapore with a capital of USD 1.0 million.
Establishment of Buhler (Thailand) Ltd., Thailand. On January 4,
2011 the Group founded Buhler (Thailand) Ltd. with a capital of THB
10.0 million. The company conducts sales activities and provides services
to our customers in Thailand.
Acquisition of J.A. Tijdhof Beheer B.V., The Netherlands. On May 6,
2011 the Group acquired 100 % of the shares in J.A. Tijdhof Beheer B.V.,
Oldenzaal, The Netherlands, which was subsequently renamed into
Bühler B.V. The company manufactures and sells extrusion dies for the
feed and biomass market.
Acquisition of Hefei Yijiete Optoelectronic Technology Co. Ltd.,
China. On June 21, 2011 the Group acquired 70 % of the shares in Hefei
Yijiete Optoelectronic Technology Co. Ltd., Hefei, China. The company
manufactures and sells sorting machines focusing primarily on sorting
machines for the mid-sized market.
2010
Acquisition of Sanmak Industria de Maquinas S.A., Brazil. On Janu-
ary 15, 2010 the Group acquired 100 % of the shares in Sanmak Industria
de Maquinas S.A., Blumenau, Brazil. The company develops, manufac-
tures and sells sorting machines, and focuses primarily on the South
American market.
Acquisition of Bangsheng Bio-Technology Co. Ltd, China. On
June 1, 2010 the Group acquired 100 % of the shares in Bangsheng Bio-
Tech nology Co. Ltd., Guangzhou, China. The company manufactures,
distributes and trades food ingredients, food mixtures, specialty flour
improvers and baking ingredients for flour mill operators and the food-
processing industry.
Acquisition of Schmidt-Seeger GmbH, Germany. On September 22,
2010 the Group acquired 100 % of the shares in Schmidt-Seeger GmbH,
Beilngries, Germany. The company is globally active as a plant supplier in
the field of grain management and malting. In addition to its headquarters
in Beilngries, north of Munich, the company also has further production
sites in Döblen, near Dresden, and Delhi, India.
Establishment of Hebei Buhler Machinery Co. Ltd, China. On
July 28, 2010 the Group founded the Hebei Buhler Machinery Co. Ltd.
with capital of CNY 3.0 million. The company processes, sells and main-
tains mechanical components as well as providing services to millers.
24 Impairment tests
The recoverable amounts have been determined based on a value-in-use
calculation. This calculation uses cash flow projections based on finan-
cial budgets approved by the respective division management covering
a five-year period.
Key assumptions used in value-in-use calculations. The calcula-
tions of values in use are most sensitive to the following assumptions:
Gross margin
Discount rate
Growth rate used to extrapolate cash flows beyond
the budget period
Raw materials price inflation
Market share assumptions
Gross margin – Gross margins are based on average values reported in
the three years preceding the start of the forecast period. These gross
margins are adjusted based on the latest available information regarding
the actual gross margins as well as anticipated efficiency improvements
over the forecast period.
Discount rate – The discount rates which are used to calculate the dis-
counted present value of the future cash flows are derived from a capital
asset pricing model using market data such as the yield on a ten-year
government bond of the respective country or specific country risk pre-
miums.
Growth rate estimates – The assumptions used in the calculation reflect
the long-term expected growth rate of the operational business and are
based on the growth strategy of the Group.
Raw materials price inflation – Estimates are obtained from published
indices relating to specific commodities. Past actual raw materials price
movements have been used as an indicator of future price movements.
Market share assumptions – The management assumes that the unit’s
position, relative to that of its competitors, may not change significantly
over the forecast period. Market share is expected to be stable over the
forecast period.
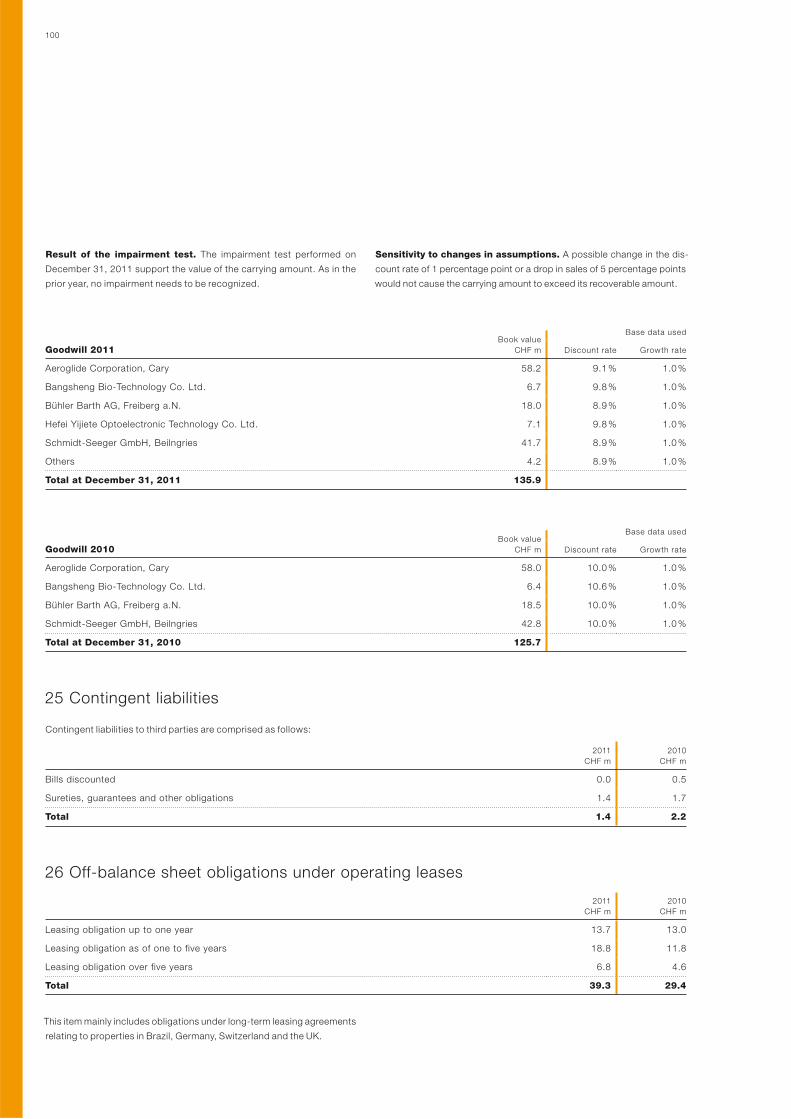
100
Result of the impairment test. The impairment test performed on
December 31, 2011 support the value of the carrying amount. As in the
prior year, no impairment needs to be recognized.
Sensitivity to changes in assumptions. A possible change in the dis-
count rate of 1 percentage point or a drop in sales of 5 percentage points
would not cause the carrying amount to exceed its recoverable amount.
Book value
CHF m
Base data used
Goodwill 2011 Discount rate Growth rate
Aeroglide Corporation, Cary 58.2 9.1 % 1.0 %
Bangsheng Bio-Technology Co. Ltd. 6.7 9.8 % 1.0 %
Bühler Barth AG, Freiberg a.N. 18.0 8.9 % 1.0 %
Hefei Yijiete Optoelectronic Technology Co. Ltd. 7.1 9.8 % 1.0 %
Schmidt-Seeger GmbH, Beilngries 41.7 8.9 % 1.0 %
Others 4.2 8.9 % 1.0 %
Total at December 31, 2011 135.9
Book value
CHF m
Base data used
Goodwill 2010 Discount rate Growth rate
Aeroglide Corporation, Cary 58.0 10.0 % 1.0 %
Bangsheng Bio-Technology Co. Ltd. 6.4 10.6 % 1.0 %
Bühler Barth AG, Freiberg a.N. 18.5 10.0 % 1.0 %
Schmidt-Seeger GmbH, Beilngries 42.8 10.0 % 1.0 %
Total at December 31, 2010 125.7
25 Contingent liabilities
Contingent liabilities to third parties are comprised as follows:
2011
CHF m
2010
CHF m
Bills discounted 0.0 0.5
Sureties, guarantees and other obligations 1.4 1.7
Total 1.4 2.2
26 Off-balance sheet obligations under operating leases
2011
CHF m
2010
CHF m
Leasing obligation up to one year 13.7 13.0
Leasing obligation as of one to five years 18.8 11.8
Leasing obligation over five years 6.8 4.6
Total 39.3 29.4
This item mainly includes obligations under long-term leasing agreements
relating to properties in Brazil, Germany, Switzerland and the UK.
101Bühler Financial Report 2011
Consolidated Financial StatementsFinancial Statements Bühler Holding AG
27 Assets pledged or assigned to secure own liabilities
Borrowers’ notes in the following amounts were created with respect to
mortgages:
2011
CHF m
2010
CHF m
Carrying amount of real estates 0.0 17.8
Nominal amount used 0.0 9.3
Actual amount used 0.0 0.0
In the previous year, the acquisition of Schmidt-Seeger GmbH resulted
in the Group acquiring mortgage debts that were fully repaid by the end
of 2010.
In connection with open legal cases, assets of CHF 1.0 million (prior year
CHF 5.4 million) serve as collateral for own liabilities where the right of
disposal is limited.
28 Research and development costs
Research and development costs directly charged to the income state-
ment in the reporting period amounted to CHF 88.8 million (prior year
CHF 78.8 million). The main research and development unit is located at
the Uzwil headquarters.
29 Related parties
Related party transactions. A loan towards the shareholders in the
amount of CHF 70.0 million (prior year CHF 0.0 million) is disclosed under
other non-current financial assets. Loans from the shareholders in the
amount of CHF 50.0 million (prior year CHF 50.0 million) respectively
CHF 87.8 million (prior year CHF 9.2 million) is disclosed under short-term
respectively long-term financial liabilities. Other related party positions
are disclosed separately in the notes. Liabilities to pension plans amount-
ed to CHF 1.1 million as per 2011 (prior year CHF 1.7 million). Related-
party transactions are conducted at arm’s length.
Key management compensation. Key management (defined as Group
Management and Board of Directors) received a total short-term compen-
sation of CHF 8.7 million (prior year CHF 7.1 million). In addition, pension
and social security contributions of CHF 1.1 million (prior year CHF
0.9 million) and CHF 5.0 million (prior year CHF 4.5 million) provisions for
other long-term benefits are recorded as expense.
30 Proposal of the Board of Directors
At the General Meeting, the Board of Directors proposes a dividend of
CHF 18.0 million (prior year CHF 18.0 million) or CHF 120 (prior year
CHF 120) per registered share with a nominal value of CHF 100 and
CHF 48 (prior year CHF 48) per registered share with a nominal value of
CHF 40 for the fiscal year 2011. The dividend payment to the sharehold-
ers of the Bühler Holding AG amounted to CHF 18.0 million in the finan-
cial year 2011 (prior year CHF 12.0 million).
31 Release for publication of the consolidated financial statements
The consolidated financial statements were released for publication by
the Board of Directors of the Bühler Holding AG on March 20, 2012.
32 Subsequent events
As of January 1, 2012 the Group has acquired a manufacturing facility in
Zamberk (Czech Republic). With these manufacturing capacities, the
Group is pursuing the strategic goals of continuing the growth especially
in Eastern Europe and manufacturing the products as closely to the cus-
tomers as possible; of building a cost-efficient production site for the top
market; and of increasing the flexibility by absorbing capacity peaks in
the future.
No other material events occurred after the balance sheet date.
102
Report of the statutory auditor on the consolidated financial statements
As statutory auditor, we have audited the accompanying consolidated
financial statements of Bühler Holding AG, which comprise the consoli-
dated statement of income, consolidated statement of comprehensive
income, consolidated statement of financial position, consolidated
statement of changes in equity, consolidated statement of cash flows
and notes (pages 65 to 101) for the year ended December 31, 2011.
Board of Directors’ responsibility. The Board of Directors is respon-
sible for the preparation and fair presentation of the consolidated finan-
cial statements in accordance with International Financial Reporting
Standards (IFRS) and the requirements of Swiss law. This responsibility
includes designing, implementing and maintaining an internal control
system relevant to the preparation and fair presentation of consolidated
financial statements that are free from material misstatement, whether
due to fraud or error. The Board of Directors is further responsible for se-
lecting and applying appropriate accounting policies and making ac-
counting estimates that are reasonable in the circumstances.
Auditor’s responsibility. Our responsibility is to express an opinion on
these consolidated financial statements based on our audit. We con-
ducted our audit in accordance with Swiss law and Swiss Auditing Stan-
dards and International Standards on Auditing (ISA). Those standards
require that we plan and perform the audit to obtain reasonable assur-
ance whether the consolidated financial statements are free from mate-
rial misstatement.
An audit involves performing procedures to obtain audit evidence about
the amounts and disclosures in the consolidated financial statements.
The procedures selected depend on the auditor’s judgment, including
the assessment of the risks of material misstatement of the consolidated
financial statements, whether due to fraud or error. In making those risk
assessments, the auditor considers the internal control system relevant
to the entity’s preparation and fair presentation of the consolidated finan-
cial statements in order to design audit procedures that are appropriate
in the circumstances, but not for the purpose of expressing an opinion on
the effectiveness of the entity’s internal control system. An audit also in-
cludes evaluating the appropriateness of the accounting policies used
and the reasonableness of accounting estimates made, as well as evalu-
ating the overall presentation of the consolidated financial statements.
We believe that the audit evidence we have obtained is sufficient and
appropriate to provide a basis for our audit opinion.
Opinion. In our opinion, the consolidated financial statements for the
year ended December 31, 2011 give a true and fair view of the financial
position, the results of operations and the cash flows in accordance with
IFRS and comply with Swiss law.
Report on other legal requirements
We confirm that we meet the legal requirements on licensing according to
the Auditor Oversight Act (AOA) and independence (article 728 CO) and
that there are no circumstances incompatible with our independence.
In accordance with article 728a paragraph 1 item 3 CO and Swiss Audit-
ing Standard 890, we confirm that an internal control system exists,
which has been designed for the preparation of consolidated financial
statements according to the instructions of the Board of Directors.
We recommend that the consolidated financial statements submitted to
you be approved.
Ernst & Young AG
Thomas Stenz Markus Abderhalden
Licensed audit expert Licensed audit expert
(Auditor in charge)
REPORT OF THE STATUTORY AUDITOR.To the General Meeting of Bühler Holding AG, Uzwil, St. Gallen, March 20, 2012

103Bühler Financial Report 2011
Consolidated Financial Statements
Financial Statements Bühler Holding AG
FINANCIAL STATEMENTS BÜHLER HOLDING AG.
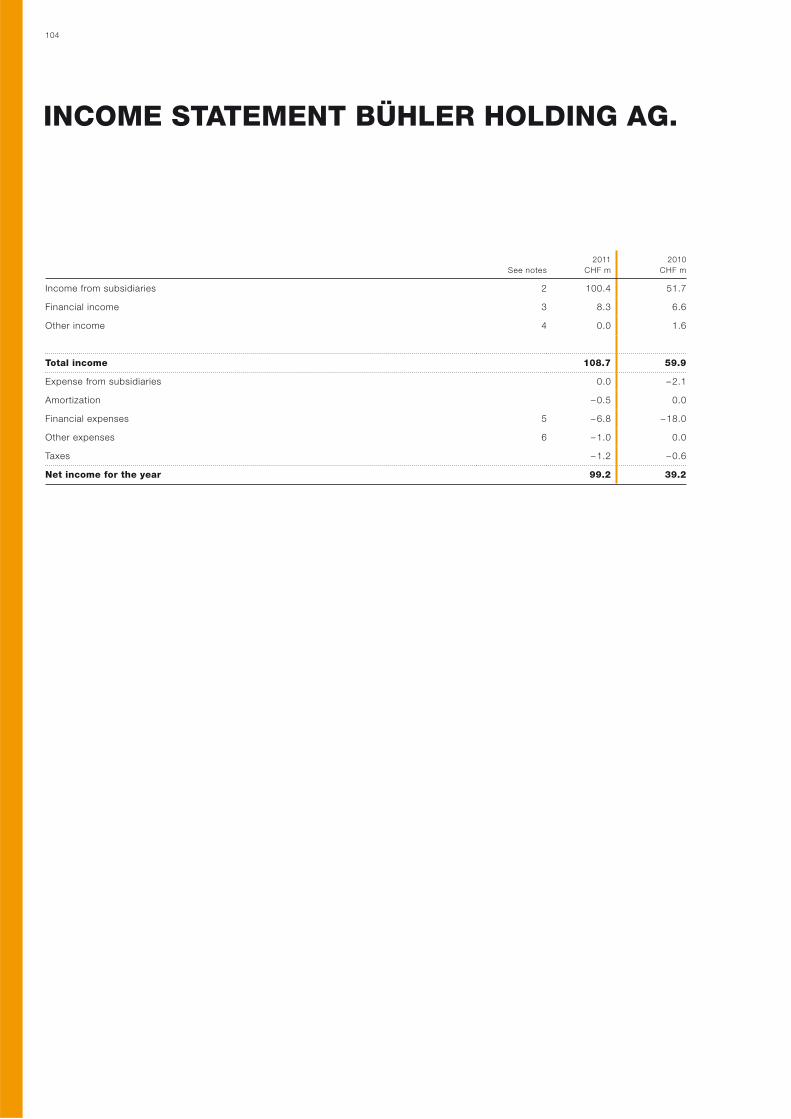
104
INCOME STATEMENT BÜHLER HOLDING AG.
See notes
2011
CHF m
2010
CHF m
Income from subsidiaries 2 100.4 51.7
Financial income 3 8.3 6.6
Other income 4 0.0 1.6
Total income 108.7 59.9
Expense from subsidiaries 0.0 – 2.1
Amortization – 0.5 0.0
Financial expenses 5 – 6.8 – 18.0
Other expenses 6 – 1.0 0.0
Taxes – 1.2 – 0.6
Net income for the year 99.2 39.2
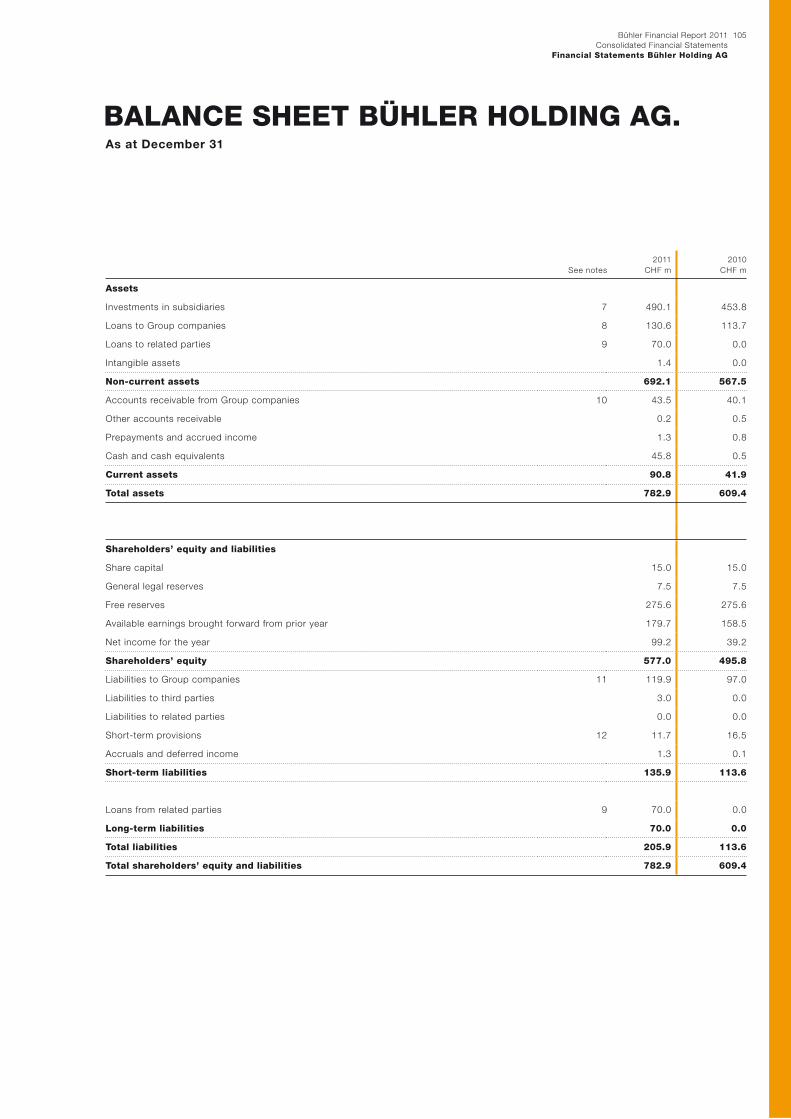
105Bühler Financial Report 2011
Consolidated Financial Statements
Financial Statements Bühler Holding AG
BALANCE SHEET BÜHLER HOLDING AG.As at December 31
See notes
2011
CHF m
2010
CHF m
Assets
Investments in subsidiaries 7 490.1 453.8
Loans to Group companies 8 130.6 113.7
Loans to related parties 9 70.0 0.0
Intangible assets 1.4 0.0
Non-current assets 692.1 567.5
Accounts receivable from Group companies 10 43.5 40.1
Other accounts receivable 0.2 0.5
Prepayments and accrued income 1.3 0.8
Cash and cash equivalents 45.8 0.5
Current assets 90.8 41.9
Total assets 782.9 609.4
Shareholders’ equity and liabilities
Share capital 15.0 15.0
General legal reserves 7.5 7.5
Free reserves 275.6 275.6
Available earnings brought forward from prior year 179.7 158.5
Net income for the year 99.2 39.2
Shareholders’ equity 577.0 495.8
Liabilities to Group companies 11 119.9 97.0
Liabilities to third parties 3.0 0.0
Liabilities to related parties 0.0 0.0
Short-term provisions 12 11.7 16.5
Accruals and deferred income 1.3 0.1
Short-term liabilities 135.9 113.6
Loans from related parties 9 70.0 0.0
Long-term liabilities 70.0 0.0
Total liabilities 205.9 113.6
Total shareholders’ equity and liabilities 782.9 609.4
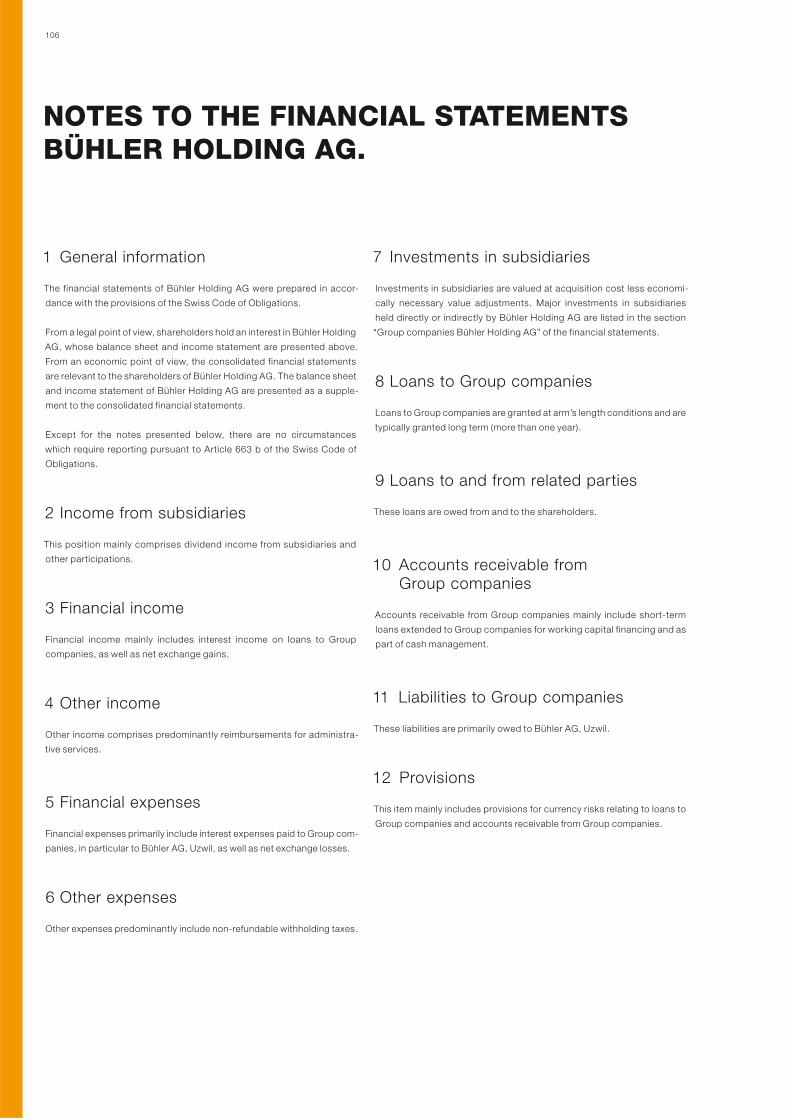
106
NOTES TO THE FINANCIAL STATEMENTS BÜHLER HOLDING AG.
1 General information
The financial statements of Bühler Holding AG were prepared in accor-
dance with the provisions of the Swiss Code of Obligations.
From a legal point of view, shareholders hold an interest in Bühler Holding
AG, whose balance sheet and income statement are presented above.
From an economic point of view, the consolidated financial statements
are relevant to the shareholders of Bühler Holding AG. The balance sheet
and income statement of Bühler Holding AG are presented as a supple-
ment to the consolidated financial statements.
Except for the notes presented below, there are no circumstances
which require reporting pursuant to Article 663 b of the Swiss Code of
Obligations.
2 Income from subsidiaries
This position mainly comprises dividend income from subsidiaries and
other participations.
3 Financial income
Financial income mainly includes interest income on loans to Group
companies, as well as net exchange gains.
4 Other income
Other income comprises predominantly reimbursements for administra-
tive services.
5 Financial expenses
Financial expenses primarily include interest expenses paid to Group com-
panies, in particular to Bühler AG, Uzwil, as well as net exchange losses.
6 Other expenses
Other expenses predominantly include non-refundable withholding taxes.
7 Investments in subsidiaries
Investments in subsidiaries are valued at acquisition cost less economi-
cally necessary value adjustments. Major investments in subsidiaries
held directly or indirectly by Bühler Holding AG are listed in the section
“Group companies Bühler Holding AG” of the financial statements.
8 Loans to Group companies
Loans to Group companies are granted at arm’s length conditions and are
typically granted long term (more than one year).
9 Loans to and from related parties
These loans are owed from and to the shareholders.
10 Accounts receivable from Group companies
Accounts receivable from Group companies mainly include short-term
loans extended to Group companies for working capital financing and as
part of cash management.
11 Liabilities to Group companies
These liabilities are primarily owed to Bühler AG, Uzwil.
12 Provisions
This item mainly includes provisions for currency risks relating to loans to
Group companies and accounts receivable from Group companies.
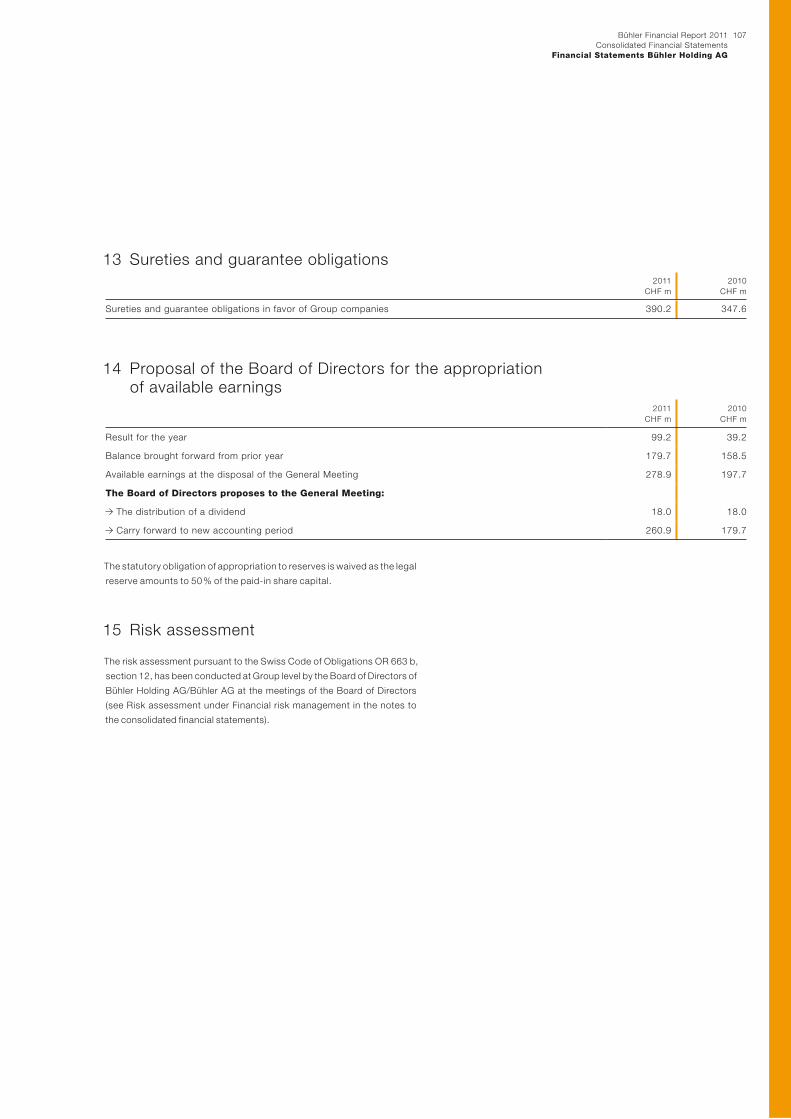
107Bühler Financial Report 2011
Consolidated Financial Statements
Financial Statements Bühler Holding AG
13 Sureties and guarantee obligations2011
CHF m
2010
CHF m
Sureties and guarantee obligations in favor of Group companies 390.2 347.6
14 Proposal of the Board of Directors for the appropriation of available earnings
2011
CHF m
2010
CHF m
Result for the year 99.2 39.2
Balance brought forward from prior year 179.7 158.5
Available earnings at the disposal of the General Meeting 278.9 197.7
The Board of Directors proposes to the General Meeting:
The distribution of a dividend 18.0 18.0
Carry forward to new accounting period 260.9 179.7
The statutory obligation of appropriation to reserves is waived as the legal
reserve amounts to 50 % of the paid-in share capital.
15 Risk assessment
The risk assessment pursuant to the Swiss Code of Obligations OR 663 b,
section 12, has been conducted at Group level by the Board of Directors of
Bühler Holding AG/Bühler AG at the meetings of the Board of Directors
(see Risk assessment under Financial risk management in the notes to
the consolidated financial statements).
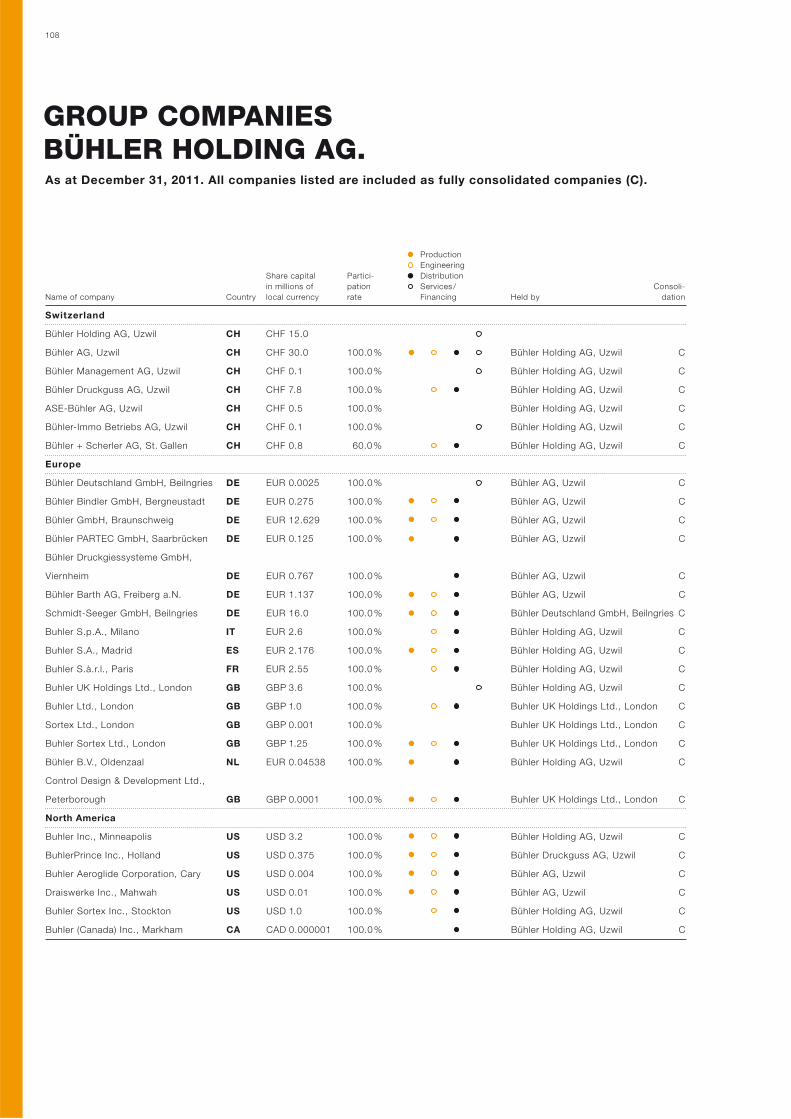
108
GROUP COMPANIES BÜHLER HOLDING AG.As at December 31, 2011. All companies listed are included as fully consolidated companies (C).
Production
Engineering
Share capital Partici- Distribution
in millions of pation Services / Consoli-
Name of company Country local currency rate Financing Held by dation
Switzerland
Bühler Holding AG, Uzwil CH CHF 15.0
Bühler AG, Uzwil CH CHF 30.0 100.0 % Bühler Holding AG, Uzwil C
Bühler Management AG, Uzwil CH CHF 0.1 100.0 % Bühler Holding AG, Uzwil C
Bühler Druckguss AG, Uzwil CH CHF 7.8 100.0 % Bühler Holding AG, Uzwil C
ASE-Bühler AG, Uzwil CH CHF 0.5 100.0 % Bühler Holding AG, Uzwil C
Bühler-Immo Betriebs AG, Uzwil CH CHF 0.1 100.0 % Bühler Holding AG, Uzwil C
Bühler + Scherler AG, St. Gallen CH CHF 0.8 60.0 % Bühler Holding AG, Uzwil C
Europe
Bühler Deutschland GmbH, Beilngries DE EUR 0.0025 100.0 % Bühler AG, Uzwil C
Bühler Bindler GmbH, Bergneustadt DE EUR 0.275 100.0 % Bühler AG, Uzwil C
Bühler GmbH, Braunschweig DE EUR 12.629 100.0 % Bühler AG, Uzwil C
Bühler PARTEC GmbH, Saarbrücken DE EUR 0.125 100.0 % Bühler AG, Uzwil C
Bühler Druckgiessysteme GmbH,
Viernheim DE EUR 0.767 100.0 % Bühler AG, Uzwil C
Bühler Barth AG, Freiberg a.N. DE EUR 1.137 100.0 % Bühler AG, Uzwil C
Schmidt-Seeger GmbH, Beilngries DE EUR 16.0 100.0 % Bühler Deutschland GmbH, Beilngries C
Buhler S.p.A., Milano IT EUR 2.6 100.0 % Bühler Holding AG, Uzwil C
Buhler S.A., Madrid ES EUR 2.176 100.0 % Bühler Holding AG, Uzwil C
Buhler S.à.r.l., Paris FR EUR 2.55 100.0 % Bühler Holding AG, Uzwil C
Buhler UK Holdings Ltd., London GB GBP 3.6 100.0 % Bühler Holding AG, Uzwil C
Buhler Ltd., London GB GBP 1.0 100.0 % Buhler UK Holdings Ltd., London C
Sortex Ltd., London GB GBP 0.001 100.0 % Buhler UK Holdings Ltd., London C
Buhler Sortex Ltd., London GB GBP 1.25 100.0 % Buhler UK Holdings Ltd., London C
Bühler B.V., Oldenzaal NL EUR 0.04538 100.0 % Bühler Holding AG, Uzwil C
Control Design & Development Ltd.,
Peterborough GB GBP 0.0001 100.0 % Buhler UK Holdings Ltd., London C
North America
Buhler Inc., Minneapolis US USD 3.2 100.0 % Bühler Holding AG, Uzwil C
BuhlerPrince Inc., Holland US USD 0.375 100.0 % Bühler Druckguss AG, Uzwil C
Buhler Aeroglide Corporation, Cary US USD 0.004 100.0 % Bühler AG, Uzwil C
Draiswerke Inc., Mahwah US USD 0.01 100.0 % Bühler AG, Uzwil C
Buhler Sortex Inc., Stockton US USD 1.0 100.0 % Bühler Holding AG, Uzwil C
Buhler (Canada) Inc., Markham CA CAD 0.000001 100.0 % Bühler Holding AG, Uzwil C
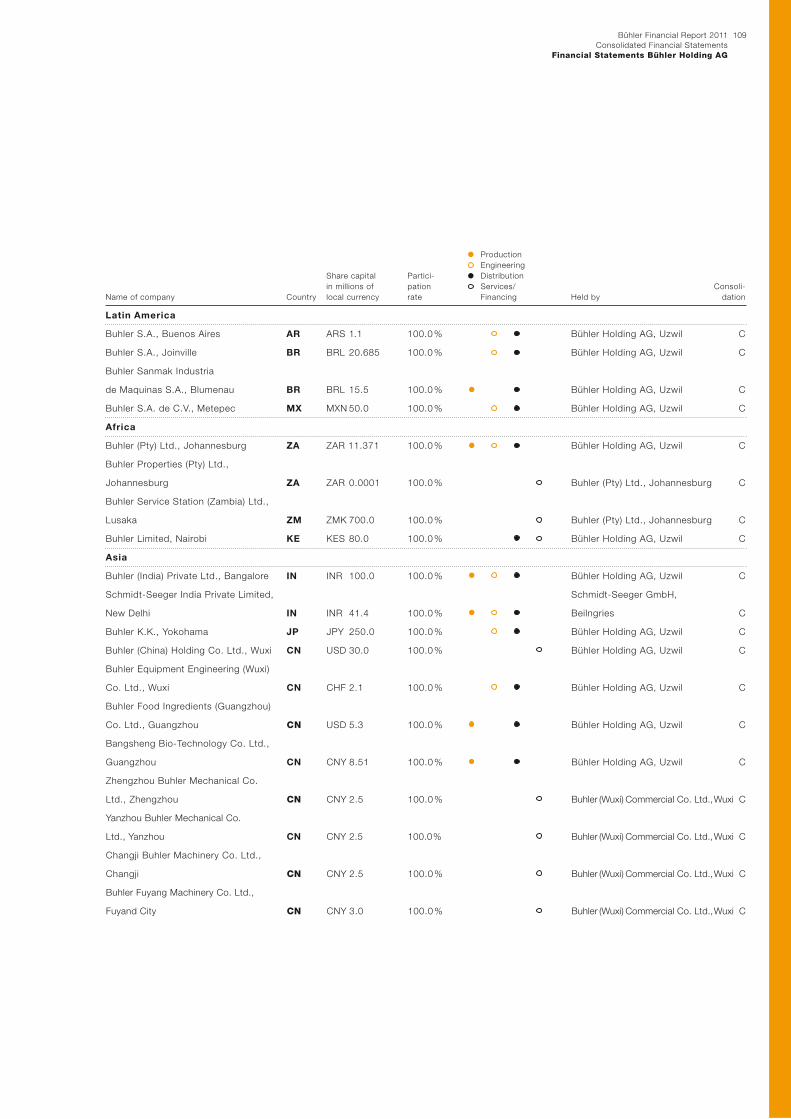
109Bühler Financial Report 2011
Consolidated Financial Statements
Financial Statements Bühler Holding AG
Production
Engineering
Share capital Partici- Distribution
in millions of pation Services/ Consoli-
Name of company Country local currency rate Financing Held by dation
Latin America
Buhler S.A., Buenos Aires AR ARS 1.1 100.0 % Bühler Holding AG, Uzwil C
Buhler S.A., Joinville BR BRL 20.685 100.0 % Bühler Holding AG, Uzwil C
Buhler Sanmak Industria
de Maquinas S.A., Blumenau BR BRL 15.5 100.0 % Bühler Holding AG, Uzwil C
Buhler S.A. de C.V., Metepec MX MXN 50.0 100.0 % Bühler Holding AG, Uzwil C
Africa
Buhler (Pty) Ltd., Johannesburg ZA ZAR 11.371 100.0 % Bühler Holding AG, Uzwil C
Buhler Properties (Pty) Ltd.,
Johannesburg ZA ZAR 0.0001 100.0 % Buhler (Pty) Ltd., Johannesburg C
Buhler Service Station (Zambia) Ltd.,
Lusaka ZM ZMK 700.0 100.0 % Buhler (Pty) Ltd., Johannesburg C
Buhler Limited, Nairobi KE KES 80.0 100.0 % Bühler Holding AG, Uzwil C
Asia
Buhler (India) Private Ltd., Bangalore IN INR 100.0 100.0 % Bühler Holding AG, Uzwil C
Schmidt-Seeger India Private Limited, Schmidt-Seeger GmbH,
New Delhi IN INR 41.4 100.0 % Beilngries C
Buhler K.K., Yokohama JP JPY 250.0 100.0 % Bühler Holding AG, Uzwil C
Buhler (China) Holding Co. Ltd., Wuxi CN USD 30.0 100.0 % Bühler Holding AG, Uzwil C
Buhler Equipment Engineering (Wuxi)
Co. Ltd., Wuxi CN CHF 2.1 100.0 % Bühler Holding AG, Uzwil C
Buhler Food Ingredients (Guangzhou)
Co. Ltd., Guangzhou CN USD 5.3 100.0 % Bühler Holding AG, Uzwil C
Bangsheng Bio-Technology Co. Ltd.,
Guangzhou CN CNY 8.51 100.0 % Bühler Holding AG, Uzwil C
Zhengzhou Buhler Mechanical Co.
Ltd., Zhengzhou CN CNY 2.5 100.0 % Buhler (Wuxi) Commercial Co. Ltd., Wuxi C
Yanzhou Buhler Mechanical Co.
Ltd., Yanzhou CN CNY 2.5 100.0 % Buhler (Wuxi) Commercial Co. Ltd., Wuxi C
Changji Buhler Machinery Co. Ltd.,
Changji CN CNY 2.5 100.0 % Buhler (Wuxi) Commercial Co. Ltd., Wuxi C
Buhler Fuyang Machinery Co. Ltd.,
Fuyand City CN CNY 3.0 100.0 % Buhler (Wuxi) Commercial Co. Ltd., Wuxi C
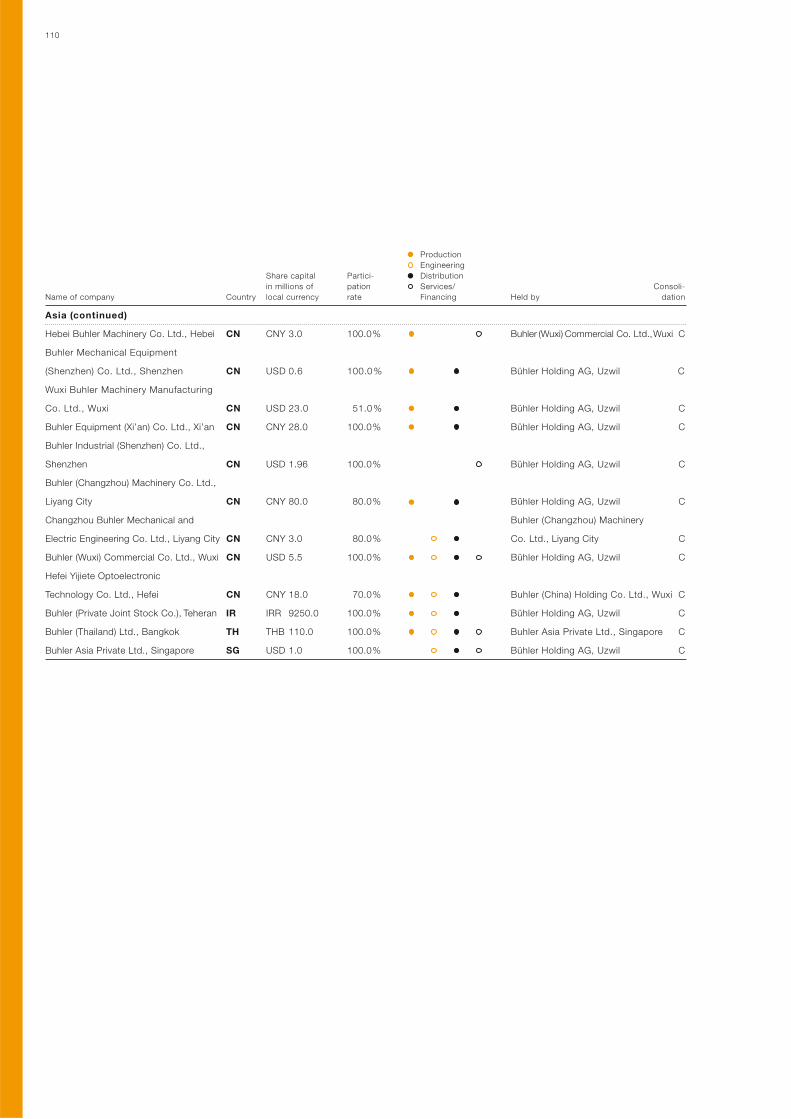
110
Production
Engineering
Share capital Partici- Distribution
in millions of pation Services/ Consoli-
Name of company Country local currency rate Financing Held by dation
Asia (continued)
Hebei Buhler Machinery Co. Ltd., Hebei CN CNY 3.0 100.0 % Buhler (Wuxi) Commercial Co. Ltd., Wuxi C
Buhler Mechanical Equipment
(Shenzhen) Co. Ltd., Shenzhen CN USD 0.6 100.0 % Bühler Holding AG, Uzwil C
Wuxi Buhler Machinery Manufacturing
Co. Ltd., Wuxi CN USD 23.0 51.0 % Bühler Holding AG, Uzwil C
Buhler Equipment (Xi’an) Co. Ltd., Xi’an CN CNY 28.0 100.0 % Bühler Holding AG, Uzwil C
Buhler Industrial (Shenzhen) Co. Ltd.,
Shenzhen CN USD 1.96 100.0 % Bühler Holding AG, Uzwil C
Buhler (Changzhou) Machinery Co. Ltd.,
Liyang City CN CNY 80.0 80.0 % Bühler Holding AG, Uzwil C
Changzhou Buhler Mechanical and Buhler (Changzhou) Machinery
Electric Engineering Co. Ltd., Liyang City CN CNY 3.0 80.0 % Co. Ltd., Liyang City C
Buhler (Wuxi) Commercial Co. Ltd., Wuxi CN USD 5.5 100.0 % Bühler Holding AG, Uzwil C
Hefei Yijiete Optoelectronic
Technology Co. Ltd., Hefei CN CNY 18.0 70.0 % Buhler (China) Holding Co. Ltd., Wuxi C
Buhler (Private Joint Stock Co.), Teheran IR IRR 9250.0 100.0 % Bühler Holding AG, Uzwil C
Buhler (Thailand) Ltd., Bangkok TH THB 110.0 100.0 % Buhler Asia Private Ltd., Singapore C
Buhler Asia Private Ltd., Singapore SG USD 1.0 100.0 % Bühler Holding AG, Uzwil C
111Bühler Financial Report 2011
Consolidated Financial Statements
Financial Statements Bühler Holding AG
Report of the statutory auditor on the financial statements
As statutory auditor, we have audited the accompanying financial state-
ments of Bühler Holding AG, which comprise the balance sheet, in come
statement and notes (pages 104 to 110) for the year ended December 31,
2011.
Board of Directors’ responsibility. The Board of Directors is responsi-
ble for the preparation of the financial statements in accordance with the
requirements of Swiss law and the company’s articles of incorporation.
This responsibility includes designing, implementing and maintaining an
internal control system relevant to the preparation of financial statements
that are free from material misstatement, whether due to fraud or error.
The Board of Directors is further responsible for selecting and applying
appropriate accounting policies and making accounting estimates that
are reasonable in the circumstances.
Auditor’s responsibility. Our responsibility is to express an opinion on
these financial statements based on our audit. We conducted our audit in
accordance with Swiss law and Swiss Auditing Standards as well as the
International Standards on Auditing (ISA). Those standards require that
we plan and perform the audit to obtain reasonable assurance whether
the financial statements are free from material misstatement.
An audit involves performing procedures to obtain audit evidence about
the amounts and disclosures in the financial statements. The procedures
selected depend on the auditor’s judgment, including the assessment of
the risks of material misstatement of the financial statements, whether
due to fraud or error. In making those risk assessments, the auditor con-
siders the internal control system relevant to the entity’s preparation of
the financial statements in order to design audit procedures that are ap-
propriate in the circumstances, but not for the purpose of expressing an
opinion on the effectiveness of the entity’s internal control system. An
audit also includes evaluating the appropriateness of the accounting
policies used and the reasonableness of accounting estimates made, as
well as evaluating the overall presentation of the financial statements. We
believe that the audit evidence we have obtained is sufficient and appro-
priate to provide a basis for our audit opinion.
Opinion. In our opinion, the financial statements for the year ended De-
cember 31, 2011 comply with Swiss law and the company’s articles of
incorporation.
Report on other legal requirements
We confirm that we meet the legal requirements on licensing according to
the Auditor Oversight Act (AOA) and independence (article 728 CO) and
that there are no circumstances incompatible with our independence.
In accordance with article 728a paragraph 1 item 3 CO and Swiss Audit-
ing Standard 890, we confirm that an internal control system exists,
which has been designed for the preparation of financial statements ac-
cording to the instructions of the Board of Directors.
We further confirm that the proposed appropriation of available earnings
complies with Swiss law and the company’s articles of incorporation. We
recommend that the financial statements submitted to you be approved.
Ernst & Young AG
Thomas Stenz Markus Abderhalden
Licensed audit expert Licensed audit expert
(Auditor in charge)
To the General Meeting of Bühler Holding AG, Uzwil, St. Gallen, March 20, 2012
REPORT OF THE STATUTORY AUDITOR.
112
Publisher
Bühler Holding AG, 9240 Uzwil (CH)
Design/artwork
New Identity Ltd., Basel (CH)
Publishing system
Multimedia Solutions AG, Zürich (CH)
Text and editing
Bühler AG
Corporate Communications, Uzwil (CH)
PEPR, Peter Eberhard, Oetwil am See (CH)
Primafila, Zurich (CH)
Photography
Peter Tillessen, Zurich (CH), pages 20 / 21, 34–41
Raffael Waldner, Zurich (CH), pages 24–31
Erik Chmil, Cologne (DE), pages 44–49
Stephan Knecht, Zurich (CH), pages 4, 57
Cover photograph
BMW Leipzig, photograph: Erik Chmil, Cologne (DE)
Lithography
Roger Bahcic, Zurich (CH)
Printers
galledia ag, Flawil (CH)
This annual report is published in English and in a
prevail.
German translation. The English original version shall

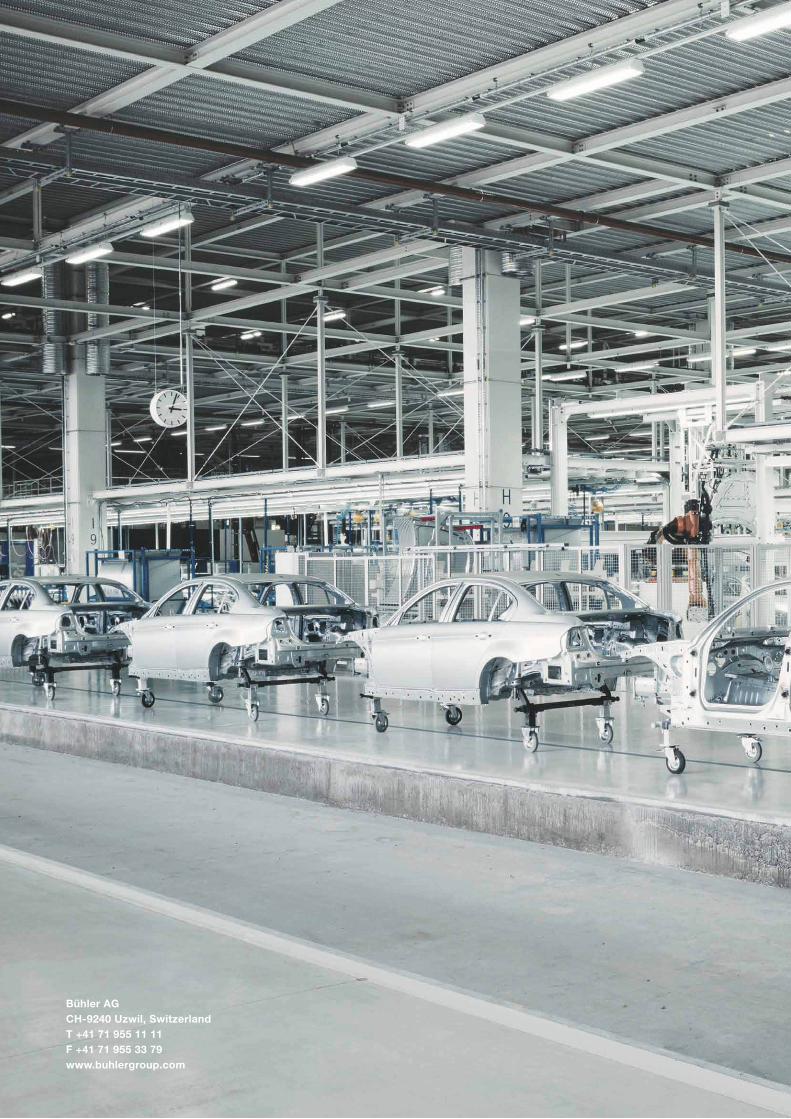
5 Bühler Geschäftsbericht 2011
Bühler AG
CH-9240 Uzwil, Switzerland
T +41 71 955 11 11
F +41 71 955 33 79
www.buhlergroup.com


![Paying Our Own Way: The Privatization of the Chilean ... · ate,' President Arturo Alessandri Palma forced the Chilean Con-' "" " PAYING OUR 2 1999] PAYING OUR OWN WAY '+ °° The](https://img.pdfslide.us/doc/110x75/5fc8f4229601e20c654d7bcf/paying-our-own-way-the-privatization-of-the-chilean-ate-president-arturo.jpg)