Embed Size (px)
Citation preview

1
Australian Council of Social Service
The effects of the current tax mix on contributions to the tax system ACOSS Tax Talk No 1 January 2015
Tax: Are we paying our fair share?

2
First published in 2014 by the Australian Council of Social Service Locked Bag 4777 Strawberry Hills, NSW, 2012 Australia Email: [email protected] Website: www.acoss.org.au ISSN: 1326 7124 ISBN: 978 0 85871 053 5 © Australian Council of Social Service 2015 This publication is copyright. Apart from fair dealing for the purpose of private study, research, criticism, or review, as permitted under the Copyright Act, no part may be reproduced by any process without written permission. Enquiries should be addressed to the Publications Officer, Australian Council of Social Service. Copies are available from the address above. The Paper has been prepared by Peter Davidson, Cassandra Goldie and Ro Evans with reviews by ACOSS Policy Advisers.
Who we are ACOSS is the peak body of the community services and welfare sector and the national voice for the needs of people affected by poverty and inequality. Our vision is for a fair, inclusive and sustainable Australia where all individuals and communities can participate in and benefit from social and economic life.
What we do ACOSS leads and supports initiatives within the community services and welfare sector and acts as an independent non-party political voice. By drawing on the direct experiences of people affected by poverty and inequality and the expertise of its diverse member base, ACOSS develops and promotes socially and economically responsible public policy and action by government, community and business.
Join ACOSS Anybody can become an ACOSS member. We have memberships available to organisations, both national and local, and free to individuals. Go to http://www.acoss.org.au/take_action/join/ to find out more.
3
Contents
1.1 Introduction................................................................................................................................ 3 1.2 Principles for Tax Reform ....................................................................................................... 4 1.3 Key Findings ............................................................................................................................... 6 1.4 How fair is our personal income tax system? ................................................................. 7 1.5 How fair are consumption and other indirect taxes? ............................................... 13 1.6 How fair is the combined effect of income consumption taxes? ......................... 16
1.1 Introduction Australia is fortunate to have had over twenty years of economic growth and weathered the global financial crisis well in comparison to other countries. A majority of people are enjoying living standards better than ever before. However, governments at all levels face serious challenges including slower economic growth, rising unemployment, and an ageing population. At least two thirds of the budget deterioration is on the revenue side. In this context, tax reform is necessary to finance the services required by an ageing population, support affordable housing markets, and to keep the economy and jobs growing in challenging economic conditions. Australia has begun a new discussion about the case for tax reform in Australia and it appears there is broad agreement that there is a real case for reform. The main purposes of the tax system is to raise the revenue Governments need in an equitable way to provide services, benefits and infrastructure the community needs, including to strengthen business investment and growth. This Tax Talks Paper No 1, is the first in the ACOSS series addressing some of the key questions about the direction that tax reform should take. There are several important principles that should drive reform, on
The Australian public has a keen sense of fairness, as demonstrated by the strong rejection of the recent Federal Budget, which failed the fairness test in a number of important respects.
This paper focusses on fairness of our current personal income and consumption tax systems, which are two parts of the system which impact on the broadest segment of the Australian community. If we are to get consensus on reform, it is important that we have a sound understanding of how the tax system operates now.

4
1.2 Principles for Tax Reform In pursing tax reform, there are some key principles that should underpin change.
1. REVENUE The tax system should raise sufficient revenue to enable Governments to meet the
Future Governments both Federal and State - will lack the revenue they need to
infrastructure as the population ages, even if wasteful and inefficient expenditures are pared back. Tax reform is needed to restore public revenues without jeopardising equity or economic efficiency. Comparison with other countries suggest that this can be done, since most wealthy nations raise more tax than we do, and Australia can likely continue to meet its essential public expenditure needs while keeping expenditure and revenue in line with comparative OECD countries.
2. SUSTAINABLE GROWTH AND COMPETITIVENESS Taxes should be raised in a way that minimises economic costs, and social and environmental harm. The tax system should support and not undermine decisions to engage in paid work, save, invest and support economic growth that are economically efficient and underpin our future prosperity. It should contribute to, and not detract from, affordable housing for all.
To sustain economic growth in the face of major economic adjustment (post-mining boom) and population ageing, Australia will have to continue to attract international investment despite less favourable terms of trade, and a concerted effort will be needed to improve productivity and workforce participation. Tax reform is needed to improve the efficiency of allocation of economic resources (capital, labour, land and the environment), by taxing different forms of investment and labour earnings more consistently, shifting the focus of taxation towards economic rents (e.g. land and minerals) and away from business inputs, encouraging workforce participation and improving housing affordability, while taking proper account of environmental harm and depletion.
3. EQUITY Personal income (from all sources) should be taxed in a consistent way in accordance with ability to pay.
A vital principle of the social compact between taxpayers and Government is that the level of tax we pay is based on our resources or ability to pay, and that people in similar circumstances should as far as possible be taxed in a consistent way. In common
Anomalies in the system that depart from the principle of equity should be well justified, and kept to a minimum. The personal income tax system plays an important role in improving equity across the community. Both equity and public support for the tax system will be strengthened if different forms of savings, investments and earnings from paid work are taxed more

5
consistently. Tax reform should not leave people with low incomes worse off but should aim to pursue overall benefit for the common good.
4. ADJUSTING TO AN AGEING POPULATION Tax reform should support meeting the costs of health, aged care and income support for an ageing population in a sustainable, efficient and equitable way.
A key part of the budget challenge is reaching consensus on how we should pay for essential services and payments for an ageing population. There is a growing gap between public revenues and growth in the cost of programs such as health, aged care and pensions. In this context the taxation of post retirement incomes should be reviewed.
5. SIMPLICITY Taxes should be as simple, transparent, efficient and predictable as possible. The system should minimise uncertainty, compliance costs and maintain the integrity of the tax system.
Many of the same inconsistencies that create unfairness and harm the economy also lead to complexity as governments add new rules to close off avoidance opportunities.
6. GOOD PROCESS Tax reform cannot be rushed. It takes time to identify and agree on the problems that reform should resolve, and to decide on a strategy for reform. Governments must lead tax reform but must do this in genuine collaboration with key stakeholders and the wider community. The process of reform needs to be open and transparent, enabling
-
government agenda, nor cherry-picking of reforms. It will require genuine engagement and wide public debate in the lead up to developing options for reform, with a view to developing a comprehensive, integrated tax reform package.
we need to ensure a good debate, and allow the community to consider why reform is needed. The Australian public needs to understand the options and to be a part of developing the case for reform. It is inevitable that in any change to the tax system, some people may be worse off. However, past experience shows that people are more prepared to contribute more to the tax base if they have a good understanding of the purpose of change, and can see how the change will lead to positive outcomes and a clear articulation of the benefits to flow from change. A crucial first phase of building the case for tax reform is to ensure that the Australian public has a reasonable understanding of how the tax system works now, and particularly who pays, and why. This should be an easy task, yet inevitably there is significant confusion generated by
even contradict each other. ACOSS considers that it is vital that we start with the facts.
6
1.3 Key Findings
combination of income and indirect taxes in Australia, including state stamp duties and payroll tax, means that most households pay around the same proportion of their incomes in tax overall.
The personal income system is relatively progressive:
Bottom 20% pays an average of 3% of their income
Top 20% pays an average of 20% of their income
Consumption and other indirect taxes are regressive -free threshold
They do not tax the portion of income that is saved, and high income earners save more
Overall, the average rate of the Goods and Services Tax paid declines with income, unlike income tax where it increases. ABS modelling shows:
o The bottom 20% pays an average of $38pw in GST, or 7% of their income o The top 20% pays an average of $103pw in GST, or 3% of their income
include business taxes like Payroll Tax, Stamp Duties, and Fuel Excise (this includes State as well as Federal taxes), which are largely passed on to consumers
These raise more revenue overall than the GST and together have a greater
overall impact on household expenses. ABS modelling shows:
o The bottom 20% pays an average of $77pw or 14% of their income
o The top 20% pays an average of $183pw or 5% of their income
The combined effect of income and consumption taxes - including income tax, GST
and other indirect taxes when added together is not as progressive as often believed.
In fact, the picture is much more nuanced, with a rate similar to that of a flat rate tax on
incomes of around 25% (+ or up to 4 %) on all income groups
The progressive effect of the personal income tax is substantially offset by the
GST and other indirect taxes, so that:
The bottom 20% pays an average of $129pw or 24% of their income
The top 20% pays an average of $1,006pw or 28% of their income
The second 20% pays 21% of their income.
The greater the role for personal income taxes in the overall tax mix, the
greater the reduction in household income inequality from the tax system as a
whole.

7
1.4 How fair is our personal income tax system? This paper will first identify how fair our personal income tax system is, and will then turn to an assessment of current consumption taxes. The personal income tax system includes taxes on individual income including taxation of wages and salaries, self-employment income and investment income. Tax exemptions for certain kinds of personal income form part of the personal income tax system. The personal income tax is designed to be progressive, that is, higher income earners pay a higher proportion of their income in tax than lower income earners. However, the personal income tax system is made up of a number of components, including PAYE tax, the Medicare Levy and tax arrangements under superannuation, and various forms of investment incomes including negative gearing and capital gains. As Figure 1 shows,
The bottom 20% pays an average of 3% of their income. This is low because for
most people the tax free threshold is at least $20,000 and most of the bottom
20% have social security payments as their main income.
The top 20% pays an average of 20% of their income. This is higher due to the
households have incomes above $80,000 and are on one of the top two
marginal tax rates (37% and 45% plus the Medicare Levy). However, they do
incomes above $80,000 and $180,000 respectively, so the tax rate on all of their
income is much less than this.
Figure 1: Current personal income tax as a % of household gross income
Government benefits taxes and household
income 2009- -10.
3%
7%
11%
15%
20%
0%
5%
10%
15%
20%
25%
Lowest Second Third Fourth Highest

8
Figure 1 shows the average rates of personal income tax paid by households in 2010. These figures appear to be too low at first sight, but this is because they show the tax paid on overall incomes, not marginal tax rates paid on the next dollar. These are also household ers in the household).
that is, many forms of income are either exempted from income tax altogether or taxed at a lower rate, for example, under superannuation, negative gearing, dividends, capital gains and partnership and trust arrangements. For example: PAYE personal income tax Rates:
0% Income from 0-$18 100 pa
19% Income from $18 201 to $80 000 pa
32.5% Income from $80 001 to $180 000 pa
45% Income from $180 000 and over
Investment income tax rates
50% tax discount for capital gains (64% of which are received by the top 10% of
households)
15% flat
with the 46.5% that otherwise applies to high income earners (32% of the value
of these tax breaks goes to the top 10% of taxpayers and less than 20% of their
value goes to the bottom 50%4);
Deductions for negatively geared investments in property and shares (45% of
households benefiting from these deductions are in the top 20%5).
As Figure 1 shows, the combined effects of the different tax treatment of different forms of income is that the personal income tax system is progressive, but not as progressive as people might think.
To understand why tax expenditures and loopholes disproportionately benefit those
on higher incomes and make the system less progressive, Figure 2 then compares
how different forms of income are distributed.
4The Treasury (2012) presented to Superannuation Roundtable, April2012 5

9
Figure 2: Income shares of top 10% and bottom 50% of taxpayers
Source
As we might expect, income from investments is more unequally distributed than wages. This applies especially to capital gains increases in the value of assets such as property and shares (64% of capital gains accrue to the top 10% of taxpayers); and dividends from shares (again, 64% of dividends accrue to by the top 10% of taxpayers); and income from partnerships and trusts (47% of which accrues to the top 10%). This is
unintended loopholes in the system6.
Lower tax rates on investments, especially long term investments such as superannuation and owner occupied housing, can be justified on the basis that the increase in value of these investments over time is partly offset by inflation. There is
ctors such as earnings from paid work, and especially land or minerals. If, for example, Australian or overseas investors can easily shift their investments to another country, then it makes sense to tax investment income at lower rates than income from land or mineral resources, which cannot be shifted in this way.7 The problem from both an efficiency and equity point of view is that different kinds of investment incomes are often taxed at different rates for no valid reason. Those mainly
6 Tax avoidance is legal, it is tax evasion that is against the law.
7 See this discussion of this issue
(2009) op cit.
18
35
19 15 16 13 12
28 28
44 47 53
64 64
0
20
40
60
80
Wag
es
Inte
rest
Bu
sin
ess
inco
me
Par
tne
rsh
ips
& t
rust
s
All
inve
stm
en
t in
com
e
Cap
ital
gai
ns
Div
ide
nd
s
bottom 50% top 10%
10
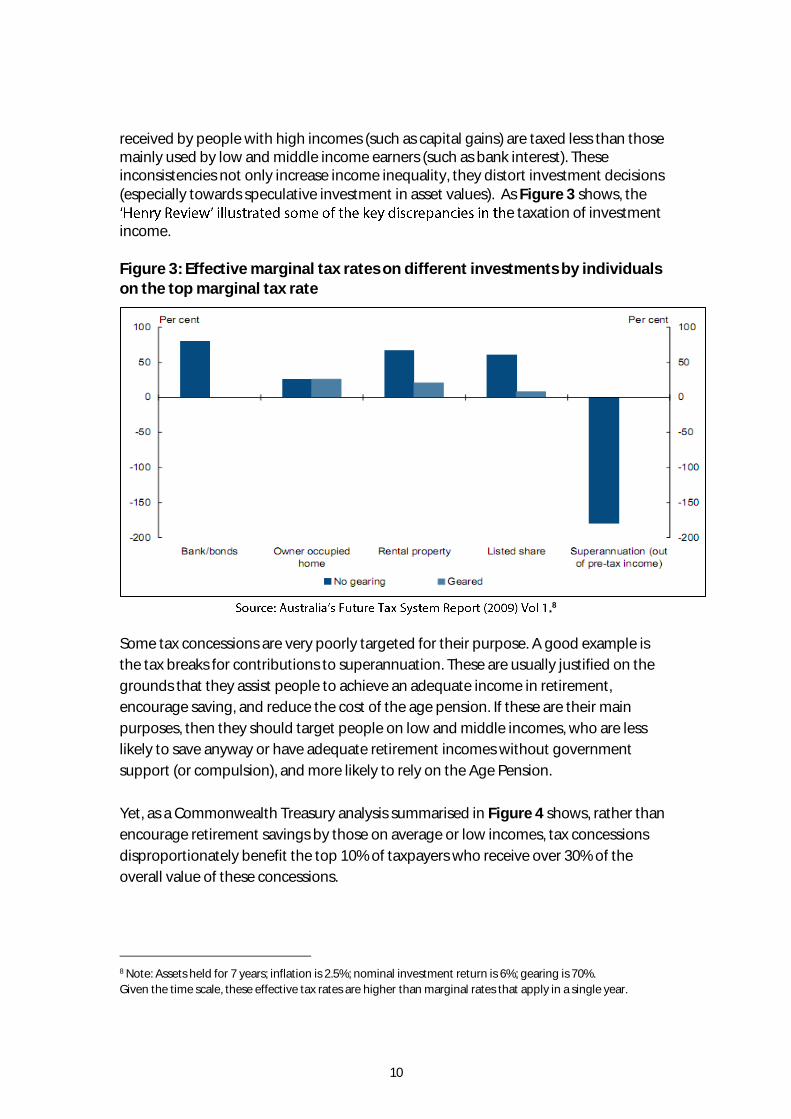
received by people with high incomes (such as capital gains) are taxed less than those mainly used by low and middle income earners (such as bank interest). These inconsistencies not only increase income inequality, they distort investment decisions (especially towards speculative investment in asset values). As Figure 3 shows, the
e taxation of investment income.
Figure 3: Effective marginal tax rates on different investments by individuals on the top marginal tax rate
.8
Some tax concessions are very poorly targeted for their purpose. A good example is
the tax breaks for contributions to superannuation. These are usually justified on the
grounds that they assist people to achieve an adequate income in retirement,
encourage saving, and reduce the cost of the age pension. If these are their main
purposes, then they should target people on low and middle incomes, who are less
likely to save anyway or have adequate retirement incomes without government
support (or compulsion), and more likely to rely on the Age Pension.
Yet, as a Commonwealth Treasury analysis summarised in Figure 4 shows, rather than
encourage retirement savings by those on average or low incomes, tax concessions
disproportionately benefit the top 10% of taxpayers who receive over 30% of the
overall value of these concessions.
8 Note: Assets held for 7 years; inflation is 2.5%; nominal investment return is 6%; gearing is 70%.
Given the time scale, these effective tax rates are higher than marginal rates that apply in a single year.

11
Figure 4: Share of superannuation tax concessions
Note: These are projections based on 2009 administrative data.
People with higher incomes can also reduce their tax using structures such as private
trusts and companies. For example, an individual on the top tax rate can use a
discretionary trust to distribute part of their income to a family member in a lower tax
bracket without losing effective control of the underlying asset, such as an investment
property.
The key conclusion from this analysis is that the income tax base (the forms of income
that are taxes, and how consistently they are taxed) is just as important as marginal tax
rates in determining how the income tax impacts on inequality. Inconsistencies in the
treatment of different forms of income and investment and business structures
undermine the equity of the tax system. There is not much point imposing a top
marginal tax rate of 45% if many people with high incomes can legally pay much less.
-0.2
1.6 3.6
6.4 7.3 8.5
10.1
12.9
18
31.8
-5
0
5
10
15
20
25
30
35
Firstdecile
Seconddecile
Thirddecile
Fourthdecile
Fifthdecile
Sixthdecile
Seventhdecile
Eighthdecile
Ninthdecile
Topdecile

12
Who pays company income tax?
strongly progressive.
The reality is more complex. In the end it is not companies, but shareholders, workers and
consumers who pay company income tax.
Which of these three groups pays more depends on the mobility of capital (whether investors can
readily shift to alternative investments this is more difficult, for example, for mining investors
because the location of minerals is fixed), the relative bargaining strength of workers and their
employers, and the efficiency of product markets (the bargaining power of consumers).
Another important factor is our dividend imputation system, which refunds part of the income tax
paid by the company to Australian shareholders. This means that the cost of company income tax is
not borne by Australian shareholders, though part of it is still borne by foreign investors.
Advocates for a lower company income tax rate argue that capital is highly mobile and that foreign
investors are sensitive to Australian company tax rates. To the extent that a relatively high tax rate
discourages foreign investment, less capital will be invested in local industries and both wages and
employment
company income tax across the board.9
On the other hand, in the absence of a company income tax, multi-national companies and their
shareholders could avoid paying tax here on income they earn in Australia. Australian company
income tax is already avoided by some multi-
shiftin
deducted against their Australian income) and profits to other lower-tax jurisdictions, or by shifting
the value of business inputs such as intellectual capital and brands to those countries.
Privately-owned companies are a special case. These are usually controlled by one individual or
family, so that company income tax is a proxy for the personal income tax that would otherwise be
paid by those individuals. The distributional impact of the income tax on private companies
company within the company (in which case it is taxed at up to 30%), or distribute it to themselves
through wages or dividends (in which case it is taxed at their marginal tax rates, minus any dividend
imputation credits).
High income earners can reduce the tax they pay, at least temporary, by holding income within a
company they control and taking advantage of the 16.5% gap between the company tax rate and
top personal income tax rate.
9

13
1.5 How fair are consumption and other indirect taxes?
Consumption taxes are taxes on goods and services. These includes broad based taxes such as the GST but also a range of more narrow based taxes on specific goods and services, such as tobacco and fuel excises, and agricultural levies. Consumption taxes are regressive for three main reasons.
(1) They are flat taxes with no tax-free threshold.
Consumption taxes are generally applied at a uniform rate from the first
dollar spent. Unlike income tax, they do not attempt to distinguish between
high income-earners and people in poverty. Although people on lower
incomes spend less, they pay tax at the same rate as high earners on what
they do spend.
(2) Consumption taxes do not tax the portion of income that is saved, and high
income earners save more.
Households in the top 20% save an average of 25% of their income (before
income tax). So a tax on consumption is applied to only 75% of their income.
On the other hand, the bottom 20% spend on average about 25% more than
their income (for example, they are drawing down past savings or going into
debt to cover basic household expenses)10. So a consumption tax is applied
to 125% of their income.
(3) A consumption tax that falls on essentials such as food is likely to be more
regressive because people on low incomes spend more of their budget on
this and similar essentials.
Housing and food comprise 39% of average spending by the bottom 20% compared
with 31% for the top 20%, so a tax on these items will have 25% more impact on the
spending power of low income households. The fact that high income earners spend
more on these items overall (including wagyu beef) is not the most important point.
Taxes should be based on ability to pay and people on low incomes feel the impact of
taxes on these items more keenly.
10 -
reported in the ABS Household Expenditure Survey data (around 40%). We have adjusted the ABS estimates downwards to take account of under-reporting of incomes by some households in the bottom 20% (e.g. small

14
In overall terms, the first two factors (that consumption taxes are levied at flat rates and not on income that is saved) are the main reasons that consumption taxes are regressive. The regressive nature of the GST and other indirect taxes including Stamp Duties, Excises and Payroll Tax, is illustrated below, in Figure 5. Figure 5: GST and other indirect taxes as a % of income
Sources: ACOSS calculations using ABS -
Benefits Taxes and household income 2009-10.
The average GST rates in Figure 5 are less than 10% because not all goods and services are taxed. The striking feature of these GST rates is that, unlike income tax, the overall rates of tax decline with income. That is, consumption taxes are usually regressive:
The bottom 20% pays an average of $38pw in GST, or 7% of their income.
The top 20% pays an average of $103pw in GST, or 3% of their income.
Although they pay more GST, their incomes are much higher so the impact of
the tax on their spending power is felt less strongly than among low income
households.
The GST is not the only tax that falls on consumption. The ABS also models the impact of other indirect taxes, including business taxes such as Payroll Tax and Stamp Duties, and consumption taxes such as Fuel Excise (this includes State as well as Federal taxes). To a substantial degree, these taxes are passed on to consumers.
business owners and investors). However there is little doubt that on average the bottom 20% spend much more than their income.
7% 5% 4% 4% 3%
14%
9% 8%
7% 5%
0%
5%
10%
15%
20%
25%
Lowest Second Third Fourth Highest
GST Other indirect taxes

15
Because they raise more revenue overall than the GST these taxes together have a greater overall impact on household expenses. To the extent that these taxes flow through to consumers, they are also regressive:
The bottom 20% pays an average of $77pw or 14% of their income.
The top 20% pays an average of $183pw or 5% of their income.
Broadly speaking, taxes which fall on household consumption are regressive for three reasons:
1. Consumption taxes are generally levied at flat rates with no tax free threshold.
2. Consumption taxes absorb a higher proportion of the incomes of low income
households because (as shown previously) those households spend more than
they earn. On the other hand, they absorb a lower proportion of the incomes of
high income earners because they save a substantial part of their income and
that part is not taxed.
On average the bottom 20% spend 125% of their gross (before tax) income
while the top 20% spend 75% of theirs. This means that a tax on all
consumption would fall on 125% of the income of low income households but
only 75% of the incomes of high income households.
3. Depending on the items that are taxed (for example, essentials or luxuries), a
consumption tax may impact on a larger or smaller proportion of the spending
of high and low income households.

16
1.6 How fair is the combined effect of income and consumption taxes?
Figure 6 below shows that when the three types of taxes discussed above income tax, GST and other indirect taxes - are added together, their overall effect on households much less progressive than often believed - with a rate, similar to that of a flat rate tax on incomes of around 25% (+ or up to 4 %) on all income groups 11. The progressive effect of the personal income tax is substantially offset by the GST and other indirect taxes, so that:
The bottom 20% pays an average of $129pw or 24% of their income.
The top 20% pays an average of $1,006pw or 28% of their income.
Figure 6: Combined effect of personal income tax and consumption and indirect taxes
Sources: ACOSS calculations based on ABS, Australia, 2009- -
Note: Households are divided into five equal groups according to their disposable incomes, adjusted for household size. Average tax rates calculated as a proportion of gross household
incomes.
11 Note that the ABS was able to allocate most but not all relevant taxes to households, so this under-estimates the
incidence of Australian taxes. Also, to the extent that indirect taxes fall more on workers and shareholders and less
on consumers than estimated by the ABS, the results will be different.
3% 7%
11% 15%
20%
7%
5%
4%
4%
3%
14% 9%
8%
7%
5%
0%
5%
10%
15%
20%
25%
30%
Lowest Second Third Fourth Highest
Current personal income tax GST Other indirect taxes
17
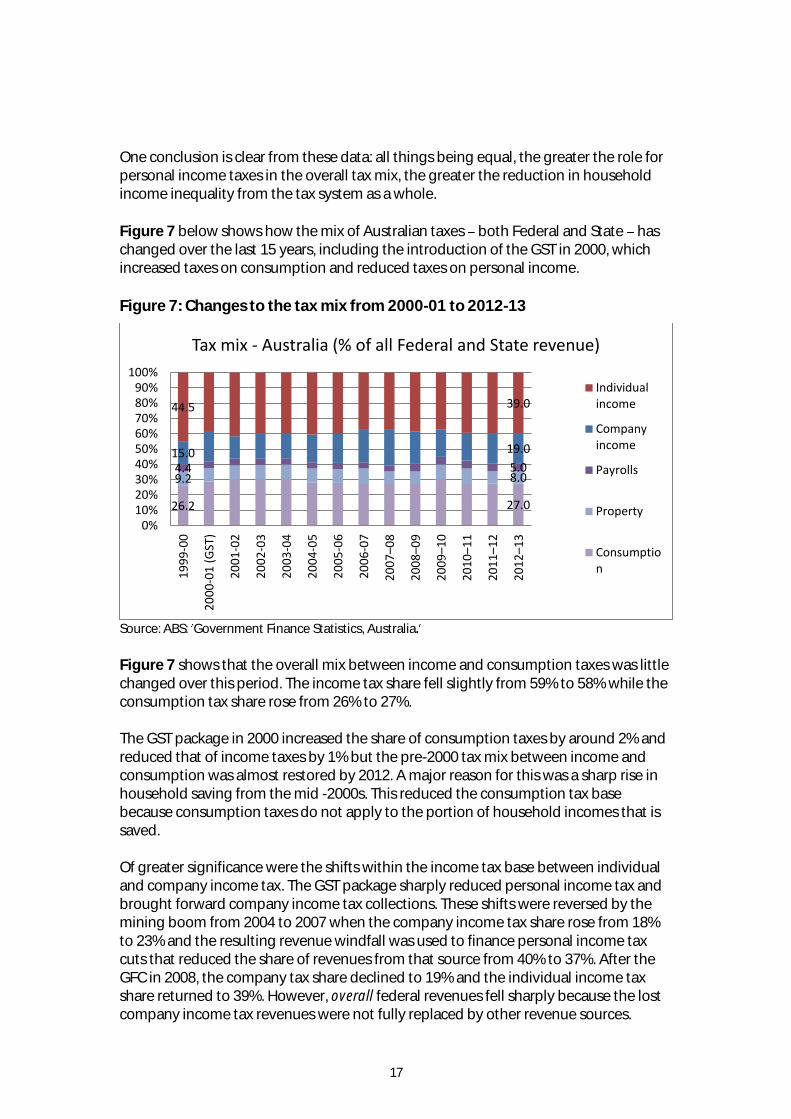
One conclusion is clear from these data: all things being equal, the greater the role for personal income taxes in the overall tax mix, the greater the reduction in household income inequality from the tax system as a whole. Figure 7 below shows how the mix of Australian taxes both Federal and State has changed over the last 15 years, including the introduction of the GST in 2000, which increased taxes on consumption and reduced taxes on personal income.
Figure 7: Changes to the tax mix from 2000-01 to 2012-13
Source: ABS: Government Finance Statistics, Australia
Figure 7 shows that the overall mix between income and consumption taxes was little changed over this period. The income tax share fell slightly from 59% to 58% while the consumption tax share rose from 26% to 27%. The GST package in 2000 increased the share of consumption taxes by around 2% and reduced that of income taxes by 1% but the pre-2000 tax mix between income and consumption was almost restored by 2012. A major reason for this was a sharp rise in household saving from the mid -2000s. This reduced the consumption tax base because consumption taxes do not apply to the portion of household incomes that is saved. Of greater significance were the shifts within the income tax base between individual and company income tax. The GST package sharply reduced personal income tax and brought forward company income tax collections. These shifts were reversed by the mining boom from 2004 to 2007 when the company income tax share rose from 18% to 23% and the resulting revenue windfall was used to finance personal income tax cuts that reduced the share of revenues from that source from 40% to 37%. After the GFC in 2008, the company tax share declined to 19% and the individual income tax share returned to 39%. However, overall federal revenues fell sharply because the lost company income tax revenues were not fully replaced by other revenue sources.
26.2 27.0
9.2 8.0 4.4 5.0
15.0 19.0
44.5 39.0
0%10%20%30%40%50%60%70%80%90%
100%
19
99
-00
20
00
-01
(G
ST)
20
01
-02
20
02
-03
20
03
-04
20
04
-05
20
05
-06
20
06
-07
20
07–0
8
20
08–0
9
20
09–1
0
20
10–1
1
20
11–1
2
20
12–1
3
Tax mix - Australia (% of all Federal and State revenue)
Individualincome
Companyincome
Payrolls
Property
Consumption

18

19