Embed Size (px)
DESCRIPTION
2011 Community Assessment for Treasure Valley in Idaho
Citation preview

Community Assesment
2011
Data to Engage and Mobilize the Treasure ValleyEducation • Health • Financial Independence
www.unitedwaytv.org

United Way of Treasure Valley • 2011 Community Assessment • www.unitedwaytv.org 1
INTRODUCTION 2
BACKGROUND 3
ASSESSMENT METHODOLOGY 4-7
EDUCATION 8-33
HEALTH 34-73
FINANCIAL INDEPENDENCE 74-95
TOP BASIC NEEDS 96-114
United Way of Treasure Valley serves Ada and Canyon counties (with outreach to Gem County).
TABLE OF CONTENTS

United Way of Treasure Valley • 2011 Community Assessment • www.unitedwaytv.org 2
United Way of Treasure Valley (UWTV) engages and mobilizes the community so individuals and families have
opportunities to succeed. By leading the way to collaborative, innovative and sustainable solutions in education,
financial independence and health, we know we can achieve the greatest community impact.
In order to identify and measure the challenges around which our work is focused, in 2011 we launched our
Community Impact Plan. This framework has four phases:
Phase 1: Research
The plan begins with the 2011 Community Assessment, concentrating on the areas of education, financial
independence and health. (UWTV) leads this collaborative effort – a partnership with Saint Alphonsus Regional
Medical Center, St. Luke’s Health System and Elks Rehab. Boise State University served as our research partner,
capitalizing on the experience and expertise of the Utah Foundation and United Way of Salt Lake, an
organization that is successfully implementing the Community Impact Plan in its community.
Phase 2: Prioritize
After reviewing the completed Community Assessment, UWTV will further refine its goals and focus based on
the themes and priority needs identified from the research.
Phase 3: Collaborate
UWTV will align with the strongest partners in the community to address the identified priority issues, aligning
needs with resources within the Treasure Valley.
Phase 4: Innovate
Together, UWTV and its partners will create collaborative, innovative and sustainable evidenced-based solutions
to community issues that revolve around education, financial independence and health.
We present this report and the background data on our website for use by the broader community. The 2011
Community Assessment assisted us with collaborative community planning, allowing us to work alongside a broad
range of exceptional partners to ensure the best use of our resources. UWTV is leading innovative, collaborative
projects that provide “pathways” to self-sufficiency.
We invite you to join us in the journey of building a stronger, more vital and vibrant Treasure Valley community.
Through our combined efforts, we will create lasting change for individuals and families, and a better tomorrow for the
generations to come.
INTRODUCTION

United Way of Treasure Valley • 2011 Community Assessment • www.unitedwaytv.org 3
United Way of Treasure Valley’s Vision
Engaging and mobilizing the community so individuals and families have opportunities to succeed
United Way of Treasure Valley’s Mission
We lead the way to collaborative, innovative and sustainable solutions in education, financial independence
and health
BACKGROUND
United Way of Treasure Valley • 2011 Community Assessment • www.unitedwaytv.org 4
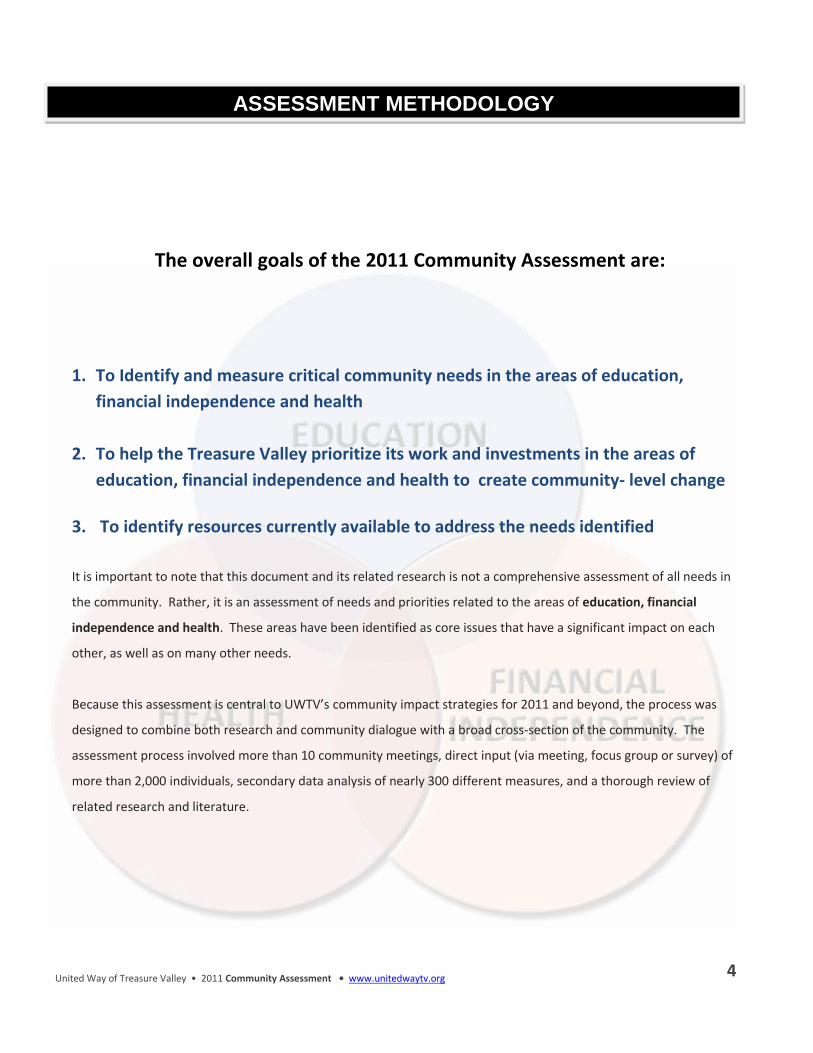
The overall goals of the 2011 Community Assessment are:
1. To Identify and measure critical community needs in the areas of education,
financial independence and health
2. To help the Treasure Valley prioritize its work and investments in the areas of
education, financial independence and health to create community- level change
3. To identify resources currently available to address the needs identified
It is important to note that this document and its related research is not a comprehensive assessment of all needs in
the community. Rather, it is an assessment of needs and priorities related to the areas of education, financial
independence and health. These areas have been identified as core issues that have a significant impact on each
other, as well as on many other needs.
Because this assessment is central to UWTV’s community impact strategies for 2011 and beyond, the process was
designed to combine both research and community dialogue with a broad cross-section of the community. The
assessment process involved more than 10 community meetings, direct input (via meeting, focus group or survey) of
more than 2,000 individuals, secondary data analysis of nearly 300 different measures, and a thorough review of
related research and literature.
ASSESSMENT METHODOLOGY

United Way of Treasure Valley • 2011 Community Assessment • www.unitedwaytv.org 5
To begin the process, researchers asked the following questions to determine the key
components of each priority area. Once these themes were identified, they were then prioritized
by UWTV. The accompanying research focuses on measuring and understanding these key
components using a secondary data analysis, survey research, focus groups, and a thorough
literature review.
Education
What is necessary for children, youth, and adults to reach
their potential through
education?
Entering school prepared
Stable home environment
Academic Success in grades K - 12
Graduating High School
Completion of some form of post high school education
Health
What is necessary for individuals and
families to lead healthy and
productive lives?
Quality affordable health care coverage
Preventative medical and dental services
Making healthy choices--preventative
behaviors
Healthy, safe and nurturing relationships
Quality mental health support
Financial Independence
What is necessary for individuals and families to become
financially stable and independent?
A job with a livable wage
Access to work supports
Financial literacy and asset development
Affordable housing
Top Basic Needs
What are people's most basic needs?
Access to food, specifically healthy
food
Access to basic medical and dental services
Emergency Housing
ASSESSMENT METHODOLOGY

United Way of Treasure Valley • 2011 Community Assessment • www.unitedwaytv.org 6
Secondary Data Analysis
The Public Policy Center at Boise State University conducted secondary data research on education, financial
independence, health and basic needs. The data was compiled by focus area with an analysis of more than
300 indicators. In addition to the template provided by United Way of Salt Lake City, additional local statistics
were included to augment the local data sets.
The Public Policy Center collected data from a variety of sources including the U.S. Census Bureau and
federal, state and local agencies. Every effort was made to use the most recent data available.
Survey Research
Stakeholder Surveys:
Online surveys were sent out and used to measure perceived needs of the community, validate the direction
of the organization, and assess the capacity of organization and partners to deliver solutions. Surveys were
constructed to allow stakeholders to respond to relevant sections based on their role.
Affected Population Surveys:
Online and paper versions of surveys measured the perceived needs of “affected population” groups and the
capacity of the stakeholder organizations to deliver solutions. Surveys were generic across the focus areas
and collected demographics (optional). A Spanish-language version of each was developed.
ASSESSMENT METHODOLOGY

United Way of Treasure Valley • 2011 Community Assessment • www.unitedwaytv.org 7
Focus Groups
Stakeholder Focus Groups:
Focus groups of key stakeholders were conducted for Ada and Canyon counties to validate stakeholder and
partner organization perceptions, and to develop a richer understanding of needs and under-resourced
areas.
Affected Population Focus Groups:
Focus groups with “affected populations” were conducted in Ada, Gem and Canyon counties to develop a
richer understanding of the needs/unmet needs and constituent priorities in the areas of education, financial
independence, health and other human health/safety net measures. A minimum of two groups per county
and topic area were held. Topics were developed such that results could be compared with the stakeholder
results.
Literature Review of Underlying Barriers
The Public Policy Center at Boise State University conducted an extensive literature review on the underlying
barriers in all four priority areas (education, financial independence, health and basic needs).
Sources
Unless otherwise specified in the text of this report, all data comes from The Public Policy Center at Boise
State University’s secondary data research conducted specifically for United Way of Treasure Valley. An
index of all data collected for this assessment can be found in the Appendix, and the complete data is
available upon request to United Way of Treasure Valley.
ASSESSMENT METHODOLOGY

United Way of Treasure Valley • 2011 Community Assessment • www.unitedwaytv.org 8
“What is necessary for children, youth and
adults to reach their potential through
education?”
FINDINGS

United Way of Treasure Valley • 2011 Community Assessment • www.unitedwaytv.org 9
Education is viewed as a foundation for economic success for the individual person and for our country in general. As a
state, Idaho guarantees public education and spends a large portion of general fund revenues on K-12 public education.
Since 2000, Idaho school funding has steadily declined. It has reduced as a share of state spending from 34% (average in
the 1980’s and 1990’s) to 26% in fiscal year 2012 (Idaho Public School Funding – 1980 to 2013; Mike Ferguson, 2012).
Language and literacy skills play an important role in academic success but even students who are excellent early readers
struggle with later literacy tasks, and students who were excellent readers at all ages can still fail to graduate high school.
As children move into upper elementary and beyond, we know that the texts and curricula that organize school learning
presuppose a familiarity with academic language and ways of knowing that do not reflect the experiences of many
students and may seem unrelated to their personal needs and lives. Students need to be able to see relationships between
school work and their everyday knowledge and experiences. Students need positive relationships with teachers and peers
and support when family or personal struggles hinder their efforts.
Children from all backgrounds can struggle in school, but students facing limitations imposed by poverty can, and do,
succeed. However, research tells us that emotional, social, and cognitive growth are connected and "together they are the
bricks and mortar that comprise the foundation for human development." This foundation develops not just within family
relations but also within community relationships that are affected by broader social and economic systems.
We know that financial security, health, and education are interconnected and that, while school practices certainly
matter, there is an emerging recognition that schools alone may not be able to adequately address barriers to student
academic achievement. When combined, the research behind these broad topics suggests that those working to improve
academic outcomes for the children in their communities may best be able to address impediments to student success
through partnerships between schools, community organizations, social service providers, health care providers, and law
enforcement agencies.
This section of the community assessment focuses on the indicators that show us how the Treasure Valley is performing in
educational attainment across a variety of measures. We have chosen indicators that are relevant to the issues of interest
to United Way and its partners, statistics that were relatively easy to find and that are collected on a fairly routine basis
from reliable sources, and indicators that should be relevant for partner agencies to incorporate into outcome measures in
their program work. In addition to the indicator data, we conducted surveys, focus groups, and interviews to provide an
expanded picture of health and wellness disparities and needs in our communities.
EDUCATION ASSESSMENT SUMMARY

United Way of Treasure Valley • 2011 Community Assessment • www.unitedwaytv.org 10
The following chart is a summary of data collected and analyzed by Boise State University and the Utah Foundation in each
of the component areas of Education. The colors represent composite ratings from multiple data sources related to trend –
whether the challenges are getting better or worse. Areas highlighted in red show relatively high cause for concern, areas
highlighted in yellow show moderate cause for concern, and areas highlighted in green show less cause for concern.
*Southern Idaho Conference School Districts include Boise, Meridian, Nampa, Caldwell, Mountain Home, Emmett, Vallivue, Kuna, and Middleton.
Challenge is Getting
Better or Worse (Trend)
Key Observations
Children enter school prepared
Beginning in the 2010-11 school year, the percentage of children scoring at benchmark on the Fall Kindergarten IRI began to decline for the Southern Idaho Conference (S.I.C.)*
Have a stable home environment
The percentage of homeless students in Canyon County increased from 1.29% to 4.01% during the 2009-10 school year.
Academic success in grades K-12
Trend data for ISAT scores over the past five years has shown a steady increase in improvement amongst all S.I.C. school districts.
A high school diploma
The collective graduation rate for the nine districts in the S.I.C. during the 2010-11 school year was 91%, compared to the national rate of 75.5% in 2009.
Completion of post high school education
In 2009, 9% of Ada County residents and 3% of Canyon County residents (ages 18-25) earned a bachelor’s degree or higher.
EDUCATION ASSESSMENT SUMMARY

United Way of Treasure Valley • 2011 Community Assessment • www.unitedwaytv.org 11
PREPARED FOR SCHOOL
Education experts agree there is a direct link between a child’s early learning experiences and success in school. (Long-term
Effects of an Early Childhood Intervention on Educational Achievement and Juvenile Arrest; Arthur Reynolds, JAMA.
2001;285:2339-2346). Brain development begins before birth, and early experiences establish either a strong or a weak
foundation for learning. Income disparities in cognitive outcomes emerge at 9 months and are more distinct at 24 months.
In Idaho schools, children's early literacy skills are measured through the Idaho Reading Indicator (IRI). The IRI is
administered to children in grades K-3 and used to identify students who may be at risk for reading failure. At each grade
level, the IRI skill assessments are benchmarked at end-of-the-year mastery levels. In other words, third graders take
assessments that are at a third-grade level of difficulty, no matter the time of the school year, so they are expected to
score higher in the spring than in the fall.
The kindergarten IRI assesses early literacy skills that are linked to later reading success. As students move through the
primary grades, the IRI increasingly utilizes curriculum-based measures of reading. Each student is assigned a score of
Benchmark, Strategic or Intensive. A Benchmark score indicates that students are performing at end-of-the-year mastery
levels.
The fall kindergarten (IRI) measures students' incoming ability to correctly identify the letters of the alphabet. In fall 2010,
56% of Idaho kindergarteners overall scored Benchmark (formerly called “At Grade Level”) on the IRI, compared to 46% of
low-income kindergarteners. By spring, 80% of kindergarteners overall were able to correctly identify letters, whereas 82%
of low-income kindergarteners were able to do so.
BARRIERS TO BEING PREPARED FOR SCHOOL
(Identified through literature review and surveys of community residents and UWTV stakeholders)
Lack of family support/parental involvement Affordability of preschool programs Poor school attendance Resistance to early learning programs based on culture/beliefs
EDUCATION ASSESSMENT SUMMARY

United Way of Treasure Valley • 2011 Community Assessment • www.unitedwaytv.org 12
Source: U.S. Census Bureau. (December 12, 2010). 2005-2009 American Community Survey 5-Year Estimates, Selected Economic Characteristics: 2005-2009, Idaho. Laughlin, Lynda. (2010). Who’s Minding the Kids? Child Care Arrangements: Spring 2005 and Summer 2006. Current Population Reports, P70-121. Washington, D.C.: U.S. Census Bureau, 2.
The majority of Idaho children under age 6 live in households, whether single-parent or two-parent, in which all parents
work. This is true for 57% of families across Idaho, 59% of families in Ada County and for 55% of families in Canyon County.
Grandparents and other relatives are an important source of child care for working families, but 55% of those who need
regular care for children under the age of 5 turn to non-relative care. The data tell us that a sizable portion of our working
families need access to early child care.
IdahoSTARS Childcare Providers by Region
District 3 District 4
Centers Enrolled 16 38
Five-Star Ratings 0 5
Four-Star Ratings 6 5
Three-Star Ratings 2 0
Source: IdahoSTARS Childcare Quality Matters, accessed at: http://www.idahostars.org/RegionalChildCareFacilities.aspx
IdahoSTARS (a program operated by the Idaho AEYC) is the state professional development system designed to increase
the quality of child care and education programs by helping those who care for and teach young children to improve their
skills and professional practice. Because the program is new, trend data is not available. However, the participation of
child care providers could be tracked over time and compared in the future. The current status of Health Districts 3 and 4
are summarized in the table above.
EDUCATION SELECTED CHARTS AND GRAPHS
53%
54%
55%
56%
57%
58%
59%
60%
Idaho Ada Canyon
Children under the age of 6 in need of childcare
United Way of Treasure Valley • 2011 Community Assessment • www.unitedwaytv.org 13
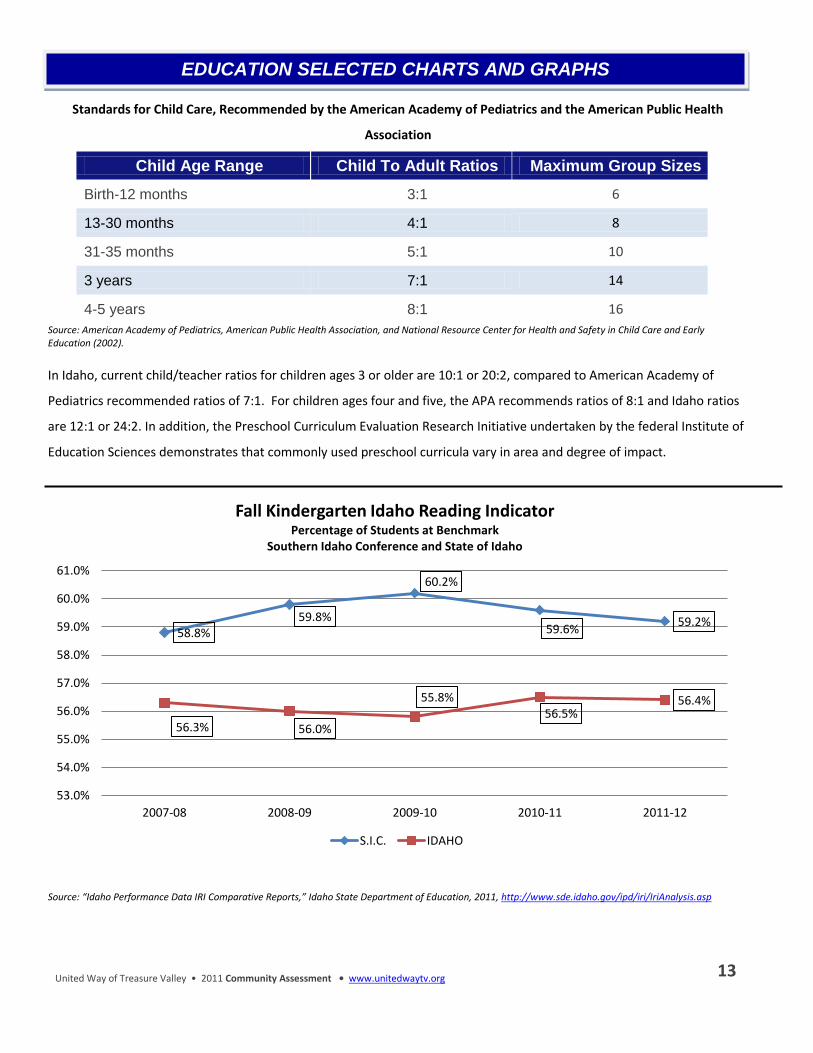
Standards for Child Care, Recommended by the American Academy of Pediatrics and the American Public Health
Association
Child Age Range Child To Adult Ratios Maximum Group Sizes
Birth-12 months 3:1 6
13-30 months 4:1 8
31-35 months 5:1 10
3 years 7:1 14
4-5 years 8:1 16
Source: American Academy of Pediatrics, American Public Health Association, and National Resource Center for Health and Safety in Child Care and Early Education (2002).
In Idaho, current child/teacher ratios for children ages 3 or older are 10:1 or 20:2, compared to American Academy of
Pediatrics recommended ratios of 7:1. For children ages four and five, the APA recommends ratios of 8:1 and Idaho ratios
are 12:1 or 24:2. In addition, the Preschool Curriculum Evaluation Research Initiative undertaken by the federal Institute of
Education Sciences demonstrates that commonly used preschool curricula vary in area and degree of impact.
Source: “Idaho Performance Data IRI Comparative Reports,” Idaho State Department of Education, 2011, http://www.sde.idaho.gov/ipd/iri/IriAnalysis.asp
58.8% 59.8%
60.2%
59.6% 59.2%
56.3% 56.0%
55.8% 56.5%
56.4%
53.0%
54.0%
55.0%
56.0%
57.0%
58.0%
59.0%
60.0%
61.0%
2007-08 2008-09 2009-10 2010-11 2011-12
Fall Kindergarten Idaho Reading Indicator Percentage of Students at Benchmark
Southern Idaho Conference and State of Idaho
S.I.C. IDAHO
EDUCATION SELECTED CHARTS AND GRAPHS

United Way of Treasure Valley • 2011 Community Assessment • www.unitedwaytv.org 14
HAVING A STABLE HOME ENVIRONMENT
The federal definition of homelessness used by all public schools in the United States includes children and youth who lack
a fixed, regular and adequate nighttime residence. This definition specifically includes children and youth living in shelters,
transitional housing, cars, campgrounds and motels, and sharing the housing of others temporarily due to loss of housing,
economic hardship or similar reasons. This is the same definition of homelessness used by Head Start, special education,
child nutrition and other federal family and youth programs.
Homelessness affects many facets of a child’s life, ranging from conception to young adulthood. By the time homeless
children reach school age, their homelessness affects their social, physical, and academic lives. These children are not only
at risk, but most suffer from physical, psychological, and emotional damage due to their circumstance. Research has
shown that childhood homelessness has a profound and accumulative negative effect on the development of children,
leading to a potential repetition of the cycle of homelessness as adults (Homelessness and its Effects on Children; Ellen
Hart-Shegos, 1999).
The Idaho Department of Education requires school districts to provide a count of the number of homeless students in
their district. The number of homeless students is determined by an actual count, not estimates, and is often based on
residency applications completed by parents upon registration. Based on this information, the Idaho Department of
Education publishes the number of students in each district whose nighttime residence is described as shelters, doubled-
up, unsheltered and hotels/motels.
The percentage of homeless students was higher in school districts located in Ada County until the 2009-10 school year,
when the percentage of homeless students in school districts in Canyon County increased more than three-fold. The most
common place homeless students went at night, for all districts, was a home other than their own. The Nampa School
District had the highest number of homeless students, followed by the Boise School District, then the Meridian School
District.
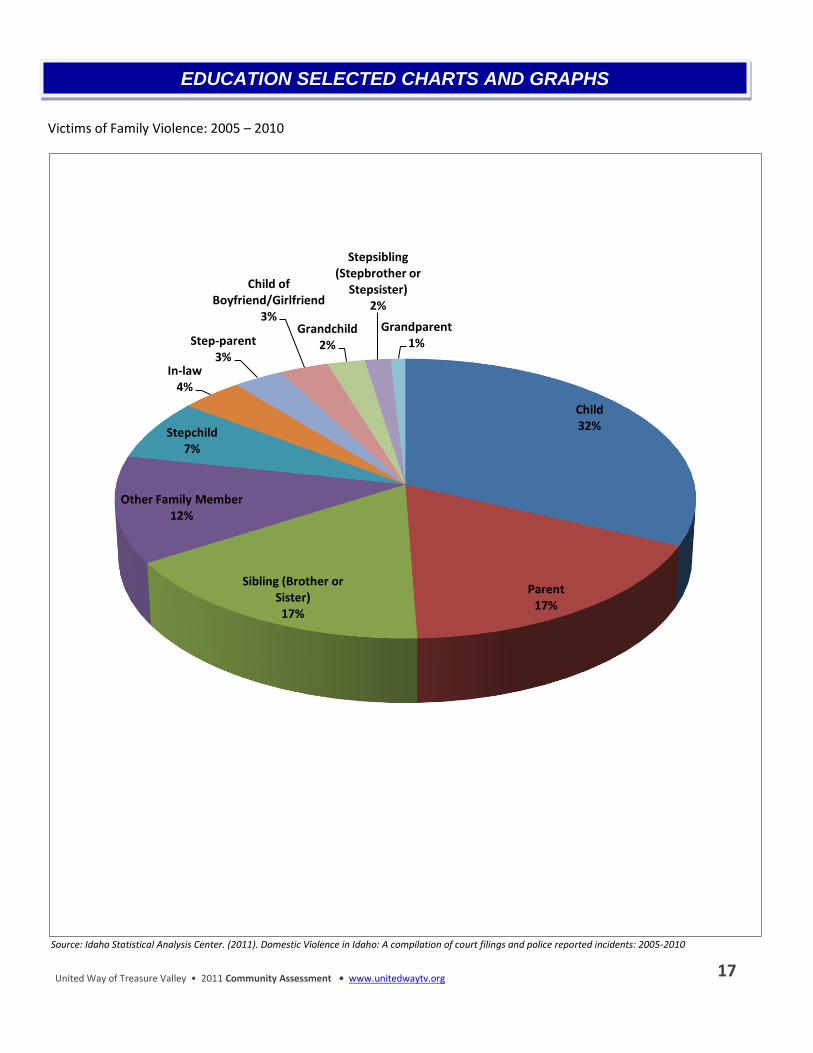
Between 2005 and 2010, 15.9% victims of violent crimes were family related. Of the 21,950 reported victims of family
violence between 2005 and 2010, nearly one-third (32%) were a child of the offender, 17.4% were a parent of the
offender, and 16.6% were a sibling of the offender. Overall there were 2.8% fewer incidents of family violence in 2010
versus 2005.
BARRIERS TO STUDENT HAVING A STABLE HOME ENVIRONMENT
(Identified through literature review and surveys of community residents and UWTV stakeholders)
Lack of parental financial stability Lack of affordable housing Single parent households with limited income Abusive relationships and exposure to violent behavior
EDUCATION ASSESSMENT SUMMARY

United Way of Treasure Valley • 2011 Community Assessment • www.unitedwaytv.org 15
Percentage of Homeless Students
Source: Homeless Student Count by District 2009-2010,” Idaho State Department of Education, 2010, http://www.sde.idaho.gov/site/homeless_edu/data.htm.
Number of Homeless Students and Location Resided at Night during the 2009-2010 School Year
Source: Homeless Student Count by District 2009-2010,” Idaho State Department of Education, 2010, http://www.sde.idaho.gov/site/homeless_edu/data.htm.
2007-2008 2008-2009 2009-2010
School Districts Mainly in Ada County 1.23% 1.86% 1.81%
School Districts Mainly in Canyon County
1.11% 1.29% 4.01%
0.0%
0.5%
1.0%
1.5%
2.0%
2.5%
3.0%
3.5%
4.0%
4.5%
EDUCATION SELECTED CHARTS AND GRAPHS

United Way of Treasure Valley • 2011 Community Assessment • www.unitedwaytv.org 16
EDUCATION SELECTED CHARTS AND GRAPHS
United Way of Treasure Valley • 2011 Community Assessment • www.unitedwaytv.org 17
Victims of Family Violence: 2005 – 2010
Source: Idaho Statistical Analysis Center. (2011). Domestic Violence in Idaho: A compilation of court filings and police reported incidents: 2005-2010
Child 32%
Parent 17%
Sibling (Brother or Sister) 17%
Other Family Member 12%
Stepchild 7%
In-law 4%
Step-parent 3%
Child of Boyfriend/Girlfriend
3% Grandchild
2%
Stepsibling (Stepbrother or
Stepsister) 2%
Grandparent 1%
EDUCATION SELECTED CHARTS AND GRAPHS

United Way of Treasure Valley • 2011 Community Assessment • www.unitedwaytv.org 18
ACADEMIC SUCCESS IN GRADES K – 12
The National Assessment of Education Progress (NAEP) is a nationally administered test that assesses fourth, eighth and
12th-grade students' knowledge in 10 subject areas. The scoring scale consists of Below Basic, Basic, Proficient and
Advanced. The NAEP is considered quite rigorous and, for many states, students scoring Proficient on the state’s
assessment may not score Proficient on the NAEP.
Idaho fourth graders who were eligible for free or reduced-price school lunch, an indicator of low income, were less likely
to score proficient or above on the reading portion of the NAEP than students not living in poverty. Twenty-one percent of
free/reduced lunch program-eligible students scored Proficient or above on the reading NAEP, compared to 41% of
students who were not eligible. Nationally, 19% of students living in poverty scored Proficient or above in reading,
compared to 57% of students not living in poverty.
In 2009, 33% of Idaho fourth graders scored Proficient or above on the reading portion of the NAEP; this is slightly higher
than the national proportion of 31%. When these findings are disaggregated by income, we see that low-income students
were less likely to score Proficient or above. Of low-income students, 21% scored Proficient or above on the reading NAEP
(this compares to 17% nationally), while 41% of students not classified as low-income did so (compared to 45% nationally).
Although there has been some performance growth since the 1992 NAEP reading assessment, these results have been
relatively stable over time and are mirrored in the NAEP math assessment. In Idaho, 30% of fourth graders living in poverty
scored Proficient or above on the math assessment; 49% of students living above poverty scored Proficient or above.
The Idaho Standards Achievement Test (ISAT) is intended to measure “essential knowledge and skills” and is administered
to students in grades three through eight and grade 10. ISATs are the statewide assessments used in Idaho to measure
student academic progress under the No Child Left Behind law (NCLB). Four categories were established to indicate
student performance levels on the tests – Below Basic (BB), Basic (B), Proficient (P), and Advanced (A). Progress is
measured on the ISAT in reading, math, and language at grades 3-8 and 10, and in science at grades 5, 7 and 10. In 2011,
92.7% of students across the state were Proficient in reading, and 88.4% were Proficient in math.
BARRIERS TO ACADEMIC SUCCESS IN GRADES K-12 (Identified through literature review and surveys of community residents and UWTV stakeholders)
Lack of family support/parental involvement Economical disadvantages Student learning gaps
EDUCATION ASSESSMENT SUMMARY

United Way of Treasure Valley • 2011 Community Assessment • www.unitedwaytv.org 19
Source: 2010/2011 Adequate Yearly Progress Report, http://apps.sde.idaho.gov/AYP/Home/Select
92.7% 93.3% 91.3%
93.1% 91.4%
93.5% 91.9% 90.9% 90.0%
92.7%
88.4% 89.0% 85.3%
89.4%
85.3%
88.8% 86.3%
83.2% 85.6%
89.5%
0.0%
20.0%
40.0%
60.0%
80.0%
100.0%
State of Idaho
Boise Caldwell Emmett Kuna Meridian Middleton Mountain Home
Nampa Vallivue
ISAT Proficiency
ISAT Reading ISAT Math
Source: 2010/2011 Adequate Yearly Progress Report, http://apps.sde.idaho.gov/AYP/Home/Select
89.1% 87.5% 90.2% 90.8%
88.7% 87.7% 87.8% 87.1% 87.2% 90.5%
83.6% 81.3%
83.7% 86.7%
80.1% 80.6% 81.4%
76.5%
81.8% 86.8%
0.0%
20.0%
40.0%
60.0%
80.0%
100.0%
State of Idaho
Boise Caldwell Emmett Kuna Meridian Middleton Mountain Home
Nampa Vallivue
ISAT Scores - Economically Disadvantaged Students
ISAT Reading ISAT Math
EDUCATION SELECTED CHARTS AND GRAPHS

United Way of Treasure Valley • 2011 Community Assessment • www.unitedwaytv.org 20
Source: Southern Idaho Conference School Districts, ISAT scores 2012
Source: Southern Idaho Conference School Districts, ISAT scores 2012
EDUCATION SELECTED CHARTS AND GRAPHS

United Way of Treasure Valley • 2011 Community Assessment • www.unitedwaytv.org 21
Source: Southern Idaho Conference School Districts, ISAT scores 2012
Source: Southern Idaho Conference School Districts, ISAT scores 2012
EDUCATION SELECTED CHARTS AND GRAPHS
United Way of Treasure Valley • 2011 Community Assessment • www.unitedwaytv.org 22
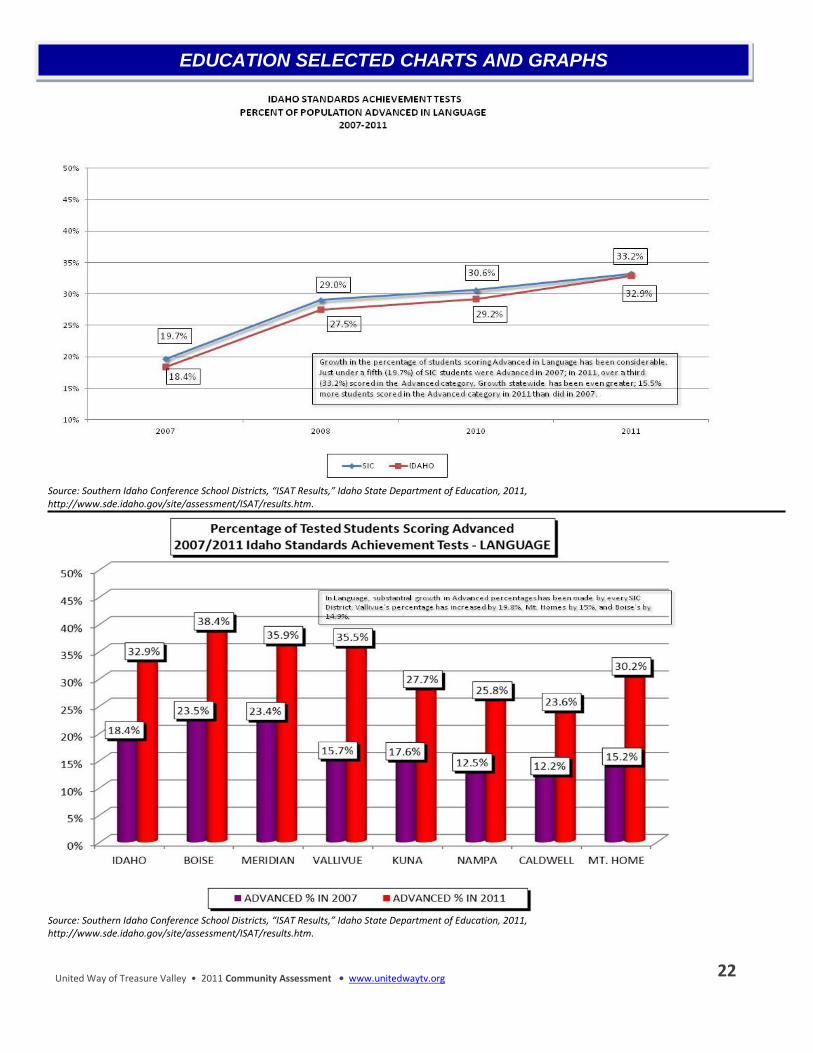
Source: Southern Idaho Conference School Districts, “ISAT Results,” Idaho State Department of Education, 2011, http://www.sde.idaho.gov/site/assessment/ISAT/results.htm.
Source: Southern Idaho Conference School Districts, “ISAT Results,” Idaho State Department of Education, 2011, http://www.sde.idaho.gov/site/assessment/ISAT/results.htm.
EDUCATION SELECTED CHARTS AND GRAPHS

United Way of Treasure Valley • 2011 Community Assessment • www.unitedwaytv.org 23
Percentage of fourth-grade students scoring Proficient or Advanced on the Reading portion of the NAEP
Source: “The Nation’s Report Card,” National Assessment of Educational Progress, National Center for Education Statistics, National Assessment Governing Board, Institute of Education Sciences, and U.S. Department of Education, 2009
Percentage of fourth-grade students scoring Proficient or Advanced on the Mathematics portion of the NAEP
Source: “The Nation’s Report Card,” National Assessment of Educational Progress, National Center for Education Statistics, National Assessment Governing Board, Institute of Education Sciences, and U.S. Department of Education, 2009
FRLP: Federal Reduced Lunch Program
2003 2005 2007 2009
US Non Eligible 42% 42% 44% 45%
Idaho Non Eligible 38% 50% 54% 50%
US FRLP Eligible 15% 16% 17% 17%
Idaho FRLP Eligible 20% 24% 27% 24%
0%
10%
20%
30%
40%
50%
60%
2003 2005 2007 2009
US Non Eligible 51% 57% 62% 64%
Idaho Non Eligible 36% 57% 57% 56%
US FRLP Eligible 16% 20% 23% 23%
Idaho FRLP Eligible 19% 30% 29% 32%
0%
10%
20%
30%
40%
50%
60%
70%
EDUCATION SELECTED CHARTS AND GRAPHS

United Way of Treasure Valley • 2011 Community Assessment • www.unitedwaytv.org 24
Percentage of eighth-grade students scoring Proficient or Advanced on the Reading portion of the NAEP
Source: “The Nation’s Report Card,” National Assessment of Educational Progress, National Center for Education Statistics, National Assessment Governing Board, Institute of Education Sciences, and U.S. Department of Education, 2009
Percentage of eighth-grade students scoring Proficient or Advanced on the Mathematics portion of the NAEP
Source: “The Nation’s Report Card,” National Assessment of Educational Progress, National Center for Education Statistics, National Assessment Governing Board, Institute of Education Sciences, and U.S. Department of Education, 2009
FRLP: Federal Reduced Lunch Program
2003 2005 2007 2009
US Non Eligible 53% 53% 58% 57%
Idaho Non Eligible 38% 41% 38% 42%
US FRLP Eligible 17% 18% 19% 19%
Idaho FRLP Eligible 22% 23% 22% 23%
0%
10%
20%
30%
40%
50%
60%
70%
2003 2005 2007 2009
US Non Eligible 51% 57% 62% 64%
Idaho Non Eligible 35% 42% 49% 56%
US FRLP Eligible 16% 20% 23% 23%
Idaho FRLP Eligible 16% 22% 25% 29%
0%
10%
20%
30%
40%
50%
60%
70%
EDUCATION SELECTED CHARTS AND GRAPHS

United Way of Treasure Valley • 2011 Community Assessment • www.unitedwaytv.org 25
A HIGH SCHOOL DIPLOMA “The Silent Epidemic” reported that high school dropouts earn $9,200 less per year than high school graduates, and
about $1 million less over a lifetime than college graduates (Civic Enterprises; J.M. Bridgeland, 2006). Students who
drop out of high school are often unable to support themselves, and high school dropouts are three times more likely
than college graduates to be unemployed. They are twice as likely as high school graduates to slip into poverty from
one year to the next. The researchers surveyed drop outs around the country and found that the main reasons for
dropping out remained the same, whether in a large inner city or a small town. Forty-five percent of students
surveyed say the reason they dropped out of high school was because they fell behind in middle and elementary
school and could not catch up.
High school completion, either through traditional graduation or via General Education Development (GED), is a
strong indicator of future economic success. Below are some of the key indicators of high school completion in the
Treasure Valley:
During the 2007-08 school year, 3,368 students in grades 9-12 left without a diploma.
Among students who were due to graduate in 2007-08, dropout rates for school districts in the
Treasure Valley ranged from 5% to 25%.
The dropout rate for low-income students was approximately 20%. Of the low-income students
who dropped out, 48% were Latino.
BARRIERS TO OBTAINING A HIGH SCHOOL DIPLOMOA (Identified through literature review and surveys of community residents and UWTV stakeholders)
Failing classes Missed too many days of school (fell behind) Lack of parental intervention and support Different cultural expectations Family poverty that requires the student to seek employment to help support the family
EDUCATION ASSESSMENT SUMMARY

United Way of Treasure Valley • 2011 Community Assessment • www.unitedwaytv.org 26
.
EDUCATION SELECTED CHARTS AND GRAPHS

United Way of Treasure Valley • 2011 Community Assessment • www.unitedwaytv.org 27
COMPLETION OF POST HIGH SCHOOL EDUCATION Postsecondary school prepares young adults for work that leads to economic success. This postsecondary experience
is commonly college, but may be vocational or technical school. The following indicators describe postsecondary
measures for Ada and Canyon counties.
During 2009, the portion of 18-24 year olds who had attended college for any length of time was 54% in
Ada County, 35% in Canyon County and 53% across the U.S.
In 2009, 9% of Ada County residents age 18-25 and 3% of Canyon County residents in that age group had
completed a bachelor’s degree or higher.
The data from the U.S. Census American Community Survey show the level of educational attainment for the
population ages 18-24 years of age. For smaller school districts, the margins of error are quite high. For all districts in
which the margin of error for at least one level of educational attainment was 5% or higher, the margin of error is
included.
Census data include GED recipients among high school graduates, which raises the overall graduation rate. Also,
Census data measures educational attainment by current geographic area rather than where people actually
attended high school. Because of these factors, the statistics are more indicative of final educational attainment
within a community and less indicative of the performance of local schools.
BARRIERS TO COMPLETION OF POST HIGH SCHOOL EDUCATION (Identified through literature review and surveys of community residents and UWTV stakeholders)
Lack of financial resources Affordability of programs Low academic performance Personal, parental or cultural expectations
EDUCATION ASSESSMENT SUMMARY

United Way of Treasure Valley • 2011 Community Assessment • www.unitedwaytv.org 28
Adults with at least a 2-Year Degree (2010)
Source: 2010 American Community Survey. Washington, DC: U.S. Department of Commerce, Census Bureau, 2010.
Adults with at least a 4-year degree (2010)
Source: 2010 American Community Survey. Washington, DC: U.S. Department of Commerce, Census Bureau, 2010.
32.7%
35.7%
31.0%
31.5%
32.0%
32.5%
33.0%
33.5%
34.0%
34.5%
35.0%
35.5%
36.0%
Idaho US
Idaho
US
24.4%
28.2%
22.0%
23.0%
24.0%
25.0%
26.0%
27.0%
28.0%
29.0%
Idaho US
Idaho
US
EDUCATION SELECTED CHARTS AND GRAPHS

United Way of Treasure Valley • 2011 Community Assessment • www.unitedwaytv.org 29
The following chart is a summary of data analyzed by UWTV that was collected by Boise State University and the Utah
Foundation in each of the component areas of Education. Levels of concern indicate ratings of the following: a) how many
people are faced with challenges related to the data, b) whether those challenges are getting better or worse, and c) how
severely the challenge impacts those individuals who experience it. Indicators highlighted in red show relatively high cause
for concern, indicators highlighted in yellow show moderate cause for concern, and indicators highlighted in green show
less cause for concern.
Level of Concern
CHILDREN ENTER SCHOOL PREPARED
Population of children under six years of age
Percent of children living in working parent households
Child/teacher ratios
Scores on Fall IRI
STABLE HOME ENVIRONMENT
Percentage of homeless students
ACADEMIC SUCCESS IN GRADES K – 12
Scores on ISAT
Scores on NAEP Tests
Transition to fourth grade
Percent of state funding dedicated to education
GRADUATING HIGH SCHOOL
Graduation rate by ethnicity and income
Dropout rates
GED completion
Community, social, parental support
COMPLETION OF POST HIGH SCHOOL EDUCATION
Enrollment in adult education programs
Enrollment in community colleges, vocational, trade, and technical institutions
Graduation from colleges or universities
Percent of students receiving financial aid
EDUCATION SECONDARY DATA ANALYSIS

United Way of Treasure Valley • 2011 Community Assessment • www.unitedwaytv.org 30
EDUCATION – COMMUNITY FEEDBACK
United Way of Treasure Valley • 2011 Community Assessment • www.unitedwaytv.org 31
EDUCATION – COMMUNITY FEEDBACK

United Way of Treasure Valley • 2011 Community Assessment • www.unitedwaytv.org 32
Which three of the following areas of education will help your children or others’ children most to reach their potential? This chart represents the sum of Most Important, Second Most Important and Third Most Important selections.
Source: 2011 Community Assessment (Boise State University Public Policy Center)
Going on to college or to technical/trade
school after high school
14%
Early learning before kindergarten (such as
Head Start type programs)
14%
Good grades in kindergarten through
high school, especially in math
and reading 12% High school diploma
12%
Help finding financial aid to continue on to
college or technical/trade
school after high school
12%
Having mentors or adult guidance
available 9%
Access to tutors who can help my child with their school
work 7%
Having after school programs
available 7%
Help applying for college or
technical/trade school
6%
English language proficiency programs
5%
Other (Please Tell Us) 2%
EDUCATION – COMMUNITY FEEDBACK

United Way of Treasure Valley • 2011 Community Assessment • www.unitedwaytv.org 33
In early 2012, United Way of Treasure Valley was selected as the backbone organization for
the Treasure Valley Education Partnership (TVEP). This unprecedented collaboration is
designed to advance a world class-education system that leads all students to meaningful
careers. TVEP aims to support every child, every step of the way, cradle to career.
Partners include 10 local school districts, higher education, business leaders from IBCEE,
foundations and other local nonprofits. Visit www.idahotvep.org for more information.
The Caldwell P16 Education Project was launched in August of 2011. This innovative
collaboration has set a goal to double the post-secondary going rate for Caldwell students. P16
inspires, educates and motivates children to learn by instilling the belief that they can succeed.
UWTV serves as the fiscal agent for this project. Partners include the Caldwell School District,
Treasure Valley YMCA, UWTV, Lee Pesky Learning Center and the J.A. & Kathryn Albertsons
Foundation.
UWTV and local youth-serving organizations began this program for low-income, at-risk fifth and sixth graders. The Boys &
Girls Club of Nampa, Boys & Girls Clubs of Ada County, Treasure Valley Family YMCA, Big Brothers Big Sisters of Southwest
Idaho, and Girl Scouts of Silver Sage Council), are part of this collaborate with a focus to build strong leadership and service
learning opportunities for youth at transitioning junior-high age.
United Way of Treasure Valley was selected as the sole winner of the 2012 Youth Venture Grant Award from
SimplexGrinnell, a Tyco International company. The $37,500 grant will enable UWTV to launch a youth-led “social
entrepreneurship” program this fall. United Way Youth Venture inspires and invests in teams of young people to design
and launch their own lasting social ventures, enabling them to have a transformative experience of leading positive
change.
United Way continues to support local education focused programs designed to provide individuals and families
opportunities to succeed. In 2011, UWTV invested nearly $1,000,000 in support of educational programs administered by
our partners listed below.
EDUCATION – NEXT STEPS FOR UNITED WAY OF TREASURE VALLEY

United Way of Treasure Valley • 2011 Community Assessment • www.unitedwaytv.org 34
“What is necessary for individuals and families
to lead healthy and productive lives?”
FINDINGS

United Way of Treasure Valley • 2011 Community Assessment • www.unitedwaytv.org 35
The World Health Organization defines health as “A state of complete physical, mental, and social well-being and not
merely the absence of disease.” The concept of community health and the elements that contribute to health are
multifaceted and encompass several factors relevant to one’s environment. Prevention is recognized as a key component
in attaining and maintaining health, particularly in the context of health care reform. In Idaho, some health issues can
effectively be addressed through prevention programs, whereas others may require secondary prevention or treatment
interventions.
Health and wellness are important to a productive life. Access to all types of health care and wellness resources lead to
healthier lives, greater well-being and longevity. Living a healthy life and being able to seek medical assistance when
needed allows families to thrive in other areas of life. Lack of access to mental health care, including addiction treatment,
can lead to homelessness or make it harder for those who are homeless to regain stability and financial independence.
While health can influence whether a person thrives in other areas of life, financial and education factors impact an
individual’s ability to lead a healthy life. An ecological approach to the person, family and community emphasizes that a
person’s health is influenced by individual traits and behavior, as well as many other circumstances, including family,
culture, and factors at the community and national level.
This report describes a range of issues impacting the health and wellness of Treasure Valley residents.
Where possible, we have used this data to examine trends across time or compare local, statewide and national statistics.
We have chosen indicators that are relevant to the issues of interest to United Way and its partners, statistics that were
relatively easy to find and that are collected on a fairly routine basis from reliable sources, and indicators that should be
relevant for partner agencies to incorporate into outcome measures in their program work. In addition to the indicator
data, we conducted surveys, focus groups and interviews to provide an expanded picture of health and wellness disparities
and needs in our communities.
HEALTH ASSESSMENT SUMMARY

United Way of Treasure Valley • 2011 Community Assessment • www.unitedwaytv.org 36
The following chart is a summary of data collected and analyzed by Boise State University and the Utah Foundation in each
of the component areas of Health. The colors represent composite ratings from multiple data sources related to trend –
whether the challenges are getting better or worse. Areas highlighted in red show relatively high cause for concern, areas
highlighted in yellow show moderate cause for concern, and areas highlighted in green show less cause for concern.
Challenge is Getting Better
or Worse (Trend)
Key Observations
Having access to quality, affordable health care coverage
According to the U.S. Census Bureau and County Health Rankings, a total of 20.5% of
Idahoans were uninsured in 2010, compared to 16.3% nationally.
Having access to preventative medical and dental services
According to the Commonwealth Fund 2009 state score card, Idaho ranked 51st in the states and territories for children receiving
preventive medical and dental care.
Making healthy choices by eating right, regularly exercising and being free of harmful substances
In 2009, 25.1% of Idaho adults were classified as obese compared to 26.9% nationally.
81.5% of Idaho youth did not eat the
recommended number of servings compared to the U.S. average of 77.7%.
Having healthy, safe and nurturing relationships (free from abuse and violence)
In Ada County, there was a 7.4 decrease in intimate partner violence.
In Canyon County, there was a 1.3% increase in intimate partner violence.
Having quality mental health support
Idaho ranks 4th in the nation for death by suicide.
HEALTH ASSESSMENT SUMMARY

United Way of Treasure Valley • 2011 Community Assessment • www.unitedwaytv.org 37
ACCESS TO QUALITY, AFFORDABLE HEALTH CARE COVERAGE
Uninsured people are less likely to receive medical care, more likely to die early and more likely to have poor health status.
However, health insurance does not always guarantee access to quality and necessary care, particularly for low-income
families. Also, as Thomas and James assert, “Any effort to expand coverage, alter current public programs, and/or create
new public programs will have important consequences for the health of communities of color, who are more likely than
Whites to be enrolled in public programs or be uninsured.”
According to the U.S. Census Bureau and County Health Rankings, a total of 20.5% of Idahoans were uninsured in 2010,
with 23% in Canyon County and 16% in Ada County. (Health District 3: 23.9%; Health District 4: 13.2%). For both Ada and
Canyon counties, the percentage of uninsured residents was higher than the national percentage.
Many families, especially the moderate-to low-income families in the Treasure Valley, are unable to afford comprehensive
health insurance coverage. Many families rely on employers to provide subsidized health insurance as a benefit of
employment, or they go without comprehensive coverage or any coverage at all. As health care costs and the cost of
providing health insurance coverage have risen, fewer employers are offering the insurance coverage levels more typical in
the past.
According to the BRFSS, the number of Idahoans without insurance in 2009 was 18.7% and 18.5% in 2008. Trending data
indicates an increase in Idahoans without health insurance. At all geographic levels, adults were much more likely to be
uninsured than children. Both adults and children in Canyon County had the highest uninsured percentages while Ada
county had the lowest.
In households below the Federal Poverty Level (FPL), 62% of children had Medicaid/CHIP insurance coverage. Of low-
income children (under 200% FPL), 49% had Medicaid/CHIP. Of Idaho’s poor children (below 100% FPL), 17% were
uninsured. Of Idaho’s low income children (below 200% FPL), 14% were uninsured. According to the Kaiser Family
Foundation, 10% of Idaho’s children were uninsured. Of all Idaho residents who were uninsured, 18% of them were
children.
BARRIERS TO QUALITY, AFFORDABLE HEALTH CARE COVERAGE (Identified through literature review and surveys of community residents and UWTV stakeholders)
Affordability and cost Restrictive Medicaid criteria—not qualifying or meeting minimum criteria for public assistance
when their circumstances warrant substantial assistance No employer coverage
HEALTH ASSESSMENT SUMMARY

United Way of Treasure Valley • 2011 Community Assessment • www.unitedwaytv.org 38
Source: U.S. Census Bureau. (2010). Current Population Survey. Accessed at: http://www.census.gov/cgi-bin/broker; County Health Rankings. (2011). Accessed at: http://www.countyhealthrankings.org/idaho/ada/3
Source: U.S. Census Bureau. (2010). Current Population Survey. Accessed at: http://www.census.gov/cgi-bin/broker
16.0%
23.0%
15.1%
0%
5%
10%
15%
20%
25%
Ada County Canyon County U.S.
Percentage of Residents without Health Insurance (2009)
Ada County
Canyon County
U.S.
13%
23%
17% 15%
6%
13% 11%
9%
0%
10%
20%
30%
40%
50%
60%
Ada County Canyon County Idaho U.S.
Percentage of Adults and Children without Health Insurance (2009)
Adults Children
HEALTH SELECTED CHARTS AND GRAPHS

United Way of Treasure Valley • 2011 Community Assessment • www.unitedwaytv.org 39
Percentage of Uninsured Individuals by Household Income (2009)
Source: U.S. Census Bureau. (2010). Current Population Survey. Accessed at: http://www.census.gov/cgi-bin/broker
Uninsured Individuals by Employment Status (2009) (Excludes those Not in the Labor Force)
Source: U.S. Census Bureau. (2010). Current Population Survey. Accessed at: http://www.census.gov/cgi-bin/broker
Uninsured Individuals (Civilian, Non-institutionalized, 25 or Older) by Educational Attainment (2009)
Source: U.S. Census Bureau. (2010). Current Population Survey. Accessed at: http://www.census.gov/cgi-bin/broker
0%
10%
20%
30%
40%
50%
60%
Under $25,000 $25,000 to
$49,999 $50,000 to
$74,999 $75,000 to
$99,999 $100,000 and over
Ada County 24.3% 22.1% 9.7% 4.8% 6.9%
Canyon County 30.0% 27.2% 16.9% 11.4% 11.5%
U.S. 23.9% 21.2% 14.6% 10.0% 6.2%
Employed Unemployed
Ada County 15.0% 45.4%
Canyon County 26.1% 60.2%
U.S. 16.6% 46.6%
0% 10% 20% 30% 40% 50% 60%
Less than high school graduate
High school graduate, GED, or alternative
Some college or associate's degree
Bachelor's degree or higher
Ada County 34.6% 20.0% 13.6% 6.9%
Canyon County 50.6% 23.6% 21.4% 12.0%
U.S. 30.1% 18.6% 14.2% 6.4%
0%
10%
20%
30%
40%
50%
60%
HEALTH SELECTED CHARTS AND GRAPHS

United Way of Treasure Valley • 2011 Community Assessment • www.unitedwaytv.org 40
Percentage of Children with Medicaid by Poverty Status (2009)
Source: Kaiser Family Foundation. (2006, 2007, 2008). State health facts. Accessed at: http://www.statehealthfacts.org/profileglance.jsp?rgn=14
Percentage of Uninsured Children by Poverty Status (2009)
Source: Kaiser Family Foundation. (2006, 2007, 2008). State health facts. Accessed at: http://www.statehealthfacts.org/profileglance.jsp?rgn=14
Idaho U.S.
Below 100% of the Poverty Line 62% 68%
Below 200% of the Poverty Line 49% 59%
0%
10%
20%
30%
40%
50%
60%
70%
80%
0% 2% 4% 6% 8%
10% 12% 14% 16% 18% 20%
Idaho U.S.
Below 100% of the Poverty Line 17% 17%
Below 200% of the Poverty Line 14% 16%
HEALTH SELECTED CHARTS AND GRAPHS

United Way of Treasure Valley • 2011 Community Assessment • www.unitedwaytv.org 41
ACCESS TO PREVENTATIVE MEDICAL AND DENTAL SERVICES
Health care coverage plays a vital role in acquiring comprehensive, coordinated and continuous care. Health insurance
facilitates access to health care in a timely manner as well as increases the utilization of preventive services and screenings.
Access to health care coverage also promotes regular doctor visits and the establishment of a medical home.
Health provider shortages significantly contribute to difficulties in accessing health care, particularly in rural areas.
Research reveals that health professional shortage areas are associated with poor health and decreased access to care.
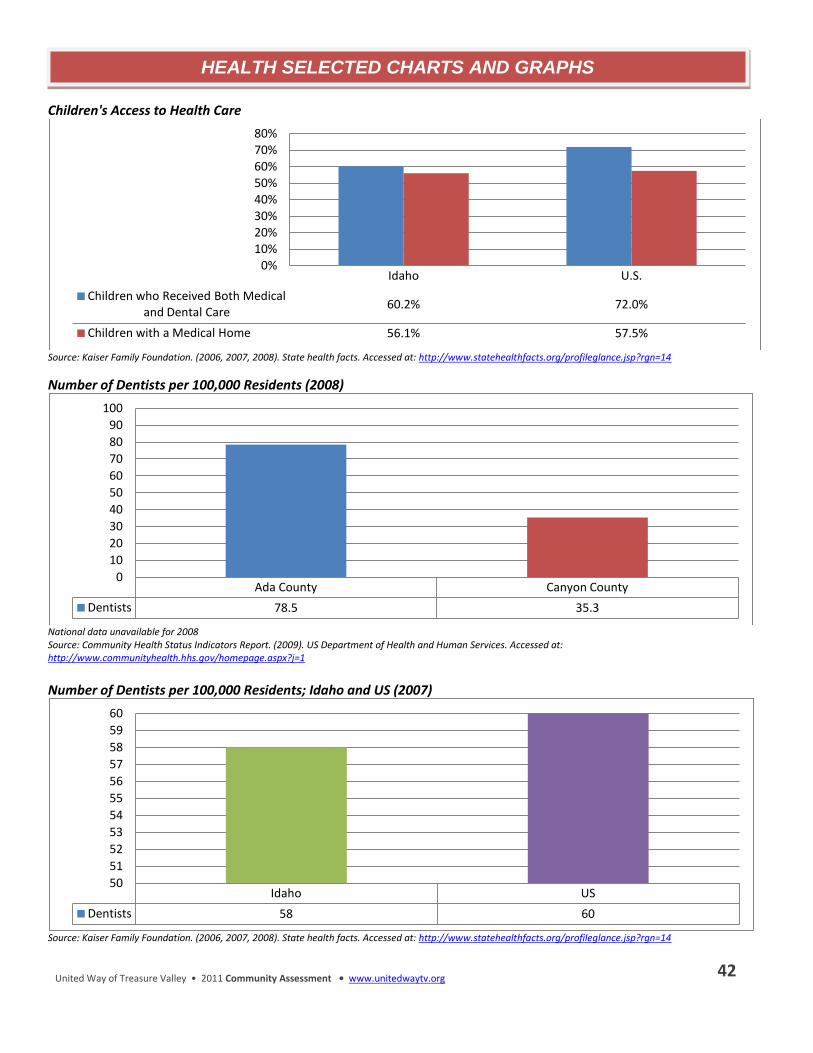
The number of active Idaho physicians in patient care per 1,000 residents was 2.3 in 2009. In Ada County there were 94.5
active physicians per 100,000 residents; Canyon County had significantly fewer with 35.3 active physicians per 100,000
residents. As with other health care professionals, the availability of dentists in Idaho is below the national average.
As of 2008, 17% of Idaho residents and 12% of people nationally resided in a primary care Health Professional Shortage
Area (HPSA). In Idaho, 62% of people and 19% of people in the U.S. live in a mental HPSA. Of Idaho residents, 17% live in a
dental HPSA, compared to 10% of U.S. residents.
For every 100,000 residents in Idaho in 2007, there were approximately 58 dentists. In Ada County, the number of dentists
available per 100,000 residents in 2008 was 78.5; Canyon County was 35.3 per 100,000, well below the statewide rate.
Idahoans are more than one and a half times more likely to live in a dental HPSA than the U.S. rate. According to the
Commonwealth Fund (CWF) 2011 State Score Card, Idaho ranked in the lowest quartile for children receiving preventive
dental care.
In 2009, Idaho ranked very poorly in terms of residents, particularly children establishing a medical home and accessing
preventive health services. According to the Commonwealth Fund 2009 state score card, Idaho ranked 51st in the states
and territories for children receiving preventive medical and dental care.
BARRIERS TO PREVENTATIVE MEDICAL AND DENTAL SERVICES (Identified through literature review and surveys of community residents and UWTV stakeholders)
Cost Patient’s passivity about his/her care Lack of understanding about the importance of prevention Scheduling conflicts and transportation restraints
HEALTH ASSESSMENT SUMMARY
United Way of Treasure Valley • 2011 Community Assessment • www.unitedwaytv.org 42
Children's Access to Health Care
Source: Kaiser Family Foundation. (2006, 2007, 2008). State health facts. Accessed at: http://www.statehealthfacts.org/profileglance.jsp?rgn=14
Number of Dentists per 100,000 Residents (2008)
National data unavailable for 2008 Source: Community Health Status Indicators Report. (2009). US Department of Health and Human Services. Accessed at: http://www.communityhealth.hhs.gov/homepage.aspx?j=1
Number of Dentists per 100,000 Residents; Idaho and US (2007)
Source: Kaiser Family Foundation. (2006, 2007, 2008). State health facts. Accessed at: http://www.statehealthfacts.org/profileglance.jsp?rgn=14
0% 10% 20% 30% 40% 50% 60% 70% 80%
Idaho U.S.
Children who Received Both Medical and Dental Care
60.2% 72.0%
Children with a Medical Home 56.1% 57.5%
Ada County Canyon County
Dentists 78.5 35.3
0
10
20
30
40
50
60
70
80
90
100
Idaho US
Dentists 58 60
50
51
52
53
54
55
56
57
58
59
60
HEALTH SELECTED CHARTS AND GRAPHS

United Way of Treasure Valley • 2011 Community Assessment • www.unitedwaytv.org 43
Percentage of Residents Living in Dental Health Providers Shortage Areas (2008)
Source: Kaiser Family Foundation. (2006, 2007, 2008). State health facts. Accessed at: http://www.statehealthfacts.org/profileglance.jsp?rgn=14
Percentage of Children who Received Both Medical and Dental Care (2009)
Source: Common Wealth Fund State Score Card. (2011). Accessed at: http://www.commonwealthfund.org/Maps-and-Data/State-Data-Center/State Scorecard
Percentage of Idaho Adults without Dental Insurance by Income (2009)
Source: Centers for Disease Control and Prevention. (2009). Behavioral Risk Factor Surveillance System: Chronic Disease indicators.
Idaho US
Residents 17.2% 10.4%
0%
2%
4%
6%
8%
10%
12%
14%
16%
18%
20%
Idaho US
Children 60.2% 72.0%
50%
55%
60%
65%
70%
75%
80%
$25,000 or Less $50,000 or More
Idaho 68.6% 18.9%
0%
10%
20%
30%
40%
50%
60%
70%
80%
HEALTH SELECTED CHARTS AND GRAPHS

United Way of Treasure Valley • 2011 Community Assessment • www.unitedwaytv.org 44
Percentage of Idaho Adults without Dental Insurance by Employment Status (2009)
Source: Centers for Disease Control and Prevention. (2009). Behavioral Risk Factor Surveillance System: Chronic Disease indicators.
Adults Reporting Poor or Fair Health
Source: County Health Rankings, (2010) and (2011). Accessed at: www.countyhealthrankings.org/idaho.
Adults Reporting Poor Physical Health Days
Source: County Health Rankings, (2010) and (2011). Accessed at: www.countyhealthrankings.org/idaho.
Unemployed Employed
Idaho 66% 34%
0%
20%
40%
60%
80%
2010 % Fair/Poor Health 2011% Fair/Poor Health
Idaho 14% 14%
Ada 11% 11%
Canyon 16% 17%
US Benchmark 10%
0%
2%
4%
6%
8%
10%
12%
14%
16%
18%
2010 Number of Days 2011 Number of Days
Idaho 3.4 3.5
Ada 2.9 2.9
Canyon 3.6 3.9
US Benchmark 3
0 0.5
1 1.5
2 2.5
3 3.5
4 4.5
HEALTH SELECTED CHARTS AND GRAPHS

United Way of Treasure Valley • 2011 Community Assessment • www.unitedwaytv.org 45
MAKING HEALTHY CHOICES
The lifestyle choices we make as individuals have dramatic influence on our health as individuals and for the community.
Ada and Canyon counties have significant proportions of their respective populations that are overweight or obese. These
measures are strongly correlated with development of diabetes. An estimated 61.3% of Idaho adults are overweight
compared to 64% nationally. The prevalence of obesity also increased significantly within the past decade. In 2009, 25.1%
of Idaho adults were classified as obese while 26.9% were classified as obese in the US.
The benefits of a healthy diet in conjunction with exercise are well known. The County Health Rankings model uses adult
obesity in the model as the most consistent means of ascertaining these diet and exercise factors. Those who were
overweight were significantly more likely to have diabetes than those who were not. The frequency of diabetes was
highest among those who were obese. The prevalence of diabetes among those who were not overweight or obese was
3.4%; the prevalence of diabetes among those who were overweight but not obese was 6.8%, and those who were obese
was 16.1%.
In 2009, 8% of Idaho youth were obese, compared to 12% of youth nationwide. 28% of Idaho youth and 32% nationally
were overweight, including those who were obese. The Idaho rates of youth overweight and obesity are favorable when
compared to the national rates. The 2009 Idaho Youth Risk Behavioral Survey (YRBS) reported 12% of Idaho youth were
overweight, and 8% were considered obese. The U.S. mean youth obesity was 12%. Overweight or obese Idaho youth
(ages 10 to 17) was 27.5%, and the U.S.mean was 31.6%.
The County Health Rankings model uses access to recreational facilities as a measure of the built environment. This
measure speaks to the program and policy choices that communities make relative to the health of families. Access to
recreation, often in the form of a facility, is an important way for families to manage weight and, ultimately, the health
issues resulting from excess weight.
An estimated 21% of Idaho adults had not participated in physical activity in the month prior to the BRFSS survey. This
rate has been consistent over the 10-year tracking period. Overweight adults were significantly more likely to have no
leisure time physical activity than with those who were not overweight (23.9% compared with 15.3%). The County Health
Rankings reported 15% of adults in Ada County had no leisure time physical activity compared to 21% of adults in Canyon
County.
Stated positively, Idaho ranked at the top of all states for the percent of high school students who met the recommended
physical activity level for 2009 according to the Commonwealth Fund score card. (Note: A low score is desirable for this
measure.) The Idaho rate was 46.4% not achieving the goal, and the national rate was 56%. The top five states averaged
50.4% of students not getting the level of physical activity prescribed.
HEALTH ASSESSMENT SUMMARY

United Way of Treasure Valley • 2011 Community Assessment • www.unitedwaytv.org 46
Nutrition directly influences one’s overall health including dental health, obesity, diabetes and other chronic illnesses. In
2009, 75.4% of Idaho adults did not eat the recommended five servings of fruits and vegetables a day. This trend has not
changed over the last 10 years and is consistent among all health districts. In the U.S., 23.4% of adults consumed the
recommended daily fruit and vegetable servings, compared to 24.6% in Idaho. Idaho fares slightly better than the U.S.
average. According to the 2009 BRFSS, adults who did not get the recommended daily servings of fruits and vegetables
were significantly more likely to be obese than those who did get the five daily servings (26.7% compared with 19.9%).
Adherence to the recommended fruit and vegetable consumption among youth in Idaho was slightly worse (18.5%) than
the U.S. average (22.3%), which means 81.5% of Idaho youth ate fruits and vegetables less than five times per day during
the month before the survey, compared with the US average of 77.7%.
According to the Idaho BRFSS, 75.4% of Idaho adults did not eat the recommended five servings of Fruits and Vegetables
(F/V) a day, which was slightly better than the U.S. average of 76.6%. Among Idaho youth, the recommended F/V
consumption was slightly worse (81.5% did not eat the recommended number of servings) than the U.S. average (77.7%).
Adults who did not get the recommended daily F/V servings were more likely to be obese (26.7%) than adults who did get
five servings a day (19.9%). Additionally, those who did not get five servings a day were more likely to have high
cholesterol (38.9%) than those who did get the recommended F/V servings (32.5%).
Access to healthy, nutritious food is important, particularly for families with children and people living with poor health.
While Ada County’s access to healthy food is more limited than Canyon County’s, both counties have far better access than
the state overall. However, neither county nor the state met the County Health Ranking benchmark of 92% of the
population with access.
Ada County’s teen pregnancy rate was 31 per 1,000 in 2010, while Canyon County’s rate was 72 per 1,000. The U.S. rate in
2009 was 43 per 1,000. Between 2009 and 2010, the teen pregnancy rate in Canyon County rose more than the national
level. During the same period, Ada County’s teen pregnancy rate dropped by 1%.
Idaho Vital Statistics indicate the teen pregnancy (for ages 15-19) rate has been declining over the past decade. In 2005,
Idaho’s rate was 44.7 per 1,000; in 2009, it was 43.3; and in 2010, it was 40. The current 2010 Ada County rate is 31.
However, in Canyon County, teen pregnancies have been increasing. In 2009, Canyon County’s rate was 64.1; in 2010 it
was 72. The national benchmark is 22; the national rate was 42.5 in 2009
The County Health Ranking model uses the rates of sexually transmitted infections as a measure of risky behavior. The
rate of sexually transmitted diseases per 100,000 people in Idaho is lower than the national average. Idaho’s STD rate was
42nd nationally in 2009. The rate of Chlamydia incidence in Ada County was 348, Canyon County was 353, and the Idaho
rate was 252.1 in 2009. The national benchmark for the County
HEALTH ASSESSMENT SUMMARY
United Way of Treasure Valley • 2011 Community Assessment • www.unitedwaytv.org 47
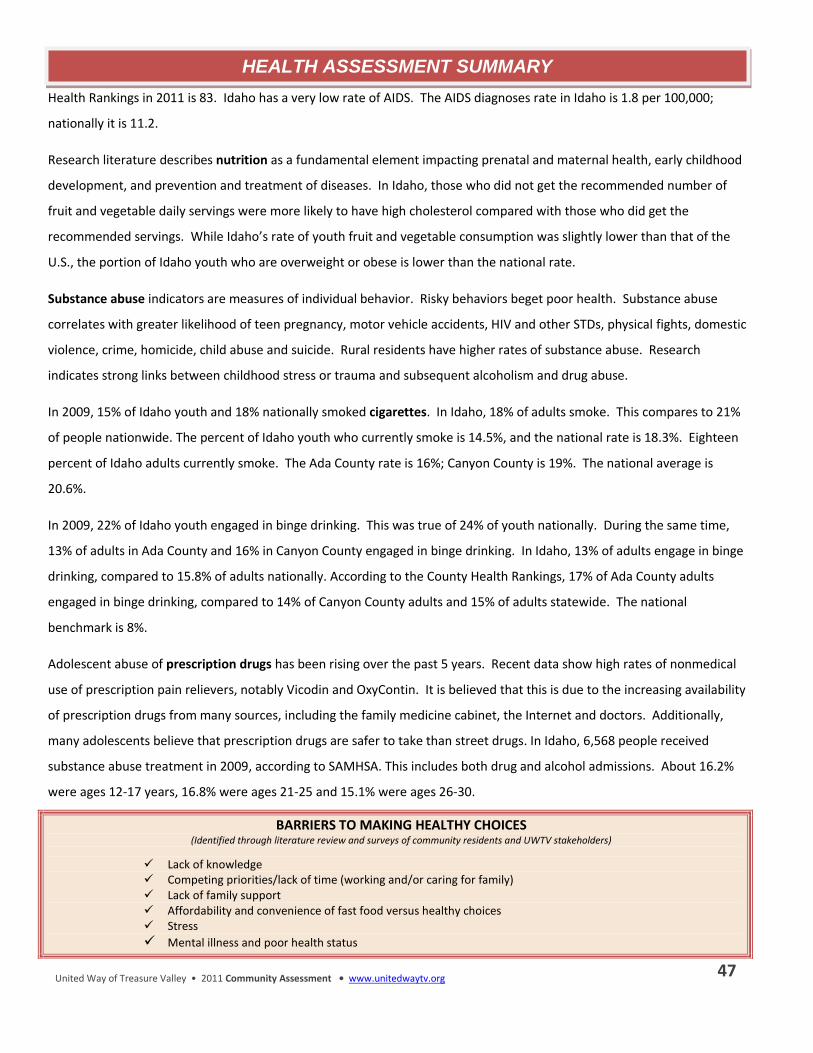
Health Rankings in 2011 is 83. Idaho has a very low rate of AIDS. The AIDS diagnoses rate in Idaho is 1.8 per 100,000;
nationally it is 11.2.
Research literature describes nutrition as a fundamental element impacting prenatal and maternal health, early childhood
development, and prevention and treatment of diseases. In Idaho, those who did not get the recommended number of
fruit and vegetable daily servings were more likely to have high cholesterol compared with those who did get the
recommended servings. While Idaho’s rate of youth fruit and vegetable consumption was slightly lower than that of the
U.S., the portion of Idaho youth who are overweight or obese is lower than the national rate.
Substance abuse indicators are measures of individual behavior. Risky behaviors beget poor health. Substance abuse
correlates with greater likelihood of teen pregnancy, motor vehicle accidents, HIV and other STDs, physical fights, domestic
violence, crime, homicide, child abuse and suicide. Rural residents have higher rates of substance abuse. Research
indicates strong links between childhood stress or trauma and subsequent alcoholism and drug abuse.
In 2009, 15% of Idaho youth and 18% nationally smoked cigarettes. In Idaho, 18% of adults smoke. This compares to 21%
of people nationwide. The percent of Idaho youth who currently smoke is 14.5%, and the national rate is 18.3%. Eighteen
percent of Idaho adults currently smoke. The Ada County rate is 16%; Canyon County is 19%. The national average is
20.6%.
In 2009, 22% of Idaho youth engaged in binge drinking. This was true of 24% of youth nationally. During the same time,
13% of adults in Ada County and 16% in Canyon County engaged in binge drinking. In Idaho, 13% of adults engage in binge
drinking, compared to 15.8% of adults nationally. According to the County Health Rankings, 17% of Ada County adults
engaged in binge drinking, compared to 14% of Canyon County adults and 15% of adults statewide. The national
benchmark is 8%.
Adolescent abuse of prescription drugs has been rising over the past 5 years. Recent data show high rates of nonmedical
use of prescription pain relievers, notably Vicodin and OxyContin. It is believed that this is due to the increasing availability
of prescription drugs from many sources, including the family medicine cabinet, the Internet and doctors. Additionally,
many adolescents believe that prescription drugs are safer to take than street drugs. In Idaho, 6,568 people received
substance abuse treatment in 2009, according to SAMHSA. This includes both drug and alcohol admissions. About 16.2%
were ages 12-17 years, 16.8% were ages 21-25 and 15.1% were ages 26-30.
BARRIERS TO MAKING HEALTHY CHOICES (Identified through literature review and surveys of community residents and UWTV stakeholders)
Lack of knowledge Competing priorities/lack of time (working and/or caring for family) Lack of family support Affordability and convenience of fast food versus healthy choices Stress
Mental illness and poor health status
HEALTH ASSESSMENT SUMMARY

United Way of Treasure Valley • 2011 Community Assessment • www.unitedwaytv.org 48
Percentage of Overweight and Obese Adults (2009)
Source: County Health Rankings. (2011). Accessed at: http://www.countyhealthrankings.org/idaho/ada/3
Prevalence of Diabetes by Weight Status among Idaho Adults (2009)
Source: County Health Rankings. (2011). Accessed at: http://www.countyhealthrankings.org/idaho/ada/3
Percentage of Population with Diabetes (2010)
Source: Centers for Disease Control and Prevention. (2009). Behavioral Risk Factor Surveillance System: Chronic Disease indicators
District 3 District 4 Idaho U.S.
Obese 30.6% 22.1% 25.1% 26.9%
Overweight 35.4% 35.6% 36.2% 37.1%
0%
10%
20%
30%
40%
50%
60%
70%
Not Overweight Overweight but not Obese Obese
Idaho 3.4% 6.8% 16.1%
0%
2%
4%
6%
8%
10%
12%
14%
16%
18%
20%
Ada County Canyon County Idaho U.S.
Population 7% 8% 8% 9%
0%
1%
2%
3%
4%
5%
6%
7%
8%
9%
10%
HEALTH SELECTED CHARTS AND GRAPHS

United Way of Treasure Valley • 2011 Community Assessment • www.unitedwaytv.org 49
Obese Adults
Source: County Health Rankings. (2011). Accessed at: http://www.countyhealthrankings.org/idaho/ada/3
Overweight and Obese Youth in Idaho (2009)
Source: Centers for Disease Control and Prevention. (2009). Youth Risk Behavior Survey. Accessed at: http://apps.nccd.cdc.gov/youthonline/App/Results.aspx?TT=A&OUT=0&SIDQID=QQ&LID=ID&...
2010% 2011%
Idaho 25% 26%
Ada 22% 22%
Canyon 25% 30%
US Benchmark 25%
0%
5%
10%
15%
20%
25%
30%
35%
Idaho U.S.
Obese 8% 12%
Overweight but not Obese 20% 20%
0%
5%
10%
15%
20%
25%
30%
35%
HEALTH SELECTED CHARTS AND GRAPHS

United Way of Treasure Valley • 2011 Community Assessment • www.unitedwaytv.org 50
Percentage of Adults Reporting No Leisure Physical Activity
Source: Centers for Disease Control and Prevention. (2009). Behavioral Risk Factor Surveillance System: Chronic Disease indicators.
Percentage of Idaho Adults Reporting No Leisure Physical Activity by Weight Status (2009)
Source: Centers for Disease Control and Prevention. (2009). Behavioral Risk Factor Surveillance System: Chronic Disease indicators.
Percentage of Adults Obtaining the Recommended Amount of Physical Activity (2009)
Source: County Health Rankings. (2011). Accessed at: http://www.countyhealthrankings.org/idaho/ada/3
Not Overweight Overweight
Idaho 15% 24%
0%
5%
10%
15%
20%
25%
30%
Idaho US
Adults 58% 51%
0%
10%
20%
30%
40%
50%
60%
70%
0%
5%
10%
15%
20%
25%
30%
2004 2005 2006 2007 2008
Boise City-Nampa Metropolitan Area
19% 20% 19% 18%
Idaho 19% 22% 21% 20% 21%
U.S. 24% 25% 24% 24% 25%
HEALTH SELECTED CHARTS AND GRAPHS

United Way of Treasure Valley • 2011 Community Assessment • www.unitedwaytv.org 51
Percentage of Students Not Meeting Recommended Physical Activity Level, 2009
Source: Wealth Fund State Data Center. Accessed at: http://www.commonwealthfund.org/Maps-and-Data/State-Data-Center/State-Scorecard.aspx
% of Youth Consuming 5 Servings Fruits/Veggies per Day (2009)
Source: Wealth Fund State Data Center. Accessed at: http://www.commonwealthfund.org/Maps-and-Data/State-Data-Center/State-Scorecard.aspx
HEALTH SELECTED CHARTS AND GRAPHS

United Way of Treasure Valley • 2011 Community Assessment • www.unitedwaytv.org 52
Zip Codes with Access to Healthy Food
Source: County Health Rankings. (2011). Accessed at: http://www.countyhealthrankings.org/idaho/ada/3
Percentage of Zip Code Areas with Healthy Food Outlet (Grocery Store, Farmers Market, or Produce Stand) (2008).
Source: County Health Rankings. (2011). Accessed at: http://www.countyhealthrankings.org/idaho/ada/3
0% 10% 20% 30% 40% 50% 60% 70% 80% 90%
100%
2010 2011
Idaho 36% 52%
Ada 35% 81%
Canyon 60% 90%
US Benchmark 92%
2010 2011
Idaho 36% 52%
Ada 35% 81%
Canyon 60% 90%
US Benchmark 92%
0%
10%
20%
30%
40%
50%
60%
70%
80%
90%
100%
HEALTH SELECTED CHARTS AND GRAPHS

United Way of Treasure Valley • 2011 Community Assessment • www.unitedwaytv.org 53
Access to Recreation Facilities
Source: County Health Rankings. (2011). Accessed at: http://www.countyhealthrankings.org/idaho/ada/3
Percentage of Population with Diabetes, 2010
Source: Centers for Disease Control and Prevention. (2009). Behavioral Risk Factor Surveillance System: Chronic Disease indicators.
0
5
10
15
20
2011
Idaho 10
Ada 12
Canyon 2
US Benchmark 17
HEALTH SELECTED CHARTS AND GRAPHS
United Way of Treasure Valley • 2011 Community Assessment • www.unitedwaytv.org 54
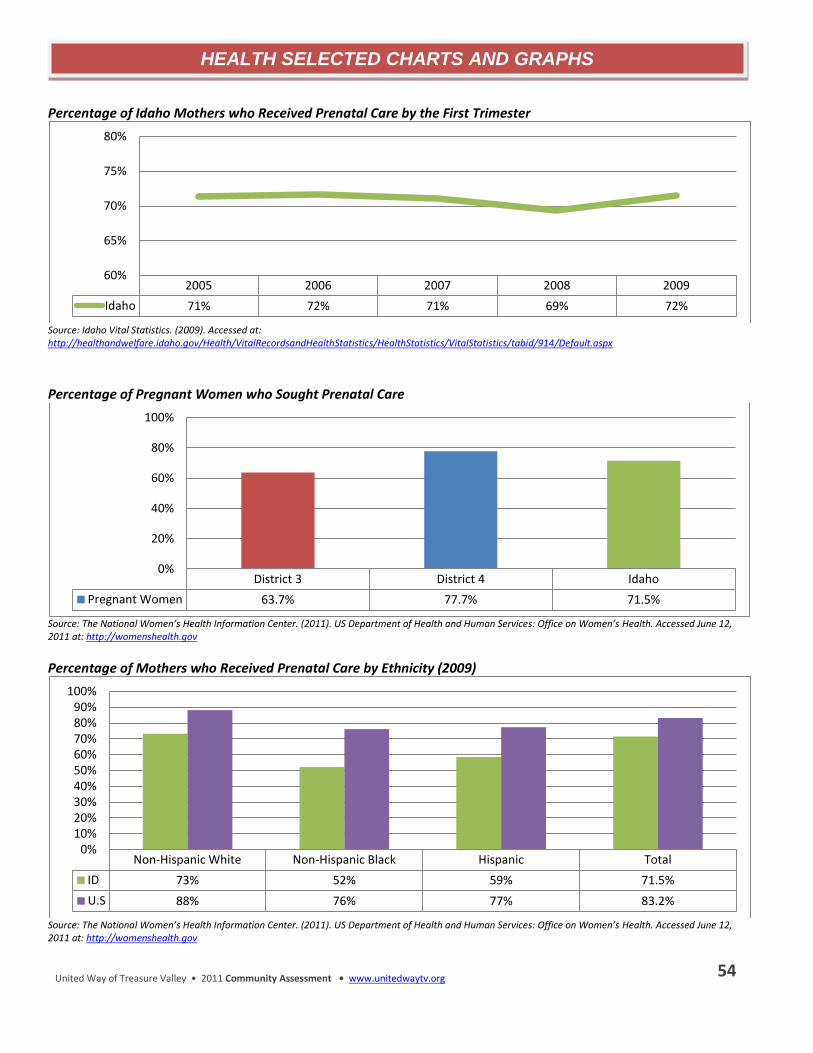
Percentage of Idaho Mothers who Received Prenatal Care by the First Trimester
Source: Idaho Vital Statistics. (2009). Accessed at: http://healthandwelfare.idaho.gov/Health/VitalRecordsandHealthStatistics/HealthStatistics/VitalStatistics/tabid/914/Default.aspx
Percentage of Pregnant Women who Sought Prenatal Care
Source: The National Women’s Health Information Center. (2011). US Department of Health and Human Services: Office on Women’s Health. Accessed June 12, 2011 at: http://womenshealth.gov
Percentage of Mothers who Received Prenatal Care by Ethnicity (2009)
Source: The National Women’s Health Information Center. (2011). US Department of Health and Human Services: Office on Women’s Health. Accessed June 12, 2011 at: http://womenshealth.gov
2005 2006 2007 2008 2009
Idaho 71% 72% 71% 69% 72%
60%
65%
70%
75%
80%
District 3 District 4 Idaho
Pregnant Women 63.7% 77.7% 71.5%
0%
20%
40%
60%
80%
100%
Non-Hispanic White Non-Hispanic Black Hispanic Total
ID 73% 52% 59% 71.5%
U.S 88% 76% 77% 83.2%
0% 10% 20% 30% 40% 50% 60% 70% 80% 90%
100%
HEALTH SELECTED CHARTS AND GRAPHS

United Way of Treasure Valley • 2011 Community Assessment • www.unitedwaytv.org 55
Teen Birth Rate per 1,000 Girls Age 15-19
Source: County Health Rankings. (2011). Accessed at: http://www.countyhealthrankings.org/idaho/ada/3; Idaho Vital Statistics, 2009.
Percentage of Children Receiving All Recommended Childhood Immunizations
Source: Common Wealth Fund State Data Center. Accessed at: http://www.commonwealthfund.org/Maps-and-Data/State-Data-Center/State-Scorecard.aspx
Percentage of Children Immunized (2009)
Source: Kaiser Family Foundation. (2006, 2007, 2008). State health facts. Accessed at: http://www.statehealthfacts.org/profileglance.jsp?rgn=14
0 10 20 30 40 50 60 70 80
2009 2010
Ada County 32 31
Canyon County 64.1 72
Idaho 43.3 40
U.S. 42.5
2005 2007
Idaho 78.1% 78.8%
Median State 81.6% 80.1%
50% 55% 60% 65% 70% 75% 80% 85% 90% 95%
100%
Idaho US
Children 57% 72%
0%
10%
20%
30%
40%
50%
60%
70%
80%
90%
100%
HEALTH SELECTED CHARTS AND GRAPHS

United Way of Treasure Valley • 2011 Community Assessment • www.unitedwaytv.org 56
Percentage of Children Immunized
Source: America’s Health Ranking. (2010). Accessed at: http://www.americashealthrankings.org/.
Percentage of Babies with Low Birth Weight
Source: County Health Rankings. (2011). Accessed at: http://www.countyhealthrankings.org/idaho/ada/3
Percentage of Low Birth Weight Babies by Ethnicity (2008)
Source: Kaiser Family Foundation. (2006, 2007, 2008). State health facts. Accessed at: http://www.statehealthfacts.org/profileglance.jsp?rgn=14
2006 2007 2008 2009 2010
Idaho 78.1% 77.8% 65.9% 87.2% 90.3%
U.S. 80.8% 80.6% 78.2% 78.2% 89.8%
50% 55% 60% 65% 70% 75% 80% 85% 90% 95%
100%
2010% 2011%
Idaho 3.3 3.3
Ada 3.4 3.2
Canyon 3.3 3.5
US Benchmark 6
0 1 2 3 4 5 6 7
Idaho U.S.
Hispanic 7% 7%
Non-Hispanic 6% 7%
0% 1% 2% 3% 4% 5% 6% 7% 8% 9%
10%
HEALTH SELECTED CHARTS AND GRAPHS

United Way of Treasure Valley • 2011 Community Assessment • www.unitedwaytv.org 57
Chlamydia rate per 100,000 Population
Source: County Health Rankings. (2011). Accessed at: http://www.countyhealthrankings.org/idaho/ada/3
AIDS Diagnoses per 100,000 Population (2009)
Source: County Health Rankings. (2011). Accessed at: http://www.countyhealthrankings.org/idaho/ada/3
0
50
100
150
200
250
300
350
400
450
2010 2011
Idaho 254 280
Ada 353 348
Canyon 405 353
US Benchmark 83
Idaho US
Diagnoses 1.8 11.2
0
2
4
6
8
10
12
HEALTH SELECTED CHARTS AND GRAPHS

United Way of Treasure Valley • 2011 Community Assessment • www.unitedwaytv.org 58
Percentage of Youth Who Have Ever Tried Cigarettes
Source: Youth Risk Behavioral Survey, 2009.
Percentage of Youth Who Are Current Smokers
Source: Youth Risk Behavioral Survey, 2009.
Percentage of Adults Who Are Current Smokers (2009)
Source: Centers for Disease Control and Prevention. (2009). Behavioral Risk Factor Surveillance System: Chronic Disease indicators.
0%
10%
20%
30%
40%
50%
60%
2007 2009
Idaho 48% 40%
U.S. 50% 46%
0%
5%
10%
15%
20%
25%
2007 2009
Idaho 20% 15%
U.S. 18%
0% 2% 4% 6% 8%
10% 12% 14% 16% 18% 20%
2010% 2011%
Idaho 18% 18%
Ada 17% 16%
Canyon 19% 19%
US Benchmark 15%
HEALTH SELECTED CHARTS AND GRAPHS

United Way of Treasure Valley • 2011 Community Assessment • www.unitedwaytv.org 59
Percentage of Youth Who Engaged in Binge Drinking (2009)
County data unavailable Source: Youth Risk Behavioral Survey, 2009.
Percentage of Adults Who Engaged in Binge Drinking (2009) (Per the Behavior Risk Surveillance Study)
Source: Centers for Disease Control and Prevention. (2009). Behavioral Risk Factor Surveillance System: Chronic Disease indicators Percentage of Adults Who Engaged in Binge Drinking (Per County Health Rankings)
Source: Centers for Disease Control and Prevention. (2009). Behavioral Risk Factor Surveillance System: Chronic Disease indicators
Idaho US
Youth 22% 24%
21%
22%
22%
23%
23%
24%
24%
25%
Idaho US
Adults 13% 16%
0%
2%
4%
6%
8%
10%
12%
14%
16%
18%
20%
2010% 2011%
Ada County 14% 15%
Canyon County 17% 17%
Idaho 13% 14%
US Benchmark 8%
0% 2% 4% 6% 8%
10% 12% 14% 16% 18%
HEALTH SELECTED CHARTS AND GRAPHS

United Way of Treasure Valley • 2011 Community Assessment • www.unitedwaytv.org 60
Drug and Alcohol Admissions in Idaho by Substance (2009)
Source: Substance Abuse and Mental Health Services Administration (SAMHSA), Centers for Disease Control and Prevention. Accessed at: http://www.samhsa.gov/
Drug and Alcohol Admissions in Idaho by Age (2009)
Source: Substance Abuse and Mental Health Services Administration (SAMHSA), Centers for Disease Control and Prevention. Accessed at: http://www.samhsa.gov/
28%
25% 14%
23%
5% 5%
Marijuana
Alcohol Only
Alcohol with another Drug
Amphetamines
Opiates
Other
16%
17%
15%
52%
12-17 Years
21-25 Years
26-30 Years
Other
HEALTH SELECTED CHARTS AND GRAPHS

United Way of Treasure Valley • 2011 Community Assessment • www.unitedwaytv.org 61
Percentage of Drug and Alcohol Admissions in Idaho by Race (2009)
Source: American Community Survey 2009, “B03001. Hispanic or Latino Origin by Specific Origin,” U.S. Census Bureau American FactFinder, 2009
Drug and Alcohol Admissions in Idaho by Gender (2009)
Source: American Community Survey 2009, “B03001. Hispanic or Latino Origin by Specific Origin,” U.S. Census Bureau American FactFinder, 2009
Percentages of Idaho Adults Aged 18-25 Who Use Legal and Illicit Drugs (2009)
Source: National Substance Abuse Index, (2006); accessed at: http://nationalsubstanceabuseindex.org/idaho/stats.php
82%
1%
4% 13% White
Black
American Indian/Alaska Native Hispanic or Latino
36% 64%
Female
Male
Illicit Drugs Tobacco Alchol
Adults 17% 39% 52%
0%
10%
20%
30%
40%
50%
60%
HEALTH SELECTED CHARTS AND GRAPHS

United Way of Treasure Valley • 2011 Community Assessment • www.unitedwaytv.org 62
HEALTHY, SAFE AND NURTURING RELATIONSHIPS
Domestic violence is one of the most common causes of injury among women, which includes incidents where the
offender and victim are married, formerly married or have a child in common. It is a cause of severe emotional and mental
trauma, lowered self-esteem, severe fears, isolation, depression, suicidal thoughts, increased substance abuse and death.
Evidence suggests drug and alcohol use may play a key role in domestic violence.
The following information is taken from the Idaho Supreme Court Annual Reports between 2005 to 2011. Domestic
violence cases include all civil protection order cases filed and domestic relations include divorce, child custody, and
visitation cases. For Magistrate Court, the number of domestic relations in 2011, were 14,807 compared to 13,185 in 2005
(an increase of 12.3%). The number of domestic violence cases decreased by 13.5%.
Intimate partner violence includes incidents where the offender and victim are related through marriage/common law as
an ex-spouse, boy/girlfriend, or same sex partners. In 2010, there were 5,880 victims of reported intimate partner violence
in Idaho compared to 6,396 in 2005 (a decrease of 7.9%). Most intimate partner violence victims were between
boyfriend/girlfriend, followed by spouse, common-law spouse, ex-spouse and homosexual relationship.
The Idaho Statistical Analysis Center published a report in May, 2011 detailing a compilation of court filings and police
reported incidents ranging from 2005 to 2010. Some of the highlights are listed below:
47.2% of intimate partner violence incidents occurred between 8 pm and 3 am. Peak hours were between
7pm and midnight, accounting for 35.1% of all incidents.
Intimate partner violence occurs most often during summer months. 28.1% occurred during the months of
June through August. One out of 10 incidents occurred in the peak month of July.
In Ada County, there was a 7.4 decrease in intimate partner violence.
In Canyon County, there was a 1.3% increase in intimate partner violence.
BARRIERS TO HEALTHY, SAFE AND NURTURING RELATIONSHIPS
(Identified through literature review and surveys of community residents and UWTV stakeholders)
Fear of getting help/leaving family Cycle of abuse (generational) Lack of knowledge of community resources Financial restraints (no source of income to support family)
HEALTH ASSESSMENT SUMMARY
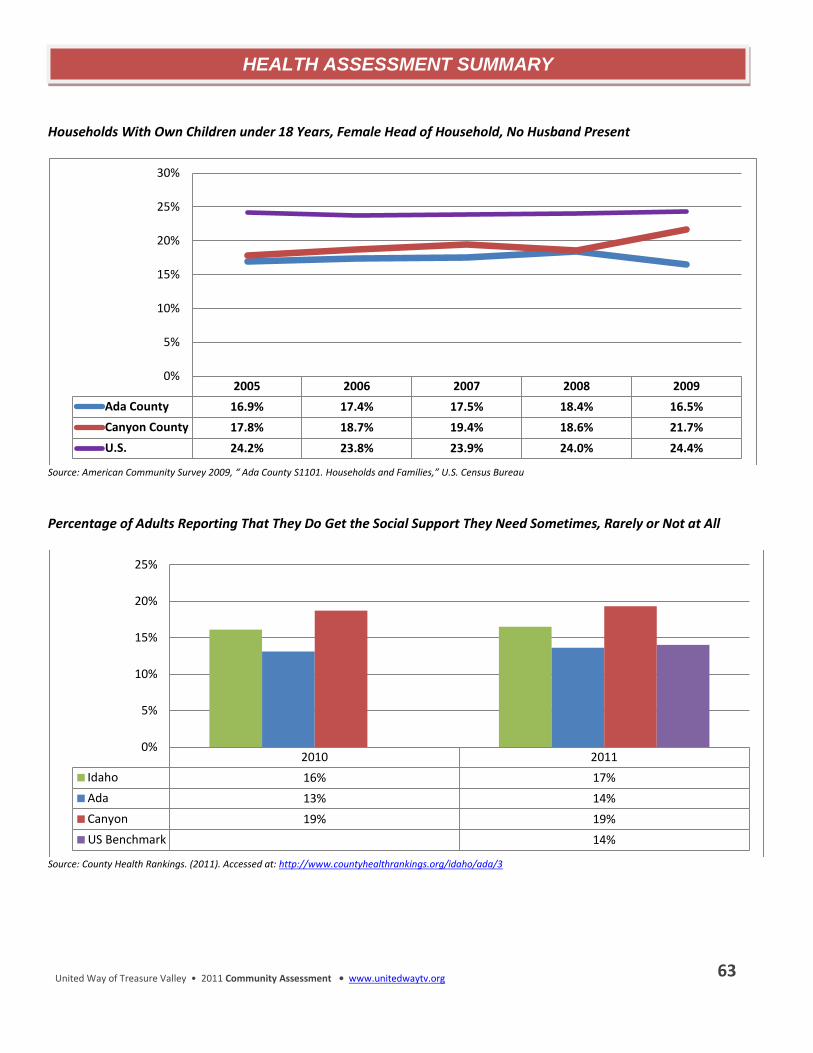
United Way of Treasure Valley • 2011 Community Assessment • www.unitedwaytv.org 63
Households With Own Children under 18 Years, Female Head of Household, No Husband Present
Source: American Community Survey 2009, “ Ada County S1101. Households and Families,” U.S. Census Bureau
Percentage of Adults Reporting That They Do Get the Social Support They Need Sometimes, Rarely or Not at All
Source: County Health Rankings. (2011). Accessed at: http://www.countyhealthrankings.org/idaho/ada/3
2005 2006 2007 2008 2009
Ada County 16.9% 17.4% 17.5% 18.4% 16.5%
Canyon County 17.8% 18.7% 19.4% 18.6% 21.7%
U.S. 24.2% 23.8% 23.9% 24.0% 24.4%
0%
5%
10%
15%
20%
25%
30%
2010 2011
Idaho 16% 17%
Ada 13% 14%
Canyon 19% 19%
US Benchmark 14%
0%
5%
10%
15%
20%
25%
HEALTH ASSESSMENT SUMMARY

United Way of Treasure Valley • 2011 Community Assessment • www.unitedwaytv.org 64
Number of Victims of Intimate Partner Violence, Family Violence and Other: 2005 – 2010
Source: Idaho Statistical Analysis Center. (2011). Domestic Violence in Idaho: A compilation of court filings and police reported incidents: 2005-2010
Number of Intimate Partner Violence by Relationship Type: 2005 – 2010
Source: Idaho Statistical Analysis Center. (2011). Domestic Violence in Idaho: A compilation of court filings and police reported incidents: 2005-2010
2005 2006 2007 2008 2009 2010
Intimate Partner Violence 6396 6335 6274 6213 6222 5880
Family Violence 3756 3669 3787 3677 3533 3528
0
1000
2000
3000
4000
5000
6000
7000
2653
2961 3037 2896
3029
2787
2610
2391 2346 2412 2310 2274
661 563
432 442 403 419 418 380 416 403 397 353
54 40 44 60 83 47
2005 2006 2007 2008 2009 2010
Boyfriend/Girlfriend Spouse Common-Law Spouse Ex-Spouse Homosexual Relationship
HEALTH ASSESSMENT SUMMARY

United Way of Treasure Valley • 2011 Community Assessment • www.unitedwaytv.org 65
QUALITY MENTAL HEALTH SUPPORT
The Surgeon General defines mental health as “the successful performance of mental function, resulting in productive
activities, fulfilling relationships with other people, and the ability to adapt to change and to cope with adversity; from
early childhood until late life, mental health is the springboard of thinking and communication skills, learning, emotional
growth, resilience, and self-esteem.”
According to the Gallup-Healthways Well-Being survey for 2009, the overall well-being in Idaho is ranked 11th in the nation
(1 is the top rank and 50 is the bottom). Idaho is ranked in the top 10 for Healthy Behavior (4th ) and Work Environment
(7th ). Idaho ranked 29th for Physical Health and 26th for Basic Access. Emotional Health ranked 17th.
According to a survey conducted in 2010-2011, primary care providers in rural and frontier Idaho reported that about 30%
of their patients presented with mental and behavioral health problems. The three most common mental health problems
are mood disorders (depression), anxiety and substance abuse. Without proper treatment, one complication of depression
is suicide.
The percentage of Ada County residents with inadequate social support was 3% lower than the state rate, meeting the U.S.
benchmark of 14%. The Canyon County percentage was about 2% higher. The proportion of Idaho residents with access to
a mental health provider in 2009 was 19,583 to 1; Ada County was 14,050 to 1; and Canyon County’s proportion was
46,030 residents to 1.
SAMHSA reported 8.8% of Idaho youth ages 12-17 have depressive symptoms. The 2009 YRBS revealed 28.3% of youth felt
sad or hopeless almost every day for two or more weeks in a row, causing them to stop doing some of their usual activities
within the 12 months prior to the survey.
The number of young children ages 2 to 17 with mental illness who received treatment in Idaho was 63.4% in 2009; the
U.S. average was 63%. The best state percentage was 81.5% and the top 5 average state’s percentages were 77.5%.
Idaho’s rate has improved since 2007, when 56.9% of children received needed mental health treatment.
Nearly 9% of Idaho’s adult population reported at least one episode of major depression in 2007 (the average of three age
groups, 18-25: 9.45%; 18+: 8.24%; and 26+: 8.01%). Nine percent of Idaho adults had major depressive symptoms, and in
2009 19% were diagnosed with a depressive disorder.
In 2009, 9% of Idaho youth had depressive symptoms and 28% of Idaho youth reported feeling sad or hopeless.
The Idaho suicide rate was nearly 20 per 100,000 in 2009, while the US rate was about 12 per 100,000. In both Ada and
Canyon Counties the number of suicides fell slightly between 2008 and 2009, although the number of suicides at the state
level rose from 251 to more than 300 during that time.
HEALTH ASSESSMENT SUMMARY

United Way of Treasure Valley • 2011 Community Assessment • www.unitedwaytv.org 66
Suicide is the eighth-leading cause of death in Idaho and the 11th in the U.S. Suicide is the second-leading cause of death in
the 15-24 and 25-34 age groups. The leading cause of death is accidents. There has been a 22% increase in suicide from
2008 to 2009, according to the Idaho Department of Health and Welfare. In 2008 there were 251 suicides and in 2009
there were 307. The average annual age-adjusted suicide death rate was 15.4/100,000. The highest suicide rates are
among males age 75 and older (25.7/100,000); however, 35.5% of those who died from suicide were aged 35-54. The 2009
Idaho suicide rate for adults was 19.9 per 100,000 (19.3 between 2005 and 2009). This is much higher than the U.S. rate of
11.5. Suicide is a risk factor of untreated mental illness. More than 90% of people who die by suicide have a history of
mental illness.
BARRIERS TO QUALITY MENTAL HEALTH SUPPORT
(Identified through literature review and surveys of community residents and UWTV stakeholders)
Lack of mental health providers
Cost of programs/coverage
Limited transportation
Lack of insurance coverage
HEALTH ASSESSMENT SUMMARY

United Way of Treasure Valley • 2011 Community Assessment • www.unitedwaytv.org 67
Percentage of Population Living in Mental Health Professions Shortage Areas (2008)
Source: County Health Rankings. (2011). Accessed at: http://www.countyhealthrankings.org/idaho/ada/3
Children with a Mental Illness Who Received Treatment
Source: Centers for Disease Control and Prevention. (2009). Youth Risk Behavior Survey. Accessed at: http://apps.nccd.cdc.gov/youthonline/App/Results.aspx?TT=A&OUT=0&SIDQID=QQ&LID=ID&...
Percentage of Idaho Adults Who Have Been Diagnosed with a Depressive Disorder by Gender (2008)
Source: Centers for Disease Control and Prevention. (2008). Behavioral Risk Factor Surveillance System: Chronic Disease indicators.
Idaho US
Population 62% 19%
0%
10%
20%
30%
40%
50%
60%
70%
2007 2009
Idaho 57% 63%
U.S. 63%
50%
55%
60%
65%
70%
Women Men All Adults
Idaho 25% 13% 19%
0%
5%
10%
15%
20%
25%
30%
HEALTH SELECTED CHARTS AND GRAPHS

United Way of Treasure Valley • 2011 Community Assessment • www.unitedwaytv.org 68
Average Number of Mentally Unhealthy Days Reported Within the Past 30 Days
Source: County Health Rankings. (2011). Accessed at: http://www.countyhealthrankings.org/idaho/ada/3.
Number of Suicides
Source: Idaho Suicide Prevention Research Project: Intentional Self‐harm by Region and County 2003‐2009. Accessed at: http://www.idahosuicide.info/_uploads/StateAggregate/01-Idaho_Suicide_by_County_03-09.pdf
Suicides in Idaho by Gender (2009)
Source: Suicide Prevention Action Network of Idaho. (2008/2009). Accessed at: http://www.spanidaho.org/
2010 Number of Days 2011 Number of Days
Idaho 3.3 3.3
Ada 3.4 3.2
Canyon 3.3 3.5
US Benchmark 2
0 0.5
1 1.5
2 2.5
3 3.5
4
2008 2009
Idaho 251 307
Ada 60 54
Canyon 22 32
0
50
100
150
200
250
300
350
23%
77%
Women
Men
HEALTH SELECTED CHARTS AND GRAPHS

United Way of Treasure Valley • 2011 Community Assessment • www.unitedwaytv.org 69
Suicide Rate per 100,000 Adults (2005-2009) (2009 only for U.S. rate)
Source: Suicide Prevention Action Network of Idaho. (2008/2009). Accessed at: http://www.spanidaho.org/
Age-Adjusted Suicide Rate per 100,000 (2009)
Source: Idaho Vital Statistics, 2009.
Youth Rates of Suicidal Thinking (2009)
Ada County Canyon County Idaho U.S.
Adults 15.9 15.7 19.3 11.5
0
5
10
15
20
25
Ada County Canyon County
Rate 20.6 11.3
0
5
10
15
20
25
0% 2% 4% 6% 8%
10% 12% 14% 16%
Seriously Considered Attempting Suicide
Made a Plan about how they would Attempt Suicide
Attempted Suicide One or More Times
Idaho 14.2% 13.3% 6.9%
U.S. 13.8% 10.9% 6.3%
HEALTH SELECTED CHARTS AND GRAPHS
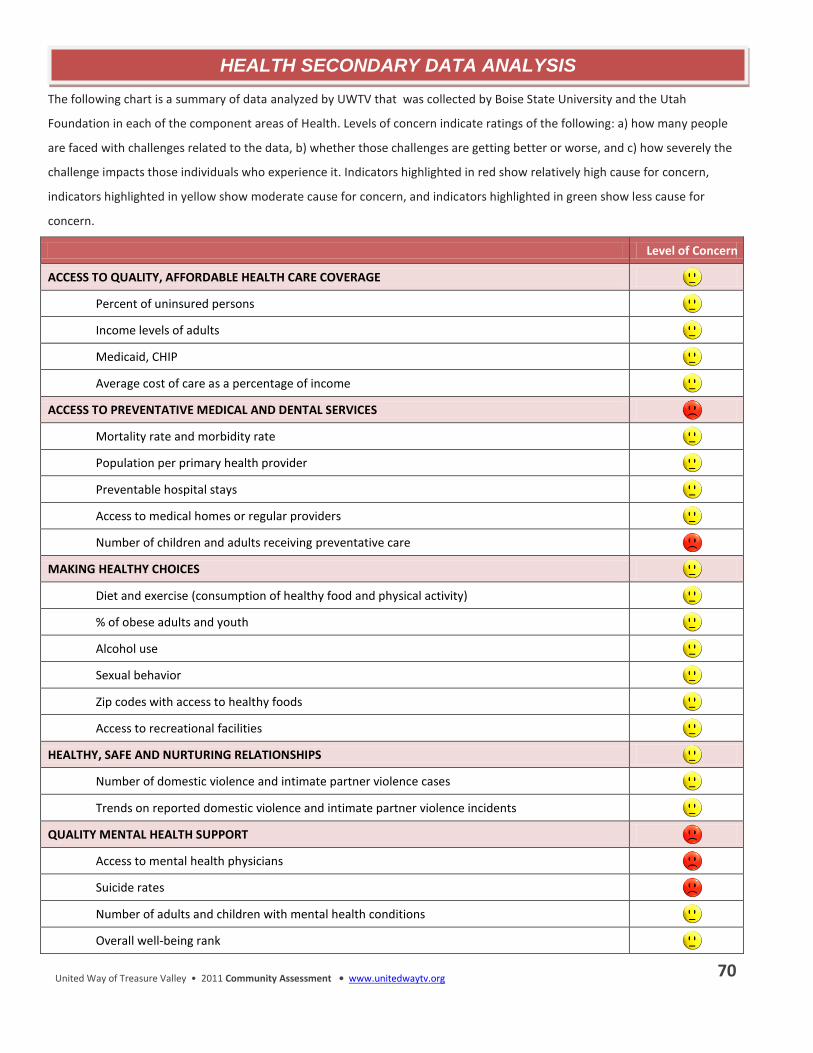
United Way of Treasure Valley • 2011 Community Assessment • www.unitedwaytv.org 70
The following chart is a summary of data analyzed by UWTV that was collected by Boise State University and the Utah
Foundation in each of the component areas of Health. Levels of concern indicate ratings of the following: a) how many people
are faced with challenges related to the data, b) whether those challenges are getting better or worse, and c) how severely the
challenge impacts those individuals who experience it. Indicators highlighted in red show relatively high cause for concern,
indicators highlighted in yellow show moderate cause for concern, and indicators highlighted in green show less cause for
concern.
Level of Concern
ACCESS TO QUALITY, AFFORDABLE HEALTH CARE COVERAGE
Percent of uninsured persons
Income levels of adults
Medicaid, CHIP
Average cost of care as a percentage of income
ACCESS TO PREVENTATIVE MEDICAL AND DENTAL SERVICES
Mortality rate and morbidity rate
Population per primary health provider
Preventable hospital stays
Access to medical homes or regular providers
Number of children and adults receiving preventative care
MAKING HEALTHY CHOICES
Diet and exercise (consumption of healthy food and physical activity)
% of obese adults and youth
Alcohol use
Sexual behavior
Zip codes with access to healthy foods
Access to recreational facilities
HEALTHY, SAFE AND NURTURING RELATIONSHIPS
Number of domestic violence and intimate partner violence cases
Trends on reported domestic violence and intimate partner violence incidents
QUALITY MENTAL HEALTH SUPPORT
Access to mental health physicians
Suicide rates
Number of adults and children with mental health conditions
Overall well-being rank
HEALTH SECONDARY DATA ANALYSIS

United Way of Treasure Valley • 2011 Community Assessment • www.unitedwaytv.org 71
Source: 2011 Community Assessment, Boise State University Public Policy Center; Stakeholder Survey
HEALTH – COMMUNITY FEEDBACK

United Way of Treasure Valley • 2011 Community Assessment • www.unitedwaytv.org 72
In December 2011, United Way of Treasure Valley was selected as one of 12 national United Ways to participate in
a Health Mobilization Group. By participating, UWTV will build knowledge on underlying factors that affect health.
We also will build capacity to engage people and organizations to improve systems, policies and conditions to
support healthier people and communities.
This collaborative also includes the following national partners:
United Way and other community leaders are in the process of forming the Treasure Valley Health Partnership.
TVHP will help build strategies around the underlying factors that affect health in the Treasure Valley. This group
will engage community leaders and organizations to improve systems, policies and conditions to create a stronger
and healthier community. The partnership is designed to accelerate progress by mobilizing community change. By
using a national framework designed by STRIVE, the goals will be created through the following:
• Creating a shared community vision around health
• Developing evidence-based decision making
• Building a Collaborative Action Plan
• Increasing resources through planned investment and sustainability
While our suicide rate is fourth highest in the nation—and the second leading cause of death among adolescents and
young adults—Idaho is the only state without a suicide prevention hotline, a tool proven to save lives. United Way’s
unique position in the community allowed us to bring together public and private partners statewide to mobilize around
the issue (Saint Alphonsus Health System, Citi Cards, Wells Fargo, the Department of Health and Welfare, The Speedy
Foundation, Region IV Suicide Prevention Action Network Chapter, United Way of Treasure Valley, United Way of
Southeastern Idaho and United Way of Kootenai County, Idaho National Guard.)
Committed volunteers across the state had worked to establish a prevention hotline for years. But it was United Way’s
ability to engage the community that made the hotline a reality. The Idaho Suicide Hotline will launch in the fall of 2012.
HEALTH – NEXT STEPS FOR UNITED WAY OF TREASURE VALLEY

United Way of Treasure Valley • 2011 Community Assessment • www.unitedwaytv.org 73
This private/public partnership was launched in 2010 after community leaders spent years of working toward building a
local treatment center. It was the first project of its type in the State of Idaho and is designed as a prototype for
communities in other regions of the state. As an original member of the Mayor's Community Detox Steering Committee,
United Way of Treasure Valley served as the fiscal agent for the purpose of identifying and applying for grants to fund both
the construction and operation of this project.
Boys and Girls Clubs of Ada County, Boys and Girls Clubs of Nampa, Caldwell YMCA and United Way of Treasure Valley have
collaborated to ensure the youth served in Canyon County at these locations will have access to nutritious snacks after
school. Albertson's Supervalu is committed to funding the 2011-12 school year. In addition to receiving healthy snacks,
there will be an emphasis on nutrition education. Our partners in this endeavor serve a number of low-income youth every
day. Results show an average of 143 children a day relied on this snack in Nampa and 51 children a day in Caldwell.
United Way continues to support local health focused programs that provide individuals and families with opportunities to succeed. In 2011, UWTV invested more than $600,000 in support of programs operated by our partners below.
HEALTH – NEXT STEPS FOR UNITED WAY OF TREASURE VALLEY

United Way of Treasure Valley • 2011 Community Assessment • www.unitedwaytv.org 74
“What is necessary for individuals and families
to become financially stable and
independent?”
FINDINGS

United Way of Treasure Valley • 2011 Community Assessment • www.unitedwaytv.org 75
Achieving healthy lives and better educational attainment is inextricably linked to financial health and independence. As
the participants of surveys and focus groups made clear, jobs with a living wage and health benefits are the key to
financially healthy families in the Treasure Valley.
This report describes a range of issues impacting the financial stability of Treasure Valley residents.
Where possible, we have used this data to examine trends across time or compare local, state and national statistics. We
have chosen indicators that are relevant to the issues of interest to United Way and its partners, statistics that were
relatively easy to find and that are collected on a fairly routine basis from reliable sources, and indicators that should be
relevant for partner agencies to incorporate into outcome measures in their program work. In addition to the indicator
data, we conducted surveys, focus groups and interviews to provide an expanded picture of health and wellness disparities
and needs in our communities.
FINANCIAL INDEPENDENCE ASSESSMENT SUMMARY

United Way of Treasure Valley • 2011 Community Assessment • www.unitedwaytv.org 76
The following chart is a summary of data collected and analyzed by Boise State University and the Utah Foundation in each
of the component areas of Financial Independence. The colors represent composite ratings from multiple data sources
related to trend – whether the challenges are getting better or worse. Areas highlighted in red show relatively high cause
for concern, areas highlighted in yellow show moderate cause for concern, and areas highlighted in green show less cause
for concern.
Challenge is Getting Better or Worse
(Trend) Key Observations
Having a job with adequate income
Nearly 8% of Ada County families and 13% of Canyon County families have income below the poverty line.
Having access to work supports
Public transportation in the Boise/Nampa area ranks 90th among the 100 metropolitan areas when considering frequency of service. The majority of Idaho children under age 6 live in households, whether single-parent or two-parent, in which all parents work. This is true for 57% of families across Idaho, for 59% of families in Ada Count, and for 55% of families in Canyon County.
Having financial literacy and savings
Idaho ranks 31st out of all states on CFED’s Assets & Opportunity Scorecard for Financial Assets and Income.
Having access to affordable housing
This census indicates that the number of homeless people in southwest Idaho was slightly more than 1,100 The number of homeless people, including those who stay in hotels, motels or temporarily with friends or family, is likely much higher.
FINANCIAL INDEPENDENCE ASSESSMENT SUMMARY

United Way of Treasure Valley • 2011 Community Assessment • www.unitedwaytv.org 77
A JOB WITH ADEQUATE INCOME
Poverty, even narrowly defined as living in a household with annual income less than the poverty line, is a widespread
problem. The poverty line, more formally known as the poverty threshold, is a federal poverty measure used mainly for
statistical purposes. The poverty threshold is a specific dollar amount set at the national level, which differs based on the
number of people in a household. It is based on income before taxes and excludes non cash benefits. It also does not
include assets or debts. The thresholds are the same across the United States and are based on the minimum cost of an
adequate annual supply of food, multiplied by three. The U.S. census adjusts the threshold each year to account for
inflation, but it has remained otherwise unchanged, despite the fact that food now consumes less than a third of most
household budgets. Many experts regard it as a drastic underestimate of the minimum wage needed to support an
individual or family. However, the poverty line and percentages of it are widely used as estimates of poverty.
Nearly 8% of Ada County families and 13% of Canyon County families have income below the poverty line. In the Treasure
Valley, as well as across the U.S., Hispanic families and families headed by single mothers are especially likely to experience
poverty. Families with low income are more likely to experience food insecurity, less likely to have health care coverage,
and their children tend to score lower on standardized tests. While stakeholders and affected population members
surveyed for this study agreed that jobs were an important key to escaping poverty, they recognized that these jobs must
pay more than minimum wage to offer families security and the prospect of financial independence.
Families headed by single women were far more likely to experience poverty than all other groups, with families headed by
married couples being the least likely family type to fall below the poverty line. The poverty rate in Canyon County was
higher than the national rate for all family types, while the rates in Ada County were lower than the national rates for all
family types except married couples. Families in Canyon County headed by single mothers have experienced higher levels
of poverty than the national rate for single mother families in all years except 2006. For all years, Ada County’s poverty
rate for families headed by single mothers was lower than the national rate by about 5% or more.
BARRIERS TO A JOB WITH ADEQUATE INCOME (Identified through literature review and surveys of community residents and UWTV stakeholders)
Lack of jobs that pay a sufficient wage
Low education levels
Language barrier
Poor health
Lack of transportation
FINANCIAL INDEPENDENCE ASSESSMENT SUMMARY

United Way of Treasure Valley • 2011 Community Assessment • www.unitedwaytv.org 78
Percentage of Families With Income Below the Poverty Line During the Past 12 Months in 2009
Source: Poverty Status in the Past 12 Months of Families,” U.S. Census American Community Survey 2009
Percentage of Families Headed by Single Mothers that Fell Below the Poverty Line During the Past 12 Months
Source: Poverty Status in the Past 12 Months of Families,” U.S. Census American Community Survey 2009
Ada County Canyon County U.S.
All Families 8% 13% 11%
Married Couple Families 6% 9% 5%
Families Headed by Single Women 22% 34% 29%
0%
5%
10%
15%
20%
25%
30%
35%
40%
2005 2006 2007 2008 2009
Ada County 17% 21% 23% 22% 22%
Canyon County 37% 24% 36% 31% 34%
U.S. 29% 29% 28% 28% 29%
0%
5%
10%
15%
20%
25%
30%
35%
40%
FINANCIAL INDEPENDENCE SELECTED CHARTS AND GRAPHS

United Way of Treasure Valley • 2011 Community Assessment • www.unitedwaytv.org 79
Percentage of Families With Income Below the Poverty Line During the Past 12 Months by Ethnicity in 2009
Source: Poverty Status in the Past 12 Months of Families,” U.S. Census American Community Survey 2009
Percentage of Families With Incomes below the Poverty Threshold During the Last 12 Months by Number of Workers in the Household in 2009
Source: Poverty Status in the Past 12 Months of Families,” U.S. Census American Community Survey 2009
Ada County Canyon County U.S.
Hispanic or Latino 25% 28% 21%
Non-Hispanic White 7% 9% 7%
0%
5%
10%
15%
20%
25%
30%
No Workers 1 Worker 2 Workers 3 or More Workers
Ada County 15% 12% 3% 1%
Canyon County 19% 21% 6% 3%
U.S. 24% 16% 3% 2%
0%
5%
10%
15%
20%
25%
30%
FINANCIAL INDEPENDENCE SELECTED CHARTS AND GRAPHS

United Way of Treasure Valley • 2011 Community Assessment • www.unitedwaytv.org 80
Percentage of Families With Incomes Below the Poverty Threshold During the Last 12 Months by the Educational Attainment of the Householder in 2009
Source: Poverty Status in the Past 12 Months of Families,” U.S. Census American Community Survey 2009
Less than High School High School Graduates (includes equivalency)
Some College or Associate's Degree
Bachelor's Degree or Higher
Ada County 24% 8% 7% 2%
Canyon County 28% 11% 9% 3%
U.S. 25% 12% 8% 2%
0%
5%
10%
15%
20%
25%
30%
FINANCIAL INDEPENDENCE SELECTED CHARTS AND GRAPHS

United Way of Treasure Valley • 2011 Community Assessment • www.unitedwaytv.org 81
ACCESS TO WORK SUPPORTS
For low-income families, child care costs often consume as much as a third of household income. These high child care
costs can present a barrier to entry to the workforce for parents seeking employment. While the Idaho Child Care Program
(ICCP) helps by providing child care subsidies, such programs are underused by those who are eligible for them nationwide.
Reasons for this underuse can include parents’ lack of awareness that the programs exist or that they are eligible for them,
the paperwork involved, or a calculation that the benefits received from a subsidy are too small to warrant the effort of
applying. Additionally, many parents who feel that they need help paying for child care may have income that is too high
for them to qualify for a subsidy. These factors may contribute to the slow but steady decline in the number of children
receiving subsidies through ICCP.
The percentage of children who spent time home alone declined in Idaho and nationwide between 2003 and 2007. While
this may be a function of rising unemployment, and regardless of the reason, Idaho children were 1 ½ times more likely to
spend unsupervised time alone than the national rate.
In Idaho, about 35% of child care providers have a bachelor’s degree or higher, while about 45% have attained a high
school diploma or less. Since the quality of child care is important, IDHW has collaborated with the IdahoSTARS program to
create a program that defines standards, tracks progress, and trains child care workers and facilities to provide quality care.
The IdahoSTARS program seeks to strengthen the standards for child care providers as a means to ensure the safety and
health of Idaho children and create an environment for preschool children to become ready for school.
Lack of adequate transportation can impact an individual’s ability to seek and retain a job, seek health care or participate
actively in the community. These are concerns for those who cannot afford a vehicle, as well as those who cannot drive for
health and other reasons. Transportation was discussed frequently in the affected population focus groups as a barrier to
achieving financial stability and a family’s overall quality of life. Access to transportation appeared to be a moderately
important concern to the affected population of survey respondents. There are many possible strategies for addressing
transportation needs. However, it is important to monitor any programs that may be implemented because past strategies
with high promise have failed to address this issue effectively.
A higher percentage of Ada County residents use public transit than U.S. residents as a whole, while virtually no Canyon
County residents use public transit to commute to work. The percentage of Canyon County residents who carpool is
slightly higher than the national percentage, which is somewhat higher than the percentage of Ada County residents who
carpool.
FINANCIAL INDEPENDENCE ASSESSMENT SUMMARY

United Way of Treasure Valley • 2011 Community Assessment • www.unitedwaytv.org 82
More than 84% of low-income residents and slightly more than half of all residents live within 3/4 of a mile of a bus stop.
While it is only possible to reach about a third of jobs in the Boise/Nampa area by bus within 90 minutes and 9.9% within
45 minutes, this is slightly better coverage than that available to the average resident of the metropolitan areas considered
in this study. However, the Boise/Nampa area ranks 90th among the 100 metropolitan areas when considering frequency
of service.
Work support programs such as the Earned Income Tax Credit (EITC), food stamps (now called Supplemental Nutrition
Assistance Program or SNAP) and unemployment insurance have all seen significant growth over the past several years as
the economy has struggled to provide enough jobs with adequate wages to support a family.
The unemployment rate counts those who do not have a job, are seeking employment and are available to work. It does
not include those who have stopped looking for a job due to discouragement or those who consider themselves
underemployed. At both a national and metropolitan level, unemployment rose between 2007 and 2010. The
unemployment rate began to level off in 2009 and fell slightly at the national level between 2010 and 2011.
Hispanic people were markedly more likely to be unemployed than those who were white and not Hispanic.
Unemployment was more common among both groups in Canyon County than in either of the other areas. The Ada
County unemployment rate was about the same as the national rate for white people and slightly lower for Hispanic
people.
BARRIERS TO ACCESSING WORK SUPPORTS (Identified through literature review and surveys of community residents and UWTV stakeholders)
Lack of affordable, quality childcare
Lack of knowledge and awareness about available support
Not qualifying for benefits (government funded programs)
High cost of owning and maintaining a personal automobile for very low-income residents
Low frequency of service and hours of service for public transportation
FINANCIAL INDEPENDENCE ASSESSMENT SUMMARY

United Way of Treasure Valley • 2011 Community Assessment • www.unitedwaytv.org 83
Number of Idaho Children Receiving Subsidized Care Through the Idaho Child Care Program
Source: “Facts Figures Trends 2010-2011,” Idaho Department of Health and Welfare, 2011,68.
Percentage of Children (Ages 6 to 11) Who Spent Some Time Home Alone Without Supervision During the Previous Week
Source: National Survey of Children’s Health Survey,” National Survey of Children’s Health Data Resource Center, 2003,2007, http://www.nschdata.org/DataQuery/DataQueryResults.aspx.
Educational Attainment of Idaho Child Care Providers in 2011
Source: University of Idaho & Idaho Stars, “Child Care in Idaho; A Summary Report of the Idaho Child Care Study Conducted by the University of Idaho and Idaho Stars,” Idaho Stars, Aug. 8, 2011,
2007 2008 2009 2010
Idaho 8017 7334 6883 6632
0
2000
4000
6000
8000
10000
2003 2007
Idaho 24% 15%
US 16% 9%
0% 5%
10% 15% 20% 25% 30%
4%
41%
15%
18%
17%
5%
Some High School
High School Graduate/GED
Vocational Program/Certificate
Associate's Degree
Bachelor's Degree
Graduate of Professional Degree
FINANCIAL INDEPENDENCE SELECTED CHARTS AND GRAPHS

United Way of Treasure Valley • 2011 Community Assessment • www.unitedwaytv.org 84
Percentage of the Population Participating in the Food Stamp (SNAP Program) in April of Each Year
Source: Food Stamp Participants by County (Apr. 2011)” (provided via e-mail by Shane P. Leach ([email protected]) of the Idaho Department of Health and Welfare, Division of Welfare, Idaho, 2011),
Unemployment Rate
Source: Databases, Tables & Calculators by Subject,” Bureau of Labor Statistics, July 12, 2011, http://data.bls.gov/cgi-bin/surveymost.
2005 2006 2007 2008 2009 2010 2011
Ada County 5% 5% 4% 5% 7% 10% 12.33%
Canyon County 10% 10% 9% 11% 15% 20% 22.69%
U.S. 9% 9% 9% 9% 11% 13%
0%
5%
10%
15%
20%
25% U.S. data for 2011 not yet available.
May 2006 May 2007 May 2008 May 2009 May 2010 May 2011
Boise-Nampa Metropolitan Area 2.3% 2.1% 3.9% 7.5% 9.0% 8.8%
U.S. 4.6% 4.4% 5.4% 9.4% 9.6% 9.1%
0%
2%
4%
6%
8%
10%
12%
FINANCIAL INDEPENDENCE SELECTED CHARTS AND GRAPHS

United Way of Treasure Valley • 2011 Community Assessment • www.unitedwaytv.org 85
Percentage of Workers Using Various Means of Transportation to Work in 2009
Source: American Community Survey, “S0802. Means of Transportation to Work by Selected Characteristics,” United States Census Bureau American FactFinder, 2009, http://factfinder.census.gov/servlet/STTable?_bm=y&-context=st&-qr_name=ACS_2009_1YR_G00_S0802&-ds_name=ACS_2009_1YR_G00_&-CONTEXT=st&-tree_id=309&-redoLog=true&-geo_id=05000US16001&-format=&-_lang=en.
Percentage of Households Reporting That They Have No Vehicle Available.
Source: American Community Survey, “S0802. Means of Transportation to Work by Selected Characteristics,” United States Census Bureau American FactFinder, 2009, http://factfinder.census.gov/servlet/STTable?_bm=y&-context=st&-qr_name=ACS_2009_1YR_G00_S0802&-ds_name=ACS_2009_1YR_G00_&-CONTEXT=st&-tree_id=309&-redoLog=true&-geo_id=05000US16001&-format=&-_lang=en.
2005 2006 2007 2008 2009
Ada County 1.8% 1.1% 1.3% 2.1% 2.2%
Canyon County 1.9% 2.0% 2.3% 1.5% 1.2%
U.S. 4.1% 4.2% 4.2% 4.4% 4.3%
0.0%
0.5%
1.0%
1.5%
2.0%
2.5%
3.0%
3.5%
4.0%
4.5%
5.0%
FINANCIAL INDEPENDENCE SELECTED CHARTS AND GRAPHS
U.S. Ada County Canyon County
Public Transit 5% 8% 0%
Carpooled 10% 8% 11%
Drove Alone 76% 80% 78%
0%
10%
20%
30%
40%
50%
60%
70%
80%
90%
100%

United Way of Treasure Valley • 2011 Community Assessment • www.unitedwaytv.org 86
FINANCIAL LITERACY AND ASSET DEVELOPMENT
Both the stakeholder and affected population focus groups agreed that financial literacy was an important skill for students
to possess before leaving school. It is difficult to discern how much impact high school financial education has on students’
later behavior, but there is clear evidence showing the potential for financial education to change adults’ behavior in the
use of credit, preparation for buying a home, and planning their retirement savings. The percentage of Idahoans who are
underbanked is slightly higher than the national rate, and the median level of credit card debt in Idaho is nearly $200 more
than the U.S. median. It may be that financial education offers the opportunity to improve Treasure Valley residents’
prospects for financial independence.
In this study, “unbanked” meant that the respondent did not have a checking or savings account. Those who were
underbanked had a checking or savings account, but used “non-bank money orders, non-bank check-cashing services,
payday loans, rent-to-own agreements, or pawn shops at least once or twice a year.”
While Idahoans were slightly less likely to be unbanked than Americans generally, they were more likely to be
underbanked. The percentage of Idahoans who were not underbanked was slightly lower than the national percentage.
To be financially stable and gain financial independence, families should be able to manage credit responsibly. Credit card
debt may measure an individual’s credit responsibility, but also the potential vulnerability to financial crisis. The median
amount of credit card debt among Idaho adults was $186 more than the median among adults nationwide. Credit card
debt may be one of the most expensive forms of credit for low-income families and may reduce the availability of financial
assets for other purposes. Lower debt, or no debt, allows families to better afford housing and health services, and
increases the likelihood of affording additional educational opportunities.
In addition to saving for retirement and making responsible use of credit cards, another important goal that might be
addressed through financial education is asset development. This issue is given particular urgency by the fact that, as of
2006, a little more than 20% of Idaho households did not have sufficient savings to support themselves at the poverty level
if they were without income for 3 months. This is lower than the national rate of 28%. However, the median net worth of
Idaho households, $66,630, is much lower than the national median of $88,803. For households earning sufficient income
to meet their families’ needs, financial education may play an important role in helping prevent them from sinking below
the poverty level due to unexpected or emergency expenses.
There is a range of asset development programs in the Treasure Valley that help families and individuals save money for
goals like buying or renting a home, starting a business or saving for a child’s college education. The need for such
programs is demonstrated by the lower median net worth of Idaho households, compared with the national median
household net worth.
FINANCIAL INDEPENDENCE ASSESSMENT SUMMARY

United Way of Treasure Valley • 2011 Community Assessment • www.unitedwaytv.org 87
The net worth of the median Idaho household is $ 66,630, which is $22,173 lower than the net worth of the median
household nationwide.
Asset development can increase the economic stability of families when basic needs are not adequately covered by income
and government support programs. Asset development programs that focus on encouraging banking and savings accounts
and low-income home and vehicle ownership are recognized methods for promoting financial self-sufficiency. Asset
development programs in Ada and Canyon counties include Individual Development Accounts (IDA) (matched savings
accounts), micro-enterprise loans (META) and construction of affordable homes (Habitat for Humanity). In Ada and
Canyon counties, 76 low-income individuals have purchased homes, started a small business or worked toward completing
post secondary education through the IDA programs. Habitat for Humanity has helped 56 families become home owners
in Ada County and 13 families become home owners in Canyon County. In META’s last fiscal year, its loans led to 22 jobs,
11 new companies and the expansion of five other businesses.
BARRIERS TO FINANCIAL LITERACY AND ASSET DEVELOPMENT (Identified through literature review and surveys of community residents and UWTV stakeholders)
Lack of a job with adequate income
Competing priorities
Lack of personal responsibility
Lack of emphasis on the importance of financial education
Dependence on others to handle financial matters
FINANCIAL INDEPENDENCE ASSESSMENT SUMMARY

United Way of Treasure Valley • 2011 Community Assessment • www.unitedwaytv.org 88
Asset Poverty Rate – Percentage of Households Without Sufficient Net Worth to Subsist at the Poverty Level for Three Months in the Absence of Income (2009).
Source: CFED Assets & Opportunity Scorecard. Accessed at: http://scorecard.assetsandopportunity.org/2012/measure/asset-poverty-rate?state=id
Average Credit Card Debt (Quarter 3, 2011)
Source: CFED Assets & Opportunity Scorecard. Accessed at: http://scorecard.assetsandopportunity.org/2012/measure/average-credit-card-debt?state=id Unbanked and Underbanked Households (2009)
Source: FDIC National Survey of Unbanked and Underbanked Households. Washington, DC: Federal Deposit Insurance Corporation, 2009.
24.8%
27.1%
Idaho US
$10,100.00
$10,200.00
$10,300.00
$10,400.00
$10,500.00
$10,600.00
$10,700.00
$10,800.00
$10,900.00
Idaho US
Idaho
US
0.0%
5.0%
10.0%
15.0%
20.0%
25.0%
Unbanked Underbanked
Idaho
US
FINANCIAL INDEPENDENCE SELECTED CHARTS AND GRAPHS

United Way of Treasure Valley • 2011 Community Assessment • www.unitedwaytv.org 89
AFFORDABLE HOUSING
Since housing is a major expense for any family, the cost of housing and the ability to afford safe and reliable housing is
important to the overall well-being of all families. Thirty percent of household income is a widely accepted upper limit on
the cost of housing that is considered affordable for a given household. The percentage of households paying more than
that threshold for housing was slightly lower in Ada County than in Canyon County, both of which were lower than the
national percentage.
Having shelter—a safe and reliable place to sleep and live—is one of the most basic human needs. A large portion of
income for most families is used to rent or buy housing. Idaho’s annual Point in Time Count numbers those in the state
who sleep in shelters or in places not intended for sleep. This census indicates that the number of homeless people in
southwest Idaho was slightly more than 1,100; the number of homeless people, including those who stay in hotels, motels,
or temporarily with friends or family, is likely much higher. During the 2009-10 school year, approximately 4% of students
in Canyon County and nearly 2% of Ada County students met the latter definition of homelessness. Homelessness is
associated with a variety of negative academic effects in children and negative health impacts in adults. When asked the
cause of their homelessness, the top three reasons given by respondents to the Point in Time Count census takers were
unemployment, lack of affordable housing and mental disabilities.
This data for homelessness is based on a formula that estimates the number of people who are homeless at some point
during the year as a range of percentages of those living in poverty. It includes people who are temporarily staying with a
friend or relative as well as those in shelters or on the streets. It will not necessarily detect the number of low-income
people in programs to prevent them from becoming homeless.
Canyon County’s estimated percentage of population who are homeless is slightly higher than the national average, which
is slightly higher than the Ada County percentage. For all three areas, these percentages have increased between 2007 and
2009, although the increase was more dramatic in Ada and Canyon counties than at the national level.
BARRIERS TO AFFORDABLE HOUSING (Identified through literature review and surveys of community residents and UWTV stakeholders)
Cost of buying and maintaining a home
Inability to qualify for low-income housing
Lack of adequate income
FINANCIAL INDEPENDENCE ASSESSMENT SUMMARY

United Way of Treasure Valley • 2011 Community Assessment • www.unitedwaytv.org 90
Households Occupied by Owners and Renters in 2009
Source: Occupancy Characteristics,” U.S. Census American Community Survey 2009
Average Estimated Percent of the Population That is Homeless at Some Point During the Year
Source: Calculations based on American Community Survey, “T1. Population Estimates [11]
Point in Time Count: Number of Homeless Individuals in Southwest Idaho
(Regions are IFHA designated regions and do not conform to IDHW regions.) Source: State of Idaho, “Point in Time Count,” Idaho Housing and Finance Association, 2007,2008,2009,2010,2011
0%
10%
20%
30%
40%
50%
60%
70%
80%
Ada County Canyon County U.S.
Owned
Rented
2005 2006 2007 2008 2009
Ada County 0.7% 0.6% 0.6% 0.7% 1.0%
Canyon County 1.3% 1.1% 1.2% 1.2% 1.6%
U.S. 1.1% 1.1% 1.0% 1.1% 1.1%
0.0% 0.2% 0.4% 0.6% 0.8% 1.0% 1.2% 1.4% 1.6% 1.8%
2007 2008 2009 2010 2011
Region 7 (Ada County) 581 611 644 872 838
Region 3 (Southwest Idaho, minus Ada County)
385 203 215 297 271
0 100 200 300 400 500 600 700 800 900
1000
FINANCIAL INDEPENDENCE SELECTED CHARTS AND GRAPHS

United Way of Treasure Valley • 2011 Community Assessment • www.unitedwaytv.org 91
The following chart is a summary of data analyzed by UWTV which was collected by Boise State University and the Utah
Foundation in each of the component areas of Financial Independence. Levels of concern indicate ratings of the following:
a) how many people are faced with challenges related to the data, b) whether those challenges are getting better or worse,
and c) how severely the challenge impacts those individuals who experience it. Indicators highlighted in red show relatively
high cause for concern, indicators highlighted in yellow show moderate cause for concern, and indicators highlighted in
green show less cause for concern.
Level of Concern
JOBS WITH A LIVEABLE WAGE
Percent of families with income below the poverty line
Percent of families headed by single mothers that fell below the poverty line
Percent of families living in poverty by ethnicity
Percent of families living in poverty line by number of workers in the household
ACCESS TO WORK SUPPORT SERVICES
Percent of children (age 6-11) who spent time alone without supervision
Number of children receiving subsidized care through the ID Childcare Program
Educational attainment of Idaho childcare providers
Percent of population receiving food stamps
Unemployment rates
FINANCIAL LITERACY AND ASSET DEVELOPMENT
Asset poverty rates
Average credit card debt
Underbanked households
Unbanked households
AFFORDABLE HOUSING
Households occupied by owners and renters
Percent of population of homeless residents during the year
Number of homeless individuals
FINANCIAL INDEPENDENCE ASSESSMENT SUMMARY

United Way of Treasure Valley • 2011 Community Assessment • www.unitedwaytv.org 92
To help provide individuals and families with opportunities to succeed, UWTV has several “Pathway Projects” that provide
a way to self-sufficiency. As we continue to prioritize the data from the assessment, it is clear that the following projects
are key to helping address community need in the area of financial independence:
IDAs are matched savings accounts that enable low-to moderate-income individuals and families to build assets and
enter the financial mainstream. The program provides an asset-based approach to giving qualifying individuals and
families a hand up out of poverty to break the cycle.
The IDA program matches an individual’s savings, up to a maximum of $2,000 at a rate of two to one. The individual’s
savings plus the match (which can total up to $6,000) can then be used for a first-time home purchase, post secondary
education or transferred to a dependent’s education.
IDA Program Successes:
76 individuals successfully completed the IDA program 47 participants have purchased a home 25 participants utilized the program for post-secondary education 5 have successfully completed the program and used their IDA to start a small business More than 770 hours of financial education were completed More than 376 hours of homeownership courses and career counseling were provided $411,157 in total participant savings and matching funds were deposited 49 participants used all or part of their Earned Income Tax Credit (EITC) to make a lasting impact
IDA Program Funders:
FINANCIAL INDEPENDENCE – NEXT STEPS FOR UNITED WAY OF TREASURE VALLEY

United Way of Treasure Valley • 2011 Community Assessment • www.unitedwaytv.org 93
Economic abuse is an often overlooked dimension of domestic abuse that is one of the root causes of the cycle of violence.
In 2009, United Way convened leaders of local domestic violence agencies who serve this population to discuss a solution
to this need. Dr. Cynthia Sanders, PhD, MSW and Associate Professor in the School of Social Work at Boise State University,
served on the United Way Vision Council and is a subject expert on issues relating to domestic violence, women’s issues,
and social and economic development. The primary goal of this effort is to implement a standardized, research-based
financial education opportunity to address this critical need and to disrupt the cycle of abuse and poverty.
United Way and the collaborative raised the funds to cover program expenses through the first year and expect to serve
150-200 women in their first year of classes. Evaluations and baseline measurements have been collected by Dr. Sanders
and will be used for comparison with women who enroll and complete the financial education classes.
Through this pilot program, we have demonstrated how working together on a community issue can result in successful
systems change and disrupt the cycle of poverty through focused attention on a root cause of the issue.
TVEAP Program Partners:
FINANCIAL INDEPENDENCE – NEXT STEPS FOR UNITED WAY OF TREASURE VALLEY

United Way of Treasure Valley • 2011 Community Assessment • www.unitedwaytv.org 94
United Way of Treasure Valley's Free Tax Help Program, a partnership with the Volunteer Income Tax Assistance
Program, offers tax preparation services free of charge to thousands of low-income working individuals, families and
seniors. This assistance can be a critical step toward financial independence in claiming the Earned Income Tax Credit
(EITC).
The EITC is a refundable federal income tax credit for low-to moderate-
income working individuals and families. This innovative, successful anti-
poverty program lifts more children out of poverty than any other single
program or category of programs.
In 2011, the free tax preparation program helped more than 4,700 people
in the Treasure Valley, for a total tax return of $6.7 million. The average
refund was $1,440, enough to open an Individual Development Account (IDA) and start a family on the path to financial
independence.
This success would not be possible without our tremendous partners, Bank of America and Idaho State Treasurer Ron
Crane. Their support facilitated a marketing and outreach effort that got the word out about the program and the
opportunity of the EITC. Our biggest thanks to them for helping us break the cycle of need through innovation!
Did you know…
The IRS estimates that $11 million in eligible EITC dollars are left unclaimed in the Treasure Valley annually.
EITC Program Partners:
FINANCIAL INDEPENDENCE – NEXT STEPS FOR UNITED WAY OF TREASURE VALLEY
FINANCIAL INDEPENDENCE – NEXT STEPS FOR UNITED WAY OF TREASURE VALLEY

United Way of Treasure Valley • 2011 Community Assessment • www.unitedwaytv.org 95
In 2011, UWTV invested more than $400,000 in programs focused on creating financial stability for individuals and
families through our partners listed below.

United Way of Treasure Valley • 2011 Community Assessment • www.unitedwaytv.org 96
“What are people’s most basic needs?”
FINDINGS

United Way of Treasure Valley • 2011 Community Assessment • www.unitedwaytv.org 97
Psychologist Abraham Maslow theorized that every human being has a hierarchy of needs, with some basic physiological
needs that must be met prior to aspiring to the more complex goals of living in a community and being a productive
member of that society. The basic needs of food, water, air and safety (including shelter and health) are recognized as
minimum requirements. As a community, we aspire for full lives for all people and families. To that end, we must ensure
basic needs are met while furthering the goal of financial independence for individuals and families.
This report examines the measures of basic needs in our communities, which provide a baseline for measuring the impact
of programs targeting these areas. The context for many of the current measures is the recent recession. As the economy
heals and jobs become available, however, efforts to enable financial independence will become increasingly important.
The indicators describe communities struggling to meet the basic needs of people.
This report describes a range of issues impacting the basic needs of Treasure Valley residents.
Where possible, we have used this data to examine trends across time or compare local, state and national statistics. We
have chosen indicators that are relevant to the issues of interest to United Way and its partners, statistics that were
relatively easy to find and that are collected on a fairly routine basis from reliable sources, and indicators that should be
relevant for partner agencies to incorporate into outcome measures in their program work. In addition to the indicator
data, we conducted surveys, focus groups and interviews to provide an expanded picture of health and wellness disparities
and needs in our communities.
BASIC NEEDS ASSESSMENT SUMMARY

United Way of Treasure Valley • 2011 Community Assessment • www.unitedwaytv.org 98
The following chart is a summary of data collected and analyzed by Boise State University and the Utah Foundation in each
of the component areas of Basic Needs. The colors represent composite ratings from multiple data sources related to the
following: a) trend – whether those challenges are getting better or worse. Areas highlighted in red show relatively high
cause for concern, areas highlighted in yellow show moderate cause for concern, and areas highlighted in green show less
cause for concern.
Challenge is Getting
Better or Worse (Trend)
Key Observations
Access to food, specifically healthy foods
The number of residents receiving food stamps has increased by 7.33% in Ada County and 12.69% in Canyon County since 2005.
Access to basic medical and dental services
In 2010, Idaho Federally Supported Health Centers saw a total of 121,329 patients, of which 6,780 were homeless.
Emergency housing
Most residents who reside in homeless shelters are there because of unemployment, followed by the inability to find affordable housing.
BASIC NEEDS ASSESSMENT SUMMARY

United Way of Treasure Valley • 2011 Community Assessment • www.unitedwaytv.org 99
ACCESS TO HEALTHY FOOD
According to the USDA definition of food security, a household is food insecure if, at some point during the preceding year,
they did not have enough food or were afraid they would not have enough food for everyone in the household, or if they
were forced to sacrifice the quality or variety of food to ensure that everyone had enough to eat. Based on the comments
of affected population members, access to high-quality, healthy food was a more widespread concern than absolute
hunger. Children living in food-insecure households tend to experience more health problems and are more likely to
repeat a grade than children in food secure households. The large portion of food-insecure households with at least one
employed adult indicates that having a job is no guarantee of food security. Further, households that receive government
food assistance are more likely to be food-insecure than similar households that do not, indicating current food assistance
programs are not sufficient to address the problem.
According to the Idaho Food Bank’s data, the rates of food insecurity in both Ada and Canyon county are higher than the
Idaho and U.S. rates. The methods of data collection are different for this study than for the National Food Security Survey,
so results cannot be directly compared.
The population at risk of food insecurity is small once the household income exceeds 185% of the poverty line. However,
the absolute numbers of families with income below 185% of the poverty line are a larger proportion of the overall
population. The Idaho Food Bank analysis show that, in Ada County, more than half of food-insecure households are above
the 185% Federal Poverty Line.
Families and individuals are eligible to receive food stamps through the Supplemental Nutrition Assistance Program (SNAP)
if their gross income is no more than 130% of the poverty threshold, or if their net income is below the poverty threshold.
Individuals must apply to receive food stamps and have their eligibility recertified regularly to continue receiving food
stamps. Only about half of those who are eligible for food stamps apply to receive them. Many individuals who receive
food stamps remain food insecure, and food insecurity also is present among households with income above the limits set
for food stamp eligibility. The portion of the population receiving food stamps should not be interpreted as a measure of
current or resolved food insecurity.
The percentage of households receiving food stamps has risen dramatically between 2007 and 2011 for all geographic
areas considered. In most years, the percentage of population receiving food stamps in Canyon County was higher than
the national rate, while the percentage in Ada County was lower than the national rate.
BASIC NEEDS ASSESSMENT SUMMARY

United Way of Treasure Valley • 2011 Community Assessment • www.unitedwaytv.org 100
Students from families with incomes lower than 130% of the poverty line are eligible for free school lunches, while those
from families making between 130% and 185% of the poverty line are eligible for lunch at a reduced price. Students from
families receiving benefits from the SNAP, Temporary Assistance for Needy Families (TANF) or the Food Distribution
Program on Indian reservations also are eligible. Applications for the free- and reduced-lunch program are sent home with
all students at the beginning of each year and are accepted throughout the year. The number of participating children
provides an estimate of how many children are from low-income families.
The percentage of students receiving free or reduced price lunch has increased over the past five years in school districts of
both Ada and Canyon counties. In Ada County, more than one-third of children receive free or reduced lunch, while about
two-thirds of Canyon County students receive free or reduced-price meals.
Respondents to the affected population survey were presented with a list of basic services and asked to select and rank the
three they considered most important. “Emergency food assistance” was rated most important by more respondents than
any other option. It also was most frequently selected overall. Stakeholder Survey respondents were asked to rate the
importance of several services to address the basic needs of community members. Of the 12 items, “emergency food
assistance” was rated as very important or somewhat important by a larger percentage of respondents (94.9%) than any
other item, except emergency shelter (96.0%).
Participants in the affected population focus groups mentioned difficulty affording or accessing healthy food much more
often than they mentioned not having enough food, or fearing that they would not have enough food. This pattern held
true even in focus groups and interviews conducted with homeless people. The only exception was a focus group
conducted with clients of the Gem County Senior Center, who mentioned that feeding programs sometimes provided their
only meal of the day.
The stakeholder focus group members stated that access to food was a basic need the community should provide. They
also believe that resources to teach people how to eat a healthy diet are important.
BARRIERS TO ACCESSING FOOD (INCLUDING HEALTHY FOOD) (Identified through literature review and surveys of community residents and UWTV stakeholders)
Stigma associated with receiving services
Lack of knowledge of available programs
Lack of transportation
Programs not distributing healthy food
BASIC NEEDS ASSESSMENT SUMMARY

United Way of Treasure Valley • 2011 Community Assessment • www.unitedwaytv.org 101
Indicators of Food Security
Percentage of Households with Low and Very Low Food Security
(Data is collected in the National Food Security Survey, a supplement to the U.S. Census Current Population Survey). Source Mark Nord, Alisha Coleman-Jensen, Margaret Andrews, and Steven Carlson, Household Food Security in the United States, 2009, United States Department of Agriculture, 2010, http://www.ers.usda.gov/Publications/ERR108/ERR108.pdf.
1996-1998 2004-2006 2007-2009
Very Low Food Security 3% 4% 5%
Low Food Security 8% 9% 7%
0%
2%
4%
6%
8%
10%
12%
14%
16%
Idaho
1996-1998 2004-2006 2007-2009
Very Low Food Security 4% 4% 5%
Low Food Security 8% 7% 8%
0%
2%
4%
6%
8%
10%
12%
14%
16%
U.S.
BASIC NEEDS SELECTED CHARTS AND GRAPHS

United Way of Treasure Valley • 2011 Community Assessment • www.unitedwaytv.org 102
Percentage of Households with Low or Very Low Food Security by County (2011)
Source: Mapping the Food Gap,” Idaho Food Bank, 2011, http://www.idahofoodbank.org/?page=map-the-meal-gap.
Percentage of U.S. Households with Low or Very Low Food Security by Income as Measured as a Percent of the Poverty Threshold (2011)
Source: Mapping the Food Gap,” Idaho Food Bank, 2011, http://www.idahofoodbank.org/?page=map-the-meal-gap.
Ada County Canyon County
Percentage Food Insecure 15% 18%
0%
2%
4%
6%
8%
10%
12%
14%
16%
18%
20%
Less than 100% Less than 130% Less than 185% 185% and Over Income Unknown
Low Food Security 24% 23% 20% 5% 6%
Very Low Food Security 19% 17% 14% 3% 3%
0%
5%
10%
15%
20%
25%
30%
35%
40%
45%
50%
BASIC NEEDS SELECTED CHARTS AND GRAPHS

United Way of Treasure Valley • 2011 Community Assessment • www.unitedwaytv.org 103
Ada County Households with Low or Very Low Food Security by Income (2011)
Source: Mapping the Food Gap,” Idaho Food Bank, 2011, http://www.idahofoodbank.org/?page=map-the-meal-gap.
Canyon County Households with Low or Very Low Food Security by Income (2011)
Source: Mapping the Food Gap,” Idaho Food Bank, 2011, http://www.idahofoodbank.org/?page=map-the-meal-gap.
33%
15%
52%
Less than 130% of the Poverty Line
Between 130-185% of the Poverty Line
Above 185% of the Poverty Line
49%
24%
27%
Less than 130% of the Poverty Line
Between 130-185% of the Poverty Line
Above 185% of the Poverty Line
BASIC NEEDS SELECTED CHARTS AND GRAPHS

United Way of Treasure Valley • 2011 Community Assessment • www.unitedwaytv.org 104
Idaho Households with Low or Very Low Food Security by Income (2011)
Source: Mark Nord, Alisha Coleman-Jensen, Margaret Andrews, and Steven Carlson, Household Food Security in the United States, 2009, United States Department of Agriculture, 2010, http://www.ers.usda.gov/Publications/ERR108/ERR108.pdf.
Percentage of U.S. Households with Low or Very Low Food Security by Household Composition (2009)
Source: Mark Nord, Alisha Coleman-Jensen, Margaret Andrews, and Steven Carlson, Household Food Security in the United States, 2009, United States Department of Agriculture, 2010, http://www.ers.usda.gov/Publications/ERR108/ERR108.pdf.
44%
19%
37%
Less than 130% of the Poverty Line
Between 130-185% of the Poverty Line
Above 185% of the Poverty Line
All
With Children
< 18 Years
With Children < 6 Years
Married-Couple
Families
Female with
Children and No Spouse
Male with
Children and No Spouse
Others with Child
With No Children
< 18 Years
More than One Adult, No Children
Women Living Alone
Men Living Alone
With Elderly
Elderly Living Alone
Food Insecure 15% 21% 23% 15% 37% 28% 32% 11% 9% 15% 15% 8% 8%
0%
5%
10%
15%
20%
25%
30%
35%
40%
BASIC NEEDS SELECTED CHARTS AND GRAPHS

United Way of Treasure Valley • 2011 Community Assessment • www.unitedwaytv.org 105
Percentage of Population Participating in the Food Stamp or SNAP Program in April of Each Year
Source: Food Stamp Participants by County (Apr. 2011)” (provided via e-mail by Shane P. Leach ([email protected]) of the Idaho Department of Health and Welfare, Division of Welfare, Idaho, 2011),
Percentage of Students Receiving Free or Reduced Price Lunch by County
Source: Food Stamp Participants by County (Apr. 2011)” (provided via e-mail by Shane P. Leach ([email protected]) of the Idaho Department of Health and Welfare, Division of Welfare, Idaho, 2011),
2005 2006 2007 2008 2009 2010 2011
Ada County 5% 5% 4% 5% 7% 10% 12.33%
Canyon County 10% 10% 9% 11% 15% 20% 22.69%
U.S. 9% 9% 9% 9% 11% 13%
0%
5%
10%
15%
20%
25% U.S. data for 2011 not yet available.
2006-2007 2007-2008 2008-2009 2009-2001 2010-2011
School Districts Mainly in Ada County 27% 28% 31% 34% 36%
School Districts Mainly in Canyon County
56% 55% 62% 66% 67%
0%
10%
20%
30%
40%
50%
60%
70%
BASIC NEEDS SELECTED CHARTS AND GRAPHS

United Way of Treasure Valley • 2011 Community Assessment • www.unitedwaytv.org 106
Percentage of Students Receiving Free or Reduced Lunch by District
Source: Free & Reduced by District,” Idaho State Department of Education, 2011, http://www.sde.idaho.gov/site/cnp/statisticsFinance/.
2006-2007 2007-2008 2008-2009 2009-2001 2010-2011
Wilder District 91% 94% 93% 94% 93%
Caldwell District 72% 60% 79% 79% 74%
Parma District 56% 61% 69% 69% 73%
Notus District 61% 59% 71% 69% 70%
Vallivue District 54% 57% 60% 68% 68%
Nampa District 52% 53% 58% 63% 64%
Middleton District 40% 40% 44% 51% 50%
Boise District 36% 36% 38% 42% 43%
Kuna District 33% 33% 37% 42% 43%
Meridian District 20% 22% 25% 27% 30%
0%
10%
20%
30%
40%
50%
60%
70%
80%
90%
100%
BASIC NEEDS SELECTED CHARTS AND GRAPHS

United Way of Treasure Valley • 2011 Community Assessment • www.unitedwaytv.org 107
ACCESS TO BASIC MEDICAL AND DENTAL SERVICES
Common concerns about access to health care arose across focus groups. These concerns included transportation, health
insurance coverage, case management, and cost.
The lack of convenient and timely public transportation service to get to appointments, or get children to appointments,
was mentioned very frequently by low-income people that do not have a car or access to private transportation. The need
for a personal automobile, or access to subsidized on-demand transport (e.g. a taxi service), was also mentioned in the
context of transportation to medical appointments.
Lack of health insurance coverage by employers, lack of access to reasonably priced insurance, and high out-of-pocket
costs were major concerns across all groups. Seniors who were covered by Medicare were less concerned. Those who had
very limited income but did not qualify for Medicare or Medicaid were particularly frustrated.
Many of the participants were frustrated by the lack of case management and fragmented medical service they receive
from their medical provider. Many mentioned the need for referral services when they could not be treated by their usual
provider. Those who use the low/no-cost clinics were concerned about the lack in coordination of care and the potential
health harm that might result. In conjunction with the need for case management, participants frequently indicated a
need for access to, or better awareness of, dental care/services available for their families, mental health care, substance
abuse/addiction services, and follow-up care after a medical visit.
Cost of basic care and out of pocket costs concerned almost all participants. Some participants with insurance were still
concerned about getting affordable care. Many low-income people said they may have access to care, but even when
subsidized, the cost was prohibitive. Several of these low-income participants indicated that they still need to use the
hospital emergency room, even if low/no-cost clinics were available because of the cost.
BARRIERS TO ACCESS TO BASIC MEDICAL AND DENTAL SERVICES (Identified through literature review and surveys of community residents and UWTV stakeholders)
Cost of services
Lack of health insurance
Lack of availability of necessary services
Lack of transportation
Long waiting lists
Individual inability and unwillingness to follow through on a plan of care
BASIC NEEDS ASSESSMENT SUMMARY

United Way of Treasure Valley • 2011 Community Assessment • www.unitedwaytv.org 108
Percent of Idaho Residents Served by Federally Supported Health Centers, 2010
Source: National Association of Community Health Centers (NACHC). Based on 2010 Uniform Data System, Bureau of Primary Health Care, HRSA, HHS
Population Living in Provider Shortage Areas
Source: Idaho Department of Health and Welfare. (2008). Idaho Oral Health State Plan 2008- 2013. Retrieved November, 23, 2008 at: http://www.healthandwelfare.idaho.gov/DesktopModules/DocumentsSortable/DocumentsSrtView.aspx?tabID=0&ItemID=10801&MId=11556
At or below
100% of Poverty
Under 200% of Poverty
Uninsured
Medicaid Medicare Hispanic/
Latino African
American White Rural
Health Center Population 66% 95% 53% 20% 8% 31% 1% 94% 91%
State Population 19% 42% 17% 13% 12% 11% 0% 85% 39%
US Population 21% 40% 16% 16% 12% 16% 13% 64% 16%
0%
10%
20%
30%
40%
50%
60%
70%
80%
90%
100%
0%
10%
20%
30%
40%
50%
60%
70%
Idaho U.S.
Population Living in Primary Care Health Professions Shortage Areas
17% 12%
Population Living in Mental Health Profession Shortage Areas
62% 19%
Population Living in Dental Health Provider Shortage Areas
17% 10%
BASIC NEEDS SELECTED CHARTS AND GRAPHS

United Way of Treasure Valley • 2011 Community Assessment • www.unitedwaytv.org 109
EMERGENCY HOUSING
Respondents to the affected population survey were given a list of nine basic services and were asked to select and
rank the three services that help families the most. Emergency shelter received the third-most rankings overall, as
well as the third-most rankings as most important. However, it received only a little more than half as many rankings
as the top two basic needs, emergency food assistance and basic health care services.
Emergency shelter was rated as very important or somewhat important by a larger percentage of Stakeholder Survey
respondents than any of the other options. Emergency shelter was just one of four of the options for meeting basic
needs to be ranked somewhat or very important by 90% or more of the respondents.
While most of the focus groups mentioned housing as a basic need, few said much else about the subject. Some of
the affected population focus groups noted that the Section 8 voucher program was unable to meet the high demand
for housing assistance. Several attendees of the affected population focus groups also reported that getting on the
waiting list for Section 8 housing was “closed” to new applicants. A few participants noted that the Charitable
Assistance to Community’s Homeless (CATCH) program run by the City of Boise was a program that worked well and
should be expanded. Some remarked that they knew friends and relatives who would benefit more from the
program than using the shelters in the area. Notably, participants in the refugee focus group commented on the
difficulty of finding affordable housing large enough to accommodate large families on the funds they are given.
BARRIERS TO EMERGENCY HOUSING (Identified through literature review and surveys of community residents and UWTV stakeholders)
Lack of availability of space
Conflicting service hours between shelters and other essential service providers
Lack of transportation
Lack of awareness about resources
BASIC NEEDS ASSESSMENT SUMMARY

United Way of Treasure Valley • 2011 Community Assessment • www.unitedwaytv.org 110
Point in Time Count: Number of Unsheltered Homeless in Southwest Idaho
(Regions are IFHA designated regions and do not conform to IDHW regions. The Point in Time Count uses its own set of districts, separate from health districts.) Source: State of Idaho, “Point in Time Count,” Idaho Housing and Finance Association, 2007,2008,2009,2010,2011
Number of Homeless Individuals by Disability Status (2011)
(Regions are IFHA designated regions and do not conform to IDHW regions.) Source: State of Idaho, “Point in Time Count,” Idaho Housing and Finance Association, 2007,2008,2009,2010,2011
2007 2008 2009 2010 2011
Region 7 (Ada County) 109 58 142 125 97
Region 3 (Southwest Idaho minus Ada County)
237 9 11 61 36
0
50
100
150
200
250
Substance Abuse Serious Mental
Illness Developmental
Disability Serious Physical Illness/Disability
Yes, But I Prefer Not To Disclose
Region 7 (Ada County) 191 148 20 82 61
Region 3 (Southwest Idaho minus Ada County)
33 16 6 17 5
0
50
100
150
200
250
BASIC NEEDS SELECTED CHARTS AND GRAPHS

United Way of Treasure Valley • 2011 Community Assessment • www.unitedwaytv.org 111
Self-Reported Causes of Homelessness of Homeless Individuals Surveyed in IFHA Regions 7 and 3 (2011)
Source: State of Idaho, “Point in Time Count,” Idaho Housing and Finance Association, 2011, http://www.healthandwelfare.idaho.gov/LinkClick.aspx?fileticket=pQDRl8C-Rxo%3D&tabid=258&mid=1854.
Unemployment Unable to Find
Affordable Housing
Mental Disabilities
Lack of Education/Job
Skills
Substance/Alcohol Abuse
Bad Credit History
Region 7 58 19 14 15 17 12
Region 3 16 8 5 4 2 5
0
10
20
30
40
50
60
70
Evicted/ Unable to Pay Rent
Physical Disabilities
Medical Costs/ Personal Illness
Divorce/ Family Breakup
Other Felony
Convictions
Region 7 10 10 5 8 9 7
Region 3 5 4 7 2 1 2
0
2
4
6
8
10
12
Domestic Violence
Voluntary Homelessness
Discharged from Jail ot Institution
Recently Moved to the
Area
Housing Uninhabitable
Aged Out of Foster Care
Don't Know/ Refused
Region 7 6 6 4 3 1 0 1
Region 3 1 0 1 1 2 1 0
0 1 2 3 4 5 6 7
BASIC NEEDS SELECTED CHARTS AND GRAPHS

United Way of Treasure Valley • 2011 Community Assessment • www.unitedwaytv.org 112
The following chart is a summary of data analyzed by UWTV which was collected by Boise State University and the Utah
Foundation in each of the component areas of Basic Needs. Levels of concern indicate ratings of the following: a) how
many people are faced with challenges related to the data, b) whether those challenges are getting better or worse, and c)
how severely the challenge impacts those individuals who experience it. Indicators highlighted in red show relatively high
cause for concern, indicators highlighted in yellow show moderate cause for concern, and indicators highlighted in green
show less cause for concern.
Level of Concern
ACCESS TO HEALTHY FOOD
Percent of households with low food insecurity
Households with Low or Very Low Food Security by Income
Percentage of the Population Participating in the Food Stamp or SNAP Program
Percent of students receiving free and reduced lunch
Availability of healthy food in the community
ACCESS BASIC MEDICAL AND DENTAL SERVICES Percent of Idaho Residents Served by Federally-Supported Health Center
Population living in provider shortage area
EMERGENCY HOUSING
Point in Time Count: Number of Unsheltered Homeless in Southwest Idaho
Number of homeless individuals by disability
Self reported causes of homelessness
BASIC NEEDS SECONDARY INDICATORS

United Way of Treasure Valley • 2011 Community Assessment • www.unitedwaytv.org 113
Stakeholder Survey respondents were asked to rate the importance of several services to address the basic needs of
community members. Of the 12 items, “emergency food assistance” was rated as very important or somewhat
important by a larger percentage of respondents (94.9%) than any other item, except emergency shelter (96.0%).
Stakeholder Survey: Basic Needs Item
Ver
y Im
po
rtan
t
Som
ew
hat
Imp
ort
ant
Ne
ith
er Im
po
rtan
t n
or
Un
imp
ort
ant
Som
ew
hat
Un
imp
ort
ant
No
t at
all
Imp
ort
ant
Do
n't
Kn
ow
No
Op
inio
n
Nu
mb
er o
f R
esp
on
den
ts
Pe
rcen
tage
Rat
ed V
ery
Imp
ort
ant
Pe
rcen
tage
Rat
ed V
ery
Imp
ort
ant
or
Som
ewh
at
Imp
ort
ant
Emergency shelter
449 147 14 6 1 4 0 621 72.3% 96.0%
Emergency food assistance
463 127 22 5 2 3 0 622 74.4% 94.9%
Crisis child care services 381 197 24 7 2 6 4 621 61.4% 93.1% Access to safety
net services 340 222 28 8 2 13 5 618 55.0% 90.9%
Information about safety net services
305 236 48 10 5 13 3 620 49.2% 87.3%
Transportation Assistance
208 319 64 14 4 8 3 620 33.6% 85.0%
Legal assistance to protect safety
238 286 67 13 4 9 4 621 38.3% 84.4%
BASIC NEEDS – COMMUNITY FEEDBACK

United Way of Treasure Valley • 2011 Community Assessment • www.unitedwaytv.org 114
Over the next year, United Way will continue to convene community partners to discuss innovative ways to address the
identified top basic needs. Through our unique position, we are able to bring collaborative partners and resources
together to discuss sustainable solutions to these most pressing needs.
United Way supports partners that are focused on providing access to healthy food to individuals and families. In addition
to our partners, we will be holding roundtable discussions with the faith-based community to address this identified need.
There are a number of our health partners that provide access to basic medical and dental services. UWTV supports these
partners through annual investments for their programs.
Access to emergency housing is a critical need that is addressed by our partners below.
BASIC NEEDS – NEXT STEPS FOR UNITED WAY OF TREASURE VALLEY