Embed Size (px)
Citation preview


Conditional Waiver for Rice andRice Pesticides Program
FINAL
December 2011
2011 Annual Monitoring ReportSacramento River Drainage Basin
Prepared for
California Rice Commission
Prepared by
WBG121311182744SAC

WBG121311182744SAC/429592/113630002 iii
Contents
Section Page
Acronyms and Abbreviations .........................................................................................................ix
1. Introduction..................................................................................................................................1-1Program Administration ....................................................................................................1-2California Rice......................................................................................................................1-2Rice Farming’s Influence on Water Quality.....................................................................1-3History of Rice Water Quality Efforts...............................................................................1-3
RPP ...........................................................................................................................1-3Conditional Waiver of Waste Discharge Requirements for Rice.....................1-7
AMR Requirements.............................................................................................................1-7
2. Growing Season, Hydrology, and Applied Materials..........................................................2-1Rice Farming in the Sacramento Valley ...........................................................................2-1Hydrology ............................................................................................................................2-2Applied Materials................................................................................................................2-5
Pesticide Use ...........................................................................................................2-5Nutrient Use............................................................................................................2-5
3. Management Practices ................................................................................................................3-1Pesticide Use Calendar .......................................................................................................3-1Role of Management Practices in Attaining Water Quality Protection .......................3-5
Water Holds ............................................................................................................3-5Actions Taken to Address Identified Water Quality Impacts..........................3-5
4. Monitoring and Reporting Requirements ..............................................................................4-1Monitoring Purpose and Objectives .................................................................................4-1
CWFR .......................................................................................................................4-1RPP ...........................................................................................................................4-2
Overview of Requirements ................................................................................................4-2CWFR .......................................................................................................................4-2Core Monitoring .....................................................................................................4-3Assessment Monitoring.........................................................................................4-4Special Project Monitoring ....................................................................................4-5RPP ...........................................................................................................................4-5
Monitoring Sites...................................................................................................................4-5CWFR Sites ..............................................................................................................4-6RPP Sites ..................................................................................................................4-6CBD1 ........................................................................................................................4-6CBD5 ........................................................................................................................4-9BS1 ............................................................................................................................4-9SSB ..........................................................................................................................4-10F...............................................................................................................................4-10

CONTENTS, CONTINUED
iv WBG121311182744SAC/429592/113630002
G ............................................................................................................................. 4-11H............................................................................................................................. 4-11SR1.......................................................................................................................... 4-12
Schedule and Constituents .............................................................................................. 4-12CWFR..................................................................................................................... 4-13RPP......................................................................................................................... 4-132011 Monitoring Calendar .................................................................................. 4-14
Administration and Execution........................................................................................ 4-14Sampling Procedures........................................................................................................ 4-14
Field Measurements ............................................................................................ 4-14Grab Samples........................................................................................................ 4-15Sample Custody and Documentation ............................................................... 4-16Sample Delivery and Analysis ........................................................................... 4-16
5. 2011 Monitoring .......................................................................................................................... 5-1CWFR Monitoring............................................................................................................... 5-1
Sampling Schedule ................................................................................................ 5-1Field Parameter Results ........................................................................................ 5-1Lab Parameter Results......................................................................................... 5-152011 Flow Data ..................................................................................................... 5-19Management Plans............................................................................................... 5-20
RPP Monitoring................................................................................................................. 5-21RPP Performance Goals ...................................................................................... 5-22Water Holds.......................................................................................................... 5-22Monitored Pesticides ........................................................................................... 5-23Sampling Schedule .............................................................................................. 5-23Sample Collection, Delivery, and Analysis ...................................................... 5-23Results.................................................................................................................... 5-24
6. Review of Quality Assurance/Quality Control ..................................................................... 6-1Internal QC........................................................................................................................... 6-1
Field QA/QC Samples .......................................................................................... 6-2Laboratory QA/QC Samples ............................................................................... 6-2
Quality Assurance Objectives ........................................................................................... 6-3Precision .................................................................................................................. 6-3Accuracy.................................................................................................................. 6-4Representativeness ................................................................................................ 6-4Comparability......................................................................................................... 6-4Completeness.......................................................................................................... 6-5
CWFR QA/QC Sample Results and Analysis ................................................................ 6-5Field QA/QC Samples .......................................................................................... 6-6Laboratory QA/QC Samples ............................................................................... 6-8Analysis of Precision ........................................................................................... 6-12Analysis of Accuracy........................................................................................... 6-12Analysis Summary............................................................................................... 6-13
RPP QA/QC Sample Results and Analysis .................................................................. 6-13Field QA/QC Samples ........................................................................................ 6-14Laboratory QA/QC Samples ............................................................................. 6-15

CONTENTS, CONTINUED
WBG121311182744SAC/429592/113630002 v
Analysis of Precision............................................................................................6-18Analysis of Accuracy ...........................................................................................6-18Analysis Summary ...............................................................................................6-19
Chains of Custody.............................................................................................................6-19
7. Summary and Recommendations ............................................................................................7-1CWFR ....................................................................................................................................7-1
Assessment of the 2011 CWFR Program.............................................................7-2CWFR Recommendations for 2012 ......................................................................7-3
RPP ........................................................................................................................................7-4Assessment of the 2011 RPP Program .................................................................7-4RPP Recommendations for 2012 ..........................................................................7-5
8. References .....................................................................................................................................8-1
Appendixes
A Sampling Site Maps
B CWFR AppendixesB-1 CWFR Field Data Sheets and Chain of Custody FormsB-2 CLS Lab ResultsB-3 Propanil Sampling Lab Results and Field SheetsB-4 Algae Management PlanB-5 Propanil Management Plan
C RPP AppendixesC-1 RPP Field Data Sheets and Chain of Custody FormsC-2 Valent Lab ResultsC-3 CLS Lab Results
D Regional Board OrdersD-1 Current CWFR MRP Order (MRP Order R5-2010-0805)D-2 Current RPP Order (Resolution No. R5-2010-9001)
Tables
1-1 Location of Required AMR Information in this Report
2-1 Herbicides: Acres Treated, Sacramento Valley, 20112-2 Herbicides: Pounds Applied, Sacramento Valley, 20112-3 Insecticides: Acres Treated, Sacramento Valley, 20112-4 Insecticides: Pounds Applied, Sacramento Valley, 20112-5 Fungicides: Acres Treated, Sacramento Valley, 20112-6 Fungicides: Pounds Applied, Sacramento Valley, 20112-7 Acres Treated with Molinate and Thiobencarb, 2007 through 20112-8 Pounds of Molinate and Thiobencarb Applied, 2007 through 2011
CONTENTS, CONTINUED
vi WBG121311182744SAC/429592/113630002
2-9 Range of Fertilizer Components Applied to Rice
3-1 Timing of Specific Rice Herbicide Applications3-2 Examples of the Timing of Herbicide Tank Mix Combinations as Provided by
Dr. Albert Fischer, UC Davis3-3 Timing of Specific Rice Insecticide Applications3-4 Timing of Sequential Rice Herbicide Applications3-5 Water Hold Requirements in Days for Thiobencarb3-6 Hold Times for Insecticides, Fungicides, and Herbicides Not Covered by RPP3-7 Thiobencarb Water Seepage Inspections in 20113-8 Thiobencarb Water Hold, Application, and Mix/Load Inspections in 2011
4-1 Assessment and Core Monitoring Cycle4-2 CWFR and RPP Monitoring Sites4-3 CWFR Monitoring Requirements, 20114-4 RPP Monitoring and Reporting Requirements, 20114-5 Analytical Laboratories and Methods, 2011
5-1 2011 CWFR Sampling Calendar5-2 Field Temperature Measurements, 20115-3 Dissolved Oxygen Field Measurements, 20115-4 pH Field Measurements, 20115-5 Electrical Conductivity Field Measurements, 20115-6 Turbidity Field Results, 20115-7 TDS Lab Results, 20115-8 TOC Lab Results, 20115-9 2011 Copper and Hardness Results5-10 Hardness -adjusted CTR Copper Water Quality Criteria (1-hour and 4-day
maximum)5-11 Flow Results5-12 2011 Propanil Monitoring Results5-13 Basin Plan Performance Goals for the Five RPP Pesticides5-14 RPP Sampling Schedule, 20115-15 Summary of Detections (RPP and City Monitoring), 20115-16 Thiobencarb Monitoring Results, RPP 20115-17 Cities of Sacramento and West Sacramento Thiobencarb Results, 2011
6-1 CWFR Field QA/QC Samples, 20116-2 2011 CWFR Field Blank and Field Duplicate Results6-3 2011 CWFR Method Blank Results6-4 2011 Laboratory MS/MSD Samples6-5 2011 CWFR Lab Control Spikes (LCS)6-6 2011 CWFR Surrogate Standard Sample Results6-7 RPP Field QA/QC Samples, 20116-8 2011 RPP Comparison of Rinse Blank Samples to Primary Samples6-9 2011 RPP Field Duplicate Results6-10 Matrix Spike Sample Results, RPP 2011

CONTENTS, CONTINUED
WBG121311182744SAC/429592/113630002 vii
6-11 Method Blank Results (CLS), RPP 20116-12 2011 RPP Laboratory LCS/LCSD Samples (Thiobencarb)6-13 Surrogate Standard Results, RPP 2011
Figures
1-1 Sacramento Valley Rice Acres, 2011
2-1 Key Events in a Typical Rice Year2-2 2011 Flow and Precipitation Data2-3 2011 Daily Maximum and Minimum Air Temperatures
3-1 Rice Growth Stages
4-1 2011 CWFR Assessment and Core Monitoring Sites and RPP Monitoring Sites
5-1 Field Temperature Measurements, 20115-2 Dissolved Oxygen Field Measurements, 20115-3 Oxygen Solubility as a Function of Temperature5-4 pH Field Measurements, 20115-5 Electrical Conductivity Field Measurements, 20115-6 Turbidity Field Measurements, 20115-7 TDS Results, 20115-8 TOC Results, 20115-9 Thiobencarb Results, RPP, 2011
Photos
1 CBD1: Colusa Basin Drain #12 CBD5: Colusa Basin Drain #53 BS1: Butte Slough #14 SSB: Sacramento Slough Bridge5 F: Lurline Creek6 G: Cherokee Canal7 H: Obanion Outfall8 SR1: Sacramento River Village Marina


WBG121311182744SAC/429592/113630002 ix
Acronyms and Abbreviations
2008 Coalition MRP CVRWQCB Order No. R5-2008-0005
µg/L micrograms per liter
µmhos/cm micromhos per centimeter
µS/cm microSiemens per centimeter
ACP agricultural civil penalty
AMP Algae Management Plan
AMR Annual Monitoring Report
Basin Plan Water Quality Control Plan for the Sacramento and San Joaquin RiverBasins
BMP Best Management Practice
CaCO3 calcium carbonate
CAC County Agricultural Commissioner
CDEC California Data Exchange Center
CDPH California Department of Public Health
cfs cubic feet per second
CLS California Laboratory Services
COC chain-of-custody
CRC California Rice Commission
CTR California Toxics Rule
CVRWQCB Central Valley Regional Water Quality Control Board
CWA Clean Water Act
CWFR Conditional Waiver for Rice
DFG California Department of Fish and Game
DO dissolved oxygen
DPR California Department of Pesticide Regulation
DWR California Department of Water Resources
DWR PP DWR pumping plant

ACRONYMS AND ABBREVIATIONS
x WBG121311182744SAC/429592/113630002
EC electrical conductivity
EPA U.S. Environmental Protection Agency
gpm gallons per minute
Irrigated Lands CVRWQCB Resolution R5-2003-0105, Conditional Waiver of WasteConditional Waiver Discharge Requirements for Discharges from Irrigated Lands within the
Central Valley
Irrigated Lands CVRWQCB Conditional Waiver of Waste Discharge RequirementsRegulatory Program for Discharges from Irrigated Lands
K potassium
LCS laboratory control spike
LCSD laboratory control spike duplicate
LT-ILRP Long-Term Irrigated Lands Regulatory Program
MAI McCampbell Analytical, Inc.
MCL maximum contaminant level
MDL method detection limit
mg/L milligrams per liter
MRL method reporting limit
MRP Monitoring and Reporting Program
MRP Order Monitoring and Reporting Program Order No. R5-2003-0826
MS/MSD matrix spike and matrix spike duplicate
N nitrogen
NASS National Agricultural Statistics Service
ND non-detect
NOA Notice of Applicability
NOI Notice of Intent
NPS nonpoint source
NTU nephelometric turbidity unit
P phosphorus
PCA pest control advisor
ppb parts per billion
PUR Pesticide Use Report

ACRONYMS AND ABBREVIATIONS
WBG121311182744SAC/429592/113630002 xi
QA/QC Quality Assurance/Quality Control
QAO quality assurance objective
QAPP Quality Assurance Project Plan
RPD relative percent difference
RPP Rice Pesticides Program
SOP standard operating procedure
SSB Sacramento Slough Bridge
SWAMP Surface Water Ambient Monitoring Program
SWRCB State Water Resources Control Board
TDS total dissolved solids
TOC total organic carbon
TMDL total maximum daily load
UC University of California
UCCE UC Cooperative Extension
UC IPM University of California Integrated Pest Management
USDA U.S. Department of Agriculture
WQO water quality objective
Zn zinc


WBG121311182744SAC/429592/113630002 1-1
SECTION 1
Introduction
The California Rice Commission (CRC) is a statutory organization representingapproximately 2,500 rice farmers who farm approximately 500,000 acres of Californiafarmland. Rice is one of the top 20 crops produced in California, and adds nearly a halfbillion dollars in revenue and thousands of jobs vital to the state’s economy. The Californiarice industry contributes significantly to the foundation of many rural economies and thepositive balance of international trade. Rice produced in the United States provides 1.5 to2 percent of global production, competes in the global market, and constitutes a largeproportion of internationally traded medium-grain (north Asian) rice.
The CRC implements water quality monitoring and reporting activities in compliance withthe following two programs of the Central Valley Regional Water Quality Control Board(CVRWQCB):
Conditional Waiver for Rice (CWFR) monitoring and reporting, a rice-specificMonitoring and Reporting Program (MRP) under the CVRWQCB’s Conditional Waiver ofWaste Discharge Requirements for Discharges from Irrigated Lands (Irrigated LandsRegulatory Program). Monitoring and reporting requirements for the 2011 CWFR arespecified in CVRWQCB Resolution No. R5-2010-0805 (CRC MRP).
Rice Pesticides Program (RPP) monitoring and reporting, pursuant to the ConditionalProhibition of Discharge requirements specified in the Water Quality Control Plan for theSacramento and San Joaquin River Basins (Basin Plan). The RPP requirements are specifiedin CVRWQCB Resolution No. R5-2010-9001.
This report serves as the 2011 Annual Monitoring Report (AMR) for the CWFR and RPPefforts, and describes the CRC-conducted program activities for the 2011 calendar year.
Key CWFR activities include:
Rice acreage information reporting
Rice pesticide use information reporting
Water quality monitoring
Laboratory coordination
Laboratory analysis and reporting
Data validation and review
Coordination of early-season data submittals between the County AgriculturalCommissioners (CACs) and the California Department of Pesticide Regulation (DPR)
Interaction with pesticide registrants to support the development of reduced-riskpesticides
Annual reporting and review

SECTION 1: INTRODUCTION
1-2 WBG121311182744SAC/429592/113630002
Key RPP activities include:
Rice acreage information reporting
Rice pesticide use information reporting
Water quality monitoring
Laboratory coordination
Laboratory analysis and reporting
Data validation and review
Coordination of early-season data submittals between the CACs and the DPR
Pesticide use compliance inspections and enforcement
Communication with the water utilities, including the City of Sacramento, City of WestSacramento, and Freeport Regional Water Authority
Interaction with pesticide registrants to support the development of reduced-riskpesticides
Triennial reporting and review
Program Administration
The CRC has long been recognized by the CVRWQCB as an entity with the authority andcapacity to implement water quality program activities to achieve water quality protection.The CRC is a statutory organization with authorities and restrictions as established in theCalifornia Food and Agricultural Code. In July 2003, the CRC was issued a Notice ofApplicability (NOA) as a watershed coalition under the CVRWQCB’s Irrigated LandsRegulatory Program and has implemented rice-specific program activities since then.
Kleinfelder was contracted by the CRC to collect water samples at specified sites to obtaindata to characterize water quality. CH2M HILL prepared this AMR under contract to theCRC.
California RiceRice is grown in nine Sacramento Valley counties (Butte, Colusa, Glenn, Placer, Sacramento,Sutter, Tehama, Yolo, and Yuba). Rice is also farmed in counties outside the SacramentoValley; however, the acreages are generally small and rice is not the dominant crop in theseareas. For the purposes of the rice-specific MRP, the monitoring area is defined as thenine rice-producing counties in the Sacramento Valley.
Rice fields provide numerous environmental and commercial advantages that no alternativeland use would, including a variety of upland and shallow aquatic habitat. In efforts toreduce rice straw burning and improve wildlife habitat, rice farmers routinely flood theirfields in the winter (when no rice is present) to degrade the straw and reduce the need forrice straw burning.

SECTION 1: INTRODUCTION
WBG121311182744SAC/429592/113630002 1-3
Rice farming requires flooded field conditions that contribute to favorable habitatconditions. More than 230 species of wildlife and millions of migratory waterfowl thrive inCalifornia rice fields. In 2003, California rice lands were designated as shorebird habitat ofinternational significance by the Manomet Center for Conservation Sciences in partnershipwith the Western Hemisphere Shorebird Reserve Network.
In 2011, an estimated 579,281 acres of rice (as reported by the CACs) were planted in thenine rice-growing counties of the Sacramento Valley.1 The CAC acreage numbers areusually higher than actual planted acres because of accounting through pesticideapplications; multiple applications on single acres can result in double counting of acreageunder the CAC method. Figure 1-1 shows the distribution of acreage within the SacramentoValley (as reported by the CACs).
Rice Farming’s Influence on Water Quality
Because rice is farmed in standing water, the importance of good farming practices to waterquality is evident. However, water quality problems associated with other crops and locales(such as soil erosion and sediment transport, saline drainage waters, and highconcentrations of trace elements in subsurface drainage) are typically not problemsassociated with rice drainage. The generally slow rate of flow through rice fields and thecontrolled rate of water release tend to minimize significant soil erosion. With regard tosalinity, much of the water used to irrigate rice fields initially has a low salt concentrationand there is little possibility for salt accumulation in a continuously flooded system, so saltconcentration in return flows is usually relatively low.
History of Rice Water Quality Efforts
The CRC has undertaken water quality management activities since the 1980s. The effortsbegan under the RPP and, beginning in 2004, included efforts under the CWFR.A description of the historical context of rice water quality management efforts in theSacramento Valley follows.
RPP
A rice pesticide regulatory program has been in place since the 1980s. Implementation of theprogram included a proactive, industry-led effort to meet water quality objectives. The riceindustry not only met the challenge, but also created an example for other commoditygroups and coalitions to follow.
In the early 1980s, fish losses occurred in Sacramento Valley agricultural drains dominatedby rice drainage. Because of these losses, the California Department of Fish and Game(DFG) conducted investigations that indicated molinate was responsible for some fishlosses. In response, increased in-field holding times for irrigation waters containingmolinate were implemented, and no additional fish losses have been documented since
1 Figures from the National Agricultural Statistics Service (NASS) have been provided in previous years. NASS was contactedand the 2011 rice acreage county level figures will be available in June 2012. The CRC advises the SWRCB to use the finalNASS statistics and not the preliminary acreage information from this report when calculating the administrative fee for thisprogram.

SECTION 1: INTRODUCTION
1-4 WBG121311182744SAC/429592/113630002
June 1983. At approximately the same time, monitoring studies found that thiobencarbconcentrations as low as 1 microgram per liter (µg/L) at the city intakes resulted in increasesin water taste complaints from people whose drinking water was supplied by theSacramento River downstream of agricultural drain inputs.
CVRWQCB monitoring studies in the early 1980s determined that molinate, thiobencarb,carbofuran, malathion, and methyl parathion were present in agricultural drains dominatedby rice drainage. As a result of studies and chemical monitoring conducted in the early1980s, the rice industry worked collaboratively with the registrants, CACs, Rice ResearchBoard, University of California (UC) at Davis, UC Cooperative Extension (UCCE), DFG,CVRWQCB, State Water Resources Control Board (SWRCB), and the California Departmentof Food and Agriculture initiated the Rice Pesticide Control program, the precursor to theRPP, in 1984 to manage and regulate the discharge of pesticides from rice fields. TheDepartment of Pesticide Regulation (DPR) was later shifted from the California Departmentof Food and Agriculture into the California Environmental Protection Agency, andmaintained oversight of the rice pesticides program.
Findings by DFG and the CVRWQCB further moved the SWRCB to contract for scientificstudies to develop a toxicity database and to suggest limits for pesticide levels in theSacramento Valley’s rivers and agricultural drains.
A review of information on the effects of molinate and thiobencarb was conducted by theSWRCB (1984). This review was used to develop specific water quality criteria andperformance goals for those pesticides. In 1990, the CVRWQCB amended the Basin Plan forthe Central Valley Region to include a conditional prohibition of discharge for irrigationreturn flows containing molinate and thiobencarb, and in 1991, carbofuran, malathion, andmethyl parathion. The conditional prohibition of discharge required that a CVRWQCB-approved management practice be followed as a condition of pesticide discharge. Proposedmanagement practices are intended to control pesticide concentrations in return flows fromrice fields so that specific performance goals are met.
Environmental monitoring in the RPP was among the most intense ever undertaken byCalifornia’s agricultural producers and resulted in a substantial knowledge base regardingthe movement of rice pesticides in the Sacramento Valley. Through the implementation ofindustry-wide Best Management Practices (BMPs), the rice industry has been successful inmeeting water quality performance goals set by the CVRWQCB.
The RPP undergoes annual CVRWQCB review, at which time the CVRWQCB considersre-certifying the program through Board approval of management practices. Annual reportsare due to the CVRWQCB each December.
As in 2010, pursuant to CVRWQCB Resolution No. R5-2010-9001, the 2011 RPP includesonly thiobencarb. Of the five rice pesticides originally specified in the Basin Planperformance goals, a review of water quality data and pesticide use trends indicates thatonly thiobencarb is still used on rice in quantities that could potentially result inexceedances of performance goals or water quality objectives, absent implementation ofCVRWQCB-approved management practices.
This is the fifth year that the CRC has submitted a single report combining information forthe CWFR and RPP programs.

TEHAMA COUNTY
950
GLENNCOUNTY
83,639
COLUSACOUNTY165,392
YUBACOUNTY
39,107
PLACERCOUNTY
19,494YOLO
COUNTY41,430
SACRAMENTOCOUNTY
3,176
SUTTERCOUNTY119,827
BUTTECOUNTY106,266
Area Location
2011 ACRES PLANTED TO RICESACRAMENTO VALLEY COUNTIES
FIGURE 1-1Sacramento Valley Rice Acres, 2011CRC 2011 Annual Monitoring Report
WBG121311182744SAC Figure_1-1.ai tdaus 12.13.2011
Note: Acreage totals based on preliminary data provided by the County Agricultural Commissioners


SECTION 1: INTRODUCTION
WBG121311182744SAC/429592/113630002 1-7
Conditional Waiver of Waste Discharge Requirements for Rice
The CRC was granted an NOA to serve as a watershed coalition group under theCVRWQCB Resolution R5-2003-0105, Conditional Waiver of Waste Discharge Requirements forDischarges from Irrigated Lands within the Central Valley (Irrigated Lands Conditional Waiver)and Monitoring and Reporting Program Order No. R5-2003-0826 (MRP Order).
In October 2004, the CRC submitted a technical report, Basis for Water Quality MonitoringProgram: Conditional Waiver of Waste Discharge Requirements for Discharges from Irrigated Landsfor Rice (CWFR), to the CVRWQCB. The report served as the basis for the CVRWQCB’s rice-specific MRP. The report presented mapping information, including subwatersheds anddrainages, rice acreage, and hydrography (lakes, reservoirs, rivers, creeks, canals, anddrains); an overview of rice cultural practices; information on the use of and a review ofhistorical data for pesticides and nutrients; a discussion of other potential constituents ofconcern; a proposed future rice-specific sampling program, including sample locations,sample parameters, and sample timing; and a discussion of the framework for futureprogram review. The geographic and historical data were analyzed and employed to selectappropriate water quality monitoring sites. Specifically, the report included information onthe study area, rice pesticide use and water quality data, nutrient use and water qualitydata, copper use and water quality data, proposed future sampling, and framework forprogram review and update.
Since 2004, the CVRWQCB has issued additional monitoring and reporting requirements,which have been refined based on water quality results and evolving requirements of theIrrigated Lands Regulatory Program.
The current monitoring and reporting requirements for the CWFR are specified in the MRPOrder R5-2010-0805 (CRC MRP), under Resolution No. R5-2006-0053 as amended byR5-2006-0077. Monitoring and reporting requirements for the 2011 RPP are specified inCVRWQCB Resolution No. R5-2010-9001.
AMR Requirements
The AMR for the CWFR program is to be submitted by December 31 of each year. The AMRis to include the following:
1. Title page
2. Table of contents
3. Description of the watershed
4. Monitoring objectives
5. Sample site descriptions
6. Location map of sampling sites and land use
7. Tabulated results of analyses
8. Sampling and analytical methods used

SECTION 1: INTRODUCTION
1-8 WBG121311182744SAC/429592/113630002
9. Copies of chains of custody
10. Associated laboratory and field quality control sample results
11. Summary of precision and accuracy
12. Pesticide use information
13. Data interpretation, including an assessment of data quality objectives
14. Summary of management practices used
15. Actions taken to address water quality impacts identified, including but not limited torevised or additional management practices to be implemented
16. Communication reports
17. Conclusions and recommendations
Table 1-1 shows the location of the required information within this report.
TABLE 1-1Location of Required AMR Information in this Report
Required Information Location in this Report
Table of contents Page iii
Description of the watershed Section 2
Monitoring objectives Section 4
Sample site descriptions Section 4
Location map of sampling sites and land use Appendix A
Tabulated results of analyses Section 5
Sampling and analytical methods used Section 4
Copies of chains of custody Appendixes B and C
Associated laboratory and field quality control sample results Appendixes B and C
Summary of precision and accuracy Section 6
Pesticide use information Section 2
Data interpretation, including an assessment of data quality objectives Section 5
Summary of management practices used Section 3
Actions taken to address water quality impacts identified, including but notlimited to revised or additional management practices to be implemented
Section 3
Communication reports The information herein supersedesthe communication reports.
Conclusions and recommendations Section 7
Field documentation Appendixes B and C
Laboratory original data Appendixes B and C
Summary of field conditions, including a description of the weather,rainfall, stream flow, color of the water, odor, and other relevantinformation that can help in data interpretation
Section 2 and field sheets

WBG121311182744SAC/429592/113630002 2-1
SECTION 2
Growing Season, Hydrology, andApplied Materials
The rice water quality monitoring programs are based on a thorough understanding of howrice is grown in the Sacramento Valley, including key events such as irrigation, drainage,and runoff, and an understanding of when and how products such as pesticides andnutrients are applied. Hydrologic conditions during the year can also influence the timing ofkey events. This section includes descriptions of the “typical” Sacramento Valley ricefarming calendar and the 2011 rice growing season (including 2011 Sacramento Riverhydrology), and includes data on the materials applied to rice during the 2011 growingseason.
Rice Farming in the Sacramento Valley
Most California rice is produced by direct seeding into standing water, and a continuousflood is maintained for most of the season. Limited acreage is drill seeded (planted withground equipment), which also uses permanent flood after stand establishment. Key eventsin the rice farming cycle are:
Field preparation
Planting
Fertilizer application
Pesticide application
Irrigation
Drainage
Harvest
Winter flood-up
Winter drainage
Figure 2-1 illustrates the typical timeline for these key events.

SECTION 2: GROWING SEASON, HYDROLOGY, AND APPLIED MATERIALS
2-2 WBG121311182744SAC/429592/113630002
Source: UCCE and grower input
FIGURE 2-1Key Events in a Typical Rice Year
Hydrology
Seasonal rainfall and weather conditions influence rice planting and rice pesticideapplication. The 2011 rice farming year was atypical, with rains and unseasonably coolerweather. Heavy rains extended into April, resulting in delayed field preparation andplanting. As a result, peak pesticide use shifted to June. After planting, rice growth anddevelopment was delayed by the cooler weather, and as a result, harvest was delayed untilmid-October and extended until mid-November.
Flow data for the Sacramento River at Colusa were acquired from the CaliforniaDepartment of Water Resources (DWR) California Data Exchange Center (CDEC), andprecipitation data for a sensor in Colusa were obtained from the University of CaliforniaIntegrated Pest Management (UC IPM) California Weather Database. Data were collectedfor the period January 1, 2011, through October 31, 2011. Flow and precipitation data forJanuary through October 2011 are shown in Figure 2-2, and minimum and maximum airtemperatures are shown in Figure 2-3.

SECTION 2: GROWING SEASON, HYDROLOGY, AND APPLIED MATERIALS
WBG121311182744SAC/429592/113630002 2-3
FIGURE 2-22011 Flow and Precipitation Data
0
0.2
0.4
0.6
0.8
1
1.2
0
5000
10000
15000
20000
25000
30000
35000
40000
45000
500001
/1/2
01
1
1/1
6/2
01
1
1/3
1/2
01
1
2/1
5/2
01
1
3/2
/20
11
3/1
7/2
01
1
4/1
/20
11
4/1
6/2
01
1
5/1
/20
11
5/1
6/2
01
1
5/3
1/2
01
1
6/1
5/2
01
1
6/3
0/2
01
1
7/1
5/2
01
1
7/3
0/2
01
1
8/1
4/2
01
1
8/2
9/2
01
1
9/1
3/2
01
1
9/2
8/2
01
1
10
/13
/20
11
10
/28
/20
11
Dai
lyP
reci
pit
atio
n(i
nch
es)
Flo
w(c
ub
icfe
et
pe
rse
con
d)
Sacramento River Flow at Colusa (COL)Precipitation at Colusa (COL.A)
1/1/2011 - 10/31/2011
Flow
Precip

SECTION 2: GROWING SEASON, HYDROLOGY, AND APPLIED MATERIALS
2-4 WBG121311182744SAC/429592/113630002
FIGURE 2-32011 Daily Maximum and Minimum Air Temperatures
0
20
40
60
80
100
1201
/1/2
01
1
1/1
6/2
01
1
1/3
1/2
01
1
2/1
5/2
01
1
3/2
/20
11
3/1
7/2
01
1
4/1
/20
11
4/1
6/2
01
1
5/1
/20
11
5/1
6/2
01
1
5/3
1/2
01
1
6/1
5/2
01
1
6/3
0/2
01
1
7/1
5/2
01
1
7/3
0/2
01
1
8/1
4/2
01
1
8/2
9/2
01
1
9/1
3/2
01
1
9/2
8/2
01
1
10
/13
/20
11
10
/28
/20
11
Air
Tem
pe
ratu
re(d
egr
ee
sF)
Daily Maximum and Minimum Air Temperatures (COL.A)1/1/2011 - 10/31/2011
Air Temp Max
Air Temp Min

SECTION 2: GROWING SEASON, HYDROLOGY, AND APPLIED MATERIALS
WBG121311182744SAC/429592/113630002 2-5
Applied Materials
Agricultural use of pesticides in California is regulated by DPR. Growers, pesticideapplicators, pest control advisors, and pest control operators report pesticide use to CACsand these data are included in DPR’s Pesticide Use Report (PUR). DPR provides the CRCwith early review/draft PUR data and enforcement data for inclusion in the CRC’s annualreport. Data presented in the following discussions of pesticide use and nutrient applicationare for the Sacramento Valley rice-growing counties.
Pesticide UseThe CACs report preliminary pesticide use information to DPR. All pesticide use numbersreported herein are preliminary and have not been audited or quality control checked byDPR.
The pesticides with acreage increases in 2011 were malathion (+145 acres), propiconazole(Tilt) (+273 acres), lambda cyhalothrin (+1,062 acres), bensulfuron-methyl (+9,093 acres),trifloxystrobin (+9,903 acres), propiconazole (+9,903 acres), triclopyr TEA (+50,745 acres),propanil (+56,258 acres), and azoxystrobin (+59,976 acres).
The pesticides with acreage decreases in 2011 were diflubenzuron (-119 acres), bispyribac-sodium (-798 acres), penoxsulam (-2,535 acres), (s)-cypermethrin (-3,328 acres),carfentrazone-ethyl (-4,950 acres), cyhalofop-butyl (-17,890 acres), clomazone (-25,739 acres),and thiobencarb (-26,046 acres).
Treated acreage has a direct correlation to pounds of active ingredient applied. According tothe preliminary CAC data, planted acreage in 2011 increased by 13,750 acres, orapproximately 2.4 percent, from 565,531 (2010) to 579,281 acres (2011).
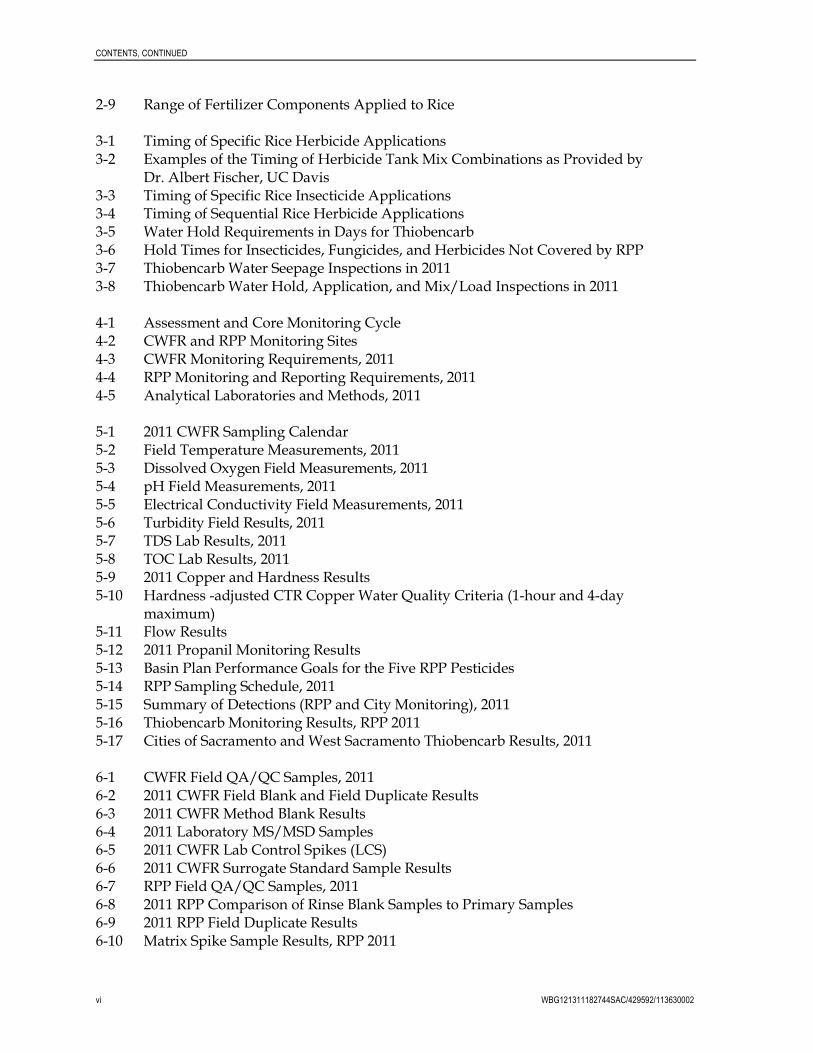
Tables 2-1 and 2-2 show the preliminary Sacramento Valley rice herbicide data, includingacres treated and pounds applied, respectively. Tables 2-3 and 2-4 show the preliminarySacramento Valley rice insecticide data, including acres treated and pounds applied,respectively. Tables 2-5 and 2-6 show the preliminary Sacramento Valley rice fungicide data,including acres treated and pounds applied, respectively. Sacramento Valley acres treatedwith thiobencarb for the time period 2009 through 2011 are listed in Table 2-7, and poundsof thiobencarb applied during this same time are listed in Table 2-8.
Nutrient UseLike most other farmland, rice acreage is fertilized annually. Fertilizer suppliers are the bestsource of information regarding the rates of fertilizer application. Suppliers were consultedto determine the range of fertilizer rates commonly applied to rice in the Sacramento Valley.The information obtained from the suppliers is summarized in Table 2-9. The table showsthat fertilizer may be applied to rice before planting (granular starter, aqua ammonia, zinc)and later in the season (topdressing). The totals for the high and low ends of the reportedrange are shown for each element in the lower section of Table 2-9.
Nitrogen (N) is essential for all commercial rice production in California. The general rate is120 to 150 pounds per acre. Specific N requirements vary with soil type, variety, croppinghistory, planting date, herbicide used, and the kind and amount of crop residue

SECTION 2: GROWING SEASON, HYDROLOGY, AND APPLIED MATERIALS
2-6 WBG121311182744SAC/429592/113630002
TABLE 2-1Herbicides: Acres Treated, Sacramento Valley, 2011
County
Acres Treated
Bensulfuron-methyl
Bispyribac-sodium
Carfentrazone-ethyl Clomazone
Cyhalofop-butyl Molinate Penoxsulam Propanil Thiobencarb
TriclopyrTEA
Butte 21,986 23,246 954 12,932 10,782 0 17,332 78,162 10,515 57,203
Colusa 7,323 19,698 967 6,892 23,866 0 11,795 104,599 5,292 101,063
Glenn 7,767 16,177 90 58,643 9,305 0 12,721 62,213 5,325 50,187
Placer 2,085 488 641 8,427 1,653 0 5,126 11,309 40 9,647
Sacramento 0 100 0 794 0 0 473 0 1,006 0
Sutter 8,825 16,919 1,913 69,864 9,982 0 51,947 99,321 11,292 84,331
Tehama 284 0 0 284 0 0 0 331 0 160
Yolo 599 1,133 323 8,117 8,880 0 6,684 20,113 12,186 19,859
Yuba 5,844 5,924 140 6,178 1,365 0 10,368 27,981 236 18,724
Total acres 54,713 83,685 5,028 172,131 65,833 0 116,446 404,029 45,892 341,174
Note:
Data are preliminary and have not been audited or error checked by DPR. Official release is anticipated by the end of 2012 – start of 2013.

SECTION 2: GROWING SEASON, HYDROLOGY, AND APPLIED MATERIALS
WBG121311182744SAC/429592/113630002 2-7
TABLE 2-2Herbicides: Pounds Applied, Sacramento Valley, 2011
County
Pounds Applied
Bensulfuron-methyl
Bispyribac-sodium
Carfentrazone-ethyl Clomazone
Cyhalofop-butyl Molinate Penoxsulam Propanil Thiobencarb
TriclopyrTEA
Butte 1,975 896 226 5,691 3,450 0 622 364,235 41,009 11,441
Colusa 568 556 56 3,032 7,637 0 423 487,431 20,638 20,213
Glenn 654 743 42 25,803 2,978 0 457 289,913 20,759 10,037
Placer 138 21 275 3,708 523 0 184 52,700 156 1,929
Sacramento 0 4 0 349 0 0 17 0 3,923 0
Sutter 741 585 439 30,740 3,194 0 1,865 135,077 44,038 16,866
Tehama 26 0 0 125 0 0 0 1,542 0 32
Yolo 44 41 22 3,572 2,842 0 240 93,727 47,525 3,972
Yuba 392 188 70 2,718 437 0 372 130,391 920 3,745
Total pounds 4,538 3,034 1,130 75,738 21,061 0 4,180 1,555,016 178,968 68,235
Note:
Data are preliminary and have not been audited or error checked by DPR. Official release is anticipated by the end of 2012 – start of 2013.

SECTION 2: GROWING SEASON, HYDROLOGY, AND APPLIED MATERIALS
2-8 WBG121311182744SAC/429592/113630002
incorporated during seedbed preparation. Winter flooding for straw decomposition andwaterfowl management has greatly reduced N use in some rice fields. Most N is appliedpreplant and either soil incorporated or injected 2 to 4 inches before flooding. Some N maybe topdressed mid-season (panicle differentiation) to correct deficiencies and maintain plantgrowth and yield.
Phosphorus (P) is applied at a rate of 18 to 26 pounds per acre and is incorporated into theseedbed before flooding. Most rice fields are above a critical need for P and do not requirerepeated use of this fertilizer. Phosphate fertilizer also may be topdressed when a deficiencyoccurs, usually in the early seedling stage.
Potassium (K) is generally unnecessary in California.
Zinc (Zn) deficiency or “alkali disease” is common in alkaline soils and areas where topsoilhas been removed. If Zn is used, the rate is 2 to 16 pounds per acre at preflood, and it is notincorporated into the soil. Zinc deficiencies most commonly occur in cool weather duringstand establishment (early season).
Iron deficiency is rare in California and can usually be corrected by lowering the soil pH.
TABLE 2-3Insecticides: Acres Treated, Sacramento Valley, 2011
County
Acres Treated
Diflubenzuron (s)-Cypermethrin Lambda Cyhalothrin Malathion
Butte 394 150 11,348 0
Colusa 0 1,061 8,578 0
Glenn 137 12,316 13,790 0
Placer 358 308 5,588 0
Sacramento 0 0 1,118 0
Sutter 29 5,247 41,057 145
Tehama 0 0 0 0
Yolo 0 75 6,795 0
Yuba 248 700 6,373 0
Total acres 1,166 19,857 94,647 145
Note:
Data are preliminary and have not been audited or error checked by DPR. Official release is anticipated by theend of 2012 – start of 2013.

SECTION 2: GROWING SEASON, HYDROLOGY, AND APPLIED MATERIALS
WBG121311182744SAC/429592/113630002 2-9
TABLE 2-4Insecticides: Pounds Applied, Sacramento Valley, 2011
County
Pounds Applied
Diflubenzuron (s)-Cypermethrin Lambda Cyhalothrin Malathion
Butte 59 8 340 0
Colusa 0 53 257 0
Glenn 21 616 414 0
Placer 54 15 168 0
Sacramento 0 0 34 0
Sutter 4 262 1,232 265
Tehama 0 0 0 0
Yolo 0 4 195 0
Yuba 37 35 191 0
Total pounds 175 993 2,831 265
Note:
Data are preliminary and have not been audited or error checked by DPR. Official release is anticipated by theend of 2012 – start of 2013.
TABLE 2-5Fungicides: Acres Treated, Sacramento Valley, 2011
County
Acres Treated
Azoxystrobin Propiconazole* Trifloxystrobin* Propiconazole (Tilt)
Butte 52,736 0 0 0
Colusa 67,357 5,083 5,083 0
Glenn 58,093 54 54 0
Placer 4,922 0 0 0
Sacramento 0 0 0 0
Sutter 37,973 11,005 11,005 0
Tehama 0 0 0 0
Yolo 3,960 800 800 0
Yuba 9,950 2,847 2,847 273
Total acres 234,991 19,789 19,789 273
Note:
Data are preliminary and have not been audited or error checked by DPR. Official release is anticipated by theend of 2012 – start of 2013.

SECTION 2: GROWING SEASON, HYDROLOGY, AND APPLIED MATERIALS
2-10 WBG121311182744SAC/429592/113630002
TABLE 2-6Fungicides: Pounds Applied, Sacramento Valley, 2011
County
Pounds Applied
Azoxystrobin Propiconazole* Trifloxystrobin* Propiconazole (Tilt)
Butte 8,965 0 0 0
Colusa 11,451 661 661 0
Glenn 9,876 7 7 0
Placer 837 0 0 0
Sacramento 0 0 0 0
Sutter 5,945 1,431 1,431 0
Tehama 0 0 0 0
Yolo 673 104 104 0
Yuba 1,692 370 370 35
Total pounds 39,439 2,573 2,573 35
Note:
Data are preliminary and have not been audited or error checked by DPR. Official release is anticipated by theend of 2012 – start of 2013.
TABLE 2-7Acres Treated with Molinate and Thiobencarb, 2007 through 2011
County
Acres Treated
Thiobencarb
2009 2010 2011
Butte 1,923 9,624 10,515
Colusa 35,201 22,629 5,292
Glenn 4,660 4,089 5,325
Placer 0 0 40
Sacramento 0 99 1,006
Sutter 859 15,529 11,292
Tehama 0 0 0
Yolo 14,698 14,863 12,186
Yuba 3,092 5,105 236
Total treated acres 60,433 71,938 45,892
Total planted acres 569,320 565,531 579,281
Note:
Data are preliminary has and have not been audited or error checked byDPR. Official release is anticipated by the end of 2012 – start of 2013.
SECTION 2: GROWING SEASON, HYDROLOGY, AND APPLIED MATERIALS
WBG121311182744SAC/429592/113630002 2-11
TABLE 2-8Pounds of Molinate and Thiobencarb Applied, 2007 through 2011
County
Pounds Applied
Thiobencarb
2009 2010 2011
Butte 7,265 32,642 41,009
Colusa 137,420 81,908 20,638
Glenn 17,806 14,148 20,759
Placer 0 0 156
Sacramento 0 297 3,923
Sutter 2,843 50,340 44,038
Tehama 0 0 0
Yolo 58,152 52,269 47,525
Yuba 9,868 16,302 920
Total pounds 233,354 247,906 178,968
Total planted acres 569,320 565,531 579,281
Note:
Data are preliminary has and have not been audited or error checked byDPR. Official release is anticipated by the end of 2012 – start of 2013.
Table 2-9Range of Fertilizer Components Applied to Rice
Material/Element
Pounds per Acre
Form and MethodLow High
N 80 120 Injected aqua
16-20 150 200
N 24 32 Solid 16-20-0-13 starter
P 30 40 Solid 16-20-0-13 starter
K 0 0 Solid 16-20-0-13 starter
S 19.5 26 Solid 16-20-0-13 starter
Zn 1 5 Metallic
NH4SO4 0 200
N 0 42 Topdressed
S 0 49 Topdressed
Total for all application methods
N 104 194
P 30 40
K 0 0
S 20 75
Zn* 1 5
*Seldom applied


WBG121311182744SAC/429592/113630002 3-1
SECTION 3
Management Practices
Management practices are a key component of the rice water quality programs. During theearly phases of the RPP, management practices were developed to increase efficacy andultimately to protect water quality. The cornerstone of rice management practices is athorough understanding of the rice calendar, including the application methods and timingof pesticide use.
Management practices include field-level management of rice pesticides and discharges,CAC enforcement programs, grower education efforts, and communication programs.This section includes the pesticide use calendar, general information on rice water qualitymanagement practices, and specific 2011 enforcement data.
Pesticide Use Calendar
Figure 3-1 depicts the rice growth stages and the season or timing of pesticide applicationsto rice, including herbicide applications, tank mix combinations, insecticide applications,and sequential herbicide applications. A ”sequential” is the application of an herbicidefollowed by another herbicide with a different mode of action. Sequential applications areused to achieve better coverage and efficacy for weed control. The second applicationusually occurs in the next growth stage of the rice plant. For example, clomazone is appliedat germination. A sequential application of bispyribac-sodium is applied at tiller initiation.
Rice pesticide applications are timed for specific growth stages of the rice plant. To simplifythe rice growth schedule, Tables 3-1 through 3-4 group pre-flood and germination into earlyseason; tiller initiation and tillering are mid-season, and panicle initiation and flower are lateseason.
This calendar of applications provides information that is useful for understanding potentialwater quality concerns relative to particular times during the year.
FIGURE 3-1Rice Growth Stages

SECTION 3: MANAGEMENT PRACTICES
3-2 WBG121311182744SAC/429592/113630002
TABLE 3-1Timing of Specific Rice Herbicide Applications
Early Season(March–April)
Mid Season(May–June)
Late Season(June–July)
Pre-Flood Germination Tiller Initiation Tillering Panicle Initiation Flowering
Bensulfuron-methylPermanent flood
Bensulfuron-methylPinpoint flood
Bispyribac-sodiumPinpoint flood
Carfentrazone-ethylPermanent flood
5-day static; 30-day release
ClomazonePermanent flood
14-day water hold
Cyhalofop-butylPinpoint flood
7-day water hold
PropanilPinpoint flood
Thiobencarb (Bolero and Abolish)Permanent flood
30-day water hold
Triclopyr TEAPinpoint flood
20-day water hold

SECTION 3: MANAGEMENT PRACTICES
WBG121311182744SAC/429592/113630002 3-3
TABLE 3-2Examples of the Timing of Herbicide Tank Mix Combinations as Provided by Dr. Albert Fischer, UC Davis
Early Season(March–April)
Mid Season(May–June)
Late Season(June–July)
Pre-Flood Germination Tiller Initiation Tillering Panicle Initiation Flowering
Bispyribac-sodium/Thiobencarb
(Abolish)Pinpoint flood
30-day water hold
Propanil/Thiobencarb(Abolish)
Permanent flood30-day water hold
TABLE 3-3Timing of Specific Rice Insecticide Applications
Early Season(March–April)
Mid Season(May–June)
Late Season(June–July)
Pre-Flood Germination Tiller Initiation Tillering Panicle Initiation Flowering
Lambda cyhalothrinBorder treatment7-day water hold
Lambda cyhalothrinBorder treatment7-day water hold
(s)-cypermethrinBorder treatment7-day water hold
(s)-cypermethrinBorder treatment7-day water hold

SECTION 3: MANAGEMENT PRACTICES
3-4 WBG121311182744SAC/429592/113630002
TABLE 3-4Timing of Sequential Rice Herbicide Applications
Early Season(March–April)
Mid Season(May–June)
Late Season(June–July)
Pre-Flood Germination Tiller Initiation Tillering Panicle Initiation Flowering
Bispyribac-sodium, Thiobencarb (Bolero)30-day water holdPermanent Flood
Bispyribac-sodium, PropanilPinpoint flood
Clomazone, Bensulfuron-methyl14-day water oldPermanent flood
Clomazone, Bispyribac-sodium14-day water holdPermanent flood
Clomazone, Carfentrazone-ethylup to 30-day water hold
Permanent flood
Clomazone, Propanil14-day water holdPermanent flood
Clomazone, Propanil/Triclopyr TEA20-day water hold
Cyhalofop-butyl, Bensulfuron-methyl7-day water hold
Pinpoint flood
Cyhalofop-butyl, Bispyribac-sodium7-day water hold
Pinpoint flood
Cyhalofop-butyl, Propanil7-day water hold
Pinpoint flood
Propanil, Cyhalofop-butyl7-day water hold
Pinpoint flood
Carfentrazone-ethyl, Cyhalofop-butyl30-day water hold, 7-day water hold
Pinpoint flood
SECTION 3: MANAGEMENT PRACTICES
WBG121311182744SAC/429592/113630002 3-5
Role of Management Practices in Attaining Water QualityProtection
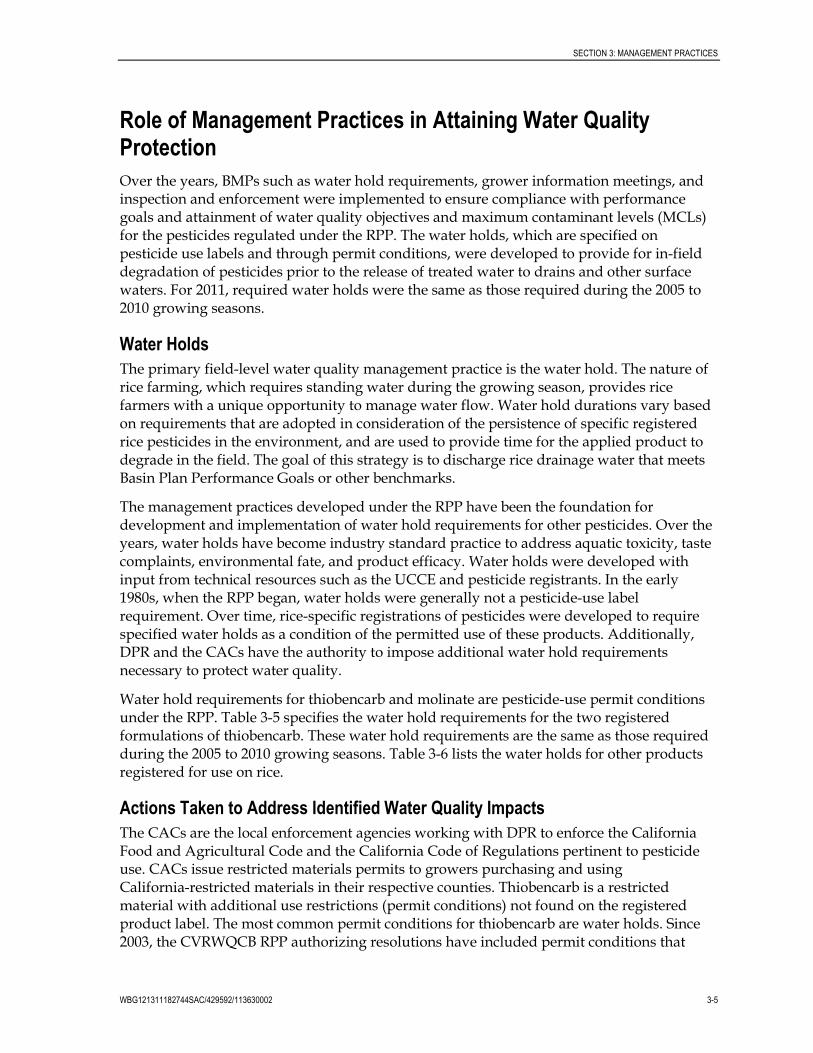
Over the years, BMPs such as water hold requirements, grower information meetings, andinspection and enforcement were implemented to ensure compliance with performancegoals and attainment of water quality objectives and maximum contaminant levels (MCLs)for the pesticides regulated under the RPP. The water holds, which are specified onpesticide use labels and through permit conditions, were developed to provide for in-fielddegradation of pesticides prior to the release of treated water to drains and other surfacewaters. For 2011, required water holds were the same as those required during the 2005 to2010 growing seasons.
Water HoldsThe primary field-level water quality management practice is the water hold. The nature ofrice farming, which requires standing water during the growing season, provides ricefarmers with a unique opportunity to manage water flow. Water hold durations vary basedon requirements that are adopted in consideration of the persistence of specific registeredrice pesticides in the environment, and are used to provide time for the applied product todegrade in the field. The goal of this strategy is to discharge rice drainage water that meetsBasin Plan Performance Goals or other benchmarks.
The management practices developed under the RPP have been the foundation fordevelopment and implementation of water hold requirements for other pesticides. Over theyears, water holds have become industry standard practice to address aquatic toxicity, tastecomplaints, environmental fate, and product efficacy. Water holds were developed withinput from technical resources such as the UCCE and pesticide registrants. In the early1980s, when the RPP began, water holds were generally not a pesticide-use labelrequirement. Over time, rice-specific registrations of pesticides were developed to requirespecified water holds as a condition of the permitted use of these products. Additionally,DPR and the CACs have the authority to impose additional water hold requirementsnecessary to protect water quality.
Water hold requirements for thiobencarb and molinate are pesticide-use permit conditionsunder the RPP. Table 3-5 specifies the water hold requirements for the two registeredformulations of thiobencarb. These water hold requirements are the same as those requiredduring the 2005 to 2010 growing seasons. Table 3-6 lists the water holds for other productsregistered for use on rice.
Actions Taken to Address Identified Water Quality Impacts
The CACs are the local enforcement agencies working with DPR to enforce the CaliforniaFood and Agricultural Code and the California Code of Regulations pertinent to pesticideuse. CACs issue restricted materials permits to growers purchasing and usingCalifornia-restricted materials in their respective counties. Thiobencarb is a restrictedmaterial with additional use restrictions (permit conditions) not found on the registeredproduct label. The most common permit conditions for thiobencarb are water holds. Since2003, the CVRWQCB RPP authorizing resolutions have included permit conditions that

SECTION 3: MANAGEMENT PRACTICES
3-6 WBG121311182744SAC/429592/113630002
required increased inspections for seepage control; buffer zones during application; apre-season mandatory meeting for growers, pest control advisors, and applicators; andformation of a Storm Event Work Group. The resolution authorizing the 2010 RPP(R5-2010-9001) adopted additional conditions recommended by the CRC. The conditionsincluded in the current RPP authorization are summarized below:
Continuation of the management practices incorporated in the 2009 use permitconditions, including water-holding requirements for thiobencarb, drift minimization,mandatory preseason thiobencarb stewardship training, water management (includingemergency releases), and seepage mitigation measures [R5-2010-9001 (1)(a)].
Additional outreach to applicators on the results of the 2009 thiobencarb water qualitymonitoring and required management practices, including clarification of hold timerequirements, application procedures, and notification requirements associated withelevated results near the Sacramento River drinking water intakes [R5-2010-9001 (1)(b)].
Consultation with the ten thiobencarb dealers and distributors in the Sacramento RiverBasin [R5-2010-9001 (1)(b)].
Funding of additional county surveillance at non-traditional hours to double the level of2009 and extension of the program to counties not previously funded, resulting insurveillance inspections increase to approximately 1.5 times the 2009 level [R5-2010-9001(1)(c)].
In the event of flooding from a storm event, the CRC would coordinate with thereclamation district previously operating as a closed system just north of Sacramento tocollect and analyze samples [R5-2010-9001 (1)(d)].
If the performance goal or water quality objective for thiobencarb is not met orincreasing thiobencarb concentrations are observed in waters designated for municipalor domestic water supply, the CRC, after consultation with DPR, will submit to theExecutive Officer proposed actions to be implemented to achieve the performance goalor water quality objective [R5-2010-9001 (1)(e)].
The restricted materials permits require the CACs to keep records of pesticides applied torice acreage, while full use reporting documents all agricultural use pesticides. The CACsmeet the notification requirements by complying with the Notice of Intent (NOI) and NOAprocess. Rice growers or pest control operators submit NOIs to the CACs at least 24 hoursprior to application so that CAC staff can observe applications. NOAs are reported 24 hoursafter an application occurs so that water holding times can be recorded, inspected, andtracked.
Compliance with pesticide-use restrictions is a critical component of the RPP’s ability toachieve water quality protection. A range of label restrictions and permit conditions applyto the use of rice pesticides, including mix/load, application, and water hold requirements.CACs perform inspections to enhance compliance with each of the label restrictions andpermit conditions. Mix/load inspections are performed primarily for worker protection andto evaluate whether pesticides are being properly handled and contained to prevent releasesto the environment. Application inspections are performed to evaluate label and permitcondition application restrictions such as buffer zones, adherence to rate and wind speed

SECTION 3: MANAGEMENT PRACTICES
WBG121311182744SAC/429592/113630002 3-7
and other local requirements, and water management. Seepage inspections evaluate theefficacy of farm water management levees to hold water in-field throughout the duration ofwater holds.
TABLE 3-5Water Hold Requirements in Days for Thiobencarb
Release Type
Thiobencarb
Bolero® 15-G andBolero® UltraMax
Abolish™8EC
Single field 30 19
Single field southern area onlya
19 —
Release into tailwater recovery system or pond onto fallow field(except southern area)
b14
b14
b
Multi-growers and district release onto closed recirculating systems 6 6
Multi-growers and district release onto closed recirculating systemsin southern area
6 —
Release into areas that discharge negligible amounts to perennialstreams
19 6c
Pre-flood application: release onto tailwater recovery system — —
Emergency release of tailwater 19 19
Commissioner verifies the hydrologic isolation of the fields 6 6
aSacramento–San Joaquin Valley defined as south of the line defined by Roads E10 and 116 in Yolo County
and the American River in Sacramento Countyb
Thiobencarb permit condition allowed Bolero® 15-G label hold period of 14 daysc
Applies to verified hydrologically isolated fields
TABLE 3-6Hold Times for Insecticides, Fungicides, and Herbicides Not Covered by RPP
Active Ingredient Trade NameWater Hold
Time Provisions
Insecticides
Diflubenzuron Dimlin® Insect Growth Regulator 14 days None
(s)-cypermethrin Mustang® 1.5 EW Insecticide 7 days None
Lambda-cyhalothrin Warrior® Insecticide 7 days None
Methyl Parathion None 24 days None
Malathion None 4 days* None
Fungicides
Azoxystrobin Quadris® Flowable Fungicide 14 days None

SECTION 3: MANAGEMENT PRACTICES
3-8 WBG121311182744SAC/429592/113630002
TABLE 3-6Hold Times for Insecticides, Fungicides, and Herbicides Not Covered by RPP
Active Ingredient Trade NameWater Hold
Time Provisions
Herbicides
Carfentrazone-ethyl Shark® 5-day static30-day release
None
Clomazone Cerano™ 14 days Less if closed system
Cyhalofop-butyl Clincher™ 7 days None
Propanil Stam™ 80 EDF 7 days None
Triclopyr TEA Grandstand™ CA Herbicide 20 days Less if closed system
Molinate Ordram® 28 days
*Voluntary hold
Release Inquiries and Emergency Releases
In 2011, there were five release inquiries and no reported emergency releases. One releaseinquiry occurred in Colusa County, three occurred in Sutter County, and one occurred inYolo County.
Seepage Control and Inspections
Seepage is a water quality concern because rice field water can move laterally throughlevees bordering rice fields, especially when levees are constructed in a manner that doesnot prevent water seepage. Often, levee borrow pits, commonly called “sweat ditches,” areused to contain this water. When water gets high enough, it can flow into local agriculturaldrainage conveyances. The CVRWQCB expressed concern that seepage was a contributingfactor to increased thiobencarb concentrations in the Sacramento River in the past.
Current program recommendations require securing weir boxes in rice fields with a soilbarrier to a depth higher than the water level. At rice pesticide permit issuance, the CACsprovide rice growers with a handout, Closed Rice Water Management Systems, prepared by theU.S. Department of Agriculture (USDA) and the UCCE. Additionally, the CACs provide thegrowers a brochure, Seepage Water Management—Voluntary Guidelines for Good Stewardship inRice Production, cooperatively developed by the UC Davis Department of Agronomy andRange Science, DPR, and UCCE. The brochure is also distributed at the mandatorythiobencarb meetings. The brochure explains the causes of seepage and identifies voluntarymanagement activities that growers should use to minimize and prevent seepage.
For several years, the CRC has contracted with three CACs to fund “off duty” enforcementactivity on weekends and holidays during RPP pesticide use season. As in 2010, the CRCincreased funding to double the level of 2009 and extended the program to four additionalcounties not previously funded. Surveillance inspections continued to be at levels 1.5 timesthe 2009 inspections, and include seven of the nine counties in the RPP. The number ofinspections is in correlation with the thiobencarb notices of intent and the amount ofproduct used. Please see Tables 2-7 and 2-8, which reflect a sharp decrease in thiobencarb

SECTION 3: MANAGEMENT PRACTICES
WBG121311182744SAC/429592/113630002 3-9
use from 2009 to 2010. Excessive spring rains delay the start of the use season and the shortwindow to apply thiobencarb for optimal effectiveness for early weed control.
In 1998, DPR and the CACs implemented a Prioritization Plan and a Negotiated Work Plan.One component of both plans was to negotiate a number of water hold inspections.The plans allow the counties to set priorities within the Pesticide Use Enforcement ProgramStandard Compendium under the Restricted Materials and Permitting manual. All ricepesticide water holding requirements are ranked as high-priority inspections when ricepesticides are used as restricted materials.
Some pre-flood inspections were per grower request, while most inspections were inresponse to an NOI filed at the CAC office. Some permits were denied due to seepageconditions upon inspection. Information was gathered from the CACs on number ofinspections, types of inspections, violations, agricultural civil penalties (ACPs), and waterseepage inspection activities in 2011. The CRC provided the CAC offices with weeklyupdates of the rice herbicide monitoring results in order to coordinate water qualityprotection activities.
CACs conducted seepage inspections, as summarized in Table 3-7. Based on the inspectiondata provided to the DPR by the CACs, 959 thiobencarb use sites were inspected forseepage. Of these inspected sites, 919 sites reported no discharge, 33 had reporteddischarges of less than 5 gallons per minute (gpm), and seven sites had reported dischargesof greater than 5 gpm. The seven sites with flow greater than 5 gpm constitute less than1 percent of inspected sites. No enforcement actions were issued.
Water Hold Inspections
CACs conducted water-hold inspections of 993 thiobencarb use sites in 2011 (Table 3-8).CACs reported inspections for the two formulations of thiobencarb (Bolero and Abolish).There were five release inquiries and no reported emergency releases. Of the 993 use sitesinspected, no water hold violation ACPs were issued.
TABLE 3-7Thiobencarb Water Seepage Inspections in 2011
County Chemical
Number ofSeepage
Inspections
Number ofSites with
No Seepage
Number ofSites w/
Less than5 gpm
Seepage
Number ofSites w/
More than5 gpm
SeepageEnforcement
Actions
Butte Bolero 167 167 0 0 0
Abolish 17 17 0 0 0
County Total 184 184 0 0 0
Colusa Bolero 180 180 0 0 0
Abolish 17 17 0 0 0
County Total 197 197 0 0 0
Glenn Bolero 153 136 14 3 0
Abolish 20 8 8 4 0
County Total 173 144 22 7 0

SECTION 3: MANAGEMENT PRACTICES
3-10 WBG121311182744SAC/429592/113630002
TABLE 3-7Thiobencarb Water Seepage Inspections in 2011
County Chemical
Number ofSeepage
Inspections
Number ofSites with
No Seepage
Number ofSites w/
Less than5 gpm
Seepage
Number ofSites w/
More than5 gpm
SeepageEnforcement
Actions
Placer Bolero 1 1 0 0 0
Abolish 0 0 0 0 0
County Total 1 1 0 0 0
Sacramento Bolero 14 14 0 0 0
Abolish 0 0 0 0 0
County Total 14 14 0 0 0
Sutter Bolero 252 251 1 0 0
Abolish 33 28 5 0 0
County Total 285 279 6 0 0
Tehama Bolero 0 0 0 0 0
Abolish 0 0 0 0 0
County Total 0 0 0 0 0
Yolo Bolero 100 95 5 0 0
Abolish 0 0 0 0 0
County Total 100 95 5* 0 0
Yuba Bolero 5 5 0 0 0
Abolish 0 0 0 0 0
County Total 5 5 0 0 0
Total 959 919 33 7 0
Notes:Bolero includes Bolero 15G and Bolero UltraMax; the counties did not differentiate between the products.Data are preliminary.*County notes all five sites with seepage of less than 5 gpm were corrected prior to thiobencarb application.
TABLE 3-8Thiobencarb Water Hold, Application, and Mix/Load Inspections in 2011
County ChemicalWater HoldInspections
ReleaseInquiries
EmergencyReleases
Water HoldACPs
Appl.Inspections
Mix-LoadInspections ACPs
Butte Bolero 15G 167 0 0 0 9 6 0
Abolish EC 17 0 0 0 3 2 0
County Total 184 0 0 0 12 8 0
Colusa Bolero 15G 180 0 0 0 0 0 0
Abolish EC 17 1 0 0 2 0 0
County Total 197 1 0 0 2 0 0

SECTION 3: MANAGEMENT PRACTICES
WBG121311182744SAC/429592/113630002 3-11
TABLE 3-8Thiobencarb Water Hold, Application, and Mix/Load Inspections in 2011
County ChemicalWater HoldInspections
ReleaseInquiries
EmergencyReleases
Water HoldACPs
Appl.Inspections
Mix-LoadInspections ACPs
Glenn Bolero 15G 153 0 0 0 0 1 0
Abolish EC 20 0 0 0 1 0 0
County Total 173 0 0 0 1 1 0
Placer Bolero 15G 5 0 0 0 0 0 0
Abolish EC 0 0 0 0 0 0 0
County Total 5 0 0 0 0 0 0
Sacramento Bolero 15G 44 0 0 0 0 0 0
Abolish EC 0 0 0 0 0 0 0
County Total 44 0 0 0 0 0 0
Sutter Bolero 15G 252 2 0 0 1 2 0
Abolish EC 33 1 0 0 0 0 0
County Total 285 3 0 0 1 2 0
Tehama Bolero 15G 0 0 0 0 1 1 0
Abolish EC 0 0 0 0 0 1 0
County Total 0 0 0 0 1 2 0
Yolo Bolero 15G 100 1 0 0 1 1 0
Abolish EC 0 0 0 0 0 0 0
County Total 100 1 0 0 1 1 0
Yuba Bolero 15G 5 0 0 0 0 0 0
Abolish EC 0 0 0 0 0 0 0
County Total 0 0 0 0 0 0 0
Total 993 5 0 0 18 14 0
Notes:
Bolero includes Bolero 15G and Bolero UltraMax; the counties did not differentiate between the products.Data are preliminary.
Application and Mix/Load Inspections
CACs conducted application and mix/load inspections, as summarized in Table 3-8. Basedon the inspection data the CACs provided to the DPR, eighteen application inspections andfourteen mix/load event inspections were performed. No enforcement actions were issuedas a result of these inspections.


WBG121311182744SAC/429592/113630002 4-1
SECTION 4
Monitoring and Reporting Requirements
This section provides an overview of the monitoring and reporting requirements of the CRCMRP and RPP, including the overall purpose and objectives; monitoring periods, sites, andconstituents; program administration; sampling procedures; and analytical labs andmethods used to assess water quality.
Monitoring Purpose and Objectives
Although similar, the CWFR and RPP programs each have different purposes and objectivesfor monitoring and reporting.
CWFR
The purpose of the CRC MRP is to monitor the discharge of wastes in irrigation return flowsand stormwater from irrigated rice lands. These objectives are consistent with the State’sNonpoint Source (NPS) Policy and include the following:
Determine whether the discharge of waste from irrigated lands within the CoalitionGroup boundaries causes or contributes to exceedances of applicable water qualitystandards or causes nuisance.
Provide information about the Coalition Group area characteristics, including but notlimited to land use, crops grown, and chemicals used.
Monitor the effectiveness of management practices implemented to address exceedancesof applicable water quality standards.
Determine which management practices are most effective in reducing wastesdischarged to surface waters from irrigated lands.
Specify details about monitoring periods, parameters, protocols, and quality assurance.
Support the development and implementation of the CWFR.
Verify the adequacy and effectiveness of the CWFR’s conditions.
Evaluate the Coalition Group’s compliance with the terms and conditions of the CWFR.

SECTION 4: MONITORING AND REPORTING REQUIREMENTS
4-2 WBG121311182744SAC/429592/113630002
RPPThe purpose of the RPP is to achieve compliance with the CVRWQCB Board-approvedmanagement practices and attainment of the thiobencarb Performance Goal established inthe Basin Plan and the agreed-upon secondary MCL as a water quality objective at theSacramento and West Sacramento city intakes. Monitoring is conducted under the RPP todetermine attainment of Performance Goal and the secondary MCL water quality objective.Similar to the CWFR, though not specifically stated in regulatory documents, the purposesof the monitoring under the RPP are:
Assess the impacts of the rice pesticides regulated under the Basin Plan.
Determine the degree of implementation of rice pesticide management practices.
Monitor the effectives of management practices and strategies to attain the PerformanceGoal.
Determine concentration of Basin Plan rice pesticides at specific sites.
Evaluate compliance with the Performance Goal and attainment of the thiobencarbwater quality objective to determine whether additional management practices arenecessary to improve and/or protect water quality.
Overview of RequirementsThe monitoring requirements for both programs define the types of monitoring, monitoringschedule, sites, constituents, program administration, and quality control and qualityassurance requirements. The details of each program are described below.
CWFRIn January 2008, the CVRWQCB adopted Order No. R5-2008-0005 (2008 Coalition MRP),which required Coalition Groups to revise their MRP plans to incorporate refinedapproaches to implementation of the Irrigated Lands Regulatory Program. The 2009 and2010 CRC MRPs were developed to be functionally equivalent to the 2008 Coalition MRP.
Monitoring requirements defined by the 2008 Coalition MRP incorporate a 3-year cycle ofassessment monitoring and core monitoring. Core monitoring is conducted at a subset ofcore sites considered representative of the Coalition Group’s area, and for a reduced set ofparameters. Assessment monitoring is to include an expanded suite of parameters and mayinclude an expanded list of sites, including assessment sites and core sites. The purposes ofthe expanded suite are to confirm that core monitoring continues to adequately characterizewater quality conditions or identify changed conditions and to provide the technical basisfor use of core sites.
CWFR assessment monitoring was conducted in 2009. The current CWFR requirementsspan a 3-year monitoring schedule, which includes 2 years of core monitoring (2010 and2011), followed by a year of assessment monitoring (2012). Table 4-1 provides the sequentialschedule for assessment and core monitoring.

SECTION 4: MONITORING AND REPORTING REQUIREMENTS
WBG121311182744SAC/429592/113630002 4-3
TABLE 4-1Assessment and Core Monitoring Cyclea
Monitoring Type 2009 2010 2011 2012
Assessmentb
c
Cored
aRepeat cycle every 3 years, or as specified in an approved MRP plan.
bAssessment monitoring is conducted at core sites and assessment sites. Site-specific monitoring requirements
may be included.cAssessment sites were monitored during the initial two events of 2010 to report dissolved copper (total copper
was reported in 2009).dCore monitoring is conducted only at core sites.
Both core and assessment monitoring can include special project monitoring. Special projectmonitoring includes monitoring and reporting implemented pursuant to approved andproposed management plans, as well as other focused investigations that may assist inaddressing data gaps or other technical evaluations.
Consistent with the approach outlined in the MRP, the CRC’s approach for its monitoringprogram includes three types of monitoring:
Core monitoring to track trends
Assessment monitoring to determine the condition of a water body
Special project monitoring for source identification and other problem solving
Core MonitoringCore monitoring sites and constituents are used to measure trends at the selectedrepresentative sites over extended periods of time. The core monitoring component of themonitoring strategy will:
Focus on a diversity of monitoring sites across the Coalition Group’s area (hydrology,size, and flow).
Include sites that through assessment monitoring or other information have been shownto be characteristic of key crop types, topography, and hydrology within the CoalitionGroup’s boundaries.
Provide scientific rationale for the site selection process based on the assessmentmonitoring, existing monitoring projects, or historical information.
Discuss the criteria for the selection of each monitoring site.
Propose the approach, including schedule, to sampling core monitoring sites.
Include water bodies that carry agricultural drainage, are dominated by agriculturaldrainage, or are otherwise affected by other irrigated agriculture activities.
Have management practice information provided to establish relationships (status andtrends) with water quality monitoring information.
In conjunction with assessment monitoring, demonstrate the effectiveness ofmanagement practices and implement new management practices as needed.

SECTION 4: MONITORING AND REPORTING REQUIREMENTS
4-4 WBG121311182744SAC/429592/113630002
Use data generated from the core monitoring sites to establish trend information aboutthe effectiveness of the Coalition Group’s efforts to reduce or eliminate the impact ofirrigated agriculture on surface waters.
The 2011 MRP includes monitoring at the four core sites (BS1, CBD1, CBD5, SSB) monitoredin previous Irrigated Lands Regulatory Program monitoring efforts. The four core sites andassessment Site F were monitored for propanil as a part of the voluntary PropanilManagement Plan. Because 2011 was a core monitoring year, the other two CWFRassessment sites were not included in the monitoring requirements.
Assessment MonitoringAssessment monitoring is used to provide supporting data for sites that a Coalition Groupwishes to select as core monitoring sites for trends. Supporting data also may allowconsideration for the use of some monitoring sites to be representative of other locationswithin the CRC study area.
The January 2008 Coalition MRP describes the technical requirements of the proposedassessment monitoring. These requirements include:
Focus on a diversity of monitoring sites across the Coalition Group’s area (hydrology,size, and flow).
Evaluate different types of water bodies for assessment.
Include a sufficient number of sampling sites to assess the entire Coalition Group areaand all drainages.
Propose the approach, including schedule, to sampling assessment monitoring sites.
Include sampling sites in areas of known water quality impairments, even if they are notcurrently identified on the Clean Water Act (CWA) 303(d) listing.
Include sampling sites that are compliance monitoring sites for total maximum dailyloads (TMDLs), where implementation is conducted by the Coalition Group.
Provide scientific rationale for the site selection process based on historical and/orongoing monitoring, drainage size, crop types and distribution, and topography andland use.
Discuss the criteria for the selection of each monitoring site.
Conduct the initial focus of monitoring on water bodies that carry agricultural drainageor are dominated by agricultural drainage.
Identify priorities with respect to work on specific watersheds, subwatersheds, andwater quality parameters.
In conjunction with core monitoring for trends and special projects focused on specificproblems, demonstrate the effectiveness of management practices, and identify locationsfor implementation of new management practices, as needed.
Include the requirements provided in Parts I through III of the 2008 Coalition MRP.

SECTION 4: MONITORING AND REPORTING REQUIREMENTS
WBG121311182744SAC/429592/113630002 4-5
The three assessment sites, shown in Table 4-2 and described in the following sections, werenot included in the 2011 MRP, as it was a core monitoring year.
TABLE 4-2CWFR and RPP Monitoring Sites
SiteCode Site Name Latitude Longitude
Estimated RiceArea Captured
by Station(acres) Program(s) Site Type
CBD1 Colusa Basin Drain aboveKnights Landing
38.81255 -121.775 171,165 CWFR, RPP Core
CBD5 Colusa Basin Drain #5 39.18648 -122.045 156,000 CWFR, RPP Core
BS1 Butte Slough at Lower PassRoad
39.18763 -121.908 183,617 CWFR, RPP Core
SSB Sacramento Slough Bridgenear Karnak
38.7842 -121.654 24,549 CWFR, RPP Core
F Lurline Creek; upstream site ofCBD5
39.21838 -122.151 -- CWFR Assessment
G Cherokee Canal; upstreamsite for BS1
39.362 -121.868 -- CWFR Assessment
H Obanion Outfall at DWRPumping Plant on ObanionRoad
39.02536 -121.728 -- CWFR Assessment
SR1 Sacramento River at VillageMarina/ Crawdads Cantina
38.60359 -121.518 ~500,000 RPP River
Note: LAT/LON coordinates are NAD83 datum.
Special Project MonitoringSpecial project monitoring is to be established on water bodies where waste-specificmonitoring or targeted source identification studies are needed. The CRC’s AlgaeManagement Plan and Propanil Management Plan are considered special projectmonitoring (Appendixes B-4 and B-5). The 2011 MRP incorporated propanil special projectmonitoring, but no additional monitoring was required for algae in 2011.
RPPThe RPP requires the following types of water quality monitoring and evaluation:
Thiobencarb water quality monitoring
Pesticide use reporting
Monitoring Sites
Monitoring under both the CWFR and the RPP is conducted at specific sites. Table 4-2 listssite names, locations, and drainage area for each of the sites under the CWFR and RPPmonitoring programs. Figure 4-1 shows the locations of the CWFR assessment and coremonitoring sites, and the locations of the RPP monitoring sites.

SECTION 4: MONITORING AND REPORTING REQUIREMENTS
4-6 WBG121311182744SAC/429592/113630002
CWFR SitesThe 2011 monitoring season was a core monitoring season (Table 4-1), and monitoring wasconducted at assessment Site F as a part of the voluntary Propanil Management Plan.Assessment sites G and H were not included in 2011 monitoring because 2011 was a coremonitoring year and the two sites are not included in a management plan. Figure 4-1 showsthe locations of the four CWFR core sites and the three CWFR assessment sites.
RPP SitesUnder the RPP, the CRC performs water quality and flow monitoring at five sites. Four ofthese sites (CBD1, CBD5, BS1, and SSB) are also monitored under the CWFR, while the fifthsite (SR1) is monitored only under the RPP. Figure 4-1 shows the five RPP monitoring sites.
CBD1CBD1 is located on the ColusaBasin Drain. Water samples atCBD1 were collected from themiddle of the bridge alongRoad 99E as it crosses ColusaBasin Drainage Canal nearRoad 108 west of KnightsLanding. CBD1 is monitoredunder both the CWFR (core) andthe RPP.
PHOTO 1CBD1: Colusa Basin Drain #1

Salt Creek
Dry Creek
Stone Corral Creek
Dry Creek
Pleasant Grove Creek
Logan Creek
Bear River
Butte
Cree
k
Auburn Ravine
Bear
River
Colusa Trough
Honcut Creek
Colusa
Trough
Sacr
amen
to R
iver
Colusa Basin Drainage Canal
Willow Slough
Cache
Creek
South Honcut Creek
North Honcut Creek
Che
rok e
e C
anal
Sacramento River
South Fork Putah Creek
Glenn-Colusa Canal
Cortina Creek
Yuba River
Sand Creek
Feat
her R
iver
Sacramento
River
Putah Creek
Feather River
Feather River
Sna
ke R
iver
Coon Creek
Beale AirBeale AirForce BaseForce Base
Sacramento International
275
160
20
128
113
65
99
70
84
16
45
50
5
80
505
Davis
Yuba City
WoodlandWoodland
WintersWinters
ColusaColusa
WilliamsWilliams
Live OakLive Oak
GridleyGridley
Sacramento
SSB
CBD1
BS1
F
SR1
H
G
CBD5
MONITORING SITESRICE PESTICIDES PROGRAMCALIFORNIA RICE COMMISSION
\\ZION\SACGIS\PROJ\RICECOMMISION_343599\MAPFILES\MONITORING_SITES_SB_FEB09.MXD MONITORING_SITES_SB_FEB09.PDF CARCHER 2/3/2009 10:09:28
0 7 14
Miles
LegendCWFR Assessment Sites
CWFR & RPP Core Sites
RPP River Site


SECTION 4: MONITORING AND REPORTING REQUIREMENTS
WBG121311182744SAC/429592/113630002 4-9
CBD5
CBD5 is located on the ColusaBasin Drain within the ColusaNational Wildlife Refuge. Watersamples at CBD5 were collectedfrom the middle of the secondbridge at the Colusa NationalWildlife Refuge south ofHighway 20. CBD5 is monitoredunder both the CWFR (core) andthe RPP.
PHOTO 2CBD5: Colusa Basin Drain #5
BS1BS1 is located on Butte Slough.Water samples at BS1 werecollected from the middle of thebridge along Lower Pass Road,which crosses Butte Soughnortheast of Meridian, California.In 1995 and 1996, samples werecollected at the west end of thewashed out bridge. Sampling atthe new bridge site started in 1997.BS1 is monitored under both theCWFR (core) and the RPP.
PHOTO 3BS1: Butte Slough #1
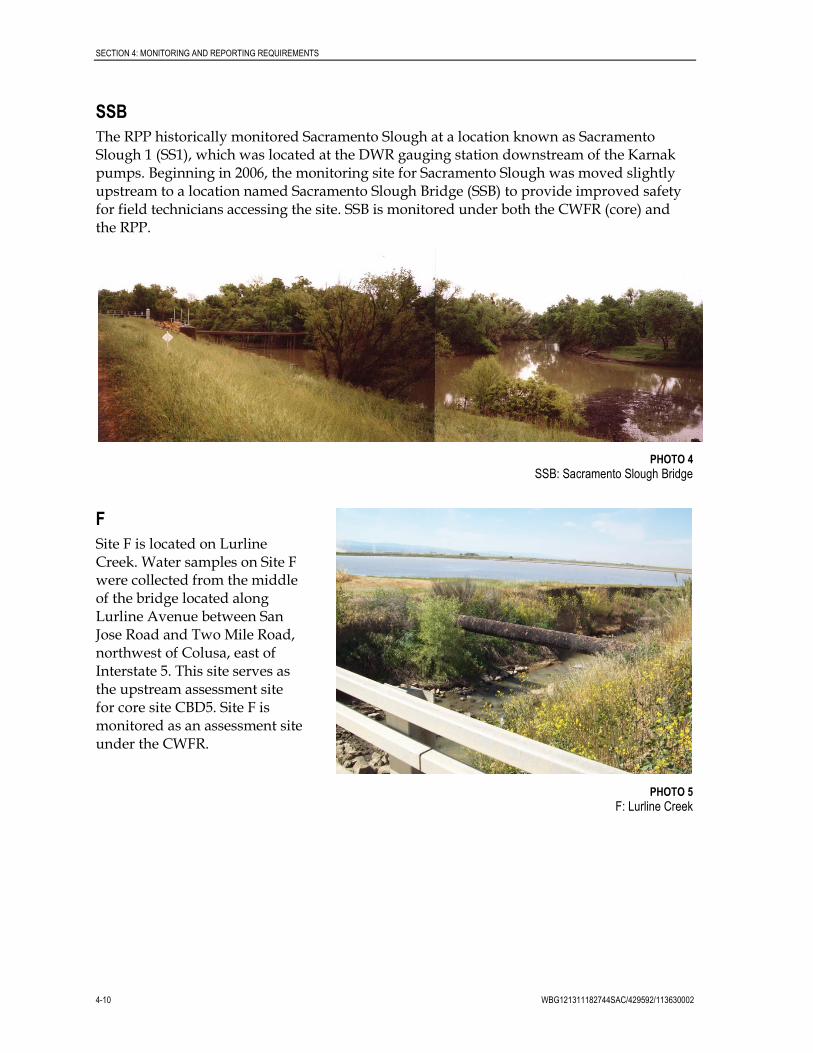
SECTION 4: MONITORING AND REPORTING REQUIREMENTS
4-10 WBG121311182744SAC/429592/113630002
SSB
The RPP historically monitored Sacramento Slough at a location known as SacramentoSlough 1 (SS1), which was located at the DWR gauging station downstream of the Karnakpumps. Beginning in 2006, the monitoring site for Sacramento Slough was moved slightlyupstream to a location named Sacramento Slough Bridge (SSB) to provide improved safetyfor field technicians accessing the site. SSB is monitored under both the CWFR (core) andthe RPP.
PHOTO 4SSB: Sacramento Slough Bridge
F
Site F is located on LurlineCreek. Water samples on Site Fwere collected from the middleof the bridge located alongLurline Avenue between SanJose Road and Two Mile Road,northwest of Colusa, east ofInterstate 5. This site serves asthe upstream assessment sitefor core site CBD5. Site F ismonitored as an assessment siteunder the CWFR.
PHOTO 5F: Lurline Creek

SECTION 4: MONITORING AND REPORTING REQUIREMENTS
WBG121311182744SAC/429592/113630002 4-11
G
Site G is located on CherokeeCanal. Water samples on Site Gwere collected from the middleof the bridge located alongColusa Highway, west of HatchRoad and east of Gridley Roadand Butte Creek. This siteserves as the upstreamassessment site for ore site BS1.Site G is monitored under theCWFR (assessment).
PHOTO 6G: Cherokee Canal
HSite H is located at the ObanionOutfall at DWR pumping plant(DWR PP) on Obanion Road.Water samples on Site H werecollected from the middle of thebridge along Obanion Roadwest of Boulton Road andimmediately east of the SutterBypass levee. Site H ismonitored under the CWFR(assessment).
PHOTO 7H: Obanion Outfall

SECTION 4: MONITORING AND REPORTING REQUIREMENTS
4-12 WBG121311182744SAC/429592/113630002
SR1
SR1 is located on theSacramento River. Watersamples at SR1 were collectedfrom the Sacramento River atthe Village Marina along theGarden Highway inSacramento. The SR1 watersamples were collected fromthe edge of a floating dock nearthe entrance of a restaurantalong the east bank of theSacramento River. Kleinfeldernoted the river level on a staffgauge located along a middledock between the samplingpoint and the riverbank. SR1 ismonitored under only the RPP.
PHOTO 8SR1: Sacramento River Village Marina
Schedule and Constituents
The monitoring schedules for CWFR and RPP sampling are based on the timing andfrequency of discharge from rice fields that may contain constituents that affect waterquality. The current monitoring periods for the CWFR were developed based on theunderstanding of the rice growing season and analysis of historical data, including datacollected since 2004 under the CWFR.
The period with the greatest risk to water quality occurs during the peak pesticideapplication period from April through June. During this period into July, water may bereleased from the field. From mid- July to mid-August, water is held on rice fields to protectgrain development. A top-dressing of nutrients may be added during the water hold.Rice drainage season, when the rice fields are drained prior to harvest, typically occurs frommid-August through September. After harvest, rice fields are generally flooded todecompose rice straw and to provide waterfowl habitat. No application of fertilizers orpesticides occurs on rice fields during the winter until the fields are drained inmid-February or March. Field preparation for the next season may include applications offertilizers.
The monitoring calendar has been developed to focus sampling on the periods of risk towater quality. Monitoring is scheduled to provide for water quality assessment during thepeak rice-pesticide application period. A typical monitoring calendar is established in theCRC MRP, but annual weather conditions and other factors may affect planting andpesticide application, and therefore the actual start-date of monitoring is establishedannually to ensure that sampling brackets the actual pesticide use season. In 2011, themonitoring start-date was delayed due to atypical weather that delayed planting. CRCwater quality monitoring for 2011 generally included:

SECTION 4: MONITORING AND REPORTING REQUIREMENTS
WBG121311182744SAC/429592/113630002 4-13
Monthly CWFR sampling of general parameters at core sites, May through August
Monthly CWFR dissolved copper sampling at core sites, May and June
Weekly CWFR special project monitoring for propanil during June and July
RPP sampling for 10 weeks (May-July), with weekly samples during weeks 1, 2, 3, 8, 9,and 10, with more intensive biweekly sampling conducted during weeks 4, 5, 6, and 7.
CWFRThe MRP specifies the constituents for which monitoring and laboratory analyses are to beconducted. Table 4-3 presents the constituents for which monitoring was required during2011.
TABLE 4-3CWFR Monitoring Requirements, 2011
Constituent UnitsSample
Type Type of Monitoring
Irrigation SeasonSampling Frequency
(May to August)
Flow cfs Fielda
Core Monthly
pH pH units Field Core Monthly
Electrical conductivity µmhos/cm Field Core Monthly
Dissolved oxygen mg/L Field Core Monthly
Temperature degrees C Field Core Monthly
Turbidity NTUs Field Core Monthly
Total dissolved solids (TDS) mg/L Grab Core Monthly
Total organic carbon (TOC) mg/L Grab Core Monthly
Hardness mg/L Grab Coreb
May and June events
Dissolved copper µg/L Grab Coreb
May and June events
Propanil Management Plan µg/L Grab Core + assessment site F Weekly (June 7 – July 26)
aFlow also may be obtained from DWR monitoring stations, where available.
bOnly monitored during the first two events, as required in the MRP.
Notes:
µg/L = micrograms per literµmhos/cm = micromhos per centimetercfs = cubic feet per secondmg/L = milligrams per literNTU = nephelometric turbidity unit
RPPMonitoring for the RPP is conducted during the period of peak rice pesticide use. Monitoringis conducted once per week for the first 3 weeks, then is increased to twice per week for thefollowing 4 weeks (corresponding with peak usage), and then is decreased to once per weekfor the final 3 weeks, as shown in Table 4-4.

SECTION 4: MONITORING AND REPORTING REQUIREMENTS
4-14 WBG121311182744SAC/429592/113630002
TABLE 4-4RPP Monitoring and Reporting Requirements, 2011
Constituent UnitsSample
Type
Sampling Frequency
Weeks 1–3 Weeks 4–7 Weeks 8–10
Thiobencarb µg/L Grab Weekly Biweekly Weekly
2011 Monitoring CalendarRice planting was delayed in 2011 because of atypical weather conditions. As a result, thetypical April start date for monitoring would not have captured pesticide use. Therefore, thefirst week of monitoring was delayed to May to better coincide with the peak use season.This decision was made in consultation with the CACs, rice growers, Pest Control Advisers,Farm Advisers, and the CVRWQCB staff.
CWFR
CWFR monitoring was conducted May through August. The first sample date wasMay 10, and sampling concluded on August 23. Dissolved copper, which is specified in theMRP for monitoring in April and May, was sampled in May and June to provide forsampling during the peak copper use period.
Propanil special project monitoring was conducted weekly for 8 weeks, from June 7 throughJuly 26. This sampling duration exceeds the requirements of the MRP and was implementedat the CRC’s discretion because of the unusual weather and planting conditions.
RPP
RPP sampling was conducted for 10 weeks, beginning on May 10 and concluding onJuly 12, 2011.
Administration and ExecutionFor the CWFR and the RPP, the CRC contracted with Kleinfelder to collect water samplesand coordinate with laboratories. Following each monitoring event, field data sheets,chain-of-custody (COC) forms, and calibration logs were scanned and e-mailed toCH2M HILL. Kleinfelder was the primary contact for all laboratory services. After analysis,the labs submitted data to Kleinfelder, which then forwarded the data to CH2M HILL forreview and analysis.
Sampling ProceduresSampling was conducted pursuant to the procedures described in the CRC’s QualityAssurance Project Plan (CH2M HILL, 2010), unless otherwise noted.
Field MeasurementsField water quality parameters for the CWFR, provided in Table 4-3, were measured prior tosample collection at each site, and flow was measured after samples were collected. At each

SECTION 4: MONITORING AND REPORTING REQUIREMENTS
WBG121311182744SAC/429592/113630002 4-15
site, a water quality sheet was completed; this documented the surface water level, width ofthe waterway, sample depth at the middle of the water column, total depth to sediment,general weather observations, time arrived on site, and field water quality measurements.Unless otherwise noted, field measurements were taken at a depth equal to approximatelyhalf the water column.
Flow
Flow is measured only under the CWFR. Measurements are taken at 10 cross-sections ateach site. The wetted width of the water body was measured, recorded, and divided by10 to determine the width of each cross-section. The midpoint of each cross-section wascalculated by dividing the cross-section width in half. Velocity was measured at themidpoint of each cross-section at 0.2 and 0.8 of the total depth from the water surface, andthen averaged. Flow was then calculated using the following equation:
10
1nnnn VDWQ
Where:
Q = estimated flow at the site (cfs)W = section width (feet)D = depth of measurement (feet)V = velocity (feet per second)
Electrical Conductivity, Dissolved Oxygen, Temperature, and pH
Electrical conductivity (EC), dissolved oxygen (DO), temperature, and pH measurementsare taken for the CWFR monitoring programs. These parameters were measured using amultiprobe instrument that was lowered directly into the water column. The meter wasallowed to equilibrate for at least 90 seconds before data were recorded. The meter wascalibrated at the beginning of the sampling day. Calibration logs for the CWFR monitoringevents are included in Appendix B-1, and the logs for the RPP monitoring events areincluded in Appendix C-1.
Turbidity
Turbidity was measured using a turbidity meter. Turbidity measurements were recordedfor the CWFR.
Grab Samples
For the CWFR and the RPP, a qualified and trained crew of Kleinfelder technicians collectedthe grab samples. The water grab samples were collected using a Kemmerer water sampler(either stainless steel and Teflon model or clear acrylic and PVC model; approximately 1.5-liter volume) at a depth equal to one-half the water column. The Kemmerer was emptiedinto a stainless steel container and the process repeated until the appropriate volume ofwater was acquired to split into the required number of samples. This process allowed forhomogenization as additional sample volume was added to the container. Certified samplecontainers were filled with the composite sample using a stainless steel funnel, with anadditional bottle filled, and to be held in sample control as a backup sample.

SECTION 4: MONITORING AND REPORTING REQUIREMENTS
4-16 WBG121311182744SAC/429592/113630002
Non-disposable equipment used in sample collection was decontaminated after each use byrinsing thoroughly with distilled water. The sample equipment was also rinsed at each sitewith water from the middle of the water column before sample collection. Clean samplingequipment was not allowed to touch the ground, and field personnel wore clean, disposablegloves. New, clean sample bottles and jars were provided by the analytical laboratories orpurchased from a supply company.
Sample containers were labeled at the time of sample collection with a unique sample IDnumber. The label contained the following information:
Sample ID
Sample location
Date and time of sample collection
Kleinfelder project number
Sampling technician identification
Samples were held on wet or blue ice at 4°C until delivered to the laboratory for analysis.
Sample Custody and Documentation
For the CWFR and the RPP, custody of samples was maintained and documented from thetime of sample collection to completion of analysis. Each sample was considered to be in thesampler’s custody, and the sampler was responsible for the care and custody of the samplesuntil they were delivered to the laboratory. Field data sheets and copies of COC forms weremaintained in the project file for samples collected during each event.
A COC form, sample labels, and field documentation were crosschecked to verify sampleidentification, type of analyses, sample volume, and number and type of containers.
Field data sheets, COC forms, and calibration forms were scanned by Kleinfelder andsubmitted to CH2M HILL. CWFR and RPP COC forms are included in Appendixes B-1and C-1, respectively.
Sample Delivery and AnalysisFor the CWFR and the RPP, after each sampling event, Kleinfelder submitted the samplesunder COC to the laboratories. Sample shipments were accompanied by the original COCform, which identified contents. Samples were transported after sample collection to the labfor analysis within the sample holding time. The laboratories performing the analyses andthe methods used are listed in Table 4-5.

SECTION 4: MONITORING AND REPORTING REQUIREMENTS
WBG121311182744SAC/429592/113630002 4-17
TABLE 4-5Analytical Laboratories and Methods, 2011
Laboratory Analytes
Analytical Method(s)Standard OperatingProcedures Notes
California LaboratoryServices (CLS)3249 Fitzgerald RoadRancho Cordova, CA 95742
Total Hardness as CalciumCarbonate (CaCO3)
SM2340B
Dissolved Copper EPA 200.8
TOC SM5310B
TDS SM2540C
Thiobencarb (QC samples) EPA 507
McCampbell Analytical, Inc.(MAI)1534 Willow Pass RoadPittsburg, CA 94565
Propanil EPA 532
Valent Dublin Laboratory(Registrant Laboratory)6560 Trinity CourtDublin, CA 94568
Thiobencarb Registrant method Analyzed underthe RPP


WBG121311182744SAC/429592/113630002 5-1
SECTION 5
2011 Monitoring
The 2011 CWFR and RPP monitoring season information and results are providedseparately according to the relevant required information for each program. CWFRmonitoring information is provided in the following order:
Sampling schedule
Field parameter results
Lab parameter results
2011 flow data
Dissolved copper and hardness analysis
Management Plans (including the Algae Management Plan [AMP] and the PropanilManagement Plan)
RPP monitoring information is provided in the following order:
RPP Performance Goals
Water holds
Pesticides monitored
Sampling schedule
Sampling collection, delivery, and analysis
Results
CWFR Monitoring
Monitoring is conducted under the CWFR according to the MRP. Monitoring at thefour core sites included measurement of general physical parameters (including lab analysisof total dissolved solids [TDS], total organic carbon [TOC], dissolved copper, and hardness).Monitoring at assessment Site F was also conducted when the CWFR and PropanilManagement Plan sampling dates coincided. The 2011 CWFR monitoring requirements andresults follow.
Sampling Schedule
The MRP specifies the general calendar for monitoring. Based on an understanding of therice growing season, a rice-specific monitoring calendar was developed to sample the Aprilthrough August “irrigation season,” with an event in August to sample a typical drainageevent. In 2011, sampling began in May because of late rains that delayed planting. Table 5-1lists regularly scheduled monitoring. No resampling was required in 2011.
Field Parameter ResultsThe following field parameters were measured as part of the 2011 sampling effort:temperature, DO, pH, EC, turbidity, and flow.

SECTION 5: 2011 MONITORING
5-2 WBG121311182744SAC/429592/113630002
TABLE 5-12011 CWFR Sampling Calendar
EventType Month
SampleDate Field Copper Hardness TDS TOC
QCSamples
Irrigation May 5/12/2011 CBD1
June 6/14/2011 CBD1
July 7/19/2011 NR NR NA
August 8/23/2011 NR NR NA
Notes:
NR = not required by the MRPNA = not applicable
Temperature Measurements
Temperature measurements were taken during field sampling using a multiprobeinstrument. Figure 5-1 shows the 2011 field temperature results. Temperatures in waterbodies are typically lowest in the winter and highest in the summer. Peak watertemperatures were observed during the June (Event 2) sampling event, with a high of80.3°F. As seen in previous years, water temperature in these water bodies essentially trackswith ambient air temperature. During peak temperatures, these drain sites would notprovide habitat for coldwater fisheries, although they may provide coldwater habitat duringother times of the year.
FIGURE 5-1Field Temperature Measurements, 2011
60.0
65.0
70.0
75.0
80.0
85.0
CWFR Event 1 CWFR Event 2 CWFR Event 3 CWFR Event 4
Tem
pe
ratu
re(d
egr
ee
sFa
hre
nh
eit
)
Conditional Waiver for Rice2011 Field Measurements - Temperature
F
BS1
CBD5
CBD1
SSB
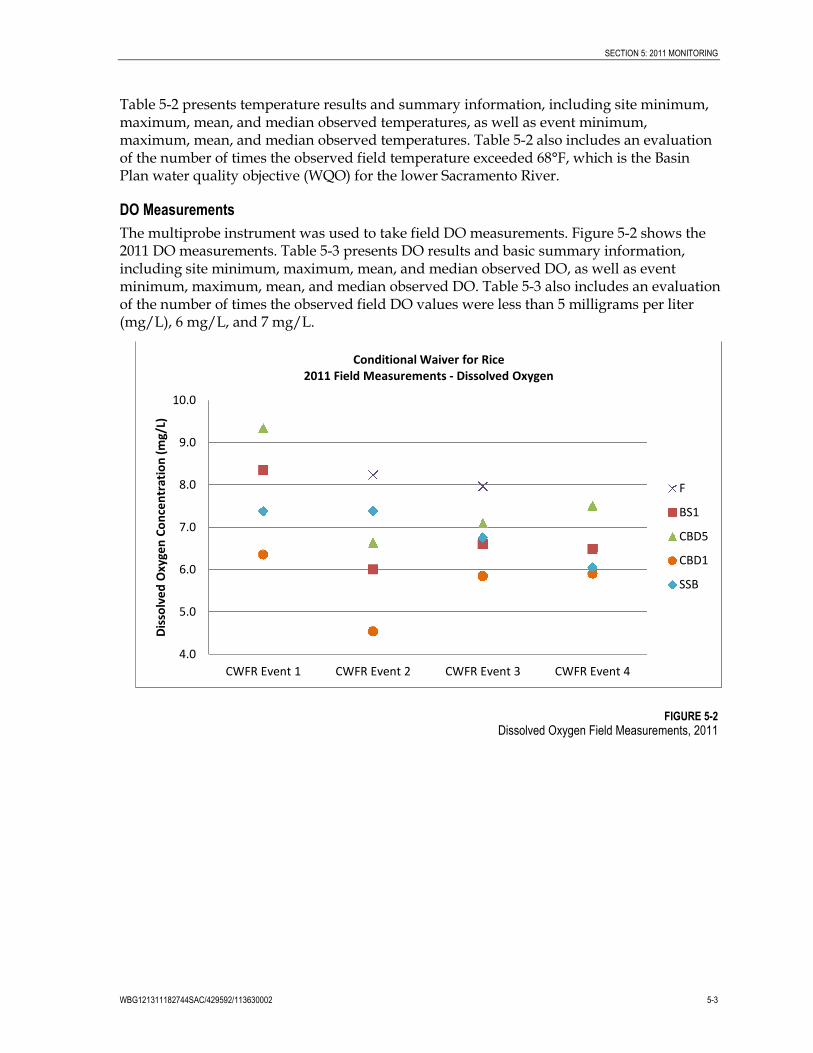
SECTION 5: 2011 MONITORING
WBG121311182744SAC/429592/113630002 5-3
Table 5-2 presents temperature results and summary information, including site minimum,maximum, mean, and median observed temperatures, as well as event minimum,maximum, mean, and median observed temperatures. Table 5-2 also includes an evaluationof the number of times the observed field temperature exceeded 68°F, which is the BasinPlan water quality objective (WQO) for the lower Sacramento River.
DO Measurements
The multiprobe instrument was used to take field DO measurements. Figure 5-2 shows the2011 DO measurements. Table 5-3 presents DO results and basic summary information,including site minimum, maximum, mean, and median observed DO, as well as eventminimum, maximum, mean, and median observed DO. Table 5-3 also includes an evaluationof the number of times the observed field DO values were less than 5 milligrams per liter(mg/L), 6 mg/L, and 7 mg/L.
FIGURE 5-2Dissolved Oxygen Field Measurements, 2011
4.0
5.0
6.0
7.0
8.0
9.0
10.0
CWFR Event 1 CWFR Event 2 CWFR Event 3 CWFR Event 4
Dis
solv
ed
Oxy
gen
Co
nce
ntr
atio
n(m
g/L)
Conditional Waiver for Rice2011 Field Measurements - Dissolved Oxygen
F
BS1
CBD5
CBD1
SSB

SECTION 5: 2011 MONITORING
5-4 WBG121311182744SAC/429592/113630002
TABLE 5-2Field Temperature Measurements, 2011
Sample Event Sample Date
Temperature (°F)EventLow
EventMean
EventMedian
EventHigh
EventVariance
EventStandardDeviation NBS1 CBD5 CBD1 SSB F
CWFR Event 1 5/12/2011 62.7 65.7 67 68.3 NR 62.7 65.9 66.4 68.3 5.7 2.4 4
CWFR Event 2 6/14/2011 74.9 80.3 79.1 79.5 79.1 74.9 78.6 79.1 80.3 4.4 2.1 5
CWFR Event 3 7/19/2011 75.1 74.4 76.2 78.4 71.1 71.1 75 75.1 78.4 7.1 2.7 5
CWFR Event 4 8/17/2011 75.7 72.8 75.4 78.1 NR 72.8 75.5 75.5 78.1 4.7 2.2 4
Site Low 62.7 65.7 67 68.3 71.1
Site Mean 72.1 73.3 74.4 76 75.1
Site Median 75 73.6 75.8 78.2 75.1
Site High 75.7 80.3 79.1 79.5 79.1
Site Variance 39.1 36.1 26.8 27.2 32.4
Site Standard Deviation 6.3 6 5.2 5.2 5.7
N 4 4 4 4 2
Number of obs. Temp >68°F 3 3 3 4 2
Number of obs. Temp <68°F 1 1 1 0 0
Percent of obs. where Temp>68°F
75% 75% 75% 100% 100%
Percent of obs. where temp<68°F
25% 25% 25% 0% 0%
Note:
NR = not required

SECTION 5: 2011 MONITORING
WBG121311182744SAC/429592/113630002 5-5
TABLE 5-3Dissolved Oxygen Field Measurements, 2011
Sample Event Sample Date
Dissolved OxygenConcentration (mg/L)
EventLow
EventMean
EventMedian
EventHigh
EventVariance
EventStandardDeviation N
Number ofobs. DO<7
Number ofobs. DO<6
Number ofobs. DO<5
Percent ofobs. DO<7
Percent ofobs. DO<6
Percent ofobs. DO<5BS1 CBD5 CBD1 SSB F
CWFR Event 1 5/12/2011 8.35 9.34 6.36 7.39 NR 6.36 7.86 7.87 9.34 1.64 1.28 4 1 0 0 25% 0% 0%
CWFR Event 2 6/14/2011 6.01 6.64 4.55 7.39 8.24 4.55 6.56 6.64 8.24 1.97 1.4 5 3 1 1 60% 20% 20%
CWFR Event 3 7/19/2011 6.6 7.09 5.85 6.76 7.98 5.85 6.86 6.76 7.98 0.6 0.77 5 3 1 0 60% 20% 0%
CWFR Event 4 8/17/2011 6.49 7.51 5.91 6.06 NR 5.91 6.49 6.27 7.51 0.52 0.72 4 3 1 0 75% 25% 0%
Site Low 6.01 6.64 4.55 6.06 7.98
Site Mean 6.86 7.64 5.66 6.9 8.11
Site Median 6.55 7.3 5.88 7.07 8.11
Site High 8.35 9.34 6.36 7.39 8.24
Site Variance 1.05 1.41 0.61 0.4 0.04
Site Standard Deviation 1.03 1.19 0.78 0.63 0.19
N 4 4 4 4 2
Number of obs. DO<7 3 1 4 2 0
Number of obs. DO<6 0 0 3 0 0
Number of obs. DO<5 0 0 1 0 0
Percent of obs. DO<7 75% 25% 100% 50% 0%
Percent of obs. DO<6 0% 0% 75% 0% 0%
Percent of obs. DO<5 0% 0% 25% 0% 0%
Note:
NR = not required

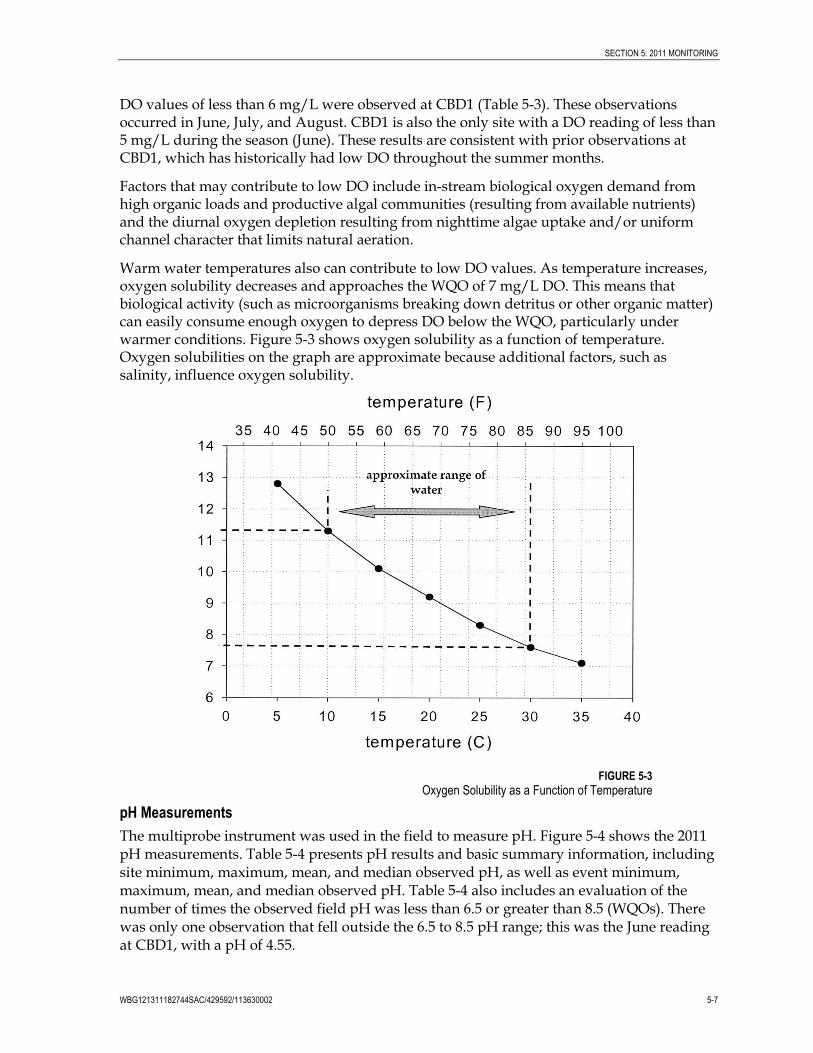
SECTION 5: 2011 MONITORING
WBG121311182744SAC/429592/113630002 5-7
DO values of less than 6 mg/L were observed at CBD1 (Table 5-3). These observationsoccurred in June, July, and August. CBD1 is also the only site with a DO reading of less than5 mg/L during the season (June). These results are consistent with prior observations atCBD1, which has historically had low DO throughout the summer months.
Factors that may contribute to low DO include in-stream biological oxygen demand fromhigh organic loads and productive algal communities (resulting from available nutrients)and the diurnal oxygen depletion resulting from nighttime algae uptake and/or uniformchannel character that limits natural aeration.
Warm water temperatures also can contribute to low DO values. As temperature increases,oxygen solubility decreases and approaches the WQO of 7 mg/L DO. This means thatbiological activity (such as microorganisms breaking down detritus or other organic matter)can easily consume enough oxygen to depress DO below the WQO, particularly underwarmer conditions. Figure 5-3 shows oxygen solubility as a function of temperature.Oxygen solubilities on the graph are approximate because additional factors, such assalinity, influence oxygen solubility.
FIGURE 5-3Oxygen Solubility as a Function of Temperature
pH Measurements
The multiprobe instrument was used in the field to measure pH. Figure 5-4 shows the 2011pH measurements. Table 5-4 presents pH results and basic summary information, includingsite minimum, maximum, mean, and median observed pH, as well as event minimum,maximum, mean, and median observed pH. Table 5-4 also includes an evaluation of thenumber of times the observed field pH was less than 6.5 or greater than 8.5 (WQOs). Therewas only one observation that fell outside the 6.5 to 8.5 pH range; this was the June readingat CBD1, with a pH of 4.55.

SECTION 5: 2011 MONITORING
5-8 WBG121311182744SAC/429592/113630002
FIGURE 5-4pH Field Measurements, 2011
4.0
4.5
5.0
5.5
6.0
6.5
7.0
7.5
8.0
8.5
CWFR Event 1 CWFR Event 2 CWFR Event 3 CWFR Event 4
pH
Conditional Waiver for Rice2011 Field Measurements - pH
F
BS1
CBD5
CBD1
SSB

SECTION 5: 2011 MONITORING
WBG121311182744SAC/429592/113630002 5-9
TABLE 5-4pH Field Measurements, 2011
Sample EventSample
Date
pH
EventLow
EventMean
EventMedian
EventHigh
EventVariance
EventStandardDeviation N
Number ofobs. pH<6.5
Number ofobs. pH>8.5
Percent ofobs. pH<6.5
Percent ofobs. pH>8.5BS1 CBD5 CBD1 SSB F
CWFR Event 1 5/12/2011 7.76 8.04 7.92 7.82 NR 7.76 7.88 7.87 8.04 0.01 0.12 4 0 0 0% 0%
CWFR Event 2 6/14/2011 7.64 6.64 4.55 7.79 8.13 4.55 6.95 7.64 8.13 2.11 1.45 5 1 0 20% 0%
CWFR Event 3 7/19/2011 7.91 8.01 8.11 7.97 7.84 7.84 7.97 7.97 8.11 0.01 0.1 5 0 0 0% 0%
CWFR Event 4 8/17/2011 7.71 7.81 7.93 7.73 NR 7.71 7.79 7.77 7.93 0.01 0.1 4 0 0 0% 0%
Site Low 7.64 6.64 4.55 7.73 7.84
Site Mean 7.75 7.62 7.12 7.83 7.98
Site Median 7.74 7.91 7.92 7.8 7.98
Site High 7.91 8.04 8.11 7.97 8.13
Site Variance 0.01 0.44 2.96 0.01 0.04
Site Standard Deviation 0.11 0.67 1.72 0.1 0.21
N 4 4 4 4 2
Number of obs. pH<6.5 0 0 1 0 0
Number of obs. pH>8.5 0 0 0 0 0
Percent of obs. pH<6.5 0% 0% 25% 0% 0%
Percent of obs. pH>8.5 0% 0% 0% 0% 0%
Note:
NR = not required

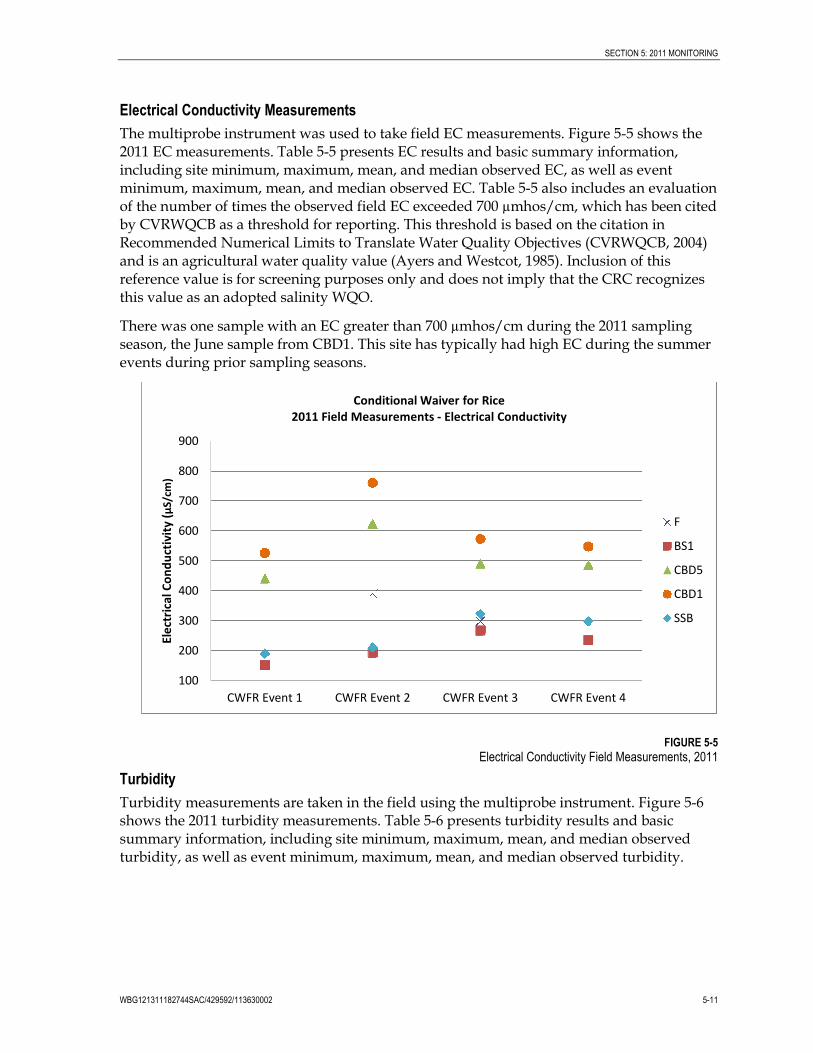
SECTION 5: 2011 MONITORING
WBG121311182744SAC/429592/113630002 5-11
Electrical Conductivity Measurements
The multiprobe instrument was used to take field EC measurements. Figure 5-5 shows the2011 EC measurements. Table 5-5 presents EC results and basic summary information,including site minimum, maximum, mean, and median observed EC, as well as eventminimum, maximum, mean, and median observed EC. Table 5-5 also includes an evaluationof the number of times the observed field EC exceeded 700 µmhos/cm, which has been citedby CVRWQCB as a threshold for reporting. This threshold is based on the citation inRecommended Numerical Limits to Translate Water Quality Objectives (CVRWQCB, 2004)and is an agricultural water quality value (Ayers and Westcot, 1985). Inclusion of thisreference value is for screening purposes only and does not imply that the CRC recognizesthis value as an adopted salinity WQO.
There was one sample with an EC greater than 700 µmhos/cm during the 2011 samplingseason, the June sample from CBD1. This site has typically had high EC during the summerevents during prior sampling seasons.
FIGURE 5-5Electrical Conductivity Field Measurements, 2011
Turbidity
Turbidity measurements are taken in the field using the multiprobe instrument. Figure 5-6shows the 2011 turbidity measurements. Table 5-6 presents turbidity results and basicsummary information, including site minimum, maximum, mean, and median observedturbidity, as well as event minimum, maximum, mean, and median observed turbidity.
100
200
300
400
500
600
700
800
900
CWFR Event 1 CWFR Event 2 CWFR Event 3 CWFR Event 4
Ele
ctri
calC
on
du
ctiv
ity
(µS/
cm)
Conditional Waiver for Rice2011 Field Measurements - Electrical Conductivity
F
BS1
CBD5
CBD1
SSB

SECTION 5: 2011 MONITORING
5-12 WBG121311182744SAC/429592/113630002
Note:
NTU = nephelometric turbidity unit
FIGURE 5-6Turbidity Field Measurements, 2011
0.0
20.0
40.0
60.0
80.0
CWFR Event 1 CWFR Event 2 CWFR Event 3 CWFR Event 4
Turb
idit
y(N
TU)
Conditional Waiver for Rice2011 Field Measurements - Turbidity
F
BS1
CBD5
CBD1
SSB

SECTION 5: 2011 MONITORING
WBG121311182744SAC/429592/113630002 5-13
TABLE 5-5Electrical Conductivity Field Measurements, 2011
Sample EventSample
Date
Electrical Conductivity (µS/cm)
EventLow
EventMean
EventMedian
EventHigh
EventVariance
Event Std.Deviation N
Number ofobs.
EC>700
Percentof
obs.EC>700BS1 CBD5 CBD1 SSB F
CWFR Event 1 5/12/2011 152 441 527 191 NR 152 328 316 527 34018 184 4 0 0%
CWFR Event 2 6/14/2011 194 623 761 212 391 194 436 391 761 62896 251 5 1 20%
CWFR Event 3 7/19/2011 268 491 574 323 299 268 391 323 574 17935 134 5 0 0%
CWFR Event 4 8/17/2011 235 487 548 299 NR 235 392 393 548 22220 149 4 0 0%
Site Low 152 441 527 191 299
Site Mean 212 511 602 256 345
Site Median 215 489 561 255 345
Site High 268 623 761 323 391
Site Variance 2511 6140 11570 4203 4278
Site Std. Deviation 50.1 78.4 107.6 64.8 65.4
N 4 4 4 4 2
Number of obs. EC>700 0 0 1 0 0
Percent of obs. EC>700 0% 0% 25% 0% 0%
Note:
NR = not required
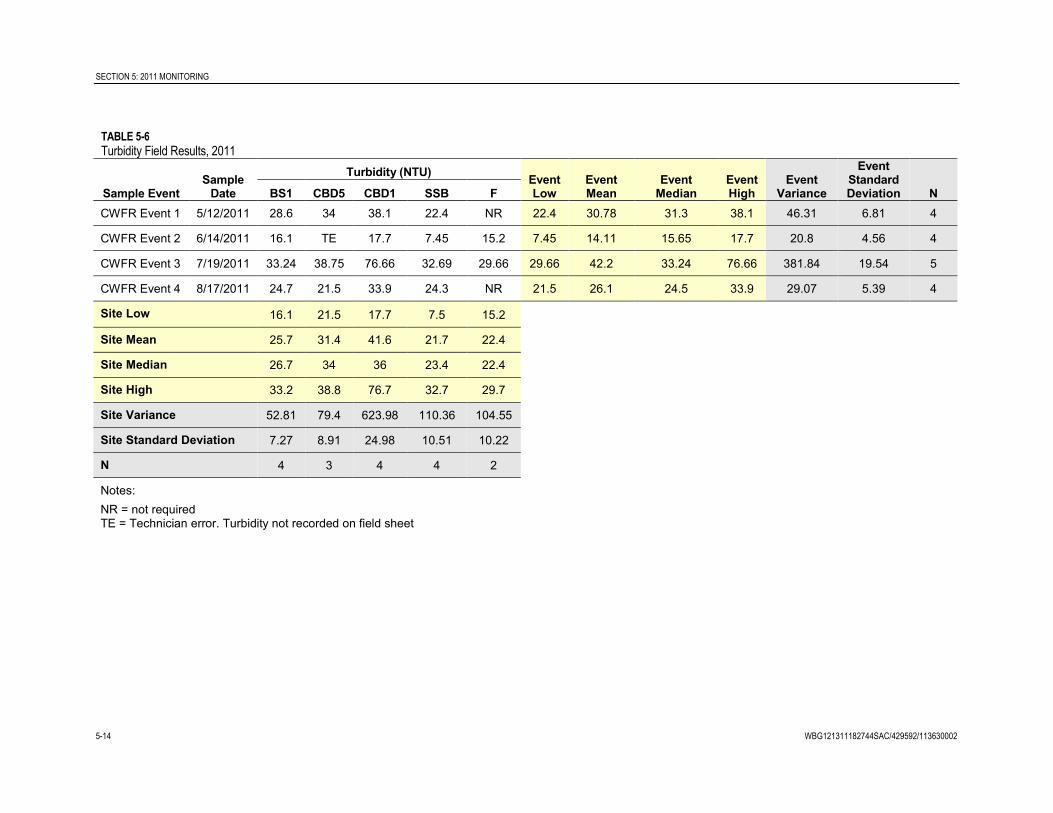
SECTION 5: 2011 MONITORING
5-14 WBG121311182744SAC/429592/113630002
TABLE 5-6Turbidity Field Results, 2011
Sample EventSample
Date
Turbidity (NTU)EventLow
EventMean
EventMedian
EventHigh
EventVariance
EventStandardDeviation NBS1 CBD5 CBD1 SSB F
CWFR Event 1 5/12/2011 28.6 34 38.1 22.4 NR 22.4 30.78 31.3 38.1 46.31 6.81 4
CWFR Event 2 6/14/2011 16.1 TE 17.7 7.45 15.2 7.45 14.11 15.65 17.7 20.8 4.56 4
CWFR Event 3 7/19/2011 33.24 38.75 76.66 32.69 29.66 29.66 42.2 33.24 76.66 381.84 19.54 5
CWFR Event 4 8/17/2011 24.7 21.5 33.9 24.3 NR 21.5 26.1 24.5 33.9 29.07 5.39 4
Site Low 16.1 21.5 17.7 7.5 15.2
Site Mean 25.7 31.4 41.6 21.7 22.4
Site Median 26.7 34 36 23.4 22.4
Site High 33.2 38.8 76.7 32.7 29.7
Site Variance 52.81 79.4 623.98 110.36 104.55
Site Standard Deviation 7.27 8.91 24.98 10.51 10.22
N 4 3 4 4 2
Notes:
NR = not requiredTE = Technician error. Turbidity not recorded on field sheet

SECTION 5: 2011 MONITORING
WBG121311182744SAC/429592/113630002 5-15
Lab Parameter Results
Core monitoring includes laboratory analysis of TDS, TOC, dissolved copper, and hardness.
TDS Measurements
TDS samples were collected in the field and analyzed in the lab. Figure 5-7 shows the 2011TDS results. Table 5-7 presents TDS results and basic summary information, including siteminimum, maximum, mean, and median observed TDS, as well as event minimum,maximum, mean, and median observed TDS.
TOC Measurements
TOC samples were collected in the field and analyzed in the lab. Figure 5-8 shows the 2011TOC results. Table 5-8 presents TOC results and basic summary information, including siteminimum, maximum, mean, and median observed TOC, as well as event minimum,maximum, mean, and median observed TOC.
Dissolved Copper and Hardness Analysis
Samples were collected for copper and hardness analysis during the first two events of theseason, in accordance with the MRP. The early season monitoring events represent the time ofcopper application and possible release. Samples were analyzed for copper using U.S.Environmental Protection Agency (EPA) Method 200.8, and hardness usingEPA Method 200.7 and calculation SM2340B. Results are shown in Table 5-9.
The California Toxics Rule (CTR) 1-hour maximum criterion for dissolved copper is:
1-hour maximum copper concentration (µg/L) = (e 0.9422[ln(hardness)]-1.700) × 0.960
The CTR 4-day maximum criterion for dissolved copper is:
4-day maximum copper concentration (µg/L) = (e 0.8545[ln(hardness)]-1.702) × 0.960
The hardness-adjusted copper criteria, based on the actual hardness measured for thesample location and date, are shown in Table 5-10. All 2011 samples were below the 1-hourand 4-day maximum copper criteria.

SECTION 5: 2011 MONITORING
5-16 WBG121311182744SAC/429592/113630002
FIGURE 5-7TDS Results, 2011
FIGURE 5-8TOC Results, 2011
0
100
200
300
400
500
CWFR Event 1 CWFR Event 2 CWFR Event 3 CWFR Event 4
Tota
lDis
solv
ed
Solid
s(m
g/L)
Conditional Waiver for Rice2011 Measurements - Total Dissolved Solids
BS1
CBD5
CBD1
SSB
0
5
10
15
20
CWFR Event 1 CWFR Event 2 CWFR Event 3 CWFR Event 4
Tota
lOrg
anic
Car
bo
n(m
g/L)
Conditional Waiver for Rice2011 Measurements - Total Organic Carbon
BS1
CBD5
CBD1
SSB

SECTION 5: 2011 MONITORING
WBG121311182744SAC/429592/113630002 5-17
TABLE 5-7TDS Lab Results, 2011
Sample EventSample
Date
Total Dissolved Solids (mg/L)EventLow
EventMean
EventMedian
EventHigh
EventVariance
EventStandardDeviation NBS1 CBD5 CBD1 SSB
CWFR Event 1 5/12/2011 110 290 340 130 110 218 210 340 13158 115 4
CWFR Event 2 6/14/2011 120 390 470 130 120 278 260 470 32092 179 4
CWFR Event 3 7/19/2011 150 290 350 180 150 243 235 350 8758 94 4
CWFR Event 4 8/17/2011 150 290 320 180 150 235 235 320 6833 83 4
Site Low 110 290 320 130
Site Mean 133 315 370 155
Site Median 135 290 345 155
Site High 150 390 470 180
Site Variance 425 2500 4600 833
Site Standard Deviation 20.6 50 67.8 28.9
N 4 4 4 4

SECTION 5: 2011 MONITORING
5-18 WBG121311182744SAC/429592/113630002
TABLE 5-8TOC Lab Results, 2011
Sample EventSample
Date
Total Organic Carbon (mg/L)EventLow
EventMean
EventMedian
EventHigh
EventVariance
EventStandardDeviation NBS1 CBD5 CBD1 SSB
CWFR Event 1 5/12/2011 3.9 5.5 6.5 4.9 3.9 5.2 5.2 6.5 1 1 4
CWFR Event 2 6/14/2011 7.3 19 19 6.5 6.5 13 13.2 19 49 7 4
CWFR Event 3 7/19/2011 4.5 6.8 8 6.7 4.5 6.5 6.8 8 2 1 4
CWFR Event 4 8/17/2011 4.2 6.1 6.9 5.3 4.2 5.6 5.7 6.9 1 1 4
Site Low 3.9 5.5 6.5 4.9
Site Mean 5 9.4 10.1 5.9
Site Median 4.4 6.5 7.5 5.9
Site High 7.3 19 19 6.7
Site Variance 2 42 36 1
Site Standard Deviation 1.57 6.46 5.97 0.89
N 4 4 4 4

SECTION 5: 2011 MONITORING
WBG121311182744SAC/429592/113630002 5-19
TABLE 5-92011 Copper and Hardness Results
Sample EventSample
Date
Dissolved CopperConcentration (µg/L) Hardness as CaCO3 (mg/L)
CBD5 BS1 CBD1 SSB CBD5 BS1 CBD1 SSB
CWFR Event 1 5/12/2011 2.8 1.0 2.5 1.4 130 61 150 77
CWFR Event 2 6/14/2011 5.5 4.1 4.3 3.0 170 86 210 87
TABLE 5-10Hardness-adjusted CTR Copper Water Quality Criteria (1-hour and 4-day maximum)
Sample EventSample
Date
1-hour maximum copperconcentration (µg/L)
4 -day maximum copperconcentration (µg/L)
CBD5 BS1 CBD1 SSB CBD5 BS1 CBD1 SSB
CWFR Event 1 5/12/2011 17.2 8.4 19.7 10.5 11.2 5.9 12.7 7.2
CWFR Event 2 6/14/2011 22.2 11.7 27 11.8 14.1 7.9 16.9 8
2011 Flow DataTable 5-11 contains the calculation of flow from the flow measurements collected during the2011 monitoring season. Flow measurements were taken at 10 cross-sections at each CWFRmonitoring site. The wetted width of the waterbody was measured, recorded, and dividedby 10 to determine the width of each cross-section. The midpoint of each cross-section wascalculated by dividing the cross-section width in half. Velocity was measured at themidpoint of each cross-section, at 20 and 80 percent of the total depth from the watersurface, and then averaged. Field measurements were documented on field sheets containedin Appendix B-1.
TABLE 5-11Flow Results
Sample EventSample
Date
Estimated Flow(cubic feet per second)
BS1 CBD5 CBD1 SSB F
CWFR Event 1 5/12/2011 383 191 10 146 NR
CWFR Event 2 6/14/2011 619 306 77 1314 51
CWFR Event 3 7/19/2011 33 745 472 2.0 82
CWFR Event 4 8/17/2011 76 940 497 701 NR
Note:
NR = not required

SECTION 5: 2011 MONITORING
5-20 WBG121311182744SAC/429592/113630002
Management PlansCVRWQCB Resolution No. R5-2006-0077 requires that coalitions implementing waterquality control programs under the Irrigated Lands Regulatory Program submitmanagement plans when monitoring results show two or more observed “exceedances”over a 3-year period. Past results have triggered management plans. Additionally, the CRCimplemented a voluntary Propanil Management Plan following one high monitoringdetection. Both final plans were submitted to the CVRWQCB in April 2010, in compliancewith the 2010 MRP. Management plan implementation in 2011 continued under both 2010plans.
Algae Management Plan
Results obtained during CRC’s 2005 through 2008 monitoring showed aquatic toxicity forSelenastrum capricornutum, an algae specified by EPA to determine chronic aquatic toxicity ofreceiving waters, triggering the submittal of an AMP. Observed toxicity for Selenastrumcapricornutum was much lower during 2009 monitoring, and the frequency and magnitudeof algae reductions showed a general downward trend. The 2010 AMP evaluated theobserved toxicity and rice pesticides concentration data collected to date, and the decisionwas made to commence monitoring under a core monitoring program regime and suspendadditional algae toxicity testing and herbicides analysis under an AMP. No algae-specificmonitoring was required in 2011.
Propanil Management Plan
Propanil monitoring at assessment and core sites was included in 2009. The CRC surpassedthe monitoring requirements by conducting additional core site propanil monitoringweekly, from June through July (peak use). Propanil results from 2009 included onedetection 47 µg/L at Site F, 11 µg/L at CBD5, and 12 µg/L at SSB. As a result, CVRWQCBstaff proposed that propanil monitoring be conducted at assessment and core monitoringsites on a weekly basis during June 2010. The CRC voluntarily proposed a PropanilManagement Plan to formalize implementation of additional grower education andoutreach. This monitoring is considered “special project monitoring” under the conditionsof the Irrigated Lands Regulatory Program.
This year propanil monitoring continued under the 2010 Propanil Monitoring Plan.Monitoring was conducted at core sites and Lurline Creek (assessment Site F), during Juneand July. This timing coordinates with the typical peak application period for propanil. Inaddition to monitoring, the plan included implementation of additional grower outreach.
Outreach activities included providing propanil use information in the CRC newsletter andgrower letter, including links to the regulations, and coordination with the registrants on abrochure, Propanil Rice Herbicide: Stewardship Practices for Protecting Water Quality.
The 2010 Propanil Management Plan is attached as Appendix B-5. The management planincludes background information on WQOs and propanil results from the 2006 through2009 monitoring seasons.
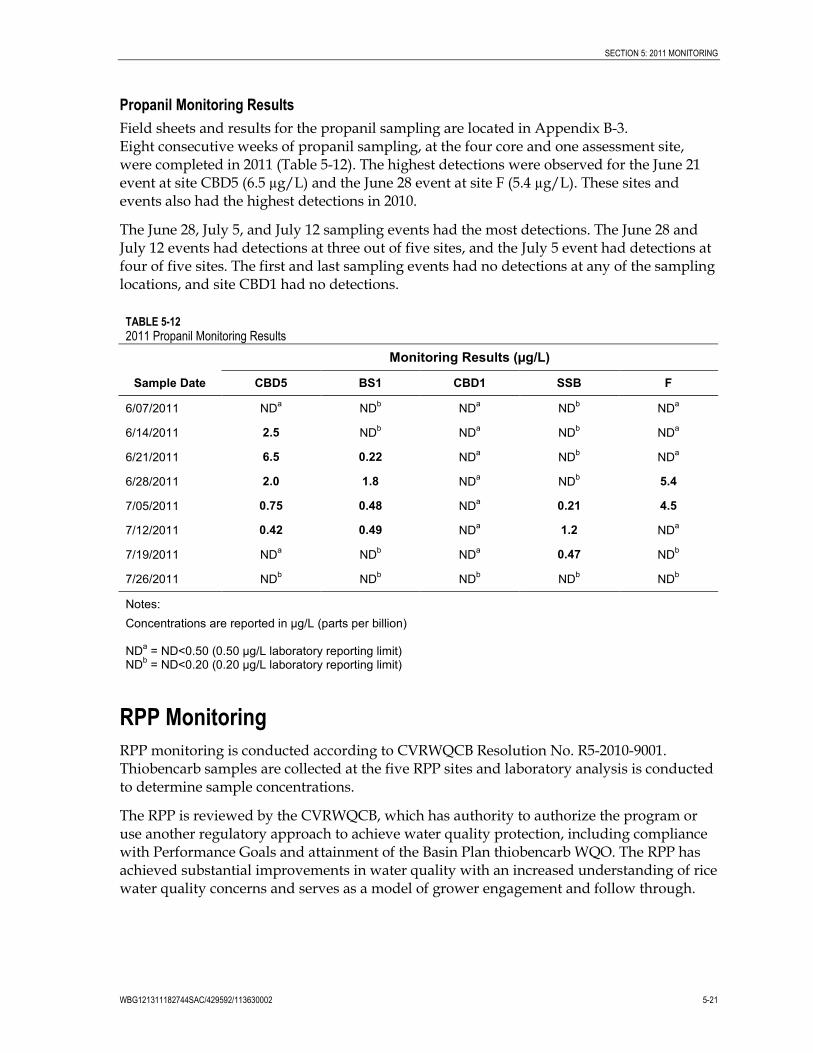
SECTION 5: 2011 MONITORING
WBG121311182744SAC/429592/113630002 5-21
Propanil Monitoring Results
Field sheets and results for the propanil sampling are located in Appendix B-3.Eight consecutive weeks of propanil sampling, at the four core and one assessment site,were completed in 2011 (Table 5-12). The highest detections were observed for the June 21event at site CBD5 (6.5 µg/L) and the June 28 event at site F (5.4 µg/L). These sites andevents also had the highest detections in 2010.
The June 28, July 5, and July 12 sampling events had the most detections. The June 28 andJuly 12 events had detections at three out of five sites, and the July 5 event had detections atfour of five sites. The first and last sampling events had no detections at any of the samplinglocations, and site CBD1 had no detections.
TABLE 5-122011 Propanil Monitoring Results
Sample Date
Monitoring Results (µg/L)
CBD5 BS1 CBD1 SSB F
6/07/2011 NDa
NDb
NDa
NDb
NDa
6/14/2011 2.5 NDb
NDa
NDb
NDa
6/21/2011 6.5 0.22 NDa
NDb
NDa
6/28/2011 2.0 1.8 NDa
NDb 5.4
7/05/2011 0.75 0.48 NDa 0.21 4.5
7/12/2011 0.42 0.49 NDa 1.2 ND
a
7/19/2011 NDa
NDb
NDa 0.47 ND
b
7/26/2011 NDb
NDb
NDb
NDb
NDb
Notes:
Concentrations are reported in µg/L (parts per billion)
NDa
= ND<0.50 (0.50 µg/L laboratory reporting limit)ND
b= ND<0.20 (0.20 µg/L laboratory reporting limit)
RPP Monitoring
RPP monitoring is conducted according to CVRWQCB Resolution No. R5-2010-9001.Thiobencarb samples are collected at the five RPP sites and laboratory analysis is conductedto determine sample concentrations.
The RPP is reviewed by the CVRWQCB, which has authority to authorize the program oruse another regulatory approach to achieve water quality protection, including compliancewith Performance Goals and attainment of the Basin Plan thiobencarb WQO. The RPP hasachieved substantial improvements in water quality with an increased understanding of ricewater quality concerns and serves as a model of grower engagement and follow through.

SECTION 5: 2011 MONITORING
5-22 WBG121311182744SAC/429592/113630002
RPP Performance GoalsSince 1990, Sacramento Valley rice farmers have operated pursuant to water qualityregulations that prohibit the discharge of irrigation return flows containing carbofuran,malathion, methyl parathion, molinate, and thiobencarb unless the discharger is followingmanagement practices approved by the CVRWQCB. The Basin Plan requires that practicesonly be approved if implementation of such practices can be expected to result incompliance with adopted numeric performance goals and narrative toxicity standards.The Basin Plan was amended to establish performance goals for the five pesticides.The goals were established to be protective of the aquatic ecosystem. The establishedperformance goals for the five pesticides regulated under the conditional prohibition ofdischarge are shown in Table 5-13. Of these pesticides, only thiobencarb is still used on ricein quantities that could potentially result in exceedances of performance goals or WQOs,absent implementation of CVRWQCB-approved management practices.
TABLE 5-13Basin Plan Performance Goals for the Five RPP Pesticides
Pesticide Basin Plan Performance Goal
Molinate 10.0 ppb
Thiobencarb 1.5 ppb
Malathion 0.1 ppb
Methyl parathion 0.13 ppb
Carbofuran 0.4 ppb
Note:
ppb = parts per billion
In addition to achieving the Basin Plan performance goal, thiobencarb levels in drinkingwater delivered to municipal customers must meet enforceable MCLs. MCLs areenforceable drinking water standards set by the EPA and the California Department ofPublic Health (CDPH, formerly the California Department of Health Services). PrimaryMCLs are health-based standards, and secondary MCLs are based on aesthetic propertiessuch as taste, color, odor, and appearance. The primary MCL for thiobencarb is 70.0 partsper billion (ppb) (toxicity), and the secondary MCL is established for nuisance at 1.0 ppb(off-taste).
Water Holds
Over the years, BMPs such as water hold requirements, grower information meetings, andinspection and enforcement were implemented to ensure compliance with performancegoals and attainment of MCLs. The water holds, which are specified on the labels and in theDPR permit conditions, are in place to provide for in-field degradation of pesticides prior tothe release of treated water to drains and other surface waters. Thiobencarb water holdrequirements were the same during 2011 as during previous growing seasons.

SECTION 5: 2011 MONITORING
WBG121311182744SAC/429592/113630002 5-23
Monitored PesticidesRPP samples were analyzed for thiobencarb during the 2011 monitoring season. As inprevious years, samples were not analyzed for molinate, carbofuran, malathion, and methyl-parathion because of registration cancellation, decrease in use, and no reportableapplications to rice. Specifically, carbofuran is no longer registered for use on rice and hashad no reportable use since 2000. Malathion has not been monitored since 2003 because of adramatic decrease in its use. Historical information indicates that the maximum rice acreagetreated with malathion was 9,278 acres in 1991. Annual malathion use on rice has been lessthan 1,000 acres since 2001. The preliminary 2011 DPR PUR documented 145 acres ofmalathion usage. Molinate was removed from monitoring during 2010 because it is now aprohibited pesticide and is no longer applied to rice.
Sampling ScheduleThe sampling calendar was developed based onhistorical data, rice pesticide use and drainagepatterns, and actual 2011 conditions. The samplingstart date was selected in consultation with growers,CACs, Pest Control Advisers, Farm Advisers, and theCVRWQCB staff. Sampling was conducted for10 weeks according to the schedule listed in Table 5-14.Sampling was initiated on May 12, 2011, at sites SR1,CBD1, CBD5, BS1, and SSB.
Weekly samples were collected on Tuesdays duringweeks 1 through 4 and 8 through 10. Samples werecollected on Tuesdays and Thursdays during weeks 5,6, and 7. The CVRWQCB requested this samplingfrequency to monitor attainment of water qualityperformance goals established for rice pesticides; thissampling frequency provides a sound technical basisfor screening for water quality concerns to informprompt follow-up.
Sample Collection, Delivery, and AnalysisDuring the 2011 sampling season water samples werecollected to measure whether the Basin PlanPerformance Goal was being attained. The registrantlaboratory conducted sample analysis, with additional samples submitted to a third-partylaboratory for analysis.
Water samples were collected from specified surface water locations within the SacramentoRiver Basin. Each site serves as an end-of-basin drainage point designed to trigger furtherstudy and potential scrutiny, should measured conditions indicate an impact (non-toxicevent) on existing instream habitat suitability. Sites included one river site and four drainsites, as shown on Figure 4-1. Samples were collected, split if required as part of the qualityassurance requirements, and submitted under COC directly to the analytical laboratories for
TABLE 5-14RPP Sampling Schedule, 2011
WeekSample
DateSampleEvent
Week 1 5/12/2011 W1D1
Week 2 5/17/2011 W2D1
Week 3 5/24/2011 W3D1
Week 4 5/31/2011 W4D1
6/2/2011 W4D2
Week 5 6/7/2011 W5D1
6/9/2011 W5D2
Week 6 6/14/2011 W6D1
6/16/2011 W6D2
Week 7 6/21/2011 W7D1
6/23/2011 W7D2
Week 8 6/28/2011 W8D1
Week 9 7/5/2011 W9D1
Week 10 7/12/2011 W10D1

SECTION 5: 2011 MONITORING
5-24 WBG121311182744SAC/429592/113630002
thiobencarb analysis. Detailed maps of each station are included in Appendix A; field sheetsand COCs are included in Appendix C-1.
The registrant, Valent Dublin Laboratory, performed thiobencarb analyses. CaliforniaLaboratory Services, Inc. (CLS) was used as a secondary laboratory for analysis of thethiobencarb quality control samples. Contact information for these laboratories is includedin Section 4, and full laboratory results are included in Appendixes C-2 through C-4.
ResultsThe 2011 RPP water quality results and city results are summarized in Table 5-15. In 2011,there were no measured exceedances of thiobencarb at the five RPP monitoring sites. Allsamples collected at City drinking water intakes were non-detect (ND) except for a singledetection of 0.12 µg/L at WSR on June 1. Field data sheets and COC forms are presented inAppendix C-1, and laboratory data sheets are presented in Appendixes C-2 through C-4.
TABLE 5-15Summary of Detections (RPP and City Monitoring), 2011
Site
Thiobencarb
Detections Greater thanMRL
Detections Greater thanPerformance Goal
Range of DetectedConcentrations
CBD5a
2 0 ND to 1.4 µg/L
BS1a
2 0 ND to 0.6 µg/L
CBD1a
4 0 ND to 1.2 µg/L
SSBa
0 0 ND
SR1a
0 0 ND
SRRb
0 0 ND
WSRc
1 0 ND
Total Drain SiteDetections
8 0
Total River SiteDetections
1 0
Totals 9 0 -
aRPP site
bCity of Sacramento intake site (as reported by the city)
cCity of West Sacramento intake site (as reported by the city)
Notes:
MRL = method reporting limitND = non-detect (below the method reporting limit)
RPP Thiobencarb Results
During the 10 weeks of sampling, levels of thiobencarb above the MRL were detectedeight times. None of the detections were above the 1.5 µg/L Basin Plan Performance Goal.The highest measured concentration, which occurred at drain site CBD5 on May 24, was1.4 µg/L. This concentration was lower than the peak measured concentration in 2010

SECTION 5: 2011 MONITORING
WBG121311182744SAC/429592/113630002 5-25
(CBD1, June 8, 2010, 1.8 µg/L). The average concentration (counting non-detects equivalentto zero) was 0.10 µg/L for the period of monitoring, which is lower than the 2010 average of0.18 µg/L. Results are shown in Figure 5-9 and Table 5-16.
FIGURE 5-9Thiobencarb Results, RPP, 2011
Non-detects are shown as zero (0) on the graph, and only the highest value of a reported duplicate sample is shown
0
0.2
0.4
0.6
0.8
1
1.2
1.4
1.6
11-May 21-May 31-May 10-Jun 20-Jun 30-Jun 10-Jul
Thio
be
nca
rbC
on
cen
trat
ion
(µg/
L)
Sample Date
2011 RPP Thiobencarb Results
CBD5
BS1
CBD1
SSB
SR1

SECTION 5: 2011 MONITORING
5-26 WBG121311182744SAC/429592/113630002
TABLE 5-16Thiobencarb Monitoring Results, RPP 2011
Sample Date
Concentrations at Monitoring Sites(µg/L [ppb])
CBD5 BS1 CBD1 SSB SR1
5/12/2011 <0.5 ND ND ND ND
5/17/2011 <0.5 (V)
ND (CLS)
ND ND ND ND
5/24/2011 1.4 ND 0.6 ND ND
5/31/2011 <0.5 0.5 0.9 <0.5 ND
6/2/2011 <0.5 0.6 <0.5 <0.5 (V)
ND (CLS)
ND
6/7/2011 1.1 <0.5 (V)
ND (CLS)
1.2 <0.5 ND
6/9/2011 <0.5 ND 0.9 <0.5 ND (V, CLS)
6/14/2011 ND ND <0.5 ND ND
6/16/2011 ND ND (V, CLS) ND ND ND
6/21/2011 <0.5 ND ND ND ND
6/23/2011 <0.5 <0.5 <0.5 ND (V, CLS) ND
6/28/2011 ND ND ND ND ND
7/5/2011 ND <0.5 <0.5 <0.5 ND
7/12/2011 ND ND ND ND ND
Notes:
ND = not detected above laboratory reporting limitsppb = parts per billion
If a sample was tested at the primary and secondary laboratories, each result is provided with the respectivelaboratory’s name (V = Valent; CLS = California Laboratory Services)Detection limit for Valent is <0.5 µg/L; detection limit for CLS is <0.15 µg/LThe Basin Plan Performance Goal for thiobencarb is 1.5 µg/L (ppb)
City Intake Results
The City of Sacramento provided the CRC with analytical results for drinking water intakesampling for Sacramento and West Sacramento. The cities of Sacramento and WestSacramento monitor at two separate locations:
SRR: Sacramento River at the intake to the water treatment facility in Sacramento,California, approximately 0.3 kilometer downstream from the confluence with theAmerican River in Sacramento County
WSR: Sacramento River at the intake to the water treatment facility in West Sacramento,California, approximately 100 yards west of Bryte Bend Bridge in West Sacramento

SECTION 5: 2011 MONITORING
WBG121311182744SAC/429592/113630002 5-27
City sampling was performed from April 25 through June 20, 2011. The intake results forthiobencarb, as provided to the CRC, are provided in Table 5-17. Only one of the drinkingwater samples had a result above the reporting limit, with a detection of 0.12 µg/L at WSRon June 1.
TABLE 5-17Cities of Sacramento and West Sacramento Thiobencarb Results, 2011
Sample Date
Thiobencarb Concentration(µg/L)
PercentSacramento
River Water atSRR
aWSR SRR*
4/25/2011 < 0.1 < 0.1 65.6
5/5/2011 < 0.1 < 0.1 62.3
5/9/2011 < 0.1 < 0.1 58.7
5/17/2011 < 0.1 < 0.1 58.6
5/18/2011 < 0.1 < 0.1 70.6
5/23/2011 < 0.1 < 0.1 67.2
5/26/2011 < 0.1 < 0.1 64.2
5/30/2011 < 0.1b
< 0.1 67.0
5/31/2011 < 0.1 < 0.1 70.9
6/1/2011 0.12 < 0.1 70.1
6/2/2011 < 0.1 < 0.1 73.6
6/6/2011 < 0.1 < 0.1 67.5
6/7/2011 < 0.1 < 0.1 70.0
6/13/2011 < 0.1 < 0.1 55.2
6/20/2011 < 0.1 < 0.1 43.1
aThe sampling location SRR, which is located on the Sacramento River at the City of
Sacramento’s municipal water treatment intake, is downstream of the confluence ofthe Sacramento and American rivers. Based on the daily flows of the two rivers, thesample taken at SRR will represent varying proportions of Sacramento andAmerican river water. This column represents the City of Sacramento’s reportedinformation regarding the blending ratio of Sacramento River and American Riverwater on the day of sampling.b
Sampled at Riverbank Marina.
Notes:
Monitoring Site Locations:
SRR = Sacramento River Water Treatment Plant IntakeWSR = Bryte Bend Water Treatment Plant Intake
SRR Results. Upstream of the City of Sacramento drinking water intake, some water mixingoccurs from the American River at the Sacramento River confluence. In 2011, concentrationsof thiobencarb were less than 0.1 µg/L at SSR, with no detections above the detection level.

SECTION 5: 2011 MONITORING
5-28 WBG121311182744SAC/429592/113630002
WSR Results. WSR is located upstream from the confluence of the American River, so themixing and dilution prior to the drinking water intake that occurs at the City of Sacramentowater intake (SRR) does not occur at WSR. Most concentrations of thiobencarb were non-detect (less than 0.1 µg/L) at WSR. One detection of 0.12 µg/L was observed on June 1.These results demonstrate achievement of both the RPP Basin Plan Performance Goals andthe drinking water MCLs.

WBG121311182744SAC/429592/113630002 6-1
SECTION 6
Review of Quality Assurance/Quality Control
The validity of water quality monitoring results relies on defining and rigorously followinga Quality Assurance/Quality Control (QA/QC) Program. QA/QC requirements arespecified in a Monitoring Quality Assurance Project Plan (QAPP), and the laboratoryQA/QC requirements are specified in QA/QC plans for each lab.
QA/QC requirements for the CWFR sampling are specified in a QAPP submittedDecember 2010 (CH2M HILL, 2010). QA/QC requirements for the RPP sampling arespecified in the same QAPP. Project schedules (sampling dates, parameters, and sites)specified for each program are revised at the beginning of each monitoring year based onactual weather conditions and grower schedules. The QAPPs were prepared in accordancewith Attachment C (Quality Assurance Project Plan Guidelines for California RiceCommission) of the Monitoring and Reporting Program under Order No. R5-2010-0805.
The QAPP specifies several types of QA/QC samples, including:
Field QA/QC samples
Field blanks
Field duplicates
Rinse blanks
Lab QA/QC samples
Method blanks
Matrix spikes and matrix spike duplicates (MS/MSDs)
Laboratory control spikes (LCSs)
Surrogate samples
The QAPP also specifies numeric QA/QC objectives for precision, accuracy,representativeness, comparability, and completeness.
This section describes the QA/QC samples and their purposes, presents the qualityassurance objectives, and then evaluates the 2011 CWFR and RPP QA/QC results againstthe objectives.
Internal QC
Internal QC is achieved by collecting and analyzing a series of duplicate, blank, spike, andspike duplicate samples to confirm that analytical results are within the specified QCobjectives. The QC sample results are used to qualify precision and accuracy, and to identifyany problem or limitation in the associated sample results. The internal QC components of asampling and analysis program ensure that data of known quality are produced anddocumented.
SECTION 6: REVIEW OF QUALITY ASSURANCE/QUALITY CONTROL
6-2 WBG121311182744SAC/429592/113630002
Field QA/QC SamplesField QA/QC samples are used to assess the influence of sampling procedures andequipment used in sampling. The results from these samples are examined to ensure thatfield procedures yield acceptable results. Two types of field quality control samples wereused during the 2011 sampling, field blanks and field duplicates.
Field Blanks
A field blank is a bottle of reagent water that is exposed to sampling conditions, returned tothe laboratory, and treated as an environmental sample. This blank is used to provideinformation about contaminants that may be introduced during sample collection, storage,and transport.
Field Duplicates
Field duplicates, or split samples, consist of an additional bottle of sample collected at arandomly selected sample location. The results from the duplicate sample are compared tothe results from the primary sample; if the relative percent difference (RPD) between thesamples is greater than 35 percent, a thorough evaluation of the samples will be performedto determine whether to take corrective action (to either report the data or resample).Duplicate samples provide precision information for the entire measurement system,including sample acquisition, homogeneity, handling, shipping, storage, laboratory samplepreparation, and laboratory analysis.
Rinse Blanks
Rinse blanks were collected for two RPP events, and were analyzed with the environmentalsamples. Rinse blanks consist of distilled water processed through the sampling equipmentusing the same procedures used for environmental samples, after decontamination has beenperformed. Results from these blank samples are examined to ensure that concentrations ofconstituents of concern are below detection limits. If there are concentrations above thedetection limit, then sampling and decontamination procedures will be reevaluated. Resultsfrom the rinse blanks represent a total of field and laboratory sources of contamination.
Laboratory QA/QC Samples
Laboratory QA/QC samples are prepared to ensure that the required level of laboratoryaccuracy is being achieved. Four types of quality control samples are used to determinelaboratory accuracy: method blanks, MS/MSDs, LCSs, and surrogate standards.
Method Blanks
Method blanks consist of deionized water that is run through all of the same steps as theenvironmental samples at the lab. These samples are used to determine the existence of anylaboratory sources of contamination.
Matrix Spikes and Matrix Spike Duplicates
MS/MSD samples are collected at the same time as the environmental samples and arespiked at the laboratory with known concentrations of the analyte(s) to be measured. Thesesamples are used to evaluate the effect a particular sample matrix has on the accuracy of the

SECTION 6: REVIEW OF QUALITY ASSURANCE/QUALITY CONTROL
WBG121311182744SAC/429592/113630002 6-3
measurement. The MSD sample serves as another check of accuracy and allows calculationof the analysis method’s precision. The difference in the measured concentrations of theoriginal sample and the spiked sample is compared with the spike concentration, and apercent recovery (the concentration that the laboratory measures divided by the knownconcentration of a spiked sample multiplied by 100) of the spiked concentration is reported.
Laboratory Control Spikes
LCSs consist of known concentrations of a constituent in distilled water. The measuredconcentrations are compared with the spike concentration, and a percent recovery can bedetermined. Results are acceptable if the percent recovery falls within a predeterminedrange.
Surrogate Standards
Surrogate standards are samples that have been spiked with an organic compound that ischemically similar to the analyte of interest, but is not expected to occur in theenvironmental sample. The recovery of the surrogate standard is used to monitor for errors,unusual effects, and other anomalies. Surrogate recovery is evaluated by comparing themeasured concentration with the amount added to the sample.
Quality Assurance Objectives
Quality assurance objectives (QAOs) are the detailed QC specifications for precision,accuracy, representativeness, comparability, and completeness. QAOs are used ascomparison criteria during data quality review to evaluate whether the minimumrequirements have been met and the data can be used as planned. The basis for assessingeach element of data quality for this project is discussed in the following subsections.
Precision
Precision is a measure of the reproducibility of analyses under a given set of conditions.Precision is assessed by replicate measurements of field and laboratory duplicate samples.The routine comparison of precision is measured by the RPD between duplicate samplemeasurements. The overall precision of a sampling event is determined by a samplingcomponent and an analytical component.
The following formula determines the RPD between two samples:
100
2/21
21x
DD
DDRPD
Where:
RPD = relative percent differenceD1 = first sample valueD2 = second sample value (duplicate)
The maximum acceptable RPD for this project is 35 percent.

SECTION 6: REVIEW OF QUALITY ASSURANCE/QUALITY CONTROL
6-4 WBG121311182744SAC/429592/113630002
AccuracyAccuracy is a determination of how close the measurement is to the true value. Accuracycan be assessed using MS/MSD, LCS, calibration standard, and spiked environmentalsamples. The accuracy of the data submitted for this project will be assessed in the followingmanner:
The percent recovery of LCS, MS/MSD, and spiked surrogates will be calculated andevaluated against established laboratory recovery limits. Acceptable laboratoryrecovery limits for this project are 75 to 120 percent.
Laboratory method blanks will be tested to determine levels of target compounds. If a targetcompound is found above the method detection limit (MDL) in the method blankcorresponding to a batch of samples, and the same target compound is found in a sample,then the data will not be background subtracted but will be flagged to indicate the result inthe blank.
Accuracy is presented as percent recovery. Because accuracy is often evaluated from spikedsamples, laboratories commonly report accuracy using this formula:
% Recovery = R / S * 100
Where:
S = spiked concentrationR = reported concentration
The laboratories monitor accuracy by reviewing MS/MSD, LCS, calibration standard, andsurrogate spike recovery results.
Representativeness
Representativeness refers to the degree to which sample data accurately and preciselydescribe the characteristics of a population of samples, parameter variations at a samplingpoint, or environmental conditions. Representativeness is a qualitative parameter that isprimarily concerned with the proper design of the sampling program or of the subsamplingof a given sample. Representativeness will be assessed by the use of duplicate field andlaboratory samples because they provide information pertaining to both precision andrepresentativeness.
Samples that are not properly preserved or are analyzed beyond acceptable holding timeswill not be considered to provide representative data. Also, detection limits aboveapplicable MCLs or screening criteria will not be considered representative.
Comparability
Comparability is a qualitative parameter expressing the confidence with which one data setcan be compared with another. Sample data should be comparable for similar samplescollected under like conditions. This goal is achieved through the use of standard techniquesto collect and analyze representative samples and reporting analytical results withappropriate units.

SECTION 6: REVIEW OF QUALITY ASSURANCE/QUALITY CONTROL
WBG121311182744SAC/429592/113630002 6-5
Comparability is limited by other analytical control parameters; therefore, only whenprecision and accuracy are known can data sets be compared with confidence. Usingstandard operating procedures (SOPs) promotes comparability.
CompletenessCompleteness is a measure of the amount of valid data obtained from a measurementsystem compared with the amount as expected to be obtained under normal conditions. Tobe considered complete, the data set must contain all analytical results and data specifiedfor the project. Additionally, all data are compared to project requirements to ensure thatspecifications are met. Completeness is evaluated by comparing the project objectives to thequality and quantity of the data collected to assess whether any deficiencies exist. Missingdata can result from any number of circumstances, ranging from sample acquisition andaccessibility problems to sample breakage and rejection of analytical data because of qualitycontrol deficiencies. Completeness is quantitatively assessed as the percent of controlled QCparameters that are within limits. Percent completeness for each set of samples for eachindividual method can be calculated as follows:
Completeness valid data obtained
total data analyzed100%
Where:
Valid data are defined as those data points that are not qualified as rejected.
The requirement for completeness is 90 percent for each individual analytical method forall QC parameters except holding times. These QC parameters will include:
Initial calibration
Continuing calibrations
LCS percent recovery
MS/MSD
Field duplicate RPDs
Surrogate percent recoveries
The requirement for holding times is 100 percent. Any deviations are reported in thereport narrative.
CWFR QA/QC Sample Results and AnalysisIn 2011, one “QC set” was required for each analytical method batch per sampling event.The minimum required samples for chemical analysis were:
Field blank
Field duplicate
MS/MSD
LCS and laboratory control spike duplicate (LCSD)
Laboratory blank
Laboratory duplicate (MS/MSD or LCS/LCSD pair may serve this function).

SECTION 6: REVIEW OF QUALITY ASSURANCE/QUALITY CONTROL
6-6 WBG121311182744SAC/429592/113630002
Note that field duplicates and field blanks are not required for events where only generalparameters are collected.
Field QA/QC Samples
Field CWFR QA/QC samples collected during 2011 sampling included field blanks andfield duplicates. The dates, events, and sites of these samples are shown in Table 6-1. Resultsfor field QA/QC samples are provided below.
TABLE 6-1CWFR Field QA/QC Samples, 2011
Sample Date Sample Event QA/QC Sample Type(s)
5/10/2011 CWFR Event 1 Field Blank at CBD1Field Duplicate at CBD1
6/7/2011 Propanil 1 Field Blank at BS1Field Duplicate at BS1
6/14/2011 CWFR Event 2
Propanil 2
Field Blank at CBD1Field Duplicate at CBD1
6/21/2011 Propanil 3 Field Blank at CBD5Field Duplicate at CBD5
6/28/2011 Propanil 4 Field Blank at BS1Field Duplicate at BS1
7/5/2011 Propanil 5 Field Blank at CBD1Field Duplicate at CBD1
7/12/2011 Propanil 6 Field Blank at BS1Field Duplicate at BS1
7/19/2011 CWFR Event 3
Propanil 7
Field Blank at BS1Field Duplicate at BS1
7/26/2011 Propanil 8 Field Duplicate at BS1Field Duplicate at BS1
8/23/2011 CWFR Event 4 None (Sampling event was for general parameters only)
Field Blanks
Field blank samples were collected and analyzed for the same constituents as theenvironmental samples. The results for the field blanks were below the MRLs for allanalytes (Table 6-2).
Field Duplicates
Field duplicate samples were collected and analyzed for the same constituents as theprimary environmental samples. Results between primary and duplicate samples weresimilar, as was expected (Table 6-2).

SECTION 6: REVIEW OF QUALITY ASSURANCE/QUALITY CONTROL
WBG121311182744SAC/429592/113630002 6-7
TABLE 6-22011 CWFR Field Blank and Field Duplicate Results
Field Blank Results
Sample EventSample
Location
Analyte
Dissolved Copper(MRL = 0.5 µg/L)
Propanil(MRL = 0.5 µg/L)
CWFR Event 1 CBD1 ND --
Propanil 1 BS1 -- ND
CWFR Event 2 SSB ND --
Propanil 2 CBD1 -- ND
Propanil 3 CBD5 -- ND
Propanil 4 BS1 -- ND
Propanil 5 CBD5 -- ND
Propanil 6 BS1 -- ND
Propanil 7 BS1 -- ND
Propanil 8 SSB -- ND
Primary and Duplicate Results
Sample EventSample
Location
Analyte
Dissolved Copper(MRL = 0.5 µg/L)
Propanil(MRL = 0.1 µg/L)
Primary Duplicate Primary Duplicate
CWFR Event 1 CBD1 2.5 2.6 -- --
Propanil 1 BS1 -- -- ND<0.20 ND<0.20
CWFR Event 2 SSB 3.0 2.8 -- --
Propanil 2 CBD1 -- -- ND<0.50 ND<0.50
Propanil 3 CBD5 -- -- 6.5 6.8
Propanil 4 BS1 -- -- 1.8 *
Propanil 5 CBD5 -- -- 0.75 0.81
Propanil 6 BS1 -- -- 0.49 0.48
Propanil 7 BS1 -- -- ND<0.20 ND<0.20
Propanil 8 SSB -- -- ND<0.20 ND<0.20
Notes:
-- = not scheduled during that sampling event* = Sample was recorded as broken by the lab; Kleinfelder was not alerted to this during the holding time, sothe backup sample was not usable. Lab has been informed of proper procedure in case of future brokensamples.ND = non-detect above the MRL

SECTION 6: REVIEW OF QUALITY ASSURANCE/QUALITY CONTROL
6-8 WBG121311182744SAC/429592/113630002
Laboratory QA/QC SamplesThe laboratory QA/QC samples included method blanks, matrix spikes, LCSs, andsurrogate standard samples; the results for each follow.
Method Blank
Method blank samples were prepared by the laboratory and tested for the same analytes asthe environmental samples. The results of all the method blank samples were below theMRL (non-detect) for these analytes (Table 6-3).
TABLE 6-32011 CWFR Method Blank Results
Sample Event
Analyte (MRL)
TDS(10 mg/L)
TOC(1.0 mg/L)
Hardness(1.0 mg CaCO3/L)
Copper(1.0 µg/L)
Propanil(0.1 µg/L)
CWFR Event 1 ND ND ND ND --
CWFR Event 2 ND ND ND<1.0 ND --
Propanil 1 -- -- -- -- ND
Propanil 2 -- -- -- -- ND
Propanil 3 -- -- -- -- ND
Propanil 4 -- -- -- -- ND
Propanil 5 -- -- -- -- ND
CWFR Event 3 ND ND -- -- --
Propanil 6 -- -- -- -- ND
Propanil 7 -- -- -- -- ND
Propanil 8 -- -- -- -- ND
CWFR Event 4 ND ND -- -- --
Notes:
-- = not scheduled during that sampling eventND = non-detect above the MRL
MS/MSD
MS and MSD samples were prepared and analyzed for every 2011 sampling event(Table 6-4). All recoveries and RPD values were within the acceptable range.
LCS
LCS samples were prepared and analyzed for every 2011 sampling event. The recoveriesand RPD percentages for all samples were within the acceptable limits (Table 6-5).

SECTION 6: REVIEW OF QUALITY ASSURANCE/QUALITY CONTROL
WBG121311182744SAC/429592/113630002 6-9
TABLE 6-42011 Laboratory MS/MSD Samples
Sample Event Analyte
SpikeLevel(µg/L)
MatrixResult(µg/L)
SpikeRecovery
(%)
DuplicateRecovery
(%)Recovery
LimitsRPD(%)
RPDLimits
CWFR Event 1 Hardness (MS1) 166 160 91 89 75-120 0.8 35
Hardness (MS2) 166 148 99 100 75-120 0.3 35
TOC 10.0 6.48 108 111 75-120 2 35
Copper (MS1) 100 2.48 101 105 75-120 3 35
Copper (MS2) 100 24.6 100 100 75-120 0.1 35
Propanil 1 Propanil 1 ND<0.20 96.8 96.6 75-120 0.22 35
CWFR Event 2Propanil 2
Hardness (MS1) 166 87.9 98 94 75-120 3 35
TOC 10.0 ND 104 107 75-120 3 35
Copper (MS1) 100 3.91 102 97 75-120 5 35
Copper (MS2) 100 1.10 93 86 75-120 8 35
Propanil 1 ND<0.50 90.4 91.8 75-120 1.5 35
Propanil 3 Propanil 1 6.5 105 110 75-120 0.67 35
Propanil 4 Propanil 1 1.8 94.2 100 75-120 2.1 35
Propanil 5 Propanil 1 0.75 91 87.3 75-120 2.3 35
Propanil 6 Propanil 1 0.49 91.5 91 75-120 0.35 35
CWFR Event 3and Propanil 7
TOC 10.0 6.68 106 106 75-120 0.1 35
Propanil 1 ND<0.20 91.6 92.4 75-120 0.84 35
Propanil 8 Propanil 1 ND<0.20 98 99.7 75-120 1.7 35
CWFR Event 4 TOC 10.0 5.32 92 108 75-120 11 35
Note:
ND = non-detect

SECTION 6: REVIEW OF QUALITY ASSURANCE/QUALITY CONTROL
6-10 WBG121311182744SAC/429592/113630002
TABLE 6-52011 CWFR Lab Control Spikes (LCS)
Sample Event Analyte
SpikeLevel(µg/L)
SpikeRecovery
(%)
DuplicateRecovery
(%)Recovery
LimitsRPD(%)
RPDLimits
CWFR Event 1 Hardness 166 97 98 75-120 1 35
TOC 10.0 107 99 75-120 8 35
Copper 100 116 108 75-120 7 35
Propanil 1 Propanil 1 94 95.3 75-120 1.3 35
CWFR Event 2Propanil 2
Hardness 166 97 97 75-120 0.6 35
TOC 10.0 98 100 75-120 2 35
Copper 100 114 112 75-120 2 35
Propanil 1 91.3 95.4 75-120 4.3 35
Propanil 3 Propanil 1 100 102 75-120 1.3 35
Propanil 4 Propanil 1 96.2 96.9 75-120 0.71 35
Propanil 5 Propanil 1 93 93.5 75-120 0.50 35
Propanil 6 Propanil 1 93.4 97.6 75-120 4.4 35
CWFR Event 3and Propanil 7
TOC 10.0 92 94 75-120 2 35
Propanil 1 96.8 90.7 75-120 6.6 35
Propanil 8 Propanil 1 104 100 75-120 3.6 35
CWFR Event 4 TOC 10.0 92 88 75-120 5 35
Surrogate Standard
Surrogate standard samples were prepared for analysis with each propanil sample batch.All the surrogate standards fell within the QAPP recovery limits (Table 6-6).
TABLE 6-62011 CWFR Surrogate Standard Sample Results
Sample Event Sample Location
Surrogate Recovery Results (%)Carbazole (EPA 532)
(65-135)*
Propanil 1 SSB 90
BS1-Dup 94
BS1 95
BS1-FBL 94
CBD5 93
CBD1 81
F 96
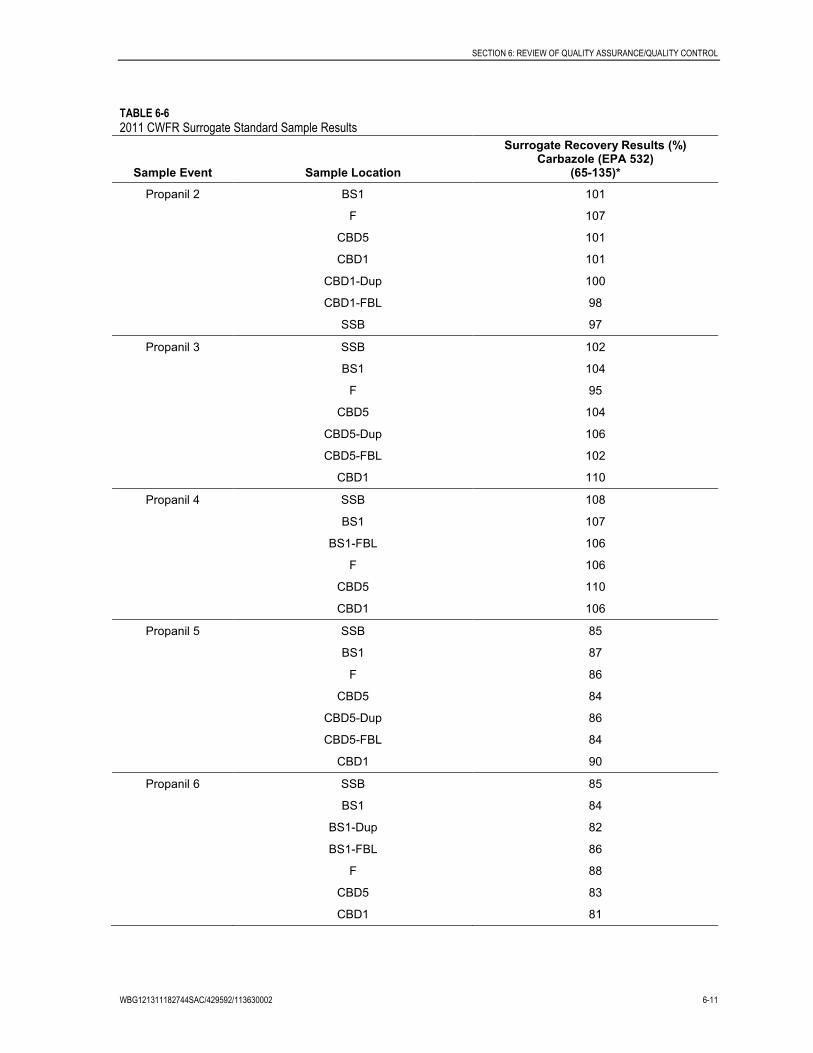
SECTION 6: REVIEW OF QUALITY ASSURANCE/QUALITY CONTROL
WBG121311182744SAC/429592/113630002 6-11
TABLE 6-62011 CWFR Surrogate Standard Sample Results
Sample Event Sample Location
Surrogate Recovery Results (%)Carbazole (EPA 532)
(65-135)*
Propanil 2 BS1 101
F 107
CBD5 101
CBD1 101
CBD1-Dup 100
CBD1-FBL 98
SSB 97
Propanil 3 SSB 102
BS1 104
F 95
CBD5 104
CBD5-Dup 106
CBD5-FBL 102
CBD1 110
Propanil 4 SSB 108
BS1 107
BS1-FBL 106
F 106
CBD5 110
CBD1 106
Propanil 5 SSB 85
BS1 87
F 86
CBD5 84
CBD5-Dup 86
CBD5-FBL 84
CBD1 90
Propanil 6 SSB 85
BS1 84
BS1-Dup 82
BS1-FBL 86
F 88
CBD5 83
CBD1 81

SECTION 6: REVIEW OF QUALITY ASSURANCE/QUALITY CONTROL
6-12 WBG121311182744SAC/429592/113630002
TABLE 6-62011 CWFR Surrogate Standard Sample Results
Sample Event Sample Location
Surrogate Recovery Results (%)Carbazole (EPA 532)
(65-135)*
Propanil 7 BS1 85
BS1-Dup 87
BS1-FBL 86
F 87
CBD5 86
CBD1 87
SSB 86
Propanil 8 BS1 87
SSB 87
SSB-Dup 89
SSB-FBL 88
F 90
CBD5 88
CBD1 91
*Control limits
FBL = field blank
DUP = duplicate
Analysis of PrecisionField duplicate samples were collected during the first two CWFR events and all propanilevents for each matrix and analyzed for each primary analyte. Duplicate results were foundto be consistent with the original matrix results. Field duplicate results are presented inTable 6-2.
MS/MSD sample sets were prepared and analyzed for every sampling event during the2011 season. All the sample sets had acceptable RPD limits for all analytes. MS/MSD resultsand RPD values are presented in Table 6-4.
LCS samples were prepared and analyzed for every sampling event during the 2011 season.The RPD percentages for all samples were within the acceptable limits. LCS results and RPDvalues are presented in Table 6-5.
Analysis of Accuracy
Field blank samples were utilized during each sampling event, and were analyzed for eachprimary analyte. All field blank samples were found to have analyte levels below the MRLs.Field blank results are presented in Table 6-2.

SECTION 6: REVIEW OF QUALITY ASSURANCE/QUALITY CONTROL
WBG121311182744SAC/429592/113630002 6-13
Method blank samples were run with every batch of analytical samples. All method blanksamples were found to have analyte levels below the MRLs. Method blank results arepresented in Table 6-3.
MS and MSD samples were prepared and analyzed for every sampling event during the2011 season. All MS/MSD results were within the acceptable recovery limits (Table 6-4).
LCS samples were prepared and analyzed for every sampling event during the 2011 season.All LCS results were within the acceptable recovery limits (Table 6-5).
Surrogate standard samples were prepared for analysis with the propanil samples fromeach propanil event. All the surrogate standards fell within the required recovery limits(Table 6-6).
Analysis SummaryAll QA/QC samples were within acceptable limits during 2011.
RPP QA/QC Sample Results and Analysis
As described in Section 5, the registrant, Valent Dublin Laboratory analyzes thiobencarbsamples. In addition, the CRC submits QA/QC samples to CLS throughout the monitoringseason.
During each QC sampling event, two sets of samples were collected. One set was sent to theanalyte-specific laboratory (Valent), and the other set was sent to the CLS laboratory forcomparison.
The field RPP QA/QC samples are shown in Table 6-7. In addition to the field QA/QCsamples, analytical laboratories typically perform method blank, LCS, and surrogatestandard analyses with each event.
TABLE 6-7RPP Field QA/QC Samples, 2011
Sample Date Sample Event QA/QC Sample Type
5/17/2011 RPP W2D1 Field duplicate at CBD5
5/31/2011 RPP W4D1 Rinse blank at CBD5
6/2/2011 RPP W4D2 Blind spikes at SSBField duplicate at SSB
6/7/2011 RPP W5D1 Field duplicate at BS1
6/9/2011 RPP W5D2 Field duplicate at SR1
6/14/2011 RPP W6D1 Rinse blank at CBD1
6/16/2011 RPP W6D2 Blind spikes at BS1Field duplicate at BS1
6/23/2011 RPP W7D2 Field duplicate at SSB

SECTION 6: REVIEW OF QUALITY ASSURANCE/QUALITY CONTROL
6-14 WBG121311182744SAC/429592/113630002
Field QA/QC SamplesField QA/QC samples collected during the 2011 season included rinse blank, fieldduplicate, and MS/MSD samples; the results for each follow.
Rinse Blank
Rinse blank samples were collected twice during the sampling season, at the W4D1 and theW6D1 sampling events. The results for all rinse blank samples were below the MDL forthiobencarb (Table 6-8).
TABLE 6-82011 RPP Comparison of Rinse Blank Samples to Primary Samples
SampleDate Sample Event Monitoring Site Sample Type* Thiobencarb (µg/L)
5/31/2011 RPP W4D1 CBD5 Primary 0.48
Rinse ND
6/14/2011 RPP W6D1 CBD1 Primary 0.30
Rinse ND
*Primary thiobencarb samples were analyzed at Valent Dublin Laboratories, and rinse samples were analyzedat CLS.
Field Duplicate
Field duplicate samples were collected during six RPP sampling events (Table 6-9).Although the primary and duplicate samples are analyzed at two different labs, all samplepairs yielded similar results for the primary and duplicate samples.
TABLE 6-92011 RPP Field Duplicate Results
SampleDate Sample Event Monitoring Site Sample Type* Thiobencarb (µg/L)
5/17/2011 RPP W2D1 CBD5 Primary <0.5
Duplicate ND
6/2/2011 RPP W4D2 SSB Primary <0.5
Duplicate ND
6/7/2011 RPP W5D1 BS1 Primary <0.5
Duplicate ND
6/9/2011 RPP W5D2 SR1 Primary <0.5
Duplicate ND
6/16/2011 RPP W6D2 BS1 Primary <0.5
Duplicate ND
6/23/2011 RPP W7D2 SSB Primary <0.5
Duplicate ND
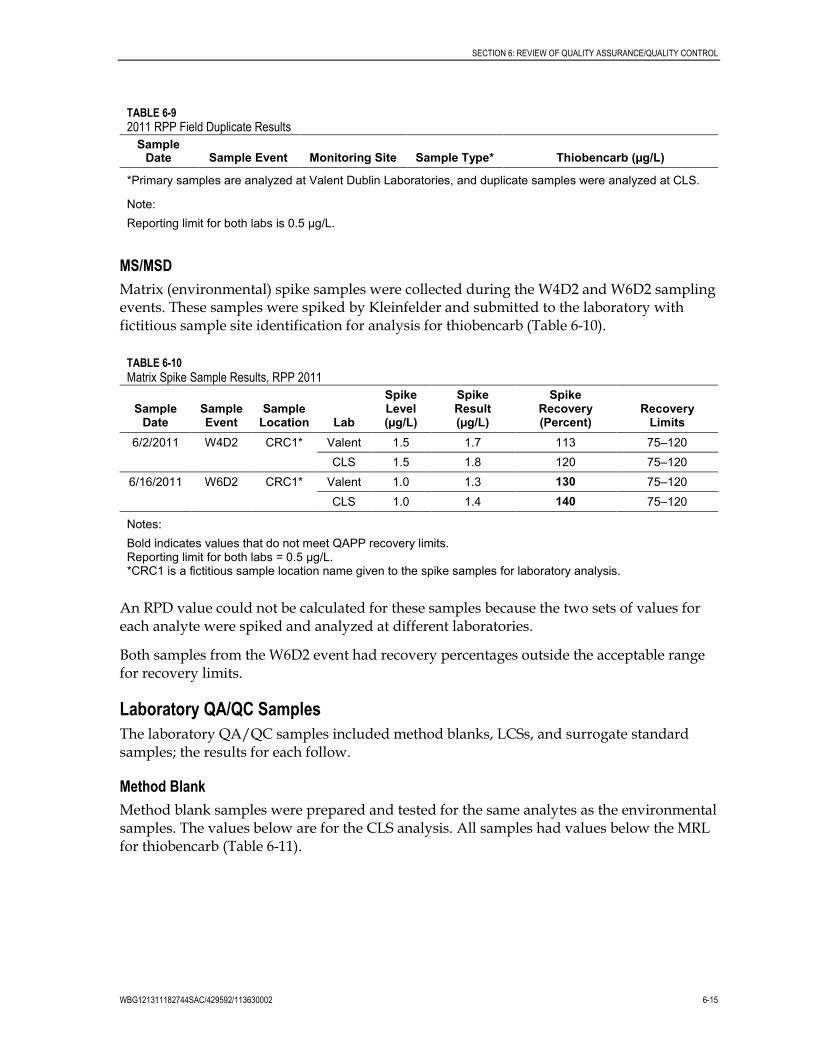
SECTION 6: REVIEW OF QUALITY ASSURANCE/QUALITY CONTROL
WBG121311182744SAC/429592/113630002 6-15
TABLE 6-92011 RPP Field Duplicate Results
SampleDate Sample Event Monitoring Site Sample Type* Thiobencarb (µg/L)
*Primary samples are analyzed at Valent Dublin Laboratories, and duplicate samples were analyzed at CLS.
Note:
Reporting limit for both labs is 0.5 µg/L.
MS/MSD
Matrix (environmental) spike samples were collected during the W4D2 and W6D2 samplingevents. These samples were spiked by Kleinfelder and submitted to the laboratory withfictitious sample site identification for analysis for thiobencarb (Table 6-10).
TABLE 6-10Matrix Spike Sample Results, RPP 2011
SampleDate
SampleEvent
SampleLocation Lab
SpikeLevel(µg/L)
SpikeResult(µg/L)
SpikeRecovery(Percent)
RecoveryLimits
6/2/2011 W4D2 CRC1* Valent 1.5 1.7 113 75–120
CLS 1.5 1.8 120 75–120
6/16/2011 W6D2 CRC1* Valent 1.0 1.3 130 75–120
CLS 1.0 1.4 140 75–120
Notes:
Bold indicates values that do not meet QAPP recovery limits.Reporting limit for both labs = 0.5 µg/L.*CRC1 is a fictitious sample location name given to the spike samples for laboratory analysis.
An RPD value could not be calculated for these samples because the two sets of values foreach analyte were spiked and analyzed at different laboratories.
Both samples from the W6D2 event had recovery percentages outside the acceptable rangefor recovery limits.
Laboratory QA/QC SamplesThe laboratory QA/QC samples included method blanks, LCSs, and surrogate standardsamples; the results for each follow.
Method Blank
Method blank samples were prepared and tested for the same analytes as the environmentalsamples. The values below are for the CLS analysis. All samples had values below the MRLfor thiobencarb (Table 6-11).

SECTION 6: REVIEW OF QUALITY ASSURANCE/QUALITY CONTROL
6-16 WBG121311182744SAC/429592/113630002
TABLE 6-11Method Blank Results (CLS), RPP 2011
Sample Date Sample EventThiobencarb
(MRL = 0.50 µg/L)
5/17/2011 W2D1 ND
5/31/2011 W4D1 ND
6/2/2011 W4D2 ND
6/7/2011 W5D1 ND
6/9/2011 W5D2 ND
6/14/2011 W6D1 ND
6/16/2011 W6D2 ND
6/23/2011 W7D2 ND
Laboratory Control Spikes
LCS samples were utilized at both laboratories as an internal QC for the data. The results ofboth laboratories’ LCS samples are included in Table 6-12.
TABLE 6-122011 RPP Laboratory LCS/LCSD Samples (Thiobencarb)
Event Lab
SpikeLevel(µg/L)
MatrixResult(µg/L)
SpikeRecovery
(%)
DuplicateRecovery
(%)Recovery
LimitsRPD(%)
RPDLimits
W1D1 Valent 1.0 NR 103.3 103.6 75-120 0.3 35
W2D1 Valent 1.0 NR 99.8 107.1 75-120 7.1 35
CLS 5.00 NR 143a
142a
75-120 0.1 35
W3D1 Valent 1.0 NR 103.7 106.6 75-120 2.8 35
W4D1 & W4D2 Valent 1.0 NR 103.8 102.3 75-120 1.5 35
CLS (D1) 5.00 NR 109 102 75-120 7 35
CLS (D2) 5.00 NR 133a
95 75-120 34 35
W5D1 & W5D2 Valent 1.0 NR 101.6 89.0b
75-120 13.2 35
CLS 5.00 NR 104 84 75-120 21 35
W6D1 & W6D2 Valent 1.0 NR 98.7 98.7 75-120 0 35
CLS 5.00 NR 101 109 75-120 7 35
W7D1 & W7D2 Valent 1.0 NR 99.1 101.4 75-120 2.3 35
CLS (W2) 5.00 NR 101 93 75-120 8 35
W8D1 Valent 1.0 NR 102.7 101.0 75-120 1.7 35
W9D1 Valent 1.0 NR 90.0 101.0 75-120 11.5 35
aCLS’s spike and/or duplicate recoveries were above acceptable limits; however, because the associated
environmental sample result was ND, a reanalysis was not performed.bValent Laboratories reported a small spill during preparation of the spike duplicate extract sample, however the
RPD was still within range, so no corrective action was taken.
Note:
NR = no value reported

SECTION 6: REVIEW OF QUALITY ASSURANCE/QUALITY CONTROL
WBG121311182744SAC/429592/113630002 6-17
Valent Laboratories. LCS samples were spiked with thiobencarb and analyzed at ValentLaboratories for selected sampling events. The RPD percentages and recovery limits for allsamples were within acceptable ranges.
CLS. LCS samples were analyzed at the secondary QA/QC laboratory, CLS, for selectedsampling events. The RPD percentages for all samples were within acceptable ranges;however, a few samples had recovery limits outside the QAPP acceptable range. Thesesamples included the spike and spike duplicate results from W2D1, and the spike resultfrom W4D2. After the second occurrence of out-of-range samples, a corrective action reportwas issued (attached to results for the W4D2 event; Appendix C-3). Following consultationamong CH2M HILL, Kleinfelder, and CLS, it was decided that a second bottle of samplewould be provided to allow for reruns if out-of-range QA/QC samples occurred. Nosubsequent results were out of range.
Surrogate Standard
Surrogate standard samples were prepared by CLS for analysis with the environmentalsamples. All sample results were within the acceptable recovery limits except for thesurrogate for the W4D1 event. The result was below the control limits; however, lack ofsample prevented a rerun. In the future, a re-extraction/analysis will be performed whenthe QC control limits have not been met (Table 6-13).
TABLE 6-13Surrogate Standard Results, RPP 2011
Sample DateSampleEvent
Surrogate Recovery Results (%)
Sample Location EPN (65-135)*
5/17/2011 W2D1 CBD5 91
5/31/2011 W4D1 CBD5 53
6/2/2011 W4D2 SSB 117
CRC1 124
6/7/2011 W5D1 BS1 82
6/9/2011 W5D2 SR1 79
6/14/2011 W6D1 CBD1 73
6/16/2011 W6D2 BS1 71
CRC1 74
6/23/2011 W7D2 SSB 66
*Control limits
Note:
EPN is CLS’s surrogate.

SECTION 6: REVIEW OF QUALITY ASSURANCE/QUALITY CONTROL
6-18 WBG121311182744SAC/429592/113630002
Analysis of PrecisionDuplicates were collected for both CWFR and RPP monitoring. Duplicates for CWFR wereanalyzed at the same lab. Duplicates for the thiobencarb sampling were uniquely processed,with the primary and duplicate samples analyzed at different laboratories (primary samplesat Valent, duplicate samples at CLS). Although this prevents a direct comparison of resultsfrom within a site, it allows a comparison of laboratories.
A field duplicate sample was collected during six of the fourteen sampling events. Althoughthe primary and duplicate samples were analyzed at two different laboratories, all samplepairs yielded similar results for the primary and duplicate samples. This shows goodcorrelation between the two laboratories used for this analysis. Field duplicate results arepresented in Table 6-9.
MS/MSD samples were utilized for each matrix during the W4D2 and W6D2 samplingevents. Although two samples for each analyte were taken at each event, the samples werespiked and analyzed at different laboratories, making an RPD comparison inappropriate.MS/MSD results are presented in Table 6-10.
LCS samples were prepared at MAI and CLS for the W1D1, W2D1, W3D1, W4D1&D2,W5D1&D2, W6D1&D2, W7D1&D1, W8D1, and W9D1 sampling events. All LCS sampleresults from both laboratories fell within the acceptable RPD limits for thiobencarb. LCSsample results are presented in Table 6-12.
Analysis of AccuracyRinse blank samples were collected twice during the 2011 sampling season, at the W4D1and W6D1 sampling events. All rinse blank samples were found to have analyte levelsbelow the MRLs. Rinse blank results are presented in Table 6-8.
Method blank samples were run with every batch of analytical samples. All method blanksamples were found to have analyte levels below the MRLs. Method blank results arepresented in Table 6-11.
MS/MSD samples were prepared for the W4D2 and W6D2 sampling events. Both samplesfrom W6D2 had recovery percentages above the acceptable range. MS/MSD results andrecovery limits are presented in Table 6-10.
All LCS samples analyzed at Valent had recovery limits within the acceptable range;however, two LCS sets analyzed at CLS had recoveries outside acceptable ranges (W2D1,W4). A corrective action report was issued. As follow-up, CLS requested that more samplewater be sent so a rerun could be performed if necessary. Valent samples met the LCSrequirements and should be considered the primary dataset for the W2D1 and W4 events.LCS sample results are presented in Table 6-12.
Surrogate standard samples were evaluated with the analytical samples at CLS. All sampleresults were within the acceptable recovery limits except for the surrogate for the W4D1event. The result was below the control limits; however, lack of sample prevented a rerun.In the future, a re-extraction/analysis will be performed when the QC limits have not beenmet (Table 6-13).

SECTION 6: REVIEW OF QUALITY ASSURANCE/QUALITY CONTROL
WBG121311182744SAC/429592/113630002 6-19
Analysis SummaryThe following summarizes the results of the QA/QC analysis performed on the RPP data:
Primary and duplicate samples were analyzed at two different laboratories, making acomparison for RPD inappropriate.
MSD samples were not submitted for analysis to each laboratory in conjunction with MSsamples. Rather, the submittal of MS samples to CLS provided an in-lieu MSD for theMS samples submitted to Valent.
Both MS samples from W6D2 had recovery percentages outside the acceptable range.The recoveries for those samples were above the acceptable recovery range.
Some of the LCS samples from the secondary QA/QC laboratory CLS had recoverylimits outside the acceptable range. It is noted that the primary Valent samples met theLCS requirements and should be considered the primary dataset for the LCS setsflagged above.
Surrogate standard samples were run at CLS. Nearly all the samples had recoverieswithin acceptable limits; one sample was below acceptable limits.
Chains of Custody
COC forms documented sample possession from the time of field sampling until the time oflaboratory analysis. A COC form was completed after sample collection at each sampleevent and prior to sample shipment or release. The COC record forms were completed withindelible ink. Unused portions of the form were crossed out and initialed by the sampler.The COC form, sample labels, and field documentation were cross-checked to verify sampleidentification, type of analyses, sample volume, and number and type of containers.
COC forms for the CWFR and RPP monitoring programs are included in Appendixes B-1and C-1, respectively.


WBG121311182744SAC/429592/113630002 7-1
SECTION 7
Summary and Recommendations
The CRC implemented water quality monitoring and reporting activities in compliance withthe following two programs of the CVRWQCB:
CWFR monitoring and reporting, pursuant to MRP Order R5-2010-0805 issued underthe CVRWQCB’s Conditional Waiver of Waste Discharge Requirements for Discharges fromIrrigated Lands. The monitoring and reporting requirements for the 2011 CWFR arespecified in CRC MRP, under Resolution No. R5-2006-0053 as amended by R5-2006-0077.
RPP pursuant to the Conditional Prohibition of Discharge requirements specified in theBasin Plan. Monitoring and reporting requirements for the 2010 RPP are specified inCVRWQCB Resolution No. R5-2010-9001.
Each program is summarized below, and recommendations are included.
CWFR
CWFR monitoring included field assessment of field parameters, including temperature,DO, pH, and EC. Lab analyses were conducted as required for TDS, TOC, hardness, anddissolved copper. Propanil monitoring was conducted under the voluntary PropanilManagement Plan at four core sites and assessment Site F. The following summarizes theCWFR water quality results:
Temperature: Temperature results indicate warm water conditions during themonitoring season. Core site temperatures were consistent with results observed inprevious years. Water temperatures track with observed air temperatures. Peak
temperatures were observed during the June monitoring event, with a high of 80.3F.
DO: DO results were generally consistent with observations in previous years. DOtypically trended above the 6 mg/L warm water standard. Low DO (less than theWARM WQO of 5 mg/L) was observed at one event in 2011, CBD1 at the June event.
pH: There was only one observation outside the 6.5 to 8.5 WQO range during 2011; theCBD1 sample from the June event had a pH of 4.55.
EC: The 2011 sampling season yielded one sample with an EC greater than700 µmhos/cm; the CBD1 sample from the June event had an EC of 761 µmhos/cm.
TDS: TDS samples were collected at core sites at all CWFR events. TDS was generallyhighest in June. The maximum observed TDS was 470 mg/L, at CBD1 in June.
TOC: TOC samples were collected at core sites at all CWFR events. TOC was generallylowest in May and highest in June. The maximum observed TOC was 19 mg/L at bothCBD5 and CBD1 in June, while all other observed TOC values were less than 8.0 mg/L.

SECTION 7: SUMMARY AND CONCLUSIONS
7-2 WBG121311182744SAC/429592/113630002
Copper and Hardness: Samples from the first two events were analyzed for hardnessand dissolved copper, in accordance with the MRP. The 1-hour and 4-day CTRhardness-adjusted copper criterion also were calculated based on the actual hardnessmeasured for the sample location and date. All the copper samples taken during the2011 monitoring season fell below the 1-hour and 4-day criteria.
Propanil Management Plan: Eight consecutive weeks of propanil sampling werecompleted in 2011. All results were below trigger values.
Assessment of the 2011 CWFR ProgramThis year represents the seventh full year of the CWFR program. The key successes andchallenges faced during 2011 program implementation are summarized as follows:
Water quality results as compared to trigger values did not trigger resampling ormanagement plan actions.
Late rains and unseasonable cool weather resulted in an atypical year for riceproduction. Late rains delayed planting, and cool weather postponed plant maturity,resulting in a later harvest.
Monitoring and assessment were conducted in accordance with the requirements of theMRP and Propanil Management Plan. Regularly scheduled CWFR sampling wasconducted as required under the MRP. This sampling included core site analysis forfield parameters (temperature, DO, pH, electrical conductivity, and flow), core samplingfor lab parameters (TOC and TDS), core site analysis for dissolved copper and hardnessduring the first two events, and propanil sampling and analysis during a eight weekperiod consistent with the use period.
CWFR water quality monitoring was conducted at four core sites. Dissolved copper wasincluded during the first two events in 2011 to provide for comparison to CTR criteria,which use dissolved copper as the basis of calculation. This effort satisfies the MRPrequirement for implementation of a phased core/assessment monitoring regime, whichincludes assessment monitoring on a 3-year cycle. Assessment monitoring will next takeplace in 2012.
The CRC continued to implement a Surface Water Ambient Monitoring Program(SWAMP)-compliant electronic data submittal system, including laboratory preparedSWAMP-compliant Electronic Data Reports for chemistry analyses. The CRC submittedresults to the CVRWQCB on a regular basis to provide for real-time discussion of results,their potential implications, and appropriate management actions.
The CRC’s SWAMP-compliant QAPP was updated in 2010, and was implemented in2011.
Review of field and laboratory QA/QC samples indicates substantial achievement ofquality objectives.
All field blank samples were found to have analyte levels below the MRLs. Fieldduplicate sample results were consistent with primary sample results.

SECTION 7: SUMMARY AND CONCLUSIONS
WBG121311182744SAC/429592/113630002 7-3
Laboratory QA/QC substantially achieved data quality objectives. Method blanksachieved data quality objectives, with all results non-detect, as expected. MS/MSDand LCS samples achieved data quality objectives, with all recoveries and RPDvalues within the target range.
Propanil analysis demonstrated that management practices are substantially protectingwater quality, with results two orders of magnitude below trigger limits that wouldindicate continued assessment monitoring or additional implementation actions.
Core monitoring sites for trend monitoring of rice water quality impacts continue to beappropriate because of the uniformity of rice farming practices across the valley. Ricewater management and rice water quality management practices are relativelyconsistent throughout the valley: The same sets of field preparation, irrigation, andharvest practices are available to growers. Additionally, the water hold requirementsapply to all rice growers, leaving little variation in the methods of rice farming from thevarious drainage areas.
Implementation of management practices continued in 2011, including water holdrequirements; education and outreach (newsletters and grower meetings); stakeholderinvolvement with enforcement activities; and coordination with the UCCE, UC Davis,and the Rice Research Board. Additionally, the CRC has the ability to directly contacteach of its members and is committed to using its outreach capabilities to address waterquality concerns when they are identified.
The CRC continues to be engaged in the CVRWQCB’s efforts to refine the IrrigatedLands Regulatory Program through its regular consultation with CVRWQCB staff andthrough its participation in the CVRWQCB’s Technical Issues Committee, CV-SALTSSalinity Coalition, Central Valley Pesticide Total Maximum Daily Load and Basin PlanAmendment, and Drinking Water Policy Workgroup.
CWFR Recommendations for 2012
The CRC’s 2011 monitoring satisfies the MRP requirements for a phased monitoringregime that includes assessment and core monitoring on a 3-year cycle. Consistent withthe MRP, it is recommended that monitoring in 2012 include assessment monitoringparameters at assessment sites. Specific parameters included in the assessment regimeshould be identified in consultation with CVRWQCB staff and in consideration ofexisting water quality monitoring data.
It is recommended the results of the Propanil Monitoring Plan be evaluatedcollaboratively with CVRWQCB staff. It is also recommended that the CRC continueimplementation of its propanil outreach.
Close consultation with CVRWQCB staff regarding the program should continue in aneffort to refine the program to focus on identified water quality concerns andappropriate implementation actions, if warranted. The CVRWQCB is developing aLong-Term Irrigated Lands Regulatory Program (LT-ILRP), scheduled for Boardconsideration in 2012. The CRC anticipates developing a rice-specific MRP under theLT-ILRP.

SECTION 7: SUMMARY AND CONCLUSIONS
7-4 WBG121311182744SAC/429592/113630002
RPP
The results of all monitoring of drinking water intakes and the SR1 river site during 2011,including intake monitoring conducted by the cities of Sacramento and West Sacramentoand RPP monitoring conducted by CRC, showed thiobencarb concentrations below thedrinking water MCL and Basin Plan Performance Goals. These results demonstrate thatexisting management practices, including water holds and other use restrictions, areprotective of water quality.
Assessment of the 2011 RPP Program The RPP continues to be an example of an effective agricultural water quality regulatory
program. The RPP implements an aggressive monitoring schedule designed to focussampling activities during the 10 weeks of peak thiobencarb use to demonstratecompliance with the Basin Plan’s Conditional Prohibition of Discharge.
There were no exceedances of the thiobencarb Basin Plan Performance Goal or thesecondary MCL.
The CRC’s RPP monitoring schedule continues to provide a rigorous sampling regimedesigned to rapidly assess compliance with the thiobencarb Performance Goal and theeffectiveness of management practices.
Water holds and other management practices implemented by rice growers and the CRCcontinue to be critical to protect water quality. Additional holiday and weekend CACinspections continued to be funded by the CRC, consistent with the CVRWQCBResolution.
Two new management practices were required initially required 2010, pursuant toResolution No. R5-2010-9001, and were implemented again in 2011. These newmanagement practices are included verbatim below and the CRC’s 2010 implementationof these practices is described in the next bullet.
1)b). The California Rice Commission will provide additional outreach on results from2009 thiobencarb monitoring and required management practices to pesticideapplicators. This outreach will include, but not be limited to, clarification of holdtime requirements, application rates, proper application procedures, andnotification of the finding of elevated thiobencarb levels in the Sacramento Rivernear drinking water intakes. The California Rice Commission will also contactten thiobencarb dealers and distributors in the Sacramento River Basin to discussthe Rice Pesticides Program and possible areas of improvement.”
1)c). The California Rice Commission will increase the funding of additional countysurveillance at non-traditional hours to double the level of 2009 and extend theprogram to counties not previously funded. Surveillance inspections willincrease to approximately 1.5 times the current level with the new funding.”
As in 2010, management practices were implemented as follows:
1)b). The CRC was successful in increasing outreach to the dealers and distributors inorder to identify possible areas of improvement. The dealers and distributors

SECTION 7: SUMMARY AND CONCLUSIONS
WBG121311182744SAC/429592/113630002 7-5
confirmed that they attended the Mandatory Thiobencarb Stewardship Meetingand could not identify any improvements to the RPP.
1)c). The additional surveillance inspections were specific to the major rice growingcounties (Butte, Colusa, and Glenn) at the time of implementation. For the 2010growing season, the CRC approached other rice -growing counties to determinetheir interest in participating in the surveillance program. Sacramento andTehama counties declined because of the limited rice acreage remaining in thecounties. Sutter County declined to participate directly in the surveillanceprogram, but committed 20 percent inspection time to the RPP through thePesticide Use Enforcement set of goals and objectives with DPR. The countiesparticipating in the additional inspections for 2011 include Butte, Colusa, Glenn,Placer, Yolo, and Yuba.
RPP Recommendations for 2012 The CRC should continue to implement aggressive efforts to implement additional,
industry outreach and education to growers, pest control advisors (PCAs), applicators,dealers, and distributors during the 2012 season, as was accomplished early in the 2011season. Examples include:
Continuance of the mandatory thiobencarb stewardship meetings
Close coordination with the CACs
Outreach via the CRC newsletter and website
Maintenance of the ongoing relationships with applicators and PCAs
A continued outreach focus on management practices for Bolero UltraMax, which isthe newer formulation of thiobencarb
Grower implementation of measures to effectively manage thiobencarb discharges,as detailed in the CVRWQCB Resolution and the DPR Permit Conditions
The CRC plans to continue the approved recommendations as outlined in ResolutionNo. R5-2010-9001. From experience in managing the RPP and communication with theCACs, the CRC recognizes additional refinement in the following program areas:
Coordination with DPR by providing feedback on updating documents that definethe water holding and early/emergency release requirements to the CACs
Reminding the CACs to provide DPR with the rice pesticide use data by October 31
It is recommended that the CRC continue to implement RPP water quality monitoringand reporting activities consistent with the program implemented during 2008 andrenewed and approved in 2010 through Resolution No. R5-2010-9001. The results of thismonitoring confirm compliance with Basin Plan requirements.
The CRC will continue its stakeholder outreach activities, including collaboration withthe cities, DPR, CACs, and the CVRWQCB.


WBG121311182744SAC/429592/113630002 8-1
SECTION 8
References
Ayers, R. S. and D. W. Wescot. 1985. Water Quality for Agriculture. Food and AgricultureOrganization of the United Nations—Irrigation and Drainage Paper No. 29, Rev. 1. Rome.
Central Valley Regional Water Quality Control Board (CVRWQCB). 2004. RecommendedNumerical Limits to Translate Water Quality Objectives. May 19, 2004. Available at:http://www.waterboards.ca.gov/centralvalley/water_issues/water_quality_standards_limits/water_quality_goals/index.shtml.
CH2M HILL. 2010. Quality Assurance Project Plan for the California Rice CommissionWater Quality Programs, Rice Pesticides Program (RPP), Conditional Waiver for Rice(CWFR), and Algae Management Plan (AMP). QAPP Revision Number: Version 2.0 FINAL.Sacramento, CA.
State Water Resources Board (SWRCB). 1984. Water Quality and Pesticides, Rice Herbicides:Molinate and Thiobencarb. California State Water Resources Control Board, Special ProjectsReport No. 84-4SP.