Embed Size (px)
Citation preview

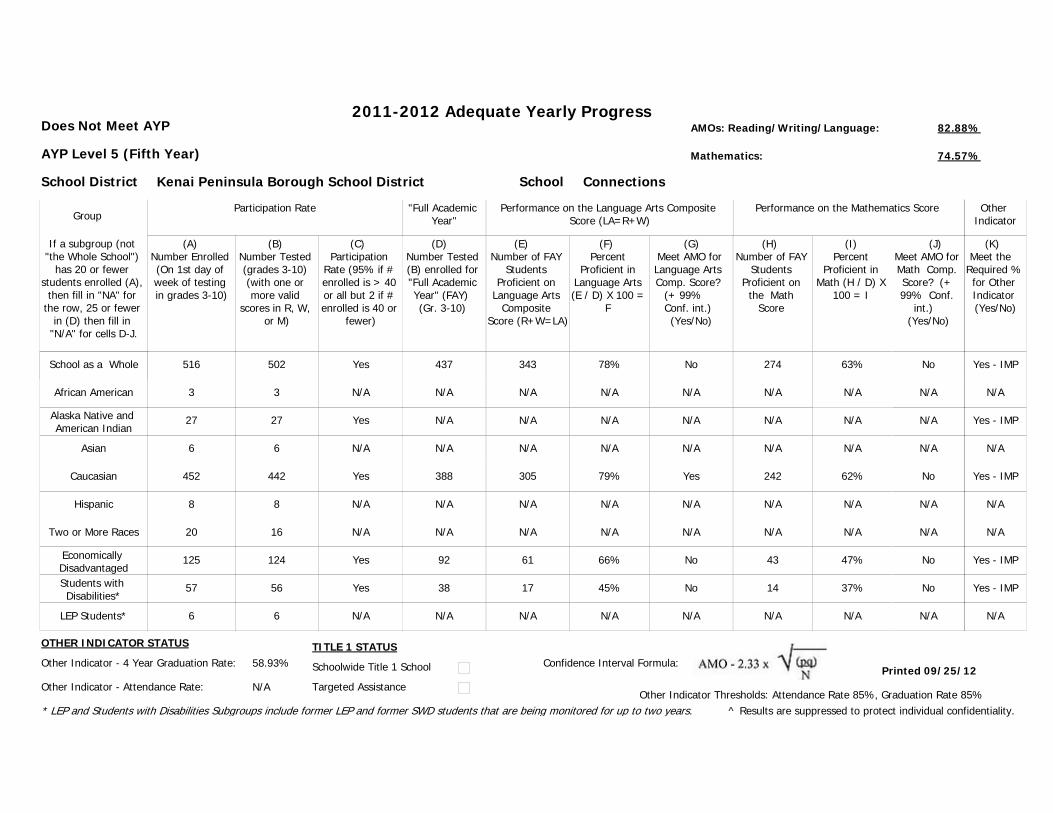
2011-2012 Adequate Yearly ProgressAMOs: Reading/Writing/Language: 82.88%
Mathematics: 74.57%
School Aurora Borealis Charter School
Group
School as a Whole 121
Participation Rate
(A) Number Enrolled (On 1st day of week of testing in grades 3-10)
(B) Number Tested (grades 3-10) (with one or more valid
scores in R, W, or M)
(C) Participation
Rate (95% if # enrolled is > 40 or all but 2 if # enrolled is 40 or
fewer)
"Full Academic Year"
African American
Alaska Native and American Indian
Asian
Caucasian
Hispanic
Economically DisadvantagedStudents with Disabilities*
LEP Students*
(D) Number Tested (B) enrolled for "Full Academic Year" (FAY) (Gr. 3-10)
(E) Number of FAY
Students Proficient on
Language Arts Composite
Score (R+W=LA)
(F) Percent
Proficient in Language Arts (E / D) X 100 =
F
121
Meets AYP
(G) Meet AMO for Language Arts Comp. Score?
(+ 99% Conf. int.) (Yes/No)
(H) Number of FAY
Students Proficient on
the Math Score
(I) Percent
Proficient in Math (H / D) X
100 = I
(J) Meet AMO for Math Comp. Score? (+ 99% Conf.
int.) (Yes/No)
Performance on the Language Arts Composite Score (LA=R+W)
Performance on the Mathematics Score
0
1
2
108
0
2
13
0
0
1
2
108
0
2
13
0
121
N/A
N/A
N/A
108
N/A
N/A
N/A
N/A
^
N/A
N/A
N/A
^
N/A
N/A
N/A
N/A
Yes
N/A
N/A
N/A
Yes
N/A
N/A
N/A
N/A
118
N/A
N/A
N/A
^
N/A
N/A
N/A
N/A
Yes
N/A
N/A
N/A
Yes
N/A
N/A
N/A
N/A
Schoolwide Title 1 School
School District Kenai Peninsula Borough School District
If a subgroup (not "the Whole School")
has 20 or fewer students enrolled (A),
then fill in "NA" for the row, 25 or fewer
in (D) then fill in "N/A" for cells D-J.
Yes
N/A
N/A
N/A
Yes
N/A
N/A
N/A
N/A
95% or More
N/A
N/A
N/A
95% or More
N/A
N/A
N/A
N/A
98%
N/A
N/A
95% or More
N/A
N/A
N/A
N/A
Printed 09/25/12Confidence Interval Formula:
Other Indicator Thresholds: Attendance Rate 85%, Graduation Rate 85%
Other Indicator - 4 Year Graduation Rate: N/A
Other Indicator - Attendance Rate: 95.03%
OTHER INDICATOR STATUS TITLE 1 STATUS
(K) Meet the
Required % for Other Indicator (Yes/No)
Other Indicator
Yes
N/A
N/A
N/A
N/A
N/A
N/A
N/A
N/A
Two or More Races 10 10 N/A N/A N/A N/A N/AN/A N/A N/A N/A
* LEP and Students with Disabilities Subgroups include former LEP and former SWD students that are being monitored for up to two years.
Targeted Assistance
^ Results are suppressed to protect individual confidentiality.
N/A

2011-2012 Adequate Yearly ProgressAMOs: Reading/Writing/Language: 82.88%
Mathematics: 74.57%
School Chapman School
Group
School as a Whole 66
Participation Rate
(A) Number Enrolled (On 1st day of week of testing in grades 3-10)
(B) Number Tested (grades 3-10) (with one or more valid
scores in R, W, or M)
(C) Participation
Rate (95% if # enrolled is > 40 or all but 2 if # enrolled is 40 or
fewer)
"Full Academic Year"
African American
Alaska Native and American Indian
Asian
Caucasian
Hispanic
Economically DisadvantagedStudents with Disabilities*
LEP Students*
(D) Number Tested (B) enrolled for "Full Academic Year" (FAY) (Gr. 3-10)
(E) Number of FAY
Students Proficient on
Language Arts Composite
Score (R+W=LA)
(F) Percent
Proficient in Language Arts (E / D) X 100 =
F
66
Meets AYP
(G) Meet AMO for Language Arts Comp. Score?
(+ 99% Conf. int.) (Yes/No)
(H) Number of FAY
Students Proficient on
the Math Score
(I) Percent
Proficient in Math (H / D) X
100 = I
(J) Meet AMO for Math Comp. Score? (+ 99% Conf.
int.) (Yes/No)
Performance on the Language Arts Composite Score (LA=R+W)
Performance on the Mathematics Score
0
8
1
43
5
44
26
0
0
8
1
43
5
44
26
0
56
N/A
N/A
N/A
36
N/A
36
N/A
N/A
48
N/A
N/A
N/A
33
N/A
29
N/A
N/A
Yes
N/A
N/A
N/A
Yes
N/A
Yes
N/A
N/A
43
N/A
N/A
N/A
29
N/A
28
N/A
N/A
Yes
N/A
N/A
N/A
Yes
N/A
Yes
N/A
N/A
Schoolwide Title 1 School
School District Kenai Peninsula Borough School District
If a subgroup (not "the Whole School")
has 20 or fewer students enrolled (A),
then fill in "NA" for the row, 25 or fewer
in (D) then fill in "N/A" for cells D-J.
Yes
N/A
N/A
N/A
Yes
N/A
Yes
Yes
N/A
86%
N/A
N/A
N/A
92%
N/A
81%
N/A
N/A
77%
N/A
N/A
81%
N/A
78%
N/A
N/A
Printed 09/25/12Confidence Interval Formula:
Other Indicator Thresholds: Attendance Rate 85%, Graduation Rate 85%
Other Indicator - 4 Year Graduation Rate: N/A
Other Indicator - Attendance Rate: 93.27%
OTHER INDICATOR STATUS TITLE 1 STATUS
(K) Meet the
Required % for Other Indicator (Yes/No)
Other Indicator
Yes
N/A
N/A
N/A
N/A
N/A
N/A
N/A
N/A
Two or More Races 9 9 N/A N/A N/A N/A N/AN/A N/A N/A N/A
* LEP and Students with Disabilities Subgroups include former LEP and former SWD students that are being monitored for up to two years.
Targeted Assistance
^ Results are suppressed to protect individual confidentiality.
N/A
2011-2012 Adequate Yearly ProgressAMOs: Reading/Writing/Language: 82.88%
Mathematics: 74.57%
School Connections
Group
School as a Whole 516
Participation Rate
(A) Number Enrolled (On 1st day of week of testing in grades 3-10)
(B) Number Tested (grades 3-10) (with one or more valid
scores in R, W, or M)
(C) Participation
Rate (95% if # enrolled is > 40 or all but 2 if # enrolled is 40 or
fewer)
"Full Academic Year"
African American
Alaska Native and American Indian
Asian
Caucasian
Hispanic
Economically DisadvantagedStudents with Disabilities*
LEP Students*
(D) Number Tested (B) enrolled for "Full Academic Year" (FAY) (Gr. 3-10)
(E) Number of FAY
Students Proficient on
Language Arts Composite
Score (R+W=LA)
(F) Percent
Proficient in Language Arts (E / D) X 100 =
F
502
Does Not Meet AYP
AYP Level 5 (Fifth Year)
(G) Meet AMO for Language Arts Comp. Score?
(+ 99% Conf. int.) (Yes/No)
(H) Number of FAY
Students Proficient on
the Math Score
(I) Percent
Proficient in Math (H / D) X
100 = I
(J) Meet AMO for Math Comp. Score? (+ 99% Conf.
int.) (Yes/No)
Performance on the Language Arts Composite Score (LA=R+W)
Performance on the Mathematics Score
3
27
6
452
8
125
57
6
3
27
6
442
8
124
56
6
437
N/A
N/A
N/A
388
N/A
92
38
N/A
343
N/A
N/A
N/A
305
N/A
61
17
N/A
No
N/A
N/A
N/A
Yes
N/A
No
No
N/A
274
N/A
N/A
N/A
242
N/A
43
14
N/A
No
N/A
N/A
N/A
No
N/A
No
No
N/A
Schoolwide Title 1 School
School District Kenai Peninsula Borough School District
If a subgroup (not "the Whole School")
has 20 or fewer students enrolled (A),
then fill in "NA" for the row, 25 or fewer
in (D) then fill in "N/A" for cells D-J.
Yes
N/A
Yes
N/A
Yes
N/A
Yes
Yes
N/A
78%
N/A
N/A
N/A
79%
N/A
66%
45%
N/A
63%
N/A
N/A
62%
N/A
47%
37%
N/A
Printed 09/25/12Confidence Interval Formula:
Other Indicator Thresholds: Attendance Rate 85%, Graduation Rate 85%
Other Indicator - 4 Year Graduation Rate: 58.93%
Other Indicator - Attendance Rate: N/A
OTHER INDICATOR STATUS TITLE 1 STATUS
(K) Meet the
Required % for Other Indicator (Yes/No)
Other Indicator
Yes - IMP
N/A
Yes - IMP
N/A
Yes - IMP
N/A
Yes - IMP
Yes - IMP
N/A
Two or More Races 20 16 N/A N/A N/A N/A N/AN/A N/A N/A N/A
* LEP and Students with Disabilities Subgroups include former LEP and former SWD students that are being monitored for up to two years.
Targeted Assistance
^ Results are suppressed to protect individual confidentiality.
N/A

2011-2012 Adequate Yearly ProgressAMOs: Reading/Writing/Language: 82.88%
Mathematics: 74.57%
School Cooper Landing School
Group
School as a Whole 3
Participation Rate
(A) Number Enrolled (On 1st day of week of testing in grades 3-10)
(B) Number Tested (grades 3-10) (with one or more valid
scores in R, W, or M)
(C) Participation
Rate (95% if # enrolled is > 40 or all but 2 if # enrolled is 40 or
fewer)
"Full Academic Year"
African American
Alaska Native and American Indian
Asian
Caucasian
Hispanic
Economically DisadvantagedStudents with Disabilities*
LEP Students*
(D) Number Tested (B) enrolled for "Full Academic Year" (FAY) (Gr. 3-10)
(E) Number of FAY
Students Proficient on
Language Arts Composite
Score (R+W=LA)
(F) Percent
Proficient in Language Arts (E / D) X 100 =
F
3
Meets AYP
(G) Meet AMO for Language Arts Comp. Score?
(+ 99% Conf. int.) (Yes/No)
(H) Number of FAY
Students Proficient on
the Math Score
(I) Percent
Proficient in Math (H / D) X
100 = I
(J) Meet AMO for Math Comp. Score? (+ 99% Conf.
int.) (Yes/No)
Performance on the Language Arts Composite Score (LA=R+W)
Performance on the Mathematics Score
0
0
0
3
0
0
0
0
0
0
0
3
0
0
0
0
^
N/A
N/A
N/A
N/A
N/A
N/A
N/A
N/A
^
N/A
N/A
N/A
N/A
N/A
N/A
N/A
N/A
Yes
N/A
N/A
N/A
N/A
N/A
N/A
N/A
N/A
^
N/A
N/A
N/A
N/A
N/A
N/A
N/A
N/A
Yes
N/A
N/A
N/A
N/A
N/A
N/A
N/A
N/A
Schoolwide Title 1 School
School District Kenai Peninsula Borough School District
If a subgroup (not "the Whole School")
has 20 or fewer students enrolled (A),
then fill in "NA" for the row, 25 or fewer
in (D) then fill in "N/A" for cells D-J.
Yes
N/A
N/A
N/A
N/A
N/A
N/A
N/A
N/A
^
N/A
N/A
N/A
N/A
N/A
N/A
N/A
N/A
^
N/A
N/A
N/A
N/A
N/A
N/A
N/A
Printed 09/25/12Confidence Interval Formula:
Other Indicator Thresholds: Attendance Rate 85%, Graduation Rate 85%
Other Indicator - 4 Year Graduation Rate: N/A
Other Indicator - Attendance Rate: 94.62%
OTHER INDICATOR STATUS TITLE 1 STATUS
(K) Meet the
Required % for Other Indicator (Yes/No)
Other Indicator
Yes
N/A
N/A
N/A
N/A
N/A
N/A
N/A
N/A
Two or More Races 0 0 N/A N/A N/A N/A N/AN/A N/A N/A N/A
* LEP and Students with Disabilities Subgroups include former LEP and former SWD students that are being monitored for up to two years.
Targeted Assistance
^ Results are suppressed to protect individual confidentiality.
N/A
2011-2012 Adequate Yearly ProgressAMOs: Reading/Writing/Language: 82.88%
Mathematics: 74.57%
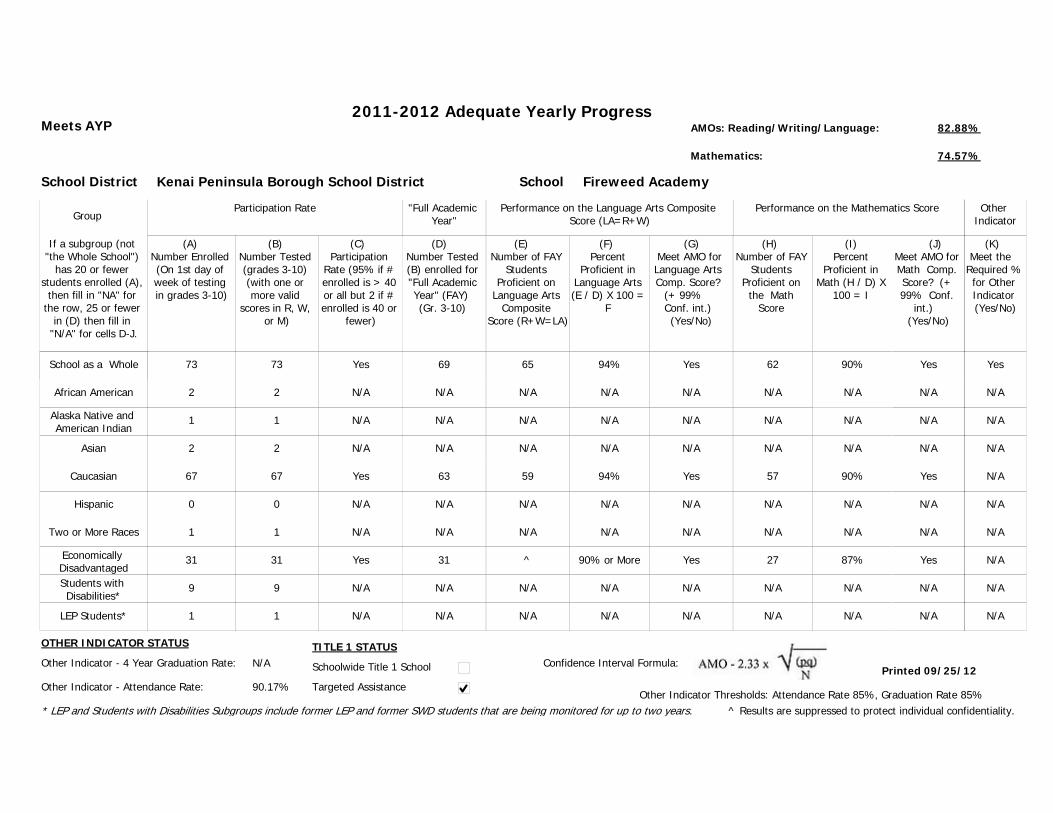
School Fireweed Academy
Group
School as a Whole 73
Participation Rate
(A) Number Enrolled (On 1st day of week of testing in grades 3-10)
(B) Number Tested (grades 3-10) (with one or more valid
scores in R, W, or M)
(C) Participation
Rate (95% if # enrolled is > 40 or all but 2 if # enrolled is 40 or
fewer)
"Full Academic Year"
African American
Alaska Native and American Indian
Asian
Caucasian
Hispanic
Economically DisadvantagedStudents with Disabilities*
LEP Students*
(D) Number Tested (B) enrolled for "Full Academic Year" (FAY) (Gr. 3-10)
(E) Number of FAY
Students Proficient on
Language Arts Composite
Score (R+W=LA)
(F) Percent
Proficient in Language Arts (E / D) X 100 =
F
73
Meets AYP
(G) Meet AMO for Language Arts Comp. Score?
(+ 99% Conf. int.) (Yes/No)
(H) Number of FAY
Students Proficient on
the Math Score
(I) Percent
Proficient in Math (H / D) X
100 = I
(J) Meet AMO for Math Comp. Score? (+ 99% Conf.
int.) (Yes/No)
Performance on the Language Arts Composite Score (LA=R+W)
Performance on the Mathematics Score
2
1
2
67
0
31
9
1
2
1
2
67
0
31
9
1
69
N/A
N/A
N/A
63
N/A
31
N/A
N/A
65
N/A
N/A
N/A
59
N/A
^
N/A
N/A
Yes
N/A
N/A
N/A
Yes
N/A
Yes
N/A
N/A
62
N/A
N/A
N/A
57
N/A
27
N/A
N/A
Yes
N/A
N/A
N/A
Yes
N/A
Yes
N/A
N/A
Schoolwide Title 1 School
School District Kenai Peninsula Borough School District
If a subgroup (not "the Whole School")
has 20 or fewer students enrolled (A),
then fill in "NA" for the row, 25 or fewer
in (D) then fill in "N/A" for cells D-J.
Yes
N/A
N/A
N/A
Yes
N/A
Yes
N/A
N/A
94%
N/A
N/A
N/A
94%
N/A
90% or More
N/A
N/A
90%
N/A
N/A
90%
N/A
87%
N/A
N/A
Printed 09/25/12Confidence Interval Formula:
Other Indicator Thresholds: Attendance Rate 85%, Graduation Rate 85%
Other Indicator - 4 Year Graduation Rate: N/A
Other Indicator - Attendance Rate: 90.17%
OTHER INDICATOR STATUS TITLE 1 STATUS
(K) Meet the
Required % for Other Indicator (Yes/No)
Other Indicator
Yes
N/A
N/A
N/A
N/A
N/A
N/A
N/A
N/A
Two or More Races 1 1 N/A N/A N/A N/A N/AN/A N/A N/A N/A
* LEP and Students with Disabilities Subgroups include former LEP and former SWD students that are being monitored for up to two years.
Targeted Assistance
^ Results are suppressed to protect individual confidentiality.
N/A
2011-2012 Adequate Yearly ProgressAMOs: Reading/Writing/Language: 82.88%
Mathematics: 74.57%
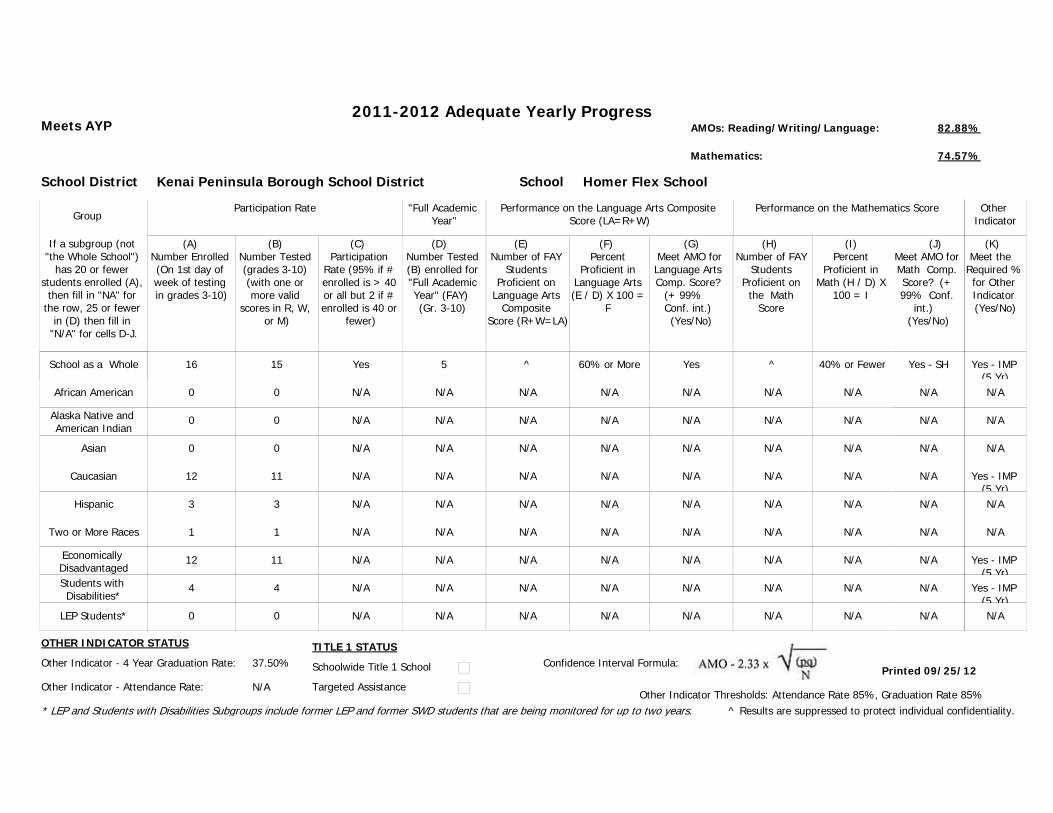
School Homer Flex School
Group
School as a Whole 16
Participation Rate
(A) Number Enrolled (On 1st day of week of testing in grades 3-10)
(B) Number Tested (grades 3-10) (with one or more valid
scores in R, W, or M)
(C) Participation
Rate (95% if # enrolled is > 40 or all but 2 if # enrolled is 40 or
fewer)
"Full Academic Year"
African American
Alaska Native and American Indian
Asian
Caucasian
Hispanic
Economically DisadvantagedStudents with Disabilities*
LEP Students*
(D) Number Tested (B) enrolled for "Full Academic Year" (FAY) (Gr. 3-10)
(E) Number of FAY
Students Proficient on
Language Arts Composite
Score (R+W=LA)
(F) Percent
Proficient in Language Arts (E / D) X 100 =
F
15
Meets AYP
(G) Meet AMO for Language Arts Comp. Score?
(+ 99% Conf. int.) (Yes/No)
(H) Number of FAY
Students Proficient on
the Math Score
(I) Percent
Proficient in Math (H / D) X
100 = I
(J) Meet AMO for Math Comp. Score? (+ 99% Conf.
int.) (Yes/No)
Performance on the Language Arts Composite Score (LA=R+W)
Performance on the Mathematics Score
0
0
0
12
3
12
4
0
0
0
0
11
3
11
4
0
5
N/A
N/A
N/A
N/A
N/A
N/A
N/A
N/A
^
N/A
N/A
N/A
N/A
N/A
N/A
N/A
N/A
Yes
N/A
N/A
N/A
N/A
N/A
N/A
N/A
N/A
^
N/A
N/A
N/A
N/A
N/A
N/A
N/A
N/A
Yes - SH
N/A
N/A
N/A
N/A
N/A
N/A
N/A
N/A
Schoolwide Title 1 School
School District Kenai Peninsula Borough School District
If a subgroup (not "the Whole School")
has 20 or fewer students enrolled (A),
then fill in "NA" for the row, 25 or fewer
in (D) then fill in "N/A" for cells D-J.
Yes
N/A
N/A
N/A
N/A
N/A
N/A
N/A
N/A
60% or More
N/A
N/A
N/A
N/A
N/A
N/A
N/A
N/A
40% or Fewer
N/A
N/A
N/A
N/A
N/A
N/A
N/A
Printed 09/25/12Confidence Interval Formula:
Other Indicator Thresholds: Attendance Rate 85%, Graduation Rate 85%
Other Indicator - 4 Year Graduation Rate: 37.50%
Other Indicator - Attendance Rate: N/A
OTHER INDICATOR STATUS TITLE 1 STATUS
(K) Meet the
Required % for Other Indicator (Yes/No)
Other Indicator
Yes - IMP (5 Yr)N/A
N/A
N/A
Yes - IMP (5 Yr)N/A
Yes - IMP (5 Yr)
Yes - IMP (5 Yr)N/A
Two or More Races 1 1 N/A N/A N/A N/A N/AN/A N/A N/A N/A
* LEP and Students with Disabilities Subgroups include former LEP and former SWD students that are being monitored for up to two years.
Targeted Assistance
^ Results are suppressed to protect individual confidentiality.
N/A
2011-2012 Adequate Yearly ProgressAMOs: Reading/Writing/Language: 82.88%
Mathematics: 74.57%
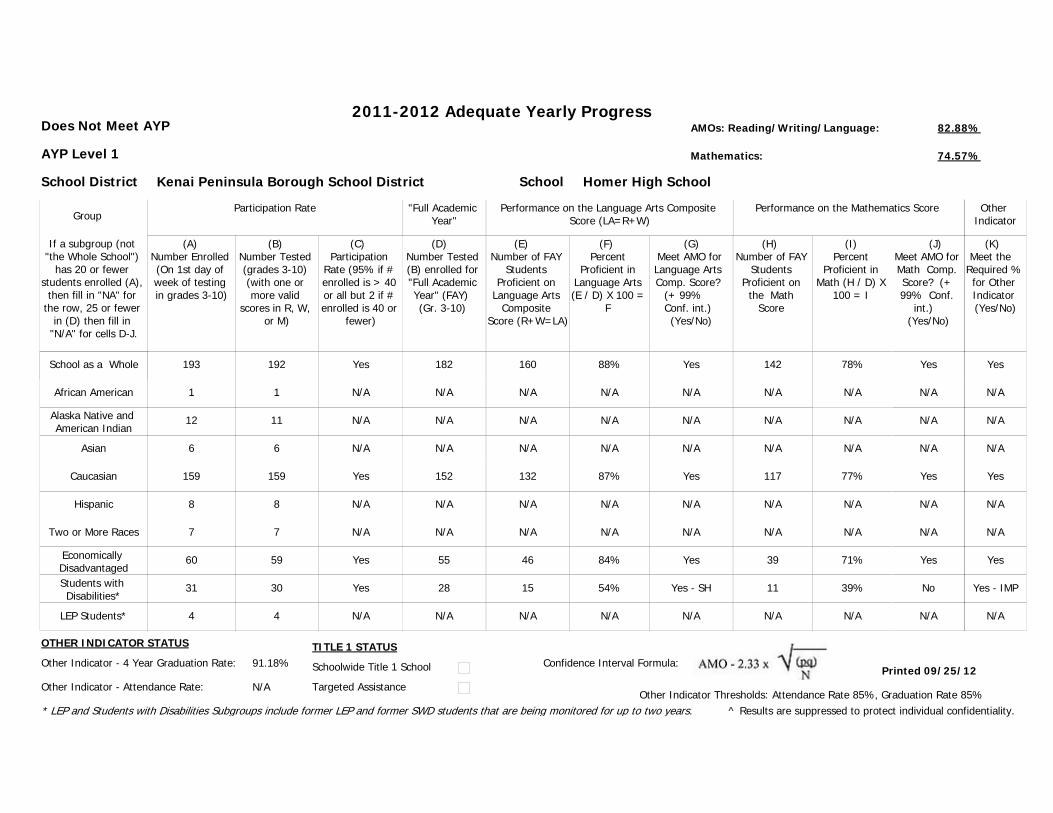
School Homer High School
Group
School as a Whole 193
Participation Rate
(A) Number Enrolled (On 1st day of week of testing in grades 3-10)
(B) Number Tested (grades 3-10) (with one or more valid
scores in R, W, or M)
(C) Participation
Rate (95% if # enrolled is > 40 or all but 2 if # enrolled is 40 or
fewer)
"Full Academic Year"
African American
Alaska Native and American Indian
Asian
Caucasian
Hispanic
Economically DisadvantagedStudents with Disabilities*
LEP Students*
(D) Number Tested (B) enrolled for "Full Academic Year" (FAY) (Gr. 3-10)
(E) Number of FAY
Students Proficient on
Language Arts Composite
Score (R+W=LA)
(F) Percent
Proficient in Language Arts (E / D) X 100 =
F
192
Does Not Meet AYP
AYP Level 1
(G) Meet AMO for Language Arts Comp. Score?
(+ 99% Conf. int.) (Yes/No)
(H) Number of FAY
Students Proficient on
the Math Score
(I) Percent
Proficient in Math (H / D) X
100 = I
(J) Meet AMO for Math Comp. Score? (+ 99% Conf.
int.) (Yes/No)
Performance on the Language Arts Composite Score (LA=R+W)
Performance on the Mathematics Score
1
12
6
159
8
60
31
4
1
11
6
159
8
59
30
4
182
N/A
N/A
N/A
152
N/A
55
28
N/A
160
N/A
N/A
N/A
132
N/A
46
15
N/A
Yes
N/A
N/A
N/A
Yes
N/A
Yes
Yes - SH
N/A
142
N/A
N/A
N/A
117
N/A
39
11
N/A
Yes
N/A
N/A
N/A
Yes
N/A
Yes
No
N/A
Schoolwide Title 1 School
School District Kenai Peninsula Borough School District
If a subgroup (not "the Whole School")
has 20 or fewer students enrolled (A),
then fill in "NA" for the row, 25 or fewer
in (D) then fill in "N/A" for cells D-J.
Yes
N/A
N/A
N/A
Yes
N/A
Yes
Yes
N/A
88%
N/A
N/A
N/A
87%
N/A
84%
54%
N/A
78%
N/A
N/A
77%
N/A
71%
39%
N/A
Printed 09/25/12Confidence Interval Formula:
Other Indicator Thresholds: Attendance Rate 85%, Graduation Rate 85%
Other Indicator - 4 Year Graduation Rate: 91.18%
Other Indicator - Attendance Rate: N/A
OTHER INDICATOR STATUS TITLE 1 STATUS
(K) Meet the
Required % for Other Indicator (Yes/No)
Other Indicator
Yes
N/A
N/A
N/A
Yes
N/A
Yes
Yes - IMP
N/A
Two or More Races 7 7 N/A N/A N/A N/A N/AN/A N/A N/A N/A
* LEP and Students with Disabilities Subgroups include former LEP and former SWD students that are being monitored for up to two years.
Targeted Assistance
^ Results are suppressed to protect individual confidentiality.
N/A

2011-2012 Adequate Yearly ProgressAMOs: Reading/Writing/Language: 82.88%
Mathematics: 74.57%
School Homer Middle School
Group
School as a Whole 191
Participation Rate
(A) Number Enrolled (On 1st day of week of testing in grades 3-10)
(B) Number Tested (grades 3-10) (with one or more valid
scores in R, W, or M)
(C) Participation
Rate (95% if # enrolled is > 40 or all but 2 if # enrolled is 40 or
fewer)
"Full Academic Year"
African American
Alaska Native and American Indian
Asian
Caucasian
Hispanic
Economically DisadvantagedStudents with Disabilities*
LEP Students*
(D) Number Tested (B) enrolled for "Full Academic Year" (FAY) (Gr. 3-10)
(E) Number of FAY
Students Proficient on
Language Arts Composite
Score (R+W=LA)
(F) Percent
Proficient in Language Arts (E / D) X 100 =
F
191
Does Not Meet AYP
AYP Level 2
(G) Meet AMO for Language Arts Comp. Score?
(+ 99% Conf. int.) (Yes/No)
(H) Number of FAY
Students Proficient on
the Math Score
(I) Percent
Proficient in Math (H / D) X
100 = I
(J) Meet AMO for Math Comp. Score? (+ 99% Conf.
int.) (Yes/No)
Performance on the Language Arts Composite Score (LA=R+W)
Performance on the Mathematics Score
0
15
3
147
13
80
34
2
0
15
3
147
13
80
34
2
178
N/A
N/A
N/A
139
N/A
72
31
N/A
160
N/A
N/A
N/A
126
N/A
60
18
N/A
Yes
N/A
N/A
N/A
Yes
N/A
Yes
No
N/A
151
N/A
N/A
N/A
119
N/A
57
19
N/A
Yes
N/A
N/A
N/A
Yes
N/A
Yes
Yes
N/A
Schoolwide Title 1 School
School District Kenai Peninsula Borough School District
If a subgroup (not "the Whole School")
has 20 or fewer students enrolled (A),
then fill in "NA" for the row, 25 or fewer
in (D) then fill in "N/A" for cells D-J.
Yes
N/A
N/A
N/A
Yes
N/A
Yes
Yes
N/A
90%
N/A
N/A
N/A
91%
N/A
83%
58%
N/A
85%
N/A
N/A
86%
N/A
79%
61%
N/A
Printed 09/25/12Confidence Interval Formula:
Other Indicator Thresholds: Attendance Rate 85%, Graduation Rate 85%
Other Indicator - 4 Year Graduation Rate: N/A
Other Indicator - Attendance Rate: 93.05%
OTHER INDICATOR STATUS TITLE 1 STATUS
(K) Meet the
Required % for Other Indicator (Yes/No)
Other Indicator
Yes
N/A
N/A
N/A
N/A
N/A
N/A
N/A
N/A
Two or More Races 13 13 N/A N/A N/A N/A N/AN/A N/A N/A N/A
* LEP and Students with Disabilities Subgroups include former LEP and former SWD students that are being monitored for up to two years.
Targeted Assistance
^ Results are suppressed to protect individual confidentiality.
N/A
2011-2012 Adequate Yearly ProgressAMOs: Reading/Writing/Language: 82.88%
Mathematics: 74.57%
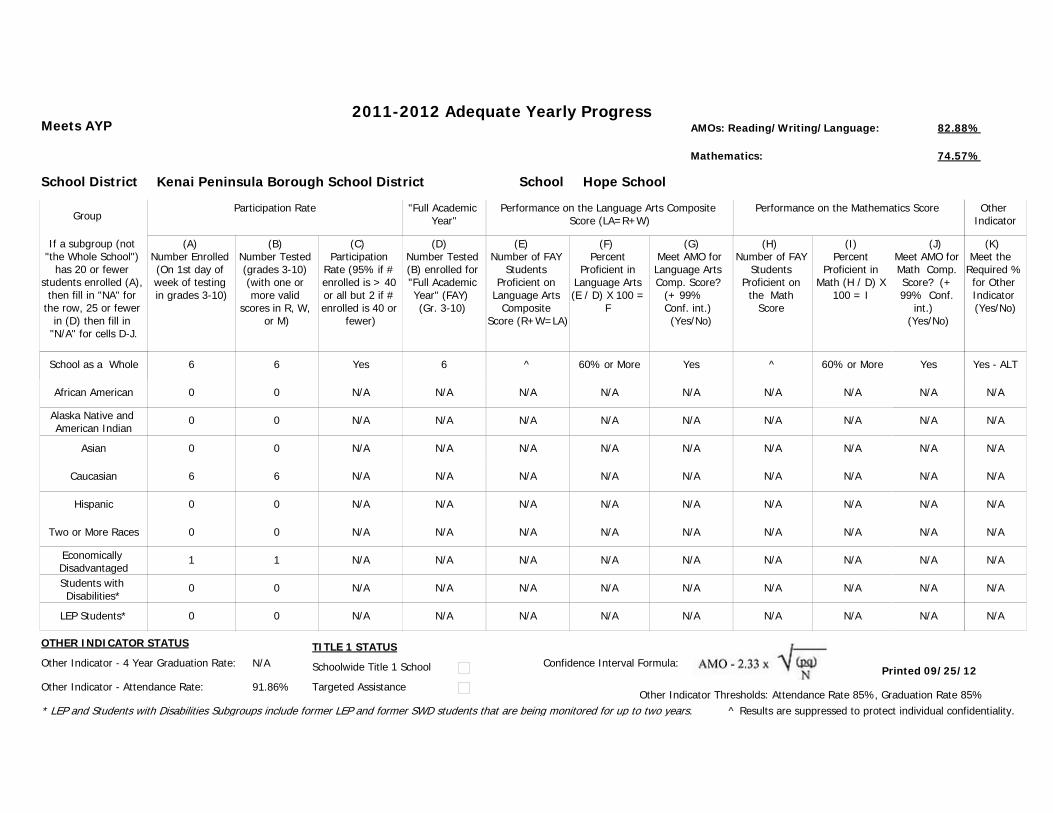
School Hope School
Group
School as a Whole 6
Participation Rate
(A) Number Enrolled (On 1st day of week of testing in grades 3-10)
(B) Number Tested (grades 3-10) (with one or more valid
scores in R, W, or M)
(C) Participation
Rate (95% if # enrolled is > 40 or all but 2 if # enrolled is 40 or
fewer)
"Full Academic Year"
African American
Alaska Native and American Indian
Asian
Caucasian
Hispanic
Economically DisadvantagedStudents with Disabilities*
LEP Students*
(D) Number Tested (B) enrolled for "Full Academic Year" (FAY) (Gr. 3-10)
(E) Number of FAY
Students Proficient on
Language Arts Composite
Score (R+W=LA)
(F) Percent
Proficient in Language Arts (E / D) X 100 =
F
6
Meets AYP
(G) Meet AMO for Language Arts Comp. Score?
(+ 99% Conf. int.) (Yes/No)
(H) Number of FAY
Students Proficient on
the Math Score
(I) Percent
Proficient in Math (H / D) X
100 = I
(J) Meet AMO for Math Comp. Score? (+ 99% Conf.
int.) (Yes/No)
Performance on the Language Arts Composite Score (LA=R+W)
Performance on the Mathematics Score
0
0
0
6
0
1
0
0
0
0
0
6
0
1
0
0
6
N/A
N/A
N/A
N/A
N/A
N/A
N/A
N/A
^
N/A
N/A
N/A
N/A
N/A
N/A
N/A
N/A
Yes
N/A
N/A
N/A
N/A
N/A
N/A
N/A
N/A
^
N/A
N/A
N/A
N/A
N/A
N/A
N/A
N/A
Yes
N/A
N/A
N/A
N/A
N/A
N/A
N/A
N/A
Schoolwide Title 1 School
School District Kenai Peninsula Borough School District
If a subgroup (not "the Whole School")
has 20 or fewer students enrolled (A),
then fill in "NA" for the row, 25 or fewer
in (D) then fill in "N/A" for cells D-J.
Yes
N/A
N/A
N/A
N/A
N/A
N/A
N/A
N/A
60% or More
N/A
N/A
N/A
N/A
N/A
N/A
N/A
N/A
60% or More
N/A
N/A
N/A
N/A
N/A
N/A
N/A
Printed 09/25/12Confidence Interval Formula:
Other Indicator Thresholds: Attendance Rate 85%, Graduation Rate 85%
Other Indicator - 4 Year Graduation Rate: N/A
Other Indicator - Attendance Rate: 91.86%
OTHER INDICATOR STATUS TITLE 1 STATUS
(K) Meet the
Required % for Other Indicator (Yes/No)
Other Indicator
Yes - ALT
N/A
N/A
N/A
N/A
N/A
N/A
N/A
N/A
Two or More Races 0 0 N/A N/A N/A N/A N/AN/A N/A N/A N/A
* LEP and Students with Disabilities Subgroups include former LEP and former SWD students that are being monitored for up to two years.
Targeted Assistance
^ Results are suppressed to protect individual confidentiality.
N/A

2011-2012 Adequate Yearly ProgressAMOs: Reading/Writing/Language: 82.88%
Mathematics: 74.57%
School Kachemak Selo School
Group
School as a Whole 47
Participation Rate
(A) Number Enrolled (On 1st day of week of testing in grades 3-10)
(B) Number Tested (grades 3-10) (with one or more valid
scores in R, W, or M)
(C) Participation
Rate (95% if # enrolled is > 40 or all but 2 if # enrolled is 40 or
fewer)
"Full Academic Year"
African American
Alaska Native and American Indian
Asian
Caucasian
Hispanic
Economically DisadvantagedStudents with Disabilities*
LEP Students*
(D) Number Tested (B) enrolled for "Full Academic Year" (FAY) (Gr. 3-10)
(E) Number of FAY
Students Proficient on
Language Arts Composite
Score (R+W=LA)
(F) Percent
Proficient in Language Arts (E / D) X 100 =
F
47
Meets AYP
(G) Meet AMO for Language Arts Comp. Score?
(+ 99% Conf. int.) (Yes/No)
(H) Number of FAY
Students Proficient on
the Math Score
(I) Percent
Proficient in Math (H / D) X
100 = I
(J) Meet AMO for Math Comp. Score? (+ 99% Conf.
int.) (Yes/No)
Performance on the Language Arts Composite Score (LA=R+W)
Performance on the Mathematics Score
0
0
0
47
0
39
6
23
0
0
0
47
0
39
6
23
47
N/A
N/A
N/A
47
N/A
39
N/A
N/A
41
N/A
N/A
N/A
41
N/A
33
N/A
N/A
Yes
N/A
N/A
N/A
Yes
N/A
Yes
N/A
N/A
42
N/A
N/A
N/A
42
N/A
35
N/A
N/A
Yes
N/A
N/A
N/A
Yes
N/A
Yes
N/A
N/A
Schoolwide Title 1 School
School District Kenai Peninsula Borough School District
If a subgroup (not "the Whole School")
has 20 or fewer students enrolled (A),
then fill in "NA" for the row, 25 or fewer
in (D) then fill in "N/A" for cells D-J.
Yes
N/A
N/A
N/A
Yes
N/A
Yes
N/A
Yes
87%
N/A
N/A
N/A
87%
N/A
85%
N/A
N/A
89%
N/A
N/A
89%
N/A
90%
N/A
N/A
Printed 09/25/12Confidence Interval Formula:
Other Indicator Thresholds: Attendance Rate 85%, Graduation Rate 85%
Other Indicator - 4 Year Graduation Rate: 100.0%
Other Indicator - Attendance Rate: N/A
OTHER INDICATOR STATUS TITLE 1 STATUS
(K) Meet the
Required % for Other Indicator (Yes/No)
Other Indicator
Yes
N/A
N/A
N/A
Yes
N/A
Yes
N/A
N/A
Two or More Races 0 0 N/A N/A N/A N/A N/AN/A N/A N/A N/A
* LEP and Students with Disabilities Subgroups include former LEP and former SWD students that are being monitored for up to two years.
Targeted Assistance
^ Results are suppressed to protect individual confidentiality.
N/A
2011-2012 Adequate Yearly ProgressAMOs: Reading/Writing/Language: 82.88%
Mathematics: 74.57%
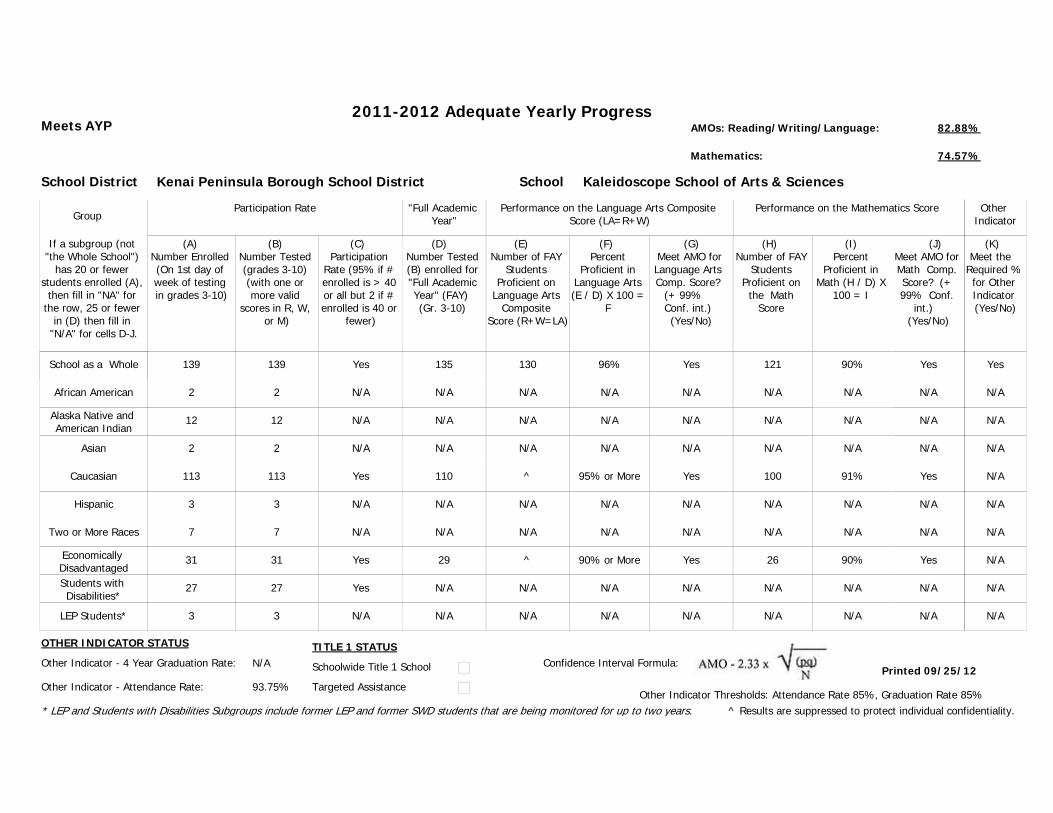
School Kaleidoscope School of Arts & Sciences
Group
School as a Whole 139
Participation Rate
(A) Number Enrolled (On 1st day of week of testing in grades 3-10)
(B) Number Tested (grades 3-10) (with one or more valid
scores in R, W, or M)
(C) Participation
Rate (95% if # enrolled is > 40 or all but 2 if # enrolled is 40 or
fewer)
"Full Academic Year"
African American
Alaska Native and American Indian
Asian
Caucasian
Hispanic
Economically DisadvantagedStudents with Disabilities*
LEP Students*
(D) Number Tested (B) enrolled for "Full Academic Year" (FAY) (Gr. 3-10)
(E) Number of FAY
Students Proficient on
Language Arts Composite
Score (R+W=LA)
(F) Percent
Proficient in Language Arts (E / D) X 100 =
F
139
Meets AYP
(G) Meet AMO for Language Arts Comp. Score?
(+ 99% Conf. int.) (Yes/No)
(H) Number of FAY
Students Proficient on
the Math Score
(I) Percent
Proficient in Math (H / D) X
100 = I
(J) Meet AMO for Math Comp. Score? (+ 99% Conf.
int.) (Yes/No)
Performance on the Language Arts Composite Score (LA=R+W)
Performance on the Mathematics Score
2
12
2
113
3
31
27
3
2
12
2
113
3
31
27
3
135
N/A
N/A
N/A
110
N/A
29
N/A
N/A
130
N/A
N/A
N/A
^
N/A
^
N/A
N/A
Yes
N/A
N/A
N/A
Yes
N/A
Yes
N/A
N/A
121
N/A
N/A
N/A
100
N/A
26
N/A
N/A
Yes
N/A
N/A
N/A
Yes
N/A
Yes
N/A
N/A
Schoolwide Title 1 School
School District Kenai Peninsula Borough School District
If a subgroup (not "the Whole School")
has 20 or fewer students enrolled (A),
then fill in "NA" for the row, 25 or fewer
in (D) then fill in "N/A" for cells D-J.
Yes
N/A
N/A
N/A
Yes
N/A
Yes
Yes
N/A
96%
N/A
N/A
N/A
95% or More
N/A
90% or More
N/A
N/A
90%
N/A
N/A
91%
N/A
90%
N/A
N/A
Printed 09/25/12Confidence Interval Formula:
Other Indicator Thresholds: Attendance Rate 85%, Graduation Rate 85%
Other Indicator - 4 Year Graduation Rate: N/A
Other Indicator - Attendance Rate: 93.75%
OTHER INDICATOR STATUS TITLE 1 STATUS
(K) Meet the
Required % for Other Indicator (Yes/No)
Other Indicator
Yes
N/A
N/A
N/A
N/A
N/A
N/A
N/A
N/A
Two or More Races 7 7 N/A N/A N/A N/A N/AN/A N/A N/A N/A
* LEP and Students with Disabilities Subgroups include former LEP and former SWD students that are being monitored for up to two years.
Targeted Assistance
^ Results are suppressed to protect individual confidentiality.
N/A

2011-2012 Adequate Yearly ProgressAMOs: Reading/Writing/Language: 82.88%
Mathematics: 74.57%
School Kalifornsky Beach Elementary
Group
School as a Whole 228
Participation Rate
(A) Number Enrolled (On 1st day of week of testing in grades 3-10)
(B) Number Tested (grades 3-10) (with one or more valid
scores in R, W, or M)
(C) Participation
Rate (95% if # enrolled is > 40 or all but 2 if # enrolled is 40 or
fewer)
"Full Academic Year"
African American
Alaska Native and American Indian
Asian
Caucasian
Hispanic
Economically DisadvantagedStudents with Disabilities*
LEP Students*
(D) Number Tested (B) enrolled for "Full Academic Year" (FAY) (Gr. 3-10)
(E) Number of FAY
Students Proficient on
Language Arts Composite
Score (R+W=LA)
(F) Percent
Proficient in Language Arts (E / D) X 100 =
F
228
Meets AYP
(G) Meet AMO for Language Arts Comp. Score?
(+ 99% Conf. int.) (Yes/No)
(H) Number of FAY
Students Proficient on
the Math Score
(I) Percent
Proficient in Math (H / D) X
100 = I
(J) Meet AMO for Math Comp. Score? (+ 99% Conf.
int.) (Yes/No)
Performance on the Language Arts Composite Score (LA=R+W)
Performance on the Mathematics Score
1
23
0
171
10
75
43
0
1
23
0
171
10
75
43
0
216
N/A
N/A
N/A
165
N/A
69
39
N/A
202
N/A
N/A
N/A
156
N/A
64
30
N/A
Yes
N/A
N/A
N/A
Yes
N/A
Yes
Yes
N/A
190
N/A
N/A
N/A
150
N/A
59
31
N/A
Yes
N/A
N/A
N/A
Yes
N/A
Yes
Yes
N/A
Schoolwide Title 1 School
School District Kenai Peninsula Borough School District
If a subgroup (not "the Whole School")
has 20 or fewer students enrolled (A),
then fill in "NA" for the row, 25 or fewer
in (D) then fill in "N/A" for cells D-J.
Yes
N/A
Yes
N/A
Yes
N/A
Yes
Yes
N/A
94%
N/A
N/A
N/A
95%
N/A
93%
77%
N/A
88%
N/A
N/A
91%
N/A
86%
79%
N/A
Printed 09/25/12Confidence Interval Formula:
Other Indicator Thresholds: Attendance Rate 85%, Graduation Rate 85%
Other Indicator - 4 Year Graduation Rate: N/A
Other Indicator - Attendance Rate: 93.23%
OTHER INDICATOR STATUS TITLE 1 STATUS
(K) Meet the
Required % for Other Indicator (Yes/No)
Other Indicator
Yes
N/A
N/A
N/A
N/A
N/A
N/A
N/A
N/A
Two or More Races 23 23 N/A N/A N/A N/A N/AYes N/A N/A N/A
* LEP and Students with Disabilities Subgroups include former LEP and former SWD students that are being monitored for up to two years.
Targeted Assistance
^ Results are suppressed to protect individual confidentiality.
N/A
2011-2012 Adequate Yearly ProgressAMOs: Reading/Writing/Language: 82.88%
Mathematics: 74.57%
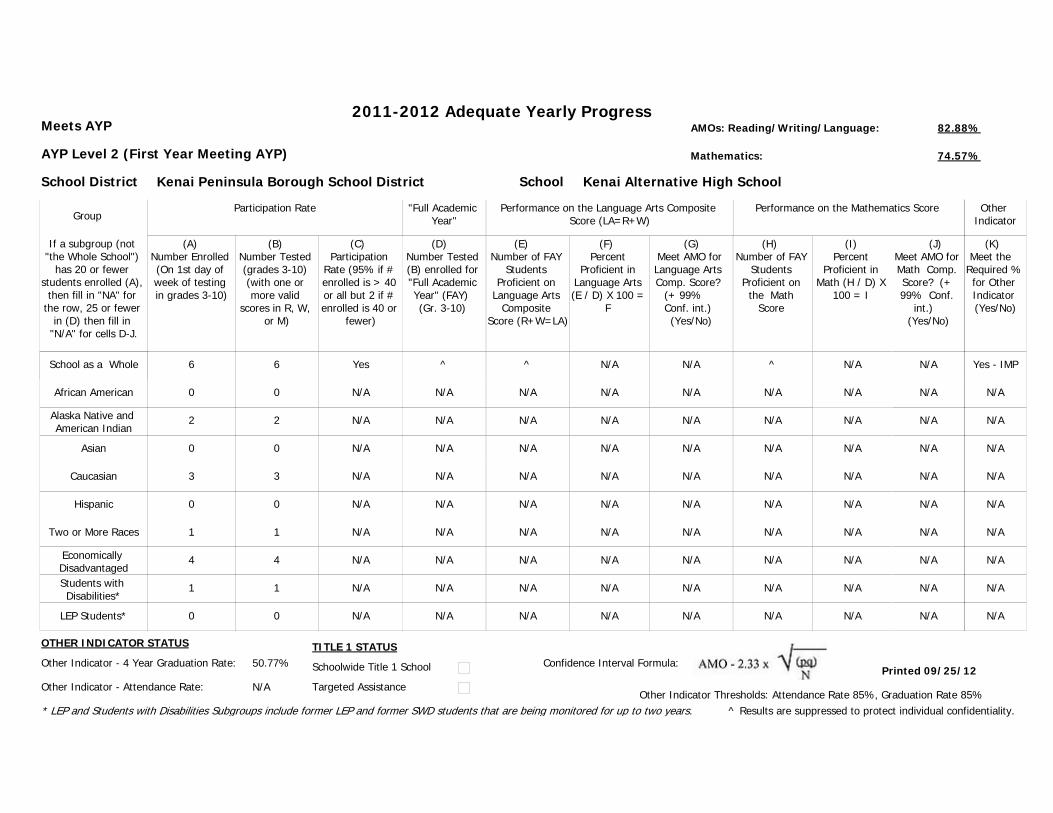
School Kenai Alternative High School
Group
School as a Whole 6
Participation Rate
(A) Number Enrolled (On 1st day of week of testing in grades 3-10)
(B) Number Tested (grades 3-10) (with one or more valid
scores in R, W, or M)
(C) Participation
Rate (95% if # enrolled is > 40 or all but 2 if # enrolled is 40 or
fewer)
"Full Academic Year"
African American
Alaska Native and American Indian
Asian
Caucasian
Hispanic
Economically DisadvantagedStudents with Disabilities*
LEP Students*
(D) Number Tested (B) enrolled for "Full Academic Year" (FAY) (Gr. 3-10)
(E) Number of FAY
Students Proficient on
Language Arts Composite
Score (R+W=LA)
(F) Percent
Proficient in Language Arts (E / D) X 100 =
F
6
Meets AYP
AYP Level 2 (First Year Meeting AYP)
(G) Meet AMO for Language Arts Comp. Score?
(+ 99% Conf. int.) (Yes/No)
(H) Number of FAY
Students Proficient on
the Math Score
(I) Percent
Proficient in Math (H / D) X
100 = I
(J) Meet AMO for Math Comp. Score? (+ 99% Conf.
int.) (Yes/No)
Performance on the Language Arts Composite Score (LA=R+W)
Performance on the Mathematics Score
0
2
0
3
0
4
1
0
0
2
0
3
0
4
1
0
^
N/A
N/A
N/A
N/A
N/A
N/A
N/A
N/A
^
N/A
N/A
N/A
N/A
N/A
N/A
N/A
N/A
N/A
N/A
N/A
N/A
N/A
N/A
N/A
N/A
N/A
^
N/A
N/A
N/A
N/A
N/A
N/A
N/A
N/A
N/A
N/A
N/A
N/A
N/A
N/A
N/A
N/A
N/A
Schoolwide Title 1 School
School District Kenai Peninsula Borough School District
If a subgroup (not "the Whole School")
has 20 or fewer students enrolled (A),
then fill in "NA" for the row, 25 or fewer
in (D) then fill in "N/A" for cells D-J.
Yes
N/A
N/A
N/A
N/A
N/A
N/A
N/A
N/A
N/A
N/A
N/A
N/A
N/A
N/A
N/A
N/A
N/A
N/A
N/A
N/A
N/A
N/A
N/A
N/A
N/A
Printed 09/25/12Confidence Interval Formula:
Other Indicator Thresholds: Attendance Rate 85%, Graduation Rate 85%
Other Indicator - 4 Year Graduation Rate: 50.77%
Other Indicator - Attendance Rate: N/A
OTHER INDICATOR STATUS TITLE 1 STATUS
(K) Meet the
Required % for Other Indicator (Yes/No)
Other Indicator
Yes - IMP
N/A
N/A
N/A
N/A
N/A
N/A
N/A
N/A
Two or More Races 1 1 N/A N/A N/A N/A N/AN/A N/A N/A N/A
* LEP and Students with Disabilities Subgroups include former LEP and former SWD students that are being monitored for up to two years.
Targeted Assistance
^ Results are suppressed to protect individual confidentiality.
N/A
2011-2012 Adequate Yearly ProgressAMOs: Reading/Writing/Language: 82.88%
Mathematics: 74.57%
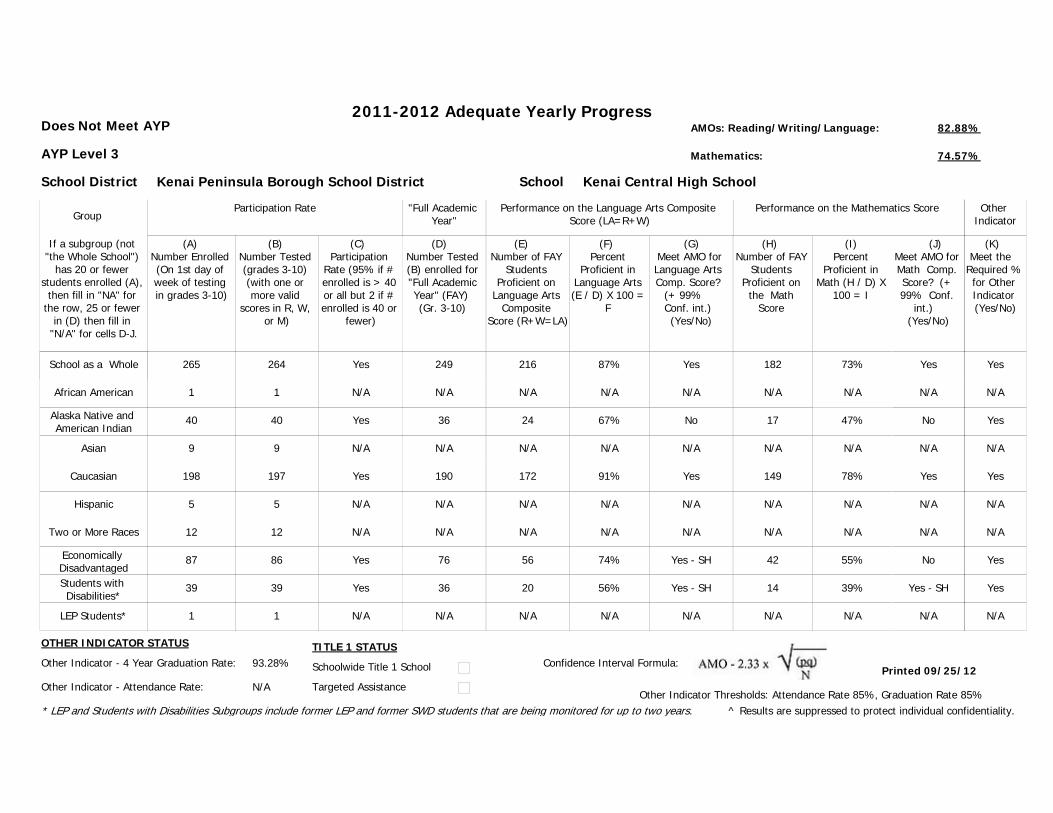
School Kenai Central High School
Group
School as a Whole 265
Participation Rate
(A) Number Enrolled (On 1st day of week of testing in grades 3-10)
(B) Number Tested (grades 3-10) (with one or more valid
scores in R, W, or M)
(C) Participation
Rate (95% if # enrolled is > 40 or all but 2 if # enrolled is 40 or
fewer)
"Full Academic Year"
African American
Alaska Native and American Indian
Asian
Caucasian
Hispanic
Economically DisadvantagedStudents with Disabilities*
LEP Students*
(D) Number Tested (B) enrolled for "Full Academic Year" (FAY) (Gr. 3-10)
(E) Number of FAY
Students Proficient on
Language Arts Composite
Score (R+W=LA)
(F) Percent
Proficient in Language Arts (E / D) X 100 =
F
264
Does Not Meet AYP
AYP Level 3
(G) Meet AMO for Language Arts Comp. Score?
(+ 99% Conf. int.) (Yes/No)
(H) Number of FAY
Students Proficient on
the Math Score
(I) Percent
Proficient in Math (H / D) X
100 = I
(J) Meet AMO for Math Comp. Score? (+ 99% Conf.
int.) (Yes/No)
Performance on the Language Arts Composite Score (LA=R+W)
Performance on the Mathematics Score
1
40
9
198
5
87
39
1
1
40
9
197
5
86
39
1
249
N/A
36
N/A
190
N/A
76
36
N/A
216
N/A
24
N/A
172
N/A
56
20
N/A
Yes
N/A
No
N/A
Yes
N/A
Yes - SH
Yes - SH
N/A
182
N/A
17
N/A
149
N/A
42
14
N/A
Yes
N/A
No
N/A
Yes
N/A
No
Yes - SH
N/A
Schoolwide Title 1 School
School District Kenai Peninsula Borough School District
If a subgroup (not "the Whole School")
has 20 or fewer students enrolled (A),
then fill in "NA" for the row, 25 or fewer
in (D) then fill in "N/A" for cells D-J.
Yes
N/A
Yes
N/A
Yes
N/A
Yes
Yes
N/A
87%
N/A
67%
N/A
91%
N/A
74%
56%
N/A
73%
N/A
N/A
78%
N/A
55%
39%
N/A
Printed 09/25/12Confidence Interval Formula:
Other Indicator Thresholds: Attendance Rate 85%, Graduation Rate 85%
Other Indicator - 4 Year Graduation Rate: 93.28%
Other Indicator - Attendance Rate: N/A
OTHER INDICATOR STATUS TITLE 1 STATUS
(K) Meet the
Required % for Other Indicator (Yes/No)
Other Indicator
Yes
N/A
Yes
N/A
Yes
N/A
Yes
Yes
N/A
Two or More Races 12 12 N/A N/A N/A N/A N/AN/A N/A N/A N/A
* LEP and Students with Disabilities Subgroups include former LEP and former SWD students that are being monitored for up to two years.
Targeted Assistance
^ Results are suppressed to protect individual confidentiality.
47%
2011-2012 Adequate Yearly ProgressAMOs: Reading/Writing/Language: 82.88%
Mathematics: 74.57%
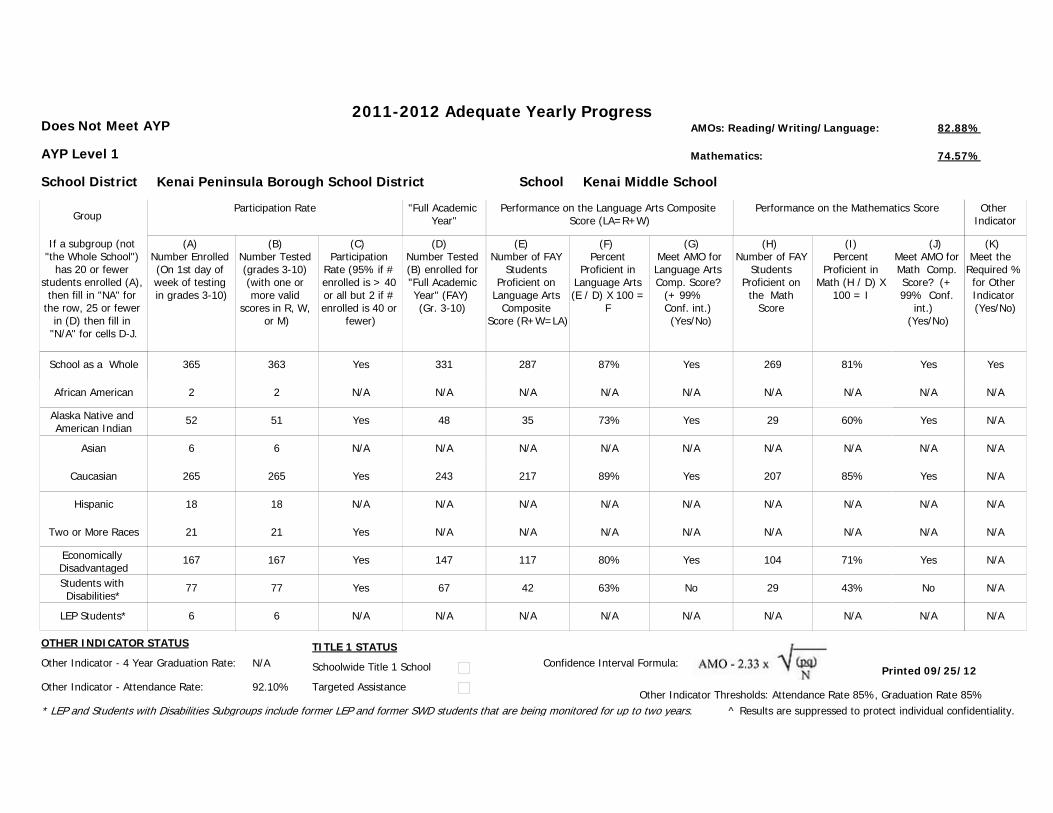
School Kenai Middle School
Group
School as a Whole 365
Participation Rate
(A) Number Enrolled (On 1st day of week of testing in grades 3-10)
(B) Number Tested (grades 3-10) (with one or more valid
scores in R, W, or M)
(C) Participation
Rate (95% if # enrolled is > 40 or all but 2 if # enrolled is 40 or
fewer)
"Full Academic Year"
African American
Alaska Native and American Indian
Asian
Caucasian
Hispanic
Economically DisadvantagedStudents with Disabilities*
LEP Students*
(D) Number Tested (B) enrolled for "Full Academic Year" (FAY) (Gr. 3-10)
(E) Number of FAY
Students Proficient on
Language Arts Composite
Score (R+W=LA)
(F) Percent
Proficient in Language Arts (E / D) X 100 =
F
363
Does Not Meet AYP
AYP Level 1
(G) Meet AMO for Language Arts Comp. Score?
(+ 99% Conf. int.) (Yes/No)
(H) Number of FAY
Students Proficient on
the Math Score
(I) Percent
Proficient in Math (H / D) X
100 = I
(J) Meet AMO for Math Comp. Score? (+ 99% Conf.
int.) (Yes/No)
Performance on the Language Arts Composite Score (LA=R+W)
Performance on the Mathematics Score
2
52
6
265
18
167
77
6
2
51
6
265
18
167
77
6
331
N/A
48
N/A
243
N/A
147
67
N/A
287
N/A
35
N/A
217
N/A
117
42
N/A
Yes
N/A
Yes
N/A
Yes
N/A
Yes
No
N/A
269
N/A
29
N/A
207
N/A
104
29
N/A
Yes
N/A
Yes
N/A
Yes
N/A
Yes
No
N/A
Schoolwide Title 1 School
School District Kenai Peninsula Borough School District
If a subgroup (not "the Whole School")
has 20 or fewer students enrolled (A),
then fill in "NA" for the row, 25 or fewer
in (D) then fill in "N/A" for cells D-J.
Yes
N/A
Yes
N/A
Yes
N/A
Yes
Yes
N/A
87%
N/A
73%
N/A
89%
N/A
80%
63%
N/A
81%
N/A
N/A
85%
N/A
71%
43%
N/A
Printed 09/25/12Confidence Interval Formula:
Other Indicator Thresholds: Attendance Rate 85%, Graduation Rate 85%
Other Indicator - 4 Year Graduation Rate: N/A
Other Indicator - Attendance Rate: 92.10%
OTHER INDICATOR STATUS TITLE 1 STATUS
(K) Meet the
Required % for Other Indicator (Yes/No)
Other Indicator
Yes
N/A
N/A
N/A
N/A
N/A
N/A
N/A
N/A
Two or More Races 21 21 N/A N/A N/A N/A N/AYes N/A N/A N/A
* LEP and Students with Disabilities Subgroups include former LEP and former SWD students that are being monitored for up to two years.
Targeted Assistance
^ Results are suppressed to protect individual confidentiality.
60%
2011-2012 Adequate Yearly ProgressAMOs: Reading/Writing/Language: 82.88%
Mathematics: 74.57%
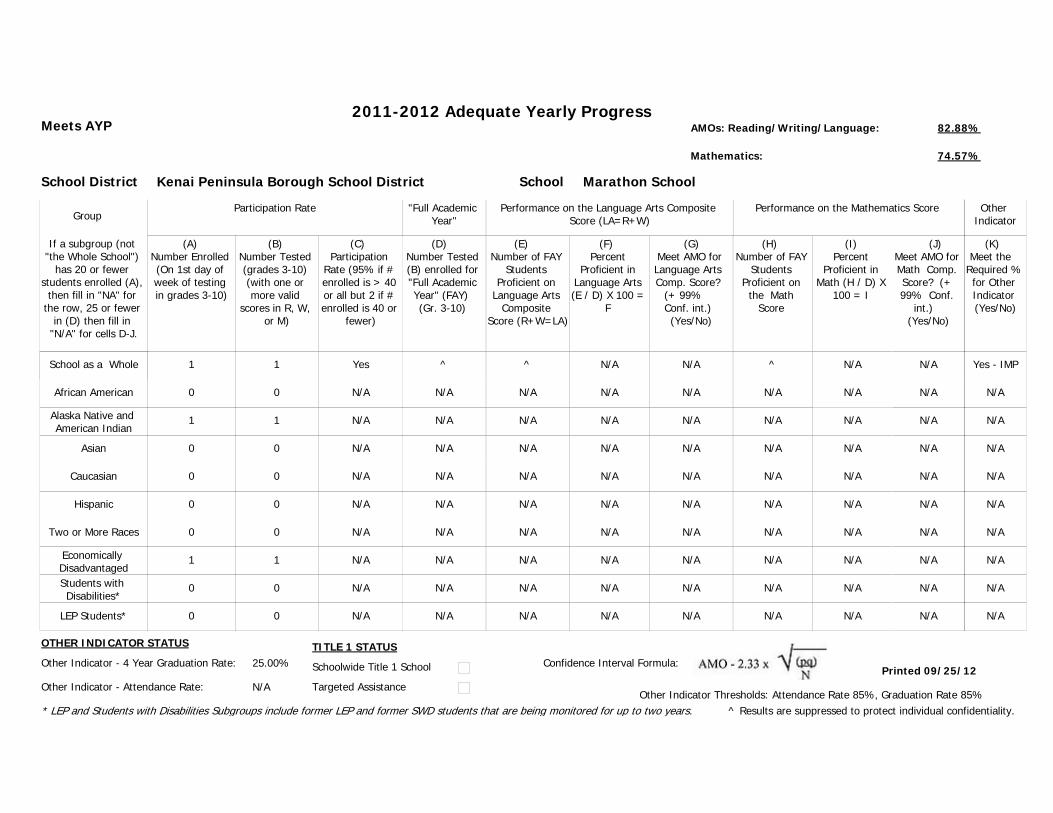
School Marathon School
Group
School as a Whole 1
Participation Rate
(A) Number Enrolled (On 1st day of week of testing in grades 3-10)
(B) Number Tested (grades 3-10) (with one or more valid
scores in R, W, or M)
(C) Participation
Rate (95% if # enrolled is > 40 or all but 2 if # enrolled is 40 or
fewer)
"Full Academic Year"
African American
Alaska Native and American Indian
Asian
Caucasian
Hispanic
Economically DisadvantagedStudents with Disabilities*
LEP Students*
(D) Number Tested (B) enrolled for "Full Academic Year" (FAY) (Gr. 3-10)
(E) Number of FAY
Students Proficient on
Language Arts Composite
Score (R+W=LA)
(F) Percent
Proficient in Language Arts (E / D) X 100 =
F
1
Meets AYP
(G) Meet AMO for Language Arts Comp. Score?
(+ 99% Conf. int.) (Yes/No)
(H) Number of FAY
Students Proficient on
the Math Score
(I) Percent
Proficient in Math (H / D) X
100 = I
(J) Meet AMO for Math Comp. Score? (+ 99% Conf.
int.) (Yes/No)
Performance on the Language Arts Composite Score (LA=R+W)
Performance on the Mathematics Score
0
1
0
0
0
1
0
0
0
1
0
0
0
1
0
0
^
N/A
N/A
N/A
N/A
N/A
N/A
N/A
N/A
^
N/A
N/A
N/A
N/A
N/A
N/A
N/A
N/A
N/A
N/A
N/A
N/A
N/A
N/A
N/A
N/A
N/A
^
N/A
N/A
N/A
N/A
N/A
N/A
N/A
N/A
N/A
N/A
N/A
N/A
N/A
N/A
N/A
N/A
N/A
Schoolwide Title 1 School
School District Kenai Peninsula Borough School District
If a subgroup (not "the Whole School")
has 20 or fewer students enrolled (A),
then fill in "NA" for the row, 25 or fewer
in (D) then fill in "N/A" for cells D-J.
Yes
N/A
N/A
N/A
N/A
N/A
N/A
N/A
N/A
N/A
N/A
N/A
N/A
N/A
N/A
N/A
N/A
N/A
N/A
N/A
N/A
N/A
N/A
N/A
N/A
N/A
Printed 09/25/12Confidence Interval Formula:
Other Indicator Thresholds: Attendance Rate 85%, Graduation Rate 85%
Other Indicator - 4 Year Graduation Rate: 25.00%
Other Indicator - Attendance Rate: N/A
OTHER INDICATOR STATUS TITLE 1 STATUS
(K) Meet the
Required % for Other Indicator (Yes/No)
Other Indicator
Yes - IMP
N/A
N/A
N/A
N/A
N/A
N/A
N/A
N/A
Two or More Races 0 0 N/A N/A N/A N/A N/AN/A N/A N/A N/A
* LEP and Students with Disabilities Subgroups include former LEP and former SWD students that are being monitored for up to two years.
Targeted Assistance
^ Results are suppressed to protect individual confidentiality.
N/A

2011-2012 Adequate Yearly ProgressAMOs: Reading/Writing/Language: 82.88%
Mathematics: 74.57%
School McNeil Canyon Elementary
Group
School as a Whole 78
Participation Rate
(A) Number Enrolled (On 1st day of week of testing in grades 3-10)
(B) Number Tested (grades 3-10) (with one or more valid
scores in R, W, or M)
(C) Participation
Rate (95% if # enrolled is > 40 or all but 2 if # enrolled is 40 or
fewer)
"Full Academic Year"
African American
Alaska Native and American Indian
Asian
Caucasian
Hispanic
Economically DisadvantagedStudents with Disabilities*
LEP Students*
(D) Number Tested (B) enrolled for "Full Academic Year" (FAY) (Gr. 3-10)
(E) Number of FAY
Students Proficient on
Language Arts Composite
Score (R+W=LA)
(F) Percent
Proficient in Language Arts (E / D) X 100 =
F
78
Meets AYP
(G) Meet AMO for Language Arts Comp. Score?
(+ 99% Conf. int.) (Yes/No)
(H) Number of FAY
Students Proficient on
the Math Score
(I) Percent
Proficient in Math (H / D) X
100 = I
(J) Meet AMO for Math Comp. Score? (+ 99% Conf.
int.) (Yes/No)
Performance on the Language Arts Composite Score (LA=R+W)
Performance on the Mathematics Score
0
5
3
65
3
28
19
11
0
5
3
65
3
28
19
11
77
N/A
N/A
N/A
64
N/A
27
N/A
N/A
67
N/A
N/A
N/A
57
N/A
21
N/A
N/A
Yes
N/A
N/A
N/A
Yes
N/A
Yes
N/A
N/A
65
N/A
N/A
N/A
54
N/A
18
N/A
N/A
Yes
N/A
N/A
N/A
Yes
N/A
Yes
N/A
N/A
Schoolwide Title 1 School
School District Kenai Peninsula Borough School District
If a subgroup (not "the Whole School")
has 20 or fewer students enrolled (A),
then fill in "NA" for the row, 25 or fewer
in (D) then fill in "N/A" for cells D-J.
Yes
N/A
N/A
N/A
Yes
N/A
Yes
N/A
N/A
87%
N/A
N/A
N/A
89%
N/A
78%
N/A
N/A
84%
N/A
N/A
84%
N/A
67%
N/A
N/A
Printed 09/25/12Confidence Interval Formula:
Other Indicator Thresholds: Attendance Rate 85%, Graduation Rate 85%
Other Indicator - 4 Year Graduation Rate: N/A
Other Indicator - Attendance Rate: 93.13%
OTHER INDICATOR STATUS TITLE 1 STATUS
(K) Meet the
Required % for Other Indicator (Yes/No)
Other Indicator
Yes
N/A
N/A
N/A
N/A
N/A
N/A
N/A
N/A
Two or More Races 2 2 N/A N/A N/A N/A N/AN/A N/A N/A N/A
* LEP and Students with Disabilities Subgroups include former LEP and former SWD students that are being monitored for up to two years.
Targeted Assistance
^ Results are suppressed to protect individual confidentiality.
N/A

2011-2012 Adequate Yearly ProgressAMOs: Reading/Writing/Language: 82.88%
Mathematics: 74.57%
School Moose Pass School
Group
School as a Whole 12
Participation Rate
(A) Number Enrolled (On 1st day of week of testing in grades 3-10)
(B) Number Tested (grades 3-10) (with one or more valid
scores in R, W, or M)
(C) Participation
Rate (95% if # enrolled is > 40 or all but 2 if # enrolled is 40 or
fewer)
"Full Academic Year"
African American
Alaska Native and American Indian
Asian
Caucasian
Hispanic
Economically DisadvantagedStudents with Disabilities*
LEP Students*
(D) Number Tested (B) enrolled for "Full Academic Year" (FAY) (Gr. 3-10)
(E) Number of FAY
Students Proficient on
Language Arts Composite
Score (R+W=LA)
(F) Percent
Proficient in Language Arts (E / D) X 100 =
F
12
Meets AYP
(G) Meet AMO for Language Arts Comp. Score?
(+ 99% Conf. int.) (Yes/No)
(H) Number of FAY
Students Proficient on
the Math Score
(I) Percent
Proficient in Math (H / D) X
100 = I
(J) Meet AMO for Math Comp. Score? (+ 99% Conf.
int.) (Yes/No)
Performance on the Language Arts Composite Score (LA=R+W)
Performance on the Mathematics Score
0
1
1
10
0
4
1
0
0
1
1
10
0
4
1
0
12
N/A
N/A
N/A
N/A
N/A
N/A
N/A
N/A
^
N/A
N/A
N/A
N/A
N/A
N/A
N/A
N/A
Yes
N/A
N/A
N/A
N/A
N/A
N/A
N/A
N/A
^
N/A
N/A
N/A
N/A
N/A
N/A
N/A
N/A
Yes
N/A
N/A
N/A
N/A
N/A
N/A
N/A
N/A
Schoolwide Title 1 School
School District Kenai Peninsula Borough School District
If a subgroup (not "the Whole School")
has 20 or fewer students enrolled (A),
then fill in "NA" for the row, 25 or fewer
in (D) then fill in "N/A" for cells D-J.
Yes
N/A
N/A
N/A
N/A
N/A
N/A
N/A
N/A
80% or More
N/A
N/A
N/A
N/A
N/A
N/A
N/A
N/A
80% or More
N/A
N/A
N/A
N/A
N/A
N/A
N/A
Printed 09/25/12Confidence Interval Formula:
Other Indicator Thresholds: Attendance Rate 85%, Graduation Rate 85%
Other Indicator - 4 Year Graduation Rate: N/A
Other Indicator - Attendance Rate: 90.34%
OTHER INDICATOR STATUS TITLE 1 STATUS
(K) Meet the
Required % for Other Indicator (Yes/No)
Other Indicator
Yes
N/A
N/A
N/A
N/A
N/A
N/A
N/A
N/A
Two or More Races 0 0 N/A N/A N/A N/A N/AN/A N/A N/A N/A
* LEP and Students with Disabilities Subgroups include former LEP and former SWD students that are being monitored for up to two years.
Targeted Assistance
^ Results are suppressed to protect individual confidentiality.
N/A
2011-2012 Adequate Yearly ProgressAMOs: Reading/Writing/Language: 82.88%
Mathematics: 74.57%
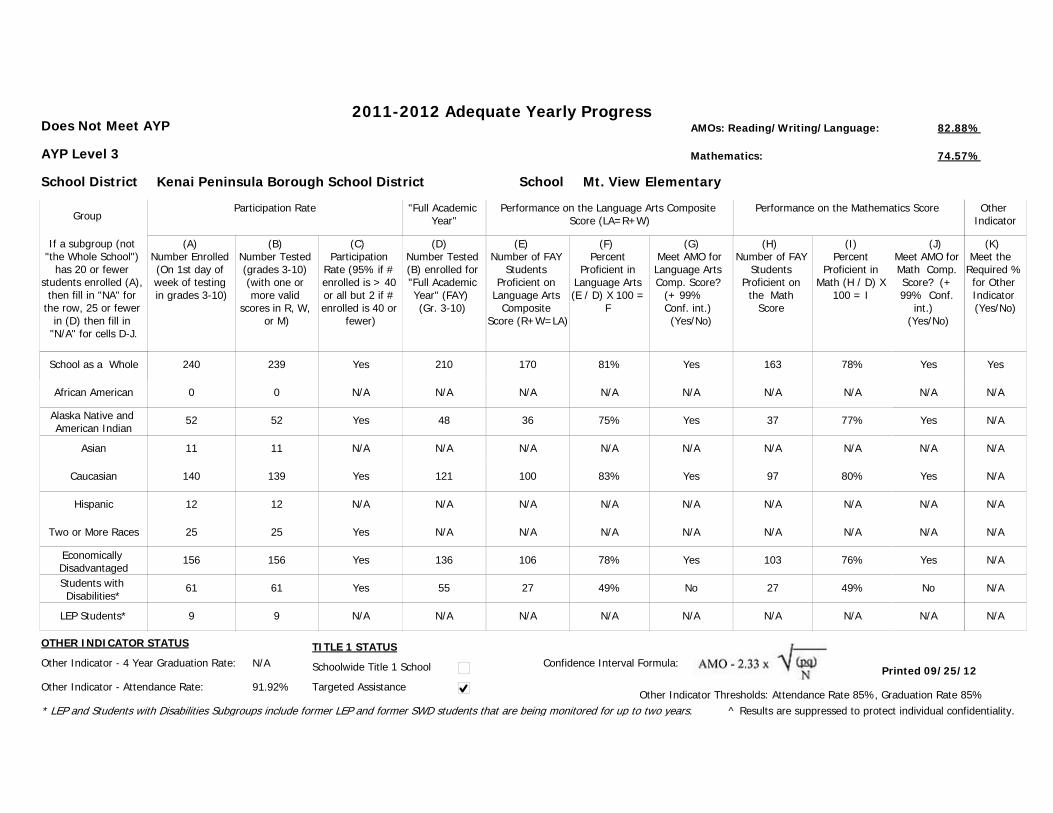
School Mt. View Elementary
Group
School as a Whole 240
Participation Rate
(A) Number Enrolled (On 1st day of week of testing in grades 3-10)
(B) Number Tested (grades 3-10) (with one or more valid
scores in R, W, or M)
(C) Participation
Rate (95% if # enrolled is > 40 or all but 2 if # enrolled is 40 or
fewer)
"Full Academic Year"
African American
Alaska Native and American Indian
Asian
Caucasian
Hispanic
Economically DisadvantagedStudents with Disabilities*
LEP Students*
(D) Number Tested (B) enrolled for "Full Academic Year" (FAY) (Gr. 3-10)
(E) Number of FAY
Students Proficient on
Language Arts Composite
Score (R+W=LA)
(F) Percent
Proficient in Language Arts (E / D) X 100 =
F
239
Does Not Meet AYP
AYP Level 3
(G) Meet AMO for Language Arts Comp. Score?
(+ 99% Conf. int.) (Yes/No)
(H) Number of FAY
Students Proficient on
the Math Score
(I) Percent
Proficient in Math (H / D) X
100 = I
(J) Meet AMO for Math Comp. Score? (+ 99% Conf.
int.) (Yes/No)
Performance on the Language Arts Composite Score (LA=R+W)
Performance on the Mathematics Score
0
52
11
140
12
156
61
9
0
52
11
139
12
156
61
9
210
N/A
48
N/A
121
N/A
136
55
N/A
170
N/A
36
N/A
100
N/A
106
27
N/A
Yes
N/A
Yes
N/A
Yes
N/A
Yes
No
N/A
163
N/A
37
N/A
97
N/A
103
27
N/A
Yes
N/A
Yes
N/A
Yes
N/A
Yes
No
N/A
Schoolwide Title 1 School
School District Kenai Peninsula Borough School District
If a subgroup (not "the Whole School")
has 20 or fewer students enrolled (A),
then fill in "NA" for the row, 25 or fewer
in (D) then fill in "N/A" for cells D-J.
Yes
N/A
Yes
N/A
Yes
N/A
Yes
Yes
N/A
81%
N/A
75%
N/A
83%
N/A
78%
49%
N/A
78%
N/A
N/A
80%
N/A
76%
49%
N/A
Printed 09/25/12Confidence Interval Formula:
Other Indicator Thresholds: Attendance Rate 85%, Graduation Rate 85%
Other Indicator - 4 Year Graduation Rate: N/A
Other Indicator - Attendance Rate: 91.92%
OTHER INDICATOR STATUS TITLE 1 STATUS
(K) Meet the
Required % for Other Indicator (Yes/No)
Other Indicator
Yes
N/A
N/A
N/A
N/A
N/A
N/A
N/A
N/A
Two or More Races 25 25 N/A N/A N/A N/A N/AYes N/A N/A N/A
* LEP and Students with Disabilities Subgroups include former LEP and former SWD students that are being monitored for up to two years.
Targeted Assistance
^ Results are suppressed to protect individual confidentiality.
77%

2011-2012 Adequate Yearly ProgressAMOs: Reading/Writing/Language: 82.88%
Mathematics: 74.57%
School Nanwalek School
Group
School as a Whole 43
Participation Rate
(A) Number Enrolled (On 1st day of week of testing in grades 3-10)
(B) Number Tested (grades 3-10) (with one or more valid
scores in R, W, or M)
(C) Participation
Rate (95% if # enrolled is > 40 or all but 2 if # enrolled is 40 or
fewer)
"Full Academic Year"
African American
Alaska Native and American Indian
Asian
Caucasian
Hispanic
Economically DisadvantagedStudents with Disabilities*
LEP Students*
(D) Number Tested (B) enrolled for "Full Academic Year" (FAY) (Gr. 3-10)
(E) Number of FAY
Students Proficient on
Language Arts Composite
Score (R+W=LA)
(F) Percent
Proficient in Language Arts (E / D) X 100 =
F
43
Does Not Meet AYP
AYP Level 2
(G) Meet AMO for Language Arts Comp. Score?
(+ 99% Conf. int.) (Yes/No)
(H) Number of FAY
Students Proficient on
the Math Score
(I) Percent
Proficient in Math (H / D) X
100 = I
(J) Meet AMO for Math Comp. Score? (+ 99% Conf.
int.) (Yes/No)
Performance on the Language Arts Composite Score (LA=R+W)
Performance on the Mathematics Score
0
41
0
2
0
40
6
2
0
41
0
2
0
40
6
2
40
N/A
38
N/A
N/A
N/A
37
N/A
N/A
27
N/A
25
N/A
N/A
N/A
25
N/A
N/A
No
N/A
No
N/A
N/A
N/A
No
N/A
N/A
25
N/A
25
N/A
N/A
N/A
22
N/A
N/A
Yes
N/A
Yes
N/A
N/A
N/A
Yes
N/A
N/A
Schoolwide Title 1 School
School District Kenai Peninsula Borough School District
If a subgroup (not "the Whole School")
has 20 or fewer students enrolled (A),
then fill in "NA" for the row, 25 or fewer
in (D) then fill in "N/A" for cells D-J.
Yes
N/A
Yes
N/A
N/A
N/A
Yes
N/A
N/A
68%
N/A
66%
N/A
N/A
N/A
68%
N/A
N/A
62%
N/A
N/A
N/A
N/A
59%
N/A
N/A
Printed 09/25/12Confidence Interval Formula:
Other Indicator Thresholds: Attendance Rate 85%, Graduation Rate 85%
Other Indicator - 4 Year Graduation Rate: 100.0%
Other Indicator - Attendance Rate: N/A
OTHER INDICATOR STATUS TITLE 1 STATUS
(K) Meet the
Required % for Other Indicator (Yes/No)
Other Indicator
Yes
N/A
Yes
N/A
N/A
N/A
Yes
N/A
N/A
Two or More Races 0 0 N/A N/A N/A N/A N/AN/A N/A N/A N/A
* LEP and Students with Disabilities Subgroups include former LEP and former SWD students that are being monitored for up to two years.
Targeted Assistance
^ Results are suppressed to protect individual confidentiality.
66%
2011-2012 Adequate Yearly ProgressAMOs: Reading/Writing/Language: 82.88%
Mathematics: 74.57%
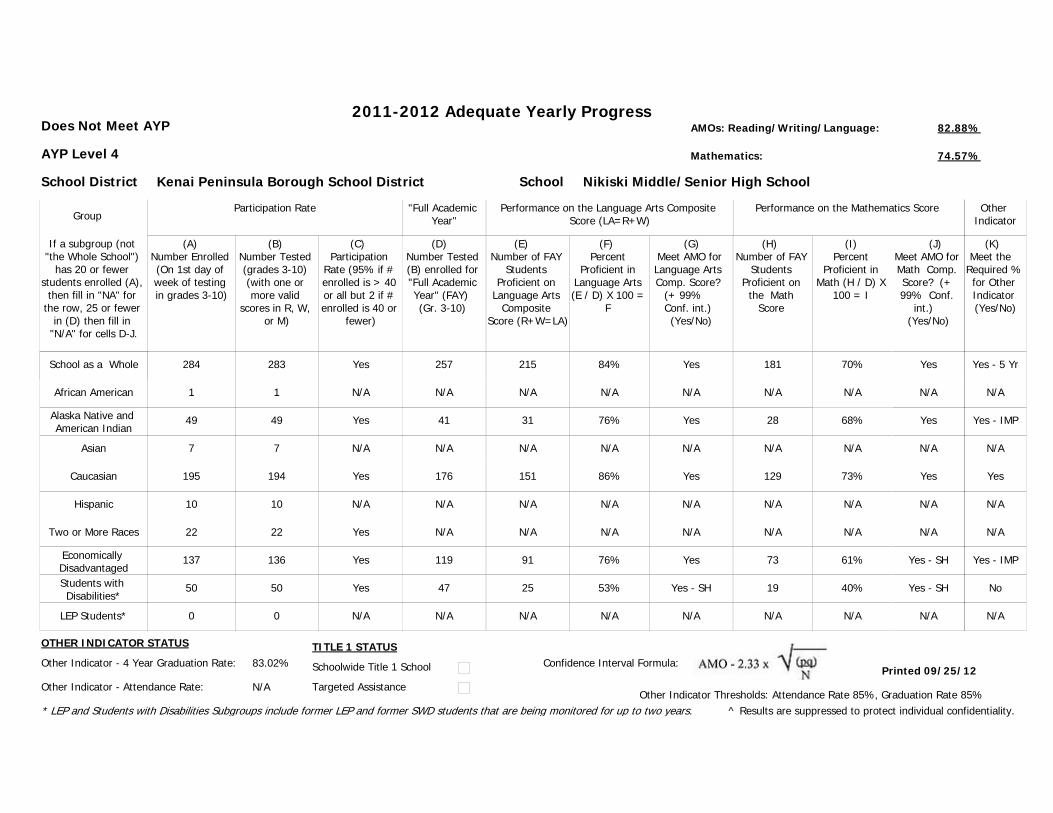
School Nikiski Middle/Senior High School
Group
School as a Whole 284
Participation Rate
(A) Number Enrolled (On 1st day of week of testing in grades 3-10)
(B) Number Tested (grades 3-10) (with one or more valid
scores in R, W, or M)
(C) Participation
Rate (95% if # enrolled is > 40 or all but 2 if # enrolled is 40 or
fewer)
"Full Academic Year"
African American
Alaska Native and American Indian
Asian
Caucasian
Hispanic
Economically DisadvantagedStudents with Disabilities*
LEP Students*
(D) Number Tested (B) enrolled for "Full Academic Year" (FAY) (Gr. 3-10)
(E) Number of FAY
Students Proficient on
Language Arts Composite
Score (R+W=LA)
(F) Percent
Proficient in Language Arts (E / D) X 100 =
F
283
Does Not Meet AYP
AYP Level 4
(G) Meet AMO for Language Arts Comp. Score?
(+ 99% Conf. int.) (Yes/No)
(H) Number of FAY
Students Proficient on
the Math Score
(I) Percent
Proficient in Math (H / D) X
100 = I
(J) Meet AMO for Math Comp. Score? (+ 99% Conf.
int.) (Yes/No)
Performance on the Language Arts Composite Score (LA=R+W)
Performance on the Mathematics Score
1
49
7
195
10
137
50
0
1
49
7
194
10
136
50
0
257
N/A
41
N/A
176
N/A
119
47
N/A
215
N/A
31
N/A
151
N/A
91
25
N/A
Yes
N/A
Yes
N/A
Yes
N/A
Yes
Yes - SH
N/A
181
N/A
28
N/A
129
N/A
73
19
N/A
Yes
N/A
Yes
N/A
Yes
N/A
Yes - SH
Yes - SH
N/A
Schoolwide Title 1 School
School District Kenai Peninsula Borough School District
If a subgroup (not "the Whole School")
has 20 or fewer students enrolled (A),
then fill in "NA" for the row, 25 or fewer
in (D) then fill in "N/A" for cells D-J.
Yes
N/A
Yes
N/A
Yes
N/A
Yes
Yes
N/A
84%
N/A
76%
N/A
86%
N/A
76%
53%
N/A
70%
N/A
N/A
73%
N/A
61%
40%
N/A
Printed 09/25/12Confidence Interval Formula:
Other Indicator Thresholds: Attendance Rate 85%, Graduation Rate 85%
Other Indicator - 4 Year Graduation Rate: 83.02%
Other Indicator - Attendance Rate: N/A
OTHER INDICATOR STATUS TITLE 1 STATUS
(K) Meet the
Required % for Other Indicator (Yes/No)
Other Indicator
Yes - 5 Yr
N/A
Yes - IMP
N/A
Yes
N/A
Yes - IMP
No
N/A
Two or More Races 22 22 N/A N/A N/A N/A N/AYes N/A N/A N/A
* LEP and Students with Disabilities Subgroups include former LEP and former SWD students that are being monitored for up to two years.
Targeted Assistance
^ Results are suppressed to protect individual confidentiality.
68%
2011-2012 Adequate Yearly ProgressAMOs: Reading/Writing/Language: 82.88%
Mathematics: 74.57%
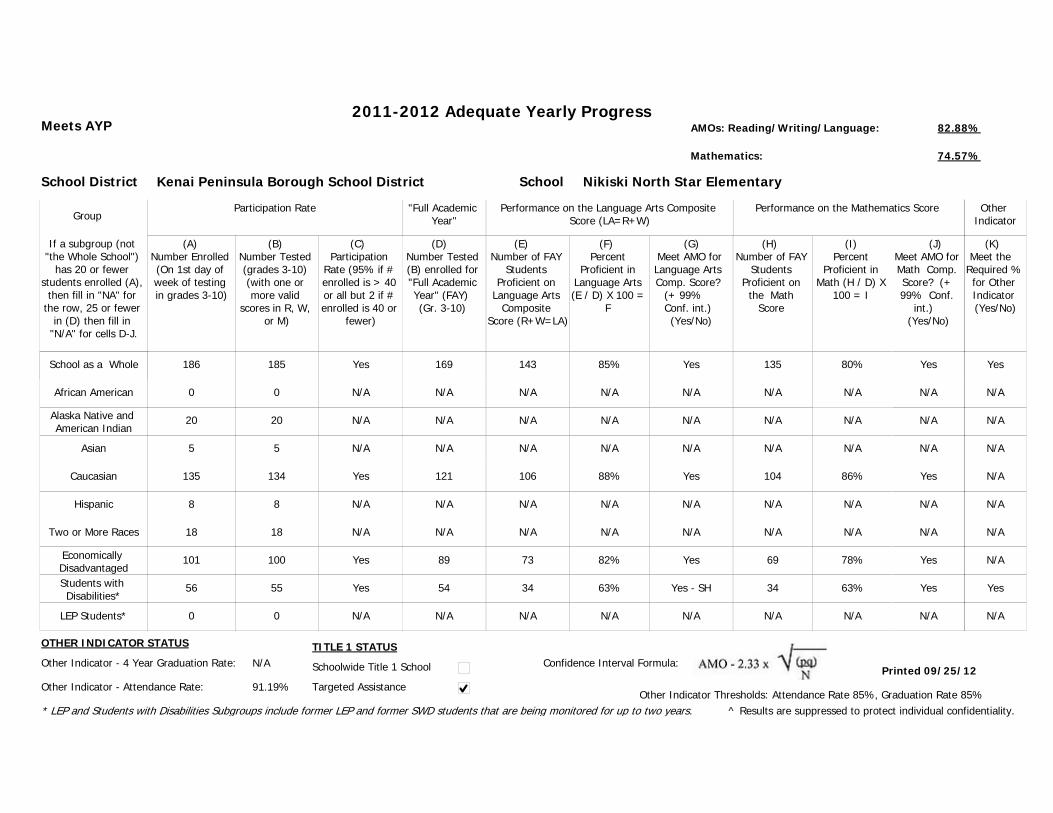
School Nikiski North Star Elementary
Group
School as a Whole 186
Participation Rate
(A) Number Enrolled (On 1st day of week of testing in grades 3-10)
(B) Number Tested (grades 3-10) (with one or more valid
scores in R, W, or M)
(C) Participation
Rate (95% if # enrolled is > 40 or all but 2 if # enrolled is 40 or
fewer)
"Full Academic Year"
African American
Alaska Native and American Indian
Asian
Caucasian
Hispanic
Economically DisadvantagedStudents with Disabilities*
LEP Students*
(D) Number Tested (B) enrolled for "Full Academic Year" (FAY) (Gr. 3-10)
(E) Number of FAY
Students Proficient on
Language Arts Composite
Score (R+W=LA)
(F) Percent
Proficient in Language Arts (E / D) X 100 =
F
185
Meets AYP
(G) Meet AMO for Language Arts Comp. Score?
(+ 99% Conf. int.) (Yes/No)
(H) Number of FAY
Students Proficient on
the Math Score
(I) Percent
Proficient in Math (H / D) X
100 = I
(J) Meet AMO for Math Comp. Score? (+ 99% Conf.
int.) (Yes/No)
Performance on the Language Arts Composite Score (LA=R+W)
Performance on the Mathematics Score
0
20
5
135
8
101
56
0
0
20
5
134
8
100
55
0
169
N/A
N/A
N/A
121
N/A
89
54
N/A
143
N/A
N/A
N/A
106
N/A
73
34
N/A
Yes
N/A
N/A
N/A
Yes
N/A
Yes
Yes - SH
N/A
135
N/A
N/A
N/A
104
N/A
69
34
N/A
Yes
N/A
N/A
N/A
Yes
N/A
Yes
Yes
N/A
Schoolwide Title 1 School
School District Kenai Peninsula Borough School District
If a subgroup (not "the Whole School")
has 20 or fewer students enrolled (A),
then fill in "NA" for the row, 25 or fewer
in (D) then fill in "N/A" for cells D-J.
Yes
N/A
N/A
N/A
Yes
N/A
Yes
Yes
N/A
85%
N/A
N/A
N/A
88%
N/A
82%
63%
N/A
80%
N/A
N/A
86%
N/A
78%
63%
N/A
Printed 09/25/12Confidence Interval Formula:
Other Indicator Thresholds: Attendance Rate 85%, Graduation Rate 85%
Other Indicator - 4 Year Graduation Rate: N/A
Other Indicator - Attendance Rate: 91.19%
OTHER INDICATOR STATUS TITLE 1 STATUS
(K) Meet the
Required % for Other Indicator (Yes/No)
Other Indicator
Yes
N/A
N/A
N/A
N/A
N/A
N/A
Yes
N/A
Two or More Races 18 18 N/A N/A N/A N/A N/AN/A N/A N/A N/A
* LEP and Students with Disabilities Subgroups include former LEP and former SWD students that are being monitored for up to two years.
Targeted Assistance
^ Results are suppressed to protect individual confidentiality.
N/A

2011-2012 Adequate Yearly ProgressAMOs: Reading/Writing/Language: 82.88%
Mathematics: 74.57%
School Nikolaevsk School
Group
School as a Whole 47
Participation Rate
(A) Number Enrolled (On 1st day of week of testing in grades 3-10)
(B) Number Tested (grades 3-10) (with one or more valid
scores in R, W, or M)
(C) Participation
Rate (95% if # enrolled is > 40 or all but 2 if # enrolled is 40 or
fewer)
"Full Academic Year"
African American
Alaska Native and American Indian
Asian
Caucasian
Hispanic
Economically DisadvantagedStudents with Disabilities*
LEP Students*
(D) Number Tested (B) enrolled for "Full Academic Year" (FAY) (Gr. 3-10)
(E) Number of FAY
Students Proficient on
Language Arts Composite
Score (R+W=LA)
(F) Percent
Proficient in Language Arts (E / D) X 100 =
F
47
Meets AYP
(G) Meet AMO for Language Arts Comp. Score?
(+ 99% Conf. int.) (Yes/No)
(H) Number of FAY
Students Proficient on
the Math Score
(I) Percent
Proficient in Math (H / D) X
100 = I
(J) Meet AMO for Math Comp. Score? (+ 99% Conf.
int.) (Yes/No)
Performance on the Language Arts Composite Score (LA=R+W)
Performance on the Mathematics Score
0
3
0
43
0
39
10
3
0
3
0
43
0
39
10
3
46
N/A
N/A
N/A
42
N/A
38
N/A
N/A
42
N/A
N/A
N/A
38
N/A
35
N/A
N/A
Yes
N/A
N/A
N/A
Yes
N/A
Yes
N/A
N/A
40
N/A
N/A
N/A
37
N/A
33
N/A
N/A
Yes
N/A
N/A
N/A
Yes
N/A
Yes
N/A
N/A
Schoolwide Title 1 School
School District Kenai Peninsula Borough School District
If a subgroup (not "the Whole School")
has 20 or fewer students enrolled (A),
then fill in "NA" for the row, 25 or fewer
in (D) then fill in "N/A" for cells D-J.
Yes
N/A
N/A
N/A
Yes
N/A
Yes
N/A
N/A
91%
N/A
N/A
N/A
90%
N/A
92%
N/A
N/A
87%
N/A
N/A
88%
N/A
87%
N/A
N/A
Printed 09/25/12Confidence Interval Formula:
Other Indicator Thresholds: Attendance Rate 85%, Graduation Rate 85%
Other Indicator - 4 Year Graduation Rate: N/A
Other Indicator - Attendance Rate: 94.46%
OTHER INDICATOR STATUS TITLE 1 STATUS
(K) Meet the
Required % for Other Indicator (Yes/No)
Other Indicator
Yes - ALT
N/A
N/A
N/A
Yes
N/A
Yes
N/A
N/A
Two or More Races 1 1 N/A N/A N/A N/A N/AN/A N/A N/A N/A
* LEP and Students with Disabilities Subgroups include former LEP and former SWD students that are being monitored for up to two years.
Targeted Assistance
^ Results are suppressed to protect individual confidentiality.
N/A

2011-2012 Adequate Yearly ProgressAMOs: Reading/Writing/Language: 82.88%
Mathematics: 74.57%
School Ninilchik School
Group
School as a Whole 94
Participation Rate
(A) Number Enrolled (On 1st day of week of testing in grades 3-10)
(B) Number Tested (grades 3-10) (with one or more valid
scores in R, W, or M)
(C) Participation
Rate (95% if # enrolled is > 40 or all but 2 if # enrolled is 40 or
fewer)
"Full Academic Year"
African American
Alaska Native and American Indian
Asian
Caucasian
Hispanic
Economically DisadvantagedStudents with Disabilities*
LEP Students*
(D) Number Tested (B) enrolled for "Full Academic Year" (FAY) (Gr. 3-10)
(E) Number of FAY
Students Proficient on
Language Arts Composite
Score (R+W=LA)
(F) Percent
Proficient in Language Arts (E / D) X 100 =
F
94
Meets AYP
(G) Meet AMO for Language Arts Comp. Score?
(+ 99% Conf. int.) (Yes/No)
(H) Number of FAY
Students Proficient on
the Math Score
(I) Percent
Proficient in Math (H / D) X
100 = I
(J) Meet AMO for Math Comp. Score? (+ 99% Conf.
int.) (Yes/No)
Performance on the Language Arts Composite Score (LA=R+W)
Performance on the Mathematics Score
1
22
2
61
3
49
24
0
1
22
2
61
3
49
24
0
85
N/A
N/A
N/A
55
N/A
41
N/A
N/A
75
N/A
N/A
N/A
47
N/A
34
N/A
N/A
Yes
N/A
N/A
N/A
Yes
N/A
Yes
N/A
N/A
74
N/A
N/A
N/A
48
N/A
35
N/A
N/A
Yes
N/A
N/A
N/A
Yes
N/A
Yes
N/A
N/A
Schoolwide Title 1 School
School District Kenai Peninsula Borough School District
If a subgroup (not "the Whole School")
has 20 or fewer students enrolled (A),
then fill in "NA" for the row, 25 or fewer
in (D) then fill in "N/A" for cells D-J.
Yes
N/A
Yes
N/A
Yes
N/A
Yes
Yes
N/A
88%
N/A
N/A
N/A
85%
N/A
83%
N/A
N/A
87%
N/A
N/A
87%
N/A
85%
N/A
N/A
Printed 09/25/12Confidence Interval Formula:
Other Indicator Thresholds: Attendance Rate 85%, Graduation Rate 85%
Other Indicator - 4 Year Graduation Rate: 80.00%
Other Indicator - Attendance Rate: N/A
OTHER INDICATOR STATUS TITLE 1 STATUS
(K) Meet the
Required % for Other Indicator (Yes/No)
Other Indicator
Yes - 5 Yr
N/A
N/A
N/A
Yes
N/A
Yes
N/A
N/A
Two or More Races 5 5 N/A N/A N/A N/A N/AN/A N/A N/A N/A
* LEP and Students with Disabilities Subgroups include former LEP and former SWD students that are being monitored for up to two years.
Targeted Assistance
^ Results are suppressed to protect individual confidentiality.
N/A
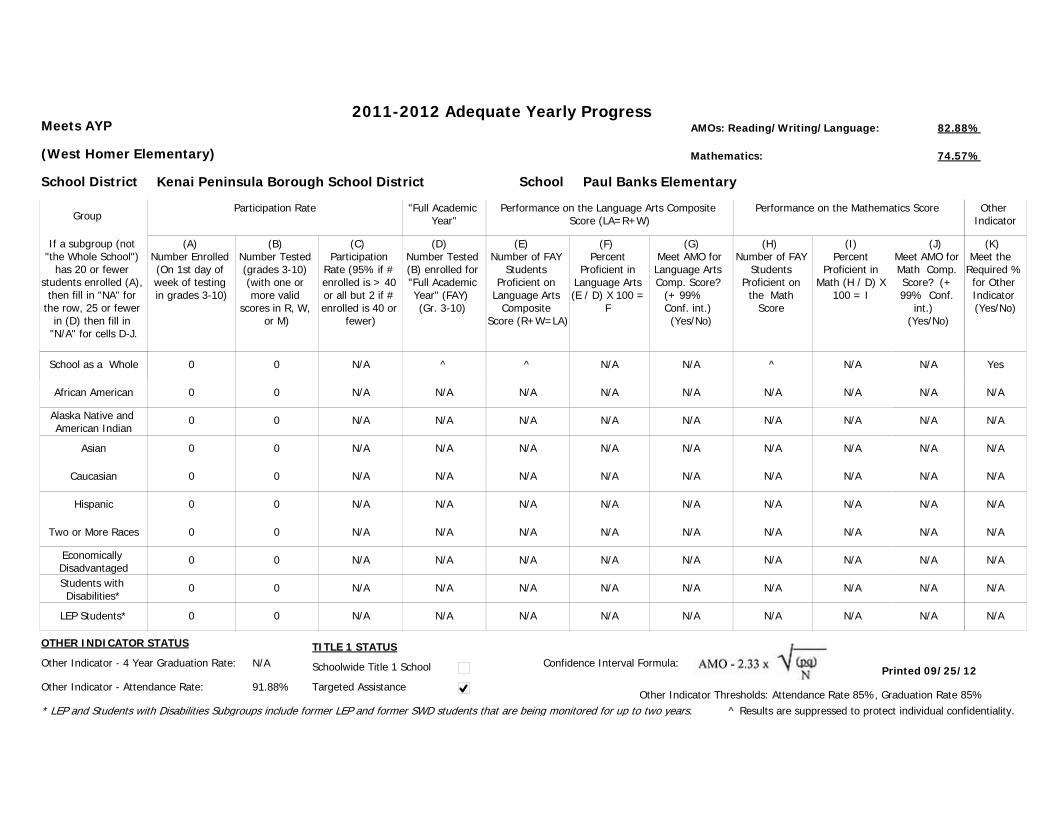
2011-2012 Adequate Yearly ProgressAMOs: Reading/Writing/Language: 82.88%
Mathematics: 74.57%
School Paul Banks Elementary
Group
School as a Whole 0
Participation Rate
(A) Number Enrolled (On 1st day of week of testing in grades 3-10)
(B) Number Tested (grades 3-10) (with one or more valid
scores in R, W, or M)
(C) Participation
Rate (95% if # enrolled is > 40 or all but 2 if # enrolled is 40 or
fewer)
"Full Academic Year"
African American
Alaska Native and American Indian
Asian
Caucasian
Hispanic
Economically DisadvantagedStudents with Disabilities*
LEP Students*
(D) Number Tested (B) enrolled for "Full Academic Year" (FAY) (Gr. 3-10)
(E) Number of FAY
Students Proficient on
Language Arts Composite
Score (R+W=LA)
(F) Percent
Proficient in Language Arts (E / D) X 100 =
F
0
Meets AYP
(West Homer Elementary)
(G) Meet AMO for Language Arts Comp. Score?
(+ 99% Conf. int.) (Yes/No)
(H) Number of FAY
Students Proficient on
the Math Score
(I) Percent
Proficient in Math (H / D) X
100 = I
(J) Meet AMO for Math Comp. Score? (+ 99% Conf.
int.) (Yes/No)
Performance on the Language Arts Composite Score (LA=R+W)
Performance on the Mathematics Score
0
0
0
0
0
0
0
0
0
0
0
0
0
0
0
0
^
N/A
N/A
N/A
N/A
N/A
N/A
N/A
N/A
^
N/A
N/A
N/A
N/A
N/A
N/A
N/A
N/A
N/A
N/A
N/A
N/A
N/A
N/A
N/A
N/A
N/A
^
N/A
N/A
N/A
N/A
N/A
N/A
N/A
N/A
N/A
N/A
N/A
N/A
N/A
N/A
N/A
N/A
N/A
Schoolwide Title 1 School
School District Kenai Peninsula Borough School District
If a subgroup (not "the Whole School")
has 20 or fewer students enrolled (A),
then fill in "NA" for the row, 25 or fewer
in (D) then fill in "N/A" for cells D-J.
N/A
N/A
N/A
N/A
N/A
N/A
N/A
N/A
N/A
N/A
N/A
N/A
N/A
N/A
N/A
N/A
N/A
N/A
N/A
N/A
N/A
N/A
N/A
N/A
N/A
N/A
Printed 09/25/12Confidence Interval Formula:
Other Indicator Thresholds: Attendance Rate 85%, Graduation Rate 85%
Other Indicator - 4 Year Graduation Rate: N/A
Other Indicator - Attendance Rate: 91.88%
OTHER INDICATOR STATUS TITLE 1 STATUS
(K) Meet the
Required % for Other Indicator (Yes/No)
Other Indicator
Yes
N/A
N/A
N/A
N/A
N/A
N/A
N/A
N/A
Two or More Races 0 0 N/A N/A N/A N/A N/AN/A N/A N/A N/A
* LEP and Students with Disabilities Subgroups include former LEP and former SWD students that are being monitored for up to two years.
Targeted Assistance
^ Results are suppressed to protect individual confidentiality.
N/A

2011-2012 Adequate Yearly ProgressAMOs: Reading/Writing/Language: 82.88%
Mathematics: 74.57%
School Port Graham School
Group
School as a Whole 10
Participation Rate
(A) Number Enrolled (On 1st day of week of testing in grades 3-10)
(B) Number Tested (grades 3-10) (with one or more valid
scores in R, W, or M)
(C) Participation
Rate (95% if # enrolled is > 40 or all but 2 if # enrolled is 40 or
fewer)
"Full Academic Year"
African American
Alaska Native and American Indian
Asian
Caucasian
Hispanic
Economically DisadvantagedStudents with Disabilities*
LEP Students*
(D) Number Tested (B) enrolled for "Full Academic Year" (FAY) (Gr. 3-10)
(E) Number of FAY
Students Proficient on
Language Arts Composite
Score (R+W=LA)
(F) Percent
Proficient in Language Arts (E / D) X 100 =
F
10
Meets AYP
AYP Level 4 (First Year Meeting AYP)
(G) Meet AMO for Language Arts Comp. Score?
(+ 99% Conf. int.) (Yes/No)
(H) Number of FAY
Students Proficient on
the Math Score
(I) Percent
Proficient in Math (H / D) X
100 = I
(J) Meet AMO for Math Comp. Score? (+ 99% Conf.
int.) (Yes/No)
Performance on the Language Arts Composite Score (LA=R+W)
Performance on the Mathematics Score
0
10
0
0
0
8
4
0
0
10
0
0
0
8
4
0
9
N/A
N/A
N/A
N/A
N/A
N/A
N/A
N/A
3
N/A
N/A
N/A
N/A
N/A
N/A
N/A
N/A
Yes - SH
N/A
N/A
N/A
N/A
N/A
N/A
N/A
N/A
3
N/A
N/A
N/A
N/A
N/A
N/A
N/A
N/A
Yes - SH
N/A
N/A
N/A
N/A
N/A
N/A
N/A
N/A
Schoolwide Title 1 School
School District Kenai Peninsula Borough School District
If a subgroup (not "the Whole School")
has 20 or fewer students enrolled (A),
then fill in "NA" for the row, 25 or fewer
in (D) then fill in "N/A" for cells D-J.
Yes
N/A
N/A
N/A
N/A
N/A
N/A
N/A
N/A
33%
N/A
N/A
N/A
N/A
N/A
N/A
N/A
N/A
33%
N/A
N/A
N/A
N/A
N/A
N/A
N/A
Printed 09/25/12Confidence Interval Formula:
Other Indicator Thresholds: Attendance Rate 85%, Graduation Rate 85%
Other Indicator - 4 Year Graduation Rate: 75.00%
Other Indicator - Attendance Rate: N/A
OTHER INDICATOR STATUS TITLE 1 STATUS
(K) Meet the
Required % for Other Indicator (Yes/No)
Other Indicator
Yes - IMP
N/A
N/A
N/A
N/A
N/A
N/A
N/A
N/A
Two or More Races 0 0 N/A N/A N/A N/A N/AN/A N/A N/A N/A
* LEP and Students with Disabilities Subgroups include former LEP and former SWD students that are being monitored for up to two years.
Targeted Assistance
^ Results are suppressed to protect individual confidentiality.
N/A

2011-2012 Adequate Yearly ProgressAMOs: Reading/Writing/Language: 82.88%
Mathematics: 74.57%
School Razdolna School
Group
School as a Whole 38
Participation Rate
(A) Number Enrolled (On 1st day of week of testing in grades 3-10)
(B) Number Tested (grades 3-10) (with one or more valid
scores in R, W, or M)
(C) Participation
Rate (95% if # enrolled is > 40 or all but 2 if # enrolled is 40 or
fewer)
"Full Academic Year"
African American
Alaska Native and American Indian
Asian
Caucasian
Hispanic
Economically DisadvantagedStudents with Disabilities*
LEP Students*
(D) Number Tested (B) enrolled for "Full Academic Year" (FAY) (Gr. 3-10)
(E) Number of FAY
Students Proficient on
Language Arts Composite
Score (R+W=LA)
(F) Percent
Proficient in Language Arts (E / D) X 100 =
F
38
Meets AYP
(G) Meet AMO for Language Arts Comp. Score?
(+ 99% Conf. int.) (Yes/No)
(H) Number of FAY
Students Proficient on
the Math Score
(I) Percent
Proficient in Math (H / D) X
100 = I
(J) Meet AMO for Math Comp. Score? (+ 99% Conf.
int.) (Yes/No)
Performance on the Language Arts Composite Score (LA=R+W)
Performance on the Mathematics Score
0
0
0
38
0
28
6
24
0
0
0
38
0
28
6
24
38
N/A
N/A
N/A
38
N/A
28
N/A
N/A
27
N/A
N/A
N/A
27
N/A
21
N/A
N/A
Yes
N/A
N/A
N/A
Yes
N/A
Yes
N/A
N/A
24
N/A
N/A
N/A
24
N/A
19
N/A
N/A
Yes
N/A
N/A
N/A
Yes
N/A
Yes
N/A
N/A
Schoolwide Title 1 School
School District Kenai Peninsula Borough School District
If a subgroup (not "the Whole School")
has 20 or fewer students enrolled (A),
then fill in "NA" for the row, 25 or fewer
in (D) then fill in "N/A" for cells D-J.
Yes
N/A
N/A
N/A
Yes
N/A
Yes
N/A
Yes
71%
N/A
N/A
N/A
71%
N/A
75%
N/A
N/A
63%
N/A
N/A
63%
N/A
68%
N/A
N/A
Printed 09/25/12Confidence Interval Formula:
Other Indicator Thresholds: Attendance Rate 85%, Graduation Rate 85%
Other Indicator - 4 Year Graduation Rate: N/A
Other Indicator - Attendance Rate: 93.19%
OTHER INDICATOR STATUS TITLE 1 STATUS
(K) Meet the
Required % for Other Indicator (Yes/No)
Other Indicator
Yes - ALT
N/A
N/A
N/A
Yes
N/A
Yes
N/A
N/A
Two or More Races 0 0 N/A N/A N/A N/A N/AN/A N/A N/A N/A
* LEP and Students with Disabilities Subgroups include former LEP and former SWD students that are being monitored for up to two years.
Targeted Assistance
^ Results are suppressed to protect individual confidentiality.
N/A

2011-2012 Adequate Yearly ProgressAMOs: Reading/Writing/Language: 82.88%
Mathematics: 74.57%
School Redoubt Elementary
Group
School as a Whole 200
Participation Rate
(A) Number Enrolled (On 1st day of week of testing in grades 3-10)
(B) Number Tested (grades 3-10) (with one or more valid
scores in R, W, or M)
(C) Participation
Rate (95% if # enrolled is > 40 or all but 2 if # enrolled is 40 or
fewer)
"Full Academic Year"
African American
Alaska Native and American Indian
Asian
Caucasian
Hispanic
Economically DisadvantagedStudents with Disabilities*
LEP Students*
(D) Number Tested (B) enrolled for "Full Academic Year" (FAY) (Gr. 3-10)
(E) Number of FAY
Students Proficient on
Language Arts Composite
Score (R+W=LA)
(F) Percent
Proficient in Language Arts (E / D) X 100 =
F
200
Meets AYP
(G) Meet AMO for Language Arts Comp. Score?
(+ 99% Conf. int.) (Yes/No)
(H) Number of FAY
Students Proficient on
the Math Score
(I) Percent
Proficient in Math (H / D) X
100 = I
(J) Meet AMO for Math Comp. Score? (+ 99% Conf.
int.) (Yes/No)
Performance on the Language Arts Composite Score (LA=R+W)
Performance on the Mathematics Score
0
17
4
158
11
96
49
1
0
17
4
158
11
96
49
1
188
N/A
N/A
N/A
152
N/A
88
46
N/A
168
N/A
N/A
N/A
140
N/A
71
35
N/A
Yes
N/A
N/A
N/A
Yes
N/A
Yes
Yes
N/A
155
N/A
N/A
N/A
130
N/A
64
30
N/A
Yes
N/A
N/A
N/A
Yes
N/A
Yes
Yes
N/A
Schoolwide Title 1 School
School District Kenai Peninsula Borough School District
If a subgroup (not "the Whole School")
has 20 or fewer students enrolled (A),
then fill in "NA" for the row, 25 or fewer
in (D) then fill in "N/A" for cells D-J.
Yes
N/A
N/A
N/A
Yes
N/A
Yes
Yes
N/A
89%
N/A
N/A
N/A
92%
N/A
81%
76%
N/A
82%
N/A
N/A
86%
N/A
73%
65%
N/A
Printed 09/25/12Confidence Interval Formula:
Other Indicator Thresholds: Attendance Rate 85%, Graduation Rate 85%
Other Indicator - 4 Year Graduation Rate: N/A
Other Indicator - Attendance Rate: 93.84%
OTHER INDICATOR STATUS TITLE 1 STATUS
(K) Meet the
Required % for Other Indicator (Yes/No)
Other Indicator
Yes
N/A
N/A
N/A
N/A
N/A
N/A
N/A
N/A
Two or More Races 10 10 N/A N/A N/A N/A N/AN/A N/A N/A N/A
* LEP and Students with Disabilities Subgroups include former LEP and former SWD students that are being monitored for up to two years.
Targeted Assistance
^ Results are suppressed to protect individual confidentiality.
N/A
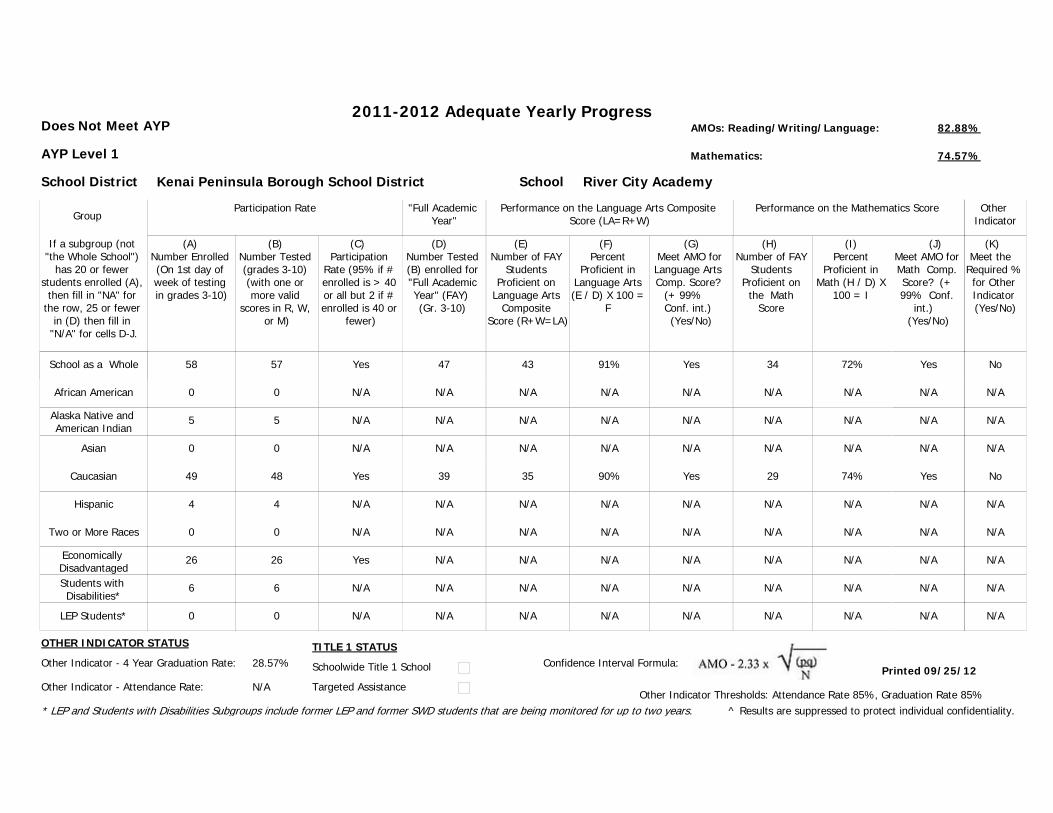
2011-2012 Adequate Yearly ProgressAMOs: Reading/Writing/Language: 82.88%
Mathematics: 74.57%
School River City Academy
Group
School as a Whole 58
Participation Rate
(A) Number Enrolled (On 1st day of week of testing in grades 3-10)
(B) Number Tested (grades 3-10) (with one or more valid
scores in R, W, or M)
(C) Participation
Rate (95% if # enrolled is > 40 or all but 2 if # enrolled is 40 or
fewer)
"Full Academic Year"
African American
Alaska Native and American Indian
Asian
Caucasian
Hispanic
Economically DisadvantagedStudents with Disabilities*
LEP Students*
(D) Number Tested (B) enrolled for "Full Academic Year" (FAY) (Gr. 3-10)
(E) Number of FAY
Students Proficient on
Language Arts Composite
Score (R+W=LA)
(F) Percent
Proficient in Language Arts (E / D) X 100 =
F
57
Does Not Meet AYP
AYP Level 1
(G) Meet AMO for Language Arts Comp. Score?
(+ 99% Conf. int.) (Yes/No)
(H) Number of FAY
Students Proficient on
the Math Score
(I) Percent
Proficient in Math (H / D) X
100 = I
(J) Meet AMO for Math Comp. Score? (+ 99% Conf.
int.) (Yes/No)
Performance on the Language Arts Composite Score (LA=R+W)
Performance on the Mathematics Score
0
5
0
49
4
26
6
0
0
5
0
48
4
26
6
0
47
N/A
N/A
N/A
39
N/A
N/A
N/A
N/A
43
N/A
N/A
N/A
35
N/A
N/A
N/A
N/A
Yes
N/A
N/A
N/A
Yes
N/A
N/A
N/A
N/A
34
N/A
N/A
N/A
29
N/A
N/A
N/A
N/A
Yes
N/A
N/A
N/A
Yes
N/A
N/A
N/A
N/A
Schoolwide Title 1 School
School District Kenai Peninsula Borough School District
If a subgroup (not "the Whole School")
has 20 or fewer students enrolled (A),
then fill in "NA" for the row, 25 or fewer
in (D) then fill in "N/A" for cells D-J.
Yes
N/A
N/A
N/A
Yes
N/A
Yes
N/A
N/A
91%
N/A
N/A
N/A
90%
N/A
N/A
N/A
N/A
72%
N/A
N/A
74%
N/A
N/A
N/A
N/A
Printed 09/25/12Confidence Interval Formula:
Other Indicator Thresholds: Attendance Rate 85%, Graduation Rate 85%
Other Indicator - 4 Year Graduation Rate: 28.57%
Other Indicator - Attendance Rate: N/A
OTHER INDICATOR STATUS TITLE 1 STATUS
(K) Meet the
Required % for Other Indicator (Yes/No)
Other Indicator
No
N/A
N/A
N/A
No
N/A
N/A
N/A
N/A
Two or More Races 0 0 N/A N/A N/A N/A N/AN/A N/A N/A N/A
* LEP and Students with Disabilities Subgroups include former LEP and former SWD students that are being monitored for up to two years.
Targeted Assistance
^ Results are suppressed to protect individual confidentiality.
N/A
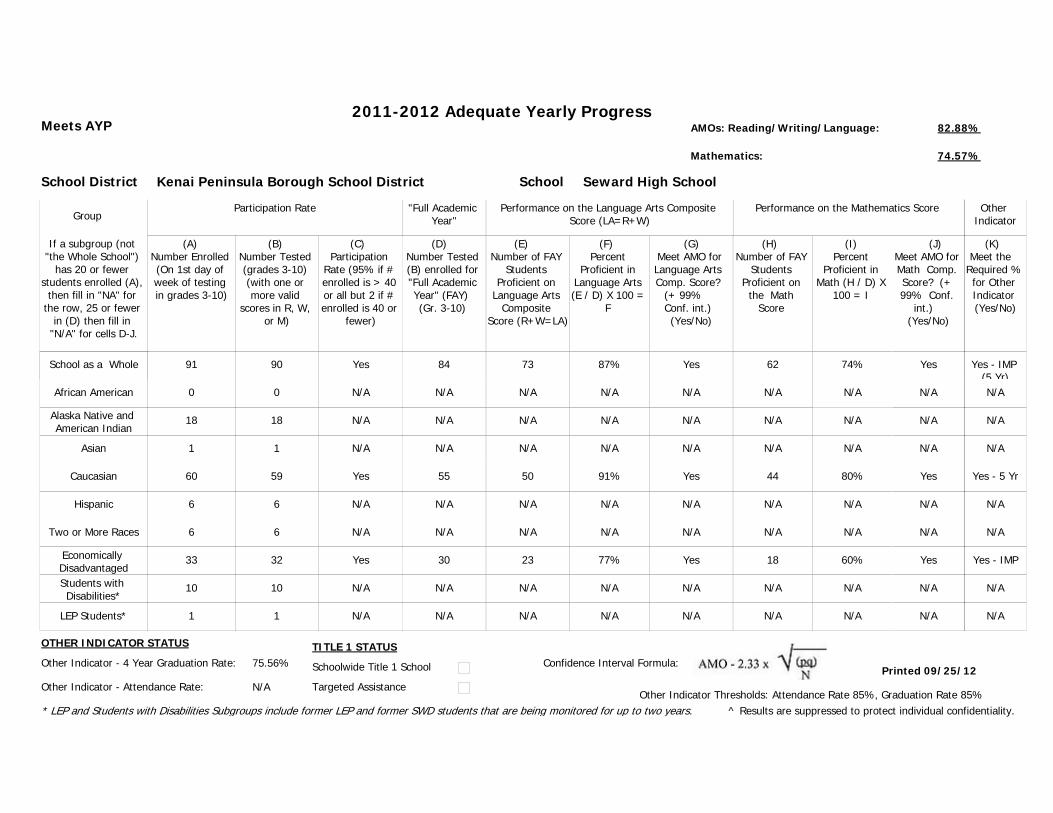
2011-2012 Adequate Yearly ProgressAMOs: Reading/Writing/Language: 82.88%
Mathematics: 74.57%
School Seward High School
Group
School as a Whole 91
Participation Rate
(A) Number Enrolled (On 1st day of week of testing in grades 3-10)
(B) Number Tested (grades 3-10) (with one or more valid
scores in R, W, or M)
(C) Participation
Rate (95% if # enrolled is > 40 or all but 2 if # enrolled is 40 or
fewer)
"Full Academic Year"
African American
Alaska Native and American Indian
Asian
Caucasian
Hispanic
Economically DisadvantagedStudents with Disabilities*
LEP Students*
(D) Number Tested (B) enrolled for "Full Academic Year" (FAY) (Gr. 3-10)
(E) Number of FAY
Students Proficient on
Language Arts Composite
Score (R+W=LA)
(F) Percent
Proficient in Language Arts (E / D) X 100 =
F
90
Meets AYP
(G) Meet AMO for Language Arts Comp. Score?
(+ 99% Conf. int.) (Yes/No)
(H) Number of FAY
Students Proficient on
the Math Score
(I) Percent
Proficient in Math (H / D) X
100 = I
(J) Meet AMO for Math Comp. Score? (+ 99% Conf.
int.) (Yes/No)
Performance on the Language Arts Composite Score (LA=R+W)
Performance on the Mathematics Score
0
18
1
60
6
33
10
1
0
18
1
59
6
32
10
1
84
N/A
N/A
N/A
55
N/A
30
N/A
N/A
73
N/A
N/A
N/A
50
N/A
23
N/A
N/A
Yes
N/A
N/A
N/A
Yes
N/A
Yes
N/A
N/A
62
N/A
N/A
N/A
44
N/A
18
N/A
N/A
Yes
N/A
N/A
N/A
Yes
N/A
Yes
N/A
N/A
Schoolwide Title 1 School
School District Kenai Peninsula Borough School District
If a subgroup (not "the Whole School")
has 20 or fewer students enrolled (A),
then fill in "NA" for the row, 25 or fewer
in (D) then fill in "N/A" for cells D-J.
Yes
N/A
N/A
N/A
Yes
N/A
Yes
N/A
N/A
87%
N/A
N/A
N/A
91%
N/A
77%
N/A
N/A
74%
N/A
N/A
80%
N/A
60%
N/A
N/A
Printed 09/25/12Confidence Interval Formula:
Other Indicator Thresholds: Attendance Rate 85%, Graduation Rate 85%
Other Indicator - 4 Year Graduation Rate: 75.56%
Other Indicator - Attendance Rate: N/A
OTHER INDICATOR STATUS TITLE 1 STATUS
(K) Meet the
Required % for Other Indicator (Yes/No)
Other Indicator
Yes - IMP (5 Yr)N/A
N/A
N/A
Yes - 5 Yr
N/A
Yes - IMP
N/A
N/A
Two or More Races 6 6 N/A N/A N/A N/A N/AN/A N/A N/A N/A
* LEP and Students with Disabilities Subgroups include former LEP and former SWD students that are being monitored for up to two years.
Targeted Assistance
^ Results are suppressed to protect individual confidentiality.
N/A

2011-2012 Adequate Yearly ProgressAMOs: Reading/Writing/Language: 82.88%
Mathematics: 74.57%
School Seward Middle School
Group
School as a Whole 82
Participation Rate
(A) Number Enrolled (On 1st day of week of testing in grades 3-10)
(B) Number Tested (grades 3-10) (with one or more valid
scores in R, W, or M)
(C) Participation
Rate (95% if # enrolled is > 40 or all but 2 if # enrolled is 40 or
fewer)
"Full Academic Year"
African American
Alaska Native and American Indian
Asian
Caucasian
Hispanic
Economically DisadvantagedStudents with Disabilities*
LEP Students*
(D) Number Tested (B) enrolled for "Full Academic Year" (FAY) (Gr. 3-10)
(E) Number of FAY
Students Proficient on
Language Arts Composite
Score (R+W=LA)
(F) Percent
Proficient in Language Arts (E / D) X 100 =
F
80
Meets AYP
(G) Meet AMO for Language Arts Comp. Score?
(+ 99% Conf. int.) (Yes/No)
(H) Number of FAY
Students Proficient on
the Math Score
(I) Percent
Proficient in Math (H / D) X
100 = I
(J) Meet AMO for Math Comp. Score? (+ 99% Conf.
int.) (Yes/No)
Performance on the Language Arts Composite Score (LA=R+W)
Performance on the Mathematics Score
1
11
2
56
5
38
12
1
1
11
2
54
5
37
10
1
74
N/A
N/A
N/A
49
N/A
33
N/A
N/A
65
N/A
N/A
N/A
43
N/A
28
N/A
N/A
Yes
N/A
N/A
N/A
Yes
N/A
Yes
N/A
N/A
55
N/A
N/A
N/A
38
N/A
24
N/A
N/A
Yes
N/A
N/A
N/A
Yes
N/A
Yes
N/A
N/A
Schoolwide Title 1 School
School District Kenai Peninsula Borough School District
If a subgroup (not "the Whole School")
has 20 or fewer students enrolled (A),
then fill in "NA" for the row, 25 or fewer
in (D) then fill in "N/A" for cells D-J.
Yes
N/A
N/A
N/A
Yes
N/A
Yes
N/A
N/A
88%
N/A
N/A
N/A
88%
N/A
85%
N/A
N/A
74%
N/A
N/A
78%
N/A
73%
N/A
N/A
Printed 09/25/12Confidence Interval Formula:
Other Indicator Thresholds: Attendance Rate 85%, Graduation Rate 85%
Other Indicator - 4 Year Graduation Rate: N/A
Other Indicator - Attendance Rate: 95.55%
OTHER INDICATOR STATUS TITLE 1 STATUS
(K) Meet the
Required % for Other Indicator (Yes/No)
Other Indicator
Yes
N/A
N/A
N/A
N/A
N/A
N/A
N/A
N/A
Two or More Races 7 7 N/A N/A N/A N/A N/AN/A N/A N/A N/A
* LEP and Students with Disabilities Subgroups include former LEP and former SWD students that are being monitored for up to two years.
Targeted Assistance
^ Results are suppressed to protect individual confidentiality.
N/A

2011-2012 Adequate Yearly ProgressAMOs: Reading/Writing/Language: 82.88%
Mathematics: 74.57%
School Skyview High School
Group
School as a Whole 186
Participation Rate
(A) Number Enrolled (On 1st day of week of testing in grades 3-10)
(B) Number Tested (grades 3-10) (with one or more valid
scores in R, W, or M)
(C) Participation
Rate (95% if # enrolled is > 40 or all but 2 if # enrolled is 40 or
fewer)
"Full Academic Year"
African American
Alaska Native and American Indian
Asian
Caucasian
Hispanic
Economically DisadvantagedStudents with Disabilities*
LEP Students*
(D) Number Tested (B) enrolled for "Full Academic Year" (FAY) (Gr. 3-10)
(E) Number of FAY
Students Proficient on
Language Arts Composite
Score (R+W=LA)
(F) Percent
Proficient in Language Arts (E / D) X 100 =
F
184
Meets AYP
(G) Meet AMO for Language Arts Comp. Score?
(+ 99% Conf. int.) (Yes/No)
(H) Number of FAY
Students Proficient on
the Math Score
(I) Percent
Proficient in Math (H / D) X
100 = I
(J) Meet AMO for Math Comp. Score? (+ 99% Conf.
int.) (Yes/No)
Performance on the Language Arts Composite Score (LA=R+W)
Performance on the Mathematics Score
2
15
1
146
5
80
27
0
2
15
1
144
5
80
27
0
162
N/A
N/A
N/A
131
N/A
66
N/A
N/A
133
N/A
N/A
N/A
109
N/A
51
N/A
N/A
Yes
N/A
N/A
N/A
Yes
N/A
Yes
N/A
N/A
108
N/A
N/A
N/A
89
N/A
44
N/A
N/A
Yes
N/A
N/A
N/A
Yes
N/A
Yes
N/A
N/A
Schoolwide Title 1 School
School District Kenai Peninsula Borough School District
If a subgroup (not "the Whole School")
has 20 or fewer students enrolled (A),
then fill in "NA" for the row, 25 or fewer
in (D) then fill in "N/A" for cells D-J.
Yes
N/A
N/A
N/A
Yes
N/A
Yes
Yes
N/A
82%
N/A
N/A
N/A
83%
N/A
77%
N/A
N/A
67%
N/A
N/A
68%
N/A
67%
N/A
N/A
Printed 09/25/12Confidence Interval Formula:
Other Indicator Thresholds: Attendance Rate 85%, Graduation Rate 85%
Other Indicator - 4 Year Graduation Rate: 90.10%
Other Indicator - Attendance Rate: N/A
OTHER INDICATOR STATUS TITLE 1 STATUS
(K) Meet the
Required % for Other Indicator (Yes/No)
Other Indicator
Yes
N/A
N/A
N/A
Yes
N/A
Yes
N/A
N/A
Two or More Races 17 17 N/A N/A N/A N/A N/AN/A N/A N/A N/A
* LEP and Students with Disabilities Subgroups include former LEP and former SWD students that are being monitored for up to two years.
Targeted Assistance
^ Results are suppressed to protect individual confidentiality.
N/A

2011-2012 Adequate Yearly ProgressAMOs: Reading/Writing/Language: 82.88%
Mathematics: 74.57%
School Soldotna Elementary
Group
School as a Whole 146
Participation Rate
(A) Number Enrolled (On 1st day of week of testing in grades 3-10)
(B) Number Tested (grades 3-10) (with one or more valid
scores in R, W, or M)
(C) Participation
Rate (95% if # enrolled is > 40 or all but 2 if # enrolled is 40 or
fewer)
"Full Academic Year"
African American
Alaska Native and American Indian
Asian
Caucasian
Hispanic
Economically DisadvantagedStudents with Disabilities*
LEP Students*
(D) Number Tested (B) enrolled for "Full Academic Year" (FAY) (Gr. 3-10)
(E) Number of FAY
Students Proficient on
Language Arts Composite
Score (R+W=LA)
(F) Percent
Proficient in Language Arts (E / D) X 100 =
F
146
Does Not Meet AYP
AYP Level 1
(G) Meet AMO for Language Arts Comp. Score?
(+ 99% Conf. int.) (Yes/No)
(H) Number of FAY
Students Proficient on
the Math Score
(I) Percent
Proficient in Math (H / D) X
100 = I
(J) Meet AMO for Math Comp. Score? (+ 99% Conf.
int.) (Yes/No)
Performance on the Language Arts Composite Score (LA=R+W)
Performance on the Mathematics Score
2
16
5
115
1
72
33
0
2
16
5
115
1
72
33
0
123
N/A
N/A
N/A
100
N/A
59
27
N/A
103
N/A
N/A
N/A
84
N/A
46
12
N/A
Yes
N/A
N/A
N/A
Yes
N/A
Yes
No
N/A
97
N/A
N/A
N/A
78
N/A
40
9
N/A
Yes
N/A
N/A
N/A
Yes
N/A
Yes
No
N/A
Schoolwide Title 1 School
School District Kenai Peninsula Borough School District
If a subgroup (not "the Whole School")
has 20 or fewer students enrolled (A),
then fill in "NA" for the row, 25 or fewer
in (D) then fill in "N/A" for cells D-J.
Yes
N/A
N/A
N/A
Yes
N/A
Yes
Yes
N/A
84%
N/A
N/A
N/A
84%
N/A
78%
44%
N/A
79%
N/A
N/A
78%
N/A
68%
33%
N/A
Printed 09/25/12Confidence Interval Formula:
Other Indicator Thresholds: Attendance Rate 85%, Graduation Rate 85%
Other Indicator - 4 Year Graduation Rate: N/A
Other Indicator - Attendance Rate: 92.58%
OTHER INDICATOR STATUS TITLE 1 STATUS
(K) Meet the
Required % for Other Indicator (Yes/No)
Other Indicator
Yes
N/A
N/A
N/A
N/A
N/A
N/A
N/A
N/A
Two or More Races 7 7 N/A N/A N/A N/A N/AN/A N/A N/A N/A
* LEP and Students with Disabilities Subgroups include former LEP and former SWD students that are being monitored for up to two years.
Targeted Assistance
^ Results are suppressed to protect individual confidentiality.
N/A
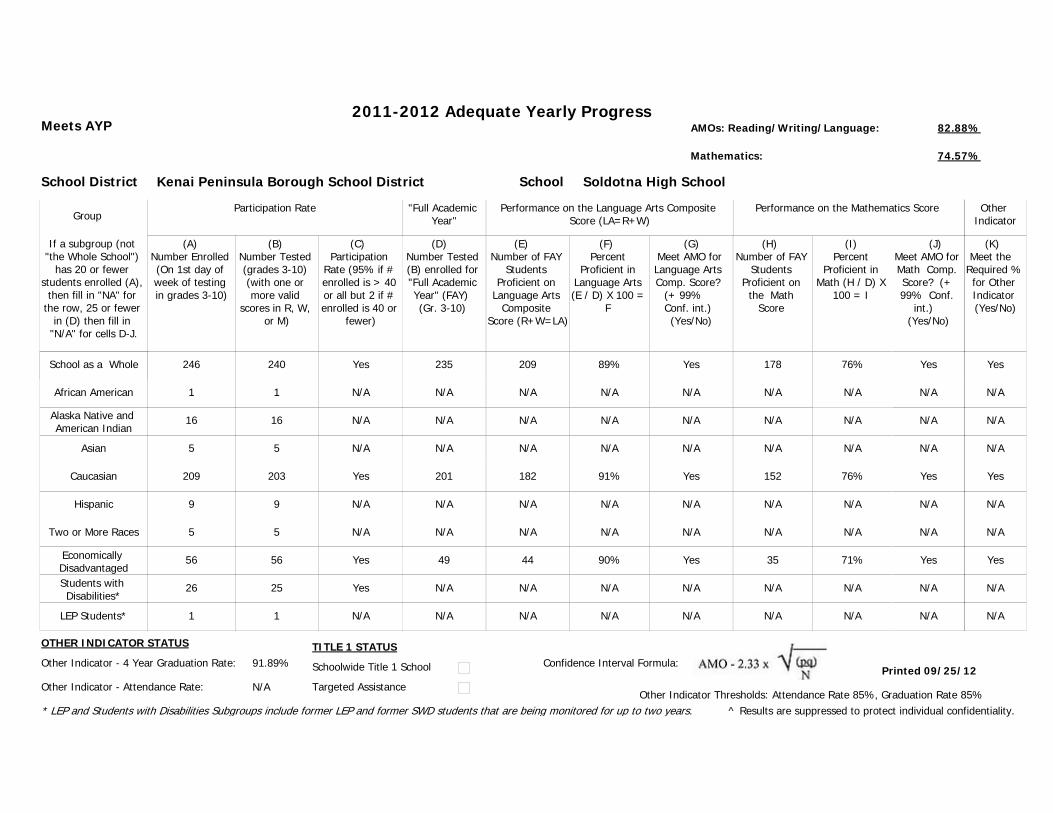
2011-2012 Adequate Yearly ProgressAMOs: Reading/Writing/Language: 82.88%
Mathematics: 74.57%
School Soldotna High School
Group
School as a Whole 246
Participation Rate
(A) Number Enrolled (On 1st day of week of testing in grades 3-10)
(B) Number Tested (grades 3-10) (with one or more valid
scores in R, W, or M)
(C) Participation
Rate (95% if # enrolled is > 40 or all but 2 if # enrolled is 40 or
fewer)
"Full Academic Year"
African American
Alaska Native and American Indian
Asian
Caucasian
Hispanic
Economically DisadvantagedStudents with Disabilities*
LEP Students*
(D) Number Tested (B) enrolled for "Full Academic Year" (FAY) (Gr. 3-10)
(E) Number of FAY
Students Proficient on
Language Arts Composite
Score (R+W=LA)
(F) Percent
Proficient in Language Arts (E / D) X 100 =
F
240
Meets AYP
(G) Meet AMO for Language Arts Comp. Score?
(+ 99% Conf. int.) (Yes/No)
(H) Number of FAY
Students Proficient on
the Math Score
(I) Percent
Proficient in Math (H / D) X
100 = I
(J) Meet AMO for Math Comp. Score? (+ 99% Conf.
int.) (Yes/No)
Performance on the Language Arts Composite Score (LA=R+W)
Performance on the Mathematics Score
1
16
5
209
9
56
26
1
1
16
5
203
9
56
25
1
235
N/A
N/A
N/A
201
N/A
49
N/A
N/A
209
N/A
N/A
N/A
182
N/A
44
N/A
N/A
Yes
N/A
N/A
N/A
Yes
N/A
Yes
N/A
N/A
178
N/A
N/A
N/A
152
N/A
35
N/A
N/A
Yes
N/A
N/A
N/A
Yes
N/A
Yes
N/A
N/A
Schoolwide Title 1 School
School District Kenai Peninsula Borough School District
If a subgroup (not "the Whole School")
has 20 or fewer students enrolled (A),
then fill in "NA" for the row, 25 or fewer
in (D) then fill in "N/A" for cells D-J.
Yes
N/A
N/A
N/A
Yes
N/A
Yes
Yes
N/A
89%
N/A
N/A
N/A
91%
N/A
90%
N/A
N/A
76%
N/A
N/A
76%
N/A
71%
N/A
N/A
Printed 09/25/12Confidence Interval Formula:
Other Indicator Thresholds: Attendance Rate 85%, Graduation Rate 85%
Other Indicator - 4 Year Graduation Rate: 91.89%
Other Indicator - Attendance Rate: N/A
OTHER INDICATOR STATUS TITLE 1 STATUS
(K) Meet the
Required % for Other Indicator (Yes/No)
Other Indicator
Yes
N/A
N/A
N/A
Yes
N/A
Yes
N/A
N/A
Two or More Races 5 5 N/A N/A N/A N/A N/AN/A N/A N/A N/A
* LEP and Students with Disabilities Subgroups include former LEP and former SWD students that are being monitored for up to two years.
Targeted Assistance
^ Results are suppressed to protect individual confidentiality.
N/A
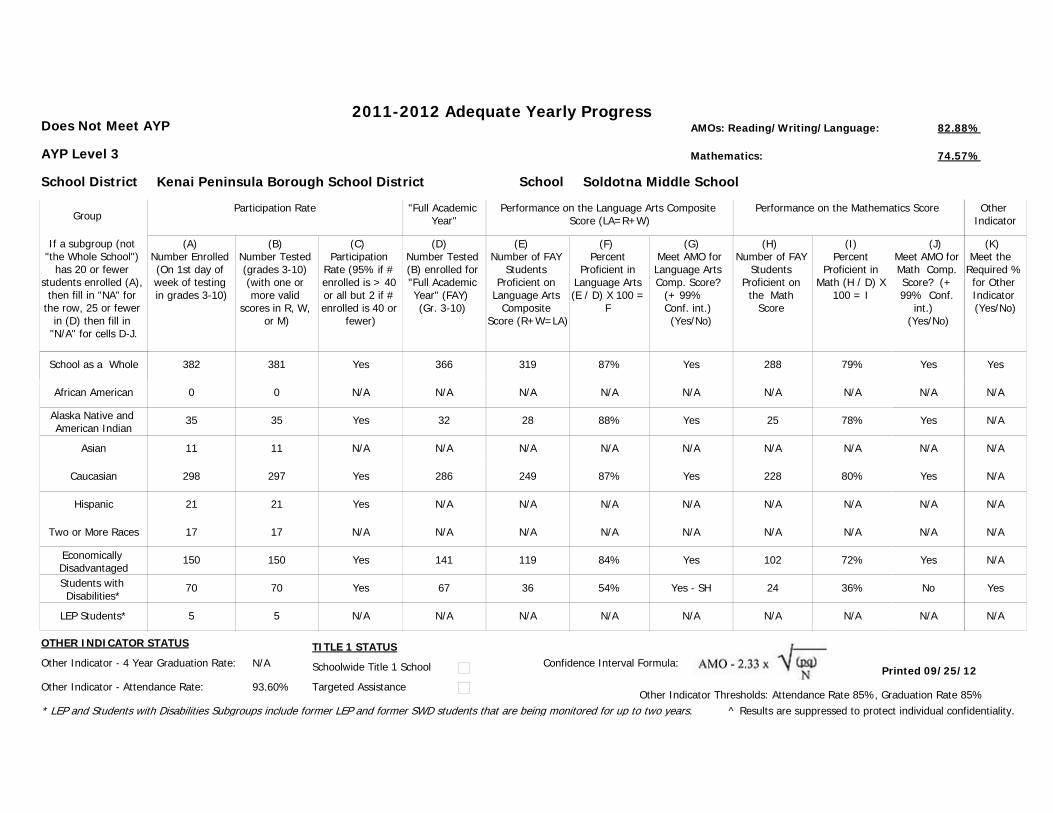
2011-2012 Adequate Yearly ProgressAMOs: Reading/Writing/Language: 82.88%
Mathematics: 74.57%
School Soldotna Middle School
Group
School as a Whole 382
Participation Rate
(A) Number Enrolled (On 1st day of week of testing in grades 3-10)
(B) Number Tested (grades 3-10) (with one or more valid
scores in R, W, or M)
(C) Participation
Rate (95% if # enrolled is > 40 or all but 2 if # enrolled is 40 or
fewer)
"Full Academic Year"
African American
Alaska Native and American Indian
Asian
Caucasian
Hispanic
Economically DisadvantagedStudents with Disabilities*
LEP Students*
(D) Number Tested (B) enrolled for "Full Academic Year" (FAY) (Gr. 3-10)
(E) Number of FAY
Students Proficient on
Language Arts Composite
Score (R+W=LA)
(F) Percent
Proficient in Language Arts (E / D) X 100 =
F
381
Does Not Meet AYP
AYP Level 3
(G) Meet AMO for Language Arts Comp. Score?
(+ 99% Conf. int.) (Yes/No)
(H) Number of FAY
Students Proficient on
the Math Score
(I) Percent
Proficient in Math (H / D) X
100 = I
(J) Meet AMO for Math Comp. Score? (+ 99% Conf.
int.) (Yes/No)
Performance on the Language Arts Composite Score (LA=R+W)
Performance on the Mathematics Score
0
35
11
298
21
150
70
5
0
35
11
297
21
150
70
5
366
N/A
32
N/A
286
N/A
141
67
N/A
319
N/A
28
N/A
249
N/A
119
36
N/A
Yes
N/A
Yes
N/A
Yes
N/A
Yes
Yes - SH
N/A
288
N/A
25
N/A
228
N/A
102
24
N/A
Yes
N/A
Yes
N/A
Yes
N/A
Yes
No
N/A
Schoolwide Title 1 School
School District Kenai Peninsula Borough School District
If a subgroup (not "the Whole School")
has 20 or fewer students enrolled (A),
then fill in "NA" for the row, 25 or fewer
in (D) then fill in "N/A" for cells D-J.
Yes
N/A
Yes
N/A
Yes
Yes
Yes
Yes
N/A
87%
N/A
88%
N/A
87%
N/A
84%
54%
N/A
79%
N/A
N/A
80%
N/A
72%
36%
N/A
Printed 09/25/12Confidence Interval Formula:
Other Indicator Thresholds: Attendance Rate 85%, Graduation Rate 85%
Other Indicator - 4 Year Graduation Rate: N/A
Other Indicator - Attendance Rate: 93.60%
OTHER INDICATOR STATUS TITLE 1 STATUS
(K) Meet the
Required % for Other Indicator (Yes/No)
Other Indicator
Yes
N/A
N/A
N/A
N/A
N/A
N/A
Yes
N/A
Two or More Races 17 17 N/A N/A N/A N/A N/AN/A N/A N/A N/A
* LEP and Students with Disabilities Subgroups include former LEP and former SWD students that are being monitored for up to two years.
Targeted Assistance
^ Results are suppressed to protect individual confidentiality.
78%

2011-2012 Adequate Yearly ProgressAMOs: Reading/Writing/Language: 82.88%
Mathematics: 74.57%
School Soldotna Montessori Charter School
Group
School as a Whole 91
Participation Rate
(A) Number Enrolled (On 1st day of week of testing in grades 3-10)
(B) Number Tested (grades 3-10) (with one or more valid
scores in R, W, or M)
(C) Participation
Rate (95% if # enrolled is > 40 or all but 2 if # enrolled is 40 or
fewer)
"Full Academic Year"
African American
Alaska Native and American Indian
Asian
Caucasian
Hispanic
Economically DisadvantagedStudents with Disabilities*
LEP Students*
(D) Number Tested (B) enrolled for "Full Academic Year" (FAY) (Gr. 3-10)
(E) Number of FAY
Students Proficient on
Language Arts Composite
Score (R+W=LA)
(F) Percent
Proficient in Language Arts (E / D) X 100 =
F
90
Meets AYP
(G) Meet AMO for Language Arts Comp. Score?
(+ 99% Conf. int.) (Yes/No)
(H) Number of FAY
Students Proficient on
the Math Score
(I) Percent
Proficient in Math (H / D) X
100 = I
(J) Meet AMO for Math Comp. Score? (+ 99% Conf.
int.) (Yes/No)
Performance on the Language Arts Composite Score (LA=R+W)
Performance on the Mathematics Score
0
1
3
73
8
20
17
0
0
1
3
73
8
20
17
0
90
N/A
N/A
N/A
72
N/A
N/A
N/A
N/A
83
N/A
N/A
N/A
67
N/A
N/A
N/A
N/A
Yes
N/A
N/A
N/A
Yes
N/A
N/A
N/A
N/A
78
N/A
N/A
N/A
63
N/A
N/A
N/A
N/A
Yes
N/A
N/A
N/A
Yes
N/A
N/A
N/A
N/A
Schoolwide Title 1 School
School District Kenai Peninsula Borough School District
If a subgroup (not "the Whole School")
has 20 or fewer students enrolled (A),
then fill in "NA" for the row, 25 or fewer
in (D) then fill in "N/A" for cells D-J.
Yes
N/A
N/A
N/A
Yes
N/A
N/A
N/A
N/A
92%
N/A
N/A
N/A
93%
N/A
N/A
N/A
N/A
87%
N/A
N/A
88%
N/A
N/A
N/A
N/A
Printed 09/25/12Confidence Interval Formula:
Other Indicator Thresholds: Attendance Rate 85%, Graduation Rate 85%
Other Indicator - 4 Year Graduation Rate: N/A
Other Indicator - Attendance Rate: 91.49%
OTHER INDICATOR STATUS TITLE 1 STATUS
(K) Meet the
Required % for Other Indicator (Yes/No)
Other Indicator
Yes
N/A
N/A
N/A
N/A
N/A
N/A
N/A
N/A
Two or More Races 6 6 N/A N/A N/A N/A N/AN/A N/A N/A N/A
* LEP and Students with Disabilities Subgroups include former LEP and former SWD students that are being monitored for up to two years.
Targeted Assistance
^ Results are suppressed to protect individual confidentiality.
N/A
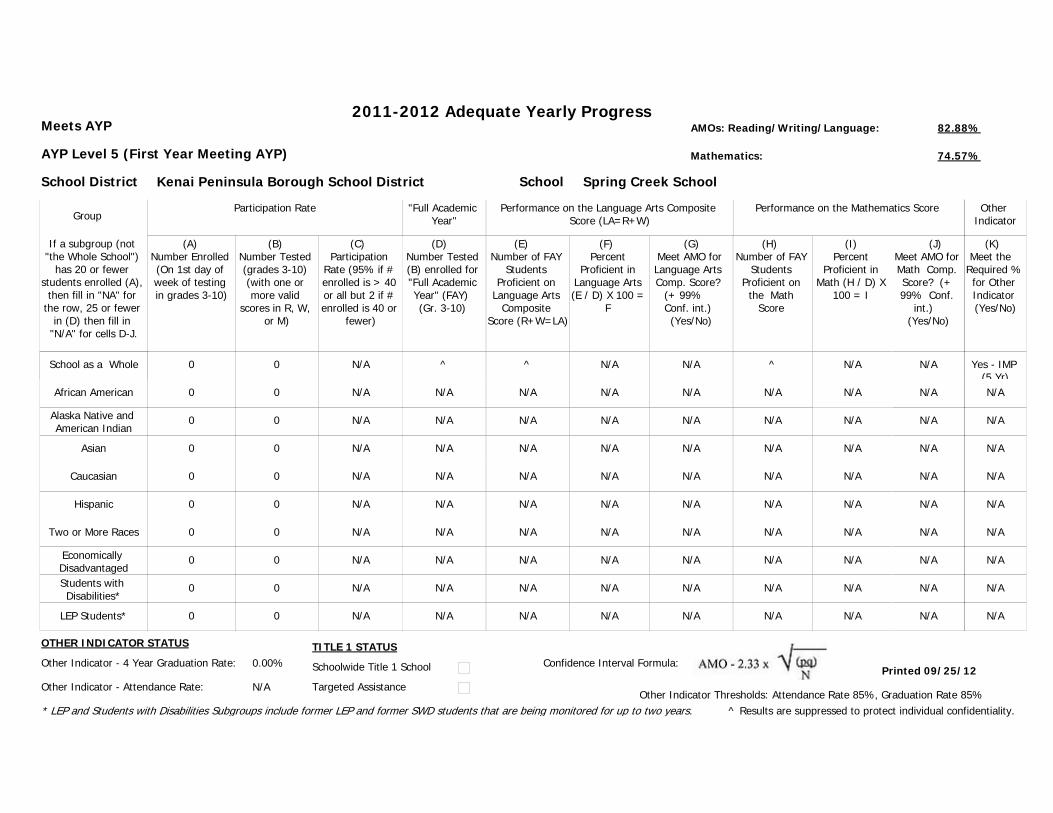
2011-2012 Adequate Yearly ProgressAMOs: Reading/Writing/Language: 82.88%
Mathematics: 74.57%
School Spring Creek School
Group
School as a Whole 0
Participation Rate
(A) Number Enrolled (On 1st day of week of testing in grades 3-10)
(B) Number Tested (grades 3-10) (with one or more valid
scores in R, W, or M)
(C) Participation
Rate (95% if # enrolled is > 40 or all but 2 if # enrolled is 40 or
fewer)
"Full Academic Year"
African American
Alaska Native and American Indian
Asian
Caucasian
Hispanic
Economically DisadvantagedStudents with Disabilities*
LEP Students*
(D) Number Tested (B) enrolled for "Full Academic Year" (FAY) (Gr. 3-10)
(E) Number of FAY
Students Proficient on
Language Arts Composite
Score (R+W=LA)
(F) Percent
Proficient in Language Arts (E / D) X 100 =
F
0
Meets AYP
AYP Level 5 (First Year Meeting AYP)
(G) Meet AMO for Language Arts Comp. Score?
(+ 99% Conf. int.) (Yes/No)
(H) Number of FAY
Students Proficient on
the Math Score
(I) Percent
Proficient in Math (H / D) X
100 = I
(J) Meet AMO for Math Comp. Score? (+ 99% Conf.
int.) (Yes/No)
Performance on the Language Arts Composite Score (LA=R+W)
Performance on the Mathematics Score
0
0
0
0
0
0
0
0
0
0
0
0
0
0
0
0
^
N/A
N/A
N/A
N/A
N/A
N/A
N/A
N/A
^
N/A
N/A
N/A
N/A
N/A
N/A
N/A
N/A
N/A
N/A
N/A
N/A
N/A
N/A
N/A
N/A
N/A
^
N/A
N/A
N/A
N/A
N/A
N/A
N/A
N/A
N/A
N/A
N/A
N/A
N/A
N/A
N/A
N/A
N/A
Schoolwide Title 1 School
School District Kenai Peninsula Borough School District
If a subgroup (not "the Whole School")
has 20 or fewer students enrolled (A),
then fill in "NA" for the row, 25 or fewer
in (D) then fill in "N/A" for cells D-J.
N/A
N/A
N/A
N/A
N/A
N/A
N/A
N/A
N/A
N/A
N/A
N/A
N/A
N/A
N/A
N/A
N/A
N/A
N/A
N/A
N/A
N/A
N/A
N/A
N/A
N/A
Printed 09/25/12Confidence Interval Formula:
Other Indicator Thresholds: Attendance Rate 85%, Graduation Rate 85%
Other Indicator - 4 Year Graduation Rate: 0.00%
Other Indicator - Attendance Rate: N/A
OTHER INDICATOR STATUS TITLE 1 STATUS
(K) Meet the
Required % for Other Indicator (Yes/No)
Other Indicator
Yes - IMP (5 Yr)N/A
N/A
N/A
N/A
N/A
N/A
N/A
N/A
Two or More Races 0 0 N/A N/A N/A N/A N/AN/A N/A N/A N/A
* LEP and Students with Disabilities Subgroups include former LEP and former SWD students that are being monitored for up to two years.
Targeted Assistance
^ Results are suppressed to protect individual confidentiality.
N/A

2011-2012 Adequate Yearly ProgressAMOs: Reading/Writing/Language: 82.88%
Mathematics: 74.57%
School Sterling Elementary
Group
School as a Whole 89
Participation Rate
(A) Number Enrolled (On 1st day of week of testing in grades 3-10)
(B) Number Tested (grades 3-10) (with one or more valid
scores in R, W, or M)
(C) Participation
Rate (95% if # enrolled is > 40 or all but 2 if # enrolled is 40 or
fewer)
"Full Academic Year"
African American
Alaska Native and American Indian
Asian
Caucasian
Hispanic
Economically DisadvantagedStudents with Disabilities*
LEP Students*
(D) Number Tested (B) enrolled for "Full Academic Year" (FAY) (Gr. 3-10)
(E) Number of FAY
Students Proficient on
Language Arts Composite
Score (R+W=LA)
(F) Percent
Proficient in Language Arts (E / D) X 100 =
F
89
Does Not Meet AYP
AYP Level 2
(G) Meet AMO for Language Arts Comp. Score?
(+ 99% Conf. int.) (Yes/No)
(H) Number of FAY
Students Proficient on
the Math Score
(I) Percent
Proficient in Math (H / D) X
100 = I
(J) Meet AMO for Math Comp. Score? (+ 99% Conf.
int.) (Yes/No)
Performance on the Language Arts Composite Score (LA=R+W)
Performance on the Mathematics Score
0
5
0
75
3
41
31
1
0
5
0
75
3
41
31
1
79
N/A
N/A
N/A
69
N/A
35
29
N/A
69
N/A
N/A
N/A
61
N/A
29
20
N/A
Yes
N/A
N/A
N/A
Yes
N/A
Yes
Yes
N/A
62
N/A
N/A
N/A
55
N/A
28
14
N/A
Yes
N/A
N/A
N/A
Yes
N/A
Yes
No
N/A
Schoolwide Title 1 School
School District Kenai Peninsula Borough School District
If a subgroup (not "the Whole School")
has 20 or fewer students enrolled (A),
then fill in "NA" for the row, 25 or fewer
in (D) then fill in "N/A" for cells D-J.
Yes
N/A
N/A
N/A
Yes
N/A
Yes
Yes
N/A
87%
N/A
N/A
N/A
88%
N/A
83%
69%
N/A
78%
N/A
N/A
80%
N/A
80%
48%
N/A
Printed 09/25/12Confidence Interval Formula:
Other Indicator Thresholds: Attendance Rate 85%, Graduation Rate 85%
Other Indicator - 4 Year Graduation Rate: N/A
Other Indicator - Attendance Rate: 93.09%
OTHER INDICATOR STATUS TITLE 1 STATUS
(K) Meet the
Required % for Other Indicator (Yes/No)
Other Indicator
Yes
N/A
N/A
N/A
N/A
N/A
N/A
N/A
N/A
Two or More Races 6 6 N/A N/A N/A N/A N/AN/A N/A N/A N/A
* LEP and Students with Disabilities Subgroups include former LEP and former SWD students that are being monitored for up to two years.
Targeted Assistance
^ Results are suppressed to protect individual confidentiality.
N/A

2011-2012 Adequate Yearly ProgressAMOs: Reading/Writing/Language: 82.88%
Mathematics: 74.57%
School Susan B. English School
Group
School as a Whole 34
Participation Rate
(A) Number Enrolled (On 1st day of week of testing in grades 3-10)
(B) Number Tested (grades 3-10) (with one or more valid
scores in R, W, or M)
(C) Participation
Rate (95% if # enrolled is > 40 or all but 2 if # enrolled is 40 or
fewer)
"Full Academic Year"
African American
Alaska Native and American Indian
Asian
Caucasian
Hispanic
Economically DisadvantagedStudents with Disabilities*
LEP Students*
(D) Number Tested (B) enrolled for "Full Academic Year" (FAY) (Gr. 3-10)
(E) Number of FAY
Students Proficient on
Language Arts Composite
Score (R+W=LA)
(F) Percent
Proficient in Language Arts (E / D) X 100 =
F
34
Meets AYP
(G) Meet AMO for Language Arts Comp. Score?
(+ 99% Conf. int.) (Yes/No)
(H) Number of FAY
Students Proficient on
the Math Score
(I) Percent
Proficient in Math (H / D) X
100 = I
(J) Meet AMO for Math Comp. Score? (+ 99% Conf.
int.) (Yes/No)
Performance on the Language Arts Composite Score (LA=R+W)
Performance on the Mathematics Score
0
13
2
15
1
19
5
0
0
13
2
15
1
19
5
0
31
N/A
N/A
N/A
N/A
N/A
N/A
N/A
N/A
^
N/A
N/A
N/A
N/A
N/A
N/A
N/A
N/A
Yes
N/A
N/A
N/A
N/A
N/A
N/A
N/A
N/A
27
N/A
N/A
N/A
N/A
N/A
N/A
N/A
N/A
Yes
N/A
N/A
N/A
N/A
N/A
N/A
N/A
N/A
Schoolwide Title 1 School
School District Kenai Peninsula Borough School District
If a subgroup (not "the Whole School")
has 20 or fewer students enrolled (A),
then fill in "NA" for the row, 25 or fewer
in (D) then fill in "N/A" for cells D-J.
Yes
N/A
N/A
N/A
N/A
N/A
N/A
N/A
N/A
90% or More
N/A
N/A
N/A
N/A
N/A
N/A
N/A
N/A
87%
N/A
N/A
N/A
N/A
N/A
N/A
N/A
Printed 09/25/12Confidence Interval Formula:
Other Indicator Thresholds: Attendance Rate 85%, Graduation Rate 85%
Other Indicator - 4 Year Graduation Rate: 100.0%
Other Indicator - Attendance Rate: N/A
OTHER INDICATOR STATUS TITLE 1 STATUS
(K) Meet the
Required % for Other Indicator (Yes/No)
Other Indicator
Yes
N/A
N/A
N/A
N/A
N/A
N/A
N/A
N/A
Two or More Races 3 3 N/A N/A N/A N/A N/AN/A N/A N/A N/A
* LEP and Students with Disabilities Subgroups include former LEP and former SWD students that are being monitored for up to two years.
Targeted Assistance
^ Results are suppressed to protect individual confidentiality.
N/A
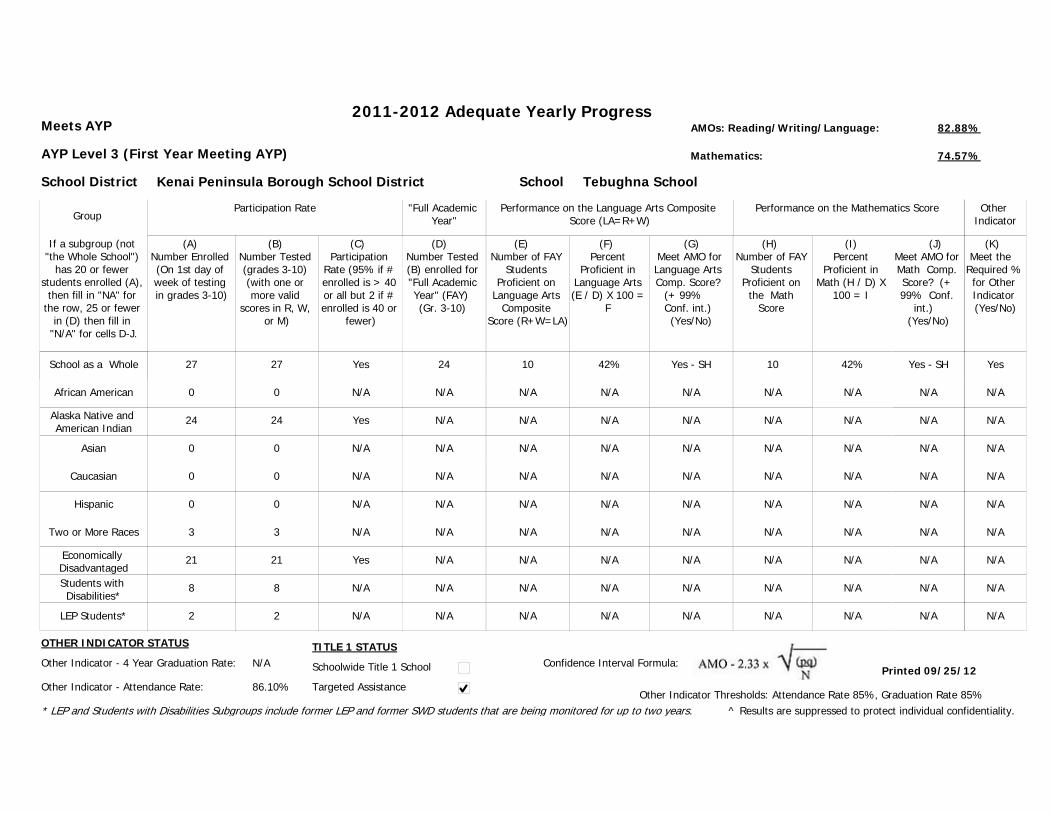
2011-2012 Adequate Yearly ProgressAMOs: Reading/Writing/Language: 82.88%
Mathematics: 74.57%
School Tebughna School
Group
School as a Whole 27
Participation Rate
(A) Number Enrolled (On 1st day of week of testing in grades 3-10)
(B) Number Tested (grades 3-10) (with one or more valid
scores in R, W, or M)
(C) Participation
Rate (95% if # enrolled is > 40 or all but 2 if # enrolled is 40 or
fewer)
"Full Academic Year"
African American
Alaska Native and American Indian
Asian
Caucasian
Hispanic
Economically DisadvantagedStudents with Disabilities*
LEP Students*
(D) Number Tested (B) enrolled for "Full Academic Year" (FAY) (Gr. 3-10)
(E) Number of FAY
Students Proficient on
Language Arts Composite
Score (R+W=LA)
(F) Percent
Proficient in Language Arts (E / D) X 100 =
F
27
Meets AYP
AYP Level 3 (First Year Meeting AYP)
(G) Meet AMO for Language Arts Comp. Score?
(+ 99% Conf. int.) (Yes/No)
(H) Number of FAY
Students Proficient on
the Math Score
(I) Percent
Proficient in Math (H / D) X
100 = I
(J) Meet AMO for Math Comp. Score? (+ 99% Conf.
int.) (Yes/No)
Performance on the Language Arts Composite Score (LA=R+W)
Performance on the Mathematics Score
0
24
0
0
0
21
8
2
0
24
0
0
0
21
8
2
24
N/A
N/A
N/A
N/A
N/A
N/A
N/A
N/A
10
N/A
N/A
N/A
N/A
N/A
N/A
N/A
N/A
Yes - SH
N/A
N/A
N/A
N/A
N/A
N/A
N/A
N/A
10
N/A
N/A
N/A
N/A
N/A
N/A
N/A
N/A
Yes - SH
N/A
N/A
N/A
N/A
N/A
N/A
N/A
N/A
Schoolwide Title 1 School
School District Kenai Peninsula Borough School District
If a subgroup (not "the Whole School")
has 20 or fewer students enrolled (A),
then fill in "NA" for the row, 25 or fewer
in (D) then fill in "N/A" for cells D-J.
Yes
N/A
Yes
N/A
N/A
N/A
Yes
N/A
N/A
42%
N/A
N/A
N/A
N/A
N/A
N/A
N/A
N/A
42%
N/A
N/A
N/A
N/A
N/A
N/A
N/A
Printed 09/25/12Confidence Interval Formula:
Other Indicator Thresholds: Attendance Rate 85%, Graduation Rate 85%
Other Indicator - 4 Year Graduation Rate: N/A
Other Indicator - Attendance Rate: 86.10%
OTHER INDICATOR STATUS TITLE 1 STATUS
(K) Meet the
Required % for Other Indicator (Yes/No)
Other Indicator
Yes
N/A
N/A
N/A
N/A
N/A
N/A
N/A
N/A
Two or More Races 3 3 N/A N/A N/A N/A N/AN/A N/A N/A N/A
* LEP and Students with Disabilities Subgroups include former LEP and former SWD students that are being monitored for up to two years.
Targeted Assistance
^ Results are suppressed to protect individual confidentiality.
N/A

2011-2012 Adequate Yearly ProgressAMOs: Reading/Writing/Language: 82.88%
Mathematics: 74.57%
School Tustumena Elementary
Group
School as a Whole 89
Participation Rate
(A) Number Enrolled (On 1st day of week of testing in grades 3-10)
(B) Number Tested (grades 3-10) (with one or more valid
scores in R, W, or M)
(C) Participation
Rate (95% if # enrolled is > 40 or all but 2 if # enrolled is 40 or
fewer)
"Full Academic Year"
African American
Alaska Native and American Indian
Asian
Caucasian
Hispanic
Economically DisadvantagedStudents with Disabilities*
LEP Students*
(D) Number Tested (B) enrolled for "Full Academic Year" (FAY) (Gr. 3-10)
(E) Number of FAY
Students Proficient on
Language Arts Composite
Score (R+W=LA)
(F) Percent
Proficient in Language Arts (E / D) X 100 =
F
89
Meets AYP
(G) Meet AMO for Language Arts Comp. Score?
(+ 99% Conf. int.) (Yes/No)
(H) Number of FAY
Students Proficient on
the Math Score
(I) Percent
Proficient in Math (H / D) X
100 = I
(J) Meet AMO for Math Comp. Score? (+ 99% Conf.
int.) (Yes/No)
Performance on the Language Arts Composite Score (LA=R+W)
Performance on the Mathematics Score
1
7
0
69
3
46
20
0
1
7
0
69
3
46
20
0
86
N/A
N/A
N/A
66
N/A
43
N/A
N/A
75
N/A
N/A
N/A
58
N/A
36
N/A
N/A
Yes
N/A
N/A
N/A
Yes
N/A
Yes
N/A
N/A
74
N/A
N/A
N/A
55
N/A
37
N/A
N/A
Yes
N/A
N/A
N/A
Yes
N/A
Yes
N/A
N/A
Schoolwide Title 1 School
School District Kenai Peninsula Borough School District
If a subgroup (not "the Whole School")
has 20 or fewer students enrolled (A),
then fill in "NA" for the row, 25 or fewer
in (D) then fill in "N/A" for cells D-J.
Yes
N/A
N/A
N/A
Yes
N/A
Yes
N/A
N/A
87%
N/A
N/A
N/A
88%
N/A
84%
N/A
N/A
86%
N/A
N/A
83%
N/A
86%
N/A
N/A
Printed 09/25/12Confidence Interval Formula:
Other Indicator Thresholds: Attendance Rate 85%, Graduation Rate 85%
Other Indicator - 4 Year Graduation Rate: N/A
Other Indicator - Attendance Rate: 92.50%
OTHER INDICATOR STATUS TITLE 1 STATUS
(K) Meet the
Required % for Other Indicator (Yes/No)
Other Indicator
Yes
N/A
N/A
N/A
N/A
N/A
N/A
N/A
N/A
Two or More Races 9 9 N/A N/A N/A N/A N/AN/A N/A N/A N/A
* LEP and Students with Disabilities Subgroups include former LEP and former SWD students that are being monitored for up to two years.
Targeted Assistance
^ Results are suppressed to protect individual confidentiality.
N/A

2011-2012 Adequate Yearly ProgressAMOs: Reading/Writing/Language: 82.88%
Mathematics: 74.57%
School Voznesenka School
Group
School as a Whole 62
Participation Rate
(A) Number Enrolled (On 1st day of week of testing in grades 3-10)
(B) Number Tested (grades 3-10) (with one or more valid
scores in R, W, or M)
(C) Participation
Rate (95% if # enrolled is > 40 or all but 2 if # enrolled is 40 or
fewer)
"Full Academic Year"
African American
Alaska Native and American Indian
Asian
Caucasian
Hispanic
Economically DisadvantagedStudents with Disabilities*
LEP Students*
(D) Number Tested (B) enrolled for "Full Academic Year" (FAY) (Gr. 3-10)
(E) Number of FAY
Students Proficient on
Language Arts Composite
Score (R+W=LA)
(F) Percent
Proficient in Language Arts (E / D) X 100 =
F
62
Meets AYP
(G) Meet AMO for Language Arts Comp. Score?
(+ 99% Conf. int.) (Yes/No)
(H) Number of FAY
Students Proficient on
the Math Score
(I) Percent
Proficient in Math (H / D) X
100 = I
(J) Meet AMO for Math Comp. Score? (+ 99% Conf.
int.) (Yes/No)
Performance on the Language Arts Composite Score (LA=R+W)
Performance on the Mathematics Score
0
0
0
62
0
50
20
19
0
0
0
62
0
50
20
19
60
N/A
N/A
N/A
60
N/A
48
N/A
N/A
50
N/A
N/A
N/A
50
N/A
38
N/A
N/A
Yes
N/A
N/A
N/A
Yes
N/A
Yes
N/A
N/A
48
N/A
N/A
N/A
48
N/A
38
N/A
N/A
Yes
N/A
N/A
N/A
Yes
N/A
Yes
N/A
N/A
Schoolwide Title 1 School
School District Kenai Peninsula Borough School District
If a subgroup (not "the Whole School")
has 20 or fewer students enrolled (A),
then fill in "NA" for the row, 25 or fewer
in (D) then fill in "N/A" for cells D-J.
Yes
N/A
N/A
N/A
Yes
N/A
Yes
N/A
N/A
83%
N/A
N/A
N/A
83%
N/A
79%
N/A
N/A
80%
N/A
N/A
80%
N/A
79%
N/A
N/A
Printed 09/25/12Confidence Interval Formula:
Other Indicator Thresholds: Attendance Rate 85%, Graduation Rate 85%
Other Indicator - 4 Year Graduation Rate: 90.00%
Other Indicator - Attendance Rate: N/A
OTHER INDICATOR STATUS TITLE 1 STATUS
(K) Meet the
Required % for Other Indicator (Yes/No)
Other Indicator
Yes
N/A
N/A
N/A
Yes
N/A
Yes
N/A
N/A
Two or More Races 0 0 N/A N/A N/A N/A N/AN/A N/A N/A N/A
* LEP and Students with Disabilities Subgroups include former LEP and former SWD students that are being monitored for up to two years.
Targeted Assistance
^ Results are suppressed to protect individual confidentiality.
N/A

2011-2012 Adequate Yearly ProgressAMOs: Reading/Writing/Language: 82.88%
Mathematics: 74.57%
School West Homer Elementary
Group
School as a Whole 219
Participation Rate
(A) Number Enrolled (On 1st day of week of testing in grades 3-10)
(B) Number Tested (grades 3-10) (with one or more valid
scores in R, W, or M)
(C) Participation
Rate (95% if # enrolled is > 40 or all but 2 if # enrolled is 40 or
fewer)
"Full Academic Year"
African American
Alaska Native and American Indian
Asian
Caucasian
Hispanic
Economically DisadvantagedStudents with Disabilities*
LEP Students*
(D) Number Tested (B) enrolled for "Full Academic Year" (FAY) (Gr. 3-10)
(E) Number of FAY
Students Proficient on
Language Arts Composite
Score (R+W=LA)
(F) Percent
Proficient in Language Arts (E / D) X 100 =
F
217
Meets AYP
(G) Meet AMO for Language Arts Comp. Score?
(+ 99% Conf. int.) (Yes/No)
(H) Number of FAY
Students Proficient on
the Math Score
(I) Percent
Proficient in Math (H / D) X
100 = I
(J) Meet AMO for Math Comp. Score? (+ 99% Conf.
int.) (Yes/No)
Performance on the Language Arts Composite Score (LA=R+W)
Performance on the Mathematics Score
0
20
1
183
8
112
63
6
0
20
1
181
8
111
63
6
206
N/A
N/A
N/A
177
N/A
102
61
N/A
190
N/A
N/A
N/A
164
N/A
92
51
N/A
Yes
N/A
N/A
N/A
Yes
N/A
Yes
Yes
N/A
176
N/A
N/A
N/A
150
N/A
82
43
N/A
Yes
N/A
N/A
N/A
Yes
N/A
Yes
Yes
N/A
Schoolwide Title 1 School
School District Kenai Peninsula Borough School District
If a subgroup (not "the Whole School")
has 20 or fewer students enrolled (A),
then fill in "NA" for the row, 25 or fewer
in (D) then fill in "N/A" for cells D-J.
Yes
N/A
N/A
N/A
Yes
N/A
Yes
Yes
N/A
92%
N/A
N/A
N/A
93%
N/A
90%
84%
N/A
85%
N/A
N/A
85%
N/A
80%
70%
N/A
Printed 09/25/12Confidence Interval Formula:
Other Indicator Thresholds: Attendance Rate 85%, Graduation Rate 85%
Other Indicator - 4 Year Graduation Rate: N/A
Other Indicator - Attendance Rate: 93.66%
OTHER INDICATOR STATUS TITLE 1 STATUS
(K) Meet the
Required % for Other Indicator (Yes/No)
Other Indicator
Yes
N/A
N/A
N/A
N/A
N/A
N/A
N/A
N/A
Two or More Races 7 7 N/A N/A N/A N/A N/AN/A N/A N/A N/A
* LEP and Students with Disabilities Subgroups include former LEP and former SWD students that are being monitored for up to two years.
Targeted Assistance
^ Results are suppressed to protect individual confidentiality.
N/A
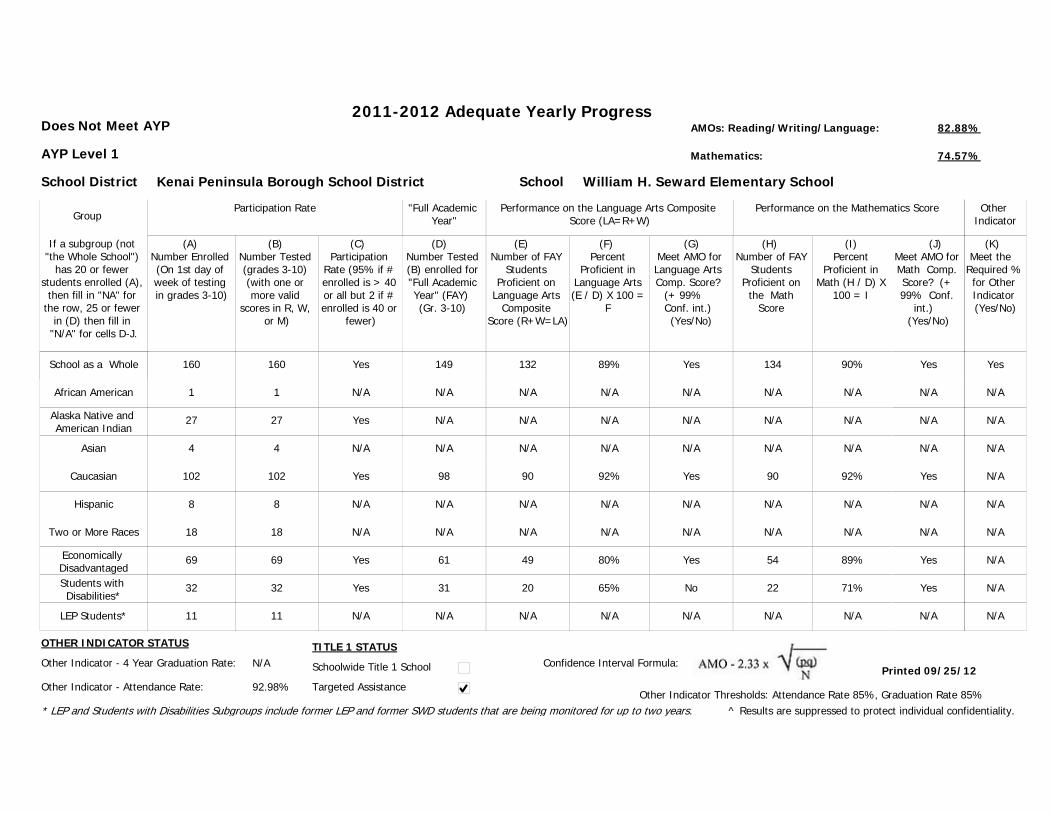
2011-2012 Adequate Yearly ProgressAMOs: Reading/Writing/Language: 82.88%
Mathematics: 74.57%
School William H. Seward Elementary School
Group
School as a Whole 160
Participation Rate
(A) Number Enrolled (On 1st day of week of testing in grades 3-10)
(B) Number Tested (grades 3-10) (with one or more valid
scores in R, W, or M)
(C) Participation
Rate (95% if # enrolled is > 40 or all but 2 if # enrolled is 40 or
fewer)
"Full Academic Year"
African American
Alaska Native and American Indian
Asian
Caucasian
Hispanic
Economically DisadvantagedStudents with Disabilities*
LEP Students*
(D) Number Tested (B) enrolled for "Full Academic Year" (FAY) (Gr. 3-10)
(E) Number of FAY
Students Proficient on
Language Arts Composite
Score (R+W=LA)
(F) Percent
Proficient in Language Arts (E / D) X 100 =
F
160
Does Not Meet AYP
AYP Level 1
(G) Meet AMO for Language Arts Comp. Score?
(+ 99% Conf. int.) (Yes/No)
(H) Number of FAY
Students Proficient on
the Math Score
(I) Percent
Proficient in Math (H / D) X
100 = I
(J) Meet AMO for Math Comp. Score? (+ 99% Conf.
int.) (Yes/No)
Performance on the Language Arts Composite Score (LA=R+W)
Performance on the Mathematics Score
1
27
4
102
8
69
32
11
1
27
4
102
8
69
32
11
149
N/A
N/A
N/A
98
N/A
61
31
N/A
132
N/A
N/A
N/A
90
N/A
49
20
N/A
Yes
N/A
N/A
N/A
Yes
N/A
Yes
No
N/A
134
N/A
N/A
N/A
90
N/A
54
22
N/A
Yes
N/A
N/A
N/A
Yes
N/A
Yes
Yes
N/A
Schoolwide Title 1 School
School District Kenai Peninsula Borough School District
If a subgroup (not "the Whole School")
has 20 or fewer students enrolled (A),
then fill in "NA" for the row, 25 or fewer
in (D) then fill in "N/A" for cells D-J.
Yes
N/A
Yes
N/A
Yes
N/A
Yes
Yes
N/A
89%
N/A
N/A
N/A
92%
N/A
80%
65%
N/A
90%
N/A
N/A
92%
N/A
89%
71%
N/A
Printed 09/25/12Confidence Interval Formula:
Other Indicator Thresholds: Attendance Rate 85%, Graduation Rate 85%
Other Indicator - 4 Year Graduation Rate: N/A
Other Indicator - Attendance Rate: 92.98%
OTHER INDICATOR STATUS TITLE 1 STATUS
(K) Meet the
Required % for Other Indicator (Yes/No)
Other Indicator
Yes
N/A
N/A
N/A
N/A
N/A
N/A
N/A
N/A
Two or More Races 18 18 N/A N/A N/A N/A N/AN/A N/A N/A N/A
* LEP and Students with Disabilities Subgroups include former LEP and former SWD students that are being monitored for up to two years.
Targeted Assistance
^ Results are suppressed to protect individual confidentiality.
N/A


![MIGRATION PROFILEpublications.jrc.ec.europa.eu/repository/bitstream/... · (2016) BY SECTOR [%] AND YEAR (2013 - 2016) TOTAL ENVIRONMENTAL OTHER N/A NOT AVAILABLE SECURITY Yearly](https://img.pdfslide.us/doc/110x75/5fa351f74b6d617a8979f99f/migration-2016-by-sector-and-year-2013-2016-total-environmental-other.jpg)