Embed Size (px)
DESCRIPTION
Conducted for:. 2010 Tennis Participation Survey. Conducted by:. December 2010. Method. Nationwide telephone survey of households Household members age 6+ enumerated Data on tennis participation collected for each person - PowerPoint PPT Presentation
Citation preview
Conducted for:
Conducted by:
December 2010

Method
Nationwide telephone survey of households Household members age 6+ enumerated Data on tennis participation collected for each person
Sample results weighted by household income, age, and geographic region To bring the sample demographic distributions in line with U.S. Census data on
the population.
Sample components (since 2007) ~5,600 landline telephone interviews ~400 interviews by cellphone with cellphone-only households
○ Cellphone-only (CPO) households now over 22% of all U.S. households○ CPO households weighted to reflect their proportion of all U.S. households.
Enumerating all household members age 6+, the survey includes observations on tennis playing (or not) for approximately 14,000 individuals.
2

Segment Definitions
Player: Played tennis at least once in the past 12 months
Infrequent player: Played tennis 1-3 times in past 12 months
Regular player: Played tennis 4-20 times in past 12 months
Frequent player: Played tennis 21 or more times in past 12 months
New player: First year person has ever played tennis
Rejoiner: Started playing tennis again in the past 12 months after having stopped playing for at least one year
Continuing player: Has played tennis for more than one year
Total play occasions: Total number of times all types of players play tennis in a year
3


Total Participation: Played tennis at least once in past year
• In 2010 the participation rate is 9.51%, down from 10.38% in 2009.
5
Total Participation has dipped 8% from the 2009 all time high but at 27.8 million, it’s at the second-highest mark ever!
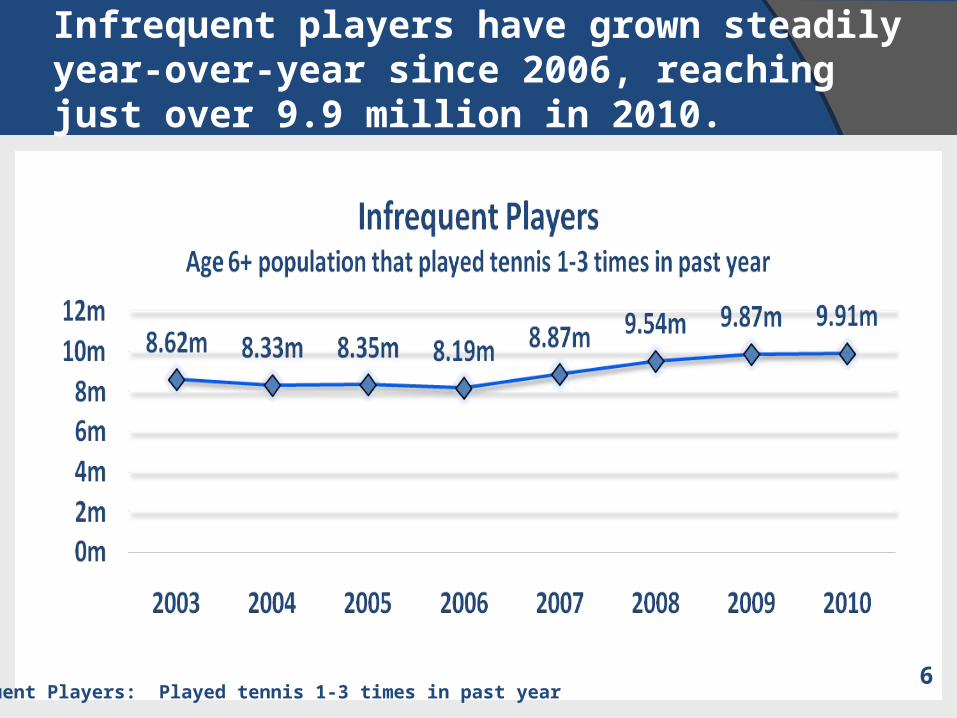
Infrequent players have grown steadily year-over-year since 2006, reaching just over 9.9 million in 2010.
Infrequent Players: Played tennis 1-3 times in past year 6

Regular players (4-20 times in past year) have declined 11% in 2010 but remain well above any previous year.
Regular Players: Played tennis 4-20 times in past year 7
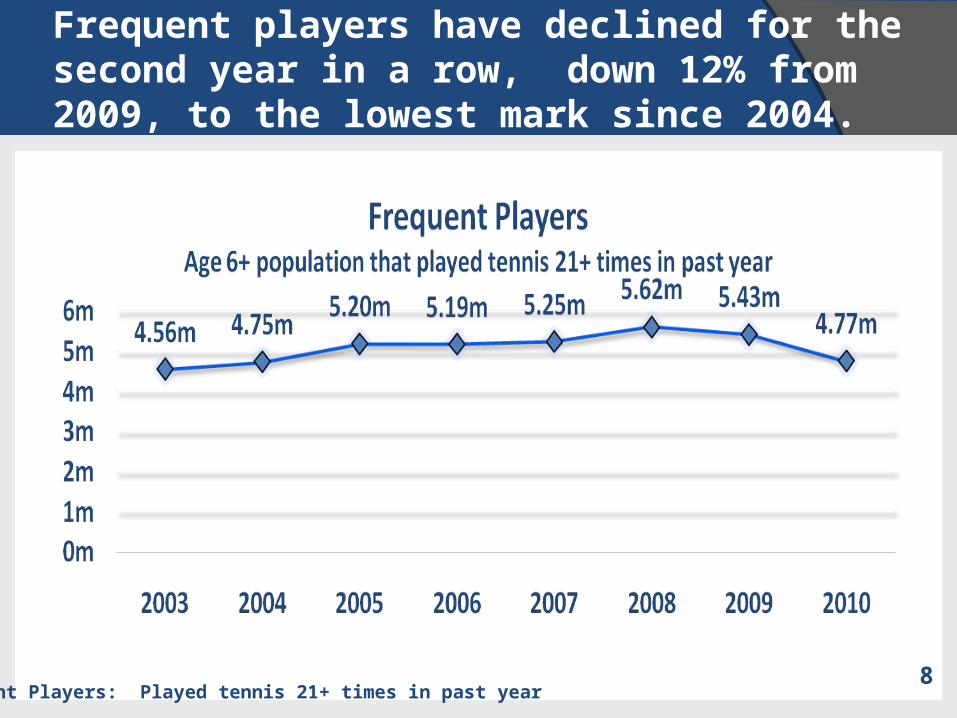
Frequent players have declined for the second year in a row, down 12% from 2009, to the lowest mark since 2004.
Frequent Players: Played tennis 21+ times in past year 8

Continuing players are down 7% against 2010, back to the same 15 million level as 2008—but still significantly higher than any year prior to 2008.
Continuing Players: Played tennis for more than one year 9
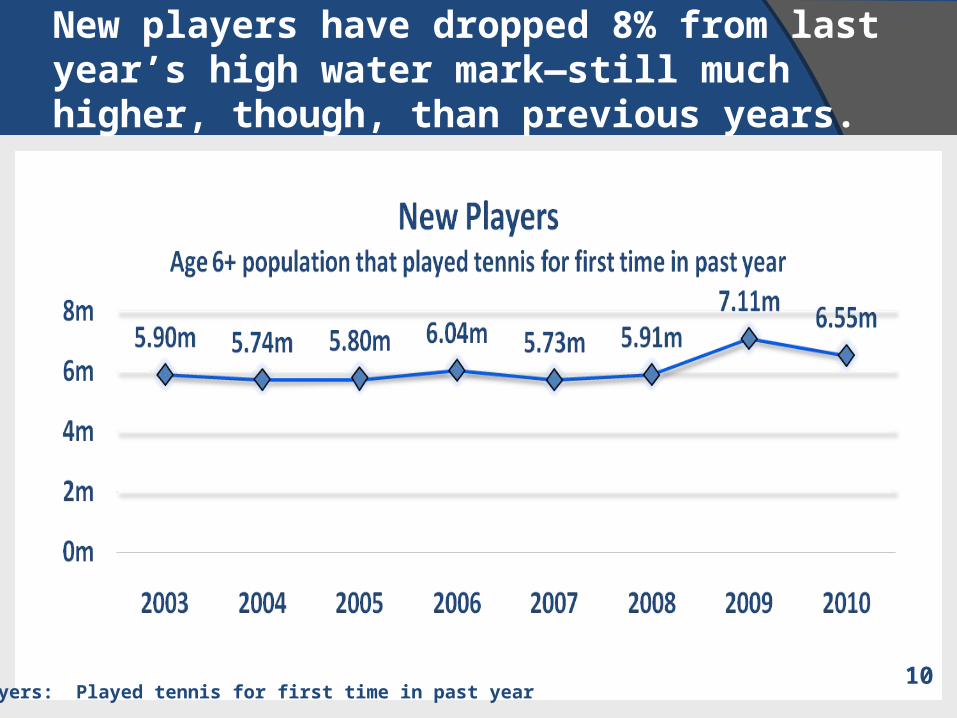
New players have dropped 8% from last year’s high water mark—still much higher, though, than previous years.
New Players: Played tennis for first time in past year 10

Rejoiners are down 9% against 2009 but are again still considerably higher than previous years.
Rejoining Players: Started playing tennis again in past year after having stopped playing for at least one year 11

Total play occasions have slid for a second year in a row (down 11% against 2010), driven by another decline in frequent play.
Total Play Occasions: Number of times all players play tennis 12
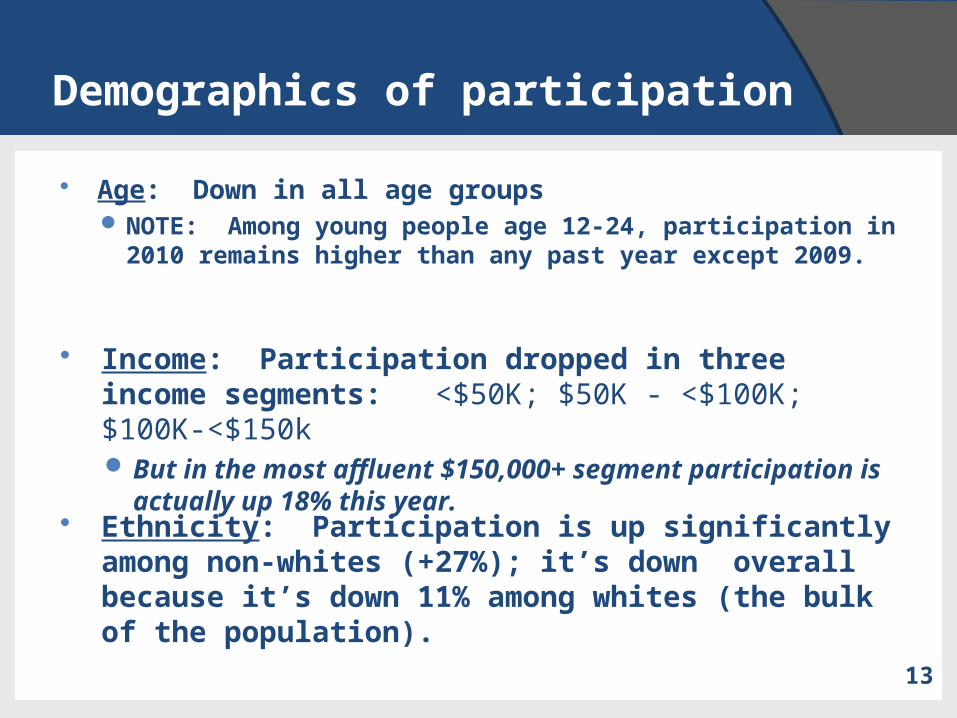
Demographics of participation
Age: Down in all age groups NOTE: Among young people age 12-24, participation in 2010 remains
higher than any past year except 2009.
13
Income: Participation dropped in three income segments: <$50K; $50K - <$100K; $100K-<$150k But in the most affluent $150,000+ segment participation is actually
up 18% this year.
Ethnicity: Participation is up significantly among non-whites (+27%); it’s down overall because it’s down 11% among whites (the bulk of the population).

A world in flux
Total Participation: Played tennis at least once in past year
-2% +5% -2% +4% +7%+12%
-8%
Average year-over-year change 3%
Average year-over-year change 9%
DJIA average year-over year change 10%
DJIA average year-over-year change 18%
14
Total Participation: Played tennis at least once in past year
+3% +6%+11%
+18% over 05/06
+22% over 03/04
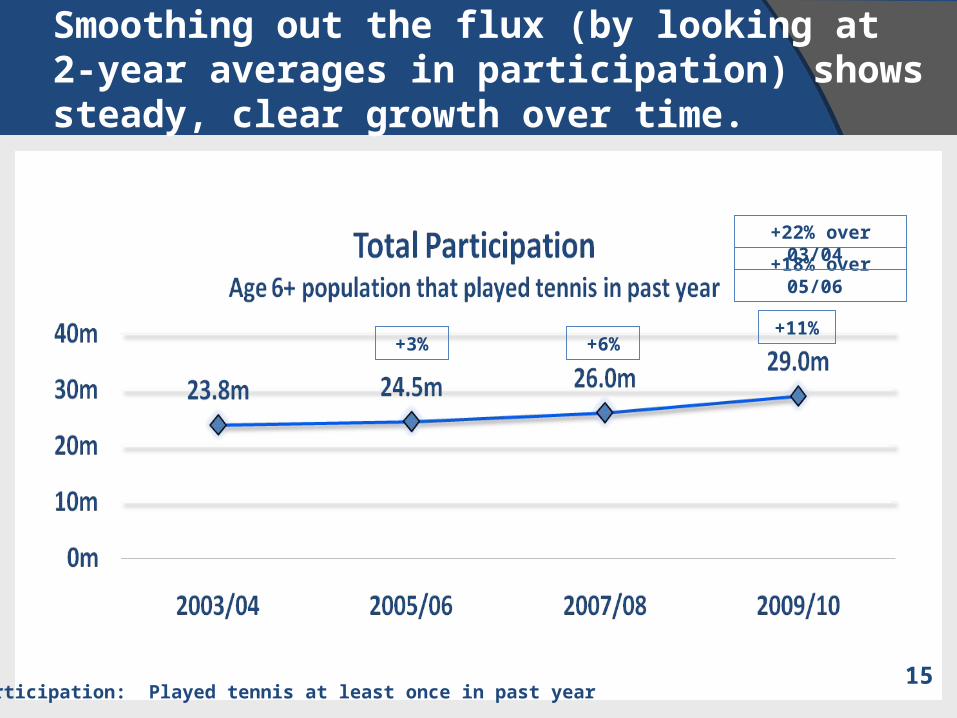
Smoothing out the flux (by looking at 2-year averages in participation) shows steady, clear growth over time.
15