Embed Size (px)
Citation preview
Exploring the Relationship Between Survey Participation and Survey Sponsorship:What do Respondents and Nonrespondents Think of Us?
By Jaki Stanley McCarthy, Jay V. Johnson, and Kathleen OttNational Agricultural Statistics Service
3251 Old Lee Highway, Room 305, Fairfax, VA 22030International Conference on Survey Nonresponse, October 1999
Key Words: Agriculture, Establishment Surveys, Nonresponse, Attitudes, Awareness, Recognition
Abstract: The type or particular organization sponsoring a survey data collection is typically
thought to have an impact on survey response. A series of questions was asked of agricultural
establishments selected for the National Agricultural Statistics Service's quarterly agricultural surveys
state in order to examine the relationship between knowledge and attitudes of respondents toward
NASS survey participation. The questions were about the respondents' identification of the agency,
their perceptions of the agency and its data, the effect of data on respondents, and their opinions
regarding responding to NASS surveys. These questions were asked of both respondents and
non-respondents to the surveys in contacts throughout 1998 and 1999. Results suggest that it is not
recognition of the agency that is related to NASS response rates, but the perceptions of how NASS
reports and services impact farm operators. Distinct differences were found in attitudes of respondents
and non-respondents for some of these measures.
1. Introduction
Survey methodologists have long speculated about what factors affect survey respondents’
willingness to cooperate when contacted on surveys. Attributes of the interviewer, the particular
respondent, the survey process or the external environment may all impact whether or not an individual
will provide data to survey researchers. (For an extensive review of these factors in household surveys,
see Groves and Couper, 1998.) In telephone or personal interview surveys, the interviewer and how
they interact with the potential respondent is critical to gaining cooperation. Interviewers are often free
to introduce and initiate an interview in whatever way they feel is suitable. The survey introduction may
include any number of different appeals intended to increase cooperation. Groves, Cialdini, and
Couper (1992) have argued that many fall into one of 6 principles of compliance: reciprocation,
consistency, social validation, authority, scarcity and liking. One of the methods that interviewers report
using to gain cooperation is to tailor the interaction (and consequently which compliance principles are
used) according to the particular respondent and what they surmise will be relevant to that individual.
Snijkers, Hox, and de Leeuw (1999) studied the tactics that high performing survey
interviewers use to gain cooperation. Similar to Groves, et al. (1992) they found that tailoring the
interaction was important. However, they also found that mentioning Statistics Netherlands as the
survey sponsor was rated as a highly efficient means of securing cooperation. Successful interviewers
also felt that the agency should pay more attention to public relations and thus, “the image of the agency
is seen as a tool to work with and attain a better response rate.”
One of the critical components to a survey introduction is the identification of the sponsoring
organization and explanation of the survey purpose. This may impact several of the compliance
principles, e.g., authority, liking. It has generally been assumed that government or university
sponsorship of a survey increases cooperation. However, to date, there is little empirical evidence to
show what the relationship between survey sponsorship and cooperation is. Brunner and Carroll
(1969) found that an advance letter printed on university stationary increased response by 30% over
samples who received no advance letter, while an advance letter on stationary from a relatively
unknown business decreased response by 6%. Heberlein and Baumgartner (1978) compared
response rates for 98 published mail questionnaire surveys and found higher response rates for
government-sponsored surveys, although these were not compared experimentally.
Presser, Blair and Triplett (1992) found that there was no difference in overall response rate for
samples where interviewers identified themselves as representing a university versus samples for which
interviewers identified themselves as representing a major newspaper. In addition, many people
contacted for surveys do not believe there is any difference between telephone surveys and
telemarketing calls (Remington, 1992). However, for those who do, their opinion of telephone surveys
is more favorable than toward telemarketing.
Within government-sponsored surveys, there is little evidence one way or the other to support
the idea that what a potential respondent thinks about the sponsoring agency affects response. The
Census Bureau, as part of the dress rehearsal for the 2000 Census, found there was not a significant
correlation between reported knowledge of the Census and likelihood of returning a Census mail form
(Bates and Buckley, 1999). However, in an evaluation of response to the 1990 Census, respondents’
attitudes toward the Census Bureau’s handling of data confidentiality and privacy were somewhat
correlated to both self reported Census returns (Fay, Bates and Moore, 1991) and actual Census
returns (Singer, Mathiowetz and Couper, 1993). Harris-Kojetin and Tucker (1999) found that in times
of more positive public opinion regarding the government and government leaders, cooperation rates on
the Current Population Survey, a major government survey, were higher.
Survey respondents representing establishments (such as schools, hospitals, factories, farms or
other businesses) may be somewhat different from respondents representing themselves or their
households. These differences may make attitudes toward the survey sponsor more important than in
general household surveys. For example, establishment survey respondents may be contacted much
more frequently by an organization than household respondents. They may also use or be more directly
affected by the survey results (see Interagency Group on Establishment Nonresponse, 1999 for an
extensive discussion of issues relevant to nonresponse in establishment surveys).
Within the agricultural establishment population, research done in the late 1970's indicated that
farmers’ self reported participation in USDA surveys was related to how well they felt the survey
purpose had been explained to them, whether they themselves used USDA reports, and their opinion of
whether or not they thought government reports were generally worthwhile (Jones, Sheatsley and
Stinchcombe, 1979). This is similar to findings in household surveys, where survey cooperation has
been linked to respondents general attitudes toward the usefulness of surveys (Frankel and Sharp,
1981). Establishments may also be hesitant to provide information they may feel is proprietary. In an
agricultural survey collecting detailed farm expenditure, income and demographic data, some of the
most common reasons given for refusing to participate were hesitance to provide the detailed financial
information and concern with data confidentiality (O’Connor, 1991, 1992). However, for this same
survey, very few farm operations gave reasons for refusing related specifically to the survey sponsor.
The National Agricultural Statistics Service (NASS) of the United State Department of
Agriculture (USDA) publishes official statistics based on data collected from farmers, ranchers and
other agribusiness operators in voluntary surveys. As is the case for many survey organizations,
response rates in NASS surveys have been steadily declining. This is particularly of concern in our
population – agricultural operators – since their numbers are shrinking over time as requests for data
about them increase (due to many factors, among them concerns for food safety and the impact of
agriculture on the environment). Since we know that survey burden is not likely to decrease, NASS is
seeking ways to maintain and increase survey cooperation.
As statisticians in a Federal Statistical agency, the staff in NASS had some ideas about what
might affect survey cooperation. Indeed, NASS personnel work closely with the survey process and
many come from agricultural backgrounds, either having been raised on a farm or ranch or in a rural
agricultural community. Many statisticians in NASS have strong beliefs or anecdotal evidence about
what affects survey cooperation and why sampled agricultural operations do or do not respond to
NASS survey requests. However, there has been little systematic or in-depth research to provide
evidence to support these beliefs. The first step in collecting this information was to obtain information
from our respondents. We conducted several focus groups with agricultural operators in several places
throughout the country, including Sycamore, IL, Dyersburg, TN, (aptly named) Farmville, VA, and
Pierre, SD.
Initially, these focus groups were designed to ask about alternatives to reporting and changes in
data collection procedures that might lessen the reporting burden NASS places on farmers and
ranchers. However, in many of these meetings, respondents did not consider the reporting burden
excessive and did not cite major concerns with the effort they expend to report their data. Even
without prompting, respondents in these meetings (including one with operators of large farms who had
always refused survey cooperation in the past) brought up ideas related to sponsorship of surveys that
they cooperated on and their concern with knowing where data they provided went and how it was
ultimately being used.
These meetings lead us to believe we needed to focus more on explaining who NASS is, as the
survey sponsor, and how data were being used that was beneficial to respondents and people like
them. However, as is true of any focus groups, these meetings included only a small, and potentially
unrepresentative, group of potential respondents. To determine if survey sponsorship is indeed related
to survey cooperation, we began collecting statistically representative data about respondents’ and
nonrespondents’ awareness of our surveys’ sponsorship and data uses.
2. Methods
Questions about respondents’ knowledge and opinions of NASS were added to the South
Dakota Quarterly Agricultural Survey (QAS) for hogs and crops, the January and July Cattle Survey,
and the Sheep Survey, all of which collect data on agricultural production and inventory. We selected
these surveys because they include a broad cross section of agricultural operations by commodity and
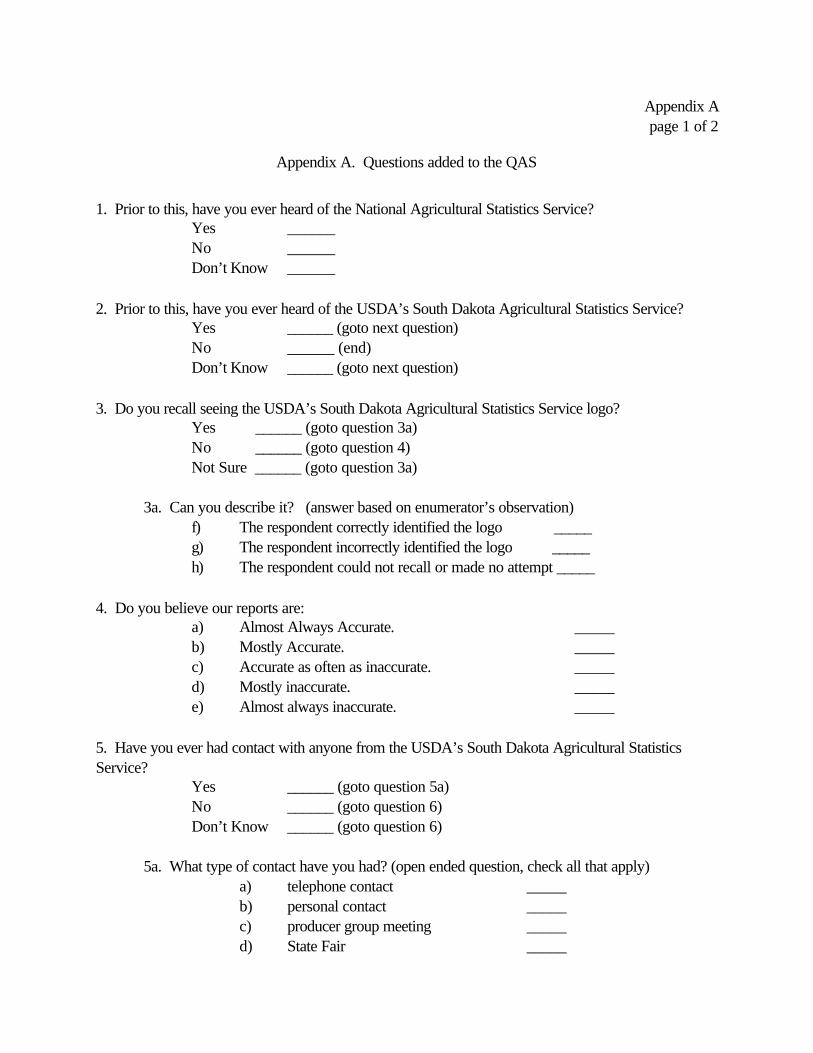
size. The exact wording of the questions appears in Appendix A.
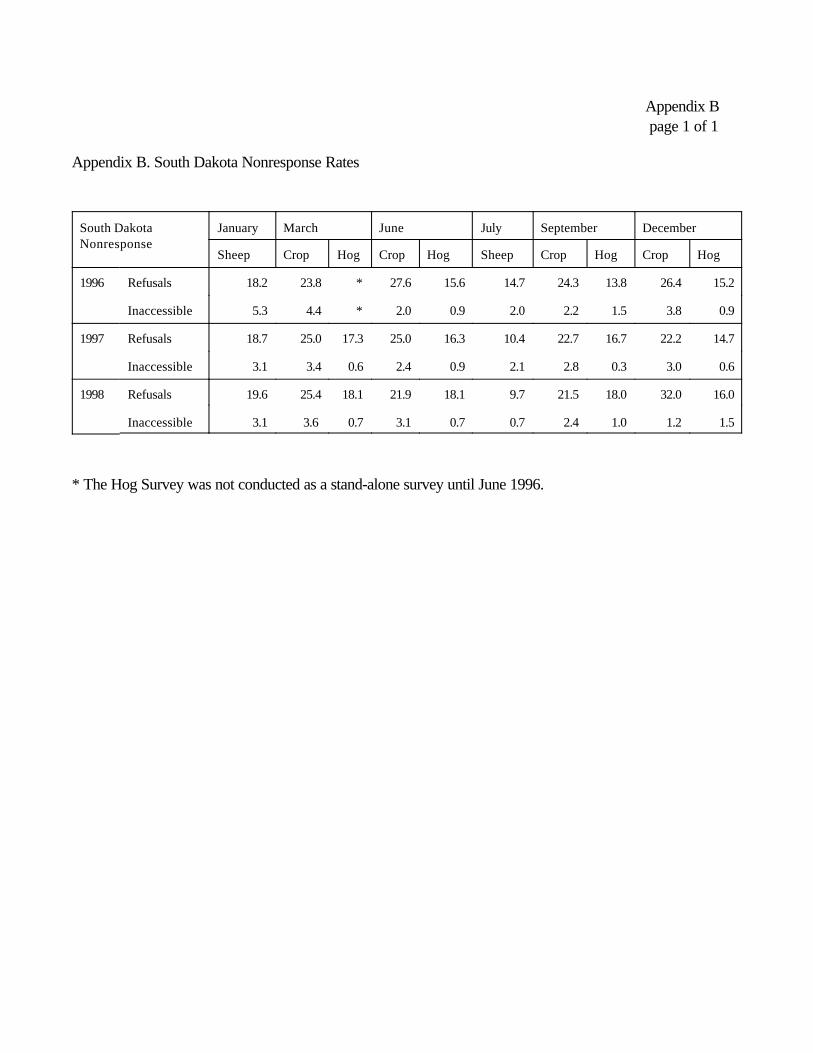
We decided to focus on one state, South Dakota, because they have historically had relatively
high non-response rates for both crop and livestock surveys. South Dakota non-response rates for
1996, 1997, and 1998 are shown in Appendix B. During 1998, South Dakota had approximately
27% of their QAS sample respondents refuse to provide survey data, and about 2-3% were never
contacted.
Beginning in June 1998, at the end of the operational questionnaire, we added a series of
questions designed to measure sampled operations familiarity with our agency and what we do, and
their opinion of our work. Questions were asked of all sampled operations, both those who did and
did not provide survey data. Surprisingly, many operators who would not provide survey data would
answer these questions.
Except where noted, the differences between cooperators and refusals are the same for
different types and sizes of farms.
3. Results
3.1 Awareness of NASS
In order to have an opinion of NASS, potential respondents must first know who we are. To
assess whether cooperators and refusals were even aware of NASS and its work, two different
questions were asked. Each quarter, all operations were asked,
“Prior to this interview, had you ever heard of the National Agricultural Statistics Service?”, and
“Prior to this interview, had you ever heard of USDA’s South Dakota Agricultural Statistics
Service?”
We asked for awareness of both the national office and the state office because interviewers
are instructed to identify themselves from USDA’s South Dakota Agricultural Statistics Service.
Publications and survey statistics could be identified this way, as National Agricultural Statistics Service,
or as USDA.
The percent of people answering Yes, Don’t Know, and No is shown below in Tables 1 and 2
(all quarters combined).
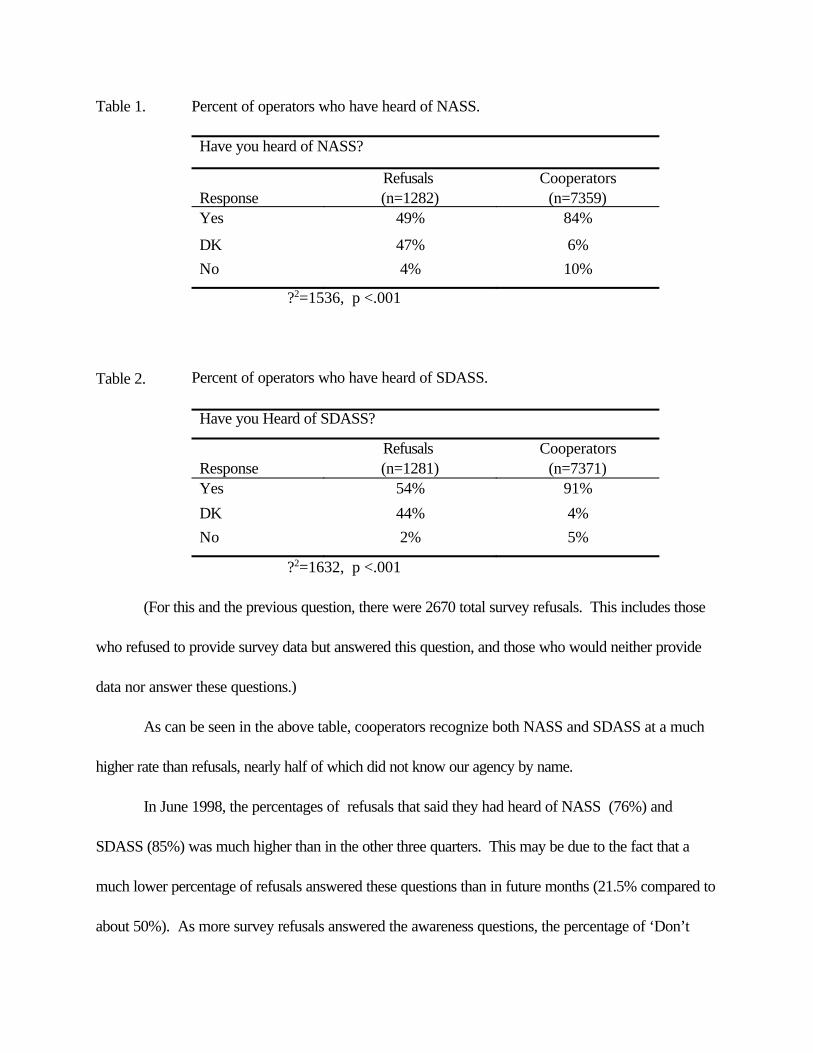
Table 1. Percent of operators who have heard of NASS.
Have you heard of NASS?
ResponseRefusals (n=1282)
Cooperators(n=7359)
Yes 49% 84%
DK 47% 6%No 4% 10%
?2=1536, p <.001
Table 2. Percent of operators who have heard of SDASS.
Have you Heard of SDASS?
ResponseRefusals (n=1281)
Cooperators(n=7371)
Yes 54% 91%
DK 44% 4%No 2% 5%
?2=1632, p <.001
(For this and the previous question, there were 2670 total survey refusals. This includes those
who refused to provide survey data but answered this question, and those who would neither provide
data nor answer these questions.)
As can be seen in the above table, cooperators recognize both NASS and SDASS at a much
higher rate than refusals, nearly half of which did not know our agency by name.
In June 1998, the percentages of refusals that said they had heard of NASS (76%) and
SDASS (85%) was much higher than in the other three quarters. This may be due to the fact that a
much lower percentage of refusals answered these questions than in future months (21.5% compared to
about 50%). As more survey refusals answered the awareness questions, the percentage of ‘Don’t
Know’ and ‘No’ answers increased. It is unclear why so many more refusals agreed to answer these
questions in later months, but it could be interviewer training and comfort with the procedures and
questions.
It appears that livestock survey refusals recognize NASS and SDASS more often than crop
survey refusals (Hogs: NASS 94%, SDASS 97%, Crops: NASS 54%, SDASS 60%). In fact,
livestock operators overall recognized NASS and SDASS more often than crop operators. It is
unclear why this would be the case, and we will continue to track this in upcoming quarters.
The largest farmers (classified as 4000+ Cattle, 300+ Dairy, 1000+ Cattle on Feed, 3500+
Sheep, 10000+ acres of Cropland, 500K+ bushels of grain storage capacity, 7000+ Hogs) recognized
NASS and SDASS at a higher rate than smaller farms, with 100% of the larger cattle on feed, cattle,
and crop farms recognizing NASS and SDASS. This held constant for all quarters.
During each quarter, two new questions were also asked in addition to these. The two
additional questions changed throughout the year. These questions fell into two areas, familiarity and
knowledge of NASS, and opinions of NASS and its work. (These questions were not asked of
anyone who indicated they had never heard of NASS or SDASS before).
3.2. Familiarity and Knowledge of NASS
The first group of questions addressed operator familiarity and knowledge of NASS. These
questions addressed whether the operator recalled NASS contact, could describe what we do, or
recalled seeing our logo. For each question, there is a table showing the percentage of refusals and
cooperators who gave each response.

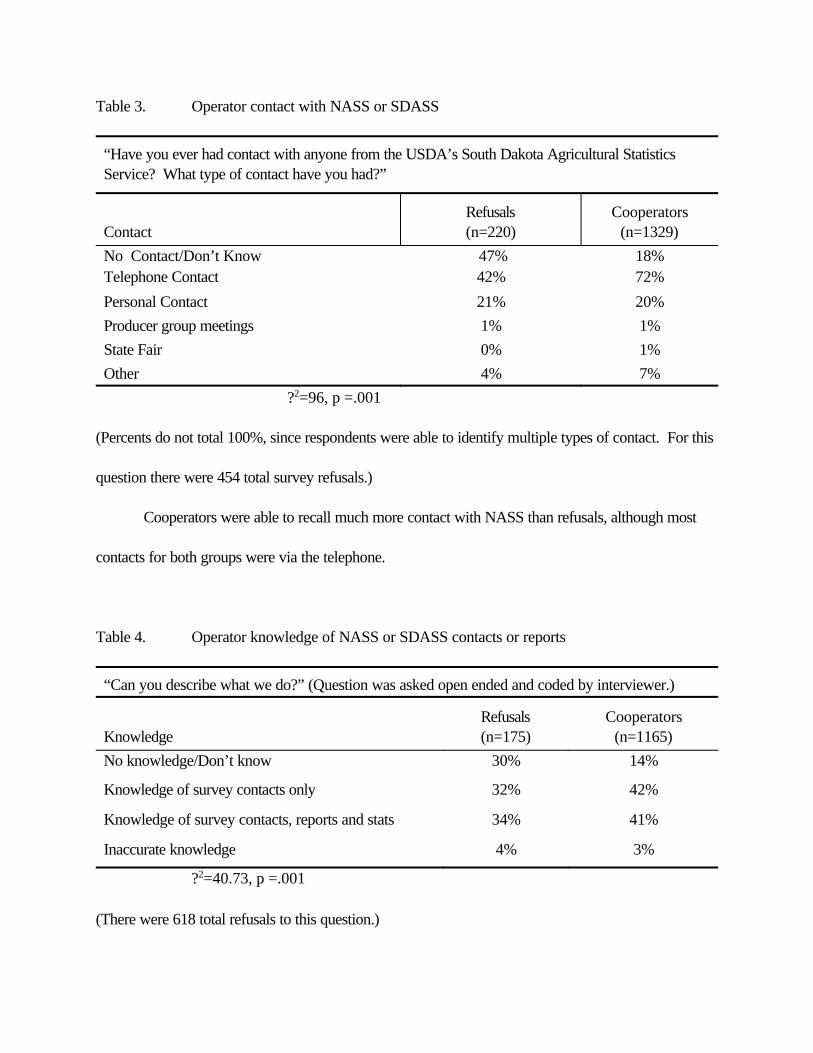
Table 3. Operator contact with NASS or SDASS
“Have you ever had contact with anyone from the USDA’s South Dakota Agricultural StatisticsService? What type of contact have you had?”
ContactRefusals(n=220)
Cooperators(n=1329)
No Contact/Don’t Know 47% 18%Telephone Contact 42% 72%
Personal Contact 21% 20%Producer group meetings 1% 1%State Fair 0% 1%Other 4% 7%
?2=96, p =.001
(Percents do not total 100%, since respondents were able to identify multiple types of contact. For this
question there were 454 total survey refusals.)
Cooperators were able to recall much more contact with NASS than refusals, although most
contacts for both groups were via the telephone.
Table 4. Operator knowledge of NASS or SDASS contacts or reports
“Can you describe what we do?” (Question was asked open ended and coded by interviewer.)
KnowledgeRefusals(n=175)
Cooperators(n=1165)
No knowledge/Don’t know 30% 14%
Knowledge of survey contacts only 32% 42%
Knowledge of survey contacts, reports and stats 34% 41%
Inaccurate knowledge 4% 3%
?2=40.73, p =.001
(There were 618 total refusals to this question.)
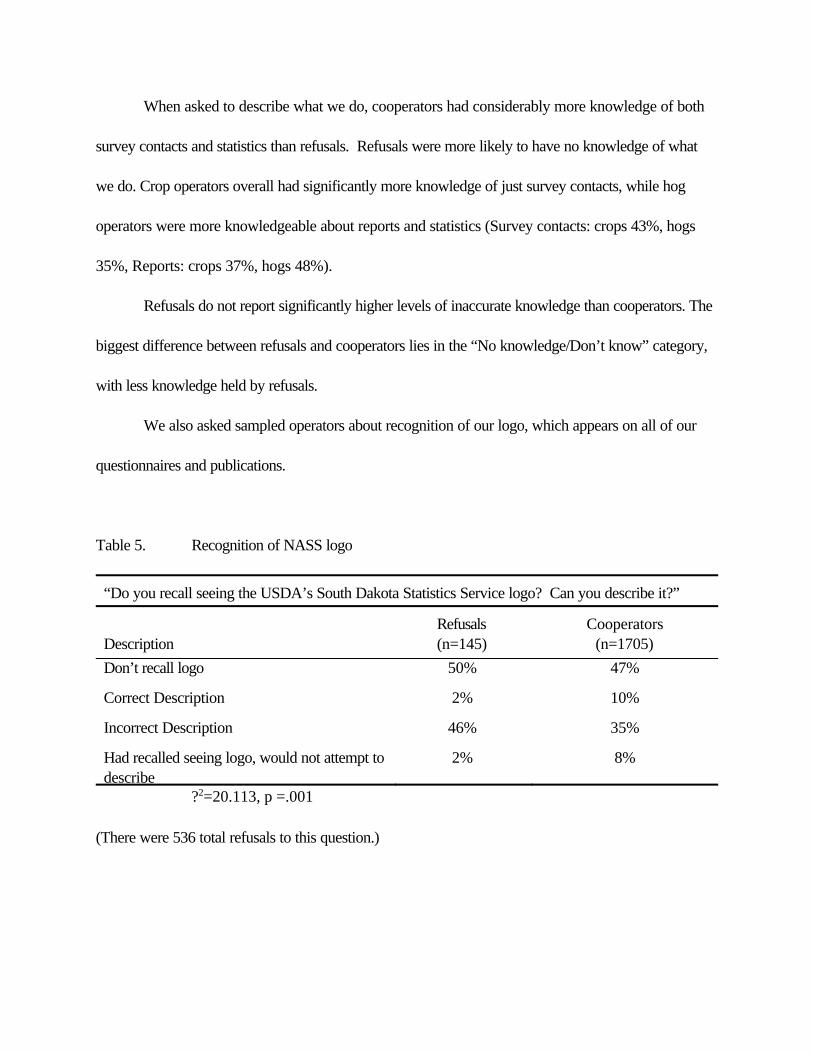
When asked to describe what we do, cooperators had considerably more knowledge of both
survey contacts and statistics than refusals. Refusals were more likely to have no knowledge of what
we do. Crop operators overall had significantly more knowledge of just survey contacts, while hog
operators were more knowledgeable about reports and statistics (Survey contacts: crops 43%, hogs
35%, Reports: crops 37%, hogs 48%).
Refusals do not report significantly higher levels of inaccurate knowledge than cooperators. The
biggest difference between refusals and cooperators lies in the “No knowledge/Don’t know” category,
with less knowledge held by refusals.
We also asked sampled operators about recognition of our logo, which appears on all of our
questionnaires and publications.
Table 5. Recognition of NASS logo
“Do you recall seeing the USDA’s South Dakota Statistics Service logo? Can you describe it?”
DescriptionRefusals(n=145)
Cooperators(n=1705)
Don’t recall logo 50% 47%
Correct Description 2% 10%
Incorrect Description 46% 35%
Had recalled seeing logo, would not attempt todescribe
2% 8%
?2=20.113, p =.001
(There were 536 total refusals to this question.)
Large numbers of both refusals and cooperators did not recall ever seeing the logo, even
though questionnaires or letters (with the logo) are routinely mailed out prior to data collection contacts.
Those who said they had seen it were far more likely to describe something other than our logo,
particularly refusals. Clearly, our logo is not serving to readily identify us as the survey sponsor. During
the past few months, NASS has changed its logo and is aggressively trying to promote it. Next year,
when we ask this question, it will reflect how well we have made the new logo recognizable and
memorable. It is important to us to distinguish ourselves from others who are requesting data. Our
pre-survey letters and releases must be recognized by the farm operators if they are to become more
aware of what we do and how we affect them.
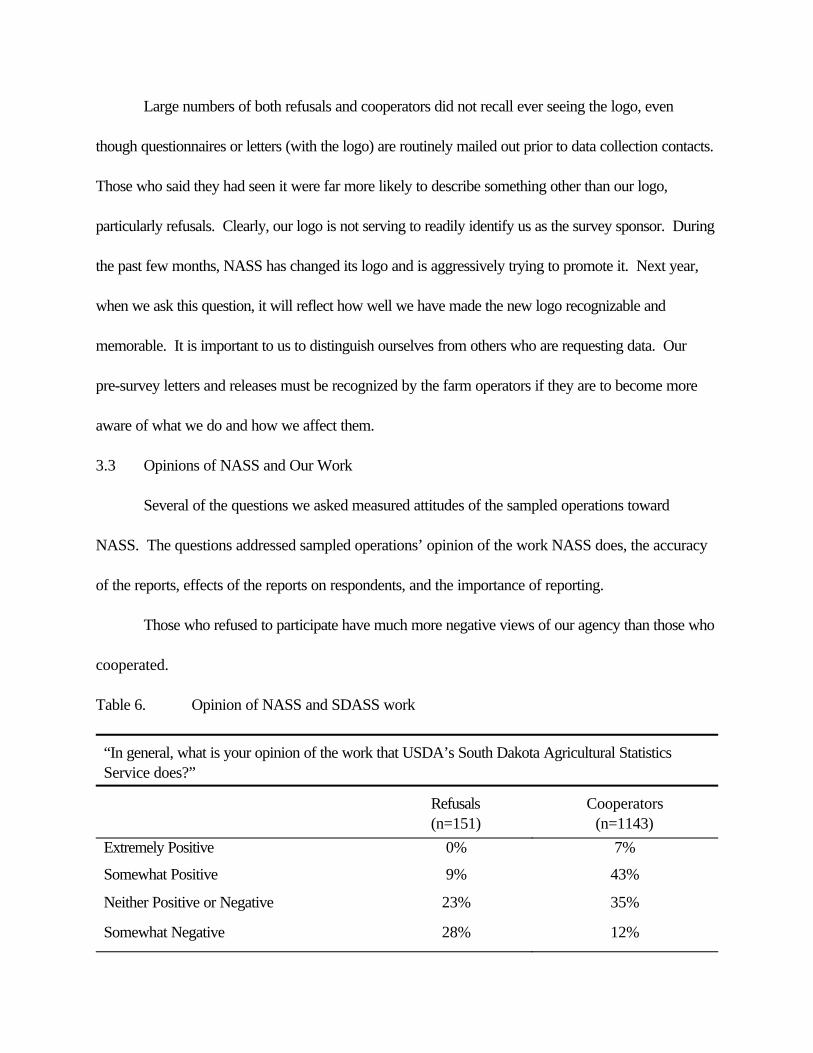
3.3 Opinions of NASS and Our Work
Several of the questions we asked measured attitudes of the sampled operations toward
NASS. The questions addressed sampled operations’ opinion of the work NASS does, the accuracy
of the reports, effects of the reports on respondents, and the importance of reporting.
Those who refused to participate have much more negative views of our agency than those who
cooperated.
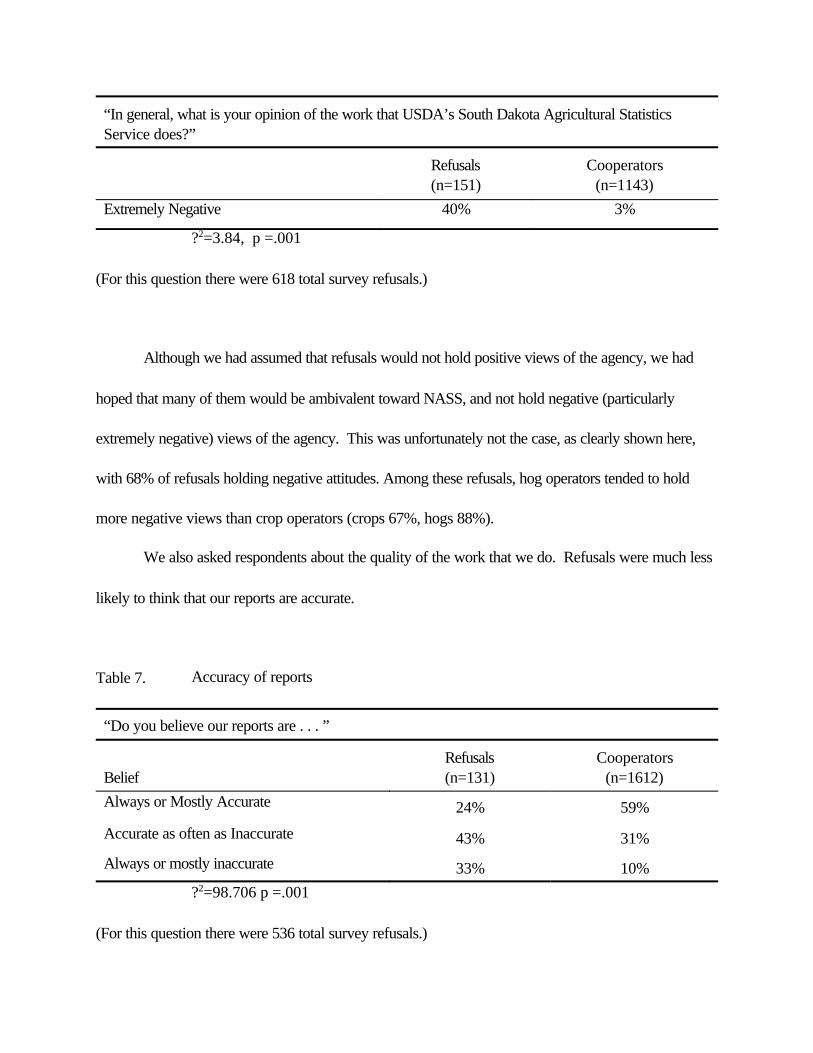
Table 6. Opinion of NASS and SDASS work
“In general, what is your opinion of the work that USDA’s South Dakota Agricultural StatisticsService does?”
Refusals(n=151)
Cooperators(n=1143)
Extremely Positive 0% 7%
Somewhat Positive 9% 43%
Neither Positive or Negative 23% 35%
Somewhat Negative 28% 12%
“In general, what is your opinion of the work that USDA’s South Dakota Agricultural StatisticsService does?”
Refusals(n=151)
Cooperators(n=1143)
Extremely Negative 40% 3%
?2=3.84, p =.001
(For this question there were 618 total survey refusals.)
Although we had assumed that refusals would not hold positive views of the agency, we had
hoped that many of them would be ambivalent toward NASS, and not hold negative (particularly
extremely negative) views of the agency. This was unfortunately not the case, as clearly shown here,
with 68% of refusals holding negative attitudes. Among these refusals, hog operators tended to hold
more negative views than crop operators (crops 67%, hogs 88%).
We also asked respondents about the quality of the work that we do. Refusals were much less
likely to think that our reports are accurate.
Table 7. Accuracy of reports
“Do you believe our reports are . . . ”
BeliefRefusals(n=131)
Cooperators(n=1612)
Always or Mostly Accurate 24% 59%
Accurate as often as Inaccurate 43% 31%
Always or mostly inaccurate 33% 10%?2=98.706 p =.001
(For this question there were 536 total survey refusals.)
We were surprised to see the amount of people, both cooperators and refusals, who did not
think our reports were accurate, something we had not expected. We do not currently have any
materials or training that address this issue. This is something that should be developed.
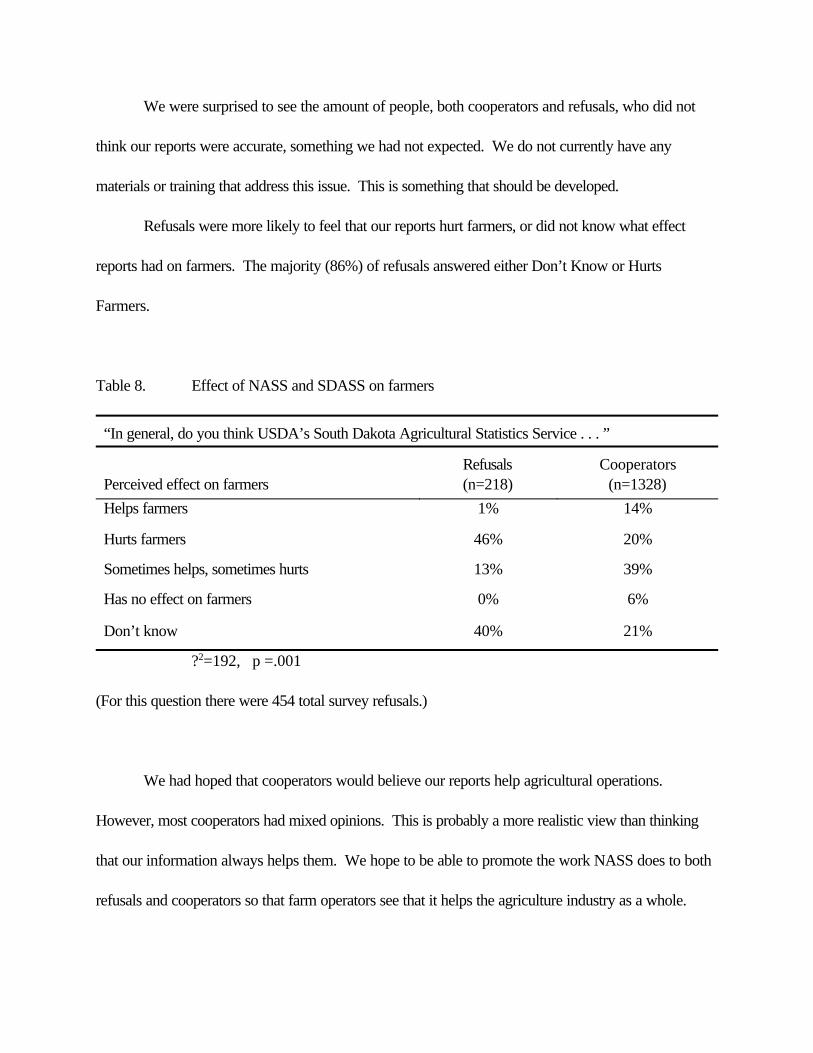
Refusals were more likely to feel that our reports hurt farmers, or did not know what effect
reports had on farmers. The majority (86%) of refusals answered either Don’t Know or Hurts
Farmers.
Table 8. Effect of NASS and SDASS on farmers
“In general, do you think USDA’s South Dakota Agricultural Statistics Service . . . ”
Perceived effect on farmersRefusals(n=218)
Cooperators(n=1328)
Helps farmers 1% 14%
Hurts farmers 46% 20%
Sometimes helps, sometimes hurts 13% 39%
Has no effect on farmers 0% 6%
Don’t know 40% 21%
?2=192, p =.001
(For this question there were 454 total survey refusals.)
We had hoped that cooperators would believe our reports help agricultural operations.
However, most cooperators had mixed opinions. This is probably a more realistic view than thinking
that our information always helps them. We hope to be able to promote the work NASS does to both
refusals and cooperators so that farm operators see that it helps the agriculture industry as a whole.

We also asked respondents about the importance of responding and providing data. Again,
opinions of refusals and cooperators were quite different.
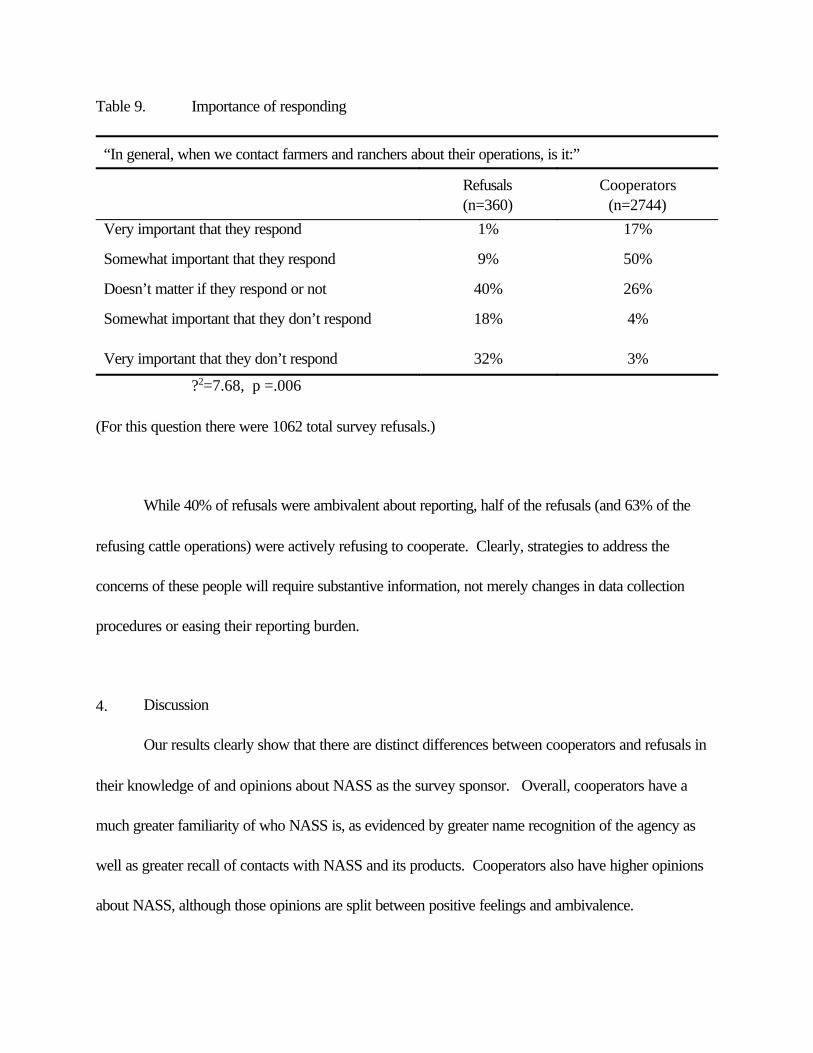
Table 9. Importance of responding
“In general, when we contact farmers and ranchers about their operations, is it:”
Refusals(n=360)
Cooperators(n=2744)
Very important that they respond 1% 17%
Somewhat important that they respond 9% 50%
Doesn’t matter if they respond or not 40% 26%
Somewhat important that they don’t respond 18% 4%
Very important that they don’t respond 32% 3%
?2=7.68, p =.006
(For this question there were 1062 total survey refusals.)
While 40% of refusals were ambivalent about reporting, half of the refusals (and 63% of the
refusing cattle operations) were actively refusing to cooperate. Clearly, strategies to address the
concerns of these people will require substantive information, not merely changes in data collection
procedures or easing their reporting burden.
4. Discussion
Our results clearly show that there are distinct differences between cooperators and refusals in
their knowledge of and opinions about NASS as the survey sponsor. Overall, cooperators have a
much greater familiarity of who NASS is, as evidenced by greater name recognition of the agency as
well as greater recall of contacts with NASS and its products. Cooperators also have higher opinions
about NASS, although those opinions are split between positive feelings and ambivalence.
The survey refusals we contacted fall into two distinct groups – those who do not recognize
NASS and do not know what we do, and those who know who NASS is, but hold very negative
views. This split is seen not just in a single question, but is evident throughout the questions we asked.
Survey managers and interviewers will need to use information about each individual refusal operation
to adequately address either their negative attitudes or lack of knowledge. (One limitation to our
findings is that only some of the survey refusals answered these questions. While we do not know what
the remaining refusals would have answered, there is little reason to suspect that they would have more
knowledge or more positive attitudes than those who answered.)
In contrast to surveys of households or the general public, establishments may more clearly see
ways in which the statistics that are the result of the surveys (and in particular Federal statistics) may
directly affect them, their industry and their livelihood. If these effects are perceived as primarily
negative, this may lead to refusal to cooperate on surveys.
Targeting all refusals in the same way will not adequately address the concerns of both groups
of refusals. For those refusals who do not recognize NASS and do not know anything about us,
cooperation may be decreasing as the number of other calls and requests for information from this
specialized subpopulation increases. Investigation of the effects of increased survey contacts by NASS
indicates that this does not lead to decreased survey cooperation (McCarthy and Beckler, 1999b).
However, NASS does not control and cannot analyze data requests made by other government
agencies, private companies and individuals. For these refusals, NASS needs to separate itself from
the other requests that are made and provide general information about the importance of providing
official NASS report data.
In general, NASS nonrespondents do not know the sponsor of the surveys or do not perceive
the work done or data produced as beneficial to them or their fellow farm operators. This is consistent
with the finding of lower household cooperation rates on the Current Population Survey, during times of
more overall negative public opinion of the government (Harris-Kojetin and Tucker, 1999). However,
our data clearly shows a correlation between an individual’s likelihood of responding and their attitudes
toward the specific government agency conducting the survey.
In addition, attitudes and opinions may be affected by the economic state of certain farms or of
farming in general. In contrast to the increased cooperation seen when public opinion of government is
positive, in household surveys, periods of relatively good economic times are associated with periods of
decreased cooperation on the Current Population Survey (Harris-Kojetin and Tucker, 1999). It may
be that during poor economic times, the public welcomes government change and is, therefore, more
willing to respond to government requests. On the other hand, during good economic times, there may
be feelings of too much government interference. Since market prices of a variety of commodities
change after the release of NASS, this same phenomenon may be occurring in agriculture surveys.
When commodity prices are high, farm operators may not see the need to cooperate with the
government, but when prices are low, they may welcome government intervention. During the time
frame when we collected this data, many commodity prices were at historic lows. Whether or not this
may have affected survey response is unknown.
In establishment surveys, uses of statistics generated from surveys and how they may impact the
establishment are more likely to be known to respondents. In addition, establishments (and particularly
large or unique establishments) are likely to be contacted repeatedly by a survey sponsor, such as a
Federal Statistical agency. This makes a respondent’s attitude and familiarity with survey sponsors
important. A respondent’s dedication to cooperate over the long term and advocate response by
others requires a belief that the repeated contacts and statistics are important and useful to them and
their industry.
5. Conclusion
When establishments contacted for a survey do not know who the sponsor of the survey is, or
do not know why the information is being collected, they may refuse to participate. In this case, the
survey request is a request for their time and effort for which they perceive little or no compensation.
Worse yet, the establishment may view the data collection as a request which actually serves to harm
them.
The first step in reducing the number of survey refusals is to find out who they are and how they
are different from survey cooperators. NASS survey refusals and cooperators appear to have similar
demographic characteristics (McCarthy and Beckler, 1999a), but they clearly differ in attitudes and
opinions toward NASS as the survey sponsor.
As stated earlier, our data show that survey refusals fall into two distinct categories. Some of
the survey refusals do not have a basic understanding of NASS, what we do, and how it may affect
them. For this group of people, more general information about NASS is appropriate. Hopefully
increasing their awareness of our agency and separating the importance of what we do from other data
requests will increase the likelihood that they will cooperate. We also found that many of the refusals
did know more about what NASS does, but held negative attitudes toward NASS, its work, and its
effect on farm operators. For these respondents, a different message is appropriate, but materials
including this message do not currently exist. Our hope is that changing these negative nonrespondents’
attitudes over time will increase cooperation and response rates.
NASS’s South Dakota field office has made efforts to increase nonrespondent awareness and
positive attitudes by using a variety of methods, including holding group meetings with nonrespondents.
In these meetings, NASS employees from the South Dakota office, as well as invited data users
increased respondent education by discussing how data is used, addressing specific concerns,
answering questions, and providing relevant materials. Although more expensive than traditional
methods of nonresponse follow-up, these methods may be more effective at changing overall attitudes
and developing positive rapport with potential long term survey participants who already hold negative
views and opinions of NASS.
We have also begun the development of some other materials to address nonresponse. For
example, an enumerator training module called “FIRE Up Response” was developed and is being used
to train field and telephone interviewers. This training program discusses methods of handling reluctant
and refusing sampled operators, including information for interviewers to use to specifically address
some of the attitudes we know nonrespondents hold. The crucial part of the training is the development
of targeted data use lists that are used to increase interviewer and respondent education about the
ways that NASS data are used that directly or indirectly benefit individual agricultural operations. It
also provided a forum for interviewer discussion and interaction regarding creative ways to deal with
refusals.
Development and testing of targeted materials (and ways to deliver them to potential
respondents) which contain information written to specifically address now known respondent concerns
and negative attitudes are also being developed. This includes letters, brochures, additional personal
contacts to develop rapport between interviewers and farm operators, and media advertisements.
Potential survey respondents’ opinions about NASS are clearly correlated with their
cooperativeness on the surveys we conduct. Other survey organizations should be aware of what their
population of interest knows about them and whether they are perceived positively or negatively. This
may have a substantial impact on whether or not an individual agrees to participate and provide
information. Survey organizations should also prepare interviewers to use the survey sponsorship as a
tool to solicit cooperation – and ideally, to use it differently for individuals with different knowledge or
opinions about the survey sponsor.
Our hope is that changing nonrespondents’ opinions about NASS as the survey sponsor will
also change their willingness to cooperate on our surveys. As we implement use of new materials we
will also continue tracking response rates, agricultural operators knowledge, and opinions of NASS.
References
Bates, N. and Buckley, S. (1999). Reported Exposure to Paid Advertising and Likelihood of
Returning a Census Form. Proceedings of the 1999 Annual Conference of the American Association
for Public Opinion Research, Alexandria, VA:American Statistical Association.
Brunner, G. and Carroll, S. (1969). The Effect of Prior Notification on the Refusal Rate in Fixed
Address Surveys. Journal of Marketing Research, 9, 42-44.
Fay, R., Bates, N. and Moore, J. (1991). Lower Mail Response in the 1990 Census: A Preliminary
Interpretation. Proceedings of the Bureau of the Census Annual Research Conference. Washington
DC: U.S. Bureau of the Census, 3-32.
Frankel, J. and Sharp, L. (1981). Measurement of Respondent Burden: Summary of Study Design and
Early Findings. Statistical Reporter, 81(4), 105-111.
Goyder, J. (1986). Surveys on Surveys: Limitations and Potentialities. Public Opinion Quarterly, 50,
27-41.
Groves, R., Cialdini, R. and Couper, M. (1992). Understanding the Decision to Participate in a Survey.
Public Opinion Quarterly, 56(4), 475-495.
Groves, R. and Couper, M. (1998). Nonresponse in Household Interview Surveys. New York:J.
Wiley and Sons, Inc.
Harris-Kojetin, B. and Tucker, C. (1999). Exploring the Relation of Economic and Political
Conditions with Refusal Rates to a Government Survey. Journal of Official Statistics, 15(2), 167-184.
Heberlein, T. and Baumgartner, R. (1978). Factors Affecting Response Rates to Mailed
Questionnaires: A Qualitative Analysis of the Published Literature. American Sociological Review,
43(4), 447-461.
Interagency Group on Establishment Nonresponse (1999). Establishment Nonresponse: Revisiting the
Issues and Looking into the Future. Statistical Policy Working Paper 28, Seminar on Interagency
Coordination and Cooperation, Office of Management and Budget, NTIS Document PB99-132029,
181-227.
Jones, C., Sheatsley, P. and Stinchcombe, A. (1979). Dakota Farmers and Ranchers Evaluate Crop
and Livestock Surveys. National Opinion Research Center Report No. 128, Chicago:National
Opinion Research Center.
McCarthy, J. and Beckler, D. (1999a). Non-response in Agriculture Establishment Surveys:
Describing, Evaluating and Implications for Data Collection and Non-response Adjustment. Paper
presented at the 1999 Annual Conference of the American Association for Public Opinion Research.
McCarthy, J. S. and Beckler, D. (1999b). An Analysis of the Relationship Between Survey Burden
and Nonresponse: If we bother them more are they less cooperative? Paper presented at the
International Conference on Survey Non-response, Portland, Oregon.
O’Connor, T. (1991). Identifying and Classifying Reasons for Nonresponse on the 1990 Farm Costs
and Returns Survey. SRB Research Report SRB-91-11, National Agricultural Statistics Service, US
Department of Agriculture.
O’Connor, T. (1992). Identifying and Classifying Reasons for Nonresponse on the 1991 Farm Costs
and Returns Survey. SRB Research Report SRB-92-10, National Agricultural Statistics Service, US
Department of Agriculture.
Presser, S., Blair, J. and Triplett, T. (1992). Survey Sponsorship, Response Rates, and Response
Effects. Social Science Quarterly, 73(3), 699-702.
Remington, T. (1992). Telemarketing and Declining Survey Response Rates. Journal of Advertising
Research, 32, RC-6 - RC7.
Singer, E., Mathiowetz, N. and Couper, M. (1993). Privacy, Confidentiality, and the 1990 U.S.
Census. Public Opinion Quarterly, 57(4), 465-482.

Snijkers, G., Hox, J., and de Leeuw, E. (1999) . Interviewers’ Tactics for Fighting Survey
Nonresponse. Journal of Official Statistics, 15(2), 185-198.
Appendix Apage 1 of 2
Appendix A. Questions added to the QAS
1. Prior to this, have you ever heard of the National Agricultural Statistics Service?Yes ______ No ______ Don’t Know ______
2. Prior to this, have you ever heard of the USDA’s South Dakota Agricultural Statistics Service?Yes ______ (goto next question)No ______ (end)Don’t Know ______ (goto next question)
3. Do you recall seeing the USDA’s South Dakota Agricultural Statistics Service logo?Yes ______ (goto question 3a)No ______ (goto question 4)Not Sure ______ (goto question 3a)
3a. Can you describe it? (answer based on enumerator’s observation)f) The respondent correctly identified the logo _____g) The respondent incorrectly identified the logo _____h) The respondent could not recall or made no attempt _____
4. Do you believe our reports are:a) Almost Always Accurate. _____b) Mostly Accurate. _____c) Accurate as often as inaccurate. _____ d) Mostly inaccurate. _____e) Almost always inaccurate. _____
5. Have you ever had contact with anyone from the USDA’s South Dakota Agricultural StatisticsService?
Yes ______ (goto question 5a)No ______ (goto question 6)Don’t Know ______ (goto question 6)
5a. What type of contact have you had? (open ended question, check all that apply)a) telephone contact _____b) personal contact _____c) producer group meeting _____
d) State Fair _____
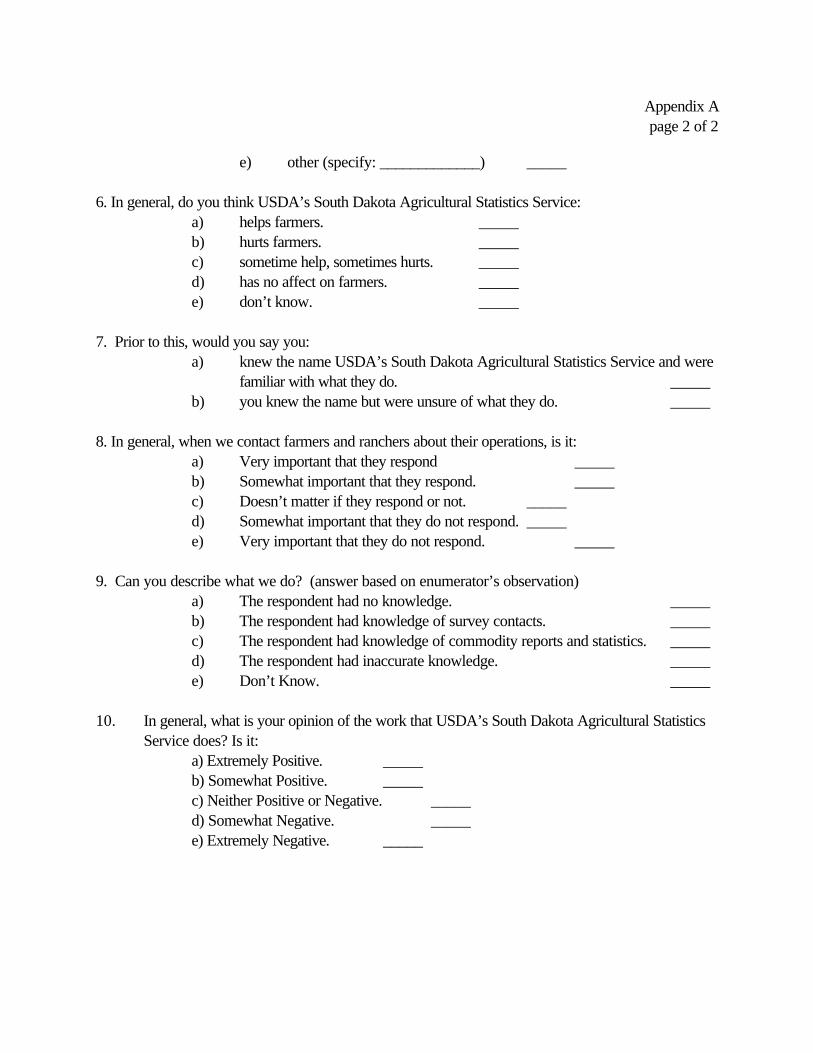
Appendix Apage 2 of 2
e) other (specify: _____________) _____
6. In general, do you think USDA’s South Dakota Agricultural Statistics Service:a) helps farmers. _____b) hurts farmers. _____c) sometime help, sometimes hurts. _____d) has no affect on farmers. _____e) don’t know. _____
7. Prior to this, would you say you:a) knew the name USDA’s South Dakota Agricultural Statistics Service and were
familiar with what they do. _____b) you knew the name but were unsure of what they do. _____
8. In general, when we contact farmers and ranchers about their operations, is it:a) Very important that they respond _____b) Somewhat important that they respond. _____c) Doesn’t matter if they respond or not. _____d) Somewhat important that they do not respond. _____e) Very important that they do not respond. _____
9. Can you describe what we do? (answer based on enumerator’s observation)a) The respondent had no knowledge. _____b) The respondent had knowledge of survey contacts. _____c) The respondent had knowledge of commodity reports and statistics. _____d) The respondent had inaccurate knowledge. _____e) Don’t Know. _____
10. In general, what is your opinion of the work that USDA’s South Dakota Agricultural StatisticsService does? Is it:
a) Extremely Positive. _____b) Somewhat Positive. _____c) Neither Positive or Negative. _____d) Somewhat Negative. _____e) Extremely Negative. _____
Appendix Bpage 1 of 1
Appendix B. South Dakota Nonresponse Rates
South DakotaNonresponse
January March June July September December
Sheep Crop Hog Crop Hog Sheep Crop Hog Crop Hog
1996 Refusals 18.2 23.8 * 27.6 15.6 14.7 24.3 13.8 26.4 15.2
Inaccessible 5.3 4.4 * 2.0 0.9 2.0 2.2 1.5 3.8 0.9
1997 Refusals 18.7 25.0 17.3 25.0 16.3 10.4 22.7 16.7 22.2 14.7
Inaccessible 3.1 3.4 0.6 2.4 0.9 2.1 2.8 0.3 3.0 0.6
1998 Refusals 19.6 25.4 18.1 21.9 18.1 9.7 21.5 18.0 32.0 16.0
Inaccessible 3.1 3.6 0.7 3.1 0.7 0.7 2.4 1.0 1.2 1.5
* The Hog Survey was not conducted as a stand-alone survey until June 1996.