Embed Size (px)
Citation preview

ACKNOWLEDGMENTS PENNDOT DISTRICT 1-0 NORTHWEST PENNSYLVANIA REGIONAL CITY OF OIL CITY
PLANNING & DEVELOPMENT COMMISSION 255 Elm Street 395 Seneca Street 21 Seneca Street PO Box 398 PO Box 1127 Oil City, PA 16301 Oil City, PA 16301 Oil City, PA 16301 Phone: 814.678.7006 Phone: 814.677.7663 Phone: 814.678.3012 www.dot.state.pa.us www.nwcommission.org www.oilcity.org PROJECT STEERING COMMITTEE: City of Oil City - Christina Sporer, City Engineer Ryan Eggleston, City Manager Jan Ruditis Northwest Commission - Sue Smith PA Department of Transportation - Erin Wiley Moyers Randy Brink Susan Roach Venango County - Judy Downs Council on Greenway & Trails - Debra Frawley South Side Business Association - Brian Stoltenburg Oil Valley Chapter of the PA Council of the Blind - Scott Roberts Don Fischer PROJECT FUNDING: The completion of the Route 62 Smart Transportation Study was funded through Pennsylvania Department of Transportation’s Pennsylvania Community Transportation Initiative (PCTI) aimed to promote Smart Transportation solutions throughout the commonwealth of Pennsylvania. PROJECT CONSULTANTS: Johnson, Mirmiran & Thompson, Inc. Traffic Planning and Design, Inc.
1550 Coraopolis Heights Road Regional Enterprise Tower Suite 440 425 Sixth Avenue Moon Township, PA 15108 Suite 2825 Pittsburgh, PA 15219 Phone: 412.375.5100 Phone: 412.765.3717 www.jmt.com www.trafficpd.com
Route 62 Smart Transportation Corridor StudyFinal Report October 2010
P a g e | i
Table of Contents Section 1.0 Introduction ............................................................................................................................... 1
Section 1.1 Plan Purpose ........................................................................................................................... 1
Section 1.2 Planning Process..................................................................................................................... 2
Section 2.0 Vision, Goals & Objectives ......................................................................................................... 5
Section 2.1 Vision ...................................................................................................................................... 5
Section 2.2 Strengths, Weaknesses, Opportunities & Threats (SWOT) .................................................... 6
Section 2.3 Goal Setting ............................................................................................................................ 7
Section 2.4 Formulating Strategies ........................................................................................................... 8
Section 2.4.1 Smart Transportation ...................................................................................................... 8
Section 3.0 Existing Conditions ................................................................................................................... 11
Section 3.1 Study Area Conditions .......................................................................................................... 11
Section 3.1.1 Transportation Facilities ................................................................................................ 11
Section 3.1.2 Parking ........................................................................................................................... 11
Section 3.2 Traffic Operations................................................................................................................. 15
Section 3.2.1 Traffic Count Data Summary ......................................................................................... 15
Section 3.2.2 Future Traffic Projections .............................................................................................. 15
Section 3.2.3 Safety Analysis ............................................................................................................... 21
Section 3.2.4 Traffic Signals ................................................................................................................ 21
Section 3.2.5 Traffic Analysis .............................................................................................................. 22
Section 3.2.6 Access Management ..................................................................................................... 24
Section 3.2.7 Transit............................................................................................................................ 25
Section 3.3 Existing Land Use .................................................................................................................. 25
Section 3.3.1 Northern Venango County Multi-Municipal Regional Plan .......................................... 29
Section 3.4 Open Space and Greenways................................................................................................. 31
Section 3.4.1 Venango County Greenways Plan ................................................................................. 31
Section 3.4.2 Oil City Comprehensive Waterways Plan ...................................................................... 32
Section 4.0 Analysis of Improvement Options and Solutions ..................................................................... 35
Section 4.1 Front Street (Route 62) Corridor .......................................................................................... 35
Section 4.2 Streetscape Improvements .................................................................................................. 38
Section 4.3 Access Management ............................................................................................................ 39
Section 4.4 Traffic Signalization Plan ...................................................................................................... 41
Section 4.5 Wye Bridge Improvements .................................................................................................. 43
Section 4.6 Greenway / Trail ................................................................................................................... 44
Route 62 Smart Transportation Corridor StudyFinal Report October 2010
P a g e | ii
Section 4.7 Public Plaza ........................................................................................................................... 45
Section 4.8 Land Use and Economic Development Opportunities ......................................................... 46
Section 4.8.1 Methods for Determining a Balanced Mix of Uses ....................................................... 46
Section 4.8.2 Assessing Building and Business Inventory ................................................................... 46
Section 4.8.3 Business Community SWOT Analysis and Visual Preference Survey ............................ 47
Section 4.8.4 Analyzing the Business Mix using a Gap Analysis ......................................................... 47
Section 4.8.5 Analyzing Local Characteristics ..................................................................................... 49
Section 4.8.6 Revitalization Strategies ................................................................................................ 49
Section 4.9 South Side Business District Revitalization Concepts ........................................................... 53
Section 5.0 Action Plan ............................................................................................................................... 69
Section 5.1 Project Prioritization and Implementation .......................................................................... 69
Appendix A: Community Participation Report
Appendix B: Traffic Count Data
Appendix C: Future Traffic Projections
Appendix D: Traffic Signal Inventory
Appendix E: Synchro HCM Reports
Appendix F: Funding Analysis
Appendix G: GAP Analysis
Appendix H: Access Management
Appendix I: Traffic Signal Warrant Analyses
Section 1
Route 62 Smart Transportation Corridor StudyFinal Report October 2010
P a g e | 1
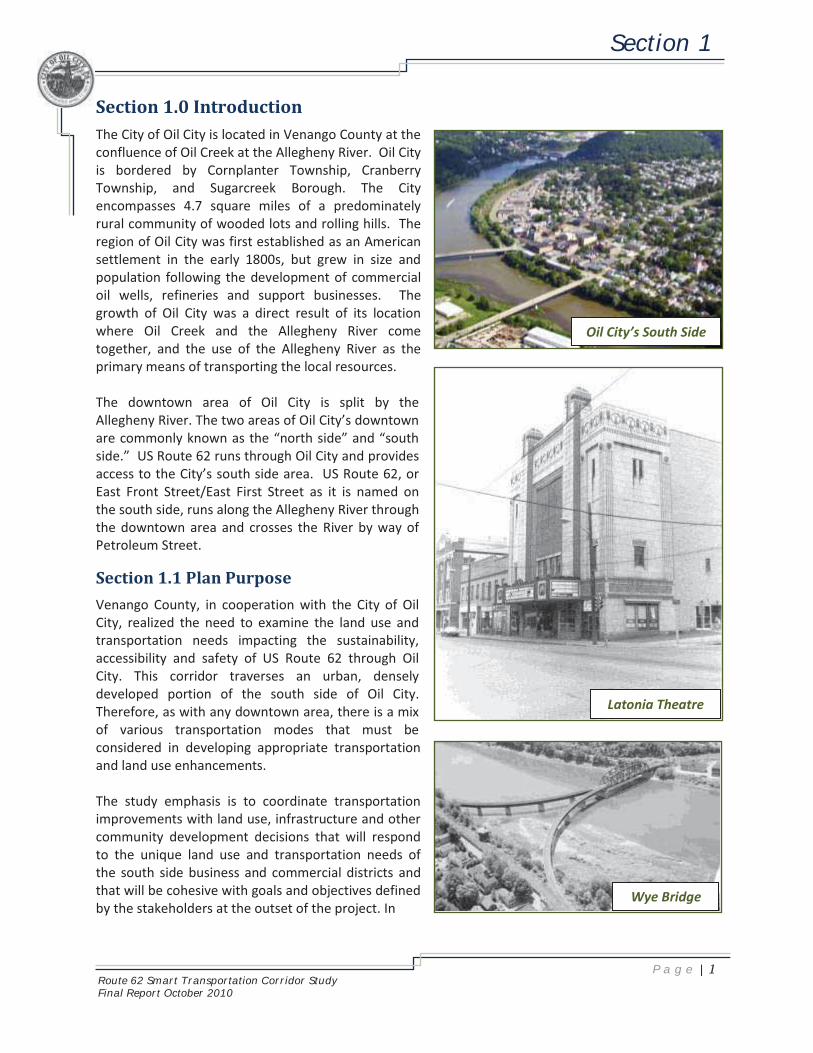
Section 1.0 Introduction The City of Oil City is located in Venango County at the confluence of Oil Creek at the Allegheny River. Oil City is bordered by Cornplanter Township, Cranberry Township, and Sugarcreek Borough. The City encompasses 4.7 square miles of a predominately rural community of wooded lots and rolling hills. The region of Oil City was first established as an American settlement in the early 1800s, but grew in size and population following the development of commercial oil wells, refineries and support businesses. The growth of Oil City was a direct result of its location where Oil Creek and the Allegheny River come together, and the use of the Allegheny River as the primary means of transporting the local resources. The downtown area of Oil City is split by the Allegheny River. The two areas of Oil City’s downtown are commonly known as the “north side” and “south side.” US Route 62 runs through Oil City and provides access to the City’s south side area. US Route 62, or East Front Street/East First Street as it is named on the south side, runs along the Allegheny River through the downtown area and crosses the River by way of Petroleum Street.
Section 1.1 Plan Purpose
Venango County, in cooperation with the City of Oil City, realized the need to examine the land use and transportation needs impacting the sustainability, accessibility and safety of US Route 62 through Oil City. This corridor traverses an urban, densely developed portion of the south side of Oil City. Therefore, as with any downtown area, there is a mix of various transportation modes that must be considered in developing appropriate transportation and land use enhancements. The study emphasis is to coordinate transportation improvements with land use, infrastructure and other community development decisions that will respond to the unique land use and transportation needs of the south side business and commercial districts and that will be cohesive with goals and objectives defined by the stakeholders at the outset of the project. In
Oil City’s South Side
Latonia Theatre
Wye Bridge
Section 1
Route 62 Smart Transportation Corridor StudyFinal Report October 2010
P a g e | 2
2005, Hickory Engineering (a Herbert, Rowland & Grubic, Inc. Company) prepared a “Route 8 and Route 62 Corridor Evaluation” under contract with the Oil Region Alliance and the municipalities of the City of Oil City, Cornplanter Township, City of Franklin, Sugarcreek Borough, and Rouseville Borough. This study generated (a) a database of all buildings, land parcels, and properties along Routes 8 and/or 62 in the subject governmental entities; (b) detailed building condition reports and adaptive use/reuse plans for 13 sample buildings throughout the corridor; (c) riverfront access and recreation development recommendations; and (d) policy/planning recommendations to showcase these highways which in essence function as the Main Street of the heart of Venango County, Pennsylvania. The City of Oil City has also undertaken a Comprehensive Waterways Plan to address the waterways assets running through the City and capitalizing on them to improve the quality of life for residents and to promote economic development and increased tourism. The Route 62 Smart Transportation Study will coordinate with these and other efforts so that the recommendations of this study will complement and work with these other studies to reach the overall goals of the City. The transportation recommendations and land use decisions along the US Route 62 Corridor are important to the overall transportation network and future economic growth of Oil City.
Section 1.2 Planning Process
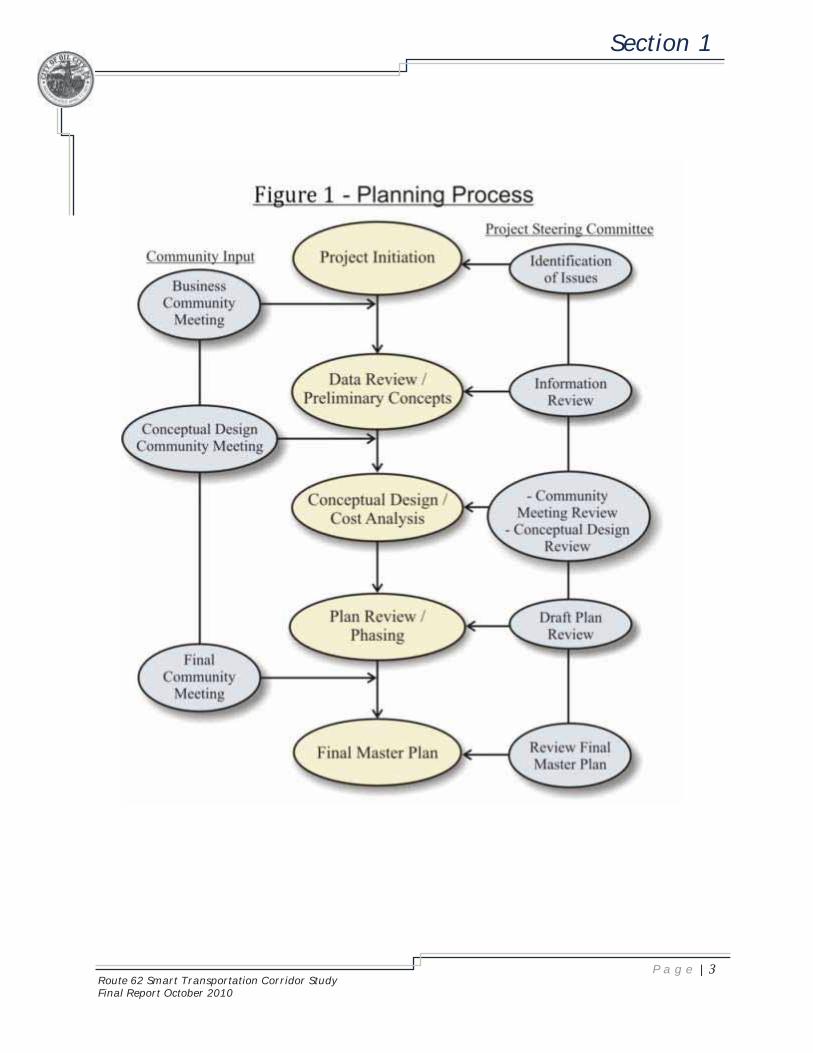
The process for developing the US Route 62 Corridor Plan was based on a collaborative planning effort focused on gaining an understanding of the community’s vision for the study area. Several key parties were involved through discussions about the project and initiatives to assist in developing an understanding of future growth in the area. The project Steering Committee included representatives from the City of Oil City, Northwest Pennsylvania Regional Planning and Development Commission (NWPRPDC), PennDOT District 1-0, Venango County Regional Planning Commission, South Side Business Association, and other key stakeholders. The planning process also included coordination with the general public to assist with the development of future plans for the project study area. Documentation of the planning process is contained in Appendix A: Community Participation Report.
Section 1
Route 62 Smart Transportation Corridor StudyFinal Report October 2010
P a g e | 3
Section 2
Route 62 Smart Transportation Corridor StudyFinal Report October 2010
P a g e | 4
THIS PAGE INTENTIONALLY LEFT BLANK
Section 2
Route 62 Smart Transportation Corridor StudyFinal Report October 2010
P a g e | 5
Section 2.0 Vision, Goals & Objectives The Vision for the study corridor, including its goals, objectives, implementation concepts and strategies, creates the foundation that guides future transportation enhancements, development and redevelopment/revitalization projects. Such strategies and future development policies are created through a collaborative step-by-step planning process used to create a Vision for the Corridor. The planning process for the Route 62 Corridor Study followed these steps for strategic vision planning:
Step 1: Vision - Define the vision and set a strategy containing a hierarchy of goals. Step 2: SWOT - Analysis conducted to understand a community’s “perceived” issues and
assets (conducted at first public forum). Step 3: Goal Setting – Prepare measurable, meaningful, and attainable goals based on
community sustainability indicators (business meeting, first public meeting, committee meetings).
Step 4: Formulate Strategies - Formulate actions and processes to be taken to attain these goals (Map your Path).
Section 2.1 Vision
An initial Vision Statement was prepared using key words identified by the project’s Steering Committee at the kick-off meeting. Committee members were asked: What key words would you use to describe the future corridor?
Key Words Development / Re-Development Smart Transportation Implementation Strategy Pedestrian Safety Vehicular Safety River Access Improved Sight Distance Aesthetically Pleasing Accessible Sustainable
A second draft of the Vision Statement was prepared and finalized after the first public meeting. The following is the statement refined through the planning process, and accepted as a Vision for the corridor:
Corridor Vision Statement Enhance the Route 62 Corridor within Oil City to be a model of PennDOT's Smart Transportation initiative by coordinating transportation improvements with land use, infrastructure, economic development and community revitalization. Implementation strategies and community revitalization projects will strengthen a sense of place and establish safe, inviting, aesthetically pleasing and sustainable commercial and residential neighborhoods within the South Side Business District. Transportation improvements will address vehicular, transit, bicycle and pedestrian safety, accessibility and mobility. Improvements will enhance the Corridor and other streets to provide connections to and from residential and commercial neighborhoods and the waterfront for all modes of transportation. Transportation improvements will provide an opportunity for renewed development within and around the Corridor, continued community growth and a variety of amenities which establish this area as a unique place attracting residents, businesses and visitors.
Section 2
Route 62 Smart Transportation Corridor StudyFinal Report October 2010
P a g e | 6
INTERNAL FACTORS - Factors that can be influenced by residents, local businesses, and municipal and county government. (Strengths & Weaknesses)
EXTERNAL FACTORS - Factors that are influenced by private property owners, developers, adjacent state and county regulatory mandates, market conditions and other factors. (Opportunities & Threats)
Section 2.2 Strengths, Weaknesses, Opportunities & Threats (SWOT)
The purpose of the SWOT (Strengths, Weaknesses, Opportunities & Threats) activity was to provide an opportunity for residents, business owners and other key stakeholders to identify the community’s assets or strengths and opportunities as well as weaknesses and threats. The planning process for the Route 62 Corridor included a two-part process. The initial step involved obtaining thoughts on the area’s strengths, weaknesses, opportunities and threats from the Project Steering Committee and the South Side Business Association. The following identifies the framework for the SWOT activity as it was conducted with the two groups.
STRENGTHS (S) – List the physical, social and regulatory assets within the region or your community.
What makes this region or your community unique? What do I like about this region or your community? What is contributing to a positive image in the region or your community?
WEAKNESSES (W) – List the physical, social or regulatory obstacles or shortcomings within the region or your community.
What do I dislike about this region or your community? What would I like to see less of in this region or your community? What is contributing to a poor community image in the region or your community?
OPPORTUNITIES (O) – List the physical and social entities or assets located outside the region that are underutilized or undeveloped.
Where are opportunities for new development and/or preservation in the region or your community? Where are opportunities for change? What would I like to see more of in this region or your community? What could change the image of this region or your community?
THREATS (T) – List the physical and social entities located outside the region that detract from the community or if left unchecked could diminish quality of life for residents and businesses in the community.
What prevents this region or your community from flourishing? What are obstacles to community development and/or preservation? What detracts from a positive image in the region or your community?
The final step in the SWOT Analysis activity involved presenting the general public with a summary list of the key issues associated with the study area in an effort to obtain a prioritized list of issues of concern.

Section 2
Route 62 Smart Transportation Corridor StudyFinal Report October 2010
P a g e | 7
The planning process has revealed six focus topics to which goals and objectives have been created: � Safety � Aesthetically pleasing improvements � Promotion of development/re-development opportunities � Considerations for alternate modes of transportation � Project prioritization/funding opportunities � Riverfront access
The attendees at the April Public Meeting commented on the critical issues within or near the study corridor and prioritized those issues. Table 1 lists the issues of concern in priority order as voted on by attendees of the Business Association, Steering Committee and Public Meetings.
Table 1: Study Area Issues (1 = greatest issue of concern / 10 = lowest issue of concern)
Issue of Concern Business Association
Steering Committee
Public
Antiquated Traffic Signals at Intersections - High Rate of Accidents -Right Turns (Weakness)
2 2 2
Sight Distance at Major Intersections (Weakness) 5 6 1
Blighted Properties - Out of Town Owners (Threat) 4 3 5
Pedestrian Enhancements - Sidewalk, Plantings, Trashcans, Benches (Opportunity)
1 9 3
Traffic Speed (Weakness) 6 1 8
Safety and Pedestrian Crossing Signs - Enhanced Signage (Opportunity)
3 4 10
Traffic Calming - Roundabouts (Opportunity) 8 5 7
Available Funding and Current Local Economy (Threat) 9 7 4
Pedestrian Trails, Paths and Sidewalks - Railroad / Pedestrian Bridge - (Opportunity)
7 8 6
Bike Lanes along Roadways - Bike Facilities (Opportunity) 10 10 9
The results of the SWOT analysis, in coordination with the preliminary discussions with the Steering Committee, were used to help establish the potential improvements throughout the project study area.
Section 2.3 Goal Setting
Project goals were developed based upon issues and concerns expressed by the Steering Committee, Business Association, public meeting attendees and by local officials and staff. The goals and objectives outlined provide the basis for future transportation improvements, development/redevelopment and revitalization programs, policies, regulatory changes, and implementation projects.

Section 2
Route 62 Smart Transportation Corridor StudyFinal Report October 2010
P a g e | 8
� Safety Goal: Create a safer environment along Route 62 and within south side’s downtown area for motorists, pedestrians, and bicyclists. � Aesthetically Pleasing Improvements Goal: Provide improvement solutions which incorporate Smart Transportation components and enhance the overall aesthetics to promote the character of the City.
� Promotion of Development/Re-Development Opportunities Goal: Gain recommendations for zoning and ordinance changes to promote development/re-development. � Considerations for Alternate Modes of Transportation Goal: Create strategies for the south side area that enable pedestrians, bicyclists and public transit vehicles and riders safe connections to shopping, work and places of entertainment.
� Project Prioritization/Funding Opportunities Goal: Develop a deliverable that identifies specific projects with associated costs to allow for the future addition of projects onto the Transportation Improvement Plan (TIP). � Riverfront Access Goal: Create strategies for developing a more accessible and inviting riverfront.
Section 2.4 Formulating Strategies
Formulating strategies requires the planning process to formulate actions and strategies to be taken to attain the goals and objectives outlined in the previous section. In order to understand all necessary actions, consistency with State, County and City initiatives must be clearly identified and incorporated into action planning. The Route 62 Transportation Corridor Plan incorporates the guiding principles recognized by the Commonwealth. The following guiding principles outline the characteristics and identify broad guidelines for transportation and community revitalization. The Smart Transportation Initiative is a leading statewide initiative that stresses the importance of creating solutions that are appropriate and specific to your community.
Section 2.4.1 Smart Transportation
Smart Transportation asks us to understand the financial, environmental, technological, and social contexts to which the State and others approach a community’s transportation challenges. Engineers are asked to apply the most innovative and cost-effective tools, ideas and design solutions to solve transportation challenges, while also helping to build or rebuild downtowns. The guiding principles that govern Smart Transportation include:
� Solutions tailored to the context of the community. Oil City has a unique mix of commercial and residential uses within and adjacent to the downtown core. An example of a solution unique to the community includes promoting the use
Section 2
Route 62 Smart Transportation Corridor StudyFinal Report October 2010
P a g e | 9
of alternative modes of transportation, such as walking and bicycling, to take advantage of the unique land use mix that exists around the downtown core.
� Approach and solution tailored to meet specific project needs.
The analysis of the issues, concerns and needs integrate smart transportation solutions with downtown revitalization strategies that help create an increased sense of place.
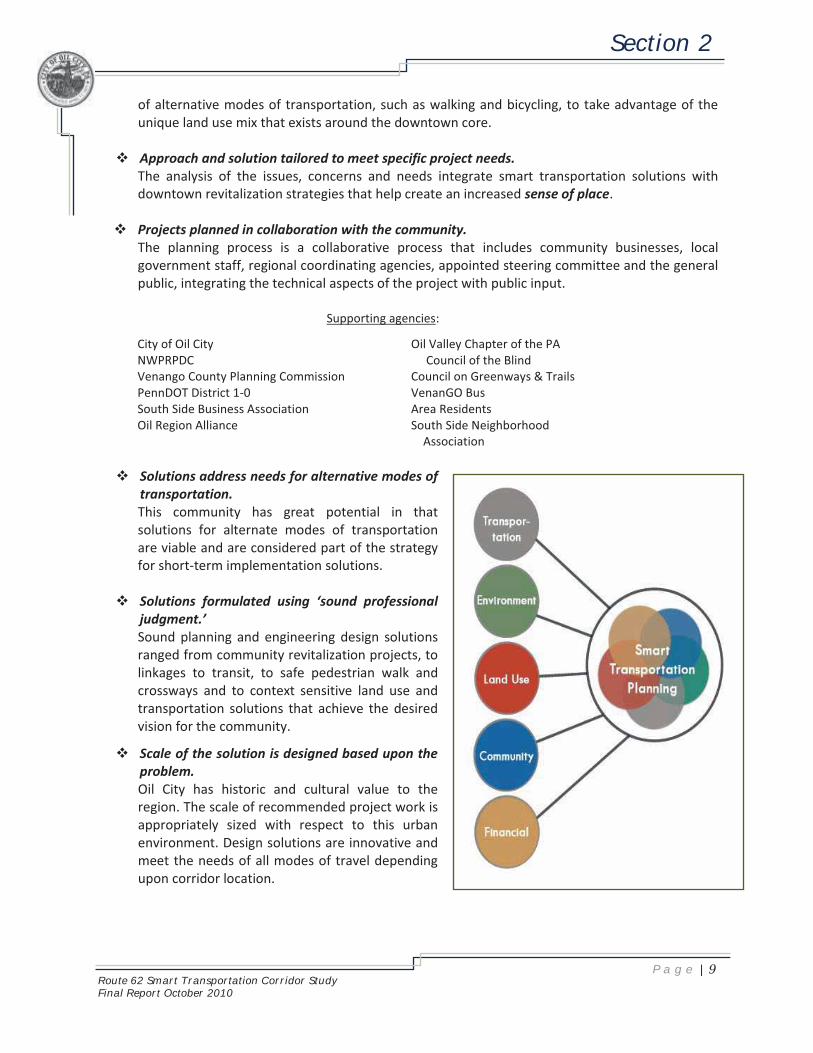
� Projects planned in collaboration with the community. The planning process is a collaborative process that includes community businesses, local government staff, regional coordinating agencies, appointed steering committee and the general public, integrating the technical aspects of the project with public input.
Supporting agencies:
City of Oil City Oil Valley Chapter of the PA NWPRPDC Council of the Blind Venango County Planning Commission Council on Greenways & Trails PennDOT District 1-0 VenanGO Bus South Side Business Association Oil Region Alliance
Area Residents South Side Neighborhood Association
� Solutions address needs for alternative modes of
transportation. This community has great potential in that solutions for alternate modes of transportation are viable and are considered part of the strategy for short-term implementation solutions.
� Solutions formulated using ‘sound professional judgment.’ Sound planning and engineering design solutions ranged from community revitalization projects, to linkages to transit, to safe pedestrian walk and crossways and to context sensitive land use and transportation solutions that achieve the desired vision for the community.
� Scale of the solution is designed based upon the
problem. Oil City has historic and cultural value to the region. The scale of recommended project work is appropriately sized with respect to this urban environment. Design solutions are innovative and meet the needs of all modes of travel depending upon corridor location.

Section 2
Route 62 Smart Transportation Corridor StudyFinal Report October 2010
P a g e | 10
These guiding principles, through a collaborative planning process with the various key stakeholders, were used to formulate strategies to address the transportation and land use issues within and surrounding the study area.

Section 3
Route 62 Smart Transportation Corridor StudyFinal Report October 2010
P a g e | 11
Signalized Intersections along Front Street
State Street Petroleum Street
Signalized Intersections along
First Street State Street Central Avenue Petroleum Street
Section 3.0 Existing Conditions Analysis of existing conditions within the study area provides an understanding of the current social, economic and physical environment. This section presents a summary of the existing conditions along the Route 62 Corridor and surrounding study area.
Section 3.1 Study Area Conditions
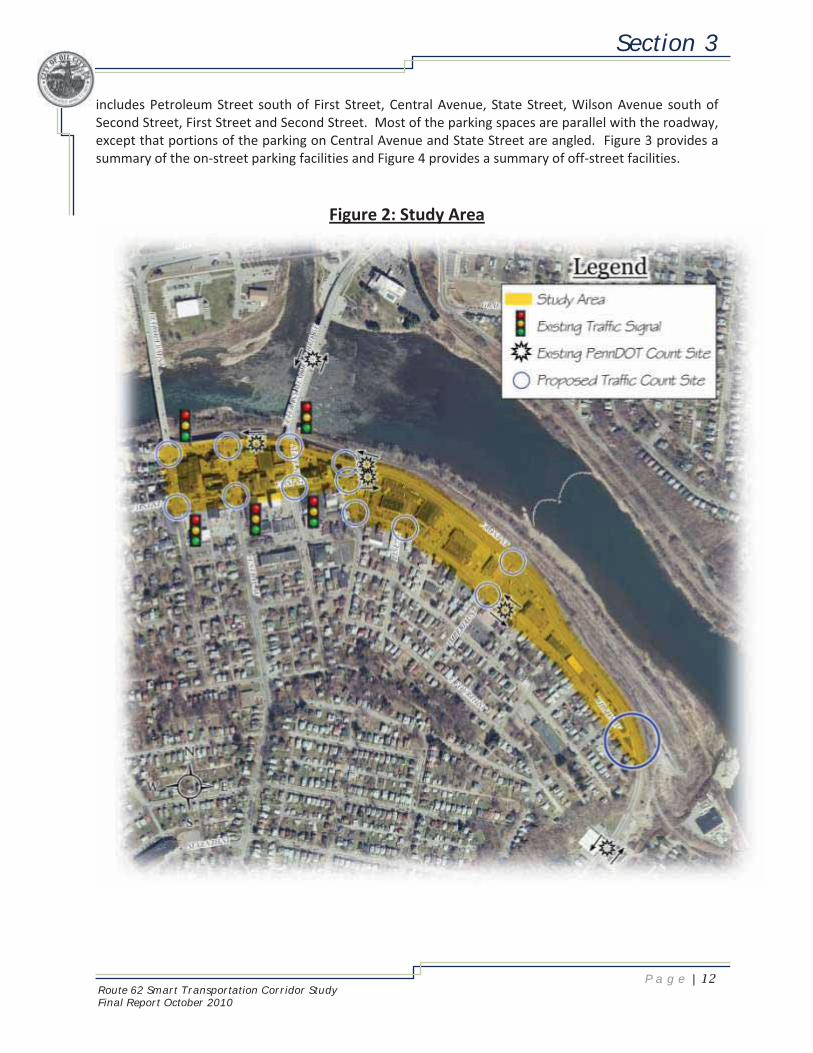
The initial study area was defined as the Route 62 Corridor leading into the south side of Oil City from Pumphouse Road to Petroleum Street. While this area defined the Route 62 Corridor along the south side, the study area was expanded through discussions with the Project Steering Committee to include a larger portion of the downtown area within the south side of Oil City. A Smart Transportation Study is focused on studying a network of streets, pedestrian facilities and transit services within a defined area with the goal of balancing the transportation, community and land use improvements which benefit all users. Based upon the goal of a Smart Transportation Study, the project study area was redefined to encompasses the transportation network of the area bounded by US Route 62 (Front Street), Petroleum Bridge and Second Street. Figure 2 provides a graphical summary of the final study area.
Section 3.1.1 Transportation Facilities
A section of US Route 62 (Front Street) in Oil City is a four-lane roadway that prohibits parking anywhere along the Corridor from Pumphouse Road to the First Street/Wilson Avenue intersection. At the intersection of Wilson Avenue, Front Street becomes a part of a one-way-pair roadway system with First Street. From this point, Front Street consists of one or two northbound travel lanes to the intersection with Petroleum Street, while First Street consists of two southbound travel lanes between Petroleum Street and Wilson Avenue. The posted speed limit within the study area is 40 mph along the four-lane roadway section and 25 mph within the downtown core area. The study area consists of a total of five (5) signalized intersections; with two along Front Street and three along First Street. The overall condition of the existing roadways within the study area range from good to fair. There currently are no sidewalk facilities along the Front Street Corridor from Pumphouse Road to State Street. Pedestrian facilities do exist within the downtown area of the study area, including along First Street, Front Street (from Wilson to Petroleum), State Street, Central Avenue, Petroleum Street and Second Street. The condition varies throughout the study area. In addition, most of the existing ADA curb ramps do not meet current PennDOT requirements.
Section 3.1.2 Parking
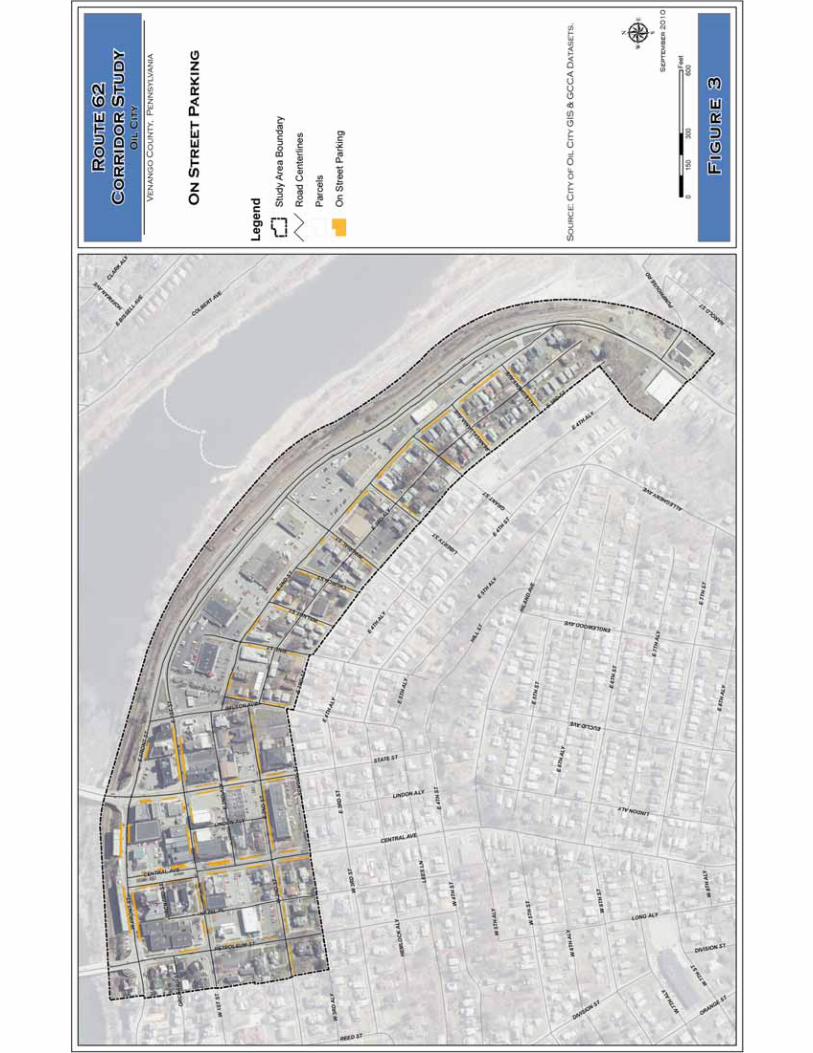
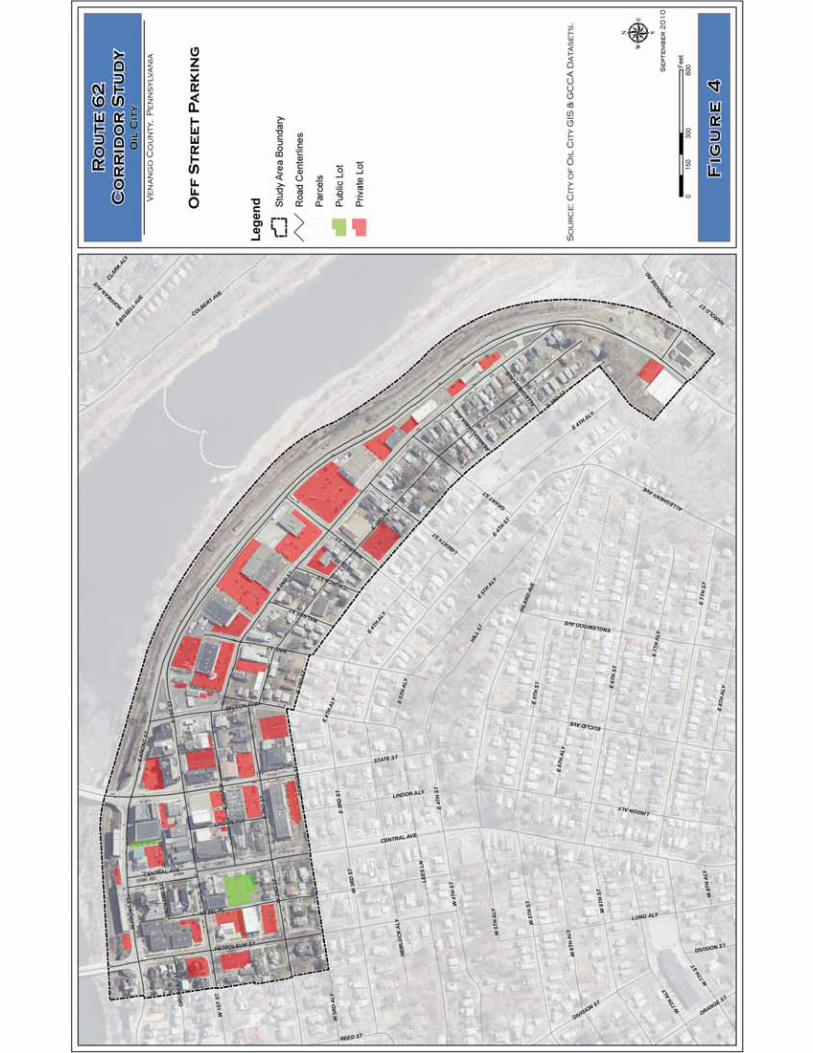
The Front Street Corridor prohibits parking along the four-lane section leading into town from the southeast. The properties located adjacent to Front Street along this four-lane section are commercial and include off-street parking at each of the individual businesses. Front Street, from Wilson Avenue to Petroleum Street includes on-street parallel parking on one or both sides of Front Street. Petroleum Street between Front Street and First Street does not provide on-street parking, but does have a drop-off area adjacent to the YMCA. Wilson Avenue has no on-street parking between Front Street and Second Street. All of the remaining streets within the study area provide on-street parking. This
Section 3
Route 62 Smart Transportation Corridor StudyFinal Report October 2010
P a g e | 12
includes Petroleum Street south of First Street, Central Avenue, State Street, Wilson Avenue south of Second Street, First Street and Second Street. Most of the parking spaces are parallel with the roadway, except that portions of the parking on Central Avenue and State Street are angled. Figure 3 provides a summary of the on-street parking facilities and Figure 4 provides a summary of off-street facilities.
Figure 2: Study Area

Section 3
Route 62 Smart Transportation Corridor StudyFinal Report October 2010
P a g e | 15
Section 3.2 Traffic Operations
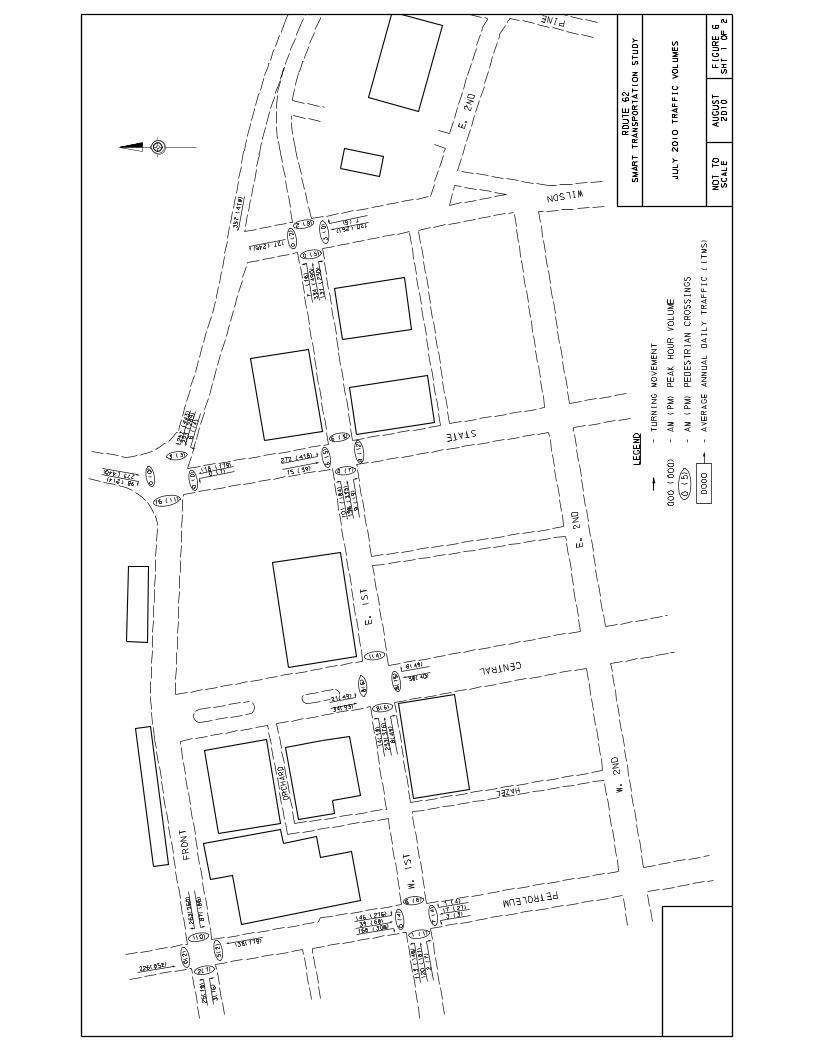
Average daily traffic (ADT) data from PennDOT’s Roadway Management System (RMS) database was obtained from PennDOT District 1-0. In addition, manual turning movement (MTM) traffic counts were performed at the 13 key study intersections during “typical” weekdays (Tuesday, Wednesday or Thursday) in November 2009; vehicular weekday peak hour traffic was also recorded in July 2010. These MTM counts recorded passenger vehicles, truck traffic (3+ axles), and bicycle traffic in 15-minute increments during the AM (7-9 a.m.) and PM (4-6 p.m.) peak periods. During the MTM counts noted above, pedestrian movements were also recorded at each intersection location. Each pedestrian movement was recorded in 15-minute increments by the approach that was crossed. During project steering committee meetings, it was noted that pedestrians are utilizing the railroad Wye Bridge near Pumphouse Road to cross the Allegheny River, as this crossing is the most direct route for pedestrians to achieve access to the southside, particularly to shopping destinations, from the Siverly neighborhood. Therefore, a pedestrian traffic count was conducted in the vicinity of the SR 62/Pumphouse Road intersection on July 8, 2010. The purpose of this count was to determine the number and location of pedestrian crossings across Route 62 in this area.
Section 3.2.1 Traffic Count Data Summary
The MTM traffic counts noted above were conducted during the month of November 2009 (November 3rd thru November 18th) at 13 key study intersections. AM and PM peak hour vehicular and pedestrian traffic volumes were determined from this data and are summarized in Figure 5.
Additional MTM traffic counts were conducted at seven of the 13 key study intersections during the month of July 2010. These traffic counts data were collected for comparison with the November data; it was anticipated that pedestrian and bicycle activity would be greater during summer months versus during late fall, due to inclement weather conditions. The AM and PM peak hour vehicular and pedestrian traffic volumes for this July 2010 data are shown in Figure 6. Copies of all traffic count data is contained in Appendix B.
A comparison of the November 2009 and July 2010 traffic volume data revealed the following:
Vehicular traffic volumes were greater in November 2009 than July 2010. There were no significant differences in pedestrian activity at the key study intersections. This indicates that pedestrian activity appears to be consistent throughout the year within the study corridor.
Section 3.2.2 Future Traffic Projections
One redevelopment project for the southeast corner of Petroleum and First Streets is in preliminary planning stages. The former use of this land was a funeral home, and a bank is planning to build a branch office on that site. A transportation improvement project located to the south of the project corridor at the intersection of Route 62 and SR 257 is currently in the final design stages; a new traffic signal is planned for that location. The PennDOT Traffic Unit suggested using a background growth rate of 0.5% per year for future year traffic projections along the Corridor; this growth rate will capture increases in future traffic volumes along the corridor due to these development/redevelopment and transportation enhancement projects.
Spreadsheets showing the calculated future traffic volume projections are contained in Appendix C.

Section 3
Route 62 Smart Transportation Corridor StudyFinal Report October 2010
P a g e | 16
THIS PAGE INTENTIONALLY LEFT BLANK


Section 3
Route 62 Smart Transportation Corridor StudyFinal Report October 2010
P a g e | 21
Section 3.2.3 Safety Analysis
Available reportable and non-reportable crash data for the most recent five-year period was provided by the City of Oil City and PennDOT District 1-0. This data showed that most of the crashes occurred at intersections. The table below provides a summary of the crash data for the study area intersections.
TABLE 3.1: Five-Year Crash History
Intersection # Crashes Predominant Type Front St / Petroleum St 17 Rear End Front St / Central Ave 4 Angle Front St / State St 4 Angle First St / Petroleum Ave 6 Struck Object/Parked Car First St / Central Ave 1 Pedestrian (fatality) First St / State St 7 Rear End/Angle, Pedestrian Front St / Wilson Ave 5 Angle First St / Wilson Ave 7 Angle Front St / E. Second St 7 Rear End/Angle Front St / Pumphouse Rd 4 Rear End
The intersection of Front Street / Petroleum Street experienced the most crashes in the Corridor. The midblock location with the highest number of crashes was the two-lane section of First Street between the intersections of Central Avenue and State Street; there were seven crashes (three rear-end and three struck fixed object). It should also be noted that even though the crash data showed there were seven crashes at the First Street / Wilson Avenue intersection over the 5-year data period, several people (during the project steering committee meetings, at a meeting with the south side business group, and at public meetings) commented that many near misses regularly occur at this intersection and sometimes involve pedestrians. These people stated that it is a daily occurrence.
Section 3.2.4 Traffic Signals
Within the study area, there are five signalized intersections. Existing traffic signal permit plans for each of these intersections was obtained from PennDOT. The existing timings programmed in each signal controller are shown on the signal permit plans.
The signal permit plans also indicate that the existing signals operate under time-based coordination; no physical signal interconnect (hardwire, fiber or wireless) currently exists.
The Oil City Fire Department maintains the existing traffic signals. JMT conducted a traffic signal inventory with the Fire Department. The purpose of this inventory was to field visit each signalized intersection and verify/record the existing signal equipment located at each intersection, for use in determining appropriate traffic signal upgrades/improvements.

Section 3
Route 62 Smart Transportation Corridor StudyFinal Report October 2010
P a g e | 22
In discussions with the Fire Department personnel responsible for maintaining the traffic signals, JMT discovered the following:
Traffic signal heads have been upgraded to LED. The controller clocks “drift” out of time. Approximately once a month, the fire department manually resets each controller clock. The current signal timing and phasing programmed in each controller correspond to those shown on the signal permit plans.
Section 3.2.5 Traffic Analysis
The Synchro Version 7 traffic engineering software was used in performing the traffic analysis for this project; the HCM report output generated from the Synchro capacity analysis implements the Highway Capacity Manual (HCM) methodology and delay/LOS calculation. The existing roadway and signal network was coded in Synchro utilizing the intersection lane configurations obtained from field site visits, signal permit plans, and current AM and PM peak hour traffic volume data obtained from the MTM counts discussed in Section 3.2.
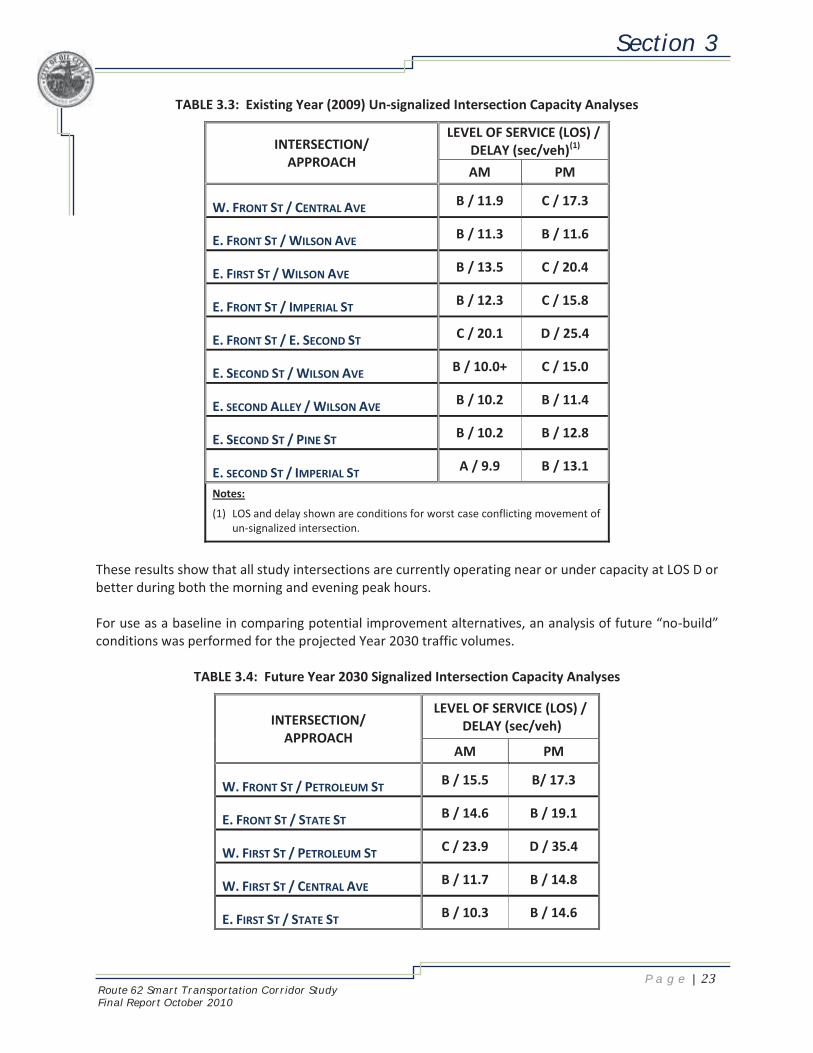
The results of the signalized and unsignalized intersection capacity/Levels of Service (LOS) analyses for existing conditions are shown in Tables 3.2 and 3.3, respectively. These results show the overall intersection operation; the detailed Synchro HCM Reports showing the delay and LOS for each approach and individual lane group movement are contained in Appendix D.
TABLE 3.2: Existing Year (2009) Signalized Intersection Capacity Analyses
INTERSECTION/ APPROACH
LEVEL OF SERVICE (LOS) / DELAY (sec/veh)
AM PM
W. FRONT ST / PETROLEUM ST B / 15.1 B/ 15.9
E. FRONT ST / STATE ST B / 14.2 B / 18.5
W. FIRST ST / PETROLEUM ST C / 22.4 C / 34.2
FIRST ST / CENTRAL AVE B / 11.6 B / 14.5
E. FIRST ST / STATE ST A / 10.0- B / 14.1
Section 3
Route 62 Smart Transportation Corridor StudyFinal Report October 2010
P a g e | 23
TABLE 3.3: Existing Year (2009) Un-signalized Intersection Capacity Analyses
INTERSECTION/ APPROACH
LEVEL OF SERVICE (LOS) / DELAY (sec/veh)(1)
AM PM
W. FRONT ST / CENTRAL AVE B / 11.9 C / 17.3
E. FRONT ST / WILSON AVE B / 11.3 B / 11.6
E. FIRST ST / WILSON AVE B / 13.5 C / 20.4
E. FRONT ST / IMPERIAL ST B / 12.3 C / 15.8
E. FRONT ST / E. SECOND ST C / 20.1 D / 25.4
E. SECOND ST / WILSON AVE B / 10.0+ C / 15.0
E. SECOND ALLEY / WILSON AVE B / 10.2 B / 11.4
E. SECOND ST / PINE ST B / 10.2 B / 12.8
E. SECOND ST / IMPERIAL ST A / 9.9 B / 13.1
Notes:
(1) LOS and delay shown are conditions for worst case conflicting movement of un-signalized intersection.
These results show that all study intersections are currently operating near or under capacity at LOS D or better during both the morning and evening peak hours. For use as a baseline in comparing potential improvement alternatives, an analysis of future “no-build” conditions was performed for the projected Year 2030 traffic volumes.
TABLE 3.4: Future Year 2030 Signalized Intersection Capacity Analyses
INTERSECTION/ APPROACH
LEVEL OF SERVICE (LOS) / DELAY (sec/veh)
AM PM
W. FRONT ST / PETROLEUM ST B / 15.5 B/ 17.3
E. FRONT ST / STATE ST B / 14.6 B / 19.1
W. FIRST ST / PETROLEUM ST C / 23.9 D / 35.4
W. FIRST ST / CENTRAL AVE B / 11.7 B / 14.8
E. FIRST ST / STATE ST B / 10.3 B / 14.6

Section 3
Route 62 Smart Transportation Corridor StudyFinal Report October 2010
P a g e | 24
TABLE 3.5: Future Year 2030 Un-signalized Intersection Capacity Analyses
INTERSECTION/ APPROACH
LEVEL OF SERVICE (LOS) / DELAY (sec/veh)(1)
AM PM
W. FRONT ST / CENTRAL AVE B / 12.5 C / 19.9
E. FRONT ST / WILSON AVE B / 11.7 B / 12.2
E. FIRST ST / WILSON AVE B / 14.4 D / 25.3
E. FRONT ST / IMPERIAL ST B / 13.1 C / 17.8
E. FRONT ST / E. SECOND ST C / 22.9 D / 30.4
E. SECOND ST / WILSON AVE B / 10.3 C / 17.6
E. SECOND ALLEY / WILSON AVE B / 11.2 B / 11.9
E. SECOND ST / PINE ST B / 10.4 B / 13.7
E. SECOND ST / IMPERIAL ST B / 10.1 B / 14.0
Notes:
(1) LOS and delay shown are conditions for worst case conflicting movement of un-signalized intersection.
These results show that with a projected slight growth in traffic volumes along the study corridor and the existing intersection configurations (i.e. no improvements) most study intersections are expected to operate under capacity at LOS C or better in Year 2030 during both the morning and evening peak hours; with relatively small increases in average delay per vehicles. In approximately 20 years, delay on the unsignalized side street approaches of Wilson Avenue at First Street and East Second Street at Front Street will increase by approximately five (5) seconds and operate at LOS D with vehicles on these approaches waiting an average of about 30 seconds.
Section 3.2.6 Access Management
The Transportation Research Board (TRB) has defined access management as “...the systematic control of the location, spacing, design, and operation of driveways, median openings, interchanges, and street connections to a roadway. It also involves roadway design applications, such as median treatments and auxiliary lanes, and the appropriate spacing of traffic signals. The purpose of access management is to provide vehicular access to land development in a manner that preserves the safety and efficiency of the transportation system.”
Per PennDOT’s Access Management Model Ordinances for Pennsylvania Municipalities Handbook, “Access management is a means of controlling the ways in which vehicles can access major roadways, using techniques such as limiting the number of driveways and intersections with local roadways.” The main goals of access management are to improve safety and reduce congestion. According to the National Highway Institute, it has been shown that with an effective access management program,

Section 3
Route 62 Smart Transportation Corridor StudyFinal Report October 2010
P a g e | 25
crashes can be reduced by up to 50 percent and roadway capacity can be increased by 23 to 45 percent, resulting in decreased delay and travel times.
Additionally, locations with difficult driveway access can result in driver frustration and low patronage. Motorists prefer to visit places of business that are easy to get into and out of.
With these goals in mind, and in working with the project steering committee, several driveways and intersections were investigated within the study corridor. These efforts included developing intersection sightline requirements as well as developing proposed driveway access modifications. The areas specifically mentioned as locations of concern included the Country Fair located on Wilson Avenue between Route 62 and East Second Street, and East Second Street. Proposed improvement options are discussed in more detail in Section 4 of this document.
Section 3.2.7 Transit
There is limited bus service in the Route 62 Corridor. There is one bus stop located on the eastern end of the Corridor on Imperial Street between Route 62 and East Second Street at the Giant Eagle parking lot. It has a shelter and street lighting (see photo at right). The transit stop is a part of the Oil City Route and Inter-City Route of the Venango Bus transit service offered throughout Venango County. The Oil City Route provides transportation services within the City of Oil City, while the Inter-City Route provides services and connection between Oil City, Franklin, and Cranberry Township.
Section 3.3 Existing Land Use
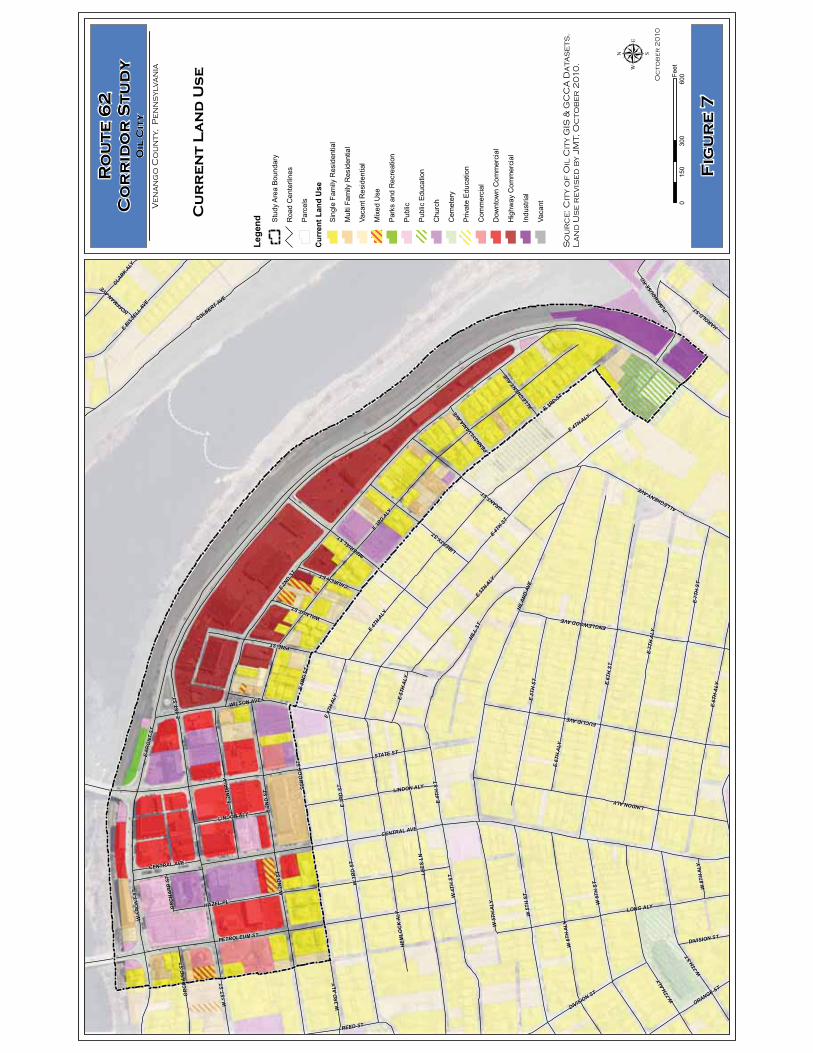
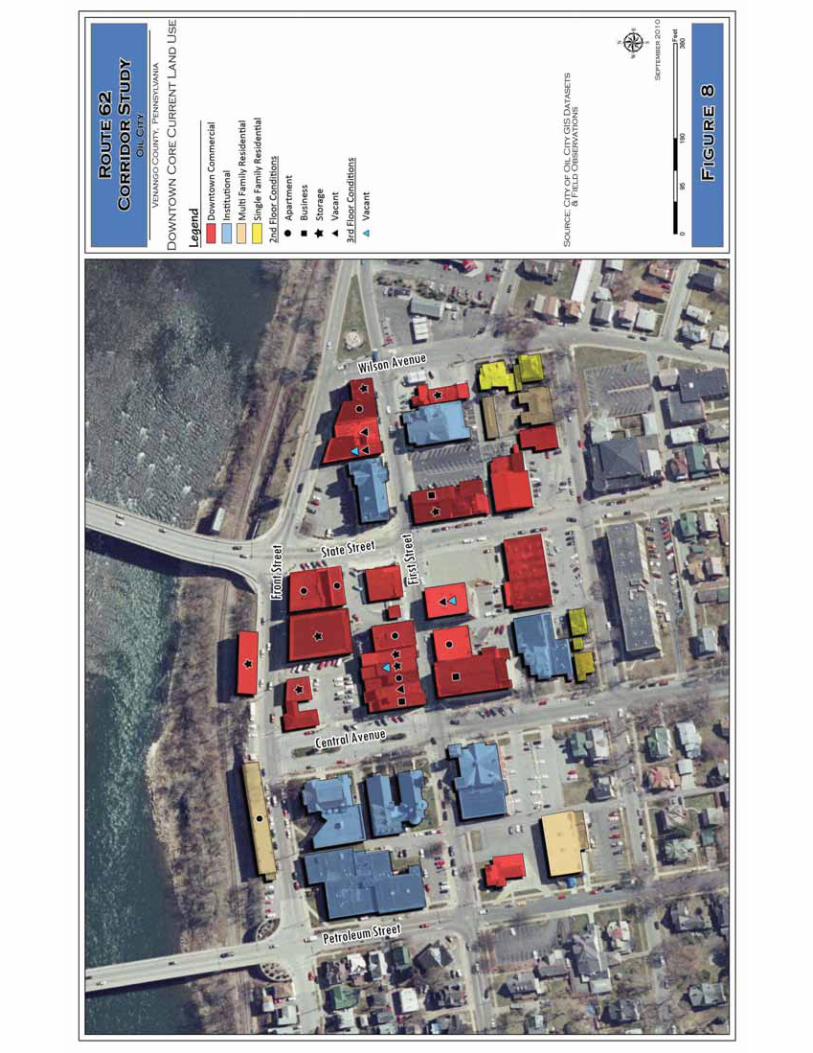
The Route 62 Transportation Corridor passes through Oil City’s South Side downtown area. Through a detailed analysis of the land uses, intensity of land uses and locations of basic needs and services, several distinct areas of the Route 62 Corridor are depicted in Figure 5 including:
Core Downtown – The Core Downtown can be described to include the properties to the west of Wilson Avenue. The core area extends from Wilson Avenue west to Petroleum Street and north to south from the River south to East Second Street. The Core area includes retail (sporting goods, home furnishings and gifts, antiques and appliances), professional and personal services, small eateries, public spaces, and several churches. The Core Downtown area also contains small pockets of transitional residential areas on Front Street and East Second Street. Such properties have the ability in the future to convert to mixed commercial properties. Oil City is distinct in that their Core Downtown area contains historical monuments within their transportation network on Central Avenue. Transition Mixed Commercial – Several areas, over decades of time, have changed the residential component of the Route 62 Corridor outside of the Core Downtown. Transitional Mixed Commercial areas are located on East Second Street between Wilson Avenue and Imperial Street as well as Petroleum Street between Orchard Street and West Second Street.

Section 3
Route 62 Smart Transportation Corridor StudyFinal Report October 2010
P a g e | 26
Today, these mixed commercial properties contribute to the downtown and region’s business economy. Suburban Commercial – The northern edge of the Route 62 Corridor has transitioned from a rural landscape into a commercial corridor for suburban retail. This occurred as this area was redeveloped in the late 1950’s. Lot sizes are larger and not bound by alleyways. The roadway corridor is a comfortable width along East Second Street from Wilson Avenue to Allegheny Avenue. Lot sizes, building size and business signage are all visibly larger in the suburban commercial area of the Corridor. East Second Street is bound by Highway Commercial and Mixed Uses. Residential – Several blocks of residential living still exist within the study area, primarily on Third Street and Second Street. Two different types of residential areas exist within the Corridor:
Transitional Residential – Transitional Residential areas are located within or adjacent to areas that have transitioned over time into mixed commercial areas. These transitional residential areas exist along Second Street and primarily contain multi-family units, attached units and duplexes along with small scale to medium scale commercial uses. Pockets of transitional residential uses can be seen outside of the downtown core. Along the west side of Petroleum Street, single-family and multi-family residential units are surrounded by commercial and mixed uses. Traditional Residential – These traditional residential neighborhoods are designed to be walkable and are located within a short distance from the downtown, schools and churches. In the study area traditional neighborhood developments along both Second Street and Third Street can be characterized as less intensive and primarily contain single-family and multi-family residential units.
Industrial – The area bounded by the Allegheny River and the Route 62 four-lane is zoned Manufacturing and Industrial; however, the area was formerly a railroad yard and roundhouse and is now vacant land with one active rail line. Other Uses – Park and recreational land uses are located at the intersection of East Front Street and State Street.
The following figures describe the current land use within the study area and the surrounding blocks.
E 1S
T ST
E 2N
D ST
E FR
ON
T ST
E 3RD A
LY
E 3RD ST
E 4TH S
T
E 7T
H S
T
STATE ST
LEES
LN
E 6T
H S
T
HILA
ND A
VE
E 6T
H A
LY
HAZEL PL
PINE ST
E 7T
H A
LY
PETROLEUM ST
LONG ALY
E 5TH A
LY
W 5
TH S
TW 4
TH S
T
W 6
TH S
T
E 5T
H S
T
E 4TH ALY
LINDON ALY
EUCLID AVE
W 3
RD
ST
W 6
TH A
LY
E 8T
H A
LY
W 7
TH S
T
W 2
ND
ST
W 7
TH A
LY
W 1
ST S
T
HEM
LOC
K A
LY
COLBERT AVE
HILL
ST
E 2N
D A
LY
IMPERIAL ST
W 3
RD
ALY
W F
RO
NT
ST
SCH
OO
L ST
GRANT ST
ENGLEWOOD AVE
LIBERTY ST
W 5
TH A
LY
ALLEGHENY AVE
E BIS
SELL AVE
WILSON AVE
REED ST
ORANGE ST
HAROLD ST
CLARK A
LY
OR
CH
AR
D S
T
PUMPH
OUSE R
D
WALNUT ST
CHURCH ST
CENTRAL AVE
DIVISION ST
W 8
TH A
LY
HOFFMAN AVE
PENNSY
LVANIA
AVE
DIVISION ST
E 4T
H AL
Y
E 4T
H ALY
CENTRAL AVE
E 2N
D S
T
ALLEGHENY A
VE
E 5T
H A
LY
E 3R
D S
T
LINDON ALY
LINDON ALY
E 3R
D S
T
E 4T
H S
T
OR
CH
AR
D S
T
Fig
ur
e 7
Ro
ut
e 6
2C
or
rid
or
St
ud
y
Ve
na
ng
o C
ou
nt
y,
Pe
nn
sy
lv
an
ia
Oil
Cit
y
μO
ct
ob
er
20
10
So
ur
ce
: C
ity
of
Oil
Cit
y G
IS
& G
CC
A D
at
as
et
s.
La
nd
Us
e r
ev
ise
d b
y J
MT
, O
ct
ob
er
20
10
.
Cu
rr
en
t L
an
d U
se
030
060
015
0Fe
et
Lege
nd Stud
y Ar
ea B
ound
ary
Roa
d C
ente
rline
s
Parc
els
Cur
rent
Lan
d U
se
Sing
le F
amily
Res
iden
tial
Mul
ti Fa
mily
Res
iden
tial
Vaca
nt R
esid
entia
l
Mix
ed U
se
Park
s an
d R
ecre
atio
n
Publ
ic
Publ
ic E
duca
tion
Chu
rch
Cem
eter
y
Priv
ate
Educ
atio
n
Com
mer
cial
Dow
ntow
n C
omm
erci
al
Hig
hway
Com
mer
cial
Indu
stria
l
Vaca
nt
Section 3
Route 62 Smart Transportation Corridor StudyFinal Report October 2010
P a g e | 29
Section 3.3.1 Northern Venango County Multi-Municipal Regional Plan
The Northern Venango County Multi-Municipal Regional Plan addresses land use, housing, transportation, community facilities, the protection of natural resources, and economic development throughout the Northern Venango County Region. The plan is divided into three sections by municipality. An overview of each municipality is provided with facts describing the future trends of each jurisdiction. Recommendations are provided to guide the municipalities towards areas of interest and changes that should be made.
The Northern Venango County Multi-Municipal Regional Plan is comprised of Cornplanter Township, City of Oil City, and Rouseville Borough. The Regional Plan is designed to address:
Use existing resources first—physical, governmental, or institutional. They should always be the primary options. Choose a few projects from the many presented by this Plan to accomplish in the first year to give the Plan implementation traction. Explore, use, and promote avenues to regional cooperation.
Cornplanter Township Cornplanter Township lies on the northern border of the three municipalities. Currently 2,687 residents live within the Township. The Township is the largest of the three municipalities with 23,872 acres or 37.3 square miles. The land within the Township is primarily publicly owned land (Oil Creek State Park and Game Lands 253). Lightly settled residential developments are focused around small villages within the Township. Housing conditions within the Township were rated as being good. The majority of housing is single-family units (90%) and mobile homes (8.7%). The number of housing units has declined from 1990 to 2000, but on average five (5) to six (6) units are being built annually. The Pennsylvania Historical and Museum Commission recognizes Pithole City as being historically significant. Large mineral extraction within the region has led to focused efforts on preserving the beauty of the natural environment. Currently, the exploration for natural gas within the Township is occurring with two drilling rig permits acquired.
City of Oil City The City of Oil City is one of the major arterial corridors within Venango County. Base upon the 2000 census, 11,504 residents lived within Oil City, which encompasses 4.7 square miles. The US Census Board has estimated the population within Oil City has decreased annually since the 2000 census to 10,502 residents. The discovery and exploration of oil in the region as well as the geographic proximity to the Allegheny River helped to develop an early trading and shipping center. Heavy industrial uses within the region led to the widespread railroad network. Early development in Oil City was prominent around the water, thus small lots and homes were built so workers could walk to and from work. Nearly 17 percent or 497 acres of the City is listed on the National Register of Historic Places. Housing is a major concern on both the north and south side of Town. The overabundant amount of housing available within Oil City coupled with the poor housing market has led many units to become dilapidated or vacant. The Oil City Fire Department and the Oil City Police Department patrol and oversee the City. Recreational uses (parks and trails) and community facilities (library) are provided within the City. Transit and bus services are also provided throughout the City.
Section 3
Route 62 Smart Transportation Corridor StudyFinal Report October 2010
P a g e | 30
Rouseville Borough Rouseville Borough has gone through much change over the past fifty years. The change has not involved new construction; instead the area has seen significant demolition of commercial buildings and generally far less retail activity. The primary difference during this time period was the closure and demolition of the Pennzoil refinery and offices that were located in the heart of Rouseville. Currently 429 residents live within the Borough of Rouseville, which encompasses 0.9 square miles. The majority of the Borough is comprised of residential land uses. A large portion of the residential housing community lies east of Route 8 and north of Route 227. Smaller pockets of residential development can be found south of Cherry Run and to the east of Route 8. Development has been limited in the Borough due to steep slopes and widespread floodplains. There is very little commercial and industrial land uses remaining in the Borough. Buildings remain vacant from commercial and industrial uses that have left the Borough. The housing market is very slow within the Borough due to poor economic conditions. The Rouseville Volunteer Fire Department and Borough park are community facilities and services that are provided to the residents.
Regional Initiatives A regional task force has been created with the three municipalities and the County to address the basic needs for the region. Four task force teams will address policies relating to land use, housing, community facilities and public safety.
The Regional Transportation Plan The primary funding source for transportation projects in the region is the United States Department of Transportation. The Regional Transportation Plan identifies transportation projects that will include upgrades to transit, rail, roadways and highways.
Economic Plan The economic status throughout the Cornplanter – Oil City – Rouseville Area (COR) has remained constant or unchanged. Cornplanter Township and Rouseville Borough have seen a decrease in median household income from 1990 to 2000, whereas Oil City experienced an increase in median household income over the same time period. Opportunities for economic development exist within the region. Tourism and retail are the main providers of revenue to the current status of the Region’s economic value. Tourism is one of Venango County’s major industries. Tourism provides a large source of revenue for the Region as well as employment opportunities. Oil City is the most prominent location for retail within the three municipalities; however, retail trade has been declining in Oil City over the past decades. Advanced manufacturing, health care, and energy are three sectors that appear to be potential growth opportunities for the Region’s economy.
Other Plans and Policies The Bike Trail is a major priority for the Oil Region Alliance. The Bike Trail Plan suggests positive additions to the current bikeways plan and recommendations for continued trail improvement. The Oil City Bike Trail and Justus Trail are designated as being segments of the main stem of the Erie to Pittsburgh Trail which is now being linked and developed. The ARTS and Culture Plan strives to make Oil City a destination for artists. The National Transit Building currently houses 25 artist tenants in the North Side downtown. New businesses and existing businesses are relocating to the downtown where the revival of the Arts is taking place.
Section 3
Route 62 Smart Transportation Corridor StudyFinal Report October 2010
P a g e | 31
Transportation and land use improvements recommended as a part of the Route 62 Smart Transportation study need to be focused on the retail and tourism opportunities available within the City of Oil City. The improvements should be focused on a multi-modal approach that not only enhances the existing motor vehicle network, but also promotes pedestrian safety, transit use and commuter and recreational bicycle facilities.
Section 3.4 Open Space and Greenways
Section 3.4.1 Venango County Greenways Plan
The Venango County Greenways Plan is a part of the Northwest Pennsylvania Greenways Planning effort. The Northwest Planning and Development Commission completed the multi-county effort for six counties.
Venango County is plentiful with recreational opportunities. These natural resources are important to the County and the surrounding Region. These resources include:
The Oil Heritage Region: The Region is historically significant for its legacy as the creation of the petroleum industry. Artifacts, scenic vistas, and museums are a few of the incredible areas to explore within the Region. Oil Creek State Park: The Park is approximately 6,250 acres and is located in the Oil Creek Valley. Drake Well Museum and Park is situated immediately north and east of Oil Creek State Park. Two High Quality Streams (Cherry Run and Little Sandy Creek) and two Exceptional Value Streams (Hemlock Creek and Dennison Run) Important Bird Areas Washington’s Trail: Historic and scenic route commemorating George Washington’s first military and diplomatic journey Allegheny River: The River stretches from its northern headwater in central Potter County downstream to Pittsburgh. The 325-mile river flows into the Monongahela to form the Ohio River in Pittsburgh. French Creek North Country National Scenic Trail: The Trail encompasses 4,600 miles from its western point in North Dakota to its eastern point in New York.
Through conservation and proper planning efforts to preserve greenways and their corridors in Venango County, future generations will be able to experience these exceptional resources.
Greenways provide a vast number of recreational opportunities for visitors. A greenway may offer trails for hiking, jogging, biking, canoeing / kayaking, and other outdoor recreational activities. Greenways also create naturally occurring buffers that separate developed and non-developed lands. These aspects present benefits to local municipalities and their residents. Benefits would include:
Promotes environmentally sound land development Promotes land and water restoration Encourages a network of non-motorized and motorized land and water transportation corridors to connect people to our resources

Section 3
Route 62 Smart Transportation Corridor StudyFinal Report October 2010
P a g e | 32
Explores opportunities to expand motorized off-highway vehicle and snowmobile trail opportunities Conserves natural resource infrastructure resources Builds capacity at the local level for implementation and encourages economic development Promotes healthy living Enhances the quality of life
The Venango County Greenways Plan defines implementation strategies that must be put in place in order to create the vision for greenways in Venango County. The County has the opportunity to complete the following tasks if the recommendations are fulfilled.
Guide growth and development in a sustainable manner Improve the economy in Venango County by enhancing tourism opportunities and venues and by providing goods and services to meet the needs of our residents and tourists Provide alternate forms of transportation to improve air and water quality and to reduce traffic congestion Connect its residents and neighborhoods to one another, as well as its parks, schools, and cultural and natural resources Conserve natural resources, which provide life sustaining functions and create the character of place, for current and future generations of Venango County residents
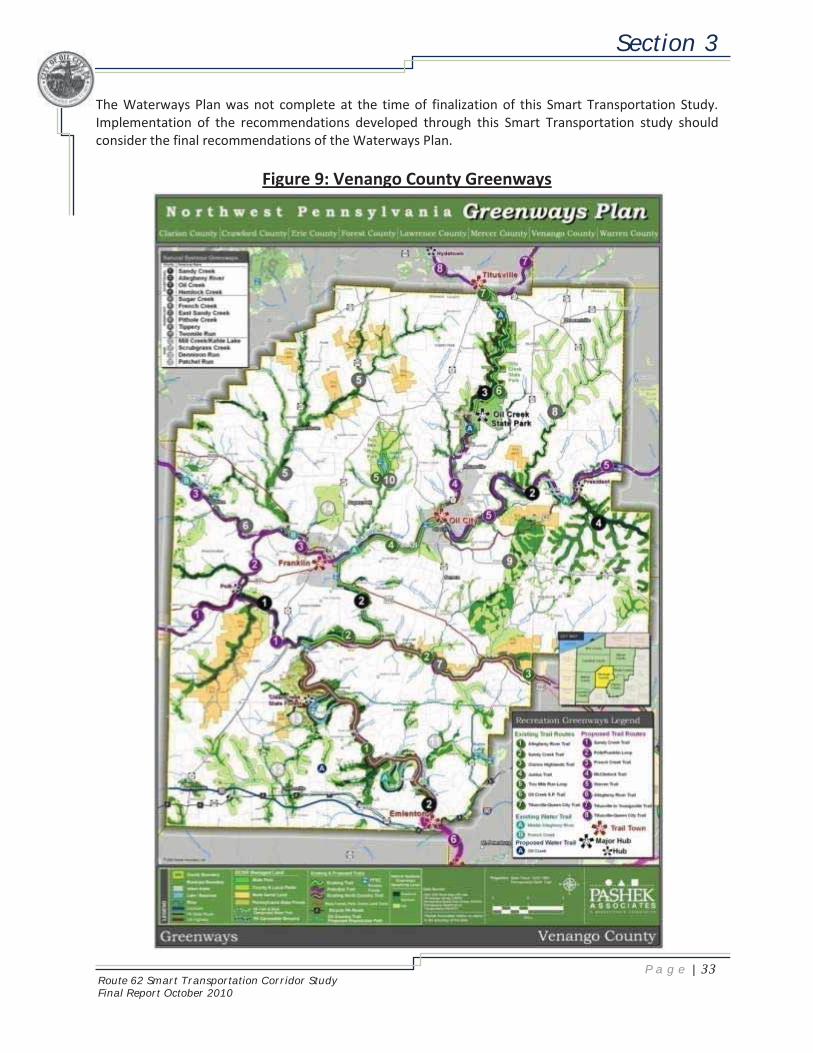
Proposed facilities identified in the plan are shown on Figure 9.
The Venango County Greenway is consistent with the Smart Transportation approach to make trails an integral part of the overall transportation network.
Section 3.4.2 Oil City Comprehensive Waterways Plan
The City of Oil City has contracted with Mackin Engineering Company to develop a Comprehensive Waterways Plan for the City focused on identifying opportunities and developing strategies that would enhance the waterfront at eight (8) key locations along the Allegheny River and Oil Creek. In addition, general corridor-wide recommendations are also being included in the Plan. The evaluation of each of the eight areas provided recommendations pertaining to the following:
Recreational Enhancements Economic Development Opportunities Access Management Educational Opportunities Aesthetic Enhancements
The Waterways Plan has made initial recommendations for the area of the South Side Business District, including designating a white-water loop under the Veteran’s Memorial Bridge (State Street), improving River access for fishing and boating, and redeveloping and strengthening the south side business section. Recommendations have also been made with regard to the Siverly Railroad Bridge, which connects the City’s Siverly neighborhood to the south side commercial and residential areas.
Section 3
Route 62 Smart Transportation Corridor StudyFinal Report October 2010
P a g e | 33
The Waterways Plan was not complete at the time of finalization of this Smart Transportation Study. Implementation of the recommendations developed through this Smart Transportation study should consider the final recommendations of the Waterways Plan.
Figure 9: Venango County Greenways
Section 3
Route 62 Smart Transportation Corridor StudyFinal Report October 2010
P a g e | 34
THIS PAGE INTENTIONALLY LEFT BLANK
Section 4
Route 62 Smart Transportation Corridor StudyFinal Report October 2010
P a g e | 35
Smart Transportation Principles
� Solutions tailored to the context of the community.
� Approach and solution tailored to meet specific project needs.
� Projects planned in collaboration with the community.
� Solutions address needs for alternative modes of transportation.
� Solutions formulated using sound professional judgment.
� Scale of the solution is designed based upon the problem.
Section 4.0 Analysis of Improvement Options and Solutions The Smart Transportation principles provided a guide for the collaborative planning process, including the development of improvement options and solutions for the south side of Oil City that enhance the Route 62 Corridor and surrounding study area. The solutions identified through the planning process are focused on addressing the critical issues by improving the quality of the area within the study and developing a plan for transportation and land use improvements that promote safety and encourage development/re-development opportunities within the south side.
Section 4.1 Front Street (Route 62) Corridor
The Front Street (Route 62) Corridor currently consists of a four-lane road from Pumphouse Road to Wilson Avenue. Front Street can be accessed from First Street/Wilson Avenue, Imperial Street, Second Street and Pumphouse Road. In addition, vehicles traveling east along Front Street have access to the CVS parking area via a right-in/right-out access point. The existing traffic volumes, which are consistent with future volumes, are low enough to allow for a potential “road diet” along the Front Street Corridor. In addition to a potential reduction of travel lanes, the Front Street Corridor could also be enhanced to provide for bicycle and pedestrian facilities, as well as additional traffic calming through the use of roundabouts at the First Street/Wilson Avenue and Second Street intersections. Road Diet The term “road diet” is associated with the reduction of travel lanes along a roadway while still providing a facility that meets the current and future traffic demand. The proposed lane reduction would reduce the existing four-lane roadway (two lanes in each direction) to a three-lane roadway, which would include one lane per direction and a left turn lane/median area. The elimination of two thru lanes would allow sufficient space for the median/left turn area, as well as designated pedestrian/bicycle facilities. The median area would provide an opportunity for a landscaped area to provide a more welcoming entrance to the City’s south side. The goal of the pedestrian/bicycle facilities would be to provide a sidewalk facility on the south side of Front Street and a shared-use facility on the north side. These improvements should also help to reduce the travel speeds along this section of Front Street. Implementation of the “road diet” improvements could be completed in a phased approach. The initial phase would reduce the number of travel lanes through pavement marking improvements which would provide a cost-effective means for calming traffic entering the City. The second phase would implement the full improvements which would include a curb, median, pedestrian/bicycle facilities and landscape plantings. Coupled with the “road diet” (under either the initial phase or full improvements) would be the reconfiguration of the Wilson Avenue approach at its intersection with First Street and Front Street,
Section 4
Route 62 Smart Transportation Corridor StudyFinal Report October 2010
P a g e | 36
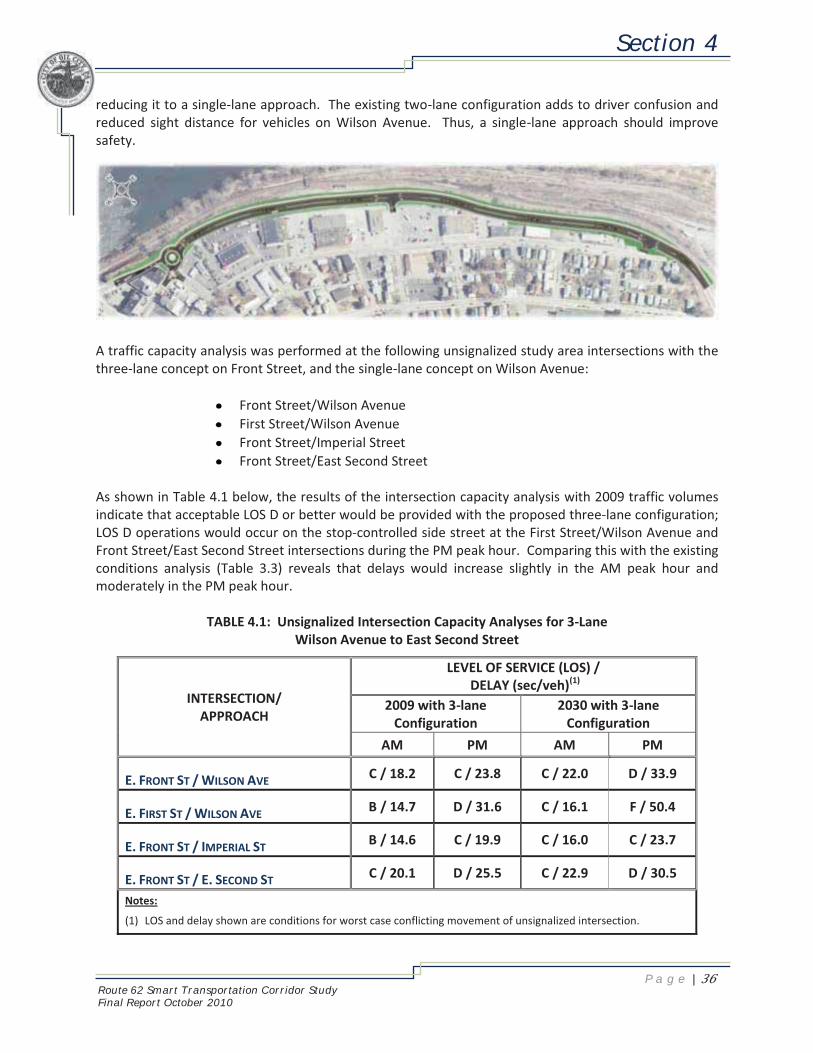
reducing it to a single-lane approach. The existing two-lane configuration adds to driver confusion and reduced sight distance for vehicles on Wilson Avenue. Thus, a single-lane approach should improve safety.
A traffic capacity analysis was performed at the following unsignalized study area intersections with the three-lane concept on Front Street, and the single-lane concept on Wilson Avenue:
Front Street/Wilson Avenue First Street/Wilson Avenue Front Street/Imperial Street Front Street/East Second Street
As shown in Table 4.1 below, the results of the intersection capacity analysis with 2009 traffic volumes indicate that acceptable LOS D or better would be provided with the proposed three-lane configuration; LOS D operations would occur on the stop-controlled side street at the First Street/Wilson Avenue and Front Street/East Second Street intersections during the PM peak hour. Comparing this with the existing conditions analysis (Table 3.3) reveals that delays would increase slightly in the AM peak hour and moderately in the PM peak hour.
TABLE 4.1: Unsignalized Intersection Capacity Analyses for 3-Lane
Wilson Avenue to East Second Street
INTERSECTION/ APPROACH
LEVEL OF SERVICE (LOS) / DELAY (sec/veh)(1)
2009 with 3-lane Configuration
2030 with 3-lane Configuration
AM PM AM PM
E. FRONT ST / WILSON AVE C / 18.2 C / 23.8 C / 22.0 D / 33.9
E. FIRST ST / WILSON AVE B / 14.7 D / 31.6 C / 16.1 F / 50.4
E. FRONT ST / IMPERIAL ST B / 14.6 C / 19.9 C / 16.0 C / 23.7
E. FRONT ST / E. SECOND ST C / 20.1 D / 25.5 C / 22.9 D / 30.5
Notes:
(1) LOS and delay shown are conditions for worst case conflicting movement of unsignalized intersection.

Section 4
Route 62 Smart Transportation Corridor StudyFinal Report October 2010
P a g e | 37
In Year 2030 with the three-lane configuration, LOS C conditions would exist at all intersections during the AM peak hour. During the PM peak hour all but the intersection of First Street/Wilson Avenue would operate at LOS D or better; the Wilson Avenue approach at First Street would experience LOS F conditions with vehicles on Wilson Avenue waiting approximately 50 seconds on average before proceeding through the intersection. Therefore, additional long-term improvements were considered at the First Street/Wilson Avenue intersection and are discussed below. Roundabouts Improvements to the Front Street corridor could include roundabouts at the First Street/Wilson Avenue intersection and/or the Second Street intersection. The inclusion of a single-lane roundabout at either of these locations would provide a means of traffic calming as motor vehicles enter the downtown area. In addition, the roundabout at the First Street/Wilson Avenue intersection would provide a gateway to the City of Oil City’s south side. Sufficient space is available to provide a roundabout at this location that incorporates the existing fountain into the center island, while minimizing impacts to surrounding properties and businesses. It appears that constructing a roundabout at the Second Street intersection would be more challenging and potentially costly than at the First Street/Wilson Avenue intersection for several reasons, including anticipated right-of-way impacts, roadway geometry, and the potential for a retaining wall adjacent to the railroad tracks to limit grading impacts and the need for track relocation. For these reasons, analysis of traffic operations of a roundabout at the Second Street intersection was not performed. A traffic analysis using the PennDOT roundabout evaluation spreadsheet was conducted for a roundabout at the First Street/Wilson Avenue intersection. One of the evaluation measures used in this analysis is the volume-to-capacity (v/c) ratio of the approaches to the roundabout; this measure is the ratio of the demand volume on the approach to the capacity (how much volume the roadway can handle) of the approach. For the roundabout analysis, a v/c ratio of 0.85 (or 85% of the capacity) is accepted as the threshold of acceptable level of service (LOS). The results of the analysis of the First Street/Wilson Avenue roundabout for existing traffic volumes and future year 2030 traffic volume projections showed that all roundabout approaches would operate below an acceptable volume to capacity (v/c) ratio of 0.85. A more detailed roundabout traffic analysis of the First Street/Wilson Avenue intersection was performed using the SIDRA traffic engineering software. The results of this analysis were consistent with the PennDOT roundabout spreadsheet. The SIDRA analyses showed a LOS A operation for the overall roundabout for 2009 and 2030 traffic volumes during the AM and PM peak hours. All approaches are expected to operate below an acceptable v/c ratio of 0.85; the worst approach would be First Street operating below a v/c ratio of 0.74. Based upon the level of service analysis, a roundabout would operate more efficiently during existing and future (2030) traffic conditions when compared to stop-controlled intersection. The results of the SIDRA analyses are contained in Appendix E.

Section 4
Route 62 Smart Transportation Corridor StudyFinal Report October 2010
P a g e | 38
Smart Transportation � Solutions tailored to the context of
the community. � Approach and solution tailored to
meet specific project needs. � Projects planned in collaboration
with the community. � Solutions address needs for
alternative modes of transportation. � Solutions formulated using sound
professional judgment. � Scale of the solution is designed
based upon the problem.
Section 4.2 Streetscape Improvements
The primary goal of streetscape improvements within the study area will be to develop a consistent pedestrian facility that meets user expectancy while providing a safe and aesthetically pleasing means of transportation for pedestrians. Streetscape improvements need to be planned and designed to meet two unique areas within the project study area. These areas include the downtown core area bounded by First Street, Petroleum Street, Wilson Avenue and Front Street, as well as the residential area located outside of the downtown core along Second Street. Within the downtown core of the south side of Oil City, the focus of the streetscape improvements will be to bring together transportation improvements with land use, and coordinate pedestrian facilities within the business and commercial districts of the study area. Improvements in this area are to include full streetscape enhancements, including the following:
Concrete sidewalks
Decorative brick pavers (buffer area)
Pedestrian lighting
Traffic Signal Improvements
Amenities (Benches, Trash receptacles, Bicycle Racks)
Decorative crosswalks
ADA curb ramps
Infrastructure Improvements (Water & Stormwater Improvements)
Street trees
Signage
The streetscape improvements along the Second Street corridor would have the same focus, including providing a safe and aesthetically pleasing facility for the pedestrians. However, the design would be less elaborate than the downtown core area and would be designed to establish dependable pedestrian facilities which adhere to the current ADA guidelines. Providing such improvements would present the residential area of the study area as being comfortable, inviting, and having a safe environment. A critical component of the pedestrian facilities in any area is adherence to current ADA guidelines, including ADA curb ramps. PennDOT is focused on upgrading the ADA curb ramps throughout the state. The City will need to work closely with PennDOT to understand their future roadway maintenance and construction project schedule as it relates to state routes within the study area. It is recommended that the City coordinate closely with PennDOT with the goal that all ramps at a given intersection are improved at one time and meet the aesthetic standards that are associated with future streetscape improvements.
Section 4
Route 62 Smart Transportation Corridor StudyFinal Report October 2010
P a g e | 39
Smart Transportation � Solutions tailored to the context of
the community. � Approach and solution tailored to
meet specific project needs. � Projects planned in collaboration
with the community. � Solutions address needs for
alternative modes of transportation. � Solutions formulated using sound
professional judgment. � Scale of the solution is designed
based upon the problem.
Section 4.3 Access Management
Opportunities for access management can be found within the study area along Wilson Avenue and East Second Street. The following summarizes some of the access management techniques that could be applied to this Corridor.
Country Fair Store/Wilson Avenue/East Second Street As it exists, the segment of Wilson Avenue between First and Second Street sees a lot of activity from both vehicles and pedestrians. In particular, this area is not clearly delineated to separate vehicle traffic on the roadway, vehicle traffic entering/exiting Country Fair, and pedestrians walking in the area. Five access management techniques that could be made in this area to better delineate vehicle and pedestrian areas include:
Driveway delineation – eliminate the wide open driveway access on Wilson Avenue and First Street by adding channelization and islands Driveway consolidation – eliminate the driveway on East Second Street due to its proximity to Wilson Avenue Cross access with CVS – provide a cross access connection from Country Fair to CVS, which would allow County Fair patrons to access Second Street via the existing CVS driveway Pedestrian Sidewalks – improve pedestrian delineation by adding more sidewalk area Street closure – eliminate the confusing roadway split of Wilson Avenue south of Second Street
US Post Office/Thorne’s Market This area could benefit by adding cross access between the USPS parking lot and Thorne’s Market parking lot. It was observed that there were shoppers parking in Thorne’s lot and entering the USPS building. In addition to providing a cross access, one of the existing Thorne’s Market driveway openings could be eliminated to reduce the number of access points along Second Street.
Imperial Street Imperial Street runs between Rite Aid and Giant Eagle. The area is currently wide open with no delineation. Tractor trailers were observed turning from Front Street onto Imperial Street. There are existing driveways on Imperial Street less than 100’ from Front Street. This creates a situation where sight distance is limited for turn vehicles. This area could benefit from better driveway delineation. Providing an entry throat on Imperial Street for approximately 100’ south of Front Street would eliminate vehicle conflicts at the driveways with vehicles turning from Front Street. Head-in parking could be maintained if necessary for Rite-Aid and the wide open access to Giant Eagle could be reduced to one or two standard sized driveway openings.

Section 4
Route 62 Smart Transportation Corridor StudyFinal Report October 2010
P a g e | 40
East Second Street from Imperial Street to Front Street Due to the narrow lot depth between East Second Street and Front Street, there is less opportunity for shared/cross access in this area. However, existing driveway openings could be narrowed to standard widths to provide better delineation and shorten pedestrian crossings of driveways.
Concept sketches illustrating the proposed access management improvements, as well as a draft model access management ordinance are contained in Appendix H.
Section 4
Route 62 Smart Transportation Corridor StudyFinal Report October 2010
P a g e | 41
Smart Transportation � Solutions tailored to the context of
the community. � Approach and solution tailored to
meet specific project needs. � Projects planned in collaboration
with the community. � Solutions address needs for
alternative modes of transportation. � Solutions formulated using sound
professional judgment. � Scale of the solution is designed
based upon the problem.
Section 4.4 Traffic Signalization Plan
A traffic signal study was performed along the Route 62 Corridor at each of the key study area intersections between Petroleum Street and Wilson Avenue. Using the intersection traffic volumes collected from the intersection turning movement counts, Traffic Signal Warrant 2 (Four-Hour Warrant) and Traffic Signal Warrant 3 (Peak Hour Warrant) contained in the Manual on Uniform Traffic Control Devices (MUTCD) were examined. The volume counts were made during the week and did not consider weekend traffic, which could be considerably higher. The results of these analyses showed that the existing traffic volumes at the following intersections do not meet the minimum volume criteria to warrant a traffic signal (see Appendix I for the detailed worksheets of the warrant analyses):
First Street/Petroleum Street First Street/Central Avenue First Street/State Street
The pedestrian volumes collected during the intersection manual turning movement traffic counts was also reviewed and compared with the criteria for MUTCD Traffic Signal Warrant 4 (Pedestrian Volume). The existing pedestrian crossings across First Street (the major street) at any of these intersections did not meet the minimum 100 crossings per hour. Intersection capacity analyses were then performed at these three (3) intersections for 2009 and 2030 traffic to determine impacts on traffic operations and anticipated delays that would be anticipated if these existing traffic signals were removed. Multi-lane approaches at stop controlled intersections can lead to driver confusion; therefore, single-lane approaches were used for all intersection approaches. These analyses showed that for all-way stop control with a single lane on all intersection approaches Petroleum Street would experience LOS F conditions with an average vehicle stop control delay of over one minute during the PM peak hour. This could result in vehicles queuing back into the Front Street/Petroleum Street intersection and across the bridge. This is already known to occur during weekend peak traffic volumes. Two lanes exist now on Petroleum Street at the intersection of First Street to allow a single left turning lane separate from the right turn/straight through lane. Two lanes also exist on the approach of West First Street onto Petroleum, providing separate left turn and right turn/straight through lanes. For these reasons, the removal of the traffic signal at First Street/Petroleum Street is not recommended and was removed from further consideration.
The capacity analyses for single-lane approaches at the First Street/Central Avenue intersection showed that with current traffic volumes and all-way stop control, all approaches would operate acceptably at LOS C or better during both the morning and evening peak hours.
Section 4
Route 62 Smart Transportation Corridor StudyFinal Report October 2010
P a g e | 42
It should be noted that following a pedestrian fatality that occurred at the intersection of First Street/Central Avenue, the Oil Valley Chapter of the PA Council of the Blind requested the City of Oil City to upgrade the traffic signal to provide audible pedestrian traffic signal operation. This upgrade would include an exclusive pedestrian signal phase, meaning pedestrians would be able to cross the intersection while all vehicles would be stopped. In order to provide this exclusive pedestrian movement, the traffic signal at First Street/Central Avenue must be maintained. The capacity analyses performed for current traffic volumes and single-lane approaches at the First Street/State Street intersection showed that the First Street approach would operate at capacity LOS E during the evening peak hour. This delay would increase in time with an increase in traffic volumes. With the traffic signal and current weekday traffic volumes, the intersection runs at LOS A or B. With increased volumes, signal timings can be adjusted to relieve the Route 62 straight-through traffic. Therefore, it is recommended the traffic signal be maintained. The traffic signal warrant analyses also showed that based on existing traffic volumes, traffic signals are not currently warranted at the following unsignalized intersections; however, peak weekend traffic counts should be collected at these intersections and analyzed prior to any traffic control modifications:
Front Street/Central Avenue Front Street/Wilson Avenue First Street/Wilson Avenue
Section 4
Route 62 Smart Transportation Corridor StudyFinal Report October 2010
P a g e | 43
Smart Transportation � Solutions tailored to the context of
the community. � Approach and solution tailored to
meet specific project needs. � Projects planned in collaboration
with the community. � Solutions address needs for
alternative modes of transportation. � Solutions formulated using sound
professional judgment. � Scale of the solution is designed
based upon the problem.
Section 4.5 Wye Bridge Improvements
Pedestrian connections across the Allegheny River, connecting the south side to the north side, include the State Street and Petroleum Street bridges. These two bridges are in proximity to one another and provide a direct connection to the two downtown core areas of each of the north and south sides. There is also an existing Wye Railroad bridge which crosses the Allegheny River east of the State Street Bridge, near the eastern limits of the study area. The bridge is currently posted for “no pedestrians;” however it is commonly used by pedestrians. The bridge connects the Siverly residential neighborhood on the north side to the commercial, residential and other areas on the south side. The Wye Bridge contains an active rail line which services Continental Plastic Containers approximately three to four times per month. Improvements to the existing bridge would be a strategic solution to provide pedestrian and bicycle use to connect the north and south sides of the river. Improvements to the bridge could include a new trail surface with a railing/fence to separate the trail from the active rail line, lighting, and repainting of the structure. Such improvements would provide a safe and convenient access and could be tied into other improvements such as open space or trail improvements.

Section 4
Route 62 Smart Transportation Corridor StudyFinal Report October 2010
P a g e | 44
Smart Transportation � Solutions tailored to the context of
the community. � Approach and solution tailored to
meet specific project needs. � Projects planned in collaboration
with the community. � Solutions address needs for
alternative modes of transportation. � Solutions formulated using sound
professional judgment. � Scale of the solution is designed
based upon the problem.
Section 4.6 Greenway / Trail
Open space along the southern banks of the Allegheny River provides a convenient opportunity for a hiker/biker trail within the study area. The proposed trail could stretch from the Veteran’s Memorial Bridge to the Wye Railroad Bridge and connect to future trail extensions. The goal of this improvement is to create a pedestrian facility that promotes pedestrian and bicycle use, serving recreational, as well as transportation, purposes. The proposed 10’ wide facility would consist of a handicapped accessible trail surface similar to the high standard surfaces used throughout the Oil Region system of trails. By introducing this improvement along with the Wye Bridge improvement, City residents could enjoy a healthier way of living through safe walking and biking, and also through a reduction in automobile use, noise, air pollution and greenhouse gas emissions.

Section 4
Route 62 Smart Transportation Corridor StudyFinal Report October 2010
P a g e | 45
Smart Transportation � Solutions tailored to the context of
the community. � Approach and solution tailored to
meet specific project needs. � Projects planned in collaboration
with the community. � Solutions address needs for
alternative modes of transportation. � Solutions formulated using sound
professional judgment. � Scale of the solution is designed
based upon the problem.
Section 4.7 Public Plaza
The proposed public plaza is located adjacent to the First Street and Front Street intersection. The goal of this improvement is to create a beautiful pedestrian gathering facility within the study area in a location that is positioned close to the downtown core area of the south side, as well as access to the views and potential recreational opportunities along the Allegheny River. Improvements in this area should also consider the final recommendations contained in the City’s Comprehensive Waterways Plan. The proposed plaza space could include an open space area that includes the existing pavilion. The open space area would provide a year-round passive space. The open space could also be used for special events, including the Oil Heritage Festival and other community events. Elements of the plaza space would need to include a retaining wall to increase the level area at the Front Street elevation. The level area could be constructed of concrete sidewalk, concrete paver sidewalk, a combination of concrete and concrete paver sidewalk or another type of hard walkway surface. The plaza would provide a river overlook outlined by an appropriate height railing. Potential exists for the plaza area to include a seating area, possibly integrated within a series of retaining/seating walls, to provide bleacher type seating for viewing of kayaking or other events along the river. The plaza area would need to provide pedestrian access to other potential improvements within the area. This would include a pedestrian walkway to the downtown core via the Front Street and State Street intersection, a pedestrian walkway to the commercial area via the Front Street and First Street intersection and pedestrian access to a future trail along the Allegheny River via an ADA accessible ramp from the plaza area to the lower banks of the river. Other key elements of the Public Plaza would include appropriate scaled lighting to provide the necessary security and site furnishings including benches, trash receptacles and bicycle racks.

Section 4
Route 62 Smart Transportation Corridor StudyFinal Report October 2010
P a g e | 46
Section 4.8 Land Use and Economic Development Opportunities
Coordinating land use, economic development and transportation is considered a facet of “smart growth” or “sustainable development.” This section explores opportunities for land use and economic development based upon transportation system enhancements increasing viable options for people to access opportunities, goods, services and other resources that improve the quality of life for City residents as well as residents of the region. The goal is to create a balance of mixed uses including housing, educational, employment, recreational, retail and service opportunities within the South Side Business District through:
improved access; increased variety of consumer goods and services within clusters; increased spending for consumer goods and services from residents of the City and region; enhanced amenities and aesthetics to provide an inviting environment for residents, businesses, shoppers and visitors; and improved regulation of land use and building condition to support business development.
Section 4.8.1 Methods for Determining a Balanced Mix of Uses
The following outlines the methods for assessment and analysis to support development of revitalization strategies with respect to land use and economic development opportunities:
Assessing Building and Business Inventory Business Community SWOT Analysis and Visual Preference Survey Analyzing the Business Mix using a Gap Analysis Analyzing Local Economics Revitalization Strategies
Section 4.8.2 Assessing Building and Business Inventory
A building and business inventory provides the foundation for describing, understanding, and restructuring the economy of the business district and downtown area. The “Route 8 and Route 62 Corridor Evaluation” performed by Hickory Engineering in 2005 generated a database of all buildings, land parcels, and properties along Route 62 in Oil City and detailed building condition reports and adaptive use/reuse plans for two buildings in the current Route 62 study area - the Latonia Theater building at 1 East First Street and the C. F. Cramer block at 2-30 West Front Street. Some basic information has been compiled as part of the current Route 62 Smart Transportation Study with respect to building condition, use/occupancy and business type for each structure located in the core of the South Side Business District. Over time, this information can be routinely updated and augmented with more detailed assessment and analysis. A summary of this information is depicted on maps and street profiles contained in Section 5. Based upon the information assembled, assessed and analyzed to date, the following key issues of concern have been identified with respect to building condition and business type. Key issues of concern with respect to building condition and integrity include:
Underutilization of first floor space; Vacant and underutilized upper floor space; Substandard minor and major conditions of upper floors and roof damage to several buildings; and

Section 4
Route 62 Smart Transportation Corridor StudyFinal Report October 2010
P a g e | 47
Façade modifications altering original architectural character of the building detracts from the physical appearance and aesthetics of the environment.
Key issues of concern with respect to business inventory include: Quality of business establishments; Lack of business clusters with respect to specialty stores; Although a cluster of restaurants is in place, a more robust mix is necessary to achieve higher attraction rates; Although a cluster of retail operations with convenience and household items exists, a more robust mix is necessary to achieve higher attraction rates; and Lack of business services available.
Section 4.8.3 Business Community SWOT Analysis and Visual Preference Survey
The South Side Business Association participated in the planning process and was actively engaged in discussions about study area strengths, weaknesses, opportunities and threats as well as provided responses to a Visual Preference Survey (VPS). The results of each of these activities is summarized in Appendix A: Community Participation Report. Input received from the business community was used to guide technical analysis and strategy development contained in this section.
Section 4.8.4 Analyzing the Business Mix using a Gap Analysis
A Gap Analysis was conducted for three areas within a defined trade area. Retail spending was assessed considering the trade area as the study area plus an eight-mile radius. Within this trade area retail spending was also assessed for the study area, Oil City (an approximate two-mile radius around the study area) and Oil City with an eight-mile radius. The Gap Analysis was used to analyze the business mix indicating the general areas where opportunity gaps as well as surplus gaps may be for retail goods and services. The following briefly describes an opportunity and surplus gap. Refer to Appendix F for a detailed GAP Analysis for Oil City and the surrounding area defined as the Trade Area for this analysis. Opportunity and surplus gaps can be defined as follows:
An opportunity gap occurs when a household must resort to spending their retail dollars on goods and services outside their neighborhood or locale due to one or more of the following conditions:
The specific type of retail opportunity does not exist in the neighborhood; The quality of goods and services is simply better outside the region; The existing retail establishments do not carry enough product to service the neighborhood;
or The type of retail goods or services does not meet the needs of the neighborhood residents.
This circumstance is referred to as an opportunity gap because, due to reasons mentioned, there is the potential for new or expansion of existing businesses to meet local demands.
A surplus gap occurs when local retail sales of goods and services exceed household spending for goods and services. A surplus indicates that local retail stores are making sales to non-local households. This circumstance is referred to as a surplus because it indicates that locally there are more goods and

Section 4
Route 62 Smart Transportation Corridor StudyFinal Report October 2010
P a g e | 48
services than the actual number of household residents can consume. If the surplus gap is exceptional or unique to a specific locality, this type of repeating expenditures could be considered a “niche” within a market area. The opportunity gaps indicating the expenditure of local dollars outside the community (goods and services not adequately provided for in the local community) and the surplus gaps of goods and services provided in the City or Surrounding Area are further identified and quantified in Appendix G: Gap Analysis. The results of this analysis can be used to identify business development opportunities, such as those identified on the following table, identifies areas to target business development in the context of physical space and configuration of land use patterns in a small town business district. The following information identifies potential opportunities to establish business clusters and niche businesses in vacant and underutilized space as well as in occupied space as uses change. The information presented represents the unmet demand for retail goods and services within the Trade Area. These opportunities should be viewed as areas for further exploration with current businesses and prospective business owners on a small scale. The information in the table below indicates the maximum amount of space that could supply goods and services to meet the demand for those services purchased outside of the Trade Area.
TABLE 4.2: Business Cluster and Niche Business Development Opportunities based upon Consumer Spending Outside of Trade Area
Business Type
Annual Opportunity
Gap in Target Area
Business Expansion or Business Development Opportunity
Demand for Maximum Square Footage within Target Area
($150-$250 in sales/sq. foot) Restaurants
Full-Service Restaurant $9,318,130 3,727 - 6,212
Limited-Service Eating Place $14,255,402 57,021 – 95,036
Special Food Services $3,499,081 13,996 – 23,327
Specialty Niches
Camera and Photographic Equipment Store $377,033 1,508 – 2,513
Luggage and Leather Goods $247,418 989 – 1,649
Hobby, Toy and Game Store $793,444 3,173 – 5,289
Book Store and Newsstand $820,772 3,283 – 5,471
Gift, Stationery, Office Supply and Novelty Store $1,157,137 4,628 – 7,714
Sporting Goods Store $3,688,326 14,753 – 24,588
Music and Musical Instrument Store $360,635 1,442 – 2,404
The rule of thumb for determining the amount of space for retail use is minimum $150 of sales per square foot. Based upon Gap Analysis results, stores with first-floor and second-floor spaces consisting of 1,000 -2,000 and 3,000 square feet can be physically and financially supported in the South Side Downtown District.
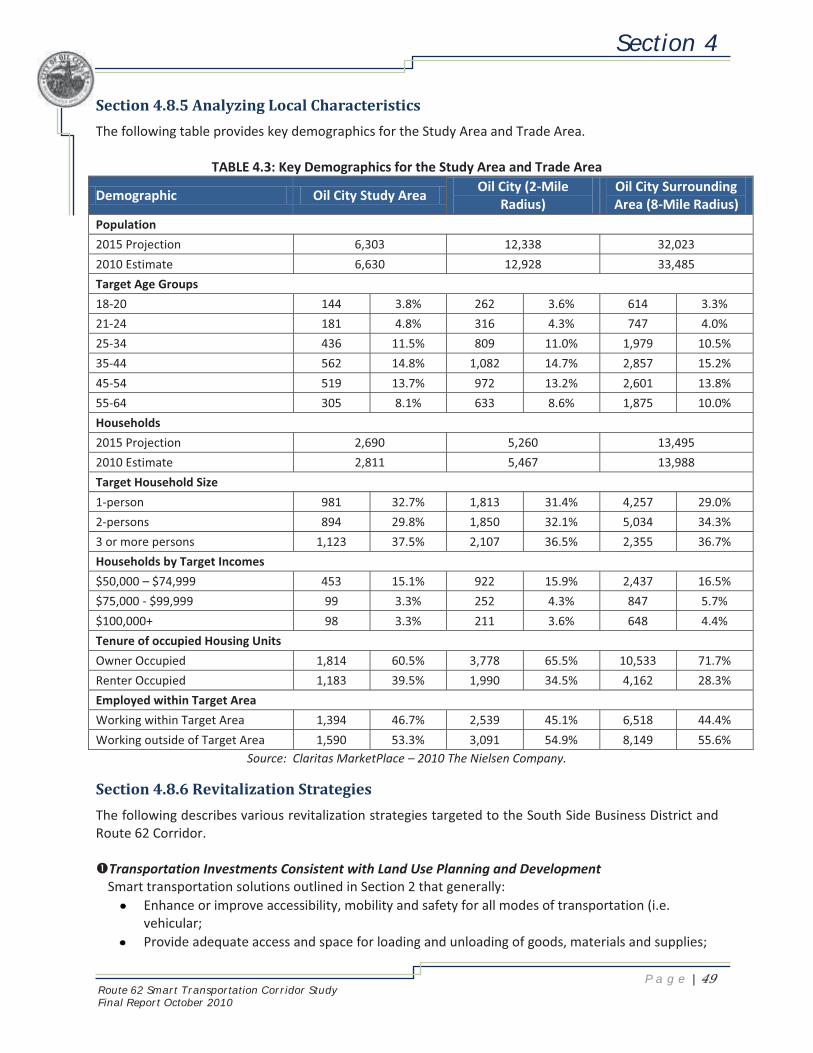
Section 4
Route 62 Smart Transportation Corridor StudyFinal Report October 2010
P a g e | 49
Section 4.8.5 Analyzing Local Characteristics
The following table provides key demographics for the Study Area and Trade Area.
TABLE 4.3: Key Demographics for the Study Area and Trade Area
Demographic Oil City Study Area Oil City (2-Mile
Radius) Oil City Surrounding Area (8-Mile Radius)
Population
2015 Projection 6,303 12,338 32,023
2010 Estimate 6,630 12,928 33,485
Target Age Groups
18-20 144 3.8% 262 3.6% 614 3.3%
21-24 181 4.8% 316 4.3% 747 4.0%
25-34 436 11.5% 809 11.0% 1,979 10.5%
35-44 562 14.8% 1,082 14.7% 2,857 15.2%
45-54 519 13.7% 972 13.2% 2,601 13.8%
55-64 305 8.1% 633 8.6% 1,875 10.0%
Households
2015 Projection 2,690 5,260 13,495
2010 Estimate 2,811 5,467 13,988
Target Household Size
1-person 981 32.7% 1,813 31.4% 4,257 29.0%
2-persons 894 29.8% 1,850 32.1% 5,034 34.3%
3 or more persons 1,123 37.5% 2,107 36.5% 2,355 36.7%
Households by Target Incomes
$50,000 – $74,999 453 15.1% 922 15.9% 2,437 16.5%
$75,000 - $99,999 99 3.3% 252 4.3% 847 5.7%
$100,000+ 98 3.3% 211 3.6% 648 4.4%
Tenure of occupied Housing Units
Owner Occupied 1,814 60.5% 3,778 65.5% 10,533 71.7%
Renter Occupied 1,183 39.5% 1,990 34.5% 4,162 28.3%
Employed within Target Area
Working within Target Area 1,394 46.7% 2,539 45.1% 6,518 44.4%
Working outside of Target Area 1,590 53.3% 3,091 54.9% 8,149 55.6% Source: Claritas MarketPlace – 2010 The Nielsen Company.
Section 4.8.6 Revitalization Strategies
The following describes various revitalization strategies targeted to the South Side Business District and Route 62 Corridor. �Transportation Investments Consistent with Land Use Planning and Development
Smart transportation solutions outlined in Section 2 that generally: Enhance or improve accessibility, mobility and safety for all modes of transportation (i.e. vehicular; Provide adequate access and space for loading and unloading of goods, materials and supplies;
Section 4
Route 62 Smart Transportation Corridor StudyFinal Report October 2010
P a g e | 50
Provide sufficient design of space at intersections for truck turning movements; Provide transit connections and pedestrian and bicycle safety improvements with connections to open space and recreational areas; and Provide amenities for pedestrians as part of streetscape elements.
�Upper Floor Usage & Building Rehabilitation
A considerable number of structures within the core of the South Side Business District have vacant or underutilized (storage) upper floors. Second floor use for retail and office space is important as well as upper floor use for apartments, and should be targeted for this area. One important factor is the condition of upper floors in the South Side Business District. Many of the upper floors require substantial or major rehabilitation resulting in considerable private or public-private investment. Programs and incentives should be developed to support rehabilitation of structures.
Office uses play an important role in supporting the expansion or addition of retail space. Office uses such as real estate agents, mortgage brokers, accountants, doctors’ offices and lawyers, if signed appropriately, can benefit from a second or third floor location above a vibrant retail establishment. Build upon existing loan programs, including the Oil Region Alliance’s Revolving Loan Fund for Route 8/62 for historic preservation and/or increased adaptive reuse, by developing a Mixed-Use Rehabilitation Loan Program with requirements for first floor commercial and upper floor office or apartment uses.
o Ensure rehabilitation efforts incorporate design requirements for rehabilitation of existing or infill development for ground floor spaces that are appropriate for retail tenants, even if retail tenants do not occupy them. Architectural features, access and window configuration should be such to support retail space.
o Support the development of second and third story office or residential uses. �Façade Improvement Program Continue a Façade Improvement Program designed to promote the continued use and maintenance of commercial buildings in the South Side Business District by helping property owners and tenants rehabilitate and restore eligible structures. Support implementation of this program by:
Allocating dedicated grants for a Façade Improvement Program for historic renovations. Enhancing and promoting the City’s Façade Improvement Program. Establishing eligibility criteria for façade improvements (exterior improvements) such as:
o Exit doors; o Painting; o Shutters and awnings; o Signs; o Stairs, porches, railings and exits; and o Walls, windows and cornices.
�Business Retention and Expansion Offer a program for business retention and expansion to support businesses to become or remain profitable within the South Side Business District. A program of this type will be designed to help existing businesses survive and grow. This strategy includes the following components:
Continue to build a detailed market analysis using the results of this study as the basis for further development of current information useful in business retention such as:
Section 4
Route 62 Smart Transportation Corridor StudyFinal Report October 2010
P a g e | 51
o Characteristics of the business district; o Description of the Trade Area; o Characteristics of existing and potential customers; and o Trends and future opportunities.
Conduct a detailed business survey. Continue to identify key businesses creating business clusters and niches.
�Niche Retail Opportunities
In the South Side Business District, niches already exist, but simply need to be organized. Strategies to grow these niches to become more visible can be achieved through store expansion, recruitment of new businesses and cooperative advertising and promotion (i.e. branding). The following describes the strategy for strengthening the existing niche markets:
Build upon the Farmers’ Market by creating a Festive Marketplace consisting of restaurants and specialty shops along with several stores offering convenience items to local residents. Build upon existing niches targeting the following opportunities.
Restaurant Niche Opportunities The following are opportunities for consideration that build upon an existing cluster of restaurant uses:
o Expand dining opportunities by offering a mix of dining opportunities from take-out, casual to fine dining (breakfast, lunch and evening dining opportunities);
Full-Service Restaurants; Special Food Services; Limited-Service Eating Places; and
o Specialty food stores combined with dining opportunities.
Restaurants should be encouraged to use outdoor areas where possible. The sidewalk and plaza area in front of the restaurants can serve this purpose. Adding a few tables with colorful umbrellas can add greatly to the visual quality of the street. Besides enhancing the vitality of the street scene, outdoor areas increase restaurant capacity with minimal increase in fixed costs. With the addition of heating elements, these tables can be used into the colder months (Fall and Spring) of the year.
Residents of the downtown area are an important market segment for existing and future dining operations in the downtown. This opportunity can be strengthened by daytime workers and tourists. The National Restaurant Association has identified four major groups of frequent diners.
o Busy parents of children often involved in after-school activities and sports typically use
drive-thru and carry-out restaurants. o Older adults and empty nesters typically eat on-premises at inexpensive sit-down
restaurants, buffets and fast food eateries. o People who are convenience driven and dislike cooking (with no young children)
typically use a variety of carry-out sources including restaurants and grocery stores. o Young, urban professionals with no children dine at higher priced establishments.

Section 4
Route 62 Smart Transportation Corridor StudyFinal Report October 2010
P a g e | 52
TABLE 4.4: Population Characteristics Supporting Restaurant Dining
Factor Threshold Target Market Characteristics
Oil City Study Area
Oil City with 2-mile radius
Oil City with 8-mile radius
Household Income
Annual Income: $50,000 – 74,999 Spends $500 to $1,396 per capita on food away from home
15.1% 15.9% 16.5%
Annual Income: $75,000- $99,999 Spends $1,396 per capita on food away from home
3.3% 4.3% 5.7%
Age Householder age 45-55 spend more per capita on food away from home
13.7% 13.2% 13.8%
Household Size One and two person households spend more per capita on food away from home
62.6% 63.5% 63.2%
Household Composition
Husband and wife composition spend more per capita on food away from home
46.2% 48.6% 53.1%
Occupation Managerial and professional occupations spend the most per capita on food away from home
49.0% 19.2% 17.0%
Source: Claritas MarketPlace – 2010 The Nielsen Company. Specialty Niche Opportunities The following are a list of potential specialty niche opportunities that tend to cluster in smaller urban areas:
o Camera and Photographic Equipment Store; o Luggage and Leather Goods; o Hobby, Toy and Game Store; o Book Store and Newsstand; o Gift, Stationery, Office Supply and Novelty Store; o Sporting Goods; and o Music and Musical Instrument Store.
�Festive Marketplace with Connection to the Waterfront
The festive marketplace strategy is used to reverse the negative trends by attracting local residents, suburban residents and out-of-town visitors to downtown areas. A typical festive marketplace includes local involvement in the creation of a safe and trendy attraction intended to serve as a major catalyst for other redevelopment. Generally, a festive marketplace offers major restaurants, specialty retail shops, and a cluster of international foods. The more successful projects seem to benefit from waterfront locations and secure parking. The festive marketplace attracts the recreational shopper/tourist shopper but is also likely to attract the convenience shopper as more residential development on upper floors takes place. The area is likely to continue attracting area residents for dining and entertainment. An opportunity for further exploration is expansion of the existing seasonal farmers market with connection along First Street to designated space along the waterfront for additional vendors with opportunities for shopping and dining as local residents and visitors travel on foot or bicycle along First Street from Central Avenue (location of traditional farmer’s market) to the waterfront (new

Section 4
Route 62 Smart Transportation Corridor StudyFinal Report October 2010
P a g e | 53
location for additional vendors). This opportunity may not succeed, however, without additional parking opportunities in this area.
Adequate Parking Supply Maintain sufficient parking on-site, on-street and in shared parking lots throughout the South Side Business District. Ensure sufficient time restrictions are placed based upon location of high demand and higher frequency of use. Develop a Parking Management Strategy as revitalization efforts warrant. �Strengthen Residential Neighborhoods Strengthen residential neighborhoods through rehabilitation, renovation and property maintenance with an increase in property values. Provide for appropriate pedestrian and bicycle safety measures to allow for these modes of travel to and from neighborhoods to the South Side Business District. Provide for sufficient densities to support commercial revitalization efforts. �Land Use Regulation and Building Codes Review and update land use regulations and building codes to address the following while maintaining consistency with the recently revised Multi-Municipal Regional Plan:
Consider Form-based Zoning for the South Side Business District with emphasis on design of public and private space with emphasis on vertical mixed use where retail or commercial are on the ground floor and residential or commercial are on upper floors. Strengthen the property maintenance code. Adopt a sign code conducive to urban environment with consideration of mass, scale, location and materials.
�Regional Tourism and Marketing Strategy
Establish connections between North Side Business District and South Side Business District through coordination and promotion of events, wayfinding signage, access to the waterfront, streetscape improvements, aesthetics and other means. Conduct joint business association meetings for the North Side Business District and the South Side Business District in order to cross market, establish a brand for Oil City and jointly promote shopping, dining, entertainment, recreation and tourism opportunities. Identify target markets.
Section 4.9 South Side Business District Revitalization Concepts
This section identifies revitalization concepts for the South Side Business District with emphasis on the core of the district. The following provides an understanding of existing conditions and potential revitalization concepts for the South Side Business District.
Section 4
Route 62 Smart Transportation Corridor StudyFinal Report October 2010
P a g e | 54
THIS PAGE INTENTIONALLY LEFT BLANK
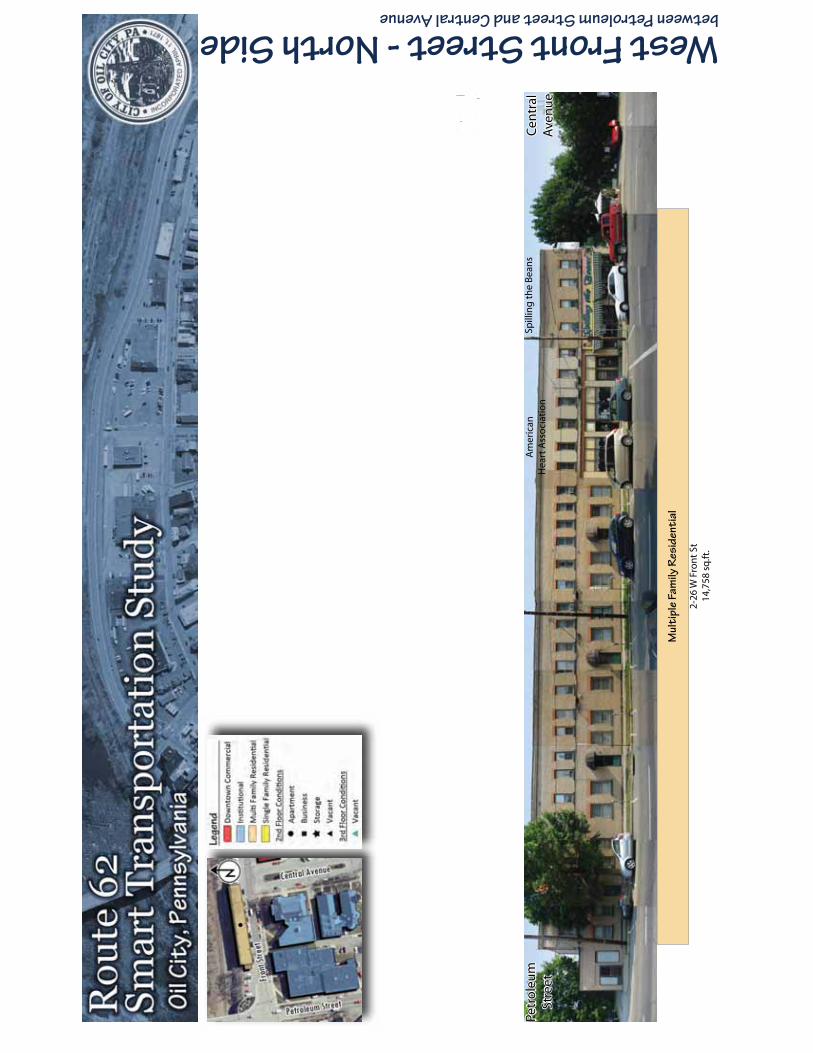
West Front Street - North Side between Petroleum Street and Central Avenue
Cen
tral
Ave
nu
e
Petr
ole
um
Stre
et
Mul
tipl
e Fa
mily
Res
iden
tial
Spill
ing
th
e B
ean
sA
mer
ican
Hea
rt A
sso
ciat
ion
2-26
W F
ron
t St
14,7
58 s
q.ft
.
Cen
tral
Ave
nu
ePe
tro
leu
mSt
reet
Cen
tral
Ave
nu
e

West Front Street - South Side between Petroleum Street and Central Avenue
2 C
entr
al A
ve24
,042
sq
.ft.
Cen
tral
Ave
nu
ePe
tro
leu
mSt
reet
Oil
Cit
y Pu
blic
Lib
rary
7 Pe
tro
leu
m S
t22
,816
sq
.ft.
Inst
itut
iona
l
Cen
tral
Ave
nu
ePe
tro
leu
mSt
reet
YM
CA
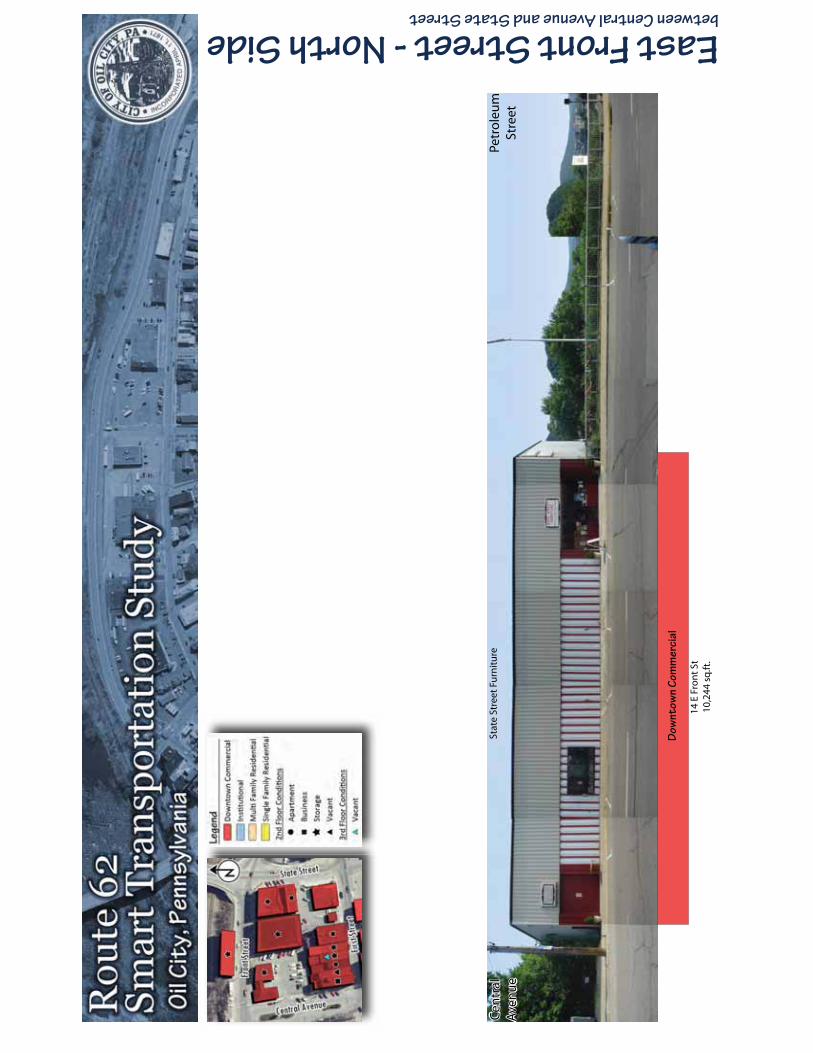
East Front Street - North Side between Central Avenue and State Street
Dow
ntow
n Co
mm
erci
al
Stat
e St
reet
Fu
rnit
ure
14 E
Fro
nt
St10
,244
sq
.ft.
Cen
tral
Ave
nu
ePe
tro
leu
mSt
reet
Cen
tral
Ave
nu
e
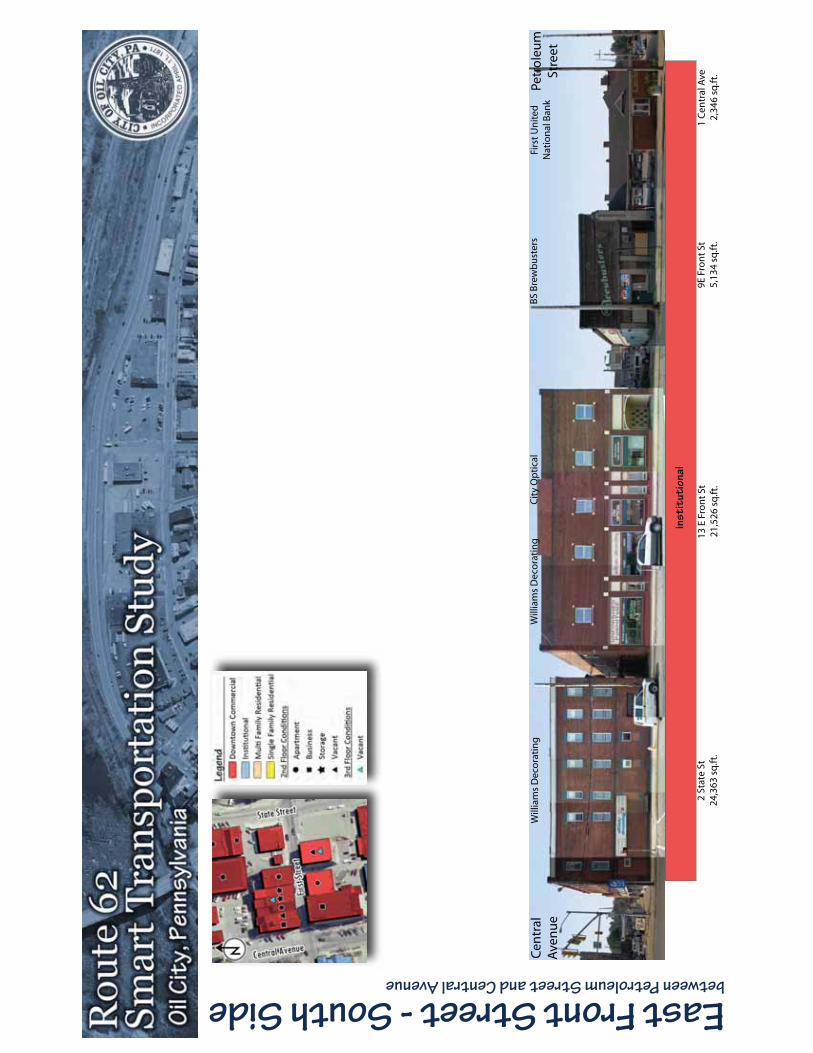
East Front Street - South Side between Petroleum Street and Central Avenue
2 St
ate
St24
,363
sq
.ft.
Will
iam
s D
eco
rati
ng
9E F
ron
t St
5,13
4 sq
.ft.
Inst
itut
iona
l
Cen
tral
Ave
nu
ePe
tro
leu
mSt
reet
Cit
y O
pti
cal
Will
iam
s D
eco
rati
ng
BS
Bre
wb
ust
ers
Firs
t U
nit
edN
atio
nal
Ban
k
13 E
Fro
nt
St21
,526
sq
.ft.
1 C
entr
al A
ve2,
346
sq.ft
.

West First Street - North Side between Petroleum Street and Central Avenue
Cen
tral
Ave
nu
ePe
tro
leu
mSt
reet
Inst
itut
iona
l
Ch
rist
Epis
cop
alC
hu
rch
YM
CA
16 C
entr
al A
ve10
,352
sq.ft
.7
Petr
ole
um
St
22,8
16 s
q.ft
.
Cen
tral
Ave
nu
e
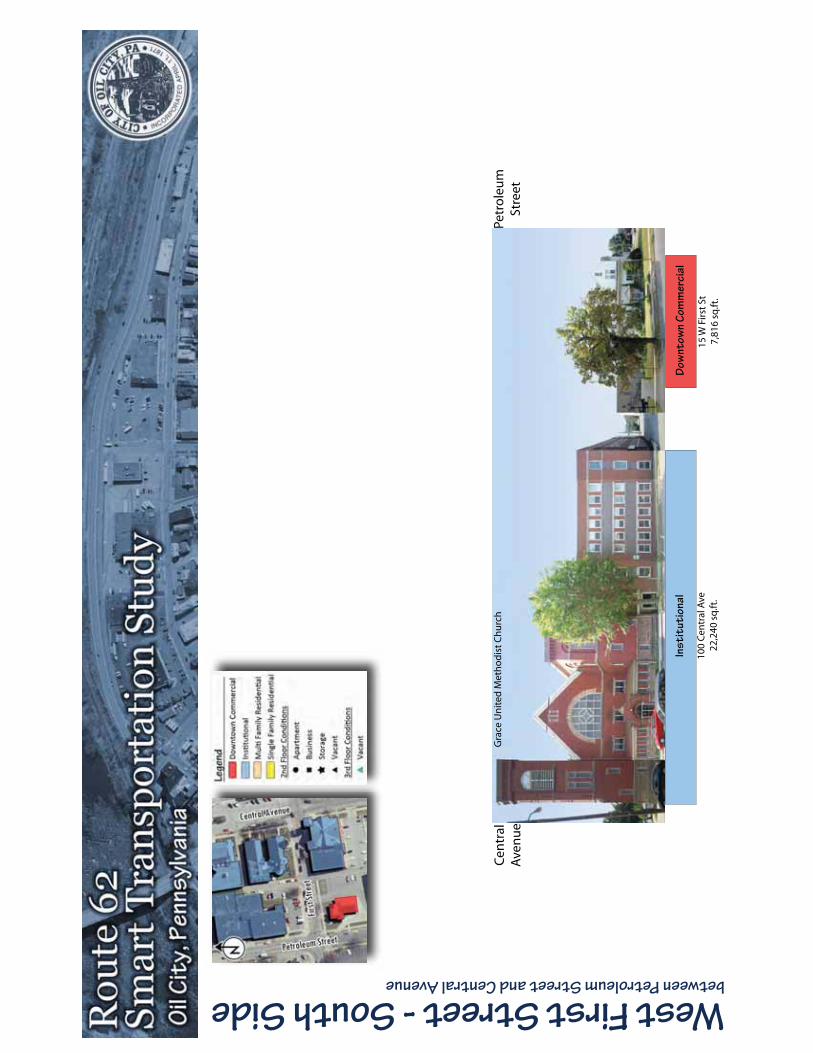
West First Street - South Side between Petroleum Street and Central Avenue
Dow
ntow
n Co
mm
erci
al
100
Cen
tral
Ave
22,2
40 s
q.ft
.
Cen
tral
Ave
nu
ePe
tro
leu
mSt
reet
Gra
ce U
nit
ed M
eth
od
ist
Ch
urc
h
15 W
Fir
st S
t7,
816
sq.ft
.
Inst
itut
iona
l
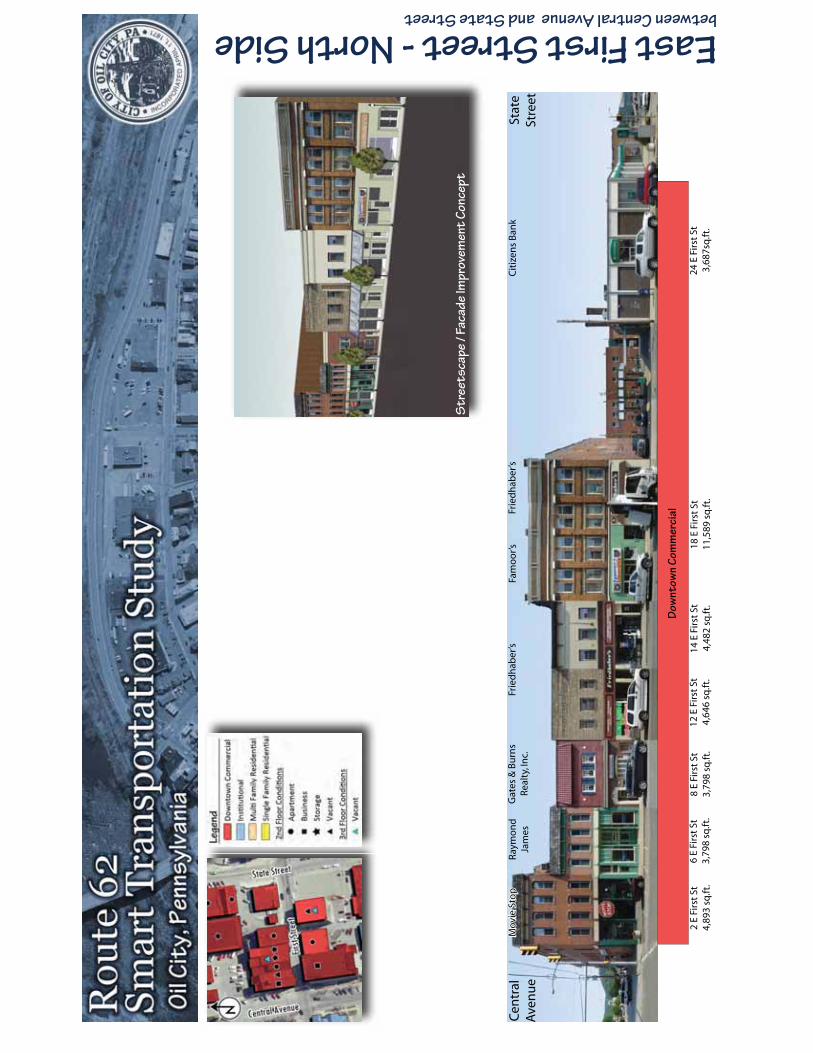
East First Street - North Side between Central Avenue and State Street
Stat
eSt
reet
Cen
tral
Ave
nu
e
Dow
ntow
n Co
mm
erci
al
Cit
izen
s B
ank
Ray
mo
nd
Jam
es
18 E
Fir
st S
t11
,589
sq
.ft.
24 E
Fir
st S
t3,
687s
q.ft
.
Frie
dh
aber
’s
Str
eets
cape
/ Fa
cade
Impr
ovem
ent
Conc
ept
2 E
Firs
t St
4,89
3 sq
.ft.
Fam
oo
r’sFr
ied
hab
er’s
Gat
es &
Bu
rns
Real
ty, I
nc.
Mov
ie S
top
6 E
Firs
t St
3,79
8 sq
.ft.
8 E
Firs
t St
3,79
8 sq
.ft.
12 E
Fir
st S
t4,
646
sq.ft
.14
E F
irst
St
4,48
2 sq
.ft.
Mov
ie S
top

East First Street - South Side between State Street and Central Avenue
Dow
ntow
n Co
mm
erci
al
19 E
Fir
st S
t19
,785
sq
.ft.
25 E
Fir
st S
t5,
943
sq.ft
.
Str
eets
cape
/ Fa
cade
Impr
ovem
ent
Conc
ept
9-15
E F
irst
St
9,50
2 sq
.ft.
Stat
eSt
reet
Cen
tral
Ave
nu
e
Ch
en’s
Gar
den
Firs
tN
atio
nal
Ban
k
Fran
klin
Oil
Reg
ion
Cre
dit
Un
ion
Clif
ford
’s C
arp
ets
1E F
irst
St
35,4
00 s
q.ft
.
Pro
fess
ion
alV
isio
n C
are
Lato
nia
Bar
ber
Sh
op
No
rth
wes
tSa
vin
gs
Ban
k
Bu
tler
’s C
and
ies/
Dee
Fo
ster
Mas
sag
e Th
erap
ist
Mas
on
icLa
ton
ia T
hea
tre
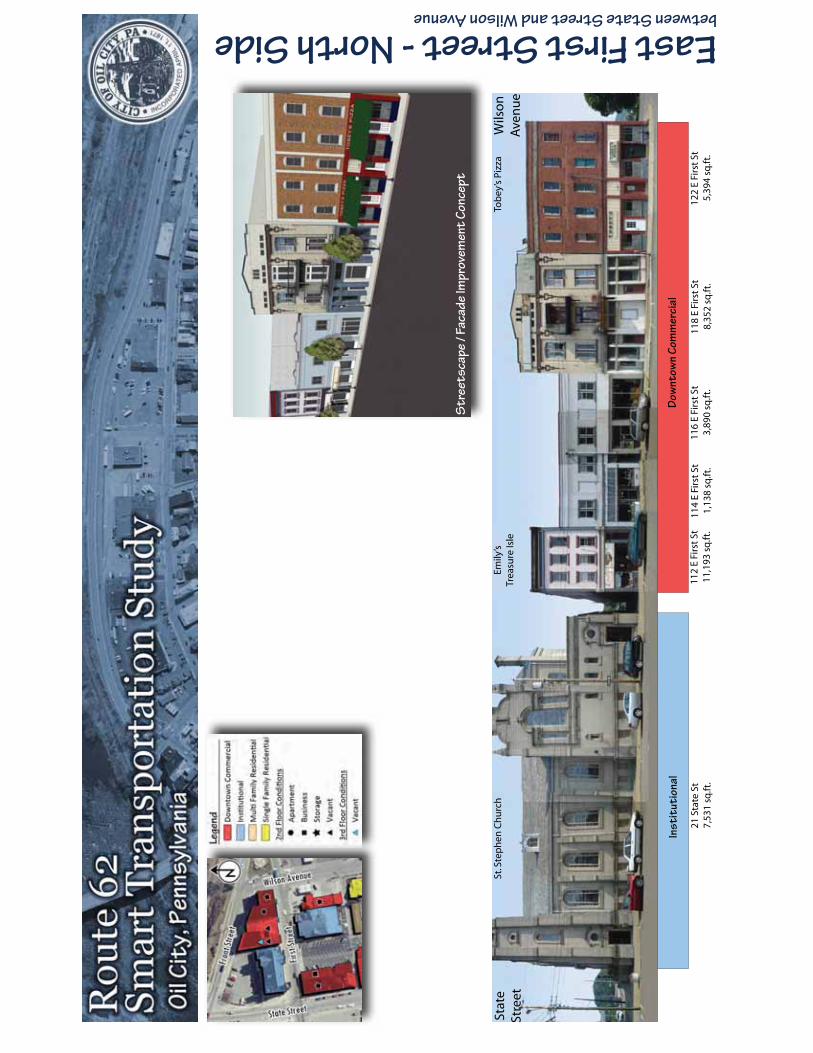
East First Street - North Side between State Street and Wilson Avenue
Wils
on
Ave
nu
eSt
ate
Stre
et
Dow
ntow
n Co
mm
erci
alIn
stit
utio
nal
114
E Fi
rst
St1,
138
sq.ft
.
Tob
ey’s
Pizz
aSt
. Ste
ph
en C
hu
rch
112
E Fi
rst
St11
,193
sq
.ft.
116
E Fi
rst
St3,
890
sq.ft
.11
8 E
Firs
t St
8,35
2 sq
.ft.
122
E Fi
rst
St5,
394
sq.ft
.
Emily
’sTr
easu
re Is
le
Str
eets
cape
/ Fa
cade
Impr
ovem
ent
Conc
ept
21 S
tate
St
7,53
1 sq
.ft.
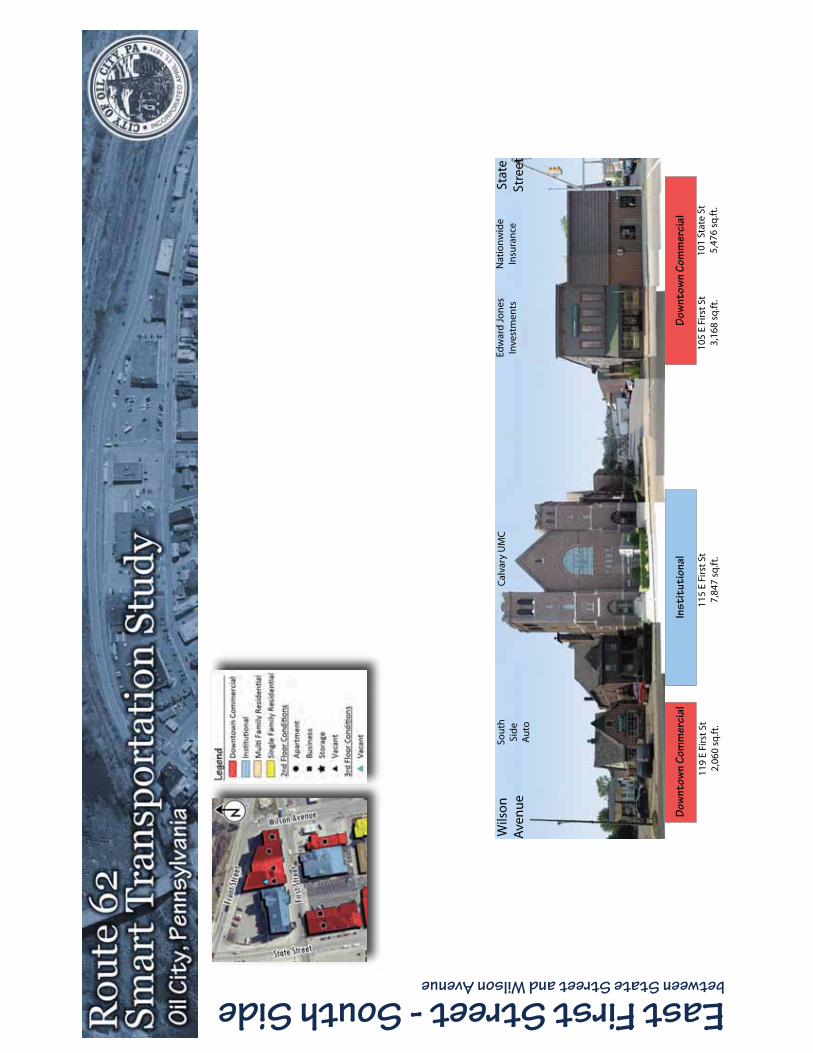
East First Street - South Side between State Street and Wilson Avenue
Dow
ntow
n Co
mm
erci
alIn
stit
utio
nal
115
E Fi
rst
St7,
847
sq.ft
.11
9 E
Firs
t St
2,06
0 sq
.ft.
105
E Fi
rst
St3,
168
sq.ft
.
Wils
on
Ave
nu
eSt
ate
Stre
et
Nat
ion
wid
eIn
sura
nce
Edw
ard
Jo
nes
Inve
stm
ents
Sou
thSi
de
Au
to
Cal
vary
UM
C
Dow
ntow
n Co
mm
erci
al
101
Stat
e St
5,47
6 sq
.ft.

Central Avenue - West Side between Front Street and First Street
Inst
itut
iona
l
Ch
rist
Ep
isco
pal
Ch
urc
h
16 C
entr
al A
ve10
,352
sq
.ft.
Firs
tSt
reet
Fro
nt
Stre
etFi
rst
Stre
et
Ch
rist
Ep
isco
pal
Ch
urc
hO
il C
ity
Lib
rary
2 C
entr
al A
ve24
,042
sq
.ft.
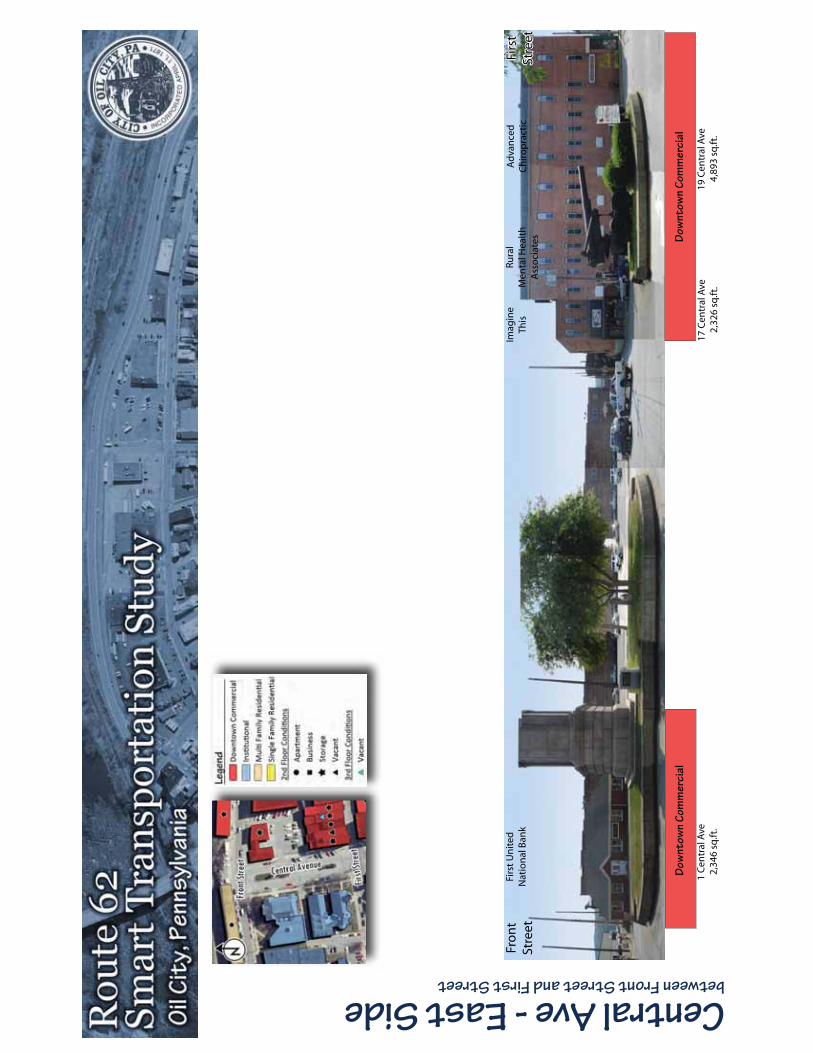
Central Ave - East Side between Front Street and First Street
19 C
entr
al A
ve4,
893
sq.ft
.
Dow
ntow
n Co
mm
erci
al
Fro
nt
Stre
etFi
rst
Stre
et
Imag
ine
This
Ad
van
ced
Ch
iro
pra
ctic
Firs
t U
nit
edN
atio
nal
Ban
k
1 C
entr
al A
ve2,
346
sq.ft
.
Firs
tSt
reet
Rura
lM
enta
l Hea
lth
Ass
oci
ates Do
wnt
own
Com
mer
cial
17 C
entr
al A
ve2,
326
sq.ft
.

State Street - East Side between Front Street and First Street
21 S
tate
St
7,53
1 sq
.ft.
Fro
nt
Stre
etFi
rst
Stre
et
St. S
tep
hen
Ch
urc
hFi
rst
Stre
et
Inst
itut
iona
l

State Street - West Side between Front Street and First Street
Fro
nt
Stre
etFi
rst
Stre
et
Cit
izen
s B
ank
2 St
ate
St13
,020
sq
.ft.
Will
iam
s Tr
avel
Will
iam
sIn
sura
nce
& T
rave
l
Will
iam
s D
eco
rati
ng
Dow
ntow
n Co
mm
erci
alDo
wnt
own
Com
mer
cial
6 St
ate
St1,
760
sq.ft
.8
Stat
e St
3,53
4 sq
.ft.
24 S
tate
St
3,68
7 sq
.ft.
Section 5
Route 62 Smart Transportation Corridor StudyFinal Report October 2010
P a g e | 69
Section 5.0 Action Plan Several improvements have been identified to address the overall project purpose of providing the City of Oil City with an approach to the development of transportation and land use improvements within the city’s south side area based upon PennDOT’s Smart Transportation initiative. These improvements focus on solutions that meet the goals defined by the City and project steering committee.
Section 5.1 Project Prioritization and Implementation
The various projects that contribute to fulfilling the vision for Smart Transportation solutions along the Route 62 Corridor and surrounding south side area have been analyzed in terms of cost, impact to the community, financing, necessary partnerships, and improvement to the local economy. Through this analysis the following project implementation and prioritization strategy has been developed.
High Level Priorities
o Central Avenue Streetscape Improvements � Central Avenue improvements would provide necessary infrastructure
improvements and an aesthetically pleasing upgrade to the pedestrian and roadway facilities between the limits of Front Street and Second Street. The improvements will accomplish these goals without impact to the existing cannon and monuments within the central island area.
o Central Avenue and First Street Signal Improvements
� Accessible (or Audible) Pedestrian Signal (APS) improvements at the intersection of Central Avenue and First Street will provide a safer crossing condition for the visually impaired pedestrian, as well as all pedestrians. The goal of an APS is to provide an audible notification of when it is safe to cross at an intersection. In addition, most modern devices are equipped with Braille to provide additional directions for operating the pedestrian push button.
o Second Street Streetscape Improvements
� Streetscape improvements along the Second Street Corridor, from Wilson Avenue to Front Street would provide functional and aesthetic improvements to the existing pedestrian facilities along this commercial/residential corridor. The improvements should be completed in coordination with access management improvements along the commercial side of the corridor, as well as infrastructure upgrades to the existing public water facilities.
o Front Street (Route 62) Corridor � A “road diet” project along the Route 62 Corridor will establish a transportation
facility that is consistent with existing and projected traffic volumes while promoting alternative modes of transportation through the inclusion of pedestrian facilities. This can be done in a phased approach, with the first phase establishing the new traffic patterns with turning lanes through the use of pavement markings only.

Section 5
Route 62 Smart Transportation Corridor StudyFinal Report October 2010
P a g e | 70
o First Street Roundabout � A single-lane roundabout at the intersection of First Street / Wilson Avenue and
Front Street will provide a gateway into the business district of the south side of Oil City while calming traffic and improving the overall safety of motor vehicles and pedestrians.
o Land Use Initiatives � Incorporation of the various revitalization strategies identified in the previous
section with a focus of balancing the transportation and land use initiatives to enhance the downtown core of the south side business district.
Middle Level Priorities
o Downtown Core Streetscape � Streetscape improvements within the downtown core area will provide an
impact related to the Smart Transportation goals and objectives that were used as guidance through the development of the corridor study. The streetscape improvement would be focused on safety and aesthetic improvements to the pedestrian facilities. These improvements could be completed at once or packaged as smaller, more affordable projects.
o Railroad Wye Bridge � Currently, the railroad bridge is posted for no pedestrians, however, the bridge
is commonly used as an access means between the north side and south side of Oil City. Bridge safety improvements, as well as upgraded pedestrian and bicycle facilities would provide a safe and convenient access between the residential area on the north side and the commercial area on the south side. Implementation of these improvements will require coordination and buy-in from leaseholder Western New York and Pennsylvania Railroad.
o Rail Trail
� Open space along the southern banks of the Allegheny River provides a convenient opportunity for a hiker/biker trail within the study area. The proposed trail could stretch from the Veteran’s Memorial Bridge to the Wye Railroad Bridge and connect to future trail extensions. The goal of this improvement is to create a pedestrian facility that promotes pedestrian and bicycle use for recreational purposes, as well as transportation purposes. Implementation of these improvements will require coordination and buy-in from leaseholder Western New York and Pennsylvania Railroad.
o Public Plaza
� The proposed public plaza is located adjacent to the State Street and Front Street intersection. The goal of this improvement is to create a beautiful pedestrian gathering facility within the study area in a location that is close to the downtown core area of the south side, as well as access to the views and potential recreation opportunities along the Allegheny River.
Section 5
Route 62 Smart Transportation Corridor StudyFinal Report October 2010
P a g e | 71
While the above solutions are categorized in “High Level” and “Mid-Level” priorities, the final implementation of these improvements will be finalized based upon available funding and partnership opportunities. It is recommended that the City of Oil City utilize the priorities to allow for a focused effort to obtain funding, but be willing to modify their course for the better good of the City. The following project sheets provide the base information pertaining to each of the proposed improvements, including the necessary information for the County’s Transportation Improvement Program (TIP).

Section 5
Route 62 Smart Transportation Corridor StudyFinal Report October 2010
P a g e | 72
THIS PAGE INTENTIONALLY LEFT BLANK

Project Description:
Central Avenue improvements would provide necessary infrastructure improvements and aesthetically pleasing upgrades to the pedestrian and roadway facilities. The improvements will accomplish these goals without impact to the existing cannon and monuments within the central island area. The planned improvement from Front Street to Second Street would include the following:
Concrete/concrete paver sidewalks Pedestrian lighting Benches, trash receptacles, bicycle racks Decorative median treatments Decorative crosswalks ADA curb ramps Street trees Water line replacement Roadway milling and overlay
Cen
tral A
venu
e S
treet
scap
e
Project Location
Project Characteristics
Priority Level High
Project Partners PennDOT, NWPRPDC, SS Business Association, SS Neighborhood Association, Oil Valley Chapter of the PA Council of the Blind, Property / Business Owners, Oil Region Alliance
Cost $1.4 to $1.5 Million
Funding Opportunities
PCTI Grant, CDBG EDA—Community Infrastructure ARRA Grant DCED—Community Revitalization Program DCED—Community & Municipal Facilities Assistance Program
Potential Improvements
Central Avenue 2nd
Stre
et
1st
Stre
et
Fron
t Stre
et

Central Avenue Streetscape
Existing Conditions

Project Description:
Accessible (or Audible) Pedestrian Signal (APS) improvements at the intersection of Central Avenue and First Street will provide a safer crossing condition for the visually impaired pedestrian. The goal of an APS is to provide an audible notification of when it is safe to cross at an intersection. In addition, most modern devices are equipped with Braille to provide additional directions for operating the pedestrian push button. To implement the APS improvements, several upgrades would be required to the existing signal, including:
New signal control cabinet Additional conduit and wiring Pushbuttons with integrated APS ADA curb ramps
Acc
essi
ble
Ped
estri
an S
igna
l
Project Location
Project Characteristics
Priority Level High
Project Partners PennDOT, NWPRPDC, SS Business Association, SS Neighbor-hood Association, Oil Valley Chapter of the PA Council of the Blind, Property / Business Owners
Cost $150,000 to $175,000
Funding Opportunities PCTI Grant, CDBG USDA—Community Facilities Loans and Grants PennDOT—Hometown Street, Safe Routes to School
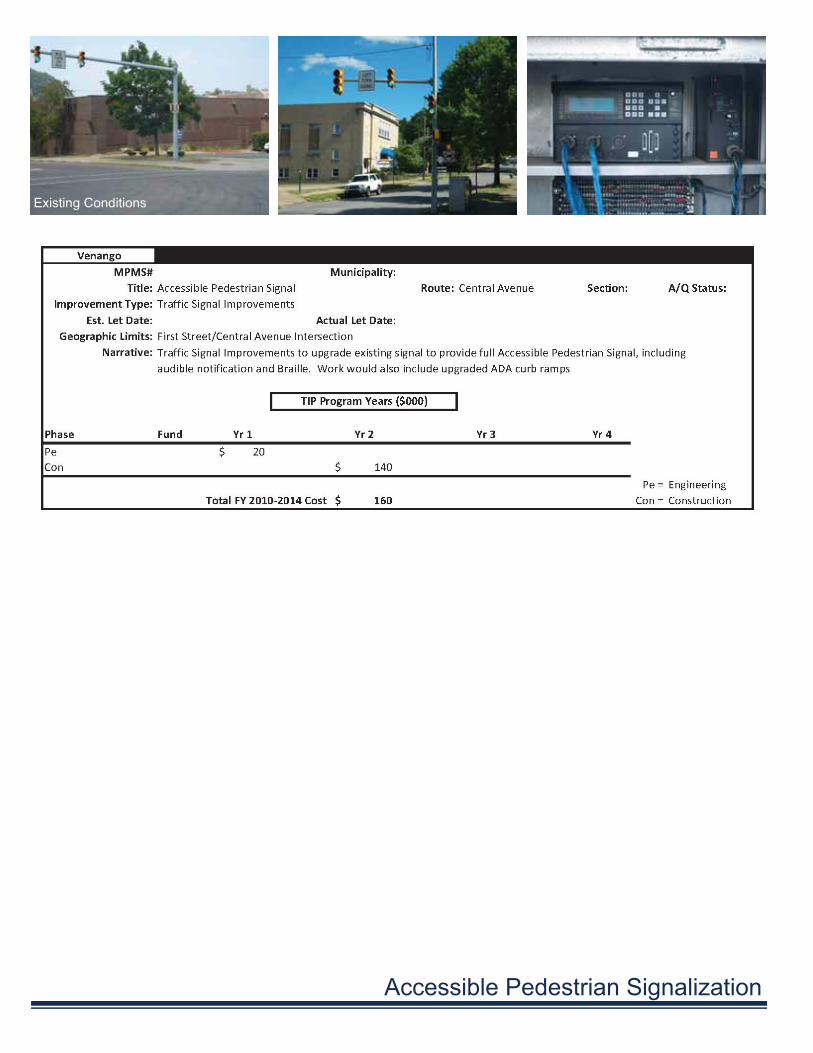
Accessible Pedestrian Signalization
Existing Conditions

Project Description:
Streetscape improvements along the Second Street Corridor, from Wilson Avenue to Front Street would provide functional and aesthetic improvements to the existing pedestrian facilities along the commercial/residential corridor. The improvements would be completed in coordination with access management improvements along the commercial side of the corridor. Specific streetscape features would include:
Concrete sidewalks Pedestrian lighting ADA curb ramps Street trees Water line replacement Roadway milling and overlay Access management improvements
Sec
ond
Stre
et S
treet
scap
e
Project Location
Project Characteristics
Priority Level High
Project Partners PennDOT, NWPRPDC, SS Business Association, SS Neighborhood Association, Oil Valley Chapter of the PA Council of the Blind, Property / Business Owners, Oil Region Alliance
Cost $2.5 to $2.6 Million
Funding Opportunities PCTI, CDBG DCED—Community & Municipal Facilities Assistance Program DCED—Elm Street EDA—Community Infrastructure ARRA Grant
Current Conditions Potential Improvements

Second Street Streetscape
Existing Conditions

Project Characteristics
Priority Level High
Project Partners PennDOT, NWPRPDC, Venango County, SS Business Association, Property / Business Owners, Oil Region Alliance
Cost $3.25 to $3.5 Million
Funding Opportunities EDA—Public Works and Economic Development PennDOT—Pennsylvania Community Transportation Initiative/ Smart Transportation
Project Description:
The Front Street (Route 62) Corridor currently consists of a four-lane road from Pumphouse Road to Wilson Avenue. Front Street can be accessed from First Street/Wilson Avenue, Imperial Street, Second Street and Pumphouse Road. In addition, vehicles traveling east along Front Street have access to the CVS parking area via a right-in/right-out access point. The existing traffic volumes, which are consistent with future volumes, are low enough to allow for a potential “road diet” along the Front Street Corridor. In addition to a potential reduction of travel lanes, the Front Street Corridor could also be enhanced to provide for bicycle and pedestrian facilities, as well as additional traffic calming through the use of roundabouts at the First Street/Wilson Avenue and Second Street intersections. The term “road diet” is associated with the reduction of traveled lanes along a roadway while
Fron
t Stre
et (R
oute
62)
Cor
ridor
Project Location
still providing a facility that meets the current and future traffic demand. The proposed lane reduction would reduce the existing four-lane roadway (two lanes in each direction) to a three-lane roadway, which would include one lane per direction and a left turn lane/median area. The elimination of two thru lanes would allow for sufficient space for the median/left turn area, as well as designated pedestrian/bicycle facilities. The median area would provide an opportunity for a landscaped area to provide a more welcoming entrance to the City’s south side. The goal of the pedestrian/bicycle facilities would be to provide a sidewalk facility on the south side of Front Street and a shared-use facility on the north side. These improvements should also help to reduce the travel speeds along this section of Front Street.
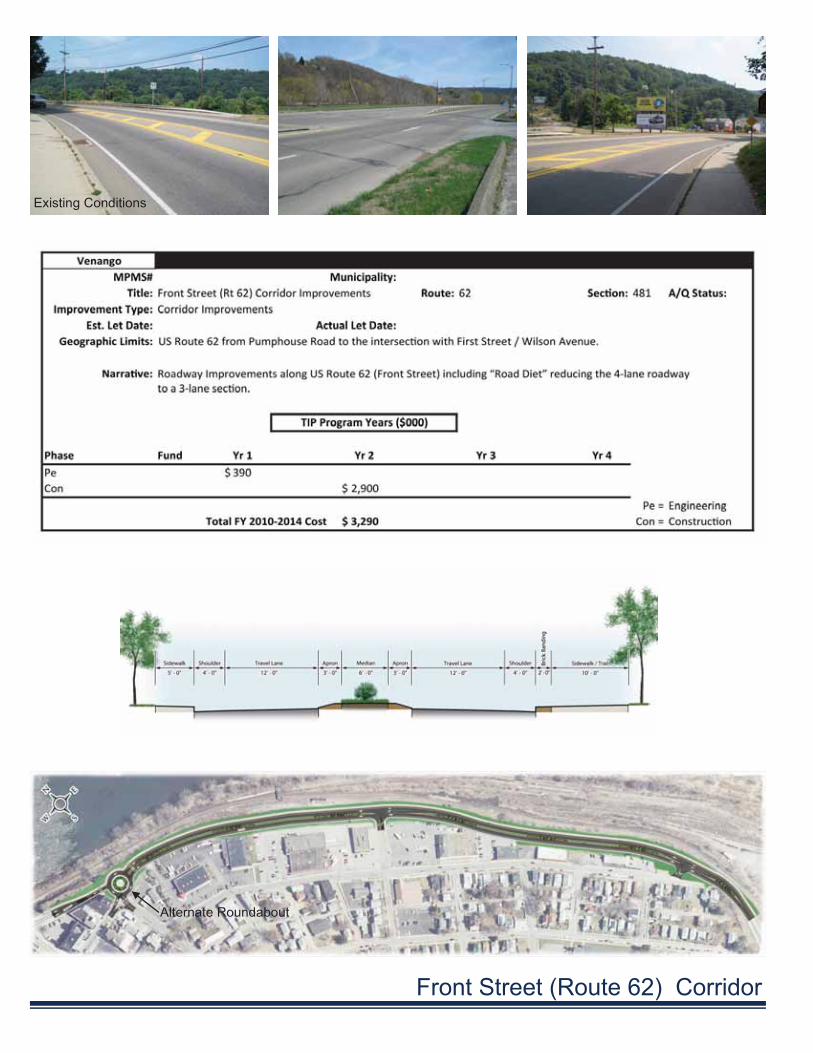
Front Street (Route 62) Corridor
Existing Conditions
Alternate Roundabout
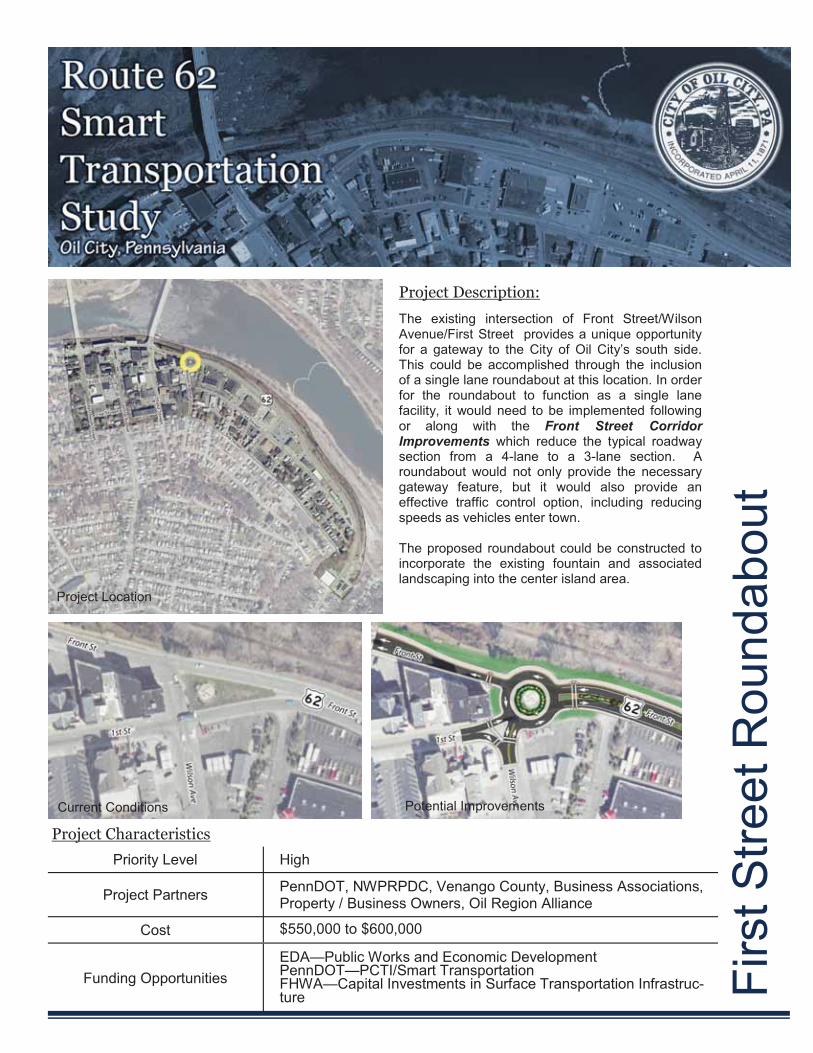
Project Description:
The existing intersection of Front Street/Wilson Avenue/First Street provides a unique opportunity for a gateway to the City of Oil City’s south side. This could be accomplished through the inclusion of a single lane roundabout at this location. In order for the roundabout to function as a single lane facility, it would need to be implemented following or along with the Front Street Corridor Improvements which reduce the typical roadway section from a 4-lane to a 3-lane section. A roundabout would not only provide the necessary gateway feature, but it would also provide an effective traffic control option, including reducing speeds as vehicles enter town. The proposed roundabout could be constructed to incorporate the existing fountain and associated landscaping into the center island area.
Firs
t Stre
et R
ound
abou
t
Project Location
Project Characteristics
Priority Level High
Project Partners PennDOT, NWPRPDC, Venango County, Business Associations, Property / Business Owners, Oil Region Alliance
Cost $550,000 to $600,000
Funding Opportunities EDA—Public Works and Economic Development PennDOT—PCTI/Smart Transportation FHWA—Capital Investments in Surface Transportation Infrastruc-ture
Current Conditions Potential Improvements

First Street Roundabout
Existing Conditions

Project Description:
Within the downtown core of the south side of Oil City, the focus of the streetscape improvements will be to bring together transportation improvements with land use, and coordinate pedestrian facilities within the business and commercial districts of the study area. Improvements in this area are to include full streetscape enhancements, including the following:
Concrete sidewalks Decorative brick pavers (buffer area) Pedestrian lighting Traffic signal improvements Amenities (Benches, Trash receptacles, Bicycle Racks) Decorative crosswalks ADA curb ramps Infrastructure Improvements (Water & Stormwater Improvements) Street trees Signage
These improvements could be completed at once or phased as funding becomes available.
Dow
ntow
n C
ore
Stre
etsc
ape
Project Location
Project Characteristics
Priority Level Middle
Project Partners PennDOT, NWPRPDC, SS Business Association, SS Neighborhood Association, Oil Valley Chapter of the PA Council of the Blind, Property / Business Owners, Oil Region Alliance
Cost $300,000 to $350,000 / Block Face (block sample First St from Central to State)
Funding Opportunities DCED—Community & Municipal Facilities Assistance Program DCED—Elm Street EDA—Community Infrastructure ARRA Grant
Current Conditions Potential Improvements

Downtown Core Streetscape
Current Conditions Potential Improvements
Existing Conditions
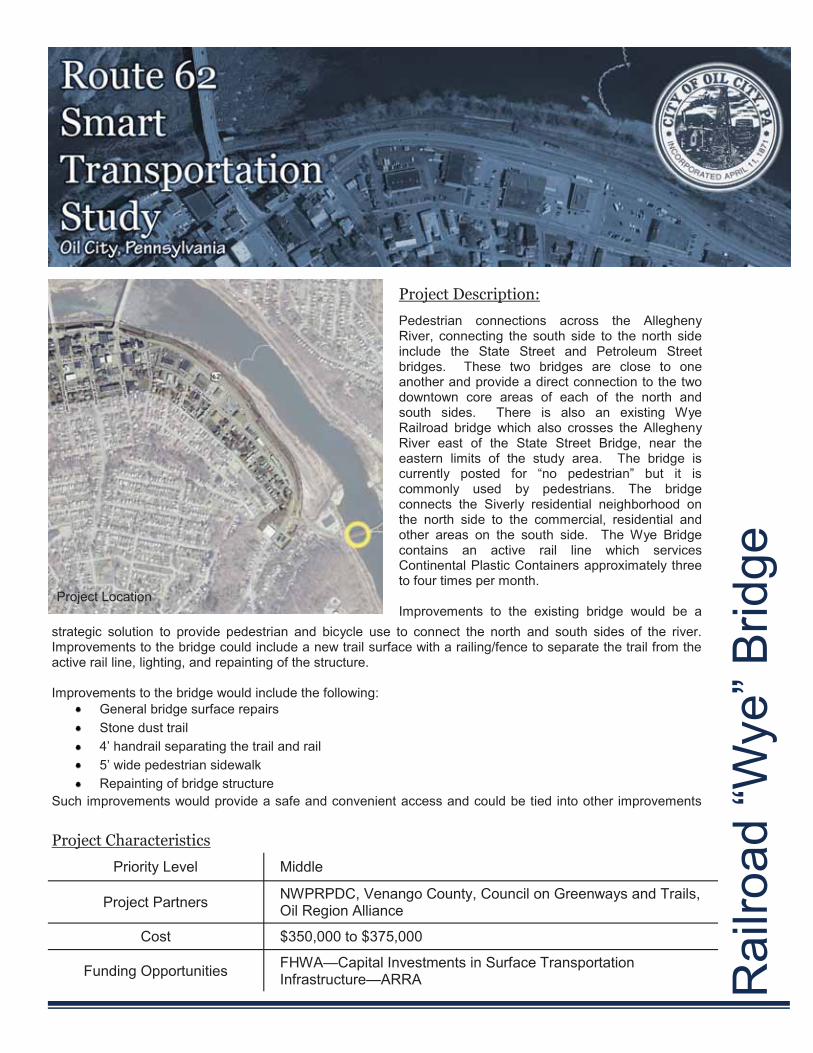
Rai
lroad
“Wye
” Brid
ge
Project Location
Project Characteristics
Priority Level Middle
Project Partners NWPRPDC, Venango County, Council on Greenways and Trails, Oil Region Alliance
Cost $350,000 to $375,000
Funding Opportunities FHWA—Capital Investments in Surface Transportation Infrastructure—ARRA
Project Description:
Pedestrian connections across the Allegheny River, connecting the south side to the north side include the State Street and Petroleum Street bridges. These two bridges are close to one another and provide a direct connection to the two downtown core areas of each of the north and south sides. There is also an existing Wye Railroad bridge which also crosses the Allegheny River east of the State Street Bridge, near the eastern limits of the study area. The bridge is currently posted for “no pedestrian” but it is commonly used by pedestrians. The bridge connects the Siverly residential neighborhood on the north side to the commercial, residential and other areas on the south side. The Wye Bridge contains an active rail line which services Continental Plastic Containers approximately three to four times per month. Improvements to the existing bridge would be a
strategic solution to provide pedestrian and bicycle use to connect the north and south sides of the river. Improvements to the bridge could include a new trail surface with a railing/fence to separate the trail from the active rail line, lighting, and repainting of the structure. Improvements to the bridge would include the following:
General bridge surface repairs Stone dust trail 4’ handrail separating the trail and rail 5’ wide pedestrian sidewalk Repainting of bridge structure
Such improvements would provide a safe and convenient access and could be tied into other improvements
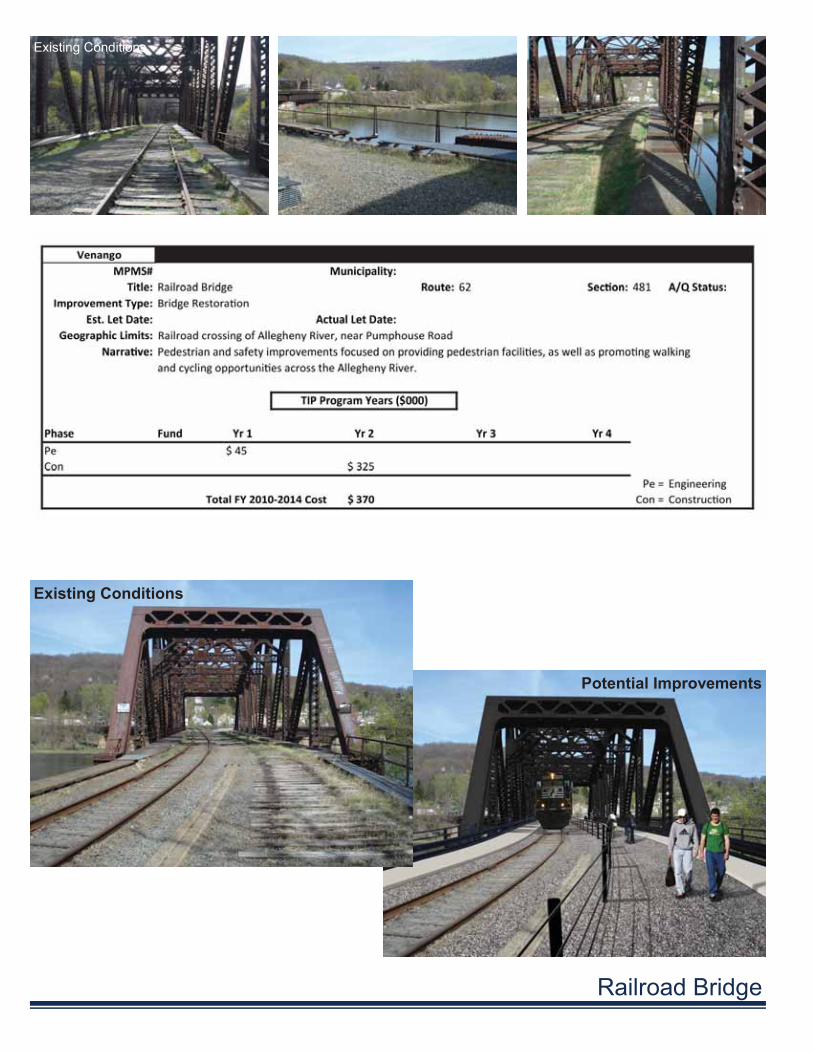
Railroad Bridge
Existing Conditions
Potential Improvements
Existing Conditions
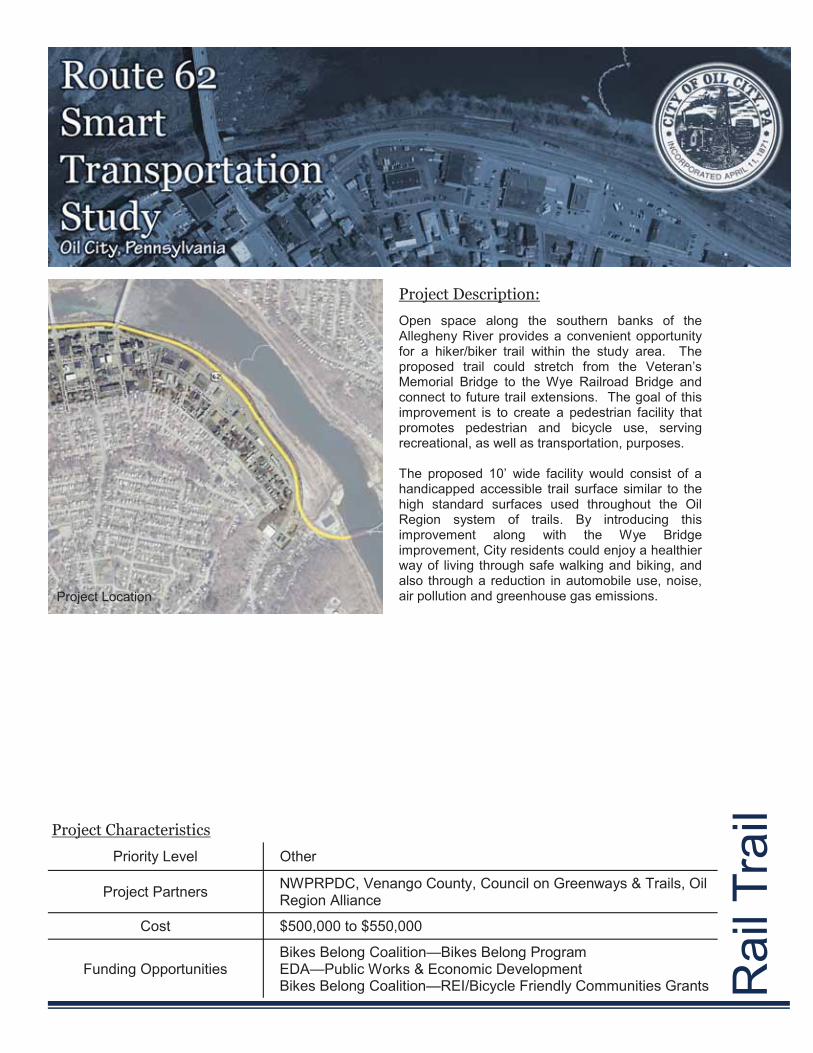
Rai
l Tra
il
Project Location
Project Characteristics
Priority Level Other
Project Partners NWPRPDC, Venango County, Council on Greenways & Trails, Oil Region Alliance
Cost $500,000 to $550,000
Funding Opportunities Bikes Belong Coalition—Bikes Belong Program EDA—Public Works & Economic Development Bikes Belong Coalition—REI/Bicycle Friendly Communities Grants
Project Description:
Open space along the southern banks of the Allegheny River provides a convenient opportunity for a hiker/biker trail within the study area. The proposed trail could stretch from the Veteran’s Memorial Bridge to the Wye Railroad Bridge and connect to future trail extensions. The goal of this improvement is to create a pedestrian facility that promotes pedestrian and bicycle use, serving recreational, as well as transportation, purposes. The proposed 10’ wide facility would consist of a handicapped accessible trail surface similar to the high standard surfaces used throughout the Oil Region system of trails. By introducing this improvement along with the Wye Bridge improvement, City residents could enjoy a healthier way of living through safe walking and biking, and also through a reduction in automobile use, noise, air pollution and greenhouse gas emissions.
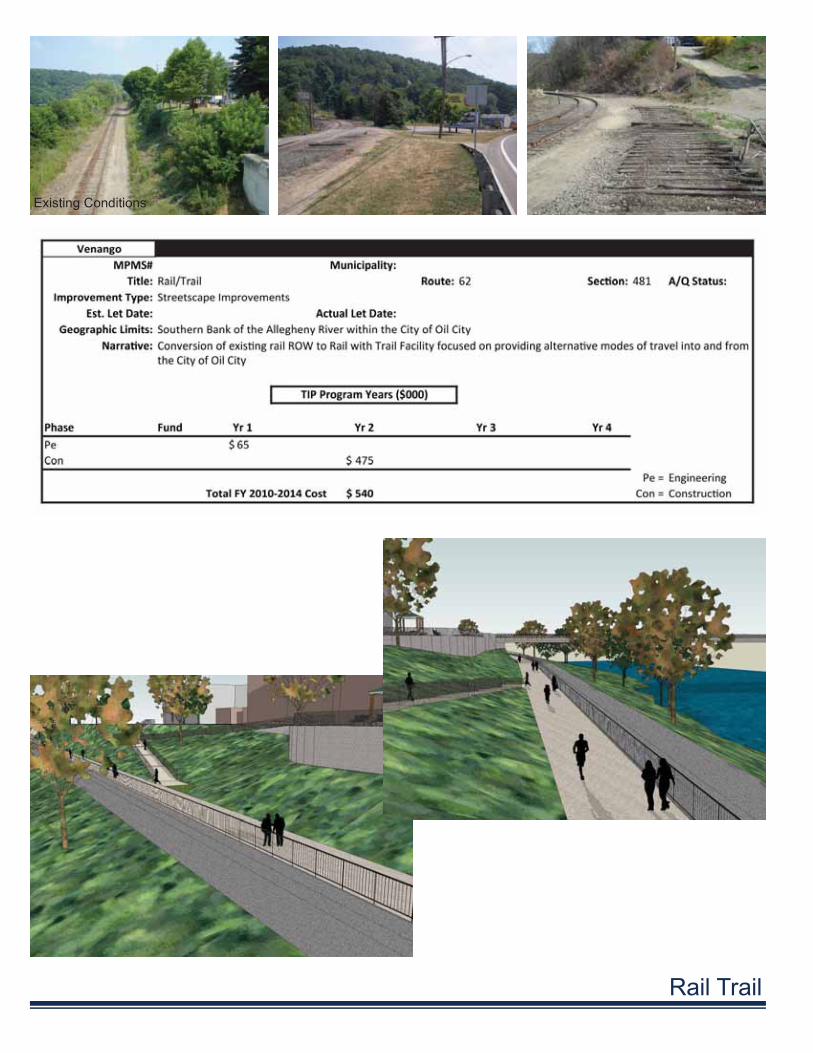
Rail Trail
Existing Conditions

Pub
lic P
laza
Project Location
Project Characteristics
Priority Level Other
Project Partners NWPRPDC, Venango County, Council on Greenways & Trail, Oil Region Alliance
Cost $950,000 to $1 Million
Funding Opportunities
EDA—Planning Program EDA—Community Infrastructure ARRA Grant DCED—Community & Municipal Facilities Assistance Program USDA—Community Facilities Loans and Grants
Project Description:
The proposed public plaza is located adjacent to the First Street and Front Street intersection. The goal of this improvement is to create a beautiful pedestrian gathering facility within the study area in a location that is positioned close to the downtown core area of the south side, as well as access to the views and potential recreation opportunities along the Allegheny River. The proposed plaza space could include an open space area that includes the existing pavilion. The open space area would provide a year-round passive space. The open space could also be used for special events, including the Oil Heritage Festival, fairs and other community events. Elements of the plaza space would need to include a retaining wall to increase the level area at the Front Street elevation. The level area could be constructed of concrete sidewalk, concrete paver
sidewalk, a combination of concrete and concrete paver sidewalk or another type of hard walkway surface. The plaza would provide a river overlook outlined by an appropriate height railing. Potential exists for the plaza area to include a seating area, possibly integrated with a series of retaining/seating walls, to provide bleacher type seating for viewing of kayaking or other events along the river. The plaza area would need to provide pedestrian access to other potential improvements within the area. This would include a pedestrian walkway to the downtown core via the Front Street and State Street intersection, a pedestrian walkway to the commercial area via the Front Street and First Street intersection and pedestrian access to a future trail along the Allegheny River via an ADA accessible ramp from the plaza area to the lower banks of the river. Other key elements of the public plaza would include appropriate scaled lighting to provide the necessary security and site furnishings including benches, trash receptacles and bicycle racks.
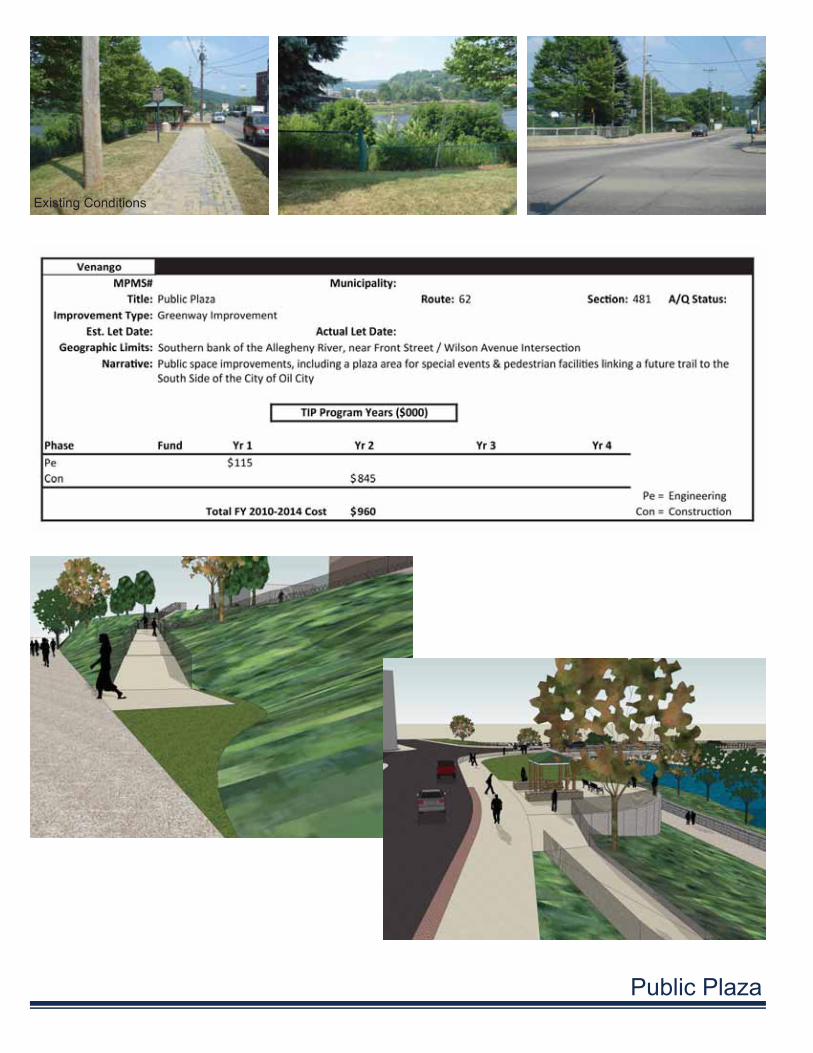
Public Plaza
Existing Conditions

Appendix A
Route 62 Smart Transportation Corridor Study Final Report October 2010
Appendix A: Community Participation Report

Route 62 Smart Transportation Corridor StudyFinal Report October 2010
P a g e | i
Table of Contents Appendix A: Community Participation .......................................................................................................... 1
Appendix A.1: Introduction ....................................................................................................................... 1
Appendix A.1.1: Study Area / Vision Statement ................................................................................... 1
Appendix A.1.2: Steering Committee.................................................................................................... 2
Appendix A.1.3: Business Association ................................................................................................... 2
Appendix A.1.4: Public Meetings .......................................................................................................... 2
Appendix A.2: Committees ....................................................................................................................... 3
Appendix A.2.1: Steering Committee.................................................................................................... 3
Appendix A.2.2: Business Association ................................................................................................... 3
Appendix A.2.3: Public Meetings .......................................................................................................... 3
Appendix A.3: Scheduled Meetings .......................................................................................................... 4
Appendix A.3.1: February 1, 2010 Steering Committee ....................................................................... 4
Appendix A.3.2: February 1, 2010 Business Association ...................................................................... 8
Appendix A.3.3: April 21, 2010 City Council........................................................................................ 15
Appendix A.3.4: April 21, 2010 Steering Committee .......................................................................... 16
Appendix A.3.5: April 21, 2010 Public Meeting .................................................................................. 17
Appendix A.3.6: June 30, 2010 Steering Committee .......................................................................... 26
Appendix A.3.7: August 25, 2010 Steering Committee ...................................................................... 27
Appendix A.3.8: August 30, 2010 City Council .................................................................................... 28
Appendix A.3.9: September 2, 2010 Public Meeting .......................................................................... 29
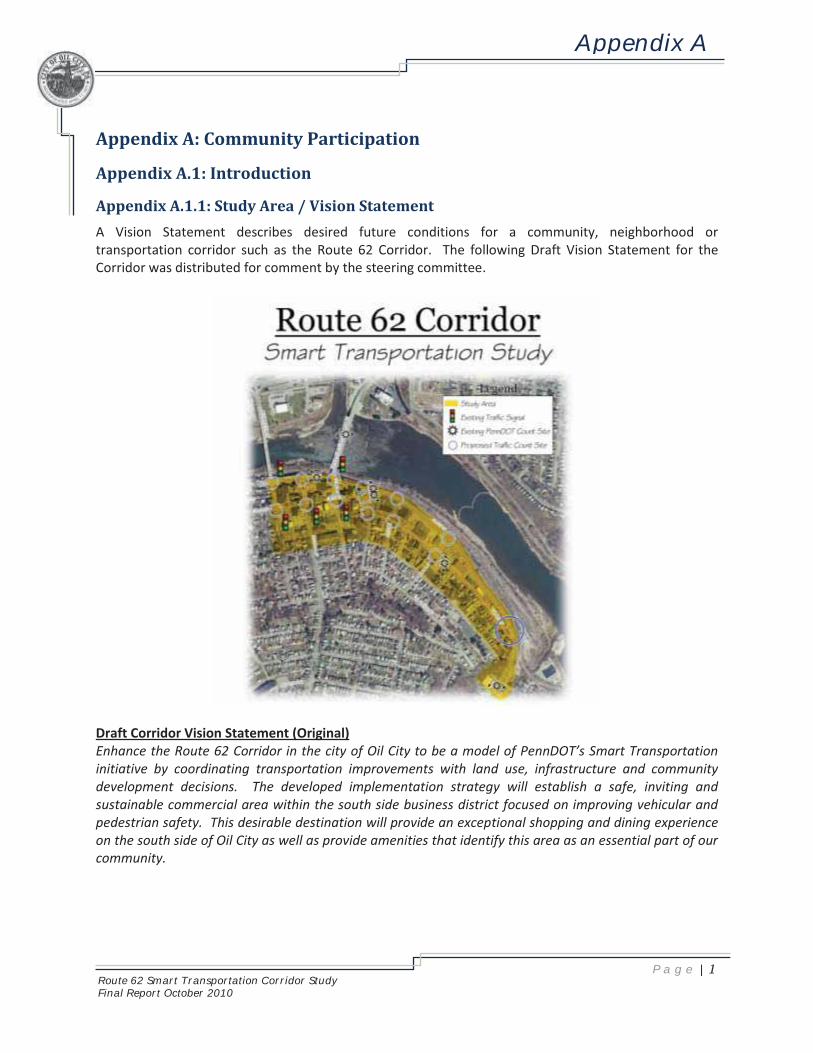
Appendix A
Route 62 Smart Transportation Corridor StudyFinal Report October 2010
P a g e | 1
Appendix A: Community Participation
Appendix A.1: Introduction
Appendix A.1.1: Study Area / Vision Statement
A Vision Statement describes desired future conditions for a community, neighborhood or transportation corridor such as the Route 62 Corridor. The following Draft Vision Statement for the Corridor was distributed for comment by the steering committee.
Draft Corridor Vision Statement (Original) Enhance the Route 62 Corridor in the city of Oil City to be a model of PennDOT’s Smart Transportation initiative by coordinating transportation improvements with land use, infrastructure and community development decisions. The developed implementation strategy will establish a safe, inviting and sustainable commercial area within the south side business district focused on improving vehicular and pedestrian safety. This desirable destination will provide an exceptional shopping and dining experience on the south side of Oil City as well as provide amenities that identify this area as an essential part of our community.
Appendix A
Route 62 Smart Transportation Corridor StudyFinal Report October 2010
P a g e | 2
Draft Corridor Vision Statement (Revised) Enhance the Route 62 Corridor within Oil City to be a model of PennDOT's Smart Transportation initiative by coordinating transportation improvements with land use, infrastructure, economic development and community revitalization. Implementation strategies and community revitalization projects will strengthen a sense of place and establish safe, inviting, aesthetically pleasing and sustainable commercial and residential neighborhoods within the South Side Business District. Transportation improvements will address vehicular, transit, bicycle and pedestrian safety, accessibility and mobility. Improvements will enhance the Corridor and other streets to provide connections to and from residential and commercial neighborhoods and the waterfront for all modes of transportation. Transportation improvements will provide an opportunity for renewed development within and around the Corridor, continued community growth and a variety of amenities which establish this area as a unique place attracting residents, businesses and visitors.
Appendix A.1.2: Steering Committee
The steering committee was created to volunteer their time to assist, review and comment on the Corridor Study. The Committee met, on average, every two months throughout the planning process that extended from February 2010 through August 2010.
Appendix A.1.3: Business Association
The business association was created to gather input and insight on the Route 62 Corridor Study.
Appendix A.1.4: Public Meetings
Public meetings were held at various locations on the Southside of Oil City. These meetings were designed to inform the public on the study and to gather their input for future recommendations.

Appendix A
Route 62 Smart Transportation Corridor StudyFinal Report October 2010
P a g e | 3
Appendix A.2: Committees
Appendix A.2.1: Steering Committee
Steering Committee Members met on the following dates: February 1, 2010 April 21, 2010 June 30, 2010 August 25, 2010
Appendix A.2.2: Business Association
Business Association Members met on the following sates: February 1, 2010
Appendix A.2.3: Public Meetings
Public Meetings were held on the following dates: April 21, 2010 September 2, 2010

Appendix A
Route 62 Smart Transportation Corridor StudyFinal Report October 2010
P a g e | 4
Appendix A.3: Scheduled Meetings
Appendix A.3.1: February 1, 2010 Steering Committee
The first Steering Committee Meeting was held on February 1, 2010.
Appendix A.3.1.1: Agenda

Appendix A
Route 62 Smart Transportation Corridor StudyFinal Report October 2010
P a g e | 5
Appendix A.3.1.1: Strengths, Weaknesses, Opportunities & Threats (SWOT) The following is a summary of the top strengths, weaknesses, and opportunities and threats identified and prioritized by the meeting attendees. The purpose of the SWOT activity is to provide an opportunity for local residents, businesses, and organizations to identify the community’s assets and opportunities as well as weakness and threats. Participants were asked to react to the following questions to identify community strengths, weaknesses, opportunities and threats.
STRENGTHS (S) – List the physical, social and regulatory assets of the community.
What makes this community unique? What do I like about this community? What is contributing to a positive community image?
WEAKNESSES (W) – List the physical, social or regulatory obstacles or shortcomings of the community.
What do I dislike about this community? What would I like to see less of in this community? What is contributing to a poor community image?
OPPORTUNITIES (O) – List the physical and social entities or assets of the community that are underutilized or undeveloped.
Where are opportunities for new development and/or preservation? Where are opportunities for change? What would I like to see more of in this community? What could change the image of this community?
THREATS (T) – List the physical and social entities or assets and regulations that detract from the community or if left unchecked could diminish quality of life for residents and businesses in the community.
What prevents this community from flourishing? What are obstacles to community development and/or preservation? What detracts from a positive community image?
Upon completion of identification of issues or review of identified issues, participants were given an opportunity to identify the level of importance for various items listed.
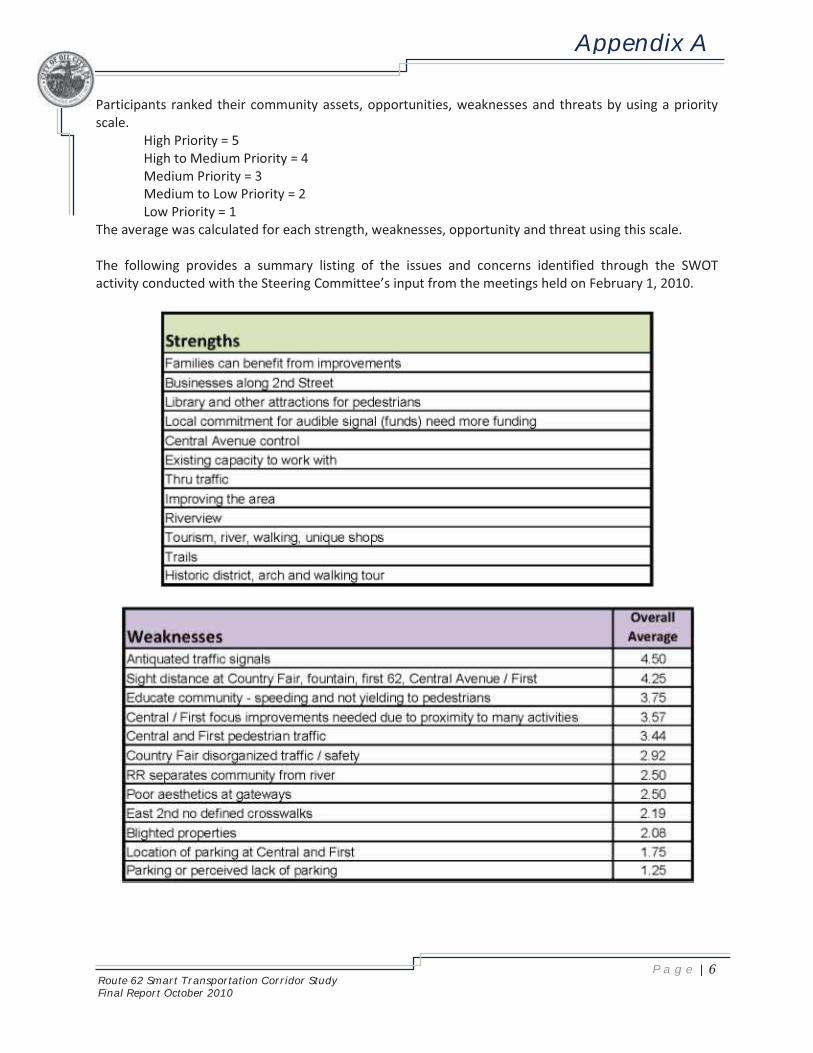
Appendix A
Route 62 Smart Transportation Corridor StudyFinal Report October 2010
P a g e | 6
Participants ranked their community assets, opportunities, weaknesses and threats by using a priority scale. High Priority = 5 High to Medium Priority = 4 Medium Priority = 3 Medium to Low Priority = 2 Low Priority = 1 The average was calculated for each strength, weaknesses, opportunity and threat using this scale. The following provides a summary listing of the issues and concerns identified through the SWOT activity conducted with the Steering Committee’s input from the meetings held on February 1, 2010.

Appendix A
Route 62 Smart Transportation Corridor StudyFinal Report October 2010
P a g e | 7

Appendix A
Route 62 Smart Transportation Corridor StudyFinal Report October 2010
P a g e | 8
Appendix A.3.2: February 1, 2010 Business Association
The first Business Association Meeting was held on February 1, 2010.
Appendix A.3.2.1: Agenda

Appendix A
Route 62 Smart Transportation Corridor StudyFinal Report October 2010
P a g e | 9
Appendix A.3.2.2: Strengths, Weaknesses, Opportunities & Threats (SWOT) The following is a summary of the top strengths, weaknesses, and opportunities and threats identified and prioritized by the meeting attendees. The purpose of the SWOT activity is to provide an opportunity for local residents, businesses, and organizations to identify the community’s assets and opportunities as well as weakness and threats. Participants were asked to react to the following questions to identify community strengths, weaknesses, opportunities and threats.
STRENGTHS (S) – List the physical, social and regulatory assets of the community. What makes this community unique? What do I like about this community? What is contributing to a positive community image?
WEAKNESSES (W) – List the physical, social or regulatory obstacles or shortcomings of the community.
What do I dislike about this community? What would I like to see less of in this community? What is contributing to a poor community image?
OPPORTUNITIES (O) – List the physical and social entities or assets of the community that are underutilized or undeveloped.
Where are opportunities for new development and/or preservation? Where are opportunities for change? What would I like to see more of in this community? What could change the image of this community?
THREATS (T) – List the physical and social entities or assets and regulations that detract from the community or if left unchecked could diminish quality of life for residents and businesses in the community.
What prevents this community from flourishing? What are obstacles to community development and/or preservation? What detracts from a positive community image?
Upon completion of identification of issues or review of identified issues, participants were given an opportunity to identify the level of importance for various items listed. Participants ranked their community assets, opportunities, weaknesses and threats by using a priority scale. High Priority = 5 High to Medium Priority = 4 Medium Priority = 3 Medium to Low Priority = 2 Low Priority = 1 The average was calculated for each strength, weaknesses, opportunity and threat using this scale. The following provides a summary listing of the issues and concerns identified through the SWOT activity conducted with the Business Association’s input from the meetings held on February 1, 2010.

Appendix A
Route 62 Smart Transportation Corridor StudyFinal Report October 2010
P a g e | 10

Appendix A
Route 62 Smart Transportation Corridor StudyFinal Report October 2010
P a g e | 11
Appendix A.3.2.3: Visual Preference Survey Summary of Visual Preference Survey A visual preference survey (VPS) is an innovative and successful technique that enables citizens to evaluate physical images of natural and built environments. The process involves asking participants to view and evaluate a wide variety of slides depicting streetscapes, land use, site design, building type, aesthetics and amenities. Individual scores indicate the level of preference for images viewed during the survey. The results are analyzed to determine what is appropriate for the Corridor. The visual preference survey was conducted during the Business Association Meeting on February 1, 2010. The following includes analysis methodology, presentation of results, a summary of preferences and the images used in the VPS. Methodology Individuals attending the meeting were asked to view numbered pictures which depicted various images of natural and built environments. Each participant was provided a sheet or a response card to record their response indicating appropriateness of the suitability of the development or setting for the Corridor. Individuals responded to twenty nine images. Response options included strongly oppose, oppose, no preference, some preference, and strong preference. Following the meeting, the survey sheets were collected and tallied. Each response option was assigned a weight factor, whereby the weights included: strongly oppose (-2), oppose (-1), no preference (0), some preference (1), and strong preference (2). The number of responses for each response option was summed and an average response value was calculated for each slide. Visual Preference Survey Results Overall, responses to the survey were favorable with some preference, or an average response value of 0.50. There were several images with strong preference, and several with strong opposition. The top preferred images included 10, 13, 15, 20, 21 and 25, with an average value of 1.53 (strong preference); while the top opposed images included 2, 12, 14, 22, 24 and 29, with an average value of -0.68. The following is a summary of images of the highest preferred and least preferred images.

Appendix A
Route 62 Smart Transportation Corridor StudyFinal Report October 2010
P a g e | 12
Highest Preference Images These images suggest a higher importance should be placed on public space such as picnic areas, sidewalks, trails, paths and parks. Historical landmarks and signage were preferred images.
Average: 2.00 Average: 1.70
Average: 1.50 Average: 1.40
Average: 1.30 Average: 1.30

Appendix A
Route 62 Smart Transportation Corridor StudyFinal Report October 2010
P a g e | 13
Lowest Preference Images These images suggest a higher importance should be placed on streetscape enhancements and signage.
Average: -0.90 Average: -0.90
Average: -0.80 Average: -0.60
Average: -0.50 Average: -0.40
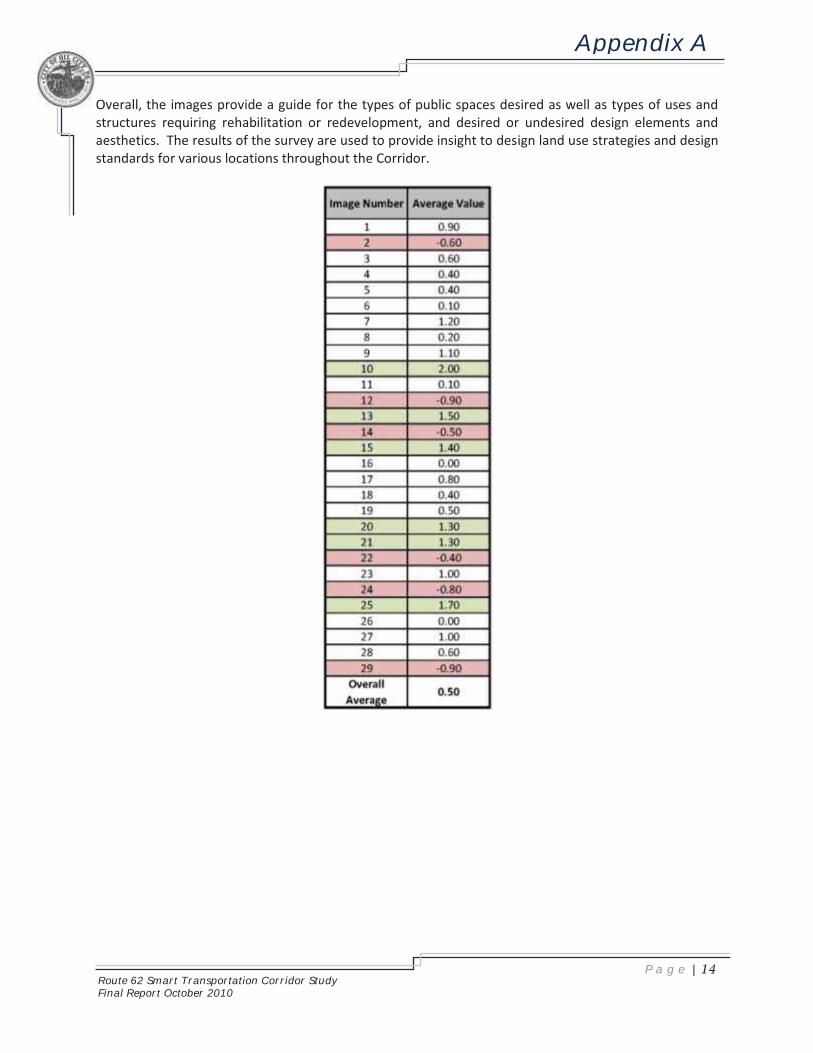
Appendix A
Route 62 Smart Transportation Corridor StudyFinal Report October 2010
P a g e | 14
Overall, the images provide a guide for the types of public spaces desired as well as types of uses and structures requiring rehabilitation or redevelopment, and desired or undesired design elements and aesthetics. The results of the survey are used to provide insight to design land use strategies and design standards for various locations throughout the Corridor.
Appendix A
Route 62 Smart Transportation Corridor StudyFinal Report October 2010
P a g e | 15
Appendix A.3.3: April 21, 2010 City Council
The first City Council Meeting was held on February 1, 2010.
Appendix A.3.3.1: Agenda

Appendix A
Route 62 Smart Transportation Corridor StudyFinal Report October 2010
P a g e | 16
Appendix A.3.4: April 21, 2010 Steering Committee
The second Steering Committee Meeting was held on April 21, 2010.
Appendix A.3.4.1: Agenda
Steering Committee Members in attendance were able to complete the activities in Section 3.4. Their results are included in Section 3.4.
Appendix A
Route 62 Smart Transportation Corridor StudyFinal Report October 2010
P a g e | 17
Appendix A.3.5: April 21, 2010 Public Meeting
The first Public Meeting was held on April 21, 2010.
Appendix A.3.5.1: Agenda
Appendix A
Route 62 Smart Transportation Corridor StudyFinal Report October 2010
P a g e | 18
Appendix A.3.5.2: Study Area / Vision Statement A Vision Statement describes desired future conditions for a community, neighborhood or transportation corridor such as Route 62 Corridor. Please review the Draft Vision Statement for the Corridor and provide and suggested changes. Draft Corridor Vision Statement (Revised) Enhance the Route 62 Corridor within Oil City to be a model of PennDOT's Smart Transportation initiative by coordinating transportation improvements with land use, infrastructure, economic development and community revitalization. Implementation strategies and community revitalization projects will strengthen a sense of place and establish safe, inviting, aesthetically pleasing and sustainable commercial and residential neighborhoods within the South Side Business District. Transportation improvements will address vehicular, transit, bicycle and pedestrian safety, accessibility and mobility. Improvements will enhance the Corridor and other streets to provide connections to and from residential and commercial neighborhoods and the waterfront for all modes of transportation. Transportation improvements will provide an opportunity for renewed development within and around the Corridor, continued community growth and a variety of amenities which establish this area as a unique place attracting residents, businesses and visitors. Comments provided by the public include:
Long I feel the Southside of Oil City to be the future heart of a new Venango City, because of Venango campus, stores, library and Y’s. Future Venango City should extend to Bredinsburg Road. Yes Sounds good Good vision Sounds good
Appendix A.3.5.3: SWOT Activity The Corridor possesses the following strengths:
Proximity of residential and commercial districts Diverse business mix with full capacity High volume of traffic to access commercial uses Scenic River Views Library, Churches, YMCA / YWCA and other attractions
The following is a summary of key corridor issues identified as weaknesses, opportunities and threats. The Key Corridor issues were ranked from 1 to 12, with 1 being the highest priority.

Appendix A
Route 62 Smart Transportation Corridor StudyFinal Report October 2010
P a g e | 19
Appendix A.3.5.4: Build – A – Streetscape (Business District) Please select all components that you would like the study to consider for future streetscape improvements within the South Side Business District.
Comments provided by the public include: Landscape plantings for stormwater management and shading, etc. I would like the Southside (present) to become the new Venango City like it originally was back in the 1840’s and 1850’s before oil. If the speeders won’t slow down on Route 62 East I would like to see some speed bumps in place. No bumpouts. Try to work with Main Street Design Committee and Garden Club. Stormwater runoff should be assessed with a more environmental approach. Streetscape on the east end would enliven a utilitarian avenue.
Appendix A
Route 62 Smart Transportation Corridor StudyFinal Report October 2010
P a g e | 20
Appendix A.3.5.5: Route 62 Boulevard Please identify all features the study should analyze as part of the alternatives considered for Route 62.
Comments provided by the public include:
Nice medians Maintenance and above. Do the bike and pedestrian trail. Without a proper riverfront any walkways would be underutilized.
Appendix A.3.5.6: Roundabouts Proper implementation of roundabouts can provide the following benefits:
Provide a means to calm traffic Can serve as a gateway feature Reduces frequency and severity of crashes When compared to a signal alternative, roundabouts can reduce traffic delays and increase traffic capacity
Please provide your opinion on consideration of a roundabout to be studied to address traffic safety and traffic speed issues.
Comments provided by the public include:
Too much for our little town. Concerns about east side pedestrian crossing. Wilson / Second is a wonderful intersection for pedestrians.
Appendix A
Route 62 Smart Transportation Corridor StudyFinal Report October 2010
P a g e | 21
Appendix A.3.5.7: Visual Preference Survey Summary of Visual Preference Survey A visual preference survey (VPS) is an innovative and successful technique that enables citizens to evaluate physical images of natural and built environments. The process involves asking participants to view and evaluate a wide variety of slides depicting streetscapes, land use, site design, building type, aesthetics and amenities. Individual scores indicate the level of preference for images viewed during the survey. The results are analyzed to determine what is appropriate for the Corridor. The visual preference survey was conducted during the Public Meeting on April 21, 2010. The following includes analysis methodology, presentation of results, a summary of preferences and the images used in the VPS. Methodology Individuals attending the meeting were asked to view numbered pictures which depicted various images of natural and built environments. Each participant was provided a sheet or a response card to record their response indicating appropriateness of the suitability of the development or setting for the Corridor. Individuals responded to twenty nine images. Response options included strongly oppose, oppose, no preference, some preference, and strong preference. Following the meeting, the survey sheets were collected and tallied. Each response option was assigned a weight factor, whereby the weights included: strongly oppose (-2), oppose (-1), no preference (0), some preference (1), and strong preference (2). The number of responses for each response option was summed and an average response value was calculated for each slide. Visual Preference Survey Results Overall, responses to the survey were marginal with some preference, or an average response value of 0.18. There were several images with strong preference, and several with strong opposition. The top preferred images included 13, 10, 23, 5, 7 and 25, with an average value of 1.45 (strong preference); while the top opposed images included 2, 12, 14, 22, 24 and 29, with an average value of -1.05. The following is a summary of images of the highest preferred and least preferred images.

Appendix A
Route 62 Smart Transportation Corridor StudyFinal Report October 2010
P a g e | 22
Highest Preference Images These images suggest a higher importance should be placed on public space such as picnic areas, sidewalks, trails, paths and parks. Historical landmarks and signage were preferred images.
Average: 1.85 Average: 1.70
Average: 1.45 Average: 1.37
Average: 1.15 Average: 1.15
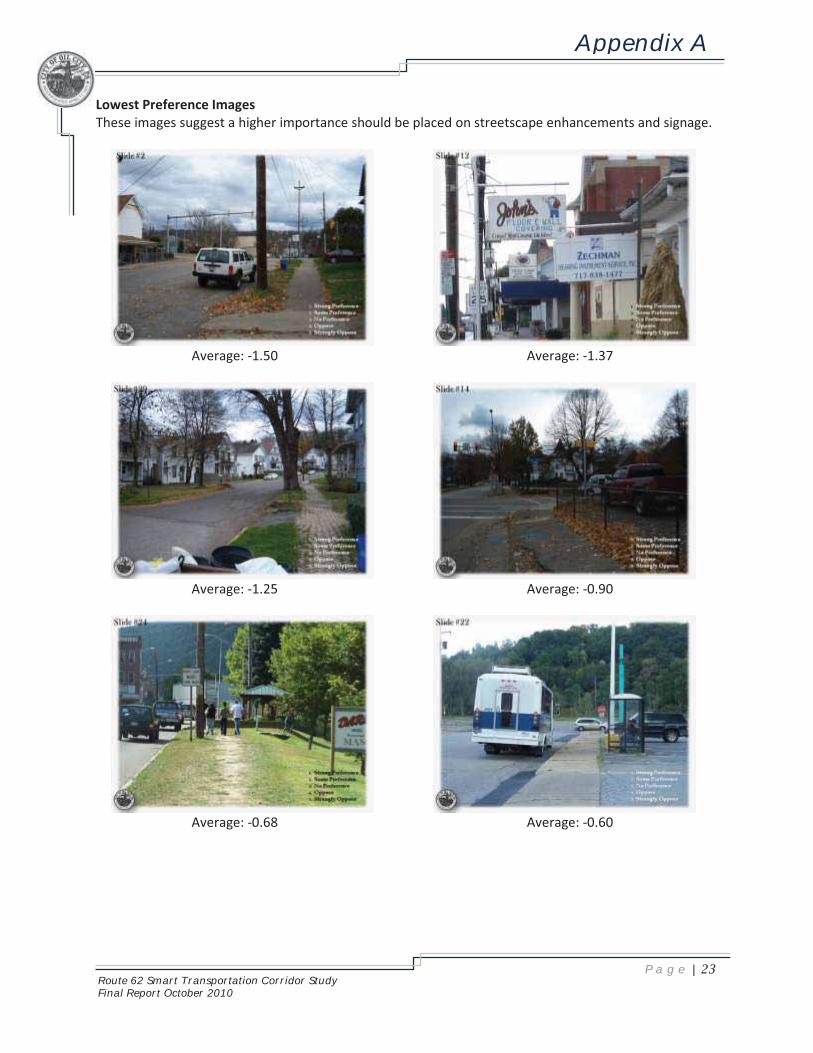
Appendix A
Route 62 Smart Transportation Corridor StudyFinal Report October 2010
P a g e | 23
Lowest Preference Images These images suggest a higher importance should be placed on streetscape enhancements and signage.
Average: -1.50 Average: -1.37
Average: -1.25 Average: -0.90
Average: -0.68 Average: -0.60
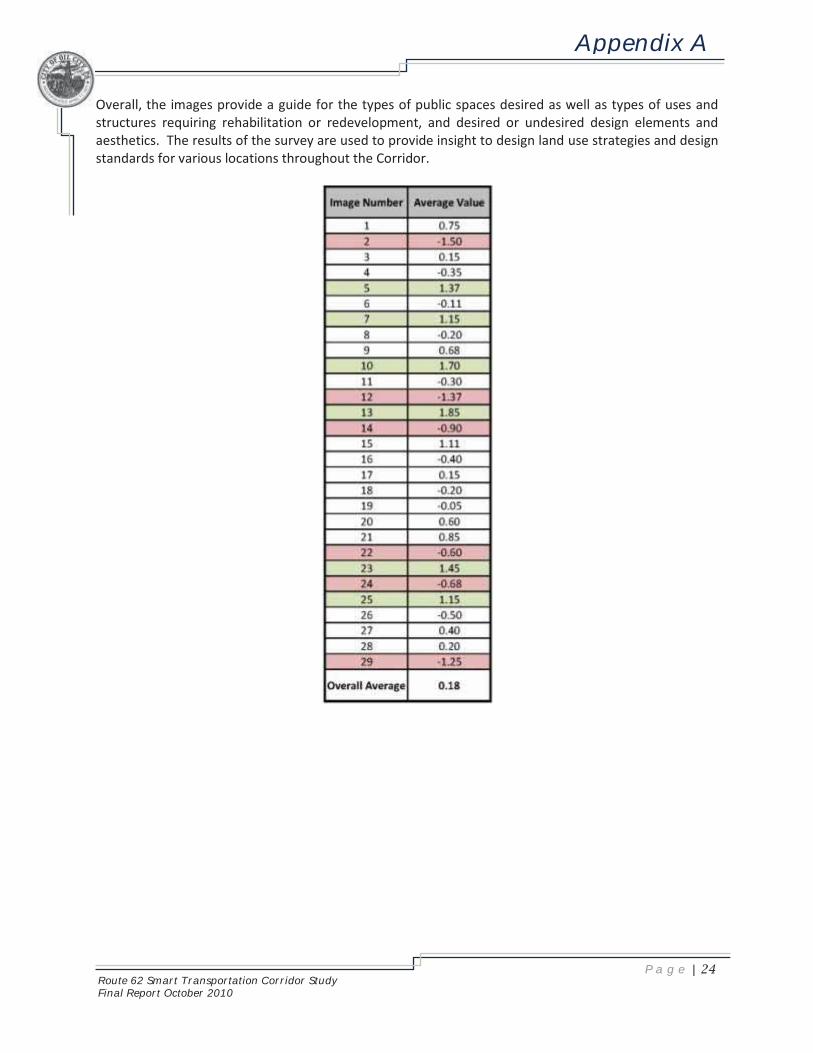
Appendix A
Route 62 Smart Transportation Corridor StudyFinal Report October 2010
P a g e | 24
Overall, the images provide a guide for the types of public spaces desired as well as types of uses and structures requiring rehabilitation or redevelopment, and desired or undesired design elements and aesthetics. The results of the survey are used to provide insight to design land use strategies and design standards for various locations throughout the Corridor.
Appendix A
Route 62 Smart Transportation Corridor StudyFinal Report October 2010
P a g e | 25
Appendix A.3.5.8: Miscellaneous Do you feel the railroad bridge should be studied for use by pedestrians? Comments provided by the public include:
Pedestrians and bicycles Yes, walking traffic from Siverly Yes Yes Yes Yes It gets used study or not Yes Yes Yes Yes, all stores and banks and most businesses frequented by Siverly residents are on the southside.
Do you have any concerns related to parking within the project study area? Comments provided by the public include:
Some parking needs to be eliminated or improved. No Always Yes Fear of loss by many businesses Yes Diagonal parking on Central Avenue. Yes Back out of diagonal spaces can be risky.
Other ideas / comments / concerns… Comments provided by the public include:
Consider bike lanes Concern for pedestrians crossing near roundabouts. Turn on red at all traffic lights. Sidewalk rehabilitation for the east end. Most ranked poorly. More bus stops, too few and far between.

Appendix A
Route 62 Smart Transportation Corridor StudyFinal Report October 2010
P a g e | 26
Appendix A.3.6: June 30, 2010 Steering Committee
The third Steering Committee Meeting was held on June 30, 2010.
Appendix A.3.6.1 Agenda
Appendix A
Route 62 Smart Transportation Corridor StudyFinal Report October 2010
P a g e | 27
Appendix A.3.7: August 25, 2010 Steering Committee
The fourth Steering Committee Meeting was held on August 25, 2010.
Appendix A.3.7.1 Agenda

Appendix A
Route 62 Smart Transportation Corridor StudyFinal Report October 2010
P a g e | 28
Appendix A.3.8: August 30, 2010 City Council
The second Steering City Council Meeting was held on August 30, 2010.
Appendix A.3.8.1 Agenda
Appendix A
Route 62 Smart Transportation Corridor StudyFinal Report October 2010
P a g e | 29
Appendix A.3.9: September 2, 2010 Public Meeting
The second Public Meeting was held on September 2, 2010.
Appendix A.3.9.1: Agenda
Appendix B
Route 62 Smart Transportation Corridor Study Final Report October 2010
Appendix B: Traffic Count Data
�
�
�
�
�
�
�
�
������������
���������� ��

JOH
NSO
N, M
IRM
IRA
N &
TH
OM
PSO
N, I
NC
.15
50 C
orao
polis
Hei
ghts
Roa
d, S
uite
440
Moo
n To
wns
hip,
PA
151
08Fi
le N
ame
: Int
erse
ctio
n 1
(Fro
nt-P
etro
leum
)S
ite C
ode
: 000
0000
1S
tart
Dat
e: 1
1/10
/200
9P
age
No
: 1
Gro
ups
Prin
ted-
Pas
s. V
eh. -
Tru
cks
- Bik
esP
etro
leum
St
Nor
thbo
und
Pet
role
um S
t Brid
geS
outh
boun
dFr
ont S
treet
Eas
tbou
ndFr
ont S
treet
Wes
tbou
ndS
tart
Tim
eLe
ftTh
ruR
ight
Ped
sA
pp. T
otal
Left
Thru
Rig
htP
eds
App
. Tot
alLe
ftTh
ruR
ight
Ped
sA
pp. T
otal
Left
Thru
Rig
htP
eds
App
. Tot
alIn
t. To
tal
07:0
0 A
M0
330
033
053
02
558
00
08
90
410
5014
607
:15
AM
033
00
330
670
067
90
00
96
049
055
164
07:3
0 A
M0
450
045
066
00
668
02
010
310
850
116
237
07:4
5 A
M0
520
153
084
00
847
06
013
520
511
104
254
Tota
l0
163
01
164
027
00
227
232
08
040
980
226
132
580
1
08:0
0 A
M0
470
047
054
00
5413
01
014
360
421
7919
408
:15
AM
042
01
430
720
072
50
22
926
050
076
200
08:3
0 A
M0
260
026
076
00
766
01
07
270
520
7918
808
:45
AM
030
00
300
740
074
20
00
223
048
071
177
Tota
l0
145
01
146
027
60
027
626
04
232
112
019
21
305
759
***
BR
EA
K *
**
04:0
0 P
M0
420
042
010
80
010
86
02
08
600
840
144
302
04:1
5 P
M0
400
040
010
40
010
48
02
010
450
580
103
257
04:3
0 P
M0
610
162
013
60
013
611
00
011
520
581
111
320
04:4
5 P
M0
510
152
013
70
213
97
02
09
430
732
118
318
Tota
l0
194
02
196
048
50
248
732
06
038
200
027
33
476
1197
05:0
0 P
M0
550
055
011
90
312
24
03
29
600
770
137
323
05:1
5 P
M0
350
136
011
00
011
010
02
012
410
640
105
263
05:3
0 P
M0
450
045
098
00
986
01
07
340
540
8823
805
:45
PM
024
00
240
830
083
100
62
1849
033
082
207
Tota
l0
159
01
160
041
00
341
330
012
446
184
022
80
412
1031
Gra
nd T
otal
066
10
566
60
1441
07
1448
120
030
615
659
40
919
515
1837
88A
pprc
h %
099
.20
0.8
099
.50
0.5
76.9
019
.23.
839
.10
60.5
0.3
Tota
l %0
17.4
00.
117
.60
380
0.2
38.2
3.2
00.
80.
24.
115
.70
24.3
0.1
40.1
Pas
s. V
eh.
065
10
565
60
1400
06
1406
118
030
515
358
90
897
514
9137
06%
Pas
s. V
eh.
098
.50
100
98.5
097
.20
85.7
97.1
98.3
010
083
.398
.199
.20
97.6
100
98.2
97.8
Truc
ks0
100
010
041
00
412
00
02
50
220
2780
% T
ruck
s0
1.5
00
1.5
02.
80
02.
81.
70
00
1.3
0.8
02.
40
1.8
2.1
Bik
es0
00
00
00
01
10
00
11
00
00
02
% B
ikes
00
00
00
00
14.3
0.1
00
016
.70.
60
00
00
0.1
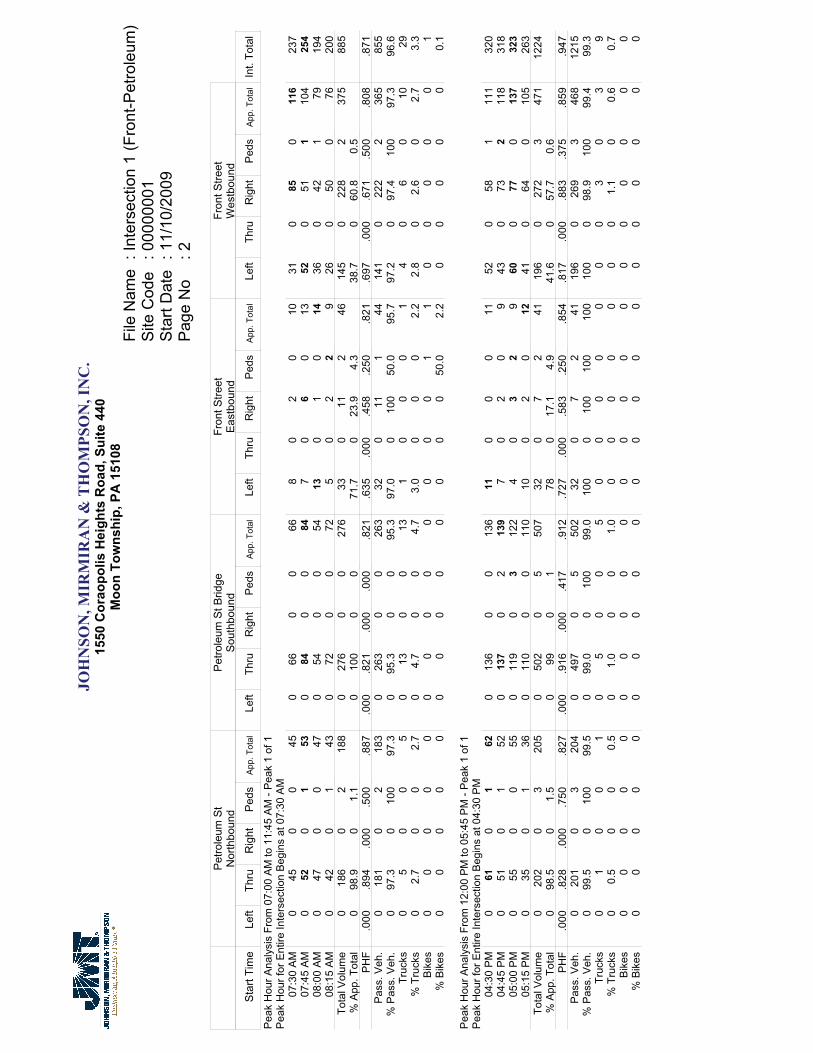
JOH
NSO
N, M
IRM
IRA
N &
TH
OM
PSO
N, I
NC
.15
50 C
orao
polis
Hei
ghts
Roa
d, S
uite
440
Moo
n To
wns
hip,
PA
151
08Fi
le N
ame
: Int
erse
ctio
n 1
(Fro
nt-P
etro
leum
)S
ite C
ode
: 000
0000
1S
tart
Dat
e: 1
1/10
/200
9P
age
No
: 2
Pet
role
um S
tN
orth
boun
dP
etro
leum
St B
ridge
Sou
thbo
und
Fron
t Stre
etE
astb
ound
Fron
t Stre
etW
estb
ound
Sta
rt Ti
me
Left
Thru
Rig
htP
eds
App
. Tot
alLe
ftTh
ruR
ight
Ped
sA
pp. T
otal
Left
Thru
Rig
htP
eds
App
. Tot
alLe
ftTh
ruR
ight
Ped
sA
pp. T
otal
Int.
Tota
l
Pea
k H
our A
naly
sis
From
07:
00 A
M to
11:
45 A
M -
Pea
k 1
of 1
Pea
k H
our f
or E
ntire
Inte
rsec
tion
Beg
ins
at 0
7:30
AM
07:3
0 A
M0
450
045
066
00
668
02
010
310
850
116
237
07:4
5 A
M0
520
153
084
00
847
06
013
520
511
104
254
08:0
0 A
M0
470
047
054
00
5413
01
014
360
421
7919
408
:15
AM
042
01
430
720
072
50
22
926
050
076
200
Tota
l Vol
ume
018
60
218
80
276
00
276
330
112
4614
50
228
237
588
5%
App
. Tot
al0
98.9
01.
10
100
00
71.7
023
.94.
338
.70
60.8
0.5
PH
F.0
00.8
94.0
00.5
00.8
87.0
00.8
21.0
00.0
00.8
21.6
35.0
00.4
58.2
50.8
21.6
97.0
00.6
71.5
00.8
08.8
71P
ass.
Veh
.0
181
02
183
026
30
026
332
011
144
141
022
22
365
855
% P
ass.
Veh
.0
97.3
010
097
.30
95.3
00
95.3
97.0
010
050
.095
.797
.20
97.4
100
97.3
96.6
Truc
ks0
50
05
013
00
131
00
01
40
60
1029
% T
ruck
s0
2.7
00
2.7
04.
70
04.
73.
00
00
2.2
2.8
02.
60
2.7
3.3
Bik
es0
00
00
00
00
00
00
11
00
00
01
% B
ikes
00
00
00
00
00
00
050
.02.
20
00
00
0.1
Pea
k H
our A
naly
sis
From
12:
00 P
M to
05:
45 P
M -
Pea
k 1
of 1
Pea
k H
our f
or E
ntire
Inte
rsec
tion
Beg
ins
at 0
4:30
PM
04:3
0 P
M0
610
162
013
60
013
611
00
011
520
581
111
320
04:4
5 P
M0
510
152
013
70
213
97
02
09
430
732
118
318
05:0
0 P
M0
550
055
011
90
312
24
03
29
600
770
137
323
05:1
5 P
M0
350
136
011
00
011
010
02
012
410
640
105
263
Tota
l Vol
ume
020
20
320
50
502
05
507
320
72
4119
60
272
347
112
24%
App
. Tot
al0
98.5
01.
50
990
178
017
.14.
941
.60
57.7
0.6
PH
F.0
00.8
28.0
00.7
50.8
27.0
00.9
16.0
00.4
17.9
12.7
27.0
00.5
83.2
50.8
54.8
17.0
00.8
83.3
75.8
59.9
47P
ass.
Veh
.0
201
03
204
049
70
550
232
07
241
196
026
93
468
1215
% P
ass.
Veh
.0
99.5
010
099
.50
99.0
010
099
.010
00
100
100
100
100
098
.910
099
.499
.3Tr
ucks
01
00
10
50
05
00
00
00
03
03
9%
Tru
cks
00.
50
00.
50
1.0
00
1.0
00
00
00
01.
10
0.6
0.7
Bik
es0
00
00
00
00
00
00
00
00
00
00
% B
ikes
00
00
00
00
00
00
00
00
00
00
0
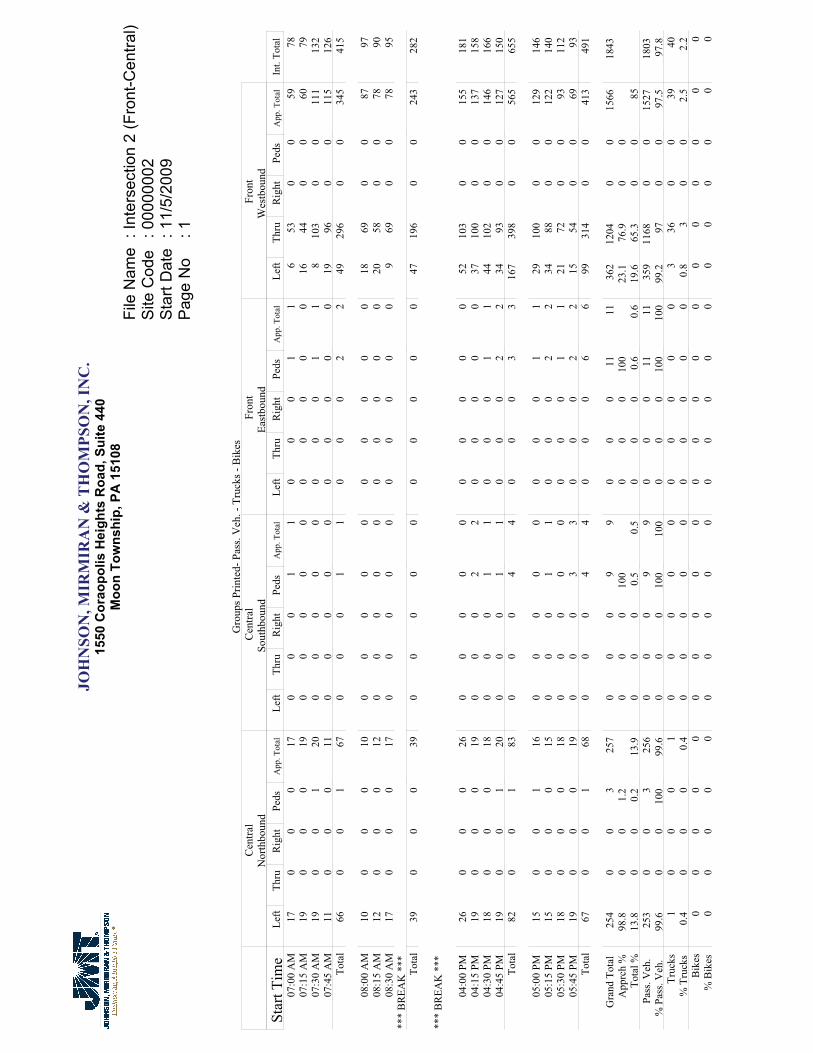
JOH
NSO
N, M
IRM
IRA
N &
TH
OM
PSO
N, I
NC
.15
50 C
orao
polis
Hei
ghts
Roa
d, S
uite
440
Moo
n To
wns
hip,
PA
151
08Fi
le N
ame
: Int
erse
ctio
n 2
(Fro
nt-C
entra
l)S
ite C
ode
: 000
0000
2S
tart
Dat
e: 1
1/5/
2009
Pag
e N
o: 1
Gro
ups P
rinte
d- P
ass.
Veh
. - T
ruck
s - B
ikes
Cen
tral
Nor
thbo
und
Cen
tral
Sout
hbou
ndFr
ont
East
boun
dFr
ont
Wes
tbou
ndSt
art T
ime
Left
Thru
Rig
htPe
dsA
pp. T
otal
Left
Thru
Rig
htPe
dsA
pp. T
otal
Left
Thru
Rig
htPe
dsA
pp. T
otal
Left
Thru
Rig
htPe
dsA
pp. T
otal
Int.
Tota
l07
:00
AM
170
00
170
00
11
00
01
16
530
059
7807
:15
AM
190
00
190
00
00
00
00
016
440
060
7907
:30
AM
190
01
200
00
00
00
01
18
103
00
111
132
07:4
5 A
M11
00
011
00
00
00
00
00
1996
00
115
126
Tota
l66
00
167
00
01
10
00
22
4929
60
034
541
5
08:0
0 A
M10
00
010
00
00
00
00
00
1869
00
8797
08:1
5 A
M12
00
012
00
00
00
00
00
2058
00
7890
08:3
0 A
M17
00
017
00
00
00
00
00
969
00
7895
***
BR
EAK
***
Tota
l39
00
039
00
00
00
00
00
4719
60
024
328
2
***
BR
EAK
***
04:0
0 PM
260
00
260
00
00
00
00
052
103
00
155
181
04:1
5 PM
190
00
190
00
22
00
00
037
100
00
137
158
04:3
0 PM
180
00
180
00
11
00
01
144
102
00
146
166
04:4
5 PM
190
01
200
00
11
00
02
234
930
012
715
0To
tal
820
01
830
00
44
00
03
316
739
80
056
565
5
05:0
0 PM
150
01
160
00
00
00
01
129
100
00
129
146
05:1
5 PM
150
00
150
00
11
00
02
234
880
012
214
005
:30
PM18
00
018
00
00
00
00
11
2172
00
9311
205
:45
PM19
00
019
00
03
30
00
22
1554
00
6993
Tota
l67
00
168
00
04
40
00
66
9931
40
041
349
1
Gra
nd T
otal
254
00
325
70
00
99
00
011
1136
212
040
015
6618
43A
pprc
h %
98.8
00
1.2
00
010
00
00
100
23.1
76.9
00
Tota
l %13
.80
00.
213
.90
00
0.5
0.5
00
00.
60.
619
.665
.30
085
Pass
. Veh
.25
30
03
256
00
09
90
00
1111
359
1168
00
1527
1803
% P
ass.
Veh
.99
.60
010
099
.60
00
100
100
00
010
010
099
.297
00
97.5
97.8
Truc
ks1
00
01
00
00
00
00
00
336
00
3940
% T
ruck
s0.
40
00
0.4
00
00
00
00
00
0.8
30
02.
52.
2B
ikes
00
00
00
00
00
00
00
00
00
00
0%
Bik
es0
00
00
00
00
00
00
00
00
00
00

JOH
NSO
N, M
IRM
IRA
N &
TH
OM
PSO
N, I
NC
.15
50 C
orao
polis
Hei
ghts
Roa
d, S
uite
440
Moo
n To
wns
hip,
PA
151
08Fi
le N
ame
: Int
erse
ctio
n 2
(Fro
nt-C
entra
l)S
ite C
ode
: 000
0000
2S
tart
Dat
e: 1
1/5/
2009
Pag
e N
o: 2
Cen
tral
Nor
thbo
und
Cen
tral
Sout
hbou
ndFr
ont
East
boun
dFr
ont
Wes
tbou
nd
Star
t Tim
eLe
ftTh
ruR
ight
Peds
App
. Tot
alLe
ftTh
ruR
ight
Peds
App
. Tot
alLe
ftTh
ruR
ight
Peds
App
. Tot
alLe
ftTh
ruR
ight
Peds
App
. Tot
alIn
t. To
tal
Peak
Hou
r Ana
lysi
s Fro
m 0
7:00
AM
to 1
1:45
AM
- Pe
ak 1
of 1
Peak
Hou
r for
Ent
ire In
ters
ectio
n B
egin
s at 0
7:30
AM
07:3
0 A
M19
00
120
00
00
00
00
11
810
30
011
113
207
:45
AM
110
00
110
00
00
00
00
019
960
011
512
608
:00
AM
100
00
100
00
00
00
00
018
690
087
9708
:15
AM
120
00
120
00
00
00
00
020
580
078
90To
tal V
olum
e52
00
153
00
00
00
00
11
6532
60
039
144
5%
App
. Tot
al98
.10
01.
90
00
00
00
100
16.6
83.4
00
PHF
.684
.000
.000
.250
.663
.000
.000
.000
.000
.000
.000
.000
.000
.250
.250
.813
.791
.000
.000
.850
.843
Pass
. Veh
.52
00
153
00
00
00
00
11
6231
50
037
743
1%
Pas
s. V
eh.
100
00
100
100
00
00
00
00
100
100
95.4
96.6
00
96.4
96.9
Truc
ks0
00
00
00
00
00
00
00
311
00
1414
% T
ruck
s0
00
00
00
00
00
00
00
4.6
3.4
00
3.6
3.1
Bik
es0
00
00
00
00
00
00
00
00
00
00
% B
ikes
00
00
00
00
00
00
00
00
00
00
0
Peak
Hou
r Ana
lysi
s Fro
m 1
2:00
PM
to 0
5:45
PM
- Pe
ak 1
of 1
Peak
Hou
r for
Ent
ire In
ters
ectio
n B
egin
s at 0
4:00
PM
04:0
0 PM
260
00
260
00
00
00
00
052
103
00
155
181
04:1
5 PM
190
00
190
00
22
00
00
037
100
00
137
158
04:3
0 PM
180
00
180
00
11
00
01
144
102
00
146
166
04:4
5 PM
190
01
200
00
11
00
02
234
930
012
715
0To
tal V
olum
e82
00
183
00
04
40
00
33
167
398
00
565
655
% A
pp. T
otal
98.8
00
1.2
00
010
00
00
100
29.6
70.4
00
PHF
.788
.000
.000
.250
.798
.000
.000
.000
.500
.500
.000
.000
.000
.375
.375
.803
.966
.000
.000
.911
.905
Pass
. Veh
.82
00
183
00
04
40
00
33
167
388
00
555
645
% P
ass.
Veh
.10
00
010
010
00
00
100
100
00
010
010
010
097
.50
098
.298
.5Tr
ucks
00
00
00
00
00
00
00
00
100
010
10%
Tru
cks
00
00
00
00
00
00
00
00
2.5
00
1.8
1.5
Bik
es0
00
00
00
00
00
00
00
00
00
00
% B
ikes
00
00
00
00
00
00
00
00
00
00
0
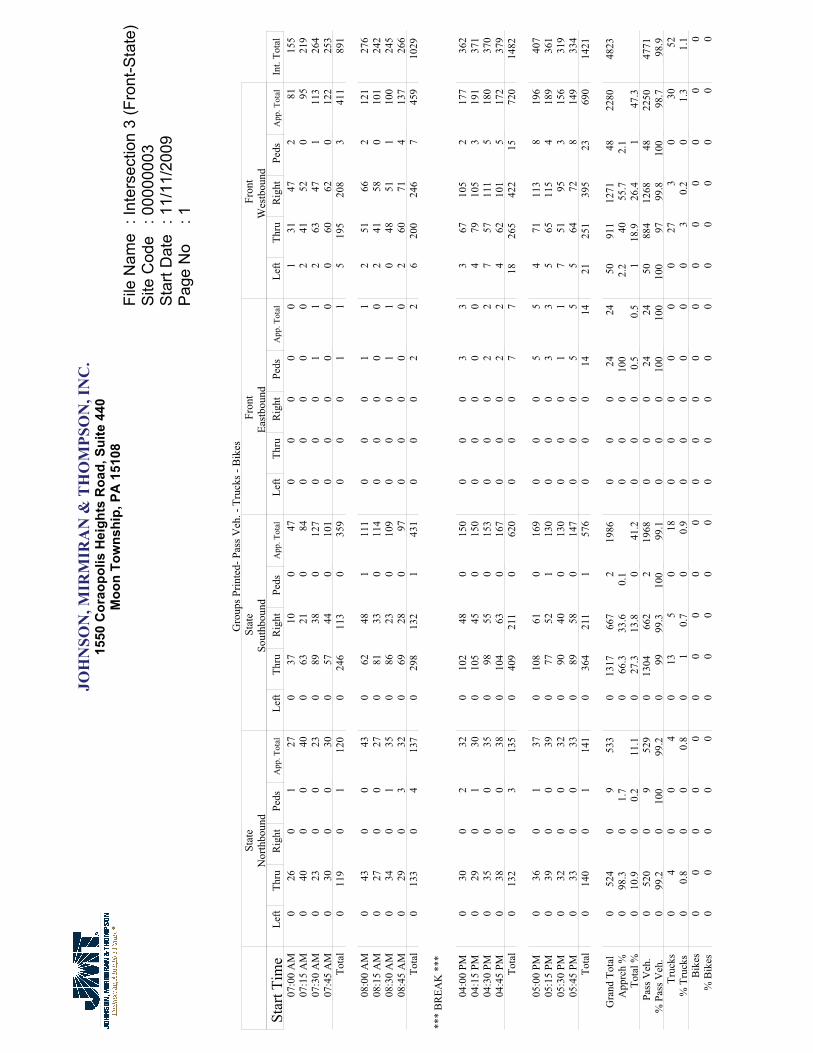
JOH
NSO
N, M
IRM
IRA
N &
TH
OM
PSO
N, I
NC
.15
50 C
orao
polis
Hei
ghts
Roa
d, S
uite
440
Moo
n To
wns
hip,
PA
151
08Fi
le N
ame
: Int
erse
ctio
n 3
(Fro
nt-S
tate
)S
ite C
ode
: 000
0000
3S
tart
Dat
e: 1
1/11
/200
9P
age
No
: 1
Gro
ups P
rinte
d- P
ass V
eh. -
Tru
cks -
Bik
esSt
ate
Nor
thbo
und
Stat
eSo
uthb
ound
Fron
tEa
stbo
und
Fron
tW
estb
ound
Star
t Tim
eLe
ftTh
ruR
ight
Peds
App
. Tot
alLe
ftTh
ruR
ight
Peds
App
. Tot
alLe
ftTh
ruR
ight
Peds
App
. Tot
alLe
ftTh
ruR
ight
Peds
App
. Tot
alIn
t. To
tal
07:0
0 A
M0
260
127
037
100
470
00
00
131
472
8115
507
:15
AM
040
00
400
6321
084
00
00
02
4152
095
219
07:3
0 A
M0
230
023
089
380
127
00
01
12
6347
111
326
407
:45
AM
030
00
300
5744
010
10
00
00
060
620
122
253
Tota
l0
119
01
120
024
611
30
359
00
01
15
195
208
341
189
1
08:0
0 A
M0
430
043
062
481
111
00
01
12
5166
212
127
608
:15
AM
027
00
270
8133
011
40
00
00
241
580
101
242
08:3
0 A
M0
340
135
086
230
109
00
01
10
4851
110
024
508
:45
AM
029
03
320
6928
097
00
00
02
6071
413
726
6To
tal
013
30
413
70
298
132
143
10
00
22
620
024
67
459
1029
***
BR
EAK
***
04:0
0 PM
030
02
320
102
480
150
00
03
33
6710
52
177
362
04:1
5 PM
029
01
300
105
450
150
00
00
04
7910
53
191
371
04:3
0 PM
035
00
350
9855
015
30
00
22
757
111
518
037
004
:45
PM0
380
038
010
463
016
70
00
22
462
101
517
237
9To
tal
013
20
313
50
409
211
062
00
00
77
1826
542
215
720
1482
05:0
0 PM
036
01
370
108
610
169
00
05
54
7111
38
196
407
05:1
5 PM
039
00
390
7752
113
00
00
33
565
115
418
936
105
:30
PM0
320
032
090
400
130
00
01
17
5195
315
631
905
:45
PM0
330
033
089
580
147
00
05
55
6472
814
933
4To
tal
014
00
114
10
364
211
157
60
00
1414
2125
139
523
690
1421
Gra
nd T
otal
052
40
953
30
1317
667
219
860
00
2424
5091
112
7148
2280
4823
App
rch
%0
98.3
01.
70
66.3
33.6
0.1
00
010
02.
240
55.7
2.1
Tota
l %0
10.9
00.
211
.10
27.3
13.8
041
.20
00
0.5
0.5
118
.926
.41
47.3
Pass
Veh
.0
520
09
529
013
0466
22
1968
00
024
2450
884
1268
4822
5047
71%
Pas
s Veh
.0
99.2
010
099
.20
9999
.310
099
.10
00
100
100
100
9799
.810
098
.798
.9Tr
ucks
04
00
40
135
018
00
00
00
273
030
52%
Tru
cks
00.
80
00.
80
10.
70
0.9
00
00
00
30.
20
1.3
1.1
Bik
es0
00
00
00
00
00
00
00
00
00
00
% B
ikes
00
00
00
00
00
00
00
00
00
00
0

JOH
NSO
N, M
IRM
IRA
N &
TH
OM
PSO
N, I
NC
.15
50 C
orao
polis
Hei
ghts
Roa
d, S
uite
440
Moo
n To
wns
hip,
PA
151
08Fi
le N
ame
: Int
erse
ctio
n 3
(Fro
nt-S
tate
)S
ite C
ode
: 000
0000
3S
tart
Dat
e: 1
1/11
/200
9P
age
No
: 2
Stat
eN
orth
boun
dSt
ate
Sout
hbou
ndFr
ont
East
boun
dFr
ont
Wes
tbou
nd
Star
t Tim
eLe
ftTh
ruR
ight
Peds
App
. Tot
alLe
ftTh
ruR
ight
Peds
App
. Tot
alLe
ftTh
ruR
ight
Peds
App
. Tot
alLe
ftTh
ruR
ight
Peds
App
. Tot
alIn
t. To
tal
Peak
Hou
r Ana
lysi
s Fro
m 0
7:00
AM
to 1
1:45
AM
- Pe
ak 1
of 1
Peak
Hou
r for
Ent
ire In
ters
ectio
n B
egin
s at 0
7:30
AM
07:3
0 A
M0
230
023
089
380
127
00
01
12
6347
111
326
407
:45
AM
030
00
300
5744
010
10
00
00
060
620
122
253
08:0
0 A
M0
430
043
062
481
111
00
01
12
5166
212
127
608
:15
AM
027
00
270
8133
011
40
00
00
241
580
101
242
Tota
l Vol
ume
012
30
012
30
289
163
145
30
00
22
621
523
33
457
1035
% A
pp. T
otal
010
00
00
63.8
360.
20
00
100
1.3
4751
0.7
PHF
.000
.715
.000
.000
.715
.000
.812
.849
.250
.892
.000
.000
.000
.500
.500
.750
.853
.883
.375
.936
.938
Pass
Veh
.0
123
00
123
028
015
91
440
00
02
26
202
233
344
410
09%
Pas
s Veh
.0
100
00
100
096
.997
.510
097
.10
00
100
100
100
94.0
100
100
97.2
97.5
Truc
ks0
00
00
09
40
130
00
00
013
00
1326
% T
ruck
s0
00
00
03.
12.
50
2.9
00
00
00
6.0
00
2.8
2.5
Bik
es0
00
00
00
00
00
00
00
00
00
00
% B
ikes
00
00
00
00
00
00
00
00
00
00
0
Peak
Hou
r Ana
lysi
s Fro
m 1
2:00
PM
to 0
5:45
PM
- Pe
ak 1
of 1
Peak
Hou
r for
Ent
ire In
ters
ectio
n B
egin
s at 0
4:15
PM
04:1
5 PM
029
01
300
105
450
150
00
00
04
7910
53
191
371
04:3
0 PM
035
00
350
9855
015
30
00
22
757
111
518
037
004
:45
PM0
380
038
010
463
016
70
00
22
462
101
517
237
905
:00
PM0
360
137
010
861
016
90
00
55
471
113
819
640
7To
tal V
olum
e0
138
02
140
041
522
40
639
00
09
919
269
430
2173
915
27%
App
. Tot
al0
98.6
01.
40
64.9
35.1
00
00
100
2.6
36.4
58.2
2.8
PHF
.000
.908
.000
.500
.921
.000
.961
.889
.000
.945
.000
.000
.000
.450
.450
.679
.851
.951
.656
.943
.938
Pass
Veh
.0
137
02
139
041
422
40
638
00
09
919
265
429
2173
415
20%
Pas
s Veh
.0
99.3
010
099
.30
99.8
100
099
.80
00
100
100
100
98.5
99.8
100
99.3
99.5
Truc
ks0
10
01
01
00
10
00
00
04
10
57
% T
ruck
s0
0.7
00
0.7
00.
20
00.
20
00
00
01.
50.
20
0.7
0.5
Bik
es0
00
00
00
00
00
00
00
00
00
00
% B
ikes
00
00
00
00
00
00
00
00
00
00
0
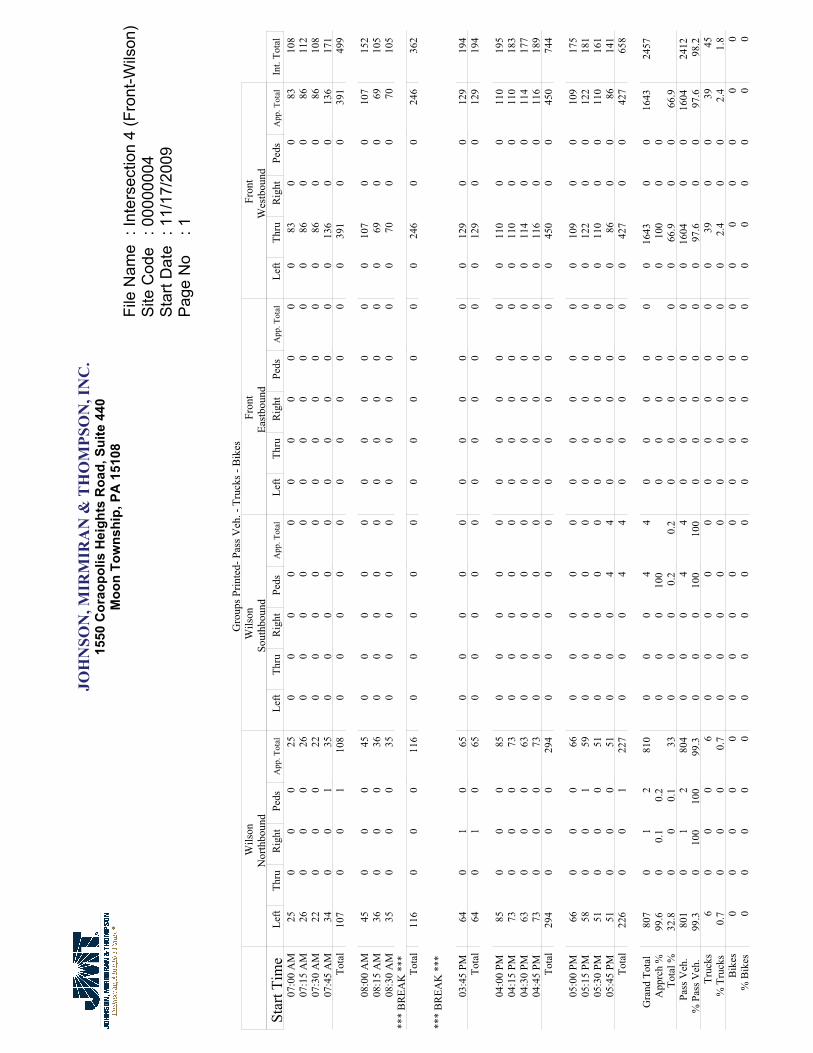
JOH
NSO
N, M
IRM
IRA
N &
TH
OM
PSO
N, I
NC
.15
50 C
orao
polis
Hei
ghts
Roa
d, S
uite
440
Moo
n To
wns
hip,
PA
151
08Fi
le N
ame
: Int
erse
ctio
n 4
(Fro
nt-W
ilson
)S
ite C
ode
: 000
0000
4S
tart
Dat
e: 1
1/17
/200
9P
age
No
: 1
Gro
ups P
rinte
d- P
ass V
eh. -
Tru
cks -
Bik
esW
ilson
Nor
thbo
und
Wils
onSo
uthb
ound
Fron
tEa
stbo
und
Fron
tW
estb
ound
Star
t Tim
eLe
ftTh
ruR
ight
Peds
App
. Tot
alLe
ftTh
ruR
ight
Peds
App
. Tot
alLe
ftTh
ruR
ight
Peds
App
. Tot
alLe
ftTh
ruR
ight
Peds
App
. Tot
alIn
t. To
tal
07:0
0 A
M25
00
025
00
00
00
00
00
083
00
8310
807
:15
AM
260
00
260
00
00
00
00
00
860
086
112
07:3
0 A
M22
00
022
00
00
00
00
00
086
00
8610
807
:45
AM
340
01
350
00
00
00
00
00
136
00
136
171
Tota
l10
70
01
108
00
00
00
00
00
039
10
039
149
9
08:0
0 A
M45
00
045
00
00
00
00
00
010
70
010
715
208
:15
AM
360
00
360
00
00
00
00
00
690
069
105
08:3
0 A
M35
00
035
00
00
00
00
00
070
00
7010
5**
* B
REA
K *
**To
tal
116
00
011
60
00
00
00
00
00
246
00
246
362
***
BR
EAK
***
03:4
5 PM
640
10
650
00
00
00
00
00
129
00
129
194
Tota
l64
01
065
00
00
00
00
00
012
90
012
919
4
04:0
0 PM
850
00
850
00
00
00
00
00
110
00
110
195
04:1
5 PM
730
00
730
00
00
00
00
00
110
00
110
183
04:3
0 PM
630
00
630
00
00
00
00
00
114
00
114
177
04:4
5 PM
730
00
730
00
00
00
00
00
116
00
116
189
Tota
l29
40
00
294
00
00
00
00
00
045
00
045
074
4
05:0
0 PM
660
00
660
00
00
00
00
00
109
00
109
175
05:1
5 PM
580
01
590
00
00
00
00
00
122
00
122
181
05:3
0 PM
510
00
510
00
00
00
00
00
110
00
110
161
05:4
5 PM
510
00
510
00
44
00
00
00
860
086
141
Tota
l22
60
01
227
00
04
40
00
00
042
70
042
765
8
Gra
nd T
otal
807
01
281
00
00
44
00
00
00
1643
00
1643
2457
App
rch
%99
.60
0.1
0.2
00
010
00
00
00
100
00
Tota
l %32
.80
00.
133
00
00.
20.
20
00
00
066
.90
066
.9Pa
ss V
eh.
801
01
280
40
00
44
00
00
00
1604
00
1604
2412
% P
ass V
eh.
99.3
010
010
099
.30
00
100
100
00
00
00
97.6
00
97.6
98.2
Truc
ks6
00
06
00
00
00
00
00
039
00
3945
% T
ruck
s0.
70
00
0.7
00
00
00
00
00
02.
40
02.
41.
8B
ikes
00
00
00
00
00
00
00
00
00
00
0%
Bik
es0
00
00
00
00
00
00
00
00
00
00
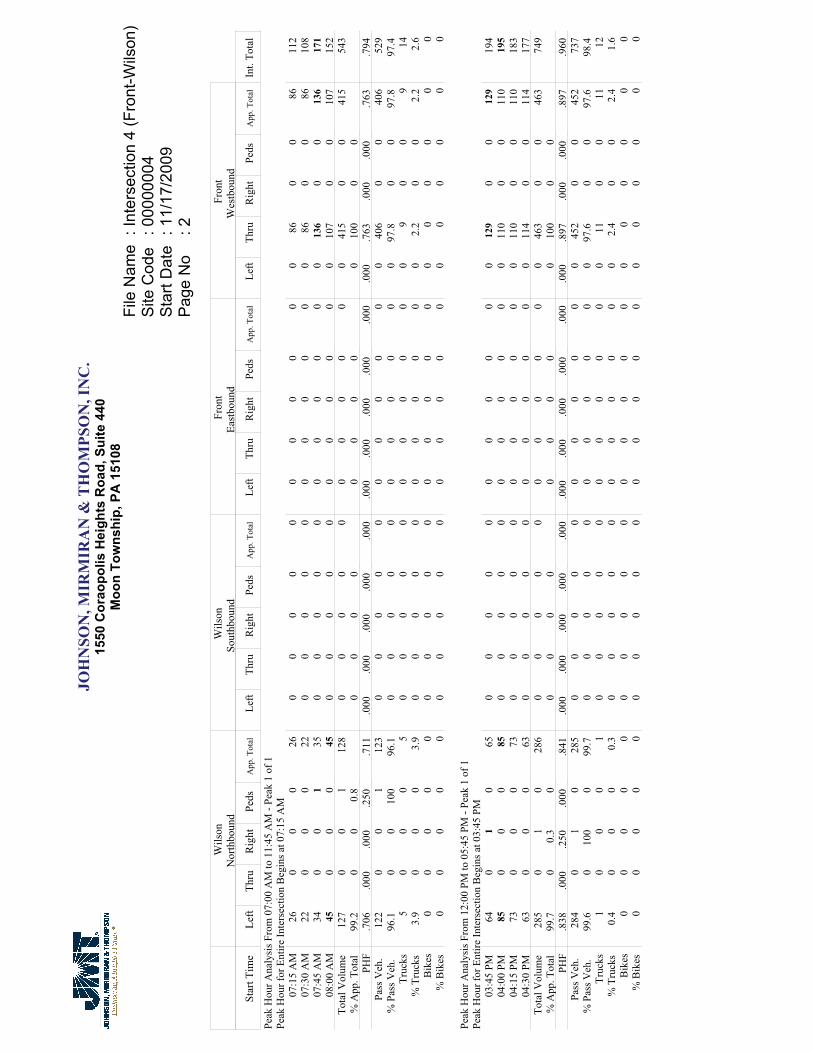
JOH
NSO
N, M
IRM
IRA
N &
TH
OM
PSO
N, I
NC
.15
50 C
orao
polis
Hei
ghts
Roa
d, S
uite
440
Moo
n To
wns
hip,
PA
151
08Fi
le N
ame
: Int
erse
ctio
n 4
(Fro
nt-W
ilson
)S
ite C
ode
: 000
0000
4S
tart
Dat
e: 1
1/17
/200
9P
age
No
: 2
Wils
onN
orth
boun
dW
ilson
Sout
hbou
ndFr
ont
East
boun
dFr
ont
Wes
tbou
nd
Star
t Tim
eLe
ftTh
ruR
ight
Peds
App
. Tot
alLe
ftTh
ruR
ight
Peds
App
. Tot
alLe
ftTh
ruR
ight
Peds
App
. Tot
alLe
ftTh
ruR
ight
Peds
App
. Tot
alIn
t. To
tal
Peak
Hou
r Ana
lysi
s Fro
m 0
7:00
AM
to 1
1:45
AM
- Pe
ak 1
of 1
Peak
Hou
r for
Ent
ire In
ters
ectio
n B
egin
s at 0
7:15
AM
07:1
5 A
M26
00
026
00
00
00
00
00
086
00
8611
207
:30
AM
220
00
220
00
00
00
00
00
860
086
108
07:4
5 A
M34
00
135
00
00
00
00
00
013
60
013
617
108
:00
AM
450
00
450
00
00
00
00
00
107
00
107
152
Tota
l Vol
ume
127
00
112
80
00
00
00
00
00
415
00
415
543
% A
pp. T
otal
99.2
00
0.8
00
00
00
00
010
00
0PH
F.7
06.0
00.0
00.2
50.7
11.0
00.0
00.0
00.0
00.0
00.0
00.0
00.0
00.0
00.0
00.0
00.7
63.0
00.0
00.7
63.7
94Pa
ss V
eh.
122
00
112
30
00
00
00
00
00
406
00
406
529
% P
ass V
eh.
96.1
00
100
96.1
00
00
00
00
00
097
.80
097
.897
.4Tr
ucks
50
00
50
00
00
00
00
00
90
09
14%
Tru
cks
3.9
00
03.
90
00
00
00
00
00
2.2
00
2.2
2.6
Bik
es0
00
00
00
00
00
00
00
00
00
00
% B
ikes
00
00
00
00
00
00
00
00
00
00
0
Peak
Hou
r Ana
lysi
s Fro
m 1
2:00
PM
to 0
5:45
PM
- Pe
ak 1
of 1
Peak
Hou
r for
Ent
ire In
ters
ectio
n B
egin
s at 0
3:45
PM
03:4
5 PM
640
10
650
00
00
00
00
00
129
00
129
194
04:0
0 PM
850
00
850
00
00
00
00
00
110
00
110
195
04:1
5 PM
730
00
730
00
00
00
00
00
110
00
110
183
04:3
0 PM
630
00
630
00
00
00
00
00
114
00
114
177
Tota
l Vol
ume
285
01
028
60
00
00
00
00
00
463
00
463
749
% A
pp. T
otal
99.7
00.
30
00
00
00
00
010
00
0PH
F.8
38.0
00.2
50.0
00.8
41.0
00.0
00.0
00.0
00.0
00.0
00.0
00.0
00.0
00.0
00.0
00.8
97.0
00.0
00.8
97.9
60Pa
ss V
eh.
284
01
028
50
00
00
00
00
00
452
00
452
737
% P
ass V
eh.
99.6
010
00
99.7
00
00
00
00
00
097
.60
097
.698
.4Tr
ucks
10
00
10
00
00
00
00
00
110
011
12%
Tru
cks
0.4
00
00.
30
00
00
00
00
00
2.4
00
2.4
1.6
Bik
es0
00
00
00
00
00
00
00
00
00
00
% B
ikes
00
00
00
00
00
00
00
00
00
00
0

JOH
NSO
N, M
IRM
IRA
N &
TH
OM
PSO
N, I
NC
.15
50 C
orao
polis
Hei
ghts
Roa
d, S
uite
440
Moo
n To
wns
hip,
PA
151
08Fi
le N
ame
: Int
erse
ctio
n 5
(Firs
t-Pet
role
um)
Site
Cod
e: 0
0000
005
Sta
rt D
ate
: 11/
10/2
009
Pag
e N
o: 1
Gro
ups
Prin
ted-
Pas
s V
eh. -
Tru
cks
- Bik
esP
etro
leum
Nor
thbo
und
Pet
role
umS
outh
boun
d1s
tE
astb
ound
1st
Wes
tbou
ndS
tart
Tim
eLe
ftTh
ruR
ight
Ped
sA
pp. T
otal
Left
Thru
Rig
htP
eds
App
. Tot
alLe
ftTh
ruR
ight
Ped
sA
pp. T
otal
Left
Thru
Rig
htP
eds
App
. Tot
alIn
t. To
tal
07:0
0 A
M1
31
05
375
210
6329
250
054
00
00
012
207
:15
AM
15
10
729
633
068
2942
20
730
00
00
148
07:3
0 A
M1
50
06
346
641
105
3927
00
660
00
11
178
07:4
5 A
M3
31
07
4214
842
142
4632
20
800
00
00
229
Tota
l6
163
025
142
3120
23
378
143
126
40
273
00
01
167
7
08:0
0 A
M3
110
014
298
560
9337
523
092
00
02
220
108
:15
AM
05
01
636
653
297
3742
10
800
00
00
183
08:3
0 A
M1
40
05
437
541
105
2032
00
520
00
11
163
08:4
5 A
M0
41
16
457
421
9526
370
265
00
00
016
6To
tal
424
12
3115
328
205
439
012
016
34
228
90
00
33
713
***
BR
EA
K *
**
04:0
0 P
M3
30
06
799
812
171
3752
00
890
00
00
266
04:1
5 P
M4
63
013
6012
774
153
3329
00
620
00
11
229
04:3
0 P
M2
101
114
8117
929
199
5340
10
940
00
22
309
04:4
5 P
M2
123
017
8012
891
182
4127
00
680
00
22
269
Tota
l11
317
150
300
5033
916
705
164
148
10
313
00
05
510
73
05:0
0 P
M1
40
05
8112
873
183
5051
10
102
00
02
229
205
:15
PM
18
22
1376
1173
016
030
331
064
00
03
324
005
:30
PM
16
00
758
965
013
239
410
080
00
03
322
205
:45
PM
19
20
1265
866
314
221
401
062
00
02
221
8To
tal
427
42
3728
040
291
661
714
016
53
030
80
00
1010
972
Gra
nd T
otal
2598
155
143
875
149
1037
2920
9056
760
212
211
830
00
1919
3435
App
rch
%17
.568
.510
.53.
541
.97.
149
.61.
447
.950
.91
0.2
00
010
0To
tal %
0.7
2.9
0.4
0.1
4.2
25.5
4.3
30.2
0.8
60.8
16.5
17.5
0.3
0.1
34.4
00
00.
60.
6P
ass
Veh
.24
9815
514
285
414
810
2626
2054
557
597
122
1168
00
019
1933
83%
Pas
s V
eh.
9610
010
010
099
.397
.699
.398
.989
.798
.398
.299
.210
010
098
.70
00
100
100
98.5
Truc
ks1
00
01
211
111
3410
50
015
00
00
050
% T
ruck
s4
00
00.
72.
40.
71.
13.
41.
61.
80.
80
01.
30
00
00
1.5
Bik
es0
00
00
00
02
20
00
00
00
00
02
% B
ikes
00
00
00
00
6.9
0.1
00
00
00
00
00
0.1
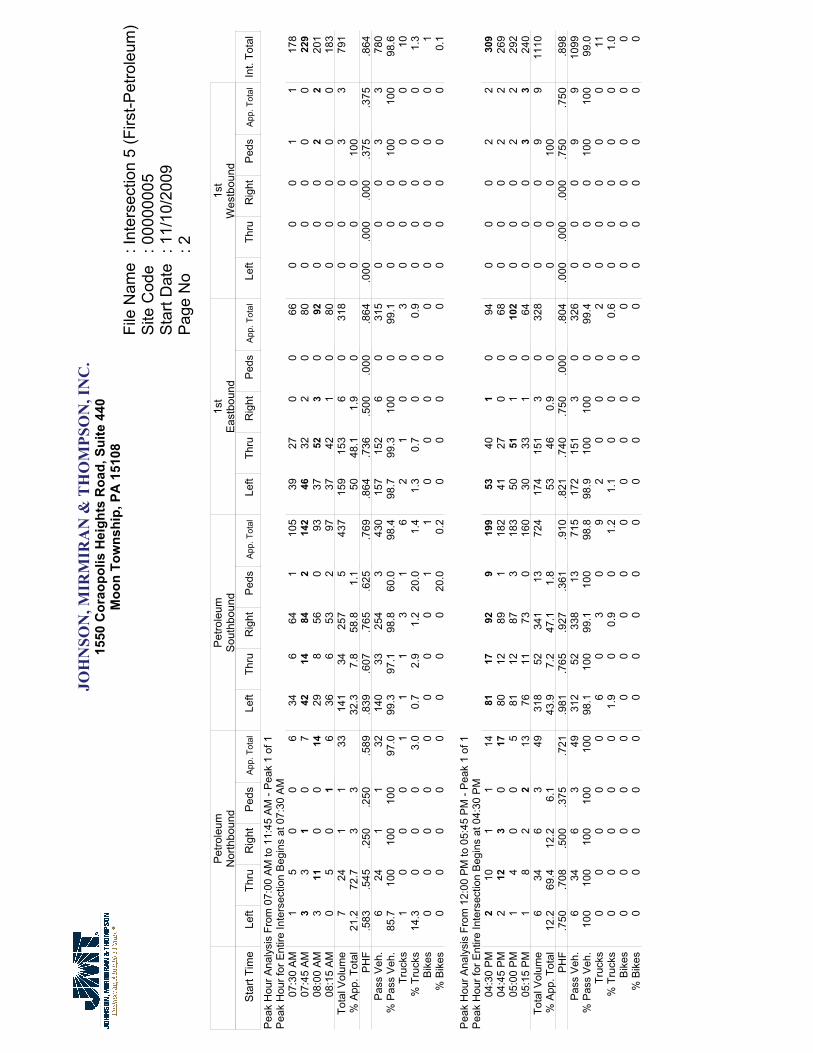
JOH
NSO
N, M
IRM
IRA
N &
TH
OM
PSO
N, I
NC
.15
50 C
orao
polis
Hei
ghts
Roa
d, S
uite
440
Moo
n To
wns
hip,
PA
151
08Fi
le N
ame
: Int
erse
ctio
n 5
(Firs
t-Pet
role
um)
Site
Cod
e: 0
0000
005
Sta
rt D
ate
: 11/
10/2
009
Pag
e N
o: 2
Pet
role
umN
orth
boun
dP
etro
leum
Sou
thbo
und
1st
Eas
tbou
nd1s
tW
estb
ound
Sta
rt Ti
me
Left
Thru
Rig
htP
eds
App
. Tot
alLe
ftTh
ruR
ight
Ped
sA
pp. T
otal
Left
Thru
Rig
htP
eds
App
. Tot
alLe
ftTh
ruR
ight
Ped
sA
pp. T
otal
Int.
Tota
l
Pea
k H
our A
naly
sis
From
07:
00 A
M to
11:
45 A
M -
Pea
k 1
of 1
Pea
k H
our f
or E
ntire
Inte
rsec
tion
Beg
ins
at 0
7:30
AM
07:3
0 A
M1
50
06
346
641
105
3927
00
660
00
11
178
07:4
5 A
M3
31
07
4214
842
142
4632
20
800
00
00
229
08:0
0 A
M3
110
014
298
560
9337
523
092
00
02
220
108
:15
AM
05
01
636
653
297
3742
10
800
00
00
183
Tota
l Vol
ume
724
11
3314
134
257
543
715
915
36
031
80
00
33
791
% A
pp. T
otal
21.2
72.7
33
32.3
7.8
58.8
1.1
5048
.11.
90
00
010
0P
HF
.583
.545
.250
.250
.589
.839
.607
.765
.625
.769
.864
.736
.500
.000
.864
.000
.000
.000
.375
.375
.864
Pas
s V
eh.
624
11
3214
033
254
343
015
715
26
031
50
00
33
780
% P
ass
Veh
.85
.710
010
010
097
.099
.397
.198
.860
.098
.498
.799
.310
00
99.1
00
010
010
098
.6Tr
ucks
10
00
11
13
16
21
00
30
00
00
10%
Tru
cks
14.3
00
03.
00.
72.
91.
220
.01.
41.
30.
70
00.
90
00
00
1.3
Bik
es0
00
00
00
01
10
00
00
00
00
01
% B
ikes
00
00
00
00
20.0
0.2
00
00
00
00
00
0.1
Pea
k H
our A
naly
sis
From
12:
00 P
M to
05:
45 P
M -
Pea
k 1
of 1
Pea
k H
our f
or E
ntire
Inte
rsec
tion
Beg
ins
at 0
4:30
PM
04:3
0 P
M2
101
114
8117
929
199
5340
10
940
00
22
309
04:4
5 P
M2
123
017
8012
891
182
4127
00
680
00
22
269
05:0
0 P
M1
40
05
8112
873
183
5051
10
102
00
02
229
205
:15
PM
18
22
1376
1173
016
030
331
064
00
03
324
0To
tal V
olum
e6
346
349
318
5234
113
724
174
151
30
328
00
09
911
10%
App
. Tot
al12
.269
.412
.26.
143
.97.
247
.11.
853
460.
90
00
010
0P
HF
.750
.708
.500
.375
.721
.981
.765
.927
.361
.910
.821
.740
.750
.000
.804
.000
.000
.000
.750
.750
.898
Pas
s V
eh.
634
63
4931
252
338
1371
517
215
13
032
60
00
99
1099
% P
ass
Veh
.10
010
010
010
010
098
.110
099
.110
098
.898
.910
010
00
99.4
00
010
010
099
.0Tr
ucks
00
00
06
03
09
20
00
20
00
00
11%
Tru
cks
00
00
01.
90
0.9
01.
21.
10
00
0.6
00
00
01.
0B
ikes
00
00
00
00
00
00
00
00
00
00
0%
Bik
es0
00
00
00
00
00
00
00
00
00
00

JOH
NSO
N, M
IRM
IRA
N &
TH
OM
PSO
N, I
NC
.15
50 C
orao
polis
Hei
ghts
Roa
d, S
uite
440
Moo
n To
wns
hip,
PA
151
08Fi
le N
ame
: Int
erse
ctio
n 6
(Firs
t-Cen
tral)
Site
Cod
e: 0
0000
006
Sta
rt D
ate
: 11/
5/20
09P
age
No
: 1
Gro
ups P
rinte
d- P
ass V
eh. -
Tru
cks -
Bik
esC
entra
lN
orth
boun
dC
entra
lSo
uthb
ound
1st
East
boun
d1s
tW
estb
ound
Star
t Tim
eLe
ftTh
ruR
ight
Peds
App
. Tot
alLe
ftTh
ruR
ight
Peds
App
. Tot
alLe
ftTh
ruR
ight
Peds
App
. Tot
alLe
ftTh
ruR
ight
Peds
App
. Tot
alIn
t. To
tal
07:0
0 A
M0
1814
032
24
00
60
490
150
00
00
088
07:1
5 A
M0
1618
034
211
00
133
533
059
00
00
010
607
:30
AM
014
180
323
60
09
663
11
710
00
00
112
07:4
5 A
M0
1423
138
216
00
181
584
063
00
00
011
9To
tal
062
731
136
937
00
4610
223
82
243
00
00
042
5
08:0
0 A
M0
1132
245
412
01
172
812
085
00
00
014
708
:15
AM
014
142
306
150
021
473
61
840
00
00
135
08:3
0 A
M0
1116
027
54
00
96
575
068
00
01
110
508
:45
AM
013
161
3010
100
121
156
72
660
00
11
118
Tota
l0
4978
513
225
410
268
1326
720
330
30
00
22
505
***
BR
EAK
***
04:0
0 PM
021
254
5017
360
154
673
81
880
00
11
193
04:1
5 PM
013
272
4212
280
242
772
133
950
00
33
182
04:3
0 PM
09
201
309
290
341
474
106
940
00
00
165
04:4
5 PM
012
231
3617
250
042
910
314
513
10
00
11
210
Tota
l0
5595
815
855
118
06
179
2632
245
1540
80
00
55
750
05:0
0 PM
010
182
3013
200
841
790
144
115
00
05
519
105
:15
PM0
1623
140
1123
03
374
105
212
132
00
02
221
105
:30
PM0
1019
332
914
03
266
976
211
10
00
33
172
05:4
5 PM
010
211
325
170
224
661
141
820
00
11
139
Tota
l0
4681
713
438
740
1612
823
353
559
440
00
011
1171
3
Gra
nd T
otal
021
232
721
560
127
270
024
421
7211
6512
829
1394
00
018
1823
93A
pprc
h %
037
.958
.43.
830
.264
.10
5.7
5.2
83.6
9.2
2.1
00
010
0To
tal %
08.
913
.70.
923
.45.
311
.30
117
.63
48.7
5.3
1.2
58.3
00
00.
80.
8Pa
ss V
eh.
020
932
221
552
125
266
024
415
7211
1112
629
1338
00
018
1823
23%
Pas
s Veh
.0
98.6
98.5
100
98.6
98.4
98.5
010
098
.610
095
.498
.410
096
00
010
010
097
.1Tr
ucks
03
50
82
40
06
054
20
560
00
00
70%
Tru
cks
01.
41.
50
1.4
1.6
1.5
00
1.4
04.
61.
60
40
00
00
2.9
Bik
es0
00
00
00
00
00
00
00
00
00
00
% B
ikes
00
00
00
00
00
00
00
00
00
00
0

JOH
NSO
N, M
IRM
IRA
N &
TH
OM
PSO
N, I
NC
.15
50 C
orao
polis
Hei
ghts
Roa
d, S
uite
440
Moo
n To
wns
hip,
PA
151
08Fi
le N
ame
: Int
erse
ctio
n 6
(Firs
t-Cen
tral)
Site
Cod
e: 0
0000
006
Sta
rt D
ate
: 11/
5/20
09P
age
No
: 2
Cen
tral
Nor
thbo
und
Cen
tral
Sout
hbou
nd1s
tEa
stbo
und
1st
Wes
tbou
nd
Star
t Tim
eLe
ftTh
ruR
ight
Peds
App
. Tot
alLe
ftTh
ruR
ight
Peds
App
. Tot
alLe
ftTh
ruR
ight
Peds
App
. Tot
alLe
ftTh
ruR
ight
Peds
App
. Tot
alIn
t. To
tal
Peak
Hou
r Ana
lysi
s Fro
m 0
7:00
AM
to 1
1:45
AM
- Pe
ak 1
of 1
Peak
Hou
r for
Ent
ire In
ters
ectio
n B
egin
s at 0
7:30
AM
07:3
0 A
M0
1418
032
36
00
96
631
171
00
00
011
207
:45
AM
014
231
382
160
018
158
40
630
00
00
119
08:0
0 A
M0
1132
245
412
01
172
812
085
00
00
014
708
:15
AM
014
142
306
150
021
473
61
840
00
00
135
Tota
l Vol
ume
053
875
145
1549
01
6513
275
132
303
00
00
051
3%
App
. Tot
al0
36.6
603.
423
.175
.40
1.5
4.3
90.8
4.3
0.7
00
00
PHF
.000
.946
.680
.625
.806
.625
.766
.000
.250
.774
.542
.849
.542
.500
.891
.000
.000
.000
.000
.000
.872
Pass
Veh
.0
5385
514
314
460
161
1325
113
227
90
00
00
483
% P
ass V
eh.
010
097
.710
098
.693
.393
.90
100
93.8
100
91.3
100
100
92.1
00
00
094
.2Tr
ucks
00
20
21
30
04
024
00
240
00
00
30%
Tru
cks
00
2.3
01.
46.
76.
10
06.
20
8.7
00
7.9
00
00
05.
8B
ikes
00
00
00
00
00
00
00
00
00
00
0%
Bik
es0
00
00
00
00
00
00
00
00
00
00
Peak
Hou
r Ana
lysi
s Fro
m 1
2:00
PM
to 0
5:45
PM
- Pe
ak 1
of 1
Peak
Hou
r for
Ent
ire In
ters
ectio
n B
egin
s at 0
4:45
PM
04:4
5 PM
012
231
3617
250
042
910
314
513
10
00
11
210
05:0
0 PM
010
182
3013
200
841
790
144
115
00
05
519
105
:15
PM0
1623
140
1123
03
374
105
212
132
00
02
221
105
:30
PM0
1019
332
914
03
266
976
211
10
00
33
172
Tota
l Vol
ume
048
837
138
5082
014
146
2639
555
1348
90
00
1111
784
% A
pp. T
otal
034
.860
.15.
134
.256
.20
9.6
5.3
80.8
11.2
2.7
00
010
0PH
F.0
00.7
50.9
02.5
83.8
63.7
35.8
20.0
00.4
38.8
69.7
22.9
40.6
55.6
50.9
26.0
00.0
00.0
00.5
50.5
50.9
29Pa
ss V
eh.
046
837
136
5081
014
145
2638
854
1348
10
00
1111
773
% P
ass V
eh.
095
.810
010
098
.610
098
.80
100
99.3
100
98.2
98.2
100
98.4
00
010
010
098
.6Tr
ucks
02
00
20
10
01
07
10
80
00
00
11%
Tru
cks
04.
20
01.
40
1.2
00
0.7
01.
81.
80
1.6
00
00
01.
4B
ikes
00
00
00
00
00
00
00
00
00
00
0%
Bik
es0
00
00
00
00
00
00
00
00
00
00

JOH
NSO
N, M
IRM
IRA
N &
TH
OM
PSO
N, I
NC
.15
50 C
orao
polis
Hei
ghts
Roa
d, S
uite
440
Moo
n To
wns
hip,
PA
151
08Fi
le N
ame
: Int
erse
ctio
n 7
(Firs
t-Sta
te)
Site
Cod
e: 0
0000
007
Sta
rt D
ate
: 11/
11/2
009
Pag
e N
o: 1
Gro
ups P
rinte
d- P
ass V
eh. -
Tru
cks -
Bik
esSt
ate
Nor
thbo
und
Stat
eSo
uthb
ound
1st
East
boun
d1s
tW
estb
ound
Star
t Tim
eLe
ftTh
ruR
ight
Peds
App
. Tot
alLe
ftTh
ruR
ight
Peds
App
. Tot
alLe
ftTh
ruR
ight
Peds
App
. Tot
alLe
ftTh
ruR
ight
Peds
App
. Tot
alIn
t. To
tal
07:0
0 A
M0
00
00
401
01
4226
351
062
00
00
010
407
:15
AM
00
00
065
20
067
3736
00
730
00
00
140
07:3
0 A
M0
00
00
865
01
9227
440
273
00
00
016
507
:45
AM
00
01
154
40
058
3256
11
900
00
00
149
Tota
l0
00
11
245
120
225
912
217
12
329
80
00
00
558
08:0
0 A
M0
00
11
562
01
5942
413
086
00
00
014
608
:15
AM
00
00
079
40
083
3056
10
870
00
00
170
08:3
0 A
M0
00
11
832
01
8635
502
087
00
01
117
508
:45
AM
00
00
066
40
171
3153
12
870
00
11
159
Tota
l0
00
22
284
120
329
913
820
07
234
70
00
22
650
***
BR
EAK
***
04:0
0 PM
00
02
290
80
199
3276
42
114
00
04
421
904
:15
PM0
00
22
100
90
010
931
795
111
60
00
22
229
04:3
0 PM
00
03
383
180
010
138
676
311
40
00
55
223
04:4
5 PM
00
01
196
100
310
939
846
513
40
00
11
245
Tota
l0
00
88
369
450
441
814
030
621
1147
80
00
1212
916
05:0
0 PM
00
00
010
47
01
112
3490
63
133
00
06
625
105
:15
PM0
00
44
746
00
8039
7410
212
50
00
33
212
05:3
0 PM
00
02
284
110
196
3362
42
101
00
02
220
105
:45
PM0
00
66
836
05
9435
505
393
00
01
119
4To
tal
00
012
1234
530
07
382
141
276
2510
452
00
012
1285
8
Gra
nd T
otal
00
023
2312
4399
016
1358
541
953
5526
1575
00
026
2629
82A
pprc
h %
00
010
091
.57.
30
1.2
34.3
60.5
3.5
1.7
00
010
0To
tal %
00
00.
80.
841
.73.
30
0.5
45.5
18.1
321.
80.
952
.80
00
0.9
0.9
Pass
Veh
.0
00
2121
1225
990
1613
4053
792
453
2515
390
00
2525
2925
% P
ass V
eh.
00
091
.391
.398
.610
00
100
98.7
99.3
9796
.496
.297
.70
00
96.2
96.2
98.1
Truc
ks0
00
00
180
00
184
292
035
00
00
053
% T
ruck
s0
00
00
1.4
00
01.
30.
73
3.6
02.
20
00
00
1.8
Bik
es0
00
22
00
00
00
00
11
00
01
14
% B
ikes
00
08.
78.
70
00
00
00
03.
80.
10
00
3.8
3.8
0.1

JOH
NSO
N, M
IRM
IRA
N &
TH
OM
PSO
N, I
NC
.15
50 C
orao
polis
Hei
ghts
Roa
d, S
uite
440
Moo
n To
wns
hip,
PA
151
08Fi
le N
ame
: Int
erse
ctio
n 7
(Firs
t-Sta
te)
Site
Cod
e: 0
0000
007
Sta
rt D
ate
: 11/
11/2
009
Pag
e N
o: 2
Stat
eN
orth
boun
dSt
ate
Sout
hbou
nd1s
tEa
stbo
und
1st
Wes
tbou
nd
Star
t Tim
eLe
ftTh
ruR
ight
Peds
App
. Tot
alLe
ftTh
ruR
ight
Peds
App
. Tot
alLe
ftTh
ruR
ight
Peds
App
. Tot
alLe
ftTh
ruR
ight
Peds
App
. Tot
alIn
t. To
tal
Peak
Hou
r Ana
lysi
s Fro
m 0
7:00
AM
to 1
1:45
AM
- Pe
ak 1
of 1
Peak
Hou
r for
Ent
ire In
ters
ectio
n B
egin
s at 0
8:00
AM
08:0
0 A
M0
00
11
562
01
5942
413
086
00
00
014
608
:15
AM
00
00
079
40
083
3056
10
870
00
00
170
08:3
0 A
M0
00
11
832
01
8635
502
087
00
01
117
508
:45
AM
00
00
066
40
171
3153
12
870
00
11
159
Tota
l Vol
ume
00
02
228
412
03
299
138
200
72
347
00
02
265
0%
App
. Tot
al0
00
100
954
01
39.8
57.6
20.
60
00
100
PHF
.000
.000
.000
.500
.500
.855
.750
.000
.750
.869
.821
.893
.583
.250
.997
.000
.000
.000
.500
.500
.929
Pass
Veh
.0
00
22
271
120
328
613
819
36
233
90
00
22
629
% P
ass V
eh.
00
010
010
095
.410
00
100
95.7
100
96.5
85.7
100
97.7
00
010
010
096
.8Tr
ucks
00
00
013
00
013
07
10
80
00
00
21%
Tru
cks
00
00
04.
60
00
4.3
03.
514
.30
2.3
00
00
03.
2B
ikes
00
00
00
00
00
00
00
00
00
00
0%
Bik
es0
00
00
00
00
00
00
00
00
00
00
Peak
Hou
r Ana
lysi
s Fro
m 1
2:00
PM
to 0
5:45
PM
- Pe
ak 1
of 1
Peak
Hou
r for
Ent
ire In
ters
ectio
n B
egin
s at 0
4:15
PM
04:1
5 PM
00
02
210
09
00
109
3179
51
116
00
02
222
904
:30
PM0
00
33
8318
00
101
3867
63
114
00
05
522
304
:45
PM0
00
11
9610
03
109
3984
65
134
00
01
124
505
:00
PM0
00
00
104
70
111
234
906
313
30
00
66
251
Tota
l Vol
ume
00
06
638
344
04
431
142
320
2312
497
00
014
1494
8%
App
. Tot
al0
00
100
88.9
10.2
00.
928
.664
.44.
62.
40
00
100
PHF
.000
.000
.000
.500
.500
.921
.611
.000
.333
.962
.910
.889
.958
.600
.927
.000
.000
.000
.583
.583
.944
Pass
Veh
.0
00
66
382
440
443
014
131
723
1249
30
00
1313
942
% P
ass V
eh.
00
010
010
099
.710
00
100
99.8
99.3
99.1
100
100
99.2
00
092
.992
.999
.4Tr
ucks
00
00
01
00
01
13
00
40
00
00
5%
Tru
cks
00
00
00.
30
00
0.2
0.7
0.9
00
0.8
00
00
00.
5B
ikes
00
00
00
00
00
00
00
00
00
11
1%
Bik
es0
00
00
00
00
00
00
00
00
07.
17.
10.
1
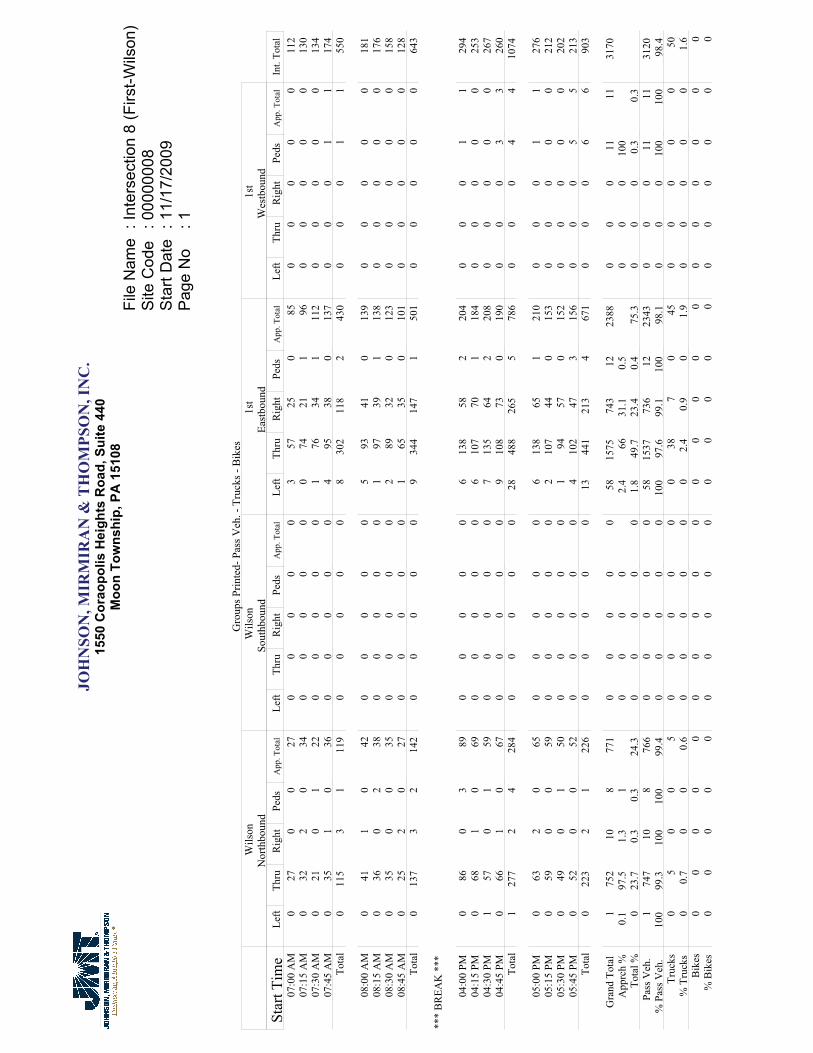
JOH
NSO
N, M
IRM
IRA
N &
TH
OM
PSO
N, I
NC
.15
50 C
orao
polis
Hei
ghts
Roa
d, S
uite
440
Moo
n To
wns
hip,
PA
151
08Fi
le N
ame
: Int
erse
ctio
n 8
(Firs
t-Wils
on)
Site
Cod
e: 0
0000
008
Sta
rt D
ate
: 11/
17/2
009
Pag
e N
o: 1
Gro
ups P
rinte
d- P
ass V
eh. -
Tru
cks -
Bik
esW
ilson
Nor
thbo
und
Wils
onSo
uthb
ound
1st
East
boun
d1s
tW
estb
ound
Star
t Tim
eLe
ftTh
ruR
ight
Peds
App
. Tot
alLe
ftTh
ruR
ight
Peds
App
. Tot
alLe
ftTh
ruR
ight
Peds
App
. Tot
alLe
ftTh
ruR
ight
Peds
App
. Tot
alIn
t. To
tal
07:0
0 A
M0
270
027
00
00
03
5725
085
00
00
011
207
:15
AM
032
20
340
00
00
074
211
960
00
00
130
07:3
0 A
M0
210
122
00
00
01
7634
111
20
00
00
134
07:4
5 A
M0
351
036
00
00
04
9538
013
70
00
11
174
Tota
l0
115
31
119
00
00
08
302
118
243
00
00
11
550
08:0
0 A
M0
411
042
00
00
05
9341
013
90
00
00
181
08:1
5 A
M0
360
238
00
00
01
9739
113
80
00
00
176
08:3
0 A
M0
350
035
00
00
02
8932
012
30
00
00
158
08:4
5 A
M0
252
027
00
00
01
6535
010
10
00
00
128
Tota
l0
137
32
142
00
00
09
344
147
150
10
00
00
643
***
BR
EAK
***
04:0
0 PM
086
03
890
00
00
613
858
220
40
00
11
294
04:1
5 PM
068
10
690
00
00
610
770
118
40
00
00
253
04:3
0 PM
157
01
590
00
00
713
564
220
80
00
00
267
04:4
5 PM
066
10
670
00
00
910
873
019
00
00
33
260
Tota
l1
277
24
284
00
00
028
488
265
578
60
00
44
1074
05:0
0 PM
063
20
650
00
00
613
865
121
00
00
11
276
05:1
5 PM
059
00
590
00
00
210
744
015
30
00
00
212
05:3
0 PM
049
01
500
00
00
194
570
152
00
00
020
205
:45
PM0
520
052
00
00
04
102
473
156
00
05
521
3To
tal
022
32
122
60
00
00
1344
121
34
671
00
06
690
3
Gra
nd T
otal
175
210
877
10
00
00
5815
7574
312
2388
00
011
1131
70A
pprc
h %
0.1
97.5
1.3
10
00
02.
466
31.1
0.5
00
010
0To
tal %
023
.70.
30.
324
.30
00
00
1.8
49.7
23.4
0.4
75.3
00
00.
30.
3Pa
ss V
eh.
174
710
876
60
00
00
5815
3773
612
2343
00
011
1131
20%
Pas
s Veh
.10
099
.310
010
099
.40
00
00
100
97.6
99.1
100
98.1
00
010
010
098
.4Tr
ucks
05
00
50
00
00
038
70
450
00
00
50%
Tru
cks
00.
70
00.
60
00
00
02.
40.
90
1.9
00
00
01.
6B
ikes
00
00
00
00
00
00
00
00
00
00
0%
Bik
es0
00
00
00
00
00
00
00
00
00
00

JOH
NSO
N, M
IRM
IRA
N &
TH
OM
PSO
N, I
NC
.15
50 C
orao
polis
Hei
ghts
Roa
d, S
uite
440
Moo
n To
wns
hip,
PA
151
08Fi
le N
ame
: Int
erse
ctio
n 8
(Firs
t-Wils
on)
Site
Cod
e: 0
0000
008
Sta
rt D
ate
: 11/
17/2
009
Pag
e N
o: 2
Wils
onN
orth
boun
dW
ilson
Sout
hbou
nd1s
tEa
stbo
und
1st
Wes
tbou
nd
Star
t Tim
eLe
ftTh
ruR
ight
Peds
App
. Tot
alLe
ftTh
ruR
ight
Peds
App
. Tot
alLe
ftTh
ruR
ight
Peds
App
. Tot
alLe
ftTh
ruR
ight
Peds
App
. Tot
alIn
t. To
tal
Peak
Hou
r Ana
lysi
s Fro
m 0
7:00
AM
to 1
1:45
AM
- Pe
ak 1
of 1
Peak
Hou
r for
Ent
ire In
ters
ectio
n B
egin
s at 0
7:45
AM
07:4
5 A
M0
351
036
00
00
04
9538
013
70
00
11
174
08:0
0 A
M0
411
042
00
00
05
9341
013
90
00
00
181
08:1
5 A
M0
360
238
00
00
01
9739
113
80
00
00
176
08:3
0 A
M0
350
035
00
00
02
8932
012
30
00
00
158
Tota
l Vol
ume
014
72
215
10
00
00
1237
415
01
537
00
01
168
9%
App
. Tot
al0
97.4
1.3
1.3
00
00
2.2
69.6
27.9
0.2
00
010
0PH
F.0
00.8
96.5
00.2
50.8
99.0
00.0
00.0
00.0
00.0
00.6
00.9
64.9
15.2
50.9
66.0
00.0
00.0
00.2
50.2
50.9
52Pa
ss V
eh.
014
42
214
80
00
00
1235
914
71
519
00
01
166
8%
Pas
s Veh
.0
98.0
100
100
98.0
00
00
010
096
.098
.010
096
.60
00
100
100
97.0
Truc
ks0
30
03
00
00
00
153
018
00
00
021
% T
ruck
s0
2.0
00
2.0
00
00
00
4.0
2.0
03.
40
00
00
3.0
Bik
es0
00
00
00
00
00
00
00
00
00
00
% B
ikes
00
00
00
00
00
00
00
00
00
00
0
Peak
Hou
r Ana
lysi
s Fro
m 1
2:00
PM
to 0
5:45
PM
- Pe
ak 1
of 1
Peak
Hou
r for
Ent
ire In
ters
ectio
n B
egin
s at 0
4:00
PM
04:0
0 PM
086
03
890
00
00
613
858
220
40
00
11
294
04:1
5 PM
068
10
690
00
00
610
770
118
40
00
00
253
04:3
0 PM
157
01
590
00
00
713
564
220
80
00
00
267
04:4
5 PM
066
10
670
00
00
910
873
019
00
00
33
260
Tota
l Vol
ume
127
72
428
40
00
00
2848
826
55
786
00
04
410
74%
App
. Tot
al0.
497
.50.
71.
40
00
03.
662
.133
.70.
60
00
100
PHF
.250
.805
.500
.333
.798
.000
.000
.000
.000
.000
.778
.884
.908
.625
.945
.000
.000
.000
.333
.333
.913
Pass
Veh
.1
276
24
283
00
00
028
481
265
577
90
00
44
1066
% P
ass V
eh.
100
99.6
100
100
99.6
00
00
010
098
.610
010
099
.10
00
100
100
99.3
Truc
ks0
10
01
00
00
00
70
07
00
00
08
% T
ruck
s0
0.4
00
0.4
00
00
00
1.4
00
0.9
00
00
00.
7B
ikes
00
00
00
00
00
00
00
00
00
00
0%
Bik
es0
00
00
00
00
00
00
00
00
00
00

JOH
NSO
N, M
IRM
IRA
N &
TH
OM
PSO
N, I
NC
.15
50 C
orao
polis
Hei
ghts
Roa
d, S
uite
440
Moo
n To
wns
hip,
PA
151
08Fi
le N
ame
: Int
erse
ctio
n 10
(SR
62-Im
peria
l)S
ite C
ode
: 000
0001
0S
tart
Dat
e: 1
1/4/
2009
Pag
e N
o: 1
Gro
ups P
rinte
d- P
ass V
eh. -
Tru
cks -
Bik
esR
T 62
Nor
thbo
und
RT
62So
uthb
ound
Impe
rial
East
boun
dIm
peria
lW
estb
ound
Star
t Tim
eLe
ftTh
ruR
ight
Peds
App
. Tot
alLe
ftTh
ruR
ight
Peds
App
. Tot
alLe
ftTh
ruR
ight
Peds
App
. Tot
alLe
ftTh
ruR
ight
Peds
App
. Tot
alIn
t. To
tal
07:0
0 A
M0
730
073
057
10
584
00
04
00
00
013
507
:15
AM
073
00
730
672
069
50
10
60
00
00
148
07:3
0 A
M0
111
00
111
079
30
822
01
03
00
00
019
607
:45
AM
011
20
011
20
941
095
40
20
60
00
00
213
Tota
l0
369
00
369
029
77
030
415
04
019
00
00
069
2
08:0
0 A
M0
800
080
068
10
694
05
09
00
00
015
808
:15
AM
165
00
660
801
081
10
40
50
00
00
152
08:3
0 A
M1
730
074
065
10
661
02
03
00
00
014
308
:45
AM
184
00
850
563
059
20
30
50
00
00
149
Tota
l3
302
00
305
026
96
027
58
014
022
00
00
060
2
***
BR
EAK
***
04:0
0 PM
290
00
920
108
110
119
110
70
180
00
00
229
04:1
5 PM
211
00
011
20
100
40
104
80
100
180
00
00
234
04:3
0 PM
410
70
011
10
932
095
110
00
110
00
00
217
04:4
5 PM
382
00
850
106
30
109
50
30
80
00
00
202
Tota
l11
389
00
400
040
720
042
735
020
055
00
00
088
2
05:0
0 PM
011
30
011
30
115
30
118
120
70
190
00
00
250
05:1
5 PM
311
90
012
20
113
50
118
80
80
160
00
00
256
05:3
0 PM
390
00
930
640
064
50
30
80
00
00
165
05:4
5 PM
271
00
730
693
072
70
30
100
00
00
155
Tota
l8
393
00
401
036
111
037
232
021
053
00
00
082
6
Gra
nd T
otal
2214
530
014
750
1334
440
1378
900
590
149
00
00
030
02A
pprc
h %
1.5
98.5
00
096
.83.
20
60.4
039
.60
00
00
Tota
l %0.
748
.40
049
.10
44.4
1.5
045
.93
02
05
00
00
0Pa
ss V
eh.
2214
050
014
270
1288
430
1331
890
590
148
00
00
029
06%
Pas
s Veh
.10
096
.70
096
.70
96.6
97.7
096
.698
.90
100
099
.30
00
00
96.8
Truc
ks0
480
048
046
10
471
00
01
00
00
096
% T
ruck
s0
3.3
00
3.3
03.
42.
30
3.4
1.1
00
00.
70
00
00
3.2
Bik
es0
00
00
00
00
00
00
00
00
00
00
% B
ikes
00
00
00
00
00
00
00
00
00
00
0
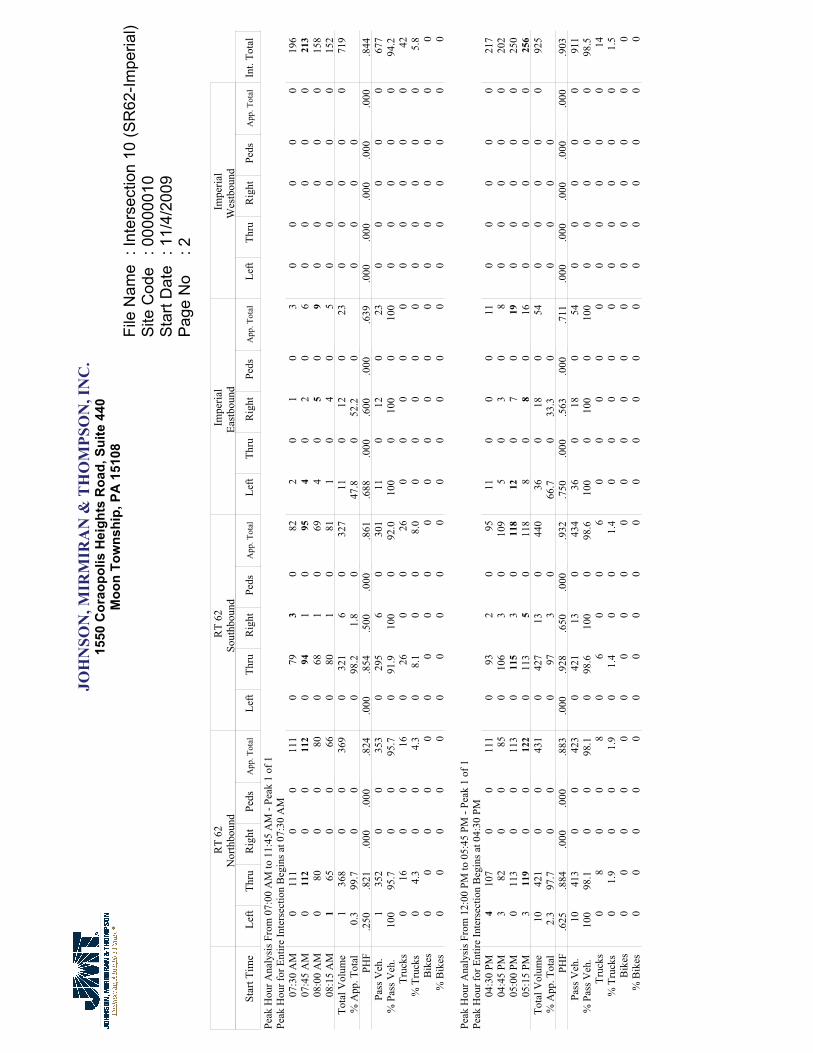
JOH
NSO
N, M
IRM
IRA
N &
TH
OM
PSO
N, I
NC
.15
50 C
orao
polis
Hei
ghts
Roa
d, S
uite
440
Moo
n To
wns
hip,
PA
151
08Fi
le N
ame
: Int
erse
ctio
n 10
(SR
62-Im
peria
l)S
ite C
ode
: 000
0001
0S
tart
Dat
e: 1
1/4/
2009
Pag
e N
o: 2
RT
62N
orth
boun
dR
T 62
Sout
hbou
ndIm
peria
lEa
stbo
und
Impe
rial
Wes
tbou
nd
Star
t Tim
eLe
ftTh
ruR
ight
Peds
App
. Tot
alLe
ftTh
ruR
ight
Peds
App
. Tot
alLe
ftTh
ruR
ight
Peds
App
. Tot
alLe
ftTh
ruR
ight
Peds
App
. Tot
alIn
t. To
tal
Peak
Hou
r Ana
lysi
s Fro
m 0
7:00
AM
to 1
1:45
AM
- Pe
ak 1
of 1
Peak
Hou
r for
Ent
ire In
ters
ectio
n B
egin
s at 0
7:30
AM
07:3
0 A
M0
111
00
111
079
30
822
01
03
00
00
019
607
:45
AM
011
20
011
20
941
095
40
20
60
00
00
213
08:0
0 A
M0
800
080
068
10
694
05
09
00
00
015
808
:15
AM
165
00
660
801
081
10
40
50
00
00
152
Tota
l Vol
ume
136
80
036
90
321
60
327
110
120
230
00
00
719
% A
pp. T
otal
0.3
99.7
00
098
.21.
80
47.8
052
.20
00
00
PHF
.250
.821
.000
.000
.824
.000
.854
.500
.000
.861
.688
.000
.600
.000
.639
.000
.000
.000
.000
.000
.844
Pass
Veh
.1
352
00
353
029
56
030
111
012
023
00
00
067
7%
Pas
s Veh
.10
095
.70
095
.70
91.9
100
092
.010
00
100
010
00
00
00
94.2
Truc
ks0
160
016
026
00
260
00
00
00
00
042
% T
ruck
s0
4.3
00
4.3
08.
10
08.
00
00
00
00
00
05.
8B
ikes
00
00
00
00
00
00
00
00
00
00
0%
Bik
es0
00
00
00
00
00
00
00
00
00
00
Peak
Hou
r Ana
lysi
s Fro
m 1
2:00
PM
to 0
5:45
PM
- Pe
ak 1
of 1
Peak
Hou
r for
Ent
ire In
ters
ectio
n B
egin
s at 0
4:30
PM
04:3
0 PM
410
70
011
10
932
095
110
00
110
00
00
217
04:4
5 PM
382
00
850
106
30
109
50
30
80
00
00
202
05:0
0 PM
011
30
011
30
115
30
118
120
70
190
00
00
250
05:1
5 PM
311
90
012
20
113
50
118
80
80
160
00
00
256
Tota
l Vol
ume
1042
10
043
10
427
130
440
360
180
540
00
00
925
% A
pp. T
otal
2.3
97.7
00
097
30
66.7
033
.30
00
00
PHF
.625
.884
.000
.000
.883
.000
.928
.650
.000
.932
.750
.000
.563
.000
.711
.000
.000
.000
.000
.000
.903
Pass
Veh
.10
413
00
423
042
113
043
436
018
054
00
00
091
1%
Pas
s Veh
.10
098
.10
098
.10
98.6
100
098
.610
00
100
010
00
00
00
98.5
Truc
ks0
80
08
06
00
60
00
00
00
00
014
% T
ruck
s0
1.9
00
1.9
01.
40
01.
40
00
00
00
00
01.
5B
ikes
00
00
00
00
00
00
00
00
00
00
0%
Bik
es0
00
00
00
00
00
00
00
00
00
00

JOH
NSO
N, M
IRM
IRA
N &
TH
OM
PSO
N, I
NC
.15
50 C
orao
polis
Hei
ghts
Roa
d, S
uite
440
Moo
n To
wns
hip,
PA
151
08Fi
le N
ame
: Int
erse
ctio
n 11
(SR
62-
Eas
tSec
ond)
Site
Cod
e: 0
0000
011
Sta
rt D
ate
: 11/
3/20
09P
age
No
: 1
Gro
ups
Prin
ted-
Pas
s V
eh. -
Tru
cks
- Bik
esR
T 62
Nor
thbo
und
RT
62S
outh
boun
d2n
dE
astb
ound
2ND
Wes
tbou
ndS
tart
Tim
eLe
ftTh
ruR
ight
Ped
sA
pp. T
otal
Left
Thru
Rig
htP
eds
App
. Tot
alLe
ftTh
ruR
ight
Ped
sA
pp. T
otal
Left
Thru
Rig
htP
eds
App
. Tot
alIn
t. To
tal
07:0
0 A
M7
830
090
065
10
660
06
06
00
00
016
207
:15
AM
1076
00
860
740
074
00
100
100
00
00
170
07:3
0 A
M14
940
010
80
801
081
00
70
70
00
00
196
07:4
5 A
M12
112
00
124
093
00
931
013
014
00
00
023
1To
tal
4336
50
040
80
312
20
314
10
360
370
00
00
759
08:0
0 A
M11
840
095
094
00
941
010
011
00
00
020
008
:15
AM
774
00
810
104
00
104
20
120
140
00
00
199
08:3
0 A
M18
820
010
00
910
091
00
130
130
00
00
204
08:4
5 A
M19
870
010
60
690
069
00
70
70
00
00
182
Tota
l55
327
00
382
035
80
035
83
042
045
00
00
078
5
***
BR
EA
K *
**
04:0
0 P
M29
117
00
146
011
90
011
90
028
028
00
00
029
304
:15
PM
2110
40
012
50
115
00
115
00
180
180
00
00
258
04:3
0 P
M25
100
00
125
011
72
011
90
028
028
00
00
027
204
:45
PM
1996
00
115
010
81
010
90
09
09
00
00
023
3To
tal
9441
70
051
10
459
30
462
00
830
830
00
00
1056
05:0
0 P
M24
112
00
136
013
53
013
84
027
031
00
00
030
505
:15
PM
3398
00
131
095
10
961
020
021
00
00
024
805
:30
PM
1386
00
990
891
090
10
150
160
00
00
205
05:4
5 P
M17
660
083
081
20
831
017
018
00
00
018
4To
tal
8736
20
044
90
400
70
407
70
790
860
00
00
942
Gra
nd T
otal
279
1471
00
1750
015
2912
015
4111
024
00
251
00
00
035
42A
pprc
h %
15.9
84.1
00
099
.20.
80
4.4
095
.60
00
00
Tota
l %7.
941
.50
049
.40
43.2
0.3
043
.50.
30
6.8
07.
10
00
00
Pas
s V
eh.
272
1430
00
1702
014
7611
014
879
023
70
246
00
00
034
35%
Pas
s V
eh.
97.5
97.2
00
97.3
096
.591
.70
96.5
81.8
098
.80
980
00
00
97Tr
ucks
741
00
480
531
054
20
30
50
00
00
107
% T
ruck
s2.
52.
80
02.
70
3.5
8.3
03.
518
.20
1.2
02
00
00
03
Bik
es0
00
00
00
00
00
00
00
00
00
00
% B
ikes
00
00
00
00
00
00
00
00
00
00
0

JOH
NSO
N, M
IRM
IRA
N &
TH
OM
PSO
N, I
NC
.15
50 C
orao
polis
Hei
ghts
Roa
d, S
uite
440
Moo
n To
wns
hip,
PA
151
08Fi
le N
ame
: Int
erse
ctio
n 11
(SR
62-
Eas
tSec
ond)
Site
Cod
e: 0
0000
011
Sta
rt D
ate
: 11/
3/20
09P
age
No
: 2
RT
62N
orth
boun
dR
T 62
Sou
thbo
und
2nd
Eas
tbou
nd2N
DW
estb
ound
Sta
rt Ti
me
Left
Thru
Rig
htP
eds
App
. Tot
alLe
ftTh
ruR
ight
Ped
sA
pp. T
otal
Left
Thru
Rig
htP
eds
App
. Tot
alLe
ftTh
ruR
ight
Ped
sA
pp. T
otal
Int.
Tota
l
Pea
k H
our A
naly
sis
From
07:
00 A
M to
11:
45 A
M -
Pea
k 1
of 1
Pea
k H
our f
or E
ntire
Inte
rsec
tion
Beg
ins
at 0
7:45
AM
07:4
5 A
M12
112
00
124
093
00
931
013
014
00
00
023
108
:00
AM
1184
00
950
940
094
10
100
110
00
00
200
08:1
5 A
M7
740
081
010
40
010
42
012
014
00
00
019
908
:30
AM
1882
00
100
091
00
910
013
013
00
00
020
4To
tal V
olum
e48
352
00
400
038
20
038
24
048
052
00
00
083
4%
App
. Tot
al12
880
00
100
00
7.7
092
.30
00
00
PH
F.6
67.7
86.0
00.0
00.8
06.0
00.9
18.0
00.0
00.9
18.5
00.0
00.9
23.0
00.9
29.0
00.0
00.0
00.0
00.0
00.9
03P
ass
Veh
.46
342
00
388
035
40
035
42
045
047
00
00
078
9%
Pas
s V
eh.
95.8
97.2
00
97.0
092
.70
092
.750
.00
93.8
090
.40
00
00
94.6
Truc
ks2
100
012
028
00
282
03
05
00
00
045
% T
ruck
s4.
22.
80
03.
00
7.3
00
7.3
50.0
06.
30
9.6
00
00
05.
4B
ikes
00
00
00
00
00
00
00
00
00
00
0%
Bik
es0
00
00
00
00
00
00
00
00
00
00
Pea
k H
our A
naly
sis
From
12:
00 P
M to
05:
45 P
M -
Pea
k 1
of 1
Pea
k H
our f
or E
ntire
Inte
rsec
tion
Beg
ins
at 0
4:15
PM
04:1
5 P
M21
104
00
125
011
50
011
50
018
018
00
00
025
804
:30
PM
2510
00
012
50
117
20
119
00
280
280
00
00
272
04:4
5 P
M19
960
011
50
108
10
109
00
90
90
00
00
233
05:0
0 P
M24
112
00
136
013
53
013
84
027
031
00
00
030
5To
tal V
olum
e89
412
00
501
047
56
048
14
082
086
00
00
010
68%
App
. Tot
al17
.882
.20
00
98.8
1.2
04.
70
95.3
00
00
0P
HF
.890
.920
.000
.000
.921
.000
.880
.500
.000
.871
.250
.000
.732
.000
.694
.000
.000
.000
.000
.000
.875
Pas
s V
eh.
8940
50
049
40
463
60
469
40
820
860
00
00
1049
% P
ass
Veh
.10
098
.30
098
.60
97.5
100
097
.510
00
100
010
00
00
00
98.2
Truc
ks0
70
07
012
00
120
00
00
00
00
019
% T
ruck
s0
1.7
00
1.4
02.
50
02.
50
00
00
00
00
01.
8B
ikes
00
00
00
00
00
00
00
00
00
00
0%
Bik
es0
00
00
00
00
00
00
00
00
00
00
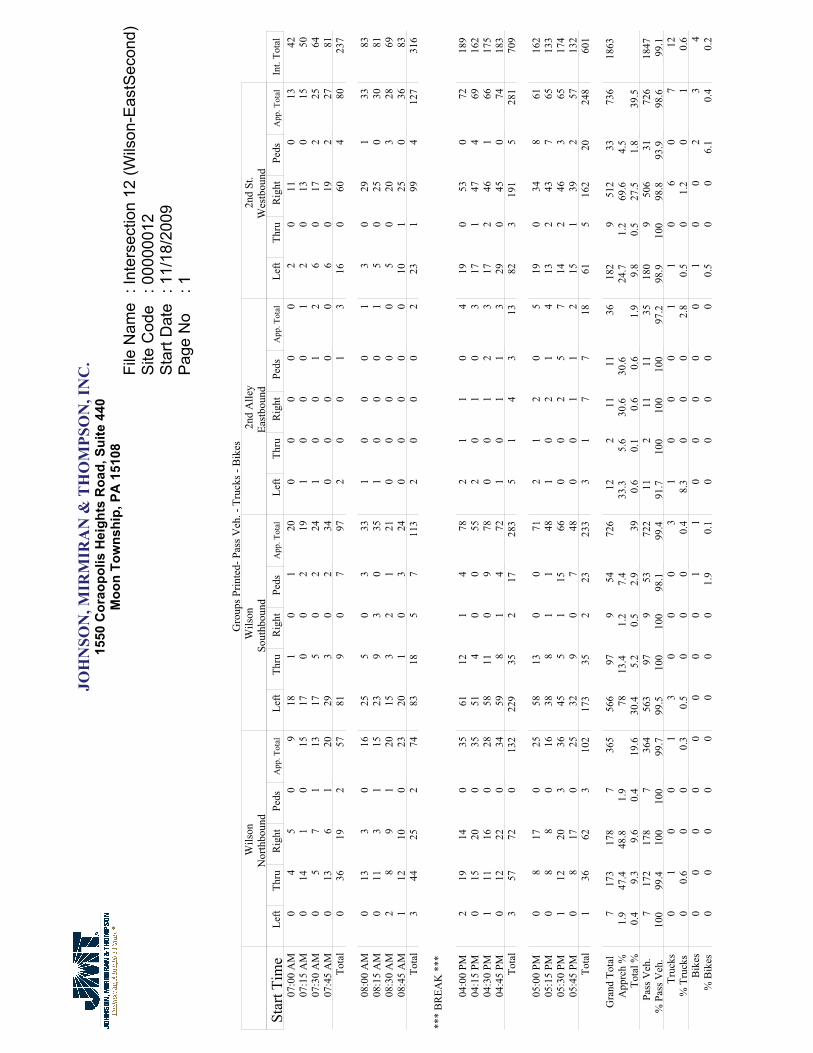
JOH
NSO
N, M
IRM
IRA
N &
TH
OM
PSO
N, I
NC
.15
50 C
orao
polis
Hei
ghts
Roa
d, S
uite
440
Moo
n To
wns
hip,
PA
151
08Fi
le N
ame
: Int
erse
ctio
n 12
(Wils
on-E
astS
econ
d)S
ite C
ode
: 000
0001
2S
tart
Dat
e: 1
1/18
/200
9P
age
No
: 1
Gro
ups P
rinte
d- P
ass V
eh. -
Tru
cks -
Bik
esW
ilson
Nor
thbo
und
Wils
onSo
uthb
ound
2nd
Alle
yEa
stbo
und
2nd
St.
Wes
tbou
ndSt
art T
ime
Left
Thru
Rig
htPe
dsA
pp. T
otal
Left
Thru
Rig
htPe
dsA
pp. T
otal
Left
Thru
Rig
htPe
dsA
pp. T
otal
Left
Thru
Rig
htPe
dsA
pp. T
otal
Int.
Tota
l07
:00
AM
04
50
918
10
120
00
00
02
011
013
4207
:15
AM
014
10
1517
00
219
10
00
12
013
015
5007
:30
AM
05
71
1317
50
224
10
01
26
017
225
6407
:45
AM
013
61
2029
30
234
00
00
06
019
227
81To
tal
036
192
5781
90
797
20
01
316
060
480
237
08:0
0 A
M0
133
016
255
03
331
00
01
30
291
3383
08:1
5 A
M0
113
115
239
30
351
00
01
50
250
3081
08:3
0 A
M2
89
120
153
21
210
00
00
50
203
2869
08:4
5 A
M1
1210
023
201
03
240
00
00
101
250
3683
Tota
l3
4425
274
8318
57
113
20
00
223
199
412
731
6
***
BR
EAK
***
04:0
0 PM
219
140
3561
121
478
21
10
419
053
072
189
04:1
5 PM
015
200
3551
40
055
20
10
317
147
469
162
04:3
0 PM
111
160
2858
110
978
00
12
317
246
166
175
04:4
5 PM
012
220
3459
81
472
10
11
329
045
074
183
Tota
l3
5772
013
222
935
217
283
51
43
1382
319
15
281
709
05:0
0 PM
08
170
2558
130
071
21
20
519
034
861
162
05:1
5 PM
08
80
1638
81
148
10
21
413
243
765
133
05:3
0 PM
112
203
3645
51
1566
00
25
714
246
365
174
05:4
5 PM
08
170
2532
90
748
00
11
215
139
257
132
Tota
l1
3662
310
217
335
223
233
31
77
1861
516
220
248
601
Gra
nd T
otal
717
317
87
365
566
979
5472
612
211
1136
182
951
233
736
1863
App
rch
%1.
947
.448
.81.
978
13.4
1.2
7.4
33.3
5.6
30.6
30.6
24.7
1.2
69.6
4.5
Tota
l %0.
49.
39.
60.
419
.630
.45.
20.
52.
939
0.6
0.1
0.6
0.6
1.9
9.8
0.5
27.5
1.8
39.5
Pass
Veh
.7
172
178
736
456
397
953
722
112
1111
3518
09
506
3172
618
47%
Pas
s Veh
.10
099
.410
010
099
.799
.510
010
098
.199
.491
.710
010
010
097
.298
.910
098
.893
.998
.699
.1Tr
ucks
01
00
13
00
03
10
00
11
06
07
12%
Tru
cks
00.
60
00.
30.
50
00
0.4
8.3
00
02.
80.
50
1.2
01
0.6
Bik
es0
00
00
00
01
10
00
00
10
02
34
% B
ikes
00
00
00
00
1.9
0.1
00
00
00.
50
06.
10.
40.
2
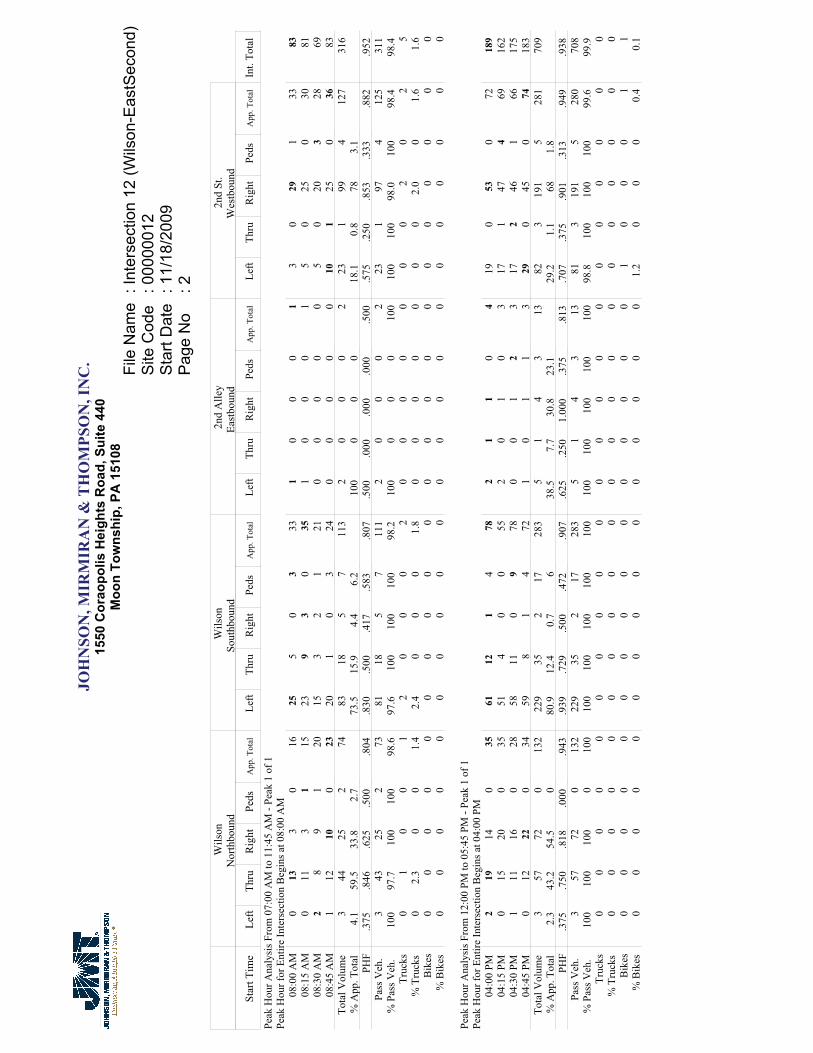
JOH
NSO
N, M
IRM
IRA
N &
TH
OM
PSO
N, I
NC
.15
50 C
orao
polis
Hei
ghts
Roa
d, S
uite
440
Moo
n To
wns
hip,
PA
151
08Fi
le N
ame
: Int
erse
ctio
n 12
(Wils
on-E
astS
econ
d)S
ite C
ode
: 000
0001
2S
tart
Dat
e: 1
1/18
/200
9P
age
No
: 2
Wils
onN
orth
boun
dW
ilson
Sout
hbou
nd2n
d A
lley
East
boun
d2n
d St
.W
estb
ound
Star
t Tim
eLe
ftTh
ruR
ight
Peds
App
. Tot
alLe
ftTh
ruR
ight
Peds
App
. Tot
alLe
ftTh
ruR
ight
Peds
App
. Tot
alLe
ftTh
ruR
ight
Peds
App
. Tot
alIn
t. To
tal
Peak
Hou
r Ana
lysi
s Fro
m 0
7:00
AM
to 1
1:45
AM
- Pe
ak 1
of 1
Peak
Hou
r for
Ent
ire In
ters
ectio
n B
egin
s at 0
8:00
AM
08:0
0 A
M0
133
016
255
03
331
00
01
30
291
3383
08:1
5 A
M0
113
115
239
30
351
00
01
50
250
3081
08:3
0 A
M2
89
120
153
21
210
00
00
50
203
2869
08:4
5 A
M1
1210
023
201
03
240
00
00
101
250
3683
Tota
l Vol
ume
344
252
7483
185
711
32
00
02
231
994
127
316
% A
pp. T
otal
4.1
59.5
33.8
2.7
73.5
15.9
4.4
6.2
100
00
018
.10.
878
3.1
PHF
.375
.846
.625
.500
.804
.830
.500
.417
.583
.807
.500
.000
.000
.000
.500
.575
.250
.853
.333
.882
.952
Pass
Veh
.3
4325
273
8118
57
111
20
00
223
197
412
531
1%
Pas
s Veh
.10
097
.710
010
098
.697
.610
010
010
098
.210
00
00
100
100
100
98.0
100
98.4
98.4
Truc
ks0
10
01
20
00
20
00
00
00
20
25
% T
ruck
s0
2.3
00
1.4
2.4
00
01.
80
00
00
00
2.0
01.
61.
6B
ikes
00
00
00
00
00
00
00
00
00
00
0%
Bik
es0
00
00
00
00
00
00
00
00
00
00
Peak
Hou
r Ana
lysi
s Fro
m 1
2:00
PM
to 0
5:45
PM
- Pe
ak 1
of 1
Peak
Hou
r for
Ent
ire In
ters
ectio
n B
egin
s at 0
4:00
PM
04:0
0 PM
219
140
3561
121
478
21
10
419
053
072
189
04:1
5 PM
015
200
3551
40
055
20
10
317
147
469
162
04:3
0 PM
111
160
2858
110
978
00
12
317
246
166
175
04:4
5 PM
012
220
3459
81
472
10
11
329
045
074
183
Tota
l Vol
ume
357
720
132
229
352
1728
35
14
313
823
191
528
170
9%
App
. Tot
al2.
343
.254
.50
80.9
12.4
0.7
638
.57.
730
.823
.129
.21.
168
1.8
PHF
.375
.750
.818
.000
.943
.939
.729
.500
.472
.907
.625
.250
1.00
0.3
75.8
13.7
07.3
75.9
01.3
13.9
49.9
38Pa
ss V
eh.
357
720
132
229
352
1728
35
14
313
813
191
528
070
8%
Pas
s Veh
.10
010
010
00
100
100
100
100
100
100
100
100
100
100
100
98.8
100
100
100
99.6
99.9
Truc
ks0
00
00
00
00
00
00
00
00
00
00
% T
ruck
s0
00
00
00
00
00
00
00
00
00
00
Bik
es0
00
00
00
00
00
00
00
10
00
11
% B
ikes
00
00
00
00
00
00
00
01.
20
00
0.4
0.1

JOH
NSO
N, M
IRM
IRA
N &
TH
OM
PSO
N, I
NC
.15
50 C
orao
polis
Hei
ghts
Roa
d, S
uite
440
Moo
n To
wns
hip,
PA
151
08Fi
le N
ame
: Int
erse
ctio
n 13
(Eas
tSec
ond-
Pin
e)S
ite C
ode
: 000
0001
3S
tart
Dat
e: 1
1/12
/200
9P
age
No
: 1
Gro
ups P
rinte
d- P
ass V
eh. -
Tru
cks -
Bik
esPi
neN
orth
boun
dPa
rkin
g Lo
tSo
uthb
ound
2nd
East
boun
d2n
dW
estb
ound
Star
t Tim
eLe
ftTh
ruR
ight
Peds
App
. Tot
alLe
ftTh
ruR
ight
Peds
App
. Tot
alLe
ftTh
ruR
ight
Peds
App
. Tot
alLe
ftTh
ruR
ight
Peds
App
. Tot
alIn
t. To
tal
07:0
0 A
M0
00
11
11
13
60
140
115
09
00
931
07:1
5 A
M0
00
11
01
40
51
200
021
113
40
1845
07:3
0 A
M0
00
00
10
20
31
200
021
018
01
1943
07:4
5 A
M0
01
01
30
41
80
272
029
021
00
2159
Tota
l0
01
23
52
114
222
812
186
161
41
6717
8
08:0
0 A
M1
00
01
00
71
80
360
036
023
10
2469
08:1
5 A
M0
01
01
10
60
71
330
034
026
10
2769
08:3
0 A
M1
00
12
10
52
81
211
023
027
00
2760
08:4
5 A
M1
00
12
10
64
112
300
133
021
11
2369
Tota
l3
01
26
30
247
344
120
11
126
097
31
101
267
***
BR
EAK
***
04:0
0 PM
01
05
69
19
423
465
21
721
693
073
174
04:1
5 PM
10
44
98
011
726
466
00
701
435
049
154
04:3
0 PM
00
32
51
011
416
675
22
852
582
062
168
04:4
5 PM
10
20
35
113
625
569
11
760
630
063
167
Tota
l2
19
1123
232
4421
9019
275
54
303
423
310
024
766
3
05:0
0 PM
01
03
48
111
1131
662
20
701
612
064
169
05:1
5 PM
10
10
24
27
1326
065
30
681
594
064
160
05:3
0 PM
10
02
36
06
113
247
10
500
512
053
119
05:4
5 PM
00
11
23
06
211
445
01
502
374
043
106
Tota
l2
12
611
213
3027
8112
219
61
238
420
812
022
455
4
Gra
nd T
otal
72
1321
4352
710
959
227
3769
514
775
39
599
292
639
1662
App
rch
%16
.34.
730
.248
.822
.93.
148
264.
992
.31.
90.
91.
493
.74.
50.
3To
tal %
0.4
0.1
0.8
1.3
2.6
3.1
0.4
6.6
3.5
13.7
2.2
41.8
0.8
0.4
45.3
0.5
361.
70.
138
.4Pa
ss V
eh.
72
1221
4252
710
955
223
3769
214
775
09
595
292
635
1650
% P
ass V
eh.
100
100
92.3
100
97.7
100
100
100
93.2
98.2
100
99.6
100
100
99.6
100
99.3
100
100
99.4
99.3
Truc
ks0
01
01
00
00
00
30
03
04
00
48
% T
ruck
s0
07.
70
2.3
00
00
00
0.4
00
0.4
00.
70
00.
60.
5B
ikes
00
00
00
00
44
00
00
00
00
00
4%
Bik
es0
00
00
00
06.
81.
80
00
00
00
00
00.
2
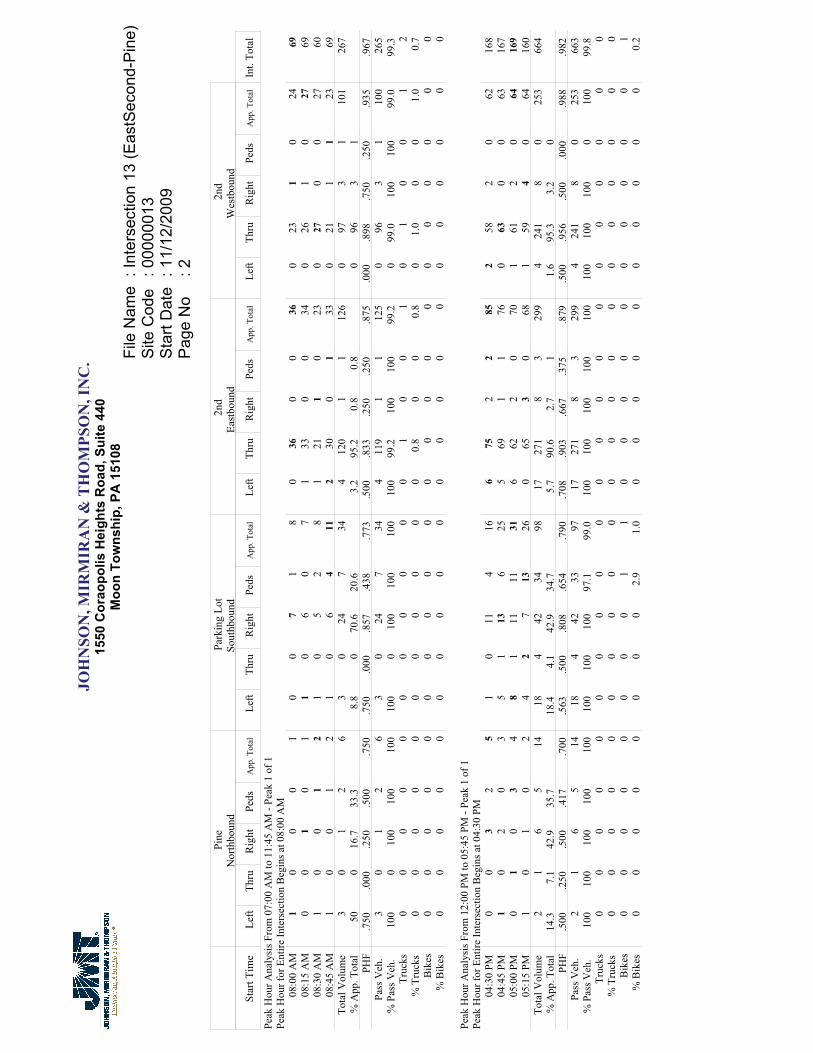
JOH
NSO
N, M
IRM
IRA
N &
TH
OM
PSO
N, I
NC
.15
50 C
orao
polis
Hei
ghts
Roa
d, S
uite
440
Moo
n To
wns
hip,
PA
151
08Fi
le N
ame
: Int
erse
ctio
n 13
(Eas
tSec
ond-
Pin
e)S
ite C
ode
: 000
0001
3S
tart
Dat
e: 1
1/12
/200
9P
age
No
: 2
Pine
Nor
thbo
und
Park
ing
Lot
Sout
hbou
nd2n
dEa
stbo
und
2nd
Wes
tbou
nd
Star
t Tim
eLe
ftTh
ruR
ight
Peds
App
. Tot
alLe
ftTh
ruR
ight
Peds
App
. Tot
alLe
ftTh
ruR
ight
Peds
App
. Tot
alLe
ftTh
ruR
ight
Peds
App
. Tot
alIn
t. To
tal
Peak
Hou
r Ana
lysi
s Fro
m 0
7:00
AM
to 1
1:45
AM
- Pe
ak 1
of 1
Peak
Hou
r for
Ent
ire In
ters
ectio
n B
egin
s at 0
8:00
AM
08:0
0 A
M1
00
01
00
71
80
360
036
023
10
2469
08:1
5 A
M0
01
01
10
60
71
330
034
026
10
2769
08:3
0 A
M1
00
12
10
52
81
211
023
027
00
2760
08:4
5 A
M1
00
12
10
64
112
300
133
021
11
2369
Tota
l Vol
ume
30
12
63
024
734
412
01
112
60
973
110
126
7%
App
. Tot
al50
016
.733
.38.
80
70.6
20.6
3.2
95.2
0.8
0.8
096
31
PHF
.750
.000
.250
.500
.750
.750
.000
.857
.438
.773
.500
.833
.250
.250
.875
.000
.898
.750
.250
.935
.967
Pass
Veh
.3
01
26
30
247
344
119
11
125
096
31
100
265
% P
ass V
eh.
100
010
010
010
010
00
100
100
100
100
99.2
100
100
99.2
099
.010
010
099
.099
.3Tr
ucks
00
00
00
00
00
01
00
10
10
01
2%
Tru
cks
00
00
00
00
00
00.
80
00.
80
1.0
00
1.0
0.7
Bik
es0
00
00
00
00
00
00
00
00
00
00
% B
ikes
00
00
00
00
00
00
00
00
00
00
0
Peak
Hou
r Ana
lysi
s Fro
m 1
2:00
PM
to 0
5:45
PM
- Pe
ak 1
of 1
Peak
Hou
r for
Ent
ire In
ters
ectio
n B
egin
s at 0
4:30
PM
04:3
0 PM
00
32
51
011
416
675
22
852
582
062
168
04:4
5 PM
10
20
35
113
625
569
11
760
630
063
167
05:0
0 PM
01
03
48
111
1131
662
20
701
612
064
169
05:1
5 PM
10
10
24
27
1326
065
30
681
594
064
160
Tota
l Vol
ume
21
65
1418
442
3498
1727
18
329
94
241
80
253
664
% A
pp. T
otal
14.3
7.1
42.9
35.7
18.4
4.1
42.9
34.7
5.7
90.6
2.7
11.
695
.33.
20
PHF
.500
.250
.500
.417
.700
.563
.500
.808
.654
.790
.708
.903
.667
.375
.879
.500
.956
.500
.000
.988
.982
Pass
Veh
.2
16
514
184
4233
9717
271
83
299
424
18
025
366
3%
Pas
s Veh
.10
010
010
010
010
010
010
010
097
.199
.010
010
010
010
010
010
010
010
00
100
99.8
Truc
ks0
00
00
00
00
00
00
00
00
00
00
% T
ruck
s0
00
00
00
00
00
00
00
00
00
00
Bik
es0
00
00
00
01
10
00
00
00
00
01
% B
ikes
00
00
00
00
2.9
1.0
00
00
00
00
00
0.2

JOH
NSO
N, M
IRM
IRA
N &
TH
OM
PSO
N, I
NC
.15
50 C
orao
polis
Hei
ghts
Roa
d, S
uite
440
Moo
n To
wns
hip,
PA
151
08Fi
le N
ame
: Int
erse
ctio
n 14
-AM
(Eas
tSec
ond-
Impe
rial)
Site
Cod
e: 0
0000
014
Sta
rt D
ate
: 11/
18/2
009
Pag
e N
o: 1
Gro
ups P
rinte
d- P
ass V
eh. -
Tru
cks -
Bik
es
Nor
thbo
und
Sout
hbou
ndEa
stbo
und
Wes
tbou
ndSt
art T
ime
Left
Thru
Rig
htPe
dsA
pp. T
otal
Left
Thru
Rig
htPe
dsA
pp. T
otal
Left
Thru
Rig
htPe
dsA
pp. T
otal
Left
Thru
Rig
htPe
dsA
pp. T
otal
Int.
Tota
l07
:00
AM
00
03
30
00
00
16
00
70
71
08
1807
:15
AM
21
12
60
00
00
111
10
130
130
013
3207
:30
AM
22
10
50
10
01
014
10
150
92
011
3207
:45
AM
00
00
00
03
03
022
30
250
160
016
44To
tal
43
25
140
13
04
253
50
600
453
048
126
08:0
0 A
M3
40
07
00
21
31
170
220
015
10
1646
08:1
5 A
M0
10
12
00
10
12
141
017
015
00
1535
08:3
0 A
M0
00
00
00
31
40
150
116
014
00
1434
08:4
5 A
M2
12
05
00
30
32
120
115
025
10
2649
Tota
l5
62
114
00
92
115
581
468
069
20
7116
4
Gra
nd T
otal
99
46
280
112
215
711
16
412
80
114
50
119
290
App
rch
%32
.132
.114
.321
.40
6.7
8013
.35.
586
.74.
73.
10
95.8
4.2
0To
tal %
3.1
3.1
1.4
2.1
9.7
00.
34.
10.
75.
22.
438
.32.
11.
444
.10
39.3
1.7
041
Pass
Veh
.9
94
628
01
122
155
108
64
123
011
05
011
528
1%
Pas
s Veh
.10
010
010
010
010
00
100
100
100
100
71.4
97.3
100
100
96.1
096
.510
00
96.6
96.9
Truc
ks0
00
00
00
00
02
20
04
04
00
48
% T
ruck
s0
00
00
00
00
028
.61.
80
03.
10
3.5
00
3.4
2.8
Bik
es0
00
00
00
00
00
10
01
00
00
01
% B
ikes
00
00
00
00
00
00.
90
00.
80
00
00
0.3
Nor
thbo
und
Sout
hbou
ndEa
stbo
und
Wes
tbou
ndSt
art T
ime
Left
Thru
Rig
htPe
dsA
pp. T
otal
Left
Thru
Rig
htPe
dsA
pp. T
otal
Left
Thru
Rig
htPe
dsA
pp. T
otal
Left
Thru
Rig
htPe
dsA
pp. T
otal
Int.
Tota
lPe
ak H
our A
naly
sis F
rom
07:
00 A
M to
08:
45 A
M -
Peak
1 o
f 1Pe
ak H
our f
or E
ntire
Inte
rsec
tion
Beg
ins a
t 08:
00 A
M08
:00
AM
34
00
70
02
13
117
02
200
151
016
4608
:15
AM
01
01
20
01
01
214
10
170
150
015
3508
:30
AM
00
00
00
03
14
015
01
160
140
014
3408
:45
AM
21
20
50
03
03
212
01
150
251
026
49To
tal V
olum
e5
62
114
00
92
115
581
468
069
20
7116
4%
App
. Tot
al35
.742
.914
.37.
10
081
.818
.27.
485
.31.
55.
90
97.2
2.8
0PH
F.4
17.3
75.2
50.2
50.5
00.0
00.0
00.7
50.5
00.6
88.6
25.8
53.2
50.5
00.8
50.0
00.6
90.5
00.0
00.6
83.8
37Pa
ss V
eh.
56
21
140
09
211
457
14
660
682
070
161
% P
ass V
eh.
100
100
100
100
100
00
100
100
100
80.0
98.3
100
100
97.1
098
.610
00
98.6
98.2
Truc
ks0
00
00
00
00
01
10
02
01
00
13
% T
ruck
s0
00
00
00
00
020
.01.
70
02.
90
1.4
00
1.4
1.8
Bik
es0
00
00
00
00
00
00
00
00
00
00

JOH
NSO
N, M
IRM
IRA
N &
TH
OM
PSO
N, I
NC
.15
50 C
orao
polis
Hei
ghts
Roa
d, S
uite
440
Moo
n To
wns
hip,
PA
151
08Fi
le N
ame
: Int
erse
ctio
n 14
-PM
(Eas
tSec
ond-
Impe
rial)
Site
Cod
e: 0
0000
014
Sta
rt D
ate
: 11/
4/20
09P
age
No
: 1
Gro
ups
Prin
ted-
Pas
s V
eh. -
Tru
cks
- Bik
es
Nor
thbo
und
Sou
thbo
und
Eas
tbou
ndW
estb
ound
Sta
rt Ti
me
Left
Thru
Rig
htP
eds
App
. Tot
alLe
ftTh
ruR
ight
Ped
sA
pp. T
otal
Left
Thru
Rig
htP
eds
App
. Tot
alLe
ftTh
ruR
ight
Ped
sA
pp. T
otal
Int.
Tota
l04
:00
PM
251
42
595
397
051
61
20
92
413
019
138
04:1
5 P
M2
322
137
250
00
524
00
15
03
50
810
204
:30
PM
026
01
272
415
149
42
10
73
112
016
9904
:45
PM
031
10
323
434
252
53
20
101
310
014
108
Tota
l4
140
74
155
1217
316
320
419
65
131
611
400
5744
7
05:0
0 P
M2
250
128
645
51
574
20
06
02
141
1710
805
:15
PM
129
10
311
335
140
23
10
62
010
012
8905
:30
PM
027
00
270
292
132
31
02
60
111
012
7705
:45
PM
127
01
292
256
235
40
20
60
212
014
84To
tal
410
81
211
59
132
185
164
136
32
242
547
155
358
Gra
nd T
otal
824
88
627
021
305
348
368
3212
83
558
1687
111
280
5A
pprc
h %
391
.93
2.2
5.7
82.9
9.2
2.2
58.2
21.8
14.5
5.5
7.1
14.3
77.7
0.9
Tota
l %1
30.8
10.
733
.52.
637
.94.
21
45.7
41.
51
0.4
6.8
12
10.8
0.1
13.9
Pas
s V
eh.
824
88
627
021
305
348
368
3212
83
558
1687
111
280
5%
Pas
s V
eh.
100
100
100
100
100
100
100
100
100
100
100
100
100
100
100
100
100
100
100
100
100
Truc
ks0
00
00
00
00
00
00
00
00
00
00
% T
ruck
s0
00
00
00
00
00
00
00
00
00
00
Bik
es0
00
00
00
00
00
00
00
00
00
00
% B
ikes
00
00
00
00
00
00
00
00
00
00
0
Nor
thbo
und
Sou
thbo
und
Eas
tbou
ndW
estb
ound
Sta
rt Ti
me
Left
Thru
Rig
htP
eds
App
. Tot
alLe
ftTh
ruR
ight
Ped
sA
pp. T
otal
Left
Thru
Rig
htP
eds
App
. Tot
alLe
ftTh
ruR
ight
Ped
sA
pp. T
otal
Int.
Tota
lP
eak
Hou
r Ana
lysi
s Fr
om 0
4:00
PM
to 0
5:45
PM
- P
eak
1 of
1P
eak
Hou
r for
Ent
ire In
ters
ectio
n B
egin
s at
04:
00 P
M04
:00
PM
251
42
595
397
051
61
20
92
413
019
138
04:1
5 P
M2
322
137
250
00
524
00
15
03
50
810
204
:30
PM
026
01
272
415
149
42
10
73
112
016
9904
:45
PM
031
10
323
434
252
53
20
101
310
014
108
Tota
l Vol
ume
414
07
415
512
173
163
204
196
51
316
1140
057
447
% A
pp. T
otal
2.6
90.3
4.5
2.6
5.9
84.8
7.8
1.5
61.3
19.4
16.1
3.2
10.5
19.3
70.2
0P
HF
.500
.686
.438
.500
.657
.600
.865
.571
.375
.981
.792
.500
.625
.250
.775
.500
.688
.769
.000
.750
.810
Pas
s V
eh.
414
07
415
512
173
163
204
196
51
316
1140
057
447
% P
ass
Veh
.10
010
010
010
010
010
010
010
010
010
010
010
010
010
010
010
010
010
00
100
100
Truc
ks0
00
00
00
00
00
00
00
00
00
00
% T
ruck
s0
00
00
00
00
00
00
00
00
00
00
Bik
es0
00
00
00
00
00
00
00
00
00
00

�
�
�
�
�
�
�
�
���������
���������� ��

JOH
NSO
N, M
IRM
IRA
N &
TH
OM
PSO
N, I
NC
.15
50 C
orao
polis
Hei
ghts
Roa
d, S
uite
440
Moo
n To
wns
hip,
PA
151
08Fi
le N
ame
: Fro
nt-P
etro
leum
Site
Cod
e: 0
0000
001
Sta
rt D
ate
: 7/1
5/20
10P
age
No
: 1
Gro
ups P
rinte
d- P
ass.
Veh
. - T
ruck
s - B
ikes
Nor
thbo
und
Sout
hbou
ndEa
stbo
und
Wes
tbou
ndSt
art T
ime
Left
Thru
Rig
htPe
dsA
pp. T
otal
Left
Thru
Rig
htPe
dsA
pp. T
otal
Left
Thru
Rig
htPe
dsA
pp. T
otal
Left
Thru
Rig
htPe
dsA
pp. T
otal
Int.
Tota
l07
:00
AM
024
00
240
410
041
10
00
119
048
067
133
07:1
5 A
M0
300
232
055
00
551
03
04
80
480
5614
707
:30
AM
034
05
390
520
052
50
20
718
073
091
189
07:4
5 A
M0
440
044
059
00
599
00
09
270
680
9520
7To
tal
013
20
713
90
207
00
207
160
50
2172
023
70
309
676
08:0
0 A
M0
300
030
054
00
547
00
07
260
501
7716
808
:15
AM
030
00
300
610
061
40
12
726
072
098
196
08:3
0 A
M0
210
223
070
00
706
00
28
320
480
8018
108
:45
AM
035
01
360
650
065
30
12
625
040
065
172
Tota
l0
116
03
119
025
00
025
020
02
628
109
021
01
320
717
***
BR
EAK
***
04:0
0 PM
042
02
440
106
01
107
70
34
1453
077
013
029
504
:15
PM0
400
040
012
80
012
89
01
111
450
731
119
298
04:3
0 PM
046
00
460
140
01
141
40
75
1655
061
011
631
904
:45
PM0
510
152
013
40
013
42
02
04
420
650
107
297
Tota
l0
179
03
182
050
80
251
022
013
1045
195
027
61
472
1209
05:0
0 PM
045
00
450
133
00
133
100
41
1548
064
011
230
505
:15
PM0
370
138
014
50
114
63
03
17
410
700
111
302
05:3
0 PM
034
01
350
116
00
116
80
011
1942
054
096
266
05:4
5 PM
035
04
390
106
00
106
30
43
1036
054
090
245
Tota
l0
151
06
157
050
00
150
124
011
1651
167
024
20
409
1118
Gra
nd T
otal
057
80
1959
70
1465
03
1468
820
3132
145
543
096
52
1510
3720
App
rch
%0
96.8
03.
20
99.8
00.
256
.60
21.4
22.1
360
63.9
0.1
Tota
l %0
15.5
00.
516
039
.40
0.1
39.5
2.2
00.
80.
93.
914
.60
25.9
0.1
40.6
Pass
. Veh
.0
571
017
588
014
290
114
3082
031
2613
954
00
939
214
8136
38%
Pas
s. V
eh.
098
.80
89.5
98.5
097
.50
33.3
97.4
100
010
081
.295
.999
.40
97.3
100
98.1
97.8
Truc
ks0
70
07
036
00
360
00
00
30
260
2972
% T
ruck
s0
1.2
00
1.2
02.
50
02.
50
00
00
0.6
02.
70
1.9
1.9
Bik
es0
00
22
00
02
20
00
66
00
00
010
% B
ikes
00
010
.50.
30
00
66.7
0.1
00
018
.84.
10
00
00
0.3

JOH
NSO
N, M
IRM
IRA
N &
TH
OM
PSO
N, I
NC
.15
50 C
orao
polis
Hei
ghts
Roa
d, S
uite
440
Moo
n To
wns
hip,
PA
151
08Fi
le N
ame
: Fro
nt-P
etro
leum
Site
Cod
e: 0
0000
001
Sta
rt D
ate
: 7/1
5/20
10P
age
No
: 2
Nor
thbo
und
Sout
hbou
ndEa
stbo
und
Wes
tbou
nd
Star
t Tim
eLe
ftTh
ruR
ight
Peds
App
. Tot
alLe
ftTh
ruR
ight
Peds
App
. Tot
alLe
ftTh
ruR
ight
Peds
App
. Tot
alLe
ftTh
ruR
ight
Peds
App
. Tot
alIn
t. To
tal
Peak
Hou
r Ana
lysi
s Fro
m 0
7:00
AM
to 1
1:45
AM
- Pe
ak 1
of 1
Peak
Hou
r for
Ent
ire In
ters
ectio
n B
egin
s at 0
7:30
AM
07:3
0 A
M0
340
539
052
00
525
02
07
180
730
9118
907
:45
AM
044
00
440
590
059
90
00
927
068
095
207
08:0
0 A
M0
300
030
054
00
547
00
07
260
501
7716
808
:15
AM
030
00
300
610
061
40
12
726
072
098
196
Tota
l Vol
ume
013
80
514
30
226
00
226
250
32
3097
026
31
361
760
% A
pp. T
otal
096
.50
3.5
010
00
083
.30
106.
726
.90
72.9
0.3
PHF
.000
.784
.000
.250
.813
.000
.926
.000
.000
.926
.694
.000
.375
.250
.833
.898
.000
.901
.250
.921
.918
Peak
Hou
r Ana
lysi
s Fro
m 1
2:00
PM
to 0
5:45
PM
- Pe
ak 1
of 1
Peak
Hou
r for
Ent
ire In
ters
ectio
n B
egin
s at 0
4:30
PM
04:3
0 PM
046
00
460
140
01
141
40
75
1655
061
011
631
904
:45
PM0
510
152
013
40
013
42
02
04
420
650
107
297
05:0
0 PM
045
00
450
133
00
133
100
41
1548
064
011
230
505
:15
PM0
370
138
014
50
114
63
03
17
410
700
111
302
Tota
l Vol
ume
017
90
218
10
552
02
554
190
167
4218
60
260
044
612
23%
App
. Tot
al0
98.9
01.
10
99.6
00.
445
.20
38.1
16.7
41.7
058
.30
PHF
.000
.877
.000
.500
.870
.000
.952
.000
.500
.949
.475
.000
.571
.350
.656
.845
.000
.929
.000
.961
.958

JOH
NSO
N, M
IRM
IRA
N &
TH
OM
PSO
N, I
NC
.15
50 C
orao
polis
Hei
ghts
Roa
d, S
uite
440
Moo
n To
wns
hip,
PA
151
08Fi
le N
ame
: Fro
nt-S
tate
Site
Cod
e: 0
0001
234
Sta
rt D
ate
: 7/8
/201
0P
age
No
: 1
Gro
ups P
rinte
d- P
ass.
Veh
. - T
ruck
sSt
ate
Nor
thbo
und
Stat
eSo
uthb
ound
Fron
tEa
stbo
und
Fron
tW
estb
ound
Star
t Tim
eLe
ftTh
ruR
ight
Peds
App
. Tot
alLe
ftTh
ruR
ight
Peds
App
. Tot
alLe
ftTh
ruR
ight
Peds
App
. Tot
alLe
ftTh
ruR
ight
Peds
App
. Tot
alIn
t. To
tal
07:0
0 A
M0
160
016
040
130
530
00
00
045
310
7614
507
:15
AM
025
03
280
4311
054
00
01
11
4960
011
019
307
:30
AM
025
02
270
7122
699
00
00
00
7059
012
925
507
:45
AM
038
00
380
7029
610
50
00
00
151
840
136
279
Tota
l0
104
05
109
022
475
1231
10
00
11
221
523
40
451
872
08:0
0 A
M0
230
023
073
260
990
00
00
051
520
103
225
08:1
5 A
M0
320
133
059
214
840
00
00
551
620
118
235
08:3
0 A
M0
130
013
067
360
103
00
00
02
5157
011
022
608
:45
AM
027
04
310
8529
011
40
00
00
254
542
112
257
Tota
l0
950
510
00
284
112
440
00
00
00
920
722
52
443
943
***
BR
EAK
***
04:0
0 PM
033
02
350
103
481
152
00
00
07
7411
41
196
383
04:1
5 PM
131
02
340
9957
115
70
00
00
863
101
017
236
304
:30
PM0
520
052
099
612
162
00
00
03
7110
80
182
396
04:4
5 PM
145
00
460
112
511
164
00
00
07
7085
016
237
2To
tal
216
10
416
70
413
217
563
50
00
00
2527
840
81
712
1514
05:0
0 PM
045
01
460
101
443
148
00
00
02
8811
90
209
403
05:1
5 PM
037
02
390
128
585
191
00
00
02
6013
10
193
423
05:3
0 PM
050
00
500
101
605
166
00
00
03
5811
40
175
391
05:4
5 PM
040
03
430
6832
310
30
00
00
860
124
019
233
8To
tal
017
20
617
80
398
194
1660
80
00
00
1526
648
80
769
1555
Gra
nd T
otal
253
20
2055
40
1319
598
3719
540
00
11
5196
613
553
2375
4884
App
rch
%0.
496
03.
60
67.5
30.6
1.9
00
010
02.
140
.757
.10.
1To
tal %
010
.90
0.4
11.3
027
12.2
0.8
400
00
00
119
.827
.70.
148
.6Pa
ss. V
eh.
253
00
2055
20
1310
594
3719
410
00
11
5193
113
513
2336
4830
% P
ass.
Veh
.10
099
.60
100
99.6
099
.399
.310
099
.30
00
100
100
100
96.4
99.7
100
98.4
98.9
Truc
ks0
20
02
09
40
130
00
00
035
40
3954
% T
ruck
s0
0.4
00
0.4
00.
70.
70
0.7
00
00
00
3.6
0.3
01.
61.
1
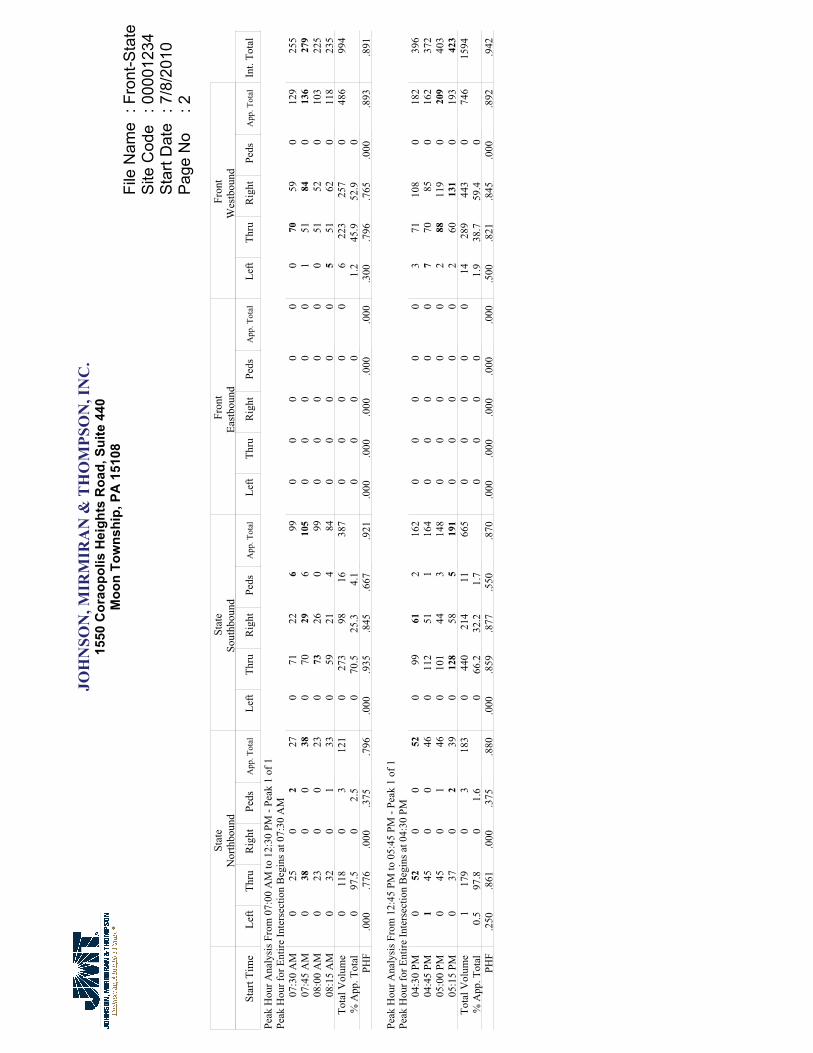
JOH
NSO
N, M
IRM
IRA
N &
TH
OM
PSO
N, I
NC
.15
50 C
orao
polis
Hei
ghts
Roa
d, S
uite
440
Moo
n To
wns
hip,
PA
151
08Fi
le N
ame
: Fro
nt-S
tate
Site
Cod
e: 0
0001
234
Sta
rt D
ate
: 7/8
/201
0P
age
No
: 2
Stat
eN
orth
boun
dSt
ate
Sout
hbou
ndFr
ont
East
boun
dFr
ont
Wes
tbou
nd
Star
t Tim
eLe
ftTh
ruR
ight
Peds
App
. Tot
alLe
ftTh
ruR
ight
Peds
App
. Tot
alLe
ftTh
ruR
ight
Peds
App
. Tot
alLe
ftTh
ruR
ight
Peds
App
. Tot
alIn
t. To
tal
Peak
Hou
r Ana
lysi
s Fro
m 0
7:00
AM
to 1
2:30
PM
- Pe
ak 1
of 1
Peak
Hou
r for
Ent
ire In
ters
ectio
n B
egin
s at 0
7:30
AM
07:3
0 A
M0
250
227
071
226
990
00
00
070
590
129
255
07:4
5 A
M0
380
038
070
296
105
00
00
01
5184
013
627
908
:00
AM
023
00
230
7326
099
00
00
00
5152
010
322
508
:15
AM
032
01
330
5921
484
00
00
05
5162
011
823
5To
tal V
olum
e0
118
03
121
027
398
1638
70
00
00
622
325
70
486
994
% A
pp. T
otal
097
.50
2.5
070
.525
.34.
10
00
01.
245
.952
.90
PHF
.000
.776
.000
.375
.796
.000
.935
.845
.667
.921
.000
.000
.000
.000
.000
.300
.796
.765
.000
.893
.891
Peak
Hou
r Ana
lysi
s Fro
m 1
2:45
PM
to 0
5:45
PM
- Pe
ak 1
of 1
Peak
Hou
r for
Ent
ire In
ters
ectio
n B
egin
s at 0
4:30
PM
04:3
0 PM
052
00
520
9961
216
20
00
00
371
108
018
239
604
:45
PM1
450
046
011
251
116
40
00
00
770
850
162
372
05:0
0 PM
045
01
460
101
443
148
00
00
02
8811
90
209
403
05:1
5 PM
037
02
390
128
585
191
00
00
02
6013
10
193
423
Tota
l Vol
ume
117
90
318
30
440
214
1166
50
00
00
1428
944
30
746
1594
% A
pp. T
otal
0.5
97.8
01.
60
66.2
32.2
1.7
00
00
1.9
38.7
59.4
0PH
F.2
50.8
61.0
00.3
75.8
80.0
00.8
59.8
77.5
50.8
70.0
00.0
00.0
00.0
00.0
00.5
00.8
21.8
45.0
00.8
92.9
42

JOH
NSO
N, M
IRM
IRA
N &
TH
OM
PSO
N, I
NC
.15
50 C
orao
polis
Hei
ghts
Roa
d, S
uite
440
Moo
n To
wns
hip,
PA
151
08Fi
le N
ame
: Fro
nt-W
ilson
Site
Cod
e: 0
0000
006
Sta
rt D
ate
: 7/8
/201
0P
age
No
: 1
Gro
ups P
rinte
d- P
ass.
Veh
. - T
ruck
s - B
ikes
Wils
onN
orth
boun
dSo
uthb
ound
Fron
tEa
stbo
und
Fron
tW
estb
ound
Star
t Tim
eLe
ftTh
ruR
ight
Peds
App
. Tot
alLe
ftTh
ruR
ight
Peds
App
. Tot
alLe
ftTh
ruR
ight
Peds
App
. Tot
alLe
ftTh
ruR
ight
Peds
App
. Tot
alIn
t. To
tal
07:0
0 A
M19
00
019
00
00
00
00
00
061
00
6180
07:1
5 A
M29
00
029
00
00
00
00
00
080
00
8010
907
:30
AM
310
00
310
00
11
00
00
00
970
198
130
07:4
5 A
M29
00
029
00
00
00
00
00
010
40
010
413
3To
tal
108
00
010
80
00
11
00
00
00
342
01
343
452
08:0
0 A
M33
00
033
00
00
00
00
00
074
00
7410
708
:15
AM
340
00
340
00
00
00
00
00
820
082
116
08:3
0 A
M28
00
028
00
01
10
00
00
076
00
7610
508
:45
AM
300
00
300
00
00
00
00
00
830
083
113
Tota
l12
50
00
125
00
01
10
00
00
031
50
031
544
1
***
BR
EAK
***
04:0
0 PM
730
00
730
00
11
00
01
10
131
00
131
206
04:1
5 PM
600
00
600
00
00
00
00
00
110
00
110
170
04:3
0 PM
670
01
680
00
00
00
00
00
107
00
107
175
04:4
5 PM
580
05
630
00
11
00
01
10
115
00
115
180
Tota
l25
80
06
264
00
02
20
00
22
046
30
046
373
1
05:0
0 PM
620
00
620
00
00
00
00
00
125
00
125
187
05:1
5 PM
580
01
590
00
00
00
00
00
132
00
132
191
05:3
0 PM
510
00
510
00
00
00
00
01
121
00
122
173
05:4
5 PM
700
03
730
00
00
00
04
40
970
097
174
Tota
l24
10
04
245
00
00
00
00
44
147
50
047
672
5
Gra
nd T
otal
732
00
1074
20
00
44
00
06
61
1595
01
1597
2349
App
rch
%98
.70
01.
30
00
100
00
010
00.
199
.90
0.1
Tota
l %31
.20
00.
431
.60
00
0.2
0.2
00
00.
30.
30
67.9
00
68Pa
ss. V
eh.
732
00
1074
20
00
44
00
06
61
1595
01
1597
2349
% P
ass.
Veh
.10
00
010
010
00
00
100
100
00
010
010
010
010
00
100
100
100
Truc
ks0
00
00
00
00
00
00
00
00
00
00
% T
ruck
s0
00
00
00
00
00
00
00
00
00
00
Bik
es0
00
00
00
00
00
00
00
00
00
00
% B
ikes
00
00
00
00
00
00
00
00
00
00
0
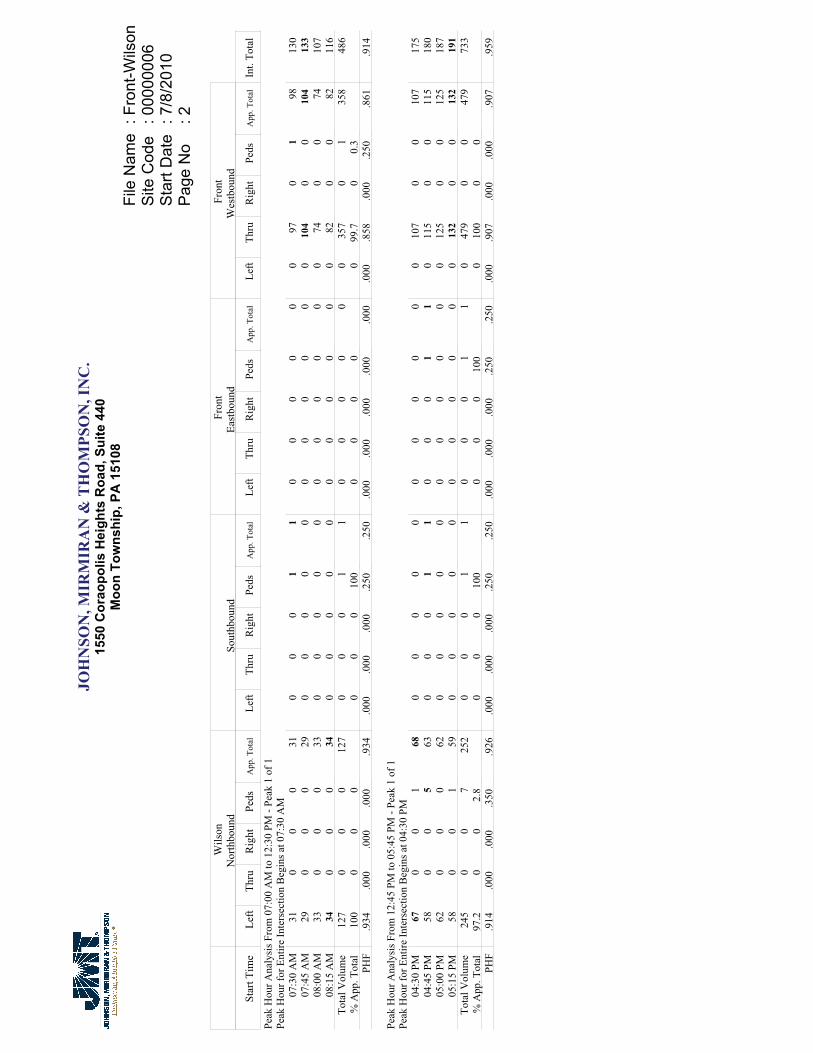
JOH
NSO
N, M
IRM
IRA
N &
TH
OM
PSO
N, I
NC
.15
50 C
orao
polis
Hei
ghts
Roa
d, S
uite
440
Moo
n To
wns
hip,
PA
151
08Fi
le N
ame
: Fro
nt-W
ilson
Site
Cod
e: 0
0000
006
Sta
rt D
ate
: 7/8
/201
0P
age
No
: 2
Wils
onN
orth
boun
dSo
uthb
ound
Fron
tEa
stbo
und
Fron
tW
estb
ound
Star
t Tim
eLe
ftTh
ruR
ight
Peds
App
. Tot
alLe
ftTh
ruR
ight
Peds
App
. Tot
alLe
ftTh
ruR
ight
Peds
App
. Tot
alLe
ftTh
ruR
ight
Peds
App
. Tot
alIn
t. To
tal
Peak
Hou
r Ana
lysi
s Fro
m 0
7:00
AM
to 1
2:30
PM
- Pe
ak 1
of 1
Peak
Hou
r for
Ent
ire In
ters
ectio
n B
egin
s at 0
7:30
AM
07:3
0 A
M31
00
031
00
01
10
00
00
097
01
9813
007
:45
AM
290
00
290
00
00
00
00
00
104
00
104
133
08:0
0 A
M33
00
033
00
00
00
00
00
074
00
7410
708
:15
AM
340
00
340
00
00
00
00
00
820
082
116
Tota
l Vol
ume
127
00
012
70
00
11
00
00
00
357
01
358
486
% A
pp. T
otal
100
00
00
00
100
00
00
099
.70
0.3
PHF
.934
.000
.000
.000
.934
.000
.000
.000
.250
.250
.000
.000
.000
.000
.000
.000
.858
.000
.250
.861
.914
Peak
Hou
r Ana
lysi
s Fro
m 1
2:45
PM
to 0
5:45
PM
- Pe
ak 1
of 1
Peak
Hou
r for
Ent
ire In
ters
ectio
n B
egin
s at 0
4:30
PM
04:3
0 PM
670
01
680
00
00
00
00
00
107
00
107
175
04:4
5 PM
580
05
630
00
11
00
01
10
115
00
115
180
05:0
0 PM
620
00
620
00
00
00
00
00
125
00
125
187
05:1
5 PM
580
01
590
00
00
00
00
00
132
00
132
191
Tota
l Vol
ume
245
00
725
20
00
11
00
01
10
479
00
479
733
% A
pp. T
otal
97.2
00
2.8
00
010
00
00
100
010
00
0PH
F.9
14.0
00.0
00.3
50.9
26.0
00.0
00.0
00.2
50.2
50.0
00.0
00.0
00.2
50.2
50.0
00.9
07.0
00.0
00.9
07.9
59

JOH
NSO
N, M
IRM
IRA
N &
TH
OM
PSO
N, I
NC
.15
50 C
orao
polis
Hei
ghts
Roa
d, S
uite
440
Moo
n To
wns
hip,
PA
151
08Fi
le N
ame
: Firs
t-Pet
role
umS
ite C
ode
: 000
0000
2S
tart
Dat
e: 7
/8/2
010
Pag
e N
o: 1
Gro
ups P
rinte
d- P
ass.
Veh
. - T
ruck
s - B
ikes
Petro
leum
Nor
thbo
und
Petro
leum
Sout
hbou
nd1s
tEa
stbo
und
1st
Wes
tbou
ndSt
art T
ime
Left
Thru
Rig
htPe
dsA
pp. T
otal
Left
Thru
Rig
htPe
dsA
pp. T
otal
Left
Thru
Rig
htPe
dsA
pp. T
otal
Left
Thru
Rig
htPe
dsA
pp. T
otal
Int.
Tota
l07
:00
AM
04
10
521
517
043
2819
11
490
00
00
9707
:15
AM
02
10
341
526
072
1934
10
540
00
00
129
07:3
0 A
M0
51
17
312
420
7522
231
450
00
00
013
207
:45
AM
23
11
737
1150
098
3535
12
730
00
00
178
Tota
l2
144
222
130
2313
50
288
104
111
47
226
00
00
053
6
08:0
0 A
M0
40
37
448
350
8730
350
166
00
00
016
008
:15
AM
15
02
823
434
162
2031
12
540
00
00
124
08:3
0 A
M0
50
05
4216
460
104
2819
02
490
00
00
158
08:4
5 A
M0
11
68
424
562
104
1928
02
490
00
44
165
Tota
l1
151
1128
151
3217
13
357
9711
31
721
80
00
44
607
***
BR
EAK
***
04:0
0 PM
23
01
665
1878
016
129
220
051
00
03
322
104
:15
PM1
61
311
7313
810
167
3132
13
670
00
00
245
04:3
0 PM
08
43
1573
1673
016
243
362
081
00
03
326
104
:45
PM0
60
28
7717
751
170
2341
02
660
00
11
245
Tota
l3
235
940
288
6430
71
660
126
131
35
265
00
07
797
2
05:0
0 PM
27
00
967
1170
014
844
374
287
00
00
024
405
:15
PM1
60
07
5914
900
163
3838
11
780
00
00
248
05:3
0 PM
05
00
567
1884
016
925
350
060
00
00
023
405
:45
PM0
31
04
649
550
128
2130
20
530
00
00
185
Tota
l3
211
025
257
5229
90
608
128
140
73
278
00
00
091
1
Gra
nd T
otal
973
1122
115
826
171
912
419
1345
549
515
2298
70
00
1111
3026
App
rch
%7.
863
.59.
619
.143
.28.
947
.70.
246
.150
.21.
52.
20
00
100
Tota
l %0.
32.
40.
40.
73.
827
.35.
730
.10.
163
.215
16.4
0.5
0.7
32.6
00
00.
40.
4Pa
ss. V
eh.
973
1122
115
775
169
886
418
3444
548
215
2196
30
00
99
2921
% P
ass.
Veh
.10
010
010
010
010
093
.898
.897
.110
095
.997
.897
.410
095
.597
.60
00
81.8
81.8
96.5
Truc
ks0
00
00
512
260
7910
120
022
00
00
010
1%
Tru
cks
00
00
06.
21.
22.
90
4.1
2.2
2.4
00
2.2
00
00
03.
3B
ikes
00
00
00
00
00
01
01
20
00
22
4%
Bik
es0
00
00
00
00
00
0.2
04.
50.
20
00
18.2
18.2
0.1

JOH
NSO
N, M
IRM
IRA
N &
TH
OM
PSO
N, I
NC
.15
50 C
orao
polis
Hei
ghts
Roa
d, S
uite
440
Moo
n To
wns
hip,
PA
151
08Fi
le N
ame
: Firs
t-Pet
role
umS
ite C
ode
: 000
0000
2S
tart
Dat
e: 7
/8/2
010
Pag
e N
o: 2
Petro
leum
Nor
thbo
und
Petro
leum
Sout
hbou
nd1s
tEa
stbo
und
1st
Wes
tbou
nd
Star
t Tim
eLe
ftTh
ruR
ight
Peds
App
. Tot
alLe
ftTh
ruR
ight
Peds
App
. Tot
alLe
ftTh
ruR
ight
Peds
App
. Tot
alLe
ftTh
ruR
ight
Peds
App
. Tot
alIn
t. To
tal
Peak
Hou
r Ana
lysi
s Fro
m 0
7:00
AM
to 1
1:45
AM
- Pe
ak 1
of 1
Peak
Hou
r for
Ent
ire In
ters
ectio
n B
egin
s at 0
7:45
AM
07:4
5 A
M2
31
17
3711
500
9835
351
273
00
00
017
808
:00
AM
04
03
744
835
087
3035
01
660
00
00
160
08:1
5 A
M1
50
28
234
341
6220
311
254
00
00
012
408
:30
AM
05
00
542
1646
010
428
190
249
00
00
015
8To
tal V
olum
e3
171
627
146
3916
51
351
113
120
27
242
00
00
062
0%
App
. Tot
al11
.163
3.7
22.2
41.6
11.1
470.
346
.749
.60.
82.
90
00
0PH
F.3
75.8
50.2
50.5
00.8
44.8
30.6
09.8
25.2
50.8
44.8
07.8
57.5
00.8
75.8
29.0
00.0
00.0
00.0
00.0
00.8
71
Peak
Hou
r Ana
lysi
s Fro
m 1
2:00
PM
to 0
5:45
PM
- Pe
ak 1
of 1
Peak
Hou
r for
Ent
ire In
ters
ectio
n B
egin
s at 0
4:30
PM
04:3
0 PM
08
43
1573
1673
016
243
362
081
00
03
326
104
:45
PM0
60
28
7717
751
170
2341
02
660
00
11
245
05:0
0 PM
27
00
967
1170
014
844
374
287
00
00
024
405
:15
PM1
60
07
5914
900
163
3838
11
780
00
00
248
Tota
l Vol
ume
327
45
3927
658
308
164
314
815
27
531
20
00
44
998
% A
pp. T
otal
7.7
69.2
10.3
12.8
42.9
947
.90.
247
.448
.72.
21.
60
00
100
PHF
.375
.844
.250
.417
.650
.896
.853
.856
.250
.946
.841
.927
.438
.625
.897
.000
.000
.000
.333
.333
.956
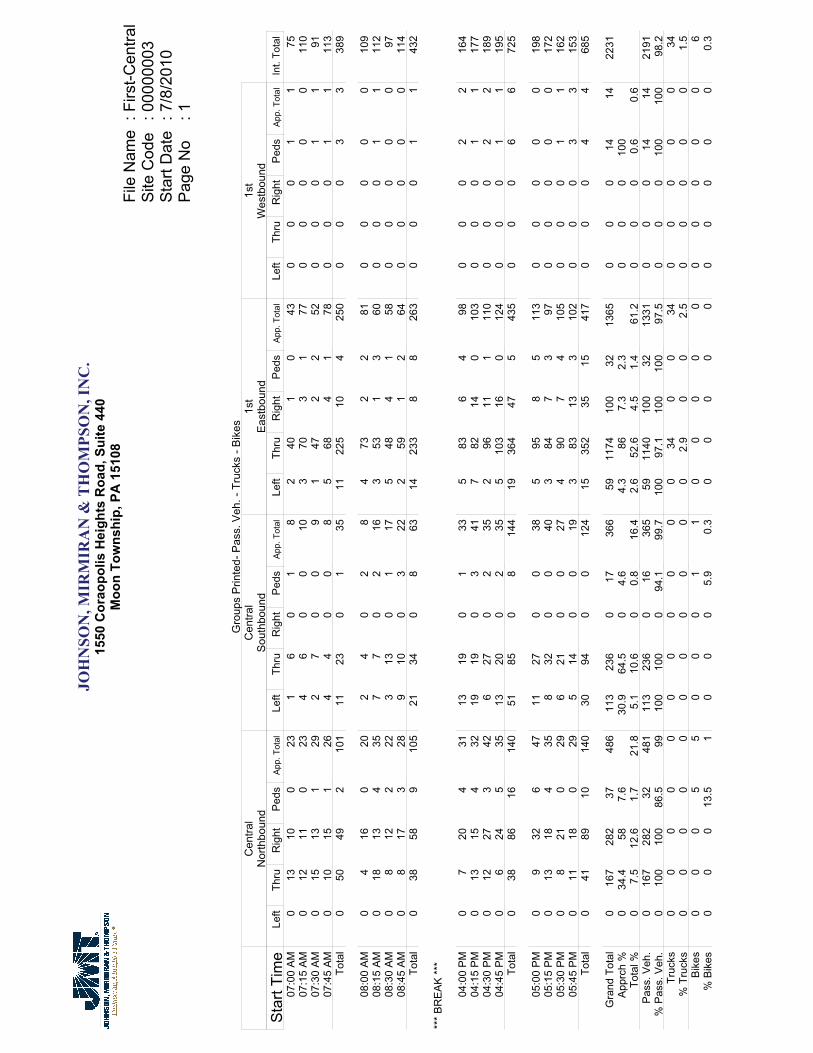
JOH
NSO
N, M
IRM
IRA
N &
TH
OM
PSO
N, I
NC
.15
50 C
orao
polis
Hei
ghts
Roa
d, S
uite
440
Moo
n To
wns
hip,
PA
151
08Fi
le N
ame
: Firs
t-Cen
tral
Site
Cod
e: 0
0000
003
Sta
rt D
ate
: 7/8
/201
0P
age
No
: 1
Gro
ups
Prin
ted-
Pas
s. V
eh. -
Tru
cks
- Bik
esC
entra
lN
orth
boun
dC
entra
lS
outh
boun
d1s
tE
astb
ound
1st
Wes
tbou
ndS
tart
Tim
eLe
ftTh
ruR
ight
Ped
sA
pp. T
otal
Left
Thru
Rig
htP
eds
App
. Tot
alLe
ftTh
ruR
ight
Ped
sA
pp. T
otal
Left
Thru
Rig
htP
eds
App
. Tot
alIn
t. To
tal
07:0
0 A
M0
1310
023
16
01
82
401
043
00
01
175
07:1
5 A
M0
1211
023
46
00
103
703
177
00
00
011
007
:30
AM
015
131
292
70
09
147
22
520
00
11
9107
:45
AM
010
151
264
40
08
568
41
780
00
11
113
Tota
l0
5049
210
111
230
135
1122
510
425
00
00
33
389
08:0
0 A
M0
416
020
24
02
84
732
281
00
00
010
908
:15
AM
018
134
357
70
216
353
13
600
00
11
112
08:3
0 A
M0
812
222
313
01
175
484
158
00
00
097
08:4
5 A
M0
817
328
910
03
222
591
264
00
00
011
4To
tal
038
589
105
2134
08
6314
233
88
263
00
01
143
2
***
BR
EA
K *
**
04:0
0 P
M0
720
431
1319
01
335
836
498
00
02
216
404
:15
PM
013
154
3219
190
341
782
140
103
00
01
117
704
:30
PM
012
273
426
270
235
296
111
110
00
02
218
904
:45
PM
06
245
3513
200
235
510
316
012
40
00
11
195
Tota
l0
3886
1614
051
850
814
419
364
475
435
00
06
672
5
05:0
0 P
M0
932
647
1127
00
385
958
511
30
00
00
198
05:1
5 P
M0
1318
435
832
00
403
847
397
00
00
017
205
:30
PM
08
210
296
210
027
490
74
105
00
01
116
205
:45
PM
011
180
295
140
019
383
133
102
00
03
315
3To
tal
041
8910
140
3094
00
124
1535
235
1541
70
00
44
685
Gra
nd T
otal
016
728
237
486
113
236
017
366
5911
7410
032
1365
00
014
1422
31A
pprc
h %
034
.458
7.6
30.9
64.5
04.
64.
386
7.3
2.3
00
010
0To
tal %
07.
512
.61.
721
.85.
110
.60
0.8
16.4
2.6
52.6
4.5
1.4
61.2
00
00.
60.
6P
ass.
Veh
.0
167
282
3248
111
323
60
1636
559
1140
100
3213
310
00
1414
2191
% P
ass.
Veh
.0
100
100
86.5
9910
010
00
94.1
99.7
100
97.1
100
100
97.5
00
010
010
098
.2Tr
ucks
00
00
00
00
00
034
00
340
00
00
34%
Tru
cks
00
00
00
00
00
02.
90
02.
50
00
00
1.5
Bik
es0
00
55
00
01
10
00
00
00
00
06
% B
ikes
00
013
.51
00
05.
90.
30
00
00
00
00
00.
3
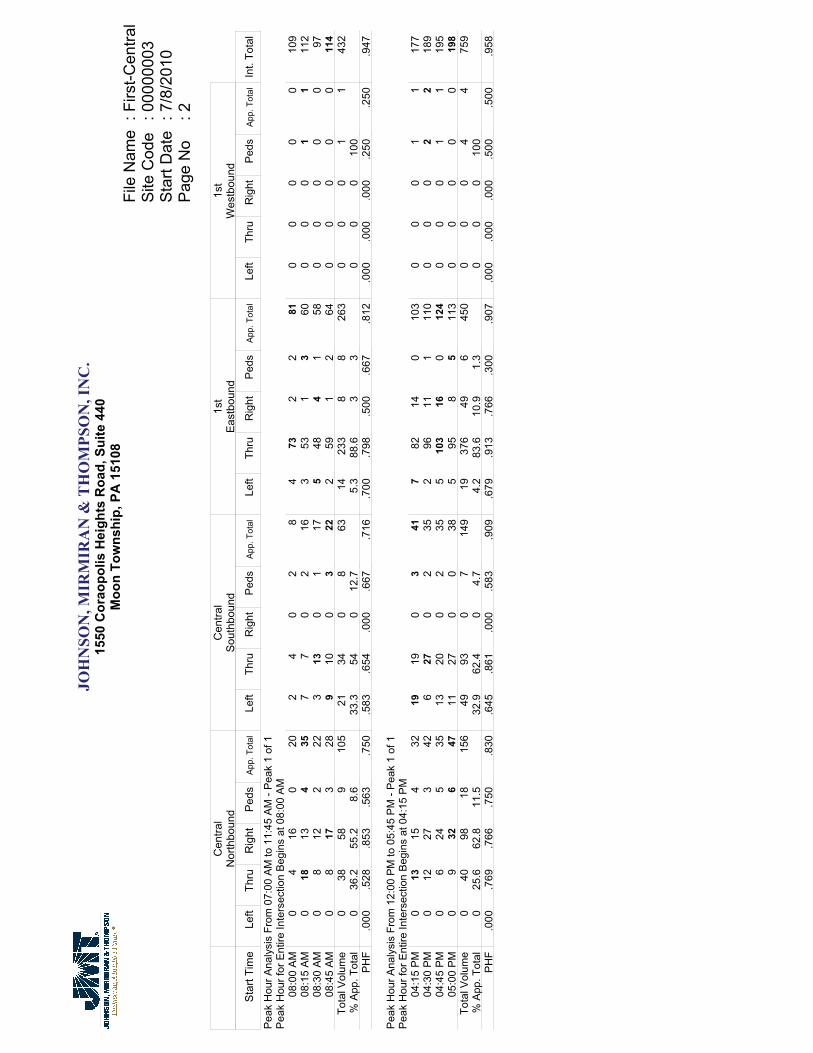
JOH
NSO
N, M
IRM
IRA
N &
TH
OM
PSO
N, I
NC
.15
50 C
orao
polis
Hei
ghts
Roa
d, S
uite
440
Moo
n To
wns
hip,
PA
151
08Fi
le N
ame
: Firs
t-Cen
tral
Site
Cod
e: 0
0000
003
Sta
rt D
ate
: 7/8
/201
0P
age
No
: 2
Cen
tral
Nor
thbo
und
Cen
tral
Sou
thbo
und
1st
Eas
tbou
nd1s
tW
estb
ound
Sta
rt Ti
me
Left
Thru
Rig
htP
eds
App
. Tot
alLe
ftTh
ruR
ight
Ped
sA
pp. T
otal
Left
Thru
Rig
htP
eds
App
. Tot
alLe
ftTh
ruR
ight
Ped
sA
pp. T
otal
Int.
Tota
l
Pea
k H
our A
naly
sis
From
07:
00 A
M to
11:
45 A
M -
Pea
k 1
of 1
Pea
k H
our f
or E
ntire
Inte
rsec
tion
Beg
ins
at 0
8:00
AM
08:0
0 A
M0
416
020
24
02
84
732
281
00
00
010
908
:15
AM
018
134
357
70
216
353
13
600
00
11
112
08:3
0 A
M0
812
222
313
01
175
484
158
00
00
097
08:4
5 A
M0
817
328
910
03
222
591
264
00
00
011
4To
tal V
olum
e0
3858
910
521
340
863
1423
38
826
30
00
11
432
% A
pp. T
otal
036
.255
.28.
633
.354
012
.75.
388
.63
30
00
100
PH
F.0
00.5
28.8
53.5
63.7
50.5
83.6
54.0
00.6
67.7
16.7
00.7
98.5
00.6
67.8
12.0
00.0
00.0
00.2
50.2
50.9
47
Pea
k H
our A
naly
sis
From
12:
00 P
M to
05:
45 P
M -
Pea
k 1
of 1
Pea
k H
our f
or E
ntire
Inte
rsec
tion
Beg
ins
at 0
4:15
PM
04:1
5 P
M0
1315
432
1919
03
417
8214
010
30
00
11
177
04:3
0 P
M0
1227
342
627
02
352
9611
111
00
00
22
189
04:4
5 P
M0
624
535
1320
02
355
103
160
124
00
01
119
505
:00
PM
09
326
4711
270
038
595
85
113
00
00
019
8To
tal V
olum
e0
4098
1815
649
930
714
919
376
496
450
00
04
475
9%
App
. Tot
al0
25.6
62.8
11.5
32.9
62.4
04.
74.
283
.610
.91.
30
00
100
PH
F.0
00.7
69.7
66.7
50.8
30.6
45.8
61.0
00.5
83.9
09.6
79.9
13.7
66.3
00.9
07.0
00.0
00.0
00.5
00.5
00.9
58

JOH
NSO
N, M
IRM
IRA
N &
TH
OM
PSO
N, I
NC
.15
50 C
orao
polis
Hei
ghts
Roa
d, S
uite
440
Moo
n To
wns
hip,
PA
151
08Fi
le N
ame
: Firs
t-Sta
teS
ite C
ode
: 005
0000
2S
tart
Dat
e: 7
/8/2
010
Pag
e N
o: 1
Gro
ups
Prin
ted-
Pas
s. V
eh. -
Tru
cks
- Bik
esSt
ate
Nor
thbo
und
Stat
eSo
uthb
ound
1st
East
boun
d1s
tW
estb
ound
Sta
rt Ti
me
Left
Thru
Rig
htP
eds
App
. Tot
alLe
ftTh
ruR
ight
Ped
sA
pp. T
otal
Left
Thru
Rig
htP
eds
App
. Tot
alLe
ftTh
ruR
ight
Ped
sA
pp. T
otal
Int.
Tota
l07
:00
AM
00
00
037
10
038
1631
10
480
00
00
8607
:15
AM
00
00
043
10
044
3255
31
910
00
22
137
07:3
0 A
M0
00
11
681
00
6923
400
467
00
01
113
807
:45
AM
00
01
169
10
070
3547
30
850
00
11
157
Tota
l0
00
22
217
40
022
110
617
37
529
10
00
44
518
08:0
0 A
M0
00
22
710
01
7225
662
194
00
00
016
808
:15
AM
00
01
155
50
262
3334
12
700
10
34
137
08:3
0 A
M0
00
11
625
01
6813
443
161
00
00
013
008
:45
AM
00
02
284
50
089
3054
30
870
00
33
181
Tota
l0
00
66
272
150
429
110
119
89
431
20
10
67
616
***
BR
EA
K *
**
04:0
0 P
M0
00
22
103
70
111
130
944
012
80
00
11
242
04:1
5 P
M0
00
00
101
110
011
231
816
011
80
00
00
230
04:3
0 P
M0
00
00
100
100
211
256
718
714
20
10
45
259
04:4
5 P
M0
00
00
998
00
107
4694
40
144
00
00
025
1To
tal
00
02
240
336
03
442
163
340
227
532
01
05
698
2
05:0
0 P
M0
00
22
109
120
112
245
944
314
60
00
00
270
05:1
5 P
M0
10
12
110
90
412
337
743
211
60
00
11
242
05:3
0 P
M0
00
33
825
04
9142
675
011
40
00
22
210
05:4
5 P
M0
10
01
775
01
8343
644
111
20
10
01
197
Tota
l0
20
68
378
310
1041
916
729
916
648
80
10
34
919
Gra
nd T
otal
02
016
1812
7086
017
1373
537
1010
5422
1623
03
018
2130
35A
pprc
h %
011
.10
88.9
92.5
6.3
01.
233
.162
.23.
31.
40
14.3
085
.7To
tal %
00.
10
0.5
0.6
41.8
2.8
00.
645
.217
.733
.31.
80.
753
.50
0.1
00.
60.
7P
ass.
Veh
.0
00
1616
1247
840
1513
4653
496
654
2115
750
00
1616
2953
% P
ass.
Veh
.0
00
100
88.9
98.2
97.7
088
.298
99.4
95.6
100
95.5
970
00
88.9
76.2
97.3
Truc
ks0
00
00
220
00
222
410
043
00
01
166
% T
ruck
s0
00
00
1.7
00
01.
60.
44.
10
02.
60
00
5.6
4.8
2.2
Bik
es0
20
02
12
02
51
30
15
03
01
416
% B
ikes
010
00
011
.10.
12.
30
11.8
0.4
0.2
0.3
04.
50.
30
100
05.
619
0.5

JOH
NSO
N, M
IRM
IRA
N &
TH
OM
PSO
N, I
NC
.15
50 C
orao
polis
Hei
ghts
Roa
d, S
uite
440
Moo
n To
wns
hip,
PA
151
08Fi
le N
ame
: Firs
t-Sta
teS
ite C
ode
: 005
0000
2S
tart
Dat
e: 7
/8/2
010
Pag
e N
o: 2
Stat
eN
orth
boun
dSt
ate
Sout
hbou
nd1s
tEa
stbo
und
1st
Wes
tbou
nd
Sta
rt Ti
me
Left
Thru
Rig
htP
eds
App
. Tot
alLe
ftTh
ruR
ight
Ped
sA
pp. T
otal
Left
Thru
Rig
htP
eds
App
. Tot
alLe
ftTh
ruR
ight
Ped
sA
pp. T
otal
Int.
Tota
l
Pea
k H
our A
naly
sis
From
07:
00 A
M to
11:
45 A
M -
Pea
k 1
of 1
Pea
k H
our f
or E
ntire
Inte
rsec
tion
Beg
ins
at 0
8:00
AM
08:0
0 A
M0
00
22
710
01
7225
662
194
00
00
016
808
:15
AM
00
01
155
50
262
3334
12
700
10
34
137
08:3
0 A
M0
00
11
625
01
6813
443
161
00
00
013
008
:45
AM
00
02
284
50
089
3054
30
870
00
33
181
Tota
l Vol
ume
00
06
627
215
04
291
101
198
94
312
01
06
761
6%
App
. Tot
al0
00
100
93.5
5.2
01.
432
.463
.52.
91.
30
14.3
085
.7P
HF
.000
.000
.000
.750
.750
.810
.750
.000
.500
.817
.765
.750
.750
.500
.830
.000
.250
.000
.500
.438
.851
Pea
k H
our A
naly
sis
From
12:
00 P
M to
05:
45 P
M -
Pea
k 1
of 1
Pea
k H
our f
or E
ntire
Inte
rsec
tion
Beg
ins
at 0
4:30
PM
04:3
0 P
M0
00
00
100
100
211
256
718
714
20
10
45
259
04:4
5 P
M0
00
00
998
00
107
4694
40
144
00
00
025
105
:00
PM
00
02
210
912
01
122
4594
43
146
00
00
027
005
:15
PM
01
01
211
09
04
123
3774
32
116
00
01
124
2To
tal V
olum
e0
10
34
418
390
746
418
433
319
1254
80
10
56
1022
% A
pp. T
otal
025
075
90.1
8.4
01.
533
.660
.83.
52.
20
16.7
083
.3P
HF
.000
.250
.000
.375
.500
.950
.813
.000
.438
.943
.821
.886
.594
.429
.938
.000
.250
.000
.313
.300
.946

JOH
NSO
N, M
IRM
IRA
N &
TH
OM
PSO
N, I
NC
.15
50 C
orao
polis
Hei
ghts
Roa
d, S
uite
440
Moo
n To
wns
hip,
PA
151
08Fi
le N
ame
: Firs
t-Wils
onS
ite C
ode
: 000
0000
7S
tart
Dat
e: 7
/8/2
010
Pag
e N
o: 1
Gro
ups P
rinte
d- C
ars -
Tru
cks -
Bik
esW
ilson
Nor
thbo
und
Wils
onSo
uthb
ound
1st
East
boun
d1s
tW
estb
ound
Star
t Tim
eLe
ftTh
ruR
ight
Peds
App
. Tot
alLe
ftTh
ruR
ight
Peds
App
. Tot
alLe
ftTh
ruR
ight
Peds
App
. Tot
alLe
ftTh
ruR
ight
Peds
App
. Tot
alIn
t. To
tal
07:0
0 A
M0
191
020
00
00
00
4825
073
00
00
093
07:1
5 A
M0
273
030
00
00
01
7124
096
00
00
012
607
:30
AM
031
02
330
00
00
071
360
107
00
01
114
107
:45
AM
025
01
260
00
00
380
291
113
00
00
013
9To
tal
010
24
310
90
00
00
427
011
41
389
00
01
149
9
08:0
0 A
M0
375
042
00
00
01
100
392
142
00
00
018
408
:15
AM
028
01
290
00
00
362
211
870
00
00
116
08:3
0 A
M0
280
028
00
00
02
8128
011
10
00
00
139
08:4
5 A
M0
272
130
00
00
01
9143
013
50
00
00
165
Tota
l0
120
72
129
00
00
07
334
131
347
50
00
00
604
***
BR
EAK
***
04:0
0 PM
077
20
790
00
22
812
763
019
80
00
11
280
04:1
5 PM
053
00
530
00
00
311
661
018
00
00
00
233
04:3
0 PM
068
24
740
00
00
311
648
016
70
00
00
241
04:4
5 PM
063
25
700
00
33
213
158
019
10
00
11
265
Tota
l0
261
69
276
00
05
516
490
230
073
60
00
22
1019
05:0
0 PM
071
10
720
00
00
412
271
019
70
00
00
269
05:1
5 PM
057
11
590
00
22
311
167
218
30
00
00
244
05:3
0 PM
054
10
550
00
00
697
510
154
00
00
020
905
:45
PM0
641
570
00
00
04
7756
013
70
00
00
207
Tota
l0
246
46
256
00
02
217
407
245
267
10
00
00
929
Gra
nd T
otal
072
921
2077
00
00
77
4415
0172
06
2271
00
03
330
51A
pprc
h %
094
.72.
72.
60
00
100
1.9
66.1
31.7
0.3
00
010
0To
tal %
023
.90.
70.
725
.20
00
0.2
0.2
1.4
49.2
23.6
0.2
74.4
00
00.
10.
1C
ars
072
021
2076
10
00
77
4314
5270
66
2207
00
03
329
78%
Car
s0
98.8
100
100
98.8
00
010
010
097
.796
.798
.110
097
.20
00
100
100
97.6
Truc
ks0
90
09
00
00
01
4914
064
00
00
073
% T
ruck
s0
1.2
00
1.2
00
00
02.
33.
31.
90
2.8
00
00
02.
4B
ikes
00
00
00
00
00
00
00
00
00
00
0%
Bik
es0
00
00
00
00
00
00
00
00
00
00
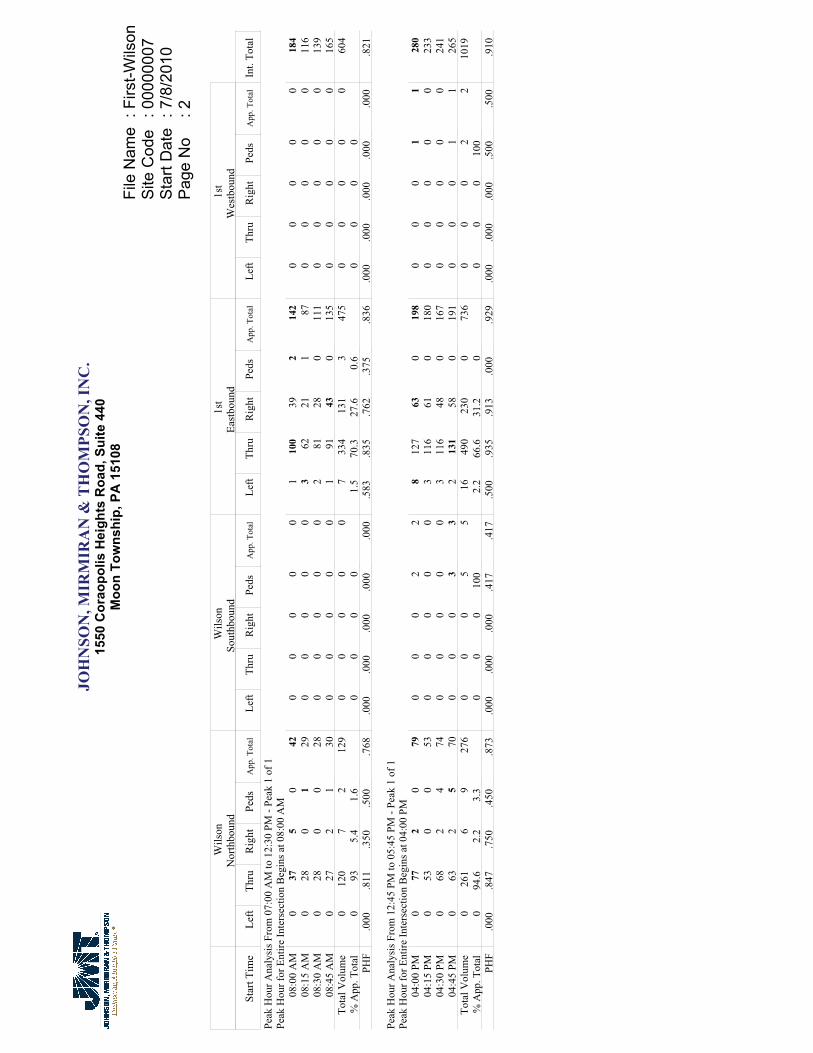
JOH
NSO
N, M
IRM
IRA
N &
TH
OM
PSO
N, I
NC
.15
50 C
orao
polis
Hei
ghts
Roa
d, S
uite
440
Moo
n To
wns
hip,
PA
151
08Fi
le N
ame
: Firs
t-Wils
onS
ite C
ode
: 000
0000
7S
tart
Dat
e: 7
/8/2
010
Pag
e N
o: 2
Wils
onN
orth
boun
dW
ilson
Sout
hbou
nd1s
tEa
stbo
und
1st
Wes
tbou
nd
Star
t Tim
eLe
ftTh
ruR
ight
Peds
App
. Tot
alLe
ftTh
ruR
ight
Peds
App
. Tot
alLe
ftTh
ruR
ight
Peds
App
. Tot
alLe
ftTh
ruR
ight
Peds
App
. Tot
alIn
t. To
tal
Peak
Hou
r Ana
lysi
s Fro
m 0
7:00
AM
to 1
2:30
PM
- Pe
ak 1
of 1
Peak
Hou
r for
Ent
ire In
ters
ectio
n B
egin
s at 0
8:00
AM
08:0
0 A
M0
375
042
00
00
01
100
392
142
00
00
018
408
:15
AM
028
01
290
00
00
362
211
870
00
00
116
08:3
0 A
M0
280
028
00
00
02
8128
011
10
00
00
139
08:4
5 A
M0
272
130
00
00
01
9143
013
50
00
00
165
Tota
l Vol
ume
012
07
212
90
00
00
733
413
13
475
00
00
060
4%
App
. Tot
al0
935.
41.
60
00
01.
570
.327
.60.
60
00
0PH
F.0
00.8
11.3
50.5
00.7
68.0
00.0
00.0
00.0
00.0
00.5
83.8
35.7
62.3
75.8
36.0
00.0
00.0
00.0
00.0
00.8
21
Peak
Hou
r Ana
lysi
s Fro
m 1
2:45
PM
to 0
5:45
PM
- Pe
ak 1
of 1
Peak
Hou
r for
Ent
ire In
ters
ectio
n B
egin
s at 0
4:00
PM
04:0
0 PM
077
20
790
00
22
812
763
019
80
00
11
280
04:1
5 PM
053
00
530
00
00
311
661
018
00
00
00
233
04:3
0 PM
068
24
740
00
00
311
648
016
70
00
00
241
04:4
5 PM
063
25
700
00
33
213
158
019
10
00
11
265
Tota
l Vol
ume
026
16
927
60
00
55
1649
023
00
736
00
02
210
19%
App
. Tot
al0
94.6
2.2
3.3
00
010
02.
266
.631
.20
00
010
0PH
F.0
00.8
47.7
50.4
50.8
73.0
00.0
00.0
00.4
17.4
17.5
00.9
35.9
13.0
00.9
29.0
00.0
00.0
00.5
00.5
00.9
10

JOH
NSO
N, M
IRM
IRA
N &
TH
OM
PSO
N, I
NC
.15
50 C
orao
polis
Hei
ghts
Roa
d, S
uite
440
Moo
n To
wns
hip,
PA
151
08Fi
le N
ame
: Pum
phou
seS
ite C
ode
: 000
0000
8S
tart
Dat
e: 7
/8/2
010
Pag
e N
o: 1
Gro
ups P
rinte
d- P
ass.
Veh
. - T
ruck
s - B
ikes
Rou
te 6
2N
orth
boun
dR
oute
62
Sout
hbou
ndPa
rkin
g Lo
tEa
stbo
und
Pum
phou
seW
estb
ound
Star
t Tim
eLe
ftTh
ruR
ight
Peds
App
. Tot
alLe
ftTh
ruR
ight
Peds
App
. Tot
alLe
ftTh
ruR
ight
Peds
App
. Tot
alLe
ftTh
ruR
ight
Peds
App
. Tot
alIn
t. To
tal
07:0
0 A
M0
680
068
056
00
560
00
00
00
10
112
507
:15
AM
087
00
870
640
064
00
00
01
00
01
152
07:3
0 A
M0
105
00
105
084
00
840
00
00
00
00
018
907
:45
AM
011
60
011
60
941
095
00
00
00
00
00
211
Tota
l0
376
00
376
029
81
029
90
00
00
10
10
267
7
08:0
0 A
M0
780
078
299
00
101
10
00
10
00
00
180
08:1
5 A
M0
730
073
081
00
810
00
00
00
00
015
408
:30
AM
077
00
770
840
084
00
00
00
01
01
162
08:4
5 A
M0
861
087
010
00
010
00
00
00
00
00
018
7To
tal
031
41
031
52
364
00
366
10
00
10
01
01
683
***
BR
EAK
***
04:0
0 PM
013
20
013
22
142
00
144
00
00
01
06
07
283
04:1
5 PM
012
60
012
63
119
00
122
00
00
00
03
03
251
04:3
0 PM
011
91
012
00
139
00
139
00
00
02
01
03
262
04:4
5 PM
013
60
013
63
131
00
134
00
00
01
00
01
271
Tota
l0
513
10
514
853
10
053
90
00
00
40
100
1410
67
05:0
0 PM
013
20
013
25
139
00
144
00
00
01
02
03
279
05:1
5 PM
014
90
014
91
130
00
131
00
00
01
02
03
283
05:3
0 PM
014
03
014
32
125
00
127
00
00
00
02
02
272
05:4
5 PM
012
01
012
11
115
00
116
00
00
00
00
00
237
Tota
l0
541
40
545
950
90
051
80
00
00
20
60
810
71
Gra
nd T
otal
017
446
017
5019
1702
10
1722
10
00
17
018
025
3498
App
rch
%0
99.7
0.3
01.
198
.80.
10
100
00
028
072
0To
tal %
049
.90.
20
500.
548
.70
049
.20
00
00
0.2
00.
50
0.7
Pass
. Veh
.0
1712
60
1718
1916
641
016
841
00
01
70
180
2534
28%
Pas
s. V
eh.
098
.210
00
98.2
100
97.8
100
097
.810
00
00
100
100
010
00
100
98Tr
ucks
032
00
320
380
038
00
00
00
00
00
70%
Tru
cks
01.
80
01.
80
2.2
00
2.2
00
00
00
00
00
2B
ikes
00
00
00
00
00
00
00
00
00
00
0%
Bik
es0
00
00
00
00
00
00
00
00
00
00

JOH
NSO
N, M
IRM
IRA
N &
TH
OM
PSO
N, I
NC
.15
50 C
orao
polis
Hei
ghts
Roa
d, S
uite
440
Moo
n To
wns
hip,
PA
151
08Fi
le N
ame
: Pum
phou
seS
ite C
ode
: 000
0000
8S
tart
Dat
e: 7
/8/2
010
Pag
e N
o: 2
Rou
te 6
2N
orth
boun
dR
oute
62
Sout
hbou
ndPa
rkin
g Lo
tEa
stbo
und
Pum
phou
seW
estb
ound
Star
t Tim
eLe
ftTh
ruR
ight
Peds
App
. Tot
alLe
ftTh
ruR
ight
Peds
App
. Tot
alLe
ftTh
ruR
ight
Peds
App
. Tot
alLe
ftTh
ruR
ight
Peds
App
. Tot
alIn
t. To
tal
Peak
Hou
r Ana
lysi
s Fro
m 0
7:00
AM
to 1
1:45
AM
- Pe
ak 1
of 1
Peak
Hou
r for
Ent
ire In
ters
ectio
n B
egin
s at 0
7:30
AM
07:3
0 A
M0
105
00
105
084
00
840
00
00
00
00
018
907
:45
AM
011
60
011
60
941
095
00
00
00
00
00
211
08:0
0 A
M0
780
078
299
00
101
10
00
10
00
00
180
08:1
5 A
M0
730
073
081
00
810
00
00
00
00
015
4To
tal V
olum
e0
372
00
372
235
81
036
11
00
01
00
00
073
4%
App
. Tot
al0
100
00
0.6
99.2
0.3
010
00
00
00
00
PHF
.000
.802
.000
.000
.802
.250
.904
.250
.000
.894
.250
.000
.000
.000
.250
.000
.000
.000
.000
.000
.870
Peak
Hou
r Ana
lysi
s Fro
m 1
2:00
PM
to 0
5:45
PM
- Pe
ak 1
of 1
Peak
Hou
r for
Ent
ire In
ters
ectio
n B
egin
s at 0
4:45
PM
04:4
5 PM
013
60
013
63
131
00
134
00
00
01
00
01
271
05:0
0 PM
013
20
013
25
139
00
144
00
00
01
02
03
279
05:1
5 PM
014
90
014
91
130
00
131
00
00
01
02
03
283
05:3
0 PM
014
03
014
32
125
00
127
00
00
00
02
02
272
Tota
l Vol
ume
055
73
056
011
525
00
536
00
00
03
06
09
1105
% A
pp. T
otal
099
.50.
50
2.1
97.9
00
00
00
33.3
066
.70
PHF
.000
.935
.250
.000
.940
.550
.944
.000
.000
.931
.000
.000
.000
.000
.000
.750
.000
.750
.000
.750
.976
Appendix C
Route 62 Smart Transportation Corridor Study Final Report October 2010
Appendix C: Future Traffic Projections
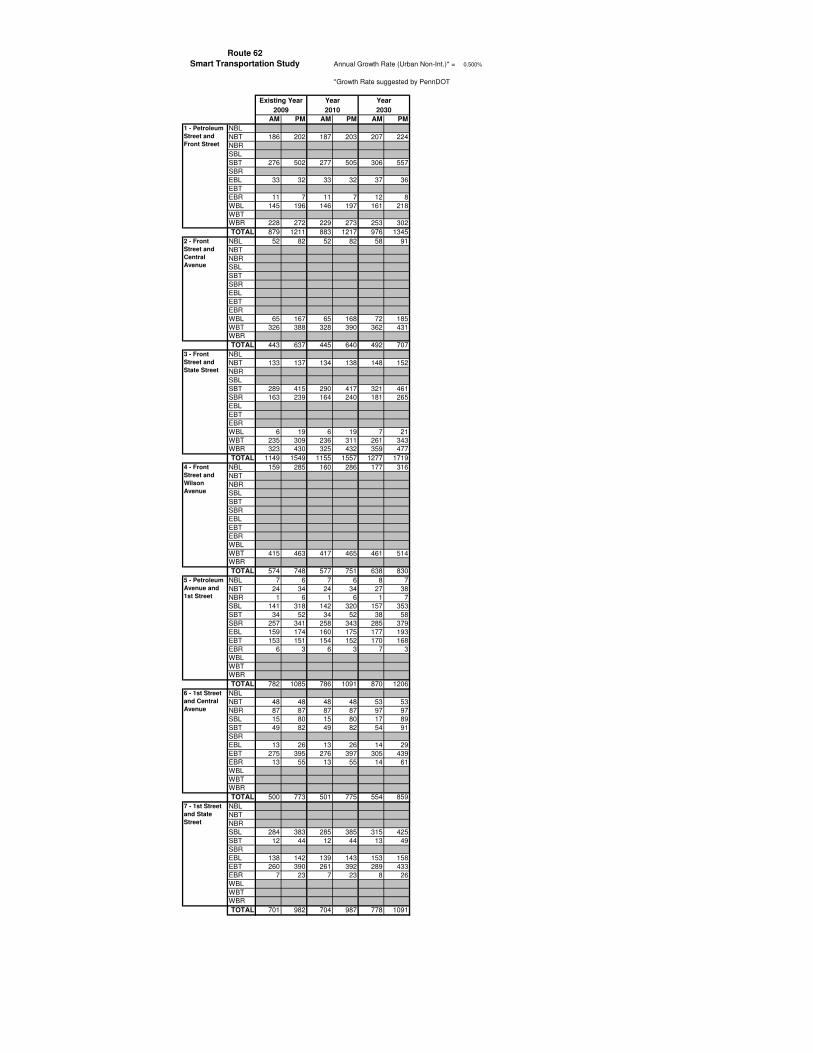
0.500%
*Growth Rate suggested by PennDOT
AM PM AM PM AM PMNBLNBT 186 202 187 203 207 224NBRSBLSBT 276 502 277 505 306 557SBREBL 33 32 33 32 37 36EBTEBR 11 7 11 7 12 8WBL 145 196 146 197 161 218WBTWBR 228 272 229 273 253 302TOTAL 879 1211 883 1217 976 1345
NBL 52 82 52 82 58 91NBTNBRSBLSBTSBREBLEBTEBRWBL 65 167 65 168 72 185WBT 326 388 328 390 362 431WBRTOTAL 443 637 445 640 492 707
NBLNBT 133 137 134 138 148 152NBRSBLSBT 289 415 290 417 321 461SBR 163 239 164 240 181 265EBLEBTEBRWBL 6 19 6 19 7 21WBT 235 309 236 311 261 343WBR 323 430 325 432 359 477TOTAL 1149 1549 1155 1557 1277 1719
NBL 159 285 160 286 177 316NBTNBRSBLSBTSBREBLEBTEBRWBLWBT 415 463 417 465 461 514WBRTOTAL 574 748 577 751 638 830
NBL 7 6 7 6 8 7NBT 24 34 24 34 27 38NBR 1 6 1 6 1 7SBL 141 318 142 320 157 353SBT 34 52 34 52 38 58SBR 257 341 258 343 285 379EBL 159 174 160 175 177 193EBT 153 151 154 152 170 168EBR 6 3 6 3 7 3WBLWBTWBRTOTAL 782 1085 786 1091 870 1206
NBLNBT 48 48 48 48 53 53NBR 87 87 87 87 97 97SBL 15 80 15 80 17 89SBT 49 82 49 82 54 91SBREBL 13 26 13 26 14 29EBT 275 395 276 397 305 439EBR 13 55 13 55 14 61WBLWBTWBRTOTAL 500 773 501 775 554 859
NBLNBTNBRSBL 284 383 285 385 315 425SBT 12 44 12 44 13 49SBREBL 138 142 139 143 153 158EBT 260 390 261 392 289 433EBR 7 23 7 23 8 26WBLWBTWBRTOTAL 701 982 704 987 778 1091
2030
4 - Front Street and Wilson Avenue
3 - Front Street and State Street
2 - Front Street and Central Avenue
2009 2010
Annual Growth Rate (Urban Non-Int.)* =
Route 62
Existing Year Year Year
Smart Transportation Study
5 - Petroleum Avenue and 1st Street
6 - 1st Street and Central Avenue
7 - 1st Street and State Street
1 - Petroleum Street and Front Street

0.500%
*Growth Rate suggested by PennDOT
AM PM AM PM AM PM20302009 2010
Annual Growth Rate (Urban Non-Int.)* =
Route 62
Existing Year Year Year
Smart Transportation Study
NBLNBT 147 257 148 258 163 285NBR 2 2 2 2 2 2SBLSBTSBREBL 12 28 12 28 13 31EBT 374 488 376 490 415 542EBR 150 265 151 266 167 294WBLWBTWBRTOTAL 685 1040 689 1044 760 1154
NBL 1 10 1 10 1 11NBT 404 427 406 429 449 474NBRSBLSBT 370 472 372 474 411 524SBR 6 13 6 13 7 14EBL 11 36 11 36 12 40EBTEBR 12 18 12 18 13 20WBLWBTWBRTOTAL 804 976 808 980 893 1083
NBL 48 89 48 89 53 99NBT 401 433 403 435 445 481NBRSBLSBT 382 484 384 486 424 537SBR 0 6 0 6 0 7EBL 4 4 4 4 4 4EBTEBR 48 82 48 82 53 91WBLWBTWBRTOTAL 883 1098 887 1102 979 1219
NBL 3 3 3 3 3 3NBT 44 57 44 57 49 63NBR 25 72 25 72 28 80SBL 103 229 104 230 114 254SBT 32 35 32 35 36 39SBR 5 2 5 2 6 2EBL 2 5 2 5 2 6EBT 0 1 0 1 0 1EBR 0 4 0 4 0 4WBL 23 82 23 82 26 91WBT 1 3 1 3 1 3WBR 99 191 99 192 110 212TOTAL 337 684 338 686 375 758
NBL 3 2 3 2 3 2NBT 0 1 0 1 0 1NBR 1 6 1 6 1 7SBL 3 18 3 18 3 20SBT 0 4 0 4 0 4SBR 24 42 24 42 27 47EBL 4 17 4 17 4 19EBT 120 271 121 272 133 301EBR 1 8 1 8 1 9WBL 0 4 0 4 0 4WBT 97 241 97 242 108 268WBR 3 8 3 8 3 9TOTAL 256 622 257 624 283 691
NBL 0 4 0 4 0 4NBT 69 140 69 141 77 155NBR 2 7 2 7 2 8SBL 5 12 5 12 6 13SBT 58 173 58 174 64 192SBR 1 16 1 16 1 18EBL 5 19 5 19 6 21EBT 6 6 6 6 7 7EBR 2 5 2 5 2 6WBL 0 6 0 6 0 7WBT 0 11 0 11 0 12WBR 9 40 9 40 10 44TOTAL 157 439 157 441 175 487
14 - 2nd Street and Imperial Street
10 - Front Street and Imperial Street
11 - Front Street and 2nd Street
12 - 2nd Street and Wilson Avenue
13 - 2nd Street and Pine Street
8 - 1st Street and Wilson Avenue

Appendix D
Route 62 Smart Transportation Corridor Study Final Report October 2010
Appendix D: Traffic Signal Inventory

�
�
�
�
�
�
�
�
�
�
�
�
�
���������
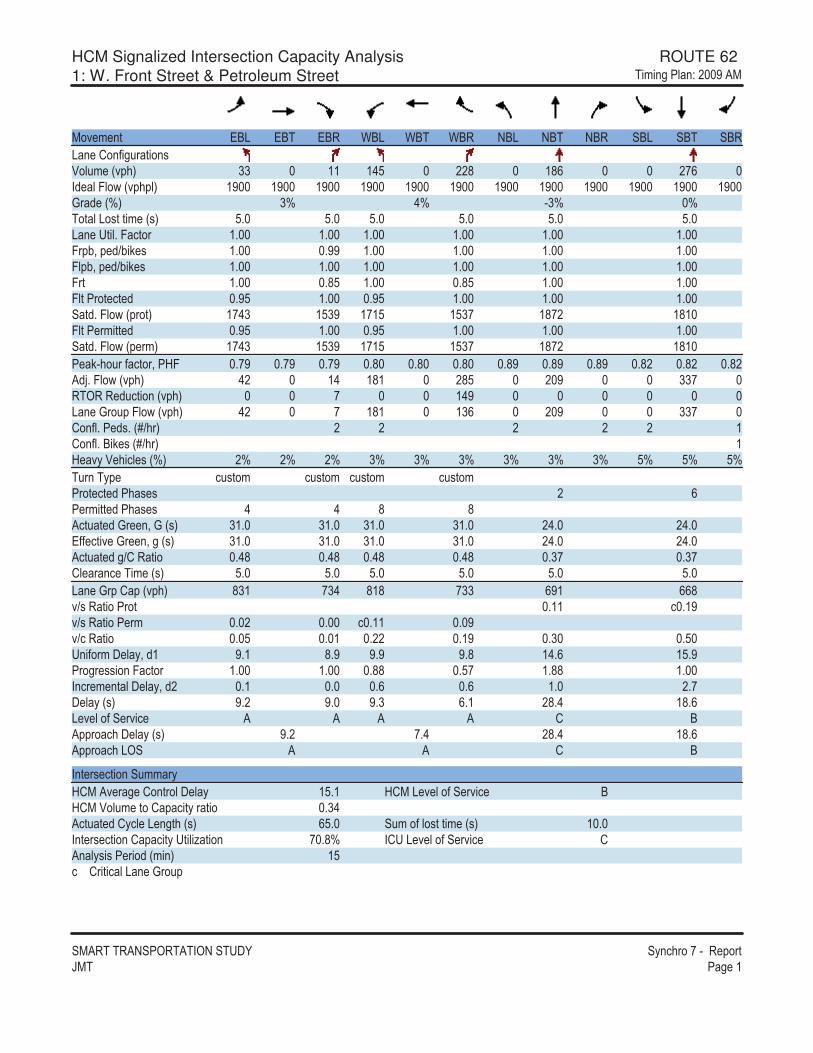
HCM Signalized Intersection Capacity Analysis ROUTE 62 1: W. Front Street & Petroleum Street ������������ ����
�������������������������� �������������� !��"#�� �� �$
��% � �" &'( &'� &'� )'( )'� )'� �'( �'� �'� �'( �'� �'�(� �*��+��,�"���-.�,� �/%!�0 11 $$ $23 ��4 $45 ��5 �6 �7�8�/%!�!0 $� $� $� $� $� $� $� $� $� $� $� $� 9�6 �/:0 1: 2: �1: :��"�(�-"�"�� �/-0 3; 3; 3; 3; 3; 3; (� ��"�;�7�"�� $; $; $; $; $; $; 7�!<=�! 6><�? - $; ;�� $; $; $; $; 7!<=�! 6><�? - $; $; $; $; $; $; 7�" $; ;43 $; ;43 $; $; 7"����" �" 6 ;�3 $; ;�3 $; $; $; �"6;�7�8�/!��"0 $�21 $31� $�$3 $31� $4�� $4$ 7"�� ���"" 6 ;�3 $; ;�3 $; $; $; �"6;�7�8�/! ��0 $�21 $31� $�$3 $31� $4�� $4$ � ?���,��+�"��=��@7 ;�� ;�� ;�� ;4 ;4 ;4 ;4� ;4� ;4� ;4� ;4� ;4��6A;�7�8�/%!�0 2� $2 $4$ �43 � � 11� ������ 6,�"����/%!�0 � $2� (� �9��,!�7�8�/%!�0 2� � $4$ $15 � � 11� *��+;�� 6-;�/B>��0 � � � � � $*��+;�'�? -�/B>��0 $@ %��. ��� -�/:0 �: �: �: 1: 1: 1: 1: 1: 1: 3: 3: 3:�,�����! �,-"�� �,-"�� �,-"�� �,-"�����" �" 6���- - � 5� ���"" 6���- - 2 2 4 4��"," 6�9� �=�9�/-0 1$; 1$; 1$; 1$; �2; �2; &++ �"�% �9� �=���/-0 1$; 1$; 1$; 1$; �2; �2; ��"," 6��>*��"�� ;24 ;24 ;24 ;24 ;1� ;1�* ��� ���� �/-0 3; 3; 3; 3; 3; 3; (� �9�!�*!�/%!�0 41$ �12 4$4 �11 5�$ 554%>-��"������" ;$$ � ;$�%>-��"���� �� ; � ; � ;$$ ; �%>���"�� ; 3 ; $ ;�� ;$� ;1 ;3 ���+����� �=�6$ �;$ 4;� �;� �;4 $2;5 $3;������ --����7�"�� $; $; ;44 ;3� $;44 $; ���� � �"�� �=�6� ;$ ; ;5 ;5 $; �;�� ��/-0 �;� �; �;1 5;$ �4;2 $4;5( % ��+�� �%�� � � � � * '�!!������ ��/-0 �;� �;2 �4;2 $4;5�!!�����(�� � � * '
��" �- �"�����,����@*���% �� �*��"���� � $3;$ @*��( % ��+�� �%�� '@*��.�,� �"��*!��"���"�� ;12��"," 6�*�� �( ��"��/-0� 53; �,���+��-"�"�� �/-0 $ ; ��" �- �"����*!��"���"��C"��� � ;4: �*��( % ��+�� �%�� *���-�-�� ���6�/���0 $3�����*��"���(� �9��,!
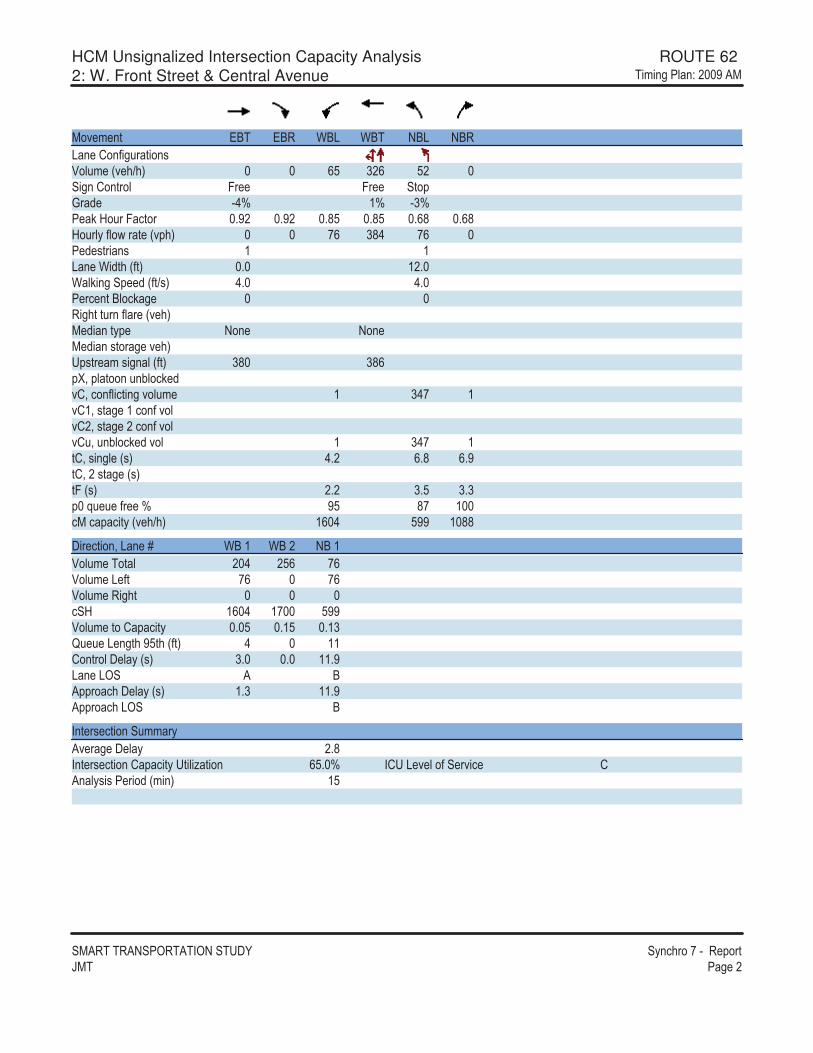
HCM Unsignalized Intersection Capacity Analysis ROUTE 62 2: W. Front Street & Central Avenue ������������ ����
�������������������������� �������������� !��"#�� �� ��
��% � �" &'� &'� )'( )'� �'( �'�(� �*��+��,�"���-.�,� �/% �>�0 53 1�5 3� �����*��"�� 7� 7� �"�!9�6 �2: $: �1:� ?�@�,��7�"�� ;�� ;�� ;43 ;43 ;54 ;54@�,���+�8��" �/%!�0 �5 142 �5 � 6 -"���- $ $(� �)�6"��/+"0 ; $�; )?�����! 6�/+">-0 2; 2; � �� �"�'��?� ����"�",���+� �/% �0� 6���"�! ��� ��� � 6���-"��� �% �0�!-"� ��-����/+"0 14 145!D=�!"����,�<��? 6%*=����+��"����%�,� $ 12� $%*$=�-"� �$����+�%�%*�=�-"� ������+�%�%*,=�,�<��? 6�%� $ 12� $"*=�-��� �/-0 2;� 5;4 5;�"*=���-"� �/-0"7�/-0 �;� 1;3 1;1! �E, , �+� �: �3 4� $ ����!��"��/% �>�0 $5 2 3�� $ 44
��� �"���=�(� �B )'�$ )'�� �'�$.�,� ���" � 2 �35 �5.�,� �( +" �5 �5.�,� �����" ��@ $5 2 $� 3��.�,� �"��*!��"� ; 3 ;$3 ;$1F, , �( ��"���3"��/+"0 2 $$*��"���� ��/-0 1; ; $$;�(� �(�� � '�!!������ ��/-0 $;1 $$;��!!�����(�� '
��" �- �"�����,�����% �� �� �� �;4��" �- �"����*!��"���"��C"���� 53; : �*��( % ��+�� �%�� � *���-�-�� ���6�/���0 $3

HCM Signalized Intersection Capacity Analysis ROUTE 62 3: E. Front Street & Veterans Memorial Bridge ������������ ����
�������������������������� �������������� !��"#�� �� �1
��% � �" &'( &'� &'� )'( )'� )'� �'( �'� �'� �'( �'� �'�(� �*��+��,�"���-.�,� �/%!�0 5 �13 1�1 $11 �4� $51�6 �7�8�/%!�!0 $� $� $� $� $� $� $� $� $� $� $� $� (� �)�6"�� $� $� $� $ $$ $� $� $� $� $� $� $39�6 �/:0 �$: $: �$: ��:��"�(�-"�"�� �/-0 3; 3; 3; 3; 3; 3; (� ��"�;�7�"�� $; $; $; $; $; $; 7�!<=�! 6><�? - $; $; ;�4 $; $; ;��7!<=�! 6><�? - $; $; $; $; $; $; 7�" $; $; ;43 $; $; ;437"����" �" 6 ;�3 $; $; $; $; $; �"6;�7�8�/!��"0 $5�� $��2 $3�� $�$ $�$� $�5�7"�� ���"" 6 ;�3 $; $; $; $; $; �"6;�7�8�/! ��0 $5�� $��2 $3�� $�$ $�$� $�5�� ?���,��+�"��=��@7 ;�� ;�� ;�� ;�1 ;�1 ;�1 ;�$ ;�$ ;�$ ;4� ;4� ;4��6A;�7�8�/%!�0 5 �31 12� $4� 1�3 $41������ 6,�"����/%!�0 $�$ $�$(� �9��,!�7�8�/%!�0 5 �31 $�5 $4� 1�3 5�*��+;�� 6-;�/B>��0 $ $ � 1 1 �@ %��. ��� -�/:0 �: �: �: 1: 1: 1: : : : : : :�,�����! � �� � �� � �����" �" 6���- - 4 � 5� ���"" 6���- - 4 4 5��"," 6�9� �=�9�/-0 11; 11; 11; ��; ��; ��; &++ �"�% �9� �=���/-0 11; 11; 11; ��; ��; ��; ��"," 6��>*��"�� ;3$ ;3$ ;3$ ;12 ;12 ;12* ��� ���� �/-0 3; 3; 3; 3; 3; 3; (� �9�!�*!�/%!�0 4�5 � $ ��3 525 53 3��%>-��"������" � ;$2 ;$ � ;$�%>-��"���� �� ; ;$� ; 2%>���"�� ; $ ;�4 ;�1 ;�� ;3 ;$ ���+����� �=�6$ �;� �;� 4;� $3;4 $�;$ $2;������ --����7�"�� $; $; $; $; 3 $; $; ���� � �"�� �=�6� ; ;4 ;� $;$ �;� ;1� ��/-0 �;� $ ; �;5 $�;� $�;� $3;$( % ��+�� �%�� � � � ' ' '�!!������ ��/-0 ; �;� $�;� $4;$�!!�����(�� � � ' '
��" �- �"�����,����@*���% �� �*��"���� � $2;� @*��( % ��+�� �%�� '@*��.�,� �"��*!��"���"�� ;1���"," 6�*�� �( ��"��/-0� 53; �,���+��-"�"�� �/-0 $ ; ��" �- �"����*!��"���"��C"��� 32;�: �*��( % ��+�� �%�� ����-�-�� ���6�/���0 $3�����*��"���(� �9��,!
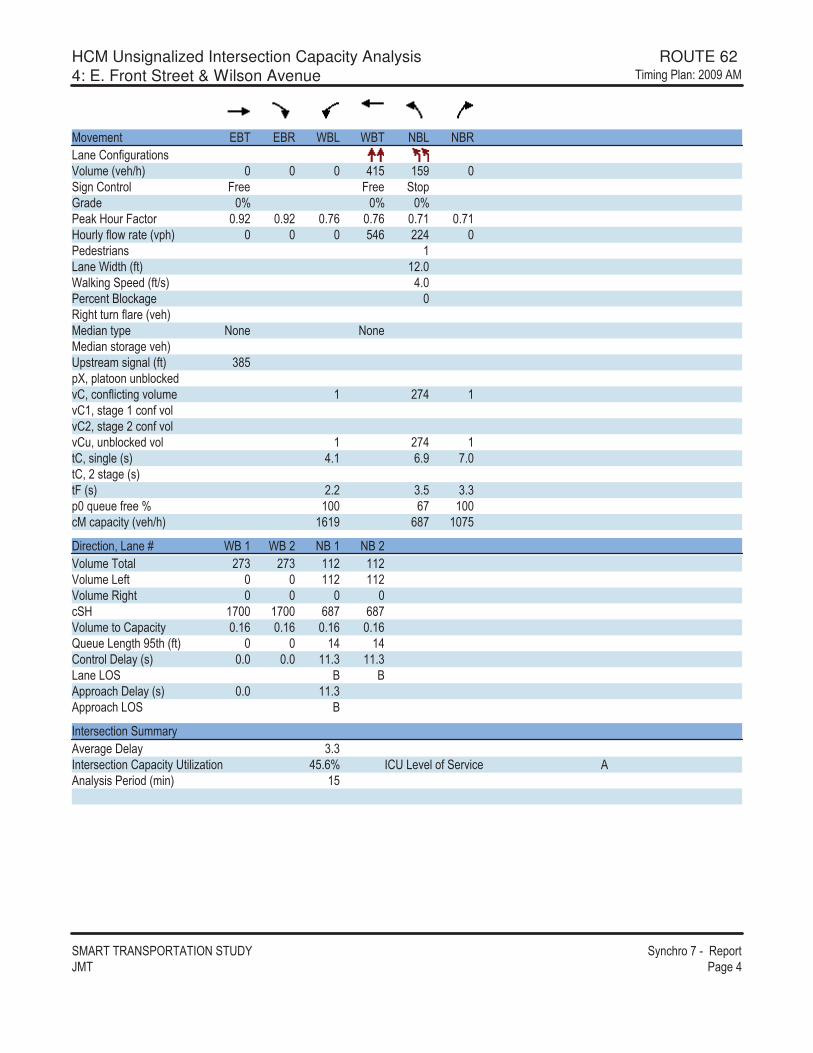
HCM Unsignalized Intersection Capacity Analysis ROUTE 62 4: E. Front Street & Wilson Avenue ������������ ����
�������������������������� �������������� !��"#�� �� �2
��% � �" &'� &'� )'( )'� �'( �'�(� �*��+��,�"���-.�,� �/% �>�0 2$3 $3� �����*��"�� 7� 7� �"�!9�6 : : :� ?�@�,��7�"�� ;�� ;�� ;�5 ;�5 ;�$ ;�$@�,���+�8��" �/%!�0 325 ��2 � 6 -"���- $(� �)�6"��/+"0 $�; )?�����! 6�/+">-0 2; � �� �"�'��?� ����"�",���+� �/% �0� 6���"�! ��� ��� � 6���-"��� �% �0�!-"� ��-����/+"0 143!D=�!"����,�<��? 6%*=����+��"����%�,� $ ��2 $%*$=�-"� �$����+�%�%*�=�-"� ������+�%�%*,=�,�<��? 6�%� $ ��2 $"*=�-��� �/-0 2;$ 5;� �; "*=���-"� �/-0"7�/-0 �;� 1;3 1;1! �E, , �+� �: $ 5� $ ����!��"��/% �>�0 $5$� 54� $ �3
��� �"���=�(� �B )'�$ )'�� �'�$ �'��.�,� ���" ��1 ��1 $$� $$�.�,� �( +" $$� $$�.�,� �����" ��@ $� $� 54� 54�.�,� �"��*!��"� ;$5 ;$5 ;$5 ;$5F, , �( ��"���3"��/+"0 $2 $2*��"���� ��/-0 ; ; $$;1 $$;1(� �(�� ' '�!!������ ��/-0 ; $$;1�!!�����(�� '
��" �- �"�����,�����% �� �� �� 1;1��" �- �"����*!��"���"��C"���� 23;5: �*��( % ��+�� �%�� � ����-�-�� ���6�/���0 $3
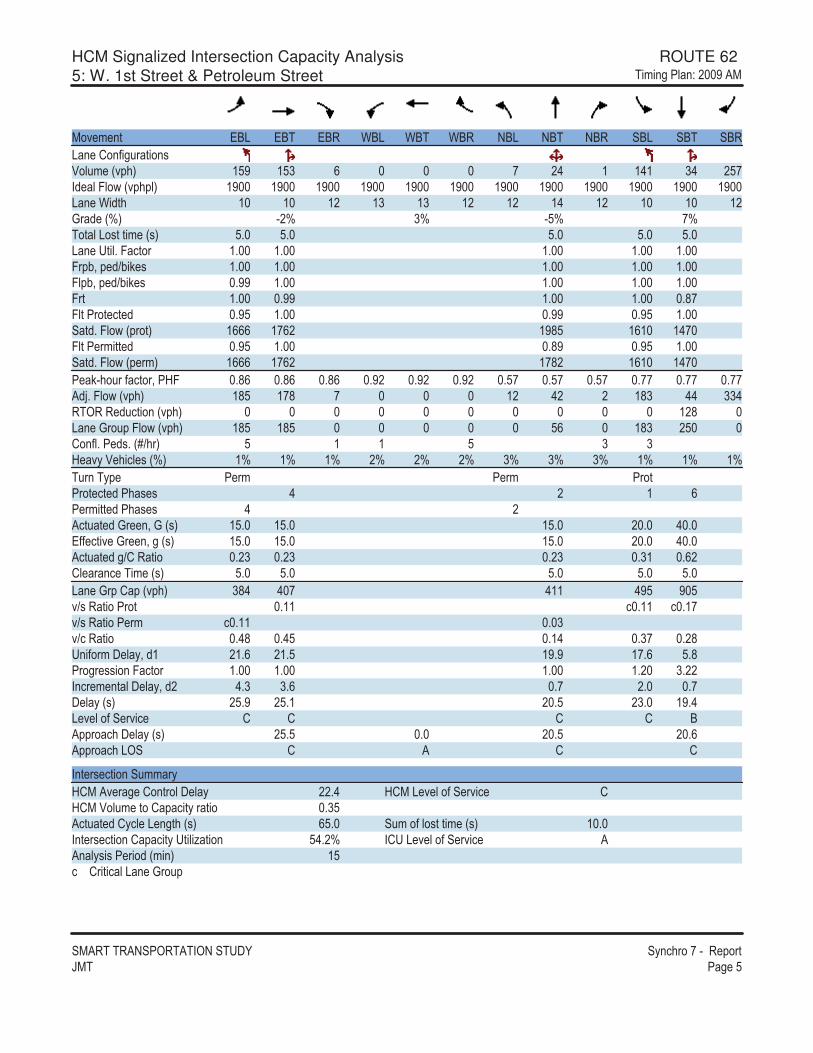
HCM Signalized Intersection Capacity Analysis ROUTE 62 5: W. 1st Street & Petroleum Street ������������ ����
�������������������������� �������������� !��"#�� �� �3
��% � �" &'( &'� &'� )'( )'� )'� �'( �'� �'� �'( �'� �'�(� �*��+��,�"���-.�,� �/%!�0 $3� $31 5 � �2 $ $2$ 12 �3��6 �7�8�/%!�!0 $� $� $� $� $� $� $� $� $� $� $� $� (� �)�6"�� $ $ $� $1 $1 $� $� $2 $� $ $ $�9�6 �/:0 ��: 1: �3: �:��"�(�-"�"�� �/-0 3; 3; 3; 3; 3; (� ��"�;�7�"�� $; $; $; $; $; 7�!<=�! 6><�? - $; $; $; $; $; 7!<=�! 6><�? - ;�� $; $; $; $; 7�" $; ;�� $; $; ;4�7"����" �" 6 ;�3 $; ;�� ;�3 $; �"6;�7�8�/!��"0 $555 $�5� $�43 $5$ $2� 7"�� ���"" 6 ;�3 $; ;4� ;�3 $; �"6;�7�8�/! ��0 $555 $�5� $�4� $5$ $2� � ?���,��+�"��=��@7 ;45 ;45 ;45 ;�� ;�� ;�� ;3� ;3� ;3� ;�� ;�� ;���6A;�7�8�/%!�0 $43 $�4 � $� 2� � $41 22 112������ 6,�"����/%!�0 $�4 (� �9��,!�7�8�/%!�0 $43 $43 35 $41 �3 *��+;�� 6-;�/B>��0 3 $ $ 3 1 1@ %��. ��� -�/:0 $: $: $: �: �: �: 1: 1: 1: $: $: $:�,�����! � �� � �� ���"���" �" 6���- - 2 � $ 5� ���"" 6���- - 2 ���"," 6�9� �=�9�/-0 $3; $3; $3; � ; 2 ; &++ �"�% �9� �=���/-0 $3; $3; $3; � ; 2 ; ��"," 6��>*��"�� ;�1 ;�1 ;�1 ;1$ ;5�* ��� ���� �/-0 3; 3; 3; 3; 3; (� �9�!�*!�/%!�0 142 2 � 2$$ 2�3 � 3%>-��"������" ;$$ � ;$$ � ;$�%>-��"���� �� � ;$$ ; 1%>���"�� ;24 ;23 ;$2 ;1� ;�4���+����� �=�6$ �$;5 �$;3 $�;� $�;5 3;4����� --����7�"�� $; $; $; $;� 1;������ � �"�� �=�6� 2;1 1;5 ;� �; ;�� ��/-0 �3;� �3;$ � ;3 �1; $�;2( % ��+�� �%�� * * * * '�!!������ ��/-0 �3;3 ; � ;3 � ;5�!!�����(�� * � * *
��" �- �"�����,����@*���% �� �*��"���� � ��;2 @*��( % ��+�� �%�� *@*��.�,� �"��*!��"���"�� ;13��"," 6�*�� �( ��"��/-0� 53; �,���+��-"�"�� �/-0 $ ; ��" �- �"����*!��"���"��C"��� 32;�: �*��( % ��+�� �%�� ����-�-�� ���6�/���0 $3�����*��"���(� �9��,!
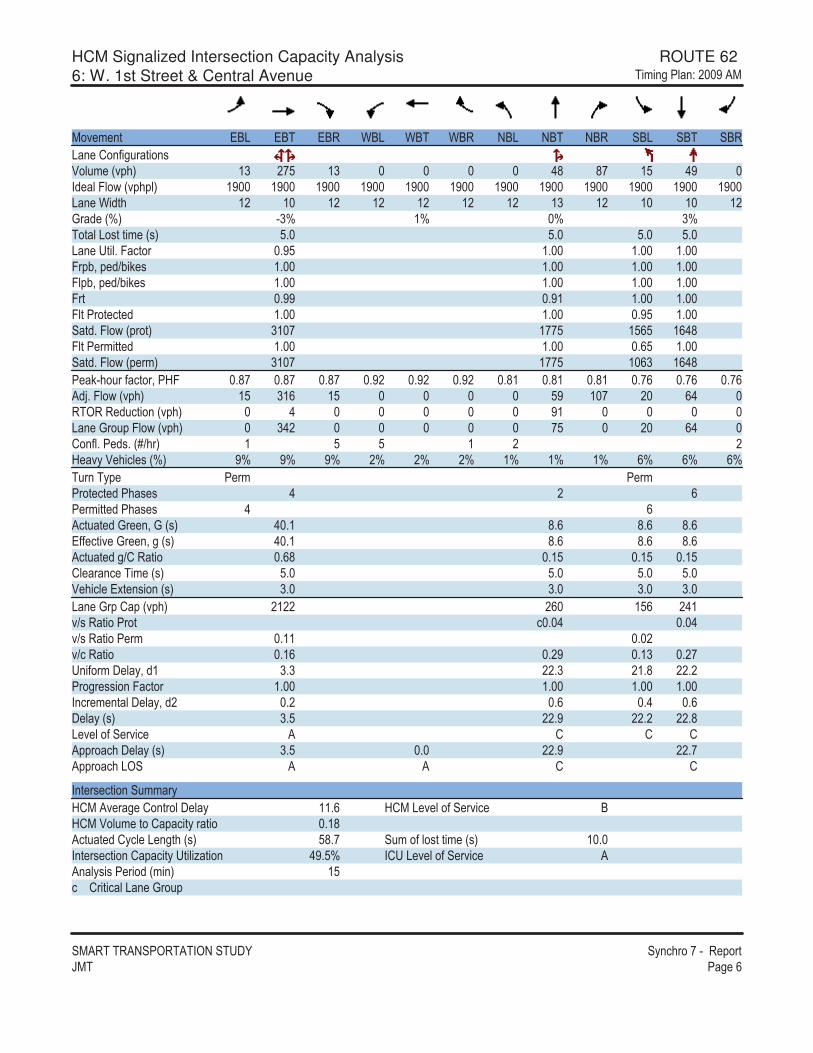
HCM Signalized Intersection Capacity Analysis ROUTE 62 6: W. 1st Street & Central Avenue ������������ ����
�������������������������� �������������� !��"#�� �� �5
��% � �" &'( &'� &'� )'( )'� )'� �'( �'� �'� �'( �'� �'�(� �*��+��,�"���-.�,� �/%!�0 $1 ��3 $1 24 4� $3 2� �6 �7�8�/%!�!0 $� $� $� $� $� $� $� $� $� $� $� $� (� �)�6"�� $� $ $� $� $� $� $� $1 $� $ $ $�9�6 �/:0 �1: $: : 1:��"�(�-"�"�� �/-0 3; 3; 3; 3; (� ��"�;�7�"�� ;�3 $; $; $; 7�!<=�! 6><�? - $; $; $; $; 7!<=�! 6><�? - $; $; $; $; 7�" ;�� ;�$ $; $; 7"����" �" 6 $; $; ;�3 $; �"6;�7�8�/!��"0 1$ � $��3 $353 $5247"�� ���"" 6 $; $; ;53 $; �"6;�7�8�/! ��0 1$ � $��3 $ 51 $524� ?���,��+�"��=��@7 ;4� ;4� ;4� ;�� ;�� ;�� ;4$ ;4$ ;4$ ;�5 ;�5 ;�5�6A;�7�8�/%!�0 $3 1$5 $3 3� $ � � 52 ������ 6,�"����/%!�0 2 �$ (� �9��,!�7�8�/%!�0 12� �3 � 52 *��+;�� 6-;�/B>��0 $ 3 3 $ � �@ %��. ��� -�/:0 �: �: �: �: �: �: $: $: $: 5: 5: 5:�,�����! � �� � �����" �" 6���- - 2 � 5� ���"" 6���- - 2 5��"," 6�9� �=�9�/-0 2 ;$ 4;5 4;5 4;5&++ �"�% �9� �=���/-0 2 ;$ 4;5 4;5 4;5��"," 6��>*��"�� ;54 ;$3 ;$3 ;$3* ��� ���� �/-0 3; 3; 3; 3; . ��� �&G" �-����/-0 1; 1; 1; 1; (� �9�!�*!�/%!�0 �$�� �5 $35 �2$%>-��"������" � ; 2 ; 2%>-��"���� �� ;$$ ; �%>���"�� ;$5 ;�� ;$1 ;�����+����� �=�6$ 1;1 ��;1 �$;4 ��;������ --����7�"�� $; $; $; $; ���� � �"�� �=�6� ;� ;5 ;2 ;5� ��/-0 1;3 ��;� ��;� ��;4( % ��+�� �%�� � * * *�!!������ ��/-0 1;3 ; ��;� ��;��!!�����(�� � � * *
��" �- �"�����,����@*���% �� �*��"���� � $$;5 @*��( % ��+�� �%�� '@*��.�,� �"��*!��"���"�� ;$4��"," 6�*�� �( ��"��/-0� 34;� �,���+��-"�"�� �/-0 $ ; ��" �- �"����*!��"���"��C"��� 2�;3: �*��( % ��+�� �%�� ����-�-�� ���6�/���0 $3�����*��"���(� �9��,!
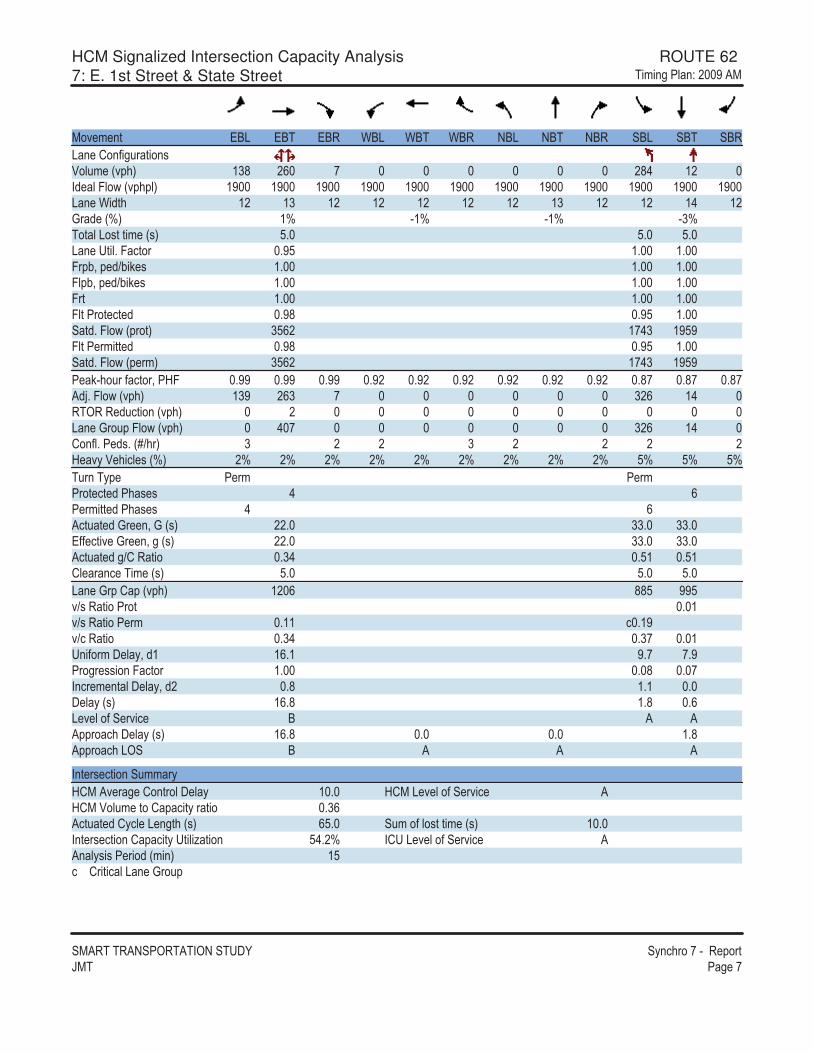
HCM Signalized Intersection Capacity Analysis ROUTE 62 7: E. 1st Street & State Street ������������ ����
�������������������������� �������������� !��"#�� �� ��
��% � �" &'( &'� &'� )'( )'� )'� �'( �'� �'� �'( �'� �'�(� �*��+��,�"���-.�,� �/%!�0 $14 �5 � �42 $� �6 �7�8�/%!�!0 $� $� $� $� $� $� $� $� $� $� $� $� (� �)�6"�� $� $1 $� $� $� $� $� $1 $� $� $2 $�9�6 �/:0 $: �$: �$: �1:��"�(�-"�"�� �/-0 3; 3; 3; (� ��"�;�7�"�� ;�3 $; $; 7�!<=�! 6><�? - $; $; $; 7!<=�! 6><�? - $; $; $; 7�" $; $; $; 7"����" �" 6 ;�4 ;�3 $; �"6;�7�8�/!��"0 135� $�21 $�3�7"�� ���"" 6 ;�4 ;�3 $; �"6;�7�8�/! ��0 135� $�21 $�3�� ?���,��+�"��=��@7 ;�� ;�� ;�� ;�� ;�� ;�� ;�� ;�� ;�� ;4� ;4� ;4��6A;�7�8�/%!�0 $1� �51 � 1�5 $2 ������ 6,�"����/%!�0 � (� �9��,!�7�8�/%!�0 2 � 1�5 $2 *��+;�� 6-;�/B>��0 1 � � 1 � � � �@ %��. ��� -�/:0 �: �: �: �: �: �: �: �: �: 3: 3: 3:�,�����! � �� � �����" �" 6���- - 2 5� ���"" 6���- - 2 5��"," 6�9� �=�9�/-0 ��; 11; 11; &++ �"�% �9� �=���/-0 ��; 11; 11; ��"," 6��>*��"�� ;12 ;3$ ;3$* ��� ���� �/-0 3; 3; 3; (� �9�!�*!�/%!�0 $� 5 443 ��3%>-��"������" ; $%>-��"���� �� ;$$ � ;$�%>���"�� ;12 ;1� ; $���+����� �=�6$ $5;$ �;� �;������ --����7�"�� $; ; 4 ; ����� � �"�� �=�6� ;4 $;$ ; � ��/-0 $5;4 $;4 ;5( % ��+�� �%�� ' � ��!!������ ��/-0 $5;4 ; ; $;4�!!�����(�� ' � � �
��" �- �"�����,����@*���% �� �*��"���� � $ ; @*��( % ��+�� �%�� �@*��.�,� �"��*!��"���"�� ;15��"," 6�*�� �( ��"��/-0� 53; �,���+��-"�"�� �/-0 $ ; ��" �- �"����*!��"���"��C"��� 32;�: �*��( % ��+�� �%�� ����-�-�� ���6�/���0 $3�����*��"���(� �9��,!

HCM Unsignalized Intersection Capacity Analysis ROUTE 62 8: E. 1st Street & Wilson Avenue ������������ ����
�������������������������� �������������� !��"#�� �� �4
��% � �" &'( &'� &'� )'( )'� )'� �'( �'� �'� �'( �'� �'�(� �*��+��,�"���-.�,� �/% �>�0 $� 1�2 $3 $2� � �����*��"�� 7� 7� �"�! �"�!9�6 : : : :� ?�@�,��7�"�� ;�5 ;�5 ;�5 ;�� ;�� ;�� ;�� ;�� ;�� ;�� ;�� ;��@�,���+�8��" �/%!�0 $� 1� $35 $5 � � 6 -"���- $ $ �(� �)�6"��/+"0 $�; ; $�; )?�����! 6�/+">-0 2; 2; 2; � �� �"�'��?� ����"�",���+� �/% �0� 6���"�! ��� ��� � 6���-"��� �% �0�!-"� ��-����/+"0 13$!D=�!"����,�<��? 6 ;�� ;�� ;�� ;�� ;�� ;��%*=����+��"����%�,� 324 2$4 2$� 1�1 2�4 3�1 $%*$=�-"� �$����+�%�%*�=�-"� ������+�%�%*,=�,�<��? 6�%� 3$� 14� 14$ 135 253 32� $"*=�-��� �/-0 2;$ 2;$ �;$ 5;3 5;� �;$ 5;3 5;�"*=���-"� �/-0"7�/-0 �;� �;� 1;3 2; 1;1 1;3 2; 1;1! �E, , �+� �: �� $ $ � $ $ $ $ ����!��"��/% �>�0 $5$� $ $2 33� 3�� 553 1�1 2�� $ 41
��� �"���=�(� �B &'�$ &'�� &'�1 �'�$ �'��.�,� ���" $� 1� $35 $ � 33.�,� �( +" $� .�,� �����" $35 ���@ $5$� $� $� 3�� 311.�,� �"��*!��"� ; $ ;�1 ; � ;� ;$ F, , �( ��"���3"��/+"0 $ $� �*��"���� ��/-0 �;� ; ; $1;3 $�;3(� �(�� � ' '�!!������ ��/-0 ;� $1;��!!�����(�� '
��" �- �"�����,�����% �� �� �� 1;$��" �- �"����*!��"���"��C"���� 2 ;1: �*��( % ��+�� �%�� � ����-�-�� ���6�/���0 $3
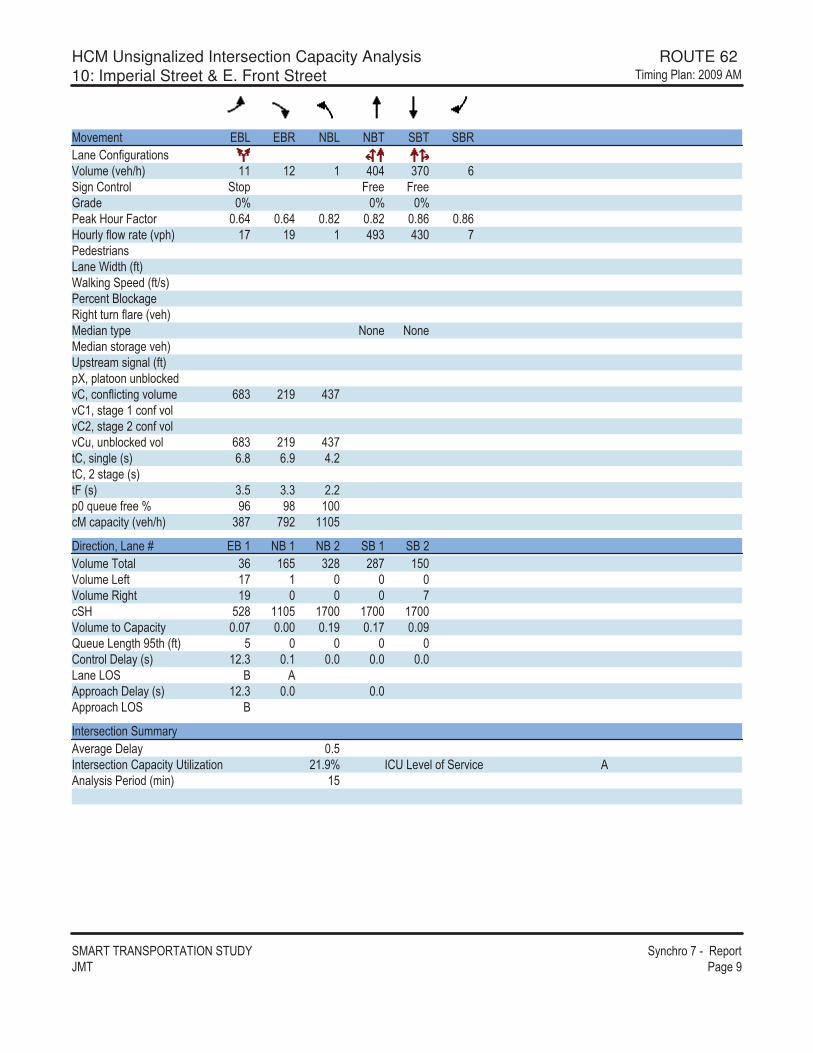
HCM Unsignalized Intersection Capacity Analysis ROUTE 62 10: Imperial Street & E. Front Street ������������ ����
�������������������������� �������������� !��"#�� �� ��
��% � �" &'( &'� �'( �'� �'� �'�(� �*��+��,�"���-.�,� �/% �>�0 $$ $� $ 2 2 1� 5�����*��"�� �"�! 7� 7� 9�6 : : :� ?�@�,��7�"�� ;52 ;52 ;4� ;4� ;45 ;45@�,���+�8��" �/%!�0 $� $� $ 2�1 21 �� 6 -"���-(� �)�6"��/+"0)?�����! 6�/+">-0� �� �"�'��?� ����"�",���+� �/% �0� 6���"�! ��� ��� � 6���-"��� �% �0�!-"� ��-����/+"0!D=�!"����,�<��? 6%*=����+��"����%�,� 541 �$� 21�%*$=�-"� �$����+�%�%*�=�-"� ������+�%�%*,=�,�<��? 6�%� 541 �$� 21�"*=�-��� �/-0 5;4 5;� 2;�"*=���-"� �/-0"7�/-0 1;3 1;1 �;�! �E, , �+� �: �5 �4 $ ����!��"��/% �>�0 14� ��� $$ 3
��� �"���=�(� �B &'�$ �'�$ �'�� �'�$ �'��.�,� ���" 15 $53 1�4 �4� $3 .�,� �( +" $� $ .�,� �����" $� ���@ 3�4 $$ 3 $� $� $� .�,� �"��*!��"� ; � ; ;$� ;$� ; �F, , �( ��"���3"��/+"0 3 *��"���� ��/-0 $�;1 ;$ ; ; ; (� �(�� ' ��!!������ ��/-0 $�;1 ; ; �!!�����(�� '
��" �- �"�����,�����% �� �� �� ;3��" �- �"����*!��"���"��C"���� �$;�: �*��( % ��+�� �%�� � ����-�-�� ���6�/���0 $3

HCM Unsignalized Intersection Capacity Analysis ROUTE 62 11: E.2nd Street & E. Front Street ������������ ����
�������������������������� �������������� !��"#�� �� �$
��% � �" &'( &'� �'( �'� �'� �'�(� �*��+��,�"���-.�,� �/% �>�0 2 24 24 2 $ 14� �����*��"�� �"�! 7� 7� 9�6 �1: 1: �1:� ?�@�,��7�"�� ;�1 ;�1 ;4$ ;4$ ;�� ;��@�,���+�8��" �/%!�0 2 3� 3� 2�3 2$3 � 6 -"���-(� �)�6"��/+"0)?�����! 6�/+">-0� �� �"�'��?� ����"�",���+� �/% �0� 6���"�! ��� ��� � 6���-"��� �% �0�!-"� ��-����/+"0!D=�!"����,�<��? 6%*=����+��"����%�,� $ �� 2$3 2$3%*$=�-"� �$����+�%�%*�=�-"� ������+�%�%*,=�,�<��? 6�%� $ �� 2$3 2$3"*=�-��� �/-0 5;2 5;� 2;$"*=���-"� �/-0"7�/-0 1;3 1;1 �;�! �E, , �+� �: �4 �� �3����!��"��/% �>�0 �21 51$ $$14
��� �"���=�(� �B &'�$ &'�� �'�$ �'�� �'�$ �'��.�,� ���" 2 3� 3� 2�3 2$3 .�,� �( +" 2 3� .�,� �����" 3� ��@ �21 51$ $$14 $� $� $� .�,� �"��*!��"� ; � ; 4 ; 3 ;�� ;�2 ; F, , �( ��"���3"��/+"0 $ � 2 *��"���� ��/-0 � ;$ $$;� 4;1 ; ; ; (� �(�� * ' ��!!������ ��/-0 $$;� ;� ; �!!�����(�� '
��" �- �"�����,�����% �� �� �� $;$��" �- �"����*!��"���"��C"���� 15;4: �*��( % ��+�� �%�� � ����-�-�� ���6�/���0 $3
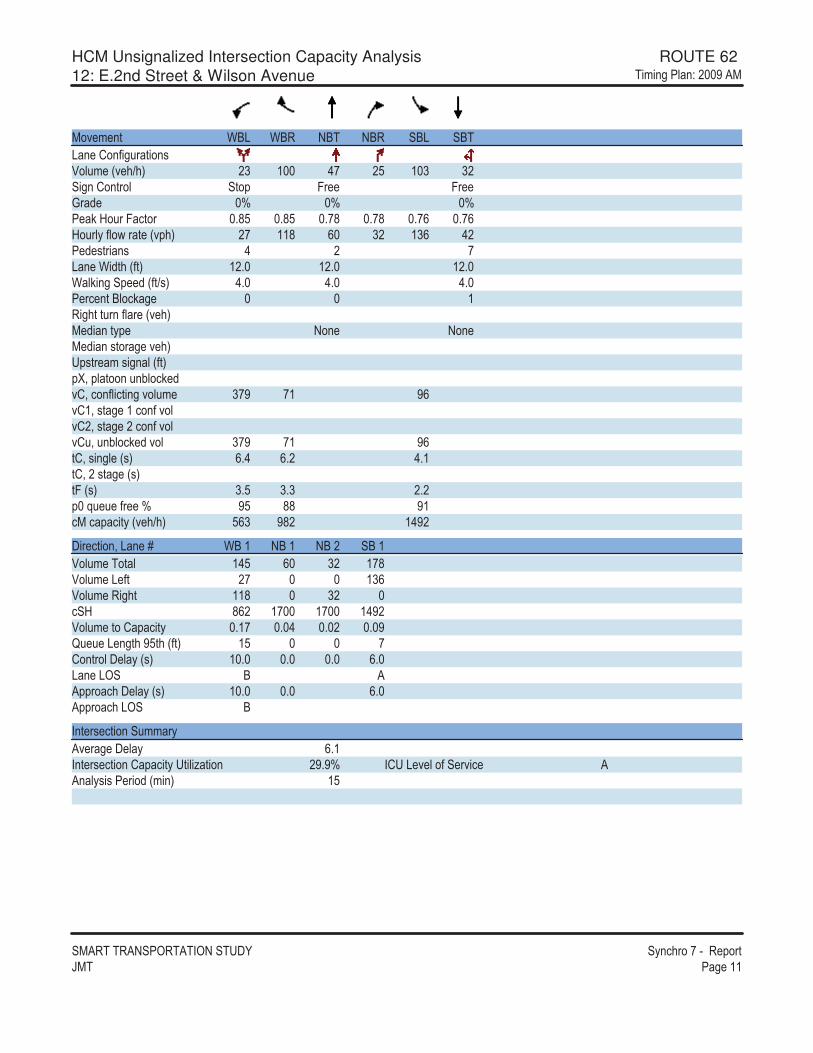
HCM Unsignalized Intersection Capacity Analysis ROUTE 62 12: E.2nd Street & Wilson Avenue ������������ ����
�������������������������� �������������� !��"#�� �� �$$
��% � �" )'( )'� �'� �'� �'( �'�(� �*��+��,�"���-.�,� �/% �>�0 �1 $ 2� �3 $ 1 1������*��"�� �"�! 7� 7� 9�6 : : :� ?�@�,��7�"�� ;43 ;43 ;�4 ;�4 ;�5 ;�5@�,���+�8��" �/%!�0 �� $$4 5 1� $15 2�� 6 -"���- 2 � �(� �)�6"��/+"0 $�; $�; $�; )?�����! 6�/+">-0 2; 2; 2; � �� �"�'��?� $����"�",���+� �/% �0� 6���"�! ��� ��� � 6���-"��� �% �0�!-"� ��-����/+"0!D=�!"����,�<��? 6%*=����+��"����%�,� 1�� �$ �5%*$=�-"� �$����+�%�%*�=�-"� ������+�%�%*,=�,�<��? 6�%� 1�� �$ �5"*=�-��� �/-0 5;2 5;� 2;$"*=���-"� �/-0"7�/-0 1;3 1;1 �;�! �E, , �+� �: �3 44 �$����!��"��/% �>�0 351 �4� $2��
��� �"���=�(� �B )'�$ �'�$ �'�� �'�$.�,� ���" $23 5 1� $�4.�,� �( +" �� $15.�,� �����" $$4 1� ��@ 45� $� $� $2��.�,� �"��*!��"� ;$� ; 2 ; � ; �F, , �( ��"���3"��/+"0 $3 �*��"���� ��/-0 $ ; ; ; 5; (� �(�� ' ��!!������ ��/-0 $ ; ; 5; �!!�����(�� '
��" �- �"�����,�����% �� �� �� 5;$��" �- �"����*!��"���"��C"���� ��;�: �*��( % ��+�� �%�� � ����-�-�� ���6�/���0 $3
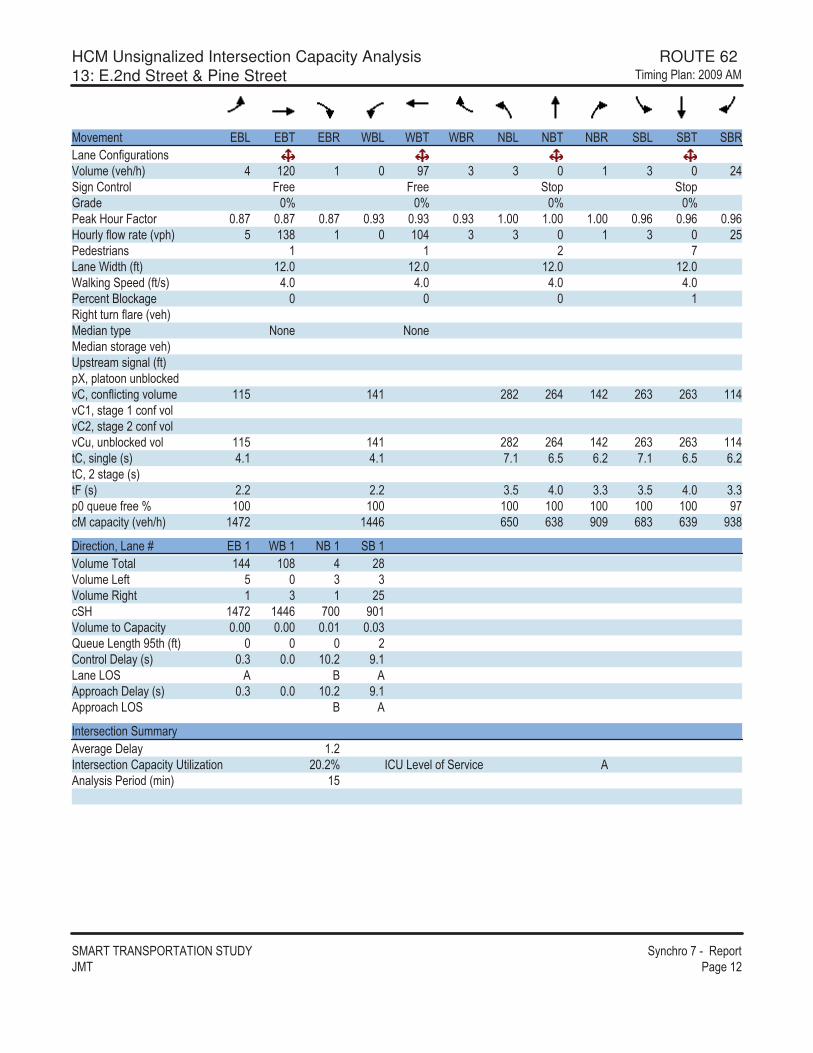
HCM Unsignalized Intersection Capacity Analysis ROUTE 62 13: E.2nd Street & Pine Street ������������ ����
�������������������������� �������������� !��"#�� �� �$�
��% � �" &'( &'� &'� )'( )'� )'� �'( �'� �'� �'( �'� �'�(� �*��+��,�"���-.�,� �/% �>�0 2 $� $ �� 1 1 $ 1 �2�����*��"�� 7� 7� �"�! �"�!9�6 : : : :� ?�@�,��7�"�� ;4� ;4� ;4� ;�1 ;�1 ;�1 $; $; $; ;�5 ;�5 ;�5@�,���+�8��" �/%!�0 3 $14 $ $ 2 1 1 $ 1 �3� 6 -"���- $ $ � �(� �)�6"��/+"0 $�; $�; $�; $�; )?�����! 6�/+">-0 2; 2; 2; 2; � �� �"�'��?� $����"�",���+� �/% �0� 6���"�! ��� ��� � 6���-"��� �% �0�!-"� ��-����/+"0!D=�!"����,�<��? 6%*=����+��"����%�,� $$3 $2$ �4� �52 $2� �51 �51 $$2%*$=�-"� �$����+�%�%*�=�-"� ������+�%�%*,=�,�<��? 6�%� $$3 $2$ �4� �52 $2� �51 �51 $$2"*=�-��� �/-0 2;$ 2;$ �;$ 5;3 5;� �;$ 5;3 5;�"*=���-"� �/-0"7�/-0 �;� �;� 1;3 2; 1;1 1;3 2; 1;1! �E, , �+� �: $ $ $ $ $ $ $ ������!��"��/% �>�0 $2�� $225 53 514 � � 541 51� �14
��� �"���=�(� �B &'�$ )'�$ �'�$ �'�$.�,� ���" $22 $ 4 2 �4.�,� �( +" 3 1 1.�,� �����" $ 1 $ �3��@ $2�� $225 � � $.�,� �"��*!��"� ; ; ; $ ; 1F, , �( ��"���3"��/+"0 �*��"���� ��/-0 ;1 ; $ ;� �;$(� �(�� � ' ��!!������ ��/-0 ;1 ; $ ;� �;$�!!�����(�� ' �
��" �- �"�����,�����% �� �� �� $;���" �- �"����*!��"���"��C"���� � ;�: �*��( % ��+�� �%�� � ����-�-�� ���6�/���0 $3

HCM Unsignalized Intersection Capacity Analysis ROUTE 62 14: Imperial Street & E.2nd Street ������������ ����
�������������������������� �������������� !��"#�� �� �$1
��% � �" &'( &'� &'� )'( )'� )'� �'( �'� �'� �'( �'� �'�(� �*��+��,�"���-.�,� �/% �>�0 3 5 � � 5� � 3 34 $�����*��"�� �"�! �"�! 7� 7� 9�6 : : : :� ?�@�,��7�"�� ;25 ;25 ;25 ;�3 ;�3 ;�3 ;54 ;54 ;54 ;4� ;4� ;4�@�,���+�8��" �/%!�0 $$ $1 2 $� $ $ 1 5 53 $� 6 -"���- $ � 2(� �)�6"��/+"0 $�; $�; $�; )?�����! 6�/+">-0 2; 2; 2; � �� �"�'��?� ����"�",���+� �/% �0� 6���"�! ��� ��� � 6���-"��� �% �0�!-"� ��-����/+"0!D=�!"����,�<��? 6%*=����+��"����%�,� $�� $42 5� $�1 $41 $ � 5� $ 5%*$=�-"� �$����+�%�%*�=�-"� ������+�%�%*,=�,�<��? 6�%� $�� $42 5� $�1 $41 $ � 5� $ 5"*=�-��� �/-0 �;$ 5;3 5;� �;$ 5;3 5;� 2;$ 2;$"*=���-"� �/-0"7�/-0 1;3 2; 1;1 1;3 2; 1;1 �;� �;�! �E, , �+� �: �� �4 $ $ $ �� $ $ ����!��"��/% �>�0 �3 � � $ � �3� �$ �23 $31� $2�3
��� �"���=�(� �B &'�$ )'�$ �'�$ �'�$.�,� ���" �4 $� $ 2 ��.�,� �( +" $$ 5.�,� �����" 2 $� 1 $��@ �3� �23 $31� $2�3.�,� �"��*!��"� ; 2 ; $ ; ; F, , �( ��"���3"��/+"0 1 $ *��"���� ��/-0 �;� 4;� ; ;5(� �(�� � � ��!!������ ��/-0 �;� 4;� ; ;5�!!�����(�� � �
��" �- �"�����,�����% �� �� �� �; ��" �- �"����*!��"���"��C"���� $�;$: �*��( % ��+�� �%�� � ����-�-�� ���6�/���0 $3

HCM Unsignalized Intersection Capacity Analysis ROUTE 62 19: E. 1st Street & E. Front Street ������������ ����
�������������������������� �������������� !��"#�� �� �$2
��% � �" &'( &'� )'� )'� �&( �&�(� �*��+��,�"���-.�,� �/% �>�0 1�5 2$3 �����*��"�� 7� 7� �"�!9�6 : : :� ?�@�,��7�"�� ;�� ;�� ;�� ;�� ;�� ;��@�,���+�8��" �/%!�0 2 � 23$ � 6 -"���-(� �)�6"��/+"0)?�����! 6�/+">-0� �� �"�'��?� ����"�",���+� �/% �0� 6���"�! ��� ��� � 6���-"��� �% �0�!-"� ��-����/+"0 5$4!D=�!"����,�<��? 6%*=����+��"����%�,� 23$ � 2 %*$=�-"� �$����+�%�%*�=�-"� ������+�%�%*,=�,�<��? 6�%� 23$ � 2 "*=�-��� �/-0 2;$ 5;4 5;�"*=���-"� �/-0"7�/-0 �;� 1;3 1;1! �E, , �+� �: $ $ $ ����!��"��/% �>�0 $$ 5 �53 $ 42
��� �"���=�(� �B &'�$ &'�� )'�$ )'��.�,� ���" � 2 � 2 ��5 ��5.�,� �( +" .�,� �����" ��5 ��5��@ $� $� $� $� .�,� �"��*!��"� ;$� ;$� ;$1 ;$1F, , �( ��"���3"��/+"0 *��"���� ��/-0 ; ; ; ; (� �(���!!������ ��/-0 ; ; �!!�����(��
��" �- �"�����,�����% �� �� �� ; ��" �- �"����*!��"���"��C"���� $�;�: �*��( % ��+�� �%�� � ����-�-�� ���6�/���0 $3

HCM Unsignalized Intersection Capacity Analysis ROUTE 62 121: E. 2nd Alley & Wilson Avenue ������������ ����
�������������������������� �������������� !��"#�� �� �$3
��% � �" &'( &'� �'( �'� �'� �'�(� �*��+��,�"���-.�,� �/% �>�0 � 1 $21 $13 3�����*��"�� �"�! 7� 7� 9�6 : : :� ?�@�,��7�"�� ;3 ;3 ;�4 ;�4 ;�5 ;�5@�,���+�8��" �/%!�0 2 2 $41 $�4 �� 6 -"���- � �(� �)�6"��/+"0 $�; $�; )?�����! 6�/+">-0 2; 2; � �� �"�'��?� $����"�",���+� �/% �0� 6���"�! ��� ��� � 6���-"��� �% �0�!-"� ��-����/+"0!D=�!"����,�<��? 6%*=����+��"����%�,� 1�� $41 $42%*$=�-"� �$����+�%�%*�=�-"� ������+�%�%*,=�,�<��? 6�%� 1�� $41 $42"*=�-��� �/-0 5;2 5;� 2;$"*=���-"� �/-0"7�/-0 1;3 1;1 �;�! �E, , �+� �: �� $ $ ����!��"��/% �>�0 5�� 451 $1��
��� �"���=�(� �B &'�$ �'�$ �'�$.�,� ���" 2 $4� $42.�,� �( +" 2 2 .�,� �����" ���@ 5�� $1�� $� .�,� �"��*!��"� ; $ ; ;$$F, , �( ��"���3"��/+"0 *��"���� ��/-0 $ ;4 ;� ; (� �(�� ' ��!!������ ��/-0 $ ;4 ;� ; �!!�����(�� '
��" �- �"�����,�����% �� �� �� ;���" �- �"����*!��"���"��C"���� � ;5: �*��( % ��+�� �%�� � ����-�-�� ���6�/���0 $3
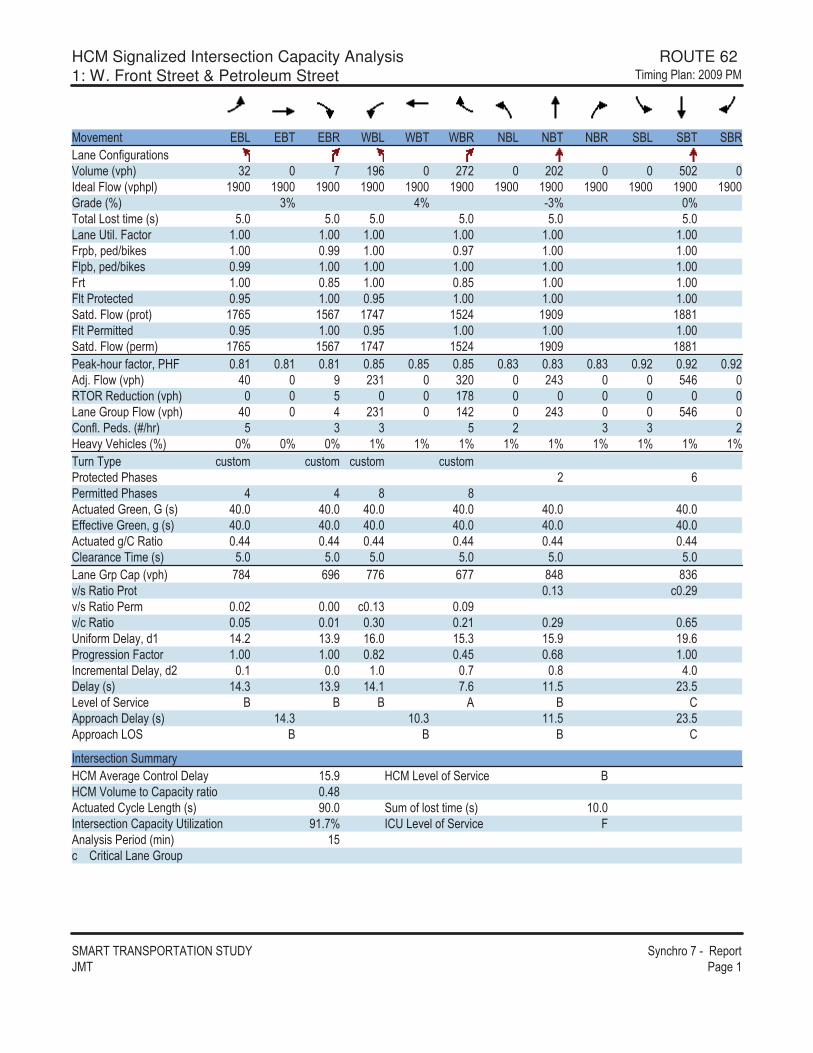
HCM Signalized Intersection Capacity Analysis ROUTE 62 1: W. Front Street & Petroleum Street ������������ ����
�������������������������� �������������� !��"#�� �� �$
��% � �" &'( &'� &'� )'( )'� )'� �'( �'� �'� �'( �'� �'�(� �*��+��,�"���-.�,� �/%!�0 1� � $�5 ��� � � 3 � �6 �7�8�/%!�!0 $� $� $� $� $� $� $� $� $� $� $� $� 9�6 �/:0 1: 2: �1: :��"�(�-"�"�� �/-0 3; 3; 3; 3; 3; 3; (� ��"�;�7�"�� $; $; $; $; $; $; 7�!<=�! 6><�? - $; ;�� $; ;�� $; $; 7!<=�! 6><�? - ;�� $; $; $; $; $; 7�" $; ;43 $; ;43 $; $; 7"����" �" 6 ;�3 $; ;�3 $; $; $; �"6;�7�8�/!��"0 $�53 $35� $�2� $3�2 $� � $44$7"�� ���"" 6 ;�3 $; ;�3 $; $; $; �"6;�7�8�/! ��0 $�53 $35� $�2� $3�2 $� � $44$� ?���,��+�"��=��@7 ;4$ ;4$ ;4$ ;43 ;43 ;43 ;41 ;41 ;41 ;�� ;�� ;���6A;�7�8�/%!�0 2 � �1$ 1� �21 325 ������ 6,�"����/%!�0 3 $�4 (� �9��,!�7�8�/%!�0 2 2 �1$ $2� �21 325 *��+;�� 6-;�/B>��0 3 1 1 3 � 1 1 �@ %��. ��� -�/:0 : : : $: $: $: $: $: $: $: $: $:�,�����! �,-"�� �,-"�� �,-"�� �,-"�����" �" 6���- - � 5� ���"" 6���- - 2 2 4 4��"," 6�9� �=�9�/-0 2 ; 2 ; 2 ; 2 ; 2 ; 2 ; &++ �"�% �9� �=���/-0 2 ; 2 ; 2 ; 2 ; 2 ; 2 ; ��"," 6��>*��"�� ;22 ;22 ;22 ;22 ;22 ;22* ��� ���� �/-0 3; 3; 3; 3; 3; 3; (� �9�!�*!�/%!�0 �42 5�5 ��5 5�� 424 415%>-��"������" ;$1 � ;��%>-��"���� �� ; � ; � ;$1 ; �%>���"�� ; 3 ; $ ;1 ;�$ ;�� ;53���+����� �=�6$ $2;� $1;� $5; $3;1 $3;� $�;5����� --����7�"�� $; $; ;4� ;23 ;54 $; ���� � �"�� �=�6� ;$ ; $; ;� ;4 2; � ��/-0 $2;1 $1;� $2;$ �;5 $$;3 �1;3( % ��+�� �%�� ' ' ' � ' *�!!������ ��/-0 $2;1 $ ;1 $$;3 �1;3�!!�����(�� ' ' ' *
��" �- �"�����,����@*���% �� �*��"���� � $3;� @*��( % ��+�� �%�� '@*��.�,� �"��*!��"���"�� ;24��"," 6�*�� �( ��"��/-0� � ; �,���+��-"�"�� �/-0 $ ; ��" �- �"����*!��"���"��C"��� �$;�: �*��( % ��+�� �%�� 7���-�-�� ���6�/���0 $3�����*��"���(� �9��,!
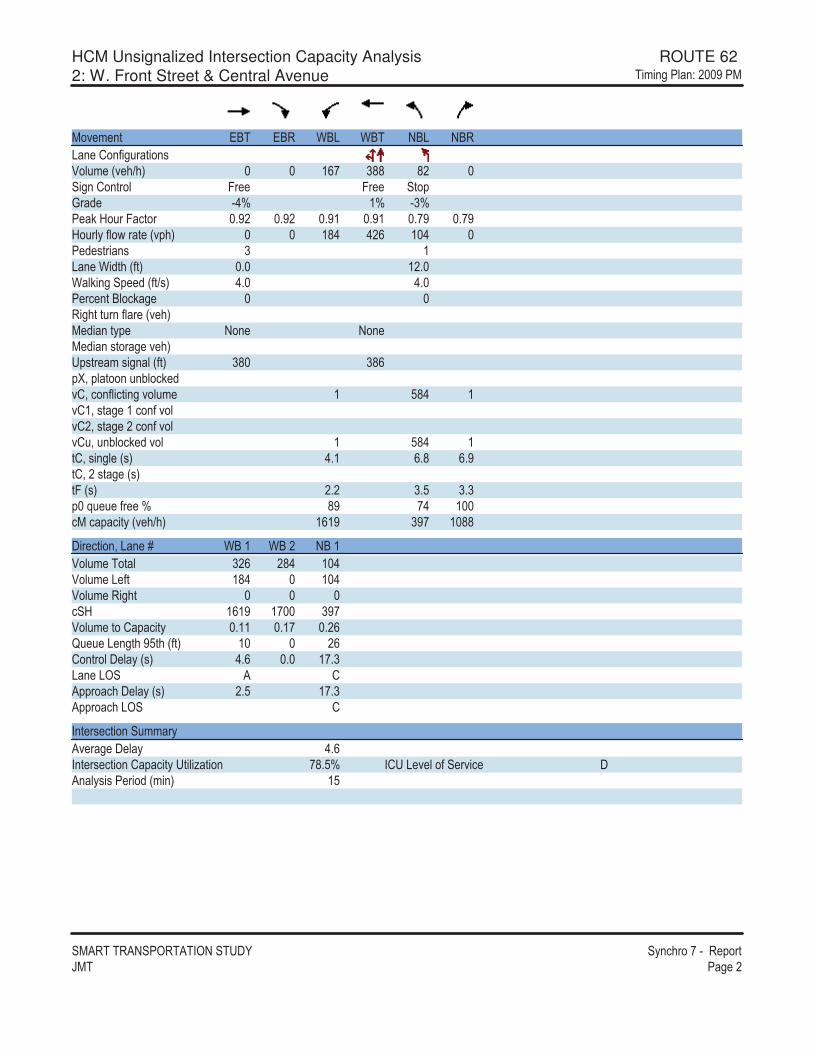
HCM Unsignalized Intersection Capacity Analysis ROUTE 62 2: W. Front Street & Central Avenue ������������ ����
�������������������������� �������������� !��"#�� �� ��
��% � �" &'� &'� )'( )'� �'( �'�(� �*��+��,�"���-.�,� �/% �>�0 $5� 144 4� �����*��"�� 7� 7� �"�!9�6 �2: $: �1:� ?�@�,��7�"�� ;�� ;�� ;�$ ;�$ ;�� ;��@�,���+�8��" �/%!�0 $42 2�5 $ 2 � 6 -"���- 1 $(� �)�6"��/+"0 ; $�; )?�����! 6�/+">-0 2; 2; � �� �"�'��?� ����"�",���+� �/% �0� 6���"�! ��� ��� � 6���-"��� �% �0�!-"� ��-����/+"0 14 145!D=�!"����,�<��? 6%*=����+��"����%�,� $ 342 $%*$=�-"� �$����+�%�%*�=�-"� ������+�%�%*,=�,�<��? 6�%� $ 342 $"*=�-��� �/-0 2;$ 5;4 5;�"*=���-"� �/-0"7�/-0 �;� 1;3 1;1! �E, , �+� �: 4� �2 $ ����!��"��/% �>�0 $5$� 1�� $ 44
��� �"���=�(� �B )'�$ )'�� �'�$.�,� ���" 1�5 �42 $ 2.�,� �( +" $42 $ 2.�,� �����" ��@ $5$� $� 1��.�,� �"��*!��"� ;$$ ;$� ;�5F, , �( ��"���3"��/+"0 $ �5*��"���� ��/-0 2;5 ; $�;1(� �(�� � *�!!������ ��/-0 �;3 $�;1�!!�����(�� *
��" �- �"�����,�����% �� �� �� 2;5��" �- �"����*!��"���"��C"���� �4;3: �*��( % ��+�� �%�� � ����-�-�� ���6�/���0 $3
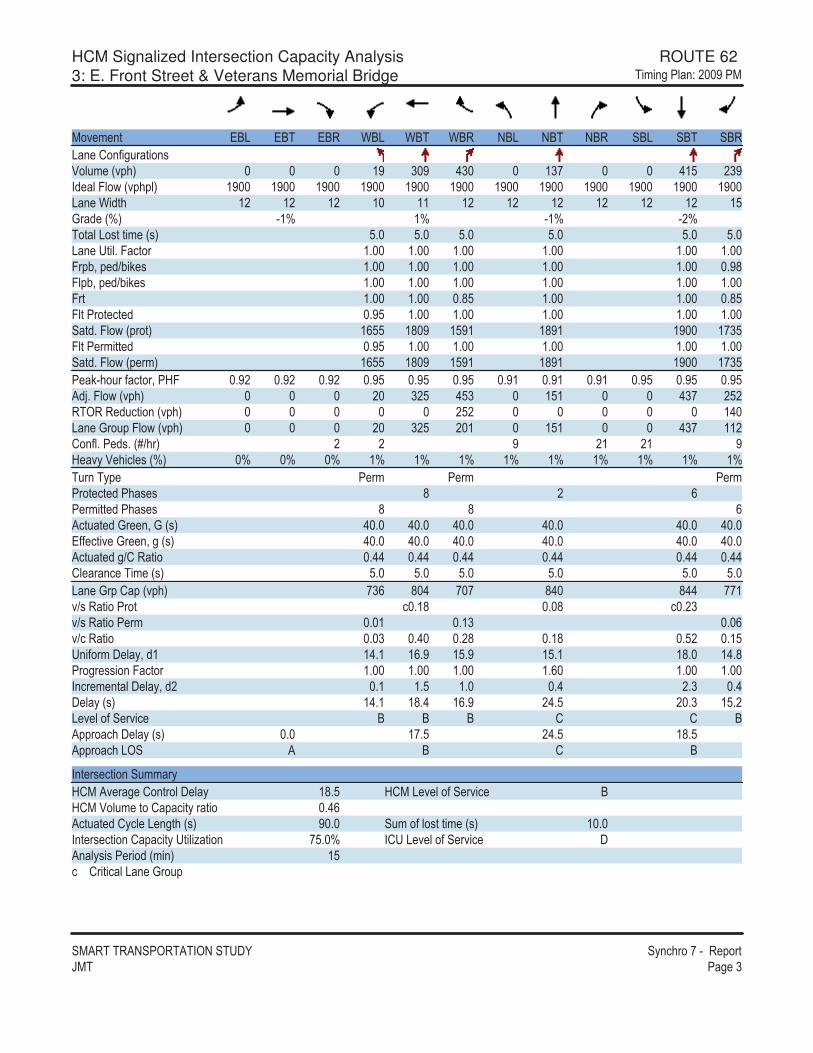
HCM Signalized Intersection Capacity Analysis ROUTE 62 3: E. Front Street & Veterans Memorial Bridge ������������ ����
�������������������������� �������������� !��"#�� �� �1
��% � �" &'( &'� &'� )'( )'� )'� �'( �'� �'� �'( �'� �'�(� �*��+��,�"���-.�,� �/%!�0 $� 1 � 21 $1� 2$3 �1��6 �7�8�/%!�!0 $� $� $� $� $� $� $� $� $� $� $� $� (� �)�6"�� $� $� $� $ $$ $� $� $� $� $� $� $39�6 �/:0 �$: $: �$: ��:��"�(�-"�"�� �/-0 3; 3; 3; 3; 3; 3; (� ��"�;�7�"�� $; $; $; $; $; $; 7�!<=�! 6><�? - $; $; $; $; $; ;�47!<=�! 6><�? - $; $; $; $; $; $; 7�" $; $; ;43 $; $; ;437"����" �" 6 ;�3 $; $; $; $; $; �"6;�7�8�/!��"0 $533 $4 � $3�$ $4�$ $� $�137"�� ���"" 6 ;�3 $; $; $; $; $; �"6;�7�8�/! ��0 $533 $4 � $3�$ $4�$ $� $�13� ?���,��+�"��=��@7 ;�� ;�� ;�� ;�3 ;�3 ;�3 ;�$ ;�$ ;�$ ;�3 ;�3 ;�3�6A;�7�8�/%!�0 � 1�3 231 $3$ 21� �3������� 6,�"����/%!�0 �3� $2 (� �9��,!�7�8�/%!�0 � 1�3 � $ $3$ 21� $$�*��+;�� 6-;�/B>��0 � � � �$ �$ �@ %��. ��� -�/:0 : : : $: $: $: $: $: $: $: $: $:�,�����! � �� � �� � �����" �" 6���- - 4 � 5� ���"" 6���- - 4 4 5��"," 6�9� �=�9�/-0 2 ; 2 ; 2 ; 2 ; 2 ; 2 ; &++ �"�% �9� �=���/-0 2 ; 2 ; 2 ; 2 ; 2 ; 2 ; ��"," 6��>*��"�� ;22 ;22 ;22 ;22 ;22 ;22* ��� ���� �/-0 3; 3; 3; 3; 3; 3; (� �9�!�*!�/%!�0 �15 4 2 � � 42 422 ��$%>-��"������" � ;$4 ; 4 � ;�1%>-��"���� �� ; $ ;$1 ; 5%>���"�� ; 1 ;2 ;�4 ;$4 ;3� ;$3���+����� �=�6$ $2;$ $5;� $3;� $3;$ $4; $2;4����� --����7�"�� $; $; $; $;5 $; $; ���� � �"�� �=�6� ;$ $;3 $; ;2 �;1 ;2� ��/-0 $2;$ $4;2 $5;� �2;3 � ;1 $3;�( % ��+�� �%�� ' ' ' * * '�!!������ ��/-0 ; $�;3 �2;3 $4;3�!!�����(�� � ' * '
��" �- �"�����,����@*���% �� �*��"���� � $4;3 @*��( % ��+�� �%�� '@*��.�,� �"��*!��"���"�� ;25��"," 6�*�� �( ��"��/-0� � ; �,���+��-"�"�� �/-0 $ ; ��" �- �"����*!��"���"��C"��� �3; : �*��( % ��+�� �%�� ����-�-�� ���6�/���0 $3�����*��"���(� �9��,!

HCM Unsignalized Intersection Capacity Analysis ROUTE 62 4: E. Front Street & Wilson Avenue ������������ ����
�������������������������� �������������� !��"#�� �� �2
��% � �" &'� &'� )'( )'� �'( �'�(� �*��+��,�"���-.�,� �/% �>�0 251 �43 �����*��"�� 7� 7� �"�!9�6 : : :� ?�@�,��7�"�� ;�� ;�� ;� ;� ;42 ;42@�,���+�8��" �/%!�0 3$2 11� � 6 -"���-(� �)�6"��/+"0)?�����! 6�/+">-0� �� �"�'��?� ����"�",���+� �/% �0� 6���"�! ��� ��� � 6���-"��� �% �0�!-"� ��-����/+"0 143!D=�!"����,�<��? 6%*=����+��"����%�,� �3� %*$=�-"� �$����+�%�%*�=�-"� ������+�%�%*,=�,�<��? 6�%� �3� "*=�-��� �/-0 2;$ 5;4 5;�"*=���-"� �/-0"7�/-0 �;� 1;3 1;1! �E, , �+� �: $ 3� $ ����!��"��/% �>�0 $5�� �$� $ 44
��� �"���=�(� �B )'�$ )'�� �'�$ �'��.�,� ���" �3� �3� $� $� .�,� �( +" $� $� .�,� �����" ��@ $� $� �$� �$�.�,� �"��*!��"� ;$3 ;$3 ;�2 ;�2F, , �( ��"���3"��/+"0 �1 �1*��"���� ��/-0 ; ; $$;5 $$;5(� �(�� ' '�!!������ ��/-0 ; $$;5�!!�����(�� '
��" �- �"�����,�����% �� �� �� 2;5��" �- �"����*!��"���"��C"���� 35;2: �*��( % ��+�� �%�� � '���-�-�� ���6�/���0 $3
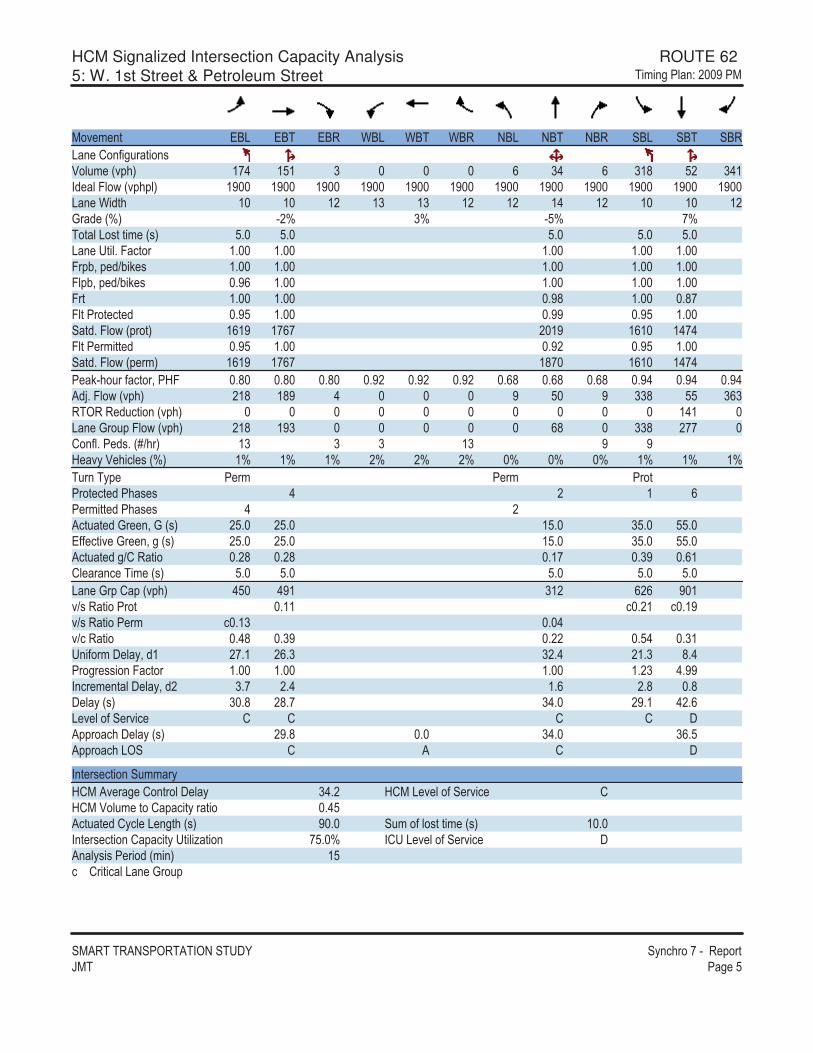
HCM Signalized Intersection Capacity Analysis ROUTE 62 5: W. 1st Street & Petroleum Street ������������ ����
�������������������������� �������������� !��"#�� �� �3
��% � �" &'( &'� &'� )'( )'� )'� �'( �'� �'� �'( �'� �'�(� �*��+��,�"���-.�,� �/%!�0 $�2 $3$ 1 5 12 5 1$4 3� 12$�6 �7�8�/%!�!0 $� $� $� $� $� $� $� $� $� $� $� $� (� �)�6"�� $ $ $� $1 $1 $� $� $2 $� $ $ $�9�6 �/:0 ��: 1: �3: �:��"�(�-"�"�� �/-0 3; 3; 3; 3; 3; (� ��"�;�7�"�� $; $; $; $; $; 7�!<=�! 6><�? - $; $; $; $; $; 7!<=�! 6><�? - ;�5 $; $; $; $; 7�" $; $; ;�4 $; ;4�7"����" �" 6 ;�3 $; ;�� ;�3 $; �"6;�7�8�/!��"0 $5$� $�5� � $� $5$ $2�27"�� ���"" 6 ;�3 $; ;�� ;�3 $; �"6;�7�8�/! ��0 $5$� $�5� $4� $5$ $2�2� ?���,��+�"��=��@7 ;4 ;4 ;4 ;�� ;�� ;�� ;54 ;54 ;54 ;�2 ;�2 ;�2�6A;�7�8�/%!�0 �$4 $4� 2 � 3 � 114 33 151������ 6,�"����/%!�0 $2$ (� �9��,!�7�8�/%!�0 �$4 $�1 54 114 ��� *��+;�� 6-;�/B>��0 $1 1 1 $1 � �@ %��. ��� -�/:0 $: $: $: �: �: �: : : : $: $: $:�,�����! � �� � �� ���"���" �" 6���- - 2 � $ 5� ���"" 6���- - 2 ���"," 6�9� �=�9�/-0 �3; �3; $3; 13; 33; &++ �"�% �9� �=���/-0 �3; �3; $3; 13; 33; ��"," 6��>*��"�� ;�4 ;�4 ;$� ;1� ;5$* ��� ���� �/-0 3; 3; 3; 3; 3; (� �9�!�*!�/%!�0 23 2�$ 1$� 5�5 � $%>-��"������" ;$$ � ;�$ � ;$�%>-��"���� �� � ;$1 ; 2%>���"�� ;24 ;1� ;�� ;32 ;1$���+����� �=�6$ ��;$ �5;1 1�;2 �$;1 4;2����� --����7�"�� $; $; $; $;�1 2;������ � �"�� �=�6� 1;� �;2 $;5 �;4 ;4� ��/-0 1 ;4 �4;� 12; ��;$ 2�;5( % ��+�� �%�� * * * * ��!!������ ��/-0 ��;4 ; 12; 15;3�!!�����(�� * � * �
��" �- �"�����,����@*���% �� �*��"���� � 12;� @*��( % ��+�� �%�� *@*��.�,� �"��*!��"���"�� ;23��"," 6�*�� �( ��"��/-0� � ; �,���+��-"�"�� �/-0 $ ; ��" �- �"����*!��"���"��C"��� �3; : �*��( % ��+�� �%�� ����-�-�� ���6�/���0 $3�����*��"���(� �9��,!

HCM Signalized Intersection Capacity Analysis ROUTE 62 6: W. 1st Street & Central Avenue ������������ ����
�������������������������� �������������� !��"#�� �� �5
��% � �" &'( &'� &'� )'( )'� )'� �'( �'� �'� �'( �'� �'�(� �*��+��,�"���-.�,� �/%!�0 �5 1�3 33 24 41 4 4� �6 �7�8�/%!�!0 $� $� $� $� $� $� $� $� $� $� $� $� (� �)�6"�� $� $ $� $� $� $� $� $1 $� $ $ $�9�6 �/:0 �1: $: : 1:��"�(�-"�"�� �/-0 3; 3; 3; 3; (� ��"�;�7�"�� ;�3 $; $; $; 7�!<=�! 6><�? - $; ;�4 $; $; 7!<=�! 6><�? - $; $; ;�� $; 7�" ;�4 ;�$ $; $; 7"����" �" 6 $; $; ;�3 $; �"6;�7�8�/!��"0 1��$ $�25 $5�� $���7"�� ���"" 6 $; $; ;5$ $; �"6;�7�8�/! ��0 1��$ $�25 $ 2� $���� ?���,��+�"��=��@7 ;�� ;�� ;�� ;�� ;�� ;�� ;42 ;42 ;42 ;�� ;�� ;���6A;�7�8�/%!�0 �4 2�� 5 3� �� $ $ $ 2 ������ 6,�"����/%!�0 � 41 (� �9��,!�7�8�/%!�0 3$ �1 $ $ $ 2 *��+;�� 6-;�/B>��0 $2 � � $2 $1 $$ $$ $1@ %��. ��� -�/:0 �: �: �: �: �: �: $: $: $: $: $: $:�,�����! � �� � �����" �" 6���- - 2 � 5� ���"" 6���- - 2 5��"," 6�9� �=�9�/-0 3$;� $$;� $$;� $$;�&++ �"�% �9� �=���/-0 3$;� $$;� $$;� $$;���"," 6��>*��"�� ;� ;$5 ;$5 ;$5* ��� ���� �/-0 3; 3; 3; 3; . ��� �&G" �-����/-0 1; 1; 1; 1; (� �9�!�*!�/%!�0 ���$ �42 $� �4$%>-��"������" ; 2 ; 5%>-��"���� �� ;$5 � ;$ %>���"�� ;�� ;�5 ;3� ;1����+����� �=�6$ 1;� �5;� �4;2 ��;1����� --����7�"�� $; $; $; $; ���� � �"�� �=�6� ;� ;3 3;3 ;4� ��/-0 2;$ ��;� 11;4 �4;$( % ��+�� �%�� � * * *�!!������ ��/-0 2;$ ; ��;� 1 ;��!!�����(�� � � * *
��" �- �"�����,����@*���% �� �*��"���� � $2;3 @*��( % ��+�� �%�� '@*��.�,� �"��*!��"���"�� ;����"," 6�*�� �( ��"��/-0� �1;$ �,���+��-"�"�� �/-0 $ ; ��" �- �"����*!��"���"��C"��� 51; : �*��( % ��+�� �%�� '���-�-�� ���6�/���0 $3�����*��"���(� �9��,!
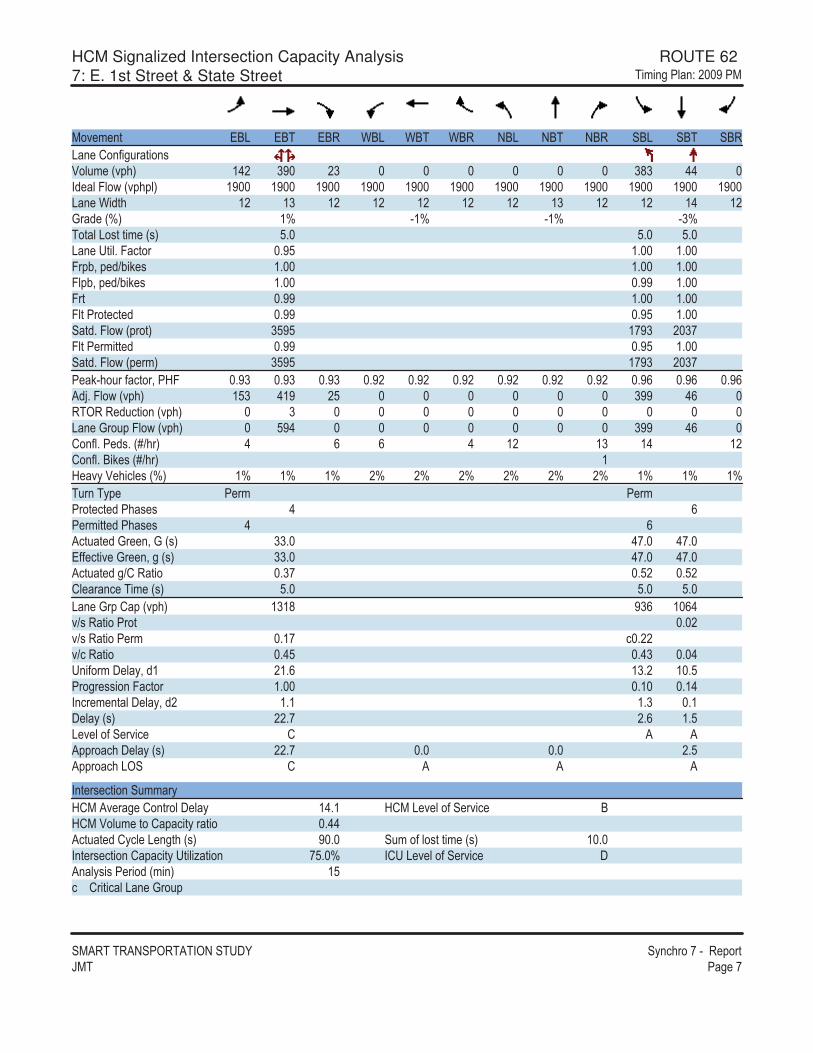
HCM Signalized Intersection Capacity Analysis ROUTE 62 7: E. 1st Street & State Street ������������ ����
�������������������������� �������������� !��"#�� �� ��
��% � �" &'( &'� &'� )'( )'� )'� �'( �'� �'� �'( �'� �'�(� �*��+��,�"���-.�,� �/%!�0 $2� 1� �1 141 22 �6 �7�8�/%!�!0 $� $� $� $� $� $� $� $� $� $� $� $� (� �)�6"�� $� $1 $� $� $� $� $� $1 $� $� $2 $�9�6 �/:0 $: �$: �$: �1:��"�(�-"�"�� �/-0 3; 3; 3; (� ��"�;�7�"�� ;�3 $; $; 7�!<=�! 6><�? - $; $; $; 7!<=�! 6><�? - $; ;�� $; 7�" ;�� $; $; 7"����" �" 6 ;�� ;�3 $; �"6;�7�8�/!��"0 13�3 $��1 � 1�7"�� ���"" 6 ;�� ;�3 $; �"6;�7�8�/! ��0 13�3 $��1 � 1�� ?���,��+�"��=��@7 ;�1 ;�1 ;�1 ;�� ;�� ;�� ;�� ;�� ;�� ;�5 ;�5 ;�5�6A;�7�8�/%!�0 $31 2$� �3 1�� 25 ������ 6,�"����/%!�0 1 (� �9��,!�7�8�/%!�0 3�2 1�� 25 *��+;�� 6-;�/B>��0 2 5 5 2 $� $1 $2 $�*��+;�'�? -�/B>��0 $@ %��. ��� -�/:0 $: $: $: �: �: �: �: �: �: $: $: $:�,�����! � �� � �����" �" 6���- - 2 5� ���"" 6���- - 2 5��"," 6�9� �=�9�/-0 11; 2�; 2�; &++ �"�% �9� �=���/-0 11; 2�; 2�; ��"," 6��>*��"�� ;1� ;3� ;3�* ��� ���� �/-0 3; 3; 3; (� �9�!�*!�/%!�0 $1$4 �15 $ 52%>-��"������" ; �%>-��"���� �� ;$� � ;��%>���"�� ;23 ;21 ; 2���+����� �=�6$ �$;5 $1;� $ ;3����� --����7�"�� $; ;$ ;$2���� � �"�� �=�6� $;$ $;1 ;$� ��/-0 ��;� �;5 $;3( % ��+�� �%�� * � ��!!������ ��/-0 ��;� ; ; �;3�!!�����(�� * � � �
��" �- �"�����,����@*���% �� �*��"���� � $2;$ @*��( % ��+�� �%�� '@*��.�,� �"��*!��"���"�� ;22��"," 6�*�� �( ��"��/-0� � ; �,���+��-"�"�� �/-0 $ ; ��" �- �"����*!��"���"��C"��� �3; : �*��( % ��+�� �%�� ����-�-�� ���6�/���0 $3�����*��"���(� �9��,!

HCM Unsignalized Intersection Capacity Analysis ROUTE 62 8: E. 1st Street & Wilson Avenue ������������ ����
�������������������������� �������������� !��"#�� �� �4
��% � �" &'( &'� &'� )'( )'� )'� �'( �'� �'� �'( �'� �'�(� �*��+��,�"���-.�,� �/% �>�0 �4 244 �53 �3� � �����*��"�� 7� 7� �"�! �"�!9�6 : : : :� ?�@�,��7�"�� ;�3 ;�3 ;�3 ;�� ;�� ;�� ;4$ ;4$ ;4$ ;�� ;�� ;��@�,���+�8��" �/%!�0 �� 3$2 ��� 1$� � � 6 -"���- 3 2 2(� �)�6"��/+"0 $�; ; $�; )?�����! 6�/+">-0 2; 2; 2; � �� �"�'��?� ����"�",���+� �/% �0� 6���"�! ��� ��� � 6���-"��� �% �0�!-"� ��-����/+"0 13$!D=�!"����,�<��? 6 ;43 ;43 ;43 ;43 ;43 ;43%*=����+��"����%�,� ��� 34� 3�� 3�� �14 435 3%*$=�-"� �$����+�%�%*�=�-"� ������+�%�%*,=�,�<��? 6�%� 5�$ 2$� 2$$ 125 5 $ �2 3"*=�-��� �/-0 2;$ 2;$ �;$ 5;3 5;� �;$ 5;3 5;�"*=���-"� �/-0"7�/-0 �;� �;� 1;3 2; 1;1 1;3 2; 1;1! �E, , �+� �: �4 $ $ �4 $ $ $ $ ����!��"��/% �>�0 $51 ��� 232 22� 3�$ $21 �45 $ �2
��� �"���=�(� �B &'�$ &'�� &'�1 �'�$ �'��.�,� ���" �� 3$2 ��� �$� $ 4.�,� �( +" �� .�,� �����" ��� ���@ $51 $� $� 22� 222.�,� �"��*!��"� ; � ;1 ;$5 ;24 ;�2F, , �( ��"���3"��/+"0 $ 51 �2*��"���� ��/-0 �;� ; ; � ;2 $3;�(� �(�� � * *�!!������ ��/-0 ;1 $4;4�!!�����(�� *
��" �- �"�����,�����% �� �� �� 3;3��" �- �"����*!��"���"��C"���� 3$;$: �*��( % ��+�� �%�� � ����-�-�� ���6�/���0 $3

HCM Unsignalized Intersection Capacity Analysis ROUTE 62 10: Imperial Street & E. Front Street ������������ ����
�������������������������� �������������� !��"#�� �� ��
��% � �" &'( &'� �'( �'� �'� �'�(� �*��+��,�"���-.�,� �/% �>�0 15 $4 $ 2�� 2�� $1�����*��"�� �"�! 7� 7� 9�6 : : :� ?�@�,��7�"�� ;�$ ;�$ ;44 ;44 ;�1 ;�1@�,���+�8��" �/%!�0 3$ �3 $$ 243 3 4 $2� 6 -"���-(� �)�6"��/+"0)?�����! 6�/+">-0� �� �"�'��?� ����"�",���+� �/% �0� 6���"�! ��� ��� � 6���-"��� �% �0�!-"� ��-����/+"0!D=�!"����,�<��? 6%*=����+��"����%�,� �4 �5$ 3��%*$=�-"� �$����+�%�%*�=�-"� ������+�%�%*,=�,�<��? 6�%� �4 �5$ 3��"*=�-��� �/-0 5;4 5;� 2;$"*=���-"� �/-0"7�/-0 1;3 1;1 �;�! �E, , �+� �: 43 �� ������!��"��/% �>�0 111 �22 $ 2$
��� �"���=�(� �B &'�$ �'�$ �'�� �'�$ �'��.�,� ���" �5 $�1 1�1 114 $41.�,� �( +" 3$ $$ .�,� �����" �3 $2��@ 2 4 $ 2$ $� $� $� .�,� �"��*!��"� ;$� ; $ ;$� ;� ;$$F, , �( ��"���3"��/+"0 $� $ *��"���� ��/-0 $3;4 ;� ; ; ; (� �(�� * ��!!������ ��/-0 $3;4 ;� ; �!!�����(�� *
��" �- �"�����,�����% �� �� �� $;���" �- �"����*!��"���"��C"���� ��; : �*��( % ��+�� �%�� � ����-�-�� ���6�/���0 $3

HCM Unsignalized Intersection Capacity Analysis ROUTE 62 11: E.2nd Street & E. Front Street ������������ ����
�������������������������� �������������� !��"#�� �� �$
��% � �" &'( &'� �'( �'� �'� �'�(� �*��+��,�"���-.�,� �/% �>�0 2 4� 4� 211 242 5�����*��"�� �"�! 7� 7� 9�6 �1: 1: �1:� ?�@�,��7�"�� ;5� ;5� ;�� ;�� ;4� ;4�@�,���+�8��" �/%!�0 5 $$� �� 2�$ 335 �� 6 -"���-(� �)�6"��/+"0)?�����! 6�/+">-0� �� �"�'��?� ����"�",���+� �/% �0� 6���"�! ��� ��� � 6���-"��� �% �0�!-"� ��-����/+"0!D=�!"����,�<��? 6%*=����+��"����%�,� $�� 335 351%*$=�-"� �$����+�%�%*�=�-"� ������+�%�%*,=�,�<��? 6�%� $�� 335 351"*=�-��� �/-0 5;2 5;� 2;$"*=���-"� �/-0"7�/-0 1;3 1;1 �;�! �E, , �+� �: �� �4 � ����!��"��/% �>�0 $4� 312 $ $1
��� �"���=�(� �B &'�$ &'�� �'�$ �'�� �'�$ �'��.�,� ���" 5 $$� �� 2�$ 335 �.�,� �( +" 5 �� .�,� �����" $$� ���@ $4� 312 $ $1 $� $� $� .�,� �"��*!��"� ; 1 ;�� ;$ ;�4 ;11 ; F, , �( ��"���3"��/+"0 � �$ 4 *��"���� ��/-0 �3;2 $1;� 4;� ; ; ; (� �(�� � ' ��!!������ ��/-0 $2;� $;3 ; �!!�����(�� '
��" �- �"�����,�����% �� �� �� �;$��" �- �"����*!��"���"��C"���� 21;�: �*��( % ��+�� �%�� � ����-�-�� ���6�/���0 $3
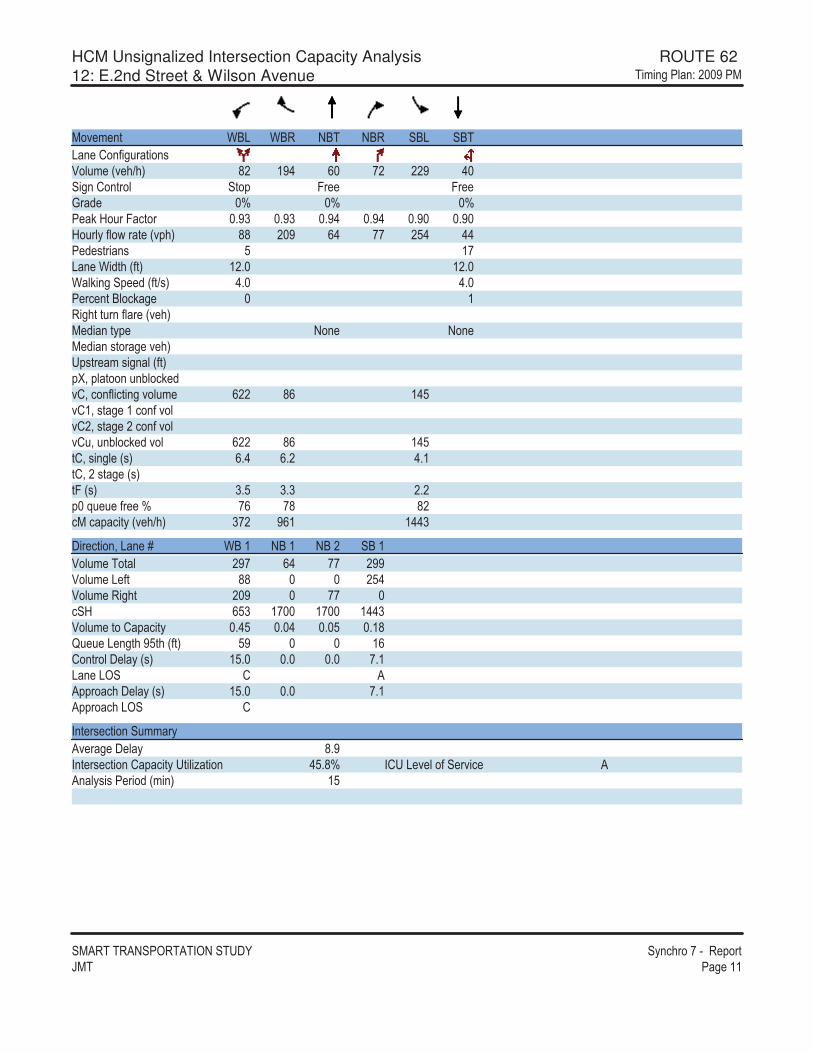
HCM Unsignalized Intersection Capacity Analysis ROUTE 62 12: E.2nd Street & Wilson Avenue ������������ ����
�������������������������� �������������� !��"#�� �� �$$
��% � �" )'( )'� �'� �'� �'( �'�(� �*��+��,�"���-.�,� �/% �>�0 4� $�2 5 �� ��� 2 �����*��"�� �"�! 7� 7� 9�6 : : :� ?�@�,��7�"�� ;�1 ;�1 ;�2 ;�2 ;� ;� @�,���+�8��" �/%!�0 44 � � 52 �� �32 22� 6 -"���- 3 $�(� �)�6"��/+"0 $�; $�; )?�����! 6�/+">-0 2; 2; � �� �"�'��?� $����"�",���+� �/% �0� 6���"�! ��� ��� � 6���-"��� �% �0�!-"� ��-����/+"0!D=�!"����,�<��? 6%*=����+��"����%�,� 5�� 45 $23%*$=�-"� �$����+�%�%*�=�-"� ������+�%�%*,=�,�<��? 6�%� 5�� 45 $23"*=�-��� �/-0 5;2 5;� 2;$"*=���-"� �/-0"7�/-0 1;3 1;1 �;�! �E, , �+� �: �5 �4 4�����!��"��/% �>�0 1�� �5$ $221
��� �"���=�(� �B )'�$ �'�$ �'�� �'�$.�,� ���" ��� 52 �� ���.�,� �( +" 44 �32.�,� �����" � � �� ��@ 531 $� $� $221.�,� �"��*!��"� ;23 ; 2 ; 3 ;$4F, , �( ��"���3"��/+"0 3� $5*��"���� ��/-0 $3; ; ; �;$(� �(�� * ��!!������ ��/-0 $3; ; �;$�!!�����(�� *
��" �- �"�����,�����% �� �� �� 4;���" �- �"����*!��"���"��C"���� 23;4: �*��( % ��+�� �%�� � ����-�-�� ���6�/���0 $3
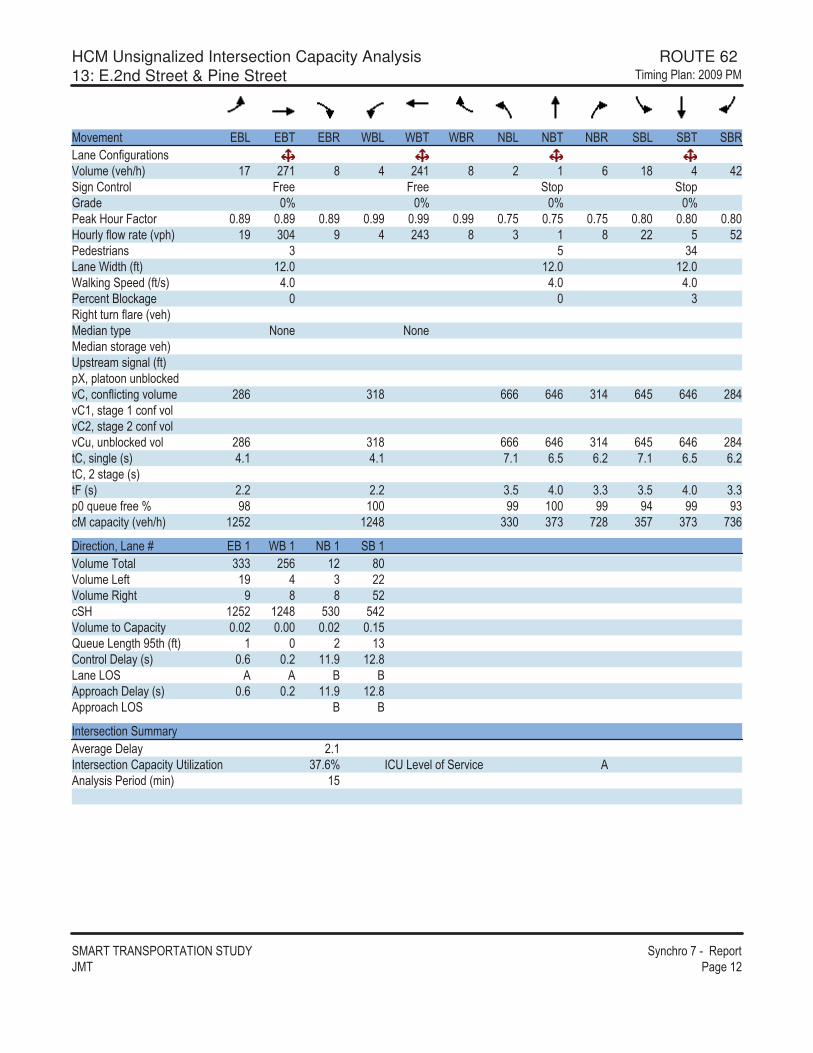
HCM Unsignalized Intersection Capacity Analysis ROUTE 62 13: E.2nd Street & Pine Street ������������ ����
�������������������������� �������������� !��"#�� �� �$�
��% � �" &'( &'� &'� )'( )'� )'� �'( �'� �'� �'( �'� �'�(� �*��+��,�"���-.�,� �/% �>�0 $� ��$ 4 2 �2$ 4 � $ 5 $4 2 2������*��"�� 7� 7� �"�! �"�!9�6 : : : :� ?�@�,��7�"�� ;4� ;4� ;4� ;�� ;�� ;�� ;�3 ;�3 ;�3 ;4 ;4 ;4 @�,���+�8��" �/%!�0 $� 1 2 � 2 �21 4 1 $ 4 �� 3 3�� 6 -"���- 1 3 12(� �)�6"��/+"0 $�; $�; $�; )?�����! 6�/+">-0 2; 2; 2; � �� �"�'��?� 1����"�",���+� �/% �0� 6���"�! ��� ��� � 6���-"��� �% �0�!-"� ��-����/+"0!D=�!"����,�<��? 6%*=����+��"����%�,� �45 1$4 555 525 1$2 523 525 �42%*$=�-"� �$����+�%�%*�=�-"� ������+�%�%*,=�,�<��? 6�%� �45 1$4 555 525 1$2 523 525 �42"*=�-��� �/-0 2;$ 2;$ �;$ 5;3 5;� �;$ 5;3 5;�"*=���-"� �/-0"7�/-0 �;� �;� 1;3 2; 1;1 1;3 2; 1;1! �E, , �+� �: �4 $ �� $ �� �2 �� �1����!��"��/% �>�0 $�3� $�24 11 1�1 ��4 13� 1�1 �15
��� �"���=�(� �B &'�$ )'�$ �'�$ �'�$.�,� ���" 111 �35 $� 4 .�,� �( +" $� 2 1 ��.�,� �����" � 4 4 3���@ $�3� $�24 31 32�.�,� �"��*!��"� ; � ; ; � ;$3F, , �( ��"���3"��/+"0 $ � $1*��"���� ��/-0 ;5 ;� $$;� $�;4(� �(�� � � ' '�!!������ ��/-0 ;5 ;� $$;� $�;4�!!�����(�� ' '
��" �- �"�����,�����% �� �� �� �;$��" �- �"����*!��"���"��C"���� 1�;5: �*��( % ��+�� �%�� � ����-�-�� ���6�/���0 $3

HCM Unsignalized Intersection Capacity Analysis ROUTE 62 14: Imperial Street & E.2nd Street ������������ ����
�������������������������� �������������� !��"#�� �� �$1
��% � �" &'( &'� &'� )'( )'� )'� �'( �'� �'� �'( �'� �'�(� �*��+��,�"���-.�,� �/% �>�0 $� 5 3 5 $$ 2 2 $2 � $� $�1 $5�����*��"�� �"�! �"�! 7� 7� 9�6 : : : :� ?�@�,��7�"�� ;�3 ;�3 ;�3 ;�3 ;�3 ;�3 ;55 ;55 ;55 ;�� ;�� ;��@�,���+�8��" �/%!�0 �3 4 � 4 $3 31 5 �$� $$ $� $�4 $5� 6 -"���- $ 2 1(� �)�6"��/+"0 $�; $�; $�; )?�����! 6�/+">-0 2; 2; 2; � �� �"�'��?� ����"�",���+� �/% �0� 6���"�! ��� ��� � 6���-"��� �% �0�!-"� ��-����/+"0!D=�!"����,�<��? 6%*=����+��"����%�,� 3 5 22� $�� 235 23 �� $�5 ��1%*$=�-"� �$����+�%�%*�=�-"� ������+�%�%*,=�,�<��? 6�%� 3 5 22� $�� 235 23 �� $�5 ��1"*=�-��� �/-0 �;$ 5;3 5;� �;$ 5;3 5;� 2;$ 2;$"*=���-"� �/-0"7�/-0 1;3 2; 1;1 1;3 2; 1;1 �;� �;�! �E, , �+� �: �2 �4 �� �4 �� �2 $ ������!��"��/% �>�0 211 3 � 43� 3 $ 3 4�� $144 $134
��� �"���=�(� �B &'�$ )'�$ �'�$ �'�$.�,� ���" 2 �5 ��� � �.�,� �( +" �3 4 5 $�.�,� �����" � 31 $$ $5��@ 245 5� $144 $134.�,� �"��*!��"� ; 4 ;$$ ; ; $F, , �( ��"���3"��/+"0 � � $*��"���� ��/-0 $1;$ $ ;� ;� ;3(� �(�� ' ' � ��!!������ ��/-0 $1;$ $ ;� ;� ;3�!!�����(�� ' '
��" �- �"�����,�����% �� �� �� �;���" �- �"����*!��"���"��C"���� ��;�: �*��( % ��+�� �%�� � ����-�-�� ���6�/���0 $3

HCM Unsignalized Intersection Capacity Analysis ROUTE 62 19: E. 1st Street & E. Front Street ������������ ����
�������������������������� �������������� !��"#�� �� �$2
��% � �" &'( &'� )'� )'� �&( �&�(� �*��+��,�"���-.�,� �/% �>�0 1�5 2$3 �����*��"�� 7� 7� �"�!9�6 : : :� ?�@�,��7�"�� ;�� ;�� ;�� ;�� ;�� ;��@�,���+�8��" �/%!�0 2 � 23$ � 6 -"���-(� �)�6"��/+"0)?�����! 6�/+">-0� �� �"�'��?� ����"�",���+� �/% �0� 6���"�! ��� ��� � 6���-"��� �% �0�!-"� ��-����/+"0 5$4!D=�!"����,�<��? 6%*=����+��"����%�,� 23$ � 2 %*$=�-"� �$����+�%�%*�=�-"� ������+�%�%*,=�,�<��? 6�%� 23$ � 2 "*=�-��� �/-0 2;$ 5;4 5;�"*=���-"� �/-0"7�/-0 �;� 1;3 1;1! �E, , �+� �: $ $ $ ����!��"��/% �>�0 $$ 5 �53 $ 42
��� �"���=�(� �B &'�$ &'�� )'�$ )'��.�,� ���" � 2 � 2 ��5 ��5.�,� �( +" .�,� �����" ��5 ��5��@ $� $� $� $� .�,� �"��*!��"� ;$� ;$� ;$1 ;$1F, , �( ��"���3"��/+"0 *��"���� ��/-0 ; ; ; ; (� �(���!!������ ��/-0 ; ; �!!�����(��
��" �- �"�����,�����% �� �� �� ; ��" �- �"����*!��"���"��C"���� $�;�: �*��( % ��+�� �%�� � ����-�-�� ���6�/���0 $3

HCM Unsignalized Intersection Capacity Analysis ROUTE 62 121: E. 2nd Alley & Wilson Avenue ������������ ����
�������������������������� �������������� !��"#�� �� �$3
��% � �" &'( &'� �'( �'� �'� �'�(� �*��+��,�"���-.�,� �/% �>�0 3 3 1 �24 �52 ������*��"�� �"�! 7� 7� 9�6 : : :� ?�@�,��7�"�� ;51 ;51 ;�2 ;�2 ;� ;� @�,���+�8��" �/%!�0 4 4 1 �52 ��1 �� 6 -"���- 1 $�(� �)�6"��/+"0 $�; $�; )?�����! 6�/+">-0 2; 2; � �� �"�'��?� $����"�",���+� �/% �0� 6���"�! ��� ��� � 6���-"��� �% �0�!-"� ��-����/+"0!D=�!"����,�<��? 6%*=����+��"����%�,� 343 ��� ���%*$=�-"� �$����+�%�%*�=�-"� ������+�%�%*,=�,�<��? 6�%� 343 ��� ���"*=�-��� �/-0 5;2 5;� 2;$"*=���-"� �/-0"7�/-0 1;3 1;1 �;�! �E, , �+� �: �4 �� $ ����!��"��/% �>�0 254 �23 $��$
��� �"���=�(� �B &'�$ �'�$ �'�$.�,� ���" $5 �5� ��5.�,� �( +" 4 1 .�,� �����" 4 ���@ 3�3 $��$ $� .�,� �"��*!��"� ; 1 ; ;$�F, , �( ��"���3"��/+"0 � *��"���� ��/-0 $$;2 ;$ ; (� �(�� ' ��!!������ ��/-0 $$;2 ;$ ; �!!�����(�� '
��" �- �"�����,�����% �� �� �� ;2��" �- �"����*!��"���"��C"���� �3;2: �*��( % ��+�� �%�� � ����-�-�� ���6�/���0 $3

�
�
�
�
�
�
�
�
�
�
�
�
�
������� ��������

HCM Signalized Intersection Capacity Analysis ROUTE 62 1: W. Front Street & Petroleum Street ������������ 1 ���
�������������������������� �������������� !��"#�� �� �$
��% � �" &'( &'� &'� )'( )'� )'� �'( �'� �'� �'( �'� �'�(� �*��+��,�"���-.�,� �/%!�0 11 $$ $23 ��4 $45 ��5 �6 �7�8�/%!�!0 $� $� $� $� $� $� $� $� $� $� $� $� 9�6 �/:0 1: 2: �1: :��"�(�-"�"�� �/-0 3; 3; 3; 3; 3; 3; (� ��"�;�7�"�� $; $; $; $; $; $; 7�!<=�! 6><�? - $; ;�� $; $; $; $; 7!<=�! 6><�? - $; $; $; $; $; $; 7�" $; ;43 $; ;43 $; $; 7"����" �" 6 ;�3 $; ;�3 $; $; $; �"6;�7�8�/!��"0 $�21 $31� $�$3 $31� $4�� $4$ 7"�� ���"" 6 ;�3 $; ;�3 $; $; $; �"6;�7�8�/! ��0 $�21 $31� $�$3 $31� $4�� $4$ � ?���,��+�"��=��@7 ;�� ;�� ;�� ;4 ;4 ;4 ;4� ;4� ;4� ;4� ;4� ;4�9��8"��7�"���/%!�0 $$$: $$$: $$$: $$$: $$$: $$$: $$$: $$$: $$$: $$$: $$$: $$$:�6A;�7�8�/%!�0 25 $3 � $ 1$5 �1� 1�2 ������ 6,�"����/%!�0 4 $53 (� �9��,!�7�8�/%!�0 25 � � $ $3$ �1� 1�2 *��+;�� 6-;�/B>��0 � � � � � $*��+;�'�? -�/B>��0 $@ %��. ��� -�/:0 �: �: �: 1: 1: 1: 1: 1: 1: 3: 3: 3:�,�����! �,-"�� �,-"�� �,-"�� �,-"�����" �" 6���- - � 5� ���"" 6���- - 2 2 4 4��"," 6�9� �=�9�/-0 1$; 1$; 1$; 1$; �2; �2; &++ �"�% �9� �=���/-0 1$; 1$; 1$; 1$; �2; �2; ��"," 6��>*��"�� ;24 ;24 ;24 ;24 ;1� ;1�* ��� ���� �/-0 3; 3; 3; 3; 3; 3; (� �9�!�*!�/%!�0 41$ �12 4$4 �11 5�$ 554%>-��"������" ;$� � ;�$%>-��"���� �� ; 1 ; � ;$� ;$ %>���"�� ; 5 ; $ ;�3 ;�$ ;12 ;35���+����� �=�6$ �;$ 4;� $ ;$ �;� $2;4 $5;1����� --����7�"�� $; $; ;44 ;35 $;43 $; ���� � �"�� �=�6� ;$ ; ;� ;5 $;� 1;2� ��/-0 �;1 �; �;3 5;$ �4;3 $�;�( % ��+�� �%�� � � � � * '�!!������ ��/-0 �;� �;3 �4;3 $�;��!!�����(�� � � * '
��" �- �"�����,����@*���% �� �*��"���� � $3;3 @*��( % ��+�� �%�� '@*��.�,� �"��*!��"���"�� ;14��"," 6�*�� �( ��"��/-0� 53; �,���+��-"�"�� �/-0 $ ; ��" �- �"����*!��"���"��C"��� � ;4: �*��( % ��+�� �%�� *���-�-�� ���6�/���0 $3�����*��"���(� �9��,!

HCM Unsignalized Intersection Capacity Analysis ROUTE 62 2: W. Front Street & Central Avenue ������������ 1 ���
�������������������������� �������������� !��"#�� �� ��
��% � �" &'� &'� )'( )'� �'( �'�(� �*��+��,�"���-.�,� �/% �>�0 53 1�5 3� �����*��"�� 7� 7� �"�!9�6 �2: $: �1:� ?�@�,��7�"�� ;�� ;�� ;43 ;43 ;54 ;54@�,���+�8��" �/%!�0 43 2�5 43 � 6 -"���- $ $(� �)�6"��/+"0 ; $�; )?�����! 6�/+">-0 2; 2; � �� �"�'��?� ����"�",���+� �/% �0� 6���"�! ��� ��� � 6���-"��� �% �0�!-"� ��-����/+"0 14 145!D=�!"����,�<��? 6%*=����+��"����%�,� $ 143 $%*$=�-"� �$����+�%�%*�=�-"� ������+�%�%*,=�,�<��? 6�%� $ 143 $"*=�-��� �/-0 2;� 5;4 5;�"*=���-"� �/-0"7�/-0 �;� 1;3 1;1! �E, , �+� �: �3 43 $ ����!��"��/% �>�0 $5 2 353 $ 44
��� �"���=�(� �B )'�$ )'�� �'�$.�,� ���" ��� �42 43.�,� �( +" 43 43.�,� �����" ��@ $5 2 $� 353.�,� �"��*!��"� ; 3 ;$� ;$3F, , �( ��"���3"��/+"0 2 $1*��"���� ��/-0 1; ; $�;3(� �(�� � '�!!������ ��/-0 $;1 $�;3�!!�����(�� '
��" �- �"�����,�����% �� �� �� �;���" �- �"����*!��"���"��C"���� 53;�: �*��( % ��+�� �%�� � *���-�-�� ���6�/���0 $3
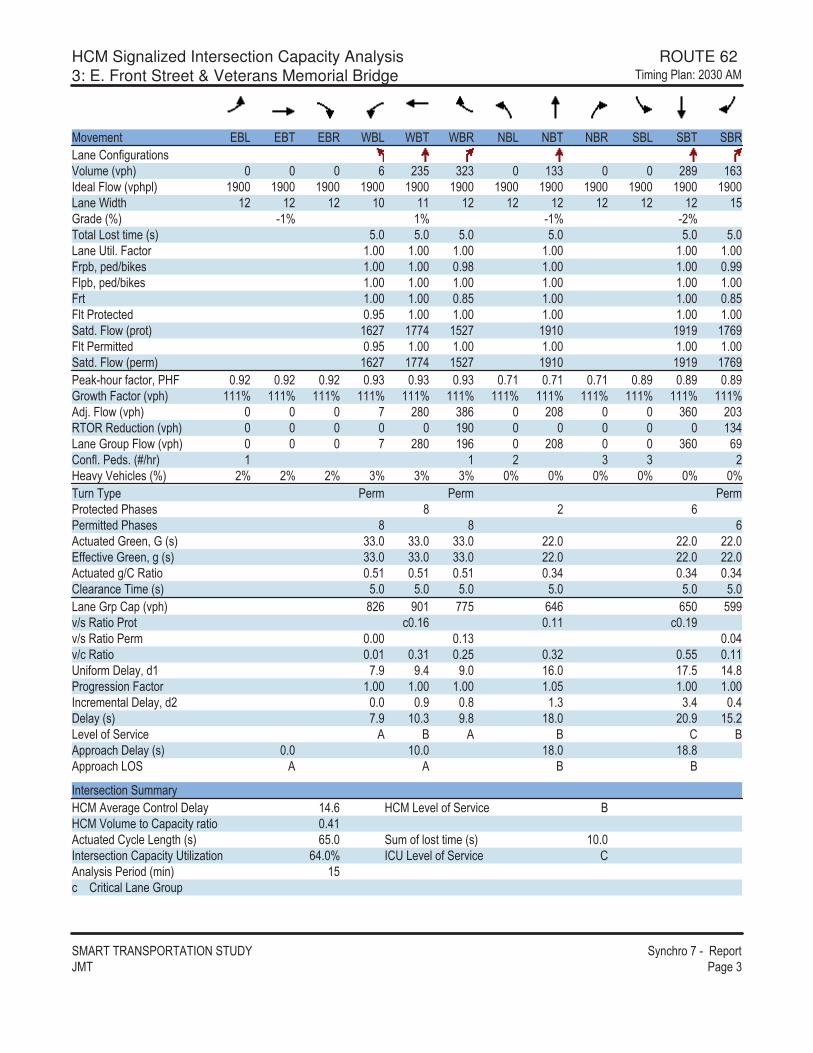
HCM Signalized Intersection Capacity Analysis ROUTE 62 3: E. Front Street & Veterans Memorial Bridge ������������ 1 ���
�������������������������� �������������� !��"#�� �� �1
��% � �" &'( &'� &'� )'( )'� )'� �'( �'� �'� �'( �'� �'�(� �*��+��,�"���-.�,� �/%!�0 5 �13 1�1 $11 �4� $51�6 �7�8�/%!�!0 $� $� $� $� $� $� $� $� $� $� $� $� (� �)�6"�� $� $� $� $ $$ $� $� $� $� $� $� $39�6 �/:0 �$: $: �$: ��:��"�(�-"�"�� �/-0 3; 3; 3; 3; 3; 3; (� ��"�;�7�"�� $; $; $; $; $; $; 7�!<=�! 6><�? - $; $; ;�4 $; $; ;��7!<=�! 6><�? - $; $; $; $; $; $; 7�" $; $; ;43 $; $; ;437"����" �" 6 ;�3 $; $; $; $; $; �"6;�7�8�/!��"0 $5�� $��2 $3�� $�$ $�$� $�5�7"�� ���"" 6 ;�3 $; $; $; $; $; �"6;�7�8�/! ��0 $5�� $��2 $3�� $�$ $�$� $�5�� ?���,��+�"��=��@7 ;�� ;�� ;�� ;�1 ;�1 ;�1 ;�$ ;�$ ;�$ ;4� ;4� ;4�9��8"��7�"���/%!�0 $$$: $$$: $$$: $$$: $$$: $$$: $$$: $$$: $$$: $$$: $$$: $$$:�6A;�7�8�/%!�0 � �4 145 � 4 15 � 1������ 6,�"����/%!�0 $� $12(� �9��,!�7�8�/%!�0 � �4 $�5 � 4 15 5�*��+;�� 6-;�/B>��0 $ $ � 1 1 �@ %��. ��� -�/:0 �: �: �: 1: 1: 1: : : : : : :�,�����! � �� � �� � �����" �" 6���- - 4 � 5� ���"" 6���- - 4 4 5��"," 6�9� �=�9�/-0 11; 11; 11; ��; ��; ��; &++ �"�% �9� �=���/-0 11; 11; 11; ��; ��; ��; ��"," 6��>*��"�� ;3$ ;3$ ;3$ ;12 ;12 ;12* ��� ���� �/-0 3; 3; 3; 3; 3; 3; (� �9�!�*!�/%!�0 4�5 � $ ��3 525 53 3��%>-��"������" � ;$5 ;$$ � ;$�%>-��"���� �� ; ;$1 ; 2%>���"�� ; $ ;1$ ;�3 ;1� ;33 ;$$���+����� �=�6$ �;� �;2 �; $5; $�;3 $2;4����� --����7�"�� $; $; $; $; 3 $; $; ���� � �"�� �=�6� ; ;� ;4 $;1 1;2 ;2� ��/-0 �;� $ ;1 �;4 $4; � ;� $3;�( % ��+�� �%�� � ' � ' * '�!!������ ��/-0 ; $ ; $4; $4;4�!!�����(�� � � ' '
��" �- �"�����,����@*���% �� �*��"���� � $2;5 @*��( % ��+�� �%�� '@*��.�,� �"��*!��"���"�� ;2$��"," 6�*�� �( ��"��/-0� 53; �,���+��-"�"�� �/-0 $ ; ��" �- �"����*!��"���"��C"��� 52; : �*��( % ��+�� �%�� *���-�-�� ���6�/���0 $3�����*��"���(� �9��,!

HCM Unsignalized Intersection Capacity Analysis ROUTE 62 4: E. Front Street & Wilson Avenue ������������ 1 ���
�������������������������� �������������� !��"#�� �� �2
��% � �" &'� &'� )'( )'� �'( �'�(� �*��+��,�"���-.�,� �/% �>�0 2$3 $3� �����*��"�� 7� 7� �"�!9�6 : : :� ?�@�,��7�"�� ;�� ;�� ;�5 ;�5 ;�$ ;�$@�,���+�8��" �/%!�0 5 5 �2� � 6 -"���- $(� �)�6"��/+"0 $�; )?�����! 6�/+">-0 2; � �� �"�'��?� ����"�",���+� �/% �0� 6���"�! ��� ��� � 6���-"��� �% �0�!-"� ��-����/+"0 143!D=�!"����,�<��? 6%*=����+��"����%�,� $ 1 2 $%*$=�-"� �$����+�%�%*�=�-"� ������+�%�%*,=�,�<��? 6�%� $ 1 2 $"*=�-��� �/-0 2;$ 5;� �; "*=���-"� �/-0"7�/-0 �;� 1;3 1;1! �E, , �+� �: $ 5� $ ����!��"��/% �>�0 $5$� 53� $ �3
��� �"���=�(� �B )'�$ )'�� �'�$ �'��.�,� ���" 1 1 1 1 $�2 $�2.�,� �( +" $�2 $�2.�,� �����" ��@ $� $� 53� 53�.�,� �"��*!��"� ;$4 ;$4 ;$� ;$�F, , �( ��"���3"��/+"0 $� $�*��"���� ��/-0 ; ; $$;� $$;�(� �(�� ' '�!!������ ��/-0 ; $$;��!!�����(�� '
��" �- �"�����,�����% �� �� �� 1;2��" �- �"����*!��"���"��C"���� 2�;3: �*��( % ��+�� �%�� � ����-�-�� ���6�/���0 $3

HCM Signalized Intersection Capacity Analysis ROUTE 62 5: W. 1st Street & Petroleum Street ������������ 1 ���
�������������������������� �������������� !��"#�� �� �3
��% � �" &'( &'� &'� )'( )'� )'� �'( �'� �'� �'( �'� �'�(� �*��+��,�"���-.�,� �/%!�0 $3� $31 5 � �2 $ $2$ 12 �3��6 �7�8�/%!�!0 $� $� $� $� $� $� $� $� $� $� $� $� (� �)�6"�� $ $ $� $1 $1 $� $� $2 $� $ $ $�9�6 �/:0 ��: 1: �3: �:��"�(�-"�"�� �/-0 3; 3; 3; 3; 3; (� ��"�;�7�"�� $; $; $; $; $; 7�!<=�! 6><�? - $; $; $; $; $; 7!<=�! 6><�? - ;�� $; $; $; $; 7�" $; ;�� $; $; ;4�7"����" �" 6 ;�3 $; ;�� ;�3 $; �"6;�7�8�/!��"0 $555 $�5$ $�43 $5$ $2� 7"�� ���"" 6 ;�3 $; ;4� ;�3 $; �"6;�7�8�/! ��0 $555 $�5$ $�3� $5$ $2� � ?���,��+�"��=��@7 ;45 ;45 ;45 ;�� ;�� ;�� ;3� ;3� ;3� ;�� ;�� ;��9��8"��7�"���/%!�0 $$$: $$$: $$$: $$$: $$$: $$$: $$$: $$$: $$$: $$$: $$$: $$$:�6A;�7�8�/%!�0 � 3 $�� 4 $2 2� � � 1 2� 1� ������ 6,�"����/%!�0 $2� (� �9��,!�7�8�/%!�0 � 3 � 3 51 � 1 ��� *��+;�� 6-;�/B>��0 3 $ $ 3 1 1@ %��. ��� -�/:0 $: $: $: �: �: �: 1: 1: 1: $: $: $:�,�����! � �� � �� ���"���" �" 6���- - 2 � $ 5� ���"" 6���- - 2 ���"," 6�9� �=�9�/-0 $3; $3; $3; � ; 2 ; &++ �"�% �9� �=���/-0 $3; $3; $3; � ; 2 ; ��"," 6��>*��"�� ;�1 ;�1 ;�1 ;1$ ;5�* ��� ���� �/-0 3; 3; 3; 3; 3; (� �9�!�*!�/%!�0 142 2 5 2 2 2�3 � 3%>-��"������" ;$� � ;$1 � ;$�%>-��"���� �� � ;$� ; 2%>���"�� ;31 ;3 ;$5 ;2$ ;1$���+����� �=�6$ �$;� �$;4 $�;� $�;4 3;������ --����7�"�� $; $; $; $;$� 1;35���� � �"�� �=�6� 3;� 2;2 ;4 �;1 ;4� ��/-0 ��;� �5;� � ;4 �1;3 �$;�( % ��+�� �%�� * * * * *�!!������ ��/-0 �5;� ; � ;4 ��;2�!!�����(�� * � * *
��" �- �"�����,����@*���% �� �*��"���� � �1;� @*��( % ��+�� �%�� *@*��.�,� �"��*!��"���"�� ;1���"," 6�*�� �( ��"��/-0� 53; �,���+��-"�"�� �/-0 $ ; ��" �- �"����*!��"���"��C"��� 32;�: �*��( % ��+�� �%�� ����-�-�� ���6�/���0 $3�����*��"���(� �9��,!

HCM Signalized Intersection Capacity Analysis ROUTE 62 6: W. 1st Street & Central Avenue ������������ 1 ���
�������������������������� �������������� !��"#�� �� �5
��% � �" &'( &'� &'� )'( )'� )'� �'( �'� �'� �'( �'� �'�(� �*��+��,�"���-.�,� �/%!�0 $1 ��3 $1 24 4� $3 2� �6 �7�8�/%!�!0 $� $� $� $� $� $� $� $� $� $� $� $� (� �)�6"�� $� $ $� $� $� $� $� $1 $� $ $ $�9�6 �/:0 �1: $: : 1:��"�(�-"�"�� �/-0 3; 3; 3; 3; (� ��"�;�7�"�� ;�3 $; $; $; 7�!<=�! 6><�? - $; $; $; $; 7!<=�! 6><�? - $; $; $; $; 7�" ;�� ;�$ $; $; 7"����" �" 6 $; $; ;�3 $; �"6;�7�8�/!��"0 1$ 5 $��3 $353 $5247"�� ���"" 6 $; $; ;3� $; �"6;�7�8�/! ��0 1$ 5 $��3 �55 $524� ?���,��+�"��=��@7 ;4� ;4� ;4� ;�� ;�� ;�� ;4$ ;4$ ;4$ ;�5 ;�5 ;�59��8"��7�"���/%!�0 $$$: $$$: $$$: $$$: $$$: $$$: $$$: $$$: $$$: $$$: $$$: $$$:�6A;�7�8�/%!�0 $� 13$ $� 55 $$� �� �� ������ 6,�"����/%!�0 2 $ $ (� �9��,!�7�8�/%!�0 14$ 42 �� �� *��+;�� 6-;�/B>��0 $ 3 3 $ � �@ %��. ��� -�/:0 �: �: �: �: �: �: $: $: $: 5: 5: 5:�,�����! � �� � �����" �" 6���- - 2 � 5� ���"" 6���- - 2 5��"," 6�9� �=�9�/-0 2 ;$ 4;� 4;� 4;�&++ �"�% �9� �=���/-0 2 ;$ 4;� 4;� 4;���"," 6��>*��"�� ;54 ;$3 ;$3 ;$3* ��� ���� �/-0 3; 3; 3; 3; . ��� �&G" �-����/-0 1; 1; 1; 1; (� �9�!�*!�/%!�0 �$$4 �51 $21 �22%>-��"������" � ; 3 ; 2%>-��"���� �� ;$� ; �%>���"�� ;$4 ;1� ;$3 ;1 ���+����� �=�6$ 1;2 ��;2 �$;4 ��;1����� --����7�"�� $; $; $; $; ���� � �"�� �=�6� ;� ;� ;3 ;�� ��/-0 1;5 �1;$ ��;1 �1; ( % ��+�� �%�� � * * *�!!������ ��/-0 1;5 ; �1;$ ��;4�!!�����(�� � � * *
��" �- �"�����,����@*���% �� �*��"���� � $$;� @*��( % ��+�� �%�� '@*��.�,� �"��*!��"���"�� ;� ��"," 6�*�� �( ��"��/-0� 34;4 �,���+��-"�"�� �/-0 $ ; ��" �- �"����*!��"���"��C"��� 3 ;2: �*��( % ��+�� �%�� ����-�-�� ���6�/���0 $3�����*��"���(� �9��,!

HCM Signalized Intersection Capacity Analysis ROUTE 62 7: E. 1st Street & State Street ������������ 1 ���
�������������������������� �������������� !��"#�� �� ��
��% � �" &'( &'� &'� )'( )'� )'� �'( �'� �'� �'( �'� �'�(� �*��+��,�"���-.�,� �/%!�0 $14 �5 � �42 $� �6 �7�8�/%!�!0 $� $� $� $� $� $� $� $� $� $� $� $� (� �)�6"�� $� $1 $� $� $� $� $� $1 $� $� $2 $�9�6 �/:0 $: �$: �$: �1:��"�(�-"�"�� �/-0 3; 3; 3; (� ��"�;�7�"�� ;�3 $; $; 7�!<=�! 6><�? - $; $; $; 7!<=�! 6><�? - $; $; $; 7�" $; $; $; 7"����" �" 6 ;�4 ;�3 $; �"6;�7�8�/!��"0 135� $�21 $�3�7"�� ���"" 6 ;�4 ;�3 $; �"6;�7�8�/! ��0 135� $�21 $�3�� ?���,��+�"��=��@7 ;�� ;�� ;�� ;�� ;�� ;�� ;�� ;�� ;�� ;4� ;4� ;4�9��8"��7�"���/%!�0 $$$: $$$: $$$: $$$: $$$: $$$: $$$: $$$: $$$: $$$: $$$: $$$:�6A;�7�8�/%!�0 $33 ��� 4 15� $3 ������ 6,�"����/%!�0 � (� �9��,!�7�8�/%!�0 231 15� $3 *��+;�� 6-;�/B>��0 1 � � 1 � � � �@ %��. ��� -�/:0 �: �: �: �: �: �: �: �: �: 3: 3: 3:�,�����! � �� � �����" �" 6���- - 2 5� ���"" 6���- - 2 5��"," 6�9� �=�9�/-0 ��; 11; 11; &++ �"�% �9� �=���/-0 ��; 11; 11; ��"," 6��>*��"�� ;12 ;3$ ;3$* ��� ���� �/-0 3; 3; 3; (� �9�!�*!�/%!�0 $� 5 443 ��3%>-��"������" ; $%>-��"���� �� ;$1 � ;�$%>���"�� ;14 ;2$ ; ����+����� �=�6$ $5;1 �;� �;������ --����7�"�� $; ; � ; ����� � �"�� �=�6� ;� $;� ; � ��/-0 $�;� �;$ ;5( % ��+�� �%�� ' � ��!!������ ��/-0 $�;� ; ; �; �!!�����(�� ' � � �
��" �- �"�����,����@*���% �� �*��"���� � $ ;1 @*��( % ��+�� �%�� '@*��.�,� �"��*!��"���"�� ;2 ��"," 6�*�� �( ��"��/-0� 53; �,���+��-"�"�� �/-0 $ ; ��" �- �"����*!��"���"��C"��� �5;�: �*��( % ��+�� �%�� ����-�-�� ���6�/���0 $3�����*��"���(� �9��,!

HCM Unsignalized Intersection Capacity Analysis ROUTE 62 8: E. 1st Street & Wilson Avenue ������������ 1 ���
�������������������������� �������������� !��"#�� �� �4
��% � �" &'( &'� &'� )'( )'� )'� �'( �'� �'� �'( �'� �'�(� �*��+��,�"���-.�,� �/% �>�0 $� 1�2 $3 $2� � �����*��"�� 7� 7� �"�! �"�!9�6 : : : :� ?�@�,��7�"�� ;�5 ;�5 ;�5 ;�� ;�� ;�� ;�� ;�� ;�� ;�� ;�� ;��@�,���+�8��" �/%!�0 $2 21� $�1 $�� � � 6 -"���- $ $ �(� �)�6"��/+"0 $�; ; $�; )?�����! 6�/+">-0 2; 2; 2; � �� �"�'��?� ����"�",���+� �/% �0� 6���"�! ��� ��� � 6���-"��� �% �0�!-"� ��-����/+"0 13$!D=�!"����,�<��? 6 ;�2 ;�2 ;�2 ;�2 ;�2 ;�2%*=����+��"����%�,� 5 4 251 25� 213 33� 515 $%*$=�-"� �$����+�%�%*�=�-"� ������+�%�%*,=�,�<��? 6�%� 333 2 � 2 $ 1�1 2�� 343 $"*=�-��� �/-0 2;$ 2;$ �;$ 5;3 5;� �;$ 5;3 5;�"*=���-"� �/-0"7�/-0 �;� �;� 1;3 2; 1;1 1;3 2; 1;1! �E, , �+� �: �� $ $ 53 $ $ $ $ ����!��"��/% �>�0 $5$� �3� 3�� 3 � 513 1�4 1�3 $ 41
��� �"���=�(� �B &'�$ &'�� &'�1 �'�$ �'��.�,� ���" $2 21� $�1 $$4 5�.�,� �( +" $2 .�,� �����" $�1 ���@ $5$� $� $� 3 � 3 �.�,� �"��*!��"� ; $ ;�3 ;$ ;�2 ;$�F, , �( ��"���3"��/+"0 $ �1 $ *��"���� ��/-0 �;� ; ; $2;2 $1;$(� �(�� � ' '�!!������ ��/-0 ;� $1;��!!�����(�� '
��" �- �"�����,�����% �� �� �� 1;1��" �- �"����*!��"���"��C"���� 22;$: �*��( % ��+�� �%�� � ����-�-�� ���6�/���0 $3

HCM Unsignalized Intersection Capacity Analysis ROUTE 62 10: Imperial Street & E. Front Street ������������ 1 ���
�������������������������� �������������� !��"#�� �� ��
��% � �" &'( &'� �'( �'� �'� �'�(� �*��+��,�"���-.�,� �/% �>�0 $$ $� $ 2 2 1� 5�����*��"�� �"�! 7� 7� 9�6 : : :� ?�@�,��7�"�� ;52 ;52 ;4� ;4� ;45 ;45@�,���+�8��" �/%!�0 $� �$ $ 32� 2�4 4� 6 -"���-(� �)�6"��/+"0)?�����! 6�/+">-0� �� �"�'��?� ����"�",���+� �/% �0� 6���"�! ��� ��� � 6���-"��� �% �0�!-"� ��-����/+"0!D=�!"����,�<��? 6%*=����+��"����%�,� �34 �21 243%*$=�-"� �$����+�%�%*�=�-"� ������+�%�%*,=�,�<��? 6�%� �34 �21 243"*=�-��� �/-0 5;4 5;� 2;�"*=���-"� �/-0"7�/-0 1;3 1;1 �;�! �E, , �+� �: �3 �� $ ����!��"��/% �>�0 12� �52 $ 5
��� �"���=�(� �B &'�$ �'�$ �'�� �'�$ �'��.�,� ���" 2 $42 153 1$4 $5�.�,� �( +" $� $ .�,� �����" �$ 4��@ 243 $ 5 $� $� $� .�,� �"��*!��"� ; 4 ; ;�$ ;$� ;$ F, , �( ��"���3"��/+"0 � *��"���� ��/-0 $1;$ ;$ ; ; ; (� �(�� ' ��!!������ ��/-0 $1;$ ; ; �!!�����(�� '
��" �- �"�����,�����% �� �� �� ;3��" �- �"����*!��"���"��C"���� �1;�: �*��( % ��+�� �%�� � ����-�-�� ���6�/���0 $3
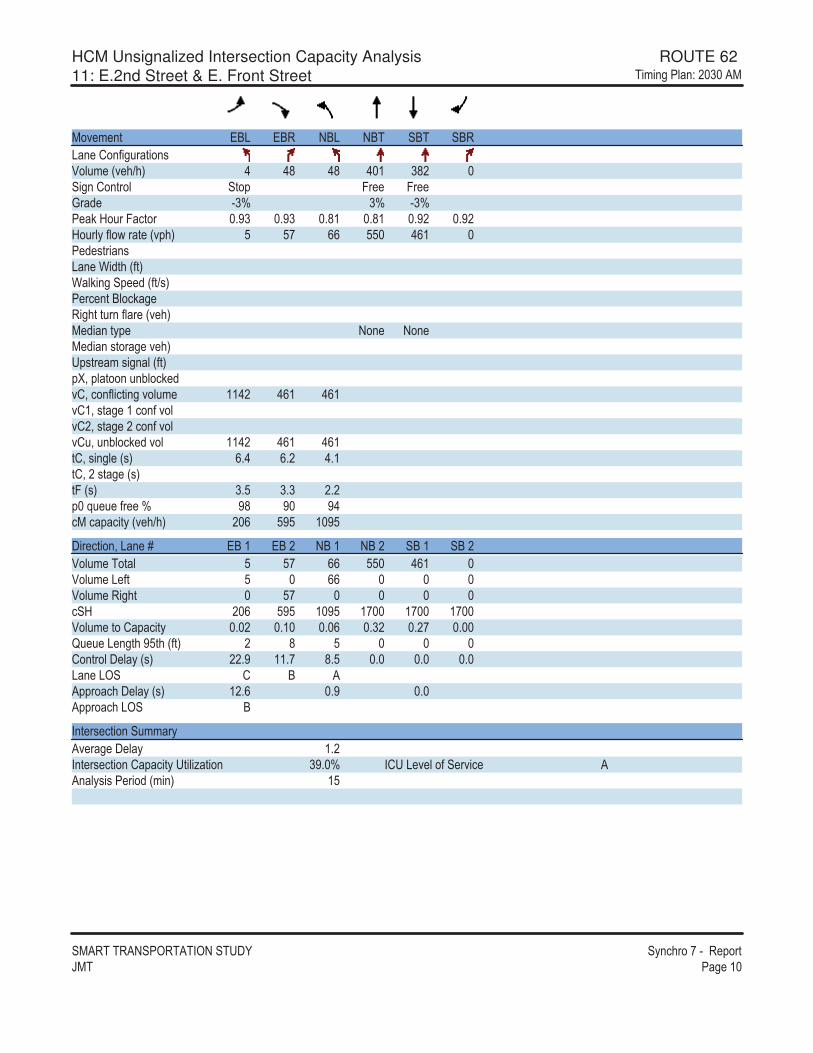
HCM Unsignalized Intersection Capacity Analysis ROUTE 62 11: E.2nd Street & E. Front Street ������������ 1 ���
�������������������������� �������������� !��"#�� �� �$
��% � �" &'( &'� �'( �'� �'� �'�(� �*��+��,�"���-.�,� �/% �>�0 2 24 24 2 $ 14� �����*��"�� �"�! 7� 7� 9�6 �1: 1: �1:� ?�@�,��7�"�� ;�1 ;�1 ;4$ ;4$ ;�� ;��@�,���+�8��" �/%!�0 3 3� 55 33 25$ � 6 -"���-(� �)�6"��/+"0)?�����! 6�/+">-0� �� �"�'��?� ����"�",���+� �/% �0� 6���"�! ��� ��� � 6���-"��� �% �0�!-"� ��-����/+"0!D=�!"����,�<��? 6%*=����+��"����%�,� $$2� 25$ 25$%*$=�-"� �$����+�%�%*�=�-"� ������+�%�%*,=�,�<��? 6�%� $$2� 25$ 25$"*=�-��� �/-0 5;2 5;� 2;$"*=���-"� �/-0"7�/-0 1;3 1;1 �;�! �E, , �+� �: �4 � �2����!��"��/% �>�0 � 5 3�3 $ �3
��� �"���=�(� �B &'�$ &'�� �'�$ �'�� �'�$ �'��.�,� ���" 3 3� 55 33 25$ .�,� �( +" 3 55 .�,� �����" 3� ��@ � 5 3�3 $ �3 $� $� $� .�,� �"��*!��"� ; � ;$ ; 5 ;1� ;�� ; F, , �( ��"���3"��/+"0 � 4 3 *��"���� ��/-0 ��;� $$;� 4;3 ; ; ; (� �(�� * ' ��!!������ ��/-0 $�;5 ;� ; �!!�����(�� '
��" �- �"�����,�����% �� �� �� $;���" �- �"����*!��"���"��C"���� 1�; : �*��( % ��+�� �%�� � ����-�-�� ���6�/���0 $3

HCM Unsignalized Intersection Capacity Analysis ROUTE 62 12: E.2nd Street & Wilson Avenue ������������ 1 ���
�������������������������� �������������� !��"#�� �� �$$
��% � �" )'( )'� �'� �'� �'( �'�(� �*��+��,�"���-.�,� �/% �>�0 �1 $ 2� �3 $ 1 1������*��"�� �"�! 7� 7� 9�6 : : :� ?�@�,��7�"�� ;43 ;43 ;�4 ;�4 ;�5 ;�5@�,���+�8��" �/%!�0 1 $1$ 5� 15 $3 2�� 6 -"���- 2 � �(� �)�6"��/+"0 $�; $�; $�; )?�����! 6�/+">-0 2; 2; 2; � �� �"�'��?� $����"�",���+� �/% �0� 6���"�! ��� ��� � 6���-"��� �% �0�!-"� ��-����/+"0!D=�!"����,�<��? 6%*=����+��"����%�,� 2� �4 $ 5%*$=�-"� �$����+�%�%*�=�-"� ������+�%�%*,=�,�<��? 6�%� 2� �4 $ 5"*=�-��� �/-0 5;2 5;� 2;$"*=���-"� �/-0"7�/-0 1;3 1;1 �;�! �E, , �+� �: �2 4� � ����!��"��/% �>�0 3�� ��2 $24
��� �"���=�(� �B )'�$ �'�$ �'�� �'�$.�,� ���" $5$ 5� 15 $��.�,� �( +" 1 $3 .�,� �����" $1$ 15 ��@ 42$ $� $� $24 .�,� �"��*!��"� ;$� ; 2 ; � ;$ F, , �( ��"���3"��/+"0 $4 4*��"���� ��/-0 $ ;1 ; ; 5;$(� �(�� ' ��!!������ ��/-0 $ ;1 ; 5;$�!!�����(�� '
��" �- �"�����,�����% �� �� �� 5;���" �- �"����*!��"���"��C"���� 1$;1: �*��( % ��+�� �%�� � ����-�-�� ���6�/���0 $3
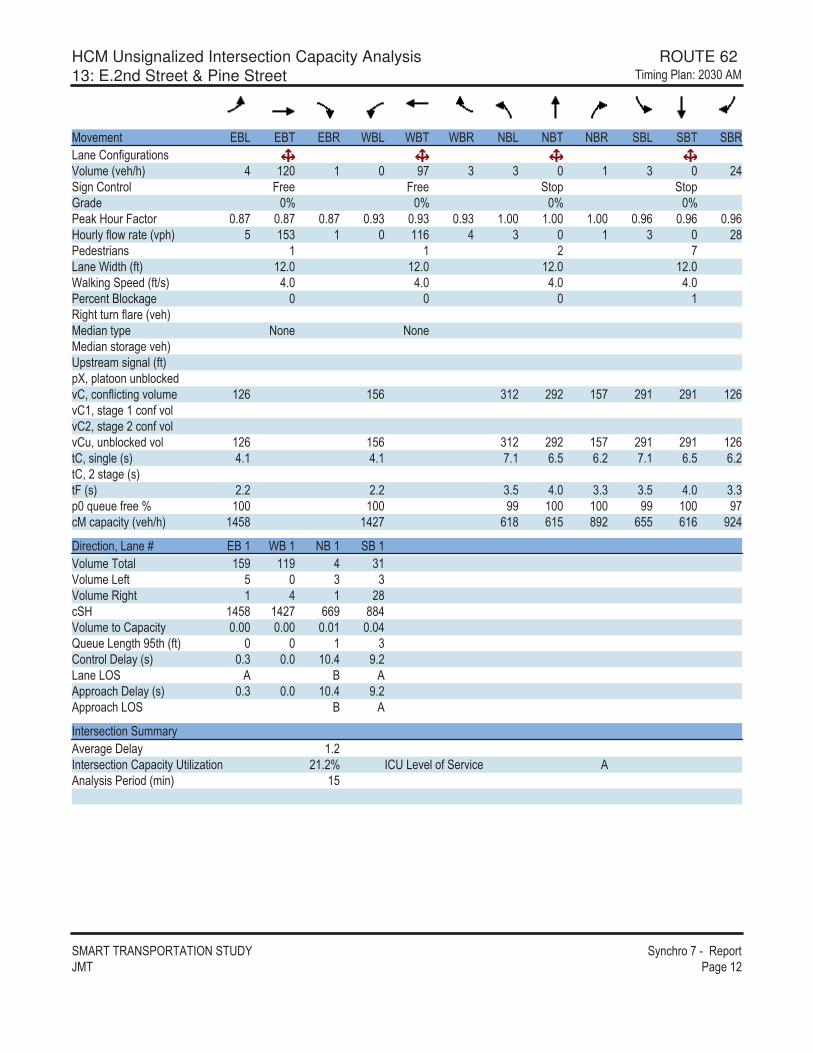
HCM Unsignalized Intersection Capacity Analysis ROUTE 62 13: E.2nd Street & Pine Street ������������ 1 ���
�������������������������� �������������� !��"#�� �� �$�
��% � �" &'( &'� &'� )'( )'� )'� �'( �'� �'� �'( �'� �'�(� �*��+��,�"���-.�,� �/% �>�0 2 $� $ �� 1 1 $ 1 �2�����*��"�� 7� 7� �"�! �"�!9�6 : : : :� ?�@�,��7�"�� ;4� ;4� ;4� ;�1 ;�1 ;�1 $; $; $; ;�5 ;�5 ;�5@�,���+�8��" �/%!�0 3 $31 $ $$5 2 1 $ 1 �4� 6 -"���- $ $ � �(� �)�6"��/+"0 $�; $�; $�; $�; )?�����! 6�/+">-0 2; 2; 2; 2; � �� �"�'��?� $����"�",���+� �/% �0� 6���"�! ��� ��� � 6���-"��� �% �0�!-"� ��-����/+"0!D=�!"����,�<��? 6%*=����+��"����%�,� $�5 $35 1$� ��� $3� ��$ ��$ $�5%*$=�-"� �$����+�%�%*�=�-"� ������+�%�%*,=�,�<��? 6�%� $�5 $35 1$� ��� $3� ��$ ��$ $�5"*=�-��� �/-0 2;$ 2;$ �;$ 5;3 5;� �;$ 5;3 5;�"*=���-"� �/-0"7�/-0 �;� �;� 1;3 2; 1;1 1;3 2; 1;1! �E, , �+� �: $ $ �� $ $ �� $ ������!��"��/% �>�0 $234 $2�� 5$4 5$3 4�� 533 5$5 ��2
��� �"���=�(� �B &'�$ )'�$ �'�$ �'�$.�,� ���" $3� $$� 2 1$.�,� �( +" 3 1 1.�,� �����" $ 2 $ �4��@ $234 $2�� 55� 442.�,� �"��*!��"� ; ; ; $ ; 2F, , �( ��"���3"��/+"0 $ 1*��"���� ��/-0 ;1 ; $ ;2 �;�(� �(�� � ' ��!!������ ��/-0 ;1 ; $ ;2 �;��!!�����(�� ' �
��" �- �"�����,�����% �� �� �� $;���" �- �"����*!��"���"��C"���� �$;�: �*��( % ��+�� �%�� � ����-�-�� ���6�/���0 $3
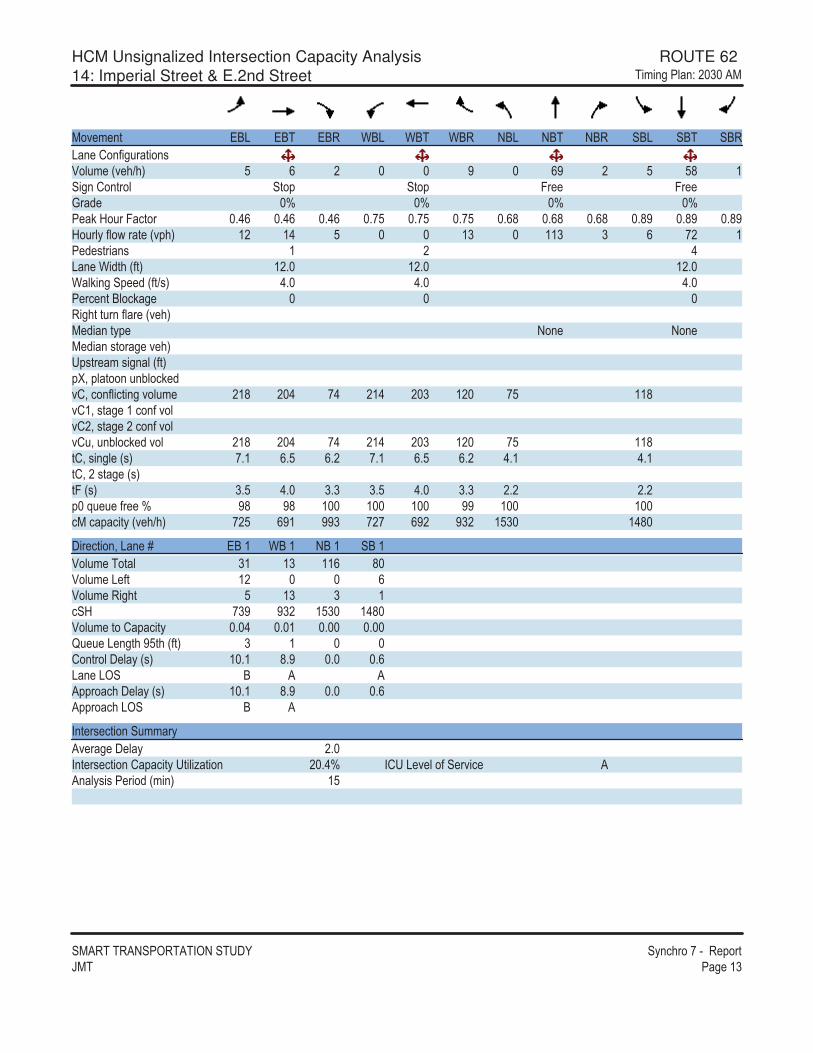
HCM Unsignalized Intersection Capacity Analysis ROUTE 62 14: Imperial Street & E.2nd Street ������������ 1 ���
�������������������������� �������������� !��"#�� �� �$1
��% � �" &'( &'� &'� )'( )'� )'� �'( �'� �'� �'( �'� �'�(� �*��+��,�"���-.�,� �/% �>�0 3 5 � � 5� � 3 34 $�����*��"�� �"�! �"�! 7� 7� 9�6 : : : :� ?�@�,��7�"�� ;25 ;25 ;25 ;�3 ;�3 ;�3 ;54 ;54 ;54 ;4� ;4� ;4�@�,���+�8��" �/%!�0 $� $2 3 $1 $$1 1 5 �� $� 6 -"���- $ � 2(� �)�6"��/+"0 $�; $�; $�; )?�����! 6�/+">-0 2; 2; 2; � �� �"�'��?� ����"�",���+� �/% �0� 6���"�! ��� ��� � 6���-"��� �% �0�!-"� ��-����/+"0!D=�!"����,�<��? 6%*=����+��"����%�,� �$4 � 2 �2 �$2 � 1 $� �3 $$4%*$=�-"� �$����+�%�%*�=�-"� ������+�%�%*,=�,�<��? 6�%� �$4 � 2 �2 �$2 � 1 $� �3 $$4"*=�-��� �/-0 �;$ 5;3 5;� �;$ 5;3 5;� 2;$ 2;$"*=���-"� �/-0"7�/-0 1;3 2; 1;1 1;3 2; 1;1 �;� �;�! �E, , �+� �: �4 �4 $ $ $ �� $ $ ����!��"��/% �>�0 ��3 5�$ ��1 ��� 5�� �1� $31 $24
��� �"���=�(� �B &'�$ )'�$ �'�$ �'�$.�,� ���" 1$ $1 $$5 4 .�,� �( +" $� 5.�,� �����" 3 $1 1 $��@ �1� �1� $31 $24 .�,� �"��*!��"� ; 2 ; $ ; ; F, , �( ��"���3"��/+"0 1 $ *��"���� ��/-0 $ ;$ 4;� ; ;5(� �(�� ' � ��!!������ ��/-0 $ ;$ 4;� ; ;5�!!�����(�� ' �
��" �- �"�����,�����% �� �� �� �; ��" �- �"����*!��"���"��C"���� � ;2: �*��( % ��+�� �%�� � ����-�-�� ���6�/���0 $3
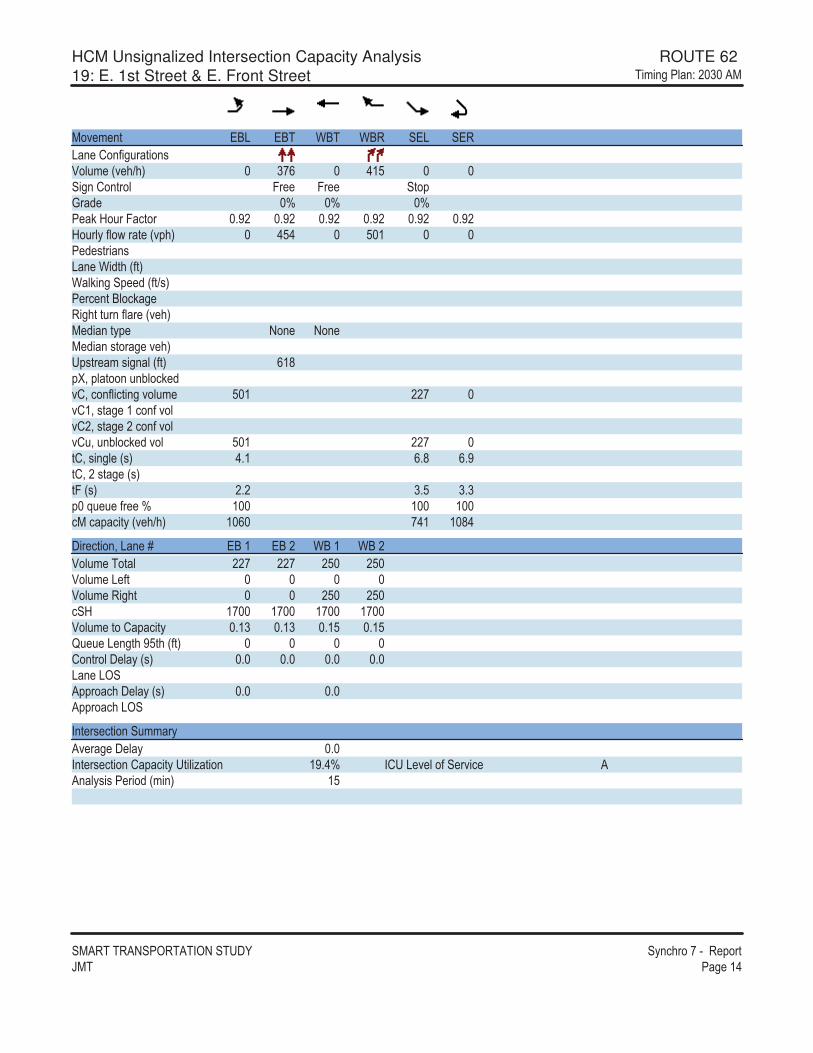
HCM Unsignalized Intersection Capacity Analysis ROUTE 62 19: E. 1st Street & E. Front Street ������������ 1 ���
�������������������������� �������������� !��"#�� �� �$2
��% � �" &'( &'� )'� )'� �&( �&�(� �*��+��,�"���-.�,� �/% �>�0 1�5 2$3 �����*��"�� 7� 7� �"�!9�6 : : :� ?�@�,��7�"�� ;�� ;�� ;�� ;�� ;�� ;��@�,���+�8��" �/%!�0 232 3 $ � 6 -"���-(� �)�6"��/+"0)?�����! 6�/+">-0� �� �"�'��?� ����"�",���+� �/% �0� 6���"�! ��� ��� � 6���-"��� �% �0�!-"� ��-����/+"0 5$4!D=�!"����,�<��? 6%*=����+��"����%�,� 3 $ ��� %*$=�-"� �$����+�%�%*�=�-"� ������+�%�%*,=�,�<��? 6�%� 3 $ ��� "*=�-��� �/-0 2;$ 5;4 5;�"*=���-"� �/-0"7�/-0 �;� 1;3 1;1! �E, , �+� �: $ $ $ ����!��"��/% �>�0 $ 5 �2$ $ 42
��� �"���=�(� �B &'�$ &'�� )'�$ )'��.�,� ���" ��� ��� �3 �3 .�,� �( +" .�,� �����" �3 �3 ��@ $� $� $� $� .�,� �"��*!��"� ;$1 ;$1 ;$3 ;$3F, , �( ��"���3"��/+"0 *��"���� ��/-0 ; ; ; ; (� �(���!!������ ��/-0 ; ; �!!�����(��
��" �- �"�����,�����% �� �� �� ; ��" �- �"����*!��"���"��C"���� $�;2: �*��( % ��+�� �%�� � ����-�-�� ���6�/���0 $3
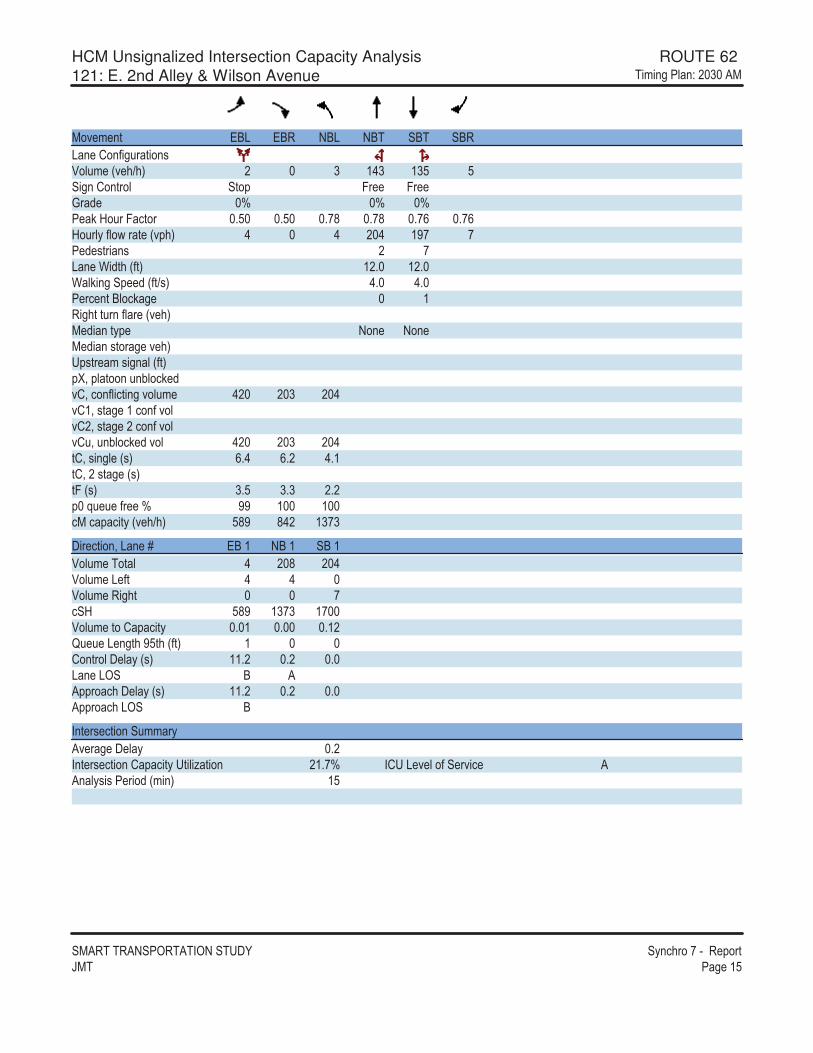
HCM Unsignalized Intersection Capacity Analysis ROUTE 62 121: E. 2nd Alley & Wilson Avenue ������������ 1 ���
�������������������������� �������������� !��"#�� �� �$3
��% � �" &'( &'� �'( �'� �'� �'�(� �*��+��,�"���-.�,� �/% �>�0 � 1 $21 $13 3�����*��"�� �"�! 7� 7� 9�6 : : :� ?�@�,��7�"�� ;3 ;3 ;�4 ;�4 ;�5 ;�5@�,���+�8��" �/%!�0 2 2 � 2 $�� �� 6 -"���- � �(� �)�6"��/+"0 $�; $�; )?�����! 6�/+">-0 2; 2; � �� �"�'��?� $����"�",���+� �/% �0� 6���"�! ��� ��� � 6���-"��� �% �0�!-"� ��-����/+"0!D=�!"����,�<��? 6%*=����+��"����%�,� 2� � 1 � 2%*$=�-"� �$����+�%�%*�=�-"� ������+�%�%*,=�,�<��? 6�%� 2� � 1 � 2"*=�-��� �/-0 5;2 5;� 2;$"*=���-"� �/-0"7�/-0 1;3 1;1 �;�! �E, , �+� �: �� $ $ ����!��"��/% �>�0 34� 42� $1�1
��� �"���=�(� �B &'�$ �'�$ �'�$.�,� ���" 2 � 4 � 2.�,� �( +" 2 2 .�,� �����" ���@ 34� $1�1 $� .�,� �"��*!��"� ; $ ; ;$�F, , �( ��"���3"��/+"0 $ *��"���� ��/-0 $$;� ;� ; (� �(�� ' ��!!������ ��/-0 $$;� ;� ; �!!�����(�� '
��" �- �"�����,�����% �� �� �� ;���" �- �"����*!��"���"��C"���� �$;�: �*��( % ��+�� �%�� � ����-�-�� ���6�/���0 $3
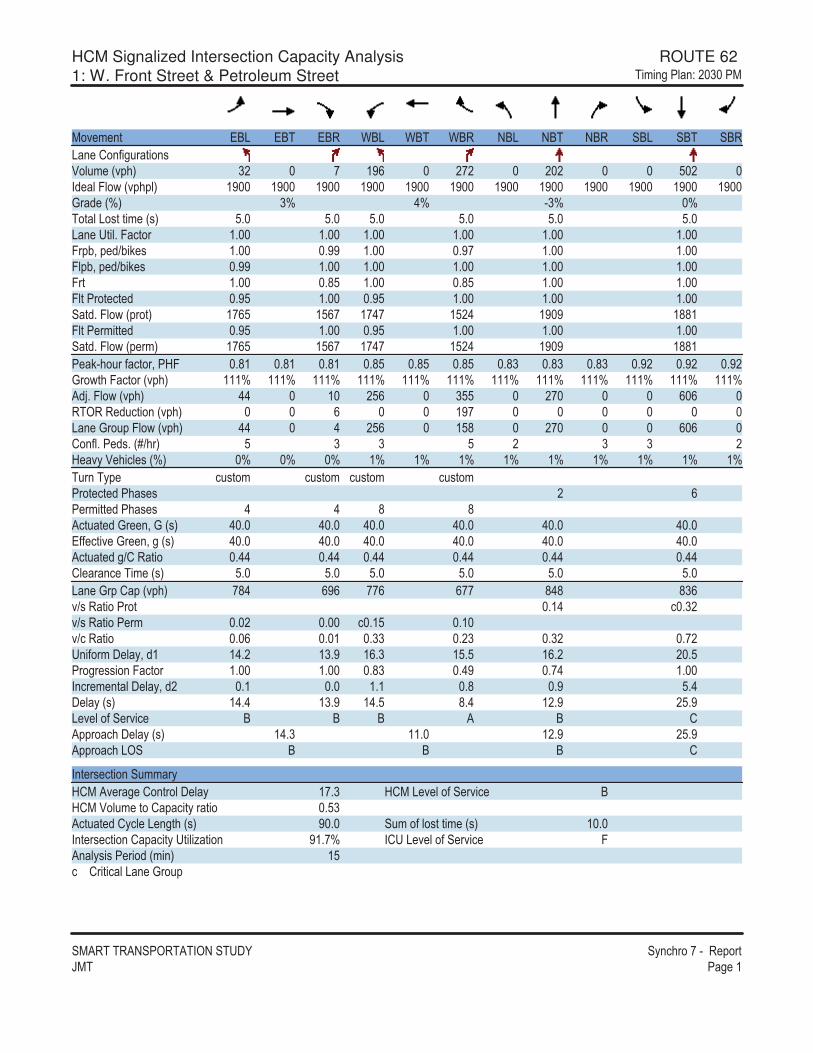
HCM Signalized Intersection Capacity Analysis ROUTE 62 1: W. Front Street & Petroleum Street ������������ 1 ���
�������������������������� �������������� !��"#�� �� �$
��% � �" &'( &'� &'� )'( )'� )'� �'( �'� �'� �'( �'� �'�(� �*��+��,�"���-.�,� �/%!�0 1� � $�5 ��� � � 3 � �6 �7�8�/%!�!0 $� $� $� $� $� $� $� $� $� $� $� $� 9�6 �/:0 1: 2: �1: :��"�(�-"�"�� �/-0 3; 3; 3; 3; 3; 3; (� ��"�;�7�"�� $; $; $; $; $; $; 7�!<=�! 6><�? - $; ;�� $; ;�� $; $; 7!<=�! 6><�? - ;�� $; $; $; $; $; 7�" $; ;43 $; ;43 $; $; 7"����" �" 6 ;�3 $; ;�3 $; $; $; �"6;�7�8�/!��"0 $�53 $35� $�2� $3�2 $� � $44$7"�� ���"" 6 ;�3 $; ;�3 $; $; $; �"6;�7�8�/! ��0 $�53 $35� $�2� $3�2 $� � $44$� ?���,��+�"��=��@7 ;4$ ;4$ ;4$ ;43 ;43 ;43 ;41 ;41 ;41 ;�� ;�� ;��9��8"��7�"���/%!�0 $$$: $$$: $$$: $$$: $$$: $$$: $$$: $$$: $$$: $$$: $$$: $$$:�6A;�7�8�/%!�0 22 $ �35 133 �� 5 5 ������ 6,�"����/%!�0 5 $�� (� �9��,!�7�8�/%!�0 22 2 �35 $34 �� 5 5 *��+;�� 6-;�/B>��0 3 1 1 3 � 1 1 �@ %��. ��� -�/:0 : : : $: $: $: $: $: $: $: $: $:�,�����! �,-"�� �,-"�� �,-"�� �,-"�����" �" 6���- - � 5� ���"" 6���- - 2 2 4 4��"," 6�9� �=�9�/-0 2 ; 2 ; 2 ; 2 ; 2 ; 2 ; &++ �"�% �9� �=���/-0 2 ; 2 ; 2 ; 2 ; 2 ; 2 ; ��"," 6��>*��"�� ;22 ;22 ;22 ;22 ;22 ;22* ��� ���� �/-0 3; 3; 3; 3; 3; 3; (� �9�!�*!�/%!�0 �42 5�5 ��5 5�� 424 415%>-��"������" ;$2 � ;1�%>-��"���� �� ; � ; � ;$3 ;$ %>���"�� ; 5 ; $ ;11 ;�1 ;1� ;�����+����� �=�6$ $2;� $1;� $5;1 $3;3 $5;� � ;3����� --����7�"�� $; $; ;41 ;2� ;�2 $; ���� � �"�� �=�6� ;$ ; $;$ ;4 ;� 3;2� ��/-0 $2;2 $1;� $2;3 4;2 $�;� �3;�( % ��+�� �%�� ' ' ' � ' *�!!������ ��/-0 $2;1 $$; $�;� �3;��!!�����(�� ' ' ' *
��" �- �"�����,����@*���% �� �*��"���� � $�;1 @*��( % ��+�� �%�� '@*��.�,� �"��*!��"���"�� ;31��"," 6�*�� �( ��"��/-0� � ; �,���+��-"�"�� �/-0 $ ; ��" �- �"����*!��"���"��C"��� �$;�: �*��( % ��+�� �%�� 7���-�-�� ���6�/���0 $3�����*��"���(� �9��,!

HCM Unsignalized Intersection Capacity Analysis ROUTE 62 2: W. Front Street & Central Avenue ������������ 1 ���
�������������������������� �������������� !��"#�� �� ��
��% � �" &'� &'� )'( )'� �'( �'�(� �*��+��,�"���-.�,� �/% �>�0 $5� 144 4� �����*��"�� 7� 7� �"�!9�6 �2: $: �1:� ?�@�,��7�"�� ;�� ;�� ;�$ ;�$ ;�� ;��@�,���+�8��" �/%!�0 � 2 2�1 $$3 � 6 -"���- 1 $(� �)�6"��/+"0 ; $�; )?�����! 6�/+">-0 2; 2; � �� �"�'��?� ����"�",���+� �/% �0� 6���"�! ��� ��� � 6���-"��� �% �0�!-"� ��-����/+"0 14 145!D=�!"����,�<��? 6%*=����+��"����%�,� $ 524 $%*$=�-"� �$����+�%�%*�=�-"� ������+�%�%*,=�,�<��? 6�%� $ 524 $"*=�-��� �/-0 2;$ 5;4 5;�"*=���-"� �/-0"7�/-0 �;� 1;3 1;1! �E, , �+� �: 4� 54 $ ����!��"��/% �>�0 $5$� 135 $ 44
��� �"���=�(� �B )'�$ )'�� �'�$.�,� ���" 15$ 1$5 $$3.�,� �( +" � 2 $$3.�,� �����" ��@ $5$� $� 135.�,� �"��*!��"� ;$1 ;$� ;1�F, , �( ��"���3"��/+"0 $$ 12*��"���� ��/-0 2;� ; $�;�(� �(�� � *�!!������ ��/-0 �;3 $�;��!!�����(�� *
��" �- �"�����,�����% �� �� �� 3; ��" �- �"����*!��"���"��C"���� 4 ;4: �*��( % ��+�� �%�� � ����-�-�� ���6�/���0 $3
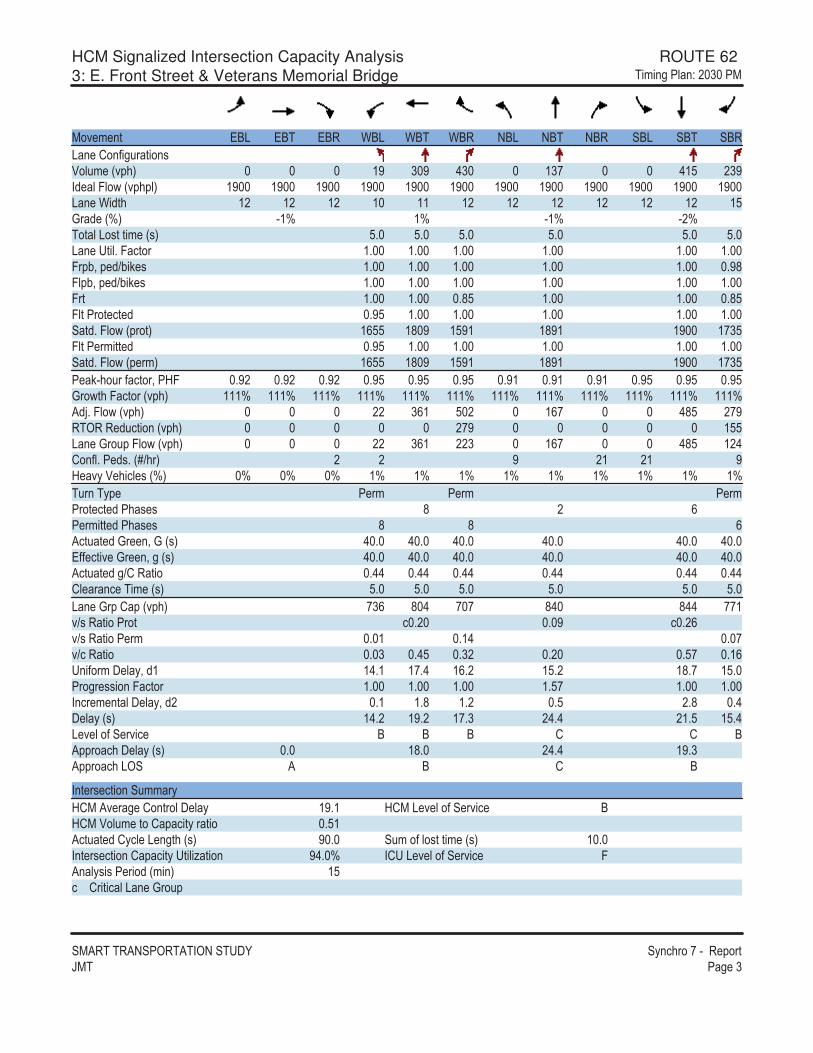
HCM Signalized Intersection Capacity Analysis ROUTE 62 3: E. Front Street & Veterans Memorial Bridge ������������ 1 ���
�������������������������� �������������� !��"#�� �� �1
��% � �" &'( &'� &'� )'( )'� )'� �'( �'� �'� �'( �'� �'�(� �*��+��,�"���-.�,� �/%!�0 $� 1 � 21 $1� 2$3 �1��6 �7�8�/%!�!0 $� $� $� $� $� $� $� $� $� $� $� $� (� �)�6"�� $� $� $� $ $$ $� $� $� $� $� $� $39�6 �/:0 �$: $: �$: ��:��"�(�-"�"�� �/-0 3; 3; 3; 3; 3; 3; (� ��"�;�7�"�� $; $; $; $; $; $; 7�!<=�! 6><�? - $; $; $; $; $; ;�47!<=�! 6><�? - $; $; $; $; $; $; 7�" $; $; ;43 $; $; ;437"����" �" 6 ;�3 $; $; $; $; $; �"6;�7�8�/!��"0 $533 $4 � $3�$ $4�$ $� $�137"�� ���"" 6 ;�3 $; $; $; $; $; �"6;�7�8�/! ��0 $533 $4 � $3�$ $4�$ $� $�13� ?���,��+�"��=��@7 ;�� ;�� ;�� ;�3 ;�3 ;�3 ;�$ ;�$ ;�$ ;�3 ;�3 ;�39��8"��7�"���/%!�0 $$$: $$$: $$$: $$$: $$$: $$$: $$$: $$$: $$$: $$$: $$$: $$$:�6A;�7�8�/%!�0 �� 15$ 3 � $5� 243 ��������� 6,�"����/%!�0 ��� $33(� �9��,!�7�8�/%!�0 �� 15$ ��1 $5� 243 $�2*��+;�� 6-;�/B>��0 � � � �$ �$ �@ %��. ��� -�/:0 : : : $: $: $: $: $: $: $: $: $:�,�����! � �� � �� � �����" �" 6���- - 4 � 5� ���"" 6���- - 4 4 5��"," 6�9� �=�9�/-0 2 ; 2 ; 2 ; 2 ; 2 ; 2 ; &++ �"�% �9� �=���/-0 2 ; 2 ; 2 ; 2 ; 2 ; 2 ; ��"," 6��>*��"�� ;22 ;22 ;22 ;22 ;22 ;22* ��� ���� �/-0 3; 3; 3; 3; 3; 3; (� �9�!�*!�/%!�0 �15 4 2 � � 42 422 ��$%>-��"������" � ;� ; � � ;�5%>-��"���� �� ; $ ;$2 ; �%>���"�� ; 1 ;23 ;1� ;� ;3� ;$5���+����� �=�6$ $2;$ $�;2 $5;� $3;� $4;� $3; ����� --����7�"�� $; $; $; $;3� $; $; ���� � �"�� �=�6� ;$ $;4 $;� ;3 �;4 ;2� ��/-0 $2;� $�;� $�;1 �2;2 �$;3 $3;2( % ��+�� �%�� ' ' ' * * '�!!������ ��/-0 ; $4; �2;2 $�;1�!!�����(�� � ' * '
��" �- �"�����,����@*���% �� �*��"���� � $�;$ @*��( % ��+�� �%�� '@*��.�,� �"��*!��"���"�� ;3$��"," 6�*�� �( ��"��/-0� � ; �,���+��-"�"�� �/-0 $ ; ��" �- �"����*!��"���"��C"��� �2; : �*��( % ��+�� �%�� 7���-�-�� ���6�/���0 $3�����*��"���(� �9��,!
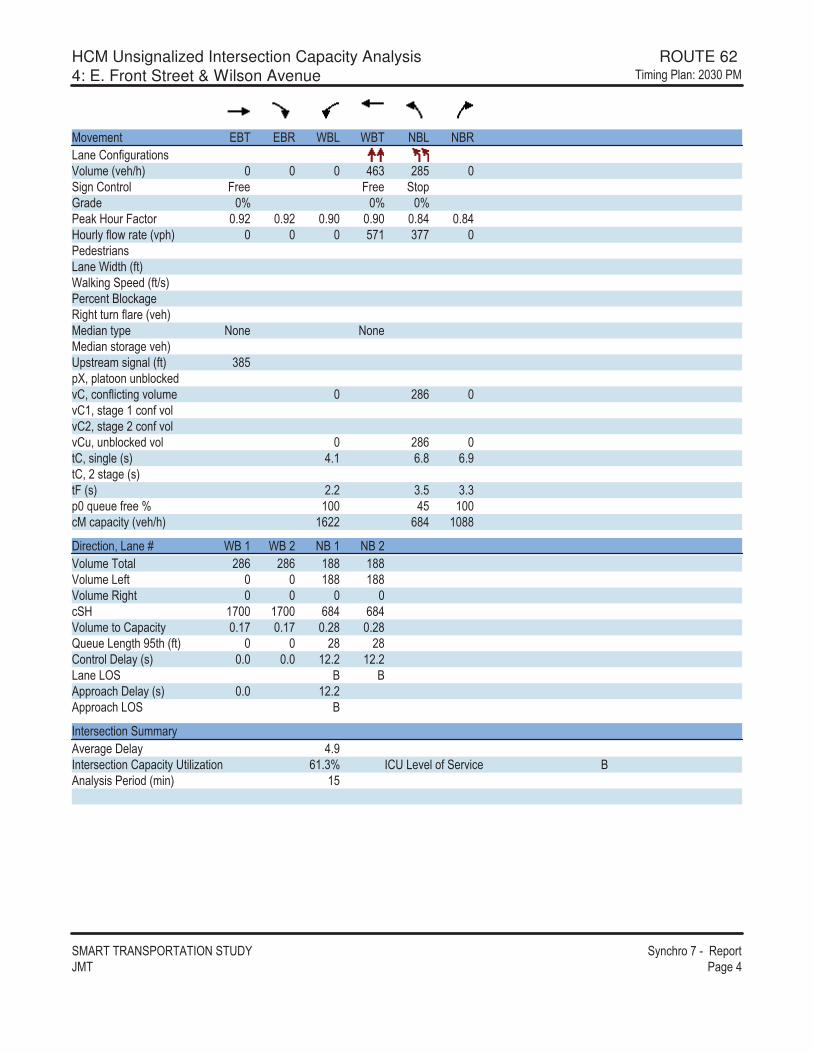
HCM Unsignalized Intersection Capacity Analysis ROUTE 62 4: E. Front Street & Wilson Avenue ������������ 1 ���
�������������������������� �������������� !��"#�� �� �2
��% � �" &'� &'� )'( )'� �'( �'�(� �*��+��,�"���-.�,� �/% �>�0 251 �43 �����*��"�� 7� 7� �"�!9�6 : : :� ?�@�,��7�"�� ;�� ;�� ;� ;� ;42 ;42@�,���+�8��" �/%!�0 3�$ 1�� � 6 -"���-(� �)�6"��/+"0)?�����! 6�/+">-0� �� �"�'��?� ����"�",���+� �/% �0� 6���"�! ��� ��� � 6���-"��� �% �0�!-"� ��-����/+"0 143!D=�!"����,�<��? 6%*=����+��"����%�,� �45 %*$=�-"� �$����+�%�%*�=�-"� ������+�%�%*,=�,�<��? 6�%� �45 "*=�-��� �/-0 2;$ 5;4 5;�"*=���-"� �/-0"7�/-0 �;� 1;3 1;1! �E, , �+� �: $ 23 $ ����!��"��/% �>�0 $5�� 542 $ 44
��� �"���=�(� �B )'�$ )'�� �'�$ �'��.�,� ���" �45 �45 $44 $44.�,� �( +" $44 $44.�,� �����" ��@ $� $� 542 542.�,� �"��*!��"� ;$� ;$� ;�4 ;�4F, , �( ��"���3"��/+"0 �4 �4*��"���� ��/-0 ; ; $�;� $�;�(� �(�� ' '�!!������ ��/-0 ; $�;��!!�����(�� '
��" �- �"�����,�����% �� �� �� 2;���" �- �"����*!��"���"��C"���� 5$;1: �*��( % ��+�� �%�� � '���-�-�� ���6�/���0 $3

HCM Signalized Intersection Capacity Analysis ROUTE 62 5: W. 1st Street & Petroleum Street ������������ 1 ���
�������������������������� �������������� !��"#�� �� �3
��% � �" &'( &'� &'� )'( )'� )'� �'( �'� �'� �'( �'� �'�(� �*��+��,�"���-.�,� �/%!�0 $�2 $3$ 1 5 12 5 1$4 3� 12$�6 �7�8�/%!�!0 $� $� $� $� $� $� $� $� $� $� $� $� (� �)�6"�� $ $ $� $1 $1 $� $� $2 $� $ $ $�9�6 �/:0 ��: 1: �3: �:��"�(�-"�"�� �/-0 3; 3; 3; 3; 3; (� ��"�;�7�"�� $; $; $; $; $; 7�!<=�! 6><�? - $; $; $; $; $; 7!<=�! 6><�? - ;�5 $; $; $; $; 7�" $; $; ;�4 $; ;4�7"����" �" 6 ;�3 $; ;�� ;�3 $; �"6;�7�8�/!��"0 $5$� $�5� � � $5$ $2�27"�� ���"" 6 ;�3 $; ;�$ ;�3 $; �"6;�7�8�/! ��0 $5$� $�5� $432 $5$ $2�2� ?���,��+�"��=��@7 ;4 ;4 ;4 ;�� ;�� ;�� ;54 ;54 ;54 ;�2 ;�2 ;�29��8"��7�"���/%!�0 $$$: $$$: $$$: $$$: $$$: $$$: $$$: $$$: $$$: $$$: $$$: $$$:�6A;�7�8�/%!�0 �2$ �$ 2 $ 35 $ 1�5 5$ 2 1������ 6,�"����/%!�0 $3� (� �9��,!�7�8�/%!�0 �2$ �$2 �5 1�5 1 � *��+;�� 6-;�/B>��0 $1 1 1 $1 � �@ %��. ��� -�/:0 $: $: $: �: �: �: : : : $: $: $:�,�����! � �� � �� ���"���" �" 6���- - 2 � $ 5� ���"" 6���- - 2 ���"," 6�9� �=�9�/-0 �3; �3; $3; 13; 33; &++ �"�% �9� �=���/-0 �3; �3; $3; 13; 33; ��"," 6��>*��"�� ;�4 ;�4 ;$� ;1� ;5$* ��� ���� �/-0 3; 3; 3; 3; 3; (� �9�!�*!�/%!�0 23 2�$ 1 � 5�5 � $%>-��"������" ;$� � ;�1 � ;�$%>-��"���� �� � ;$3 ; 2%>���"�� ;32 ;22 ;�3 ;5 ;12���+����� �=�6$ ��;5 �5;� 1�;5 �$;� 4;5����� --����7�"�� $; $; $; $;�$ 3; ����� � �"�� �=�6� 2;3 �;4 $;� 1;2 ;4� ��/-0 1�;$ ��;3 12;3 1 ; 22;3( % ��+�� �%�� * * * * ��!!������ ��/-0 1 ;� ; 12;3 14; �!!�����(�� * � * �
��" �- �"�����,����@*���% �� �*��"���� � 13;2 @*��( % ��+�� �%�� �@*��.�,� �"��*!��"���"�� ;3 ��"," 6�*�� �( ��"��/-0� � ; �,���+��-"�"�� �/-0 $ ; ��" �- �"����*!��"���"��C"��� �3; : �*��( % ��+�� �%�� ����-�-�� ���6�/���0 $3�����*��"���(� �9��,!

HCM Signalized Intersection Capacity Analysis ROUTE 62 6: W. 1st Street & Central Avenue ������������ 1 ���
�������������������������� �������������� !��"#�� �� �5
��% � �" &'( &'� &'� )'( )'� )'� �'( �'� �'� �'( �'� �'�(� �*��+��,�"���-.�,� �/%!�0 �5 1�3 33 24 41 4 4� �6 �7�8�/%!�!0 $� $� $� $� $� $� $� $� $� $� $� $� (� �)�6"�� $� $ $� $� $� $� $� $1 $� $ $ $�9�6 �/:0 �1: $: : 1:��"�(�-"�"�� �/-0 3; 3; 3; 3; (� ��"�;�7�"�� ;�3 $; $; $; 7�!<=�! 6><�? - $; ;�4 $; $; 7!<=�! 6><�? - $; $; ;�� $; 7�" ;�4 ;�$ $; $; 7"����" �" 6 $; $; ;�3 $; �"6;�7�8�/!��"0 1��� $�25 $5�1 $���7"�� ���"" 6 $; $; ;34 $; �"6;�7�8�/! ��0 1��� $�25 �45 $���� ?���,��+�"��=��@7 ;�� ;�� ;�� ;�� ;�� ;�� ;42 ;42 ;42 ;�� ;�� ;��9��8"��7�"���/%!�0 $$$: $$$: $$$: $$$: $$$: $$$: $$$: $$$: $$$: $$$: $$$: $$$:�6A;�7�8�/%!�0 1$ 2�� 55 51 $$ $$� $$3 ������ 6,�"����/%!�0 4 45 (� �9��,!�7�8�/%!�0 355 4� $$� $$3 *��+;�� 6-;�/B>��0 $2 � � $2 $1 $$ $$ $1@ %��. ��� -�/:0 �: �: �: �: �: �: $: $: $: $: $: $:�,�����! � �� � �����" �" 6���- - 2 � 5� ���"" 6���- - 2 5��"," 6�9� �=�9�/-0 3 ;1 $�;� $�;� $�;�&++ �"�% �9� �=���/-0 3 ;1 $�;� $�;� $�;���"," 6��>*��"�� ;5� ;$4 ;$4 ;$4* ��� ���� �/-0 3; 3; 3; 3; . ��� �&G" �-����/-0 1; 1; 1; 1; (� �9�!�*!�/%!�0 ��24 1 4 $�2 1 3%>-��"������" ; 3 ; �%>-��"���� �� ;$� � ;$$%>���"�� ;�3 ;�4 ;52 ;14���+����� �=�6$ 2;1 �5;$ �4; �5;5����� --����7�"�� $; $; $; $; ���� � �"�� �=�6� ;1 ;3 �;� ;4� ��/-0 2;5 �5;5 13;� ��;2( % ��+�� �%�� � * � *�!!������ ��/-0 2;5 ; �5;5 1$;5�!!�����(�� � � * *
��" �- �"�����,����@*���% �� �*��"���� � $2;4 @*��( % ��+�� �%�� '@*��.�,� �"��*!��"���"�� ;11��"," 6�*�� �( ��"��/-0� �1;� �,���+��-"�"�� �/-0 $ ; ��" �- �"����*!��"���"��C"��� 53;1: �*��( % ��+�� �%�� *���-�-�� ���6�/���0 $3�����*��"���(� �9��,!
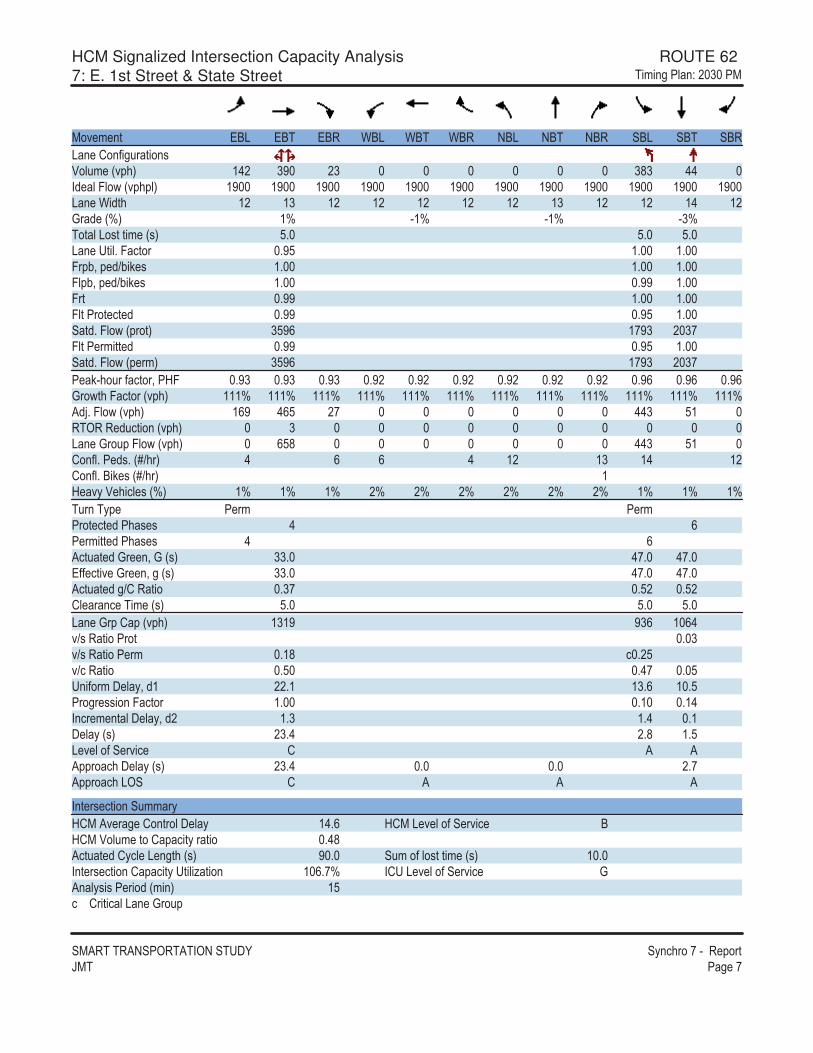
HCM Signalized Intersection Capacity Analysis ROUTE 62 7: E. 1st Street & State Street ������������ 1 ���
�������������������������� �������������� !��"#�� �� ��
��% � �" &'( &'� &'� )'( )'� )'� �'( �'� �'� �'( �'� �'�(� �*��+��,�"���-.�,� �/%!�0 $2� 1� �1 141 22 �6 �7�8�/%!�!0 $� $� $� $� $� $� $� $� $� $� $� $� (� �)�6"�� $� $1 $� $� $� $� $� $1 $� $� $2 $�9�6 �/:0 $: �$: �$: �1:��"�(�-"�"�� �/-0 3; 3; 3; (� ��"�;�7�"�� ;�3 $; $; 7�!<=�! 6><�? - $; $; $; 7!<=�! 6><�? - $; ;�� $; 7�" ;�� $; $; 7"����" �" 6 ;�� ;�3 $; �"6;�7�8�/!��"0 13�5 $��1 � 1�7"�� ���"" 6 ;�� ;�3 $; �"6;�7�8�/! ��0 13�5 $��1 � 1�� ?���,��+�"��=��@7 ;�1 ;�1 ;�1 ;�� ;�� ;�� ;�� ;�� ;�� ;�5 ;�5 ;�59��8"��7�"���/%!�0 $$$: $$$: $$$: $$$: $$$: $$$: $$$: $$$: $$$: $$$: $$$: $$$:�6A;�7�8�/%!�0 $5� 253 �� 221 3$ ������ 6,�"����/%!�0 1 (� �9��,!�7�8�/%!�0 534 221 3$ *��+;�� 6-;�/B>��0 2 5 5 2 $� $1 $2 $�*��+;�'�? -�/B>��0 $@ %��. ��� -�/:0 $: $: $: �: �: �: �: �: �: $: $: $:�,�����! � �� � �����" �" 6���- - 2 5� ���"" 6���- - 2 5��"," 6�9� �=�9�/-0 11; 2�; 2�; &++ �"�% �9� �=���/-0 11; 2�; 2�; ��"," 6��>*��"�� ;1� ;3� ;3�* ��� ���� �/-0 3; 3; 3; (� �9�!�*!�/%!�0 $1$� �15 $ 52%>-��"������" ; 1%>-��"���� �� ;$4 � ;�3%>���"�� ;3 ;2� ; 3���+����� �=�6$ ��;$ $1;5 $ ;3����� --����7�"�� $; ;$ ;$2���� � �"�� �=�6� $;1 $;2 ;$� ��/-0 �1;2 �;4 $;3( % ��+�� �%�� * � ��!!������ ��/-0 �1;2 ; ; �;��!!�����(�� * � � �
��" �- �"�����,����@*���% �� �*��"���� � $2;5 @*��( % ��+�� �%�� '@*��.�,� �"��*!��"���"�� ;24��"," 6�*�� �( ��"��/-0� � ; �,���+��-"�"�� �/-0 $ ; ��" �- �"����*!��"���"��C"��� $ 5;�: �*��( % ��+�� �%�� 9���-�-�� ���6�/���0 $3�����*��"���(� �9��,!
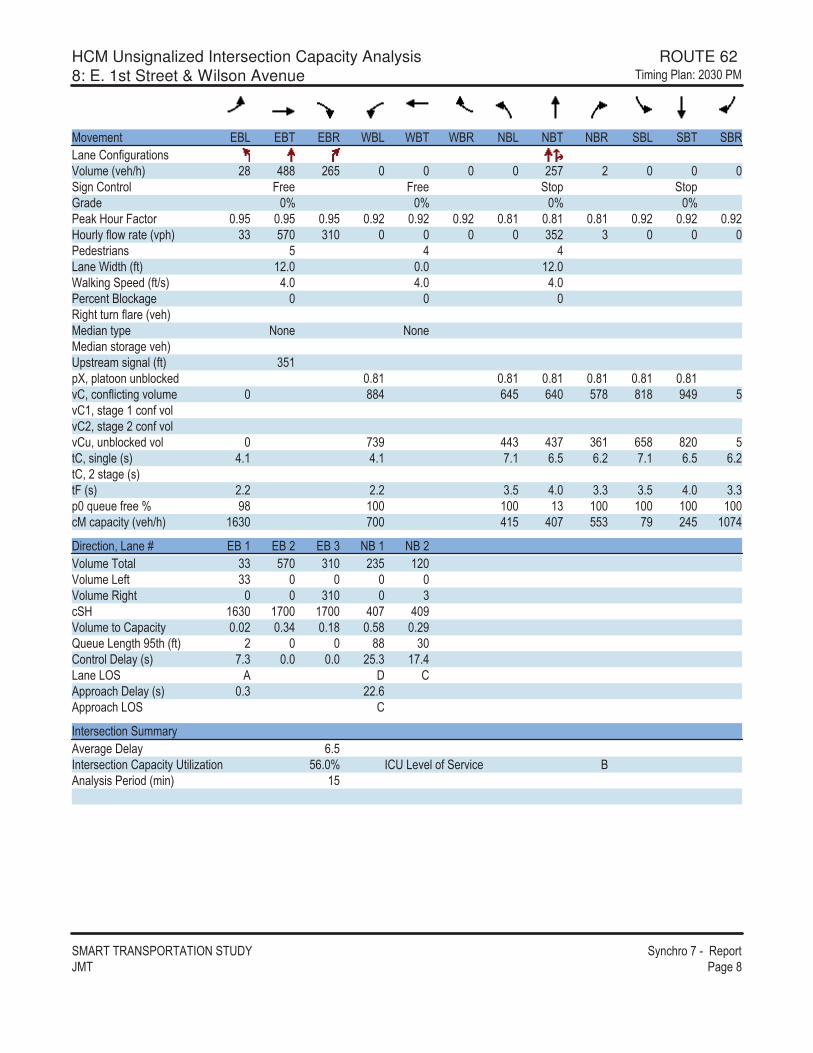
HCM Unsignalized Intersection Capacity Analysis ROUTE 62 8: E. 1st Street & Wilson Avenue ������������ 1 ���
�������������������������� �������������� !��"#�� �� �4
��% � �" &'( &'� &'� )'( )'� )'� �'( �'� �'� �'( �'� �'�(� �*��+��,�"���-.�,� �/% �>�0 �4 244 �53 �3� � �����*��"�� 7� 7� �"�! �"�!9�6 : : : :� ?�@�,��7�"�� ;�3 ;�3 ;�3 ;�� ;�� ;�� ;4$ ;4$ ;4$ ;�� ;�� ;��@�,���+�8��" �/%!�0 11 3� 1$ 13� 1 � 6 -"���- 3 2 2(� �)�6"��/+"0 $�; ; $�; )?�����! 6�/+">-0 2; 2; 2; � �� �"�'��?� ����"�",���+� �/% �0� 6���"�! ��� ��� � 6���-"��� �% �0�!-"� ��-����/+"0 13$!D=�!"����,�<��? 6 ;4$ ;4$ ;4$ ;4$ ;4$ ;4$%*=����+��"����%�,� 442 523 52 3�4 4$4 �2� 3%*$=�-"� �$����+�%�%*�=�-"� ������+�%�%*,=�,�<��? 6�%� �1� 221 21� 15$ 534 4� 3"*=�-��� �/-0 2;$ 2;$ �;$ 5;3 5;� �;$ 5;3 5;�"*=���-"� �/-0"7�/-0 �;� �;� 1;3 2; 1;1 1;3 2; 1;1! �E, , �+� �: �4 $ $ $1 $ $ $ $ ����!��"��/% �>�0 $51 � 2$3 2 � 331 �� �23 $ �2
��� �"���=�(� �B &'�$ &'�� &'�1 �'�$ �'��.�,� ���" 11 3� 1$ �13 $� .�,� �( +" 11 .�,� �����" 1$ 1��@ $51 $� $� 2 � 2 �.�,� �"��*!��"� ; � ;12 ;$4 ;34 ;��F, , �( ��"���3"��/+"0 � 44 1 *��"���� ��/-0 �;1 ; ; �3;1 $�;2(� �(�� � � *�!!������ ��/-0 ;1 ��;5�!!�����(�� *
��" �- �"�����,�����% �� �� �� 5;3��" �- �"����*!��"���"��C"���� 35; : �*��( % ��+�� �%�� � '���-�-�� ���6�/���0 $3

HCM Unsignalized Intersection Capacity Analysis ROUTE 62 10: Imperial Street & E. Front Street ������������ 1 ���
�������������������������� �������������� !��"#�� �� ��
��% � �" &'( &'� �'( �'� �'� �'�(� �*��+��,�"���-.�,� �/% �>�0 15 $4 $ 2�� 2�� $1�����*��"�� �"�! 7� 7� 9�6 : : :� ?�@�,��7�"�� ;�$ ;�$ ;44 ;44 ;�1 ;�1@�,���+�8��" �/%!�0 35 �4 $1 31� 351 $5� 6 -"���-(� �)�6"��/+"0)?�����! 6�/+">-0� �� �"�'��?� ����"�",���+� �/% �0� 6���"�! ��� ��� � 6���-"��� �% �0�!-"� ��-����/+"0!D=�!"����,�<��? 6%*=����+��"����%�,� 455 �4� 3��%*$=�-"� �$����+�%�%*�=�-"� ������+�%�%*,=�,�<��? 6�%� 455 �4� 3��"*=�-��� �/-0 5;4 5;� 2;$"*=���-"� �/-0"7�/-0 1;3 1;1 �;�! �E, , �+� �: 4$ �5 ������!��"��/% �>�0 ��1 �$1 ��$
��� �"���=�(� �B &'�$ �'�$ �'�� �'�$ �'��.�,� ���" 42 $�� 13� 1�5 � 1.�,� �( +" 35 $1 .�,� �����" �4 $5��@ 152 ��$ $� $� $� .�,� �"��*!��"� ;�1 ; $ ;�$ ;�� ;$�F, , �( ��"���3"��/+"0 �� $ *��"���� ��/-0 $�;4 ;� ; ; ; (� �(�� * ��!!������ ��/-0 $�;4 ;� ; �!!�����(�� *
��" �- �"�����,�����% �� �� �� $;1��" �- �"����*!��"���"��C"���� 1$;�: �*��( % ��+�� �%�� � ����-�-�� ���6�/���0 $3

HCM Unsignalized Intersection Capacity Analysis ROUTE 62 11: E.2nd Street & E. Front Street ������������ 1 ���
�������������������������� �������������� !��"#�� �� �$
��% � �" &'( &'� �'( �'� �'� �'�(� �*��+��,�"���-.�,� �/% �>�0 2 4� 4� 211 242 5�����*��"�� �"�! 7� 7� 9�6 �1: 1: �1:� ?�@�,��7�"�� ;5� ;5� ;�� ;�� ;4� ;4�@�,���+�8��" �/%!�0 5 $1� $ � 3�� 5$4 4� 6 -"���-(� �)�6"��/+"0)?�����! 6�/+">-0� �� �"�'��?� ����"�",���+� �/% �0� 6���"�! ��� ��� � 6���-"��� �% �0�!-"� ��-����/+"0!D=�!"����,�<��? 6%*=����+��"����%�,� $133 5$4 5�3%*$=�-"� �$����+�%�%*�=�-"� ������+�%�%*,=�,�<��? 6�%� $133 5$4 5�3"*=�-��� �/-0 5;2 5;� 2;$"*=���-"� �/-0"7�/-0 1;3 1;1 �;�! �E, , �+� �: �5 �1 4�����!��"��/% �>�0 $24 2�1 �5$
��� �"���=�(� �B &'�$ &'�� �'�$ �'�� �'�$ �'��.�,� ���" 5 $1� $ � 3�� 5$4 4.�,� �( +" 5 $ � .�,� �����" $1� 4��@ $24 2�1 �5$ $� $� $� .�,� �"��*!��"� ; 2 ;�� ;$$ ;1$ ;15 ; F, , �( ��"���3"��/+"0 1 �� � *��"���� ��/-0 1 ;2 $2;� �;� ; ; ; (� �(�� � ' ��!!������ ��/-0 $3;� $;5 ; �!!�����(�� *
��" �- �"�����,�����% �� �� �� �;1��" �- �"����*!��"���"��C"���� 2�;$: �*��( % ��+�� �%�� � ����-�-�� ���6�/���0 $3

HCM Unsignalized Intersection Capacity Analysis ROUTE 62 12: E.2nd Street & Wilson Avenue ������������ 1 ���
�������������������������� �������������� !��"#�� �� �$$
��% � �" )'( )'� �'� �'� �'( �'�(� �*��+��,�"���-.�,� �/% �>�0 4� $�2 5 �� ��� 2 �����*��"�� �"�! 7� 7� 9�6 : : :� ?�@�,��7�"�� ;�1 ;�1 ;�2 ;�2 ;� ;� @�,���+�8��" �/%!�0 �4 �1� �$ 43 �4� 2�� 6 -"���- 3 $�(� �)�6"��/+"0 $�; $�; )?�����! 6�/+">-0 2; 2; � �� �"�'��?� $����"�",���+� �/% �0� 6���"�! ��� ��� � 6���-"��� �% �0�!-"� ��-����/+"0!D=�!"����,�<��? 6%*=����+��"����%�,� 5� �1 $5$%*$=�-"� �$����+�%�%*�=�-"� ������+�%�%*,=�,�<��? 6�%� 5� �1 $5$"*=�-��� �/-0 5;2 5;� 2;$"*=���-"� �/-0"7�/-0 1;3 1;1 �;�! �E, , �+� �: � �5 4 ����!��"��/% �>�0 11$ �3� $2�3
��� �"���=�(� �B )'�$ �'�$ �'�� �'�$.�,� ���" 1�� �$ 43 11�.�,� �( +" �4 �4�.�,� �����" �1� 43 ��@ 5$$ $� $� $2�3.�,� �"��*!��"� ;32 ; 2 ; 3 ;� F, , �( ��"���3"��/+"0 4 $4*��"���� ��/-0 $�;5 ; ; �;�(� �(�� * ��!!������ ��/-0 $�;5 ; �;��!!�����(�� *
��" �- �"�����,�����% �� �� �� $ ; ��" �- �"����*!��"���"��C"���� 2�;�: �*��( % ��+�� �%�� � ����-�-�� ���6�/���0 $3
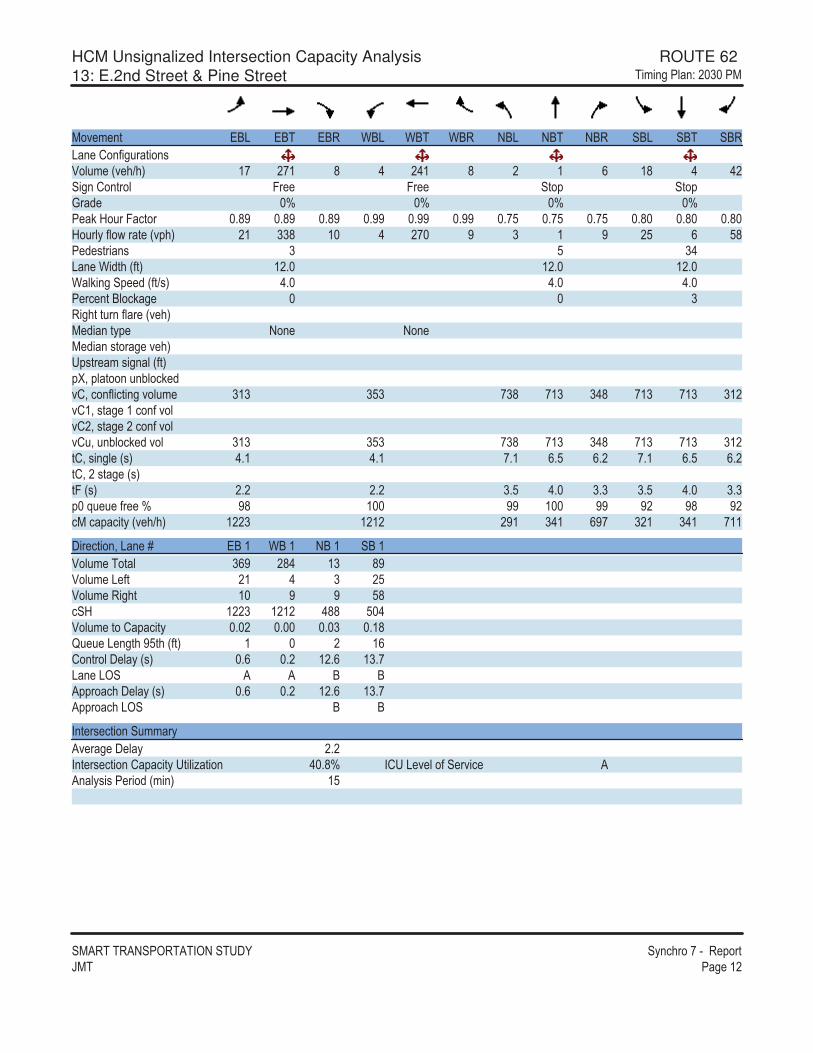
HCM Unsignalized Intersection Capacity Analysis ROUTE 62 13: E.2nd Street & Pine Street ������������ 1 ���
�������������������������� �������������� !��"#�� �� �$�
��% � �" &'( &'� &'� )'( )'� )'� �'( �'� �'� �'( �'� �'�(� �*��+��,�"���-.�,� �/% �>�0 $� ��$ 4 2 �2$ 4 � $ 5 $4 2 2������*��"�� 7� 7� �"�! �"�!9�6 : : : :� ?�@�,��7�"�� ;4� ;4� ;4� ;�� ;�� ;�� ;�3 ;�3 ;�3 ;4 ;4 ;4 @�,���+�8��" �/%!�0 �$ 114 $ 2 �� � 1 $ � �3 5 34� 6 -"���- 1 3 12(� �)�6"��/+"0 $�; $�; $�; )?�����! 6�/+">-0 2; 2; 2; � �� �"�'��?� 1����"�",���+� �/% �0� 6���"�! ��� ��� � 6���-"��� �% �0�!-"� ��-����/+"0!D=�!"����,�<��? 6%*=����+��"����%�,� 1$1 131 �14 �$1 124 �$1 �$1 1$�%*$=�-"� �$����+�%�%*�=�-"� ������+�%�%*,=�,�<��? 6�%� 1$1 131 �14 �$1 124 �$1 �$1 1$�"*=�-��� �/-0 2;$ 2;$ �;$ 5;3 5;� �;$ 5;3 5;�"*=���-"� �/-0"7�/-0 �;� �;� 1;3 2; 1;1 1;3 2; 1;1! �E, , �+� �: �4 $ �� $ �� �� �4 ������!��"��/% �>�0 $��1 $�$� ��$ 12$ 5�� 1�$ 12$ �$$
��� �"���=�(� �B &'�$ )'�$ �'�$ �'�$.�,� ���" 15� �42 $1 4�.�,� �( +" �$ 2 1 �3.�,� �����" $ � � 34��@ $��1 $�$� 244 3 2.�,� �"��*!��"� ; � ; ; 1 ;$4F, , �( ��"���3"��/+"0 $ � $5*��"���� ��/-0 ;5 ;� $�;5 $1;�(� �(�� � � ' '�!!������ ��/-0 ;5 ;� $�;5 $1;��!!�����(�� ' '
��" �- �"�����,�����% �� �� �� �;���" �- �"����*!��"���"��C"���� 2 ;4: �*��( % ��+�� �%�� � ����-�-�� ���6�/���0 $3

HCM Unsignalized Intersection Capacity Analysis ROUTE 62 14: Imperial Street & E.2nd Street ������������ 1 ���
�������������������������� �������������� !��"#�� �� �$1
��% � �" &'( &'� &'� )'( )'� )'� �'( �'� �'� �'( �'� �'�(� �*��+��,�"���-.�,� �/% �>�0 $� 5 3 5 $$ 2 2 $2 � $� $�1 $5�����*��"�� �"�! �"�! 7� 7� 9�6 : : : :� ?�@�,��7�"�� ;�3 ;�3 ;�3 ;�3 ;�3 ;�3 ;55 ;55 ;55 ;�� ;�� ;��@�,���+�8��" �/%!�0 �4 � � � $5 3� � �13 $� $2 $�4 $4� 6 -"���- $ 2 1(� �)�6"��/+"0 $�; $�; $�; )?�����! 6�/+">-0 2; 2; 2; � �� �"�'��?� ����"�",���+� �/% �0� 6���"�! ��� ��� � 6���-"��� �% �0�!-"� ��-����/+"0!D=�!"����,�<��? 6%*=����+��"����%�,� 35$ 2�5 �$� 3 3 3 �22 �$� �2�%*$=�-"� �$����+�%�%*�=�-"� ������+�%�%*,=�,�<��? 6�%� 35$ 2�5 �$� 3 3 3 �22 �$� �2�"*=�-��� �/-0 �;$ 5;3 5;� �;$ 5;3 5;� 2;$ 2;$"*=���-"� �/-0"7�/-0 1;3 2; 1;1 1;3 2; 1;1 �;� �;�! �E, , �+� �: �1 �4 �� �4 �� �1 $ ������!��"��/% �>�0 1�� 2� 41 25� 254 ��� $151 $11
��� �"���=�(� �B &'�$ )'�$ �'�$ �'�$.�,� ���" 22 42 �32 �1 .�,� �( +" �4 � � $2.�,� �����" � 3� $� $4��@ 225 534 $151 $11 .�,� �"��*!��"� ;$ ;$1 ; ; $F, , �( ��"���3"��/+"0 4 $$ $*��"���� ��/-0 $2; $$;1 ;� ;3(� �(�� ' ' � ��!!������ ��/-0 $2; $$;1 ;� ;3�!!�����(�� ' '
��" �- �"�����,�����% �� �� �� �;���" �- �"����*!��"���"��C"���� 1�;�: �*��( % ��+�� �%�� � ����-�-�� ���6�/���0 $3

HCM Unsignalized Intersection Capacity Analysis ROUTE 62 19: E. 1st Street & E. Front Street ������������ 1 ���
�������������������������� �������������� !��"#�� �� �$2
��% � �" &'( &'� )'� )'� �&( �&�(� �*��+��,�"���-.�,� �/% �>�0 1�5 2$3 �����*��"�� 7� 7� �"�!9�6 : : :� ?�@�,��7�"�� ;�� ;�� ;�� ;�� ;�� ;��@�,���+�8��" �/%!�0 232 3 $ � 6 -"���-(� �)�6"��/+"0)?�����! 6�/+">-0� �� �"�'��?� ����"�",���+� �/% �0� 6���"�! ��� ��� � 6���-"��� �% �0�!-"� ��-����/+"0 5$4!D=�!"����,�<��? 6%*=����+��"����%�,� 3 $ ��� %*$=�-"� �$����+�%�%*�=�-"� ������+�%�%*,=�,�<��? 6�%� 3 $ ��� "*=�-��� �/-0 2;$ 5;4 5;�"*=���-"� �/-0"7�/-0 �;� 1;3 1;1! �E, , �+� �: $ $ $ ����!��"��/% �>�0 $ 5 �2$ $ 42
��� �"���=�(� �B &'�$ &'�� )'�$ )'��.�,� ���" ��� ��� �3 �3 .�,� �( +" .�,� �����" �3 �3 ��@ $� $� $� $� .�,� �"��*!��"� ;$1 ;$1 ;$3 ;$3F, , �( ��"���3"��/+"0 *��"���� ��/-0 ; ; ; ; (� �(���!!������ ��/-0 ; ; �!!�����(��
��" �- �"�����,�����% �� �� �� ; ��" �- �"����*!��"���"��C"���� $�;2: �*��( % ��+�� �%�� � ����-�-�� ���6�/���0 $3
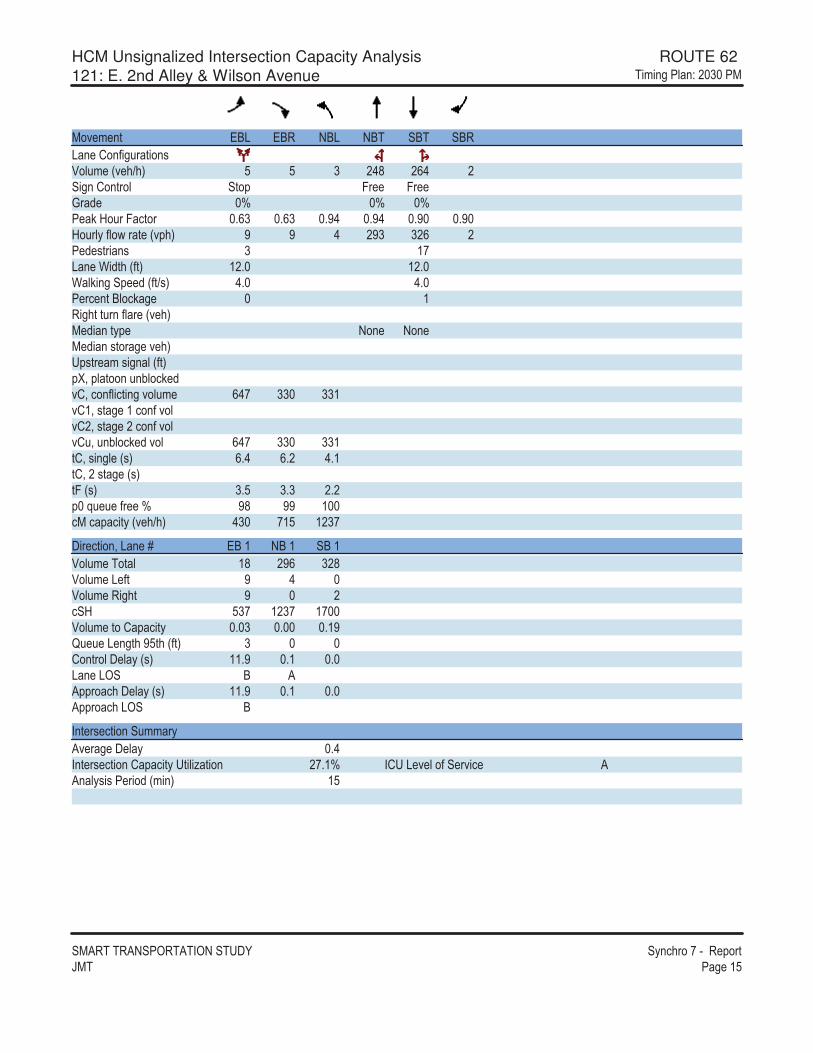
HCM Unsignalized Intersection Capacity Analysis ROUTE 62 121: E. 2nd Alley & Wilson Avenue ������������ 1 ���
�������������������������� �������������� !��"#�� �� �$3
��% � �" &'( &'� �'( �'� �'� �'�(� �*��+��,�"���-.�,� �/% �>�0 3 3 1 �24 �52 ������*��"�� �"�! 7� 7� 9�6 : : :� ?�@�,��7�"�� ;51 ;51 ;�2 ;�2 ;� ;� @�,���+�8��" �/%!�0 � � 2 ��1 1�5 �� 6 -"���- 1 $�(� �)�6"��/+"0 $�; $�; )?�����! 6�/+">-0 2; 2; � �� �"�'��?� $����"�",���+� �/% �0� 6���"�! ��� ��� � 6���-"��� �% �0�!-"� ��-����/+"0!D=�!"����,�<��? 6%*=����+��"����%�,� 52� 11 11$%*$=�-"� �$����+�%�%*�=�-"� ������+�%�%*,=�,�<��? 6�%� 52� 11 11$"*=�-��� �/-0 5;2 5;� 2;$"*=���-"� �/-0"7�/-0 1;3 1;1 �;�! �E, , �+� �: �4 �� $ ����!��"��/% �>�0 21 �$3 $�1�
��� �"���=�(� �B &'�$ �'�$ �'�$.�,� ���" $4 ��5 1�4.�,� �( +" � 2 .�,� �����" � ���@ 31� $�1� $� .�,� �"��*!��"� ; 1 ; ;$�F, , �( ��"���3"��/+"0 1 *��"���� ��/-0 $$;� ;$ ; (� �(�� ' ��!!������ ��/-0 $$;� ;$ ; �!!�����(�� '
��" �- �"�����,�����% �� �� �� ;2��" �- �"����*!��"���"��C"���� ��;$: �*��( % ��+�� �%�� � ����-�-�� ���6�/���0 $3

�
�
�
�
�
�
�
�
�
�
�
�
�
�����������������������

HCM Unsignalized Intersection Capacity Analysis 8: E. 1st Street & Wilson AvenueRoute 62 Corridor Smart Transportation Study � �����1�� �)�-���"��&-"���6��%
#�� �������������� !��"
��% � �" &'( &'� &'� )'( )'� )'� �'( �'� �'� �'( �'� �'�(� �*��+��,�"���-.�,� �/% �>�0 $� 1�2 $3 $2� � �����*��"�� 7� 7� �"�! �"�!9�6 : : : :� ?�@�,��7�"�� ;�5 ;�5 ;�5 ;�� ;�� ;�� ;�� ;�� ;�� ;�� ;�� ;��@�,���+�8��" �/%!�0 $� 1� $35 $5 � � 6 -"���- $ $ �(� �)�6"��/+"0 $�; ; $�; )?�����! 6�/+">-0 2; 2; 2; � �� �"�'��?� ����"�",���+� �/% �0� 6���"�! ��� ��� � 6���-"��� �% �0�!-"� ��-����/+"0 13$!D=�!"����,�<��? 6 ;�� ;�� ;�� ;�� ;�� ;��%*=����+��"����%�,� 1�� 2$4 2$� 1�1 2�4 2$� $%*$=�-"� �$����+�%�%*�=�-"� ������+�%�%*,=�,�<��? 6�%� 133 14� 14$ 135 253 14$ $"*=�-��� �/-0 2;$ 2;$ �;$ 5;3 5;� �;$ 5;3 5;�"*=���-"� �/-0"7�/-0 �;� �;� 1;3 2; 1;1 1;3 2; 1;1! �E, , �+� �: �� $ $ � $ $ $ $ ����!��"��/% �>�0 $5$� $$51 33� 3�� 553 1�1 3�� $ 41
��� �"���=�(� �B &'�$ &'�� &'�1 �'�$.�,� ���" $� 1� $35 $5�.�,� �( +" $� .�,� �����" $35 ���@ $5$� $� $� 31$.�,� �"��*!��"� ; $ ;�1 ; � ;1$F, , �( ��"���3"��/+"0 $ 1�*��"���� ��/-0 �;� ; ; $2;�(� �(�� � '�!!������ ��/-0 ;� $2;��!!�����(�� '
��" �- �"�����,�����% �� �� �� 1;2��" �- �"����*!��"���"��C"���� 32;�: �*��( % ��+�� �%�� � ����-�-�� ���6�/���0 $3

HCM Unsignalized Intersection Capacity Analysis 11: E.2nd Street & E. Front StreetRoute 62 Corridor Smart Transportation Study � �����1�� �)�-���"��&-"���6��%
#�� �������������� !��"
��% � �" &'( &'� �'( �'� �'� �'�(� �*��+��,�"���-.�,� �/% �>�0 2 24 24 2 $ 14� �����*��"�� �"�! 7� 7� 9�6 �1: 1: �1:� ?�@�,��7�"�� ;�1 ;�1 ;4$ ;4$ ;�� ;��@�,���+�8��" �/%!�0 2 3� 3� 2�3 2$3 � 6 -"���-(� �)�6"��/+"0)?�����! 6�/+">-0� �� �"�'��?� ����"�",���+� �/% �0� 6���"�! ��� ��� � 6���-"��� �% �0�!-"� ��-����/+"0!D=�!"����,�<��? 6%*=����+��"����%�,� $ �� 2$3 2$3%*$=�-"� �$����+�%�%*�=�-"� ������+�%�%*,=�,�<��? 6�%� $ �� 2$3 2$3"*=�-��� �/-0 5;2 5;� 2;$"*=���-"� �/-0"7�/-0 1;3 1;1 �;�! �E, , �+� �: �4 �� �3����!��"��/% �>�0 �21 51$ $$14
��� �"���=�(� �B &'�$ &'�� �'�$ �'�� �'�$.�,� ���" 2 3� 3� 2�3 2$3.�,� �( +" 2 3� .�,� �����" 3� ��@ �21 51$ $$14 $� $� .�,� �"��*!��"� ; � ; 4 ; 3 ;�� ;�2F, , �( ��"���3"��/+"0 $ � 2 *��"���� ��/-0 � ;$ $$;� 4;1 ; ; (� �(�� * ' ��!!������ ��/-0 $$;� ;� ; �!!�����(�� '
��" �- �"�����,�����% �� �� �� $;$��" �- �"����*!��"���"��C"���� 15;4: �*��( % ��+�� �%�� � ����-�-�� ���6�/���0 $3
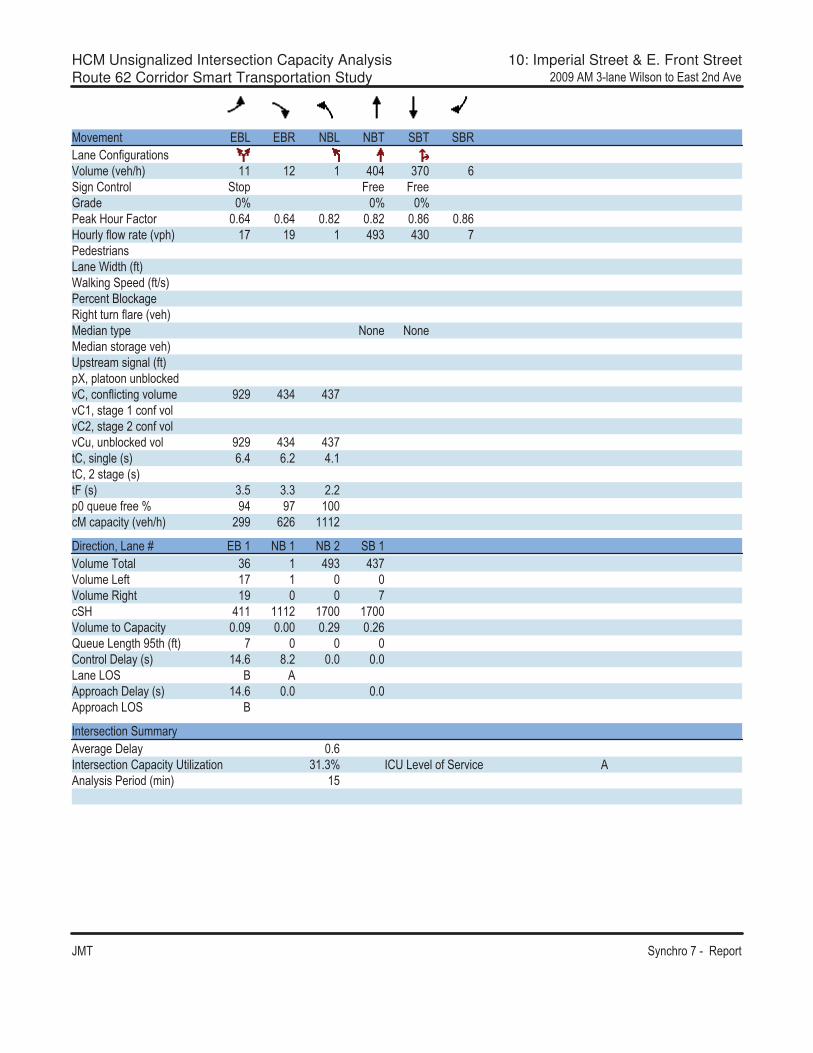
HCM Unsignalized Intersection Capacity Analysis 10: Imperial Street & E. Front StreetRoute 62 Corridor Smart Transportation Study � �����1�� �)�-���"��&-"���6��%
#�� �������������� !��"
��% � �" &'( &'� �'( �'� �'� �'�(� �*��+��,�"���-.�,� �/% �>�0 $$ $� $ 2 2 1� 5�����*��"�� �"�! 7� 7� 9�6 : : :� ?�@�,��7�"�� ;52 ;52 ;4� ;4� ;45 ;45@�,���+�8��" �/%!�0 $� $� $ 2�1 21 �� 6 -"���-(� �)�6"��/+"0)?�����! 6�/+">-0� �� �"�'��?� ����"�",���+� �/% �0� 6���"�! ��� ��� � 6���-"��� �% �0�!-"� ��-����/+"0!D=�!"����,�<��? 6%*=����+��"����%�,� ��� 212 21�%*$=�-"� �$����+�%�%*�=�-"� ������+�%�%*,=�,�<��? 6�%� ��� 212 21�"*=�-��� �/-0 5;2 5;� 2;$"*=���-"� �/-0"7�/-0 1;3 1;1 �;�! �E, , �+� �: �2 �� $ ����!��"��/% �>�0 ��� 5�5 $$$�
��� �"���=�(� �B &'�$ �'�$ �'�� �'�$.�,� ���" 15 $ 2�1 21�.�,� �( +" $� $ .�,� �����" $� ���@ 2$$ $$$� $� $� .�,� �"��*!��"� ; � ; ;�� ;�5F, , �( ��"���3"��/+"0 � *��"���� ��/-0 $2;5 4;� ; ; (� �(�� ' ��!!������ ��/-0 $2;5 ; ; �!!�����(�� '
��" �- �"�����,�����% �� �� �� ;5��" �- �"����*!��"���"��C"���� 1$;1: �*��( % ��+�� �%�� � ����-�-�� ���6�/���0 $3
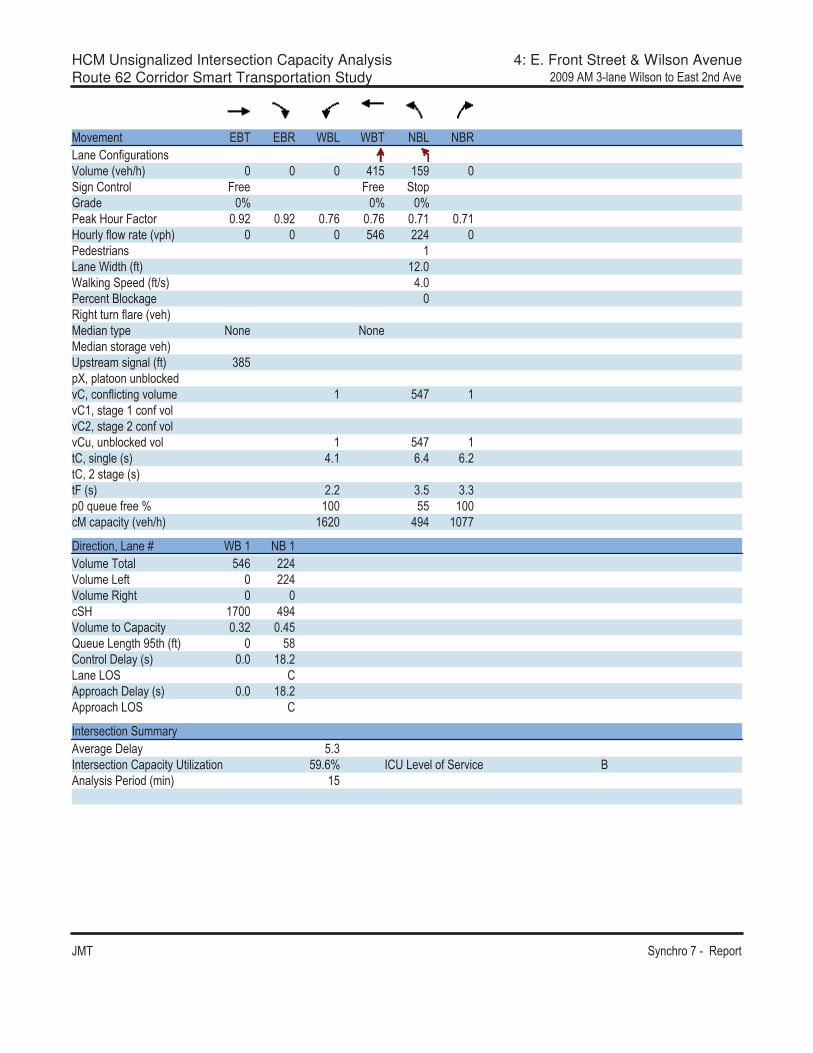
HCM Unsignalized Intersection Capacity Analysis 4: E. Front Street & Wilson AvenueRoute 62 Corridor Smart Transportation Study � �����1�� �)�-���"��&-"���6��%
#�� �������������� !��"
��% � �" &'� &'� )'( )'� �'( �'�(� �*��+��,�"���-.�,� �/% �>�0 2$3 $3� �����*��"�� 7� 7� �"�!9�6 : : :� ?�@�,��7�"�� ;�� ;�� ;�5 ;�5 ;�$ ;�$@�,���+�8��" �/%!�0 325 ��2 � 6 -"���- $(� �)�6"��/+"0 $�; )?�����! 6�/+">-0 2; � �� �"�'��?� ����"�",���+� �/% �0� 6���"�! ��� ��� � 6���-"��� �% �0�!-"� ��-����/+"0 143!D=�!"����,�<��? 6%*=����+��"����%�,� $ 32� $%*$=�-"� �$����+�%�%*�=�-"� ������+�%�%*,=�,�<��? 6�%� $ 32� $"*=�-��� �/-0 2;$ 5;2 5;�"*=���-"� �/-0"7�/-0 �;� 1;3 1;1! �E, , �+� �: $ 33 $ ����!��"��/% �>�0 $5� 2�2 $ ��
��� �"���=�(� �B )'�$ �'�$.�,� ���" 325 ��2.�,� �( +" ��2.�,� �����" ��@ $� 2�2.�,� �"��*!��"� ;1� ;23F, , �( ��"���3"��/+"0 34*��"���� ��/-0 ; $4;�(� �(�� *�!!������ ��/-0 ; $4;��!!�����(�� *
��" �- �"�����,�����% �� �� �� 3;1��" �- �"����*!��"���"��C"���� 3�;5: �*��( % ��+�� �%�� � '���-�-�� ���6�/���0 $3

HCM Unsignalized Intersection Capacity Analysis 8: E. 1st Street & Wilson AvenueRoute 62 Corridor Smart Transportation Study � �����1�� �)�-���"��&;��6
#�� �������������� !��"
��% � �" &'( &'� &'� )'( )'� )'� �'( �'� �'� �'( �'� �'�(� �*��+��,�"���-.�,� �/% �>�0 �4 244 �53 �3� � �����*��"�� 7� 7� �"�! �"�!9�6 : : : :� ?�@�,��7�"�� ;�3 ;�3 ;�3 ;�� ;�� ;�� ;4$ ;4$ ;4$ ;�� ;�� ;��@�,���+�8��" �/%!�0 �� 3$2 ��� 1$� � � 6 -"���- 3 2 2(� �)�6"��/+"0 $�; ; $�; )?�����! 6�/+">-0 2; 2; 2; � �� �"�'��?� ����"�",���+� �/% �0� 6���"�! ��� ��� � 6���-"��� �% �0�!-"� ��-����/+"0 13$!D=�!"����,�<��? 6 ;4� ;4� ;4� ;4� ;4� ;4�%*=����+��"����%�,� 3$4 34� 3�� 3�� �14 3�� 3%*$=�-"� �$����+�%�%*�=�-"� ������+�%�%*,=�,�<��? 6�%� 1 4 145 14 1$1 3�3 14 3"*=�-��� �/-0 2;$ 2;$ �;$ 5;3 5;� �;$ 5;3 5;�"*=���-"� �/-0"7�/-0 �;� �;� 1;3 2; 1;1 1;3 2; 1;1! �E, , �+� �: �4 $ $ �� $ $ $ $ ����!��"��/% �>�0 $51 $ �� 25� 22� 3�� $2� 225 $ �2
��� �"���=�(� �B &'�$ &'�� &'�1 �'�$.�,� ���" �� 5 � $45 1� .�,� �( +" �� .�,� �����" �1 $45 ���@ $51 $� $� 224.�,� �"��*!��"� ; � ;15 ;$$ ;�$F, , �( ��"���3"��/+"0 $ $1�*��"���� ��/-0 �;� ; ; 1 ;�(� �(�� � ��!!������ ��/-0 ;1 1 ;��!!�����(�� �
��" �- �"�����,�����% �� �� �� 4;4��" �- �"����*!��"���"��C"���� �1;5: �*��( % ��+�� �%�� � ����-�-�� ���6�/���0 $3

HCM Unsignalized Intersection Capacity Analysis 11: E.2nd Street & E. Front StreetRoute 62 Corridor Smart Transportation Study � �����1�� �)�-���"��&;��6
#�� �������������� !��"
��% � �" &'( &'� �'( �'� �'� �'�(� �*��+��,�"���-.�,� �/% �>�0 2 4� 4� 211 242 5�����*��"�� �"�! 7� 7� 9�6 �1: 1: �1:� ?�@�,��7�"�� ;5� ;5� ;�� ;�� ;4� ;4�@�,���+�8��" �/%!�0 5 $$� �� 2�$ 335 �� 6 -"���-(� �)�6"��/+"0)?�����! 6�/+">-0� �� �"�'��?� ����"�",���+� �/% �0� 6���"�! ��� ��� � 6���-"��� �% �0�!-"� ��-����/+"0!D=�!"����,�<��? 6%*=����+��"����%�,� $��2 35 351%*$=�-"� �$����+�%�%*�=�-"� ������+�%�%*,=�,�<��? 6�%� $��2 35 351"*=�-��� �/-0 5;2 5;� 2;$"*=���-"� �/-0"7�/-0 1;3 1;1 �;�! �E, , �+� �: �� �4 � ����!��"��/% �>�0 $4$ 31� $ $1
��� �"���=�(� �B &'�$ &'�� �'�$ �'�� �'�$.�,� ���" 5 $$� �� 2�$ 351.�,� �( +" 5 �� .�,� �����" $$� ���@ $4$ 31� $ $1 $� $� .�,� �"��*!��"� ; 1 ;�� ;$ ;�4 ;11F, , �( ��"���3"��/+"0 � �$ 4 *��"���� ��/-0 �3;3 $1;� 4;� ; ; (� �(�� � ' ��!!������ ��/-0 $2;1 $;3 ; �!!�����(�� '
��" �- �"�����,�����% �� �� �� �;$��" �- �"����*!��"���"��C"���� 22;$: �*��( % ��+�� �%�� � ����-�-�� ���6�/���0 $3
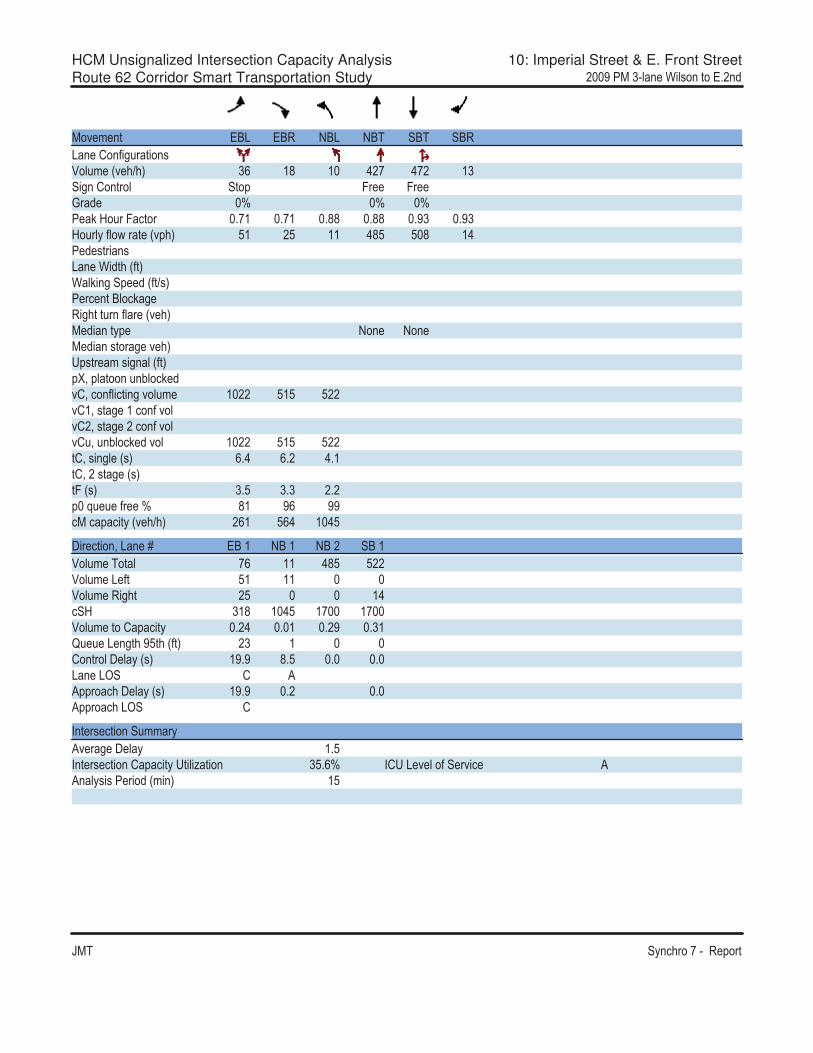
HCM Unsignalized Intersection Capacity Analysis 10: Imperial Street & E. Front StreetRoute 62 Corridor Smart Transportation Study � �����1�� �)�-���"��&;��6
#�� �������������� !��"
��% � �" &'( &'� �'( �'� �'� �'�(� �*��+��,�"���-.�,� �/% �>�0 15 $4 $ 2�� 2�� $1�����*��"�� �"�! 7� 7� 9�6 : : :� ?�@�,��7�"�� ;�$ ;�$ ;44 ;44 ;�1 ;�1@�,���+�8��" �/%!�0 3$ �3 $$ 243 3 4 $2� 6 -"���-(� �)�6"��/+"0)?�����! 6�/+">-0� �� �"�'��?� ����"�",���+� �/% �0� 6���"�! ��� ��� � 6���-"��� �% �0�!-"� ��-����/+"0!D=�!"����,�<��? 6%*=����+��"����%�,� $ �� 3$3 3��%*$=�-"� �$����+�%�%*�=�-"� ������+�%�%*,=�,�<��? 6�%� $ �� 3$3 3��"*=�-��� �/-0 5;2 5;� 2;$"*=���-"� �/-0"7�/-0 1;3 1;1 �;�! �E, , �+� �: 4$ �5 ������!��"��/% �>�0 �5$ 352 $ 23
��� �"���=�(� �B &'�$ �'�$ �'�� �'�$.�,� ���" �5 $$ 243 3��.�,� �( +" 3$ $$ .�,� �����" �3 $2��@ 1$4 $ 23 $� $� .�,� �"��*!��"� ;�2 ; $ ;�� ;1$F, , �( ��"���3"��/+"0 �1 $ *��"���� ��/-0 $�;� 4;3 ; ; (� �(�� * ��!!������ ��/-0 $�;� ;� ; �!!�����(�� *
��" �- �"�����,�����% �� �� �� $;3��" �- �"����*!��"���"��C"���� 13;5: �*��( % ��+�� �%�� � ����-�-�� ���6�/���0 $3
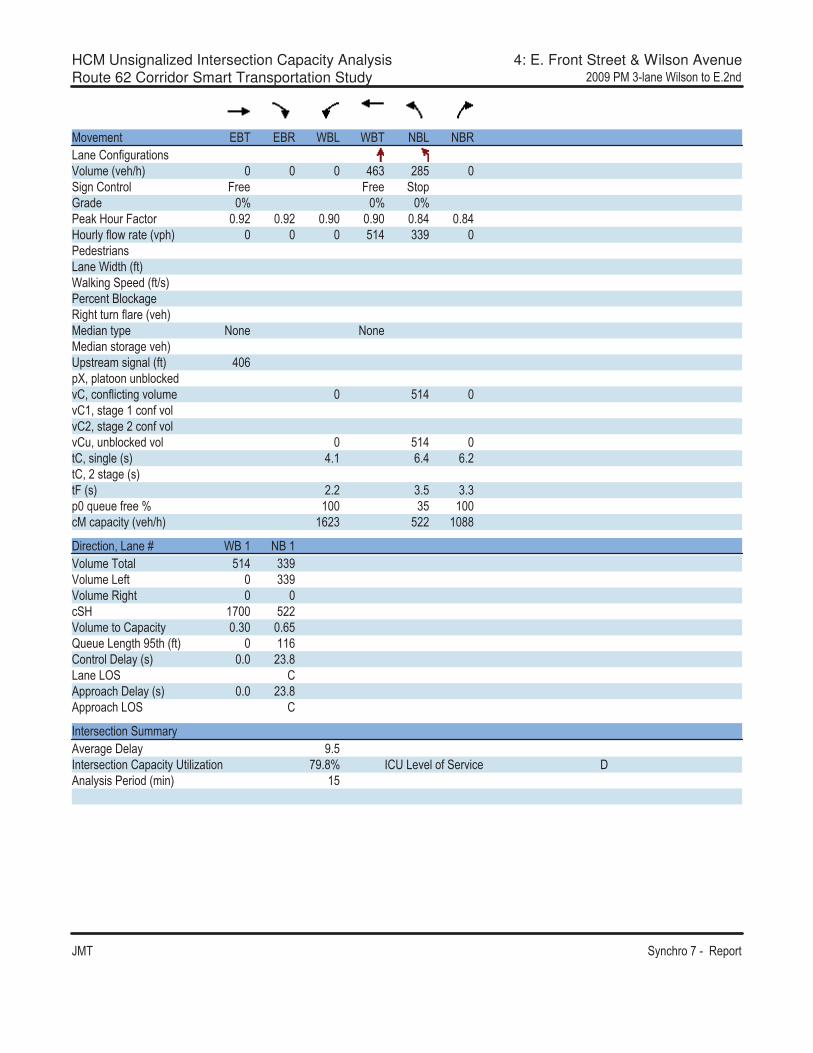
HCM Unsignalized Intersection Capacity Analysis 4: E. Front Street & Wilson AvenueRoute 62 Corridor Smart Transportation Study � �����1�� �)�-���"��&;��6
#�� �������������� !��"
��% � �" &'� &'� )'( )'� �'( �'�(� �*��+��,�"���-.�,� �/% �>�0 251 �43 �����*��"�� 7� 7� �"�!9�6 : : :� ?�@�,��7�"�� ;�� ;�� ;� ;� ;42 ;42@�,���+�8��" �/%!�0 3$2 11� � 6 -"���-(� �)�6"��/+"0)?�����! 6�/+">-0� �� �"�'��?� ����"�",���+� �/% �0� 6���"�! ��� ��� � 6���-"��� �% �0�!-"� ��-����/+"0 2 5!D=�!"����,�<��? 6%*=����+��"����%�,� 3$2 %*$=�-"� �$����+�%�%*�=�-"� ������+�%�%*,=�,�<��? 6�%� 3$2 "*=�-��� �/-0 2;$ 5;2 5;�"*=���-"� �/-0"7�/-0 �;� 1;3 1;1! �E, , �+� �: $ 13 $ ����!��"��/% �>�0 $5�1 3�� $ 44
��� �"���=�(� �B )'�$ �'�$.�,� ���" 3$2 11�.�,� �( +" 11�.�,� �����" ��@ $� 3��.�,� �"��*!��"� ;1 ;53F, , �( ��"���3"��/+"0 $$5*��"���� ��/-0 ; �1;4(� �(�� *�!!������ ��/-0 ; �1;4�!!�����(�� *
��" �- �"�����,�����% �� �� �� �;3��" �- �"����*!��"���"��C"���� ��;4: �*��( % ��+�� �%�� � ����-�-�� ���6�/���0 $3
�
�
�
�
�
�
�
�
�
�
�
�
�
����������������������

HCM Unsignalized Intersection Capacity Analysis 8: E. 1st Street & Wilson AvenueRoute 62 Corridor Smart Transportation Study � 1 ����1�� �)�-���"��&-"���6��%
#�� �������������� !��"
��% � �" &'( &'� &'� )'( )'� )'� �'( �'� �'� �'( �'� �'�(� �*��+��,�"���-.�,� �/% �>�0 $� 1�2 $3 $2� � �����*��"�� 7� 7� �"�! �"�!9�6 : : : :� ?�@�,��7�"�� ;�5 ;�5 ;�5 ;�� ;�� ;�� ;�� ;�� ;�� ;�� ;�� ;��@�,���+�8��" �/%!�0 $2 21� $�1 $�� � � 6 -"���- $ $ �(� �)�6"��/+"0 $�; ; $�; )?�����! 6�/+">-0 2; 2; 2; � �� �"�'��?� ����"�",���+� �/% �0� 6���"�! ��� ��� � 6���-"��� �% �0�!-"� ��-����/+"0 13$!D=�!"����,�<��? 6 ;�2 ;�2 ;�2 ;�2 ;�2 ;�2%*=����+��"����%�,� 212 251 25� 213 33� 25� $%*$=�-"� �$����+�%�%*�=�-"� ������+�%�%*,=�,�<��? 6�%� 1�� 2 � 2 $ 1�1 2�� 2 $ $"*=�-��� �/-0 2;$ 2;$ �;$ 5;3 5;� �;$ 5;3 5;�"*=���-"� �/-0"7�/-0 �;� �;� 1;3 2; 1;1 1;3 2; 1;1! �E, , �+� �: �� $ $ 53 $ $ $ $ ����!��"��/% �>�0 $5$� $$$� 3�� 3 � 513 1�4 3 � $ 41
��� �"���=�(� �B &'�$ &'�� &'�1 �'�$.�,� ���" $2 21� $�1 $4 .�,� �( +" $2 .�,� �����" $�1 ���@ $5$� $� $� 3 2.�,� �"��*!��"� ; $ ;�3 ;$ ;15F, , �( ��"���3"��/+"0 $ 2 *��"���� ��/-0 �;� ; ; $5;$(� �(�� � *�!!������ ��/-0 ;� $5;$�!!�����(�� *
��" �- �"�����,�����% �� �� �� 1;���" �- �"����*!��"���"��C"���� 3�;5: �*��( % ��+�� �%�� � '���-�-�� ���6�/���0 $3

HCM Unsignalized Intersection Capacity Analysis 11: E.2nd Street & E. Front StreetRoute 62 Corridor Smart Transportation Study � 1 ����1�� �)�-���"��&-"���6��%
#�� �������������� !��"
��% � �" &'( &'� �'( �'� �'� �'�(� �*��+��,�"���-.�,� �/% �>�0 2 24 24 2 $ 14� �����*��"�� �"�! 7� 7� 9�6 �1: 1: �1:� ?�@�,��7�"�� ;�1 ;�1 ;4$ ;4$ ;�� ;��@�,���+�8��" �/%!�0 3 3� 55 33 25$ � 6 -"���-(� �)�6"��/+"0)?�����! 6�/+">-0� �� �"�'��?� ����"�",���+� �/% �0� 6���"�! ��� ��� � 6���-"��� �% �0�!-"� ��-����/+"0!D=�!"����,�<��? 6%*=����+��"����%�,� $$2� 25$ 25$%*$=�-"� �$����+�%�%*�=�-"� ������+�%�%*,=�,�<��? 6�%� $$2� 25$ 25$"*=�-��� �/-0 5;2 5;� 2;$"*=���-"� �/-0"7�/-0 1;3 1;1 �;�! �E, , �+� �: �4 � �2����!��"��/% �>�0 � 5 3�3 $ �3
��� �"���=�(� �B &'�$ &'�� �'�$ �'�� �'�$.�,� ���" 3 3� 55 33 25$.�,� �( +" 3 55 .�,� �����" 3� ��@ � 5 3�3 $ �3 $� $� .�,� �"��*!��"� ; � ;$ ; 5 ;1� ;��F, , �( ��"���3"��/+"0 � 4 3 *��"���� ��/-0 ��;� $$;� 4;3 ; ; (� �(�� * ' ��!!������ ��/-0 $�;5 ;� ; �!!�����(�� '
��" �- �"�����,�����% �� �� �� $;���" �- �"����*!��"���"��C"���� 1�; : �*��( % ��+�� �%�� � ����-�-�� ���6�/���0 $3

HCM Unsignalized Intersection Capacity Analysis 10: Imperial Street & E. Front StreetRoute 62 Corridor Smart Transportation Study � 1 ����1�� �)�-���"��&-"���6��%
#�� �������������� !��"
��% � �" &'( &'� �'( �'� �'� �'�(� �*��+��,�"���-.�,� �/% �>�0 $$ $� $ 2 2 1� 5�����*��"�� �"�! 7� 7� 9�6 : : :� ?�@�,��7�"�� ;52 ;52 ;4� ;4� ;45 ;45@�,���+�8��" �/%!�0 $� �$ $ 32� 2�4 4� 6 -"���-(� �)�6"��/+"0)?�����! 6�/+">-0� �� �"�'��?� ����"�",���+� �/% �0� 6���"�! ��� ��� � 6���-"��� �% �0�!-"� ��-����/+"0!D=�!"����,�<��? 6%*=����+��"����%�,� $ 1$ 24$ 243%*$=�-"� �$����+�%�%*�=�-"� ������+�%�%*,=�,�<��? 6�%� $ 1$ 24$ 243"*=�-��� �/-0 5;2 5;� 2;$"*=���-"� �/-0"7�/-0 1;3 1;1 �;�! �E, , �+� �: �1 �5 $ ����!��"��/% �>�0 �5 34� $ 5�
��� �"���=�(� �B &'�$ �'�$ �'�� �'�$.�,� ���" 2 $ 32� 243.�,� �( +" $� $ .�,� �����" �$ 4��@ 15� $ 5� $� $� .�,� �"��*!��"� ;$$ ; ;1� ;��F, , �( ��"���3"��/+"0 � *��"���� ��/-0 $5; 4;2 ; ; (� �(�� * ��!!������ ��/-0 $5; ; ; �!!�����(�� *
��" �- �"�����,�����% �� �� �� ;5��" �- �"����*!��"���"��C"���� 11;5: �*��( % ��+�� �%�� � ����-�-�� ���6�/���0 $3

HCM Unsignalized Intersection Capacity Analysis 4: E. Front Street & Wilson AvenueRoute 62 Corridor Smart Transportation Study � 1 ����1�� �)�-���"��&-"���6��%
#�� �������������� !��"
��% � �" &'� &'� )'( )'� �'( �'�(� �*��+��,�"���-.�,� �/% �>�0 2$3 $3� �����*��"�� 7� 7� �"�!9�6 : : :� ?�@�,��7�"�� ;�� ;�� ;�5 ;�5 ;�$ ;�$@�,���+�8��" �/%!�0 5 5 �2� � 6 -"���- $(� �)�6"��/+"0 $�; )?�����! 6�/+">-0 2; � �� �"�'��?� ����"�",���+� �/% �0� 6���"�! ��� ��� � 6���-"��� �% �0�!-"� ��-����/+"0 143!D=�!"����,�<��? 6%*=����+��"����%�,� $ 5 � $%*$=�-"� �$����+�%�%*�=�-"� ������+�%�%*,=�,�<��? 6�%� $ 5 � $"*=�-��� �/-0 2;$ 5;2 5;�"*=���-"� �/-0"7�/-0 �;� 1;3 1;1! �E, , �+� �: $ 23 $ ����!��"��/% �>�0 $5� 235 $ ��
��� �"���=�(� �B )'�$ �'�$.�,� ���" 5 5 �2�.�,� �( +" �2�.�,� �����" ��@ $� 235.�,� �"��*!��"� ;15 ;33F, , �( ��"���3"��/+"0 4 *��"���� ��/-0 ; ��; (� �(�� *�!!������ ��/-0 ; ��; �!!�����(�� *
��" �- �"�����,�����% �� �� �� 5;2��" �- �"����*!��"���"��C"���� 53; : �*��( % ��+�� �%�� � *���-�-�� ���6�/���0 $3
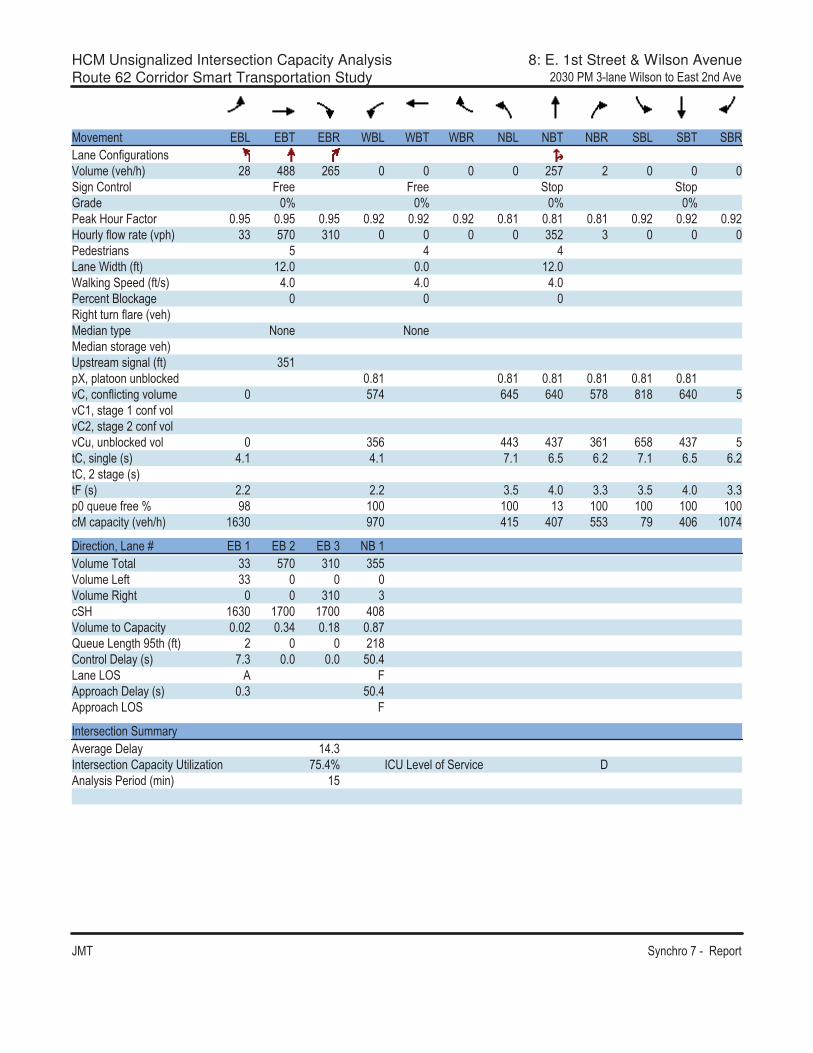
HCM Unsignalized Intersection Capacity Analysis 8: E. 1st Street & Wilson AvenueRoute 62 Corridor Smart Transportation Study � 1 ����1�� �)�-���"��&-"���6��%
#�� �������������� !��"
��% � �" &'( &'� &'� )'( )'� )'� �'( �'� �'� �'( �'� �'�(� �*��+��,�"���-.�,� �/% �>�0 �4 244 �53 �3� � �����*��"�� 7� 7� �"�! �"�!9�6 : : : :� ?�@�,��7�"�� ;�3 ;�3 ;�3 ;�� ;�� ;�� ;4$ ;4$ ;4$ ;�� ;�� ;��@�,���+�8��" �/%!�0 11 3� 1$ 13� 1 � 6 -"���- 3 2 2(� �)�6"��/+"0 $�; ; $�; )?�����! 6�/+">-0 2; 2; 2; � �� �"�'��?� ����"�",���+� �/% �0� 6���"�! ��� ��� � 6���-"��� �% �0�!-"� ��-����/+"0 13$!D=�!"����,�<��? 6 ;4$ ;4$ ;4$ ;4$ ;4$ ;4$%*=����+��"����%�,� 3�2 523 52 3�4 4$4 52 3%*$=�-"� �$����+�%�%*�=�-"� ������+�%�%*,=�,�<��? 6�%� 135 221 21� 15$ 534 21� 3"*=�-��� �/-0 2;$ 2;$ �;$ 5;3 5;� �;$ 5;3 5;�"*=���-"� �/-0"7�/-0 �;� �;� 1;3 2; 1;1 1;3 2; 1;1! �E, , �+� �: �4 $ $ $1 $ $ $ $ ����!��"��/% �>�0 $51 �� 2$3 2 � 331 �� 2 5 $ �2
��� �"���=�(� �B &'�$ &'�� &'�1 �'�$.�,� ���" 11 3� 1$ 133.�,� �( +" 11 .�,� �����" 1$ 1��@ $51 $� $� 2 4.�,� �"��*!��"� ; � ;12 ;$4 ;4�F, , �( ��"���3"��/+"0 � �$4*��"���� ��/-0 �;1 ; ; 3 ;2(� �(�� � 7�!!������ ��/-0 ;1 3 ;2�!!�����(�� 7
��" �- �"�����,�����% �� �� �� $2;1��" �- �"����*!��"���"��C"���� �3;2: �*��( % ��+�� �%�� � ����-�-�� ���6�/���0 $3
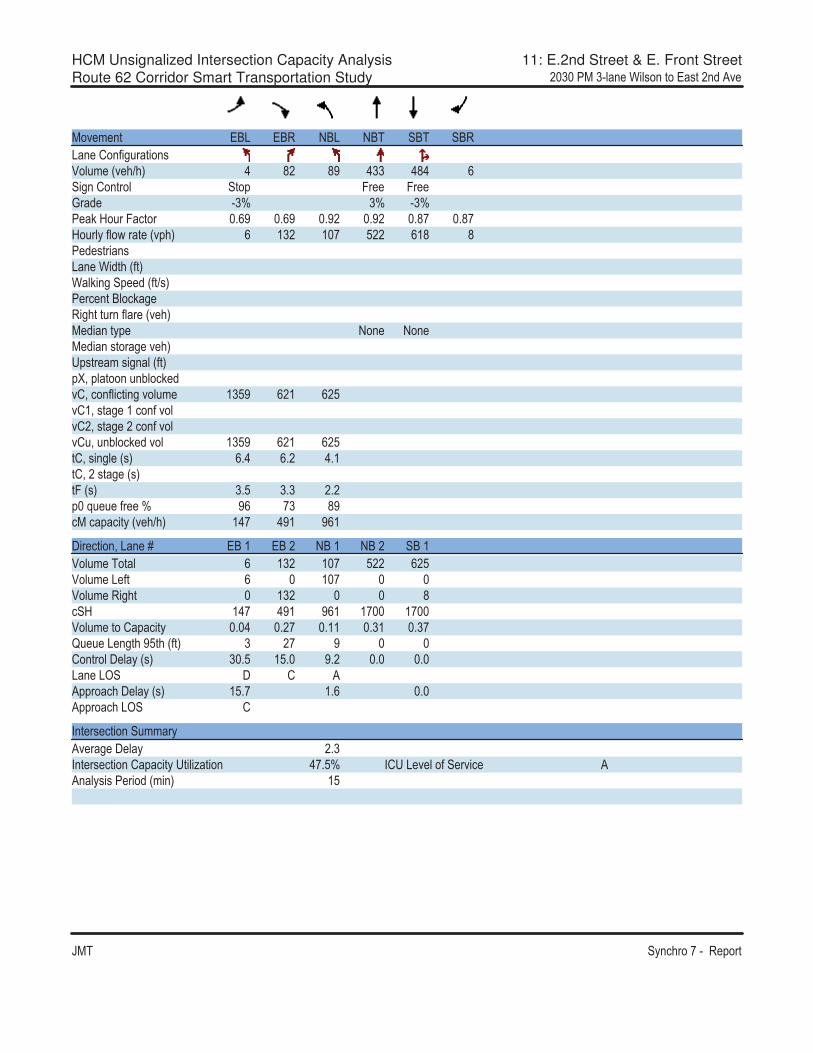
HCM Unsignalized Intersection Capacity Analysis 11: E.2nd Street & E. Front StreetRoute 62 Corridor Smart Transportation Study � 1 ����1�� �)�-���"��&-"���6��%
#�� �������������� !��"
��% � �" &'( &'� �'( �'� �'� �'�(� �*��+��,�"���-.�,� �/% �>�0 2 4� 4� 211 242 5�����*��"�� �"�! 7� 7� 9�6 �1: 1: �1:� ?�@�,��7�"�� ;5� ;5� ;�� ;�� ;4� ;4�@�,���+�8��" �/%!�0 5 $1� $ � 3�� 5$4 4� 6 -"���-(� �)�6"��/+"0)?�����! 6�/+">-0� �� �"�'��?� ����"�",���+� �/% �0� 6���"�! ��� ��� � 6���-"��� �% �0�!-"� ��-����/+"0!D=�!"����,�<��? 6%*=����+��"����%�,� $13� 5�$ 5�3%*$=�-"� �$����+�%�%*�=�-"� ������+�%�%*,=�,�<��? 6�%� $13� 5�$ 5�3"*=�-��� �/-0 5;2 5;� 2;$"*=���-"� �/-0"7�/-0 1;3 1;1 �;�! �E, , �+� �: �5 �1 4�����!��"��/% �>�0 $2� 2�$ �5$
��� �"���=�(� �B &'�$ &'�� �'�$ �'�� �'�$.�,� ���" 5 $1� $ � 3�� 5�3.�,� �( +" 5 $ � .�,� �����" $1� 4��@ $2� 2�$ �5$ $� $� .�,� �"��*!��"� ; 2 ;�� ;$$ ;1$ ;1�F, , �( ��"���3"��/+"0 1 �� � *��"���� ��/-0 1 ;3 $3; �;� ; ; (� �(�� � * ��!!������ ��/-0 $3;� $;5 ; �!!�����(�� *
��" �- �"�����,�����% �� �� �� �;1��" �- �"����*!��"���"��C"���� 2�;3: �*��( % ��+�� �%�� � ����-�-�� ���6�/���0 $3
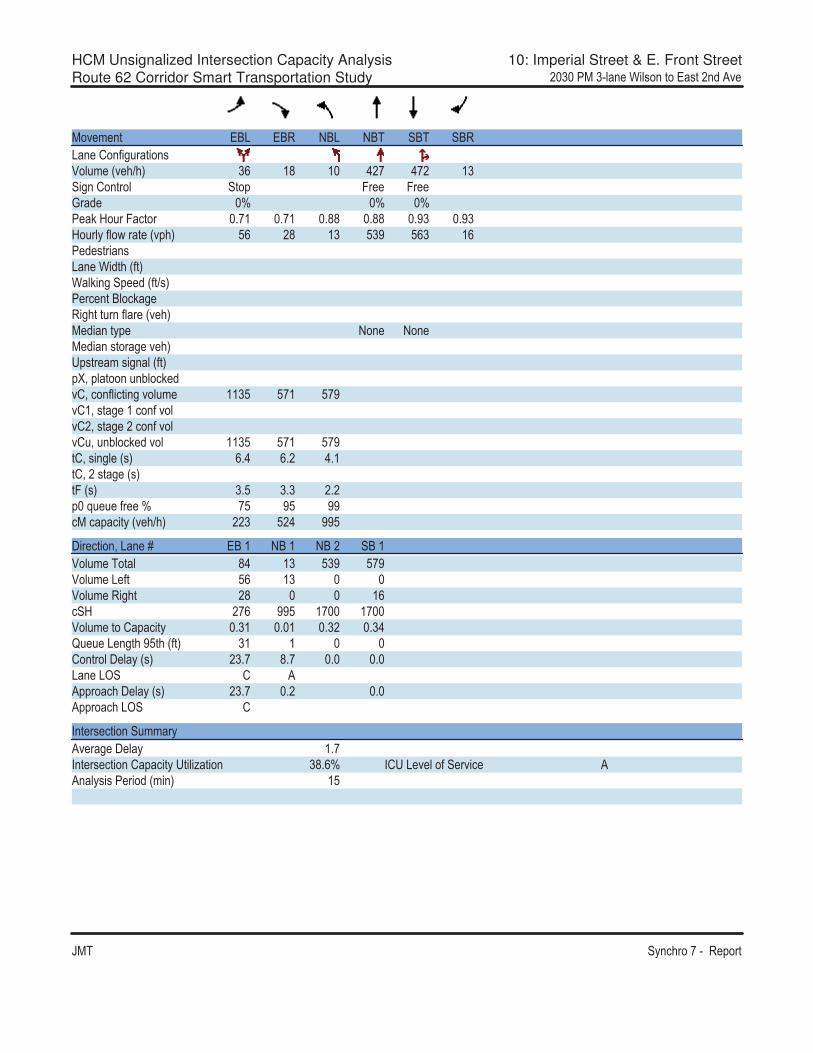
HCM Unsignalized Intersection Capacity Analysis 10: Imperial Street & E. Front StreetRoute 62 Corridor Smart Transportation Study � 1 ����1�� �)�-���"��&-"���6��%
#�� �������������� !��"
��% � �" &'( &'� �'( �'� �'� �'�(� �*��+��,�"���-.�,� �/% �>�0 15 $4 $ 2�� 2�� $1�����*��"�� �"�! 7� 7� 9�6 : : :� ?�@�,��7�"�� ;�$ ;�$ ;44 ;44 ;�1 ;�1@�,���+�8��" �/%!�0 35 �4 $1 31� 351 $5� 6 -"���-(� �)�6"��/+"0)?�����! 6�/+">-0� �� �"�'��?� ����"�",���+� �/% �0� 6���"�! ��� ��� � 6���-"��� �% �0�!-"� ��-����/+"0!D=�!"����,�<��? 6%*=����+��"����%�,� $$13 3�$ 3��%*$=�-"� �$����+�%�%*�=�-"� ������+�%�%*,=�,�<��? 6�%� $$13 3�$ 3��"*=�-��� �/-0 5;2 5;� 2;$"*=���-"� �/-0"7�/-0 1;3 1;1 �;�! �E, , �+� �: �3 �3 ������!��"��/% �>�0 ��1 3�2 ��3
��� �"���=�(� �B &'�$ �'�$ �'�� �'�$.�,� ���" 42 $1 31� 3��.�,� �( +" 35 $1 .�,� �����" �4 $5��@ ��5 ��3 $� $� .�,� �"��*!��"� ;1$ ; $ ;1� ;12F, , �( ��"���3"��/+"0 1$ $ *��"���� ��/-0 �1;� 4;� ; ; (� �(�� * ��!!������ ��/-0 �1;� ;� ; �!!�����(�� *
��" �- �"�����,�����% �� �� �� $;���" �- �"����*!��"���"��C"���� 14;5: �*��( % ��+�� �%�� � ����-�-�� ���6�/���0 $3

HCM Unsignalized Intersection Capacity Analysis 4: E. Front Street & Wilson AvenueRoute 62 Corridor Smart Transportation Study � 1 ����1�� �)�-���"��&-"���6��%
#�� �������������� !��"
��% � �" &'� &'� )'( )'� �'( �'�(� �*��+��,�"���-.�,� �/% �>�0 251 �43 �����*��"�� 7� 7� �"�!9�6 : : :� ?�@�,��7�"�� ;�� ;�� ;� ;� ;42 ;42@�,���+�8��" �/%!�0 3�$ 1�� � 6 -"���-(� �)�6"��/+"0)?�����! 6�/+">-0� �� �"�'��?� ����"�",���+� �/% �0� 6���"�! ��� ��� � 6���-"��� �% �0�!-"� ��-����/+"0 143!D=�!"����,�<��? 6%*=����+��"����%�,� 3�$ %*$=�-"� �$����+�%�%*�=�-"� ������+�%�%*,=�,�<��? 6�%� 3�$ "*=�-��� �/-0 2;$ 5;2 5;�"*=���-"� �/-0"7�/-0 �;� 1;3 1;1! �E, , �+� �: $ �� $ ����!��"��/% �>�0 $5�1 242 $ 44
��� �"���=�(� �B )'�$ �'�$.�,� ���" 3�$ 1��.�,� �( +" 1��.�,� �����" ��@ $� 242.�,� �"��*!��"� ;12 ;�4F, , �( ��"���3"��/+"0 $�1*��"���� ��/-0 ; 11;�(� �(�� ��!!������ ��/-0 ; 11;��!!�����(�� �
��" �- �"�����,�����% �� �� �� $1;3��" �- �"����*!��"���"��C"���� 42;$: �*��( % ��+�� �%�� � &���-�-�� ���6�/���0 $3
Appendix E
Route 62 Smart Transportation Corridor Study Final Report October 2010
Appendix E: Synchro HCM Reports
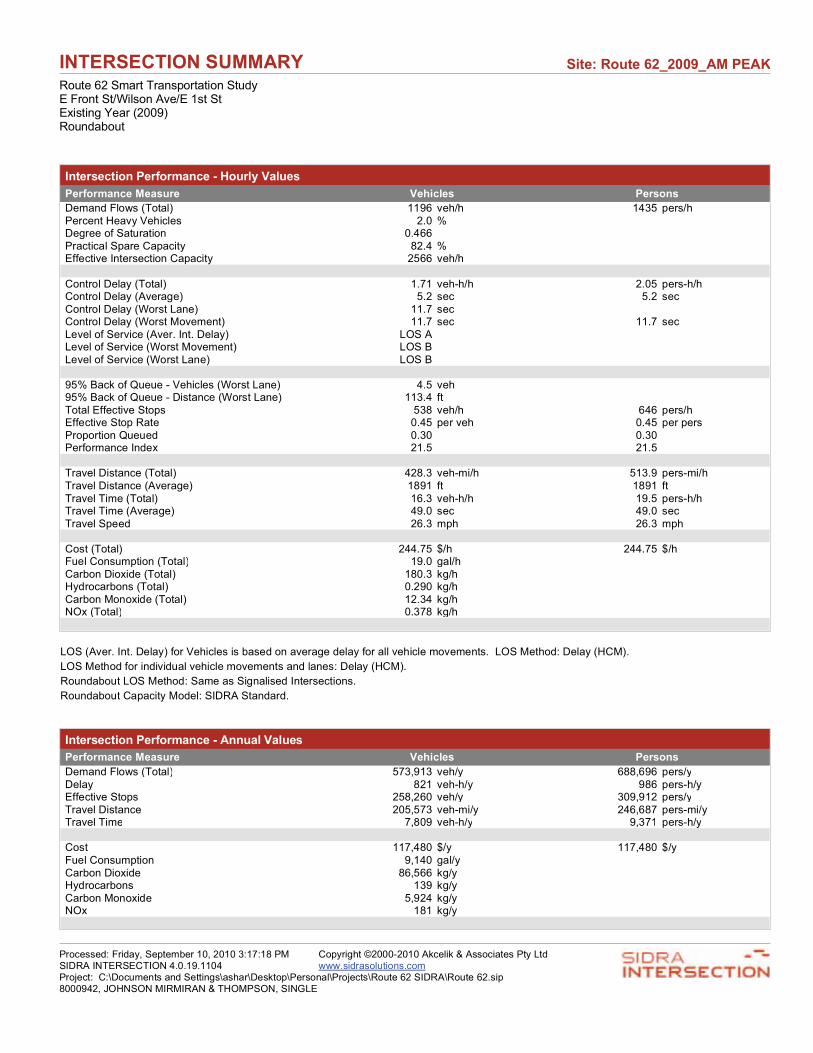
��������������� �� ����� ������������� ��� ����������� ��� ����� �������������� ������������������������������������ � !!"#������$���
��������������� ��!"���#$���%&'"%������ ��!"�����"���� '�(��%�� �������%���������&�� �����# ��"� ��'�' �()* �� ��'+� ,����-�����.�'�,��� /! 0%�� ����1���� ����� !/(��+ �,��,����� ��2���,��� 3/( 0�11�,�����4��� ��,�����2���,��� *�� ��'�'
2��� ���%����� �����# �/5� ��'6'�' /!* �� �6'�'2��� ���%����� ��� ���# */ ��, */ ��,2��� ���%����� �� ���7���# ��/5 ��,2��� ���%����� �� ���8�������# ��/5 ��, ��/5 ��,7������1�� ��,�� ��� /�4��/�%����# 79��7������1�� ��,�� �� ���8�������# 79�:7������1�� ��,�� �� ���7���# 79�:
"*0�:�,;��1�<�����6�.�'�,���� �� ���7���# (/* ��'"*0�:�,;��1�<�����6�%�����,�� �� ���7���# ��)/( 1��������11�,��������� *)3 ��'�' �(� �� ��'�11�,������������� !/(* �� ���' !/(* �� ��� �+ ��� �����<����� !/)! !/)!+� 1� ���,��4���� �/* �/*
� �����%�����,�� �����# (3/) ��'6���' *�)/" �� �6���'� �����%�����,�� ��� ���# �3"� 1� �3"� 1�� ���������� �����# ��/) ��'6'�' �"/* �� �6'�'� ���������� ��� ���# ("/! ��, ("/! ��,� ��������� �/) ��' �/) ��'
2���� �����# ((/5* =�' ((/5* =�'�����2����������� �����# �"/! ����'2� $���%������� �����# �3!/) ;��'-�� �,� $���� �����# !/"! ;��'2� $���8�������� �����# �/)( ;��'>9�� �����# !/)53 ;��'
79� ��� /�4��/�%����#�1� �.�'�,�������$����������� ����������1� �������'�,������������/��79�8��'��?�%����� -28#/��79�8��'���1� ��������������'�,����������������������?�%����� -28#/��������$����79�8��'��?������������������4��� ��,�����/������$����2���,����8����?�4%�������� �/
��������������� ��!"���# ���"%'"%������ ��!"�����"���� '�(��%�� �������%���������&�� �����# *5)@"�) ��'�� �33@�"� �� ���%���� 3� ��'6'�� "3� �� �6'���11�,��������� *3@�! ��'�� )!"@"� �� ���� �����%�����,� !*@*5) ��'6���� (�@�35 �� �6����� ��������� 5@3!" ��'6'�� "@)5� �� �6'��
2��� ��5@(3! =�� ��5@(3! =�������2���������� "@�(! �����2� $���%������ 3�@*�� ;���-�� �,� $��� �)" ;���2� $���8������� *@"( ;���>9� �3� ;���
+ �,�����?�� ����@������$� ��!@�!�!�)?�5?�3�+84%���4>����2�49>�(/!/�"/��!(
2��� ��'��A!!!6!�!��;,���;�B�����,������+���7��&&&/��� ����������/,��
+ �C�,�?� 2?D%�,������������������D��'� D%��;���D+� �����D+ �C�,��D��������4%��D�������/���3!!!"(@�E9->9>�84�84��>�B��-98+9>@�4>F7�

������������� ���� ������������������������������� ��� ����� �������������� ������������������������������������ � !!"#������$���
���������������� �!��"���#�!$�%"%&�'�()��*�+����
,���-. �� �.�����
����/�� 01.��2����
��� ����.������
3������*�� ��(�
4 ��2��+�����
�**�(�������������
��� ����������1�5�(��� .�����(�
��5�5 & ��( ��( ��5 *� �� ���5 ��5���56��������������
73 3 ��! 2! !2 ��28 39�' �2% 7:2 !2�� !28� 2!:� � 2! !2�8 82; 39�� �2% 7:2 !2�� !2�% 2"
��� ��(5 �� 2! !2 ��28 39�' �2% 7:2 !2�� !28� 2!
����6���� ����� ����� � ;%� 2! !2;�� �2% 39�� ;2% ��72; !2%8 !2%8 7�27
��� ��(5 ;%� 2! !2;�� �2% 39�� ;2% ��72; !2%8 !2%8 7�27
����6�������� ���%3 3 �7 2! !2%� �!2� 39�' !2! !2! !2!! �2!% 2"� � ;!8 2! !2;: 2; 39�� !2! !2! !2!! !28 %2;� � ��7 2! !2!"8 �2� 39�� !2! !2! !2!! !2� ;2
��� ��(5 %:7 2! !2;: 27 39�' !2! !2! !2!! !28 %2!
����1�5�(��� ��"� 2! !2;�� %2 39�� ;2% ��72; !27! !2;% �27
3������*�� ��(�� ��� 2�-��2�.����#6�39��2��'����������� ����������*� �������5�(������������2��39 ,��5��6�.����� 0<,#2��3������*�� ��(�� �� ���,�������#6�39�'2��39�,��5���*� ��������������5�(������������6�.����� 0<,#2����� ��(5�39��������� ��$���������5��/� ���������*� �������5�(�����������2������$����39�,��5��6������������������-��� ��(�����2������$����<���(����,����6�-.�������� �2
4 �(�����6�� ����=������$� ��!=�!�!�76�86�:�4,-.���->����<�-9>�;2!2�"2��!;
<��� ��5��?!!!@!�!��)(���)�A�����(������4���3��///2��� ����������2(��
4 �B�(�6� <6C.�(������������������C��5� C.��)���C4� �����C4 �B�(��C��������-.��C�������2���:!!!";=�D90>9>�,-�,-��>�A��09,49>=�->E3�

��������������� �� ����� ����������������� ����������� ��� ����� �������������� ������������������������������������ � !!"#������$���
��������������� ��!"���#$���%&'"%������ ��!"�����"���� '�(��%�� �������%���������&�� �����# ��'( ��)�) �"�! �� ��)*� +����,�����-�)�+��� .! /%�� ����0���� ����� !.�'"* �+��+����� ��1���+��� ''.� /�00�+�����2��� ��+�����1���+��� 334 ��)�)
1��� ���%����� �����# '.�" ��)5)�) '.4 �� �5)�)1��� ���%����� ��� ���# 6.! ��+ 6.! ��+1��� ���%����� �� ���7���# �(.4 ��+1��� ���%����� �� ���8�������# �(.4 ��+ �(.4 ��+7������0�� ��+�� ��� .�2��.�%����# 79��7������0�� ��+�� �� ���8�������# 79�:7������0�� ��+�� �� ���7���# 79�:
"3/�:�+;��0�<�����5�-�)�+���� �� ���7���# 6." ��)"3/�:�+;��0�<�����5�%�����+�� �� ���7���# !�.3 0��������00�+��������� " ��)�) ��!6 �� ��)�00�+������������� !.3� �� ���) !.3� �� ��� �* ��� �����<����� !.'" !.'"*� 0� ���+��2���� ''. ''.
� �����%�����+�� �����# 344.� ��)5���) 6!�.' �� �5���)� �����%�����+�� ��� ���# �"! 0� �"! 0�� ���������� �����# '.( ��)5)�) 4.� �� �5)�)� ���������� ��� ���# 3�.� ��+ 3�.� ��+� ��������� 3.� ��) 3.� ��)
1���� �����# '3�.�" =�) '3�.�" =�)�����1����������� �����# 6.' ����)1� $���%������� �����# 34.� ;��),�� �+� $���� �����# !.(� ;��)1� $���8�������� �����# �4.'6 ;��)>9�� �����# !.3(3 ;��)
79� ��� .�2��.�%����#�0� �-�)�+�������$����������� ����������0� �������)�+������������.��79�8��)��?�%����� ,18#.��79�8��)���0� ��������������)�+����������������������?�%����� ,18#.��������$����79�8��)��?������������������2��� ��+�����.������$����1���+����8����?�2%�������� �.
��������������� ��!"���# ���"%'"%������ ��!"�����"���� '�(��%�� �������%���������&�� �����# 64(@�6( ��)�� "(�@!!" �� ���%���� �@3" ��)5)�� �@4'3 �� �5)���00�+��������� ((@�'! ��)�� 3'�@�33 �� ���� �����%�����+� 4@3!" ��)5���� ''"@!�� �� �5����� ��������� ��@( ��)5)�� �'@("� �� �5)��
1��� ��4@4!" =�� ��4@4!" =�������1���������� �'@!4! �����1� $���%������ �'@44� ;���,�� �+� $��� ! ;���1� $���8������� 4@4�" ;���>9� � ;���
* �+�����?�� ����@������$� ��!@�!�!�'?�6?�"�*82%���2>����1�29>�(.!.�".��!(
1��� ��)��A!!!5!�!��;+���;�B�����+������*���7��&&&.��� ����������.+��
* �C�+�?� 1?D%�+������������������D��)� D%��;���D*� �����D* �C�+��D��������2%��D�������.���4!!!"(@�E9,>9>�82�82��>�B��,98*9>@�2>F7�
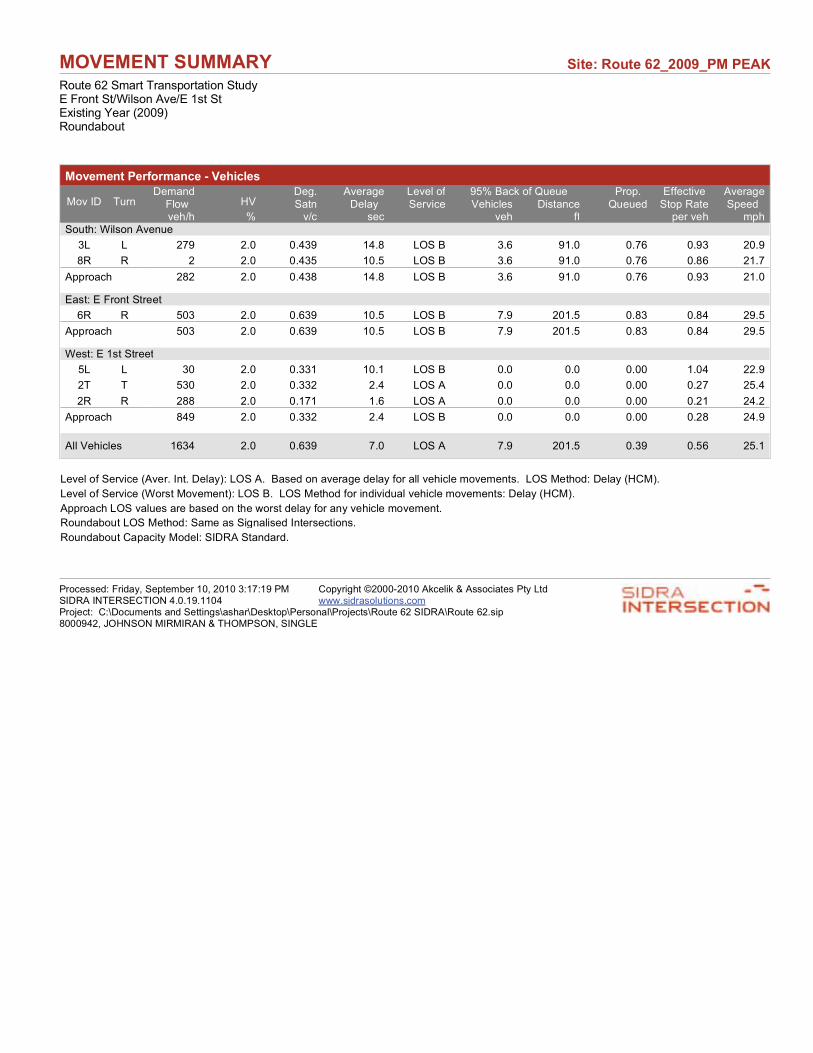
������������� ���� ������������������������������� ��� ����� �������������� ������������������������������������ � !!"#������$���
���������������� �!��"���#�!$�%"%&�'�()��*�+����
,���-. �� �.�����
����/�� 01.��2����
��� ����.������
3������*�� ��(�
4 ��2��+�����
�**�(�������������
��� ����������1�5�(��� .�����(�
��5�5 & ��( ��( ��5 *� �� ���5 ��5���56��������������
73 3 8" 2! !297" �92: 3;�' 72� "�2! !28� !2"7 !2":� � 2! !297% �!2% 3;�' 72� "�2! !28� !2:� �28
��� ��(5 : 2! !297: �92: 3;�' 72� "�2! !28� !2"7 �2!
����6���� ����� ����� � %!7 2! !2�7" �!2% 3;�' 82" !�2% !2:7 !2:9 "2%
��� ��(5 %!7 2! !2�7" �!2% 3;�' 82" !�2% !2:7 !2:9 "2%
����6�������� ���%3 3 7! 2! !277� �!2� 3;�' !2! !2! !2!! �2!9 2"� � %7! 2! !277 29 3;�� !2! !2! !2!! !28 %29� � :: 2! !2�8� �2� 3;�� !2! !2! !2!! !2� 92
��� ��(5 :9" 2! !277 29 3;�' !2! !2! !2!! !2: 92"
����1�5�(��� ��79 2! !2�7" 82! 3;�� 82" !�2% !27" !2%� %2�
3������*�� ��(�� ��� 2�-��2�.����#6�3;��2��'����������� ����������*� �������5�(������������2��3; ,��5��6�.����� 0<,#2��3������*�� ��(�� �� ���,�������#6�3;�'2��3;�,��5���*� ��������������5�(������������6�.����� 0<,#2����� ��(5�3;��������� ��$���������5��/� ���������*� �������5�(�����������2������$����3;�,��5��6������������������-��� ��(�����2������$����<���(����,����6�-.�������� �2
4 �(�����6�� ����=������$� ��!=�!�!�76�86�"�4,-.���->����<�-;>�92!2�"2��!9
<��� ��5��?!!!@!�!��)(���)�A�����(������4���3��///2��� ����������2(��
4 �B�(�6� <6C.�(������������������C��5� C.��)���C4� �����C4 �B�(��C��������-.��C�������2���:!!!"9=�D;0>;>�,-�,-��>�A��0;,4;>=�->E3�

��������������� �� ����� ������������� ��� ����������� ��� ����� �������������� ���������������������������� ����� ��� !"������#���
������� �������!��"#� �$%���&'(#&������!��"#� ���#���� (�)� &�� �������$���������%��������" � & ��'�' �!( �� ��')� *����+�����,�'�*��� -� .$�/ ����0���� ����� �-! �) �*��*����� ��1���*��� ��-! .�00�*�����2��� ��*�����1���*��� !�� ��'�'
1��� ���$�����������" �-(3 ��'4'�' - & �� �4'�'1��� ���$��������� �/�" !-5 ��* !-5 ��*1��� ���$�������� ���6���" �- ��*1��� ���$�������� ���7�������" �- ��* �- ��*6������0�� ��*������ -�2��-�$����" 68��6������0�� ��*����� ���7�������" 68�96������0�� ��*����� ���6���" 68�9
(!.�9�*:��0�;�����4�,�'�*������� ���6���" !-5 ��'(!.�9�*:��0�;�����4�$�����*����� ���6���" � �-! 0��������00�*��������� � ��'�' &5� �� ��'�00�*������������� �-5& �� ���' �-5& �� ��� �) ��� �����;����� �- �- )� 0� ���*��2���< 5- 5-
� �����$�����*��������" 5&!- ��'4���' !&�-5 �� �4���'� �����$�����*������ �/�" �3(� 0� �3(� 0�� ����������������" �3-� ��'4'�' �-3 �� �4'�'� �������������� �/�" 5(- ��* 5(- ��*� ��������� �- ��' �- ��'
1����������" & -� =�' & -� =�'�����1�����������������" �- /���'1� #���$��<����������" ��- :/�'+�� �*� #����������" �- 5 :/�'1� #���7���<����������" � -3! :/�'>8<�������" �-5 :/�'
68����� -�2��-�$����"�0� �,�'�*�������#����������� �/��������0� �������'�*������������-��68�7��'��?�$������+17"-��68�7��'���0� ��������������'�*����������������������?�$������+17"-��������#����68�7��'��?���������/��������2��� ��*�����-������#����1���*����7����?�2$�������� �-
������� �������!��"#� �$ ���#&(#&������!��"#� ���#���� (�)� &�� �������$���������%��������" � &@�5 ��'�� &�5@5! �� ���$���� (5( ��'4'�� �@� ( �� �4'���00�*��������� (3@ 5� ��'�� !3@��3 �� ���� �����$�����*� 3@��� ��'4���� & @&( �� �4����� ��������� 3@&�3 ��'4'�� ��@5!� �� �4'��
1��� � �@�5( =�� � �@�5( =�������1���������� ��@�� /����1� #���$��<��� (�@��� :/��+�� �*� #��� �!� :/��1� #���7���<��� �@�!� :/��>8< � :/��
) �*�����?�� ����@������#� ���@����� ?�&?��)72$���2>����1�28>�5-�-�(-���5
1��� �/'��A���4�����:*���:�B�����*������)���6��%%%-��� ����������-*��
) �C�*�?� 1?D$�*����������������/�D��'� D$��:���D)� �����D) �C�*��D��������2$��D�������-���3���(5@�E8+>8>�72�72��>�B��+87)8>@�2>F6�
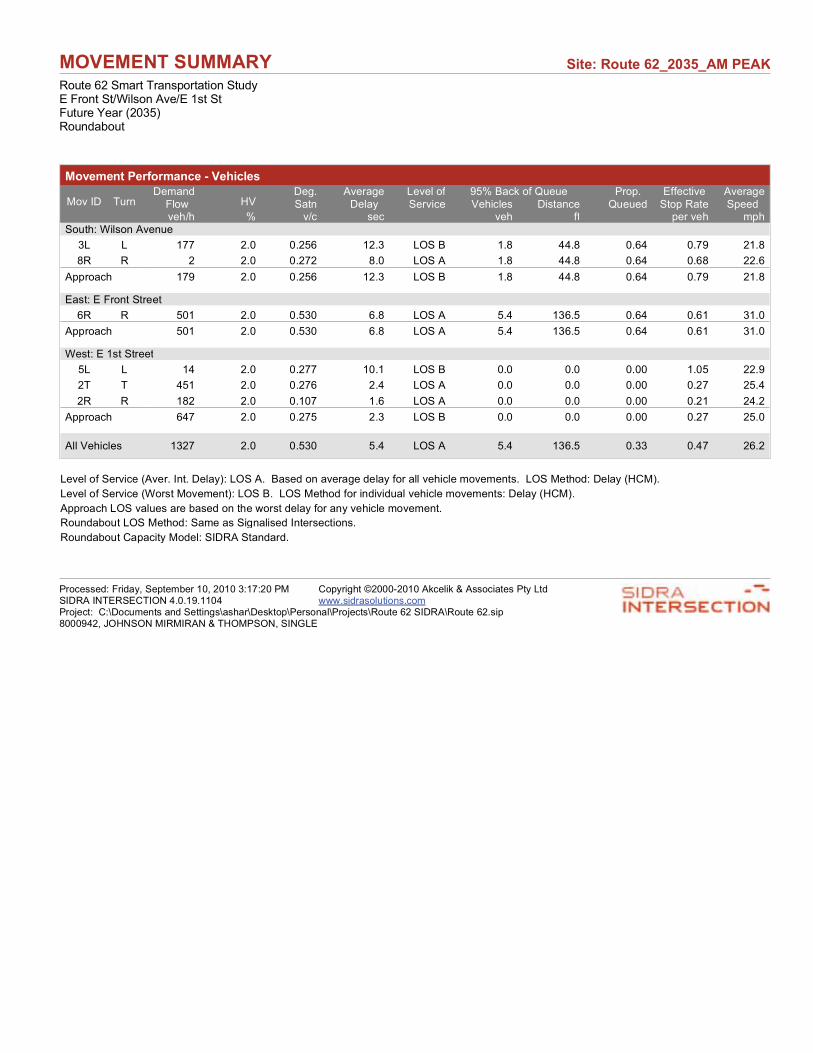
������������� ���� ������������������������������� ��� ����� �������������� ���������������������������� ����� ��� !"������#���
������������ ���!�"��#���$�"%�&$!%�&�'(��)�*����
+���,- �� �-���������.�� /0
-�12����
��� �1��-������
3������)�� ��'�
4 ��2��*�����
�))�'�������������
��� �1��������0�5�'��� -�����'�
��5�5 % ��' ��' ��5 )� �� ���5 ��5���56��������������
3 3 �77 2� �2!� �2 38�& �29 ::29 �2�: �27$ �299� � 2� �27 92� 38�� �29 ::29 �2�: �2�9 2�
��� ��'5 �7$ 2� �2!� �2 38�& �29 ::29 �2�: �27$ �29
����6���� ����� ����� � !�� 2� �2! � �29 38�� !2: � �2! �2�: �2�� �2�
��� ��'5 !�� 2� �2! � �29 38�� !2: � �2! �2�: �2�� �2�
����6�������� ���!3 3 �: 2� �277 ��2� 38�& �2� �2� �2�� �2�! 2$� � :!� 2� �27� 2: 38�� �2� �2� �2�� �27 !2:� � �9 2� �2��7 �2� 38�� �2� �2� �2�� �2� :2
��� ��'5 �:7 2� �27! 2 38�& �2� �2� �2�� �27 !2�
����0�5�'��� � 7 2� �2! � !2: 38�� !2: � �2! �2 �2:7 �2
3������)�� ��'������ 2�,��2�-����"6�38��2��&����������� �1��������)� �������5�'������������2��38 +��5��6�-������/;+"2��3������)�� ��'����� ���+�������"6�38�&2��38�+��5���)� ��������������5�'������������6�-������/;+"2����� ��'5�38��������� ��#���������5��.� ���������)� �������5�'�����������2������#����38�+��5��6���������1��������,��� ��'�����2������#����;���'����+����6�,-�������� �2
4 �'�����6�� ����<������#� ���<����� 6�76��4+,-���,=����;�,8=�:2�2�$2���:
;��� �15��>���?�����('���(�@�����'������4���3��...2��� ����������2'��
4 �A�'�6� ;6B-�'����������������1�B��5� B-��(���B4� �����B4 �A�'��B��������,-��B�������2���9���$:<�C8/=8=�+,�+,��=�@��/8+48=<�,=D3�

��������������� �� ����� ����������������� ����������� ��� ����� �������������� ���������������������������� ����� ��� !"������#���
������� �������!��"#� �$%���&'(#&������!��"#� ���#���� (�)� &�� �������$���������%��������" �&� ��'�' �(� �� ��')� *����+�����,�'�*��� -� .$�/ ����0���� ����� �-(1�) �*��*����� ��2���*��� �1-3 .�00�*�����4��� ��*�����2���*��� 1!� ��'�'
2��� ���$�����������" 1-� ��'5'�' !-�� �� �5'�'2��� ���$��������� �/�" &-! ��* &-! ��*2��� ���$�������� ���6���" �(- ��*2��� ���$�������� ���7�������" �(-1 ��* �(-1 ��*6������0�� ��*������ -�4��-�$����" 68��6������0�� ��*����� ���7�������" 68�96������0�� ��*����� ���6���" 68�9
3!.�9�*:��0�;�����5�,�'�*������� ���6���" ��- ��'3!.�9�*:��0�;�����5�$�����*����� ���6���" &�-& 0��������00�*��������� ��1 ��'�' � (� �� ��'�00�*������������� �-� �� ���' �-� �� ��� �) ��� �����;����� �-1 �-1 )� 0� ���*��4���< 3-1 3-1
� �����$�����*��������" �! - ��'5���' (& -& �� �5���'� �����$�����*������ �/�" �3� 0� �3� 0�� ����������������" �-( ��'5'�' -� �� �5'�'� �������������� �/�" ! -� ��* ! -� ��*� ��������� 1-1 ��' 1-1 ��'
2����������" 1��-�1 =�' 1��-�1 =�'�����2�����������������" �-& /���'2� #���$��<����������" 3�-3 :/�'+�� �*� #����������" �-1(3 :/�'2� #���7���<����������" �-3& :/�'>8<�������" �-��& :/�'
68����� -�4��-�$����"�0� �,�'�*�������#����������� �/��������0� �������'�*������������-��68�7��'��?�$������+27"-��68�7��'���0� ��������������'�*����������������������?�$������+27"-��������#����68�7��'��?���������/��������4��� ��*�����-������#����2���*����7����?�4$�������� �-
������� �������!��"#� �$ ���#&(#&������!��"#� ���#���� (�)� &�� �������$���������%��������" &(�@�� ��'�� �@�11@ � �� ���$���� @�1� ��'5'�� @1!! �� �5'���00�*��������� !1&@!1! ��'�� �!&@! �� ���� �����$�����*� � @!�3 ��'5���� (�@ �� �5����� ��������� �@&! ��'5'�� �!@ 3� �� �5'��
2��� �3@��( =�� �3@��( =�������2���������� �1@(3 /����2� #���$��<��� �1�@�3! :/��+�� �*� #��� � :/��2� #���7���<��� ��@�(� :/��>8< 3( :/��
) �*�����?�� ����@������#� ���@����� ?�(?��)74$���4>����2�48>�1-�-�3-���1
2��� �/'��A���5�����:*���:�B�����*������)���6��%%%-��� ����������-*��
) �C�*�?� 2?D$�*����������������/�D��'� D$��:���D)� �����D) �C�*��D��������4$��D�������-���&���31@�E8+>8>�74�74��>�B��+87)8>@�4>F6�

������������� ���� ������������������������������� ��� ����� �������������� ���������������������������� ����� ��� !"������#���
������������ ���!�"��#���$�"%�&$!%�&�'(��)�*����
+���,- �� �-���������.�� /0
-�12����
��� �1��-������
3������)�� ��'�
4 ��2��*�����
�))�'�������������
��� �1��������0�5�'��� -�����'�
��5�5 % ��' ��' ��5 )� �� ���5 ��5���56��������������
3 3 �� 2� �2!� �728 39�& 82: ��2! �2: �2�8 �2:� � 2� �2!8 � 2� 39�& 82: ��2! �2: �2$$ �2:
��� ��'5 � 2� �2!� �72 39�& 82: ��2! �2: �2�8 �2
����6���� ����� ����� � !!$ 2� �278� � 2: 39�& ��2 :�2: �2$8 �2�� 72
��� ��'5 !!$ 2� �278� � 2: 39�& ��2 :�2: �2$8 �2�� 72
����6�������� ���!3 3 8 2� �2 7� ��2� 39�& �2� �2� �2�� �2�8 2$� � !:$ 2� �2 �$ 28 39�� �2� �2� �2�� �27 !28� � � 2� �2�:$ �2� 39�� �2� �2� �2�� �2� 82
��� ��'5 $8 2� �2 �$ 28 39�& �2� �2� �2�� �2: 82$
����0�5�'��� �:� 2� �278� :2! 39�� ��2 :�2: �28 �2� 828
3������)�� ��'������ 2�,��2�-����"6�39��2��&����������� �1��������)� �������5�'������������2��39 +��5��6�-������/;+"2��3������)�� ��'����� ���+�������"6�39�&2��39�+��5���)� ��������������5�'������������6�-������/;+"2����� ��'5�39��������� ��#���������5��.� ���������)� �������5�'�����������2������#����39�+��5��6���������1��������,��� ��'�����2������#����;���'����+����6�,-�������� �2
4 �'�����6�� ����<������#� ���<����� 6�76��4+,-���,=����;�,9=�82�2�$2���8
;��� �15��>���?�����('���(�@�����'������4���3��...2��� ����������2'��
4 �A�'�6� ;6B-�'����������������1�B��5� B-��(���B4� �����B4 �A�'��B��������,-��B�������2���:���$8<�C9/=9=�+,�+,��=�@��/9+49=<�,=D3�

Appendix F
Route 62 Smart Transportation Corridor Study Final Report October 2010
Appendix F: Funding Analysis
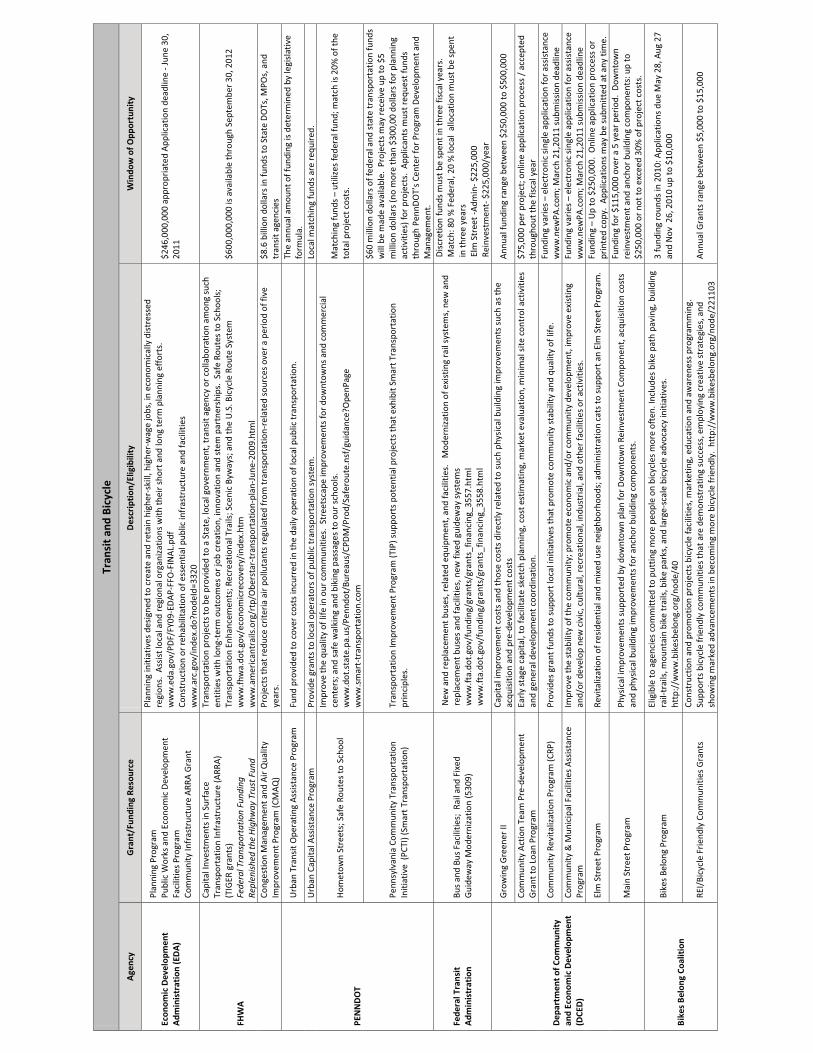
Tran
sit a
nd B
icyc
le
Age
ncy
Gra
nt/F
undi
ng R
esou
rce
Des
crip
tion
/Elig
ibili
ty
Win
dow
of O
ppor
tuni
ty
Econ
omic
Dev
elop
men
t A
dmin
istr
atio
n (E
DA
)
Plan
ning
Pro
gram
Pu
blic
Wor
ks a
nd E
cono
mic
Dev
elop
men
t Fa
cilit
ies
Prog
ram
Co
mm
unity
Infr
astr
uctu
re A
RRA
Gra
nt
Plan
ning
initi
ativ
es d
esig
ned
to c
reat
e an
d re
tain
hig
her-
skill
, hig
her-
wag
e jo
bs, i
n ec
onom
ical
ly d
istr
esse
d re
gion
s. A
ssis
t loc
al a
nd re
gion
al o
rgan
izat
ions
with
thei
r sh
ort a
nd lo
ng te
rm p
lann
ing
effo
rts.
w
ww
.eda
.gov
/PD
F/FY
09-E
DA
P-FF
O-F
INA
L.pd
f Co
nstr
uctio
n or
reha
bilit
atio
n of
ess
entia
l pub
lic in
fras
truc
ture
and
faci
litie
s
ww
w.a
rc.g
ov/i
ndex
.do?
node
Id=3
320
$246
,000
,000
app
ropr
iate
d A
pplic
atio
n de
adlin
e - J
une
30,
2011
FHW
A
Capi
tal I
nves
tmen
ts in
Sur
face
Tr
ansp
orta
tion
Infr
astr
uctu
re (A
RRA
) (T
IGER
gra
nts)
Fe
dera
l Tra
nspo
rtat
ion
Fund
ing
Repl
enis
hed
the
Hig
hway
Tru
st F
und
Tran
spor
tatio
n pr
ojec
ts to
be
prov
ided
to a
Sta
te, l
ocal
gov
ernm
ent,
tran
sit a
genc
y or
col
labo
ratio
n am
ong
such
en
titie
s w
ith lo
ng-t
erm
out
com
es o
r job
cre
atio
n, in
nova
tion
and
stem
par
tner
ship
s. S
afe
Rout
es to
Sch
ools
; Tr
ansp
orta
tion
Enha
ncem
ents
; Rec
reat
iona
l Tra
ils; S
ceni
c By
way
s; a
nd th
e U
.S. B
icyc
le R
oute
Sys
tem
w
ww
.fhw
a.do
t.go
v/ec
onom
icre
cove
ry/i
ndex
.htm
w
ww
.am
eric
antr
ails
.org
/rtp
/Obe
rsta
r-tr
ansp
orta
tion-
plan
-Jun
e-20
09.h
tml
$600
,000
,000
is a
vaila
ble
thro
ugh
Sept
embe
r 30,
201
2
Cong
estio
n M
anag
emen
t and
Air
Qua
lity
Impr
ovem
ent P
rogr
am (C
MA
Q)
Proj
ects
that
red
uce
crite
ria a
ir p
ollu
tant
s re
gula
ted
from
tran
spor
tatio
n-re
late
d so
urce
s ov
er a
per
iod
of fi
ve
year
s.
$8.6
bill
ion
dolla
rs in
fund
s to
Sta
te D
OTs
, MPO
s, a
nd
tran
sit a
genc
ies
PEN
ND
OT
Urb
an T
rans
it O
pera
ting
Ass
ista
nce
Prog
ram
Fu
nd p
rovi
ded
to c
over
cos
ts in
curr
ed in
the
daily
ope
ratio
n of
loca
l pub
lic tr
ansp
orta
tion.
Th
e an
nual
am
ount
of f
undi
ng is
det
erm
ined
by
legi
slat
ive
form
ula.
U
rban
Cap
ital A
ssis
tanc
e Pr
ogra
m
Prov
ide
gran
ts to
loca
l ope
rato
rs o
f pub
lic tr
ansp
orta
tion
syst
em.
Loca
l mat
chin
g fu
nds
are
requ
ired
.
Hom
etow
n St
reet
s; S
afe
Rout
es to
Sch
ool
Impr
ove
the
qual
ity o
f life
in o
ur c
omm
uniti
es.
Stre
etsc
ape
impr
ovem
ents
for
dow
ntow
ns a
nd c
omm
erci
al
cent
ers;
and
saf
e w
alki
ng a
nd b
ikin
g pa
ssag
es to
our
sch
ools
. w
ww
.dot
.sta
te.p
a.us
/Pen
ndot
/Bur
eaus
/CPD
M/P
rod/
Safe
rout
e.ns
f/gu
idan
ce?O
penP
age
ww
w.s
mar
t-tr
ansp
orta
tion.
com
Mat
chin
g fu
nds
– ut
ilize
s fe
dera
l fun
d; m
atch
is 2
0% o
f the
to
tal p
roje
ct c
osts
.
Penn
sylv
ania
Com
mun
ity T
rans
port
atio
n In
itiat
ive
(PCT
I) (S
mar
t Tra
nspo
rtat
ion)
Tr
ansp
orta
tion
Impr
ovem
ent P
rogr
am (T
IP) s
uppo
rts
pote
ntia
l pro
ject
s th
at e
xhib
it Sm
art T
rans
port
atio
n pr
inci
ples
.
$60
mill
ion
dolla
rs o
f fed
eral
and
sta
te tr
ansp
orta
tion
fund
s w
ill b
e m
ade
avai
labl
e. P
roje
cts
may
rec
eive
up
to $
5 m
illio
n do
llars
(no
mor
e th
an $
300,
00 d
olla
rs fo
r pla
nnin
g ac
tiviti
es) f
or p
roje
cts.
App
lican
ts m
ust r
eque
st fu
nds
thro
ugh
Penn
DO
T’s
Cent
er fo
r Pro
gram
Dev
elop
men
t and
M
anag
emen
t.
Fede
ral T
rans
it
Adm
inis
trat
ion
Bus
and
Bus
Faci
litie
s; R
ail a
nd F
ixed
G
uide
way
Mod
erni
zatio
n (5
309)
New
and
rep
lace
men
t bus
es, r
elat
ed e
quip
men
t, a
nd fa
cilit
ies.
M
oder
niza
tion
of e
xist
ing
rail
syst
ems,
new
and
re
plac
emen
t bus
es a
nd fa
cilit
ies,
new
fixe
d gu
idew
ay s
yste
ms
w
ww
.fta.
dot.
gov/
fund
ing/
gran
ts/g
rant
s_fin
anci
ng_3
557.
htm
l w
ww
.fta.
dot.
gov/
fund
ing/
gran
ts/g
rant
s_fin
anci
ng_3
558.
htm
l
Dis
cret
ion
fund
s m
ust b
e sp
ent i
n th
ree
fisca
l yea
rs.
Mat
ch: 8
0 %
Fed
eral
, 20
% lo
cal
allo
catio
n m
ust b
e sp
ent
in th
ree
year
s E
lm S
tree
t -A
dmin
- $22
5,00
0
Rein
vest
men
t- $
225,
000/
year
Dep
artm
ent o
f Com
mun
ity
and
Econ
omic
Dev
elop
men
t (D
CED
)
Gro
win
g G
reen
er II
Ca
pita
l im
prov
emen
t cos
ts a
nd th
ose
cost
s di
rect
ly r
elat
ed to
suc
h ph
ysic
al b
uild
ing
impr
ovem
ents
suc
h as
the
acqu
isiti
on a
nd p
re-d
evel
opm
ent c
osts
A
nnua
l fun
ding
ran
ge b
etw
een
$250
,000
to $
500,
000
Com
mun
ity A
ctio
n Te
am P
re-d
evel
opm
ent
Gra
nt to
Loa
n Pr
ogra
m
Earl
y st
age
capi
tal,
to fa
cilit
ate
sket
ch p
lann
ing,
cos
t est
imat
ing,
mar
ket e
valu
atio
n, m
inim
al s
ite c
ontr
ol a
ctiv
ities
an
d ge
nera
l dev
elop
men
t coo
rdin
atio
n.
$75,
000
per
proj
ect;
onl
ine
appl
icat
ion
proc
ess
/ ac
cept
ed
thro
ugho
ut th
e fis
cal y
ear
Com
mun
ity R
evita
lizat
ion
Prog
ram
(CRP
) Pr
ovid
es g
rant
fund
s to
sup
port
loca
l ini
tiativ
es th
at p
rom
ote
com
mun
ity s
tabi
lity
and
qual
ity o
f life
. Fu
ndin
g va
ries
– e
lect
roni
c si
ngle
app
licat
ion
for a
ssis
tanc
e w
ww
.new
PA.c
om; M
arch
21,
2011
sub
mis
sion
dea
dlin
e Co
mm
unity
& M
unic
ipal
Fac
ilitie
s A
ssis
tanc
e Pr
ogra
m
Impr
ove
the
stab
ility
of t
he c
omm
unity
; pro
mot
e ec
onom
ic a
nd/o
r co
mm
unity
dev
elop
men
t, im
prov
e ex
istin
g an
d/or
dev
elop
new
civ
ic, c
ultu
ral,
recr
eatio
nal,
indu
stri
al, a
nd o
ther
faci
litie
s or
act
iviti
es.
Fund
ing
vari
es –
ele
ctro
nic
sing
le a
pplic
atio
n fo
r ass
ista
nce
ww
w.n
ewPA
.com
; Mar
ch 2
1,20
11 s
ubm
issi
on d
eadl
ine
Elm
Str
eet P
rogr
am
Revi
taliz
atio
n of
resi
dent
ial a
nd m
ixed
use
nei
ghbo
rhoo
ds; a
dmin
istr
atio
n ca
ts to
sup
port
an
Elm
Str
eet P
rogr
am.
Fund
ing
– U
p to
$25
0,00
0. O
nlin
e ap
plic
atio
n pr
oces
s or
pr
inte
d co
py.
App
licat
ions
may
be
subm
itted
at a
ny ti
me.
Mai
n St
reet
Pro
gram
Ph
ysic
al im
prov
emen
ts s
uppo
rted
by
dow
ntow
n pl
an fo
r Dow
ntow
n Re
inve
stm
ent C
ompo
nent
, acq
uisi
tion
cost
s an
d ph
ysic
al b
uild
ing
impr
ovem
ents
for a
ncho
r bui
ldin
g co
mpo
nent
s.
Fund
ing
for
$115
,000
ove
r a 5
yea
r pe
riod
. D
ownt
own
rein
vest
men
t and
anc
hor
build
ing
com
pone
nts:
up
to
$250
,000
or
not t
o ex
ceed
30%
of p
roje
ct c
osts
.
Bike
s Be
long
Coa
litio
n
Bike
s Be
long
Pro
gram
El
igib
le to
age
ncie
s co
mm
itted
to p
uttin
g m
ore
peop
le o
n bi
cycl
es m
ore
ofte
n. In
clud
es b
ike
path
pav
ing,
bui
ldin
g ra
il-tr
ails
, mou
ntai
n bi
ke tr
ails
, bik
e pa
rks,
and
larg
e-sc
ale
bicy
cle
advo
cacy
initi
ativ
es.
http
://w
ww
.bik
esbe
long
.org
/nod
e/40
3 fu
ndin
g ro
unds
in 2
010:
App
licat
ions
due
May
28,
Aug
27
and
Nov
26,
201
0 up
to $
10,0
00
REI/
Bicy
cle
Frie
ndly
Com
mun
ities
Gra
nts
Cons
truc
tion
and
prom
otio
n pr
ojec
ts b
icyc
le fa
cilit
ies,
mar
ketin
g, e
duca
tion
and
awar
enes
s pr
ogra
mm
ing.
Su
ppor
ts b
icyc
le fr
iend
ly c
omm
uniti
es th
at a
re d
emon
stra
ting
succ
ess,
em
ploy
ing
crea
tive
stra
tegi
es, a
nd
show
ing
mar
ked
adva
ncem
ents
in b
ecom
ing
mor
e bi
cycl
e fr
iend
ly.
http
://w
ww
.bik
esbe
long
.org
/nod
e/22
1103
A
nnua
l Gra
nts
rang
e be
twee
n $5
,000
to $
15,0
00

Stre
etsc
ape
Enha
ncem
ents
Age
ncy
Gra
nt/F
undi
ng R
esou
rce
Des
crip
tion
/Elig
ibili
ty
Win
dow
of O
ppor
tuni
ty
Econ
omic
Dev
elop
men
t A
dmin
istr
atio
n (E
DA
)
Plan
ning
Pro
gram
Pu
blic
Wor
ks a
nd E
cono
mic
Dev
elop
men
t Fa
cilit
ies
Prog
ram
Co
mm
unity
Infr
astr
uctu
re A
RRA
Gra
nt
Plan
ning
initi
ativ
es d
esig
ned
to c
reat
e an
d re
tain
hig
her-
skill
, hig
her-
wag
e jo
bs, i
n ec
onom
ical
ly d
istr
esse
d re
gion
s. A
ssis
t loc
al a
nd re
gion
al o
rgan
izat
ions
with
thei
r sh
ort a
nd lo
ng te
rm p
lann
ing
effo
rts.
w
ww
.eda
.gov
/PD
F/FY
09-E
DA
P-FF
O-F
INA
L.pd
f Co
nstr
uctio
n or
reha
bilit
atio
n of
ess
entia
l pub
lic in
fras
truc
ture
and
faci
litie
s
ww
w.a
rc.g
ov/i
ndex
.do?
node
Id=3
320
$246
,000
,000
app
ropr
iate
d A
pplic
atio
n de
adlin
e - J
une
30,
2011
U.S
. Dep
artm
ent o
f Hou
sing
an
d U
rban
Dev
elop
men
t (H
UD
)
Com
mun
ity D
evel
opm
ent B
lock
Gra
nt (C
DBG
) –
ARR
A g
rant
fund
s H
ousi
ng a
nd in
fras
truc
ture
impr
ovem
ents
. Leb
anon
Cou
nty
adm
inis
ters
the
CDBG
pro
gram
ann
ually
. w
ww
.arc
.gov
/ind
ex.d
o?no
deId
=332
0 $1
3.61
bill
ion
in A
RRA
fund
ing.
PEN
ND
OT
Urb
an T
rans
it O
pera
ting
Ass
ista
nce
Prog
ram
Fu
nd p
rovi
ded
to c
over
cos
ts in
curr
ed in
the
daily
ope
ratio
n of
loca
l pub
lic tr
ansp
orta
tion.
Th
e an
nual
am
ount
of f
undi
ng is
det
erm
ined
by
legi
slat
ive
form
ula.
Urb
an C
apita
l Ass
ista
nce
Prog
ram
Pr
ovid
e gr
ants
to lo
cal o
pera
tors
of p
ublic
tran
spor
tatio
n sy
stem
. Lo
cal m
atch
ing
fund
s ar
e re
quir
ed.
Hom
etow
n St
reet
s; S
afe
Rout
es to
Sch
ool
Impr
ove
the
qual
ity o
f life
in o
ur c
omm
uniti
es.
Stre
etsc
ape
impr
ovem
ents
for
dow
ntow
ns a
nd c
omm
erci
al
cent
ers;
and
saf
e w
alki
ng a
nd b
ikin
g pa
ssag
es to
our
sch
ools
. w
ww
.dot
.sta
te.p
a.us
/Pen
ndot
/Bur
eaus
/CPD
M/P
rod/
Safe
rout
e.ns
f/gu
idan
ce?O
penP
age
ww
w.s
mar
t-tr
ansp
orta
tion.
com
Mat
chin
g fu
nds
– ut
ilize
s fe
dera
l fun
d; m
atch
is 2
0% o
f the
to
tal p
roje
ct c
osts
.
Penn
sylv
ania
Com
mun
ity T
rans
port
atio
n In
itiat
ive
(PCT
I) (S
mar
t Tra
nspo
rtat
ion)
Tr
ansp
orta
tion
Impr
ovem
ent P
rogr
am (T
IP) s
uppo
rts
pote
ntia
l pro
ject
s th
at e
xhib
it Sm
art T
rans
port
atio
n pr
inci
ples
.
$60
mill
ion
dolla
rs o
f fed
eral
and
sta
te tr
ansp
orta
tion
fund
s w
ill b
e m
ade
avai
labl
e. P
roje
cts
may
rec
eive
up
to $
5 m
illio
n do
llars
(no
mor
e th
an $
300,
00 d
olla
rs fo
r pla
nnin
g ac
tiviti
es) f
or p
roje
cts.
App
lican
ts m
ust r
eque
st fu
nds
thro
ugh
Penn
DO
T’s
Cent
er fo
r Pro
gram
Dev
elop
men
t and
M
anag
emen
t.
Dep
artm
ent o
f Com
mun
ity
and
Econ
omic
Dev
elop
men
t (D
CED
)
Gro
win
g G
reen
er II
Ca
pita
l im
prov
emen
t cos
ts a
nd th
ose
cost
s di
rect
ly r
elat
ed to
suc
h ph
ysic
al b
uild
ing
impr
ovem
ents
suc
h as
the
acqu
isiti
on a
nd p
re-d
evel
opm
ent c
osts
A
nnua
l fun
ding
ran
ge b
etw
een
$250
,000
to $
500,
000
Com
mun
ity A
ctio
n Te
am P
re-d
evel
opm
ent
Gra
nt to
Loa
n Pr
ogra
m
Earl
y st
age
capi
tal,
to fa
cilit
ate
sket
ch p
lann
ing,
cos
t est
imat
ing,
mar
ket e
valu
atio
n, m
inim
al s
ite c
ontr
ol a
ctiv
ities
an
d ge
nera
l dev
elop
men
t coo
rdin
atio
n.
$75,
000
per
proj
ect;
onl
ine
appl
icat
ion
proc
ess
/ ac
cept
ed
thro
ugho
ut th
e fis
cal y
ear
Mai
n St
reet
Pro
gram
Ph
ysic
al im
prov
emen
ts s
uppo
rted
by
dow
ntow
n pl
an fo
r Dow
ntow
n Re
inve
stm
ent C
ompo
nent
, acq
uisi
tion
cost
s an
d ph
ysic
al b
uild
ing
impr
ovem
ents
for a
ncho
r bui
ldin
g co
mpo
nent
s.
Fund
ing
for
$115
,000
ove
r a 5
yea
r pe
riod
. D
ownt
own
rein
vest
men
t and
anc
hor
build
ing
com
pone
nts:
up
to
$250
,000
or
not t
o ex
ceed
30%
of p
roje
ct c
osts
.
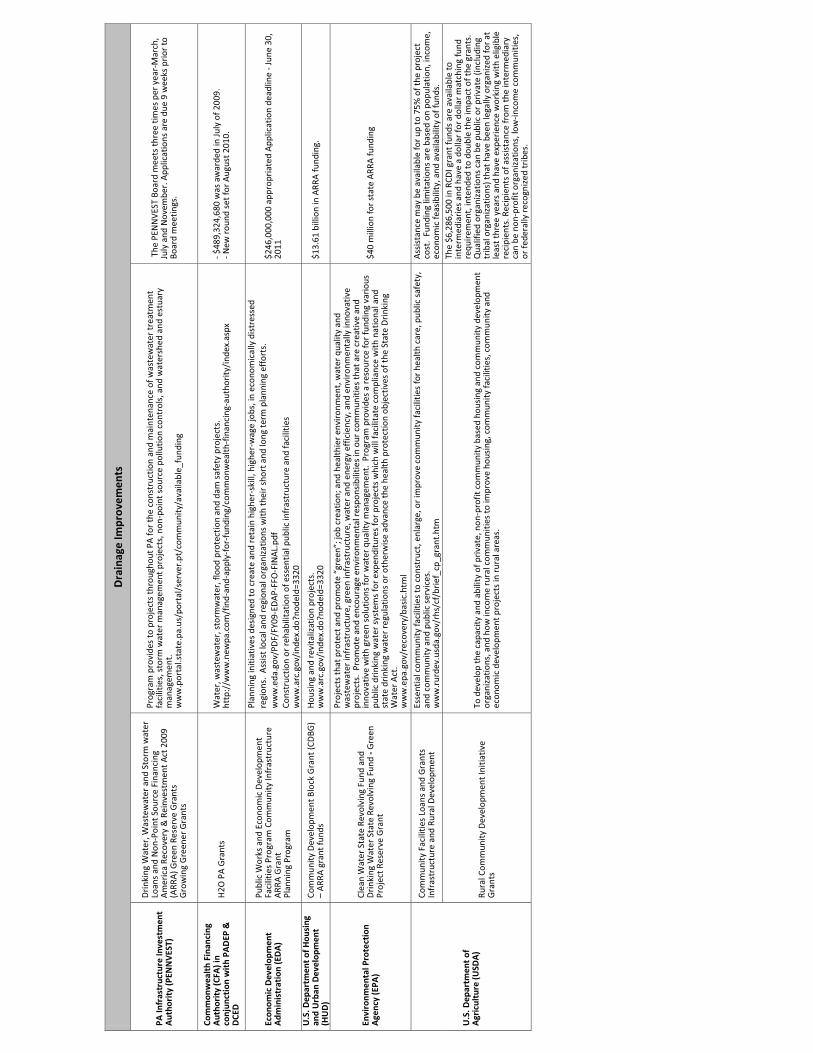
Dra
inag
e Im
prov
emen
ts
PA In
fras
truc
ture
Inve
stm
ent
Aut
hori
ty (P
ENN
VES
T)
Dri
nkin
g W
ater
, Was
tew
ater
and
Sto
rm w
ater
Lo
ans
and
Non
-Poi
nt S
ourc
e Fi
nanc
ing
A
mer
ica
Reco
very
& R
einv
estm
ent A
ct 2
009
(ARR
A) G
reen
Res
erve
Gra
nts
Gro
win
g G
reen
er G
rant
s
Prog
ram
pro
vide
s to
pro
ject
s th
roug
hout
PA
for
the
cons
truc
tion
and
mai
nten
ance
of w
aste
wat
er tr
eatm
ent
faci
litie
s, s
torm
wat
er m
anag
emen
t pro
ject
s, n
on-p
oint
sou
rce
pollu
tion
cont
rols
, and
wat
ersh
ed a
nd e
stua
ry
man
agem
ent.
w
ww
.por
tal.s
tate
.pa.
us/p
orta
l/se
rver
.pt/
com
mun
ity/a
vaila
ble_
fund
ing
The
PEN
NVE
ST B
oard
mee
ts th
ree
times
per
yea
r-M
arch
, Ju
ly a
nd N
ovem
ber.
App
licat
ions
are
due
9 w
eeks
prio
r to
Bo
ard
mee
tings
.
Com
mon
wea
lth
Fina
ncin
g A
utho
rity
(CFA
) in
conj
unct
ion
wit
h PA
DEP
&
DCE
D
H2O
PA
Gra
nts
Wat
er, w
aste
wat
er, s
torm
wat
er, f
lood
pro
tect
ion
and
dam
saf
ety
proj
ects
. ht
tp:/
/ww
w.n
ewpa
.com
/fin
d-an
d-ap
ply-
for-
fund
ing/
com
mon
wea
lth-f
inan
cing
-aut
hori
ty/i
ndex
.asp
x - $
489,
324,
680
was
aw
arde
d in
July
of 2
009.
- N
ew ro
und
set f
or A
ugus
t 201
0.
Econ
omic
Dev
elop
men
t A
dmin
istr
atio
n (E
DA
)
Publ
ic W
orks
and
Eco
nom
ic D
evel
opm
ent
Faci
litie
s Pr
ogra
m C
omm
unity
Infr
astr
uctu
re
ARR
A G
rant
Pl
anni
ng P
rogr
am
Plan
ning
initi
ativ
es d
esig
ned
to c
reat
e an
d re
tain
hig
her-
skill
, hig
her-
wag
e jo
bs, i
n ec
onom
ical
ly d
istr
esse
d re
gion
s. A
ssis
t loc
al a
nd re
gion
al o
rgan
izat
ions
with
thei
r sh
ort a
nd lo
ng te
rm p
lann
ing
effo
rts.
w
ww
.eda
.gov
/PD
F/FY
09-E
DA
P-FF
O-F
INA
L.pd
f Co
nstr
uctio
n or
reha
bilit
atio
n of
ess
entia
l pub
lic in
fras
truc
ture
and
faci
litie
s
ww
w.a
rc.g
ov/i
ndex
.do?
node
Id=3
320
$246
,000
,000
app
ropr
iate
d A
pplic
atio
n de
adlin
e - J
une
30,
2011
U.S
. Dep
artm
ent o
f Hou
sing
an
d U
rban
Dev
elop
men
t (H
UD
)
Com
mun
ity D
evel
opm
ent B
lock
Gra
nt (C
DBG
) –
ARR
A g
rant
fund
s H
ousi
ng a
nd r
evita
lizat
ion
proj
ects
. w
ww
.arc
.gov
/ind
ex.d
o?no
deId
=332
0 $1
3.61
bill
ion
in A
RRA
fund
ing.
Envi
ronm
enta
l Pro
tect
ion
Age
ncy
(EPA
)
Clea
n W
ater
Sta
te R
evol
ving
Fun
d an
d D
rink
ing
Wat
er S
tate
Rev
olvi
ng F
und
- Gre
en
Proj
ect R
eser
ve G
rant
Proj
ects
that
pro
tect
and
pro
mot
e “g
reen
”; jo
b cr
eatio
n; a
nd h
ealth
ier e
nviro
nmen
t, w
ater
qua
lity
and
was
tew
ater
infr
astr
uctu
re, g
reen
infr
astr
uctu
re, w
ater
and
ene
rgy
effic
ienc
y, a
nd e
nvir
onm
enta
lly in
nova
tive
proj
ects
. Pr
omot
e an
d en
cour
age
envi
ronm
enta
l res
pons
ibili
ties
in o
ur c
omm
uniti
es th
at a
re c
reat
ive
and
inno
vativ
e w
ith g
reen
sol
utio
ns fo
r w
ater
qua
lity
man
agem
ent.
Pro
gram
pro
vide
s a
reso
urce
for
fund
ing
vario
us
publ
ic d
rink
ing
wat
er s
yste
ms
for e
xpen
ditu
res
for p
roje
cts
whi
ch w
ill fa
cilit
ate
com
plia
nce
with
nat
iona
l and
st
ate
drin
king
wat
er r
egul
atio
ns o
r oth
erw
ise
adva
nce
the
heal
th p
rote
ctio
n ob
ject
ives
of t
he S
tate
Dri
nkin
g W
ater
Act
. w
ww
.epa
.gov
/rec
over
y/ba
sic.
htm
l
$40
mill
ion
for
stat
e A
RRA
fund
ing
U.S
. Dep
artm
ent o
f A
gric
ultu
re (U
SDA
)
Com
mun
ity F
acili
ties
Loan
s an
d G
rant
s In
fras
truc
ture
and
Rur
al D
evel
opm
ent
Esse
ntia
l com
mun
ity fa
cilit
ies
to c
onst
ruct
, enl
arge
, or i
mpr
ove
com
mun
ity fa
cilit
ies
for
heal
th c
are,
pub
lic s
afet
y,
and
com
mun
ity a
nd p
ublic
ser
vice
s.
ww
w.r
urde
v.us
da.g
ov/r
hs/c
f/br
ief_
cp_g
rant
.htm
Ass
ista
nce
may
be
avai
labl
e fo
r up
to 7
5% o
f the
pro
ject
co
st.
Fund
ing
limita
tions
are
bas
ed o
n po
pula
tion,
inco
me,
ec
onom
ic fe
asib
ility
, and
ava
ilabi
lity
of fu
nds.
Rura
l Com
mun
ity D
evel
opm
ent I
nitia
tive
Gra
nts
To d
evel
op th
e ca
paci
ty a
nd a
bilit
y of
pri
vate
, non
-pro
fit c
omm
unity
bas
ed h
ousi
ng a
nd c
omm
unity
dev
elop
men
t or
gani
zatio
ns, a
nd h
ow in
com
e ru
ral c
omm
uniti
es to
impr
ove
hous
ing,
com
mun
ity fa
cilit
ies,
com
mun
ity a
nd
econ
omic
dev
elop
men
t pro
ject
s in
rur
al a
reas
.
The
$6,2
86,5
00 in
RCD
I gra
nt fu
nds
are
avai
labl
e to
in
term
edia
ries
and
hav
e a
dolla
r fo
r do
llar m
atch
ing
fund
re
quir
emen
t, in
tend
ed to
dou
ble
the
impa
ct o
f the
gra
nts.
Q
ualif
ied
orga
niza
tions
can
be
publ
ic o
r pri
vate
(inc
ludi
ng
trib
al o
rgan
izat
ions
) tha
t hav
e be
en le
gally
org
aniz
ed fo
r at
le
ast t
hree
yea
rs a
nd h
ave
expe
rien
ce w
orki
ng w
ith e
ligib
le
reci
pien
ts. R
ecip
ient
s of
ass
ista
nce
from
the
inte
rmed
iary
ca
n be
non
-pro
fit o
rgan
izat
ions
, low
-inco
me
com
mun
ities
, or
fede
rally
reco
gniz
ed tr
ibes
.

Dow
ntow
n Re
vita
lizat
ion
Age
ncy
Gra
nt/F
undi
ng R
esou
rce
Des
crip
tion
/Elig
ibili
ty
Win
dow
of O
ppor
tuni
ty
US
Dep
artm
ent o
f A
gric
ultu
re (U
SDA
)
Com
mun
ity F
acili
ties
Loan
s an
d G
rant
s In
fras
truc
ture
and
Rur
al D
evel
opm
ent
Impr
ove
esse
ntia
l com
mun
ity fa
cilit
ies
in c
omm
uniti
es. w
ww
.rur
dev.
usda
.gov
/rhs
/cf/
brie
f_cp
_gra
nt.h
tm
The
amou
nt o
f gra
nt a
ssis
tanc
e fo
r a
proj
ect c
osts
dep
ends
up
on th
e m
edia
n ho
useh
old
inco
me
and
the
popu
latio
n in
th
e co
mm
unity
whe
re th
e pr
ojec
t is
loca
ted
and
the
avai
labi
lity
of g
rant
fund
s.
Rura
l Com
mun
ity D
evel
opm
ent I
nitia
tive
Gra
nts
To d
evel
op th
e ca
paci
ty a
nd a
bilit
y of
pri
vate
, non
-pro
fit c
omm
unity
bas
ed h
ousi
ng a
nd c
omm
unity
dev
elop
men
t or
gani
zatio
ns, a
nd h
ow in
com
e ru
ral c
omm
uniti
es to
impr
ove
hous
ing,
com
mun
ity fa
cilit
ies,
com
mun
ity a
nd
econ
omic
dev
elop
men
t pro
ject
s in
rur
al a
reas
.
The
$6,2
86,5
00 in
RCD
I gra
nt fu
nds
are
avai
labl
e to
in
term
edia
ries
and
hav
e a
dolla
r fo
r do
llar m
atch
ing
fund
re
quir
emen
t, in
tend
ed to
dou
ble
the
impa
ct o
f the
gra
nts.
Q
ualif
ied
orga
niza
tions
can
be
publ
ic o
r pri
vate
(inc
ludi
ng
trib
al o
rgan
izat
ions
) tha
t hav
e be
en le
gally
org
aniz
ed fo
r at
le
ast t
hree
yea
rs a
nd h
ave
expe
rien
ce w
orki
ng w
ith e
ligib
le
reci
pien
ts. R
ecip
ient
s of
ass
ista
nce
from
the
inte
rmed
iary
ca
n be
non
-pro
fit o
rgan
izat
ions
, low
-inco
me
com
mun
ities
, or
fede
rally
reco
gniz
ed tr
ibes
.
Econ
omic
Dev
elop
men
t A
dmin
istr
atio
n (E
DA
) Pl
anni
ng P
rogr
am
Plan
ning
initi
ativ
es d
esig
ned
to c
reat
e an
d re
tain
hig
her-
skill
, hig
her-
wag
e jo
bs, i
n ec
onom
ical
ly d
istr
esse
d re
gion
s. A
ssis
t loc
al a
nd re
gion
al o
rgan
izat
ions
with
thei
r sh
ort a
nd lo
ng te
rm p
lann
ing
effo
rts.
w
ww
.eda
.gov
/PD
F/FY
09-E
DA
P-FF
O-F
INA
L.pd
f
Pote
ntia
l ap
plic
ants
are
res
pons
ible
for
dem
onst
ratin
g to
ED
A,
by
prov
idin
g st
atis
tics
and
othe
r in
form
atio
n,
as
appr
opri
ate,
the
nat
ure
and
leve
l of e
cono
mic
dis
tres
s in
the
re
gion
. G
rant
may
not
exc
eed
50%
of
the
tota
l co
st o
f th
e pr
ojec
t. P
roje
cts
may
rec
eive
an
addi
tiona
l am
ount
tha
t sh
all
not
exce
ed 3
0%, b
ased
on
the
rela
tive
need
s of
the
reg
ion
in
whi
ch th
e pr
ojec
t will
be
loca
ted,
as
dete
rmin
ed b
y ED
A.
U.S
. Dep
artm
ent o
f Hou
sing
an
d U
rban
Dev
elop
men
t (H
UD
)
Com
mun
ity D
evel
opm
ent B
lock
Gra
nt (C
DBG
) –
ARR
A g
rant
fund
s
com
mun
ity d
evel
opm
ent a
ctiv
ities
: Acq
uisi
tion,
dem
oliti
on, r
ehab
ilita
tion,
str
eets
, wat
er a
nd s
ewer
faci
litie
s,
neig
hbor
hood
cen
ters
, rec
reat
ion
faci
litie
s, a
nd o
ther
pub
lic w
orks
; eco
nom
ic d
evel
opm
ent a
ctiv
ities
w
ww
.arc
.gov
/ind
ex.d
o?no
deId
=332
0 A
nnua
l gra
nt c
ycle
Dep
artm
ent o
f Com
mun
ity
and
Econ
omic
Dev
elop
men
t (D
CED
)
Gro
win
g G
reen
er II
Ca
pita
l im
prov
emen
t cos
ts a
nd th
ose
cost
s di
rect
ly r
elat
ed to
suc
h ph
ysic
al b
uild
ing
impr
ovem
ents
suc
h as
the
acqu
isiti
on a
nd p
re-d
evel
opm
ent c
osts
A
nnua
l fun
ding
ran
ge b
etw
een
$250
,000
to $
500,
000
Mai
n St
reet
Pro
gram
Ph
ysic
al im
prov
emen
ts s
uppo
rted
by
dow
ntow
n pl
an fo
r Dow
ntow
n Re
inve
stm
ent C
ompo
nent
, acq
uisi
tion
cost
s an
d ph
ysic
al b
uild
ing
impr
ovem
ents
for a
ncho
r bui
ldin
g co
mpo
nent
s.
Fund
ing
for
$115
,000
ove
r a 5
yea
r pe
riod
. D
ownt
own
rein
vest
men
t and
anc
hor
build
ing
com
pone
nts:
up
to
$250
,000
or
not t
o ex
ceed
30%
of p
roje
ct c
osts
.
Com
mun
ity R
evita
lizat
ion
Prog
ram
(CRP
) Pr
ovid
es g
rant
fund
s to
sup
port
loca
l ini
tiativ
es th
at p
rom
ote
com
mun
ity s
tabi
lity
and
qual
ity o
f life
. Fu
ndin
g va
ries
– e
lect
roni
c si
ngle
app
licat
ion
for a
ssis
tanc
e w
ww
.new
PA.c
om; M
arch
21,
2011
sub
mis
sion
dea
dlin
e H
ousi
ng &
Red
evel
opm
ent A
ssis
tanc
e Co
mm
unity
Ser
vice
s Bl
ock
Gra
nt
Urb
an D
evel
opm
ent P
rogr
am
Regi
onal
Eco
nom
ic D
evel
opm
ent D
istr
ict
Initi
ativ
e Pr
ogra
m (R
EDD
I)
Com
mun
ity d
evel
opm
ent,
rede
velo
pmen
t and
rev
italiz
atio
n pr
ojec
ts. w
ww
.new
pa.c
om
Fund
ing
leve
ls v
ary
ever
y ye
ar. G
rant
aw
ards
are
mad
e in
th
ree
fund
ing
roun
ds d
urin
g th
e fis
cal y
ear.
DCE
D w
ill g
rant
ap
prox
imat
ely
1/3
of th
e pr
ogra
m a
ppro
pria
tion
in e
ach
roun
d. (A
pplic
atio
ns d
ue: M
arch
, Sep
tem
ber
and
Dec
embe
r).
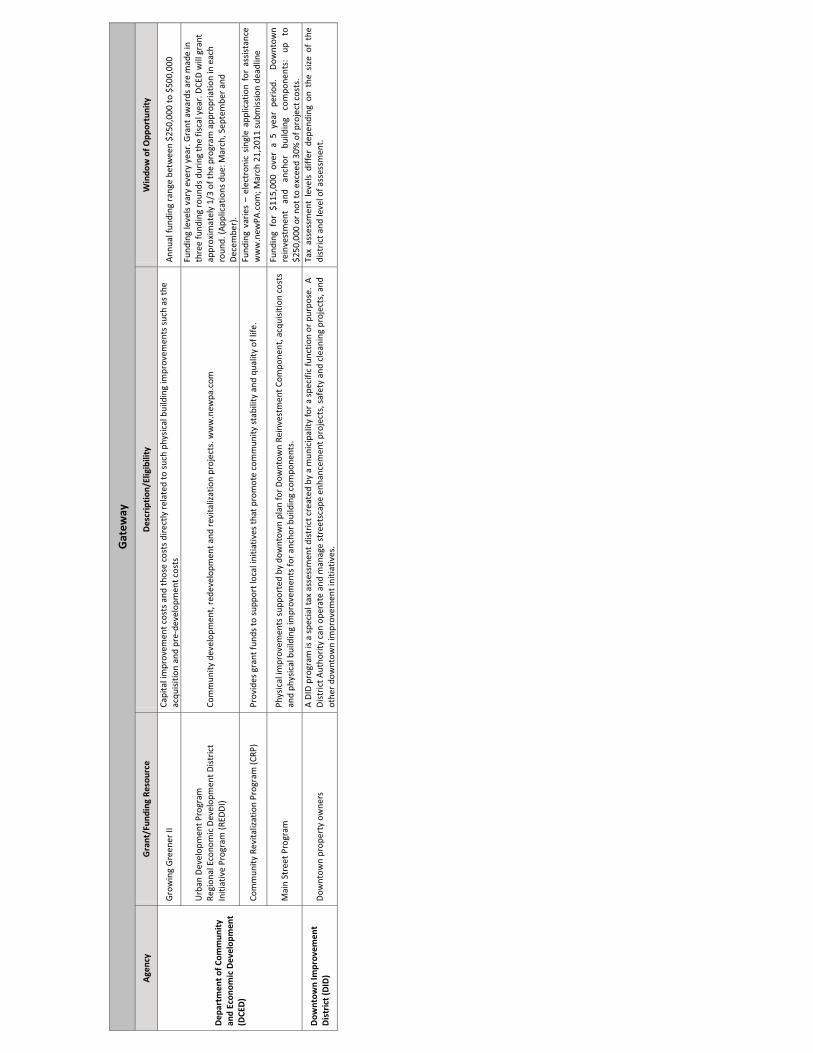
Gat
eway
Age
ncy
Gra
nt/F
undi
ng R
esou
rce
Des
crip
tion
/Elig
ibili
ty
Win
dow
of O
ppor
tuni
ty
Dep
artm
ent o
f Com
mun
ity
and
Econ
omic
Dev
elop
men
t (D
CED
)
Gro
win
g G
reen
er II
Ca
pita
l im
prov
emen
t cos
ts a
nd th
ose
cost
s di
rect
ly r
elat
ed to
suc
h ph
ysic
al b
uild
ing
impr
ovem
ents
suc
h as
the
acqu
isiti
on a
nd p
re-d
evel
opm
ent c
osts
A
nnua
l fun
ding
ran
ge b
etw
een
$250
,000
to $
500,
000
Urb
an D
evel
opm
ent P
rogr
am
Regi
onal
Eco
nom
ic D
evel
opm
ent D
istr
ict
Initi
ativ
e Pr
ogra
m (R
EDD
I) Co
mm
unity
dev
elop
men
t, re
deve
lopm
ent a
nd r
evita
lizat
ion
proj
ects
. ww
w.n
ewpa
.com
Fund
ing
leve
ls v
ary
ever
y ye
ar. G
rant
aw
ards
are
mad
e in
th
ree
fund
ing
roun
ds d
urin
g th
e fis
cal y
ear.
DCE
D w
ill g
rant
ap
prox
imat
ely
1/3
of th
e pr
ogra
m a
ppro
pria
tion
in e
ach
roun
d. (A
pplic
atio
ns d
ue: M
arch
, Sep
tem
ber
and
Dec
embe
r).
Com
mun
ity R
evita
lizat
ion
Prog
ram
(CRP
) Pr
ovid
es g
rant
fund
s to
sup
port
loca
l ini
tiativ
es th
at p
rom
ote
com
mun
ity s
tabi
lity
and
qual
ity o
f life
. Fu
ndin
g va
ries
– e
lect
roni
c si
ngle
app
licat
ion
for
assi
stan
ce
ww
w.n
ewPA
.com
; Mar
ch 2
1,20
11 s
ubm
issi
on d
eadl
ine
Mai
n St
reet
Pro
gram
Ph
ysic
al im
prov
emen
ts s
uppo
rted
by
dow
ntow
n pl
an fo
r Dow
ntow
n Re
inve
stm
ent C
ompo
nent
, acq
uisi
tion
cost
s an
d ph
ysic
al b
uild
ing
impr
ovem
ents
for a
ncho
r bui
ldin
g co
mpo
nent
s.
Fund
ing
for
$115
,000
ove
r a
5 ye
ar p
erio
d.
Dow
ntow
n re
inve
stm
ent
and
anch
or
build
ing
com
pone
nts:
up
to
$2
50,0
00 o
r no
t to
exce
ed 3
0% o
f pro
ject
cos
ts.
Dow
ntow
n Im
prov
emen
t D
istr
ict (
DID
) D
ownt
own
prop
erty
ow
ners
A
DID
pro
gram
is a
spe
cial
tax
asse
ssm
ent d
istr
ict c
reat
ed b
y a
mun
icip
ality
for
a sp
ecifi
c fu
nctio
n or
pur
pose
. A
D
istr
ict A
utho
rity
can
oper
ate
and
man
age
stre
etsc
ape
enha
ncem
ent p
roje
cts,
saf
ety
and
clea
ning
pro
ject
s, a
nd
othe
r do
wnt
own
impr
ovem
ent i
nitia
tives
.
Tax
asse
ssm
ent
leve
ls d
iffer
dep
endi
ng o
n th
e si
ze o
f th
e di
stri
ct a
nd le
vel o
f ass
essm
ent.
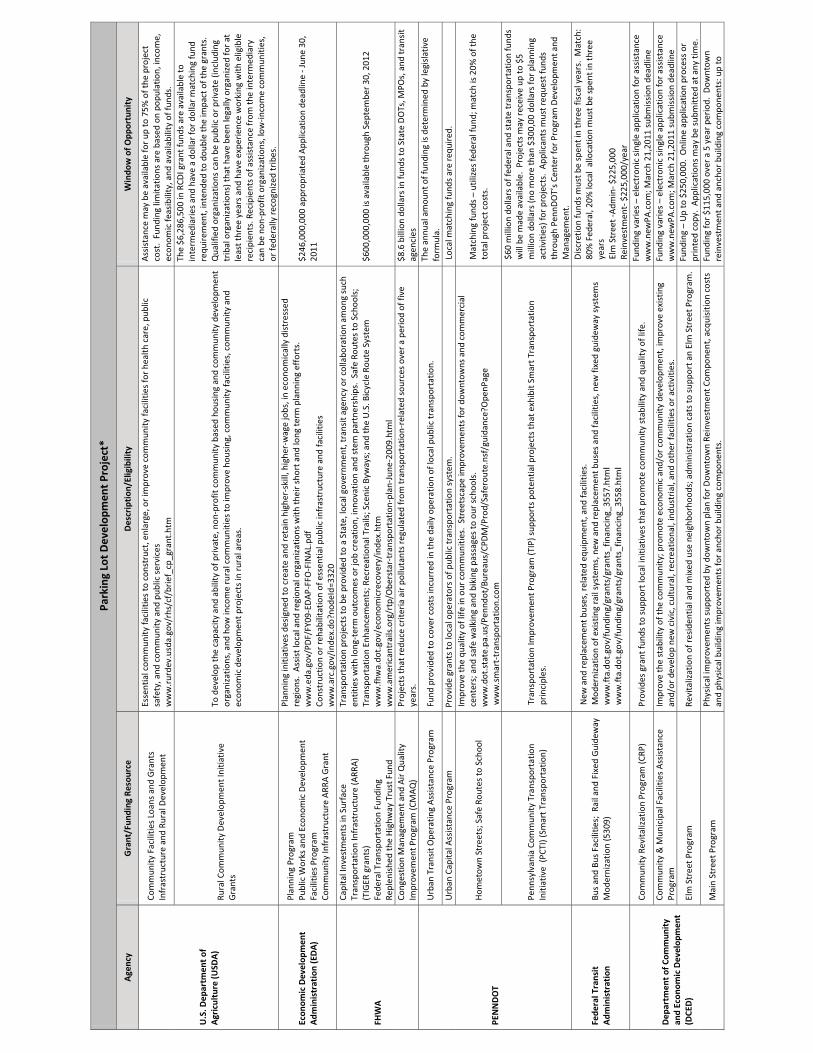
Park
ing
Lot D
evel
opm
ent P
roje
ct*
Age
ncy
Gra
nt/F
undi
ng R
esou
rce
Des
crip
tion
/Elig
ibili
ty
Win
dow
of O
ppor
tuni
ty
U.S
. Dep
artm
ent o
f A
gric
ultu
re (U
SDA
)
Com
mun
ity F
acili
ties
Loan
s an
d G
rant
s In
fras
truc
ture
and
Rur
al D
evel
opm
ent
Esse
ntia
l com
mun
ity fa
cilit
ies
to c
onst
ruct
, enl
arge
, or i
mpr
ove
com
mun
ity fa
cilit
ies
for
heal
th c
are,
pub
lic
safe
ty, a
nd c
omm
unity
and
pub
lic s
ervi
ces
ww
w.r
urde
v.us
da.g
ov/r
hs/c
f/br
ief_
cp_g
rant
.htm
Ass
ista
nce
may
be
avai
labl
e fo
r up
to 7
5% o
f the
pro
ject
co
st.
Fund
ing
limita
tions
are
bas
ed o
n po
pula
tion,
inco
me,
ec
onom
ic fe
asib
ility
, and
ava
ilabi
lity
of fu
nds.
Rura
l Com
mun
ity D
evel
opm
ent I
nitia
tive
Gra
nts
To d
evel
op th
e ca
paci
ty a
nd a
bilit
y of
pri
vate
, non
-pro
fit c
omm
unity
bas
ed h
ousi
ng a
nd c
omm
unity
dev
elop
men
t or
gani
zatio
ns, a
nd h
ow in
com
e ru
ral c
omm
uniti
es to
impr
ove
hous
ing,
com
mun
ity fa
cilit
ies,
com
mun
ity a
nd
econ
omic
dev
elop
men
t pro
ject
s in
rur
al a
reas
.
The
$6,2
86,5
00 in
RCD
I gra
nt fu
nds
are
avai
labl
e to
in
term
edia
ries
and
hav
e a
dolla
r fo
r do
llar m
atch
ing
fund
re
quir
emen
t, in
tend
ed to
dou
ble
the
impa
ct o
f the
gra
nts.
Q
ualif
ied
orga
niza
tions
can
be
publ
ic o
r pri
vate
(inc
ludi
ng
trib
al o
rgan
izat
ions
) tha
t hav
e be
en le
gally
org
aniz
ed fo
r at
le
ast t
hree
yea
rs a
nd h
ave
expe
rien
ce w
orki
ng w
ith e
ligib
le
reci
pien
ts. R
ecip
ient
s of
ass
ista
nce
from
the
inte
rmed
iary
ca
n be
non
-pro
fit o
rgan
izat
ions
, low
-inco
me
com
mun
ities
, or
fede
rally
reco
gniz
ed tr
ibes
.
Econ
omic
Dev
elop
men
t A
dmin
istr
atio
n (E
DA
)
Plan
ning
Pro
gram
Pu
blic
Wor
ks a
nd E
cono
mic
Dev
elop
men
t Fa
cilit
ies
Prog
ram
Co
mm
unity
Infr
astr
uctu
re A
RRA
Gra
nt
Plan
ning
initi
ativ
es d
esig
ned
to c
reat
e an
d re
tain
hig
her-
skill
, hig
her-
wag
e jo
bs, i
n ec
onom
ical
ly d
istr
esse
d re
gion
s. A
ssis
t loc
al a
nd re
gion
al o
rgan
izat
ions
with
thei
r sh
ort a
nd lo
ng te
rm p
lann
ing
effo
rts.
w
ww
.eda
.gov
/PD
F/FY
09-E
DA
P-FF
O-F
INA
L.pd
f Co
nstr
uctio
n or
reha
bilit
atio
n of
ess
entia
l pub
lic in
fras
truc
ture
and
faci
litie
s
ww
w.a
rc.g
ov/i
ndex
.do?
node
Id=3
320
$246
,000
,000
app
ropr
iate
d A
pplic
atio
n de
adlin
e - J
une
30,
2011
FHW
A
Capi
tal I
nves
tmen
ts in
Sur
face
Tr
ansp
orta
tion
Infr
astr
uctu
re (A
RRA
) (T
IGER
gra
nts)
Fe
dera
l Tra
nspo
rtat
ion
Fund
ing
Repl
enis
hed
the
Hig
hway
Tru
st F
und
Tran
spor
tatio
n pr
ojec
ts to
be
prov
ided
to a
Sta
te, l
ocal
gov
ernm
ent,
tran
sit a
genc
y or
col
labo
ratio
n am
ong
such
en
titie
s w
ith lo
ng-t
erm
out
com
es o
r job
cre
atio
n, in
nova
tion
and
stem
par
tner
ship
s. S
afe
Rout
es to
Sch
ools
; Tr
ansp
orta
tion
Enha
ncem
ents
; Rec
reat
iona
l Tra
ils; S
ceni
c By
way
s; a
nd th
e U
.S. B
icyc
le R
oute
Sys
tem
w
ww
.fhw
a.do
t.go
v/ec
onom
icre
cove
ry/i
ndex
.htm
w
ww
.am
eric
antr
ails
.org
/rtp
/Obe
rsta
r-tr
ansp
orta
tion-
plan
-Jun
e-20
09.h
tml
$600
,000
,000
is a
vaila
ble
thro
ugh
Sept
embe
r 30,
201
2
Cong
estio
n M
anag
emen
t and
Air
Qua
lity
Impr
ovem
ent P
rogr
am (C
MA
Q)
Proj
ects
that
red
uce
crite
ria a
ir p
ollu
tant
s re
gula
ted
from
tran
spor
tatio
n-re
late
d so
urce
s ov
er a
per
iod
of fi
ve
year
s.
$8.6
bill
ion
dolla
rs in
fund
s to
Sta
te D
OTs
, MPO
s, a
nd tr
ansi
t ag
enci
es
PEN
ND
OT
Urb
an T
rans
it O
pera
ting
Ass
ista
nce
Prog
ram
Fu
nd p
rovi
ded
to c
over
cos
ts in
curr
ed in
the
daily
ope
ratio
n of
loca
l pub
lic tr
ansp
orta
tion.
Th
e an
nual
am
ount
of f
undi
ng is
det
erm
ined
by
legi
slat
ive
form
ula.
U
rban
Cap
ital A
ssis
tanc
e Pr
ogra
m
Prov
ide
gran
ts to
loca
l ope
rato
rs o
f pub
lic tr
ansp
orta
tion
syst
em.
Loca
l mat
chin
g fu
nds
are
requ
ired
.
Hom
etow
n St
reet
s; S
afe
Rout
es to
Sch
ool
Impr
ove
the
qual
ity o
f life
in o
ur c
omm
uniti
es.
Stre
etsc
ape
impr
ovem
ents
for
dow
ntow
ns a
nd c
omm
erci
al
cent
ers;
and
saf
e w
alki
ng a
nd b
ikin
g pa
ssag
es to
our
sch
ools
. w
ww
.dot
.sta
te.p
a.us
/Pen
ndot
/Bur
eaus
/CPD
M/P
rod/
Safe
rout
e.ns
f/gu
idan
ce?O
penP
age
ww
w.s
mar
t-tr
ansp
orta
tion.
com
Mat
chin
g fu
nds
– ut
ilize
s fe
dera
l fun
d; m
atch
is 2
0% o
f the
to
tal p
roje
ct c
osts
.
Penn
sylv
ania
Com
mun
ity T
rans
port
atio
n In
itiat
ive
(PCT
I) (S
mar
t Tra
nspo
rtat
ion)
Tr
ansp
orta
tion
Impr
ovem
ent P
rogr
am (T
IP) s
uppo
rts
pote
ntia
l pro
ject
s th
at e
xhib
it Sm
art T
rans
port
atio
n pr
inci
ples
.
$60
mill
ion
dolla
rs o
f fed
eral
and
sta
te tr
ansp
orta
tion
fund
s w
ill b
e m
ade
avai
labl
e. P
roje
cts
may
rec
eive
up
to $
5 m
illio
n do
llars
(no
mor
e th
an $
300,
00 d
olla
rs fo
r pla
nnin
g ac
tiviti
es) f
or p
roje
cts.
App
lican
ts m
ust r
eque
st fu
nds
thro
ugh
Penn
DO
T’s
Cent
er fo
r Pro
gram
Dev
elop
men
t and
M
anag
emen
t.
Fede
ral T
rans
it
Adm
inis
trat
ion
Bus
and
Bus
Faci
litie
s; R
ail a
nd F
ixed
Gui
dew
ay
Mod
erni
zatio
n (5
309)
New
and
rep
lace
men
t bus
es, r
elat
ed e
quip
men
t, a
nd fa
cilit
ies.
Mod
erni
zatio
n of
exi
stin
g ra
il sy
stem
s, n
ew a
nd re
plac
emen
t bus
es a
nd fa
cilit
ies,
new
fixe
d gu
idew
ay s
yste
ms
w
ww
.fta.
dot.
gov/
fund
ing/
gran
ts/g
rant
s_fin
anci
ng_3
557.
htm
l w
ww
.fta.
dot.
gov/
fund
ing/
gran
ts/g
rant
s_fin
anci
ng_3
558.
htm
l
Dis
cret
ion
fund
s m
ust b
e sp
ent i
n th
ree
fisca
l yea
rs.
Mat
ch:
80%
Fed
eral
, 20%
loca
l al
loca
tion
mus
t be
spen
t in
thre
e ye
ars
Elm
Str
eet -
Adm
in- $
225,
000
Re
inve
stm
ent-
$22
5,00
0/ye
ar
Dep
artm
ent o
f Com
mun
ity
and
Econ
omic
Dev
elop
men
t (D
CED
)
Com
mun
ity R
evita
lizat
ion
Prog
ram
(CRP
) Pr
ovid
es g
rant
fund
s to
sup
port
loca
l ini
tiativ
es th
at p
rom
ote
com
mun
ity s
tabi
lity
and
qual
ity o
f life
. Fu
ndin
g va
ries
– e
lect
roni
c si
ngle
app
licat
ion
for a
ssis
tanc
e w
ww
.new
PA.c
om; M
arch
21,
2011
sub
mis
sion
dea
dlin
e Co
mm
unity
& M
unic
ipal
Fac
ilitie
s A
ssis
tanc
e Pr
ogra
m
Impr
ove
the
stab
ility
of t
he c
omm
unity
; pro
mot
e ec
onom
ic a
nd/o
r co
mm
unity
dev
elop
men
t, im
prov
e ex
istin
g an
d/or
dev
elop
new
civ
ic, c
ultu
ral,
recr
eatio
nal,
indu
stri
al, a
nd o
ther
faci
litie
s or
act
iviti
es.
Fund
ing
vari
es –
ele
ctro
nic
sing
le a
pplic
atio
n fo
r ass
ista
nce
ww
w.n
ewPA
.com
; Mar
ch 2
1,20
11 s
ubm
issi
on d
eadl
ine
Elm
Str
eet P
rogr
am
Revi
taliz
atio
n of
resi
dent
ial a
nd m
ixed
use
nei
ghbo
rhoo
ds; a
dmin
istr
atio
n ca
ts to
sup
port
an
Elm
Str
eet P
rogr
am.
Fund
ing
– U
p to
$25
0,00
0. O
nlin
e ap
plic
atio
n pr
oces
s or
pr
inte
d co
py.
App
licat
ions
may
be
subm
itted
at a
ny ti
me.
Mai
n St
reet
Pro
gram
Ph
ysic
al im
prov
emen
ts s
uppo
rted
by
dow
ntow
n pl
an fo
r Dow
ntow
n Re
inve
stm
ent C
ompo
nent
, acq
uisi
tion
cost
s an
d ph
ysic
al b
uild
ing
impr
ovem
ents
for a
ncho
r bui
ldin
g co
mpo
nent
s.
Fund
ing
for
$115
,000
ove
r a 5
yea
r pe
riod
. D
ownt
own
rein
vest
men
t and
anc
hor
build
ing
com
pone
nts:
up
to

$250
,000
or
not t
o ex
ceed
30%
of p
roje
ct c
osts
.
Gro
win
g G
reen
er II
Ca
pita
l im
prov
emen
t cos
ts a
nd th
ose
cost
s di
rect
ly r
elat
ed to
suc
h ph
ysic
al b
uild
ing
impr
ovem
ents
suc
h as
the
acqu
isiti
on a
nd p
re-d
evel
opm
ent c
osts
A
nnua
l fun
ding
ran
ge b
etw
een
$250
,000
to $
500,
000
Com
mun
ity A
ctio
n Te
am P
re-d
evel
opm
ent
Gra
nt to
Loa
n Pr
ogra
m
Earl
y st
age
capi
tal,
to fa
cilit
ate
sket
ch p
lann
ing,
cos
t est
imat
ing,
mar
ket e
valu
atio
n, m
inim
al s
ite c
ontr
ol a
ctiv
ities
an
d ge
nera
l dev
elop
men
t coo
rdin
atio
n.
$75,
000
per
proj
ect;
onl
ine
appl
icat
ion
proc
ess
/ ac
cept
ed
thro
ugho
ut th
e fis
cal y
ear
* Fu
ndin
g m
ay b
e de
pend
ent u
pon
the
leve
l of e
cono
mic
dev
elop
men
t, in
crea
se in
jobs
, aff
iliat
ion
to tr
ansi
t fac
ilitie
s an
d op
erat
ions
, and
or p
rivat
e in
vest
men
t.

Appendix G
Route 62 Smart Transportation Corridor Study Final Report October 2010
Appendix G: GAP Analysis

Route 62 Smart Transportation Corridor Study Final Report October 2010
P a g e | i
Table of Contents Appendix G.1 GAP Analysis ........................................................................................................................... 1
Appendix G.1.1: Oil City Study Area / Gap Analysis Results ..................................................................... 1
Appendix G.1.2: Oil City (2 Mile Radius) / Gap Analysis Results ............................................................... 3
Appendix G.1.3: Oil City Surrounding Area (8 Mile Radius) / Gap Analysis Results ................................. 5
Appendix G.1.4: Oil City Study Area .......................................................................................................... 9
Appendix G.1.5: Oil City (2 Mile Radius) ................................................................................................. 11
Appendix G.1.6: Oil City Surrounding Area (8 Mile Radius) .................................................................... 13

Appendix G
Route 62 Smart Transportation Corridor Study Final Report October 2010
P a g e | 1
Appendix G.1 GAP Analysis For reference, opportunity gaps indicate the expenditure of local dollars outside of the community (goods and services not adequately provided for in the local community) and the surplus gaps of goods and services provided in the City or Surrounding Area that meet regional demand.
Appendix G.1.1: Oil City Study Area / Gap Analysis Results
The data indicates that the Oil City Study Area may be able to support a motor vehicle and parts dealer, gasoline station, a general merchandise store, or clothing and clothing accessory store. The data also indicates that the Oil City Study Area is meeting a regional demand for electronics and appliances, building materials and garden equipment, food and beverage products, health and personal care facilities and products, and food services and drinking places. Utilizing a gap analysis provides an initial indicator for retail and services opportunities for a selected region, therefore further market study and analysis is considered prudent.
Table G.1-1: Oil City Study Area Opportunity Gap & Opportunity Surplus Oil City Study Area Opportunity Gap & Opportunity Surplus
Opportunity Gaps: Opportunities for new or expanded stores. Local resident demand exceeds local store supply of goods or services for the following:
$463,797 for Motor Vehicle and Parts Dealers (automotive dealers) $64,519 for Furniture and Home Furnishings $696,896 for Gasoline Stations (stations with or without convenience stores) $209,647 for Clothing and Clothing Accessory products (clothing, shoe, jewelry, luggage, and leather
stores) $65,405 for Sporting Goods, Hobby, Book, Music products (sporting goods, books, periodical, and
musical instrument stores) $599,933 for General Merchandise Store products (department stores) $37,640 for Miscellaneous Store products (florists, office supplies, gifts, and used merchandise stores) $390,795 for Non-Store Retailers
Opportunity Surplus: Opportunities to meet regional demand. Local store supply of goods and services in this area exceeds local resident demand. This indicates that people from outside the area come here to purchase the following products.
$107,918 for Electronics and Appliances (appliance, electronic, computer and software, camera equipment stores)
$291,472 for Building Materials, Garden Equipment Store products $1,439,426 for Food and Beverage Store products (grocery, specialty foods, beer, wine, & liquor stores) $966,146 for Health and Personal Care Store products (health and personal care merchandise from
fixed point-of-sale locations – which may include Doctors, Physicians, Counselors, as staff) $112,602 for Food Service and Drinking Places (full service restaurants, limited service restaurants,
special food services, and drinking places)
Source: 2010 Claritas Inc., GAP Report
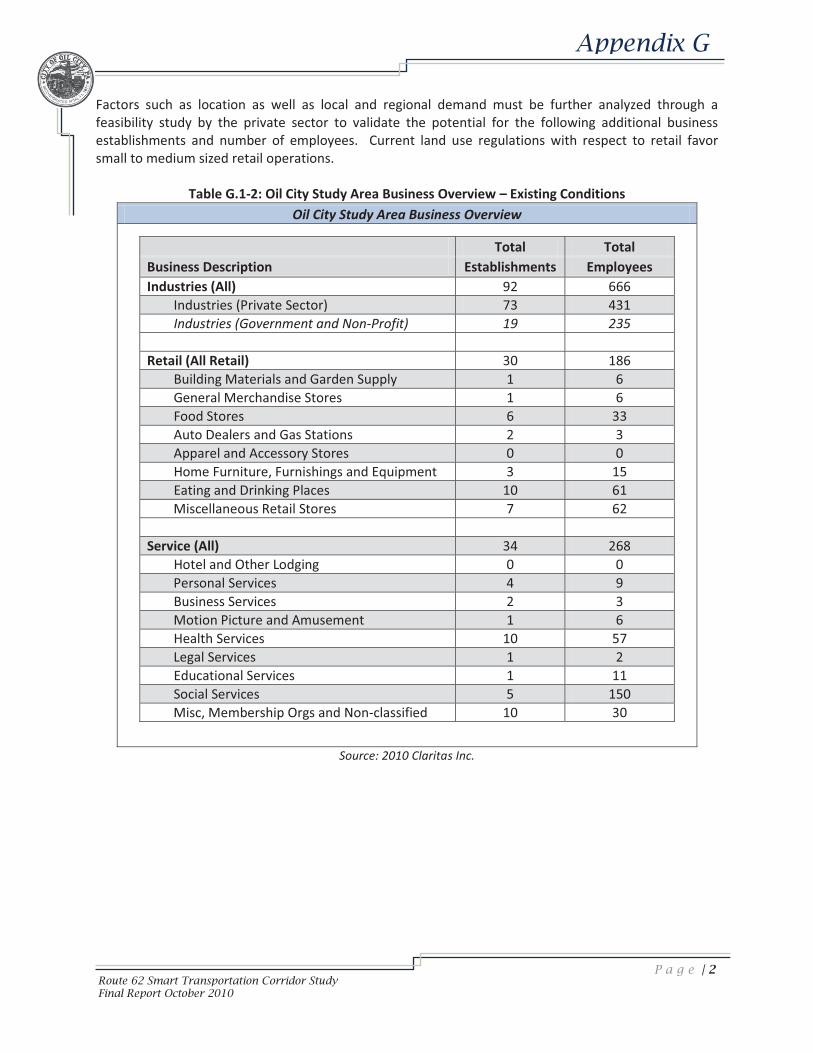
Appendix G
Route 62 Smart Transportation Corridor Study Final Report October 2010
P a g e | 2
Factors such as location as well as local and regional demand must be further analyzed through a feasibility study by the private sector to validate the potential for the following additional business establishments and number of employees. Current land use regulations with respect to retail favor small to medium sized retail operations.
Table G.1-2: Oil City Study Area Business Overview – Existing Conditions Oil City Study Area Business Overview
Total Total Business Description Establishments Employees Industries (All) 92 666 Industries (Private Sector) 73 431 Industries (Government and Non-Profit) 19 235 Retail (All Retail) 30 186 Building Materials and Garden Supply 1 6 General Merchandise Stores 1 6 Food Stores 6 33 Auto Dealers and Gas Stations 2 3 Apparel and Accessory Stores 0 0 Home Furniture, Furnishings and Equipment 3 15 Eating and Drinking Places 10 61 Miscellaneous Retail Stores 7 62 Service (All) 34 268 Hotel and Other Lodging 0 0 Personal Services 4 9 Business Services 2 3 Motion Picture and Amusement 1 6 Health Services 10 57 Legal Services 1 2 Educational Services 1 11 Social Services 5 150 Misc, Membership Orgs and Non-classified 10 30
Source: 2010 Claritas Inc.

Appendix G
Route 62 Smart Transportation Corridor Study Final Report October 2010
P a g e | 3
Appendix G.1.2: Oil City (2 Mile Radius) / Gap Analysis Results
The data indicates that the two mile radius within Oil City may be able to support in addition to the current businesses, motor vehicle and parts dealer, furniture and home furnishing store, electronics and appliance store, food and beverage store, health and personal care store, gasoline station, clothing and clothing accessory store, sporting goods, hobby and music store, general merchandise store, and a food service and drinking place. The data also indicates that the geographic region is meeting a regional demand for building materials and garden equipment. Utilizing a gap analysis provides an initial indicator for retail and services opportunities for a selected region; therefore further market study and analysis is considered prudent.
Table G.1-3: Oil City (2 Mile Radius) Opportunity Gap & Opportunity Surplus
Oil City (2 Mile Radius) Opportunity Gap – Opportunity Surplus Opportunity Gaps: Opportunities for new or expanded stores. Local resident demand exceeds local store supply of goods or services for the following:
$10.8 million for Motor Vehicle and Parts Dealers (automotive dealers) $3.0 million for Furniture and Home Furnishings $1.1 million for Electronics and Appliances (appliance, electronic, computer and software, camera
equipment stores) $10.1 million for Food and Beverage Store products (grocery, specialty foods, beer, wine, & liquor
stores) $2.5 million for Health and Personal Care Store products (health and personal care merchandise from
fixed point-of-sale locations – which may include Doctors, Physicians, Counselors, as staff) $4.4 million for Gasoline Stations (stations with or without convenience stores) $7.0 million for Clothing and Clothing Accessory products (clothing, shoe, jewelry, luggage, and leather
stores) $2.3 million for Sporting Goods, Hobby, Book, Music products (sporting goods, books, periodical, and
musical instrument stores) $22.8 million for General Merchandise Store products (department stores) $1.7 million for Miscellaneous Store products (florists, office supplies, gifts, and used merchandise
stores) $14.1 million for Non-Store Retailers $12.5 for Food Service and Drinking Places (full service restaurants, limited service restaurants, special
food services, and drinking places)
Opportunity Surplus: Opportunities to meet regional demand. Local store supply of goods and services in this area exceeds local resident demand. This indicates that people from outside the area come here to purchase the following products.
$2.1 million for Building Materials, Garden Equipment Store products
Source: 2010 Claritas Inc., Gap Report
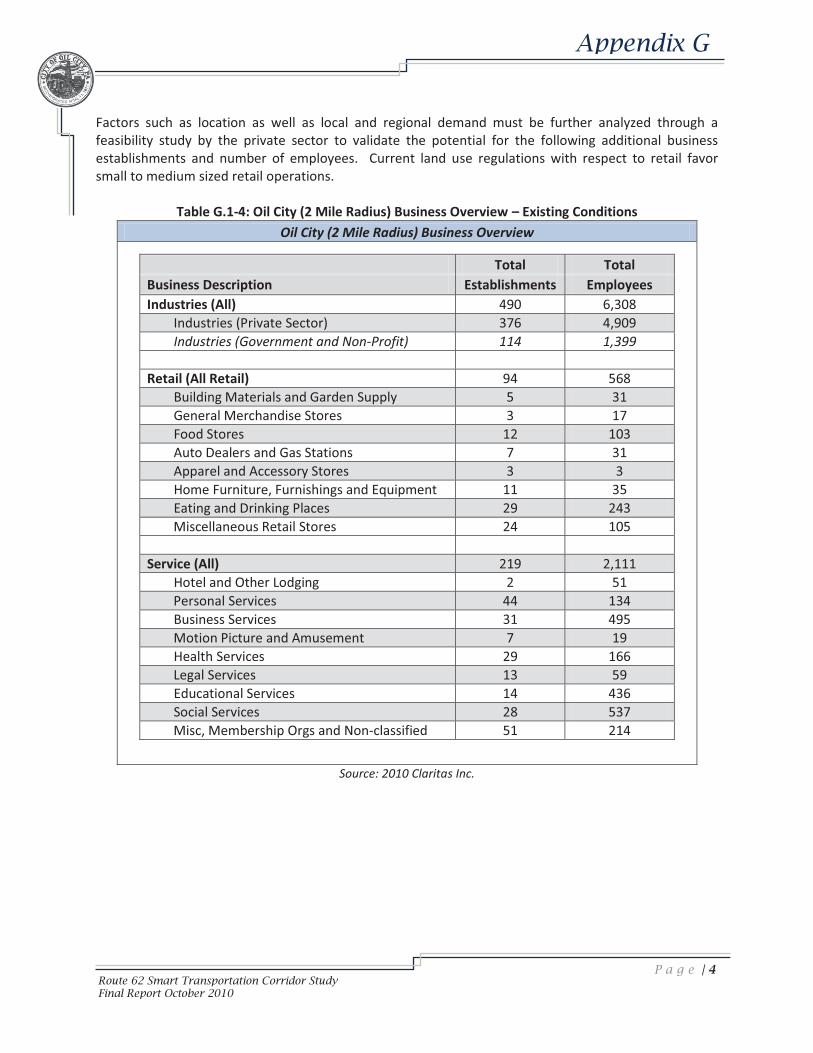
Appendix G
Route 62 Smart Transportation Corridor Study Final Report October 2010
P a g e | 4
Factors such as location as well as local and regional demand must be further analyzed through a feasibility study by the private sector to validate the potential for the following additional business establishments and number of employees. Current land use regulations with respect to retail favor small to medium sized retail operations.
Table G.1-4: Oil City (2 Mile Radius) Business Overview – Existing Conditions Oil City (2 Mile Radius) Business Overview
Total Total Business Description Establishments Employees Industries (All) 490 6,308 Industries (Private Sector) 376 4,909 Industries (Government and Non-Profit) 114 1,399 Retail (All Retail) 94 568 Building Materials and Garden Supply 5 31 General Merchandise Stores 3 17 Food Stores 12 103 Auto Dealers and Gas Stations 7 31 Apparel and Accessory Stores 3 3 Home Furniture, Furnishings and Equipment 11 35 Eating and Drinking Places 29 243 Miscellaneous Retail Stores 24 105 Service (All) 219 2,111 Hotel and Other Lodging 2 51 Personal Services 44 134 Business Services 31 495 Motion Picture and Amusement 7 19 Health Services 29 166 Legal Services 13 59 Educational Services 14 436 Social Services 28 537 Misc, Membership Orgs and Non-classified 51 214
Source: 2010 Claritas Inc.
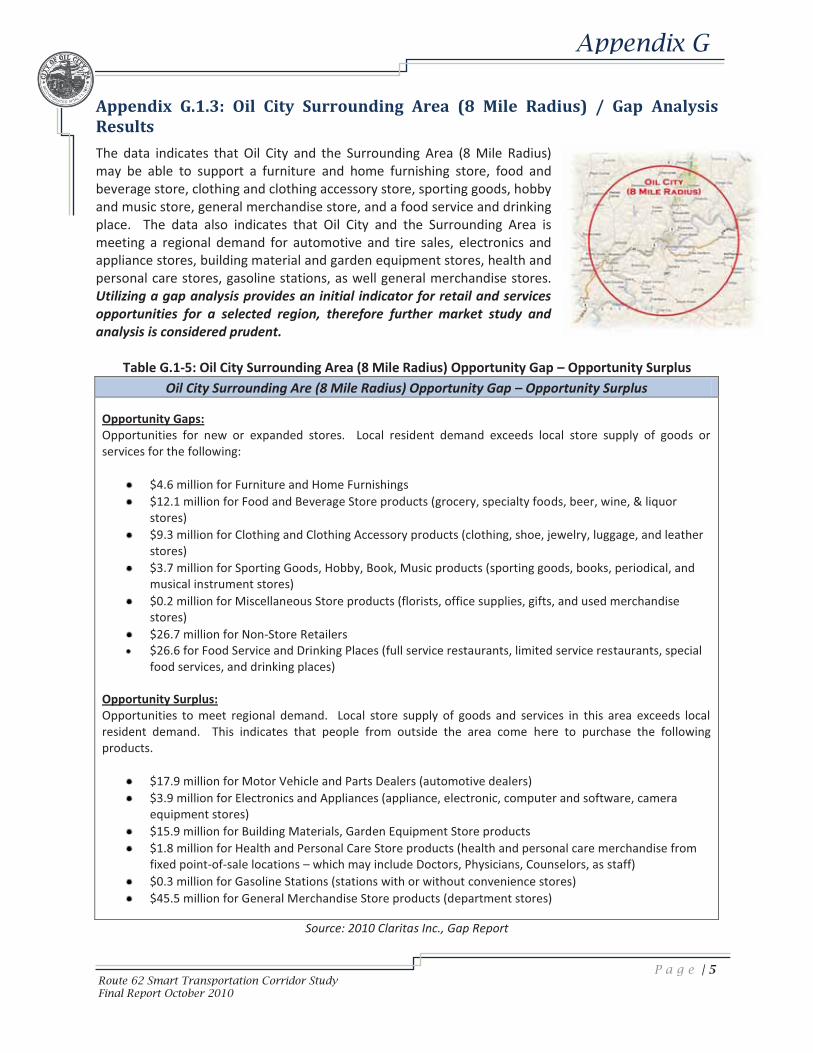
Appendix G
Route 62 Smart Transportation Corridor Study Final Report October 2010
P a g e | 5
Appendix G.1.3: Oil City Surrounding Area (8 Mile Radius) / Gap Analysis Results
The data indicates that Oil City and the Surrounding Area (8 Mile Radius) may be able to support a furniture and home furnishing store, food and beverage store, clothing and clothing accessory store, sporting goods, hobby and music store, general merchandise store, and a food service and drinking place. The data also indicates that Oil City and the Surrounding Area is meeting a regional demand for automotive and tire sales, electronics and appliance stores, building material and garden equipment stores, health and personal care stores, gasoline stations, as well general merchandise stores. Utilizing a gap analysis provides an initial indicator for retail and services opportunities for a selected region, therefore further market study and analysis is considered prudent.
Table G.1-5: Oil City Surrounding Area (8 Mile Radius) Opportunity Gap – Opportunity Surplus Oil City Surrounding Are (8 Mile Radius) Opportunity Gap – Opportunity Surplus
Opportunity Gaps: Opportunities for new or expanded stores. Local resident demand exceeds local store supply of goods or services for the following:
$4.6 million for Furniture and Home Furnishings $12.1 million for Food and Beverage Store products (grocery, specialty foods, beer, wine, & liquor
stores) $9.3 million for Clothing and Clothing Accessory products (clothing, shoe, jewelry, luggage, and leather
stores) $3.7 million for Sporting Goods, Hobby, Book, Music products (sporting goods, books, periodical, and
musical instrument stores) $0.2 million for Miscellaneous Store products (florists, office supplies, gifts, and used merchandise
stores) $26.7 million for Non-Store Retailers $26.6 for Food Service and Drinking Places (full service restaurants, limited service restaurants, special
food services, and drinking places)
Opportunity Surplus: Opportunities to meet regional demand. Local store supply of goods and services in this area exceeds local resident demand. This indicates that people from outside the area come here to purchase the following products.
$17.9 million for Motor Vehicle and Parts Dealers (automotive dealers) $3.9 million for Electronics and Appliances (appliance, electronic, computer and software, camera
equipment stores) $15.9 million for Building Materials, Garden Equipment Store products $1.8 million for Health and Personal Care Store products (health and personal care merchandise from
fixed point-of-sale locations – which may include Doctors, Physicians, Counselors, as staff) $0.3 million for Gasoline Stations (stations with or without convenience stores) $45.5 million for General Merchandise Store products (department stores)
Source: 2010 Claritas Inc., Gap Report
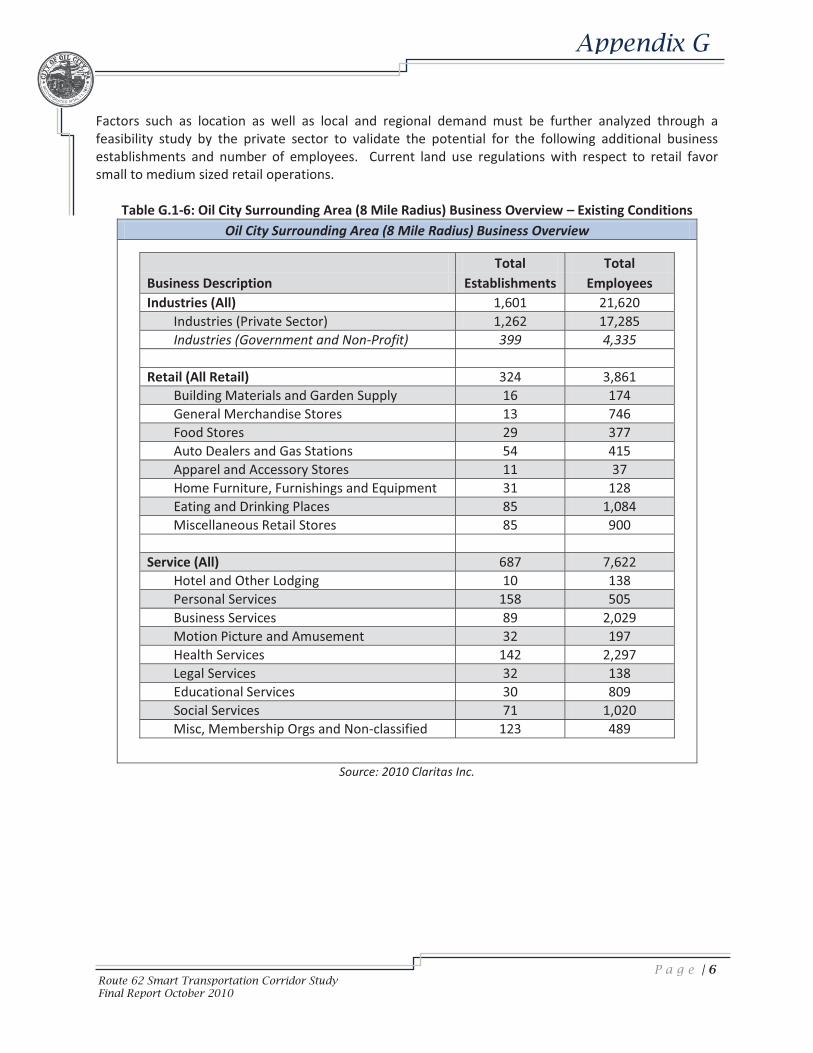
Appendix G
Route 62 Smart Transportation Corridor Study Final Report October 2010
P a g e | 6
Factors such as location as well as local and regional demand must be further analyzed through a feasibility study by the private sector to validate the potential for the following additional business establishments and number of employees. Current land use regulations with respect to retail favor small to medium sized retail operations.
Table G.1-6: Oil City Surrounding Area (8 Mile Radius) Business Overview – Existing Conditions
Oil City Surrounding Area (8 Mile Radius) Business Overview
Total Total Business Description Establishments Employees Industries (All) 1,601 21,620 Industries (Private Sector) 1,262 17,285 Industries (Government and Non-Profit) 399 4,335 Retail (All Retail) 324 3,861 Building Materials and Garden Supply 16 174 General Merchandise Stores 13 746 Food Stores 29 377 Auto Dealers and Gas Stations 54 415 Apparel and Accessory Stores 11 37 Home Furniture, Furnishings and Equipment 31 128 Eating and Drinking Places 85 1,084 Miscellaneous Retail Stores 85 900 Service (All) 687 7,622 Hotel and Other Lodging 10 138 Personal Services 158 505 Business Services 89 2,029 Motion Picture and Amusement 32 197 Health Services 142 2,297 Legal Services 32 138 Educational Services 30 809 Social Services 71 1,020 Misc, Membership Orgs and Non-classified 123 489
Source: 2010 Claritas Inc.
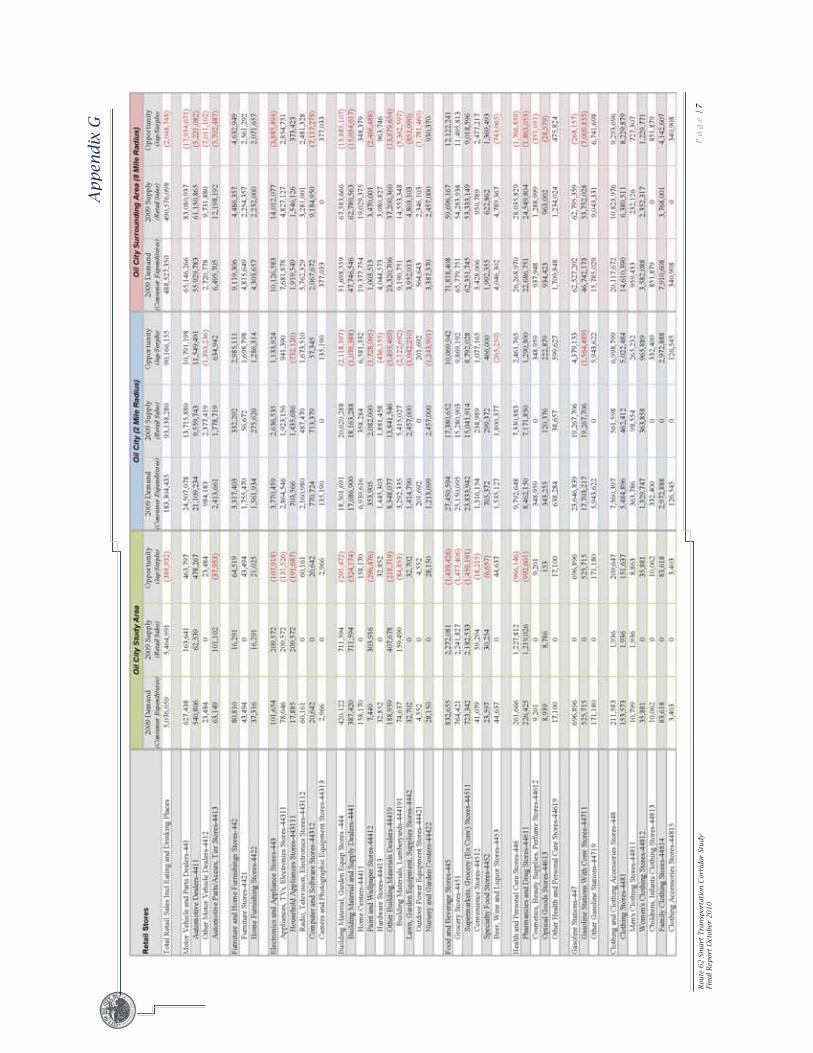
Ap
pen
dix
G
Rou
te 6
2 S
mart
Tra
nsp
orta
tion
Cor
ridor
Stu
dy
Fin
al R
epor
t O
ctob
er 2
010
Pa
ge
| 7
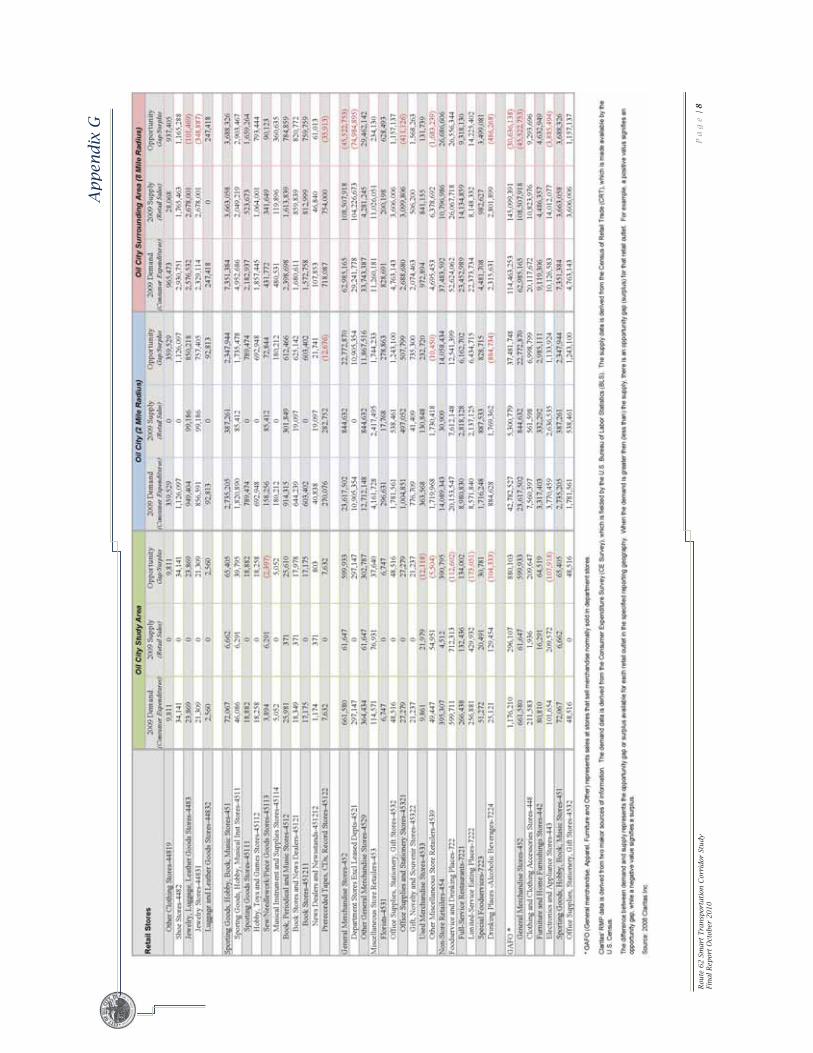
Ap
pen
dix
G
Rou
te 6
2 S
mart
Tra
nsp
orta
tion
Cor
ridor
Stu
dy
Fin
al R
epor
t O
ctob
er 2
010
Pa
ge
| 8

Appendix G
Route 62 Smart Transportation Corridor Study Final Report October 2010
P a g e | 9
Appendix G.1.4: Oil City Study Area
Retail Store Type

Appendix G
Route 62 Smart Transportation Corridor Study Final Report October 2010
P a g e | 10
Source: 2009 Claritas Inc.
Food Away From Home
Source: 2009 Claritas Inc.
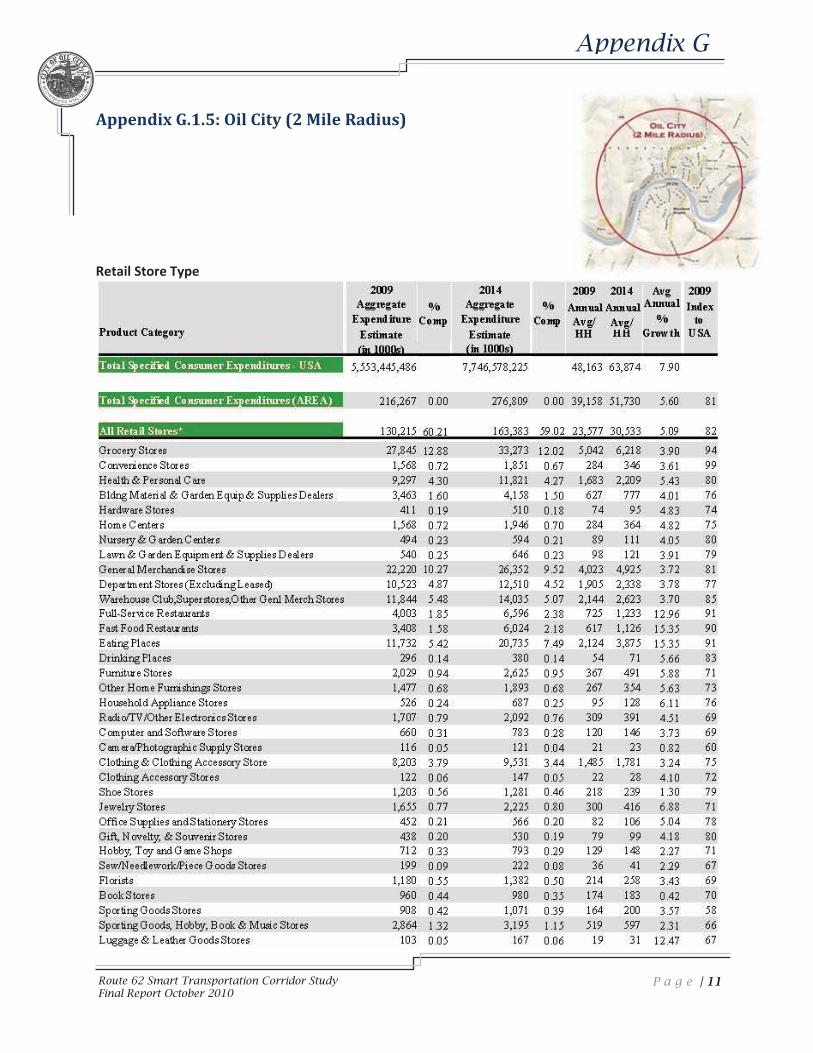
Appendix G
Route 62 Smart Transportation Corridor Study Final Report October 2010
P a g e | 11
Appendix G.1.5: Oil City (2 Mile Radius)
Retail Store Type
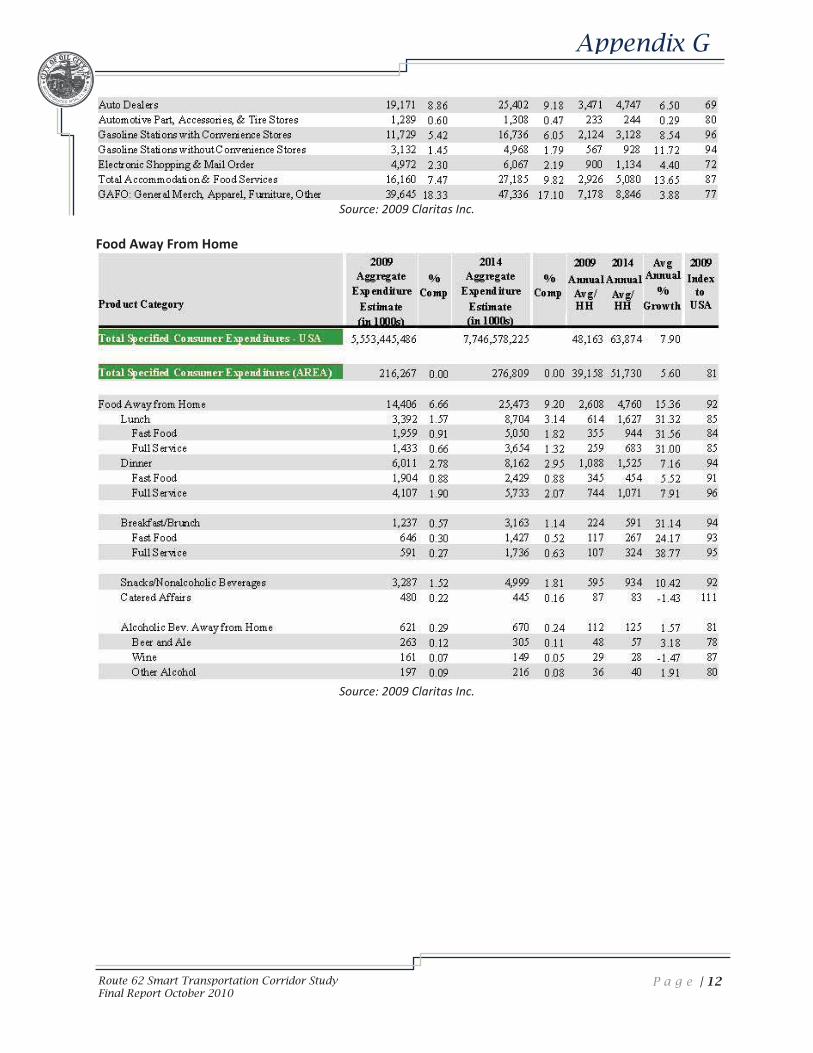
Appendix G
Route 62 Smart Transportation Corridor Study Final Report October 2010
P a g e | 12
Source: 2009 Claritas Inc.
Food Away From Home
Source: 2009 Claritas Inc.
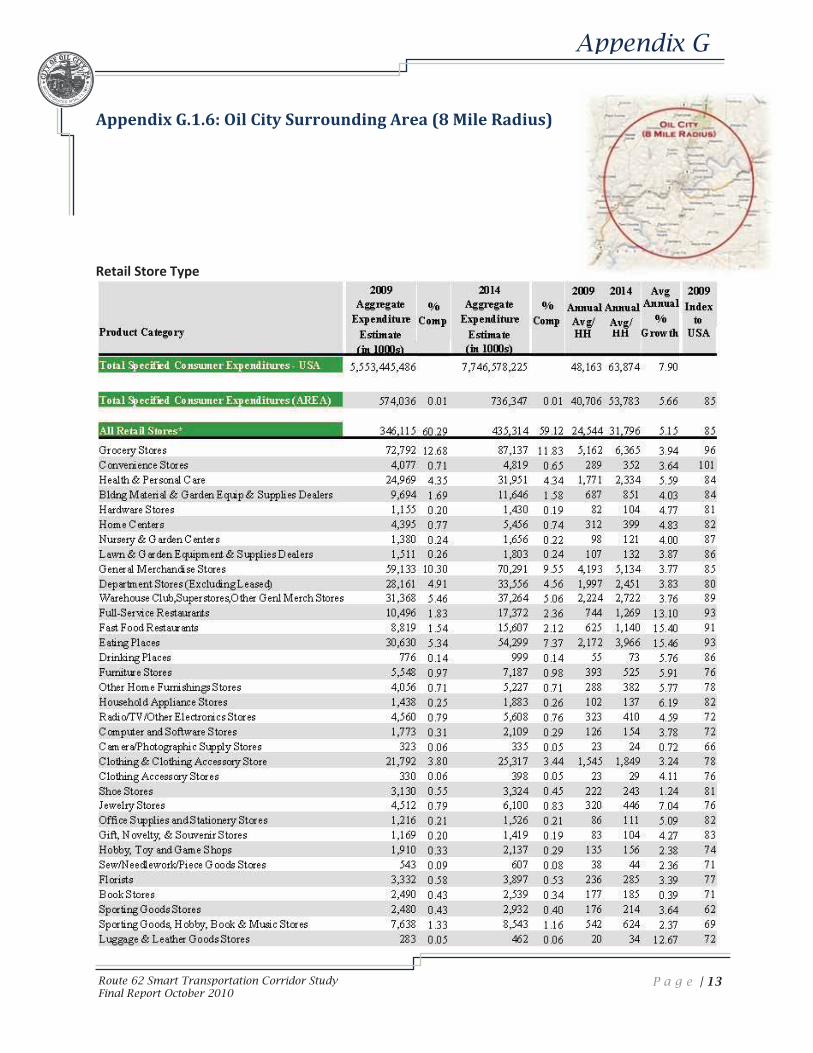
Appendix G
Route 62 Smart Transportation Corridor Study Final Report October 2010
P a g e | 13
Appendix G.1.6: Oil City Surrounding Area (8 Mile Radius)
Retail Store Type

Appendix G
Route 62 Smart Transportation Corridor Study Final Report October 2010
P a g e | 14
Note: All Retail Stores Total is NOT the sum of the other line items. Some line items are sub-categories of multiple
line items and could appear in more than one line item. Source: 2009 Claritas Inc.
Food Away From Home
Source: 2009 Claritas Inc.
Appendix H
Route 62 Smart Transportation Corridor Study Final Report October 2010
Appendix H: Access Management
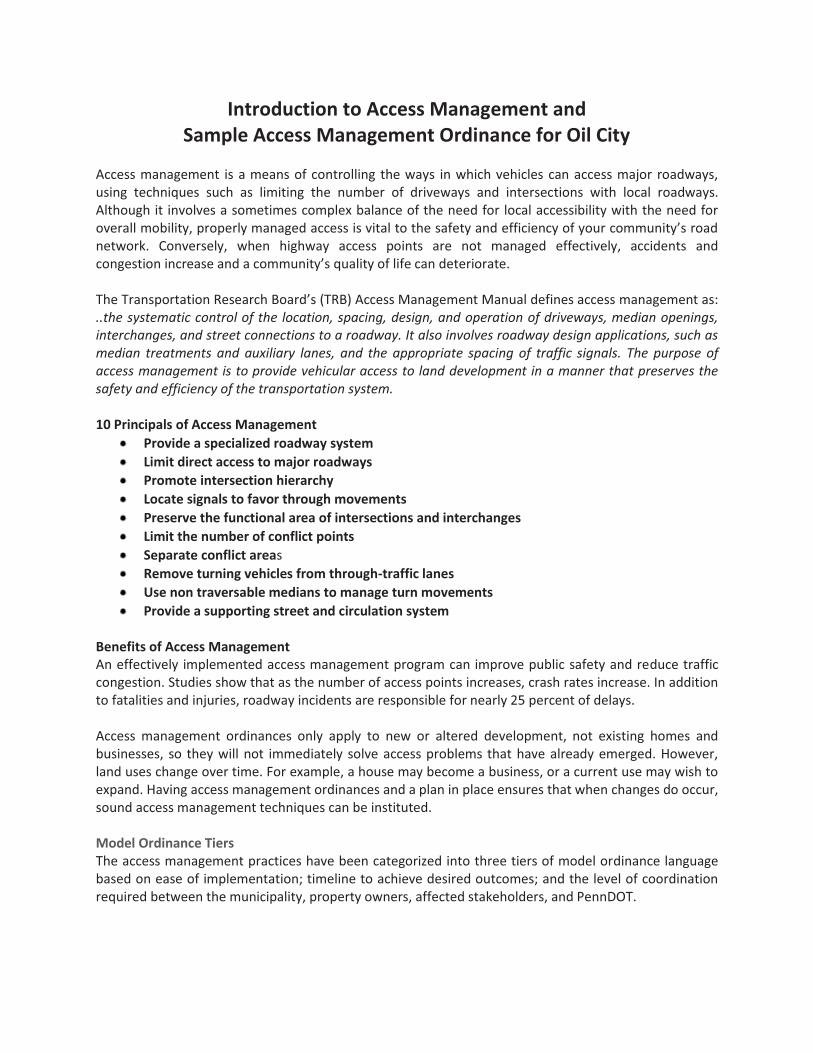
Introduction to Access Management and Sample Access Management Ordinance for Oil City
Access management is a means of controlling the ways in which vehicles can access major roadways, using techniques such as limiting the number of driveways and intersections with local roadways. Although it involves a sometimes complex balance of the need for local accessibility with the need for overall mobility, properly managed access is vital to the safety and efficiency of your community’s road network. Conversely, when highway access points are not managed effectively, accidents and congestion increase and a community’s quality of life can deteriorate. The Transportation Research Board’s (TRB) Access Management Manual defines access management as: ..the systematic control of the location, spacing, design, and operation of driveways, median openings, interchanges, and street connections to a roadway. It also involves roadway design applications, such as median treatments and auxiliary lanes, and the appropriate spacing of traffic signals. The purpose of access management is to provide vehicular access to land development in a manner that preserves the safety and efficiency of the transportation system. 10 Principals of Access Management
Provide a specialized roadway system Limit direct access to major roadways Promote intersection hierarchy Locate signals to favor through movements Preserve the functional area of intersections and interchanges Limit the number of conflict points Separate conflict areas Remove turning vehicles from through-traffic lanes Use non traversable medians to manage turn movements Provide a supporting street and circulation system
Benefits of Access Management An effectively implemented access management program can improve public safety and reduce traffic congestion. Studies show that as the number of access points increases, crash rates increase. In addition to fatalities and injuries, roadway incidents are responsible for nearly 25 percent of delays. Access management ordinances only apply to new or altered development, not existing homes and businesses, so they will not immediately solve access problems that have already emerged. However, land uses change over time. For example, a house may become a business, or a current use may wish to expand. Having access management ordinances and a plan in place ensures that when changes do occur, sound access management techniques can be instituted. Model Ordinance Tiers The access management practices have been categorized into three tiers of model ordinance language based on ease of implementation; timeline to achieve desired outcomes; and the level of coordination required between the municipality, property owners, affected stakeholders, and PennDOT.

Tier 1 Tier 1 practices relate to the number and location of driveways and basic design elements that should be evaluated for every access. These practices should be implemented during the land development approval process and require coordination between the municipality, property owner, and possibly PennDOT. Additional practices such as shared driveways and internal access to outparcels attempt to consolidate access points among adjacent property owners. The practices included in this tier are generally the easiest to implement because they cost the least, take the least time to implement, and require the least amount of coordination between the property owner, municipality, and PennDOT. • Number of Driveways • Corner Clearance • Safe Sight Distance • Driveway Channelization • Joint and Cross Access • Access to Outparcels • Driveway Throat Length • Driveway Throat Width • Driveway Radius • Driveway Profile
Tier 2 Tier 2 practices involve more complex design elements for individual driveways, such as left turn lanes and deceleration lanes. Other practices, such as driveway and signalized intersection spacing, involve multiple driveways or off-site intersections. The practices in this tier can be implemented during the land development approval process, but they could require a higher level of coordination among the municipality, multiple property owners, and PennDOT. Some of the practices could require implementation through multiple land development approvals or a comprehensive project involving several properties. The practices in this tier can be more costly and require a longer period of time to implement than the practices in Tier 1 due to the participation of multiple property owners. • Auxiliary Lanes • Left Turn Lane • Acceleration Lane • Driveway Spacing • Signalized Intersection Spacing • Driveway Clearance from Interchange Ramps
Tier 3 Tier 3 includes roadway design and planning practices such as medians, two-way center left turn lanes, setbacks, frontage roads involving multiple driveways, intersections, and properties. These practices cover a much larger corridor or area and typically require the highest degree of coordination among property owners, the municipality, and PennDOT. In addition, this tier contains planning and regulatory tools such as the official map and zoning overlay districts to implement these types of practices. In most situations, these practices would require capital funding for implementation. These types of practices could require years to fully implement. These practices are more expensive, require much higher levels
of coordination between stakeholders, and much more time to implement than Tier 1 and Tier 2 practices. • Overlay Districts • Official Map • Two-way Left Turn Lanes • Frontage/Service Roads • Non-traversable Medians • Setbacks • Bonuses and Incentives • Pre-existing Access
References Access Management Model Ordinances for Pennsylvania Municipalities Handbook, PennDOT Access Management Manual, Transportation Research Board

ACCESS MANAGEMENT ORDINANCE FOR OIL CITY (adapted from Access Management Model Ordinances for Pennsylvania Municipalities Handbook, PennDOT)
Purpose The purpose of this ordinance is to provide vehicular access to land development in a manner that preserves the safety and efficiency of the transportation system. Access management encompasses the careful planning of the location, design and operation of driveways, median openings, interchanges, and street connections. If access systems are not properly designed, the primary transportation network, including arterials and highways, will be unable to accommodate the access needs of development and retain their primary transportation function. This ordinance is intended to promote safe and efficient travel within Oil City by limiting the number of conflict points, providing safe spacing standards between driveways, encouraging shared access between abutting properties, and ensuring safe access by emergency vehicles.
Applicability This ordinance shall apply to all arterials and collectors within the City, as identified herein, and to all properties which abut these roadways. List proposed streets
Conformance with Plans, Regulations, and Statutes This ordinance is generally consistent with of the comprehensive plan for Oil City. This ordinance also conforms with the requirements of the Pennsylvania Municipalities Planning Code and meets or exceeds the standards contained in Title 67, Chapter 441 of the Pennsylvania Code titled, Access To And Occupancy Of Highways By Driveways And Local Roads.”
Definitions 85th Percentile Speed – The speed, in miles per hour, which is exceeded by only 15 percent of the drivers traveling on a section of highway.
95th Percentile Queue Length - The queue exceeded at some point during 5 percent of the signal cycles.
Access – A driveway, street, or other means of passage of vehicles between the highway and abutting property, including acceleration and deceleration lanes and such drainage structures as may be necessary for proper construction and maintenance thereof. [67 PA Code Chapter 441]
Average Daily Traffic (ADT) – The total volume of traffic during a number of whole days (more than one day) and less than one year divided by the number of days in that period.
Design Speed – The maximum safe speed that can be maintained over a section of roadway when conditions are so favorable that the design features of the road govern.
Driveway – Every entrance or exit used by vehicular traffic to or from properties abutting a highway. The term includes proposed streets, lanes, alleys, courts, and ways. [67 PA Code Chapter 441]
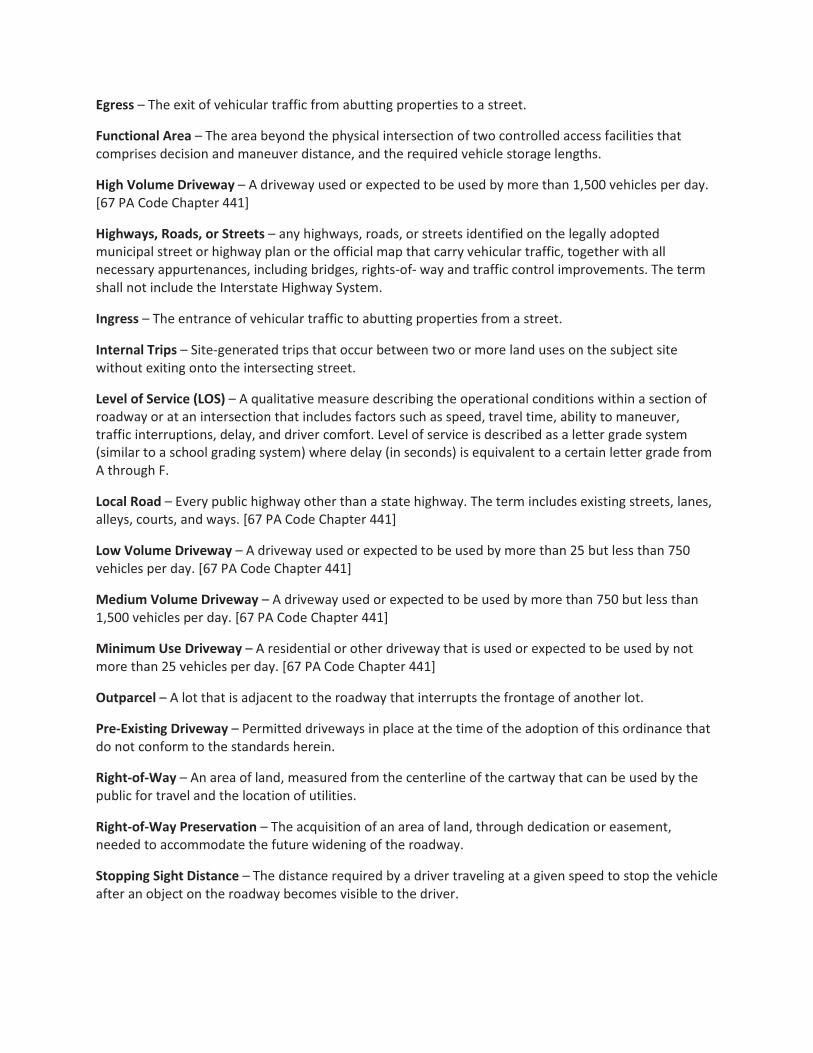
Egress – The exit of vehicular traffic from abutting properties to a street.
Functional Area – The area beyond the physical intersection of two controlled access facilities that comprises decision and maneuver distance, and the required vehicle storage lengths.
High Volume Driveway – A driveway used or expected to be used by more than 1,500 vehicles per day. [67 PA Code Chapter 441]
Highways, Roads, or Streets – any highways, roads, or streets identified on the legally adopted municipal street or highway plan or the official map that carry vehicular traffic, together with all necessary appurtenances, including bridges, rights-of- way and traffic control improvements. The term shall not include the Interstate Highway System.
Ingress – The entrance of vehicular traffic to abutting properties from a street.
Internal Trips – Site-generated trips that occur between two or more land uses on the subject site without exiting onto the intersecting street.
Level of Service (LOS) – A qualitative measure describing the operational conditions within a section of roadway or at an intersection that includes factors such as speed, travel time, ability to maneuver, traffic interruptions, delay, and driver comfort. Level of service is described as a letter grade system (similar to a school grading system) where delay (in seconds) is equivalent to a certain letter grade from A through F.
Local Road – Every public highway other than a state highway. The term includes existing streets, lanes, alleys, courts, and ways. [67 PA Code Chapter 441]
Low Volume Driveway – A driveway used or expected to be used by more than 25 but less than 750 vehicles per day. [67 PA Code Chapter 441]
Medium Volume Driveway – A driveway used or expected to be used by more than 750 but less than 1,500 vehicles per day. [67 PA Code Chapter 441]
Minimum Use Driveway – A residential or other driveway that is used or expected to be used by not more than 25 vehicles per day. [67 PA Code Chapter 441]
Outparcel – A lot that is adjacent to the roadway that interrupts the frontage of another lot.
Pre-Existing Driveway – Permitted driveways in place at the time of the adoption of this ordinance that do not conform to the standards herein.
Right-of-Way – An area of land, measured from the centerline of the cartway that can be used by the public for travel and the location of utilities.
Right-of-Way Preservation – The acquisition of an area of land, through dedication or easement, needed to accommodate the future widening of the roadway.
Stopping Sight Distance – The distance required by a driver traveling at a given speed to stop the vehicle after an object on the roadway becomes visible to the driver.
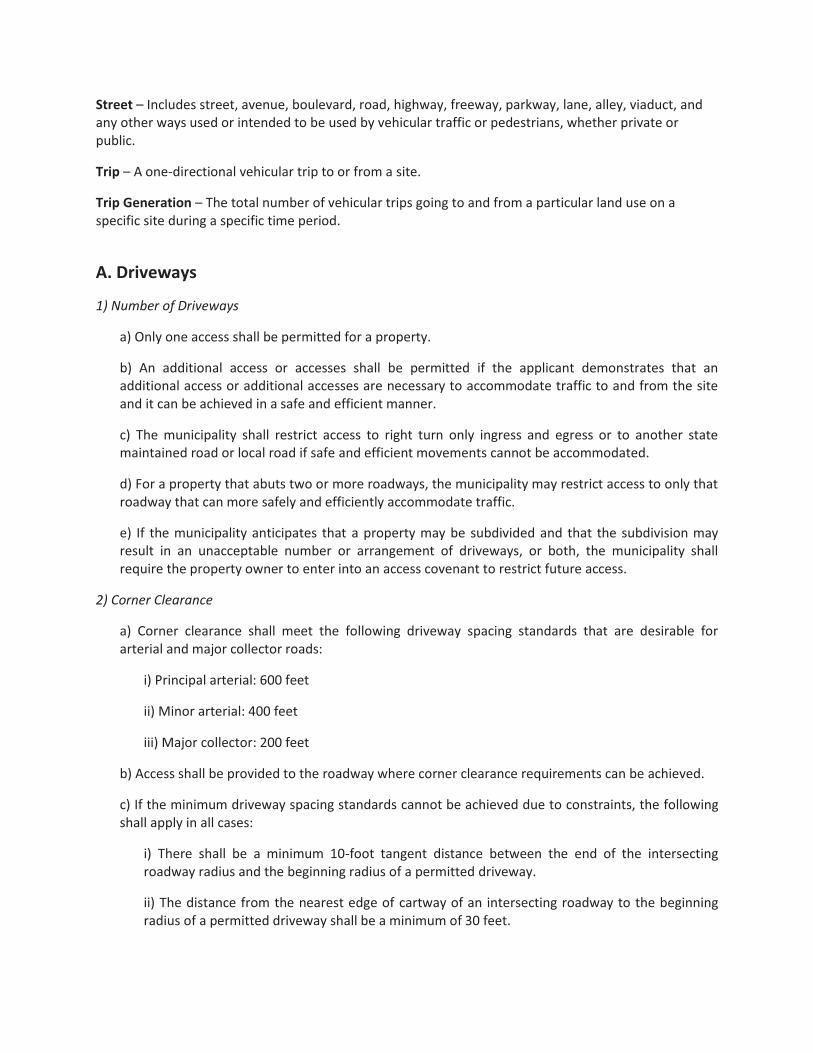
Street – Includes street, avenue, boulevard, road, highway, freeway, parkway, lane, alley, viaduct, and any other ways used or intended to be used by vehicular traffic or pedestrians, whether private or public.
Trip – A one-directional vehicular trip to or from a site.
Trip Generation – The total number of vehicular trips going to and from a particular land use on a specific site during a specific time period.
A. Driveways
1) Number of Driveways
a) Only one access shall be permitted for a property.
b) An additional access or accesses shall be permitted if the applicant demonstrates that an additional access or additional accesses are necessary to accommodate traffic to and from the site and it can be achieved in a safe and efficient manner.
c) The municipality shall restrict access to right turn only ingress and egress or to another state maintained road or local road if safe and efficient movements cannot be accommodated.
d) For a property that abuts two or more roadways, the municipality may restrict access to only that roadway that can more safely and efficiently accommodate traffic.
e) If the municipality anticipates that a property may be subdivided and that the subdivision may result in an unacceptable number or arrangement of driveways, or both, the municipality shall require the property owner to enter into an access covenant to restrict future access.
2) Corner Clearance
a) Corner clearance shall meet the following driveway spacing standards that are desirable for arterial and major collector roads:
i) Principal arterial: 600 feet
ii) Minor arterial: 400 feet
iii) Major collector: 200 feet
b) Access shall be provided to the roadway where corner clearance requirements can be achieved.
c) If the minimum driveway spacing standards cannot be achieved due to constraints, the following shall apply in all cases:
i) There shall be a minimum 10-foot tangent distance between the end of the intersecting roadway radius and the beginning radius of a permitted driveway.
ii) The distance from the nearest edge of cartway of an intersecting roadway to the beginning radius of a permitted driveway shall be a minimum of 30 feet.

d) If no other reasonable access to the property is available, and no reasonable alternative is identified, the driveway shall be located the farthest possible distance from the intersecting roadway. In such cases, directional connections (i.e., right in/right out only, right in only or right out only) may be required.
e) The municipality shall require restrictions at the driveway if the municipal engineer determines that the location of the driveway and particular ingress or egress movements will create safety or operational problems.
3) Safe Sight Distance
a) Safe sight distance shall be available for all permitted turning movements at all driveway intersections.
b) PennDOT’s Pub. 441 and Pub. 282 for driveways or Pub. 70 for local roads shall be referenced to determine minimum driveway and roadway intersection safe sight distance requirements.
c) All driveways and intersecting roadways shall be designed and located so that the sight distance is optimized to the degree possible without jeopardizing other requirements such as intersection spacing, and at least minimum sight distance requirements are met.
4) Driveway Channelization
a) For high and medium volume driveways, channelization islands and medians shall be used to separate conflicting traffic movements into specified lanes to facilitate orderly movements for vehicles and pedestrians.
b) Where it is found to be necessary to restrict particular turning movements at a driveway, due to the potential disruption to the orderly flow of traffic or a result of sight distance constraints, the municipality may require a raised channelization island.
c) Raised channelization islands shall be designed with criteria consistent with the latest AASHTO publication entitled A Policy on Geometric Design of Highways and Streets.
5) Joint and Cross Access

a) The municipality may require a joint driveway in order to achieve the following driveway spacing standards that are desirable for arterial and major collector roads:
i) Principal arterial: 600 feet
ii) Minor arterial: 400 feet
iii) Major collector: 200 feet
b) Adjacent non-residential properties shall provide a joint or cross access driveway to allow circulation between sites wherever feasible along roadways classified as major collectors or arterials in accordance with the functional classification contained in the municipal comprehensive plan. The following shall apply to joint and cross access driveways:
i) The driveway shall have a design speed of 10 mph and have sufficient width to accommodate two-way traffic including the largest vehicle expected to frequently access the properties.
ii) A circulation plan that may include coordinated or shared parking shall be required.
iii) Features shall be included in the design to make it visually obvious that abutting properties shall be tied in to provide cross access.
c) The property owners along a joint or cross access driveway shall:
i) Record an easement with the deed allowing cross access to and from other properties served by the driveway.
ii) Record an agreement with the municipality so that future access rights along the driveway shall be granted at the discretion of the municipality and the design shall be approved by the municipal engineer.
iii) Record a joint agreement with the deed defining the maintenance responsibilities of each of the property owners located along the driveway.
6) Access to Outparcels
a) For commercial and office developments under the same ownership and consolidated for the purposes of development or phased developments comprised of more than one building site, the municipality shall require that the development be served by an internal road that is separated from the main roadway.
b) All access to outparcels shall be internalized using the internal roadway.
c) The driveways for outparcels shall be designed to allow safe and efficient ingress and egress movements from the internal road.
d) The internal circulation roads shall be designed to avoid excessive queuing across parking aisles.
e) The design of the internal road shall be in accordance with all other sections of this ordinance.
f) All necessary easements and agreements required under Section A.6.c shall be met.
g) A municipality may require an access covenant to restrict an outparcel to internal access only.

B. Driveway Design Elements
1) Driveway Throat Length
a) For minimum use driveways, the throat length shall be a minimum of 25 feet.
b) For low volume driveways, the throat length shall be a minimum of 50 feet or as determined by queuing analysis.
c) For medium volume driveways, the throat length shall be a minimum of 120 feet or as determined by a queuing analysis.
d) For high volume driveways, the throat length shall be a minimum of 150 feet or as determined by a queuing analysis.
2) Driveway Throat Width
a) For driveways without curb:
i) A minimum use driveway shall have a minimum width of 10 feet.
ii) Low and medium volume driveways shall have a minimum width of 10 feet for one-way operation and a minimum width of 20 feet for two-way operation.
iii) The design of high volume driveways shall be based on analyses to determine the number of required lanes.
b) For driveways with curb, two feet should be added to the widths contained in Section a.i and a.ii.
c) The municipality may require additional driveway width to provide turning lanes for adequate traffic flow and safety.
d) The municipality may require that the driveway design include a median to control turning movements. Where medians are required or permitted, the minimum width of the median shall be four feet to provide adequate clearance for signs.

3) Driveway Radius
a) The following criteria shall apply to driveway radii:
i) For minimum use driveways, the radii shall be a minimum of 15 feet.
ii) For low volume driveways, the radii shall be a minimum of 15 feet uncurbed and 25 feet curbed.
iii) For medium volume driveways, the radii shall be a minimum of 15 feet uncurbed and 25 feet curbed.
iv) For high volume driveways, the design should be reviewed by the municipal engineer on municipal roadways and PennDOT on state maintained roadways.
b) For all driveways, the radii shall be designed to accommodate the largest vehicle expected to frequently use the driveway.
c) Except for joint driveways, no portion of a driveway radius may be located on or along the frontage of an adjacent property.
4) Driveway Profile
a) Driveway grade requirements where curb is not present on the intersecting street:
i) Shoulder slopes vary from four percent to six percent. When shoulders are present, the existing shoulder slope shall be maintained across the full shoulder width.
ii) The change in grade between the cross slope of the connecting roadway or shoulder and the driveway shall not exceed eight percent.
iii) The driveway grade shall not exceed eight percent within 10 feet of the edge of travel lane for minimum use driveways and within 40 feet for low, medium, and high volume driveways.
iv) A 40-foot minimum vertical curve should be used for a high volume driveway.
b) Driveway grade requirements where curbs and sidewalks are present:
i) The difference between the cross slope of the roadway and the grade of the driveway apron may not exceed eight percent.
ii) The driveway grade shall not exceed eight percent within 10 feet of the edge of travel lane for minimum use driveways and within 40 feet for low, medium, and high volume driveways.
iii) If a planted area exists between the sidewalk and curb, the following shall apply:
(1) The grade of the planted area shall not exceed eight percent.
(2) If the driveway grade would exceed eight percent in the area between the curb and the sidewalk, the outer edge (street side) of the sidewalk may be depressed to enable the driveway grade to stay within eight percent. A maximum sidewalk cross slope of eight percent must be maintained.
(3) If the sidewalk cross slope exceeds two percent, the entire sidewalk may be depressed. The longitudinal grade of the sidewalk may not exceed six percent.
c) Although site conditions may not allow strict adherence to these guidelines in this ordinance, every effort should be made to design and construct the safest and most efficient access onto the municipal or state roadway.
C. TRANSPORTATION IMPACT STUDIES A transportation impact study is an engineering study that evaluates the effect that traffic generated by a proposed development would have on surrounding roadway operations, and determines the improvements to the existing transportation system necessary to accommodate that traffic. A transportation impact study should be completed when thresholds are met based on the size of the development and its impact on adjacent access points and intersections. An application for access to a development shall include a traffic impact study if:
The access is expected to have an average daily traffic volume of 3,000 or more,
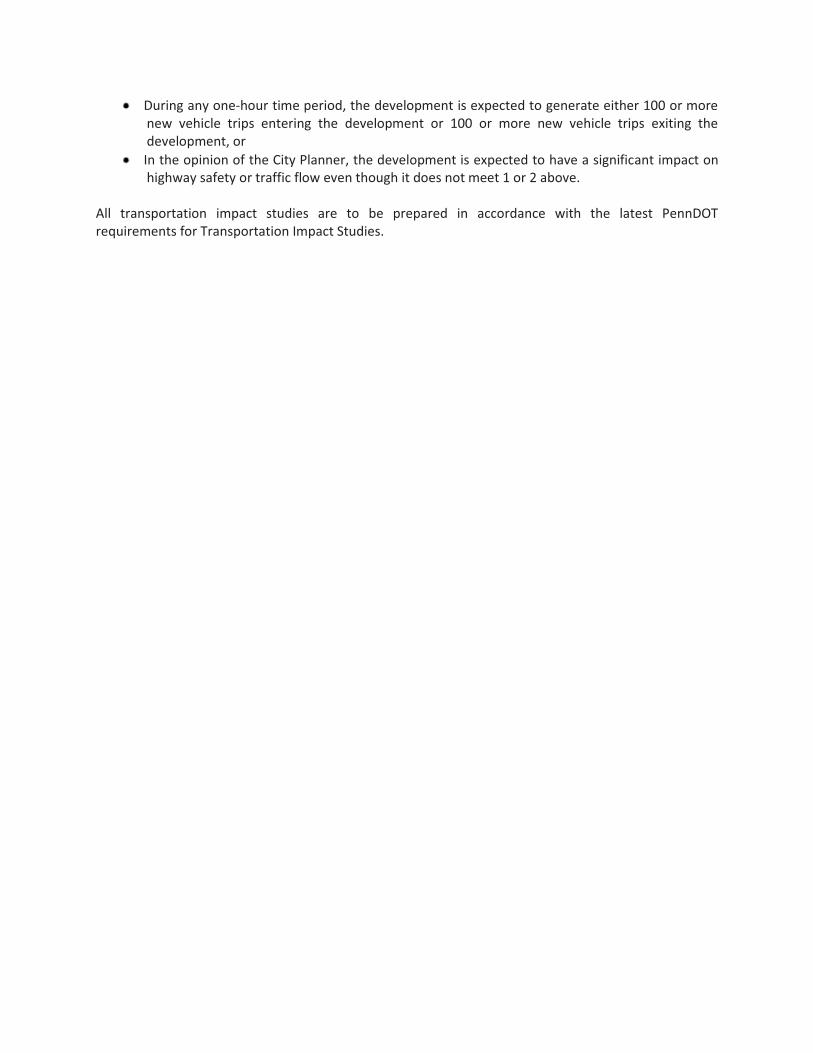
During any one-hour time period, the development is expected to generate either 100 or more new vehicle trips entering the development or 100 or more new vehicle trips exiting the development, or
In the opinion of the City Planner, the development is expected to have a significant impact on highway safety or traffic flow even though it does not meet 1 or 2 above.
All transportation impact studies are to be prepared in accordance with the latest PennDOT requirements for Transportation Impact Studies.
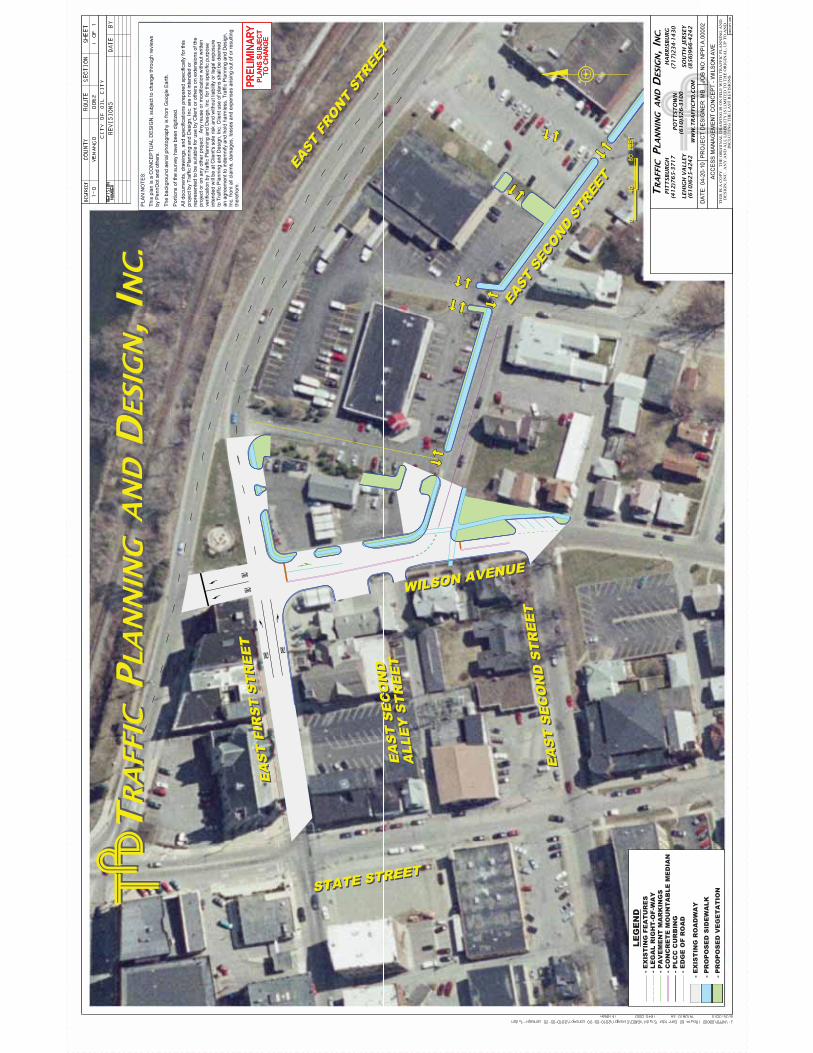
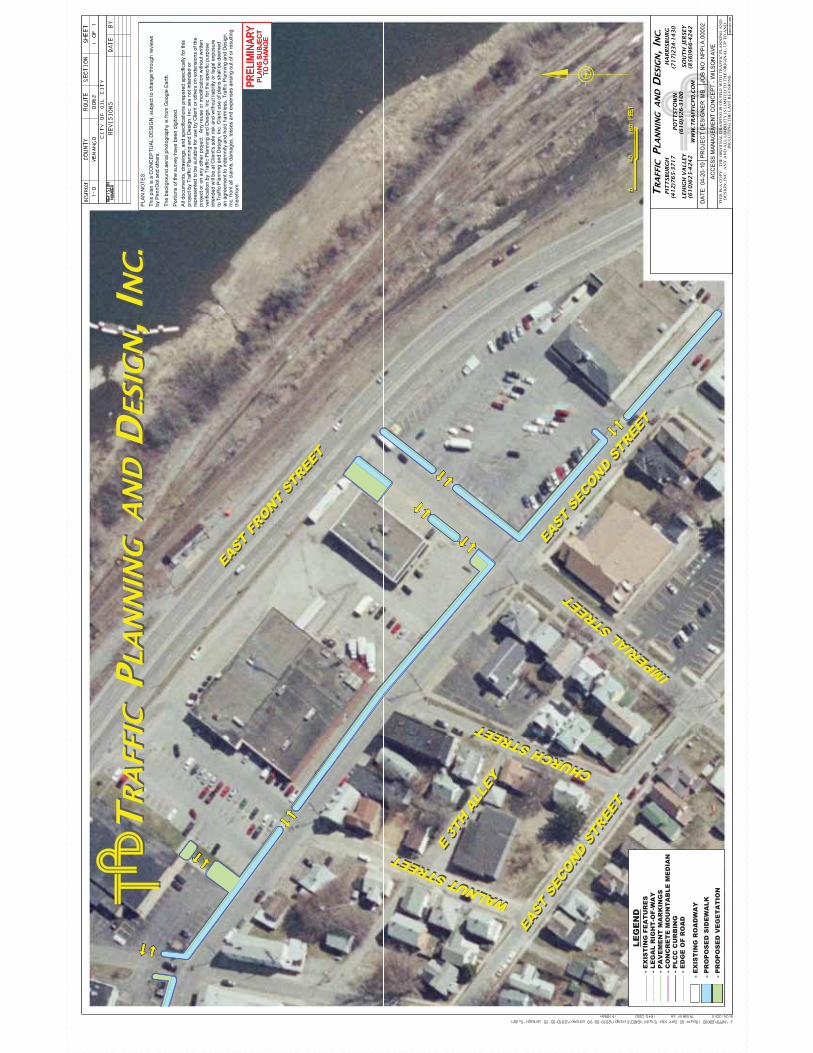


Appendix I
Route 62 Smart Transportation Corridor Study Final Report October 2010
Appendix I: Traffic Signal Warrant Analyses

FOUR HOUR VOLUME WARRANT

Municipality: Analyst:County: TPD Project #:
Condition:Lanes Speed
1 351
Left Thru Right Left Thru Right Left Thru Right Left Thru Right32 0 8 98 0 226 0 163 0 0 270 026 0 4 112 0 192 0 145 0 0 276 032 0 6 200 0 273 0 194 0 0 485 030 0 12 184 0 228 0 159 0 0 410 0
1 7:00-8:00 A.M.2 8:00-9:00 A.M.3 4:00-5:00 P.M.4 5:00-6:00 P.M.56
MUTCD Warrant 3 - Four Hour Volume
Major Street Volume Minor Street Volume Minor Street Warrant Meets Warrant?Results
Direction2009
Condition
North-SouthEast-West
M. MudryNPPD.A.00002
296679569
473yes
290324304
412
433421
7:00-8:00 A.M.8:00-9:00 A.M.
yesyes
189228
yes
NoNo
Southbound
Normal values apply
Hour
MUTCD Warrant 3 - Four Hour Volume
Volume Level Criteria1. Is the critical speed of major street > 40 mph?2. Is the intersection in a built-up area of isolated community of <10,000 population?
Eastbound Westbound Northbound
4:00-5:00 P.M.5:00-6:00 P.M.
Minor Street:Major Street:
Traffic Signal Warrant Summary
Petroleum StreetFront Street
Oil CityVenango
Street Name
12
3
4
0
100
200
300
400
500
300 500 700 900 1100 1300 1500
Min
or S
tree
t -H
igh
Volu
me
Appr
oach
(vph
)
Major Street - Total of Both Approaches (vph)
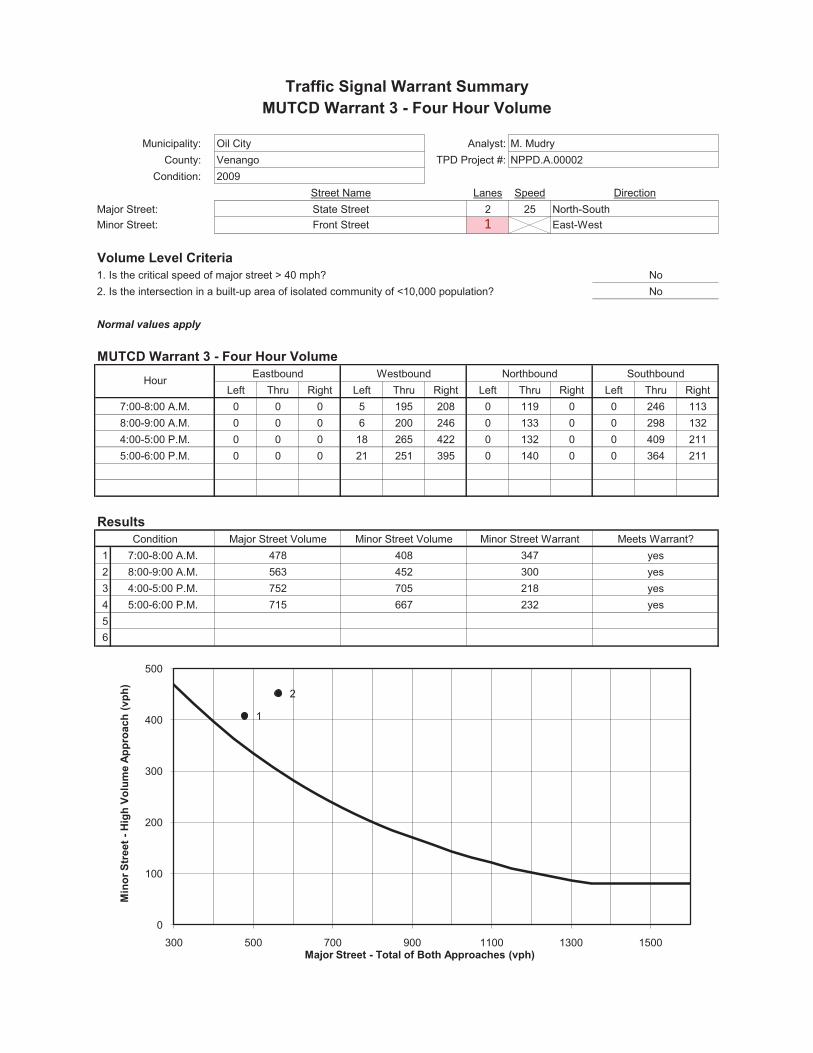
Municipality: Analyst:County: TPD Project #:
Condition:Lanes Speed
2 251
Left Thru Right Left Thru Right Left Thru Right Left Thru Right0 0 0 5 195 208 0 119 0 0 246 1130 0 0 6 200 246 0 133 0 0 298 1320 0 0 18 265 422 0 132 0 0 409 2110 0 0 21 251 395 0 140 0 0 364 211
1 7:00-8:00 A.M.2 8:00-9:00 A.M.3 4:00-5:00 P.M.4 5:00-6:00 P.M.56
Traffic Signal Warrant SummaryMUTCD Warrant 3 - Four Hour Volume
Oil City M. MudryVenango NPPD.A.000022009
Street Name DirectionMajor Street: State Street North-SouthMinor Street: Front Street East-West
Volume Level Criteria1. Is the critical speed of major street > 40 mph? No2. Is the intersection in a built-up area of isolated community of <10,000 population? No
Normal values apply
MUTCD Warrant 3 - Four Hour Volume
Hour Eastbound Westbound Northbound Southbound
7:00-8:00 A.M.8:00-9:00 A.M.4:00-5:00 P.M.5:00-6:00 P.M.
ResultsCondition Major Street Volume Minor Street Volume Minor Street Warrant Meets Warrant?
478 408 347 yes563 452 300 yes752 705 218 yes715 667 232 yes
1
2
0
100
200
300
400
500
300 500 700 900 1100 1300 1500
Min
or S
tree
t -H
igh
Volu
me
Appr
oach
(vph
)
Major Street - Total of Both Approaches (vph)
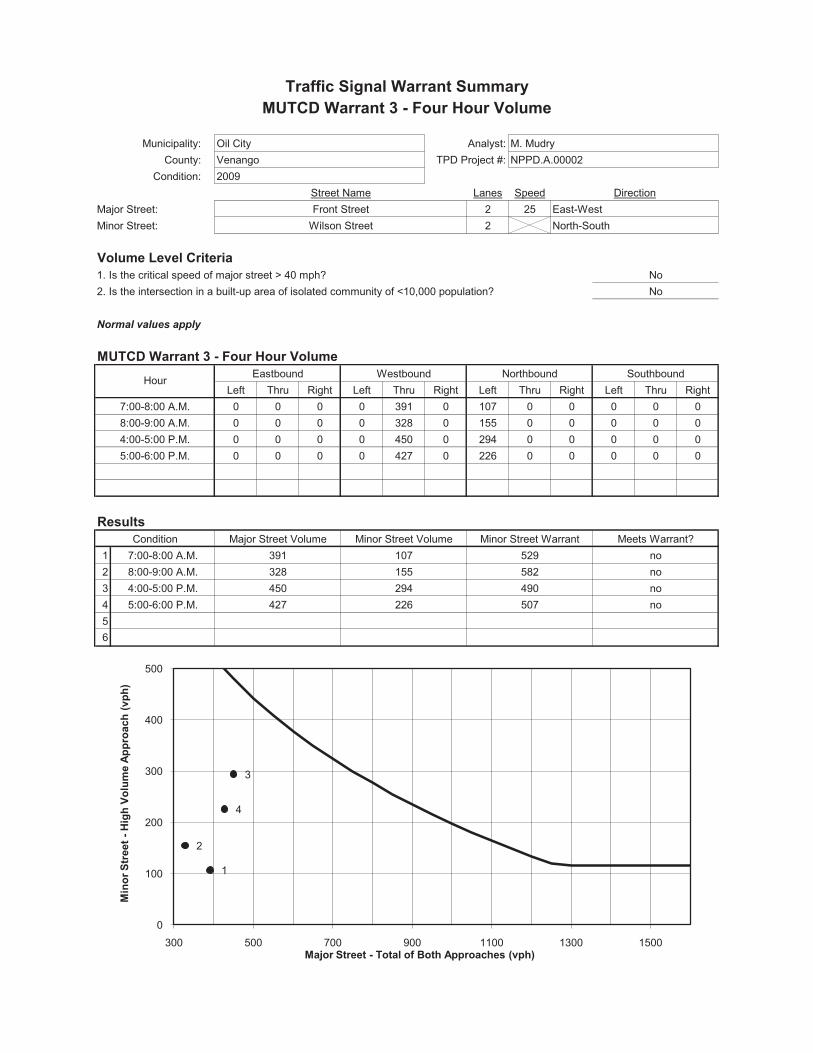
Municipality: Analyst:County: TPD Project #:
Condition:Lanes Speed
2 252
Left Thru Right Left Thru Right Left Thru Right Left Thru Right0 0 0 0 391 0 107 0 0 0 0 00 0 0 0 328 0 155 0 0 0 0 00 0 0 0 450 0 294 0 0 0 0 00 0 0 0 427 0 226 0 0 0 0 0
1 7:00-8:00 A.M.2 8:00-9:00 A.M.3 4:00-5:00 P.M.4 5:00-6:00 P.M.56
Traffic Signal Warrant SummaryMUTCD Warrant 3 - Four Hour Volume
Oil City M. MudryVenango NPPD.A.000022009
Street Name DirectionMajor Street: Front Street East-WestMinor Street: Wilson Street North-South
Volume Level Criteria1. Is the critical speed of major street > 40 mph? No2. Is the intersection in a built-up area of isolated community of <10,000 population? No
Normal values apply
MUTCD Warrant 3 - Four Hour Volume
Hour Eastbound Westbound Northbound Southbound
7:00-8:00 A.M.8:00-9:00 A.M.4:00-5:00 P.M.5:00-6:00 P.M.
ResultsCondition Major Street Volume Minor Street Volume Minor Street Warrant Meets Warrant?
391 107 529 no328 155 582 no450 294 490 no427 226 507 no
1
2
3
4
0
100
200
300
400
500
300 500 700 900 1100 1300 1500
Min
or S
tree
t -H
igh
Volu
me
Appr
oach
(vph
)
Major Street - Total of Both Approaches (vph)
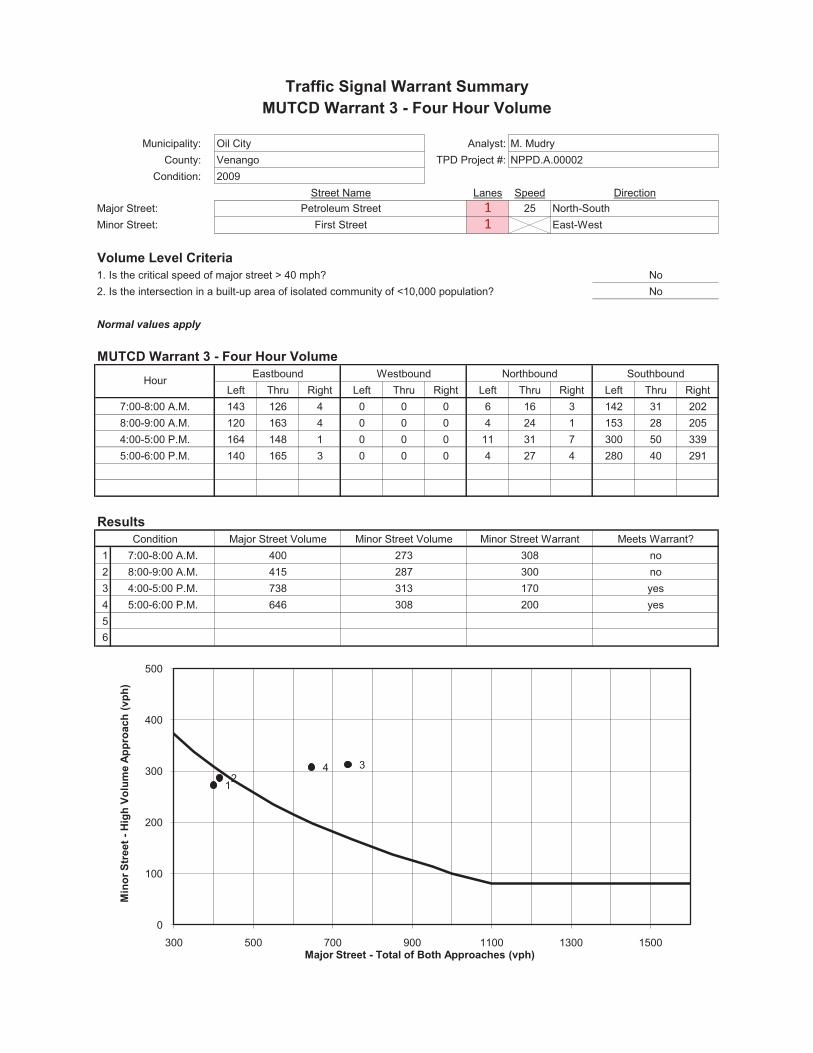
Municipality: Analyst:County: TPD Project #:
Condition:Lanes Speed
1 251
Left Thru Right Left Thru Right Left Thru Right Left Thru Right143 126 4 0 0 0 6 16 3 142 31 202120 163 4 0 0 0 4 24 1 153 28 205164 148 1 0 0 0 11 31 7 300 50 339140 165 3 0 0 0 4 27 4 280 40 291
1 7:00-8:00 A.M.2 8:00-9:00 A.M.3 4:00-5:00 P.M.4 5:00-6:00 P.M.56
Traffic Signal Warrant SummaryMUTCD Warrant 3 - Four Hour Volume
Oil City M. MudryVenango NPPD.A.000022009
Street Name DirectionMajor Street: Petroleum Street North-SouthMinor Street: First Street East-West
Volume Level Criteria1. Is the critical speed of major street > 40 mph? No2. Is the intersection in a built-up area of isolated community of <10,000 population? No
Normal values apply
MUTCD Warrant 3 - Four Hour Volume
Hour Eastbound Westbound Northbound Southbound
7:00-8:00 A.M.8:00-9:00 A.M.4:00-5:00 P.M.5:00-6:00 P.M.
ResultsCondition Major Street Volume Minor Street Volume Minor Street Warrant Meets Warrant?
400 273 308 no415 287 300 no738 313 170 yes646 308 200 yes
12
34
0
100
200
300
400
500
300 500 700 900 1100 1300 1500
Min
or S
tree
t -H
igh
Volu
me
Appr
oach
(vph
)
Major Street - Total of Both Approaches (vph)
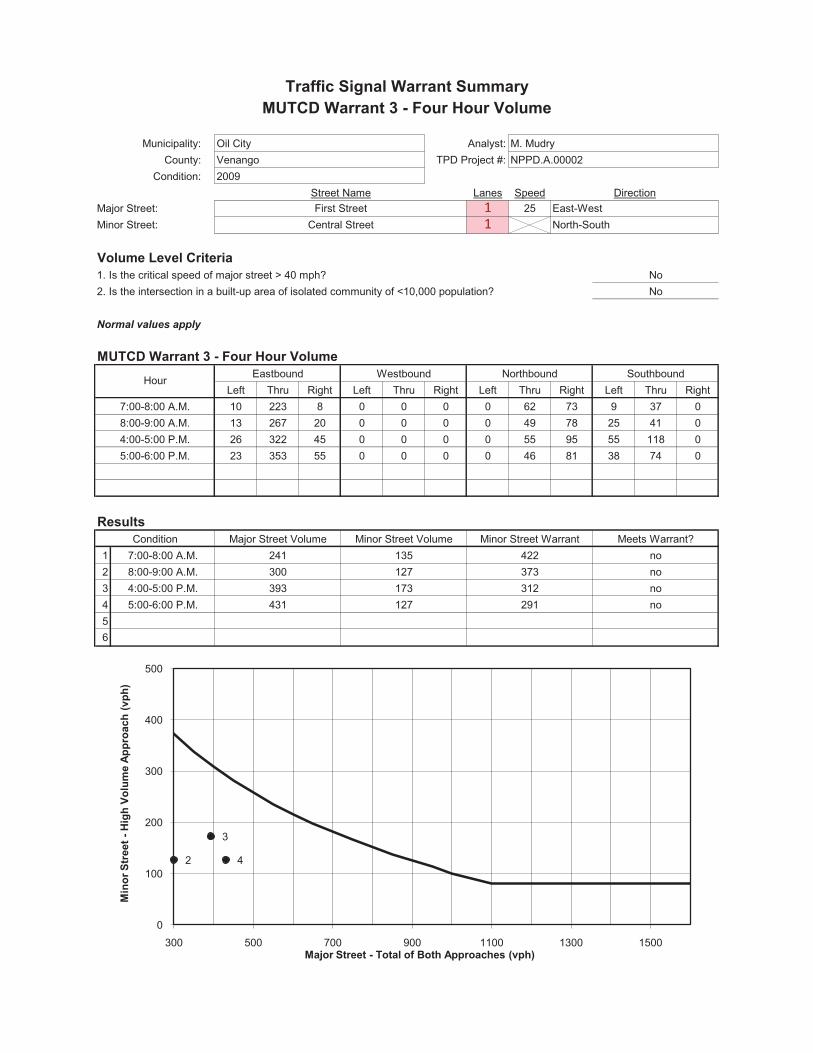
Municipality: Analyst:County: TPD Project #:
Condition:Lanes Speed
1 251
Left Thru Right Left Thru Right Left Thru Right Left Thru Right10 223 8 0 0 0 0 62 73 9 37 013 267 20 0 0 0 0 49 78 25 41 026 322 45 0 0 0 0 55 95 55 118 023 353 55 0 0 0 0 46 81 38 74 0
1 7:00-8:00 A.M.2 8:00-9:00 A.M.3 4:00-5:00 P.M.4 5:00-6:00 P.M.56
Traffic Signal Warrant SummaryMUTCD Warrant 3 - Four Hour Volume
Oil City M. MudryVenango NPPD.A.000022009
Street Name DirectionMajor Street: First Street East-WestMinor Street: Central Street North-South
Volume Level Criteria1. Is the critical speed of major street > 40 mph? No2. Is the intersection in a built-up area of isolated community of <10,000 population? No
Normal values apply
MUTCD Warrant 3 - Four Hour Volume
Hour Eastbound Westbound Northbound Southbound
7:00-8:00 A.M.8:00-9:00 A.M.4:00-5:00 P.M.5:00-6:00 P.M.
ResultsCondition Major Street Volume Minor Street Volume Minor Street Warrant Meets Warrant?
241 135 422 no300 127 373 no393 173 312 no431 127 291 no
2
3
4
0
100
200
300
400
500
300 500 700 900 1100 1300 1500
Min
or S
tree
t -H
igh
Volu
me
Appr
oach
(vph
)
Major Street - Total of Both Approaches (vph)
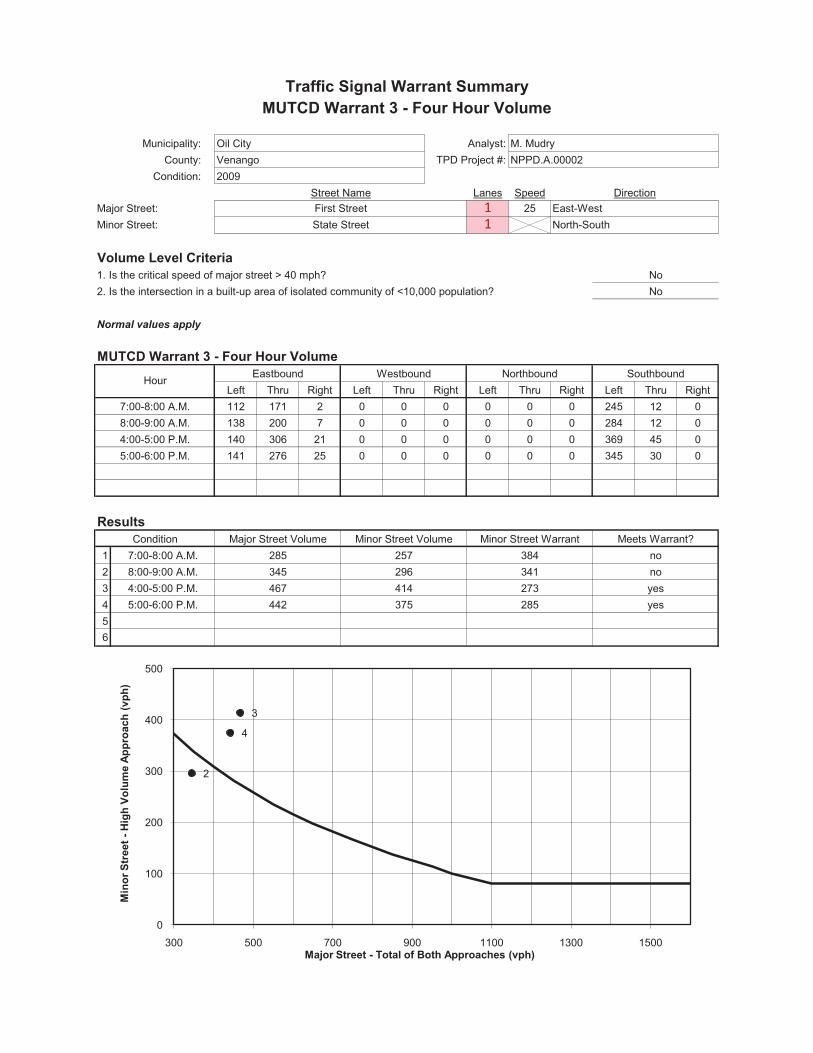
Municipality: Analyst:County: TPD Project #:
Condition:Lanes Speed
1 251
Left Thru Right Left Thru Right Left Thru Right Left Thru Right112 171 2 0 0 0 0 0 0 245 12 0138 200 7 0 0 0 0 0 0 284 12 0140 306 21 0 0 0 0 0 0 369 45 0141 276 25 0 0 0 0 0 0 345 30 0
1 7:00-8:00 A.M.2 8:00-9:00 A.M.3 4:00-5:00 P.M.4 5:00-6:00 P.M.56
Traffic Signal Warrant SummaryMUTCD Warrant 3 - Four Hour Volume
Oil City M. MudryVenango NPPD.A.000022009
Street Name DirectionMajor Street: First Street East-WestMinor Street: State Street North-South
Volume Level Criteria1. Is the critical speed of major street > 40 mph? No2. Is the intersection in a built-up area of isolated community of <10,000 population? No
Normal values apply
MUTCD Warrant 3 - Four Hour Volume
Hour Eastbound Westbound Northbound Southbound
7:00-8:00 A.M.8:00-9:00 A.M.4:00-5:00 P.M.5:00-6:00 P.M.
ResultsCondition Major Street Volume Minor Street Volume Minor Street Warrant Meets Warrant?
285 257 384 no345 296 341 no467 414 273 yes442 375 285 yes
2
3
4
0
100
200
300
400
500
300 500 700 900 1100 1300 1500
Min
or S
tree
t -H
igh
Volu
me
Appr
oach
(vph
)
Major Street - Total of Both Approaches (vph)
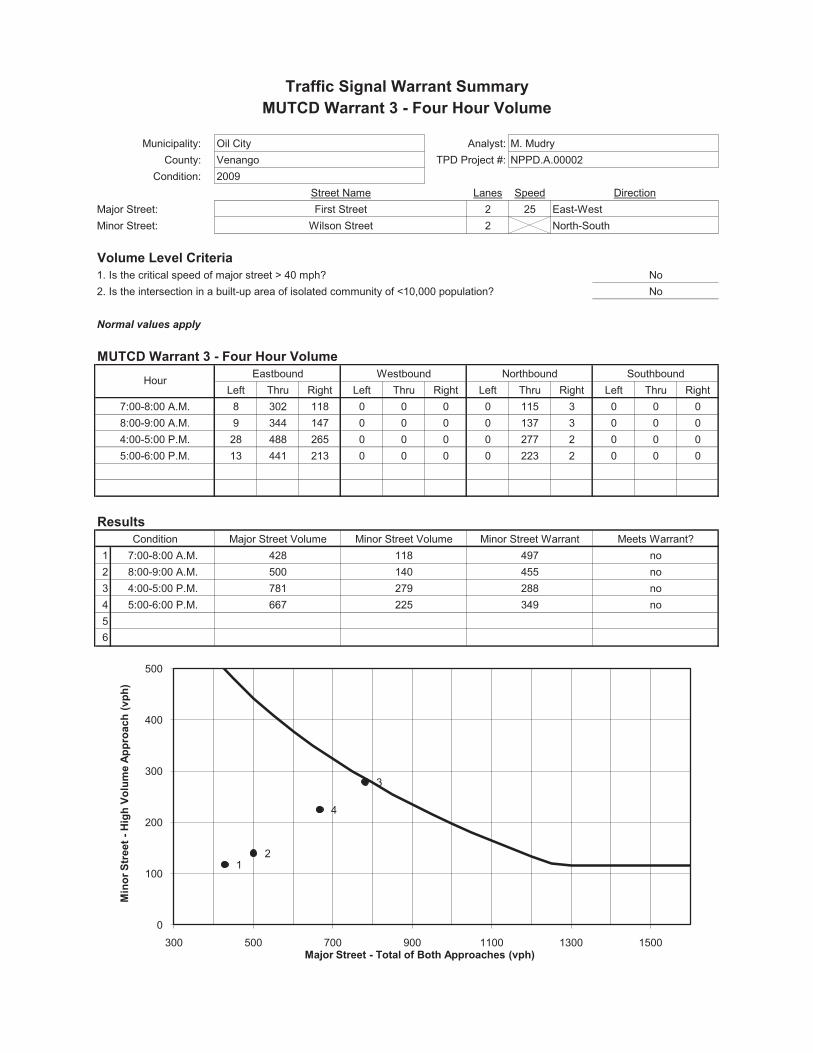
Municipality: Analyst:County: TPD Project #:
Condition:Lanes Speed
2 252
Left Thru Right Left Thru Right Left Thru Right Left Thru Right8 302 118 0 0 0 0 115 3 0 0 09 344 147 0 0 0 0 137 3 0 0 0
28 488 265 0 0 0 0 277 2 0 0 013 441 213 0 0 0 0 223 2 0 0 0
1 7:00-8:00 A.M.2 8:00-9:00 A.M.3 4:00-5:00 P.M.4 5:00-6:00 P.M.56
Traffic Signal Warrant SummaryMUTCD Warrant 3 - Four Hour Volume
Oil City M. MudryVenango NPPD.A.000022009
Street Name DirectionMajor Street: First Street East-WestMinor Street: Wilson Street North-South
Volume Level Criteria1. Is the critical speed of major street > 40 mph? No2. Is the intersection in a built-up area of isolated community of <10,000 population? No
Normal values apply
MUTCD Warrant 3 - Four Hour Volume
Hour Eastbound Westbound Northbound Southbound
7:00-8:00 A.M.8:00-9:00 A.M.4:00-5:00 P.M.5:00-6:00 P.M.
ResultsCondition Major Street Volume Minor Street Volume Minor Street Warrant Meets Warrant?
428 118 497 no500 140 455 no781 279 288 no667 225 349 no
12
3
4
0
100
200
300
400
500
300 500 700 900 1100 1300 1500
Min
or S
tree
t -H
igh
Volu
me
Appr
oach
(vph
)
Major Street - Total of Both Approaches (vph)

PEAK HOUR VOLUME WARRANT
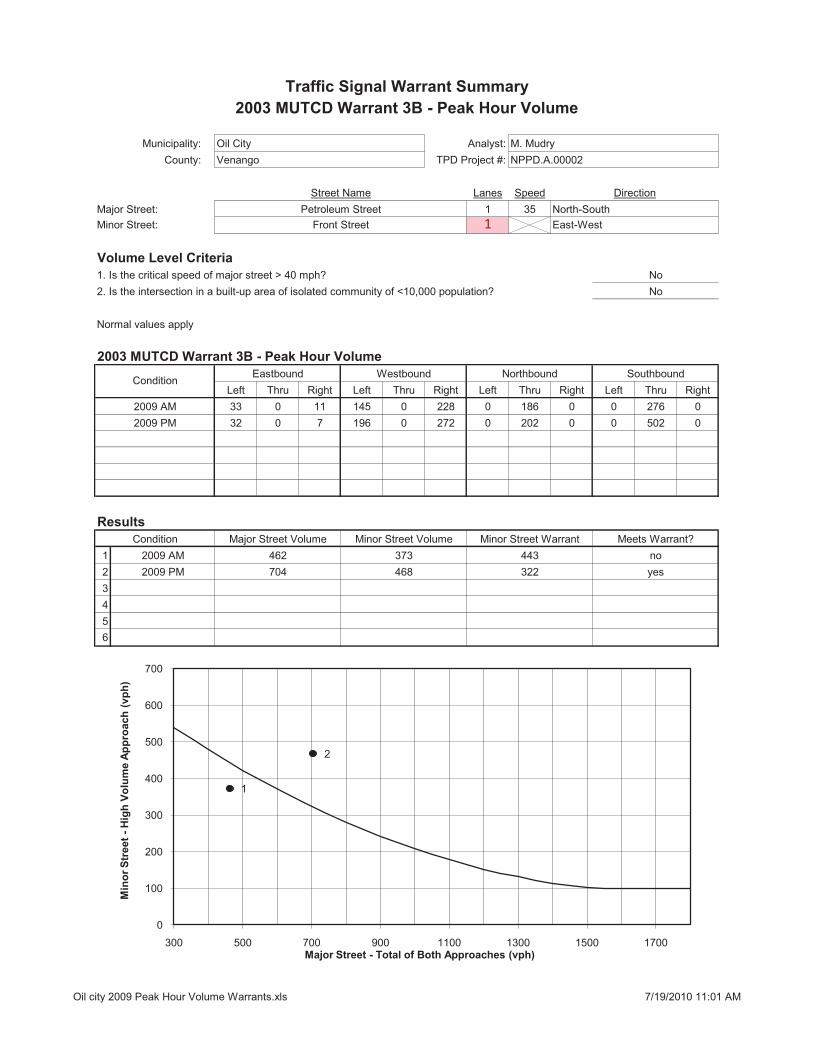
Municipality: Analyst:County: TPD Project #:
Lanes Speed1 351
Left Thru Right Left Thru Right Left Thru Right Left Thru Right33 0 11 145 0 228 0 186 0 0 276 032 0 7 196 0 272 0 202 0 0 502 0
1 2009 AM2 2009 PM3456
2009 PM
No
North-SouthEast-West
M. MudryNPPD.A.00002
2003 MUTCD Warrant 3B - Peak Hour Volume
100
Major Street Volume Minor Street Volume Minor Street Warrant443373
468462704
100
noyes
yesyes
100100
yesyes
322
Southbound
Normal values apply
Condition
Results
2009 AM
Condition
2003 MUTCD Warrant 3B - Peak Hour Volume
Volume Level Criteria1. Is the critical speed of major street > 40 mph?2. Is the intersection in a built-up area of isolated community of <10,000 population?
Eastbound Westbound Northbound
No
Meets Warrant?
Minor Street:Major Street:
Traffic Signal Warrant Summary
Petroleum StreetFront Street
Oil CityVenango
Street Name Direction
1
2
0
100
200
300
400
500
600
700
300 500 700 900 1100 1300 1500 1700
Min
or S
tree
t -H
igh
Volu
me
Appr
oach
(vph
)
Major Street - Total of Both Approaches (vph)
Oil city 2009 Peak Hour Volume Warrants.xls 7/19/2010 11:01 AM
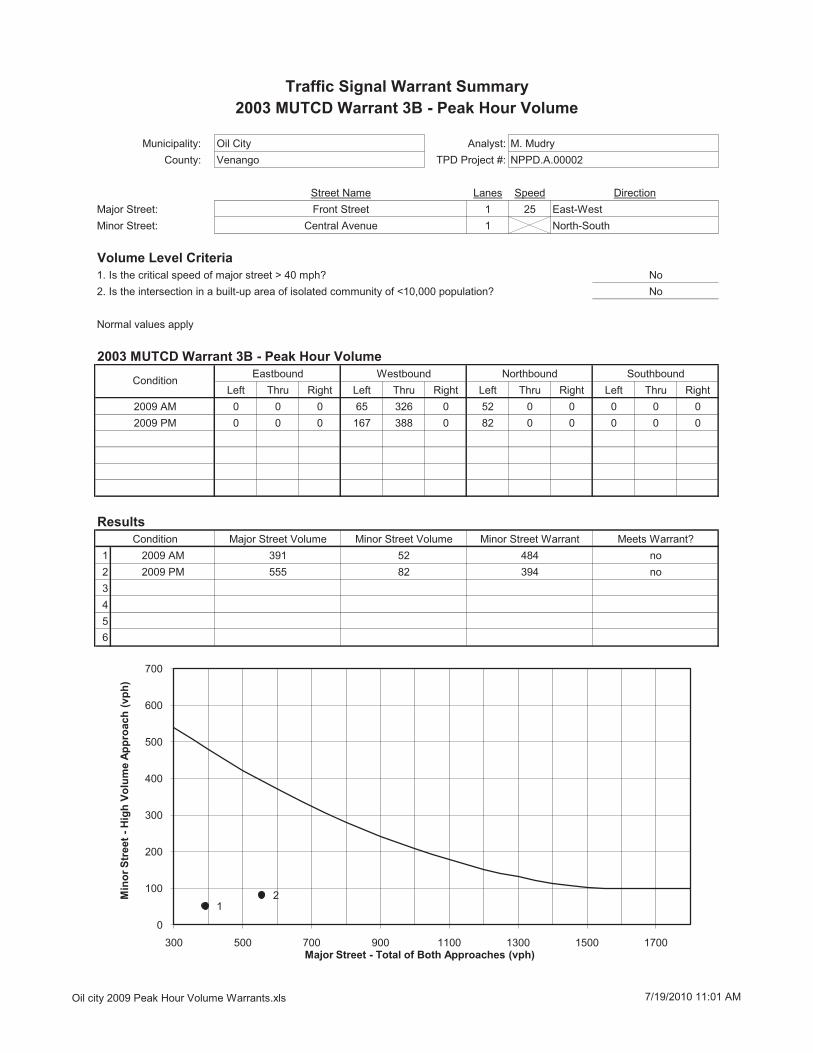
Municipality: Analyst:County: TPD Project #:
Lanes Speed1 251
Left Thru Right Left Thru Right Left Thru Right Left Thru Right0 0 0 65 326 0 52 0 0 0 0 00 0 0 167 388 0 82 0 0 0 0 0
1 2009 AM2 2009 PM3456
Traffic Signal Warrant Summary2003 MUTCD Warrant 3B - Peak Hour Volume
Oil City M. MudryVenango NPPD.A.00002
Street Name DirectionMajor Street: Front Street East-WestMinor Street: Central Avenue North-South
Volume Level Criteria1. Is the critical speed of major street > 40 mph? No2. Is the intersection in a built-up area of isolated community of <10,000 population? No
Normal values apply
2003 MUTCD Warrant 3B - Peak Hour Volume
Condition Eastbound Westbound Northbound Southbound
2009 AM2009 PM
ResultsCondition Major Street Volume Minor Street Volume Minor Street Warrant Meets Warrant?
391 52 484 no555 82 394 no
100 yes100 yes100 yes100 yes
12
0
100
200
300
400
500
600
700
300 500 700 900 1100 1300 1500 1700
Min
or S
tree
t -H
igh
Volu
me
Appr
oach
(vph
)
Major Street - Total of Both Approaches (vph)
Oil city 2009 Peak Hour Volume Warrants.xls 7/19/2010 11:01 AM

Municipality: Analyst:County: TPD Project #:
Lanes Speed2 251
Left Thru Right Left Thru Right Left Thru Right Left Thru Right0 0 0 6 235 323 0 133 0 0 289 1630 0 0 19 309 430 0 137 0 0 415 239
1 2009 AM2 2009 PM3456
Traffic Signal Warrant Summary2003 MUTCD Warrant 3B - Peak Hour Volume
Oil City M. MudryVenango NPPD.A.00002
Street Name DirectionMajor Street: State Street North-SouthMinor Street: Front Street East-West
Volume Level Criteria1. Is the critical speed of major street > 40 mph? No2. Is the intersection in a built-up area of isolated community of <10,000 population? No
Normal values apply
2003 MUTCD Warrant 3B - Peak Hour Volume
Condition Eastbound Westbound Northbound Southbound
2009 AM2009 PM
ResultsCondition Major Street Volume Minor Street Volume Minor Street Warrant Meets Warrant?
585 564 474 yes791 758 374 yes
100 yes100 yes100 yes100 yes
1
0
100
200
300
400
500
600
700
300 500 700 900 1100 1300 1500 1700
Min
or S
tree
t -H
igh
Volu
me
Appr
oach
(vph
)
Major Street - Total of Both Approaches (vph)
Oil city 2009 Peak Hour Volume Warrants.xls 7/19/2010 11:01 AM

Municipality: Analyst:County: TPD Project #:
Lanes Speed2 252
Left Thru Right Left Thru Right Left Thru Right Left Thru Right0 0 0 0 415 0 159 0 0 0 0 00 0 0 0 463 0 285 0 0 0 0 0
1 2009 AM2 2009 PM3456
Traffic Signal Warrant Summary2003 MUTCD Warrant 3B - Peak Hour Volume
Oil City M. MudryVenango NPPD.A.00002
Street Name DirectionMajor Street: Front Street East-WestMinor Street: Wilson Street North-South
Volume Level Criteria1. Is the critical speed of major street > 40 mph? No2. Is the intersection in a built-up area of isolated community of <10,000 population? No
Normal values apply
2003 MUTCD Warrant 3B - Peak Hour Volume
Condition Eastbound Westbound Northbound Southbound
2009 AM2009 PM
ResultsCondition Major Street Volume Minor Street Volume Minor Street Warrant Meets Warrant?
415 159 727 no463 285 693 no
150 yes150 yes150 yes150 yes
1
2
0
100
200
300
400
500
600
700
300 500 700 900 1100 1300 1500 1700
Min
or S
tree
t -H
igh
Volu
me
Appr
oach
(vph
)
Major Street - Total of Both Approaches (vph)
Oil city 2009 Peak Hour Volume Warrants.xls 7/19/2010 11:01 AM

Municipality: Analyst:County: TPD Project #:
Lanes Speed1 251
Left Thru Right Left Thru Right Left Thru Right Left Thru Right159 153 6 0 0 0 7 24 1 141 34 257174 151 3 0 0 0 6 34 6 318 52 341
1 2009 AM2 2009 PM3456
Traffic Signal Warrant Summary2003 MUTCD Warrant 3B - Peak Hour Volume
Oil City M. MudryVenango NPPD.A.00002
Street Name DirectionMajor Street: Petroleum Street North-SouthMinor Street: First Street East-West
Volume Level Criteria1. Is the critical speed of major street > 40 mph? No2. Is the intersection in a built-up area of isolated community of <10,000 population? No
Normal values apply
2003 MUTCD Warrant 3B - Peak Hour Volume
Condition Eastbound Westbound Northbound Southbound
2009 AM2009 PM
ResultsCondition Major Street Volume Minor Street Volume Minor Street Warrant Meets Warrant?
464 318 442 no757 328 299 yes
100 yes100 yes100 yes100 yes
1 2
0
100
200
300
400
500
600
700
300 500 700 900 1100 1300 1500 1700
Min
or S
tree
t -H
igh
Volu
me
Appr
oach
(vph
)
Major Street - Total of Both Approaches (vph)
Oil city 2009 Peak Hour Volume Warrants.xls 7/19/2010 11:01 AM
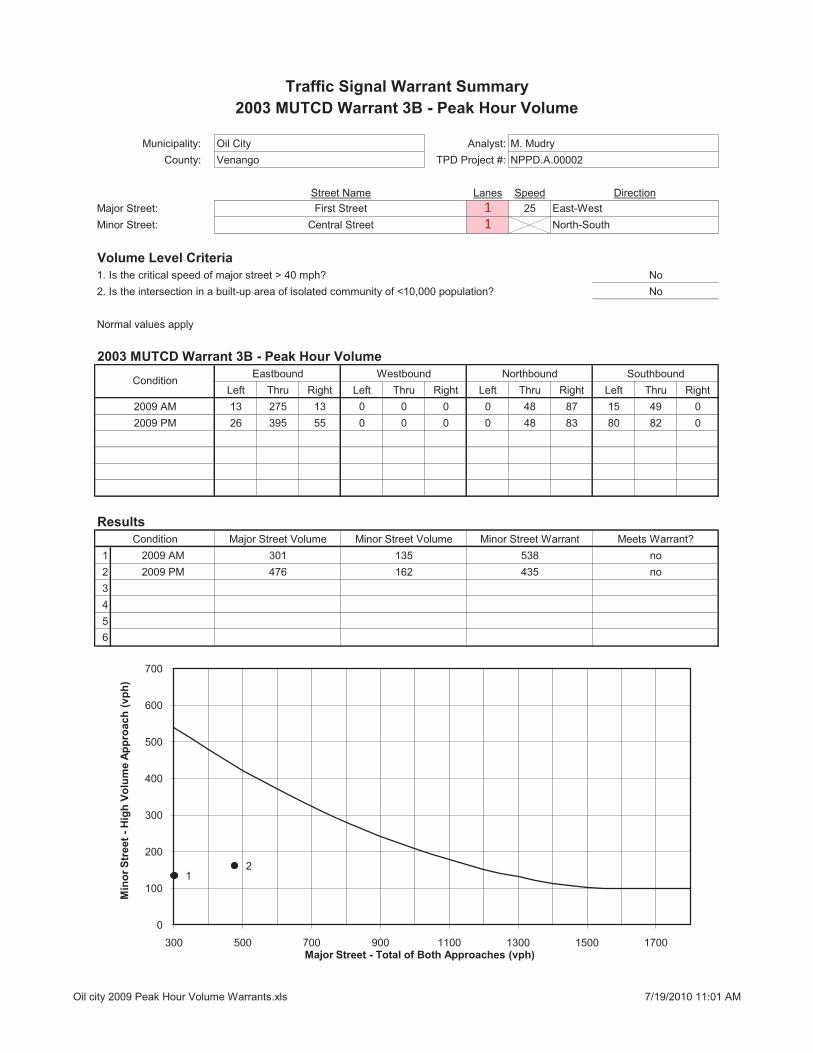
Municipality: Analyst:County: TPD Project #:
Lanes Speed1 251
Left Thru Right Left Thru Right Left Thru Right Left Thru Right13 275 13 0 0 0 0 48 87 15 49 026 395 55 0 0 0 0 48 83 80 82 0
1 2009 AM2 2009 PM3456
Traffic Signal Warrant Summary2003 MUTCD Warrant 3B - Peak Hour Volume
Oil City M. MudryVenango NPPD.A.00002
Street Name DirectionMajor Street: First Street East-WestMinor Street: Central Street North-South
Volume Level Criteria1. Is the critical speed of major street > 40 mph? No2. Is the intersection in a built-up area of isolated community of <10,000 population? No
Normal values apply
2003 MUTCD Warrant 3B - Peak Hour Volume
Condition Eastbound Westbound Northbound Southbound
2009 AM2009 PM
ResultsCondition Major Street Volume Minor Street Volume Minor Street Warrant Meets Warrant?
301 135 538 no476 162 435 no
100 yes100 yes100 yes100 yes
12
0
100
200
300
400
500
600
700
300 500 700 900 1100 1300 1500 1700
Min
or S
tree
t -H
igh
Volu
me
Appr
oach
(vph
)
Major Street - Total of Both Approaches (vph)
Oil city 2009 Peak Hour Volume Warrants.xls 7/19/2010 11:01 AM

Municipality: Analyst:County: TPD Project #:
Lanes Speed1 251
Left Thru Right Left Thru Right Left Thru Right Left Thru Right138 260 7 0 0 0 0 0 0 284 12 0142 390 23 0 0 0 0 0 0 383 44 0
1 2009 AM2 2009 PM3456
Traffic Signal Warrant Summary2003 MUTCD Warrant 3B - Peak Hour Volume
Oil City M. MudryVenango NPPD.A.00002
Street Name DirectionMajor Street: First Street East-WestMinor Street: State Street North-South
Volume Level Criteria1. Is the critical speed of major street > 40 mph? No2. Is the intersection in a built-up area of isolated community of <10,000 population? No
Normal values apply
2003 MUTCD Warrant 3B - Peak Hour Volume
Condition Eastbound Westbound Northbound Southbound
2009 AM2009 PM
ResultsCondition Major Street Volume Minor Street Volume Minor Street Warrant Meets Warrant?
405 296 476 no555 427 394 yes
100 yes100 yes100 yes100 yes
1
2
0
100
200
300
400
500
600
700
300 500 700 900 1100 1300 1500 1700
Min
or S
tree
t -H
igh
Volu
me
Appr
oach
(vph
)
Major Street - Total of Both Approaches (vph)
Oil city 2009 Peak Hour Volume Warrants.xls 7/19/2010 11:01 AM

Municipality: Analyst:County: TPD Project #:
Lanes Speed2 252
Left Thru Right Left Thru Right Left Thru Right Left Thru Right12 374 150 0 0 0 0 147 2 0 0 028 488 265 0 0 0 0 257 2 0 0 0
1 2009 AM2 2009 PM3456
Traffic Signal Warrant Summary2003 MUTCD Warrant 3B - Peak Hour Volume
Oil City M. MudryVenango NPPD.A.00002
Street Name DirectionMajor Street: First Street East-WestMinor Street: Wilson Street North-South
Volume Level Criteria1. Is the critical speed of major street > 40 mph? No2. Is the intersection in a built-up area of isolated community of <10,000 population? No
Normal values apply
2003 MUTCD Warrant 3B - Peak Hour Volume
Condition Eastbound Westbound Northbound Southbound
2009 AM2009 PM
ResultsCondition Major Street Volume Minor Street Volume Minor Street Warrant Meets Warrant?
536 149 643 no781 259 491 no
150 yes150 yes150 yes150 yes
1
2
0
100
200
300
400
500
600
700
300 500 700 900 1100 1300 1500 1700
Min
or S
tree
t -H
igh
Volu
me
Appr
oach
(vph
)
Major Street - Total of Both Approaches (vph)
Oil city 2009 Peak Hour Volume Warrants.xls 7/19/2010 11:01 AM
Route 62Smart Transportation Study
imagination. innovation. involvement. impact.
October 2010