Embed Size (px)
Citation preview

2010 results presentationMonday 28 February 2011
Forward-looking statements
Except for the historical information contained herein, the matters discussed in this presentation include forward-looking statements. In particular, all statements that express forecasts, expectations and projections with respect to future matters, including trends in results of operations, margins, growth rates, overall market trends, the impact of interest or exchange rates, the availability of financing, anticipated costs savings and synergies and the execution of Pearson's strategy, are forward looking statements. By their nature, forward looking statements involve risks and uncertainties because they relate to events and depend on circumstances that will occur in future.
There are a number of factors which could cause actual results and developments to differ materially from those expressed or implied by these forward looking statements, including a number of factors outside Pearson's control. These include international, national and local conditions, as well as competition. They also include other risks detailed from time to time in the company's publicly-filed documents.
Any forward looking statements speak only as of the date they are made, and Pearson gives no undertaking to update forward-looking statements to reflect any changes in its expectations with regard thereto or any changes to events, conditions or circumstances on which any such statement is based.

Highlights
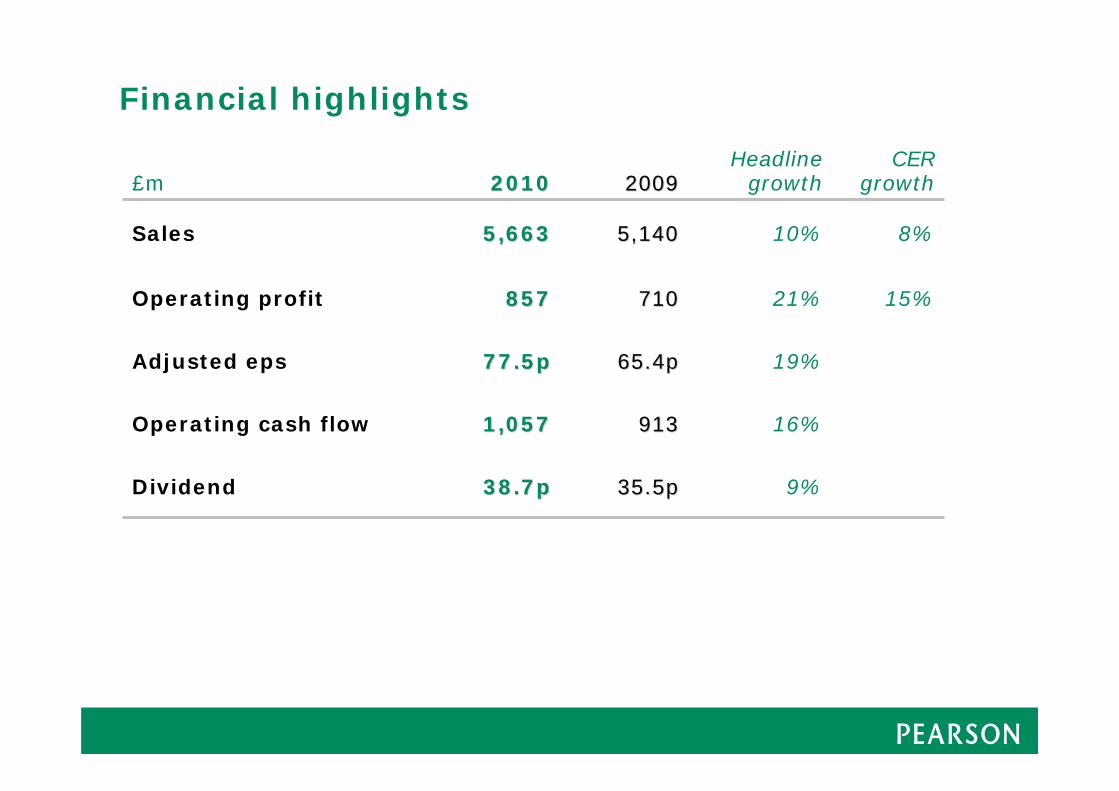
Financial highlights
£m 20102010 20092009Headline
growthCER
growth
Sales 5,6635,663 5,1405,140 10% 8%
Operating profit 857857 710710 21% 15%
Adjusted eps 77.5p77.5p 65.4p65.4p 19%
Operating cash flow 1,0571,057 913913 16%
Dividend 38.7p38.7p 35.5p35.5p 9%
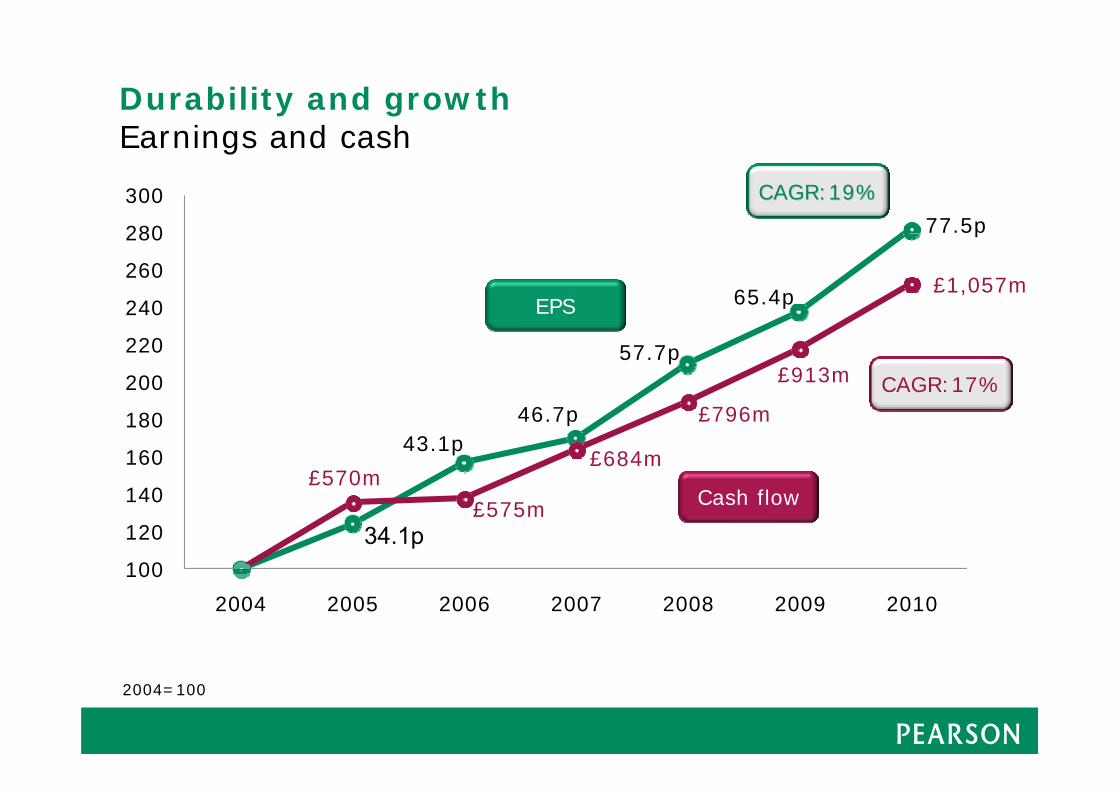
Durability and growthEarnings and cash
100
120
140
160
180
200
220
240
260
280
300
2004 2005 2006 2007 2008 2009 2010
£913m
65.4p
£796m
£684m
£575m£570m
57.7p
46.7p43.1p
34.1pCash flow
EPS
CAGR:19%CAGR:19%
CAGR:17%
£1,057m
77.5p
2004=100
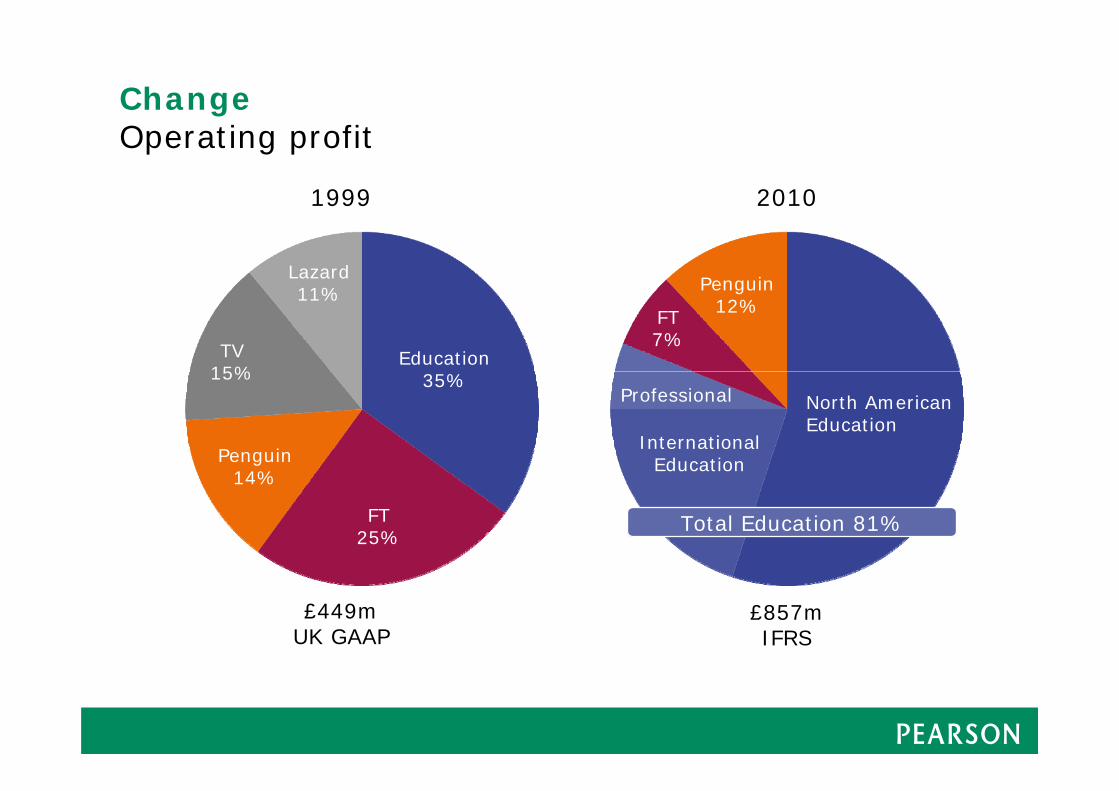
ChangeOperating profit
2010
£857mIFRS
1999
£449mUK GAAP
Education35%
FT25%
Penguin14%
TV15%
Lazard11%
FT 7%
Penguin12%
North AmericanEducation
InternationalEducation
Professional
Total Education 81%
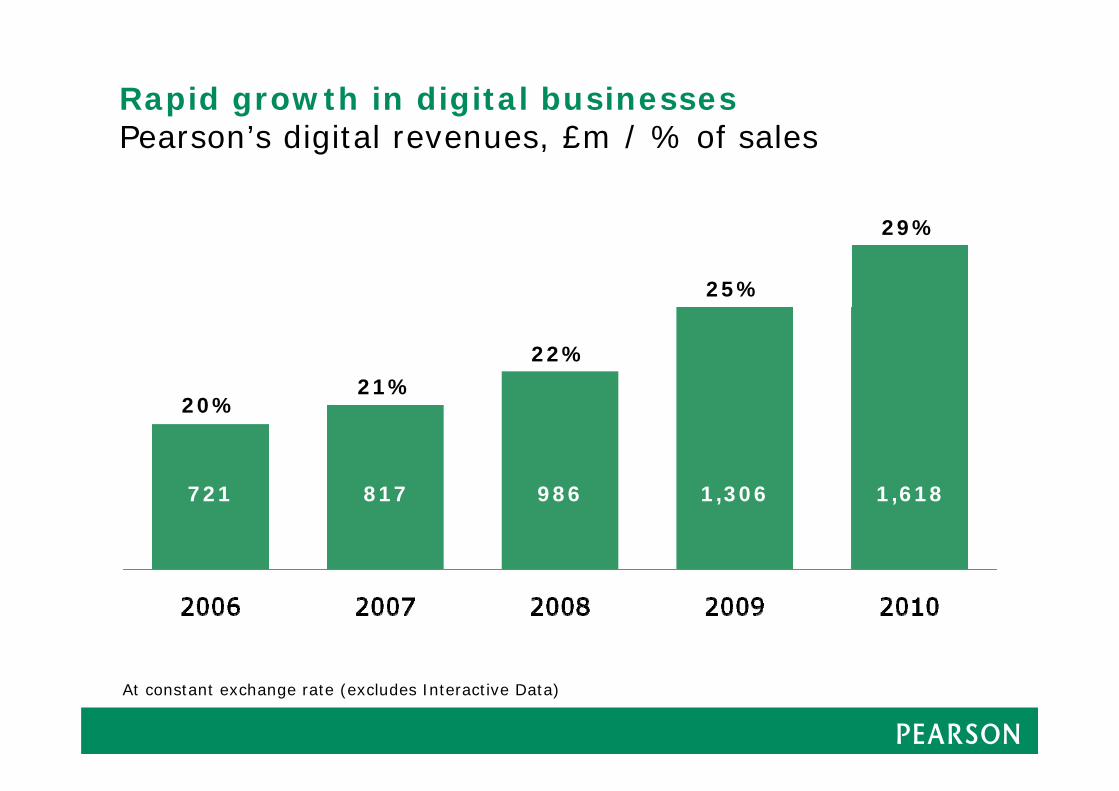
Rapid growth in digital businessesPearson’s digital revenues, £m / % of sales
721 817 986
20%21%
22%
25%
1,306
At constant exchange rate (excludes Interactive Data)
1,618
29%
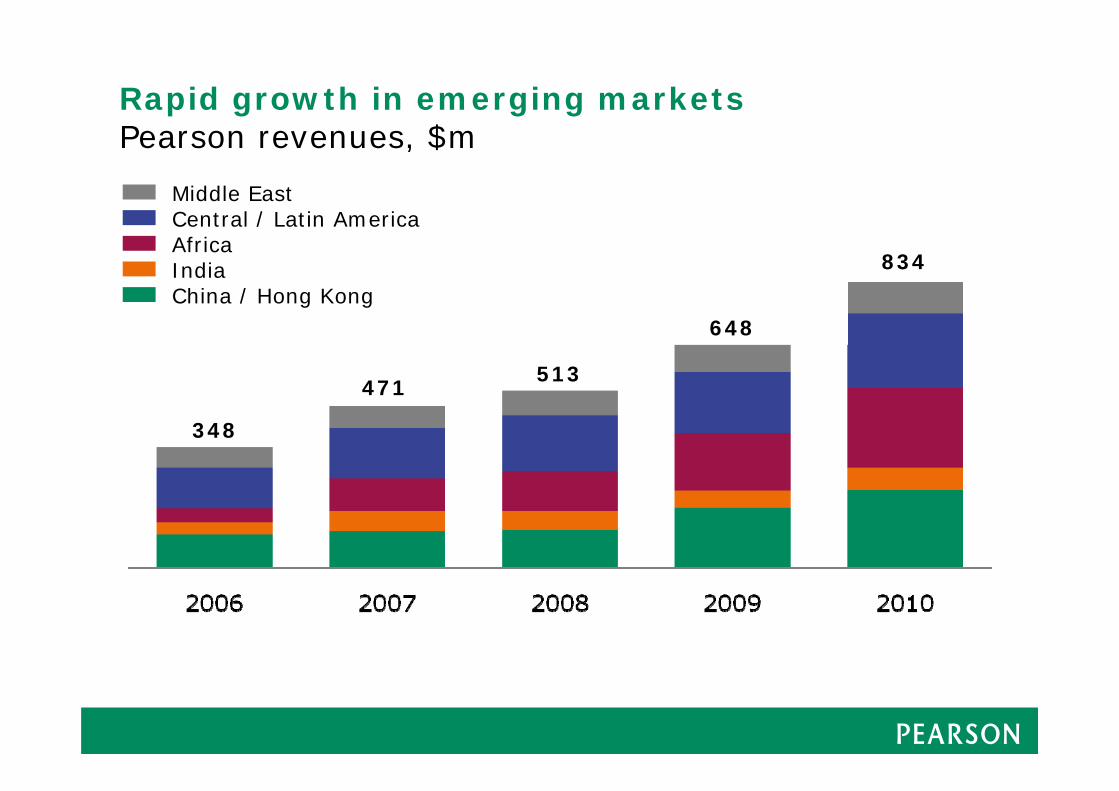
Rapid growth in emerging marketsPearson revenues, $m
Middle EastCentral / Latin AmericaAfricaIndiaChina / Hong Kong
834
348
471513
648
Financial review
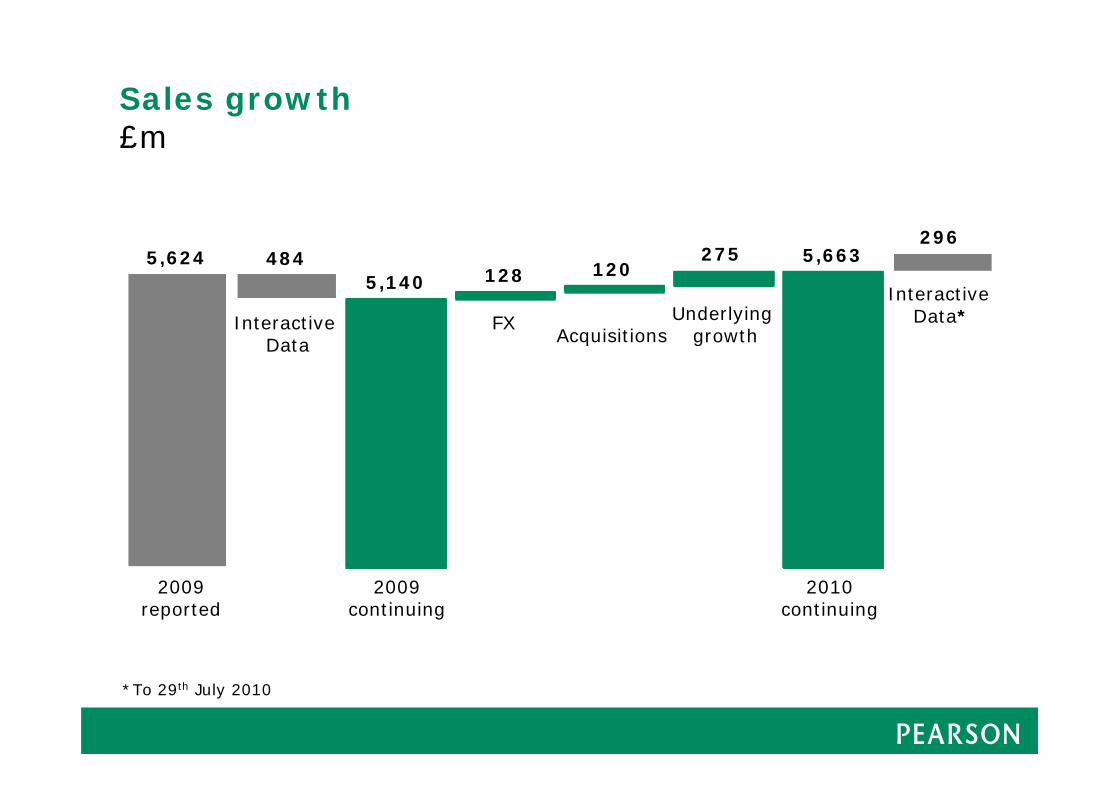
Sales growth£m
5,6245,140
FX
275
Acquisitions
120
Underlying growth
484
Interactive Data
2010continuing
128
2009reported
2009continuing
2965,663
Interactive Data*
*To 29th July 2010
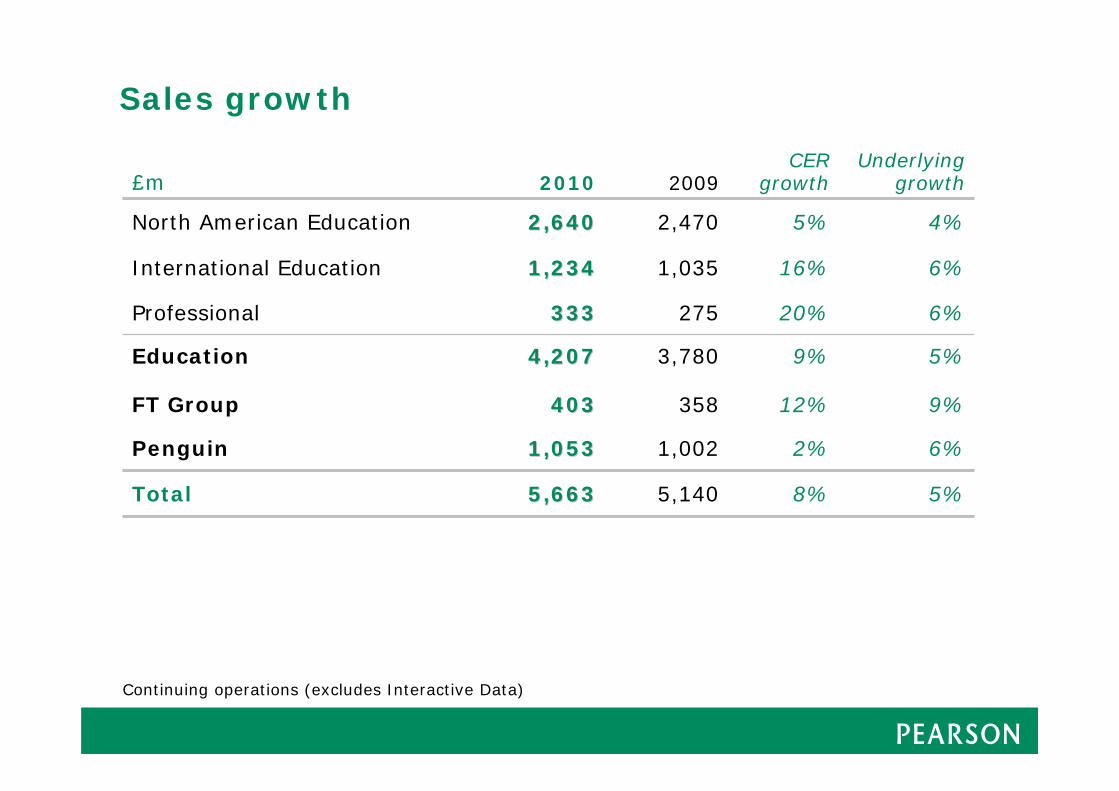
Sales growth
£m 2010 2009CER
growthUnderlying
growth
North American Education 2,6402,640 2,470 5% 4%
International Education 1,2341,234 1,035 16% 6%
Professional 333333 275 20% 6%
Education
FT Group
4,2074,207
403403
3,780
358
9%
12%
5%
9%
Penguin 1,0531,053 1,002 2% 6%
Total 5,6635,663 5,140 8% 5%
Continuing operations (excludes Interactive Data)
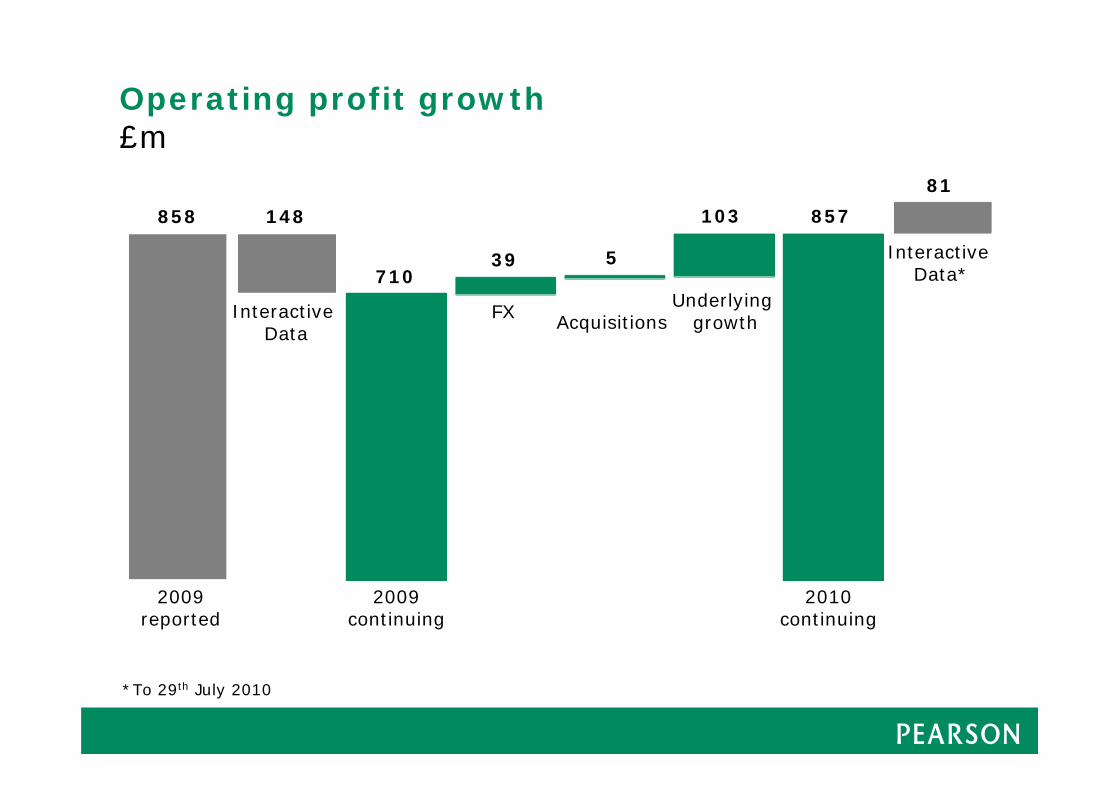
Operating profit growth£m
858
710
FX
103
5
148
Interactive Data
39
857
2009reported
2009continuing
2010continuing
81
Interactive Data*
*To 29th July 2010
AcquisitionsUnderlying
growth
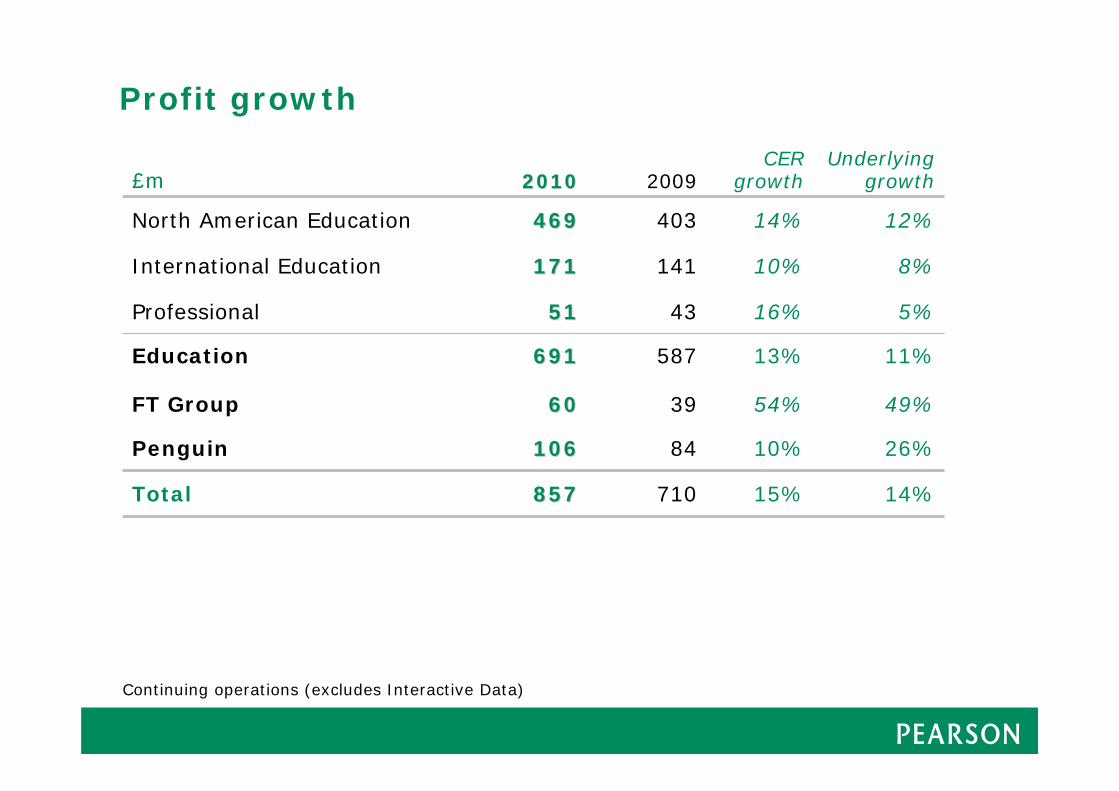
Profit growth
£m 20102010 2009CER
growthUnderlying
growth
North American Education 469469 403 14% 12%
International Education 171171 141 10% 8%
Professional 5151 43 16% 5%
Education
FT Group
691691
6060
587
39
13%
54%
11%
49%
Penguin 106106 84 10% 26%
Total 857857 710 15% 14%
Continuing operations (excludes Interactive Data)
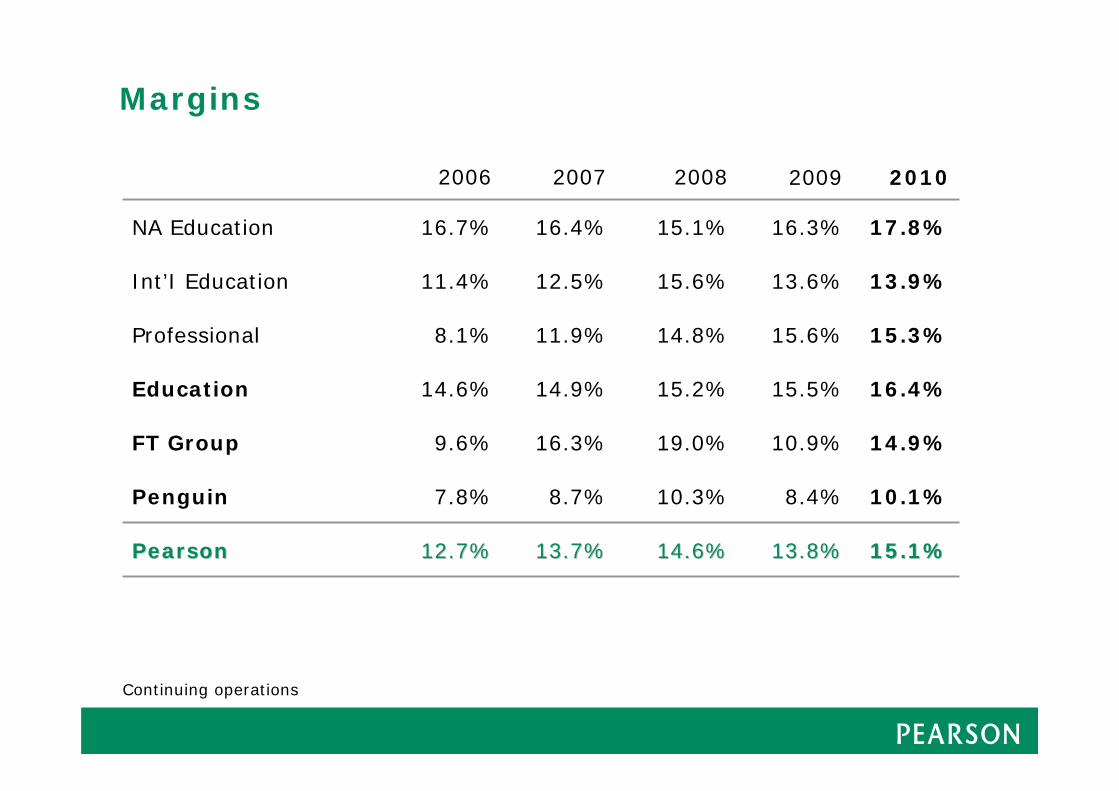
Margins
Continuing operations
2006 2007 2008 2009 2010
NA Education 16.7% 16.4% 15.1% 16.3% 17.8%
Int’I Education 11.4% 12.5% 15.6% 13.6% 13.9%
Professional 8.1% 11.9% 14.8% 15.6% 15.3%
Education 14.6% 14.9% 15.2% 15.5% 16.4%
FT Group 9.6% 16.3% 19.0% 10.9% 14.9%
Penguin 7.8% 8.7% 10.3% 8.4% 10.1%
PearsonPearson 12.7%12.7% 13.7%13.7% 14.6%14.6% 13.8%13.8% 15.1%15.1%
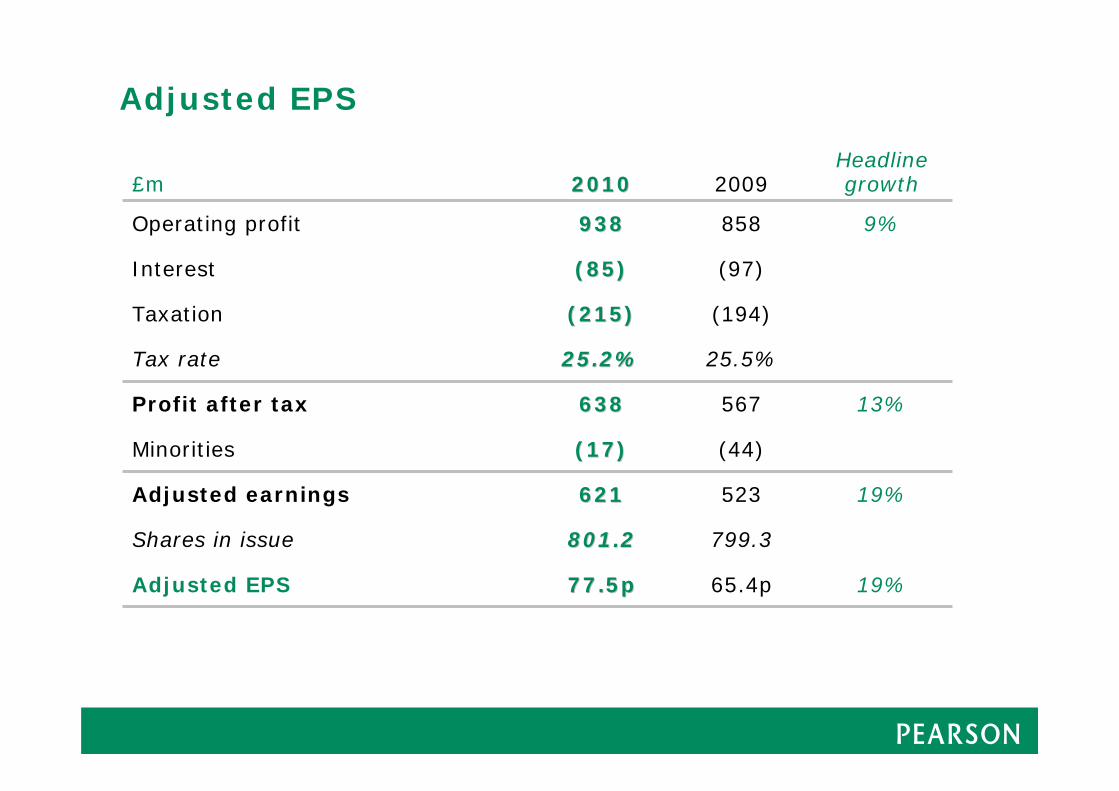
Adjusted EPS
£m 20102010 2009Headline growth
Operating profit 938938 858 9%
Interest (85)(85) (97)
Taxation (215)(215) (194)
Tax rate 25.2%25.2% 25.5%
Profit after tax 638638 567 13%
Minorities (17)(17) (44)
Adjusted earnings 621621 523 19%
Shares in issue 801.2801.2 799.3
Adjusted EPS 77.5p77.5p 65.4p 19%
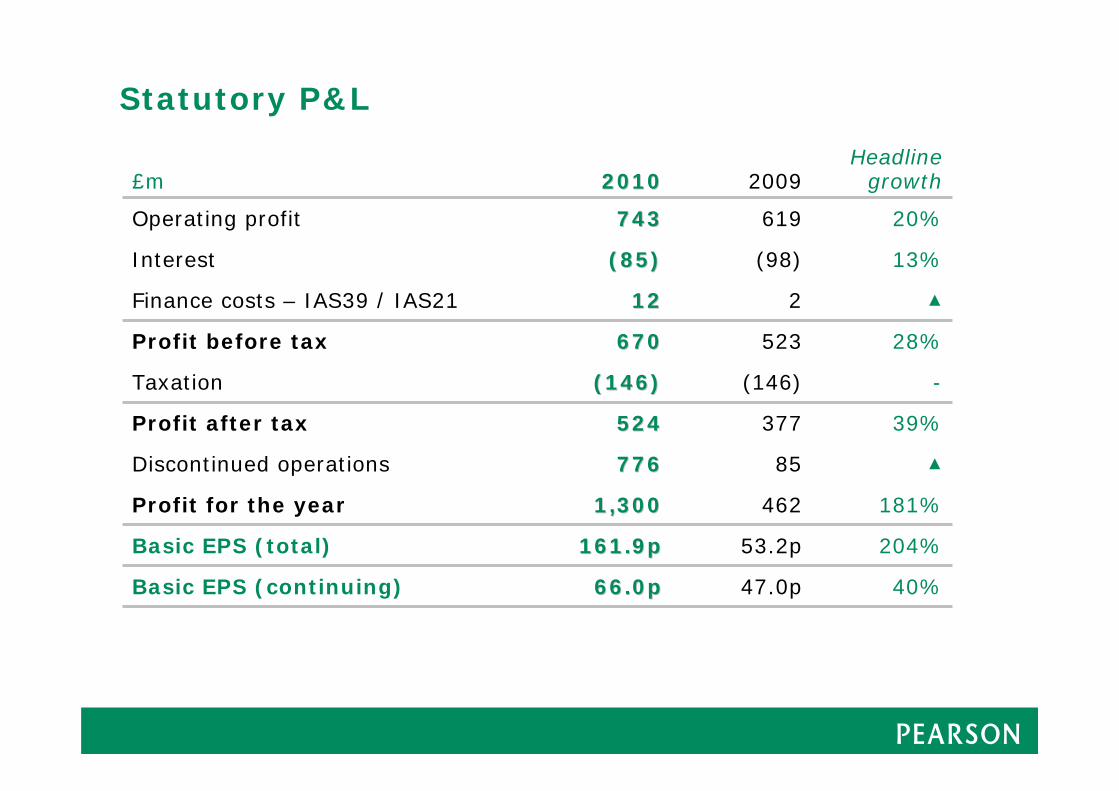
Statutory P&L
£m 20102010 2009Headline
growth
Operating profit 743743 619 20%
Interest (85)(85) (98) 13%
Finance costs – IAS39 / IAS21 1212 2 ▲
Profit before tax 670670 523 28%
Taxation (146)(146) (146) -
Profit after tax 524524 377 39%
Discontinued operations 776776 85 ▲
Profit for the year 1,3001,300 462 181%
Basic EPS (total) 161.9p161.9p 53.2p 204%
Basic EPS (continuing) 66.0p66.0p 47.0p 40%
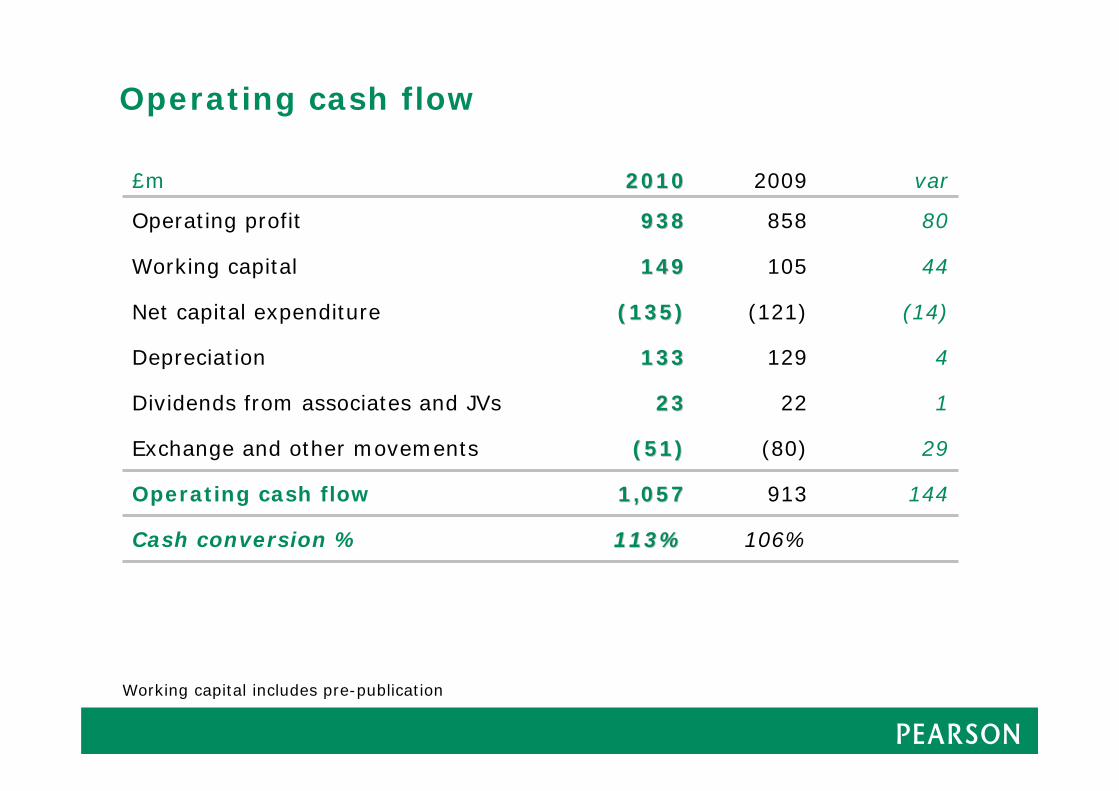
Operating cash flow
Working capital includes pre-publication
£m 20102010 2009 var
Operating profit 938938 858 80
Working capital 149149 105 44
Net capital expenditure (135)(135) (121) (14)
Depreciation 133133 129 4
Dividends from associates and JVs 2323 22 1
Exchange and other movements (51)(51) (80) 29
Operating cash flow 1,0571,057 913 144
Cash conversion % 113%113% 106%
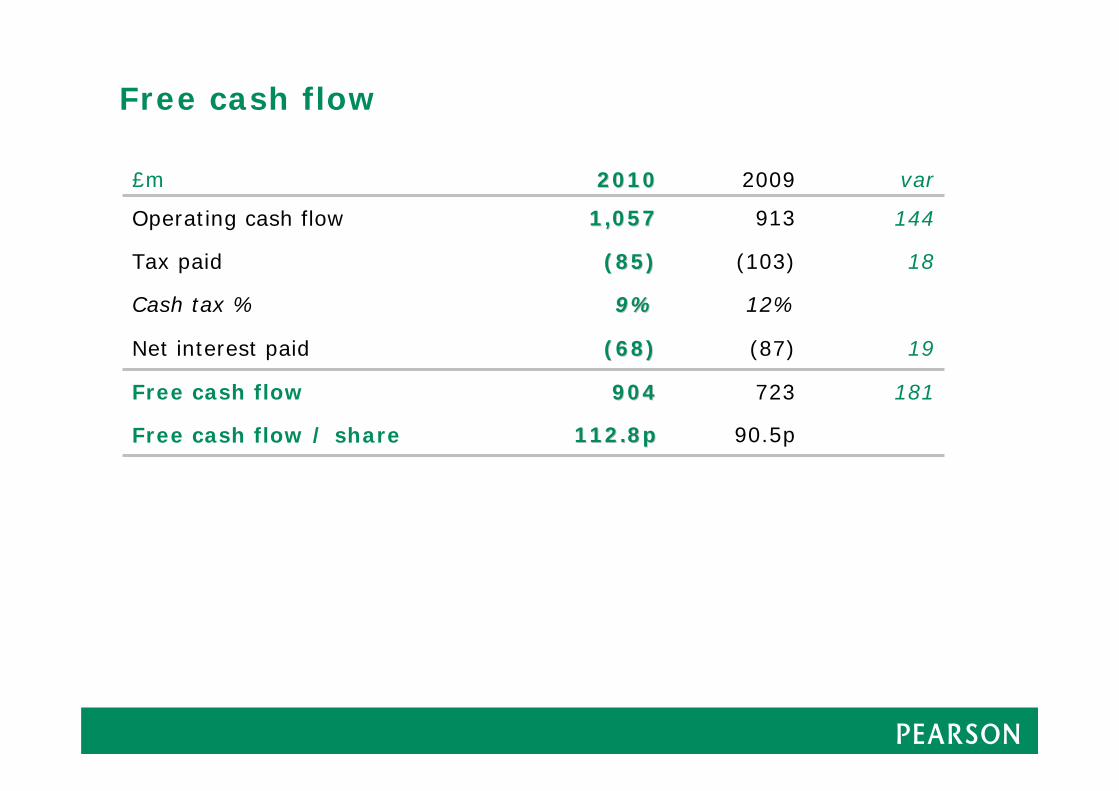
Free cash flow
£m 20102010 2009 var
Operating cash flow 1,0571,057 913 144
Tax paid (85)(85) (103) 18
Cash tax % 9%9% 12%
Net interest paid (68)(68) (87) 19
Free cash flow 904904 723 181
Free cash flow / share 112.8p112.8p 90.5p
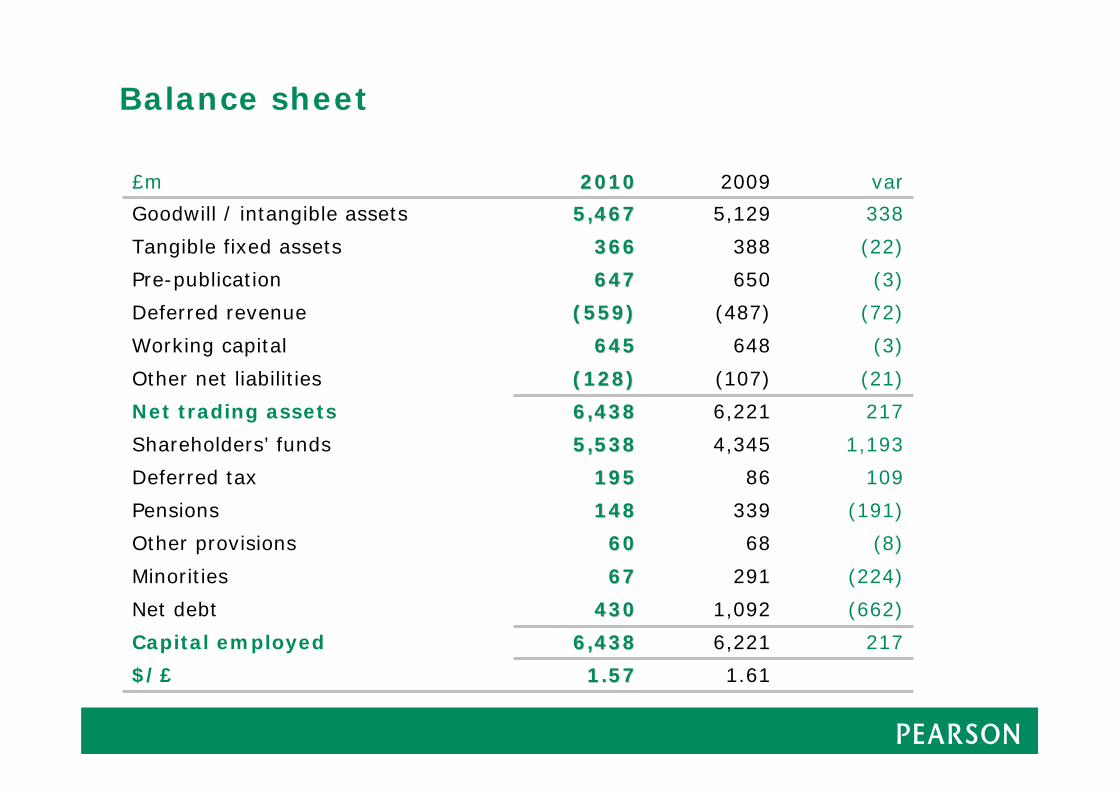
Balance sheet
£m 20102010 2009 var
Goodwill / intangible assets 5,4675,467 5,129 338
Tangible fixed assets 366366 388 (22)
Pre-publication 647647 650 (3)
Deferred revenue (559)(559) (487) (72)
Working capital 645645 648 (3)
Other net liabilities (128)(128) (107) (21)
Net trading assets 6,4386,438 6,221 217
Shareholders’ funds 5,5385,538 4,345 1,193
Deferred tax 195195 86 109
Pensions 148148 339 (191)
Other provisions 6060 68 (8)
Minorities 6767 291 (224)
Net debt 430430 1,092 (662)
Capital employed 6,4386,438 6,221 217
$/£ 1.571.57 1.61
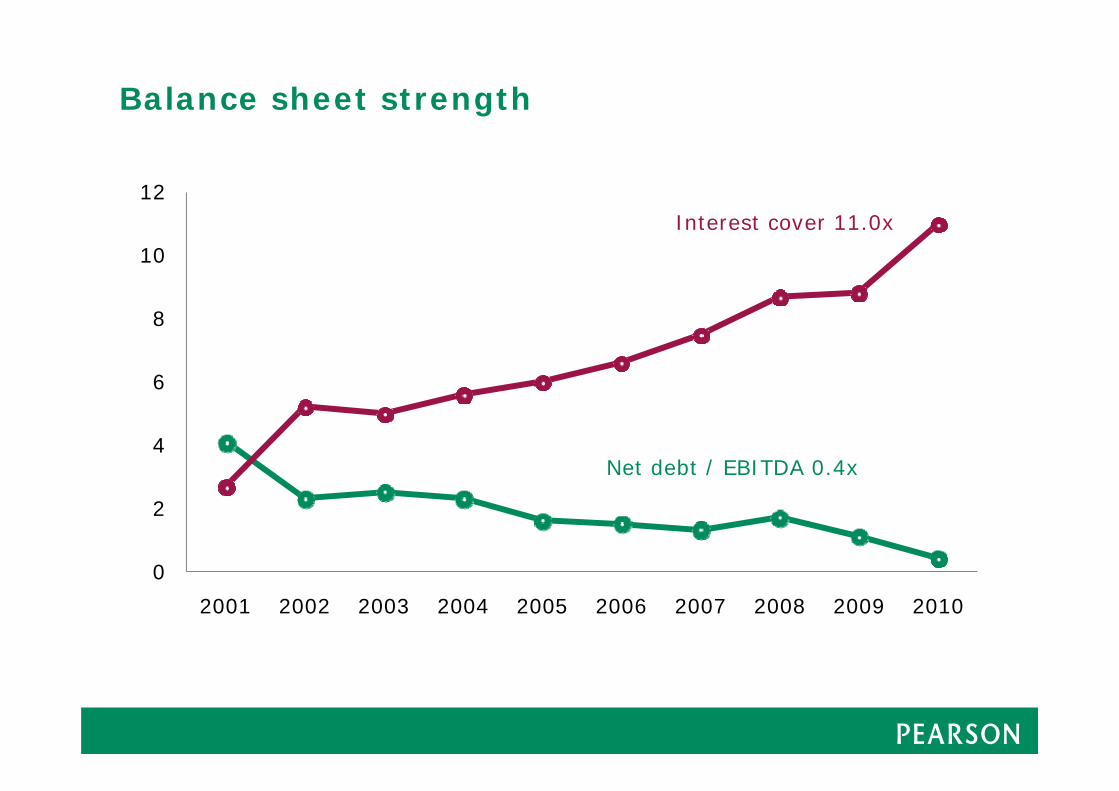
0
2
4
6
8
10
12
2001 2002 2003 2004 2005 2006 2007 2008 2009 2010
Balance sheet strength
Interest cover 11.0x
Net debt / EBITDA 0.4x
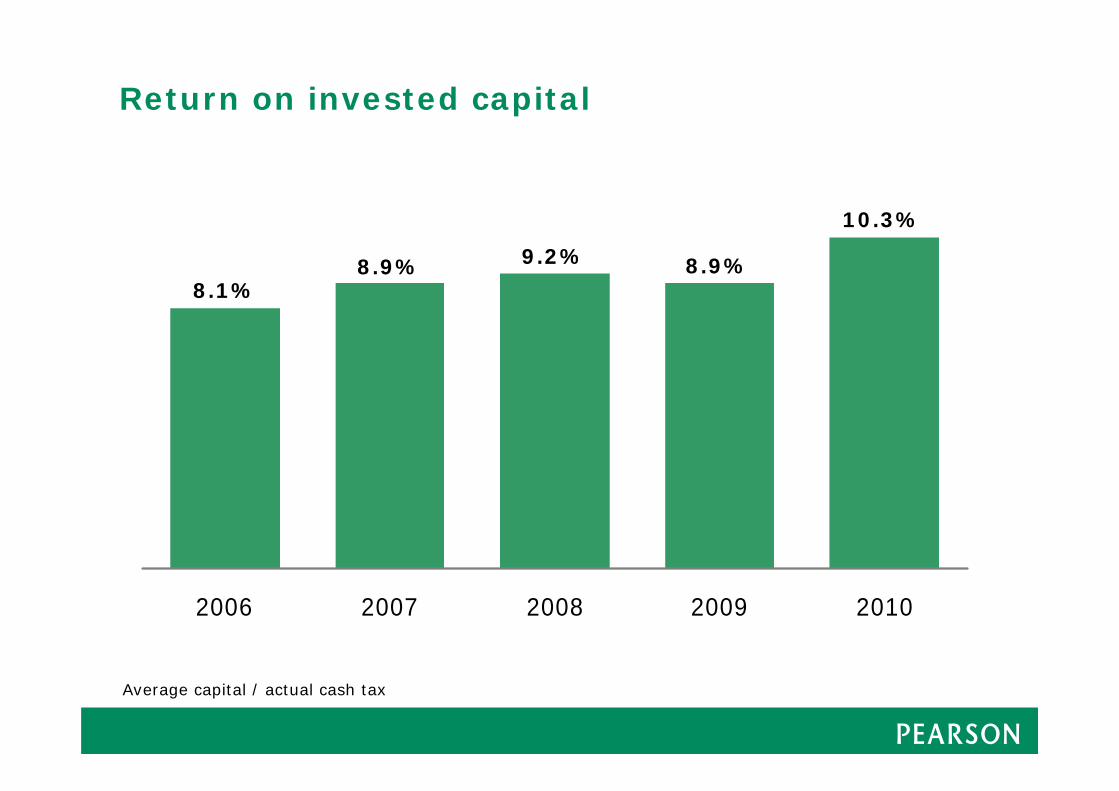
2006 2007 2008 2009 2010
Return on invested capital
8.1%8.9% 9.2% 8.9%
Average capital / actual cash tax
10.3%
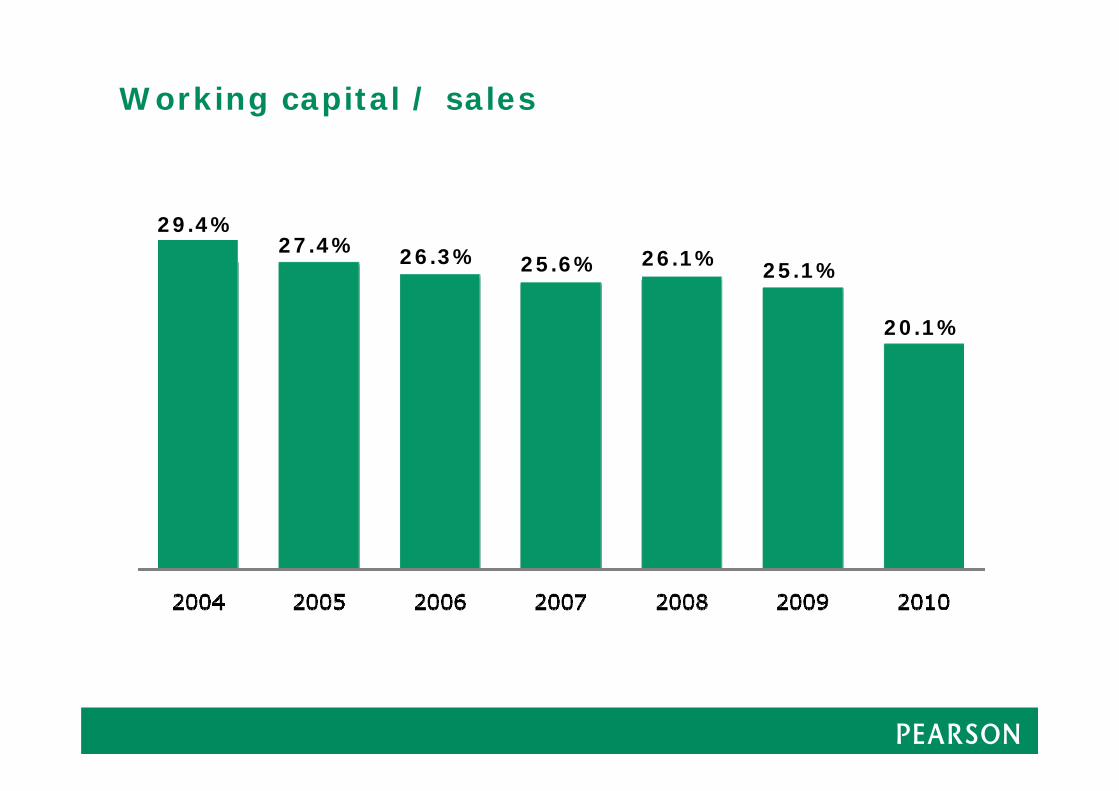
Working capital / sales
29.4%27.4% 26.3% 25.6% 26.1% 25.1%
20.1%
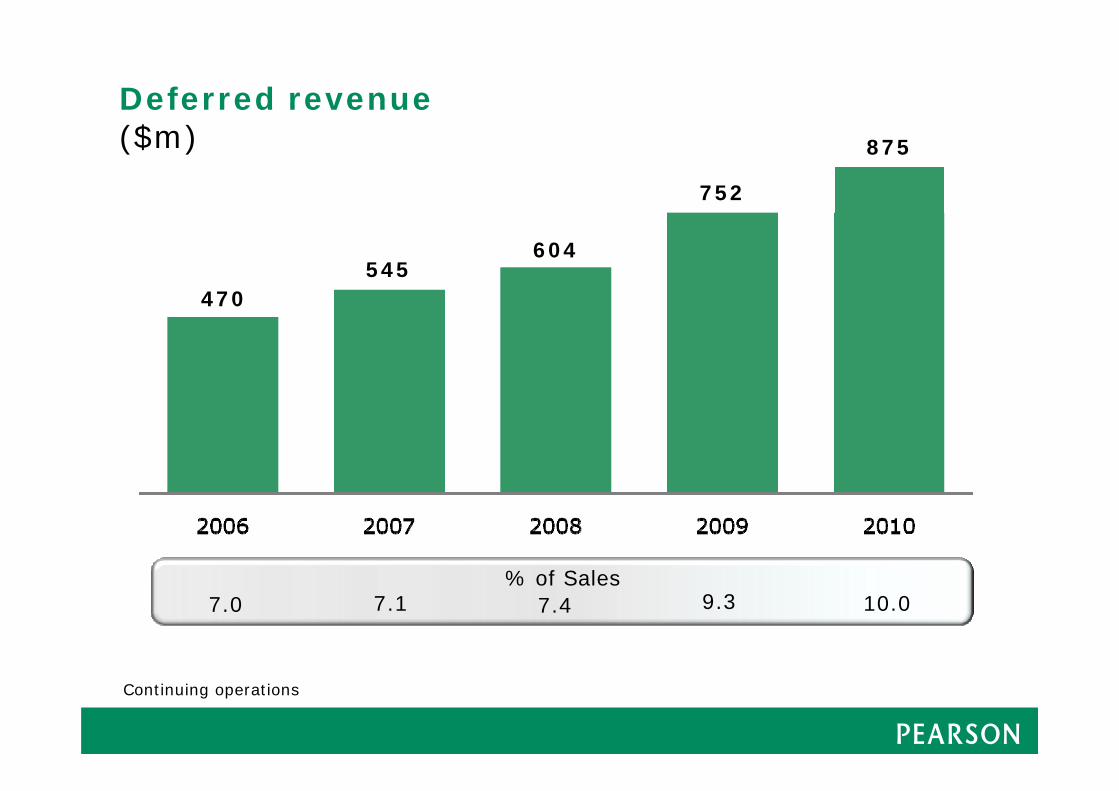
Deferred revenue($m)
470545
604
752
Continuing operations
875
% of Sales7.0 7.1 7.4 9.3 10.0
2006 2007 2008 2009 2010
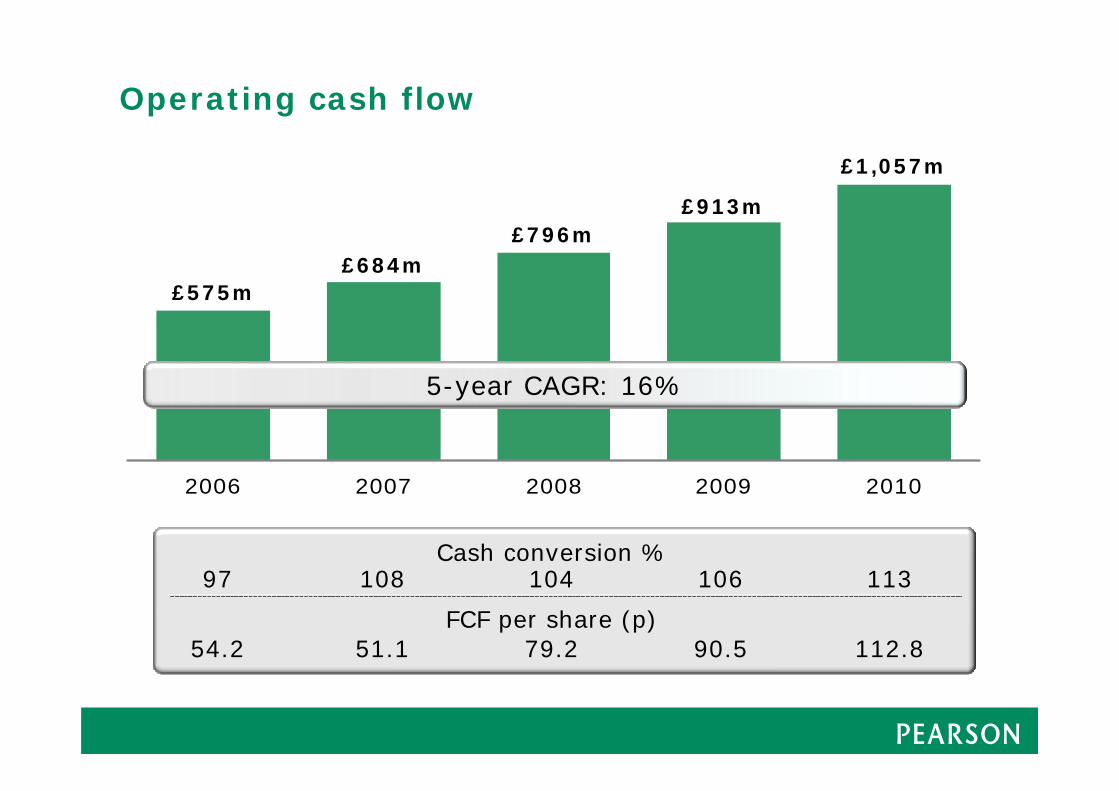
Operating cash flow
£575m£684m
£796m£913m
5-year CAGR: 16%
Cash conversion % 97 108 104 106 113
FCF per share (p) 54.2 51.1 79.2 90.5 112.8
£1,057m
Uses of cash
Organic investment
Bolt-on acquisitions
Dividends
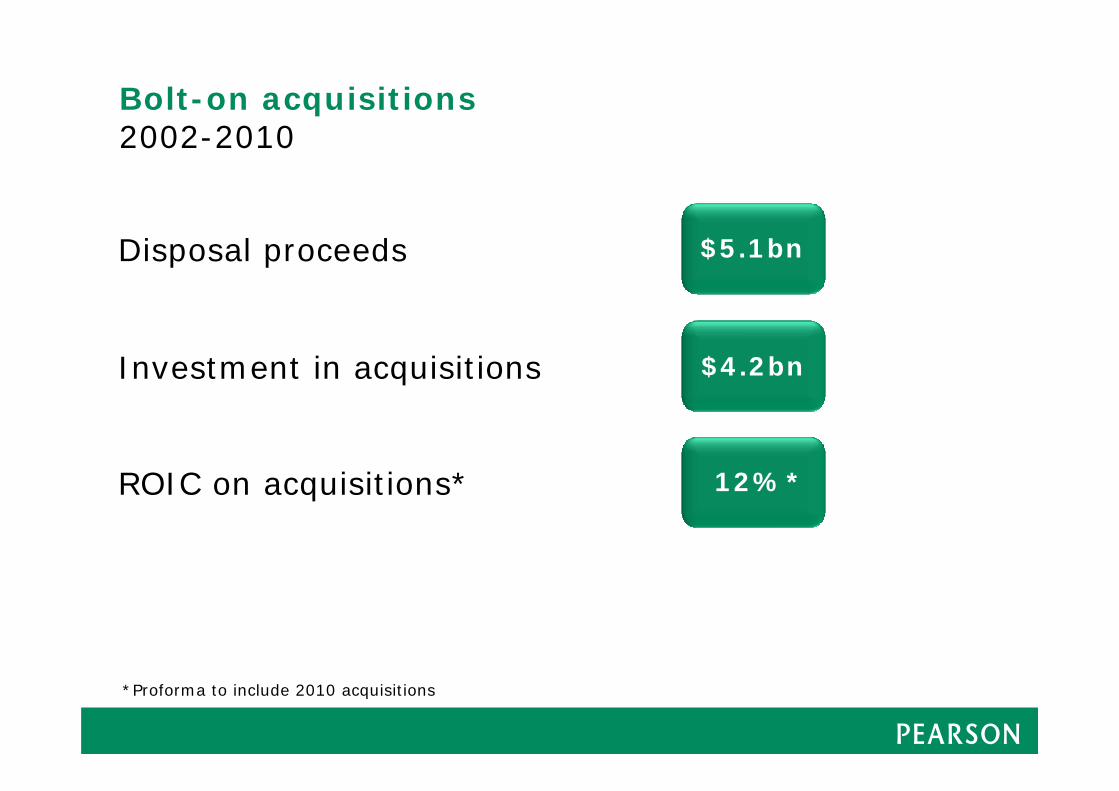
Bolt-on acquisitions2002-2010
$5.1bn
$4.2bn
12%*
Disposal proceeds
Investment in acquisitions
ROIC on acquisitions*
*Proforma to include 2010 acquisitions
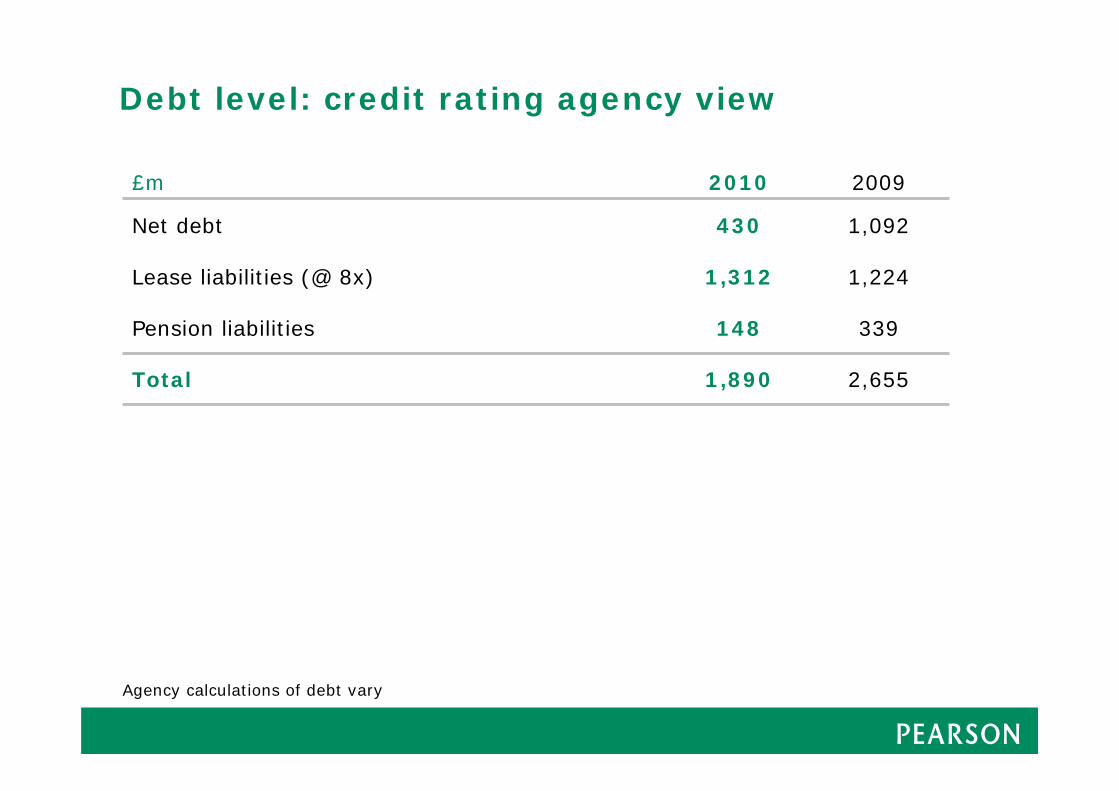
Agency calculations of debt vary
£m 2010 2009
Net debt 430 1,092
Lease liabilities (@ 8x) 1,312 1,224
Pension liabilities 148 339
Total 1,890 2,655
Debt level: credit rating agency view
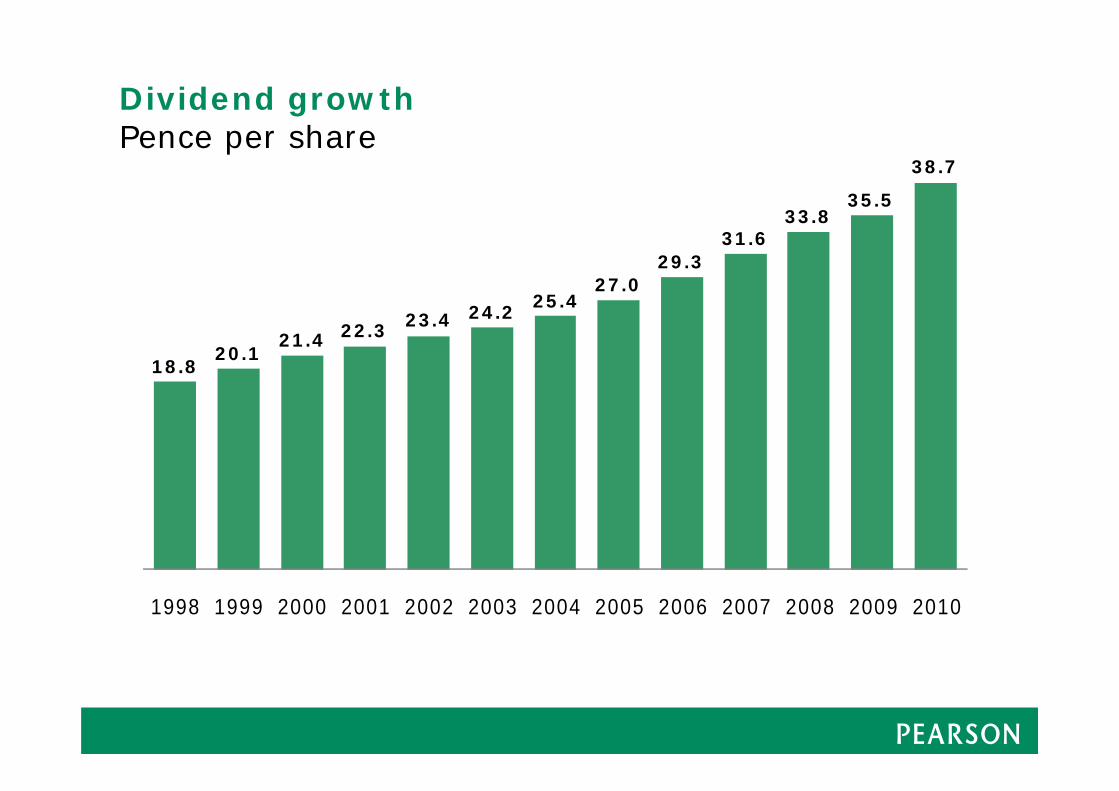
1998 1999 2000 2001 2002 2003 2004 2005 2006 2007 2008 2009 2010
Dividend growthPence per share
18.820.1
21.4 22.3 23.4 24.225.4
27.029.3
31.633.8
35.5
38.7
2011 priorities
Further sales growth and margin improvement
Strong cash conversion
Investment in organic growth and acquisitions

Strategy

Change in our markets
Fiscal
Geopolitical
Educational
Digital
Change in consumer publishing
Digital readers
New business models
Sales channel disruption
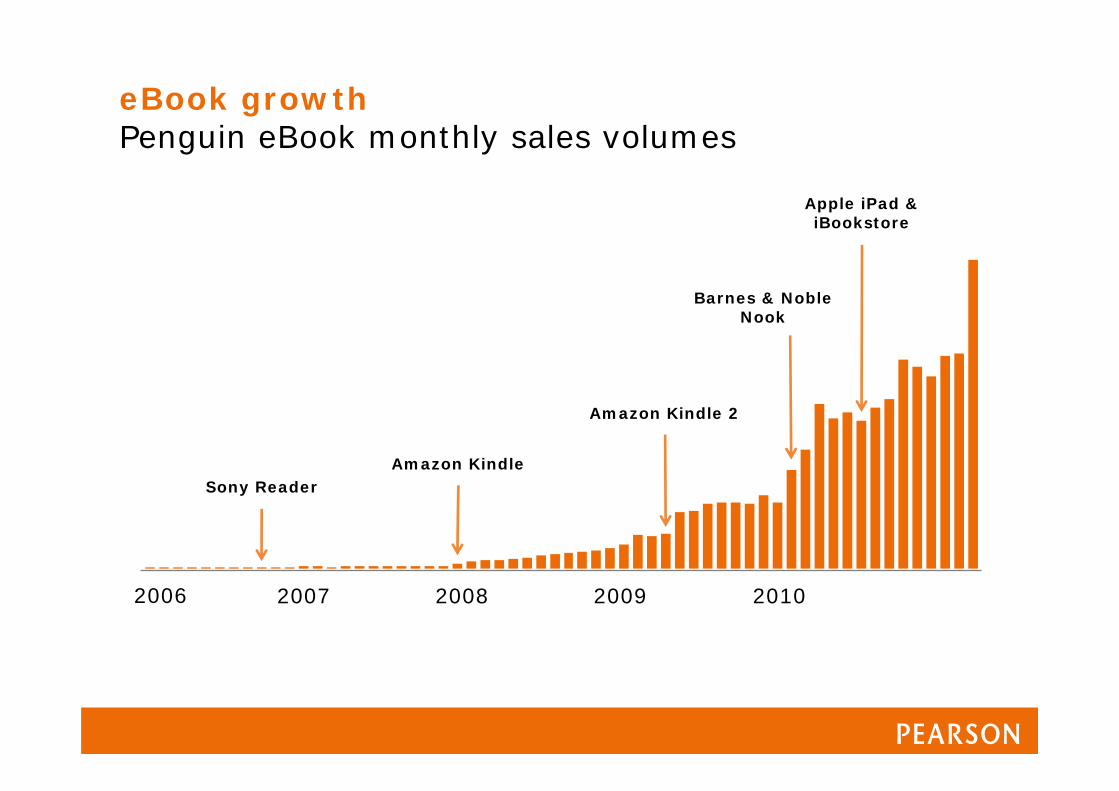
2007 2009 201020082006
Apple iPad & iBookstore
Barnes & Noble Nook
Amazon Kindle 2
Amazon Kindle Sony Reader
eBook growthPenguin eBook monthly sales volumes
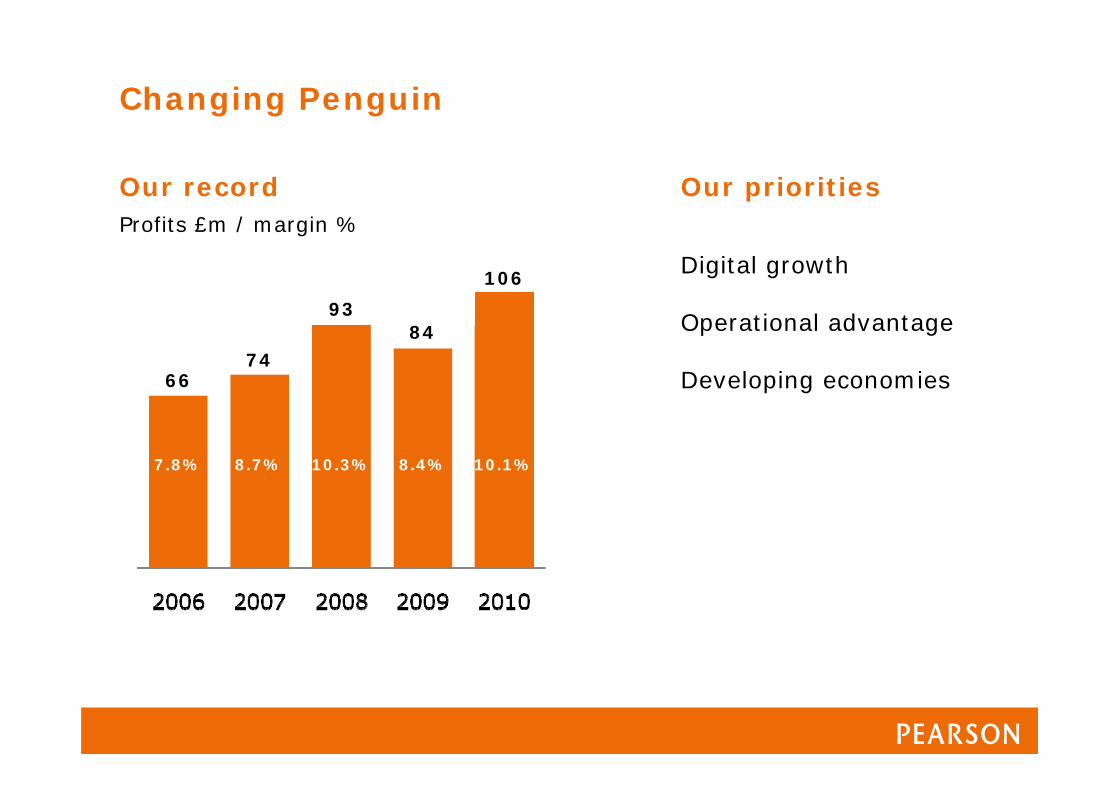
Our priorities
Changing Penguin
Our recordProfits £m / margin %
66
106
8493
74
8.7% 10.3% 8.4% 10.1%7.8%
Digital growth
Operational advantage
Developing economies
Change in business information
Digital readers
Premium business models
Recovery in markets, financial sector
Emerging economies

Digital and subscription revenuesFT Group revenue mix
Print / digital Content & subscription / advertising
87%
13%
60%
40%
Digital
Content /subscriptions
Advertising
Excludes Interactive Data
74%
26%
45%
55%
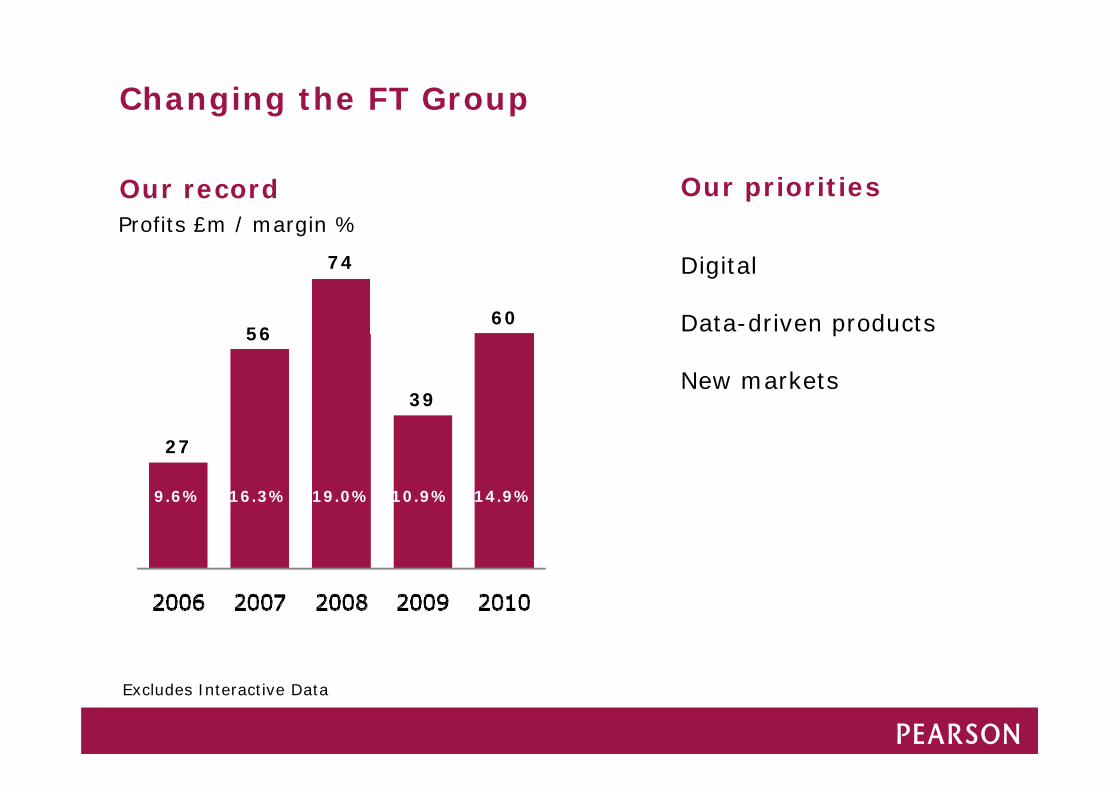
Our priorities
Changing the FT Group
Our record
Digital
Data-driven products
New markets
Excludes Interactive Data
Profits £m / margin %
27
60
39
74
56
16.3% 19.0% 10.9% 14.9%9.6%

Change in North American Education
Federal & State budgets weak, but signs of recovery
Higher Ed enrolments slower in for-profit colleges
Commitment to education reform – will plus money

Change in International Education
Participation
Effectiveness
English
Technology
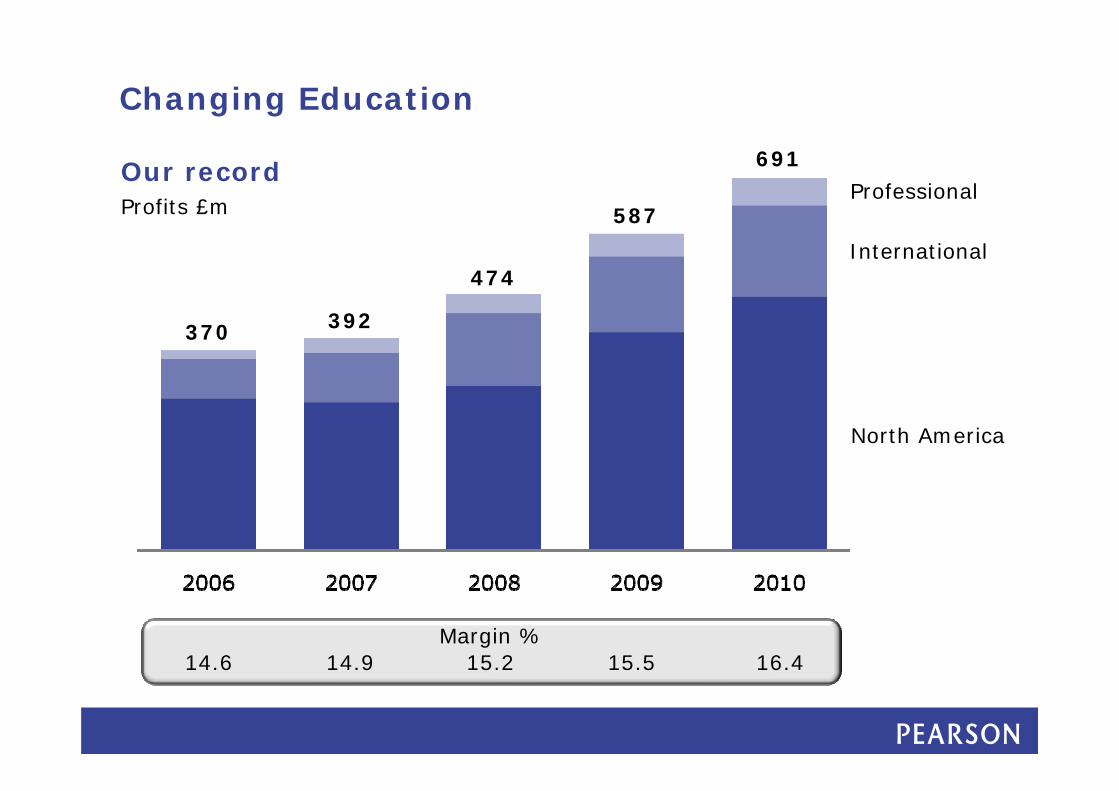
Changing Education
Margin % 14.6 14.9 15.2 15.5 16.4
Professional
International
North America
370 392
474
587
691
Profits £m
Our record
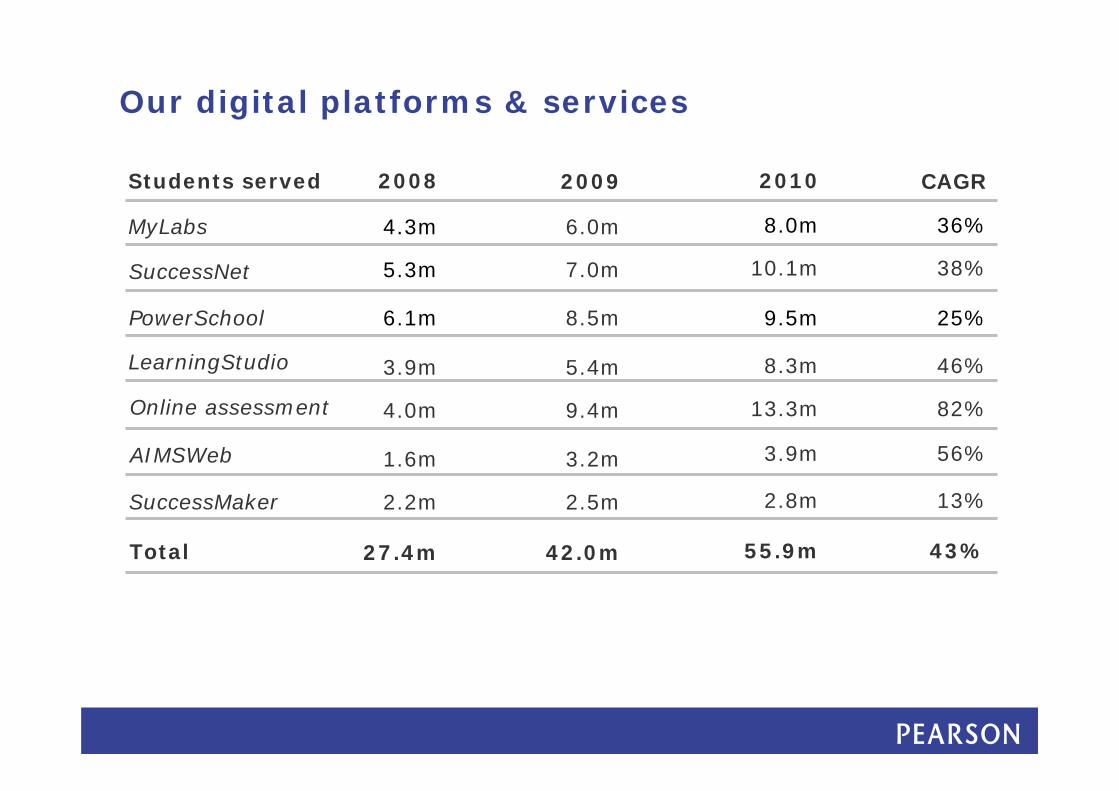
Our digital platforms & services
MyLabs
SuccessNet
PowerSchool
2009 2010 CAGR
4.3m
5.3m
6.1m
2008
6.0m
7.0m
8.5m
LearningStudio
Online assessment
3.9m
4.0m
5.4m
9.4m
AIMSWeb
SuccessMaker
1.6m
2.2m
3.2m
2.5m
Total 27.4m 42.0m
8.0m
10.1m
9.5m
8.3m
13.3m
3.9m
2.8m
55.9m
36%
38%
25%
46%
82%
56%
13%
43%
Students served
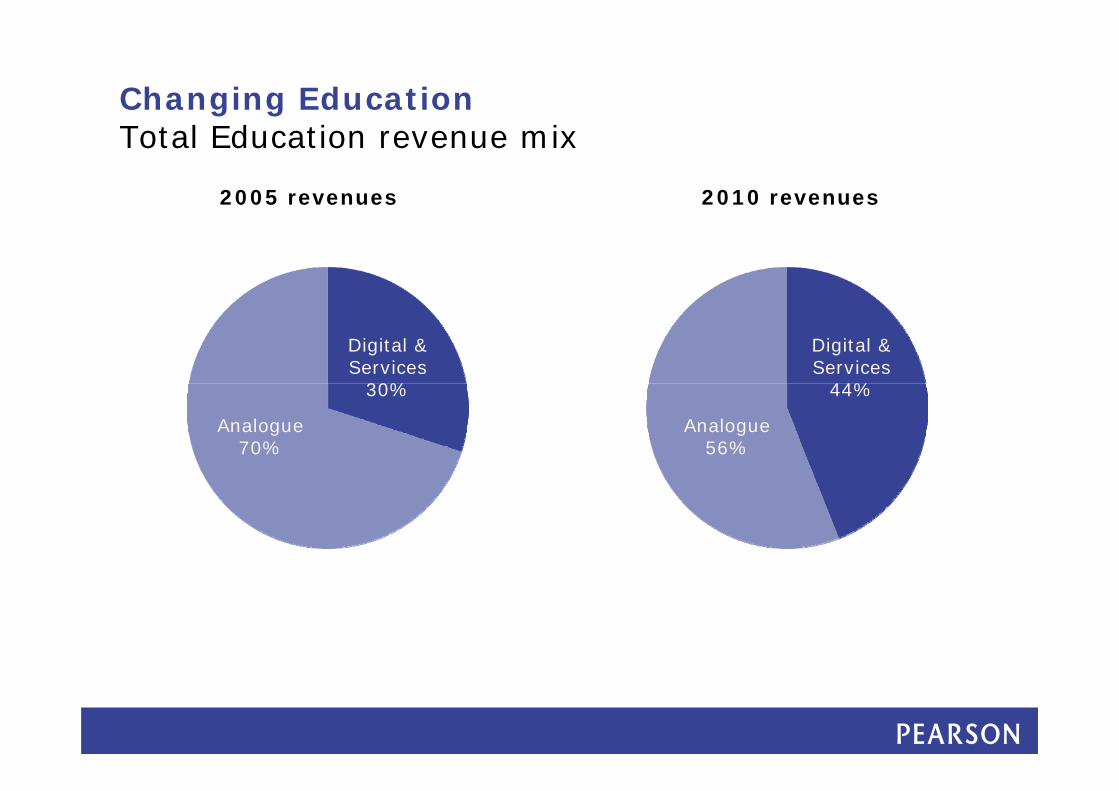
Changing EducationTotal Education revenue mix
2005 revenues 2010 revenues
Digital & Services
44%
Analogue 56%
Digital & Services
30%
Analogue 70%
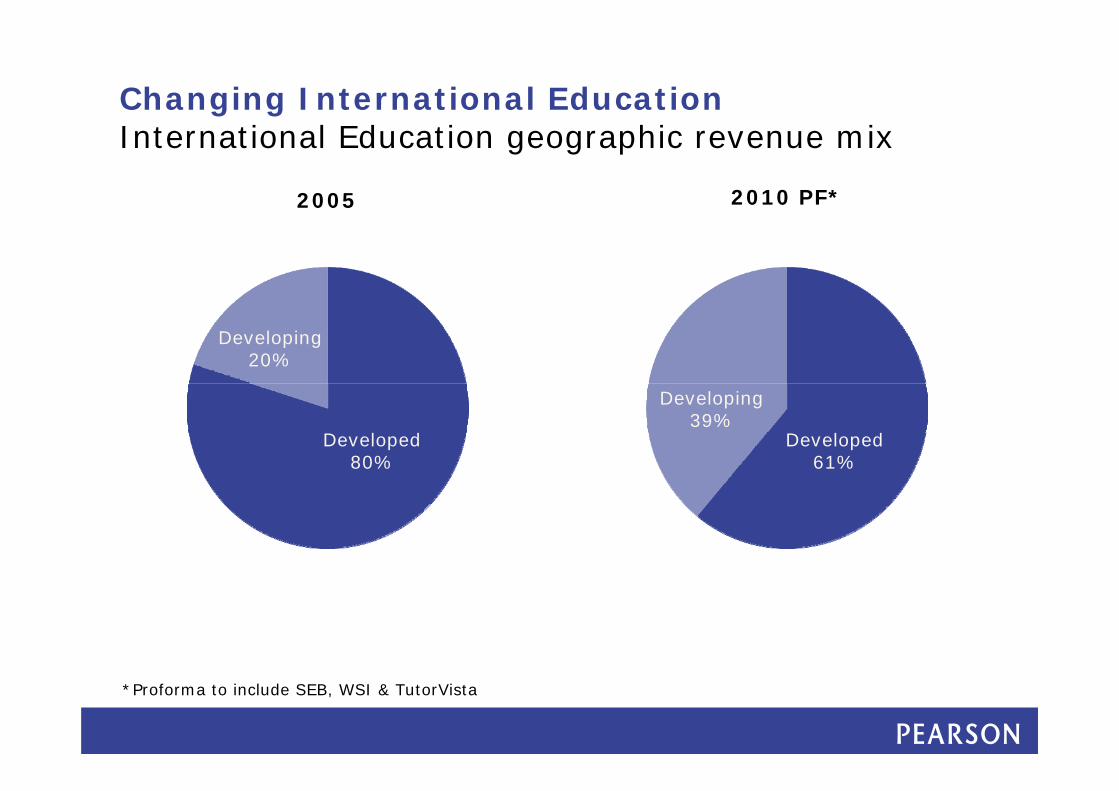
Changing International EducationInternational Education geographic revenue mix
*Proforma to include SEB, WSI & TutorVista
2010 PF*
Developing39%
Developed61%
Developing20%
Developed80%
2005
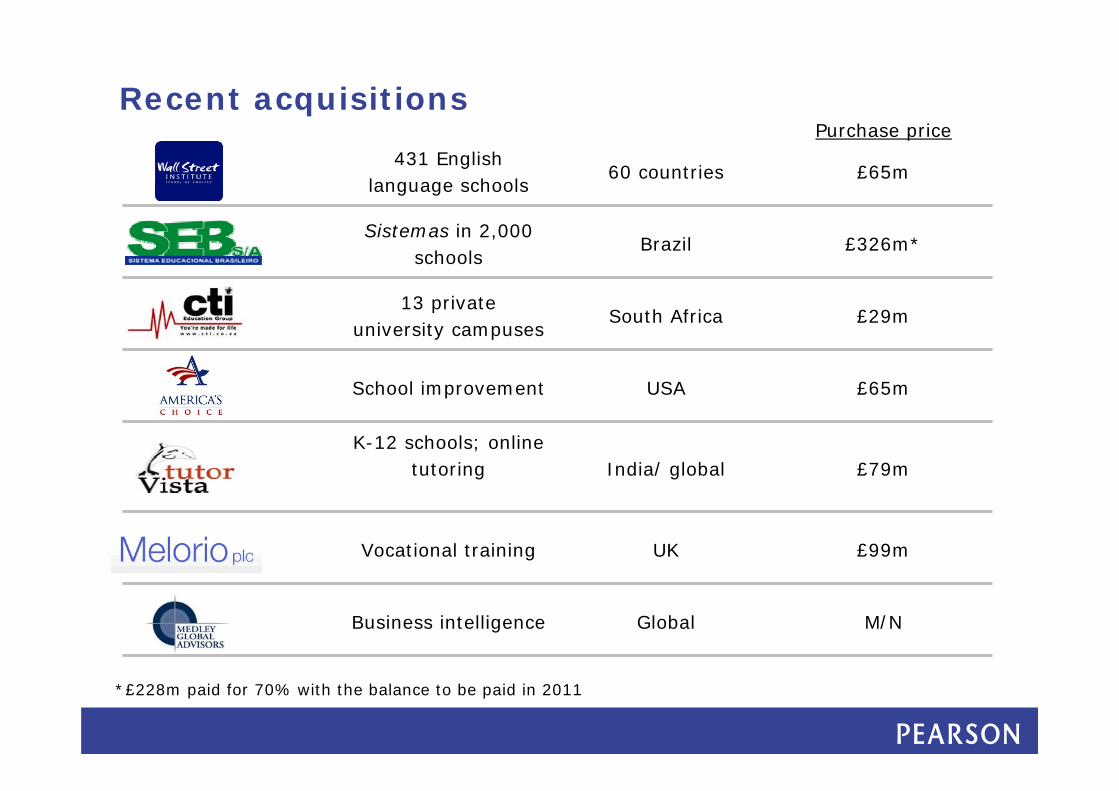
Recent acquisitions
*£228m paid for 70% with the balance to be paid in 2011
Purchase price
431 English language schools
60 countries £65m
Sistemas in 2,000 schools
Brazil £326m*
13 private university campuses
South Africa £29m
School improvement USA £65m
K-12 schools; online tutoring India/ global £79m
Vocational training UK £99m
Business intelligence Global M/N
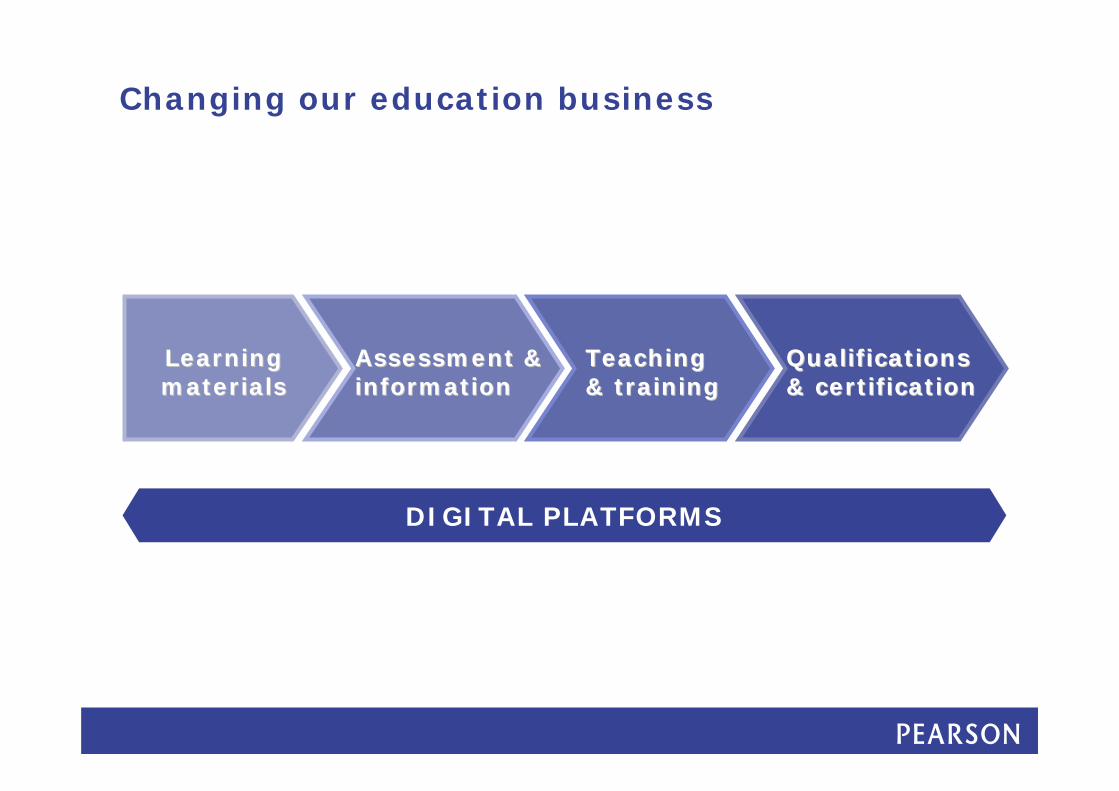
Qualifications Qualifications & certification& certification
Teaching Teaching & training& training
Assessment & Assessment & informationinformation
Learning Learning materialsmaterials
Changing our education business
DIGITAL PLATFORMS
Pearson
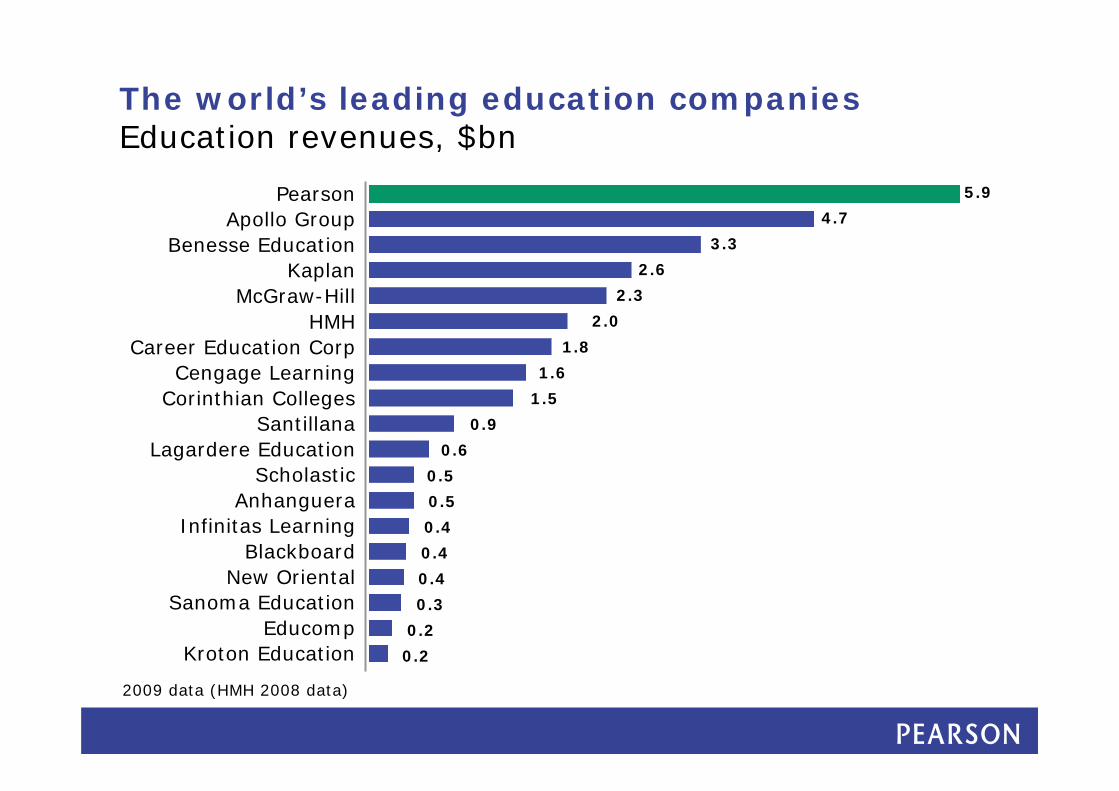
The world’s leading education companiesEducation revenues, $bn
2009 data (HMH 2008 data)
5.9
4.7
3.3
2.6
2.3
1.8
1.6
1.5
0.9
0.6
0.5
0.5
0.4
0.4
0.4
0.3
0.2
0.2
Kroton Education
Apollo GroupBenesse Education
KaplanMcGraw-Hill
Career Education CorpCengage Learning
Corinthian Colleges
HMH
SantillanaLagardere Education
ScholasticAnhanguera
Infinitas LearningBlackboard
New OrientalSanoma Education
Educomp
2.0

Appendices
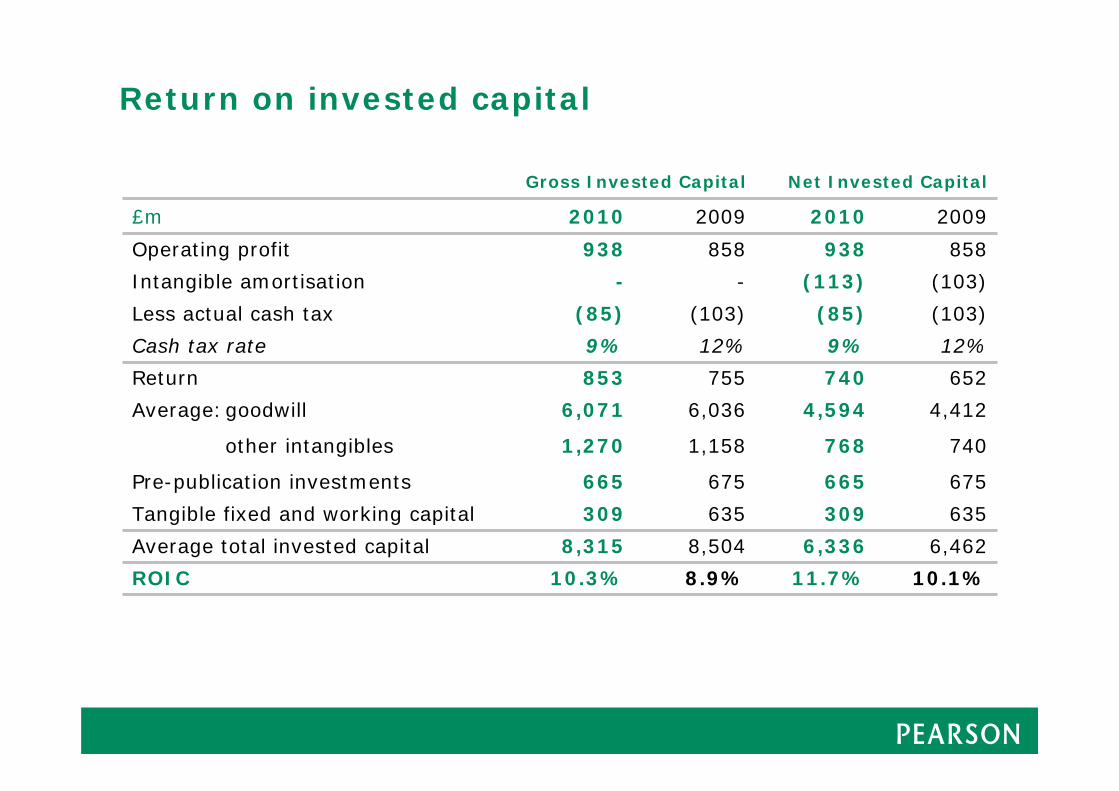
Return on invested capital
Gross Invested Capital Net Invested Capital
£m 2010 2009 2010 2009
Operating profit 938 858 938 858
Intangible amortisation - - (113) (103)
Less actual cash tax (85) (103) (85) (103)
Cash tax rate 9% 12% 9% 12%
Return 853 755 740 652
Average:goodwill 6,071 6,036 4,594 4,412
other intangibles 1,270 1,158 768 740
Pre-publication investments 665 675 665 675
Tangible fixed and working capital 309 635 309 635
Average total invested capital 8,315 8,504 6,336 6,462
ROIC 10.3% 8.9% 11.7% 10.1%
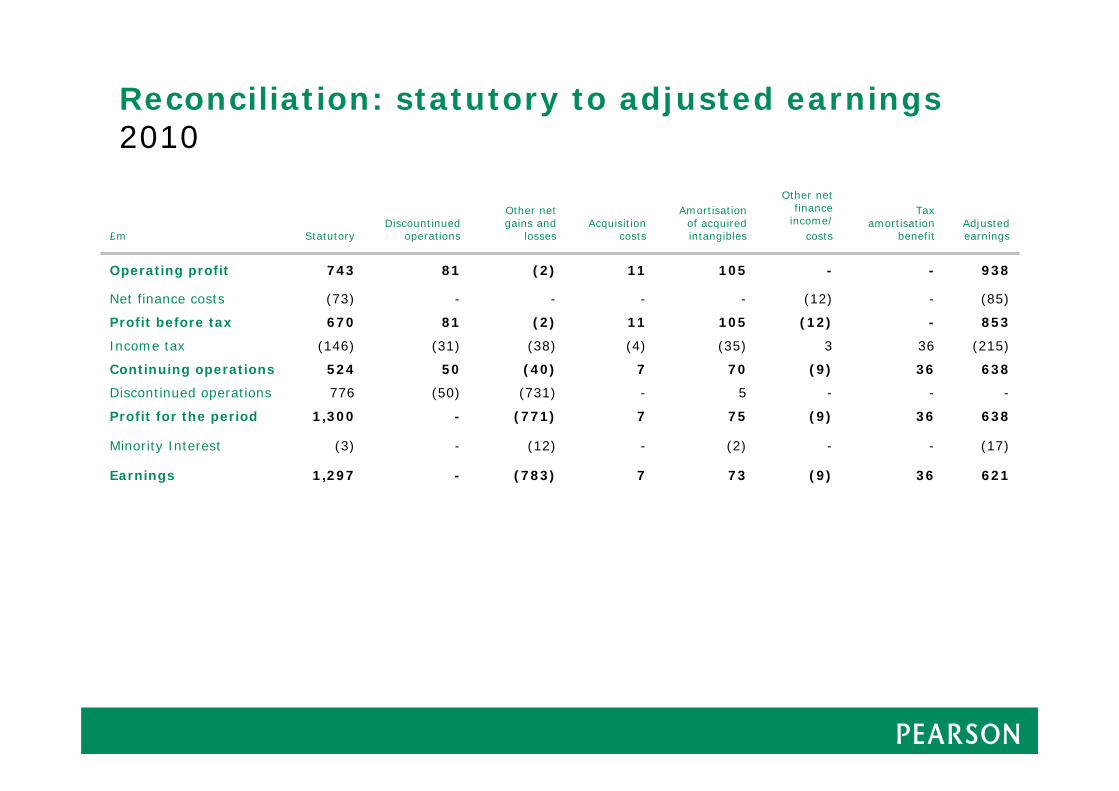
Reconciliation: statutory to adjusted earnings2010
£m StatutoryDiscountinued
operations
Other net gains and
lossesAcquisition
costs
Amortisation of acquired intangibles
Other net finance
income/costs
Tax amortisation
benefitAdjusted earnings
Operating profit 743 81 (2) 11 105 - - 938
Net finance costs (73) - - - - (12) - (85)
Profit before tax 670 81 (2) 11 105 (12) - 853
Income tax (146) (31) (38) (4) (35) 3 36 (215)
Continuing operations 524 50 (40) 7 70 (9) 36 638
Discontinued operations 776 (50) (731) - 5 - - -
Profit for the period 1,300 - (771) 7 75 (9) 36 638
Minority Interest (3) - (12) - (2) - - (17)
Earnings 1,297 - (783) 7 73 (9) 36 621
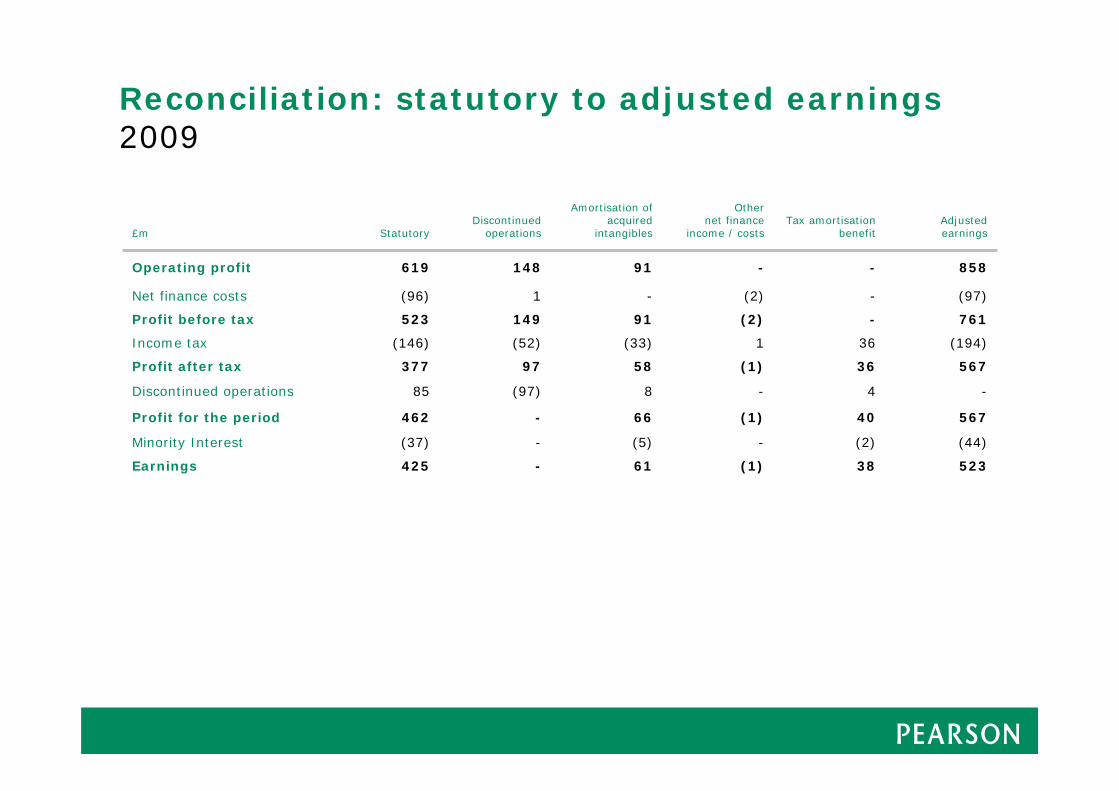
Reconciliation: statutory to adjusted earnings2009
£m StatutoryDiscontinued
operations
Amortisation of acquired
intangibles
Other net finance
income / costsTax amortisation
benefitAdjusted earnings
Operating profit 619 148 91 - - 858
Net finance costs (96) 1 - (2) - (97)
Profit before tax 523 149 91 (2) - 761
Income tax (146) (52) (33) 1 36 (194)
Profit after tax 377 97 58 (1) 36 567
Discontinued operations 85 (97) 8 - 4 -
Profit for the period 462 - 66 (1) 40 567
Minority Interest (37) - (5) - (2) (44)
Earnings 425 - 61 (1) 38 523
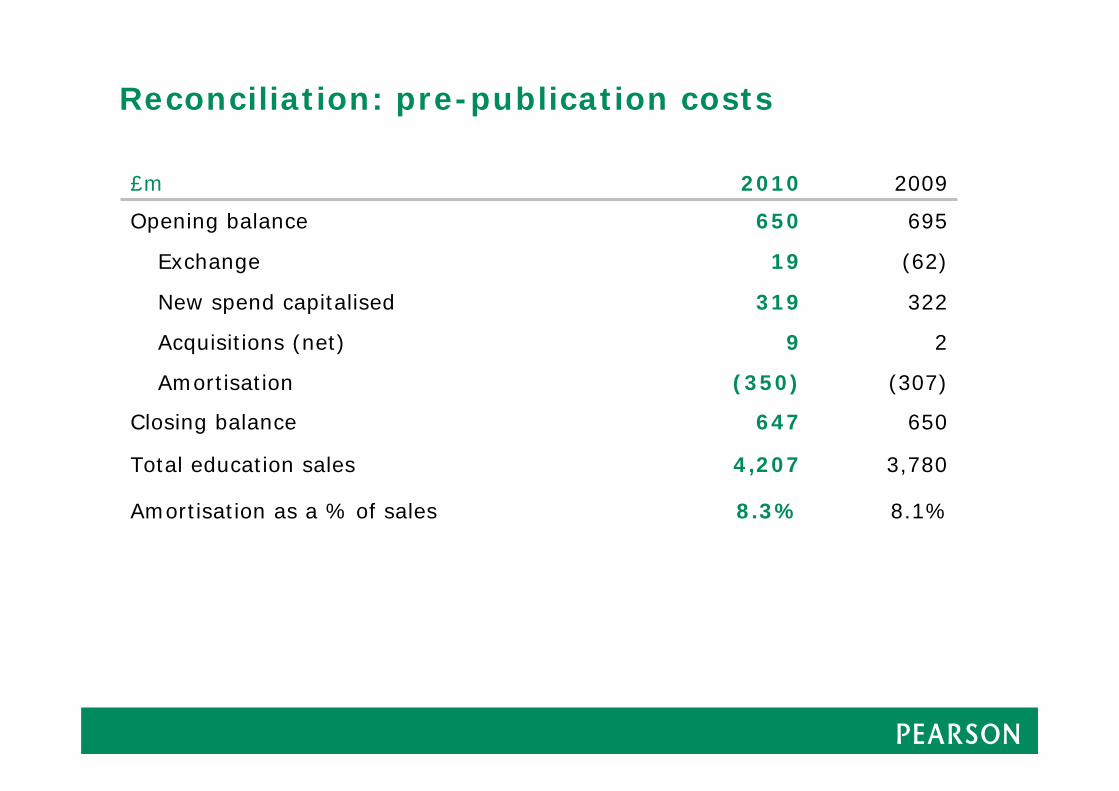
Reconciliation: pre-publication costs
£m 2010 2009
Opening balance 650 695
Exchange 19 (62)
New spend capitalised 319 322
Acquisitions (net) 9 2
Amortisation (350) (307)
Closing balance 647 650
Total education sales 4,207 3,780
Amortisation as a % of sales 8.3% 8.1%
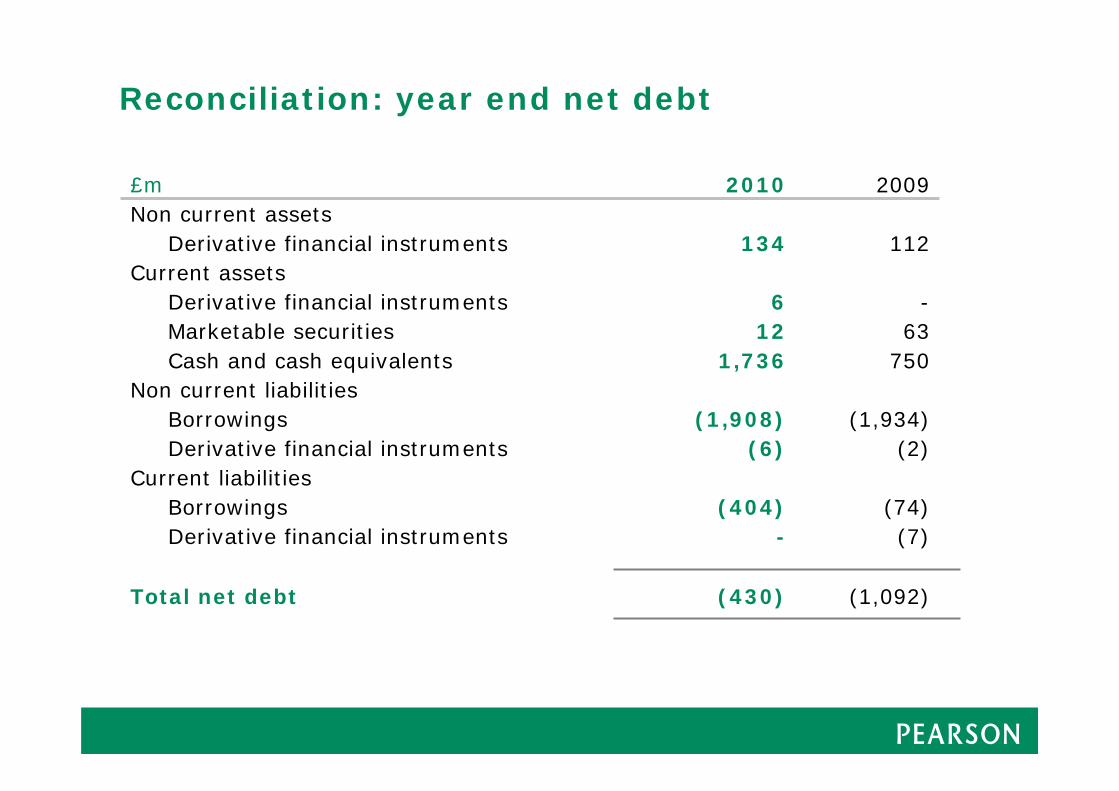
Reconciliation: year end net debt
£m 2010 2009Non current assets
Derivative financial instruments 134 112Current assets
Derivative financial instruments 6 -Marketable securities 12 63Cash and cash equivalents 1,736 750
Non current liabilitiesBorrowings (1,908) (1,934)Derivative financial instruments (6) (2)
Current liabilitiesBorrowings (404) (74)Derivative financial instruments - (7)
Total net debt (430) (1,092)
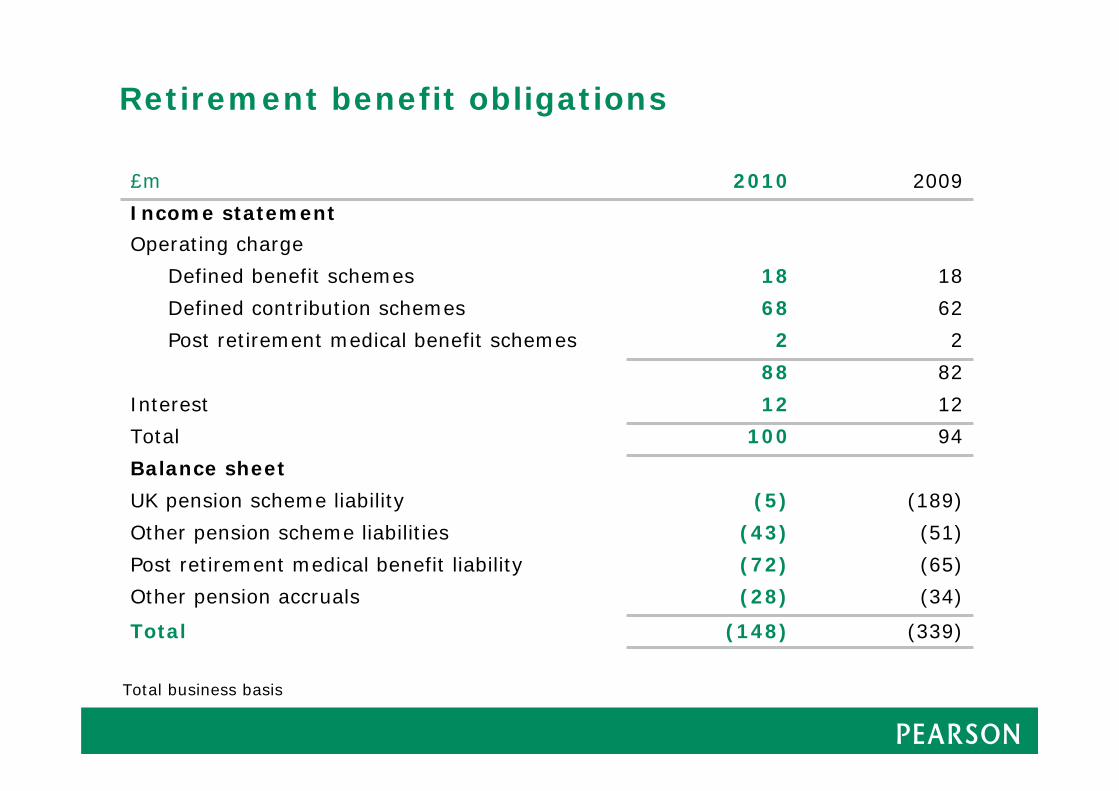
Retirement benefit obligations
£m 2010 2009
Income statement
Operating charge
Defined benefit schemes 18 18
Defined contribution schemes 68 62
Post retirement medical benefit schemes 2 2
88 82
Interest 12 12
Total 100 94
Balance sheet
UK pension scheme liability (5) (189)
Other pension scheme liabilities (43) (51)
Post retirement medical benefit liability (72) (65)
Other pension accruals (28) (34)
Total (148) (339)
Total business basis
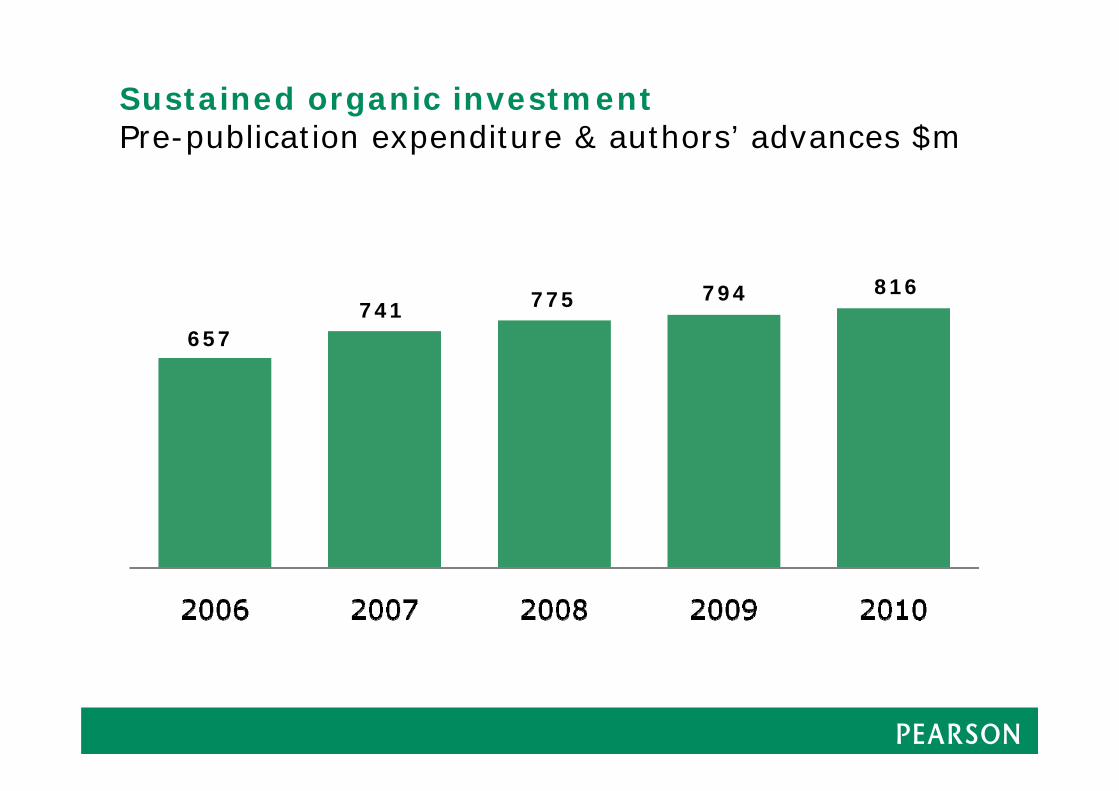
Sustained organic investmentPre-publication expenditure & authors’ advances $m
657741 775 794 816

Learn more atwww.pearson.com

![Final Results 2010 [Presentation slides] - Mitchells & Butlers › pdf › 2010 › results › final_results10_slides.… · Final Results 2010 [Presentation slides] Keywords: Final](https://img.pdfslide.us/doc/110x75/5f2878169df78139e52a7d4d/final-results-2010-presentation-slides-mitchells-butlers-a-pdf-a-2010.jpg)