Embed Size (px)
Citation preview

| 1 |
2010 9M Results Presentation9th November 2010

| 2 |
Broadcasting
| 3 |
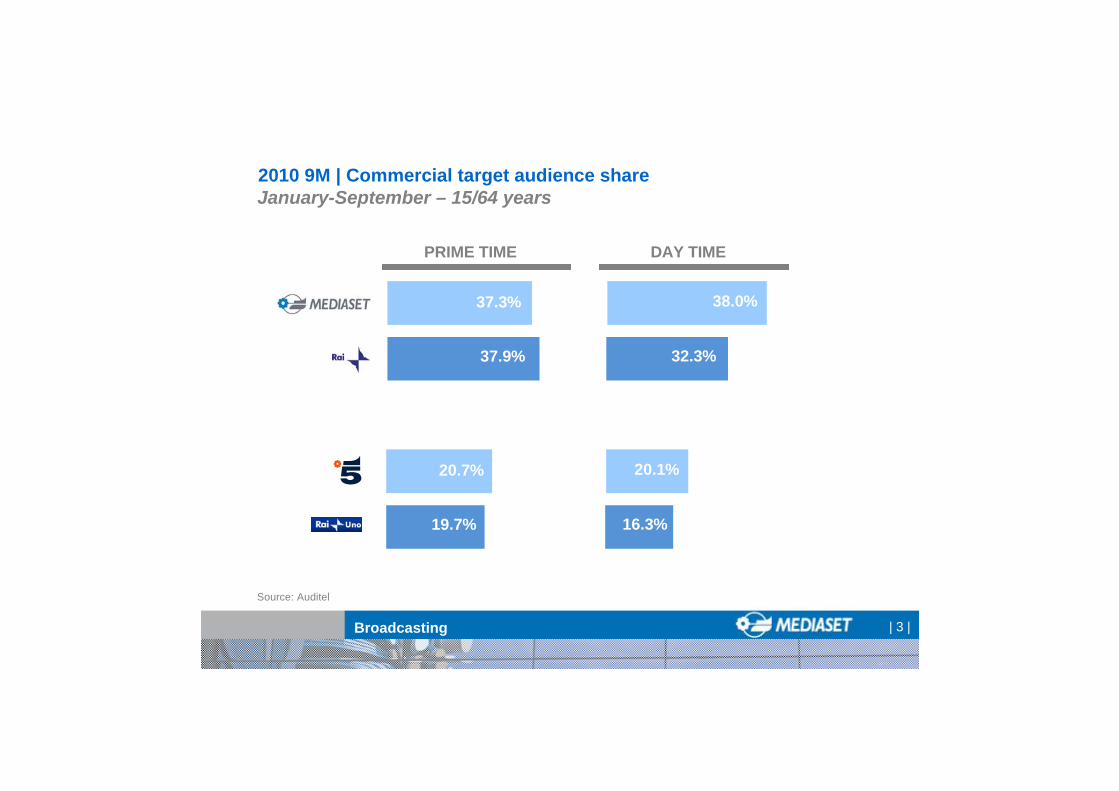
37.9%
37.3%
2010 9M | Commercial target audience share
Broadcasting
PRIME TIME DAY TIME
January-September – 15/64 years
Source: Auditel
38.0%
32.3%
19.7%
20.7% 20.1%
16.3%

| 4 |
+1.1%
+6.3%+5.4%
+7.5%
Jan/Jul Aug Sept Oct
ITALY | TV Consumption trend 2010 % Var. vs 2009
Source: Auditel, total viewing
Broadcasting

| 5 |
ITALY | TV Consumption by area % Var. vs 2009
Total Italy
All-digital regions
All-digital regions from 31/12/10 *
Rest of Italy
6.5%
11.1%
4.6%
4.6%
Source: Auditel, total viewing; Sept-Oct* Lombardia, Friuli, Emilia, Veneto
Broadcasting

| 6 |
37.9%
2.5%
40.4%
2.0%
42.4%
33.6%
3.3%
36.8%
Generalist (C5+I1+R4)
Multichannel FTA (6)
Subtotal
Pay TV Channels
Total
Generalist (R1+R2+R3)
Multichannel FTA (11)
Total
15-64 yrs
Source: Auditel (1 January – 30 Sept. 2010); Pay TV Channels, Company elaborations on Auditel data
24 hoursMEDIASET 2010 9M | Audience Share
Broadcasting

| 7 |
MEDIASET | Multichannel Audience Share24 Hours – Individuals
MS DTT (Free+Pay)
RAI DTT
SKY Channels
FOX Channels
Disney
Turner
Discovery
4.1%
2.9%
3.3%
1.8%
0.9%
0.3%
0.4%
1/1-30/09 2010
Source: Company elaborations on Auditel data
Broadcasting

| 8 |
Advertising

| 9 |
Jan - Mar Mar - Jun
+5.2%
Jun - Sep
+5.4% +4.1%
MEDIASET 2010 9M | Publitalia Advertising Revenues analysis2010 % Var. vs 2009
Advertising

| 10 |
(Euro ml.)
9M 2009 9M2010
+5.0%
1,914.81,823.0
Advertising
MEDIASET 2010 9M | Advertising Revenues2010 % Var. vs 2009
| 11 |
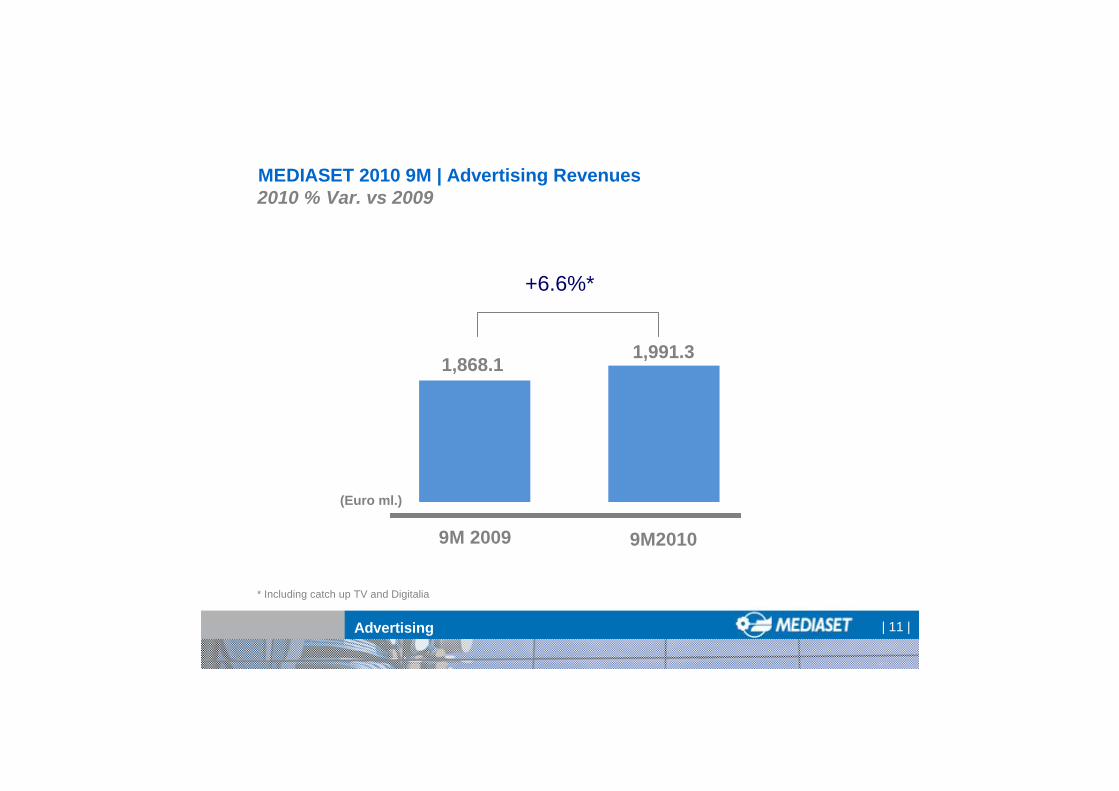
(Euro ml.)
9M 2009 9M2010
+6.6%*
1,991.31,868.1
Advertising
MEDIASET 2010 9M | Advertising Revenues2010 % Var. vs 2009
* Including catch up TV and Digitalia

| 12 | Advertising
Source: Nielsen (January-August)
* Excluding Cards, Out-of-home, Direct Mail)** Excluding keywords, search advertising
Total Market*
Mediaset
Total Market excluding Mediaset
Rai
Newspapers
Magazines
Radio
Internet**
Jan-Aug 2010
+4.8%
+5.7%
+4.2%
+5.6%
-0.3%
-8.4%
+12.8%
+17.7%
ITALY 2010 8M | Advertising market trend

| 13 |
MEDIASET 2010 9M | Advertising Trend by Sector
Auto
Grocery
9M2010 vs 2009
+6.1%
+10.1%
9M 2009 vs 2008
-8.6%
-11.1%
Positive Sectors
Advertising

| 14 |
Non-Food
PERSONAL CARE
HOUSEKEEPING
TOILETRIES
Food
FOOD
BEVERAGE
MEDIASET 2010 9M | Recovery of Fast Moving Consumer Goods
9M 2009 vs. 2008 9M 2010 vs. 2009
-13.2%
-13.3%
-12.7%
-7.8%
-12.7%
-10.7%
-2.4%
+10.1%
+12.6%
+3.1%
+10.0%
+15.7%
+7.0%
+9.4%
Advertising

| 15 |
MEDIASET 2010 9M | Advertising Trend by Sector
Auto
Grocery
9M2010 vs 2009
+6.1%
+10.1%
9M 2009 vs 2008
-8.6%
-11.1%
Positive Sectors
Telecom
Pharma
9M2010 vs 2009
+1.3%
+0.7%
9M 2009 vs 2008
+2.3%
+4.0%
Stable Sectors
Advertising

| 16 |
Media/Publishing
Finance/Insurance
9M 2010 vs 2009
-17.8%
-10.8%
9M 2009 vs 2008
-29.6%
-14.2%
MEDIASET 2010 9M | Advertising Trend by Sector
Decreasing Sectors
Advertising

| 17 |
Household Appliances
Retail
Clothing
9M 2010 vs 2009
+63.2%
+32.7%
+17.5%
9M 2009 vs 2008
-32.4%
-13.1%
-27.1%
MEDIASET 2010 9M | Advertising Trend by Sector
Small sectors with a very strong trend
Media/Publishing
Finance/Insurance
9M 2010 vs 2009
-17.8%
-10.8%
9M 2009 vs 2008
-29.6%
-14.2%
Decreasing Sectors
Advertising

| 18 | Advertising
871
168
Active clients
New clients
MEDIASET 2010 9M | Customer Base
9M 2010 vs. 2009*
+10.7%
+6.6%
% on Total Sales*
29.0%
50.8%
* Analysis based on 2010 clients ranking
TOP 10 Investors
TOP 30 Investors

| 19 |
Financials

| 20 |
MEDIASET GROUP 2010 9M | P&L Highlights
Net Consolidated Revenues
EBITDA
EBIT
NET PROFIT (Reported)
NET PROFIT (Adjusted*)
Group Net Financial Position
9M 2009(Euro ml.)
* Excluding the net impact of the amortisation of intangibles related to the PPA of Endemol and the write-off of the investment in Edam
2,652.1
1,193.2
380.9
184.2
198.0
(1,601.5)
Financials
9M 2010
3,045.8
1,379.8
534.7
192.6
267.9
(1,308.1)

| 21 |
FinancialsItalian Business

| 22 |
MEDIASET ITALIAN BUSINESS 2010 9M | P&L Results
Net Consolidated RevenuesPersonnel Costs
Other Operating Costs
EBITDARights Amortisation
Other Amortisation & Depreciation
Operating ProfitFinancial Income (Losses)
Associates
Pre-Tax ProfitTaxes
NET PROFIT
9M 2009(Euro ml.)
2,220.7(316.8)
(900.8)
1,003.1(618.9)
(85.8)
298.4(27.3)
(0.2)
271.0(108.0)
156.0
Financials
9M 2010
2,423.9(331.4)
(988.2)
1,104.2(627.1)
(109.2)
367.9(16.7)
(4.1)
347.1(134.6)
207.0
% Var
+9.1%
+10.1%
+23.3%
+32.7%

| 23 |
FTA TV
Network Operator
Pay TV
Other Activities
Intra-company Eliminations
Adjustments
TOTAL
Total NetRevenues
1,702.1
142.7
526.8
264.2
(103.7)
(108.2)
2,423.9
OperatingProfit
359.5
(8.0)
(0.9)
29.9
-
(12.6)
367.9
(Euro ml.)
Financials
Total Costs(including D&A)
(1,342.7)
(150.7)
(527.7)
(234.2)
103.7
95.6
2,056.0
MEDIASET ITALIAN BUSINESS 2010 9M | Operations Breakdown

| 24 |
MEDIASET ITALIAN BUSINESS 2010 9M | FTA TV Operations(Euro ml.)
Total Net TV Revenues
TV Advertising Revenues
Multichannel Adv. Revenues
Commissions
Other TV Revenues
Net Intra-company items
Total TV CostsPersonnel
TV Operating Costs
TV Rights Amortisations
Other A&D
Net Intra-company Items
FTA TV Operating Profitmargin
1,623.8
1,823.0
6.1
(272.0)
65.7
1.0
(1,311.9)
(261.4)
(502.9)
(444.2)
(42.4)
(61.0)
311.919.2%
9M 2009
1,702.1
1,914.8
17.8
(287.7)
54.8
2.5
(1,342.7)
(275.3)
(539.0)
(432.1)
(29.8)
(66.6)
359.521.1%
9M 2010
Financials

| 25 |
MEDIASET ITALIAN BUSINESS 2010 9M | Network Operator
9M 2009(Euro ml.)
Total Net Revenues
3° Party DVB-T/DVB-H Revenues
Other Revenues
Net intra-company Items
Total CostsPersonnel
Other Operating Costs
Other Amortisation & Depreciation
Network Operator Operating Profit
161.865.0
4.8
92.1
(141.0)(26.7)
(73.7)
(40.6)
20.8
Financials
9M 2010
142.738.5
5.0
99.3
(150.7)(27.0)
(76.1)
(47.6)
(8.0)

| 26 |
Source: Company data, until 30 September 2010
MEDIASET PREMIUM | Active Clients
30 Sept 2008
3,285,000
2,850,000
Financials
2,471,000
30 Sept 2009 30 Sept 2010

| 27 |
MEDIASET ITALIAN BUSINESS 2010 9M | Pay TV
Total Net Pay TV Revenues
Pay TV Revenues
Advertising Revenues
Other Revenues
Commissions
Total Pay TV CostsPersonnel
Other Operating Costs
Rights Amortisations and Other D&A
Net intra-company items
Pay TV Operating Profit
9M 2009(Euro ml.)
379.9
212.2
18.3
152.0
(2.6)
(432.5)(10.6)
(212.2)
(178.2)
(31.5)
(52.6)
Financials
9M 2010
526.8
342.5
43.0
147.5
(6.3)
(527.7)(13.4)
(255.7)
(227.8)
(30.7)
(0.9)

| 28 |
Total Net RevenuesMedusa/Taodue 3° Party revenues
Medusa/Taodue intra-company revenues
Multimedia
Mediashopping
Other Non-TV Revenues
Net Intra-company items
Total CostsPersonnel
Other Operating Cost
Right Amortisations and other D&A
Intra-company Items
Other Activities Operating Profit
9M 2009(Euro ml.)
272.565.8
126.4
15.9
38.3
28.3
2.3
(236.3)(18.2)
(143.9)
(70.0)
(4.2)
36.2
Financials
MEDIASET ITALIAN BUSINESS 2010 9M | Other Activities
9M 2010
264.263.6
108.2
14.3
52.7
23.4
1.9
(234.2)(15.7)
(134.9)
(77.3)
(6.3)
29.9

| 29 |
395.5 424.2
486.9 67.0
35.1 55.7
46.347.8
(Euro ml.) TV rights and cinema
Pay TV rights
DTT
Technical & immaterial
Total Investments
MEDIASET ITALIAN BUSINESS 2010 9M | Investments
Financials
965.3 593.2
9M 20109M 2009

| 30 |
MEDIASET ITALIAN BUSINESS 2010 9M | Cash Flow Statement
Initial Net Financial Position (01/01)
Cash Flow from Core Activities
Cash Flow from Operations
Investments
Disinvestments
Change in Net Working Capital (CNWC)
Equity (Investments)/Disinvestment
Free Cash Flow
Change in consolidation area
Cashed in Dividends
Dividends
Total Net Cash Flow
Final Net Financial Position (30/09)
Group Net Financial Position (30/09)
9M 2009(Euro ml.)
(1,345.8)
230.7
870.0
(965.3)
1.2
324.7
(11.8)
218.9
26.7
107.6
(431.9)
(78.8)
(1,424.6)
(1,601.5)
Financials
9M 2010
(1,396.0)
403.0
967.3
(593.2)
1.8
27.1
5.9
408.9
-
25.7
(264.2)
170.4
(1,225.6)
(1,308.1)

| 31 |
MEDIASET SPANISH BUSINESS | Back up Slides
| 32 |
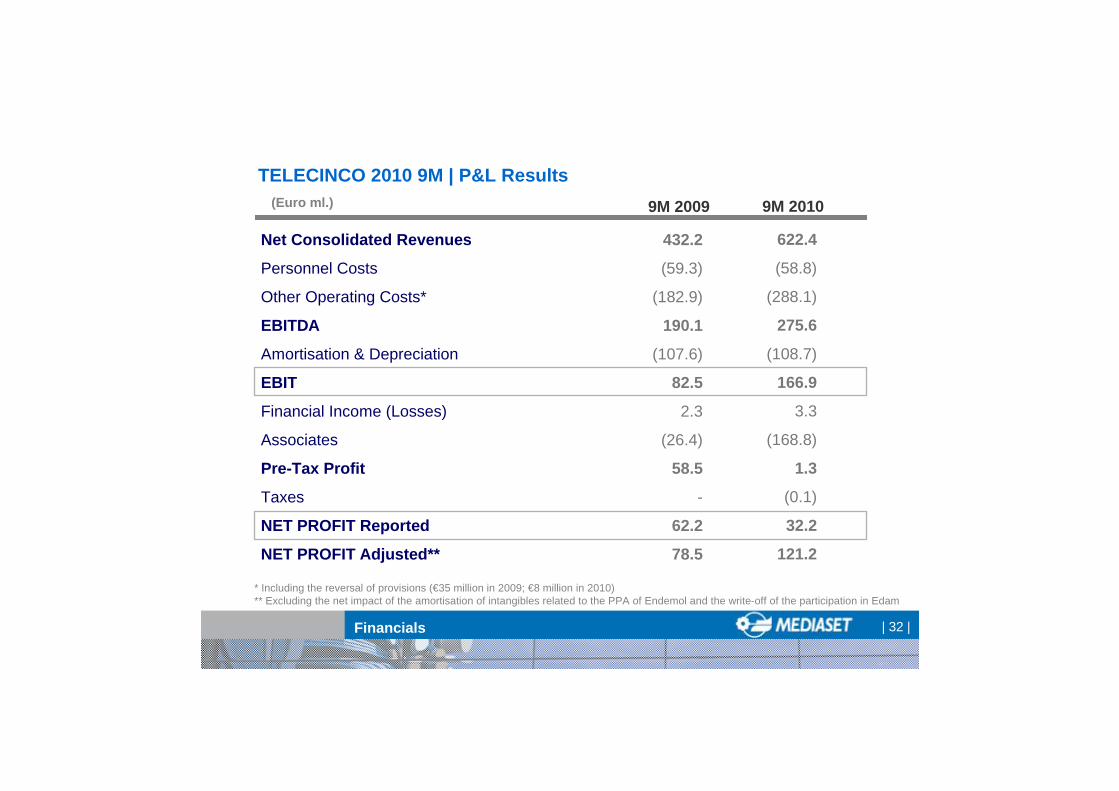
432.2
(59.3)
(182.9)
190.1
(107.6)
82.5
2.3
(26.4)
58.5
-
62.2
78.5
TELECINCO 2010 9M | P&L Results
Net Consolidated Revenues
Personnel Costs
Other Operating Costs*
EBITDA
Amortisation & Depreciation
EBIT
Financial Income (Losses)
Associates
Pre-Tax Profit
Taxes
NET PROFIT Reported
NET PROFIT Adjusted**
9M 2009(Euro ml.)
Financials
* Including the reversal of provisions (€35 million in 2009; €8 million in 2010)** Excluding the net impact of the amortisation of intangibles related to the PPA of Endemol and the write-off of the participation in Edam
622.4
(58.8)
(288.1)
275.6
(108.7)
166.9
3.3
(168.8)
1.3
(0.1)
32.2
121.2
9M 2010

| 33 | Financials
9M 20109M 2009
127.2 100.0
3.2 4.0
TV rights
Tangible & Intangible Fixed Assets
Total Investments
TELECINCO 2010 9M | Investments
135.8 121.0
(Euro ml.)
5.4 17.0Co-production & Distribution

| 34 | Financials
TELECINCO 2010 9M | Cash Flow Statement
Initial Net Financial Position (01/01)
Free Cash Flow
- Cash Flow from Operations
- Investments/Disinvestment
- Change in Net Working Capital (CNWC)
Change in consolidation area
Change in Equity
Equity (Investments)/Disinvest.
Cashed in Dividends
Dividends
Total Net Cash Flow
Final Net Financial Position (30/09)
9M 2009 9M 2010
(156.0)
185.4
279.6
(121.0)
26.9
-
1.4
(65.8)
1.0
(48.4)
73.5
(82.5)
(Euro ml.)
(25.9)
70.0
195.4
(135.8)
10.4
-
(2.8)
(9.8)
1.8
(210.3)
(151.1)
(176.9)

| 35 |
MEDIASET GROUP 2010 9M | Net Profit Adjustment
NET PROFIT (Reported)
Edam Adjustments from Telecinco
Telecinco Minorities
Net Edam PPA Adjustment
Adjusted NET PROFIT
192.6
89.0
(43.4)
29.7
267.9
(Euro ml.)
Financials
184.2
16.3
(7.9)
5.4
198.0
9M 2009 9M 2010

| 36 |
Forward-looking StatementsStatements contained in this document, particularly the ones regarding any Mediaset Group possible or assumed future performance, are or may be forward looking statements and in thisrespect they involve some risks and uncertainties.
Mediaset Group actual results and developments may differ materially from the onesexpressed or implied by the above statements depending on a variety of factors.
Any reference to past performance of Mediaset Group shall not be taken as an indication of future performance.
This announcement does not constitute an offer to sell or the solicitation of an offer to buy the securities discussed herein.
The executive responsible for the preparation of the Mediaset S.p.A. accounts, Andrea Goretti, declares that, as per para. 2 art. 154-bis, of the “Testo Unico della Finanza”, that the accounting information contained in this document corresponds to that contained in the company’s books.
Investor Relations Department:
Tel: +39 02 2514.7008Fax: +39 02 2514.6719Email: [email protected]: www.mediaset.it/investor/