Embed Size (px)
Citation preview

2010 Minerals Yearbook
U.S. Department of the Interior U.S. Geological Survey
BRAZIL
July 2012

Brazil—2010 4.1
The Mineral indusTry of Brazil
By alfredo C. Gurmendi
in 2010, Brazil continued to be a leading producer of minerals in the world and marketed about 80 mineral commodities. The country was a leading producer of steel feedstocks, such as high-content iron ore and niobium, and the third ranked producer of, in terms of volume, aluminum, alumina, bauxite, and iron ore. Brazil has discovered a massive pre-salt area that contains almost 90 billion barrels (Gbbl) of crude oil but is located at depths of 5 to 7 kilometers (km) and under a layer of salt up to 2 km thick, so developing and producing fuels from these pre-salt fields would be costly. In 2010, Brazil’s leading mineral exports were, in order of value, iron ore, gold, niobium, copper, manganese, bauxite, lead, and tin, and its leading imports were coal, potash, copper, and zinc, among others (Banco Central do Brasil, 2011b, p. 97, 107; Bray, 2011b; Departamento Nacional de Produção Mineral, 2011a, p. 6, 10; 2011b; instituto Brasileiro de Mineração, 2011a; Jorgenson, 2011; Papp, 2011a, b).
Minerals in the National Economy
Brazil’s mineral sector—which included metals, industrial minerals, and mineral fuels, biofuels, and ethanol—continued to experience a phase of real growth as a result of new mineral projects and expansions. Consequently, Brazil was expected to remain among the global leaders in the production of mineral commodities and to continue to attract domestic and foreign investors in its mineral industry. according to the Banco Central do Brasil, the country experienced two quarters of recession in 2009 as world demand for Brazil’s commodity-based exports and external credit decreased. after the global economic downturn, Brazil’s economy returned to growth in the second half of 2009, and in 2010, the economic recovery had a positive effect on the credit, earnings, liquidity, and solvency of the domestic banking system and made the country an attractive destination for foreign investment. With the revival of consumer and investor confidence, and boosted by the recovery in exports, Brazil’s real gross domestic product (GDP) increased by 7.5% in 2010 compared with a decrease of 0.6% in 2009. The mining and mineral processing industries contributed almost 3.6% of the GDP in 2010 compared with 2.4% in 2009, which was mostly attributable to the high international prices and increases in production of several mineral commodities, such as, in order of value, iron ore, petroleum, gold, copper, and lead. Of the total labor force of 102.2 million, the industrial sector employed 14.3 million (or 14%). Within the industrial sector, the mineral industry employed 786,500 (or 5.5%), of which 160,314 people were employed in mining, including 16,700 who were placer miners or garimpeiros (Banco Central do Brasil, 2011a, p. 4, 6–7; Departamento Nacional de Produção Mineral, 2011a, p. 2, 22–23; Economic Commission for latin america and the Caribbean, 2011, p. 31; international Monetary Fund, 2011a, p. 15–16; 2011b, p. 61; U.S. Central intelligence agency, 2011).
Government Policies and Programs
The National Department of Mineral Production (DNPM) provided a document titled “Taxation of Mining activities in Brazil—analysis of Current Situation and of Changes Proposed for Tax reform,” using the November 1999 legislation as its guide. The purpose of the document was to inform the tax reform discussion underway in the Brazilian National Congress (2010–11) that was aimed at developing a new tax policy in line with the national interest and the growing globalization of the economy. in addition to changing the terms of concession contracts, the proposal would create a National Council of Mineral resources to function as both a minerals regulator and advisor, with the purpose of increasing the royalties on mineral production. according to the instituto Brasileiro de Mineração (iBraM), the regulatory framework to be established for the pre-salt crude oil and natural gas reserves would influence the Government’s proposed minerals regulation framework agreement as well. Currently (2010), the Mining Code [Decree-law (act) No. 227 of February 28, 1967] governs all aspects of the mineral industry, from exploration to production and use of mineral resources, and establishes the rights and duties of the holders of mining rights. The Ministry of Mines and Energy’s (MME) DNPM has responsibility for managing the county’s mineral resources, for the inspection of the mineral activity in the country, and for enforcing the Mining Code and implementing its legal provisions. Decree-law (act) No. 227 was amended by law No. 9314 of November 14, 1996, to provide greater flexibility for investment in the Brazilian mining sector. article 7 stipulates that the production of minerals will depend upon the exploration authorization permit granted by the General Director of the DNPM and the development concession issued by the Minister of the MME. licensing is a restricted system applicable exclusively to the production of industrial minerals (Departamento Nacional de Produção Mineral, 2011c; instituto Brasileiro de Mineração, 2011b).
Article 20 of Brazil’s Constitution (which was enacted on October 5, 1988) and Constitutional amendments nos. 6 and 9, dated august 15, 1995, allow the participation of the private sector by means of joint ventures and private investment in the mining, natural gas, and petroleum sectors. The Government allows state-owned Petrobrás to enter into joint ventures with foreign investors and to invest overseas (Departamento Nacional de Produção Mineral, 2011c; instituto Brasileiro de Mineração, 2011b).
The agencia Nacional do Petróleo (aNP) is responsible for issuing exploration and production licenses and ensuring compliance with relevant regulations. recent legislation concerning pre-salt exploration and production has changed the operating environment somewhat. The Brazilian Government released the proposed regulatory framework for the pre-salt reserves in august 2009. The framework consists of four pieces

4.2 U.S. GEOlOGiCal SUrVEY MiNEralS YEarBOOK—2010
of legislation. The first two bills were signed into law in July 2010. The first law creates a new agency, Petrosal, to administer new pre-salt production. The second allows the Government to capitalize Petrobrás by granting the company 5 billion barrels (Gbbl) of unlicensed pre-salt oil reserves in exchange for a larger ownership share. The other two bills, which would establish a new development fund to manage Government revenues from pre-salt oil and lay out a new production-sharing agreement (PSa) system for pre-salt reserves, just passed by the Brazilian Congress in December 2010. Petrobrás would be the sole operator of each PSa and would hold a minimum 30% stake in all pre-salt projects (Departamento Nacional de Produção Mineral, 2011c; Empresa de Pesquisa Energética, 2011, p. 100–102).
The environmental licensing system is divided into three steps—a preliminary license, which is required during the planning stage; an installation license, which is required prior to any construction being done; and an operational license, which is required before beginning mining or processing operations. Decree No. 6848 of May 14, 2009, modifies Decree No. 4340 of august 22, 2002, to regulate the environmental compensation process (instituto Brasileiro de Mineração, 2011b).
Brazil’s import tax rates for minerals vary from 3% to 9%; the rate for ores and concentrates is 5% and that for other mineral derivatives is 7%. The export tax does not apply to exported mineral products, although there is a value-added tax. in most cases, the basis for assessment of corporate income taxes is the net profit for the fiscal year; the corporate tax rate ranges between 10% and 15% and is levied on the net profit. Profits may be expatriated. Equity ownership, which is allowed by means of privatization or by direct acquisition, may be as high as 100%. Since early 2007, the Concessions Law created additional opportunities for the private sector in public utilities previously reserved for the Government (Departamento Nacional de Produção Mineral, 2011c; instituto Brasileiro de Mineração, 2011a, b).
in 2010, the iBraM reported an investment of $321 million in mineral exploration compared with $234 million in 2009. The MME’s Companhia de Pesquisa de Recursos Minerais (CPRM) (Geological Survey of Brazil) was developing programs for basic geologic mapping; geophysical, metallogenetic, and hydrogeologic mapping; and prospecting in areas of potential development. The CPrM was also creating programs for environmental geology, geologic hazards, and hydrogeology, and maintaining the country’s geologic database and the corresponding economic analyses, particularly for coal, copper, diamond, gold, kaolin, nickel, peat, and zinc, to assist domestic and foreign investors in the mining sector (Companhia de Pesquisa de recursos Minerais, 2011, p. 15, 19, 43; Departamento Nacional de Produção Mineral, 2011b; instituto Brasileiro de Mineração, 2011a, b).
according to the CPrM, there are substantial mineral deposits to be discovered in Brazil. With only one-third of the country’s territory mapped, CPRM was planning to map the entire country’s geology. CPRM indicated that the chances of finding first class polymetallic deposits similar to the massive Carajas deposit in the State of Para were high, especially in the Amazon region. Carajas, which was the world’s largest iron
ore mine, holds an estimated 7.2 billion metric tons of iron ore resources (proven and probable) and produced about 100 million metric tons per year (Mt/yr). Vale was planning to increase Carajas’s production to 130 Mt/yr by 2012. The Carajas iron deposit also holds high content of copper, gold, manganese, and nickel (Companhia de Pesquisa de recursos Minerais, 2011; Vale S.a., 2011).
in 2010, the mining royalties collected by the Brazilian Financial Compensation for Exploiting Mineral resources—Federal royalty (CFEM) amounted to $556 million compared with $412 million in 2009. The CFEM rate is no more than 2% of the corporation’s net profit. The prevailing rates are 3% for bauxite, manganese ore, potassium, and rock salt; 2% for coal, fertilizers, iron ore, and other minerals; 1% for gold (gold in prospecting is exempt); and 0.2% for other precious minerals and precious stones. The collected royalties are allocated among the municipalities, States, and the Federal Government in the proportion of 65%, 23%, and 12%, respectively. The Federal Government shares its 12% CFEM fund with the DNPM (9.8%); the Fondo Nacional de Desarrollo Cientifico y Tecnologico (FNDCT), which is a funding instrument for technological innovation benefiting all Brazil’s productive sectors (2%); and the Brazilian Environment Agency (IBAMA) (0.2%) (Banco Central do Brasil, 2011a, p. 39; Departamento Nacional de Produção Mineral, 2011a, p. 24–26; 2011c; instituto Brasileiro de Mineração, 2011a).
Brazil was the 7th ranked economy in the world and had implemented a set of economic and social policies that had produced tangible results for the country’s economy. Brazil continued to participate in the BriCS (Brazil, russia, india, China, and South africa) economic forum, whose member countries, combined, accounted for 42% of the world’s population, 26% of the world’s land area, and 14.6% of the world’s GDP in late 2010 (FinancialMirror, 2011).
Production
According to IBRAM, the value of Brazil’s mineral production in 2010 was $39 billion compared with $24 billion in 2009. in the americas, Brazil continued to be a leading producer of aluminum, bauxite, cement, ferroalloys, gold, iron ore, kaolin, lead, manganese, nickel, steel, and tin. Brazil’s reportedly large mineral reserves and other identified resources help make it one of the leading mining countries in the americas and the world (table 3; Departamento Nacional de Produção Mineral, 2011a, p. 3; instituto Brasileiro de Mineração, 2011a).
Brazil’s major integrated steel operations had a producing area of 28 mills [13 integrated (from iron ore) and 15 semi-integrated (from processing pig iron and scrap)] managed by 10 business groups; together, the mills had an installed capacity of 44.6 Mt/yr of crude steel. In 2010, Brazil’s crude steel production amounted to 33 million metric tons (Mt) compared with 26.5 Mt in 2009. according to the instituto aço Brasil, the country was the seventh ranked producer of raw steel in the world and the leading producer in latin america. Brazil was the third ranked iron ore producer in the world after China and australia with an output of 372.1 Mt; Vale S.a. produced 297 Mt, or 79.8% of Brazil’s iron ore production

Brazil—2010 4.3
(Departamento Nacional de Produção Mineral, 2011b; instituto aço Brasil, 2011; Vale S.a., 2011).
Mineração rio do Norte S.a. (MrN), the majority of which was privately owned, was the world’s third ranked bauxite producer and exporter; it produced 16.8 Mt in 2010, which was about 53% of the country’s total revised bauxite production of 31.7 Mt, followed by Vale, which produced almost 24%, or about 7.5 Mt. Brazil produced 25 Mt of pig iron in 2010 compared with 22 Mt in 2009 (table 1; Departamento Nacional de Produção Mineral, 2011b; instituto Brasileiro de Mineração, 2011b; Vale S.a., 2011).
in 2010, Petrobrás continued to operate in an integrated fashion in the segments of exploration and production, refining, crude oil and natural gas trade and transportation, petrochemicals and derivatives, electric energy, and biofuel and other renewable energy source distribution. Petrobrás was a leader in the Brazilian petroleum sector and had a presence in 28 countries. The company expected to achieve self-sufficiency in crude oil and natural gas production and aimed to be among the top five integrated energy companies in the world by 2020. The company’s 2010–14 business plan foresees investments in the order of $174.4 billion, of which about 90% would be invested in the country and 10% would be invested overseas. Petrobrás was also planning to make domestic investments of $42 billion to develop its pre-salt petroleum resources in the atlantic zone. It was expected that Brazil’s total crude oil production would be 33.3 million barrels per day (Mbbl/d) by 2013.
Brazil’s diversified mineral endowment, competent labor force, and macroeconomic policies continued to attract investor interest in the country’s mining and petroleum industries in spite of the past (2008–9) global economic crisis. leading international mining, petroleum, and steel companies were notably interested in, in order of value, crude oil and gas, iron ore, steel, coal, gold, copper, and diamond (Departamento Nacional de Produção Mineral, 2011b; Petróleo Brasileiro S.a., 2011a).
Structure of the Mineral Industry
Brazilian corporations, which included those owned by private Brazilian and foreign investors and by the Government, partially or wholly owned the major portion of the mineral and petroleum sectors. in 2010, the DNPM had 7,809 companies [including more than 500 transnational corporations (TNCs) recorded in its annual mining report] that had established operations in Brazil owing to the country’s favorable policies on mergers, joint ventures, and privatization. The competitiveness of Brazil’s mineral industry resulted from investments in new technologies to improve efficiencies and productivity, particularly in, in order of value, the mining, crude oil and natural gas, and steel sectors (instituto Brasileiro de Mineração, 2011a, b; Departamento Nacional de Produção Mineral, 2011b, c).
in 2010, the integrated energy company Petrobrás was composed of the following related units: Petrobrás Química, S.A., which had integrated refining-petrochemical operations; Petrobrás Distribuidora S.a., which distributed petroleum products in Brazil; Petrobrás international Braspetro B.V., which handled international operations; Petrobrás international Finance Co., which facilitated the import of crude oil and
derivatives; Petrobrás Gás S.a., which was responsible for trading Brazilian and imported natural gas and fertilizers; Petrobrás Transporte S.a., which constructed and operated the facilities, pipelines, terminals, and vessels needed for the transportation and storage of crude oil and derivatives, natural gas, and bulk products; Downstream Participaçỡes S.A., which facilitated asset exchange between Petrobrás and repsol YPF S.A. of Spain’s subsidiary in Argentina for refining and distribution, among other subsidiaries. In 2010, Petrobrás’ operations around the world included those in angola, argentina, Bolivia, Chile, China, Colombia, Cuba, Ecuador, Japan, Mexico, Namibia, Netherlands, Nigeria, Paraguay, Peru, Portugal, the United Kingdom, and the United States, among others. in addition, the Brazilian cement companies Holcim (Brasil) S.a, lafarge (Brasil) S.a., Votorantim Cimentos S.a., and others owned 39 cement plants in eight Brazilian States and accounted for more than 75% of the national output of more than 59.1 Mt. among these cement plants, 12 were located in the State of Minas Gerais and 9 were located in the State of Sao Paulo (tables 1, 2; Departamento Nacional de Produção Mineral, 2011b; Petróleo Brasileiro S.a., 2011b).
Since 2000, TNCs had accounted for almost $400 billion in registered investment with the Banco Central do Brasil. Planned investments in the mineral sector during 2010–14 amounted to $62 billion. among the major TNCs operating in Brazil were anglo american plc, BHP Billiton plc, and BP p.l.c. of the United Kingdom; De Beers Group of South africa; and Glencore international aG of Switzerland (Banco Central do Brasil, 2011b, p. 91; Departamento Nacional de Produção Mineral, 2011b; instituto Brasileiro de Mineração, 2011a).
in 2010, the active international mining and oil companies in Brazil included alcan aluminum ltd., Barrick Gold Corp., and Teck Cominco inc. of Canada; Shanghai Baosteel of China; royal Dutch/Shell Group (Shell) of the Netherlands; Energia de Portugal; iberdrola S.a. and repsol of Spain; anglo american, BHP Minerals international Exploration inc. (BHP Billiton Ltd., 100%), and Rio Tinto plc of the United Kingdom; and Chevron Corp. (ChevronTexaco Brasil S.a.), Dow Chemical Co., Exxon Mobil Corp. (Esso Brasileira de Petróleo ltda.), Freeport-McMoran Copper & Gold inc., Newmont Mining Corp., and Placer Dome U.S. inc. of the United States (table 2; Departamento Nacional de Produção Mineral, 2011b; instituto Brasileiro de Mineração, 2011a).
in 2010, three international cement companies—Cimentos de Portugal, SGPS, S.a. (Cimpor) of Portugal; lafarge S.a. of France; and Holcim ltd. of Switzerland—were active in Brazil. according to the DNPM, 36 iron ore mining companies were operating 53 mines and 54 processing plants in the country. There were about 2,500 mineral mines in Brazil, which were classified conforming to their run-of-mine outputs: large mines—between 1 Mt/yr and 3 Mt/yr or higher; medium mines—between 100,000 metric tons per year (t/yr) and 1 Mt/yr; and small mines—between 10,000 and 100,000 t/yr (Departamento Nacional de Produção Mineral, 2011a).
in 2010, Brazil produced about 460,000 gigawatthours (GWh) of electric power and consumed about 420,000 GWh. Brazil’s domestic energy supply encompassed the following: hydroelectric, 74%; natural gas, 6.8%; imports, 6.5%;

4.4 U.S. GEOlOGiCal SUrVEY MiNEralS YEarBOOK—2010
biomass, 4.7%; oil products, 3.6%; nuclear, 2.7%; and others, 1.7% (Departamento Nacional de Produção Mineral, 2011b; Empresa de Pesquisa Energética, 2011, p. 14, 21; U.S. Energy information administration, 2011).
Mineral Trade
Brazil was the leading economy in latin america and a member of the Mercado Común del Cono Sur (MErCOSUr), which was the second largest trade association in the americas and the eighth worldwide. in 2010, exports were valued at almost $202 billion, and imports, $182 billion compared with $153 billion and $128 billion, respectively, in 2009. Brazil’s mineral sector had a trade surplus of $27.6 billion compared with revised $15.6 billion in 2009 (Banco Central do Brasil, 2011b, p. 91–92; Departamento Nacional de Produção Mineral, 2011a, p. 9; instituto Brasileiro de Mineração, 2011a).
The mineral industry contributed significantly to the country’s trade balance. in 2010, Brazil exported iron ore and concentrates (valued at $28.9 billion), gasoline and petroleum ($14.2 billion), flat-rolled products ($6 billion), ferroalloys ($5.8 billion), aluminum and aluminum products ($3.5 billion), gold in bars ($1.8 billion), ferroniobium (iron-niobium) ($1.6 billion), copper ($1.2 billion), pig iron ($971 million), and tubes and cast iron ($860 million) (Banco Central do Brasil, 2011b, p. 97; Departamento Nacional de Produção Mineral, 2011a, p. 10; 2011b; instituto Brasileiro de Mineração, 2011a).
Commodity Review
Metals
Aluminum and Bauxite and Alumina.—alumina production increased to more than 8 Mt from a revised 7.8 Mt in 2009, or by almost 3%. Exports of alumina totaled more than 6.4 Mt compared with more than 5.5 Mt in 2009. Primary aluminum production remained at about the same level as that of 2009 (1.5 Mt). Companhia Brasileira de alumínio (CBA) produced about 31% of Brazil’s primary aluminum; Alumínio Brasileiro S.A. (Albras), 29.5%; Alcoa Inc., 22.5%; BHP Billiton plc, 11.4%; and others, 5.6%. In 2010, exports of aluminum totaled 760,000 metric tons (t) valued at about $1.7 billion compared with 926,000 t valued at about $2.7 billion in 2009. Brazil’s imports of all forms of aluminum totaled 104,000 t valued at about $212 million in 2010 compared with 201,000 t valued at about $457 million in 2009. Bauxite production increased to 31.7 Mt in 2010 from almost 28.1 Mt in 2009. The MRN accounted for about 53% (16.8 Mt) of the total bauxite production for 2010. Exports amounted to about 6.8 Mt of bauxite compared with more than 3 Mt in 2009. according to the associação Brasileira do alumínio, Brazil’s consumption of aluminum products by end use were as follows: packaging (30%), transports (28%), electrical (12%), construction (10%), consumer durables (9%), machinery (4%), and others (7%). Brazil was the sixth ranked aluminum producer in the world after China, russia, Canada, australia, and the United States (associação Brasileira do alumínio, 2011; Bray, 2011a, b; Departamento Nacional de Produção Mineral, 2011b).
Copper.—Brazil’s copper production in concentrate increased slightly to 213,548 t in 2010 from a revised 211,692 t in 2009. The leading producers were Vale, with 116,813 t of the concentrate from its Sossego Mine in Carajas, State of Para, and Mineração Caraíba S/a, with 23,311 t from its deposit in Jaguari, State of Bahia. in 2010, Caraiba Metais S/a (CMSa) of Camacari, State of Bahia, which was the only electrolytic copper producer in Brazil, produced almost 219,800 t of primary copper metal compared with 217,600 t in 2009. in 2010, Brazil imported 467,870 t of copper ore, equivalent to 140,343 t of copper metal content mostly from Chile (93%) and Portugal (5%); 251,975 t of copper cathode mostly from Chile (80%) and Peru (18%); 60,669 t of manufactured copper products from Chile (58%), China (14%), and Peru (9%). CMSA was planning to produce about 500,000 t/yr of electrolytic copper in D’Avila, State of Bahia, by 2011 (Departamento Nacional de Produção Mineral, 2011a, p. 10; 2011b; instituto Brasileiro de Mineração, 2011a; Vale S.a., 2011).
In 2010, Vale’s copper project portfolio produced 207,000 t of concentrate compared with 198,000 t in 2009, or an increase of 4.5%. Vale’s copper projects included the sulfide ore resources of, in order of volume, the Sossego, the Salobo, the alemao, and the Cristalino deposits, and the oxidized ore deposit of Project 118; all these projects are located in the mineral province of Carajas, State of Para. Vale’s subsidiary Salobo Metais S/A was conducting a feasibility study for the Salobo copper project, which was expected to be completed by 2012; development of the project would require an investment of $1.2 billion. Salobo was expected to produce 520,000 t/yr of copper in concentrate and 255,000 t/yr of metal copper by 2013. The Salobo project in Maraba, State of Para, was Brazil’s largest copper deposit and could support a 520,000-t/yr-capacity mill. in 2010, Vale produced 10,000 t/yr of preliminary copper cathode from Project 118 and was planning to produce 38,000 t/yr by 2015 (Departamento Nacional de Produção Mineral, 2011b; Vale S.a., 2011).
Vale’s Cristalino copper deposit was in the process of a feasibility study; afterwards it was expected to produce 30,000 t/yr of copper concentrate by 2015 with an investment of $500 million. Vale continued to conduct intensive geologic prospecting to identify new copper areas in the Carajas District. Mineração Maracá S/a completed a feasibility study for the Chapada copper-gold-silver project in alto Horizonte, State of Goias. The estimated ore reserves amounted to 434.5 Mt containing 1.3 Mt of copper and 9.6 t of gold. The Chapada Mine was projected to produce 51,000 t/yr of copper concentrate, 2.8 t/yr of gold, and 6.1 t/yr of silver by 2012 (Departamento Nacional de Produção Mineral, 2011b; Vale S.a., 2011).
Gold.—Gold production increased to 62 t in 2010 from a revised 60 t in 2009, or by more than 3%; mining companies produced 55.6 t (89.5%), and garimpeiros produced 6.5 t (10.5%). In 2010, the leading producing companies were Kinross Gold Corp. (29%), AngloGold Ashanti Mineração Ltda. (22%), Yamana Gold Inc. (17%), Gold Digging (12%), and Jaguar Mining (7%), and others (13%). The leading producing States were Minas Gerais (64%), Bahia (11%), and Para (3%) (Departamento Nacional de Produção Mineral, 2011b; instituto Brasileiro de Mineração, 2011a).

Brazil—2010 4.5
Iron Ore and Iron and Steel.—Brazil produced 372.1 Mt of beneficiated iron ore in 2010 compared with a revised 298.5 Mt in 2009, which was an increase of about 24.7%. Of that production, the leading iron ore producer was Vale (79.8%); other producers, such as Companhia Siderúrgica Nacional (CSN), Minerações Brasileiras reunidas S/a (MBr), and Samarco Mineração S/A contributed the remaining 20.2%. In 2010, Brazil exported about 258.8 Mt of iron ore valued at almost $21.4 billion. The leading importers of Brazilian iron ore were China (46%); Japan (11%); Germany (7%), the Republic of Korea (4%); and France (3%) (Departamento Nacional de Produção Mineral, 2011a, p. 10; 2011b; instituto Brasileiro de Mineração, 2011a; Vale S.a., 2011).
Ferroalloys production increased to almost 1.1 Mt from a revised 831,121 t in 2009, or by more than 26.3%. Vale’s ferroalloys production increased to 207,000 t in 2010 compared with 99,000 t in 2009, or by 109.1%. Brazil’s Prometal Produtos Metalúrgicos S.A. and Norway’s Elkem A/S produced 210,000 t of ferromanganese in 2010 compared with a revised 154,000 t in 2009. The prometal project, in which Elkem held a 40% share, was located in Maraba, State of Para. The manganese was supplied by Vale’s Mina do Azul, and the iron ore was from Vale’s Serra dos Carajas Mine (Departamento Nacional de Produção Mineral, 2011a, p. 10; 2011b; instituto Brasileiro de Mineração, 2011a; Vale S.a., 2011).
Brazil produced 32 Mt of pig iron in 2010 compared with 35 Mt in 2009, which was a decrease of almost 8.6%. Brazil was the fifth ranked producer after China, Japan, Russia, and India (Departamento Nacional de Produção Mineral, 2011a, p. 10; 2011b; Fenton, 2011).
raw steel production increased to 33 Mt in 2010 from 26.5 Mt in 2009, or by more than 24.7%. Brazil exported 7.9 Mt of steel valued at $5 billion in 2010 compared with 7.5 Mt of steel valued at $6.5 billion in 2009. The major recipients of Brazil’s exports were the United States (45%); Mexico, the Republic of Korea, Taiwan, and Thailand (6% each); and Argentina, Chile, Colombia, and Spain (4% each). Brazil imported about 4.7 Mt of steel valued at $4.3 billion compared with more than 3 Mt of steel valued at almost $4.5 billion in 2009. More than 60% of China’s exports to Brazil were of metal-mechanic goods. The apparent domestic consumption of steel in Brazil was about 24.6 Mt compared with 27.2 Mt in 2009, which represented a decrease of about 9.6%. The Brazilian steel industry’s investments amounted to $34.1 billion during the period 1994 through 2010. New steel facilities could be added, which would represent an additional investment of more than $5 billion by 2013. after the effects of the past (2008–9) global economic crisis, however, investors in the sector were revising the implementation process for their new projects (Departamento Nacional de Produção Mineral, 2011a, p. 10–11; 2011b; Fenton, 2011; instituto aço Brasil, 2011).
Manganese.—Manganese production in concentrate (MnO2) increased to about 2.6 Mt in 2010 from a revised 2.3 Mt in 2009. Rio Doce Manganês S.A.’s (RDM) (a wholly owned subsidiary of Vale) manganese mines in the States of Minas Gerais (Morro da Mina) and Para (Mina do azul) produced about 1.8 Mt of manganese ore and 207,000 t of ferroalloys (ferromanganese) in 2010 compared with 1.7 Mt of manganese ore and 223,000 t
of ferroalloys (ferromanganese) in 2009. in 2010, domestic consumption of manganese was as follows: manganese ferroalloys, 90%, and electrical batteries, 10% (Departamento Nacional de Produção Mineral, 2011b; instituto Brasileiro de Mineração, 2011a; Vale S.a., 2011).
Nickel.—Brazil produced 108,983 t of nickel content in ore in 2010 compared with revised 41,059 t in 2009; production of electrolytic nickel was 19,111 t in 2010 compared with a revised 16,598 t in 2009; nickel in ferronickel alloys decreased to 8,465 t in 2010 from a revised 9,427 t in 2009; nickel in matte increased to 14,308 t in 2010 from a revised 8,518 t in 2009; and nickel in carbonates increased to 30,161 t in 2010 from a revised 16,766 t in 2009. Vale produced 179,000 t of nickel in 2010 compared with 187,000 t in 2009. in 2010, anglo american initiated operations in its Barro alto nickel project in the State of Goias. The company planned to produce 150,000 t/yr of nickel as concentrate content by 2012. in 2010, Vale invested $430 million to use a high-pressure acid-leaching technology to produce 25,000 t/yr of nickel from its Ourilandia project in Carajas, State of Para. Vale was also focused on the development of the Onca Puma nickel laterite project in the State of Para, and would invest a total of $2.3 billion in the project to produce 53,000 t/yr of nickel metal. With these additional projects, the production of nickel ore in Brazil was expected to increase by 200,000 t/yr in 2011 (table 1; Departamento Nacional de Produção Mineral, 2011b; instituto Brasileiro de Mineração, 2011a; Vale S.a., 2011).
Zinc.—Brazil produced 211,203 t of zinc content in concentrates in 2010 compared with a revised 172,688 t in 2009. Primary metal production increased to 288,107 t in 2010 from a revised 242,136 t in 2009; the increase represented almost 93% of the installed annual metal capacity of 310,000 t. Grupo Votorantim (GV) was the only producer of zinc in Brazil. Production was through GV’s two mines (Paracatu and Vazante) and two metallurgy operations (Juiz de Fora and Tres Marias) located in Minas Gerais State. GV produced 217,000 t of zinc metal mainly from domestic concentrates treated at the Tres Marias metallurgical and Juiz de Fora plants, which had the capacities to produce 180,000 t/yr and 110,000 t/yr of zinc metal, respectively, and 71,107 t of zinc metal entirely from imported concentrates (Departamento Nacional de Produção Mineral, 2011b; instituto Brasileiro de Mineração, 2011a; Votorantim Group, 2011).
Industrial Minerals
Asbestos.—in 2010, Brazil produced 302,257 t of asbestos (fiber content) compared with revised 288,452 t in 2009. Brazil’s significant asbestos deposits are located in Cana Brava and Minacu in the State of Goias; Goias was the only producing State in the country. Sociedade anônima Mineração de amianto was planning to increase its production capacity to 350,000 t/yr from 230,000 t/yr by 2013 and would continue to supply 90% of Brazil’s asbestos for the manufacture of specialized cement products, which were, in order of economic importance, ceiling tiles, protective screens, water and sewer pipes, water tanks, and molded electrical insulators. Other uses were, in order of value, thermal insulators, paper and cardboard, slabs, decorations,

4.6 U.S. GEOlOGiCal SUrVEY MiNEralS YEarBOOK—2010
insecticide, asphalt for highways and airport runways, and automobiles. asbestos mining and consumption were highly regulated in most industrialized nations and the use of asbestos continued to decline owing to health hazards. in 2010, Brazil was the third ranked world producer of asbestos after russia and China (Departamento Nacional de Produção Mineral, 2011b; Virta, 2011).
Gemstones.—in the americas, Brazil and Guyana followed Canada as the leading producers and traders of mostly alluvial diamond. in 2010, Brazil continued to be one of South America’s leading gemstone producers and exporters. Many different varieties of gemstones are found in the araxa, the Bambui, and the Canastra geologic groups; these include, in order of value (U.S. dollars per carat), diamond, emerald, aquamarine, topaz, tourmaline, opal, chrysoberyl, amethyst, citrine, and agate. Brazil was the world’s only source of some quality gemstones, such as imperial topaz and Paraiba tourmaline. In 2010, 52% of the diamond and gemstones was mined by mining companies and 48% was mined by garimpeiros. According to the DNPM’s Mineral Summary Statistics for 2006–9, Brazil’s diamond production from year to year had been uncertain, and annual production had been declining since 2007. The leading State producers were Mato Grosso (47%), Minas Gerais (43%), Bahia (4.9%), Piaui (2.9%), Parana (1.9%), and Goias (0.3%). The carats produced and reported conformed to the Kimberley Process Certification Scheme’s (KPCS) guidelines (table 1; Departamento Nacional de Produção Mineral, 2011b; Olson, 2011).
in 2010, Brazil exported 20,037 carats valued at $3.3 million; the major markets for Brazilian rough diamond were Belgium (93.2%), Israel (3.4%), China (2.3%), and India (1.1%). Brazil imported 21,747 carats valued at $382.7 million. About 98.5% of the imports was diamond (industrial) valued at $135.5 million from the United States and 1.5% was uncut stones valued at $247.2 million from the European Union, particularly from Belgium (Departamento Nacional de Produção Mineral, 2011a).
Phosphate Rock.—Production of phosphate rock (concentrates) amounted to 6.2 Mt in 2010 compared with a revised 6.1 Mt in 2009. The leading mining companies, in order of percentage of the country’s total reserves (340 Mt) were Vale (25%), Fosfértil S.A. and Ultrafértil S.A. (20% each), and Bunge Fertilizantes S.A. (15%) in Minas Gerais, and Copebras S.A. (6%) in Sao Paulo; together they represented 86% of the total reserves in 2010. The reported imports of concentrates amounted to 1.4 Mt in 2010 compared with 0.9 Mt in 2009. The reported domestic consumption of concentrates was about 7.6 Mt in 2010 compared with 7 Mt in 2009. Of the total phosphoric acid produced, 96% was used in the fertilizer industry and 4% was used in the chemical industry (Departamento Nacional de Produção Mineral, 2011b; instituto Brasileiro de Mineração, 2011a).
Mineral Fuels and Other Sources of Energy
Brazil had expanded its crude oil, natural gas, and electricity consumption in recent years. The country was the 9th ranked energy consumer in the world and the 3d ranked in the Western Hemisphere, after the United States and Canada. Total primary
energy consumption in Brazil had increased by more than 30% in the past decade owing to the country’s sustained economic growth. Increasing the country’s crude oil production, however, had been a long-term goal of the Brazilian Government, and recent offshore exploration in Brazil had resulted in massive discoveries of large pre-salt crude oil deposits, which could transform Brazil into one of the leading crude oil producers in the world. Total Brazilian energy consumption increased to 10.6 quadrillion British thermal units (BTU) in 2010. The largest share of Brazil’s total energy consumption came from oil and other liquids (50%, including ethanol), followed by hydroelectricity (34%) and natural gas (8%). Although natural gas was a small share of total energy consumption, attempts to diversify electricity generation from hydropower to gas-fired powerplants could cause natural gas consumption to increase in the coming years. also, attempts to diversify electricity generation, ranging from hydropower and renewable energy (biomass, ethanol, solar, and wind) to natural gas powerplants, could increase the consumption of natural gas (Departamento Nacional de Produção Mineral, 2011b; Petróleo Brasileiro S.a., 2011a; 2011b, p. 62–63).
Coal.—In 2010, Brazil produced 6.3 Mt of beneficiated coal compared with a revised 5.8 Mt in 2009. The Brazilian coal industry’s mine operations were concentrated in the three southernmost States of Rio Grande do Sul (54.8%), Santa Catarina (43.7%), and Parana (1.5%). Coal demand increased mainly because the thermoelectric plants were operating at full capacity in these three States (Departamento Nacional de Produção Mineral, 2011b).
To meet Brazil’s coal (coke, metallurgical) demand, 19.5 Mt was imported in 2010 compared with 14.5 Mt in 2009. imports came from the United States (37%), Australia (27%), Colombia (10%), Canada (8%), China (5%), and other countries (13%). In 2010, Brazil’s usage of coal was 81% to generate electric energy and 19% for industrial use (cellulose, 3.8%; petrochemicals, 3.3%; the food industry, 1.5%; ceramic, 1.3%; and others, 9.1%) (Departamento Nacional de Produção Mineral, 2011b).
Natural Gas, Petroleum, and Other Sources of Energy.—In 2010, Brazil’s gross natural gas production amounted to 22.9 billion cubic meters. Natural gas constituted only a small portion of Brazil’s energy consumption. The largest share of Brazil’s natural gas production took place in offshore fields in the Campos Basin (10 billion cubic meters) and the State of rio de Janeiro (8 billion cubic meters). Most onshore production took place in the States of amazonas and Bahia and was mostly for local consumption because of the shortage of transportation infrastructure. To meet increasing demand and to decrease reliance on imports, Petrobrás planned to bring several new natural gas projects online during the course of the coming years. also, the pre-salt areas were estimated to contain sizable natural gas reserves as well. according to Petrobrás, Tupi alone could contain between 140 and 200 billion cubic meters of recoverable natural gas, which, if proven, could increase Brazil’s total natural gas reserves by 50% (Departamento Nacional de Produção Mineral, 2011b; Petróleo Brasileiro S.a., 2011a; 2011b, p. 62–63).
In 2010, Brazil’s total natural gas proven reserves were estimated to be 824.7 billion cubic meters. Brazil imported

Brazil—2010 4.7
natural gas from Bolivia by way of the 2,000-mile Gasbol pipeline, which links Santa Cruz, Bolivia, to Porto alegre, Brazil, by way of Sao Paulo. Bolivia accounted for 96% (8.4 billion cubic meters) of Brazil’s total natural gas imports. Brazil had two liquefied natural gas (LNG) regasification terminals, both installed in the past 2 years (2009–10); they were the Pecem terminal in the northeast and the Guanabara Bay terminal in the southeast. Both facilities were floating regasification and storage units operated by Golar LNG, with a combined capacity of 210 million cubic meters per day. according to aNP, Brazil received 4 million cubic meters of natural gas in the form of lNG in 2010, mostly from Trinidad and Tobago (Departamento Nacional de Produção Mineral, 2011b; Petróleo Brasileiro S.a., 2011a; 2011b, p. 62–63).
Petrobrás was the dominant participant in Brazil’s petroleum sector, holding important positions in upstream, midstream, and downstream activities. in 2010, according to the Brazilian Empresa de Pesquisa Energética, Brazil’s crude oil reserves amounted to 28.5 Gbbl at yearend 2010, which ranked it second in reserves in South america after Venezuela. The offshore Campos and Santos Basins, which are located off of the country’s southern coast, hold the vast majority of Brazil’s proven reserves. Brazil’s crude oil production had risen steadily in recent years, and the country’s oil production in 2010 was about 2.1 Mbbl/d of liquids, or about 5% higher than in 2009. More than 90% of Brazil’s oil production was from offshore in very deep water and consisted of mostly heavy grades. Five fields in the Campos Basin (Barracuda, Marlim, Marlim leste, Marlim Sul, and roncador) accounted for more than 50% of Brazil’s crude oil production. These Petrobrás-operated fields each produced between 100,000 and 400,000 barrels per day (bbl/d). international oil companies also played a role in Brazilian production. The Shell-operated Parque de Conchas project and the Chevron-operated Frade project were expected to achieve production levels of 100,000 bbl/d and 68,000 bbl/d, respectively, by 2014. as pre-salt discoveries boost Brazilian production in the medium and long terms, crude oil exports are likely to increase steadily (BP p.l.c., 2011, p. 6–8, 20–22; Empresa de Pesquisa Energética, 2011, p. 38; Petróleo Brasileiro S.a., 2011a; 2011b, p. 62–63).
Brazil’s exports of crude oil amounted to about 640,000 bbl/d in 2010 compared with 525,700 bbl/d in 2009; however, this export growth could be moderated by increases in domestic consumption driven by rapid economic growth. Brazil still imported some light crude oil to meet the needs of its refineries. imports of crude oil decreased to 123.7 Mbbl in 2010 from 136.9 Mbbl in 2009. The leading import sources were Nigeria (45%), Algeria (15%), and Saudi Arabia (10%) (BP p.l.c., 2011, p. 6–8, 20–22; Empresa de Pesquisa Energética, 2011, p. 38; Petróleo Brasileiro S.a., 2011a; 2011b, p. 62–63).
Petrobrás was considering developing future subsea technology solutions for its crude oil and natural gas projects offshore Brazil, which would include the development of subsea production systems to address the challenges associated with Petrobras’ pre-salt crude oil and natural gas fields and the design of subsea processing technologies that could increase recovery rates at Petrobrás’ maturing crude oil and natural gas fields (Petróleo Brasileiro S.a., 2011a).
Petrobrás had also started numerous ethanol pipeline projects, including one that runs from Goias State to Sao Paulo State. BP Brasil ltda. was involved in the Edia ethanol project in Goias State, which produced 7,500 bbl/d of ethanol in 2010; ethanol was produced from sugar cane that grows in Brazil’s tropical climate. In 2010, Petrobrás’ foreign exploration for and production of mineral fuels took place in angola, argentina, Bolivia, Colombia, Ecuador, Nigeria, Peru, the United States, and Venezuela (BP p.l.c., 2011, p. 6–8, 20–22; Empresa de Pesquisa Energética, 2011, p. 38; Petróleo Brasileiro S.a., 2011a; 2011b, p. 62–63).
Brazil’s largest oil discoveries in recent years had come from the Atlantic offshore pre-salt basins. Petrobrás’ pre-salt Tupi/iracema pilot project in the Santos Basin was planned to produce 100,000 bbl/d of crude oil and 5,000,000 cubic meters per day of natural gas during 2011 and 2012. The Tupi/iracema deposit was expected to enter into its final development phase by 2017. The project was a consortium of Petrobrás (65%, operator), BG Group plc of the United Kingdom (25%), and Brazil’s Galp Energia S.A. (10%) to carry on the project’s evaluation plan, which was approved by the agência Nacional do Petróleo, Gás Natural e Biocombustíveis (Empresa de Pesquisa Energética, 2011, p. 39–40; Petróleo Brasileiro S.a., 2011b, p. 36, 62–63; U.S. Energy information administration, 2011, p. 1, 4, 6).
In 2010, the partnership of Shell (80%) and Petrobrás (20%) on the Bijupira and the Salema projects in Campos Basin also produced a combined 50,000 bbl/d of crude oil and more than 480,000 cubic meters per day of natural gas; the fields had resources of about 190 Mbbl of crude oil and 1.8 billion cubic meters of natural gas. Other companies involved in exploration in the pre-salt basins included Chevron, ExxonMobil, repsol, Shell, and Statoil aSa of Norway (Empresa de Pesquisa Energética, 2011, p. 38–40; Petróleo Brasileiro S.a., 2011a).
Reserves and Resources
Brazil was among the world leaders in reserves of some mineral commodities (table 3). The country’s world rankings for reserves of mineral commodities were as follows: first, niobium and tantalum; second, graphite; third, bauxite, tin, and zinc; fourth, magnesite and manganese; and fifth, iron ore (Departamento Nacional de Produção Mineral, 2011b).
Outlook
Brazil’s mineral sector, which includes metals, industrial minerals, and fuels, continued to experience a phase of real growth in 2010. The main vehicles for the foreign direct investment (FDI) inflows in the short and medium terms are expected to be consortia, joint ventures, and acquisitions in new projects with Petrobrás, Vale, and others. investments in biofuel, hydroelectric, nuclear, and thermoelectric powerplants are expected to meet Brazil’s future energy needs. As an exporter of mineral commodities, the country is poised to gain from the continued FDI inflows into its economy, which represented an almost 57% share ($48.5 billion) of South America’s total FDI of $85.1 billion in 2010. New mineral projects and expansions

4.8 U.S. GEOlOGiCal SUrVEY MiNEralS YEarBOOK—2010
that were in progress are expected to ensure that Brazil retains its position among the global leaders in mineral commodity production in the foreseeable future. Brazil’s renewed economic growth and its associated financial innovation are supporting an increase in the number of domestic and transnational investors in Brazil’s mineral industry and, in particular, in the metals, natural gas and petroleum, and biofuels and ethanol industries
in 2010, Brazil had undergone dramatic changes in the crude oil and natural gas markets owing to the increase in energy investment opportunities, and Brazil had become the center of an increasingly rapid process of energy integration in South america. according to the Banco Central do Brasil and the Economic Commission for latin america and the Caribbean, more than 400 leading TNCs were planning to invest in Brazil; these investments could position Brazil behind, in order of investment volume, China, the United States, and india. Brazil is expected to continue to be a strong economy in latin America and the BRICS countries. As one of the world’s leading producers of bauxite, crude oil, graphite, iron ore, manganese, niobium, tantalum, and tin, Brazil is expected to continue to attract additional FDI inflows in the near future (Azambuja, 2010, p. 27–40; Banco Central do Brasil, 2011a, p. 20; Economic Commission for latin america and the Caribbean, 2011, p. 31; Petróleo Brasileiro S.a., 2011a).
Brazil’s Federal tax exemptions on imports of equipment for minerals prospecting, exploration, development, and production are expected to continue in the medium and long terms. The aNP was planning to extend these exemptions for the fuels sector into 2020. Petroleum companies and other investors have shown confidence in the country, which could support continued economic growth and FDi in new technologies well into the next decade (Departamento Nacional de Produção Mineral, 2011b, c).
Brazil’s gold production could increase significantly in the foreseeable future because of the growth of Brazil’s copper production and increased interest by domestic and foreign investors in largely unexplored areas. More than 2,500 gold occurrences, which are mostly Precambrian vein deposits and alluvial placers, are known. according to iBraM, the Brazilian mining sector would receive significant investments in the amount of $68.5 billion for the period 2011–15. in 2010, investment in mineral exploration, such as for, in order of economic value, bauxite, copper, iron ore, and nickel, amounted to $321 million (instituto Brasileiro de Mineração, 2011a, b; Departamento Nacional de Produção Mineral, 2011b).
The Government eliminated all import tariffs and price controls on petroleum and derivatives to motivate private investment and to increase competition that would benefit the Brazilian economy. Petrobrás was expected to build additional refineries with the participation of new partners from the private sector (Departamento Nacional de Produção Mineral, 2011c; Petróleo Brasileiro S.a., 2011a).
The amazon region contains considerable natural gas resources that remain nonproductive as yet, especially the Urucu field, which contains Brazil’s largest onshore natural gas reserves. There is also the potential for major undiscovered mineral resources in addition to the large reserves of, in order of value, iron ore, manganese, bauxite, gold, and tin. There is, however, a concern over biodiversity in the amazon rainforest,
which comprises 30% of the world’s remaining tropical forests, and which provides shelter to 10% of the globe’s plant and animal species and removes excess carbon dioxide from the atmosphere. Much of future minerals production, therefore, will also depend on the approaches and new technologies to be used for economic and social development that protects the environment in a responsible and sustainable way (Departamento Nacional de Produção Mineral, 2011b).
References Cited
Associação Brasileira do Alumínio, 2011, Profile of the Brazilian aluminum industry—annual report 2009: associação Brasileira do alumínio. (accessed January 20, 2012, at http://www.abal.org.br/english/industria/perfil.asp.)
azambuja, Marcos, 2010, The BriC club, in Brazilian foreign policy, present and future: Washington, DC, liberdade e Cidadania Foundation, 120 p.
Banco Central do Brasil, 2011a, Economic and financial sector overview: Banco Central do Brasil, august, 94 p. (accessed January 20, 2012, at http://www.bcb.gov.br/pec/appron/apres/a_Tombini_EconomicandFinancialSectorOverview08-15-2011.pdf.)
Banco Central do Brasil, 2011b, relatório anual 2010: Banco Central do Brasil, 236 p. (accessed January 20, 2011, at http://www.bcb.gov.br/pec/boletim/banual2010/rel2010p.pdf.)
BP p.l.c., 2011, Statistical review of world energy: BP p.l.c., June, 49 p. (accessed January 31, 2012, at http://www.bp.com/liveassets/bp_internet/globalbp/globalbp_uk_english/reports_and_publications/statistical_energy_review_2011/STaGiNG/local_assets/pdf/statistical_review_of_world_energy_full_report_2011.pdf.)
Bray, E.l., 2011a, aluminum: U.S. Geological Survey Mineral Commodity Summaries 2011, p. 16–17.
Bray, E.l., 2011b, Bauxite and alumina: U.S. Geological Survey Mineral Commodity Summaries 2011, p. 26–27.
Companhia de Pesquisa de recursos Minerais, 2011, relatório da administração 2010: Companhia de Pesquisa de recursos Minerais, 65 p. (accessed January 24, 2012, at http://www.cprm.gov.br/publique/media/rel_anual_2010.pdf.)
Departamento Nacional de Produção Mineral, 2011a, Economic outlook of the Brazilian mining 2010: Departamento Nacional de Produção Mineral, 27 p. (accessed December 10, 2011, at http://www.dnpm.gov.br/panorama_economico_2010_eng.pdf.)
Departamento Nacional de Produção Mineral, 2011b, Sumário mineral 2011: Departamento Nacional de Produção Mineral. (accessed January 11, 2012, at https://sistemas.dnpm.gov.br/publicacao/mostra_imagem.asp?iDBancoarquivoarquivo=6350.)
Departamento Nacional de Produção Mineral, 2011c, Taxation of mining activities in Brazil—analysis of current situation and of changes proposed for tax reform: Departamento Nacional de Produção Mineral. (accessed January 24, 2012, at http://www.dnpm.gov.br/enportal/mostra_arquivo.asp?iDBancoarquivoarquivo=429.)
Economic Commission for latin america and the Caribbean, 2011, Foreign direct investment in latin america and the Caribbean 2010: Economic Commission for latin america and the Caribbean, 204 p. (accessed December 9, 2011, at http://www.eclac.org/publicaciones/xml/0/43290/2011-323-liEi-WEB.pdf.)
Empresa de Pesquisa Energética, 2011, Brazilian energy balance 2011: Brasilia, DF, Brazil, Empresa de Pesquisa Energética, 264 p.
Fenton, M.D., 2011, iron and steel: U.S. Geological Survey Mineral Commodity Summaries 2011, p. 78–79.
FinancialMirror, 2011, Brazil’s rise as a major world player: FinancialMirror. (Accessed December 9, 2011, at http://www.financialmirror.com/blog-details.php?nid=885.)
instituto aço Brasil, 2011, Steel market data 2010: instituto aço Brasil. (accessed January 25, 2012, at http://www.acobrasil.org.br/site/english/numeros/numeros--mercado.asp.)
instituto Brasileiro de Mineração, 2011a, a positive outlook for Brazilian mining: instituto Brasileiro de Mineração. (accessed January 11, 2012, at http://www.ibram.org.br/.)
instituto Brasileiro de Mineração, 2011b, Practical aspects of the Brazilian mineral legislation: instituto Brasileiro de Mineração. (accessed January 11, 2012, at http://www.ibram.org.br/).

Brazil—2010 4.9
international Monetary Fund, 2011a, regional economic outlook april 2011—Western hemisphere watching out for overheating: international Monetary Fund, 96 p. (accessed January 23, 2012, at http://www.imf.org/external/pubs/ft/reo/2011/whd/eng/pdf/wreo0411.pdf.)
international Monetary Fund, 2011b, World economic outlook april 2011—Tensions from the two-speed recovery unemployment, commodities, and capital flows: International Monetary Fund, 242 p. (Accessed July 29, 2011, at http://www.imf.org/external/pubs/ft/weo/2011/01/pdf/text.pdf.)
Jorgenson, J.D., 2011, iron ore: U.S. Geological Survey Mineral Commodity Summaries 2011, p. 84–85.
Olson, D.W., 2011, Gemstones: U.S. Geological Survey Mineral Commodity Summaries 2011, p. 62–63.
Papp, J.F., 2011a, Niobium (columbium): U.S. Geological Survey Mineral Commodity Summaries 2011, p. 110–111.
Papp, J.F., 2011b, Tantalum: U.S. Geological Survey Mineral Commodity Summaries 2011, p. 162–163.
Petróleo Brasileiro S.a., 2011a, Petrobrás—an integrated energy company: Petróleo Brasileiro S.a. (accessed January 26, 2012, at http://www.petrobras.com.br/en/about-us/profile/.)
Petróleo Brasileiro S.a., 2011b, Petrobrás magazine 2011: rio de Janeiro, Brasil, Petróleo Brasileiro S.a., issue 61, 62 p.
U.S. Central intelligence agency, 2011, Brazil, in The world factbook: U.S. Central intelligence agency. (accessed January 23, 2012, at https://www.cia.gov/library/publications/the-world-factbook/geos/br.html.)
U.S. Energy information administration, 2011, Brazil—analysis: U.S. Energy information administration, January. (accessed January 23, 2012, at http://www.eia.gov/countries/cab.cfm?fips=BR.)
Vale S.a., 2011, Mining production report 2010: Vale S.a. (accessed January 25, 2012, at http://www.vale.com.br/en-us/o-que-fazemos/mineracao/pages/default.aspx.)
Virta, r.l., 2011, asbestos: U.S. Geological Survey Mineral Commodity Summaries 2011, p. 22–23.
Votorantim Group, 2011, Consolidated presence in Brazil and worldwide—zinc: Votorantim Group. (accessed January 30, 2012, at http://www.votorantim.com.br/en-us/negocios/metais/Pages/zinco.aspx.)

4.10 U.S. GEOlOGiCal SUrVEY MiNEralS YEarBOOK—2010
2006 2007 2008 2009 2010p
aluminum:Bauxite, dry basis, gross weight 22,836,000 25,460,700 28,097,500 28,060,000 r 31,700,000alumina 6,720,000 7,077,600 7,822,300 7,800,000 r 8,040,000Metal:
Primary 1,605,000 1,655,000 1,661,100 1,536,000 r 1,536,000Secondary 253,000 255,000 256,000 250,000 r 252,000
Total 1,858,000 1,910,000 1,917,100 1,786,000 r 1,788,000Cadmium, metal, primarye 200 200 200 200 200Chromium:
Crude ore 562,739 627,772 664,347 r 365,210 r 520,129Concentrate and lump, Cr2O3 content 228,721 253,254 256,300 246,900 258,308Marketable producte, 3 12,000 12,000 12,000 12,000 12,000
Cobalt:e
Mine output, Co content of hydroxide 1,500 1,500 1,500 1,500 1,500Metal, electrolytic4, 5 1,200 1,200 1,200 1,200 1,200
Copper:Mine output, Cu content 147,836 205,728 218,295 r 211,692 r 213,548Metal, refined:
Electrowon -- r 900 r 3,800 r 6,500 r 7,400Primary 179,700 r 178,380 r 191,008 r 193,899 r 177,800Secondarye 40,000 r 40,000 r 39,000 r 31,000 r 47,700
Total 219,700 r 219,280 r 233,808 r 231,399 r 232,900Gold:
Mine output kilograms 39,266 44,443 r 46,066 r 52,207 r 55,592Garimpeiros, independent miners do. 5,150 5,170 r 8,600 r 8,123 r 6,455
Total do. 44,416 49,613 r 54,666 r 60,330 r 62,047iron and steel:
iron ore and concentrate, marketable product:6
Gross weight thousand metric tons 317,800 354,674 350,707 r 298,528 r 372,120Fe content do. 211,020 235,504 233,514 198,771 r 247,772
Metal:Pig iron do. 32,452 35,571 35,000 r 35,000 r 32,000Ferroalloys, electric arc furnace:
Ferrochromium 166,577 195,890 199,324 r 131,048 r 277,114Ferrochromium silicon 11,600 e 11,600 e 11,507 1,500 1,500Ferromanganese 573,430 r 419,230 r 388,000 r 154,000 r 210,000Ferronickel 9,814 9,918 7,136 r 9,427 r 8,465Ferronobium 41,566 52,442 53,839 34,746 r 52,588Ferrosilicon 146,000 e 146,000 e 144,832 145,000 145,000Ferrosilicon magnesiume 14,600 14,600 14,560 r 14,500 14,500inoculante 11,100 11,100 11,100 11,000 11,000Silicomanganese 180,000 e 180,000 e 178,560 178,600 178,600Silicon metal 133,000 e 133,000 e 131,940 132,000 132,000Other ferroalloys 19,500 e 19,500 e 19,344 19,300 19,300
Totale 1,310,000 r 1,190,000 r 1,160,142 r, 5 831,121 5 1,050,067 5
Crude steel, excluding castings thousand metric tons 30,900 34,782 r 33,700 r 26,500 33,033Semimanufactures, flat and nonflate do. 17,500 17,500 17,500 17,500 17,500
lead:Mine output, Pb content in concentrate 25,764 24,574 25,286 r 15,890 r 19,650Metal, secondary 108,951 130,963 95,704 104,160 r 114,887
Manganese:Ore and concentrate, marketable:3
Gross weight 3,390,000 r 1,570,000 r 3,200,000 r 2,320,000 r 2,620,000Metal content 1,120,000 r 520,000 r 1,280,000 r 928,000 r 1,048,000
Metal:Primary 18,450 22,140 20,910 19,580 19,580Secondarye 1,600 1,600 1,600 1,520 1,710
TaBlE 1Brazil: PrODUCTiON OF MiNEral COMMODiTiES1
Commodity2
METalS
(Metric tons unless otherwise specified)
See footnotes at end of table.

Brazil—2010 4.11
2006 2007 2008 2009 2010p
Nickel:Mine output, ore 5,503,211 5,927,554 6,380,055 r 4,333,069 r 11,128,385Ni content in ore 82,492 58,317 67,116 41,059 r 108,983Ni content in carbonate 21,630 20,796 18,580 r 16,766 r 30,161Ni content in matte 5,416 3,401 8,328 8,518 r 14,308Ni, electrolytic 21,339 21,635 18,530 16,598 r 19,111Ferronickel, Ni content 9,814 9,918 7,136 r 9,427 r 8,465
Niobium (columbium)-tantalum ores and concentrates, gross weight:Columbite and tantalitee 456 456 456 456 456Djalmaite concentratee 10 10 10 10 10Pyrochlore concentrate, Nb2O5 content 68,850 81,922 60,692 r 88,920 r 63,320
Silver:7
Primary kilograms 30,000 36,000 35,500 r 35,000 r 36,500Secondary do. 39,000 32,000 31,500 r 31,000 r 32,000
Total do. 69,000 68,000 67,000 r 66,000 r 68,500Tin:
Mine output, Sn content 9,528 11,835 13,899 r 9,500 r 10,400Metal, smelter:
Primary 8,780 9,384 11,020 r 8,311 r 9,098Secondarye 250 250 250 250 250
Total 9,030 9,634 10,558 10,600 10,600Titanium:
ilmenite:Gross weight 127,200 130,000 130,000 52,800 r 166,000TiO2 content 89,195 95,559 96,292 r 39,117 r 123,391
rutile, TiO2 content 2,100 3,000 2,309 r 2,737 r 2,519Tungsten, mine output, W content 525 537 408 r 192 r 166zinc:
Mine output, zn content 185,211 193,887 173,933 172,688 r 211,203Metal, smelter, primary 272,311 265,126 248,874 242,136 r 288,107
zirconium, zircon concentrate, gross weight8 25,120 26,739 26,739 26,700 26,700
asbestos:Crude ore 3,541,000 3,528,000 4,154,000 4,165,250 r 4,364,600Fiber 227,304 254,204 287,673 288,452 r 302,257
Barite:Crude 47,611 r 22,869 r 241,179 r 196,860 r 198,161Beneficiated 19,151 13,311 23,276 r 49,847 r 41,385Marketable producte, 3 45,000 45,000 45,000 45,000 45,000
Calcite thousand metric tons 16,736 r 21,844 r 22,255 r 14,565 r 18,930Cement, hydraulic do. 41,895 r 46,551 51,884 r 51,748 59,066Clays:
Bentonite, beneficiated 235,481 238,746 340,141 r 264,243 r 531,693Kaolin:
Crude 6,200,000 6,382,000 7,042,000 r 7,928,000 r 6,460,000Beneficiated 2,455,000 2,530,000 2,456,000 r 1,987,000 r 2,200,000Marketable product3 2,404,000 2,428,000 2,618,000 2,115,000 2,300,000
Diamond:e
Gem and industrial:Private sector thousand carats 84 84 38 r 11 r 13Garimpagem do. 97 98 33 r 10 r 12Total9 do. 181 182 71 r 21 r 25
Diatomite:Crude 10,753 9,638 12,126 r 7,534 r 9,264Beneficiated 8,968 5,555 4,430 r 4,350 r 4,082Marketable producte, 3 13,100 13,100 13,100 13,000 r 13,000
METalS—Continued
iNDUSTrial MiNEralS
See footnotes at end of table.
TaBlE 1—ContinuedBrazil: PrODUCTiON OF MiNEral COMMODiTiES1
(Metric tons unless otherwise specified)
Commodity2

4.12 U.S. GEOlOGiCal SUrVEY MiNEralS YEarBOOK—2010
2006 2007 2008 2009 2010p
Feldspar:Crude 166,418 5 182,168 5 182,200 5 182,000 e 182,000Marketable product:3
Feldspar 71,785 166,089 e 166,100 e 166,000 e 166,000 e
leucitee 5,000 5,000 5,000 5,000 5,000Sodalite, crudee 500 500 500 500 500
Total 77,285 171,589 171,600 171,500 171,500Fluorspar:
Crude ore 192,628 198,449 191,600 192,000 e 192,000Concentrates, marketable product:
acid-grade 41,373 45,342 45,032 28,803 r 7,486Metallurgical-grade 22,231 20,582 18,209 15,161 r 18,328
Total 63,604 65,924 63,241 43,964 r 25,814Graphite:
Crudee 650,000 650,000 650,000 650,000 650,000Marketable product, concentrate3 76,194 77,163 r 74,831 r 59,425 r 72,623
Gypsum and anhydrite, crude 1,711,671 1,923,119 2,238,645 r 2,348,390 r 2,750,000Kyanite:e
Crude 750 750 750 750 750Marketable product3 600 600 600 600 600
lime, hydrated and quicklime thousand metric tons 7,057 7,393 7,400 e 7,400 7,400lithium, concentrates 8,950 8,950 14,460 r 15,929 r 15,733Magnesite:
Crude 1,163,422 1,301,827 1,475,814 r 1,234,041 r 1,535,052Beneficiated 382,718 399,314 421,333 r 409,909 r 483,882
Mica, all gradese 4,000 4,000 4,000 4,000 4,000Nitrogen, N content of ammoniae 950,000 950,000 950,000 950,000 950,000Phosphate rock, including apatite:
Crude:Mine product thousand metric tons 36,700 38,265 39,243 42,000 42,000Of which sold directlye do. 35 35 35 35 35
Concentrate:Gross weight do. 5,932 6,185 6,727 r 6,084 r 6,192P2O5 content do. 2,111 2,185 2,472 r 2,163 r 2,179
Pigment, mineral, other, crudee 2,000 2,000 2,000 2,000 2,000Potash, marketable (K2O) 403,080 423,897 383,257 452,698 r 417,990Potassium (KCl) 635,200 636,500 575,480 716,630 r 661,690Precious and semiprecious stones except diamond,
crude and worked:e
agate 3,000 3,000 3,000 3,000 3,000amethyst 1,000 1,000 1,000 1,000 1,000aquamarine 20 20 20 20 20Citrine 100 100 100 100 100Emerald 90 90 90 90 90Opal 500 500 500 500 500ruby value $10,000 $10,000 $10,000 $10,000 $10,000Sapphire do. $15,000 $15,000 $15,000 $15,000 $15,000Topaz 50 50 50 50 50Tourmaline 80 80 80 80 80Other 500 500 500 500 500
Quartz crystal, all grades 14,195 22,561 21,511 r 11,588 r 13,024rare-earth metals, monazite concentrate, gross weight 958 1,173 834 r 303 r 500Salt:
Marine thousand metric tons 5,122 5,365 5,200 r 4,462 r 5,615rock do. 1,622 1,621 1,528 r 1,443 r 1,415
Silica, silexe 1,600 1,600 1,600 1,600 1,600See footnotes at end of table.
Brazil: PrODUCTiON OF MiNEral COMMODiTiES1
(Metric tons unless otherwise specified)
Commodity2
iNDUSTrial MiNEralS—Continued
TaBlE 1—Continued

Brazil—2010 4.13
2006 2007 2008 2009 2010p
Sodium compounds:eCaustic soda 1,050,000 1,050,000 1,050,000 1,050,000 1,050,000Soda ash, manufactured (barilla) 200,000 200,000 200,000 200,000 200,000
Stone, sand and gravel:eDimension stone:
Marble, rough-cut cubic meters 200,000 200,000 200,000 200,000 200,000Of which sold directly 50,000 50,000 50,000 50,000 50,000
Crushed and broken stone:Basalt cubic meters 1,200,000 1,200,000 1,200,000 1,200,000 1,200,000Calcareous shells 450,000 450,000 450,000 450,000 450,000Dolomite thousand metric tons 3,500 3,500 3,500 3,500 3,500Gneiss cubic meters 1,100,000 1,100,000 1,100,000 1,100,000 1,100,000Granite thousand cubic meters 60,000 60,000 60,000 60,000 60,000limestone thousand metric tons 60,000 60,000 60,000 60,000 60,000Quartz10 250,000 250,000 250,000 250,000 250,000Quartzite:
Crude 400,000 400,000 400,000 400,000 400,000Processed 200,000 200,000 200,000 200,000 200,000
Sand, industrial 2,700,000 2,700,000 2,700,000 2,700,000 2,700,000Sulfur:
Frasch 20,954 22,336 22,400 22,400 22,400Byproduct:
Metallurgy 297,539 321,707 321,750 321,800 r 321,800Petroleum 117,203 135,623 135,650 135,700 e 135,700
Total 435,696 479,666 479,800 479,900 e 479,900Talc and Pyrophyllite:
Combined:Crude 389,471 401,204 513,433 r 577,935 r 655,436Marketable producte, 3 2,000 2,000 2,000 2,000 2,000
Vermiculite:Concentrate 19,279 18,952 32,503 r 50,438 r 49,976Marketable producte, 3 3,100 3,100 3,100 3,100 3,100
Coal, bituminous:run-of-mine thousand metric tons 13,200 13,600 r 13,210 r 13,578 13,600Beneficiated/Marketable3 do. 5,528 6,133 r 6,723 r 5,818 r 6,310
Coke, metallurgical, all types do. 7,493 r 8,315 r 8,286 r 7,259 r 9,189Natural gas, gross million cubic meters 17,706 r 18,152 r 21,593 r 21,142 r 22,938Natural gas liquids million 42-gallon barrels 10,196 e 10,767 e 10,365 e 9,673 e 9,570Petroleum:
Crude thousand 42-gallon barrels 630,516 r 640,039 r 664,338 r 714,041 r 752,253refinery products:11, 12
liquefied petroleum gas (lPG) do. 13,891 14,175 14,437 r 15,675 15,700Gasoline do. 142,703 145,673 148,365 r 161,091 161,100Jet fuel do. 592 605 621 r 670 700Kerosene do. 27,727 28,304 28,827 r 31,300 31,300Distillate fuel oil do. 219,228 223,580 227,709 r 247,241 247,200lubricants do. 6,228 6,357 6,475 r 7,030 7,000residual fuel oil do. 125,731 128,348 130,719 r 141,932 142,000Other do. 106,906 109,131 111,147 r 120,681 121,700
Total do. 643,006 656,173 668,300 r 725,620 726,700eEstimated; estimated data are rounded to no more than thee significant digits; may not add to totals shown. pPreliminary. rrevised. do. Ditto. -- zero.1Table includes data available through December 31, 2011.
iNDUSTrial MiNEralS—Continued
MiNEral FUElS aND rElaTED MaTErialS
TaBlE 1—Continued
2in addition to the commodities listed, bismuth, molybdenite, and uranium oxide are produced, but output is not reported, and available information isinadequate to make reliable estimates of output.3Direct sales and (or) beneficiated (marketable product).4Source: Cobalt Development institute.5reported figure.
Commodity2
Brazil: PrODUCTiON OF MiNEral COMMODiTiES1
(Metric tons unless otherwise specified)

4.14 U.S. GEOlOGiCal SUrVEY MiNEralS YEarBOOK—2010
TaBlE 1—ContinuedBrazil: PrODUCTiON OF MiNEral COMMODiTiES1
6includes sponge iron, in metric tons, as follows: 2006 to 2010—270,000 (estimated).7Officially reported output. Of total production, the following quantities are identified as secondary silver (the balance being silver content of other
12Source: Economia Mineral do Brasil, Departamento Nacional de Produção Mineral, 2009 and 2010; and Petrobrás annual report 2009 and Petrobrás Magazine 2010.
8includes baddeleyite-caldasite.9Figures represent officially reported diamond output plus official Brazilian estimates of output by nonreporting miners.10apparently includes crude quartz used to produce quartz crystal (listed separately in this table), as well as additional quantities of common quartz.11Data are those officially reported to the United Nations by the Ministry of Mines and Energy of Brazil. Source: Energy Statistics Yearbook.
ores and concentrates), in kilograms: 2006 and 2007, 50,000; 2008 through 2010, 45,000.

Brazil—2010 4.15
Major operating companies and major equity owners location of main facilities annual capacity
aluminum Albras-Alumínio Brasileiro S.A. (Albras) [Vale S.A., 51%, Belem and Vila do Conde, Para State (two 455 (metal).and Nippon Amazon Aluminio Co. (NAAC), 49%] smelters)
Do. alcan alumínio do Brasil S.a. [alcan aluminum ltd. Saramenha, Minas Gerais State (smelter and 100 (metal).(Alcan), 100%] refinery)
Do. do. do. 150 (alumina).Do. alcan Empreendimentos ltda. (alcan alumínio do Brasil lamininaçao de Pindamonhangaba, Sao Paulo 280 (metal).
S.A., 100%) State (smelter)Do. alcan alumínio Poços de Caldas (alucaldas) (alcan Poços de Caldas, Minas Gerais State (mine) 1,000 (bauxite).
Alumínio do Brasil S.A., 100%)Do. Alcoa Alumínio S.A. (Alcoa Inc., 54%; BHP Billiton plc, do. 400 (bauxite).
36%; Alcan Aluminum Ltd., 10%)Do. do. Sao luiz, Maranhao State (refinery) 550 (alumina).Do. do. Sao luiz, Maranhao State (smelter) 239 (metal).Do. alumínio do Brasil Nordeste S.a. (alcan aluminum ltd., aratu, Bahia State (smelter) 120 (metal).
100%)Do. Alumar Consortium S.A. (Alcoa Alumínio S.A., 100%) Juriti bauxite mine, Para State 4,000 (bauxite).Do. Alumar Consortium S.A. (Alcoa Inc., 54%; BHP Billiton Sao luis, Maranhao State (refinery) 2,000 (alumina).
plc, 36%; Alcan Aluminum Ltd., 10%)Do. Alumar Consortium S.A. (Alcoa Inc., 53.66%, and BHP Sao luis, Maranhao State (smelter) 1,000 (metal).
Billiton plc, 46.34%)Do. alumínio do Norte do Brasil S.a. (alunorte) (Vale S.a., Barcarena, Para State (refinery) 6,300 (alumina).
57%, and Hydro Aluminium, Nippon, Japan Alunorte,43%)
Do. Companhia Brasileira de alumínio (CBa) (Votorantim Poços de Caldas, Minas Gerais State (mine) 1,000 (bauxite).Group, 100%)
Do. do. Sorocaba, Sao Paulo State (refinery) 500 (alumina).Do. do. Sorocaba, Sao Paulo State (smelter) 400 (metal).Do. Companhia Geral do Minas (aluminum Co. of america, Poços de Caldas, Minas Gerais State (refinery) 275 (alumina).
79%, and others, 21%)Do. do. Poços de Caldas, Minas Gerais State (smelter) 95 (metal).Do. Mineração Rio do Norte S.A. (MRN) (Vale S.A., 40%; Oriximina, Para State (mine) 18,000 (bauxite).
BHP Billiton plc, 14.8%; Alcoa Inc., 13.2%; AlcanEmpreendimentos Ltda., 12%; Companhia Brasileira deAluminio, Norsk Hydro Comercio e Industria, 5%;Reynolds Aluminio do Brasil, 5%)
Do. do. Papagalo, Para State (mine) 2,000 (bauxite).Do. do. Trombetas, Para State (mine) 2,000 (bauxite).Do. Vale do Sul Alumínio S.A. (Valesul) (Vale S.A., 100%) Santa Cruz, rio de Janeiro State (smelter) 95 (metal).Do. Reynolds Internacional do Brasil, 42.5%; Bradesco Bank, Sorocaba, Sao Paulo State (smelter) 5.4 million (cans).
42.5%; J.P. Morgan, 15%)Do. Vale S.A., (private, 100%) Paragominas, Para State (mine) 9,900 (bauxite).Do. do. Jabuti, Para State (alumina) 1,860 (alumina).
Chromite Coitezeirio Mineração S.A. (COMISA) (private, 75.4%, Campo Formosa, Bahia State (mine) 50 (ore).and Bayer do Brasil S.A., 24.6%)
Do. Companhia de Ferro ligas da Bahia (FErBaSa) do. 370 (ore).(private, 100%)
Do. do. Campo Formoso, Bahia State (beneficiation 292 (concentrate).plant)
Copper Vale S.A. (private, 100%) Sossego Mine, Serra dos Carajas, Para State 130 (ore).Do. do. Salobo Mine, Para State (copper concentrate and 520 (concentrate),
refinery plant) 255 (metal).Do. Mineração Caraíba S/a (Grupo ParaNaPaNEMa, Jaguari, Bahia State (mine) 130 (ore).
100%)Do. do. Jaguari, Bahia State (beneficiation plant) 90 (concentrate).Do. Caraíba Metais S/a (CMSa) (Grupo ParaNaPaNEMa, Camacari, Bahia State (refinery) 220 (metal).
100%)Do. Yamana Gold Inc. (YGI) (private, 100%) Chapada, alto Horizonte in Goias State (mine) 200 (concentrate).Do. Companhia Brasileira Carbureto de Calcio (private, Santos Dumont, Minas Gerais State (plant) 54.
100%)
METalSCommodity
See footnotes at end of table.
TaBlE 2Brazil: STrUCTUrE OF THE MiNEral iNDUSTrY iN 2010
(Thousand metric tons unless otherwise specified)

4.16 U.S. GEOlOGiCal SUrVEY MiNEralS YEarBOOK—2010
Major operating companies and major equity owners location of main facilities annual capacity
Ferroalloys Prometal Produtos Metalúrgicos S.A., 60%, and Elkem Maraba, Para State (plant) 500.A/S, 40%
Do. Nova Era Silicon S.A. (Vale S.A., 49%; Mitsubishi Corp., Nova Era, Minas Gerais State 48.25.5%; Kawasaki Steel Corp., 25.5%)
Do. Companhia Ferro-Ligas de Bahia S.A. (FERBASA), 100% Pojuca, Bahia State (plant) 194.Do. Companhia Ferro-ligas Minas Gerais (MiNaSliGaS), Pirapora, Minas Gerais State (plant) 58.
100%Do. Companhia Paulista de Ferro-ligas (CPF) (private, Barbacena, Caxambu, Jeceaba, Passa Quatro, 326.
100%) and Passa Vinte, Minas Gerais State;Corumba, Matto Grosso do Sul State; andXanxere, Santa Catarina State
Do. italmagnesio S.a. indústria e Comercio (iSaiC) (private, Braganca Paulista, Sao Paulo State; and 63.100%) Varzeada Palma, Minas Gerais State (two
plants)Do. Rio Doce Manganês S.A. (Vale S.A., 100%) Bahia, Mato Grosso do Sul, and Minas Gerais 600.Do. Urucum Mineração S.A. (Vale S.A., 100%) Corumba plant, Mato Grosso do Sul State 20.
Gold kilograms Vale S.A. (private, 100%) Gold mines in the States of Minas Gerais, Bahia, 18,000.and Para
Do. do. Mineração Morro Velho S.a. (angloGold ashanti Cuiaba, Novo lima, and Sabara, Minas Gerais 8,100.Minerção Ltda., 100%) State; and Jacobina, Bahia State (four mines)
Do. do. Mineração Serra Grande S.a. (angloGold ashanti Serra Grande, Minas Gerais State (mine) 6,000.Mineração Ltda., 50%, and Kinross Gold Corp., 50%)
Do. do. São Bento Mineração S.A. (Eldorado Gold Corp., 100%) Santa Barbara, Minas Gerais State (mine) 4,000.Do. do. Rio Paracatu Mineração S.A. (Kinross Gold Corp., 50%, Paracatu Mine, Minas Gerais State (mine) 7,500.
and Mineração Serra Grande S.A., 50%)Do. do. Yamana Gold Inc. (YGI) (private, 100%) Chapada, alto Horizonte in Goias State (mine) 1,200.Do. do. do. Sao Francisco Mine, Mato Grosso State (mine) 3,100.Do. do. do. Jacobina Mine, Bahia State (mine) 3,000.Do. do. do. Fazenda Brasileiro, Goias State (mine) 3,700.Do. do. do. Sao Vicente Mine, Mato Grosso State (mine) 1,900.
iron ore Companhia Siderúrgica Nacional (CSN) (private, 100%) Volta Mine, Minas Gerais State 15,000.Do. Itaminas Comércio de Minérios S.A. (private, 100%) itaminas, Minas Gerais State 5,000.Do. Vale S.A. (private, 100%) Serra dos Carajas Mine in Parauapebas, 100,400.
Para StateDo. do. itabirito, Mato, Vargem Grande, and Paraopeba, 87,300.
Minas Gerais State (four mines)Do. do. itabira, Ouro Preto, Santa Barbara, Xavier, 134,600.
Tamandúa, Capao, and Mato, Minas GeraisState (seven mines)
Do. do. Mato Grosso do Sul State (one mine) 1,500.Do. do. Ponta Madeira, Sao luis, and Tubarao, Maranhao 31,700.
State (pellet plants)Do. Vale S.A. (Vale S.A., 50.9%, and Arcelor Mittal Co., Hispanobras, Espirito Santo State (pellet plant) 3,800.
49.1%)Do. Vale S.A. (Vale S.A., 50%, and BHP Billiton plc, 50%) Sepetiba, Samarco, rio de Janeiro State 21,800.
(pellet plant)Do. Ferteco Mineração S.a. (FErTECO) (Exploration Ouro Preto and Brumadinho, Minas Gerais 12,800.
Bergbau GmbH, 100%) State (two mines)Do. S.A. Mineração da Trindade (SAMITRI) (private, 100%) Mariana, rio Piracicaba, itabira, Ouro Preto, 9,300.
and Sabara, Minas Gerais State (five mines)Do. Minerações Brasileiras reunidas S/a (MBr) (BHP Capao Xavier, Tamandua, and Capitao do Mato, 32,000.
Billiton plc, 50%, and Mitsui Co. Ltd., 50%) Minas Gerais State (three mines)Do. Samarco Mineração S.A. (SAMITRI), 51%, and alegria, Minas Gerais State (mine) 15,000.
BHP Billiton Ltd., 49%Do. Mineração Corumbaense reunida S/a (MCr) (rio Tinto Corumba, Mato Grosso do Sul (mine) 2,000.
plc, 100%)lead Companhia Mineira de Metais (CMM) (private, 100%) Paracatu, Minas Gerais State (mine) 25 (ore).
Do. do. Paracatu, Minas Gerais State (plant) 15 (concentrate).
METalS—ContinuedCommodity
See footnotes at end of table.
TaBlE 2—Continued
(Thousand metric tons unless otherwise specified)
Brazil: STrUCTUrE OF THE MiNEral iNDUSTrY iN 2010

Brazil—2010 4.17
Commodity Major operating companies and major equity owners location of main facilities annual capacity
Manganese Rio Doce Manganês S.A. (RDM) (Vale S.A., 100%) Morro da Mina, Minas Gerais State 300.Do. do. Mina do azul, Carajas, Para State 2,500.Do. do. Mina Mineiros, Bahia State 1,500.Do. Urucum Mineração S.A. (Vale S.A., 100%) Corumba and ladario, Mato Grosso do Sul 1,500 (ore), 500
State (two mines and plant) (concentrate).Do. Construtora Polares Ltda. (CPL) (private, 100%) Corumba Minas Gerais State (mine) 200 (ore).
Nickel Companhia Niquel Tocantins (Grupo Votarantim, 100%) Niquelandia, Goias State (mine) 30 (ore).Do. do. Niquelandia, Goias State (refinery plant) 25 (electrolytic).Do. Mineração Serra da Fortaleza (Grupo Votarantim, 100%) Fortaleza, Minas Gerais State (mine) 19 (nickel matte).Do. CODEMIN S.A. (Anglo American plc, 100%) Niquelandia, Goias State (refinery) 20 (metal).Do. Vale S.A. (private 100%) Onca Puma and Vermelho, Para State 58 (iron-nickel
(alloy plant) alloy).Niobium (columbium) Companhia Brasileira de Metalurgia e Mineração (Grupo araxa, Minas Gerais State (mine) 120 (ore).
Moreira Sales S.A., 55%, and Molycorp, Inc., 45%)Do. do. araxa, Minas Gerais State (beneficiation plant) 60 (pyrochlore).Do. Mineração Catalão de Goiás ltda. (MCGl) (Bozzano Ouvidor and Catalao i, Goias State (mines) 70 (ore).
Simosen S.A., 68.5%, and Anglo American plc, 31.5%)Do. do. Ouvidor, Goias State (plants) 24 (pyrochlore).
Steel Aço Minas Gerais S.A. (GERDAU AÇOMINAS, 100%) rodovia, Minas Gerais State 7,000.Do. Acesita S.A. (private, 100%) Timoteo, Minas Gerais State (specialty steel) 900.Do. Companhia Siderúrgica Belgo-Mineira (private, 100%) João Monlevade, Minas Gerais State 1,000.Do. Companhia Siderúrgica de Tubarão (private, 100%) Serra, Espírito Santo State 4,800.Do. Companhia Siderúrgica Nacional (CSN) (private, 100%) Volta redonda, rio de Janeiro State 5,800.Do. Companhia Siderúrgica Paulista (COSiPa) (private, Cubatao, Sao Paulo State 4,500.
100%)Do. Usinas Siderúrgicas de Minas Gerais, S.a. (USiMiNaS) ipatinga, Minas Gerais State 5,500.
(private, 100%)Tantalum metric tons Mineração Taboca/AM (private, 100%) Pitinga Mine, amazonas State (mine) 180 (concentrate).
Do. do. Companhia Industrial Fluminense S.A. (private, 100%) Fluminense Mine, Minas Gerais State (mine) 25 (concentrate).Tin Mineração Jacunda Ltda. (MJL) (private, 100%) Santa Barbara, Novo Mundo, and Potosi, 108 (ore).
rondonia State (six mines)Do. do. Santa Barbara, Novo Mundo, and Potosi, 450 (concentrate).
rondonia State (three beneficiation plants)Do. Grupo PARANAPANEMA (private, 100%) aripuana, Mato Grosso State; ariquemes, 5,420 (ore).
rondonia State; Novo aripuana, Pitinga,and Presidente Figueiredo, amazonas State;and Sao Felix do Xingu, Para State (fivemines and two plants)
Do. do. Piraporada Bom Jesus, Sao Paulo State 1,400 (concentrate),(refinery) 25 (metal).
Do. Marmoré S.A. (Grupo PARANAPANEMA, 100%) Juiz de Fora, Minas Gerais State (mine) 20 (ore).Do. Grupo PARANAPANEMA (private, 100%) aripuana, Mato Grosso State; ariquemes, 5,420 (ore).
rondonia State; Novo aripuana, Pitinga,and Presidente Figueiredo, amazonas State;and Sao Felix do Xingu, Para State (fivemines and two plants)
Do. do. Piraporada Bom Jesus, Sao Paulo State 1,400 (concentrate),(refinery) 25 (metal).
Do. Marmoré S.A. (Grupo PARANAPANEMA, 100%) Juiz de Fora, Minas Gerais State (mine) 20 (ore).Titanium Rutilo e Ilmenita do Brasil S.A. (RIBSA), 100% Mataraca, Paraiba State (mine) 4,200 (ore).
Do. do. Mataraca, Paraiba State (two beneficiation 120 (concentrate).plants)
zinc Votorantim Metais Zinco S/A (Grupo Votorantim, 100%) Vazante, Minas Gerais State (mine) 800 (ore).Do. do. Vazante, Minas Gerais State (beneficiation plant) 175 (concentrate).Do. do. Tres Marias, Minas Gerais State (refinery) 180 (metal).Do. do. Juiz de Fora, Minas Gerais State (complex) 130 (metal).
zirconium Nuclemon Minero-Química Ltda. (Government, 100%) Sao Joao da Barra, rio de Janeiro State (mine) 660 (ore).Do. do. itapemirim, Espirito Santo State (mine) 90 (ore).
See footnotes at end of table.
(Thousand metric tons unless otherwise specified)
Brazil: STrUCTUrE OF THE MiNEral iNDUSTrY iN 2010
METalS—Continued
TaBlE 2—Continued

4.18 U.S. GEOlOGiCal SUrVEY MiNEralS YEarBOOK—2010
Commodity Major operating companies and major equity owners location of main facilities annual capacity
zirconium—Continued Nuclemon Minero-Química Ltda. (Government, 100%) Prado, Bahia State (mine) 90 (ore).Do. do. Prado, Bahia State (three beneficiation plants) 123 (concentrate).Do. do. Prado, Bahia State (three separation plants) 90 (concentrate).
asbestos Sociedade anônima Mineração de amianto (private, Cana Brava and Minacu, Goias State (mines) 9,000 (ore).100%)
Do. do. Cana Brava and Minacu, Goias State 230 (concentrate).(beneficiation plant)
Cement Votorantim Cimentos S.A. (Grupo Votorantim, 100%) itapevi and Salto de Pirapora, Sao Paulo State 5,000 (3 plants).Do. do. itau de Minas, Minas Gerais State 5,000 (3 plants).Do. do. rio Branco do Sul, Parana State 5,000 (3 plants).Do. do. Cipasa, Santa Elena, Sergipe State 5,000 (3 plants).Do. do. Cantagalo, Esteio, rio Grande do Sul State 5,000 (3 plants).Do. Companhia de Cimento Portland Paraiso (CCPP), 50%, States of Espirito Santo, Goias, Minas Gerais, 4,000.
and Lafarge S.A., 50% and rio de Janeiro (five plants)Do. Companhia de Cimento Portland S.a. (CiMPOr Brazil) States of rio Grande do Sul, Santa Catarina, Sao 6,000.
Paulo, Goias, and Bahia (six plants)Do. Camargo Correia Cimentos S.A. (CCSA) (private, 100%) ijaci, Minas Gerais State (plant) 1,600.Do. Holcim (Brasil) S.a. Chacara, San antonio, Sao Paulo State 5,000.
(four plants)Fluorspar Mineração Nossa Senhora do Carmo ltda. (private, Cerro azul, Parana State (two mines) 180 (ore).
100%)Do. Mineração Santa Catarina Ltda. (MSCL) (private, 100%) Morro da Fumaça, Santa rosa de lima, rio 100 (ore), 120
Fortuna, Santa Catarina State; and Tangua, (concentrate).rio de Janeiro State (three mines andbeneficiation plant)
Gemstones carats Mineradora S/A (Diagem do Brasil Mineração Ltda., 100%) Juina, Mato Grosso State 92,100.Do. do. Chapada Brasil Ltda. (Grupo Elkedra Diamonds NL, 100%) Chapada dos Guimaraes, Mato Grosso State 100,000.
(mine)Do. do. Mineração Rio Novo S/A. (private, 100%) Diamantina, Minas Gerais State (mine) 107,500.
Graphite Nacional de Grafite Ltda. (NGL) (private, 100%) itapecerica, Pedra azul, Salto da Divisa, Minas 80 (ore).Gerais State (three mines)
Do. do. itapecerica, Pedra azul, Salto da Divisa, Minas 60 (concentrate).Gerais State (three beneficiation plants)
Do. Grafita MG Ltda. (GML) (private, 100%) Mateus leme, zerra azul, Minas Gerais State 20 (ore).(two mines)
Do. Marmoré Mineração e Metalurgia ltda. (MMl) (Grupo Maiquinique, Bahia State (mine) 10 (ore).PARANAPANEMA, 100%)
Gypsum Companhia Brasileira de Equipamento (private, 100%) Codo, Maranhao State, and ipubi, Pernambuco 600 (ore).State (two mines)
Do. Mineradora Rancharia Ltd/Supergesso S.A (private, 100%) ipubi, Pernambuco State (mine) 600 (ore).Do. Holcin Brasil S.A. (Grupo Holderbank, 100%) Holder, Pernambuco State (mine) 600 (ore).Do. Mineradora São Jorge S.A (Grupo Laudenor Lins, 100%) Sao Jorge, Maranhao State (mine) 110 (ore).Do. Votorantin Cimentos N/NE (private, 100%) Mateo, Ceara State (mine) 70 (ore).
Kaolin Caulim da Amazônia S.A. (CADAM) (private, 100%) Mazagao, amapa State (mine) 720 (ore).Do. do. Mazagao, amapa State (beneficiation plant) 360 (concentrate).Do. do. adam Mine, rio Jari, amazonas State 660 (concentrate).Do. Pará Pigmentos S.A. (PPSA) (private, 100%) Para Mine, Para State 500 (concentrate).Do. Ymerys rio Capim Caulim S.a. (rCCSa) (private, rio Capim Mine, Para State 500 (concentrate).
100%)Do. Empresa de Mineração Horii ltda. (EMHl) (private, Biritiba and Mogi das Cruzes, Sao Paulo State 200 (ore).
100%) (two mines)Do. do. Biritiba and Mogi das Cruzes, Sao Paulo State 180 (concentrate).
(two beneficiation plants)
iNDUSTrial MiNEralS
Brazil: STrUCTUrE OF THE MiNEral iNDUSTrY iN 2010TaBlE 2—Continued
(Thousand metric tons unless otherwise specified)
METalS—Continued
See footnotes at end of table.
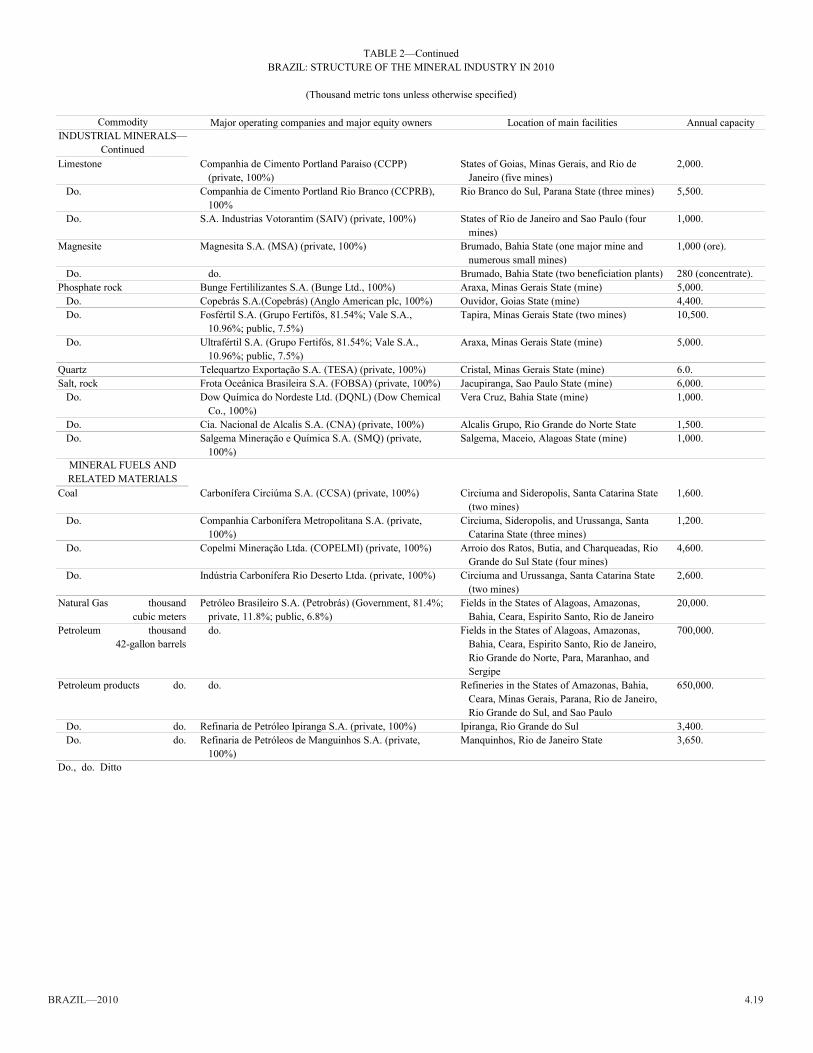
Brazil—2010 4.19
Major operating companies and major equity owners location of main facilities annual capacity
limestone Companhia de Cimento Portland Paraiso (CCPP) States of Goias, Minas Gerais, and rio de 2,000.(private, 100%) Janeiro (five mines)
Do. Companhia de Cimento Portland rio Branco (CCPrB), rio Branco do Sul, Parana State (three mines) 5,500.100%
Do. S.A. Industrias Votorantim (SAIV) (private, 100%) States of rio de Janeiro and Sao Paulo (four 1,000.mines)
Magnesite Magnesita S.A. (MSA) (private, 100%) Brumado, Bahia State (one major mine and 1,000 (ore).numerous small mines)
Do. do. Brumado, Bahia State (two beneficiation plants) 280 (concentrate).Phosphate rock Bunge Fertililizantes S.A. (Bunge Ltd., 100%) araxa, Minas Gerais State (mine) 5,000.
Do. Copebrás S.A.(Copebrás) (Anglo American plc, 100%) Ouvidor, Goias State (mine) 4,400.Do. Fosfértil S.A. (Grupo Fertifós, 81.54%; Vale S.A., Tapira, Minas Gerais State (two mines) 10,500.
10.96%; public, 7.5%)Do. Ultrafértil S.A. (Grupo Fertifós, 81.54%; Vale S.A., araxa, Minas Gerais State (mine) 5,000.
10.96%; public, 7.5%)Quartz Telequartzo Exportação S.A. (TESA) (private, 100%) Cristal, Minas Gerais State (mine) 6.0.Salt, rock Frota Oceânica Brasileira S.A. (FOBSA) (private, 100%) Jacupiranga, Sao Paulo State (mine) 6,000.
Do. Dow Química do Nordeste ltd. (DQNl) (Dow Chemical Vera Cruz, Bahia State (mine) 1,000.Co., 100%)
Do. Cia. Nacional de Alcalis S.A. (CNA) (private, 100%) alcalis Grupo, rio Grande do Norte State 1,500.Do. Salgema Mineração e Química S.a. (SMQ) (private, Salgema, Maceio, alagoas State (mine) 1,000.
100%)
Coal Carbonífera Circiúma S.A. (CCSA) (private, 100%) Circiuma and Sideropolis, Santa Catarina State 1,600.(two mines)
Do. Companhia Carbonífera Metropolitana S.a. (private, Circiuma, Sideropolis, and Urussanga, Santa 1,200.100%) Catarina State (three mines)
Do. Copelmi Mineração Ltda. (COPELMI) (private, 100%) arroio dos ratos, Butia, and Charqueadas, rio 4,600.Grande do Sul State (four mines)
Do. Indústria Carbonífera Rio Deserto Ltda. (private, 100%) Circiuma and Urussanga, Santa Catarina State 2,600.(two mines)
Natural Gas thousand Petróleo Brasileiro S.A. (Petrobrás) (Government, 81.4%; Fields in the States of alagoas, amazonas, 20,000.cubic meters private, 11.8%; public, 6.8%) Bahia, Ceara, Espirito Santo, rio de Janeiro
Petroleum thousand do. Fields in the States of alagoas, amazonas, 700,000.42-gallon barrels Bahia, Ceara, Espirito Santo, rio de Janeiro,
rio Grande do Norte, Para, Maranhao, andSergipe
Petroleum products do. do. refineries in the States of amazonas, Bahia, 650,000.Ceara, Minas Gerais, Parana, rio de Janeiro,rio Grande do Sul, and Sao Paulo
Do. do. Refinaria de Petróleo Ipiranga S.A. (private, 100%) ipiranga, rio Grande do Sul 3,400.Do. do. refinaria de Petróleos de Manguinhos S.a. (private, Manquinhos, rio de Janeiro State 3,650.
100%)
Commodity
Brazil: STrUCTUrE OF THE MiNEral iNDUSTrY iN 2010TaBlE 2—Continued
iNDUSTrial MiNEralS—Continued
Do., do. Ditto
(Thousand metric tons unless otherwise specified)
MiNEral FUElS aNDrElaTED MaTErialS
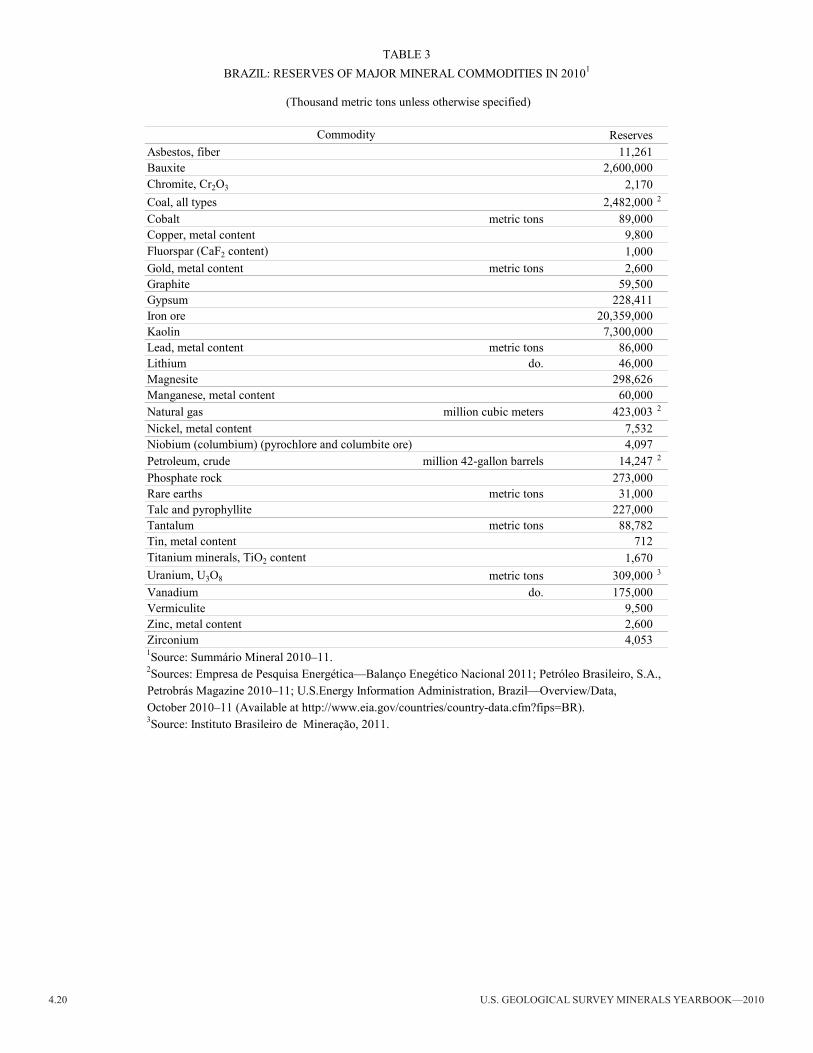
4.20 U.S. GEOlOGiCal SUrVEY MiNEralS YEarBOOK—2010
reservesasbestos, fiber 11,261Bauxite 2,600,000Chromite, Cr2O3 2,170Coal, all types 2,482,000 2
Cobalt metric tons 89,000Copper, metal content 9,800Fluorspar (CaF2 content) 1,000Gold, metal content metric tons 2,600Graphite 59,500Gypsum 228,411iron ore 20,359,000Kaolin 7,300,000lead, metal content metric tons 86,000lithium do. 46,000Magnesite 298,626Manganese, metal content 60,000Natural gas million cubic meters 423,003 2
Nickel, metal content 7,532Niobium (columbium) (pyrochlore and columbite ore) 4,097Petroleum, crude million 42-gallon barrels 14,247 2
Phosphate rock 273,000rare earths metric tons 31,000Talc and pyrophyllite 227,000Tantalum metric tons 88,782Tin, metal content 712Titanium minerals, TiO2 content 1,670Uranium, U3O8 metric tons 309,000 3
Vanadium do. 175,000Vermiculite 9,500zinc, metal content 2,600zirconium 4,053
TaBlE 3Brazil: rESErVES OF MaJOr MiNEral COMMODiTiES iN 20101
(Thousand metric tons unless otherwise specified)
Commodity
1Source: Summário Mineral 2010–11. 2Sources: Empresa de Pesquisa Energética—Balanço Enegético Nacional 2011; Petróleo Brasileiro, S.a.,Petrobrás Magazine 2010–11; U.S.Energy information administration, Brazil—Overview/Data,
3Source: instituto Brasileiro de Mineração, 2011. October 2010–11 (available at http://www.eia.gov/countries/country-data.cfm?fips=Br).


![2013 Minerals Yearbook - USGS · PDF file2013 Minerals Yearbook U.S. Department of the Interior U.S. Geological Survey CHILE [ADVANCE RELEASE] ... (CODELCO). The Economic and Social](https://img.pdfslide.us/doc/110x75/5a74dc667f8b9aea3e8c0db0/2013-minerals-yearbook-usgs-a-2013-minerals-yearbook-us-department-of.jpg)