Embed Size (px)
Citation preview

Department ofAgriculture and Food
norTh-easT asia
Bulletin no. 4793 issn 1833-7236 February 2010
Market Outlook 2010 North Asia.indd 2 24/2/10 4:13:59 PM

Bulletin 4793 ISSN 1833-7236
February 2010
NORTH-EAST ASIA Western Australia's Exports
2008–09 and
Business Development Strategy to 2011–12

Disclaimer
While all reasonable care has been taken in the preparation of the material in this document, the Western Australian Government and its officers accept no responsibility for any errors it may contain, whether caused by negligence or otherwise, or for any loss, however caused, sustained by any person who relied on it.
Copyright © Western Australian Agriculture Authority, 2010
Copies of this document are available in alternative formats upon request. 3 Baron-Hay Court, South Perth WA 6151 Tel: (08) 9368 3333 Email: [email protected] www.agric.wa.gov.au
For further information about this document, contact: Matt Yamamoto Tel: +61 8 9368 3469

i
Contents Page
JAPAN ........................................................................................................................................... 1
Market overview ...................................................................................................................... 1 Economic outlook ................................................................................................................. 1 Consumer trends .................................................................................................................. 3 Marketing channels .............................................................................................................. 7 Online sales getting serious ................................................................................................. 9 Realignment and consolidation in the retail markets ........................................................... 9 Merger puts food companies on global path ........................................................................ 12
Japan’s agrifood, fibre and fisheries imports ...................................................................... 15 Wheat and barley ................................................................................................................. 18 Baled hay and cereal straw .................................................................................................. 25 Canola .................................................................................................................................. 27 Red-fleshed grapefruit .......................................................................................................... 28 Health food ingredients ........................................................................................................ 30 Investment attraction opportunities ...................................................................................... 30 Developing a Western Australian green tea industry ........................................................... 35 Cultivation of Pink Lady™ apple in Japan ........................................................................... 36
Major projects and upcoming events .................................................................................... 37
Contacts ................................................................................................................................... 38
SOUTH KOREA ............................................................................................................................. 39
Market overview ...................................................................................................................... 39 Grain exports (feed grains, seeds, wheat flour) ................................................................... 43 Meat and animal products .................................................................................................... 44 Dairy products ...................................................................................................................... 47 Horticulture ........................................................................................................................... 49 Fisheries ............................................................................................................................... 50 Wine ..................................................................................................................................... 52 Organic and ‘wellbeing’ products ......................................................................................... 54 Retail products ..................................................................................................................... 55 Pet food ................................................................................................................................ 57
Major projects and coming events ........................................................................................ 58 7th Seoul International Wines and Spirits Expo 2010 .......................................................... 58 Seoul Food and Hotel 2010 ................................................................................................. 58 Busan International Seafood and Fishery Expo 2010 ......................................................... 58
Further resources .................................................................................................................... 59
Contacts ................................................................................................................................... 60

Western Australian Agrifood and Fibre Market Outlook–Japan
1
JAPAN
A market overview for Western Australian agribusinesses Japan is a very important market for Western Australian agrifood businesses. This Market Outlook for Japan provides a market overview and discusses Western Australian agrifood export performance and business opportunities.
Economic outlook
Japan slips into deflationary spiral The Bank of Japan (BOJ) estimated that the Japanese economy is likely to plateau or shrink early next fiscal year, which begins April 2010. The BOJ’s basic economic outlook predicted that the economy would gradually recover although the consumer price index would continue to decline for three years through fiscal 2011. The report warned of a possible weakening in gross domestic product early that fiscal year.
Behind this pessimism is the likelihood that public spending and durable goods consumption will slow as the government's economic stimulus measures run out of steam. Falling prices may be desirable for consumers, but the phenomenon risks pushing down corporate earnings, thereby putting downward pressure on the economy.
Since October 2009 when the Bank of Japan forecast three straight years of negative inflation, the sustained decline in prices has become a more palpable threat to the fragile economy. Outlook for Economic Activity and Prices (a biannual benchmark report by the central bank) forecast a 1.5 per cent decrease in the core consumer price index in the current fiscal year, followed by a 0.8 per cent decline in 2010 and 0.4 per cent decline for 2011. The weak economic recovery is prolonging the glut of labour and fixed capital, according to the bank.
The core CPI, which excludes perishable food, logged a record decline of 2.4 per cent on the year (2009) in August, followed by a 2.3 per cent dip in September, according to the Internal Affairs Ministry. The core CPI dropped for a seventh straight month. Demand undershot supply by a record annualised 40 trillion yen (A$500 billion) in the April–June quarter, putting prices under continued strong downward pressure.
Pay cuts are also depressing prices by weakening consumer spending.

Western Australian Agrifood and Fibre Market Outlook–Japan
2
The BOJ fears that households and companies will put off purchases and investment in expectation of further price drops. Japan may slip into a deflationary spiral of recession and declining prices.
War of attrition Financial conditions for consumers are worsening, as indicated by a 20 per cent year-on-year drop in this year's summer bonuses at large companies, as well as the 2.6 per cent decrease in workers' net income in September 2009. Under the circumstances, retailers are scrambling to join a price battle over a shrinking consumer-spending pie, with the race showing little sign of ending soon.
Some economists noted that actual store prices are even lower than the levels indicated by the CPI. The extremely cheap 880 yen (approx. A$11) jeans that major supermarket operator Aeon Co. began selling in August at its Jusco chain as a private-brand product sold 250 000 pairs within 10 days of their release. Seven and I Holdings (the biggest retailer group) started selling private-brand wine from California at 598 yen (approx. A$7) in 750 ml bottles.
Prices in the market are trending south and may fall further in the future. There are two main reasons for falling prices. One is technological innovation. With digital home appliances, for example, mass production lowers costs, enabling consumers to buy high-performance products at lower prices while boosting company sales and profits. The development can be described as a 'benign price fall' because it energises economic activity.
However, what is happening now is a price decline resulting from intensifying competition among retailers and manufacturers. The financial and economic crises have heavily depressed demand, unleashing the 40 trillion yen a year supply glut, the worst on record, according to the Japanese Government Cabinet Office. The high level of surplus products and facilities is prompting manufacturers and retailers to increase sales volume at almost any cost. The BOJ estimates that closing the gap between supply and demand will take until fiscal 2012 at the earliest.
As a result, Aeon, for example, suffered 14.6 billion yen in group net loss in the half year through August 2009, despite the strong sales of its private-brand goods including the 880 yen jeans. That was the second straight net loss the company has posted for the first half of a fiscal year. Aeon spilled 16 billion yen in red ink in the same term last year. Many of its rival supermarket chains are also faring poorly amid the harsh price battle, underscoring the fact that retailers are mired in a war of attrition.
Profit fall or loss leads to even lower wages and possibly higher unemployment. As a result, consumption could weaken further, which in turn forces producers and retailers to cut prices further, triggering a deflationary spiral.
Meanwhile, department stores are increasingly losing ground to low price retailers such as Fast Retailing Co., the operator of the Uniqlo clothing chain, saw a 7.8 per cent year-on-year decline in September nationwide sales on the poor performance of high-end products. Regional department stores have put up the shutters in quick succession, while major department store Mitsukoshi Ltd is considering a substantial payroll cut. When households can secure stable income, falling prices should be favourable for consumers by heightening their purchasing power. However, recent circumstances do not allow people to bask in such affluence.
Western Australian Agrifood and Fibre Market Outlook — Japan
3
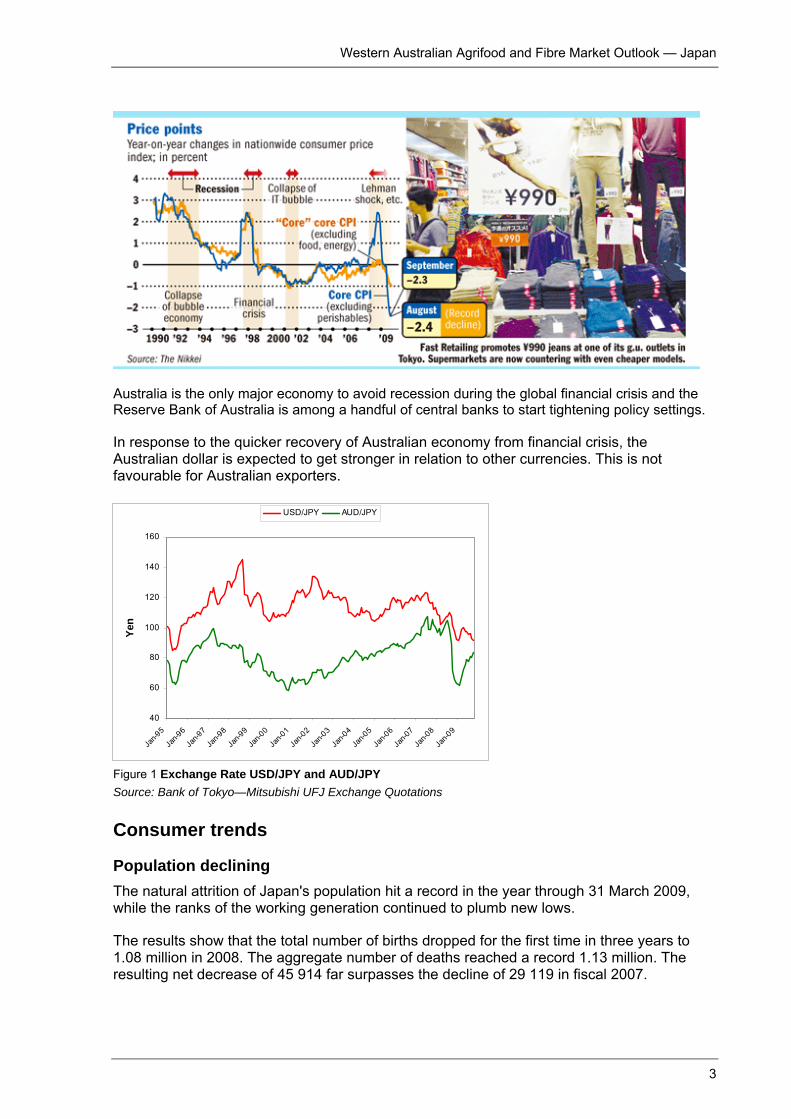
Australia is the only major economy to avoid recession during the global financial crisis and the Reserve Bank of Australia is among a handful of central banks to start tightening policy settings.
In response to the quicker recovery of Australian economy from financial crisis, the Australian dollar is expected to get stronger in relation to other currencies. This is not favourable for Australian exporters.
40
60
80
100
120
140
160
Jan-9
5
Jan-9
6
Jan-9
7
Jan-9
8
Jan-9
9
Jan-0
0
Jan-0
1
Jan-0
2
Jan-0
3
Jan-0
4
Jan-0
5
Jan-0
6
Jan-0
7
Jan-0
8
Jan-0
9
Yen
USD/JPY AUD/JPY
Figure 1 Exchange Rate USD/JPY and AUD/JPY Source: Bank of Tokyo—Mitsubishi UFJ Exchange Quotations
Consumer trends
Population declining The natural attrition of Japan's population hit a record in the year through 31 March 2009, while the ranks of the working generation continued to plumb new lows.
The results show that the total number of births dropped for the first time in three years to 1.08 million in 2008. The aggregate number of deaths reached a record 1.13 million. The resulting net decrease of 45 914 far surpasses the decline of 29 119 in fiscal 2007.

Western Australian Agrifood and Fibre Market Outlook–Japan
4
By age group, those 14 or younger totalled just 17.2 million, the lowest ever. People in the productive ages from 15 to 64 totalled a record low of 81.65 million. This figure has been on a steady downtrend since the first survey in 1994. The number of people 65 or older rose to a record 28.21 million.
As a result, working age people accounted for just 64.25 per cent of the total population, the lowest among industrialised nations. In 1994, the figure stood at nearly 70 per cent. The continuing decline is a major concern because it will increasingly put pressure on the national pension and medical insurance programs.
Fifty-six per cent of Japan's total population now belong to the 40-and-older crowd. Not surprisingly, these 71.6 million people are swaying market trends. Moreover, their ranks are growing, having expanded by 2.5 million from 2005.
Clearly, at a time when the domestic market is shrinking, the senior segment is fast becoming fertile ground for firms in a wide variety of areas.
Key consumers The domestic market for eyeglasses is a good place to look at the growing influence of older people. In 2008, the eyewear market shrank more than 20 per cent to slightly over 420 billion yen (A$5.25 billion). Purchases of reading glasses, however, have been surging among people aged 45 and up. Since 2007, the demographic has been outstripping younger consumers in terms of total glasses purchases. On a unit basis, people in the 45 or older bracket purchase glasses more than do those under 45, according to eyewear industry sources.

Western Australian Agrifood and Fibre Market Outlook — Japan
5
According to an estimate by the Japan Research Institute, senior households—where the head of the house is 60 or older—will be responsible for 40 per cent of all consumption in Japan in 2009. What is more, the senior market will jump 30 per cent by 2025 compared to 2000.
Overall, seniors are satisfied with their material wealth but are looking for something deeper connections. An opinion poll conducted by the Cabinet Office found that 44 per cent of people in their 20s are seeking material wealth, in sharp contrast with 66 per cent of seniors in their 60s searching for emotional happiness.
Added convenience Gone are the days of convenience stores catering especially to young people. For Seven-Eleven Japan Co., customers in the 50-plus age bracket accounted for 26 per cent in fiscal 2008. That percentage is more than double the 10 per cent seen in fiscal 1993.
In sharp contrast, the proportion of young customers in their 20s has declined to just 25 per cent, a 12 point drop from fiscal 1993.
To meet the needs of older customers, Seven-Eleven Japan Co. (Japan's largest convenience store chain) started making price tags larger and shopping baskets lighter. Rival convenience store chain Lawson Inc., meanwhile, began expanding aisles and setting shelves lower.
The attempts by stores to lure older customers do not stop there. Many convenience store chains are rushing to develop prepared meals for seniors, especially bento box lunches. Wagashi, or Japanese-style sweets, are also occupying more shelf space.
As the number of working families in Japan increases, the demand for convenient foods such as ready-to-eat meals is growing.
Smaller packages Prepared rice packs are gaining popularity among seniors thanks to their ease of use—you just pop them into an electric oven for a few minutes. Frozen food maker Katokichi Co. boosted production of the packs by 20 per cent in August and started to sell prepared rice in 150-gram packs, 50 g smaller than ordinary ones. Most buyers are in the 50-plus bracket.

Western Australian Agrifood and Fibre Market Outlook–Japan
6
With an eye on elderly people as well as singles, many food manufacturers and retailers are making their offerings smaller and are selling some products individually. Ajinomoto Co., for example, began selling three instant soup powders in individual packs.
Food safety On the other hand, the Japanese are a health-conscious race, and food safety is becoming as important as food quality in purchasing decisions. Over the past five years, many new regulations aimed at increasing food safety have been introduced. Even local food processors struggle to keep pace with the changes imposed by the new regulations.
Health scares caused by cases of Escherichia coli 0–157, spoiled dairy products, bovine spongiform encephalopathy (BSE), more recent cases of pesticide-contaminated frozen dumplings imported from China and melamine contamination in Chinese dairy products have heightened consumer awareness in relation to food products. Consumers are paying much more attention to food safety.
0
10
20
30
40
50
60
Safetyconscious
Low price Products madeonly fromdomesticproduces
Healthconscious
Convenienceconscious
%2008 Jan2008 MayFuture
Figure 2 Food production aims of companies for food production (survey May 2008) Source: Agriculture Forestry and Fisheries Finance Corporation
0
10
20
30
40
50
60
Safety Economic Preferdomesticproduces
Healthconscious
Easy-to-use Home made
%
2008 Jan2008 MayFuture
Figure 3 Consumer preferences when making food choices (survey May 2008) Source: Agriculture Forestry and Fisheries Finance Corporation

Western Australian Agrifood and Fibre Market Outlook — Japan
7
Marketing channels
Nakashoku vs Gaishoku The Japanese meals market can be divided into three categories:
• Nakashoku (retail): prepared meals sold at retail outlets including supermarkets, convenience stores and specialised food outlets
• Gaishoku (food service): meals eaten away from home (fast food, restaurants)
• Naishoku (retail): meals cooked at home from ingredients purchased at supermarkets
Fully cooked home meal replacement (called ‘nakashoku’) is positioned between food service (gaishoku) and home cooking (naishoku). Meals such as packed lunch/dinner boxes and everyday household dishes are sold at prepared food specialty shops, supermarkets and convenience stores, which are often open 24 hours a day.
8
8.1
8.2
8.3
8.4
8.5
8.6
2004 2005 2006 2007 2008 2009(E) 2010(E)
Year
Yen
(x tr
illio
n)
Figure 4 Nakashoku (prepared meal) market Source: Business Media Makoto
01,0002,0003,0004,0005,0006,0007,0008,0009,000
04 05 06 07 08(E)
Year
Yen
(bill
ion)
Convenience storesFood supermarketGeneral Merchadise StoreDepartment storeSpecialised shop
Figure 5 Prepared meal sales by outlet type Source: Japan Meal Replacement Association
Under the depressed economy in Japan for the past decade, eating out has levelled off or decreased slightly, whilst outsourcing food has increased. With social advancement of women and the increase in single-person households, home cooking will decrease and outsourcing for food, such as take out and meal delivery service, will increase.

Western Australian Agrifood and Fibre Market Outlook–Japan
8
The growth of nakashoku market has slowed down, but it still had some growth with consumers who are keen to get by on less, rather than eating out. The gaishoku (food service) market declined by 0.5 per cent in 2008 compared to 2007. The nakashoku market has grown because of a trend towards nuclear families, the ease of home meal cooking and relative cheapness. Since the burst of the economic bubble in the early 1990s, the food service market has been affected by the economic downturn. In recent years, diversification of consumer needs has given that market more impact, indicating that the food service market has reached further maturity and saturation.
Facing the severe slump in consumer spending, the biggest family restaurant chain operator Skylark Co. decided to delay the opening of new locations by one year and instead turn existing eateries into lower-priced restaurants.
The company concluded that it would not be able to generate sufficient profits by opening new locations when consumers are increasingly tightening their belts. Additionally, rivals have staked out prime locations near train stations to take advantage of falling rents, further intensifying competition.
8626
14634
19277
25676
2786728650 29070 28496
27388 2699225854 25448
24568 24483 24390 24552 24558 24432
5,000
10,000
15,000
20,000
25,000
30,000
75 80 85 90 95 96 97 98 99 00 01 02 03 04 05 06 07 08
Year
Yen
(x tr
illio
n)
Figure 6 Total value of Japanese food service market 1975–2008 Source: Japan Food Service Association

Western Australian Agrifood and Fibre Market Outlook — Japan
9
Online sales getting serious Japan's online population of more than 90 million gives the internet a penetration rate approaching 75 per cent. If this massive consumer class moves, merchandise, services and money move as well. The trick is to be there when it does.
Shifting online In August, a major supermarket chain, Summit Inc., closed a store in Chofu, Tokyo. Sluggish sales were not the reason. Rather, the supermarket operator is converting the location into a merchandise-processing and shipping centre for its online store. The centre is to reopen in October 2010.
‘A major share holder company of Summit Inc is aiming to develop the online business to 100 billion yen (A$1.25 billion) in sales in 2019..
Other companies have also begun working to build online businesses. Before the end of the year, Seven and I Holdings Co. will consolidate its Ito-Yokado Co. and Seven-Eleven Japan Co. websites, which until now have been independently developed. The huge retail conglomerate will build a new distribution location in Saitama Prefecture, and the site will list 5 million products. Customers will be able to pick up orders at Seven-Eleven stores, if they choose to.
Seven and I is positioning online shopping as a new pillar of earnings, alongside overseas store openings. It ‘will continue to pursue partnerships and merger-and-acquisition opportunities with companies having expertise in this area,’ an official said.
Japan's old-line retailers all aspire to build portals that perform like Rakuten Ichiba, Japan's largest shopping site. Rakuten Inc. enjoyed a record operating profit for the first six months of 2009, up 28 per cent from the same period a year earlier. On its busiest days, its transactions exceed three billion yen (A$37.5 million), the equivalent of three large department stores the size of Mitsukoshi Ltd's main emporium in Nihombashi, Tokyo. ‘Even with the poor economy, online sales are growing well,’ company President Hiroshi Mikitani said. Department store and supermarket chains, on the other hand, are under duress due to the recession and are being forced to close stores, pare staff and reduce operating hours. The more this trend takes root, the more attractive online sales will be. The internet is effectively open 24 hours a day.
Online sales in Japan have been climbing at more than 20 per cent, topping 6 trillion yen (A$75 billion) in fiscal 2008. Conversely, department stores and supermarkets have seen sales fall by around 20 per cent over the past decade.
Online as well as mail-order catalogue sales seem to have exceeded 8 trillion yen (A$8 billion) in fiscal 2008, surpassing convenience stores (nearly 8 trillion yen) and department stores (over 7 trillion yen).
Realignment and consolidation in the retail markets General retail trends indicate that there has been, and will continue to be, increased consolidation among companies. Many retailers seem to be looking to purchase direct from producers rather than through import agents and wholesale distributors.

Western Australian Agrifood and Fibre Market Outlook–Japan
10
Japan's top three convenience store operators—Seven-Eleven Japan, Lawson and FamilyMart—are battling for market share through alliances and acquisitions.
Convenience stores are one of the major food outlets in Japan, especially for prepared meals, lunch box catering, sandwiches and drinks. There has been remarkable growth in this outlet type over the years. However, the market may now be reaching maturity. Department store companies have been in dark tunnel for a long time and supermarket chain operators are also struggling.
An emerging trend across all sectors of the Japanese food industry is to invest in China and other Asian countries to expand sales growth as well as to secure food product and ingredient supplies.
Japanese firms looking for global scale need to strategically handle more than one type of product. Becoming more comprehensive is a way to survive and thrive, as demonstrated by Nestle SA, the world's largest food company. The merger between Kirin Holdings Co. and Suntory Holdings Ltd is likely to fuel further realignments in Japan's food industry.
Realignments ongoing in retailing As the global economic downturn increasingly weighs on consumers, Japan's retail chains are being forced to adapt to ever fiercer competition.
Convenience store chains, department store operators and large specialty retail groups are reaching out to their adversaries and even beyond traditional boundaries as they search for partners—and survival.
Japan is saturated with more than 40 000 convenience stores. Through 2007, sales declined at every chain for eight years in a row.
Third-ranked convenience store operator FamilyMart Co. and its top shareholder Itochu Corp. are finalising plans to purchase their smaller rival company, am/pm Japan Co.

Western Australian Agrifood and Fibre Market Outlook — Japan
11
FamilyMart, which has around 7600 locations throughout Japan, sees the acquisition boosting its competitiveness. Post takeover, FamilyMart will close in on No. 2 rival Lawson Inc. , which has a nationwide network of some 9700 locations, and overtake top-ranked Seven-Eleven Japan Co. in Tokyo, which is the biggest market.
Itochu, which owns a 31 per cent stake in FamilyMart, will be able to secure a customer for new products by sweeping am/pm under its umbrella.
Convenience store major FamilyMart Co. this summer became the first Japanese retailer to run more stores outside Japan than in its home market, with the exception of Seven-Eleven Japan Co., another popular convenience store chain that originated, however, in the USA.
While the retail sector is typically a domestic demand-oriented industry, FamilyMart's successful expansion into Taiwan and South Korea has been driven by a localisation strategy. This combines the parent firm's operating expertise with each country's eating habits and other traditions.
Now the company expects to use the expertise it has obtained in Taiwan and elsewhere to move into other key areas.
The Japanese convenience store industry is unlikely to grow due to the country's falling birth rate and rapidly aging population, as well as the saturation of convenience stores across the country.
‘We will look abroad for growth,’ FamilyMart President Junji Ueda said.
Tie-ups between major supermarket and trading companies
Major trading house Itochu Corp. is to obtain a 3 per cent interest in Uny Co., moving in to help the No. 4 Japanese supermarket operator develop a supermarket chain in China.
The alliance caps a recent string of tie-ups between trading houses and major supermarket chain operators, underscoring the potential benefits for partnering companies in both industries.

Western Australian Agrifood and Fibre Market Outlook–Japan
12
Uny intends to launch 10 to 20 Chinese stores starting in 2011. In addition, Itochu aims to help these stores by leveraging the nationwide procurement and distribution network of the Ting Hsin group, which holds the largest share of China's processed food market and in which Itochu holds a stake.
In Japan, Itochu and Uny will cooperate in the contract farming business, riding growing interest in food safety. Itochu has developed ties with various agricultural corporations and farmers through its contract farming business. Their crops will be sold through Uny, as well as regional supermarket allies Izumiya Co. and Fuji Co. The resulting increase in volume is expected to drive prices down.
In addition, the two firms plan to cooperate in the convenience store business. Itochu holds a roughly 31 per cent interest in No. 3 convenience store operator FamilyMart Co., while Uny owns a stake of about 47 per cent in fourth-ranked Circle K Sunkus Co. If these two major operators join forces in product procurement and other areas, they will likely be able to achieve significant cost reductions.
Itochu and Uny are expected to invite regional supermarkets to tie up with them as well, with an eye toward creating an alliance capable of competing with leading players like Seven and I Holdings Co. and Aeon Co.
Aeon, the No. 1 supermarket operator, formed capital ties with Mitsubishi Corp. in December 2008, when the trading company acquired a 5 per cent interest. In addition to investing in Aeon's distribution unit, Mitsubishi has been cooperating in the development of Aeon's private-brand products.
At Daiei Inc., product procurement from its top shareholder, Marubeni Corp., is forecast to increase 10 per cent to be worth more than 80 billion yen (A$1 billion) in the year ending February 2010.
Supermarkets are turning to trading houses to drive streamlining forward and beef up profitability as their struggles continue.
Aeon sustained a group net loss of 14.6 billion yen in the March–August half. Seven and I Holdings supermarket unit Ito-Yokado Co. sank into the red on an operating basis for that period as well.
Information held by trading houses on the real estate market and locations in China and other Asian countries is also of great interest to supermarket operators looking to expand into these growth markets.
Merger puts food companies on global path The envisaged merger between beer giants Kirin Holdings Co. and Suntory Holdings Ltd would create an entity capable of competing overseas with major Western players. It could also serve as a growth model for other domestic demand-focused firms struggling amid Japan's shrinking population.
Both Kirin and Suntory posted record profits in the fiscal year ended December 2008, thanks to strong sales of low priced, beerlike beverages as well as high-grade beers.

Western Australian Agrifood and Fibre Market Outlook — Japan
13
Despite being at the top of their game, the two companies nevertheless began considering a merger for one reason—Japan's falling birth rate and aging society. The population trend means there is a strong prospect that the domestic food and beverage market will contract over the long term.
Kirin has been on something of a merger and acquisition spending spree in recent years, having purchased National Foods Ltd of Australia, San Miguel Brewery Inc. of the Philippines and Australian brewery Lion Nathan Ltd. Suntory bought Cerebos Pacific Ltd, a major Singaporean health-food maker, and Frucor Beverages Group Ltd, a New Zealand energy drink maker. The resulting company should have more funds at its disposal to pursue more overseas M&As.
Kirin President Kazuyasu Kato said that the company to emerge from the merger between Kirin Holdings Co. and Suntory Holdings Ltd will strive to become a leading food purveyor in the Asia and Oceania regions.
Major beer brewer Sapporo Holdings Ltd will acquire a 21.65 per cent stake in unlisted beverage producer Pokka Corporation, creating a food-and-drink triumvirate with Meiji Holdings Co., which owns 22 per cent of Pokka.
Foreign operations will be a key consideration for the three-way alliance. More than 20 per cent of Pokka's revenue comes from abroad, including foreign markets where it boasts high market share such as Singapore. Meanwhile, Sapporo's beer operations have a strong base in North America, though the company is lagging in Asia. Meiji Holdings has been slow to expand overseas.
Aeon speeding into Asia The Aeon Co. group is hastening its expansion into Asia, looking to establish new foundations for growth outside Japan in preparation for the inevitable time when domestic growth potential wanes.
As part of this strategy, Aeon Mall Co. will open shopping centres in Vietnam, adding that nation to a list that already includes supermarkets in China, Thailand and Malaysia. The first shopping centre will be located in Ho Chi Minh City and is expected to open by 2012. The facility will have dozens of tenants, anchored by a Jusco supermarket.

Western Australian Agrifood and Fibre Market Outlook–Japan
14
Seven and I aims to boost its Chinese sales Seven and I Holdings Co. plans to boost its Chinese sales to an annual 400 billion yen or so in fiscal year 2014, five times the fiscal 2008 figure, through rapid openings of convenience stores, supermarkets and restaurants.
With domestic retailers struggling amid deflation and the greying of Japanese society, Seven and I has set its sights on the Chinese market. It plans to increase its convenience stores there to more than 500 in three years and to accelerate supermarket and restaurant openings.
The retailer now operates 100 convenience stores in China. Seven-Eleven Japan Co. opened its first Chinese outlet in Beijing in 2004. The chain expanded into Shanghai in April 2009 under a franchise contract with a Taiwanese retailer and into Tianjin in September 2009. The goal is to have 500 stores in these three metropolises and to move into other cities, such as Chengdu.
A subsidiary, Ito-Yokado Co., has nine stores in Beijing and four in Chengdu. The Chengdu operations saw their sales grow 30 per cent on the year in fiscal 2008. The general supermarket operator plans to open two more in each city within three years and is considering openings in other inland cities and north-eastern locations.
Seven and I opened its first family restaurant in Beijing in July 209, with plans to expand to 30 locations in the nation's capital in three years.
The retail giant's convenience store, supermarket and restaurant businesses will deepen their cooperation in such areas as product procurement.

Western Australian Agrifood and Fibre Market Outlook — Japan
15
Japan’s agrifood, fibre and fisheries imports Japan is the second biggest economy after the USA. It is also the world's largest net importer of agrifood products with a population of 128 million people. A shortage of arable land and increasing labour and production costs have led to Japan’s growing dependency on agrifood imports. Japan’s food self-sufficiency ratio is declining as consumer eating habits change. Japan now imports 60 per cent of its food.
Japan imported A$79 billion of agrifood and fibre products from all over the world in 2008. It is important to note that imports have increased by 20 per cent from 2007. Imported food is in very tough competition with the food products from other countries and local production.
Table 1 Japan’s agrifood, fibre and fisheries imports 2008
Product Value (A$M) Suppliers
1 Fish and crustaceans 13 993 USA, Russia, China
2 Cereals 12 270 USA, Australia, Canada
3 Meat and edible offal 10 034 USA, Australia, Brazil
4 Edible preparations: meat, fish 5 605 China, Thailand, USA
5 Beverages 3 542 France, USA, Italy
6 Fruit, nuts and peel 2 929 Philippines, USA, New Zealand
7 Vegetables, roots and tubers 2 028 China, USA, New Zealand
8 Coffee, tea and spices 1 969 Brazil, Colombia, China
9 Dairy, eggs and honey 1 817 Australia, New Zealand, USA
10 Sugar and sugar confectionary 907 Thailand, Australia, USA
Source: Global Trade Information Service 2009
The top suppliers of agrifood and fibre products to Japan were the United States (28 per cent), China (12 per cent), Australia (8 per cent), Canada (7 per cent) and Thailand (5 per cent).

Western Australian Agrifood and Fibre Market Outlook–Japan
16
Australian and Western Australian agrifood export performance Japan is one of Australia’s largest agrifood markets and was valued at A$5265 million in 2008–09. Western Australia’s agrifood exports to Japan were valued at A$769 million in 2008–09, making Japan the state’s second biggest export market after Indonesia. Western Australia contributed approximately 15 per cent of Australia’s agrifood exports to Japan in the last fiscal year.
Western Australia exports a variety of produces to Japan, but the main exports are wheat, barley, cereal hay, canola and crayfish, which together constituted 84 per cent of Western Australia’s total value of exports to Japan. Unfortunately, wheat and crayfish showed a relatively big decline in the export value in 2008–09 from 2007–08. Japan was Western Australia’s largest export market on beef, cereal hay and prawn in 2008–09.
Japan has been a very important market for Western Australia’s grain industry for a long time. In 2008–09, Japan was Western Australia’s fourth largest wheat export market (A$288 million) accounting for about 11 per cent of Western Australia’s total wheat exports. Japan is also the second largest export market for Western Australian barley, valued at A$158 million in 2008–09 and accounting for about 31 per cent of Western Australia’s total barley exports.
In 2008–09, Western Australia exported A$60 million of canola, A$23 million of malt and A$8 million of lupins to Japan accounting for 11 per cent, 13 per cent and 19 per cent of total Western Australia’s exports respectively.
Japan was Western Australia’s largest cereal hay export market, valued at A$104 million about 75 per cent of Western Australia’s total cereal hay exports in 2008–09. Western Australia’s cereal hay exports to Japan have been growing steadily for last five years. The export value in 2008–09 increased by around 50 per cent from 2004–05.
Japan is also an important market for Western Australia’s seafood industry. In 2008–09, Japan was Western Australia’s largest prawn export market (A$12 million) accounting for 63 per cent of Western Australia’s total prawn exports. Western Australia’s prawn export showed more than 70 per cent increase in value as compared to the last two years. Although there has been a gradual decline in Western Australia’s crayfish export to Japan over the past five years, it is still about 14 per cent of Western Australia’s total crayfish export in 2008–09.
In 2008–09 Japan was Western Australia’s largest beef export market, valued at A$34 million accounting for 23 per cent of Western Australia’s total beef export. Western Australia exported A$6 million of lamb to Japan in the same fiscal year.
Japan was a major importer for Western Australian dairy industry for a long time since Western Australia was the largest ice cream exporter for Japan in Australia. Western Australia’s ice cream export to Japan declined by more than 80 per cent in 2008–09 compared to 2004–05 because a major exporter has almost pulled out of this business.

Western Australian Agrifood and Fibre Market Outlook — Japan
17
Table 2 Western Australia’s top 10 export value agrifood products to Japan 2008–09
Product Value (A$m) Proportion of total (%) Japan's ranking Change from 2007–08 (%)
1 Wheat 288 37.40 4th -23.60
2 Barley 157.9 20.50 2nd 28.40
3 Cereal Hay 103.8 13.50 1st 29.20
4 Canola 59.5 7.70 4th 12.50
5 Crayfish 35.7 4.60 3rd -20.20
6 Beef 33.5 4.40 1st 15.30
7 Malt 22.7 3.00 4th 2.40
8 Prawns 12.4 1.60 1st 73.30
9 Lupins 8.3 1.10 2nd 178.30
10 Lamb 6.2 0.80 7th 38.20
Others 40.77 5.30 -2.20
Total 769.1 100.00 -5.30
Source: ABS and DAFWA estimates
0
1,000
2,000
3,000
4,000
5,000
6,000
2004
/2005
2005
/2006
2006
/2007
2007
/2008
2008
/2009
Year
A$M
Rest of Australia
WA
Figure 7 Western Australian share of total Australian agrifood exports to Japan 2004–05 to 2008–09 Source: ABS and DAFWA estimates

Western Australian Agrifood and Fibre Market Outlook–Japan
18
Market opportunities and future outlook for Western Australian agrifood products
Wheat and barley
Wheat and barley import system Wheat and barley imports are still fully controlled by Japan MAFF (Ministry of Agriculture, Forestry and Fisheries) and very high tariffs are imposed on wheat, barley and wheat flour not imported through MAFF’s tender system.
From 2006 all barley (1 to 1.1 million tonnes) and wheat (50 000 to 100 000 tonnes) imported for feed purposes have to be imported under the SBS (Simultaneous Buying and Selling) tender system. From April 2007 barley for feed and food and some wheat for food commenced being imported though the SBS system. Under the SBS system, a Japanese importer and Japanese end user work together to bid their two prices simultaneously. The importer gives its selling price to MAFF and the user gives its buying price to MAFF. Basically, the combination with the biggest mark-up wins the bid for the tender and the planned import quantity of each tender set by MAFF is filled.
Most imports of wheat for food including ASW from Western Australia, however, are still conducted under the original MAFF tender system where the importer who bids at the lowest price to MAFF wins the tender. Under the current MAFF Weekly Tender system, the quality aspects of different varieties are not taken into account. As long as the shipper offers the correct specification for the ASW grade, they win or lose the tender on price alone.
Under the current import system, MAFF is responsible for storage risk, as opposed to the SBS system where the user is responsible for any storage risk in Japan. There are more than 90 wheat flour milling companies that mill less than 30 000 tonnes of annual flour production. Those small and medium sized companies are against shifting to the SBS system because they might lose their business. They may be the main reason why the wheat flour industry in Japan is reluctant to support shifting ASW trade to the SBS system.
The general view is that imports of wheat for food will be shifted to the SBS system within three years. In the meantime, MAFF is trying to shift to a temporal import system (so called 'Immediate Selling system') which passes most of the responsibilities in the management of inventory and shipment/vessel (18 ports for wheat and 25 ports in Japan) to the private sector (trading companies and wheat flour companies). The structure of MAFF that earns the mark up will be retained even if it is completely shifted to the SBS system.
The top four wheat flour milling companies (Nisshin, Nippon, Showa, Nitto Fuji) almost dominate the market at 74 per cent. With changes in the import system, the shakeout of firms will continue further.
Wheat Total wheat flour consumption in Japan has levelled off at about 4.6 million tonnes, with some decline in recent years.
From April 2007, a limited tonnage of wheat (Prime Hard from Australia and Durum from Canada) for food purposes was planned to be imported via the SBS tender system. However, due to a drought in Queensland, supply of Prime Hard was inadequate to meet the tender and a much smaller tonnage has been exported in containers. Approximately 400 000

Western Australian Agrifood and Fibre Market Outlook — Japan
19
tonnes of wheat are expected as imports to Japan via the SBS system in 2009, similar to 2008.
Prime Hard (PH) from Queensland is the preferred wheat for Chinese noodles and sheets for dumplings. However, there has been a shortage of PH and Dark Northern Spring (DNS) from the United States has made up the shortfall.
As for the quality of ASW wheat imported in 2009, a major user advised that the quality on the first few shipments was not as good as before. Some companies rejected to receive the wheat. Their complaints included the fact that
● unable to make udon noodle with usual good 'creamy golden' colour; it was dull and a bit too white.
● the texture did not have good viscosity; they had to feel some hardness in the udon noodle. shrine
Since then, there has not been a major issue in quality for the rest of the season.
Table 3 Japanese Government’s wheat imports by type (wheat grade) (unit: 1000 tonnes)
FY Type (Grade) 2003 2004 2005 2006 2007 2008
World total 5 061 4 979 4 787 4 960 4 896 4 863
USA WW 571 646 425 426 773 710
HRW (11.5) 921 885 704 823 908 791
HRW (13.0) 200 161 144 62 – –
DNS 1 168 1 066 1 304 1 414 1 264 1 441
S. total 2 860 2 758 2 577 2 726 2 945 2 942
Canada CW 798 896 919 860 878 826
DRM 205 196 223 226 217 293
S. total 1 004 1 092 1 142 1 086 1 095 1 119
Australia ASW 971 881 815 872 761 727
PH 226 249 253 275 92 72
S. total 1 198 1 129 1 068 1 148 853 799
Source: MAFF
Japanese domestic noodle wheat production, which is in direct competition with Western Australian noodle wheat, deceased 3 per cent (28 900 tonnes) to 881 200 tonnes in 2008 from the previous year due to unfavourable weather in growing season in Hokkaido. It is expected that this level of production will be maintained.
Rice flour production has been promoted by the government and the production of rice flour has been increased to 9500 tonnes in 2008 from 1000 tonnes in 2003. The rice flour is mainly used for bread, noodle and cake.

Western Australian Agrifood and Fibre Market Outlook–Japan
20
0
20
40
60
80
100
2000 2001 2002 2003 2004 2005 2006 2007 2008
Fiscal Year
Production Area
Figure 8 Domestic wheat production (unit: 10 000 tonnes, 10 000 ha) Source: MAFF
Flour production for noodles (fresh, frozen, dry and instant)
Total flour consumption for noodles has steadily declined since 1996 from 1.46 million tonnes to 1.28 million tonnes in 2008. Some increase in flour consumption has been seen for dry and frozen noodle at the expense of the fresh noodles.
2008 flour consumption by end use (previous year)
● Fresh and frozen noodles—586 778 tonnes (596 006)
● Dry noodles—202 139 tonnes (199 154)
● Instant noodles—323 326 tonnes (353 931)

Western Australian Agrifood and Fibre Market Outlook—Japan
21
Table 4 Wheat flour production (tonnes) by noodle type Udon Chinese noodle Japanese noodle (soba) Production Change (%) Fresh noodles
Fresh Cooked Fresh Cooked Steamed Dumpling wrap Fresh Cooked 2000 1 420 768 -0.9 686 719 33 319 216 747 187 681 60 506 97 414 23 333 25 387 42 332 2001 1 440 843 1.4 696 464 35 129 218 410 194 449 59 575 97 708 22 468 24 316 44 410 2002 1421 473 -1.3 684 968 34 289 215 399 193 994 54 792 96 059 22 411 23 978 44 045 2003 1 424 719 0.2 675 212 35 303 218 834 184 847 52 062 100 041 20 266 22 978 40 882 2004 1 413 555 -0.8 660 619 35 420 210 675 178 204 53 621 99 929 20 162 20 808 41 801 2005 1 367 960 -3.2 631 161 33 201 206 412 168 149 49 916 97 925 18 321 19 224 38 012 2006 1 323 601 -3.2 602 810 31 536 202 040 155 084 50 786 93 792 15 800 18 055 35 716 2006 1 323 601 -3.2 602 810 31 536 202 040 155 084 50 786 93 792 15 800 18 055 35 716 2007 1 319 118 -0.3 596 006 32 683 197 138 155 658 47 702 95 450 15 286 17 593 34 496 2008 1 277 165 -3.2 586 778 32 970 196 217 158 081 43 737 93 800 14 208 15 607 32 157
Tenobe Dry noodle Udon Hiramen Hiyamugi Somen
Udon Hiyamugi Somen Chinese Japanese Instant
noodle Pasta
242 047 51 730 5 184 27 225 40 153 67 691 5 611 44 453 336 684 168 314 235 072 50 205 5 125 25 834 39 619 65 331 6 143 42 815 342 933 156 044 238 512 47 869 5 063 26 099 41 543 70 006 5 660 42 269 356 377 149 490 226 373 45 653 4 116 22 552 37 145 67 830 5 423 43 654 356 375 153 757 230 295 49 338 3 920 20 951 38 763 66 762 6 564 43 998 364 836 154 376 228 428 48 779 3 421 21 123 41 496 4 737 3 992 52 826 6 900 45 153 368 003 156 505 220 257 45 761 3 050 18 658 41 728 4 638 4 010 54 137 7 023 41 253 355 606 160 936 203 264 44 925 2 786 17 918 42 193 3 222 3 379 44 036 7 127 37 718 350 007 167 521 199 154 43 064 2 632 17 380 38 656 3 828 3 642 44 490 7 762 37 700 353 931 170 027 202 139 44 079 2 806 18 024 39 842 3 535 3 199 45 537 9 061 36 055 323 326 164 925
Source: General FMAMAFF Note: Tenobe: Manual stretching process with two sticks is required. Hiyamugi and Somen are thinner than Udon or Hiramen. Somen is thinner than Hiyamugi.
Table 5 MAFF's sales of barley by food use
2002 2003 2004 2005 2006 2007 2008 Shochu 188 209 250 214 372 87 220 Barley tea 33 23 25 24 40 26 26 Beer 27 15 32 16 18 20 45
Source: MAFF

Western Australian Agrifood and Fibre Market Outlook — Japan
22
The Japanese import of wheat flour-based premix was growing steadily as a cheap substitute for wheat until the mid-1990s. However, the import has been decreasing after 2006 due to the price rise caused by recent rise of international wheat price. The import quantity in 2008 dropped by 14.4 per cent from previous year to 100 000 tonnes. Australia was the fifth biggest exporter with 8.5 per cent of share in 2008.
Barley Of the 1.3 to 1.4 million tonnes of barley imported by Japan per annum, approximately 1.0 million tonnes is used for animal feed and 0.3 million tonnes is used for human consumption, including the alcoholic beverage shochu. Barley is used for animal feed after steaming and rolling. Barley for shochu is processed by barley refining processors before distributing to shochu makers.
0
50
100
150
200
250
300
350
400
‘02 ‘03 ‘04 ‘05 ‘06 ‘07 ‘08
Year
'000
T ShochuBarley TeaBeer
Figure 9 MAFF’s sales of barley by food use Source: MAFF
Table 6 MAFF’s sales of barley (tonnes) by use
FY 2002 2003 2004 2005 2006 2007 2008 USA Two 2 USA naked 0.3 Canada Two raw 5 10 5 11 Canada Six raw 4 15 2 1 Canada naked 1 Australia Two raw 188 209 250 205 347 77 208
Shochu
S. total 188 209 250 214 372 87 220 Canada Six 26 18 20 20 35 25 25 Australia Two 7 5 5 4 5 1 1
Barley Tea
S. total 33 23 25 24 40 26 26 Canada Two 7 7 7 21 Australia Two 24 8 22 9 16 13 24 USA Two 3 7 3 2
Beer
S. total 27 15 32 16 18 20 45 G. Total 248 247 307 254 431 133 291
Source: MAFF

Western Australian Agrifood and Fibre Market Outlook — Japan
23
Barley for human consumption (beer and shochu alcohol) Regular beer consumption has been gradually declining after peaking in 1994. Alcoholic beverage consumption is declining in Japan due to fewer drinkers among young people and the ageing of the generation of big drinkers. Consumer preferences are moving away from consumption of beer due to the trend towards healthy lifestyles.
Table 7 Volume of sales of alcoholic beverages in Japan (1000 kL)
2003 2004 2005 2006 2007
Sake 826 746 719 688 664
Shochu 921 983 999 1 000 1 005
Beer 3 783 3 617 3 408 3 304 3 215
Whiskeys 112 100 94 90 85
Fruit wine 247 234 247 238 239
Low malt beer 2 403 2 213 1 679 1 516 1 473
Total 8 292 7 893 7 146 6 836 7 836
Source: National Tax Office
Major breweries are stepping up production of no-malt beer to quench the thirst of increasingly thrifty consumers who favour those low priced varieties over pricier regular beer. A 350 ml can of no-malt beer sells for around 140 yen, which is roughly 30 per cent less than regular beer. Many consumers have switched from regular to no-malt beer ever since the economic downturn became pronounced last fall. No-malt beer shipments for the January-June period jumped 27.4 per cent on the year, while shipments of regular beer dipped 5.5 per cent.
No-malt beer now accounts for almost 30 per cent of the overall beer market. By 2008, the country's beer market had shrunk 16 per cent from its 1994 peak, reflecting the falling birth rate and a shift among young consumers away from beer. Kirin Brewery Co.'s beer-flavoured beverage containing no alcohol has been boosting the market for such drinks and prompting other major brewers to come up with new products for the emerging segment.
Shochu (a distilled spirit made from raw materials such as barley, sweet potato, rice or buckwheat) and chuhai (shochu mixed with soda water and flavoured syrup), which have a lower alcohol content, are becoming more popular. Australia is the dominant supplier of barley to Japan for the shochu market. The shochu market as a whole has entered a period of maturity and further increases in the market are not anticipated. With regard to Japanese malting barley (for shochu) import from Australia, it is estimated that Japan purchases 160 000 tonnes from Western Australia and 40 000 tonnes from the eastern states each year.
In Japan most of the two row barley crop is used for shochu production. Barley with high starch content that delivers high alcohol production is appreciated for shochu production. Australian barley has an advantage on this point and is highly rated by users. The users want hard barley because high yield percentage is obtained at the time of barley processing (pearling). Western Australian Starling barley is also highly rated on the hardness. However, the current main varieties such as Starling from Western Australia and Schooner from South Australia are getting old and good varieties to take the place of the old varieties are expected. A major barley refiner (processor) for shochu has advised that Western Australian Bauden is very similar to Starling in quality characteristic and should be acceptable as its successor. However, they are concerned that Bauden has a bit higher broken grain at the time of pearling and tends to be a bit thinner in grain size (under 2 mm).

Western Australian Agrifood and Fibre Market Outlook — Japan
24
A barley processing association advised that the colour of 2008–2009 WA barley was not so attractive–rather they were dull in colour and the broken barley ratio after pearling process was higher than usual. This result could be caused by unfavourable climate during growing season and harvest time last year.
Table 8 MAFF’s import of barley for food (1000 tonnes)
2003 2004 2005 2006 2007 2008 Australia 216 286 216 324 91 257 Canada 20 20 43 49 38 74 USA 4 3 2 2 0.3 Total for year 240 309 259 375 131 331
Source: MAFF
Barley for feed Of the 1.0 to 1.1 million tonnes of barley imported for feed, about 70 per cent is used as an ingredient of stockfeed (compound mixed feed) after steaming and rolling. The remaining 30 per cent of barley for feed purposes is distributed to livestock farmers as a single component feed (direct feed) after either steaming and rolling or grinding roughly (less than 2.5 mm mesh). Barley for compound mixed-feed use is increasing, but it is difficult for Japanese beef consumption per capita to be expanded greatly. The increasingly ageing population and decline of the total population will affect the feed requirements for the livestock industry in the long term.
Under the SBS system, MAFF has increased the list of preferred suppliers to meet the diversified range of needs from users. Traditionally, feed barley was sourced from only three countries, the USA, Canada and Australia but there have been imports from other countries such as Russia and Ukraine. Toyota Tsusho Corp. plans to import milling wheat from Kazakhstan to Japan for the first time to diversify its supply sources as food demand increases in Asia. The company studied routes from Kazakhstan after a trial delivery of 3800 metric tonnes of feed barley from the central Asian nation in October 2009 while grain exporters in Kazakhstan as well as Russia and Ukraine restricted shipments in 2008 to secure the supply for local consumption or to curb food inflation.

Western Australian Agrifood and Fibre Market Outlook — Japan
25
It is estimated that Japan purchases 300 000 to 400 000 tonnes of feed barley from Western Australia each year.
0
100,000
200,000
300,000
400,000
500,000
600,000
700,000
800,000
2003 2004 2005 2006 2007 2008
Year
Tonn
es
United States Australia CanadaOthers
Figure 10 Barley imports by Japanese government for feed purposes Source: Global Trade Information Service 2009
Baled hay and cereal straw Japan has been a consistent importer of baled hay and straw which is used as a good roughage feed for dairy and beef cattle. In 2008 Japan imported 2.10 million tonnes of baled hay.
0
500,000
1,000,000
1,500,000
2,000,000
2,500,000
3,000,000
3,500,000
4,000,000
1998 1999 2000 2001 2002 2003 2004 2005 2006 2007 2008
Year
tonn
e
Beet pulp pelletsAlfalfa Hay cubesStraw Baled hay
Figure 11 Japan’s roughage feed imports (includes baled hay, straw, hay cubes and BPP) imports Source: Global Trade Information Service
The market has been growing very rapidly for the past 20 years but in 2008 baled hay imports decreased by 139 004 tonnes, down 6 per cent from the previous year. Japan’s total roughage feed imports have been declining for the last five years (Figure 1).

Western Australian Agrifood and Fibre Market Outlook — Japan
26
This was mainly due to increased commodity prices and stock feed prices last year and Japanese livestock farmers have been in a difficult situation from various reasons. Japanese agricultural cooperative organisation has analysed that the dairy industry couldn’t cover their production costs in their operation due to a low milk price last year, but due to a revised milk price that have provided this year, the dairy farmers have just taken a pause. On the other hand, consumers tend to buy cheaper meat such as chicken and pork and beef farmers have been in the most difficult situation at present in the livestock industry due to the poor beef market
Other remarkable points shown in 2008 are that rice straw imports from China were very much increased to 161 562 tonnes because the price is attractive. The imports in 2008 were seven times higher than the previous year. Australian oat hay imports to Japan also increased to 434 099 tonnes in 2008 which is 8 per cent up from 2007; Western Australia captured the highest share of this increase. This was mainly due to increased price of USA sudan hay which competes with oat hay. The price of USA alfalfa hay (another main import in the baled hay category) is expected to go up due to the recovery of the USA market.
It is difficult to see how the hay and straw market will expand further given the decline in Japanese livestock production.
0
100,000
200,000
300,000
400,000
500,000
600,000
2004/2005 2005/2006 2006/2007 2007/2008 2008/2009
Year
tonn
e
WA Rest of Aust
Figure 12 Australian and Western Australian cereal hay exports to Japan Source: ABS and DAFWA estimates
Table 9 Japan’s baled hay and straw imports
Import (tonnes)
2005 2006 2007 2008 2008/07 (%)
Alfalfa hay 469 261 456 968 423 715 430 488 102 Sudan hay 318 216 309 477 370 536 358 855 97 Timothy 504 052 289 831 508 320 436 948 86 Rye straw 254 130 281 081 215 619 182 217 85 Fescue straw 111 934 106 303 90 206 81 109 90 Bermuda 101 622 106 927 139 573 95 253 68 Australian oat hay 539 077 538 300 400 899 434 099 108 Others 87 116 2 439 629 90 447 81 342 90 Total 2 385 408 2 439 629 2 239 315 2 100 311 94
Source: Feed Industry Newspaper

Western Australian Agrifood and Fibre Market Outlook — Japan
27
Canola Since Japan has been dependent on Canada for its canola supply (96 per cent of canola supplied by Canada in 2008), Australian canola exports to Japan have been developed as an alternative source. The Australian share of the canola supply to Japan has averaged 19 per cent from 2002 to 2008 in volume.
Between 2003–04 to 2007–08, Japan was Western Australia’s largest market for canola. In 2008–09 Japan imported 90 702 tonnes of canola from Western Australia, valued at A$60 million, making Japan the fourth largest market for Western Australia’s canola exports after the Netherlands, France and Pakistan. Western Australia has been dominant in Australian canola exports to Japan.
Non-GM and GM canola market in Japan In 2007, 86 per cent of the Canadian area sown to canola was sown to GM canola. Estimates of the current market size of non-GM canola in Japan vary from 30 000 to 80 000 tonnes. These estimates include approximately 15 000 tonnes of requirements from Consumers’ Co-ops and 8–9000 tonnes of a small oil crusher which specialises in non-GM canola oil. It is most likely that a minimum of 23 000–25 000 tonnes of non-GM canola will stay, if the price of non-GM canola doesn’t get too high.
J-Oils Mills and Nisshin Oillio are the two major Japanese users of Australian canola. A rough market share of vegetable oil in Japan is Nisshin Oillio: 35 per cent; J-Oil: 35 per cent; and Showa: 10 per cent.
At the February 2009 opening of Grain Pool’s Japanese office, representatives from J-Oils answered questions from the Western Australian Farm Weekly as follows:
● J-Oils is prepared to pay a premium for Australian canola to ensure canola supply if there are problems with supply of Canadian canola.
● Over the past five years there has been a premium for non-GM canola but the market for non-GM canola is small and diminishing. Only small non-GM niche markets are prepared to pay a premium for non-GM canola.
● The demand for non-GM canola oil is only 3–5 per cent of the total canola oil market in Japan. Japanese demand for non-GM foods is not in the oil market but in the processed food market, for example, tofu which must be labelled as GM. Oil derived from GM canola is not required to be labelled as GM in Japan.
If the Australian Government allowed cultivation of GM canola this would not affect J-Oils purchase of Australian canola.

Western Australian Agrifood and Fibre Market Outlook — Japan
28
0
500
1,000
1,500
2,000
2,500
'000
T
2002 2003 2004 2005 2006 2007 2008
Year
Canada AustraliaOthers
Figure 13 Japan’s canola imports Source: Global Trade Information Service
201.304982
140.31157
86.4108969.808728 65.189486
82.434569 67.171548 71.00624852.903812 59.510859
0
50
100
150
200
250
04/05 05/06 06/07 07/08 08/09
Year
A$M
WA Australia
Figure 14 Western Australian canola export trends for Japan Sources: ABS and DAFWA estimates
Red-fleshed grapefruit Grapefruit is the second largest (by volume) imported fruit into Japan, behind bananas. However, Japanese total imports of grapefruit have shrunk to 184 022 tonnes in 2008 from the peak of 554 841 tonnes in 1995 mainly due to a decrease of exports from the USA.
Research by Department of Agriculture and Food, Western Australia senior research officer Francis De Lima made a significant impact on international market access for citrus fruit from Australia. Japan accepted new cold treatment protocols for fruit fly, based on years of groundbreaking research led by Dr De Lima.
The department’s Kununurra office advised at the beginning of 2010 that verification for Red-fleshed grapefruit has been completed and sent to MAFF in Japan. If all goes well, exports will commence to Japan in 2010. We understand that the anticipated annual tonnage will be 10–12,000 tonnes of which approximately 50 per cent will be shipped to Japan. Other markets include Hong Kong, Taiwan and the EU.

Western Australian Agrifood and Fibre Market Outlook — Japan
29
0
50,000
100,000
150,000
200,000
250,000
300,000
350,000
2003 2004 2005 2006 2007 2008
Year
tonn
e
United States South Africa Swaziland Israel Others
Figure 15 Japan’s import of grapefruit including pomelos, fresh or dried (tonne) Source: Global Trade Information Service
50
100
150
200
250
J F M A M J J A S O N D
Month
Yen/
kg
2005 2006 2007 2008 2009
Figure 16 USA grapefruit wholesale price in Tokyo wholesale markets Source: Tokyo Wholesale Markets

Western Australian Agrifood and Fibre Market Outlook — Japan
30
2008
0
200
400
600
800
1000
1200
1400
J F M A M J J A S O N D
Month
Tonn
es
USA South Africa Israel Others
Figure 17 Quantity by origin at Tokyo wholesale markets 2008 Source: Tokyo Wholesale Markets
Health food ingredients The Japanese Government is encouraging people to stay healthy, eat correctly and use health foods and supplements, rather than rely on government-sponsored prescriptions. As a result, imports of health food production ingredients are expected to increase rapidly. Trade and Market Services aims to create business opportunities for Western Australian producers in this area.
Western Australia’s clean, green image provides an opportunity for Western Australian exporters to exploit the Japanese organic and healthy food market. Suppliers who can verify that their products come from a clean, green environment with an ecologically friendly production system and who can differentiate their own products from others are well placed to take advantage of this market.
Investment attraction opportunities Agricultural production in Japan is declining at an alarming rate. The country’s food self-sufficiency ratio is also declining as consumer eating habits change. Japan now imports 60 per cent of her food from overseas, which is a massive amount. This structure is expected to continue. The Japanese Government is now thinking that it is necessary to promote agricultural investment in overseas countries as a way to ensure food imports, to diversify the origin countries and to improve its food security.
There are many examples of Japanese trading houses, food and beverage manufacturers and retailers who have invested their capital in agrifood and retail businesses in overseas countries. These movements have recently increased and are expected to continue as those domestic industries are realigned. Australia has been a good destination for investment in agrifood business.

Western Australian Agrifood and Fibre Market Outlook — Japan
31
These companies need overseas markets for their business growth. The domestic market and market size is predicted to decline, due to rapid aging of the population and decline in the birth rate.
Naturally all the eyes of the companies are on Asia which holds approximately 60 per cent of world population. As income rises in that market, especially in China, the importance as a consumption area will arise more and more.
Japanese companies also have to cultivate a more global view to develop off-shore trade and secure business expansion. Western Australia needs to attract those companies that will bring special value-adding technology in food processing to the State for increased trade development and investment.
Nation low in food self-sufficiency Food self-sufficiency refers to the ratio of domestically produced food to the nation's total food consumption in terms of calories. In fiscal 2007, Japan's figure was 40 per cent, down from over 70 per cent in the first half of the 1960s due to dietary changes—mainly from rice to bread as a staple food and fish to meat dishes—and increasing imports. The figure first fell below half to 49 per cent in fiscal 1989.
Looking overseas, in 2003 Australia's self-sufficiency rate was 237 per cent, followed by the USA, France and Canada (all over 100 per cent), Germany (84 per cent) and the UK (70 per cent). Japan's figure is exceptionally low among developed nations.
As population growth in emerging nations tightens food supplies worldwide, anxiety is justifiably growing in Japan over food security.
Japanese agriculture declining rapidly The proportion of Japan's agricultural land is shrinking, and fewer and fewer people are working the nation's remaining fields. Arable land is sitting idle, as if the growing global concerns about imminent food shortages are someone else's problem.
Land and labour are essential factors in agricultural production. Since its 1960 peak at 14.54 million people, Japan's agricultural population has been trending steadily downward. At just 2.98 million, the 2008 figure is down by nearly 80 per cent compared to the high.

Western Australian Agrifood and Fibre Market Outlook — Japan
32
From 1960 to 2008, the number of agricultural households fell by 58 per cent to 2.52 million, and it is less than 2 million if one leaves out small operations producing mostly for their own consumption.
Aging and dwindling workforce in the agricultural sector Along with the falling numbers of farming people and households, farmers are getting older. In 1983, about 40 per cent of the people in agriculture were 60 years old and older; today the percentage is over 70 per cent, and 60 per cent of them are over 65.
In the same period, the number of those in their 40s and 50s has fallen by half. Although the Japanese population as a whole is aging, but still less than 30 per cent are 60 and older.
‘If this continues, 60 per cent of Japan's agricultural workers will be over 75 in 10 years, making agriculture a sub industry,’ warned a former official of the Ministry of Agriculture, Forestry and Fisheries.
The decrease and aging of the agricultural population have led to a reduction in agricultural land. In 1961, agricultural concerns reached a peak with 6.09 million hectares (15.04 million acres) of land in production; by 2008 that had fallen to 4.63 million hectares.
Japan changes tack to fix food shortage In response to rises in the price of food, the number of starving people has increased in many developing countries (1 billion people in 2009). World population is expected to grow, especially in Asian and African countries, from 6.6 billion people in 2006 to 7.6 billion people in 2018. Furthermore, GDP per capita is also expected to increase from $7234 to $9303 in 2009. Under those circumstances, world demand for grains is predicted to grow by 500 million tonnes to 2.6 billion tonnes in the 12 years from 2006 to 2018. As it is difficult to catch up with the growth of the demand through breed improvement or increase of planted area, the total stock of world grains is expected to shrink over that period.

Western Australian Agrifood and Fibre Market Outlook — Japan
33
The Japanese Government thinks that it is important to increase the food production in the world and to expand agricultural investment while the supply and demand situation in food tends to be tight in medium and long term. They now believe that it is necessary to promote agricultural investment in overseas countries and to diversify the origin countries from food security point of view.
The Japanese Government has already set up special desks at the two Ministries in Japan, Ministry of Agriculture and Ministry of Foreign Affairs, to deal with proposals of overseas agricultural investment from private companies. The government is prepared to support them with several programs including diplomatic and financial assistance. Overseas Development Administration (ODA) should be promoted to increase the food production in developing countries.
After focusing for decades on oil, metals and minerals, Japan's huge trading houses are turning to agricultural commodities. They are enthusiastically supporting the shift amid concerns about local and global food security.
The move by general trading houses came as the Japanese Government prepared to launch plans last August to finance investment in food production overseas. Japan is the world's largest net importer of food, buying in more than $79 billion.
Among Japan's five mammoth trading houses, Mitsui and Co, Itochu and Marubeni are expanding into food commodities such as soybean, palm oil, wheat and corn.
‘The Japanese trading houses are … particularly investing in assets such as grain elevators and export terminals,’ says Philippe de Lapérouse, from USA-based agribusiness consultants HighQuest Partners.
The Japanese approach differs from countries such as South Korea and Saudi Arabia, which want to secure resources to feed their own populations. Rather, the trading houses want to increase global supplies by seeking opportunities abroad. Amid the global food crisis, having money does not necessarily guarantee the ability to obtain food. No matter how well developed domestic agriculture becomes, Japan simply will never be fully self-sufficient. However, the country can take steps to ensure a more stable food supply. One way is to take a ‘made by Japanese’ approach, in which domestic firms produce food products abroad for shipment to Japan. The recent overseas investments by Japanese food companies have other objectives. At a time when the Japanese market is shrinking because of a decline in population due to the falling birth rate and the ageing population, companies are more aggressively seeking overseas markets.
In August 2008 Japanese company Kirin Holdings Co. agreed to buy Australia’s second-ranked milk processor, Dairy Farmers, building on its purchases in the previous year of that country’s premier dairy firm, National Foods Ltd. Kirin aims to boost exports of dairy products to South-East Asia after expanding operations in Australia. The acquisition of Dairy Farmers will raise Kirin’s share of the Australian milk market from 37 per cent to 63 per cent and in the country’s yogurt market from 27 per cent to 55 per cent.
Itochu buys stake in Aussie dairy firm Itochu Corp. has acquired a 45 per cent interest in a mid-tier dairy company in Australia to produce milk powders for export to Japan, China and South-East Asia.

Western Australian Agrifood and Fibre Market Outlook — Japan
34
Figure 18 Itochu and Burra Foods will build a powdered milk factory in Australia.
Demand for dairy products is growing, particularly in China and other emerging nations as income levels rise. In anticipation of tighter market conditions, the trading house sought to secure a production base.
Itochu invested about 2.4 billion yen (A$30 million) in the holding company of dairy firm Burra Foods Australia Pty Ltd, becoming the second-largest shareholder after the founding family. Itochu also extended about 500 million yen (A$6.3 million) in loans to the holding company.
Burra Foods plans to build a powdered milk factory with an output capacity of 24 000 tons a year. Scheduled to go into operation in July 2010. the facility will make mainly powdered skim milk to be supplied to manufacturers of dairy products and foods. The ingredient is used in such items as ice cream, processed milk and yogurt.
Itochu poised to buy into leading China food firm In a bid to tap the strong growth potential of the Chinese food market, Itochu Corp. announced last November 2009 that it will acquire a 20 per cent stake in Ting Hsin group for 70 billion yen (A$875 million).
The leading Chinese processed food firm in terms of market share controls major food-related companies, including No. 1 Chinese instant noodle maker Tingyi (Cayman Islands) Holding Corp. and the operator of the FamilyMart chain of convenience stores.
Itochu will take the stake in Ting Hsin group through its holding company, Ting Hsin (Cayman Islands) Holding Corp.
Helped by its close relationship with Itochu, Ting Hsin has already established various local joint ventures with such Japanese firms as Asahi Breweries Ltd, Kagome Co., Nippon Flour Mills Co. and Shikishima Baking Co. Leveraging its capital ties with Itochu, Ting Hsin plans to bolster its partnerships with Japanese companies further across a wide range of areas, including sweets and spices.
Following a series of food scares, public interest in food safety has been growing in China. Demand for high-quality processed food has also been growing as the middle class continues to expand. By teaming up with Japanese companies and tapping their product development and manufacturing expertise, Ting Hsin aims to bolster its competitiveness.

Western Australian Agrifood and Fibre Market Outlook — Japan
35
In August, Itochu also formed a comprehensive business tie-up with major Chinese food company Cofco Ltd. The two firms are now holding talks to start joint procurement of wheat and dairy products. They are also looking to work together in the edible oil and meat processing businesses.
Mitsui inks feed materials tie-up with China's New Hope Group Last September 2009, Mitsui and Co. said that it has formed an alliance with Chinese agribusiness giant, New Hope Group, that will focus on such operations as importing feed ingredients into China.
Their cooperation will also extend to joint procurement and sales of feed in China, with Mitsui supplying compound feed technologies as well as access to distribution networks. Demand for dairy products and meats have grown in China alongside an improving standard of living, spurring the need for stable feed supplies.
To help meet this demand, New Hope Group seeks to tap the procurement resources of Mitsui, which purchases agricultural supplies on a global scale. Mitsui, meanwhile, expects to benefit from the synergy resulting from the partnership.
New Hope Group, which handles 13 million tons of compound feed annually, aims to increase this figure to 30 million tons after five years and to boost its market share from 10 per cent to 15 per cent.
The companies will also consider expanding their cooperation to business areas such as livestock, dairy, chemicals and financial operations.
Developing a Western Australian green tea industry The ground work by the Department of Agriculture and Food, Western Australia and the Green Tea Partnership Group to develop a green tea industry in the south-western Western Australia is now starting to deliver.
In December 2009, the industry has four commercial plantings comprising about six hectares of commercial plantings of tea plants in the South West region. There are also a number of small ‘test’ plantings by prospective growers in the region. Prospective growers continue to show interest and orders are being negotiated with nursery suppliers. The oldest commercial plantings are approaching three years of age and will be suitable for their first harvesting next season (2010–11) This first harvest will be of limited value for commercial processing. Commercial processing is planned for the following year.
The Manjimup Green Tea Company was established as a commercial entity to attract investment into the growing of green tea leaf and the establishment and operation of a commercial processing and distribution facility in the region. Efforts to attract investment to establish a commercial processing operation continue. New investment packages are being developed by the Department of Agriculture and Food, Western Australia in collaboration with the Manjimup Green Tea Company to provide more detailed information pertinent to making sound investment decisions.
Japanese tea companies continue to show interest in the opportunities for Australian produced green tea as a complementary ‘counter seasonal’ product for the Japanese market. There will also be opportunities for import replacement for the continued strong Australian market and for markets in Europe and the USA.
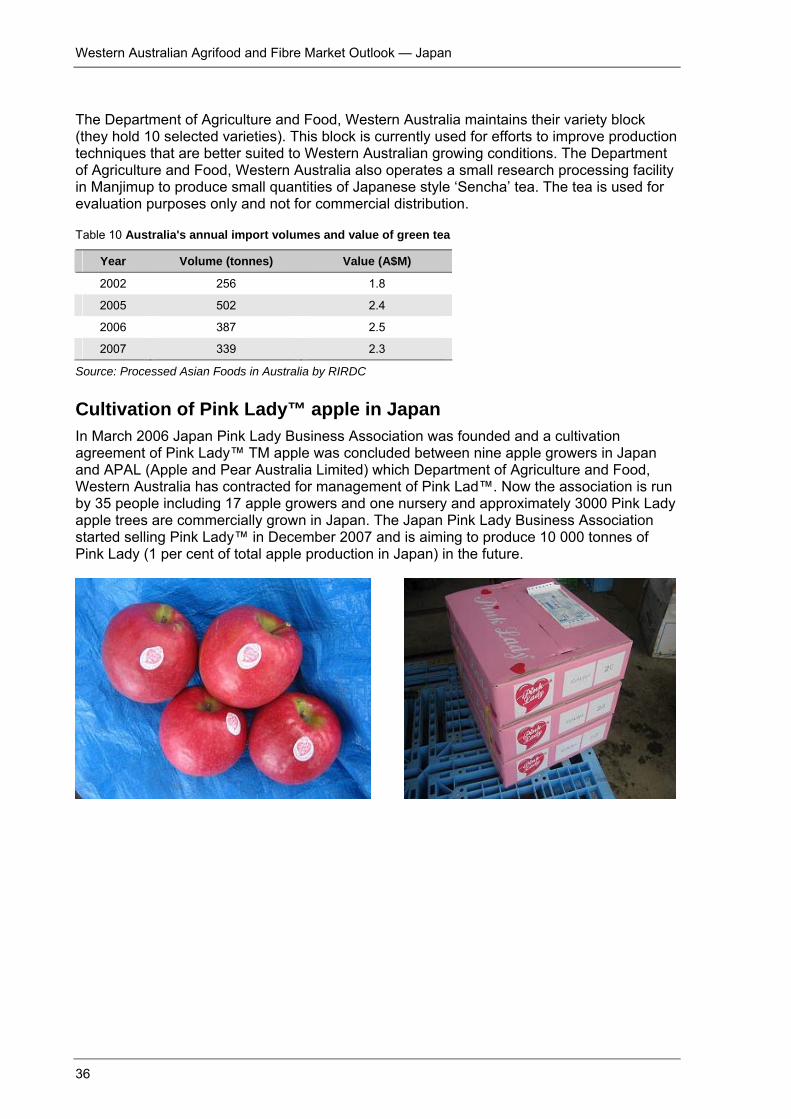
Western Australian Agrifood and Fibre Market Outlook — Japan
36
The Department of Agriculture and Food, Western Australia maintains their variety block (they hold 10 selected varieties). This block is currently used for efforts to improve production techniques that are better suited to Western Australian growing conditions. The Department of Agriculture and Food, Western Australia also operates a small research processing facility in Manjimup to produce small quantities of Japanese style ‘Sencha’ tea. The tea is used for evaluation purposes only and not for commercial distribution.
Table 10 Australia's annual import volumes and value of green tea
Year Volume (tonnes) Value (A$M)
2002 256 1.8
2005 502 2.4
2006 387 2.5
2007 339 2.3
Source: Processed Asian Foods in Australia by RIRDC
Cultivation of Pink Lady™ apple in Japan In March 2006 Japan Pink Lady Business Association was founded and a cultivation agreement of Pink Lady™ TM apple was concluded between nine apple growers in Japan and APAL (Apple and Pear Australia Limited) which Department of Agriculture and Food, Western Australia has contracted for management of Pink Lad™. Now the association is run by 35 people including 17 apple growers and one nursery and approximately 3000 Pink Lady apple trees are commercially grown in Japan. The Japan Pink Lady Business Association started selling Pink Lady™ in December 2007 and is aiming to produce 10 000 tonnes of Pink Lady (1 per cent of total apple production in Japan) in the future.
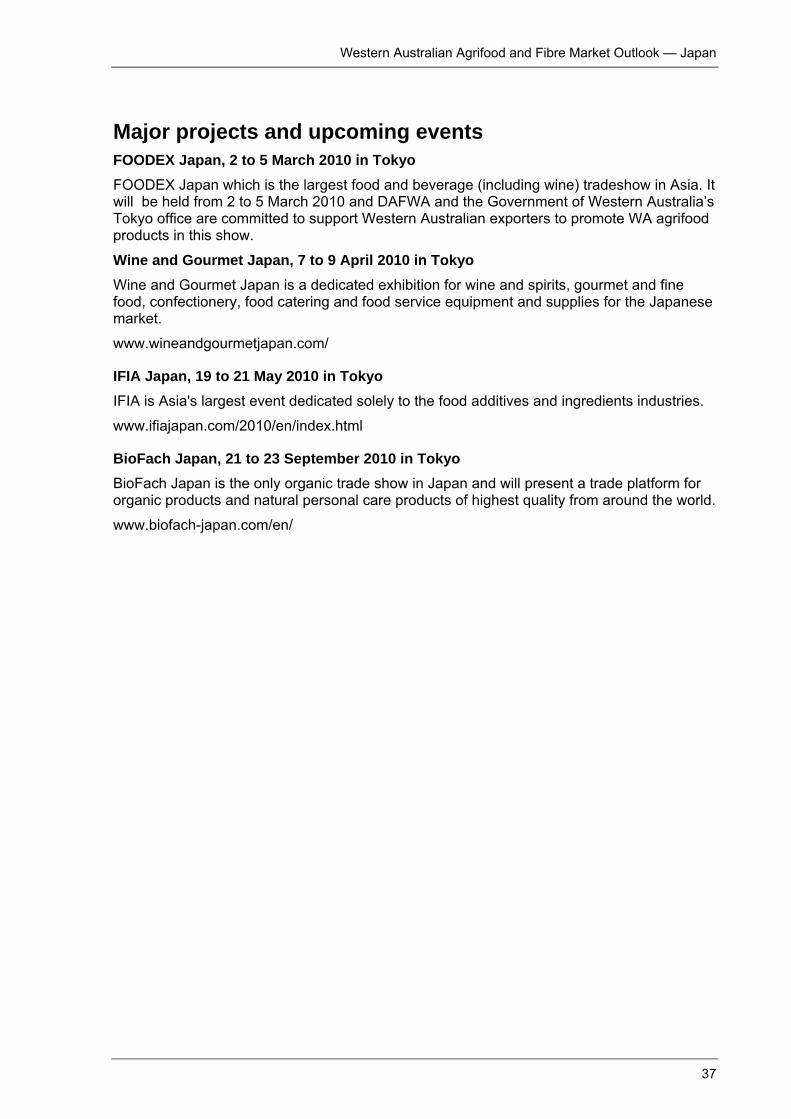
Western Australian Agrifood and Fibre Market Outlook — Japan
37
Major projects and upcoming events FOODEX Japan, 2 to 5 March 2010 in Tokyo FOODEX Japan which is the largest food and beverage (including wine) tradeshow in Asia. It will be held from 2 to 5 March 2010 and DAFWA and the Government of Western Australia’s Tokyo office are committed to support Western Australian exporters to promote WA agrifood products in this show.
Wine and Gourmet Japan, 7 to 9 April 2010 in Tokyo
Wine and Gourmet Japan is a dedicated exhibition for wine and spirits, gourmet and fine food, confectionery, food catering and food service equipment and supplies for the Japanese market.
www.wineandgourmetjapan.com/
IFIA Japan, 19 to 21 May 2010 in Tokyo IFIA is Asia's largest event dedicated solely to the food additives and ingredients industries.
www.ifiajapan.com/2010/en/index.html
BioFach Japan, 21 to 23 September 2010 in Tokyo BioFach Japan is the only organic trade show in Japan and will present a trade platform for organic products and natural personal care products of highest quality from around the world.
www.biofach-japan.com/en/

Western Australian Agrifood and Fibre Market Outlook — Japan
38
Contacts Government of Western Australia Tokyo Office Mr Craig Peacock Commissioner of North Asia Agency Department of the Premier and Cabinet Government of Western Australia 13th Floor, Fukoku Seimei Bldg, 2–2–2 Uchisaiwai-cho, Chiyoda-ku Tokyo 100–0011 Japan
Tel: (813) 5157 8281 Fax: (813) 5157 8286 Mobile: (8190) 9333 1961 Email: [email protected] Website: http://wajapan.net
Mr Yujun Ichikawa Business Development Manager (Agriculture, Biotechnology) Government of Western Australia
Tel: (813) 5157 8281 Fax: (813) 5157 8286 Email: [email protected]
Kobe office Ms Noriko Hirata Regional Director Government of Western Australia Kobe Office 6F Golden Sun Bldg 4 chome 3–6 Nakayamate-dori Chuo-ku Kobe Hyogo 650–0004
Tel +8178 242 7705 Fax +8178 242 7707 Email: [email protected]
Department of Agriculture and Food, Western Australia Mr Matt Yamamoto Manager Market Development–Japan and Korea Trade and Market Services Department of Agriculture and Food, Western Australia 3 Baron-Hay Court, South Perth WA 6151 Australia
Tel: +61 8 9368 3469 (Direct) Fax: +61 8 9367 7389 Mobile: 0404 819 537 Email: [email protected] Website: www.agric.wa.gov.au

Western Australian Agrifood and Fibre Market Outlook — South Korea
39
SOUTH KOREA
A market overview for Western Australian agribusinesses South Korea is a very important market for Western Australian agrifood businesses. This Market Outlook for South Korea provides a market overview and discusses Western Australian agrifood export performance and investment opportunities.
This report was researched and prepared by the Western Australian Global Network Office, South Korea and Trade & Market Services, Department of Agriculture and Food Western Australia.
Economic overview South Korea is the world’s 14th largest economy in 2008 with a GDP of A$1.47 trillion on a purchasing power parity (PPP) basis. GDP per capita was A$30 360 in 2008. Although the Korean economy has been affected by the global economic crisis, it is recovering quickly. The Korea Development Institute (KDI), an economic think-tank of the Korean Government, forecasts Korea’s economic growth may achieve 5.5 per cent in 2010 with A$17.6 billion of the current account surplus.
According to Korea Rural Economic Institute (KREI), Korean agriculture accounts for 3.2 per cent of GDP (down from 24 per cent in 1975) and 6.3 per cent of the country’s labour. Consequently Korea depends on imports for about 60–70 per cent of its food and animal feed needs. Korea’s major imports include grain and meat products. The Korean Government forecasts that the local agriculture ratio of the GDP will decrease to 2.7 per cent by 2010 and 1.6 per cent by 2020.
Korean total agricultural and food imports in 2008 were valued at A$26 billion, and have increased 39 per cent since 2004. China and the USA are the major suppliers accounting for 46 per cent of market share. Other important suppliers include Australia and Brazil.
18
20
22
24
26
28
2004 2005 2006 2007 2008
A$ B
illion
Figure 19 South Korean agrifood imports 2004 to 2008 (A$B) Source: Global Trade Information Service 2009

Western Australian Agrifood and Fibre Market Outlook — Japan
40
The South Korean market is highly developed and very competitive, with consumer demands shifting towards high-quality, healthy and natural products. In the case of beef consumption, even though the USA and Canadian beef fully returned to the market last year with relatively cheaper prices, the market is still dominated by Australian beef due to safety issues, such as BSE. Demand is growing rapidly for organic food in products such as vegetables, nutritional foods and organic wheat, as well as for products aimed at the ageing population. These markets are considered to have high potential for expansion.
Regarding investment opportunities, the Korean Government recently allocated A$20 million to encourage Korean agri-investment companies to invest in overseas farms for national food security. Major companies put effort into finding appropriate places to invest. South East Asian countries, the Maritime Province of Siberia and Mongolia are considered as priority options. However, Western Australia is another attractive destination for the investors.
Western Australian Agrifood and Fibre Market Outlook — Japan
41
Australian and Western Australian agrifood export performance Western Australia’s food and beverage exports to South Korea were valued at A$403m in 2008–09, making South Korea the state’s fifth largest export market for these products. The main exports from Western Australia included wheat, cereal hay, lupins, beef and malt, which together constituted 94 per cent of Western Australia’s total value of exports to South Korea (Table 11). In 2008–09 South Korea continues to be an important market for Western Australian grain industry.
Table 11 Western Australia’s top 10 export agrifood products to South Korea 2008–09
Product Value (A$M) Proportion of total (%) Wheat 290.50 72.1 Hay and chaff excl. lucerne 25.70 6.4 Lupins 25.67 6.4 Beef 24.86 6.2 Malt 13.23 3.3 Barley 8.15 2.0 Canola oil 3.21 0.8 Cream 2.27 0.6 Lamb 1.75 0.4 Offal, cattle 1.75 0.4 Others 5.97 1.5 Total 403.05 100.00
Source: ABS and DAFWA estimates 2009
Western Australia contributed almost 28 per cent of Australia's A$1.4 billion agricultural exports to South Korea during 2008–09 (Figure 20). Australia exports a variety of agricultural products to South Korea. However, beef, wheat and malt dominate, representing 66 per cent of Australia’s total value of exports. With the exception of grains, where Western Australia currently exports 100 per cent of Australia’s total exports of lupins and wheat to South Korea, Western Australia contributes a very small percentage of Australia’s other agricultural exports to South Korea.

Western Australian Agrifood and Fibre Market Outlook — Japan
42
200
400
600
800
1,000
1,200
1,400
1,600
1,800
04/05 05/06 06/07 07/08 08/09
Year
A$M WA
Australia
Figure 20 Export value (A$M) of Australian and Western Australian agrifood to South Korea 2004–05 to 2008–09 Source: ABS and DAFWA estimates 2009
South Korea is an important market for Western Australia’s grain exports. In 2008–09, South Korea was Western Australia’s third largest wheat export market (A$290m) accounting for around 11 per cent of Western Australia’s total wheat exports. South Korea is the largest export market for Western Australian lupins (A$25.7m) accounting for around 48 per cent of Western Australia’s total lupin exports. Lupins have been well received for use in the South Korean compound feed market. In 2008–09 cereal hay (the second biggest export to South Korea from Western Australia), lupins, malt, barley and canola oil showed very good increases in export value compared to the exports in 2007–08 figures.
In 2008–09 cream, meat and animal products for pet food, wine, pearl shell and processed oats showed good growth in the export value to South Korea from the previous year. On the other hand, the exports of beef, lamb, cattle offal, oats and pearls declined from 2007–08.
Quarantine issues, including fruit fly and codling moth, are major impediments to market access for Australian fresh horticultural products. Bilateral discussions between quarantine agencies are held periodically to help improve this situation. At present, imports of most fruits have been prohibited because of phytosanitary concerns.

Western Australian Agrifood and Fibre Market Outlook — Japan
43
Market opportunities and outlook for Western Australian agrifood products
Grain exports (feed grains, seeds, wheat flour) South Korea is an important export market for Western Australian grain exports. In 2008–09, South Korea was Western Australia’s third largest wheat export market (A$290m), accounting for more than 11 per cent of Western Australia’s total wheat exports. Figure 21 shows the value of Western Australian wheat exports to Korea during the past five years.
100
150
200
250
300
2004/2005 2005/2006 2006/2007 2007/2008 2008/2009
Year
A$M
Figure 21 Western Australian wheat exports to South Korea 2004–05 to 2008–09 (A$m) Source: ABS and DAFWA estimates 2009
In 2008-09, total wheat consumption in Korea increased to 3.0 million tonnes from 2.9 and is expected to grow 3.9 million tons in 2009–10 due to strong demand for competitively priced feed wheat from Ukraine Russia Federation and Kazakhstan. Feed wheat consumption has grown up to 942 000 tons this year from 686 000 tons in 2007–08, whereas milling wheat decreased slightly from 2.2 to 2.0 million tons for the same period of time.
Valuable Australian wheat grades exported to South Korea are Australian Hard (used for specialty dry noodles), Australian Standard White (for noodle flour, soft flours and bread) and Australian Soft (for snack foods, biscuits and cakes).
A movement by Korean Government aims to increase the country’s self-sufficiency rate and improve the country’s food security; this plan includes domestic wheat production growth up to 200 000 tons by 2017 which is 10 per cent up from current production.
South Korea is the largest market for the export of Western Australian lupins. In 2008–09 Western Australian lupin exports were valued at A$25.67m, up 6.4 per cent from 2007–08. There is only one lupin mill in Korea operated by Sunny Lupin and owned by the Grain Pool Pty Ltd (GPPL). Since Australian Sweet lupins for human consumption were developed in Western Australia, the search for potential markets for lupin flour is underway, to resolve quarantine regulation and tariff issues. In 2009 relevant information and samples for the product test were provided to some major noodle manufacturers and food and bakery franchise companies in Korea.
Western Australian Agrifood and Fibre Market Outlook — Japan
44
WA hay and chaff exports to Korea increased a significantly with A$25.7 million in FY 2008/09, which is 80.4 per cent up from previous year. This large increase is caused by strong demand from the Korea feedstock market for Australian product due to competitive price and good quality compared to USA and Canada.
The Korean domestic oilseeds market was dominated by mainly imported soybean and corn. Its share has moved to olive and grape seed oil in conjunction with a trend towards wellbeing since 2003. The demand for canola and sunflower oil has increased recently due to being more price competitive than olive and grape seed oil. Canada is the largest canola oil exporter to Korea, dominating over 95 per cent of market share with A$21 million in 2007 compared to A$0 from WA due to poor competitiveness in price. However, WA achieved A$3.2 million for canola exports in 2008–09 for the first time. It is expected for this market to grow next year if more consumers are concerned with health issue and looking for a better quality product.
Korea’s import of wheat flour from WA was valued at A$43m in 2008, double the value of 2006. Canada was the biggest wheat flour exporter to Korea taking about 50 per cent of market share and followed by Turkey, Hungary, Indonesia and Australia.
The majority of Australian wheat flour exported to Korea is organic wheat flour for the local bakery sector, mainly sourced from Queensland. Australian wheat is seen as good for noodle making rather than baking purposes. However, in the organic wheat flour sector it has been very well received by high-end local bakery chains including Kim Young-Mo bakery.
Major importers of grain to South Korea are Daehan Flour Mills, CJ, Donga, Samhwa, Samyang Milmax, Purina, Daehan Livestock and Feed, Sunjin, Samyang feed, Daesang Farmsco and Nonghyup Feed.
Specific opportunities for the Western Australia grain industry are:
● wheat for flour manufacturers
● grains for stockfeed, including wheat, barley, soybean and corn
● hay, including oaten hay and lucerne hay
● organic grains for flour mixes and beverages
● oats for horse feed
● alternative lupin species for human consumption.
Meat and animal products Specific opportunities for meat imports into South Korea are:
● chilled beef for retail and food service sectors—grain-fed preferred but grass-fed market segments exist
● pork meat and offal as an ingredient for the meat processing and food service sectors
● wagyu beef—due to the strong USA dollar, Australian grain-fed wagyu has a better position than USA grain-fed beef
● processed meats including frankfurter sausage, luncheon meat, canned ground beef and hamburger patties for the food service industry
● bulk, crude, edible beef tallow for use in the food industry.

Western Australian Agrifood and Fibre Market Outlook — Japan
45
Beef The past year has seen a weaker and uncertain Korean beef market. The coincidence of the credit crisis, severe economic downturn and re-entry of USA beef has lowered demand and prices for Australian beef in Korea. After a very sluggish start for Australian beef exports to Korea in the early 2009, volumes have steadily increased. For the ten months of 2009, Australian exports totalled A$348 million. The market expects to achieve A$420 million (A$25 million from WA) at the end of 2009 with over 54 per cent of market share followed by USA and New Zealand beef.
-
200
400
600
800
1,000
1,200
2004 2005 2006 2007 2008
$A M
illion
Other
United States
New Zealand
Australia
Figure 22 Beef imports to South Korea, 2004–2008 Source: Global Trade Information Service, 2009
USA beef imports during 2009 did not expand as quickly as the market expected after the Korean Government lifted an import ban on USA beef in 2008. The lower sales are attributed to several factors including: slow economic recovery and weakened Korean currency earlier in the year, ample inventories of USA beef caused by overestimating consumer demand, and increased consumer demand for Australian clean beef. Indeed, many Korean consumers are still resisting USA beef, forcing many importers to sell product at a loss in order to clear stocks. This has had a huge impact on the market, with prices for Australian beef also forced lower to compete.
Looking into 2010, USA beef is expected to slowly find wider consumer acceptance, with increasing import volumes and to erodie Australia’s majority share of the imported beef market. Under the assumption of increased USA imports, Australian beef exports to Korea in 2010 are forecast to decline less than 10 per cent from 95 000 to 90 000 tonnes swt. However, the market will still be dominated by Australian beef due to continued consumer concern on safety issue of BSE.
In Korea very little beef is consumed in the form of processed meat and virtually all beef is purchased for direct cooking in the form of Korean barbecue, soup and other Korean dishes. Only 600 tonnes of imported beef rounds from Australia and New Zealand are processed into beef jerky by a domestic company.
The most popular cuts of beef are bone-in short ribs, loins and chuck rolls. Short ribs are consumed mainly for Korean barbecue or kalbi (marinated beef). Loins are also used for Korean barbecue while chuck roll is used for making bulgogi, shaboo shaboo and steak. As Koreans like to barbecue their beef, well-marbled beef receives higher prices than lean meat.

Western Australian Agrifood and Fibre Market Outlook — Japan
46
Also, consumers are accustomed to grain-fed beef and prefer it to grass-fed beef. Grass-fed beef is often marinated to cover the ‘grass flavour’ that Koreans do not like. There is also a preference for fresh chilled beef rather than frozen beef. While USA beef was banned, not only did the total amount of short rib imports drop and Australian clod replaced chuck roll.
Sheep and goat meat Only two countries supply lamb and mutton to the South Korean market—Australia and New Zealand. Australian lamb exports to South Korea have increased by around 80 per cent over the past five years. In 2008–09, Australian and Western Australian lamb exports to South Korea were valued at A$7.6m and A$1.7m respectively.
Lamb is mainly supplied to five-star hotels, high-end restaurants, some health food restaurants and small food service establishments serving expatriate Asian labourers in South Korea. Recently some family restaurants such as Tony Romas, VIPs and Marche developed a menu including rack of lamb or lamb shoulder. In addition, some online retail stores, including KGV Australia (www.bodyplan.co.kr), are supplying lamb for wholesalers or to consumers directly. Most South Korean consumers are not familiar with lamb as it is not a traditional product. They are unfamiliar with how to cook it and there is no South Korean word that distinguishes lamb from mutton.
In South Korea frozen square-cut shoulder, rack, foreshank and leg are the main cuts of lamb used in the hotel and restaurant industries.
In the case of mutton, frozen cut shoulder is mainly supplied to Asian expatriate worker communities or to restaurants catering to these workers through special suppliers connected with specific markets.
MLA South Korea advises that there are currently around 15 to 20 companies importing sheep meat into South Korea, with a reported average monthly volume of imports from 1–50 tonnes. Some companies are providing for South Korean customers and others for the expatriate worker communities in South Korea.
Sheep meat, especially lamb, is becoming increasingly popular in South Korea due to BSE issues with beef. It also provides a protein substitute for beef, pork and poultry. There is great potential and many opportunities for Western Australian lamb to develop in the South Korean market if some of the issues below are overcome:
● Most South Koreans still believe that sheep meat has a strong and unpleasant smell. More time needs to be spent in changing consumer beliefs and educating consumers through promotional events and tastings at food fairs, supermarkets and hypermarkets. Developing a niche market with high-quality brands of products such as organic lamb would be a potential opportunity for the Western Australian industry.
● As sheep meat is not a traditional South Korean product, most local consumers and industry personnel are unfamiliar with cooking and cutting requirements compared with other more traditional meats such as beef or pork. An education program for consumers, retailers and food service personnel should be undertaken prior to market entry.
● Appropriate packaging is also an important factor for the retail market. According to MLA South Korea, home-ready packaging has received positive and welcoming feedback from consumers compared with bulk packaging. In retail stores targeting South Korean end-users, it is important to display lamb in home-ready packaging with small portions and a useful recipe to ensure easy use.

Western Australian Agrifood and Fibre Market Outlook — Japan
47
● A major concern is high tariff rates, with the South Korean market being very price sensitive. The current tariff for sheep meat in South Korea is 22.5 per cent, which is much higher than in other countries. For example, the tariff in Japan is zero, in China 15 per cent, in Mexico 10 per cent and in Middle Eastern countries 0–5 per cent.
Pork For the first half of the year, the USA is still dominating pork import market in Korea with 28 per cent (A$132.9m), followed by Chile with 16 per cent and Canada with 13.7 per cent. Australian pork was exported to Korea for only A$143 000 over the same period of 2009, and A$0.8m in 2008–09.
According to Korea Swine Association, the favourite pork cut is fatty bellies with 50 per cent followed by bulgogi (seasoned and marinated pork made from arm picnic or ham), collar butt and short ribs.
Pork consumption is forecast to increase to 1.5 million tonnes in 2010 after dropping this year due to high prices of domestic pork, especially pork belly and the brief H1N1 scare. H1N1 is a subtype of influenza A virus and the most common cause of influenza (flu) in humans. According to inspection data, pork imports during the first half of this year are down by almost 40 per cent to 68 000 tons from the same period last year. Due to the limited supplies, the pork belly price is now 40 per cent higher than frozen Australian beef loin.
The outbreak of H1N1 briefly caused pork consumption to decline. According to a survey conducted by the Korea Rural Economic Institute, right after reports of H1N1 in Korea, about 43 per cent of consumers replied that they would either reduce their pork consumption or stop eating pork. Consumer opinion improved after the announcement that the new influenza was not swine flu and helped pork prices to recover from their brief skid.
WA has opportunities for pork exports in the Korea market with the following strategies:
• Create a brand of WA pork representing WA as a safe and clean environmental state as over 40 per cent of the local pork brand has been launched and consumers are familiar with the meat brand. For example, Bosung city launched a brand of ‘Bosung Nok Don’ with Bosung Farming Association, which is pork fed with green tea to help eliminate the pork fat smell.
• Promote WA pork products by participating a major food and meat fair to be held in Korea every year and co-working with some Korean major hypermarkets, such as GS Mart and E-Mart to organise a special sales promotion through importers.
• Develop specialised pork for niche market such as non-antibiotic certificated pork. These products can be value-added products especially for high-end consumers, for instance, Korea’s local brand ‘JAYEON-N’ which has been certified as a non-antibiotic pork from SGS Australia, was launched in 2007 and working well so far.
Dairy products Korea imports about 150 000 tonnes of dairy products each year with an import value of around A$400 million. Australian product occupies around 21 per cent of the total import volume. The Economic Union, USA and New Zealand are our competitors and share market portion similarly. In 2008–09, Korea imported Western Australian dairy products including mainly cream, cheese and whey with a value of A$2.4 million, a 248 per cent of increase from the previous year.

Western Australian Agrifood and Fibre Market Outlook — Japan
48
0 2 4 6 8 10 12 14 16 18
Singapore
Hong Kong
Malaysia
South Korea
Saudi Arabia
Philippines
UAE
Taiw an
A$ millionSource: ABS DAFWA Graphic
Figure 23 Major WA dairy export markets 2008–09 (A$M)
The Korean dairy industry is dominated by a small number of dairy companies and cooperatives. The major dairy companies are Seoul Dairy (www.seoulmilk.co.kr), Maeil Dairy (www2.mail.com), Namyang Dairy (http://company.namyangi.com), Bingrae (www.bing.co.kr), Lotte Milk (www.purmil.co.kr) and Vilac (www.vilac.co.kr). These companies control the retail distribution of products such as milk, cream, yogurt, ice cream and cheese. This means that companies wanting to sell these products at retail can generally do so by working with local dairy companies.
Seoul and Mail Dairy occupy over 70 per cent of market share of dairy products and Namyang is major producers of yogurt and infant formula and Bingrae is famous for ice cream manufacturer in Korea, importing most of ingredients from overseas. The small and medium sized cheese shredding companies such as Sunrich, TS Corporation and ChoHeung import the majority of bulk packaged cheese from South America, Europe and Australia, supplying to food service companies including pizzerias, bakeries, hotels and restaurants.
Tariffs on the dairy products are applied based on a quota system which provides low import duty within the quota and higher duty for out of quota. For example, out of quota tariffs on milk powders are 176 per cent (40 per cent within the quota) and tariff on butter other than dairy spreads is 89 per cent. Traders try to change project formulation in an effort to be classified as non-quota product. For other items categorised as cheese, although the tariff is quite high (36 per cent), trade takes place due to strong demand from consumers. Although Korea produces a small quantity of cheese locally, this is insufficient to meet the demand for cheese for processing, pizza, hamburgers and the growing food service trade.
The Free Trade Agreement (FTA) negotiations between Australia and Korea was launched last year. The agreement would bring a strong competitive advantage in this very price sensitive market with more than A$300 million each year. However currently we are threatened by advanced stage for FTA negotiations among Korea, EU and USA. If the KORUS or EU Agreement comes into force, our competitive position in this market will be lost. Therefore, we need to conclude this negotiation as soon as possible.

Western Australian Agrifood and Fibre Market Outlook — Japan
49
Recent good news by the EU to end dairy export subsidies to their exporters will lead to an increased Korean market share for Australian dairy products. WA’s low cost, pasture based dairy industry is expected to remain a competitive option for the worldwide supply of dairy products including Korea.
Also a movement of changing for securing food and food resources by direct or indirect investment opportunity development by Korean Government and major dairy companies is being recognised and this would be a good opportunity for the WA dairy industry to create and expand business area.
Cheese Korea is one of the world’s most valuable and fastest growing dairy markets. Cheese sales in Korea are expected to continue to record strong growth. With the continuing popular trend for health and wellbeing and Western-style food and dining, the demand for cheese will increase.
Australia’s export of cheese to Korea is recovering and Australia is the third largest exporter of cheese to South Korea after New Zealand and the USA, taking about 15 per cent of market share. The value of Western Australian cheese exported to the South Korean market was nil in 2007–08 due to shortage of supply and A$0.07m during 2008–09.
Processed cheese dominates most of cheese sales in Korea with over 95 per cent of market share. However, unprocessed cheese is becoming popular and sales of unprocessed cheese recorded faster growth than processed cheese.
Mozzarella cheese accounts for the major soft cheese sales in Korea. Demand for other gourmet cheeses such as Brie, Camembert and fruit cream cheese is growing as consumer demand is diversified; the wine market is also developing. Premium soft cheese products are increasingly imported and delivering higher unit prices.
Horticulture
Fruit and vegetables Korea is mostly self-sufficient in fresh vegetables and fruits including most of the fruit exported by WA, such as apples, pears, strawberries and melons. These products are relatively profitable compared to other parts of Korea’s agriculture. The fruit and vegetable share of total agricultural production value is almost one-third.
Fruit The volume of fruit imports is increasing by about 5 per cent each year reaching A$562 million of fresh fruit in 2008. The major items are bananas, pineapples, kiwi fruit, grapes, lemons, oranges, cherries and mangoes. Korea imports bananas mostly from the Philippines and Columbia; recently a small amount of bananas were imported from Queensland with a Dole Food brand. However, most of Australia’s fruit imports have been prohibited because of phytosanitary conditions.
Mangoes are imported mainly from Taiwan, Thailand and the Philippines. The market protocol for the export of Australian mangoes to Korea was established in 2007 but no fresh mangoes have been imported into Korea since 2007 due to the cost involved in having a Korean inspector in Australia relative to the export volume to Korea. Therefore, it will take some time to establish the Australian mango in the Korean market.

Western Australian Agrifood and Fibre Market Outlook — Japan
50
Progress on market access for the Tasmanian cherry has been made and is expected to be completed within one year. The table grape is the next item for which market access will be sought.
There are business opportunities in fruit export of food ingredients produced by freezing, freeze-dry or concentrated solutions. Fruit seedlings are yet another opportunity for market access.
Vegetables From 13 November 2006, South Korean officials banned the entry of carrot exports from mainland Australia. This followed a South Korean application to the World Trade Organisation (WTO) earlier that year to add several plant species, including carrots, to the list of prohibited plants from countries where the banana-burrowing nematode (Radopholus similis) is found. South Korea has accepted Tasmania as being free from R. similis and therefore the import of Tasmanian carrots is currently permitted.
China is the main supplier of fresh vegetables for South Korea, including the major WA exports of carrot, cauliflower and cabbage, as well as onion, garlic and ginger. Korea also imports limited volumes of vegetables such as broccoli and asparagus mainly from China, Thailand, and the Philippines. However, Korea produces an abundance of vegetables and as a growing result of consumer concern for wellbeing and healthy food, some vegetable import volumes from China are slightly decreasing.
Potatoes and seed potatoes
Australia exported fresh and chilled potatoes to a South Korean port worth A$4.7m in 2007. However, this sharply decreased to A$2.3m in 2008 and A$2.0m from January to October in 2009 with a 9.4 per cent of decline at the same period last year because of Australia’s reduced supply due to drought.
The USA is the largest potato exporter to Korea (over 60–70 per cent since 2007) followed by Australia. Australian potatoes, mostly the Atlantic variety from New South Wales and South Australia, are mainly used to manufacture crisps. South Korea’s top three snack companies—Orion (www.orionworld.com), Nongshim (www.nongshim.com) and Haitai (www.ht.co.kr)—are importing potatoes directly from Australia without using importers as middlemen. There are indicators to show that the volume of trade is likely to increase.
The South Korea National Plant Quarantine Service (KNPQS) has prohibited the import of fresh and seed potatoes from Western Australia. Western Australia and Victoria have yet to prove freedom from white potato cyst nematode. These quarantine issues will need to be resolved before entry into the market and before Western Australian potato exporters can be confident about approaching major snack companies to market fresh potatoes.
Fisheries According to Korea Food Distribution Yearbook 2009, Korea’s total self-sufficiency for marine seafood continued to decrease from 112 per cent in 2004 to 70 per cent in 2008 (2.6 million tonnes of total import volume). Seafood consumption per capita increased to around 60 kg in 2008 from 48.1 kg in 2005. These figures reflect the recent market trend in food consumption, moving toward to wellbeing and a healthy life. Most Korean consumers regard seafood as a healthy and safe food compared to meats due to diseases, such as BSE, bird flu and foot-and-mouth, carried by cattle and livestock.

Western Australian Agrifood and Fibre Market Outlook — Japan
51
Major import countries to Korea are China with A$1.2 billion in 2007–08 (38 per cent of total import values), followed by Russia (A$0.4 billion), Japan (A$0.3 billion), Vietnam (A$0.3 billion), USA (A$0.16 billion), and Australia (only A$1.8 million), under 0.05 per cent of market share.
Alaska pollack, shrimp and croakers are the major species of the marine products. WA supplies a small amount of pearl shell, crayfish, crustaceans (lobsters, crab), oysters and flat fish. In 2008–09, the total value of pearl shell exported to Korea grew to A$431 819 from nil in 2007.
Table 12 Major species of fish imported by Korea from the world
Species Value (2007) U$1000 Value (2006) Value (2005)
Alaska pollack 363.8 289.2 277.6 Shrimp 246.7 219.1 167.4 Croaker 164.6 147.8 142.7 Common octopus 125.5 81.9 67.0 Hairtail 109.7 102.8 100.3 Tuna 93.6 60.4 48.3 Cuttlefish 86.2 58.9 64.1 Blue crab 82.2 82.3 67.7 Angler 77.4 72.0 60.1 Salmon 71.5 56.8 36.0 Spawn 70.2 79.4 53.7 Sea bream 58.4 57.9 41.6 Mackerel 56.6 42.3 25.8 Crab 49.0 49.6 35.5
Source: Korea Food Distribution Year book 2009
Most live lobsters are imported from Canada and the USA due to very competitive pricing (almost double the price gap) and consumer preference for claw lobsters. Frozen lobsters are imported mainly from Canada, the USA and Oman. A small volume of WA live lobsters was exported to Korea for use in high-end hotel restaurants but are no longer available due to this price gap and a limited supply season.
Market opportunities for Western Australian marine seafood products:
• Participating in a seafood exhibition to be held in Korea would be efficient and cost effective for exporters. Busan International Seafood and Fishery Expo 2010 will be held in Busan on 11–13 November 2010
• Developing in a different way. Targeting the niche market with frozen sashimi lobsters (all-year-round supply) and tropical lobster tails (cheaper than western and southern lobsters)
• Yabbies, marron and scampi (high-end hotels during Korean holiday seasons), frozen half-shell scallop
• Live oyster, frozen snapper, live/frozen short fin eel, and chilled and frozen southern bluefin tuna.

Western Australian Agrifood and Fibre Market Outlook — Japan
52
Wine Korea’s wine import from all countries for the last 10 months (from January to October 2009) declined 35.1 per cent compared to the same period in 2008. After reaching the highest record ever of A$183.1 million, the world economic recession and unstable Korean currency market fluctuation led to this decline.
France reports that its wine import countryside declined by 47.3 per cent and 3 million in value, followed by USA with 35.2 per cent, and Australia with 33.6 per cent (A$7.15 million of value). Chilean and Italian wine also declined 18.1 and 30.1 per cent with A$22.3 and A$16.06 million in value this year. However, WA wine exports to Korea have doubled from 2007–08 and reached about A$452 000 in 2008–09.
5,000
6,000
7,000
8,000
9,000
10,000
11,000
12,000
13,000
14,000
15,000
2004-05 2005-06 2006-07 2007-08 2008-09
Aust
ralia
(A$'
000)
150
200
250
300
350
400
450
500
WA
(A$'
000)
Australia Western Australia
Figure 24 Australian and Western Australian wine exports to South Korea 2004–05 to 2008–09 Source: ABS and DAFWA estimates 2009
Under the current market circumstance caused by the world economic recession, most wine importers and retailers remain conservative and rely heavily on stock sales promotion. However, industry representatives expect the market to recover next year as many positive economic figures have been recorded by the government.
Korea is still one of the biggest potential markets for alcoholic beverage consumption. Recently the Korean consumer trend is shifting toward healthy and wellbeing food and beverages. This makes wine a more competitive alcohol compared to current local spirits, such as soju, whisky and beer.
However, another competitor, renown Korean traditional rice wine Makgulli which has been regarded as a cheap and healthy drinks, has strongly appealed to the market with a better taste. The product quality improved last year and the company expects continued growth in 2010. WA wine exporters should consider this new Korean market trend before approaching the market.
Other opportunities for Western Australian wines in the Korean market include the following:
• While hotels are a good market entry point for new premium wines, there are also good marketing opportunities in hypermarkets, wine bars, specialty wine stores, department stores, convenient stores and online shopping malls.

Western Australian Agrifood and Fibre Market Outlook — Japan
53
• European wines dominated the market for many years. However, more people have recognised wines from new wine countries including Australia, USA and Chile since 2000 and are accepting of Australian wines as well. Promoting WA wine through online community groups who love Australian wine is an effective way to launch WA wine brands.
• Spirits such as soju, whisky and beer had historically dominated liquor sales but women and the younger generation are leading the shift from hard liquors to wine and soft alcohol beverages.
• Wine consumption in Korea is still in its early stage. It accounts for less than 2 per cent of total alcoholic beverage sales, which means drinking wine is not a mainstream position in Korea. Proactive market development can help achieve a better position in the market.
• Continued investment in exhibiting at major wine trade shows will assist Western Australian wine exporters to understand the local market. Trade show visits also provide adequate time to build relationships with potential importers. There are a number of wine related trade shows in Seoul, such as Food and Hotel South Korea in May 2010 (www.seoulfood.or.kr) and the Seoul International Wine and Spirits Show in May 2010 (www.swsexpo.com).
• Organised one-on-one visits and meetings with potential importers provide the more direct route to building reliable relationships with importers. Networking and human relationships are crucial factors to a successful business in South Korea.
• Winery programs connected with the tourism and education sectors of Western Australia wine promotion are worthwhile. Tourism Australia and Tourism Western Australia are interested in promoting wine tour programs with local travel agencies for wine lovers and tourists.
• There is a niche market open to the development of different kinds of wines such as organic, ice and more fruity wines for targets outside regular wine drinkers.
However, market challenges still exist:
• Korea has complex labelling and tax requirements for imported wine, and consumer prices for wine are in general higher than other alcoholic beverages except whisky. Australia wine is expected to lose more competitiveness in price when Korea’s FTA negotiation is concluded with EU and USA in 2010. Since Chilean wine signed an FTA with Korea in 2004, they had this tariff advantage over USA since then.
• Wine is enjoyed by a small portion of the population. Consumers and traders in general have little knowledge and experience about wine. WA wine exporters typically have limited knowledge of the Korean market. There is a lack of marketing and promotion by the suppliers due to relatively small market size compared to the USA, EU and Japan.
• Except for a few big brands, Australian wine sold in the Korean market is regarded as expensive. Most Australian wines retail in the US$40–70 price bracket, which is more expensive than Chilean wines.
• Compared to South Australia, Western Australia wines have no regional brand power in the Korean market. The Korean industry is heavily influenced by Robert Parker and Wine Spectator ratings. It is hard to get into the Korean market without having outstanding international reviews and ratings. Western Australian wines need to earn international recognition through the wine magazine or other avenues in order to develop a selling message to the Korean wine industry.

Western Australian Agrifood and Fibre Market Outlook — Japan
54
An example of the Korean tariff and tax system, based on a A$10 CIF bottle of wine: A. CIF value: A$10.00 B. Tariff (Customs duty): A x 15% = $1.50 C. Wine tax: (AxB) x 30% = $3.45 D. Education Tax: C x 10% = $0.35 E. Subtotal: A+B+C+D = $15.30 F. Value Added Tax: E x 10% = $1.53 G. Fees for Customs Clearance, etx: A x 8% = $0.80 H. Customs cleared cost of wine: E+F+G = A$17.63
Organic and ‘wellbeing’ products Organic products being developed mainly in Korea include food, health food, pet food, personal care products such as cosmetics, in-house cleaning products and flowers. Food is the No. 1 item occupying the market share and the best product representing organic market. Total market for imported organic food was A$54 million in 2008, an increase of about 20 per cent compared to the previous year.
Most market experts are expecting the total organic market to grow on average by 15 per cent every year and to continue to grow into the mid-term to long term. This is based on recent market trends, for example, major food companies have committed to develop the market by launching their own brands and items have been diversified from food to non-food products since 2002. Consumer consumption patterns are changing. In the past, most organic products were purchased for infants, children and people with diseases. It now seems these patterns are broadening to include the whole family as more people make healthy eating a priority consideration.
According to Food Journal Korea, the total number of organic retail outlets in 2008 is 1200; specialty shops account for 41.8 per cent, discount stores 24.9 per cent, shopping centres 11.5 per cent, department stores 6.2 per cent and others with 15.6 per cent.
The major organic food producers in Korea include:
OLGA (www.olga.co.kr)
• This is a group of major Korean eco-friendly and organic product stores operated by Natural Whole Food (NWF), subsidiary of PULMUONE one of the major food manufacturer in Korea.
• OLGA stores supply over 3000 organic and conventional products to hypermarkets, supermarket, department stores and internet shopping mall OLGA also runs eight stand-alone shops independently.
• OLGA sources around 180 organic products from overseas directly and over 600 organic products are either locally produced or purchased through distributors. Half of the store is set up for fresh products, 40 per cent for processed foods including frozen foods, and 10 per cent for industrial products, such as cleaning or personal care products.
E-FARM (www.efarm.co.kr)
• E-FARM was established by one of Korea’s major fishery-focused food manufacturer, Dongwon Food. They supply their products mainly to hypermarket, department stores and online shopping malls.

Western Australian Agrifood and Fibre Market Outlook — Japan
55
• They carry over 600 organic and healthy food products focused on baby meals and beverages. They also source over 100 organic agri-products such as potato, pumpkin, tofu and fruit directly from overseas.
VEGEFOOD (www.vegefood.co.kr)
• Established in 1998 as a leading company specialising in vegetable diet products in Korea, this company distributes their healthy, eco-friendly and organic products to vegetarians and consumers through their 150 franchising stores, vegetarian restaurants, feeding facilities and online shopping mall.
LOVING HUT (www.lovinghut.co.kr)
• Developed over 60 food items and menus for vegetarians only, LOVING HUT supplies the menu and products to their 19 franchise restaurants and online shopping mall. Major products supplied are soybean meat, grain, processed food, pet food, jam and vegetable oil.
Western Australia’s clean, green image provides an opportunity for Western Australian exporters to exploit the South Korean organic market, especially with non-GMO grains, seeds, wine, dairy products, processed foods and children’s food. Suppliers who can verify that their products come from a clean, green environment and are produced under strict health and safety standards are well placed to take advantage of this market.
In 2008 an organic noodle company in Victoria successfully launched their products in Korea. They worked with the Korean company Sajo which has good distribution channels and sold the organic noodle under their own label to Korean specifications. This product is now distributed in more than 100 stores by the major supermarket chains (E-mart, Homplus and Hanaro mart).
Korean food manufacturers are also interested in importing organic food ingredients as raw materials in their final organic products. The products sought are organic wheat flour, Australian Sweet lupins, organic fruit and vegetable puree/powder, organic dairy products (cheese and butter) and organic juice concentrate.
Retail products
Retail market overview Structural change in the Korean retail industry had been occurring since the late 1990s during the Asian economic crisis. In general, the economic recession created a momentum for the emergence of the new retail format as consumers become more sensitive to price due to decreasing income. Discount stores and hypermarkets run by big retail groups–the new retail format–have rapidly grown in this environment and now dominate the Korean distribution industry. In contrast to the declining sales by department stores, the growth of discount stores is the strongest trend in Korean retailing since 2000.
Table 13 shows total volume of retail sales and change of market share between department stores, hypermarkets, traditional markets and others over the last three years. It clarifies the main retail types driving the Korean retail market.

Western Australian Agrifood and Fibre Market Outlook — Japan
56
Table 13 Retail market sales in Korea
2007 (A$ billion)
2008 (E) (A$ billion)
2009 (F) (A$ billion) Retail type
Sales Growth Sales Growth Sales Growth Department stores 18.9 3.2 19.9 4.9 20.3 2.0 Hypermarkets 28.2 9.8 29.8 5.6 30.7 3.1 Supermarkets 11.8 4.7 12.5 6.2 13.2 50.0 Convenience stores 4.6 11.0 5.4 15.3 6.0 11.6 Internet shopping malls 15.8 17.1 18.4 16.9 30.8 13.1 TV home shopping 3.5 -3.8 3.6 3.2 3.6 1.3 Traditional markets 79.7 3.1 80.5 0.9 78.7 -2.2 Total 161.6 5.6 170.0 4.6 173.3 1.9
Source: Food Distribution Yearbook 2009
With the advent and sales growth of new retail businesses, such as home shopping, internet shopping malls and super-supermarkets (SSM), competition is also increasing. This shifts bargaining power from suppliers to consumers; price and brand competitiveness became more important than the product. Managing the consumer relationship has become even more critical to distribution companies.
The total sales of hypermarkets in 2009 (F) accounts for 17.3 per cent of total retail market sales with A$30.7 billion. The major brands are E-mart (www.emart.co.kr), Home Plus (www.homeplus.co.kr), Lotte Mart (www.lottemart.co.kr), and New Core Outlet and GS Mart (www.gsretail.com).
Emart is the No. 1 hypermarket in Korea, owned by Shinsegae Group with 120 branch stores and over A$10.8 billion of annual turnover in 2008. Home Plus took over Carrefour Korea in 2007 and is expanding its market share with 111 branch stores and A$7.8 billion turnover. Lotte Mart is owned by Korea No. 1 food company, Lotte Group, is running 63 branch stores with A$4.6 billion of annual turnover in 2008.
Cheese, meats, fruit juice, canola oil, honey and some health foods are the main items major hypermarkets are importing directly or indirectly from Australia. To cut the product price, direct import volume of product is being increased. This competition creates new business opportunities for hypermarkets to invest their money overseas by purchasing cattle, dairy or grain farms and manufacturing facilities, and by equity sharing with overseas food producers to keep prices down and secure the supply of their own brand of agri-products from overseas.
Table 14 Sales by hypermarkets and discount stores in 2008
Number of stores Hypermarkets Sales (A$M)
Local Overseas E-Mart 10.85 120 18 Home Plus 7.80 111 Lotte Mart 4.55 63 28 New Core Outlet 1.54 16 Costco Sale 1.01 6 NH Distribution 0.86 6 GS Mart 0.81 14 Mega Mart 0.63 5
Source: Korea Food Distribution Yearbook 2009

Western Australian Agrifood and Fibre Market Outlook — Japan
57
Pet food Korea’s total pet food import value (retail only) was A$71.6 million in 2008, a 12 per cent increase from the previous year. This commodity has shown around 10–15 per cent growth every year for last four years. However, the affect of the global economy recession is seen in the slight decrease of the pet food market this year with A$60.8 from January to October 2009, a 1.7 per cent decline for the same period.
The USA was the largest pet food exporter to Korea occupying 39 per cent of the market with A$28.2 million in 2008, followed by China with 24.9 per cent, Australia with 11.7 per cent (WA nil), and France 7.2 per cent. According to the Korea Kennel Club (KKC), total pet number in Korea are estimated around 3 million and have increased 10 per cent every year. Over 95 per cent of all pets are dogs, 4 per cent are cats and the last 1 per cent is made up of others such as birds, rabbits, hamsters and reptiles. The pet industry market is growing every year and was estimated around A$2 billion in 2008.
This pet food market in Korea shows great market potential and is being developed and diversified by big food companies and retailers such as CJ Corp (www.cj.net), Costco (www.costco.co.kr), Sungbo Science Tech (www.SBC.co.kr) and Emart (www.emart.co.kr). They are sourcing products from overseas by direct import from such as Hill’s Science Diet, ANF Holistic, Royal Canin and Purina. The pet food market is generally fragmented.
Western Australia’s small and medium size manufacturing companies have business opportunities if their price and quality are competitive as many of the consumers are still relying on small and medium specialised pet shops and veterinary surgeons’ recommendations for purchasing foods. Promoting for the niche markets is an effective approach to develop markets. Retailers normally require a high margin (30–50 per cent) for new products so it is important to set a proper pricing structure when in discussion with importers. Pet foods and pet treats developed for large dogs are not suited for the Korean market.
Opportunities for Australian pet food exports include: ● organic dried pet food ● premium pet treat ● canned pet food (meat).

Western Australian Agrifood and Fibre Market Outlook — Japan
58
Major projects and coming events
7th Seoul International Wines and Spirits Expo 2010 A major South Korean wine and spirit fair to be held from 6 to 8 May 2010 at COEX Seoul with over 320 booths from 20 countries (http://www.swsexpo.com).
Seoul Food and Hotel 2010 Seoul Food and Hotel 2010 will be held in ILSAN from 12 to 15 May 2010. This will be a magnet for established companies in the food industry who have participated in the exhibition for more than 20 years as well as for newly emerging companies who will bring with them the latest innovations in the food industry (http://www.seoulfood.or.kr)
Busan International Seafood and Fishery Expo 2010 This is the largest seafood related show in Korea and will be held in Busan, the second largest city in the country, on 11 to 13 November 2010.
Western Australian Agrifood and Fibre Market Outlook — Japan
59
Further resources • Tariff information can be found at the following website:
www.apectariff.org/tdb.cgi/ff3137/apeccgi.cgi?KR
• Quarantine information can be found at the following website: www.aqis.gov.au/phyto/asp/ex_home.asp

Western Australian Agrifood and Fibre Market Outlook — Japan
60
Contacts DEPARTMENT OF AGRICULTURE AND FOOD, WESTERN AUSTRALIA TRADE AND MARKET SERVICES Mr Simon Johnson A/Assistant Director General 3 Baron-Hay Court SOUTH PERTH WA 6151 AUSTRALIA
Tel: +9368 3634 Fax: +9367 7389 Email: [email protected]
WESTERN AUSTRALIAN INTERNATIONAL TRADE & INVESTMENT OFFICES CHINA Shanghai Regional Director Western Australian Trade and Investment Office Room 2208 CITIC Square 1168 Nanjing Road West SHANGHAI 200041 PEOPLE’S REPUBLIC OF CHINA
Tel: +86 21 5292 5899 Fax: +86 21 5292 5889 Website: www.westernaustralia.cn
Hangzhou Representative Western Australian Trade and Investment Office Room 1705 World Trade Centre Office Plaza Zhejiang World Trade Centre 122 Shuguang Road HANGZHOU 310007 PEOPLE’S REPUBLIC OF CHINA
Tel: +86 571 8795 0296 Fax: +86 571 8795 0295 Website: www.westernaustralia.cn

Western Australian Agrifood and Fibre Market Outlook — Japan
61
INDONESIA Jakarta Regional Director Western Australian Trade Office Wisma Budi, 5th Floor Jl. HR. Rasuna Said, Kav C-6 Kuningan JAKARTA 12940 INDONESIA
Tel: +6221 5290 2860 Fax: +6221 8296 2722
INDIA Mumbai Regional Director Western Australian Trade Office 93, Jolly Maker Chambers No 2 9th Floor, Nariman Point MUMBAI 400 021 INDIA
Tel: +91 22 6630 3973 Fax: +91 22 6630 3977
Chennai Senior Trade Advisor Western Australian Trade Office 1 Doshi Regency 876 Poonamallee High Road, Kilpauk CHENNAI 600 084 INDIA
Tel: +91 44 2640 0407 Fax: +91 44 2643 0064
SOUTH KOREA Seoul Regional Director Government of Western Australia, Trade & Investment Office Unit 702, 7th Floor Kwanghwamoon Building 211 Sejongno, Jongno-gu SEOUL 110-730 KOREA
Tel : +82 2 722 1217 Fax: +82 2 722 1218 Website: www.westernaustralia.or.kr
Western Australian Agrifood and Fibre Market Outlook — Japan
62
MIDDLE EAST Dubai Regional Director Western Australian Trade Office Suite 106, Emarat Atrium Building Sheikh Zayed Road DUBAI, UNITED ARAB EMIRATES
Tel: +971 4 343 3226 Fax: +971 4 343 3238
MALAYSIA Kuala Lumpur Regional Director Western Australian Trade Office 4th Floor, UBN Tower 10 Jalan P Ramlee KUALA LUMPUR 50250 MALAYSIA
Tel: +603 2031 8175 Fax: +603 2031 8177
JAPAN Tokyo Commissioner North Asia Agency Department of the Premier and Cabinet Government of Western Australia 13th Floor, Fukoku Seimei Bldg 2-2-2 Uchisaiwai-cho Chiyoda-ku TOKYO 100-0011 JAPAN
Tel: +81 3 5157 8281 Fax: +81 3 5157 8286 Website: http://wajapan.net
Kobe Regional Director Government of Western Australia Kobe Office 6F Golden Sun Bldg 4 chome 3-6 Nakayamate-dori Chuo-ku Kobe HYOGO 650-0004 Japan
Tel: +81 78 242 7705 Fax: +81 78 242 7707

Western Australian Agrifood and Fibre Market Outlook — Japan
63
EUROPE London Agent General Government of Western Australia 5th Floor, Australia Centre Corner of Strand & Melbourne Place LONDON WC2B 4LG UNITED KINGDOM
Tel: +44 20 7240 2881 Fax: +44 20 7240 6637 Website: www.wago.co.uk
THE AMERICAS Los Angeles Regional Director Western Australian Office of Trade and Investment (USA) PO Box 611 Sunset Beach CALIFORNIA 90742 USA
Tel: 00111 562 592 4342 Fax: 00111 562 684 0795 Website: www.tradewesternaustralia.com

Trade and markeT services
Department of Agriculture and Food Western Australia3 Baron-Hay Court South Perth Western Australia 6151Telephone +61 8 9368 3382Facsimile +61 8 9367 7389www.agric.wa.gov.au
Market Outlook 2010 North Asia.indd 1 24/2/10 4:13:54 PM