Embed Size (px)
Citation preview
2010
ILLINOIS COMMUNITY
RECREATION FACILITIES & PARK TRENDS
INVENTORY
Prepared by
Robin Hall & Yung-Kuei Huang
Office of Recreation and Park Resources
University of Illinois
Prepared for
Illinois Department of Natural Resources
Grants Administration Division & Realty and Planning Division
i
ACKNOWLEDGEMENTS
A special thanks is given to all the park districts, cities, villages and counties that participated in
this study. This would not have been done without their help and support.
Also, thanks to IDNR staff members Dick Westfall and Marla Gursh in the Planning Division.
Also thanks to Tom DiLello, Mick Rosenthal, and Steve Gonzalez (retired) in the Grants
Division.
Thanks to Dr. Ted Flickinger, Peter Murphy and Cindy Deiters at the Illinois Association of
ParkDistricts, and Larry Frang and Rebecca Turner at the Illinois Municipal League.
ii
TABLE OF CONTENTS
I. EXECUTIVE SUMMARY ............................................................................................... 1
A. INTRODUCTION ..................................................................................................... 1
B. PROCESS................................................................................................................... 1
C. RESPONSE ................................................................................................................ 2
D. RESULTS – ANALYSIS OF SELECTED RETURNS ............................................ 2
1. POPULATION ANALYSIS ............................................................................................... 2
2. OPERATING BUDGETS .................................................................................................. 3
3. COMMUNITY OUTDOOR RECREATION LANDS ...................................................... 3
4. COMMUNITY OUTDOOR RECREATION FACILITIES .............................................. 4
II. APPENDIX A: SURVEY RESULTS .......................................................................... 5
III. APPENDIX B: SURVEY INSTRUMENTS ......................................................... 81
A. COVER LETTER .................................................................................................... 82
B. SURVEY .................................................................................................................. 83
1
Illinois Community Recreation Facilities and Park Trends Inventory
A. Introduction
The Office of Recreation and Park Resources (ORPR) at the University of Illinois, under contract with the State of Illinois Department of Natural Resources (IDNR), Division of Planning and Division of Grant Administration, conducted a survey of city park and recreation departments, park districts, and county forest preserve and conservation districts in the State of Illinois. The information collected in the survey is used in several ways.
(1) The information gathered in the survey is used by the Planning Division of IDNR in the development and update of their statewide comprehensive outdoor recreation plan (SCORP). It is also used in other aspects of their planning.
(2) The data is used by the Grant Division in their review processes. Any city, park district or county agency that submits a completed survey and applies for an OSLAD grant receives extra credit in their grant review process.
(3) The information helps the Illinois Department of Natural Resources, the Illinois Association of Park Districts (IAPD), the Illinois Municipal League (IMC), and the Illinois Park and Recreation Association (IPRA) develop a more complete inventory of community park and recreation facilities in Illinois.
(4) The survey results provide some information the IAPD Research Committee has identified as being of value to cities, park districts and practitioners.
(5) The results also help identify topics for further and more detailed study that would be of value for departments, agencies, planners, and administrators.
This year’s survey asked for some information that was not included in the 2008 inventory, i.e. boat and canoe launch ramps and more detailed information concerning trails and paths. IDNR and ORPR are also interested in identifying cities and park districts that provide “natural areas.” For the purpose of this student, “natural areas” are defined as space specifically preserved for the functions of habitat restoration/preservation, species biodiversity, public health and appreciation of native plants and wildlife.” (Barry). The inventory also asked for information about different types of larger facilities a city or agency may provide, i.e. museums, nature/environmental centers, arboretums etc. In addition, cities and park districts were asked about the provision of a fitness center and formal relationships with health or medical agencies.
B. Process
In the spring of 2010 ORPR staff developed a survey instrument in cooperation with IDNR staff. ORPR staff also reviewed the document with staff from the Illinois Association of Park Districts (IAPD) and members of IAPD’s Research Committee. After IDNR staff approved the survey instrument, it was pretested with approximately ten practitioners from departments or agencies of different sizes and delivery types. Staff from these agencies were asked to critique and offer suggestions concerning the survey. IDNR staff gave a final review and approval of the revised inventory form. Then, ORPR started the data collection process. A copy of the survey instrument is included in Appendix B. The Office of Recreation and Park Resources working with IDNR and IAPD identified 482 incorporated areas and/or census designated places in the State that have requested grant assistance from the IDNR. These agencies were used as potential survey participants. All of these agencies were mailed a cover
2
letter explaining the purpose of the survey and a copy of the survey. A copy of the cover letter is included with this report in Appendix B. The letter explained the purpose of the survey and it also explained that an agency could go to the ORPR website and fill out the same survey online. A follow-up mailing was sent to the non-responding agencies approximately three and one-half weeks after the first mailing. If email addresses were available, non-respondents were also contacted by that method. A few weeks later, some non-respondents were called to encourage their participation. The data received by ORPR was coded and entered into Microsoft Office Access.
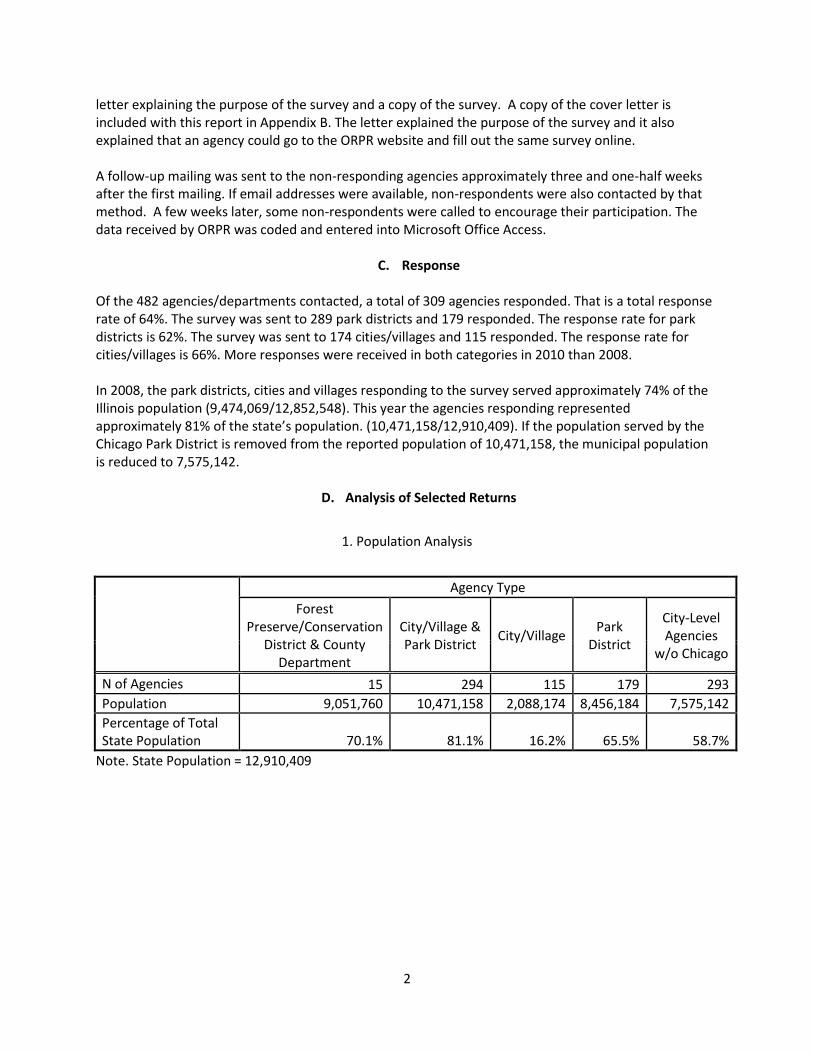
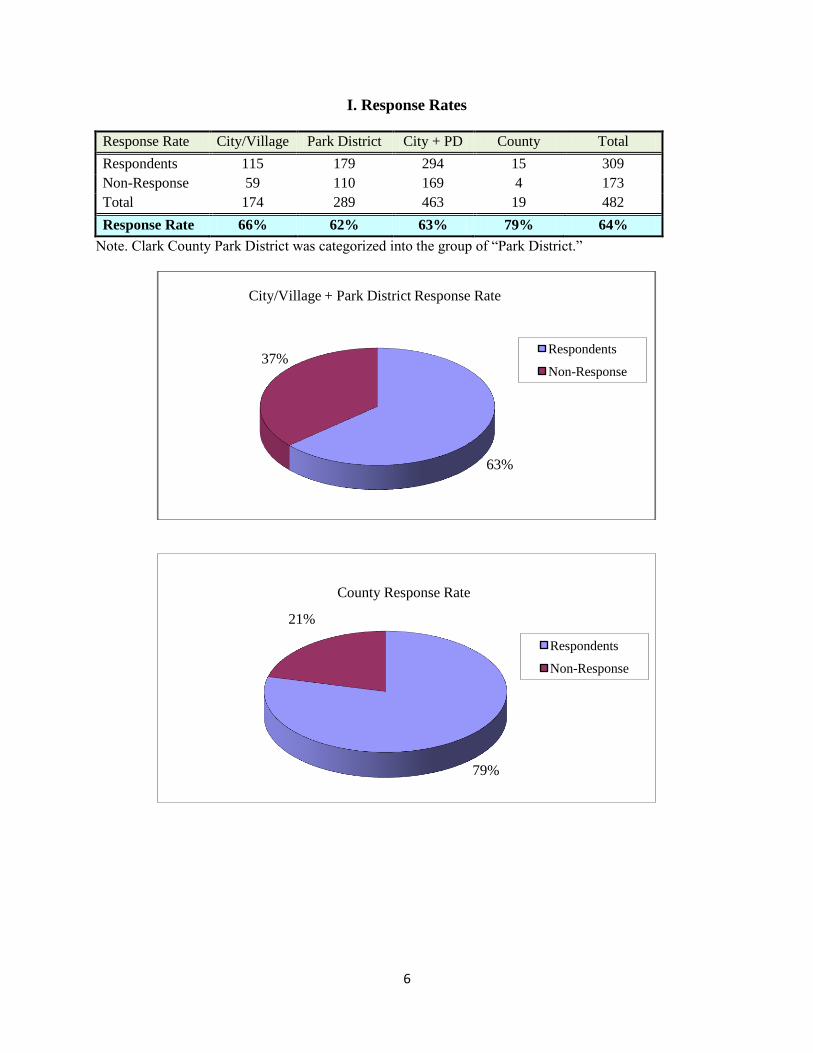
C. Response Of the 482 agencies/departments contacted, a total of 309 agencies responded. That is a total response rate of 64%. The survey was sent to 289 park districts and 179 responded. The response rate for park districts is 62%. The survey was sent to 174 cities/villages and 115 responded. The response rate for cities/villages is 66%. More responses were received in both categories in 2010 than 2008. In 2008, the park districts, cities and villages responding to the survey served approximately 74% of the Illinois population (9,474,069/12,852,548). This year the agencies responding represented approximately 81% of the state’s population. (10,471,158/12,910,409). If the population served by the Chicago Park District is removed from the reported population of 10,471,158, the municipal population is reduced to 7,575,142.
D. Analysis of Selected Returns
1. Population Analysis
Agency Type
Forest Preserve/Conservation
District & County Department
City/Village & Park District
City/Village Park
District
City-Level Agencies
w/o Chicago
N of Agencies 15 294 115 179 293
Population 9,051,760 10,471,158 2,088,174 8,456,184 7,575,142
Percentage of Total State Population 70.1% 81.1% 16.2% 65.5% 58.7%
Note. State Population = 12,910,409
3
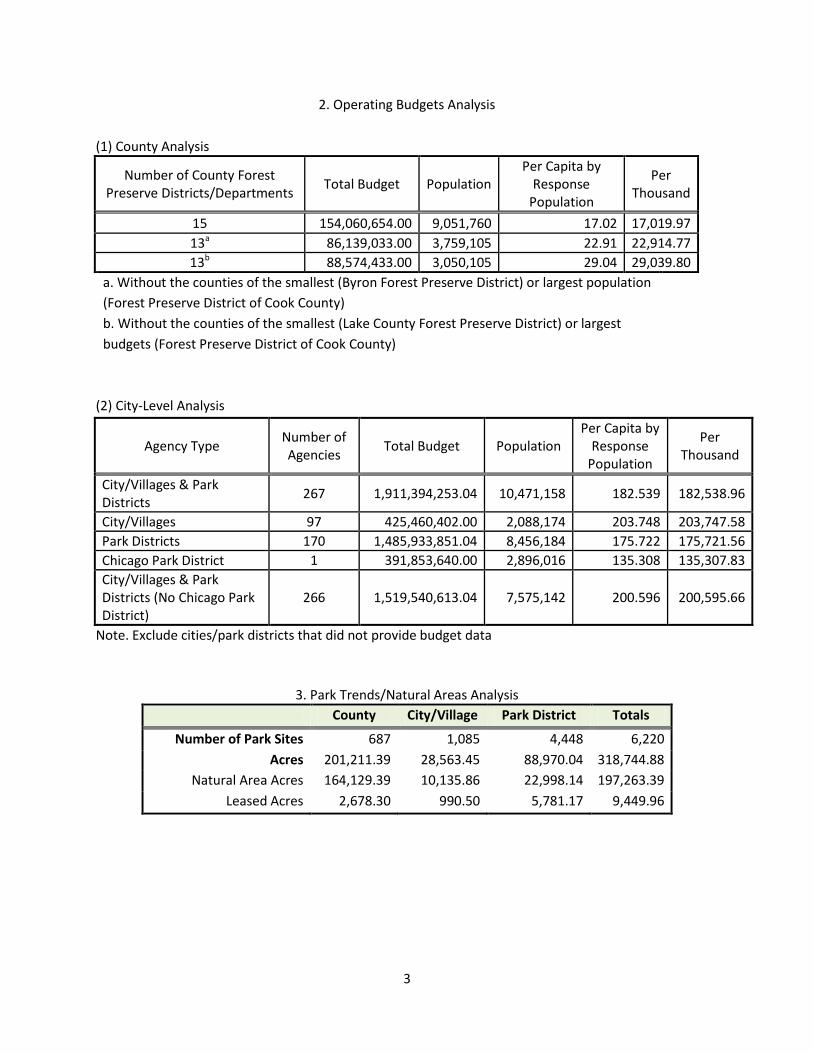
2. Operating Budgets Analysis
(1) County Analysis
Number of County Forest Preserve Districts/Departments
Total Budget Population Per Capita by
Response Population
Per Thousand
15 154,060,654.00 9,051,760 17.02 17,019.97
13a 86,139,033.00 3,759,105 22.91 22,914.77
13b 88,574,433.00 3,050,105 29.04 29,039.80
a. Without the counties of the smallest (Byron Forest Preserve District) or largest population
(Forest Preserve District of Cook County)
b. Without the counties of the smallest (Lake County Forest Preserve District) or largest
budgets (Forest Preserve District of Cook County)
(2) City-Level Analysis
Agency Type Number of Agencies
Total Budget Population Per Capita by
Response Population
Per Thousand
City/Villages & Park Districts
267 1,911,394,253.04 10,471,158 182.539 182,538.96
City/Villages 97 425,460,402.00 2,088,174 203.748 203,747.58
Park Districts 170 1,485,933,851.04 8,456,184 175.722 175,721.56
Chicago Park District 1 391,853,640.00 2,896,016 135.308 135,307.83
City/Villages & Park Districts (No Chicago Park District)
266 1,519,540,613.04 7,575,142 200.596 200,595.66
Note. Exclude cities/park districts that did not provide budget data
3. Park Trends/Natural Areas Analysis
County City/Village Park District Totals
Number of Park Sites 687 1,085 4,448 6,220
Acres 201,211.39 28,563.45 88,970.04 318,744.88
Natural Area Acres 164,129.39 10,135.86 22,998.14 197,263.39
Leased Acres 2,678.30 990.50 5,781.17 9,449.96
4
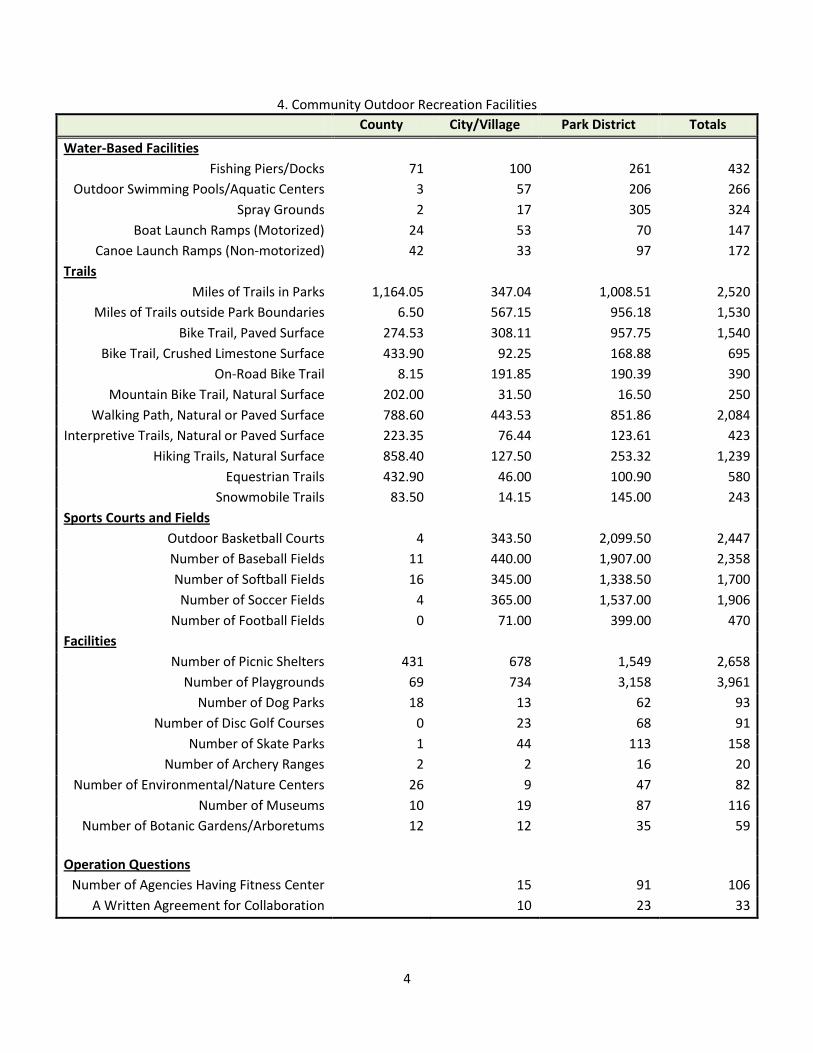
4. Community Outdoor Recreation Facilities
County City/Village Park District Totals
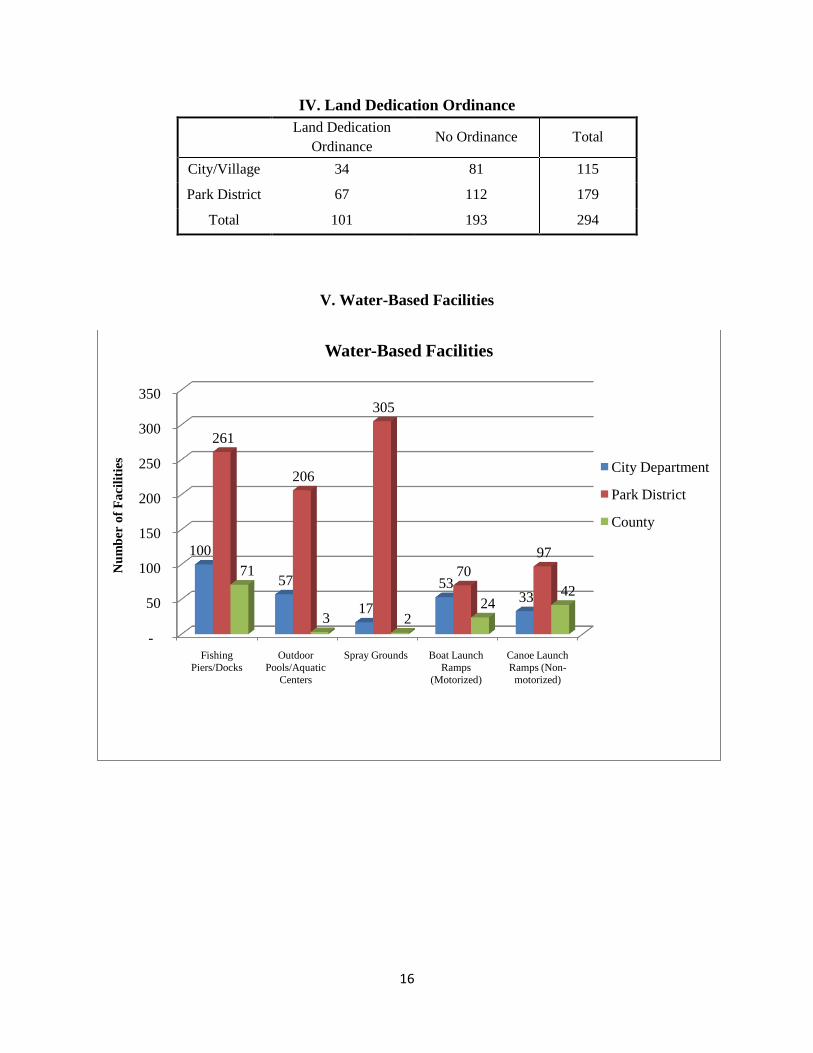
Water-Based Facilities
Fishing Piers/Docks 71 100 261 432
Outdoor Swimming Pools/Aquatic Centers 3 57 206 266
Spray Grounds 2 17 305 324
Boat Launch Ramps (Motorized) 24 53 70 147
Canoe Launch Ramps (Non-motorized) 42 33 97 172
Trails
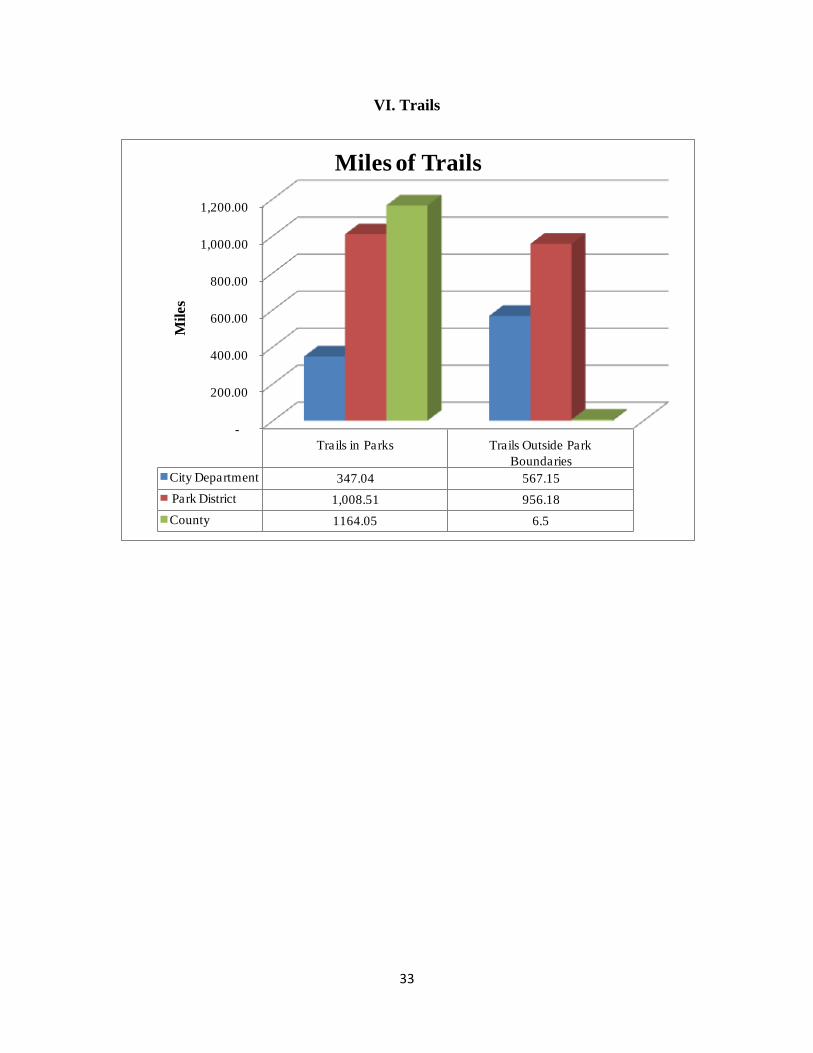
Miles of Trails in Parks 1,164.05 347.04 1,008.51 2,520
Miles of Trails outside Park Boundaries 6.50 567.15 956.18 1,530
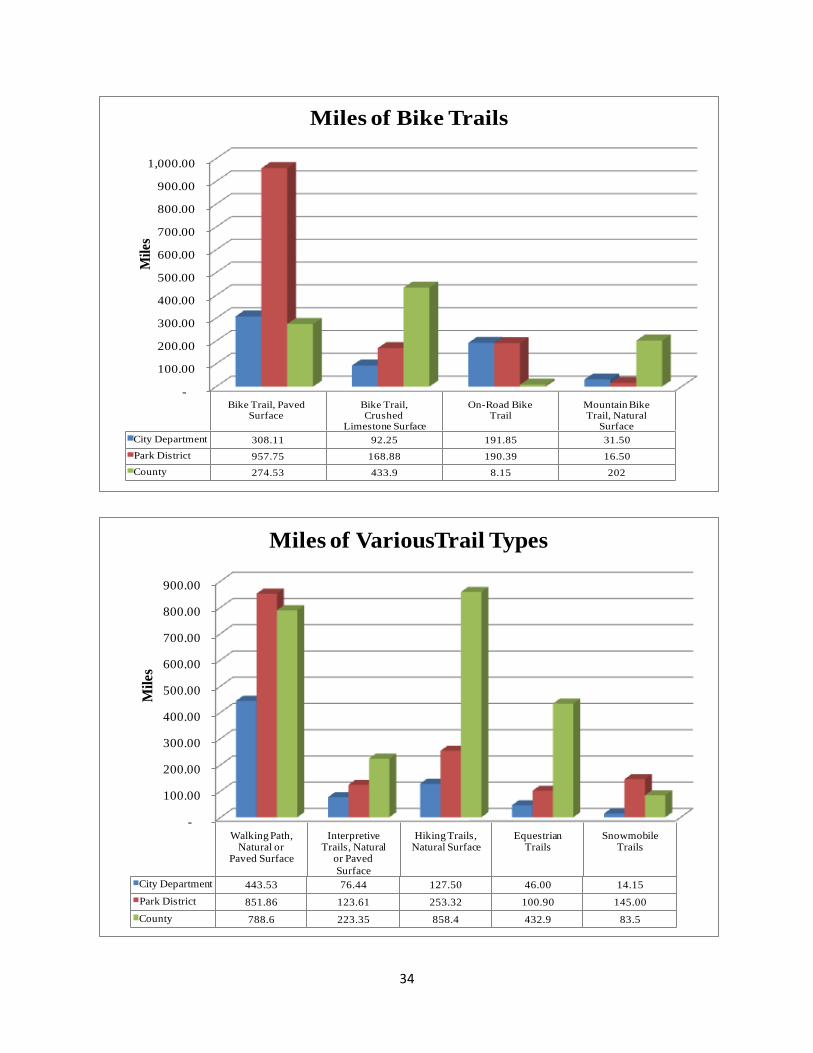
Bike Trail, Paved Surface 274.53 308.11 957.75 1,540
Bike Trail, Crushed Limestone Surface 433.90 92.25 168.88 695
On-Road Bike Trail 8.15 191.85 190.39 390
Mountain Bike Trail, Natural Surface 202.00 31.50 16.50 250
Walking Path, Natural or Paved Surface 788.60 443.53 851.86 2,084
Interpretive Trails, Natural or Paved Surface 223.35 76.44 123.61 423
Hiking Trails, Natural Surface 858.40 127.50 253.32 1,239
Equestrian Trails 432.90 46.00 100.90 580
Snowmobile Trails 83.50 14.15 145.00 243
Sports Courts and Fields
Outdoor Basketball Courts 4 343.50 2,099.50 2,447
Number of Baseball Fields 11 440.00 1,907.00 2,358
Number of Softball Fields 16 345.00 1,338.50 1,700
Number of Soccer Fields 4 365.00 1,537.00 1,906
Number of Football Fields 0 71.00 399.00 470
Facilities
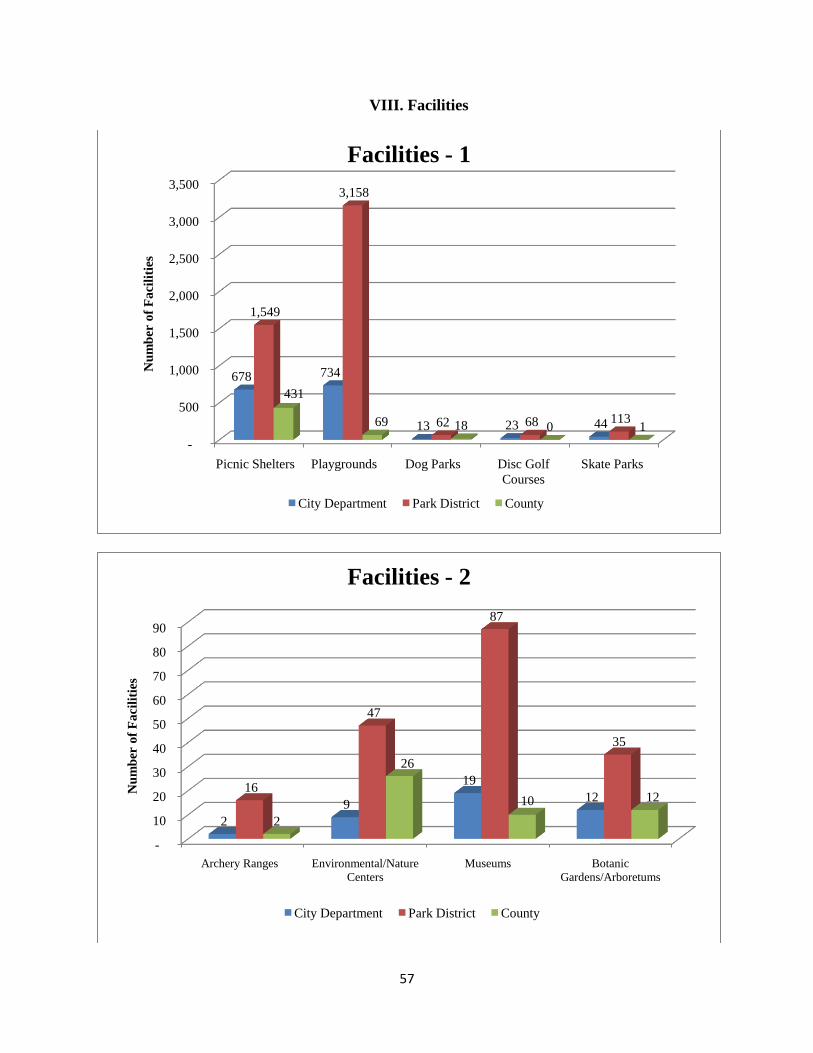
Number of Picnic Shelters 431 678 1,549 2,658
Number of Playgrounds 69 734 3,158 3,961
Number of Dog Parks 18 13 62 93
Number of Disc Golf Courses 0 23 68 91
Number of Skate Parks 1 44 113 158
Number of Archery Ranges 2 2 16 20
Number of Environmental/Nature Centers 26 9 47 82
Number of Museums 10 19 87 116
Number of Botanic Gardens/Arboretums 12 12 35 59
Operation Questions
Number of Agencies Having Fitness Center
15 91 106
A Written Agreement for Collaboration
10 23 33

5
Appendix A: Survey Results
6
I. Response Rates
Response Rate City/Village Park District City + PD County Total
Respondents 115 179 294 15 309
Non-Response 59 110 169 4 173
Total 174 289 463 19 482
Response Rate 66% 62% 63% 79% 64%
Note. Clark County Park District was categorized into the group of “Park District.”
63%
37%
City/Village + Park District Response Rate
Respondents
Non-Response
79%
21%
County Response Rate
Respondents
Non-Response
7
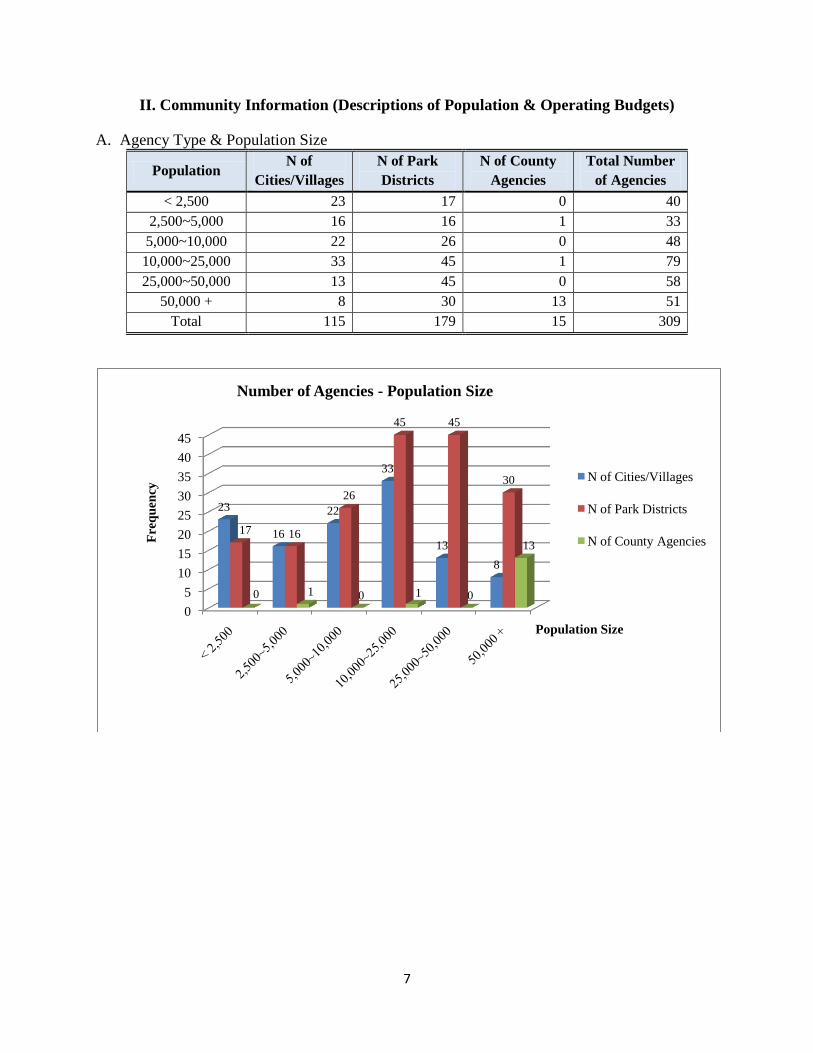
II. Community Information (Descriptions of Population & Operating Budgets)
A. Agency Type & Population Size
Population N of
Cities/Villages
N of Park
Districts
N of County
Agencies
Total Number
of Agencies
< 2,500 23 17 0 40
2,500~5,000 16 16 1 33
5,000~10,000 22 26 0 48
10,000~25,000 33 45 1 79
25,000~50,000 13 45 0 58
50,000 + 8 30 13 51
Total 115 179 15 309
0
5
10
15
20
25
30
35
40
45
23
16
22
33
13
8
17 16
26
45 45
30
0 1 0 1 0
13
Fre
qu
ency
Population Size
Number of Agencies - Population Size
N of Cities/Villages
N of Park Districts
N of County Agencies
8
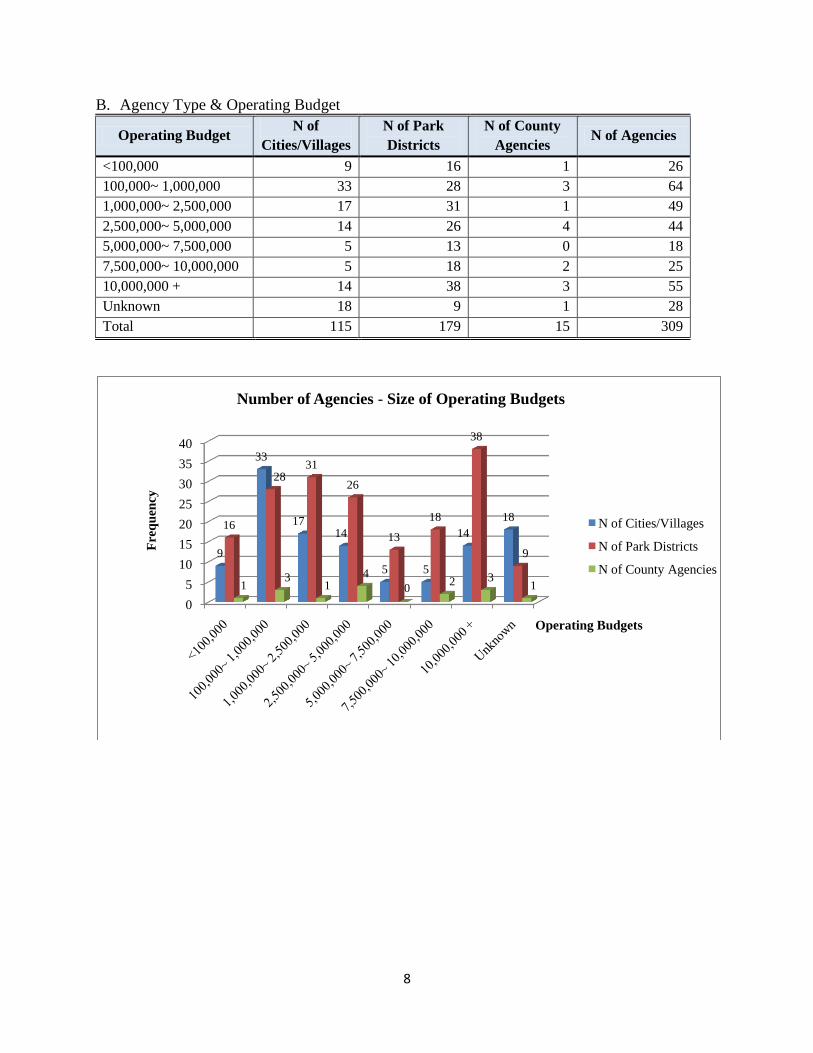
B. Agency Type & Operating Budget
Operating Budget N of
Cities/Villages
N of Park
Districts
N of County
Agencies N of Agencies
<100,000 9 16 1 26
100,000~ 1,000,000 33 28 3 64
1,000,000~ 2,500,000 17 31 1 49
2,500,000~ 5,000,000 14 26 4 44
5,000,000~ 7,500,000 5 13 0 18
7,500,000~ 10,000,000 5 18 2 25
10,000,000 + 14 38 3 55
Unknown 18 9 1 28
Total 115 179 15 309
0
5
10
15
20
25
30
35
40
9
33
1714
5 5
14
1816
2831
26
13
18
38
9
13
14
02 3
1
Fre
qu
ency
Operating Budgets
Number of Agencies - Size of Operating Budgets
N of Cities/Villages
N of Park Districts
N of County Agencies
9
III. Parks Information
A. Park Sites
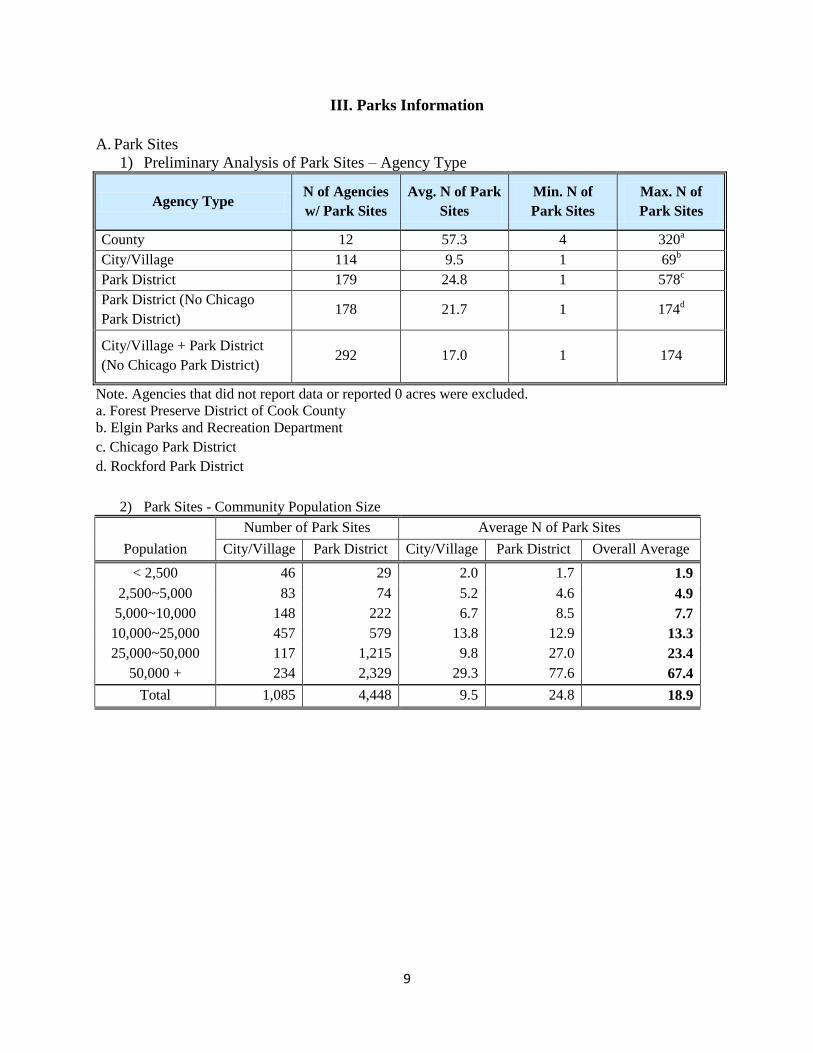
1) Preliminary Analysis of Park Sites – Agency Type
Agency Type N of Agencies
w/ Park Sites
Avg. N of Park
Sites
Min. N of
Park Sites
Max. N of
Park Sites
County 12 57.3 4 320a
City/Village 114 9.5 1 69b
Park District 179 24.8 1 578c
Park District (No Chicago
Park District) 178 21.7 1 174
d
City/Village + Park District
(No Chicago Park District) 292 17.0 1 174
Note. Agencies that did not report data or reported 0 acres were excluded.
a. Forest Preserve District of Cook County
b. Elgin Parks and Recreation Department
c. Chicago Park District
d. Rockford Park District
2) Park Sites - Community Population Size
Number of Park Sites Average N of Park Sites
Population City/Village Park District City/Village Park District Overall Average
< 2,500 46 29 2.0 1.7 1.9
2,500~5,000 83 74 5.2 4.6 4.9
5,000~10,000 148 222 6.7 8.5 7.7
10,000~25,000 457 579 13.8 12.9 13.3
25,000~50,000 117 1,215 9.8 27.0 23.4
50,000 + 234 2,329 29.3 77.6 67.4
Total 1,085 4,448 9.5 24.8 18.9
10
3) Park Sites – Operating Budgets
Number of Park Sites Average N of Park Sites
Operating Budget City/Village Park District City/Village Park District Overall Average
<100,000 16 33 1.8 2.1 2.0
100,000~ 1,000,000 232 170 7.0 6.1 6.6
1,000,000~ 2,500,000 187 382 11.0 12.3 11.9
2,500,000~ 5,000,000 204 368 14.6 14.2 14.3
5,000,000~ 7,500,000 58 246 11.6 18.9 16.9
7,500,000~ 10,000,000 56 547 11.2 30.4 26.2
10,000,000 + 235 2,603 18.1 68.5 55.6
Unknown 97 99 5.4 11.0 7.3
Total 1,085 4,448 9.5 24.8 18.9
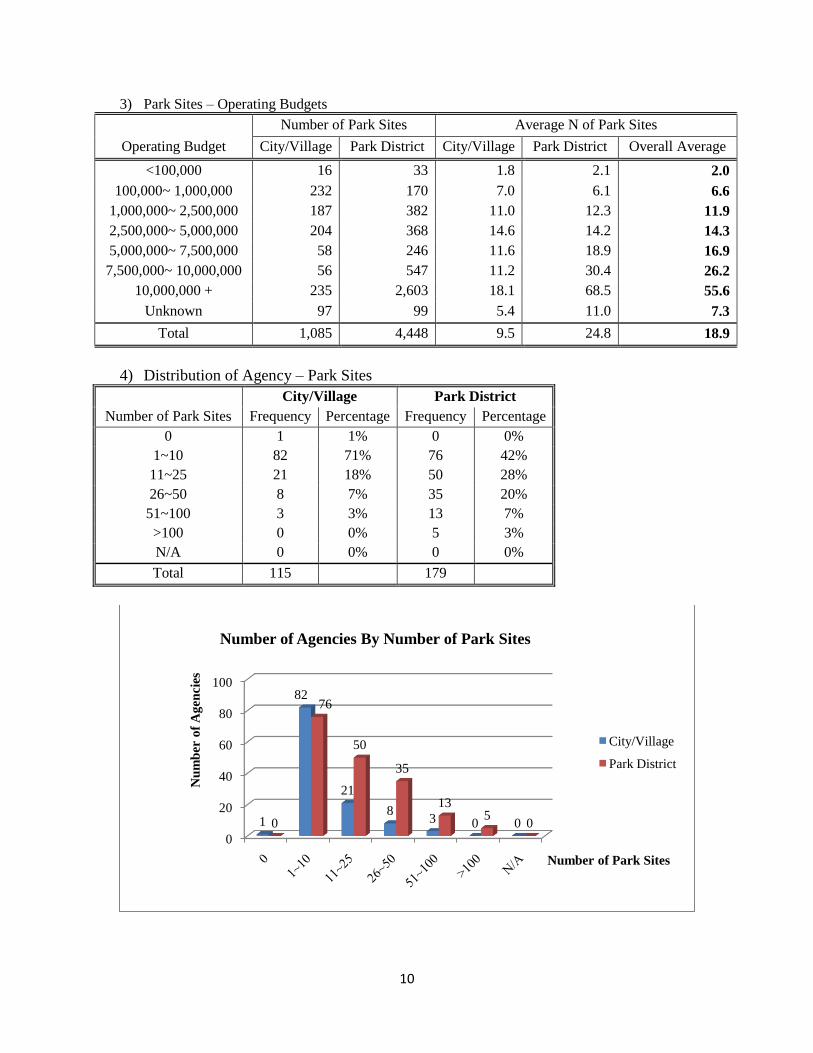
4) Distribution of Agency – Park Sites
City/Village Park District
Number of Park Sites Frequency Percentage Frequency Percentage
0 1 1% 0 0%
1~10 82 71% 76 42%
11~25 21 18% 50 28%
26~50 8 7% 35 20%
51~100 3 3% 13 7%
>100 0 0% 5 3%
N/A 0 0% 0 0%
Total 115 179
0
20
40
60
80
100
1
82
21
83 0 00
76
50
35
135
0
Nu
mb
er o
f A
gen
cies
Number of Park Sites
Number of Agencies By Number of Park Sites
City/Village
Park District
11
B. Land Acres
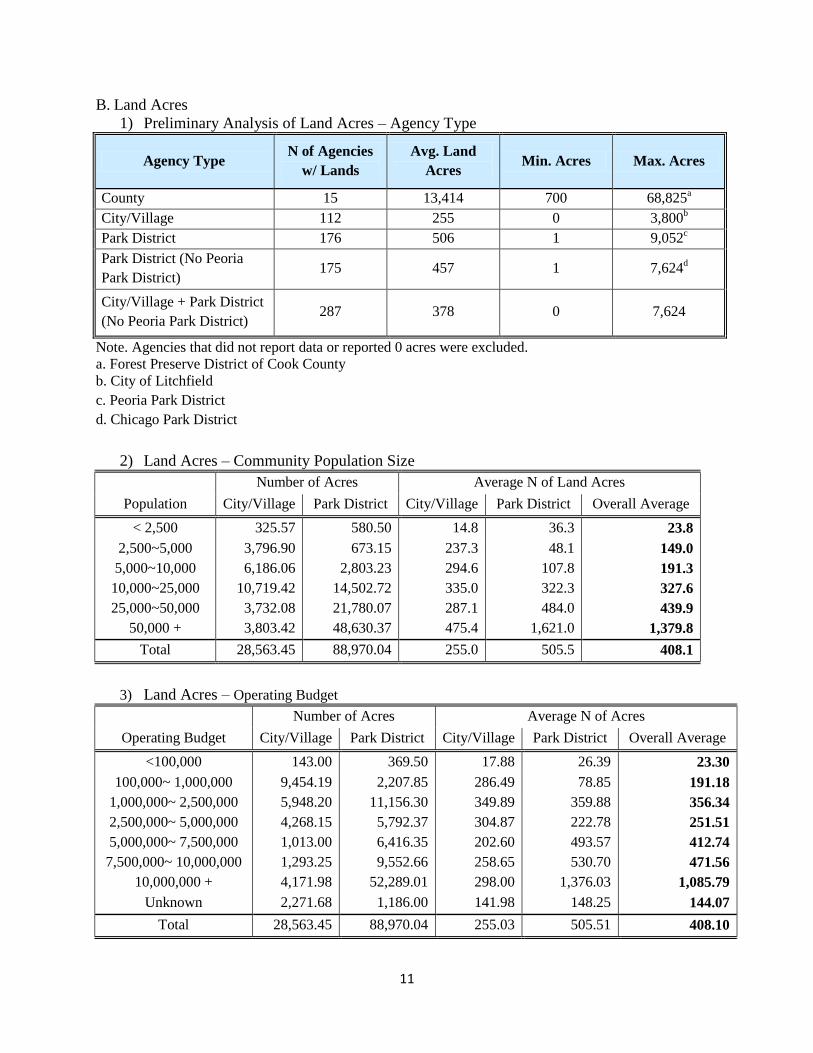
1) Preliminary Analysis of Land Acres – Agency Type
Agency Type N of Agencies
w/ Lands
Avg. Land
Acres Min. Acres Max. Acres
County 15 13,414 700 68,825a
City/Village 112 255 0 3,800b
Park District 176 506 1 9,052c
Park District (No Peoria
Park District) 175 457 1 7,624
d
City/Village + Park District
(No Peoria Park District) 287 378 0 7,624
Note. Agencies that did not report data or reported 0 acres were excluded.
a. Forest Preserve District of Cook County
b. City of Litchfield
c. Peoria Park District
d. Chicago Park District
2) Land Acres – Community Population Size
Number of Acres Average N of Land Acres
Population City/Village Park District City/Village Park District Overall Average
< 2,500 325.57 580.50 14.8 36.3 23.8
2,500~5,000 3,796.90 673.15 237.3 48.1 149.0
5,000~10,000 6,186.06 2,803.23 294.6 107.8 191.3
10,000~25,000 10,719.42 14,502.72 335.0 322.3 327.6
25,000~50,000 3,732.08 21,780.07 287.1 484.0 439.9
50,000 + 3,803.42 48,630.37 475.4 1,621.0 1,379.8
Total 28,563.45 88,970.04 255.0 505.5 408.1
3) Land Acres – Operating Budget
Number of Acres Average N of Acres
Operating Budget City/Village Park District City/Village Park District Overall Average
<100,000 143.00 369.50 17.88 26.39 23.30
100,000~ 1,000,000 9,454.19 2,207.85 286.49 78.85 191.18
1,000,000~ 2,500,000 5,948.20 11,156.30 349.89 359.88 356.34
2,500,000~ 5,000,000 4,268.15 5,792.37 304.87 222.78 251.51
5,000,000~ 7,500,000 1,013.00 6,416.35 202.60 493.57 412.74
7,500,000~ 10,000,000 1,293.25 9,552.66 258.65 530.70 471.56
10,000,000 + 4,171.98 52,289.01 298.00 1,376.03 1,085.79
Unknown 2,271.68 1,186.00 141.98 148.25 144.07
Total 28,563.45 88,970.04 255.03 505.51 408.10
12
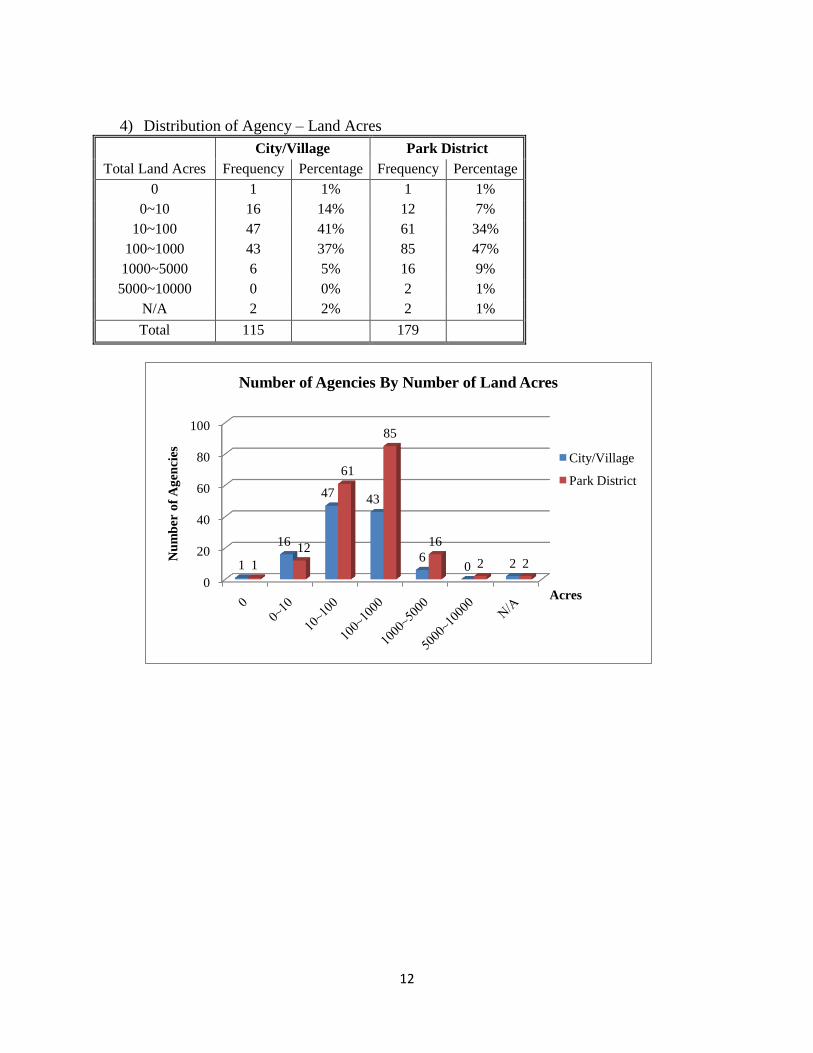
4) Distribution of Agency – Land Acres
City/Village Park District
Total Land Acres Frequency Percentage Frequency Percentage
0 1 1% 1 1%
0~10 16 14% 12 7%
10~100 47 41% 61 34%
100~1000 43 37% 85 47%
1000~5000 6 5% 16 9%
5000~10000 0 0% 2 1%
N/A 2 2% 2 1%
Total 115 179
0
20
40
60
80
100
1
16
4743
60 21
12
61
85
16
2 2
Nu
mb
er o
f A
gen
cies
Acres
Number of Agencies By Number of Land Acres
City/Village
Park District
13
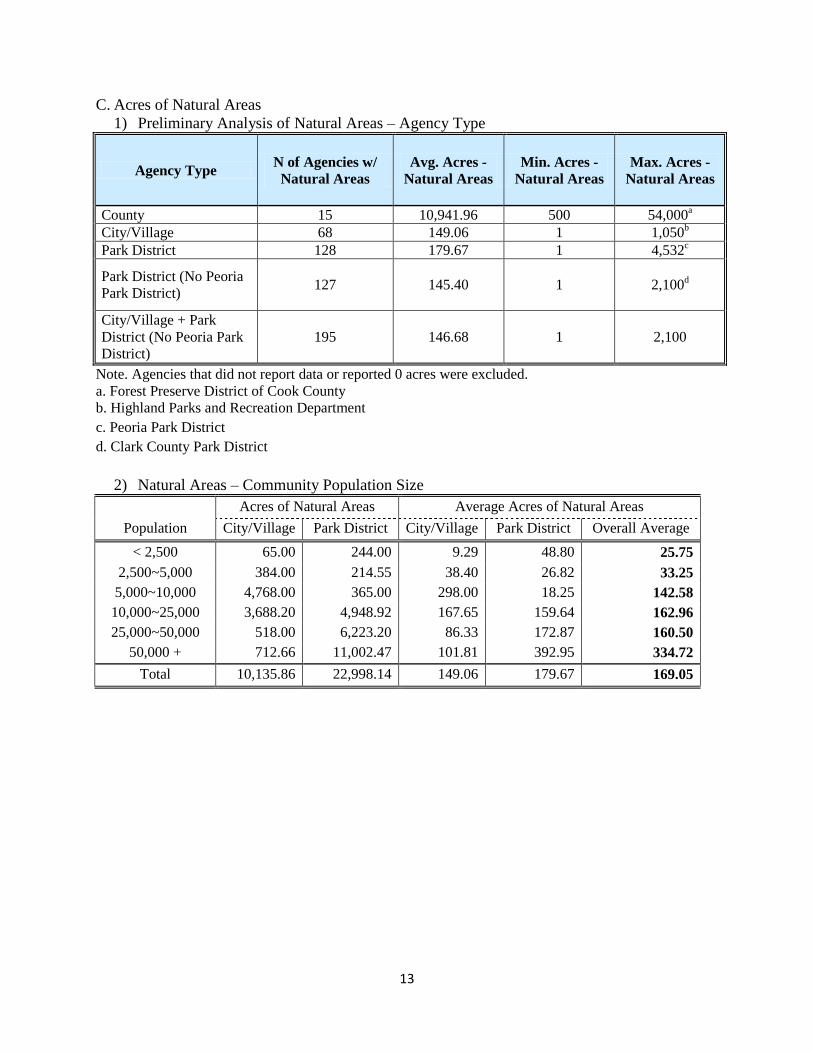
C. Acres of Natural Areas
1) Preliminary Analysis of Natural Areas – Agency Type
Agency Type N of Agencies w/
Natural Areas
Avg. Acres -
Natural Areas
Min. Acres -
Natural Areas
Max. Acres -
Natural Areas
County 15 10,941.96 500 54,000a
City/Village 68 149.06 1 1,050b
Park District 128 179.67 1 4,532c
Park District (No Peoria
Park District) 127 145.40 1 2,100
d
City/Village + Park
District (No Peoria Park
District)
195 146.68 1 2,100
Note. Agencies that did not report data or reported 0 acres were excluded.
a. Forest Preserve District of Cook County
b. Highland Parks and Recreation Department
c. Peoria Park District
d. Clark County Park District
2) Natural Areas – Community Population Size
Acres of Natural Areas Average Acres of Natural Areas
Population City/Village Park District City/Village Park District Overall Average
< 2,500 65.00 244.00 9.29 48.80 25.75
2,500~5,000 384.00 214.55 38.40 26.82 33.25
5,000~10,000 4,768.00 365.00 298.00 18.25 142.58
10,000~25,000 3,688.20 4,948.92 167.65 159.64 162.96
25,000~50,000 518.00 6,223.20 86.33 172.87 160.50
50,000 + 712.66 11,002.47 101.81 392.95 334.72
Total 10,135.86 22,998.14 149.06 179.67 169.05
14
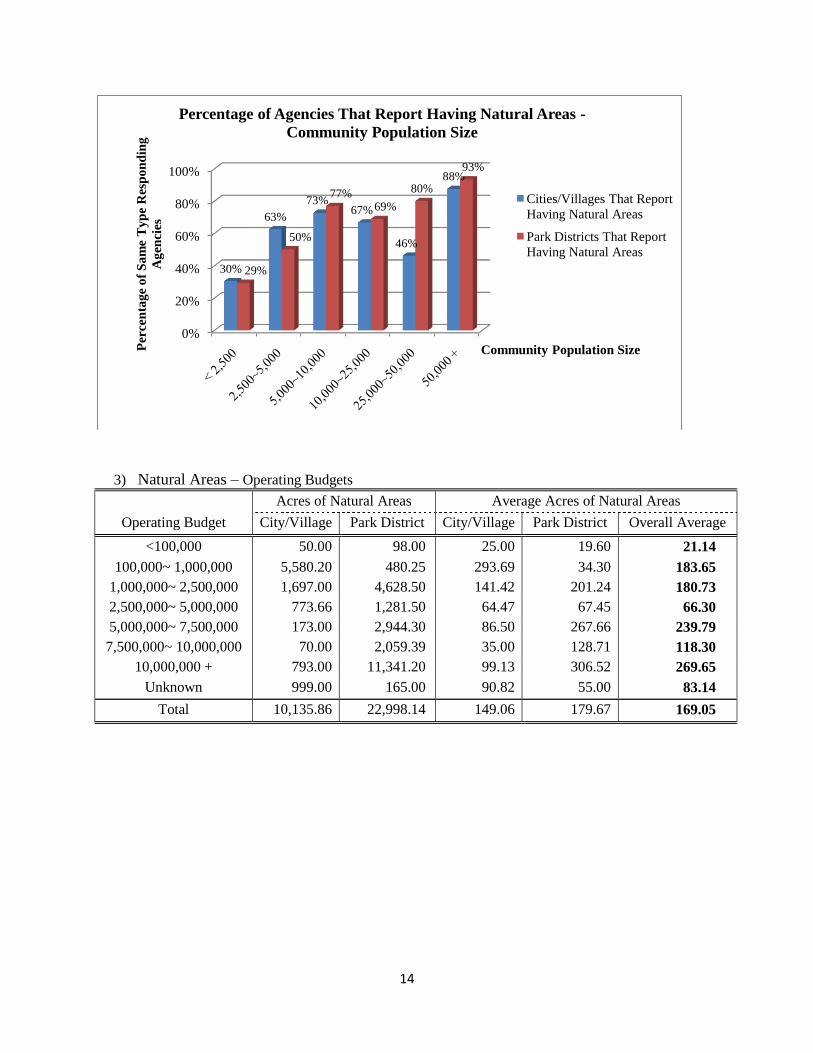
3) Natural Areas – Operating Budgets
Acres of Natural Areas Average Acres of Natural Areas
Operating Budget City/Village Park District City/Village Park District Overall Average
<100,000 50.00 98.00 25.00 19.60 21.14
100,000~ 1,000,000 5,580.20 480.25 293.69 34.30 183.65
1,000,000~ 2,500,000 1,697.00 4,628.50 141.42 201.24 180.73
2,500,000~ 5,000,000 773.66 1,281.50 64.47 67.45 66.30
5,000,000~ 7,500,000 173.00 2,944.30 86.50 267.66 239.79
7,500,000~ 10,000,000 70.00 2,059.39 35.00 128.71 118.30
10,000,000 + 793.00 11,341.20 99.13 306.52 269.65
Unknown 999.00 165.00 90.82 55.00 83.14
Total 10,135.86 22,998.14 149.06 179.67 169.05
0%
20%
40%
60%
80%
100%
30%
63%
73%67%
46%
88%
29%
50%
77%69%
80%
93%
Per
cen
tag
e o
f S
am
e T
yp
e R
esp
on
din
g
Ag
enci
es
Community Population Size
Percentage of Agencies That Report Having Natural Areas -
Community Population Size
Cities/Villages That Report
Having Natural Areas
Park Districts That Report
Having Natural Areas
15
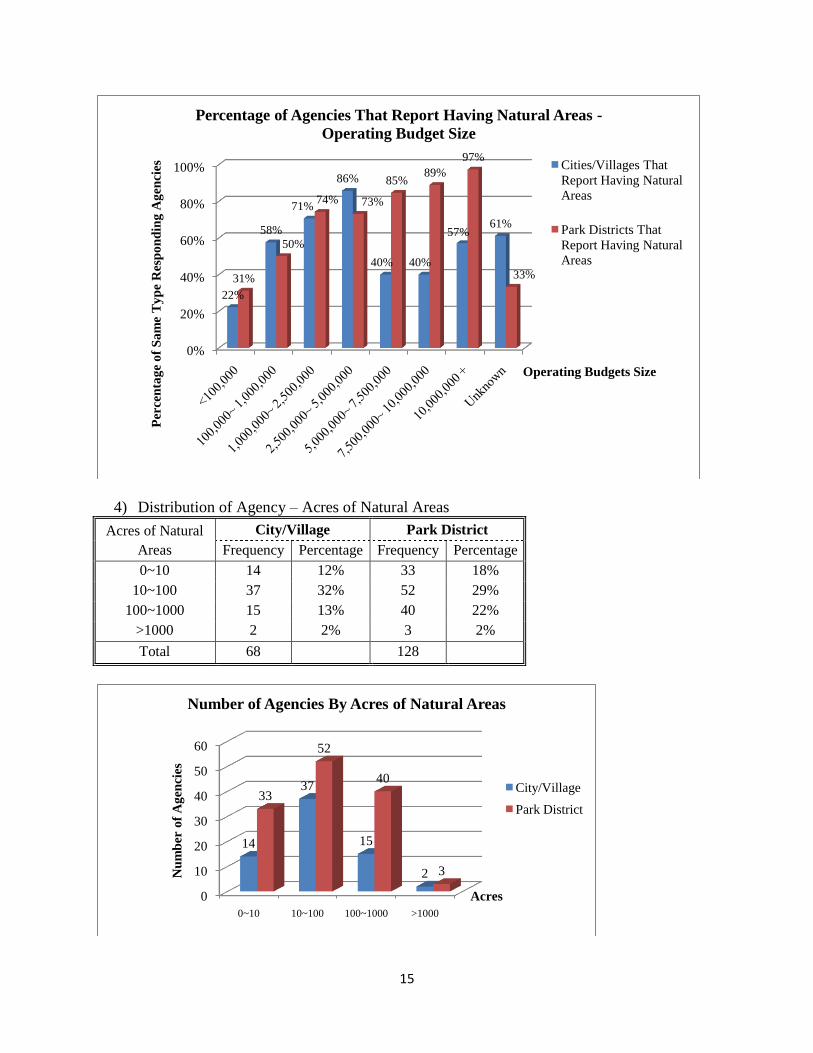
4) Distribution of Agency – Acres of Natural Areas
Acres of Natural
Areas
City/Village Park District
Frequency Percentage Frequency Percentage
0~10 14 12% 33 18%
10~100 37 32% 52 29%
100~1000 15 13% 40 22%
>1000 2 2% 3 2%
Total 68 128
0%
20%
40%
60%
80%
100%
22%
58%
71%
86%
40% 40%
57%61%
31%
50%
74% 73%
85%89%
97%
33%
Per
cen
tag
e o
f S
am
e T
yp
e R
esp
on
din
g A
gen
cies
Operating Budgets Size
Percentage of Agencies That Report Having Natural Areas -
Operating Budget Size
Cities/Villages That
Report Having Natural
Areas
Park Districts That
Report Having Natural
Areas
0
10
20
30
40
50
60
0~10 10~100 100~1000 >1000
14
37
15
2
33
52
40
3Nu
mb
er o
f A
gen
cies
Acres
Number of Agencies By Acres of Natural Areas
City/Village
Park District
16
IV. Land Dedication Ordinance
Land Dedication
Ordinance No Ordinance Total
City/Village 34 81 115
Park District 67 112 179
Total 101 193 294
V. Water-Based Facilities
-
50
100
150
200
250
300
350
Fishing
Piers/Docks
Outdoor
Pools/Aquatic
Centers
Spray Grounds Boat Launch
Ramps
(Motorized)
Canoe Launch
Ramps (Non-
motorized)
100
57
17
53 33
261
206
305
70
97
71
3 224
42
Nu
mb
er o
f F
aci
liti
es
Water-Based Facilities
City Department
Park District
County
17
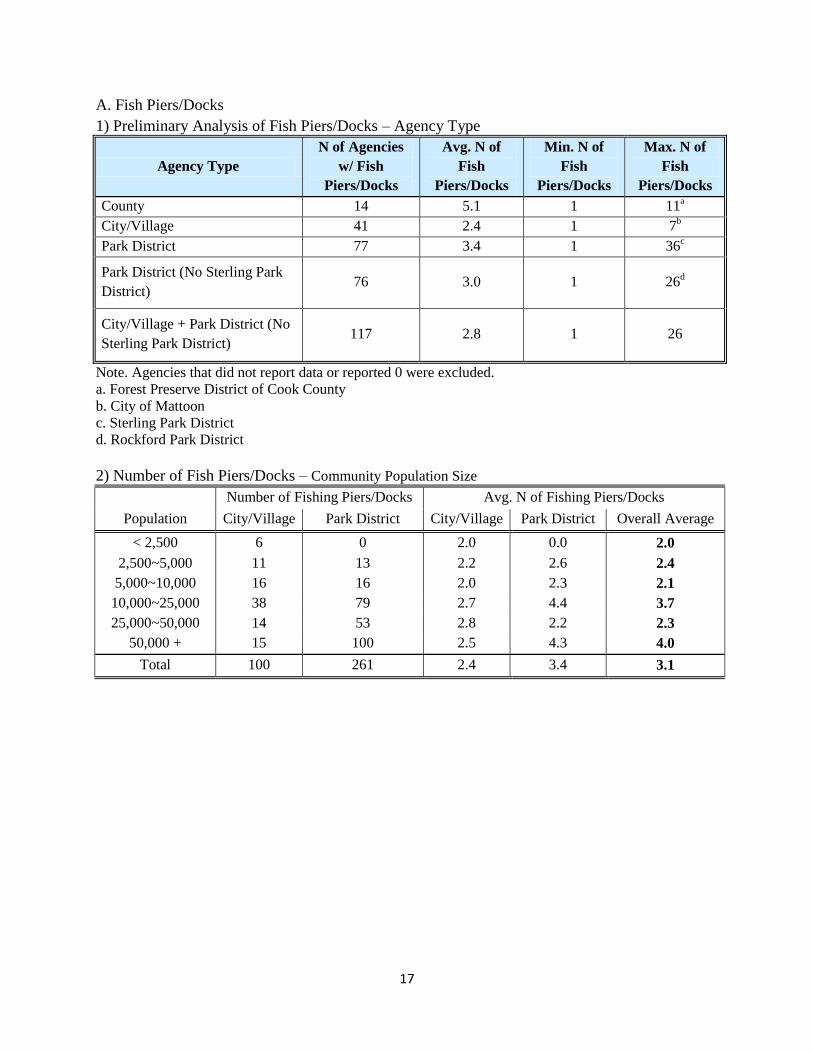
A. Fish Piers/Docks
1) Preliminary Analysis of Fish Piers/Docks – Agency Type
Agency Type
N of Agencies
w/ Fish
Piers/Docks
Avg. N of
Fish
Piers/Docks
Min. N of
Fish
Piers/Docks
Max. N of
Fish
Piers/Docks
County 14 5.1 1 11a
City/Village 41 2.4 1 7b
Park District 77 3.4 1 36c
Park District (No Sterling Park
District) 76 3.0 1 26
d
City/Village + Park District (No
Sterling Park District) 117 2.8 1 26
Note. Agencies that did not report data or reported 0 were excluded.
a. Forest Preserve District of Cook County
b. City of Mattoon
c. Sterling Park District
d. Rockford Park District
2) Number of Fish Piers/Docks – Community Population Size
Number of Fishing Piers/Docks Avg. N of Fishing Piers/Docks
Population City/Village Park District City/Village Park District Overall Average
< 2,500 6 0 2.0 0.0 2.0
2,500~5,000 11 13 2.2 2.6 2.4
5,000~10,000 16 16 2.0 2.3 2.1
10,000~25,000 38 79 2.7 4.4 3.7
25,000~50,000 14 53 2.8 2.2 2.3
50,000 + 15 100 2.5 4.3 4.0
Total 100 261 2.4 3.4 3.1
18
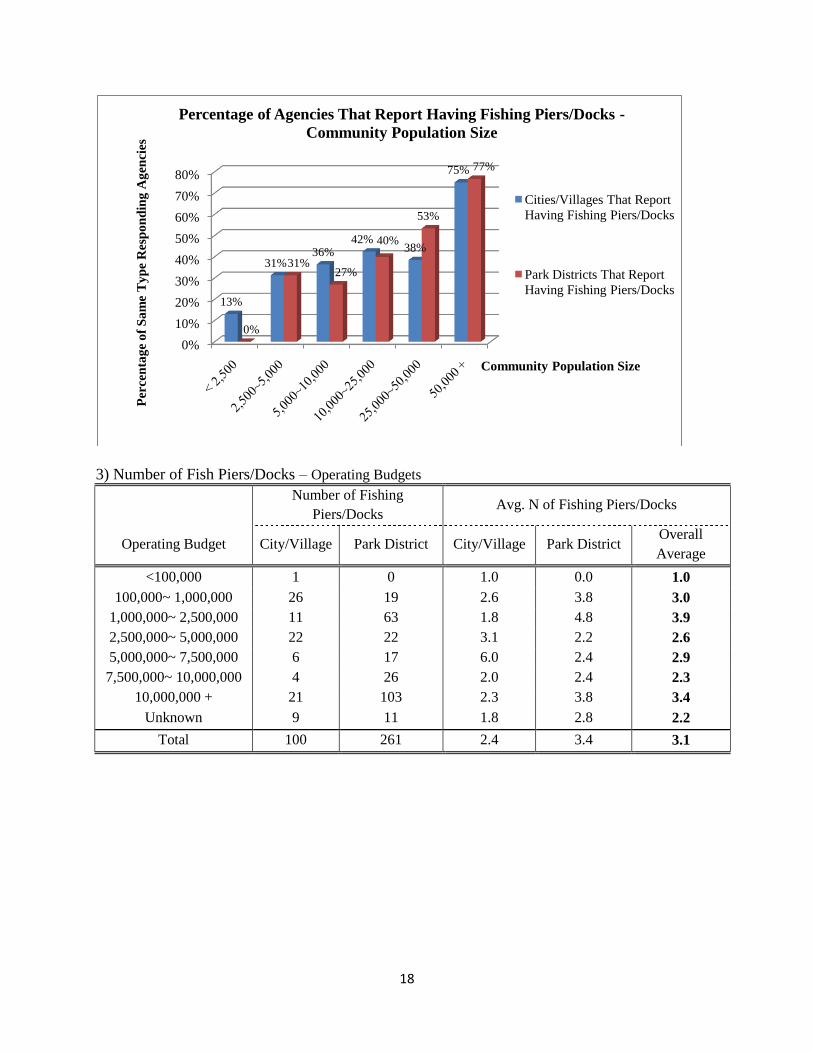
3) Number of Fish Piers/Docks – Operating Budgets
Number of Fishing
Piers/Docks Avg. N of Fishing Piers/Docks
Operating Budget City/Village Park District City/Village Park District Overall
Average
<100,000 1 0 1.0 0.0 1.0
100,000~ 1,000,000 26 19 2.6 3.8 3.0
1,000,000~ 2,500,000 11 63 1.8 4.8 3.9
2,500,000~ 5,000,000 22 22 3.1 2.2 2.6
5,000,000~ 7,500,000 6 17 6.0 2.4 2.9
7,500,000~ 10,000,000 4 26 2.0 2.4 2.3
10,000,000 + 21 103 2.3 3.8 3.4
Unknown 9 11 1.8 2.8 2.2
Total 100 261 2.4 3.4 3.1
0%
10%
20%
30%
40%
50%
60%
70%
80%
13%
31%36%
42%38%
75%
0%
31%27%
40%
53%
77%
Per
cen
tag
e o
f S
am
e T
yp
e R
esp
on
din
g A
gen
cies
Community Population Size
Percentage of Agencies That Report Having Fishing Piers/Docks -
Community Population Size
Cities/Villages That Report
Having Fishing Piers/Docks
Park Districts That Report
Having Fishing Piers/Docks
19
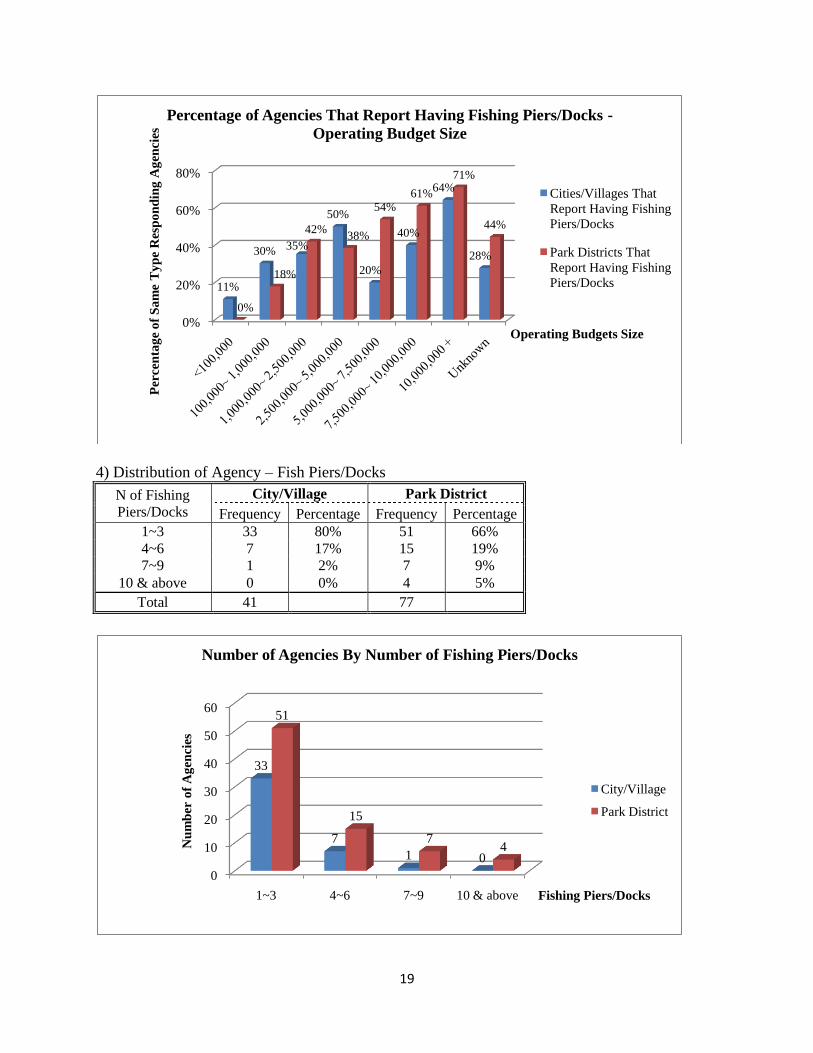
4) Distribution of Agency – Fish Piers/Docks
N of Fishing
Piers/Docks
City/Village Park District
Frequency Percentage Frequency Percentage
1~3 33 80% 51 66%
4~6 7 17% 15 19%
7~9 1 2% 7 9%
10 & above 0 0% 4 5%
Total 41 77
0%
20%
40%
60%
80%
11%
30% 35%
50%
20%
40%
64%
28%
0%
18%
42%38%
54%61%
71%
44%
Per
cen
tag
e o
f S
am
e T
yp
e R
esp
on
din
g A
gen
cies
Operating Budgets Size
Percentage of Agencies That Report Having Fishing Piers/Docks -
Operating Budget Size
Cities/Villages That
Report Having Fishing
Piers/Docks
Park Districts That
Report Having Fishing
Piers/Docks
0
10
20
30
40
50
60
1~3 4~6 7~9 10 & above
33
7
1 0
51
15
74N
um
ber
of
Ag
enci
es
Fishing Piers/Docks
Number of Agencies By Number of Fishing Piers/Docks
City/Village
Park District
20
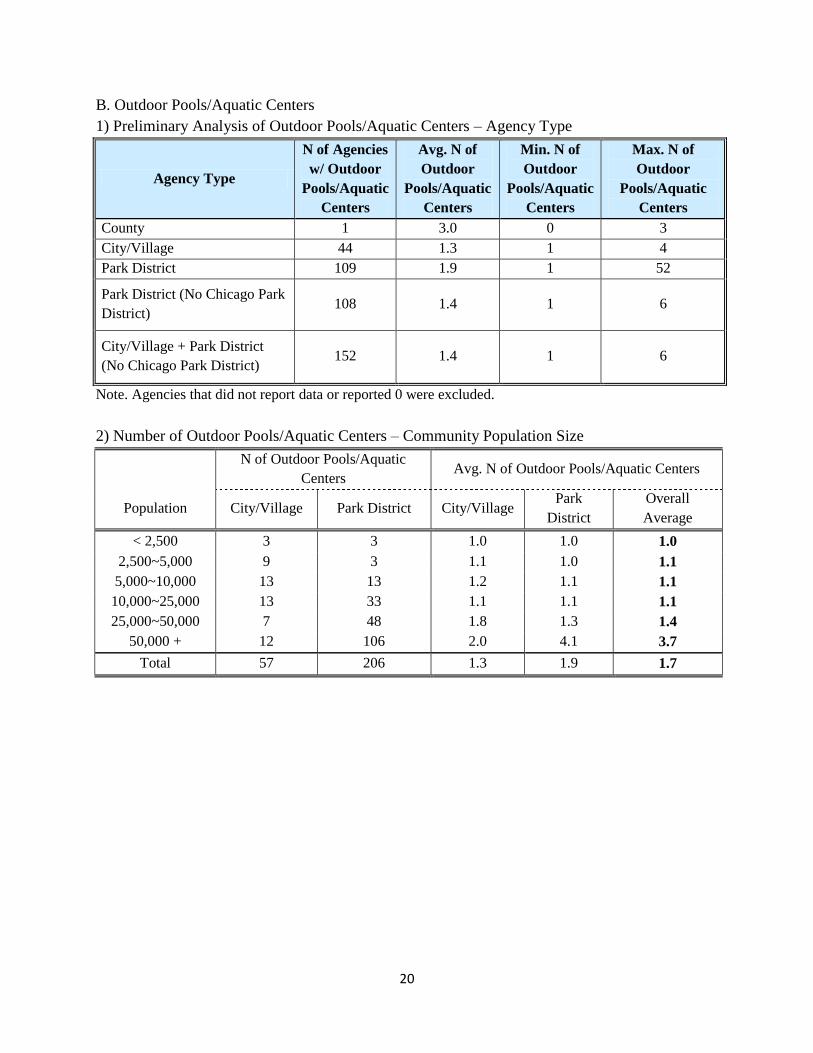
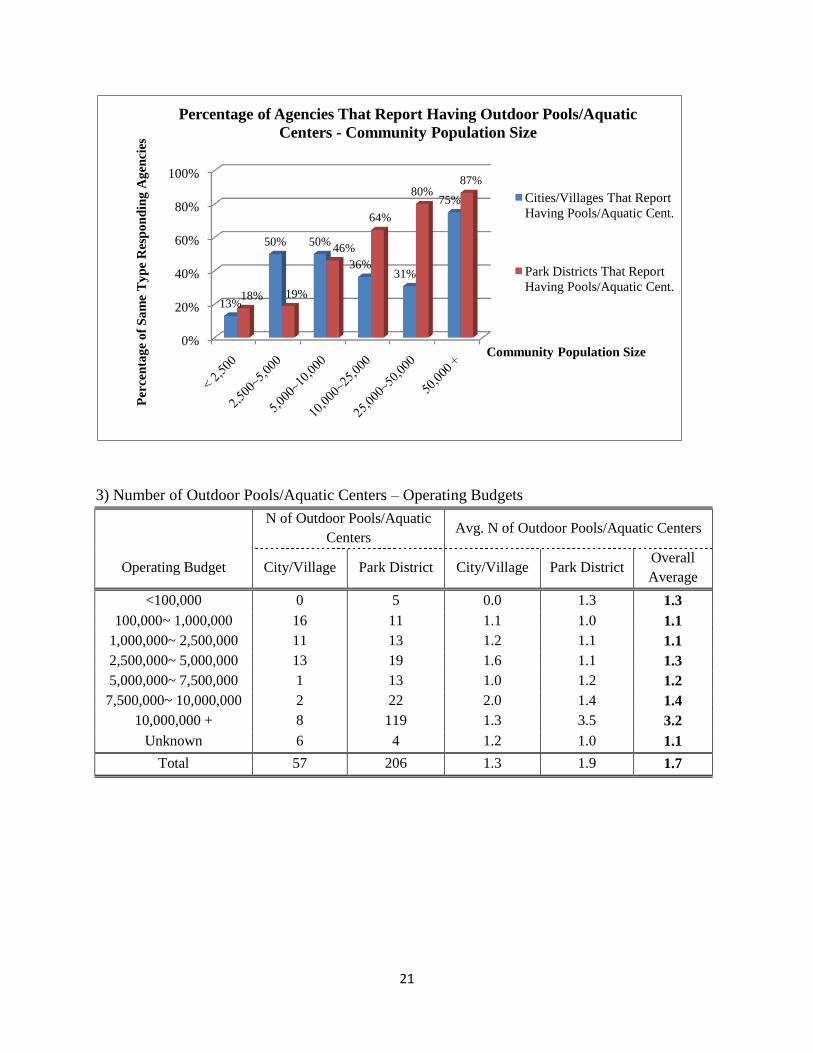
B. Outdoor Pools/Aquatic Centers
1) Preliminary Analysis of Outdoor Pools/Aquatic Centers – Agency Type
Agency Type
N of Agencies
w/ Outdoor
Pools/Aquatic
Centers
Avg. N of
Outdoor
Pools/Aquatic
Centers
Min. N of
Outdoor
Pools/Aquatic
Centers
Max. N of
Outdoor
Pools/Aquatic
Centers
County 1 3.0 0 3
City/Village 44 1.3 1 4
Park District 109 1.9 1 52
Park District (No Chicago Park
District) 108 1.4 1 6
City/Village + Park District
(No Chicago Park District) 152 1.4 1 6
Note. Agencies that did not report data or reported 0 were excluded.
2) Number of Outdoor Pools/Aquatic Centers – Community Population Size
N of Outdoor Pools/Aquatic
Centers Avg. N of Outdoor Pools/Aquatic Centers
Population City/Village Park District City/Village Park
District
Overall
Average
< 2,500 3 3 1.0 1.0 1.0
2,500~5,000 9 3 1.1 1.0 1.1
5,000~10,000 13 13 1.2 1.1 1.1
10,000~25,000 13 33 1.1 1.1 1.1
25,000~50,000 7 48 1.8 1.3 1.4
50,000 + 12 106 2.0 4.1 3.7
Total 57 206 1.3 1.9 1.7
21
3) Number of Outdoor Pools/Aquatic Centers – Operating Budgets
N of Outdoor Pools/Aquatic
Centers Avg. N of Outdoor Pools/Aquatic Centers
Operating Budget City/Village Park District City/Village Park District Overall
Average
<100,000 0 5 0.0 1.3 1.3
100,000~ 1,000,000 16 11 1.1 1.0 1.1
1,000,000~ 2,500,000 11 13 1.2 1.1 1.1
2,500,000~ 5,000,000 13 19 1.6 1.1 1.3
5,000,000~ 7,500,000 1 13 1.0 1.2 1.2
7,500,000~ 10,000,000 2 22 2.0 1.4 1.4
10,000,000 + 8 119 1.3 3.5 3.2
Unknown 6 4 1.2 1.0 1.1
Total 57 206 1.3 1.9 1.7
0%
20%
40%
60%
80%
100%
13%
50% 50%
36%31%
75%
18% 19%
46%
64%
80%87%
Per
cen
tag
e o
f S
am
e T
yp
e R
esp
on
din
g A
gen
cies
Community Population Size
Percentage of Agencies That Report Having Outdoor Pools/Aquatic
Centers - Community Population Size
Cities/Villages That Report
Having Pools/Aquatic Cent.
Park Districts That Report
Having Pools/Aquatic Cent.
22
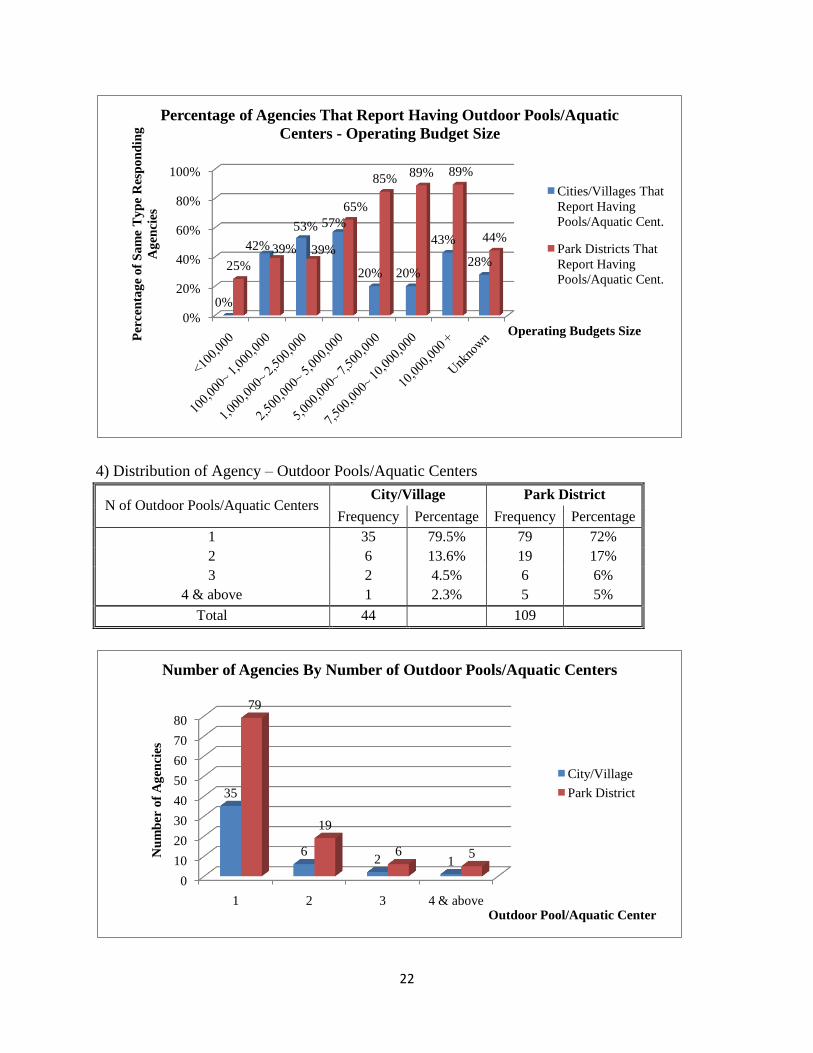
4) Distribution of Agency – Outdoor Pools/Aquatic Centers
N of Outdoor Pools/Aquatic Centers City/Village Park District
Frequency Percentage Frequency Percentage
1 35 79.5% 79 72%
2 6 13.6% 19 17%
3 2 4.5% 6 6%
4 & above 1 2.3% 5 5%
Total 44 109
0%
20%
40%
60%
80%
100%
0%
42%
53% 57%
20% 20%
43%
28%25%
39% 39%
65%
85%89% 89%
44%
Per
cen
tag
e o
f S
am
e T
yp
e R
esp
on
din
g
Ag
enci
es
Operating Budgets Size
Percentage of Agencies That Report Having Outdoor Pools/Aquatic
Centers - Operating Budget Size
Cities/Villages That
Report Having
Pools/Aquatic Cent.
Park Districts That
Report Having
Pools/Aquatic Cent.
0
10
20
30
40
50
60
70
80
1 2 3 4 & above
35
62 1
79
19
6 5Nu
mb
er o
f A
gen
cies
Outdoor Pool/Aquatic Center
Number of Agencies By Number of Outdoor Pools/Aquatic Centers
City/Village
Park District
23
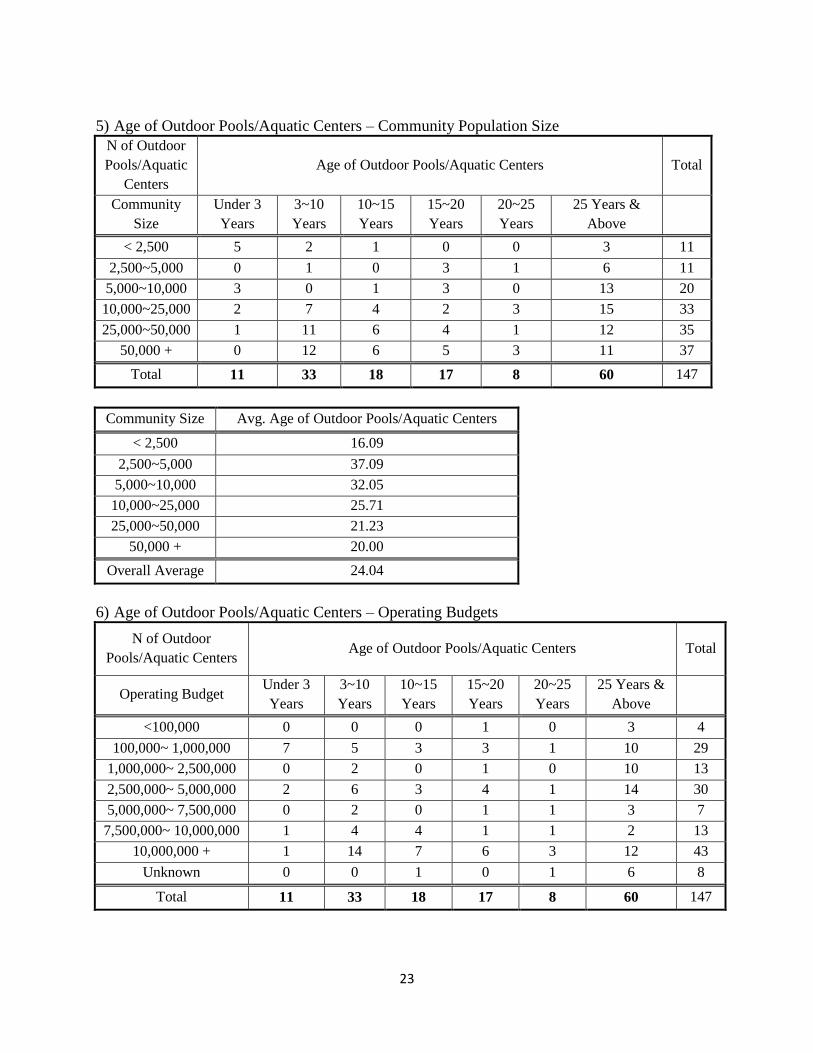
5) Age of Outdoor Pools/Aquatic Centers – Community Population Size
N of Outdoor
Pools/Aquatic
Centers
Age of Outdoor Pools/Aquatic Centers Total
Community
Size
Under 3
Years
3~10
Years
10~15
Years
15~20
Years
20~25
Years
25 Years &
Above
< 2,500 5 2 1 0 0 3 11
2,500~5,000 0 1 0 3 1 6 11
5,000~10,000 3 0 1 3 0 13 20
10,000~25,000 2 7 4 2 3 15 33
25,000~50,000 1 11 6 4 1 12 35
50,000 + 0 12 6 5 3 11 37
Total 11 33 18 17 8 60 147
Community Size Avg. Age of Outdoor Pools/Aquatic Centers
< 2,500 16.09
2,500~5,000 37.09
5,000~10,000 32.05
10,000~25,000 25.71
25,000~50,000 21.23
50,000 + 20.00
Overall Average 24.04
6) Age of Outdoor Pools/Aquatic Centers – Operating Budgets
N of Outdoor
Pools/Aquatic Centers Age of Outdoor Pools/Aquatic Centers Total
Operating Budget Under 3
Years
3~10
Years
10~15
Years
15~20
Years
20~25
Years
25 Years &
Above
<100,000 0 0 0 1 0 3 4
100,000~ 1,000,000 7 5 3 3 1 10 29
1,000,000~ 2,500,000 0 2 0 1 0 10 13
2,500,000~ 5,000,000 2 6 3 4 1 14 30
5,000,000~ 7,500,000 0 2 0 1 1 3 7
7,500,000~ 10,000,000 1 4 4 1 1 2 13
10,000,000 + 1 14 7 6 3 12 43
Unknown 0 0 1 0 1 6 8
Total 11 33 18 17 8 60 147
24
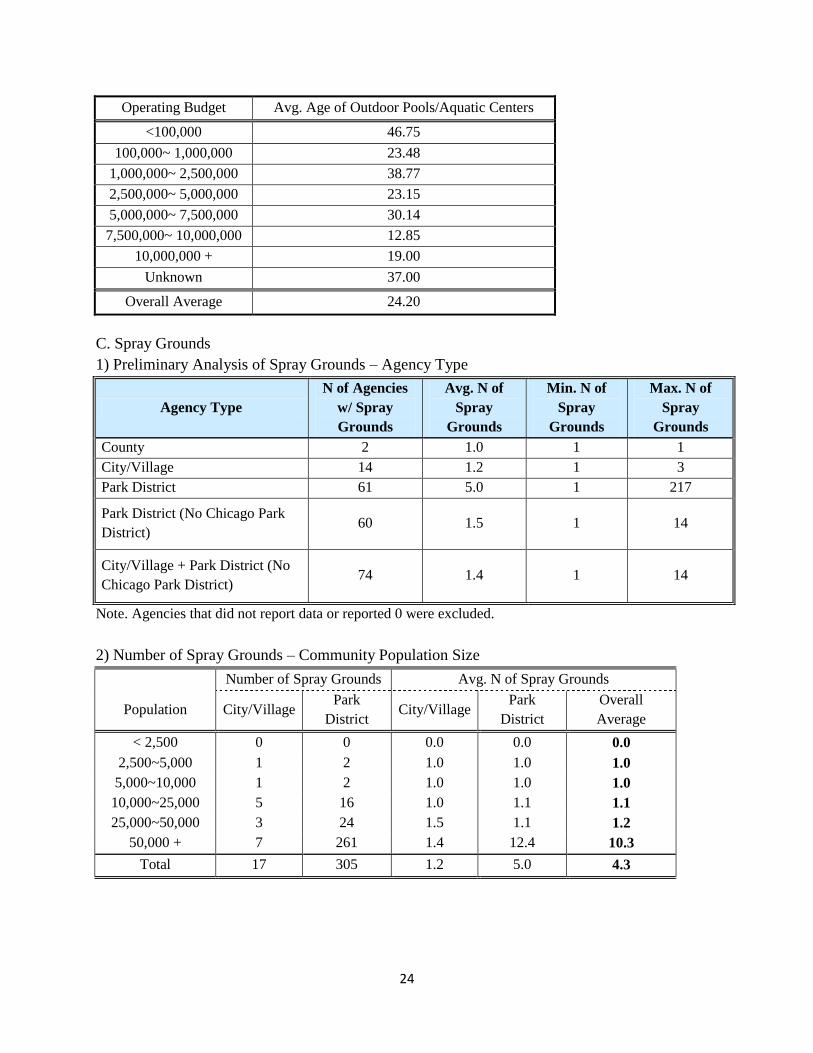
Operating Budget Avg. Age of Outdoor Pools/Aquatic Centers
<100,000 46.75
100,000~ 1,000,000 23.48
1,000,000~ 2,500,000 38.77
2,500,000~ 5,000,000 23.15
5,000,000~ 7,500,000 30.14
7,500,000~ 10,000,000 12.85
10,000,000 + 19.00
Unknown 37.00
Overall Average 24.20
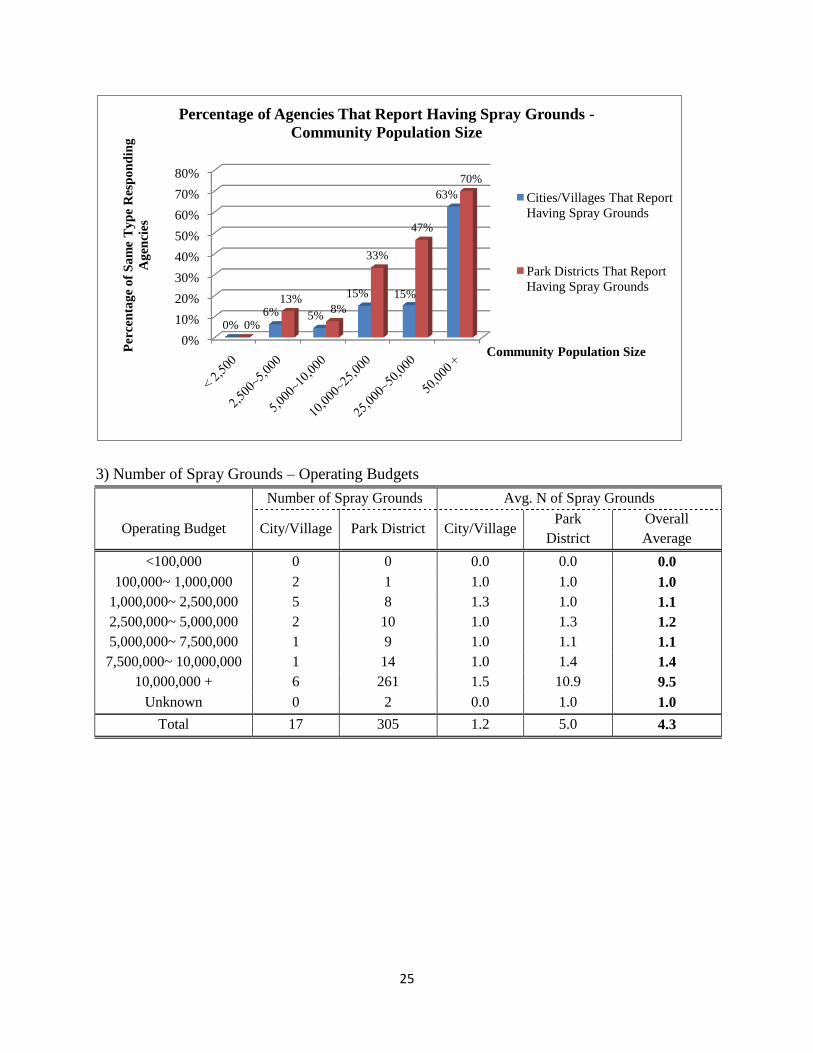
C. Spray Grounds
1) Preliminary Analysis of Spray Grounds – Agency Type
Agency Type
N of Agencies
w/ Spray
Grounds
Avg. N of
Spray
Grounds
Min. N of
Spray
Grounds
Max. N of
Spray
Grounds
County 2 1.0 1 1
City/Village 14 1.2 1 3
Park District 61 5.0 1 217
Park District (No Chicago Park
District) 60 1.5 1 14
City/Village + Park District (No
Chicago Park District) 74 1.4 1 14
Note. Agencies that did not report data or reported 0 were excluded.
2) Number of Spray Grounds – Community Population Size
Number of Spray Grounds Avg. N of Spray Grounds
Population City/Village Park
District City/Village
Park
District
Overall
Average
< 2,500 0 0 0.0 0.0 0.0
2,500~5,000 1 2 1.0 1.0 1.0
5,000~10,000 1 2 1.0 1.0 1.0
10,000~25,000 5 16 1.0 1.1 1.1
25,000~50,000 3 24 1.5 1.1 1.2
50,000 + 7 261 1.4 12.4 10.3
Total 17 305 1.2 5.0 4.3
25
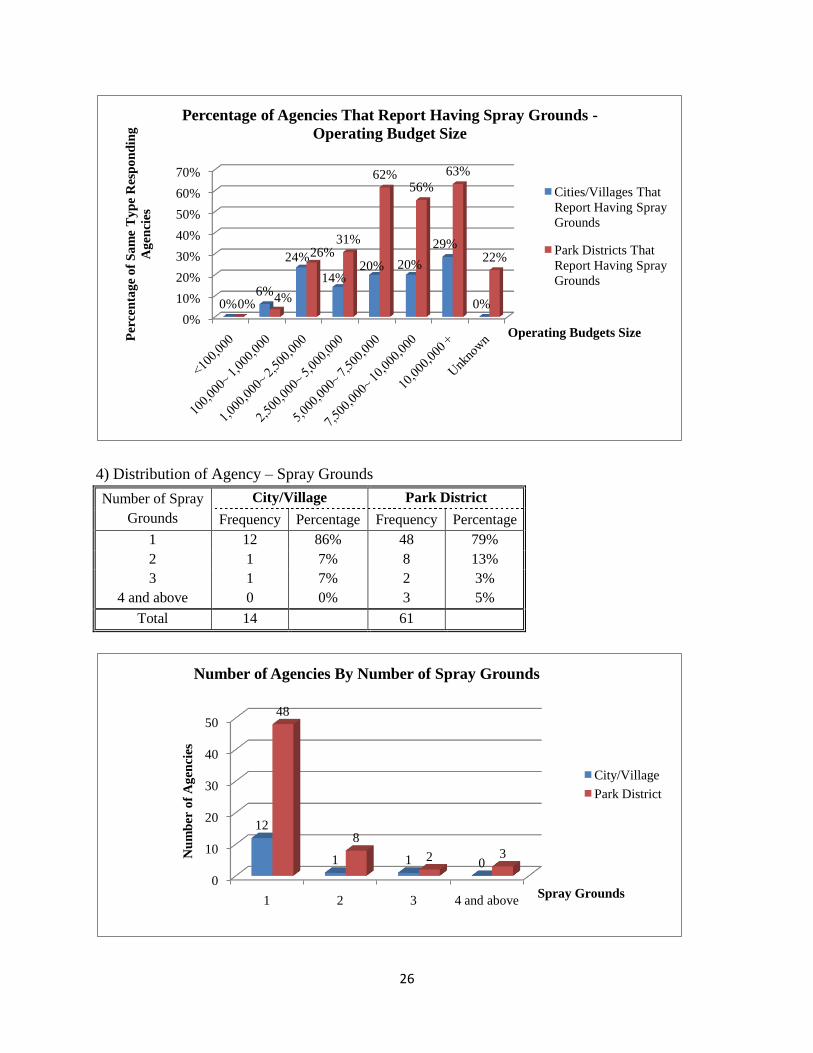
3) Number of Spray Grounds – Operating Budgets
Number of Spray Grounds Avg. N of Spray Grounds
Operating Budget City/Village Park District City/Village Park
District
Overall
Average
<100,000 0 0 0.0 0.0 0.0
100,000~ 1,000,000 2 1 1.0 1.0 1.0
1,000,000~ 2,500,000 5 8 1.3 1.0 1.1
2,500,000~ 5,000,000 2 10 1.0 1.3 1.2
5,000,000~ 7,500,000 1 9 1.0 1.1 1.1
7,500,000~ 10,000,000 1 14 1.0 1.4 1.4
10,000,000 + 6 261 1.5 10.9 9.5
Unknown 0 2 0.0 1.0 1.0
Total 17 305 1.2 5.0 4.3
0%
10%
20%
30%
40%
50%
60%
70%
80%
0%6% 5%
15% 15%
63%
0%
13%8%
33%
47%
70%
Per
cen
tag
e o
f S
am
e T
yp
e R
esp
on
din
g
Ag
enci
es
Community Population Size
Percentage of Agencies That Report Having Spray Grounds -
Community Population Size
Cities/Villages That Report
Having Spray Grounds
Park Districts That Report
Having Spray Grounds
26
4) Distribution of Agency – Spray Grounds
Number of Spray
Grounds
City/Village Park District
Frequency Percentage Frequency Percentage
1 12 86% 48 79%
2 1 7% 8 13%
3 1 7% 2 3%
4 and above 0 0% 3 5%
Total 14
61
0%
10%
20%
30%
40%
50%
60%
70%
0%6%
24%
14%20% 20%
29%
0%0%4%
26%31%
62%56%
63%
22%
Per
cen
tag
e o
f S
am
e T
yp
e R
esp
on
din
g
Ag
enci
es
Operating Budgets Size
Percentage of Agencies That Report Having Spray Grounds -
Operating Budget Size
Cities/Villages That
Report Having Spray
Grounds
Park Districts That
Report Having Spray
Grounds
0
10
20
30
40
50
1 2 3 4 and above
12
1 1 0
48
8
2 3Nu
mb
er o
f A
gen
cies
Spray Grounds
Number of Agencies By Number of Spray Grounds
City/Village
Park District
27
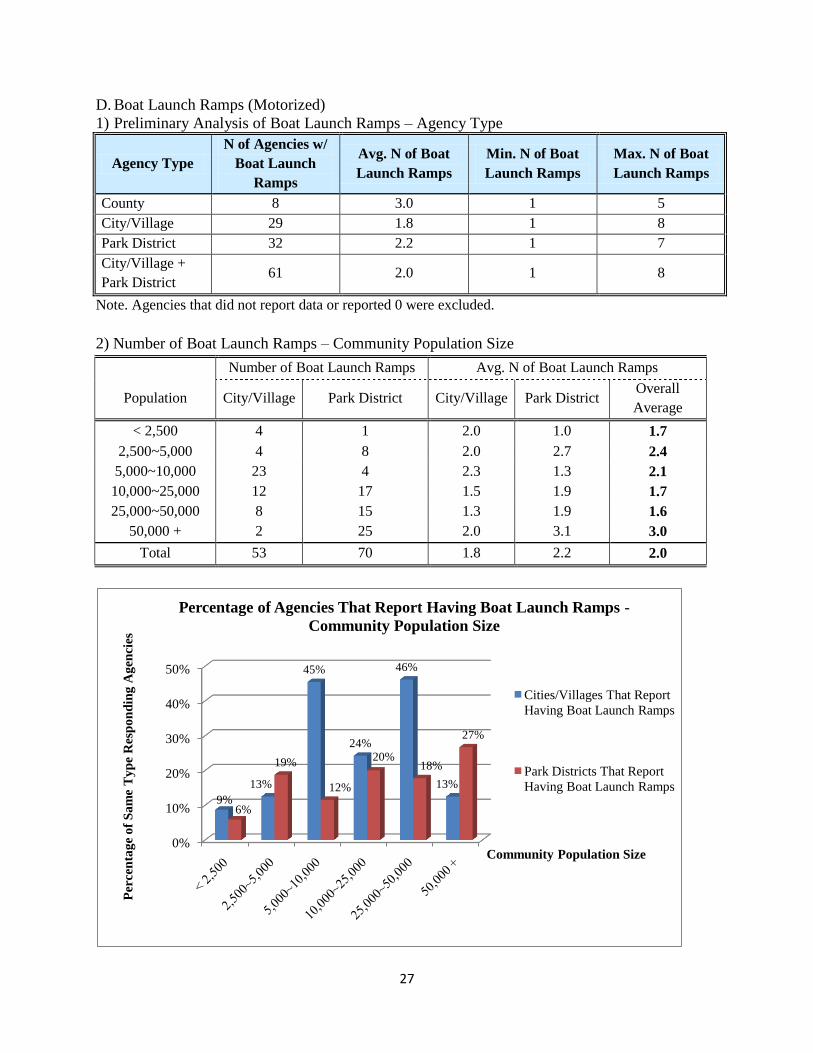
D. Boat Launch Ramps (Motorized)
1) Preliminary Analysis of Boat Launch Ramps – Agency Type
Agency Type
N of Agencies w/
Boat Launch
Ramps
Avg. N of Boat
Launch Ramps
Min. N of Boat
Launch Ramps
Max. N of Boat
Launch Ramps
County 8 3.0 1 5
City/Village 29 1.8 1 8
Park District 32 2.2 1 7
City/Village +
Park District 61 2.0 1 8
Note. Agencies that did not report data or reported 0 were excluded.
2) Number of Boat Launch Ramps – Community Population Size
Number of Boat Launch Ramps Avg. N of Boat Launch Ramps
Population City/Village Park District City/Village Park District Overall
Average
< 2,500 4 1 2.0 1.0 1.7
2,500~5,000 4 8 2.0 2.7 2.4
5,000~10,000 23 4 2.3 1.3 2.1
10,000~25,000 12 17 1.5 1.9 1.7
25,000~50,000 8 15 1.3 1.9 1.6
50,000 + 2 25 2.0 3.1 3.0
Total 53 70 1.8 2.2 2.0
0%
10%
20%
30%
40%
50%
9%
13%
45%
24%
46%
13%
6%
19%
12%
20%18%
27%
Per
cen
tag
e o
f S
am
e T
yp
e R
esp
on
din
g A
gen
cies
Community Population Size
Percentage of Agencies That Report Having Boat Launch Ramps -
Community Population Size
Cities/Villages That Report
Having Boat Launch Ramps
Park Districts That Report
Having Boat Launch Ramps
28
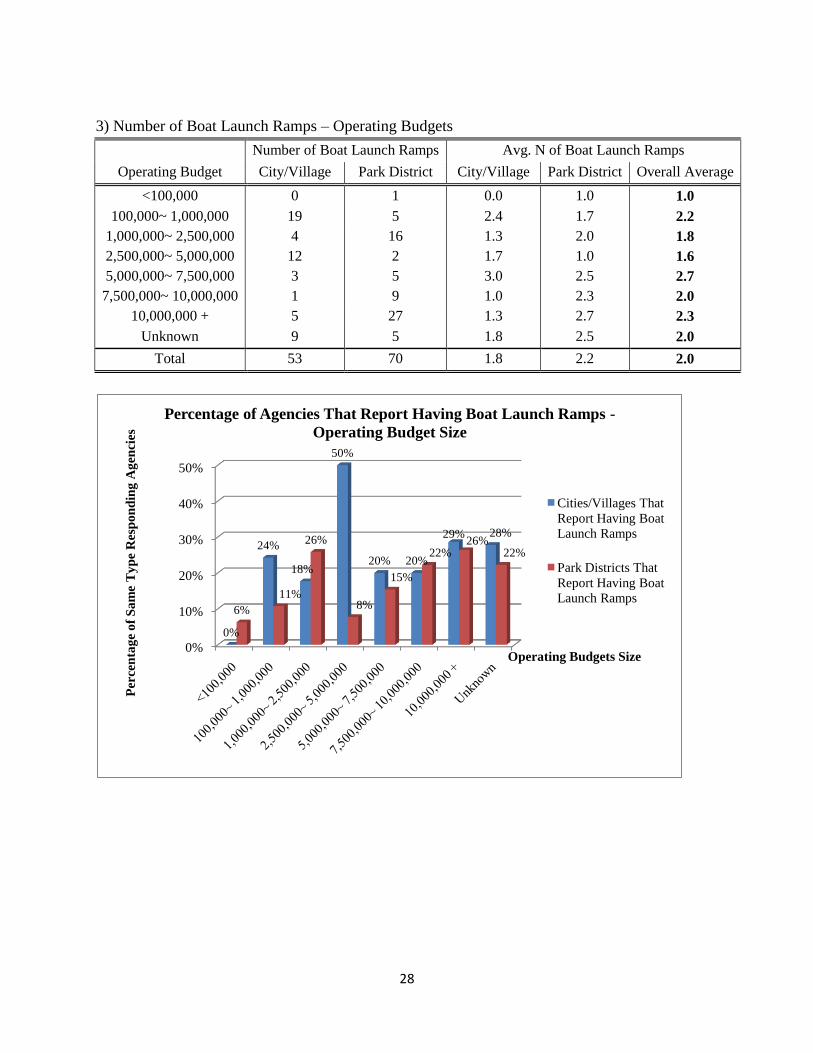
3) Number of Boat Launch Ramps – Operating Budgets
Number of Boat Launch Ramps Avg. N of Boat Launch Ramps
Operating Budget City/Village Park District City/Village Park District Overall Average
<100,000 0 1 0.0 1.0 1.0
100,000~ 1,000,000 19 5 2.4 1.7 2.2
1,000,000~ 2,500,000 4 16 1.3 2.0 1.8
2,500,000~ 5,000,000 12 2 1.7 1.0 1.6
5,000,000~ 7,500,000 3 5 3.0 2.5 2.7
7,500,000~ 10,000,000 1 9 1.0 2.3 2.0
10,000,000 + 5 27 1.3 2.7 2.3
Unknown 9 5 1.8 2.5 2.0
Total 53 70 1.8 2.2 2.0
0%
10%
20%
30%
40%
50%
0%
24%
18%
50%
20% 20%
29% 28%
6%
11%
26%
8%
15%
22%26%
22%
Per
cen
tag
e o
f S
am
e T
yp
e R
esp
on
din
g A
gen
cies
Operating Budgets Size
Percentage of Agencies That Report Having Boat Launch Ramps -
Operating Budget Size
Cities/Villages That
Report Having Boat
Launch Ramps
Park Districts That
Report Having Boat
Launch Ramps
29
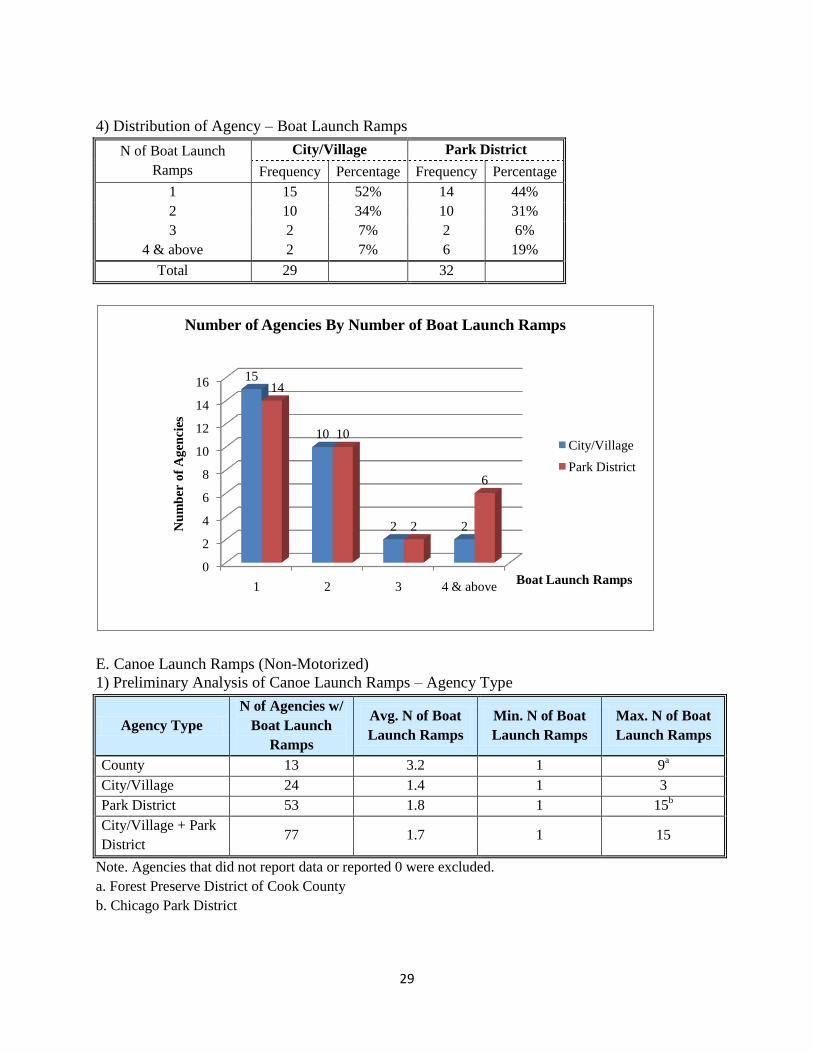
4) Distribution of Agency – Boat Launch Ramps
N of Boat Launch
Ramps
City/Village Park District
Frequency Percentage Frequency Percentage
1 15 52% 14 44%
2 10 34% 10 31%
3 2 7% 2 6%
4 & above 2 7% 6 19%
Total 29
32
E. Canoe Launch Ramps (Non-Motorized)
1) Preliminary Analysis of Canoe Launch Ramps – Agency Type
Agency Type
N of Agencies w/
Boat Launch
Ramps
Avg. N of Boat
Launch Ramps
Min. N of Boat
Launch Ramps
Max. N of Boat
Launch Ramps
County 13 3.2 1 9a
City/Village 24 1.4 1 3
Park District 53 1.8 1 15b
City/Village + Park
District 77 1.7 1 15
Note. Agencies that did not report data or reported 0 were excluded.
a. Forest Preserve District of Cook County
b. Chicago Park District
0
2
4
6
8
10
12
14
16
1 2 3 4 & above
15
10
2 2
14
10
2
6
Nu
mb
er o
f A
gen
cies
Boat Launch Ramps
Number of Agencies By Number of Boat Launch Ramps
City/Village
Park District
30
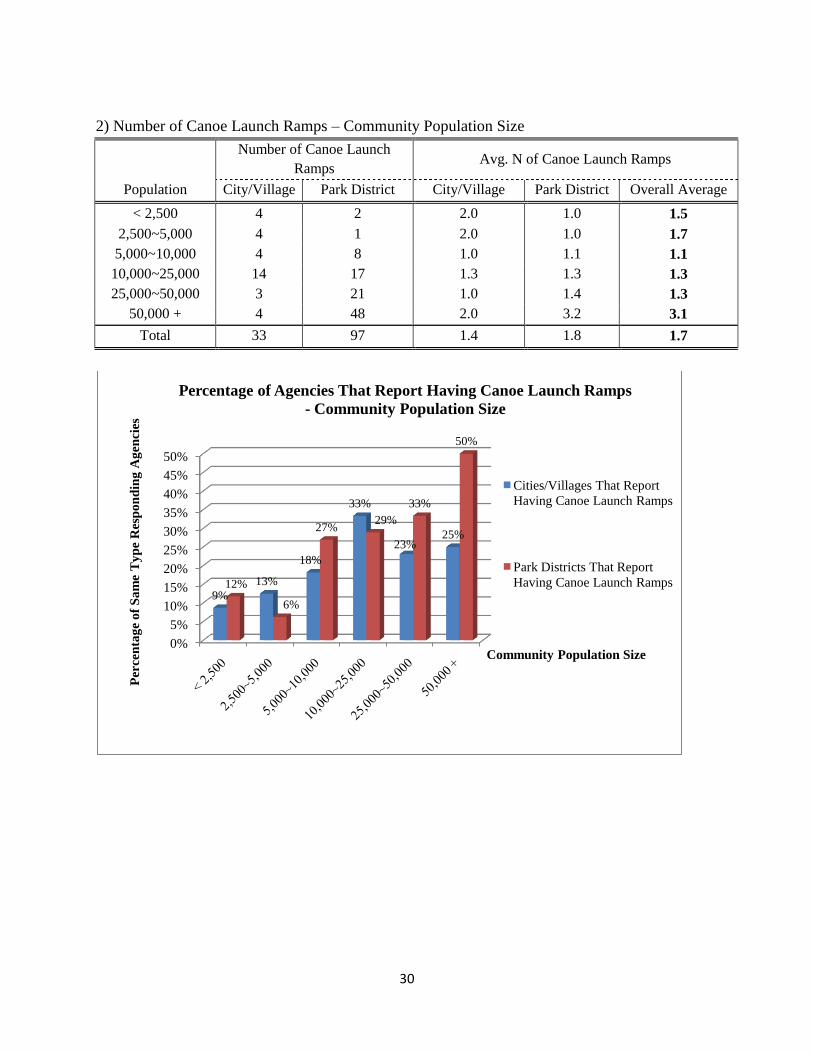
2) Number of Canoe Launch Ramps – Community Population Size
Number of Canoe Launch
Ramps Avg. N of Canoe Launch Ramps
Population City/Village Park District City/Village Park District Overall Average
< 2,500 4 2 2.0 1.0 1.5
2,500~5,000 4 1 2.0 1.0 1.7
5,000~10,000 4 8 1.0 1.1 1.1
10,000~25,000 14 17 1.3 1.3 1.3
25,000~50,000 3 21 1.0 1.4 1.3
50,000 + 4 48 2.0 3.2 3.1
Total 33 97 1.4 1.8 1.7
0%
5%
10%
15%
20%
25%
30%
35%
40%
45%
50%
9%
13%
18%
33%
23%25%
12%
6%
27%29%
33%
50%
Per
cen
tag
e o
f S
am
e T
yp
e R
esp
on
din
g A
gen
cies
Community Population Size
Percentage of Agencies That Report Having Canoe Launch Ramps
- Community Population Size
Cities/Villages That Report
Having Canoe Launch Ramps
Park Districts That Report
Having Canoe Launch Ramps
31
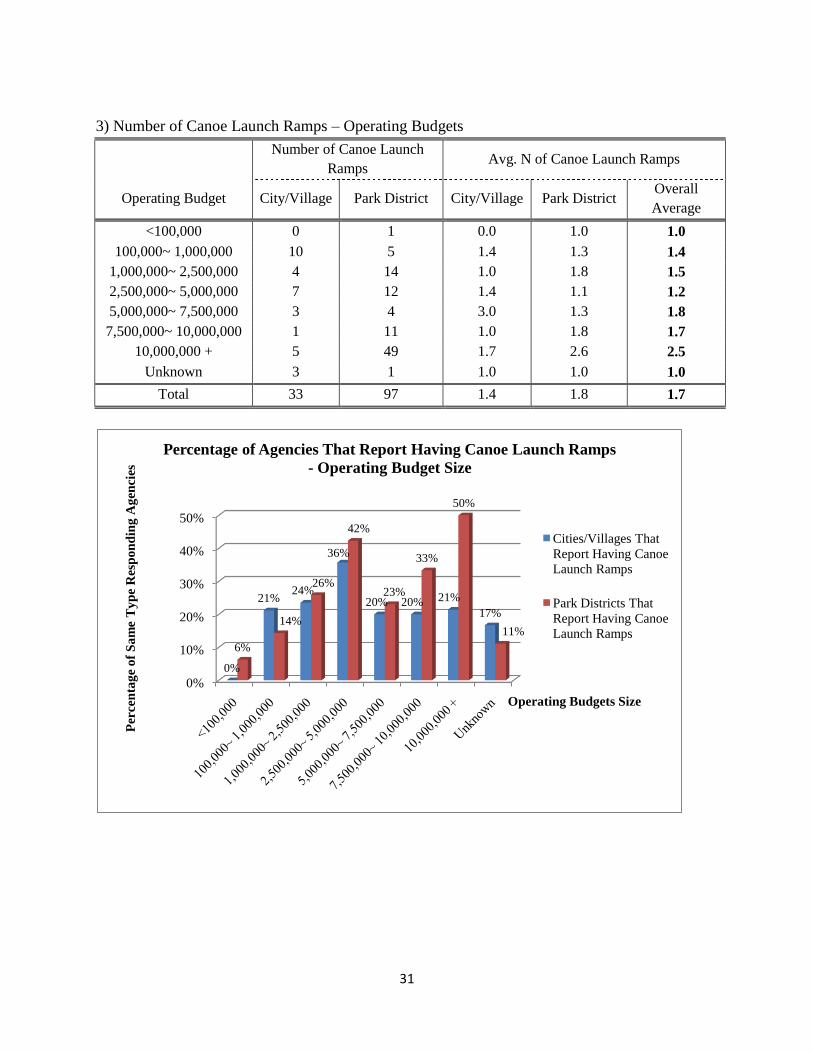
3) Number of Canoe Launch Ramps – Operating Budgets
Number of Canoe Launch
Ramps Avg. N of Canoe Launch Ramps
Operating Budget City/Village Park District City/Village Park District Overall
Average
<100,000 0 1 0.0 1.0 1.0
100,000~ 1,000,000 10 5 1.4 1.3 1.4
1,000,000~ 2,500,000 4 14 1.0 1.8 1.5
2,500,000~ 5,000,000 7 12 1.4 1.1 1.2
5,000,000~ 7,500,000 3 4 3.0 1.3 1.8
7,500,000~ 10,000,000 1 11 1.0 1.8 1.7
10,000,000 + 5 49 1.7 2.6 2.5
Unknown 3 1 1.0 1.0 1.0
Total 33 97 1.4 1.8 1.7
0%
10%
20%
30%
40%
50%
0%
21%24%
36%
20% 20% 21%
17%
6%
14%
26%
42%
23%
33%
50%
11%
Per
cen
tag
e o
f S
am
e T
yp
e R
esp
on
din
g A
gen
cies
Operating Budgets Size
Percentage of Agencies That Report Having Canoe Launch Ramps
- Operating Budget Size
Cities/Villages That
Report Having Canoe
Launch Ramps
Park Districts That
Report Having Canoe
Launch Ramps
32
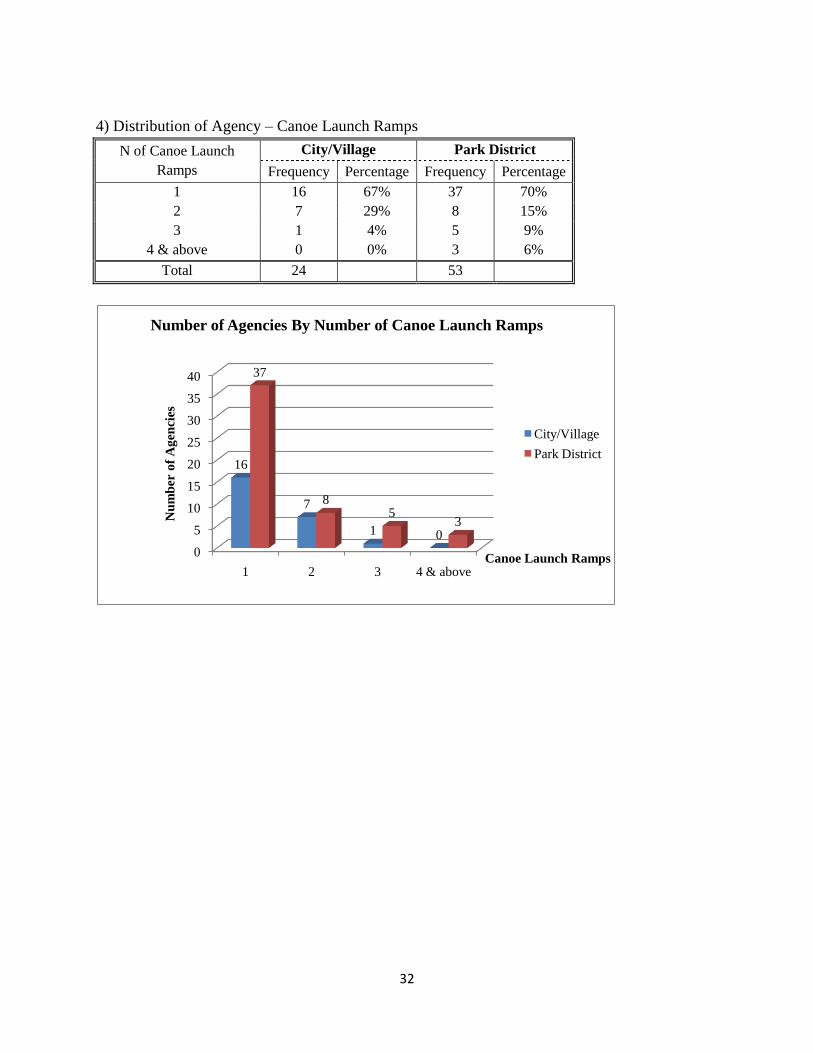
4) Distribution of Agency – Canoe Launch Ramps
N of Canoe Launch
Ramps
City/Village Park District
Frequency Percentage Frequency Percentage
1 16 67% 37 70%
2 7 29% 8 15%
3 1 4% 5 9%
4 & above 0 0% 3 6%
Total 24 53
0
5
10
15
20
25
30
35
40
1 2 3 4 & above
16
7
1 0
37
85
3Nu
mb
er o
f A
gen
cies
Canoe Launch Ramps
Number of Agencies By Number of Canoe Launch Ramps
City/Village
Park District
33
VI. Trails
-
200.00
400.00
600.00
800.00
1,000.00
1,200.00
Trails in Parks Trails Outside Park
Boundaries
City Department 347.04 567.15
Park District 1,008.51 956.18
County 1164.05 6.5
Mil
es
Miles of Trails
34
-
100.00
200.00
300.00
400.00
500.00
600.00
700.00
800.00
900.00
1,000.00
Bike Trail, Paved Surface
Bike Trail, Crushed
Limestone Surface
On-Road Bike Trail
Mountain Bike Trail, Natural
Surface
City Department 308.11 92.25 191.85 31.50
Park District 957.75 168.88 190.39 16.50
County 274.53 433.9 8.15 202
Mil
es
Miles of Bike Trails
-
100.00
200.00
300.00
400.00
500.00
600.00
700.00
800.00
900.00
Walking Path, Natural or
Paved Surface
Interpretive Trails, Natural
or Paved
Surface
Hiking Trails, Natural Surface
Equestrian Trails
Snowmobile Trails
City Department 443.53 76.44 127.50 46.00 14.15
Park District 851.86 123.61 253.32 100.90 145.00
County 788.6 223.35 858.4 432.9 83.5
Mil
es
Miles of VariousTrail Types
35
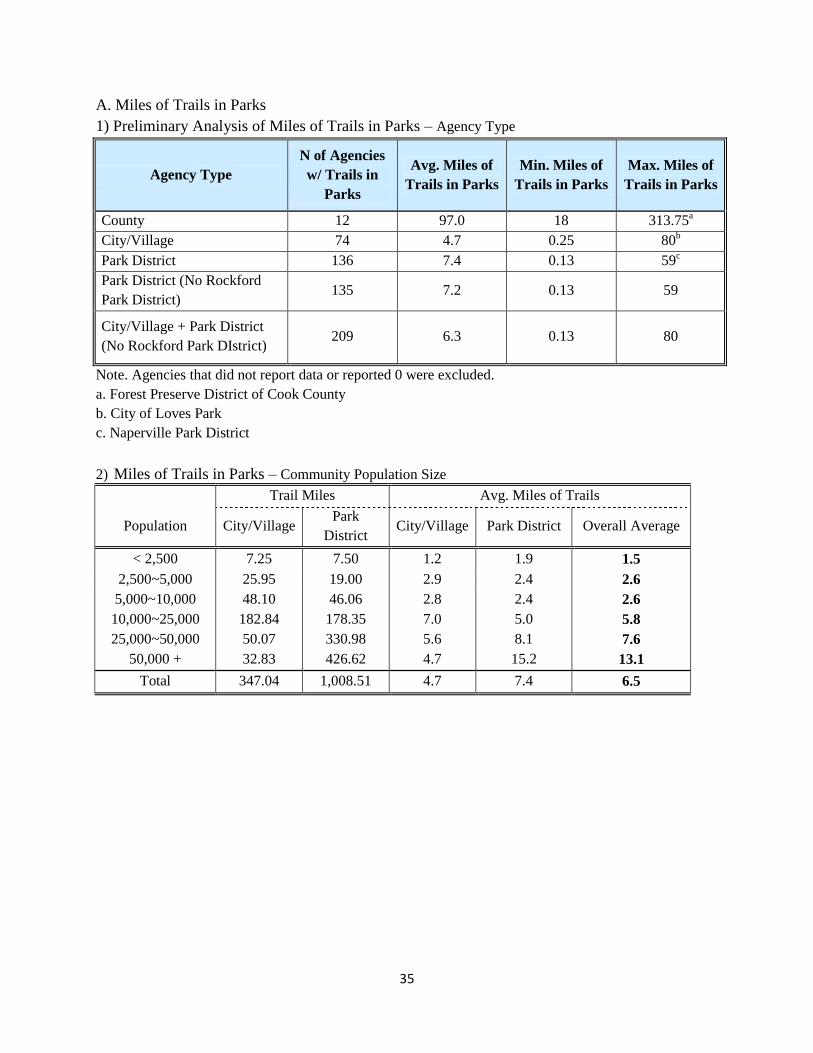
A. Miles of Trails in Parks
1) Preliminary Analysis of Miles of Trails in Parks – Agency Type
Agency Type
N of Agencies
w/ Trails in
Parks
Avg. Miles of
Trails in Parks
Min. Miles of
Trails in Parks
Max. Miles of
Trails in Parks
County 12 97.0 18 313.75a
City/Village 74 4.7 0.25 80b
Park District 136 7.4 0.13 59c
Park District (No Rockford
Park District) 135 7.2 0.13 59
City/Village + Park District
(No Rockford Park DIstrict) 209 6.3 0.13 80
Note. Agencies that did not report data or reported 0 were excluded.
a. Forest Preserve District of Cook County
b. City of Loves Park
c. Naperville Park District
2) Miles of Trails in Parks – Community Population Size
Trail Miles Avg. Miles of Trails
Population City/Village Park
District City/Village Park District Overall Average
< 2,500 7.25 7.50 1.2 1.9 1.5
2,500~5,000 25.95 19.00 2.9 2.4 2.6
5,000~10,000 48.10 46.06 2.8 2.4 2.6
10,000~25,000 182.84 178.35 7.0 5.0 5.8
25,000~50,000 50.07 330.98 5.6 8.1 7.6
50,000 + 32.83 426.62 4.7 15.2 13.1
Total 347.04 1,008.51 4.7 7.4 6.5
36
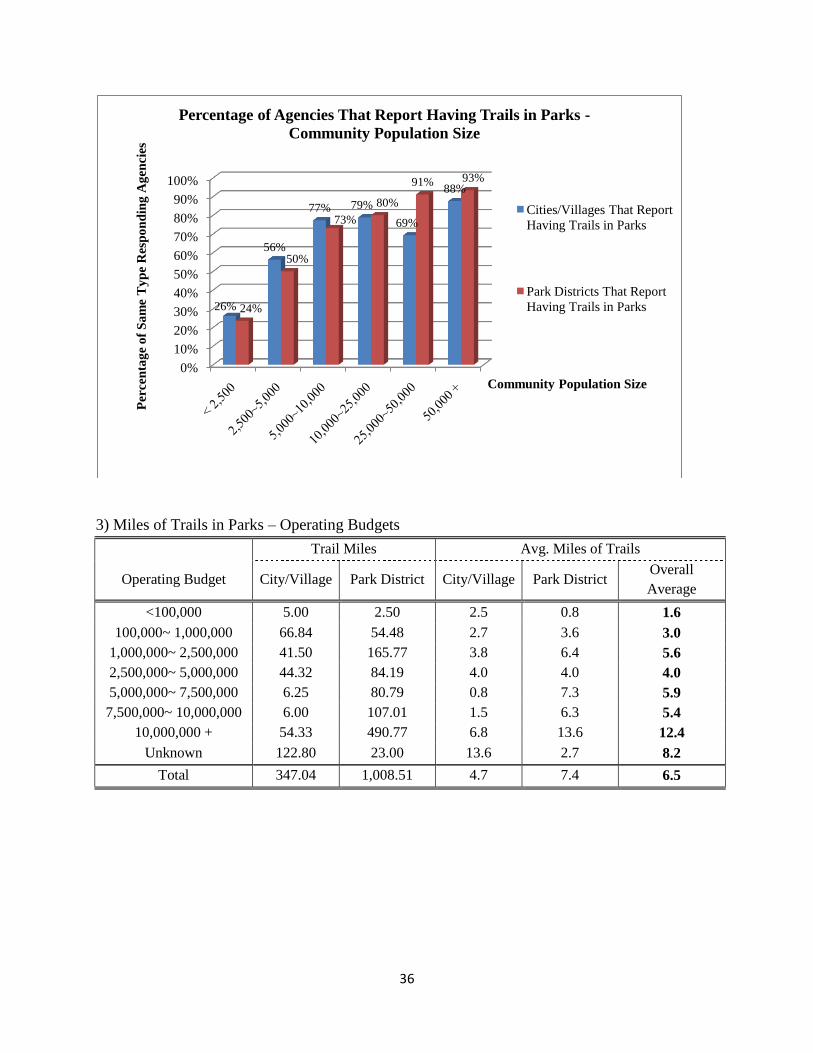
3) Miles of Trails in Parks – Operating Budgets
Trail Miles Avg. Miles of Trails
Operating Budget City/Village Park District City/Village Park District Overall
Average
<100,000 5.00 2.50 2.5 0.8 1.6
100,000~ 1,000,000 66.84 54.48 2.7 3.6 3.0
1,000,000~ 2,500,000 41.50 165.77 3.8 6.4 5.6
2,500,000~ 5,000,000 44.32 84.19 4.0 4.0 4.0
5,000,000~ 7,500,000 6.25 80.79 0.8 7.3 5.9
7,500,000~ 10,000,000 6.00 107.01 1.5 6.3 5.4
10,000,000 + 54.33 490.77 6.8 13.6 12.4
Unknown 122.80 23.00 13.6 2.7 8.2
Total 347.04 1,008.51 4.7 7.4 6.5
0%
10%
20%
30%
40%
50%
60%
70%
80%
90%
100%
26%
56%
77% 79%
69%
88%
24%
50%
73%
80%
91% 93%
Per
cen
tag
e o
f S
am
e T
yp
e R
esp
on
din
g A
gen
cies
Community Population Size
Percentage of Agencies That Report Having Trails in Parks -
Community Population Size
Cities/Villages That Report
Having Trails in Parks
Park Districts That Report
Having Trails in Parks
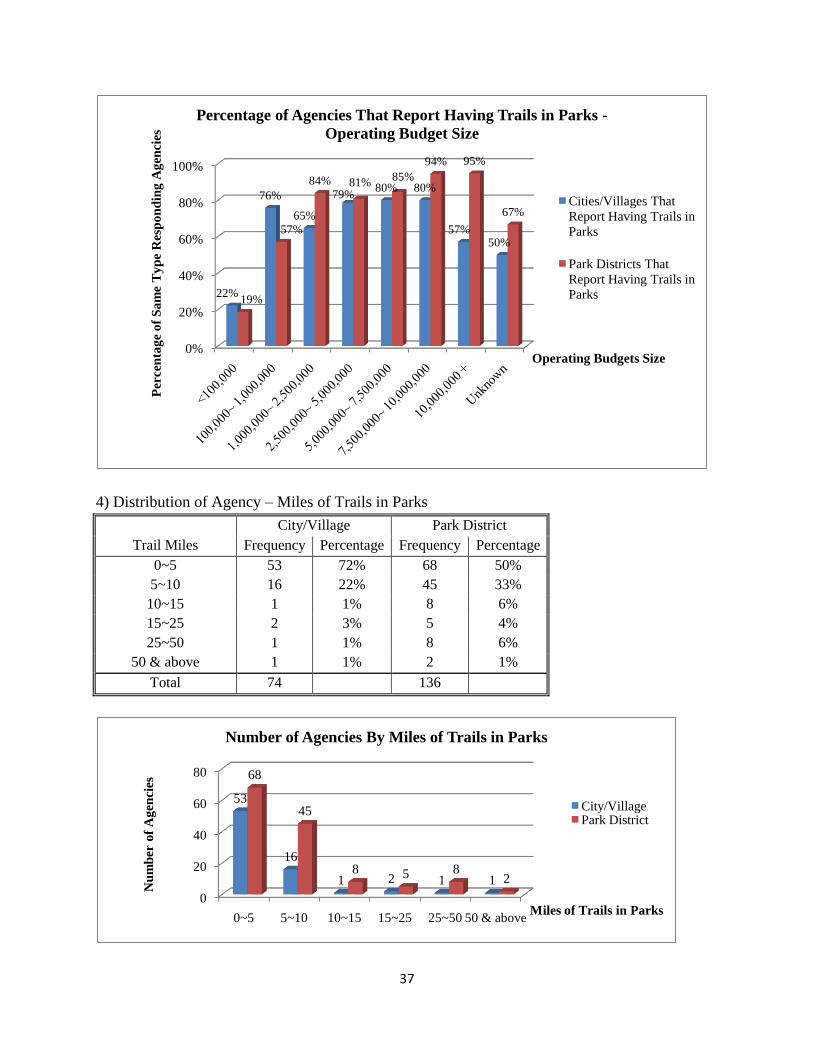
37
4) Distribution of Agency – Miles of Trails in Parks
City/Village Park District
Trail Miles Frequency Percentage Frequency Percentage
0~5 53 72% 68 50%
5~10 16 22% 45 33%
10~15 1 1% 8 6%
15~25 2 3% 5 4%
25~50 1 1% 8 6%
50 & above 1 1% 2 1%
Total 74 136
0%
20%
40%
60%
80%
100%
22%
76%
65%
79%80% 80%
57%50%
19%
57%
84% 81%85%
94% 95%
67%
Per
cen
tag
e o
f S
am
e T
yp
e R
esp
on
din
g A
gen
cies
Operating Budgets Size
Percentage of Agencies That Report Having Trails in Parks -
Operating Budget Size
Cities/Villages That
Report Having Trails in
Parks
Park Districts That
Report Having Trails in
Parks
0
20
40
60
80
0~5 5~10 10~15 15~25 25~50 50 & above
53
16
1 2 1 1
68
45
8 5 82
Nu
mb
er o
f A
gen
cies
Miles of Trails in Parks
Number of Agencies By Miles of Trails in Parks
City/VillagePark District
38
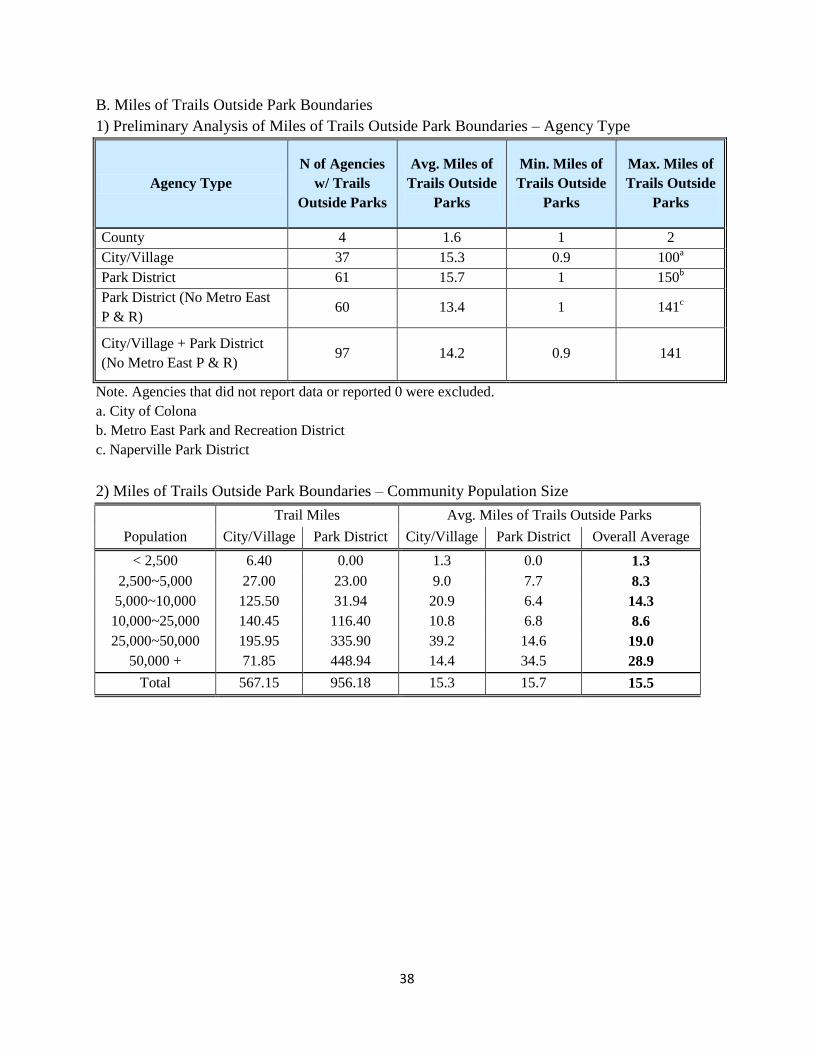
B. Miles of Trails Outside Park Boundaries
1) Preliminary Analysis of Miles of Trails Outside Park Boundaries – Agency Type
Agency Type
N of Agencies
w/ Trails
Outside Parks
Avg. Miles of
Trails Outside
Parks
Min. Miles of
Trails Outside
Parks
Max. Miles of
Trails Outside
Parks
County 4 1.6 1 2
City/Village 37 15.3 0.9 100a
Park District 61 15.7 1 150b
Park District (No Metro East
P & R) 60 13.4 1 141
c
City/Village + Park District
(No Metro East P & R) 97 14.2 0.9 141
Note. Agencies that did not report data or reported 0 were excluded.
a. City of Colona
b. Metro East Park and Recreation District
c. Naperville Park District
2) Miles of Trails Outside Park Boundaries – Community Population Size
Trail Miles Avg. Miles of Trails Outside Parks
Population City/Village Park District City/Village Park District Overall Average
< 2,500 6.40 0.00 1.3 0.0 1.3
2,500~5,000 27.00 23.00 9.0 7.7 8.3
5,000~10,000 125.50 31.94 20.9 6.4 14.3
10,000~25,000 140.45 116.40 10.8 6.8 8.6
25,000~50,000 195.95 335.90 39.2 14.6 19.0
50,000 + 71.85 448.94 14.4 34.5 28.9
Total 567.15 956.18 15.3 15.7 15.5
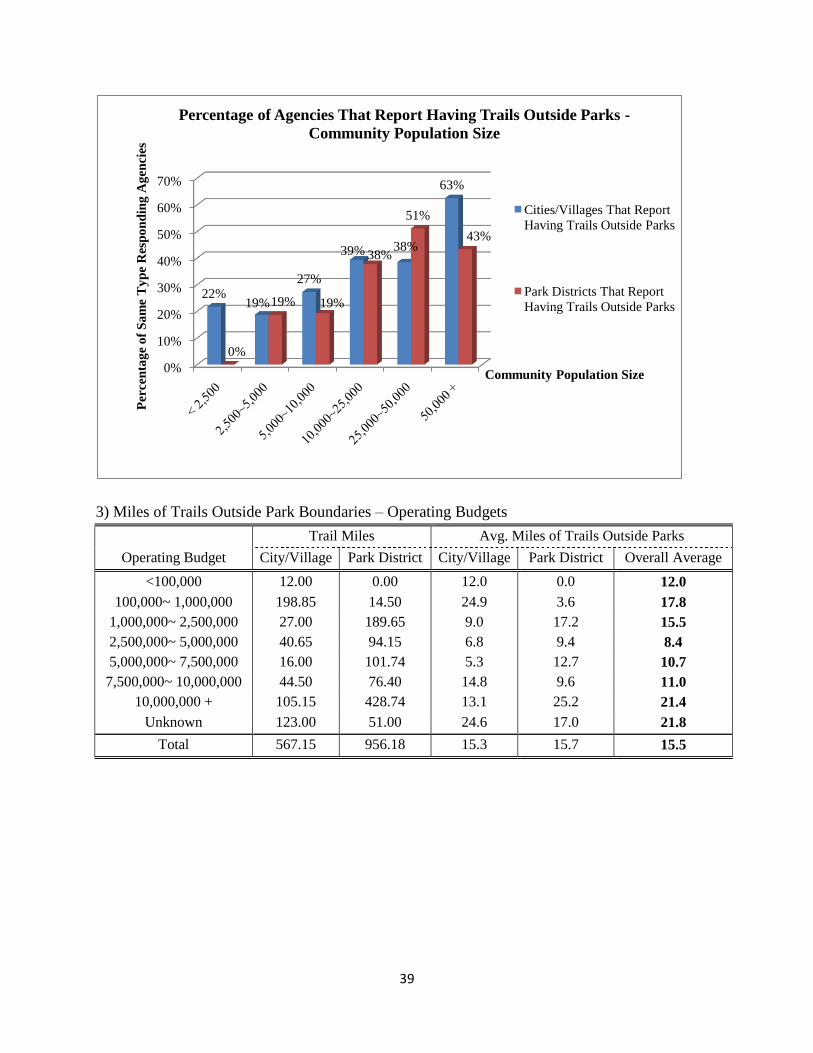
39
3) Miles of Trails Outside Park Boundaries – Operating Budgets
Trail Miles Avg. Miles of Trails Outside Parks
Operating Budget City/Village Park District City/Village Park District Overall Average
<100,000 12.00 0.00 12.0 0.0 12.0
100,000~ 1,000,000 198.85 14.50 24.9 3.6 17.8
1,000,000~ 2,500,000 27.00 189.65 9.0 17.2 15.5
2,500,000~ 5,000,000 40.65 94.15 6.8 9.4 8.4
5,000,000~ 7,500,000 16.00 101.74 5.3 12.7 10.7
7,500,000~ 10,000,000 44.50 76.40 14.8 9.6 11.0
10,000,000 + 105.15 428.74 13.1 25.2 21.4
Unknown 123.00 51.00 24.6 17.0 21.8
Total 567.15 956.18 15.3 15.7 15.5
0%
10%
20%
30%
40%
50%
60%
70%
22%19%
27%
39% 38%
63%
0%
19% 19%
38%
51%
43%
Per
cen
tag
e o
f S
am
e T
yp
e R
esp
on
din
g A
gen
cies
Community Population Size
Percentage of Agencies That Report Having Trails Outside Parks -
Community Population Size
Cities/Villages That Report
Having Trails Outside Parks
Park Districts That Report
Having Trails Outside Parks
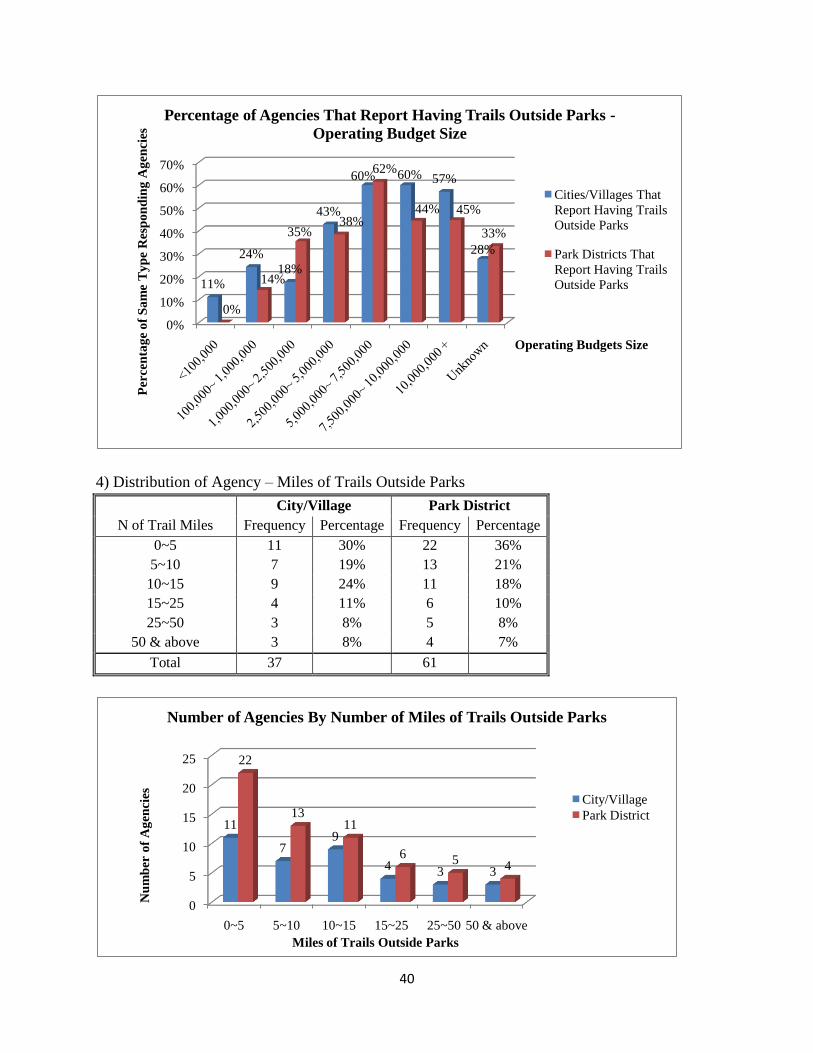
40
4) Distribution of Agency – Miles of Trails Outside Parks
City/Village Park District
N of Trail Miles Frequency Percentage Frequency Percentage
0~5 11 30% 22 36%
5~10 7 19% 13 21%
10~15 9 24% 11 18%
15~25 4 11% 6 10%
25~50 3 8% 5 8%
50 & above 3 8% 4 7%
Total 37 61
0%
10%
20%
30%
40%
50%
60%
70%
11%
24%
18%
43%
60% 60% 57%
28%
0%
14%
35%38%
62%
44% 45%
33%
Per
cen
tag
e o
f S
am
e T
yp
e R
esp
on
din
g A
gen
cies
Operating Budgets Size
Percentage of Agencies That Report Having Trails Outside Parks -
Operating Budget Size
Cities/Villages That
Report Having Trails
Outside Parks
Park Districts That
Report Having Trails
Outside Parks
0
5
10
15
20
25
0~5 5~10 10~15 15~25 25~50 50 & above
11
79
4 3 3
22
1311
6 5 4
Nu
mb
er o
f A
gen
cies
Miles of Trails Outside Parks
Number of Agencies By Number of Miles of Trails Outside Parks
City/Village
Park District
41
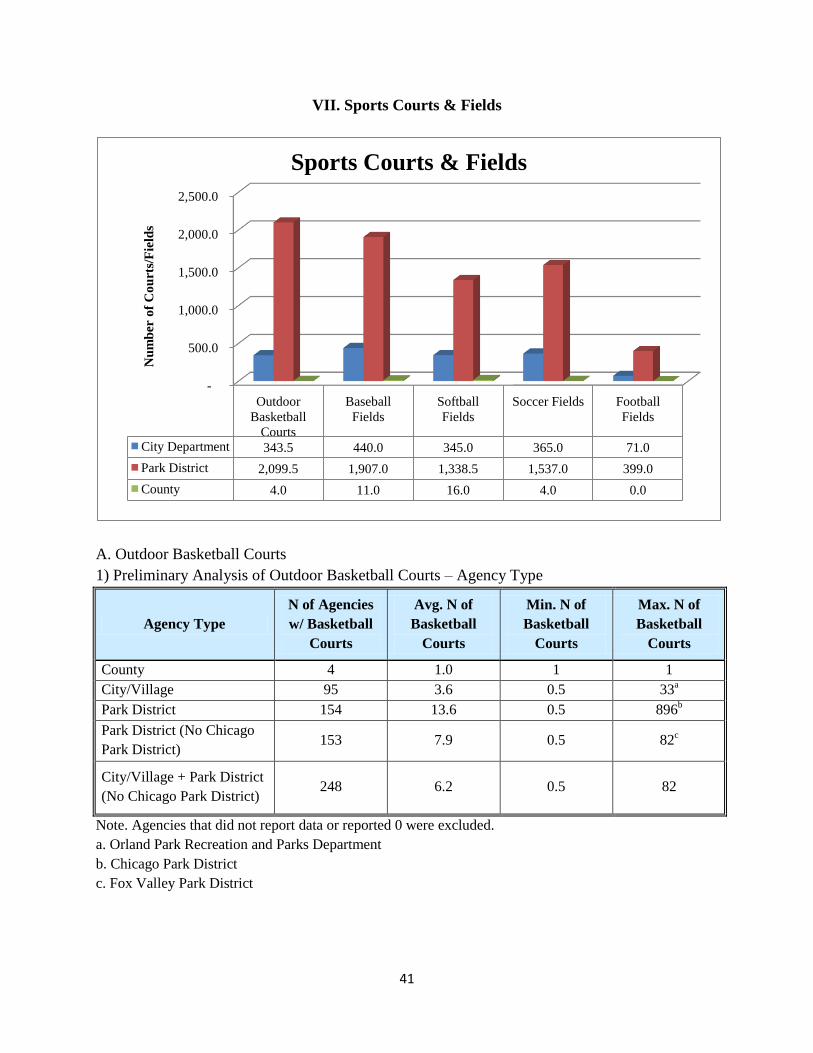
VII. Sports Courts & Fields
A. Outdoor Basketball Courts
1) Preliminary Analysis of Outdoor Basketball Courts – Agency Type
Agency Type
N of Agencies
w/ Basketball
Courts
Avg. N of
Basketball
Courts
Min. N of
Basketball
Courts
Max. N of
Basketball
Courts
County 4 1.0 1 1
City/Village 95 3.6 0.5 33a
Park District 154 13.6 0.5 896b
Park District (No Chicago
Park District) 153 7.9 0.5 82
c
City/Village + Park District
(No Chicago Park District) 248 6.2 0.5 82
Note. Agencies that did not report data or reported 0 were excluded.
a. Orland Park Recreation and Parks Department
b. Chicago Park District
c. Fox Valley Park District
-
500.0
1,000.0
1,500.0
2,000.0
2,500.0
Outdoor
Basketball
Courts
Baseball
Fields
Softball
Fields
Soccer Fields Football
Fields
City Department 343.5 440.0 345.0 365.0 71.0
Park District 2,099.5 1,907.0 1,338.5 1,537.0 399.0
County 4.0 11.0 16.0 4.0 0.0
Nu
mb
er o
f C
ou
rts/
Fie
lds
Sports Courts & Fields
42
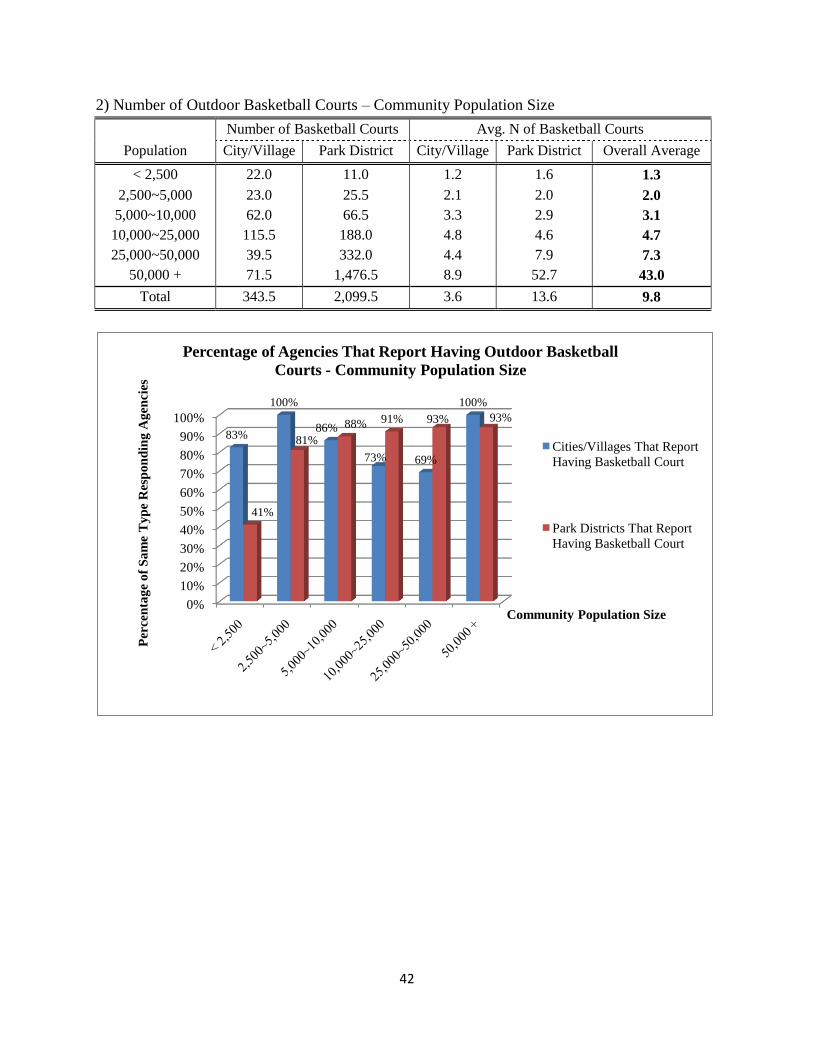
2) Number of Outdoor Basketball Courts – Community Population Size
Number of Basketball Courts Avg. N of Basketball Courts
Population City/Village Park District City/Village Park District Overall Average
< 2,500 22.0 11.0 1.2 1.6 1.3
2,500~5,000 23.0 25.5 2.1 2.0 2.0
5,000~10,000 62.0 66.5 3.3 2.9 3.1
10,000~25,000 115.5 188.0 4.8 4.6 4.7
25,000~50,000 39.5 332.0 4.4 7.9 7.3
50,000 + 71.5 1,476.5 8.9 52.7 43.0
Total 343.5 2,099.5 3.6 13.6 9.8
0%
10%
20%
30%
40%
50%
60%
70%
80%
90%
100%
83%
100%
86%
73% 69%
100%
41%
81%
88% 91% 93% 93%
Per
cen
tag
e o
f S
am
e T
yp
e R
esp
on
din
g A
gen
cies
Community Population Size
Percentage of Agencies That Report Having Outdoor Basketball
Courts - Community Population Size
Cities/Villages That Report
Having Basketball Court
Park Districts That Report
Having Basketball Court
43
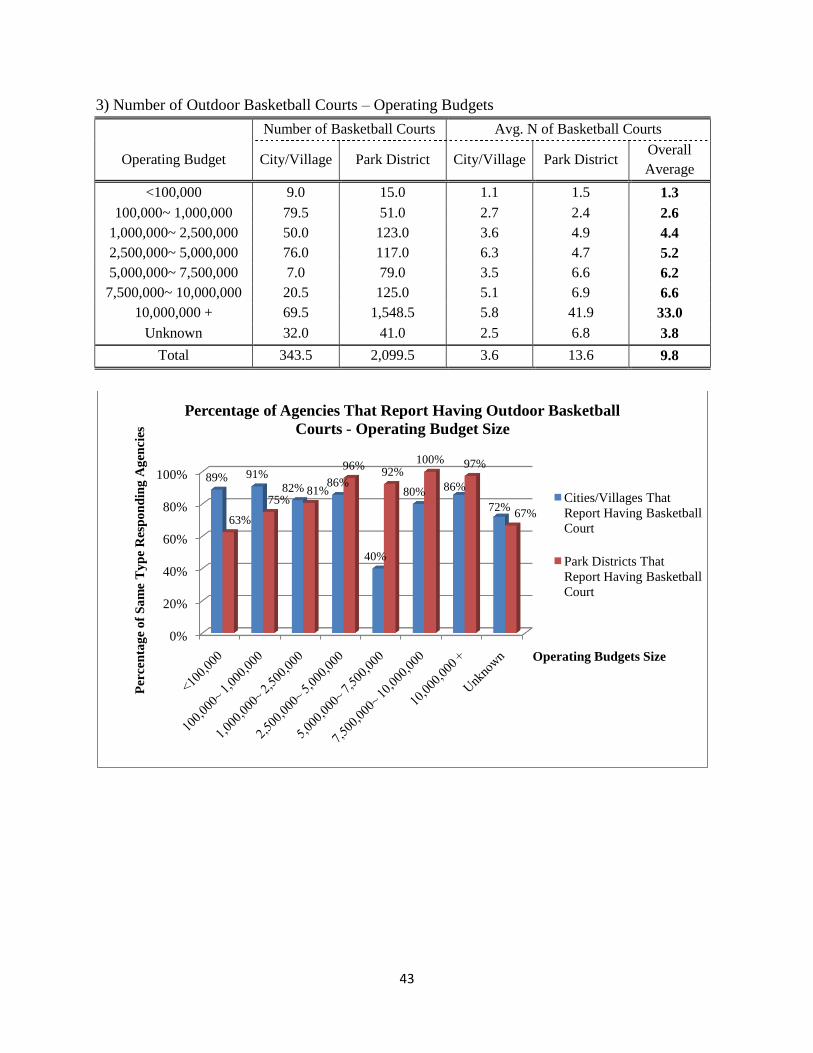
3) Number of Outdoor Basketball Courts – Operating Budgets
Number of Basketball Courts Avg. N of Basketball Courts
Operating Budget City/Village Park District City/Village Park District Overall
Average
<100,000 9.0 15.0 1.1 1.5 1.3
100,000~ 1,000,000 79.5 51.0 2.7 2.4 2.6
1,000,000~ 2,500,000 50.0 123.0 3.6 4.9 4.4
2,500,000~ 5,000,000 76.0 117.0 6.3 4.7 5.2
5,000,000~ 7,500,000 7.0 79.0 3.5 6.6 6.2
7,500,000~ 10,000,000 20.5 125.0 5.1 6.9 6.6
10,000,000 + 69.5 1,548.5 5.8 41.9 33.0
Unknown 32.0 41.0 2.5 6.8 3.8
Total 343.5 2,099.5 3.6 13.6 9.8
0%
20%
40%
60%
80%
100% 89% 91%
82% 86%
40%
80% 86%
72%63%
75%81%
96%92%
100% 97%
67%
Per
cen
tag
e o
f S
am
e T
yp
e R
esp
on
din
g A
gen
cies
Operating Budgets Size
Percentage of Agencies That Report Having Outdoor Basketball
Courts - Operating Budget Size
Cities/Villages That
Report Having Basketball
Court
Park Districts That
Report Having Basketball
Court
44
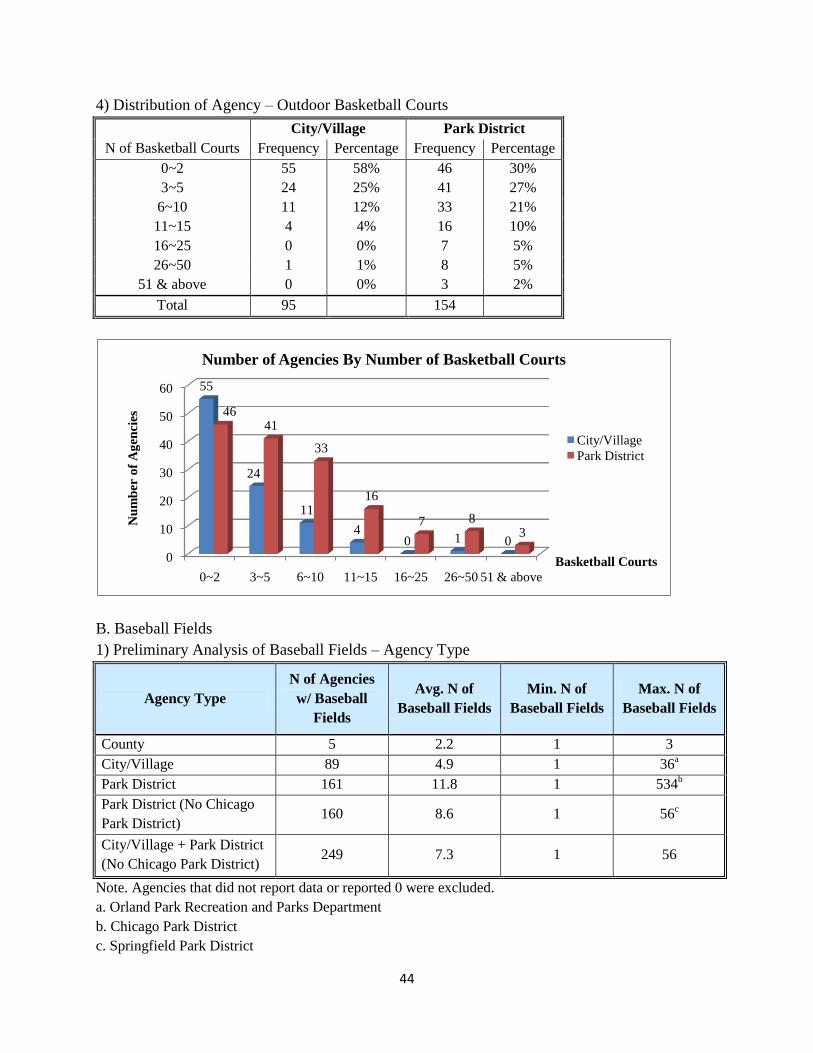
4) Distribution of Agency – Outdoor Basketball Courts
City/Village Park District
N of Basketball Courts Frequency Percentage Frequency Percentage
0~2 55 58% 46 30%
3~5 24 25% 41 27%
6~10 11 12% 33 21%
11~15 4 4% 16 10%
16~25 0 0% 7 5%
26~50 1 1% 8 5%
51 & above 0 0% 3 2%
Total 95 154
B. Baseball Fields
1) Preliminary Analysis of Baseball Fields – Agency Type
Agency Type
N of Agencies
w/ Baseball
Fields
Avg. N of
Baseball Fields
Min. N of
Baseball Fields
Max. N of
Baseball Fields
County 5 2.2 1 3
City/Village 89 4.9 1 36a
Park District 161 11.8 1 534b
Park District (No Chicago
Park District) 160 8.6 1 56
c
City/Village + Park District
(No Chicago Park District) 249 7.3 1 56
Note. Agencies that did not report data or reported 0 were excluded.
a. Orland Park Recreation and Parks Department
b. Chicago Park District
c. Springfield Park District
0
10
20
30
40
50
60
0~2 3~5 6~10 11~15 16~25 26~50 51 & above
55
24
11
40 1 0
4641
33
16
7 83
Nu
mb
er o
f A
gen
cies
Basketball Courts
Number of Agencies By Number of Basketball Courts
City/Village
Park District
45
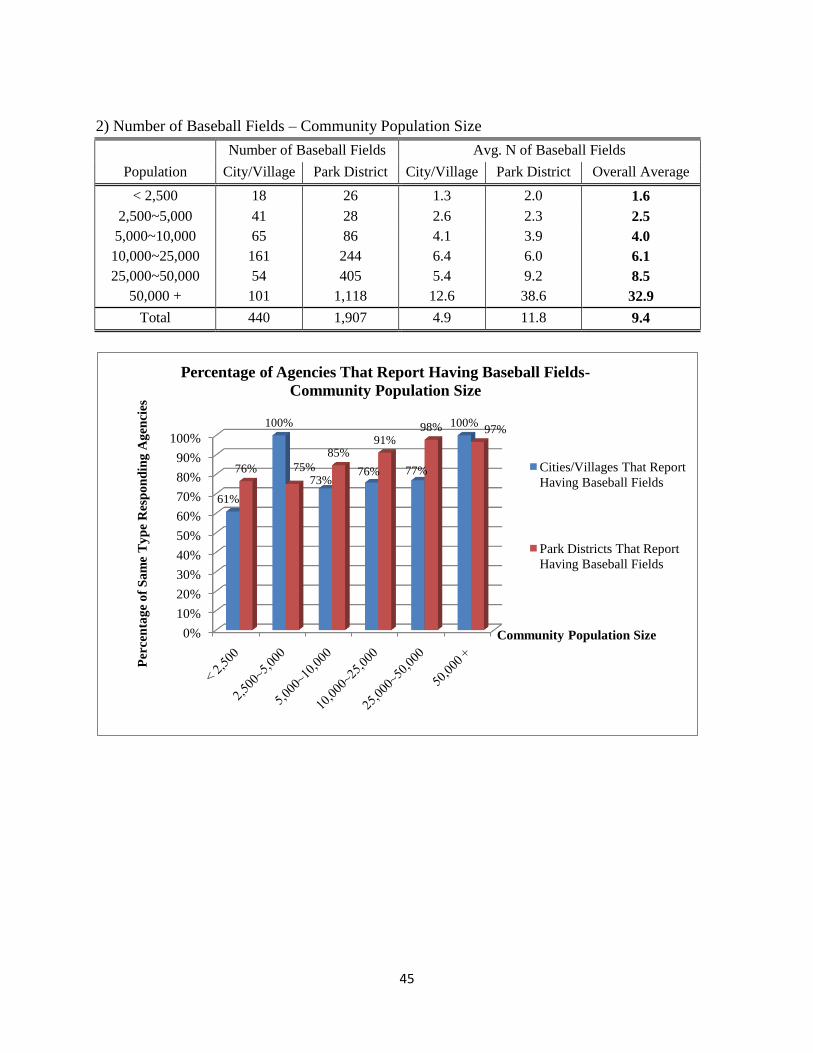
2) Number of Baseball Fields – Community Population Size
Number of Baseball Fields Avg. N of Baseball Fields
Population City/Village Park District City/Village Park District Overall Average
< 2,500 18 26 1.3 2.0 1.6
2,500~5,000 41 28 2.6 2.3 2.5
5,000~10,000 65 86 4.1 3.9 4.0
10,000~25,000 161 244 6.4 6.0 6.1
25,000~50,000 54 405 5.4 9.2 8.5
50,000 + 101 1,118 12.6 38.6 32.9
Total 440 1,907 4.9 11.8 9.4
0%
10%
20%
30%
40%
50%
60%
70%
80%
90%
100%
61%
100%
73%76% 77%
100%
76% 75%
85%91%
98% 97%
Per
cen
tag
e o
f S
am
e T
yp
e R
esp
on
din
g A
gen
cies
Community Population Size
Percentage of Agencies That Report Having Baseball Fields-
Community Population Size
Cities/Villages That Report
Having Baseball Fields
Park Districts That Report
Having Baseball Fields
46
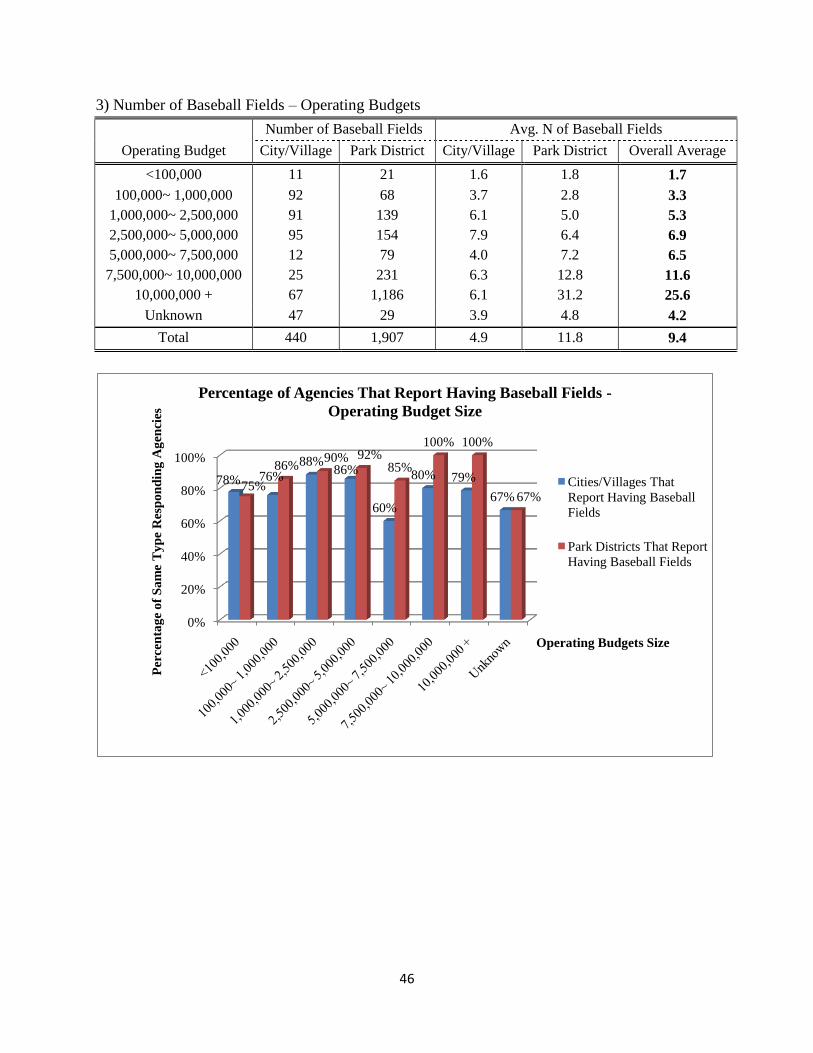
3) Number of Baseball Fields – Operating Budgets
Number of Baseball Fields Avg. N of Baseball Fields
Operating Budget City/Village Park District City/Village Park District Overall Average
<100,000 11 21 1.6 1.8 1.7
100,000~ 1,000,000 92 68 3.7 2.8 3.3
1,000,000~ 2,500,000 91 139 6.1 5.0 5.3
2,500,000~ 5,000,000 95 154 7.9 6.4 6.9
5,000,000~ 7,500,000 12 79 4.0 7.2 6.5
7,500,000~ 10,000,000 25 231 6.3 12.8 11.6
10,000,000 + 67 1,186 6.1 31.2 25.6
Unknown 47 29 3.9 4.8 4.2
Total 440 1,907 4.9 11.8 9.4
0%
20%
40%
60%
80%
100%
78% 76%88%
86%
60%
80% 79%
67%75%
86%90% 92%
85%
100% 100%
67%
Per
cen
tag
e o
f S
am
e T
yp
e R
esp
on
din
g A
gen
cies
Operating Budgets Size
Percentage of Agencies That Report Having Baseball Fields -
Operating Budget Size
Cities/Villages That
Report Having Baseball
Fields
Park Districts That Report
Having Baseball Fields
47
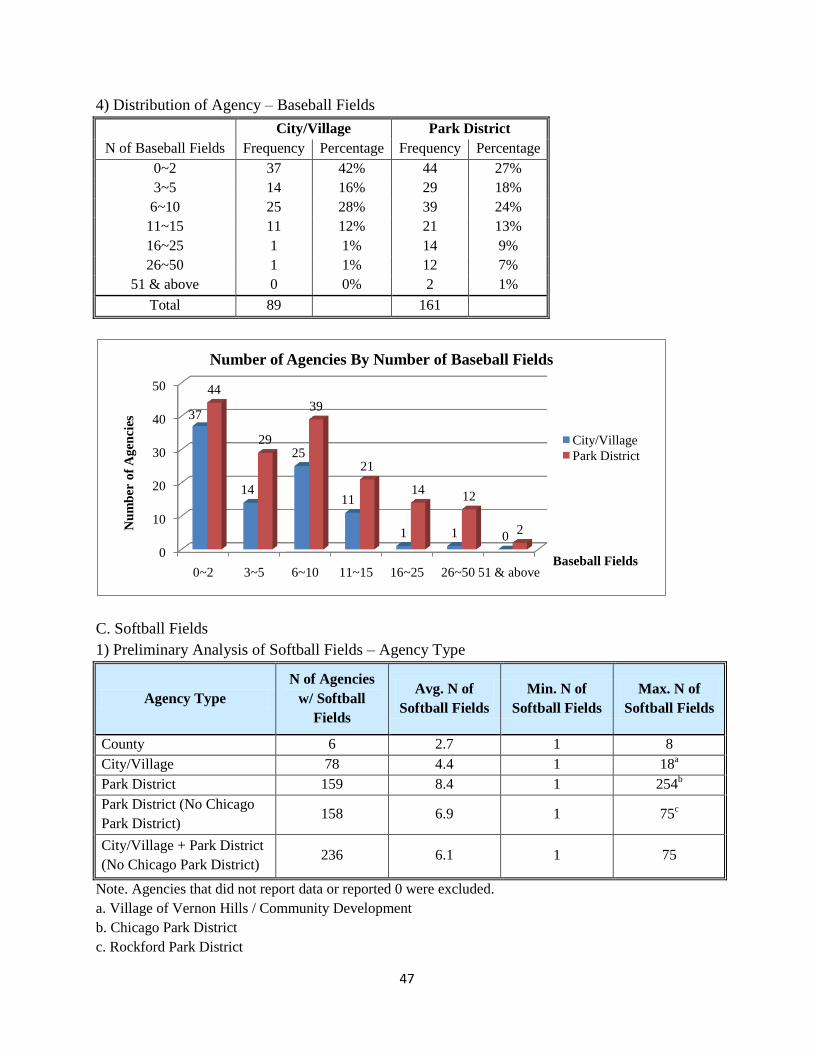
4) Distribution of Agency – Baseball Fields
City/Village Park District
N of Baseball Fields Frequency Percentage Frequency Percentage
0~2 37 42% 44 27%
3~5 14 16% 29 18%
6~10 25 28% 39 24%
11~15 11 12% 21 13%
16~25 1 1% 14 9%
26~50 1 1% 12 7%
51 & above 0 0% 2 1%
Total 89 161
C. Softball Fields
1) Preliminary Analysis of Softball Fields – Agency Type
Agency Type
N of Agencies
w/ Softball
Fields
Avg. N of
Softball Fields
Min. N of
Softball Fields
Max. N of
Softball Fields
County 6 2.7 1 8
City/Village 78 4.4 1 18a
Park District 159 8.4 1 254b
Park District (No Chicago
Park District) 158 6.9 1 75
c
City/Village + Park District
(No Chicago Park District) 236 6.1 1 75
Note. Agencies that did not report data or reported 0 were excluded.
a. Village of Vernon Hills / Community Development
b. Chicago Park District
c. Rockford Park District
0
10
20
30
40
50
0~2 3~5 6~10 11~15 16~25 26~50 51 & above
37
14
25
11
1 1 0
44
29
39
21
1412
2Nu
mb
er o
f A
gen
cies
Baseball Fields
Number of Agencies By Number of Baseball Fields
City/Village
Park District
48
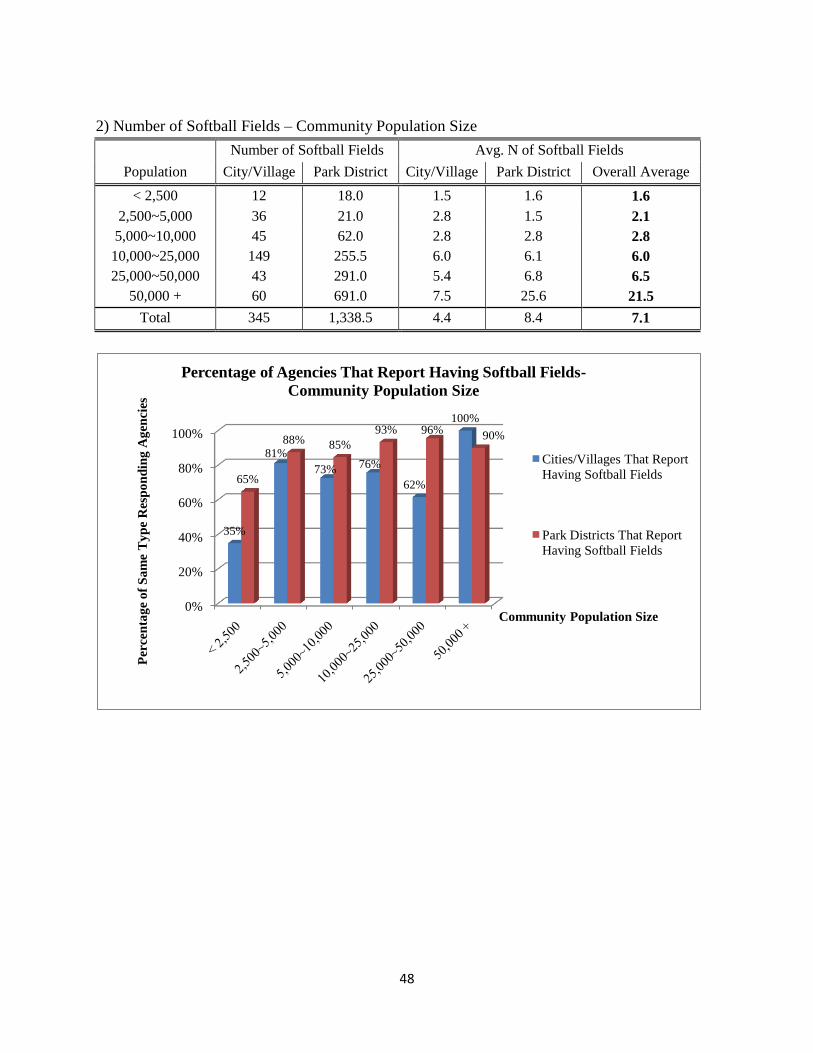
2) Number of Softball Fields – Community Population Size
Number of Softball Fields Avg. N of Softball Fields
Population City/Village Park District City/Village Park District Overall Average
< 2,500 12 18.0 1.5 1.6 1.6
2,500~5,000 36 21.0 2.8 1.5 2.1
5,000~10,000 45 62.0 2.8 2.8 2.8
10,000~25,000 149 255.5 6.0 6.1 6.0
25,000~50,000 43 291.0 5.4 6.8 6.5
50,000 + 60 691.0 7.5 25.6 21.5
Total 345 1,338.5 4.4 8.4 7.1
0%
20%
40%
60%
80%
100%
35%
81%
73% 76%
62%
100%
65%
88% 85%
93% 96%90%
Per
cen
tag
e o
f S
am
e T
yp
e R
esp
on
din
g A
gen
cies
Community Population Size
Percentage of Agencies That Report Having Softball Fields-
Community Population Size
Cities/Villages That Report
Having Softball Fields
Park Districts That Report
Having Softball Fields
49
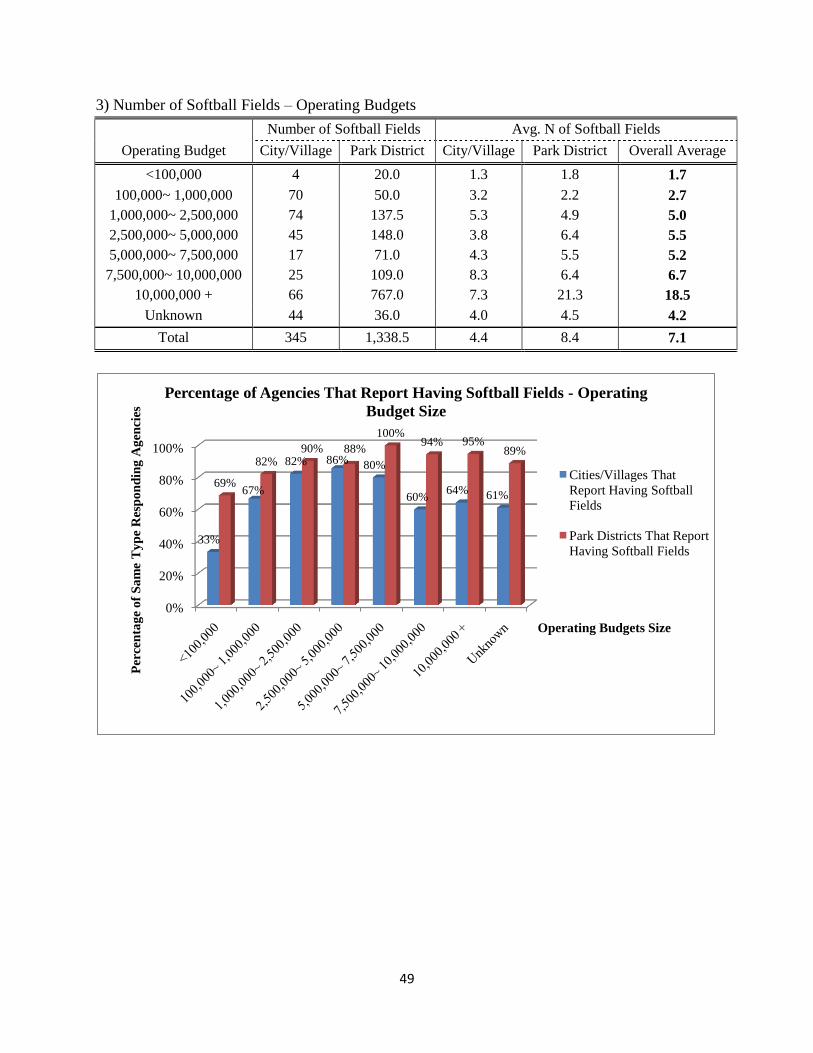
3) Number of Softball Fields – Operating Budgets
Number of Softball Fields Avg. N of Softball Fields
Operating Budget City/Village Park District City/Village Park District Overall Average
<100,000 4 20.0 1.3 1.8 1.7
100,000~ 1,000,000 70 50.0 3.2 2.2 2.7
1,000,000~ 2,500,000 74 137.5 5.3 4.9 5.0
2,500,000~ 5,000,000 45 148.0 3.8 6.4 5.5
5,000,000~ 7,500,000 17 71.0 4.3 5.5 5.2
7,500,000~ 10,000,000 25 109.0 8.3 6.4 6.7
10,000,000 + 66 767.0 7.3 21.3 18.5
Unknown 44 36.0 4.0 4.5 4.2
Total 345 1,338.5 4.4 8.4 7.1
0%
20%
40%
60%
80%
100%
33%
67%
82% 86% 80%
60%64% 61%
69%
82%90% 88%
100%94% 95%
89%
Per
cen
tag
e o
f S
am
e T
yp
e R
esp
on
din
g A
gen
cies
Operating Budgets Size
Percentage of Agencies That Report Having Softball Fields - Operating
Budget Size
Cities/Villages That
Report Having Softball
Fields
Park Districts That Report
Having Softball Fields
50
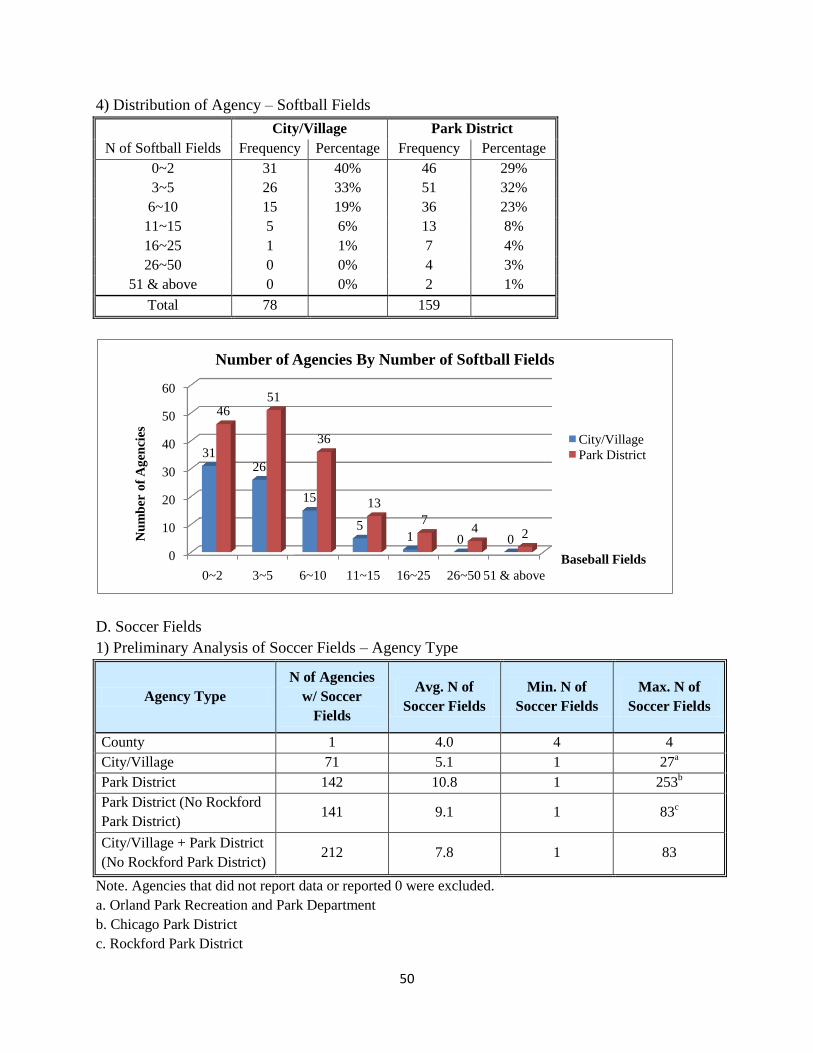
4) Distribution of Agency – Softball Fields
City/Village Park District
N of Softball Fields Frequency Percentage Frequency Percentage
0~2 31 40% 46 29%
3~5 26 33% 51 32%
6~10 15 19% 36 23%
11~15 5 6% 13 8%
16~25 1 1% 7 4%
26~50 0 0% 4 3%
51 & above 0 0% 2 1%
Total 78 159
D. Soccer Fields
1) Preliminary Analysis of Soccer Fields – Agency Type
Agency Type
N of Agencies
w/ Soccer
Fields
Avg. N of
Soccer Fields
Min. N of
Soccer Fields
Max. N of
Soccer Fields
County 1 4.0 4 4
City/Village 71 5.1 1 27a
Park District 142 10.8 1 253b
Park District (No Rockford
Park District) 141 9.1 1 83
c
City/Village + Park District
(No Rockford Park District) 212 7.8 1 83
Note. Agencies that did not report data or reported 0 were excluded.
a. Orland Park Recreation and Park Department
b. Chicago Park District
c. Rockford Park District
0
10
20
30
40
50
60
0~2 3~5 6~10 11~15 16~25 26~50 51 & above
3126
15
51 0 0
4651
36
13
74 2N
um
ber
of
Ag
enci
es
Baseball Fields
Number of Agencies By Number of Softball Fields
City/Village
Park District
51
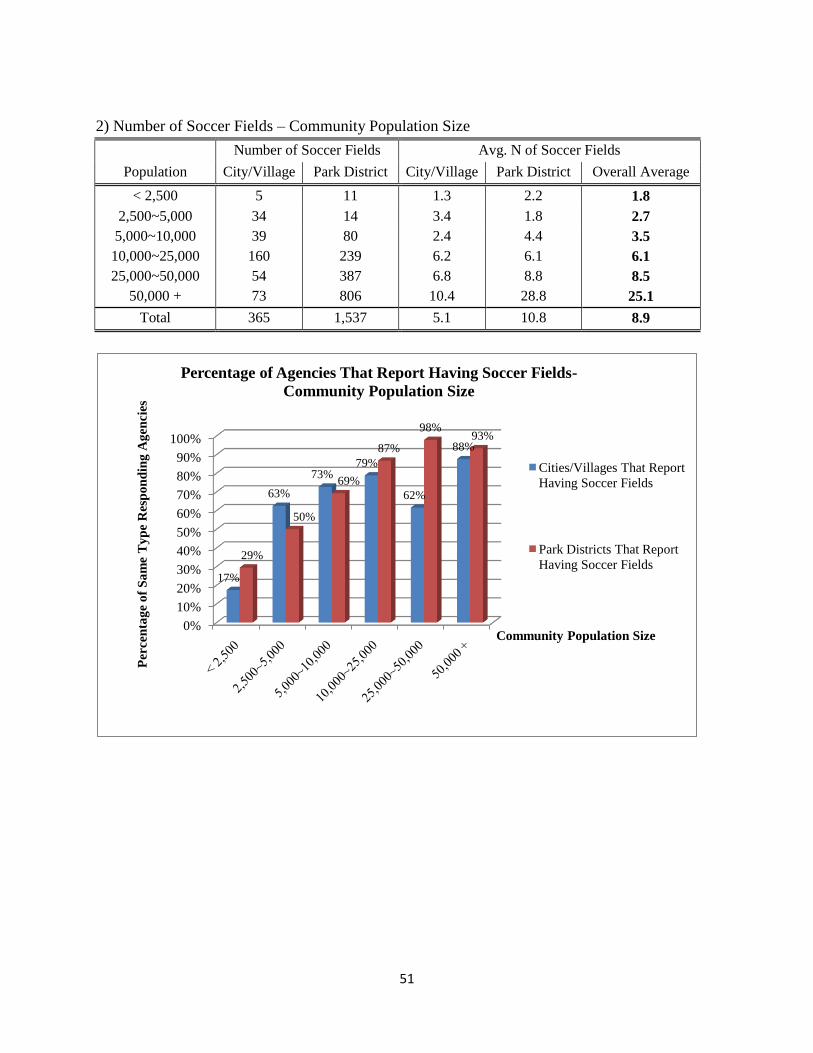
2) Number of Soccer Fields – Community Population Size
Number of Soccer Fields Avg. N of Soccer Fields
Population City/Village Park District City/Village Park District Overall Average
< 2,500 5 11 1.3 2.2 1.8
2,500~5,000 34 14 3.4 1.8 2.7
5,000~10,000 39 80 2.4 4.4 3.5
10,000~25,000 160 239 6.2 6.1 6.1
25,000~50,000 54 387 6.8 8.8 8.5
50,000 + 73 806 10.4 28.8 25.1
Total 365 1,537 5.1 10.8 8.9
0%
10%
20%
30%
40%
50%
60%
70%
80%
90%
100%
17%
63%
73%79%
62%
88%
29%
50%
69%
87%
98%93%
Per
cen
tag
e o
f S
am
e T
yp
e R
esp
on
din
g A
gen
cies
Community Population Size
Percentage of Agencies That Report Having Soccer Fields-
Community Population Size
Cities/Villages That Report
Having Soccer Fields
Park Districts That Report
Having Soccer Fields
52
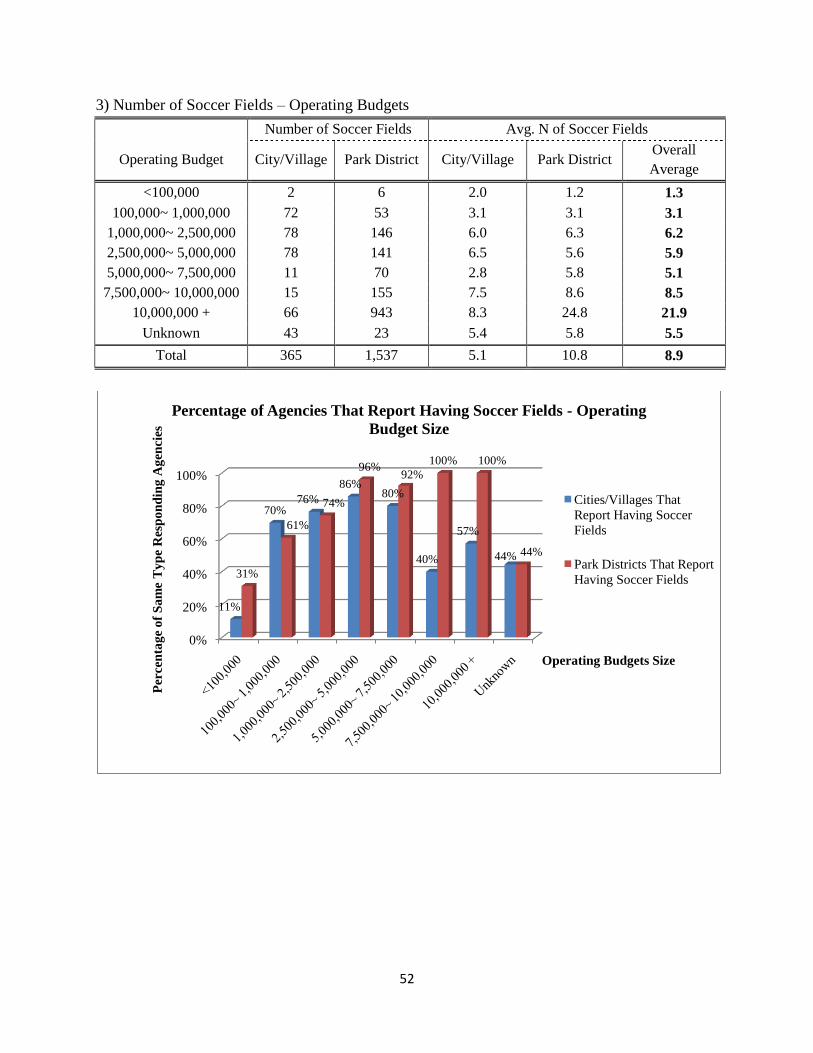
3) Number of Soccer Fields – Operating Budgets
Number of Soccer Fields Avg. N of Soccer Fields
Operating Budget City/Village Park District City/Village Park District Overall
Average
<100,000 2 6 2.0 1.2 1.3
100,000~ 1,000,000 72 53 3.1 3.1 3.1
1,000,000~ 2,500,000 78 146 6.0 6.3 6.2
2,500,000~ 5,000,000 78 141 6.5 5.6 5.9
5,000,000~ 7,500,000 11 70 2.8 5.8 5.1
7,500,000~ 10,000,000 15 155 7.5 8.6 8.5
10,000,000 + 66 943 8.3 24.8 21.9
Unknown 43 23 5.4 5.8 5.5
Total 365 1,537 5.1 10.8 8.9
0%
20%
40%
60%
80%
100%
11%
70%76%
86%80%
40%
57%
44%
31%
61%
74%
96%92%
100% 100%
44%
Per
cen
tag
e o
f S
am
e T
yp
e R
esp
on
din
g A
gen
cies
Operating Budgets Size
Percentage of Agencies That Report Having Soccer Fields - Operating
Budget Size
Cities/Villages That
Report Having Soccer
Fields
Park Districts That Report
Having Soccer Fields
53
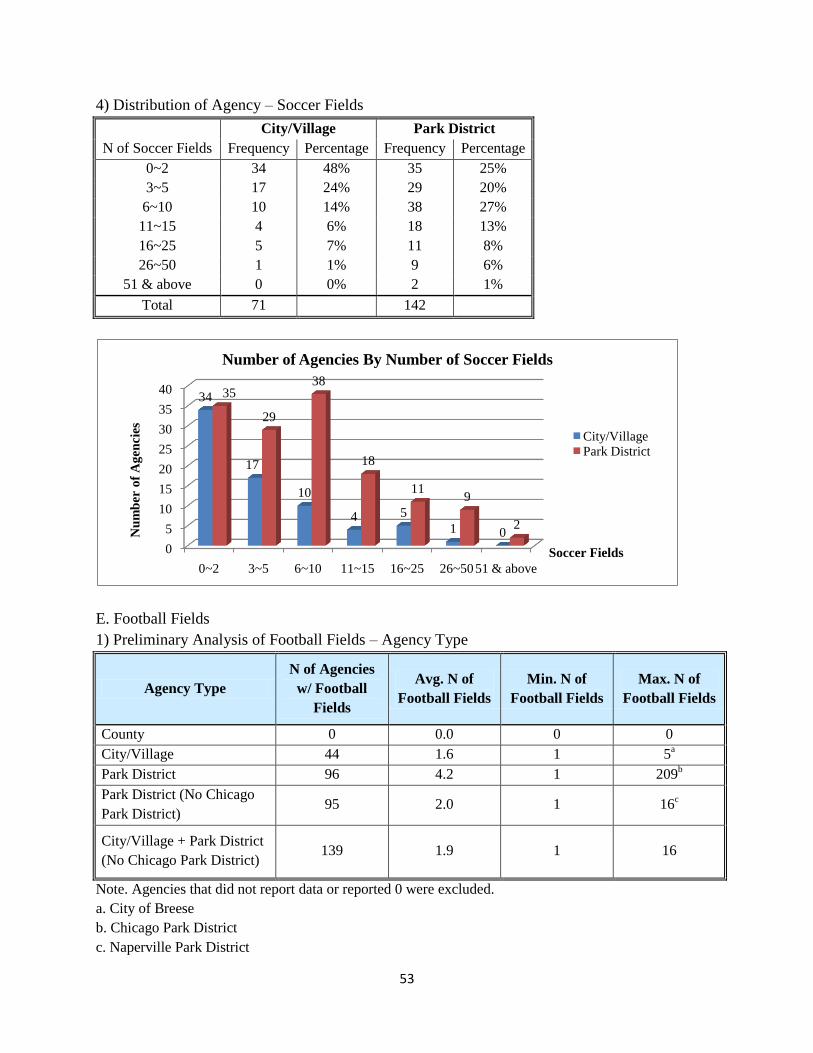
4) Distribution of Agency – Soccer Fields
City/Village Park District
N of Soccer Fields Frequency Percentage Frequency Percentage
0~2 34 48% 35 25%
3~5 17 24% 29 20%
6~10 10 14% 38 27%
11~15 4 6% 18 13%
16~25 5 7% 11 8%
26~50 1 1% 9 6%
51 & above 0 0% 2 1%
Total 71 142
E. Football Fields
1) Preliminary Analysis of Football Fields – Agency Type
Agency Type
N of Agencies
w/ Football
Fields
Avg. N of
Football Fields
Min. N of
Football Fields
Max. N of
Football Fields
County 0 0.0 0 0
City/Village 44 1.6 1 5a
Park District 96 4.2 1 209b
Park District (No Chicago
Park District) 95 2.0 1 16
c
City/Village + Park District
(No Chicago Park District) 139 1.9 1 16
Note. Agencies that did not report data or reported 0 were excluded.
a. City of Breese
b. Chicago Park District
c. Naperville Park District
0
5
10
15
20
25
30
35
40
0~2 3~5 6~10 11~15 16~25 26~5051 & above
34
17
10
4 5
1 0
35
29
38
18
119
2
Nu
mb
er o
f A
gen
cies
Soccer Fields
Number of Agencies By Number of Soccer Fields
City/VillagePark District
54
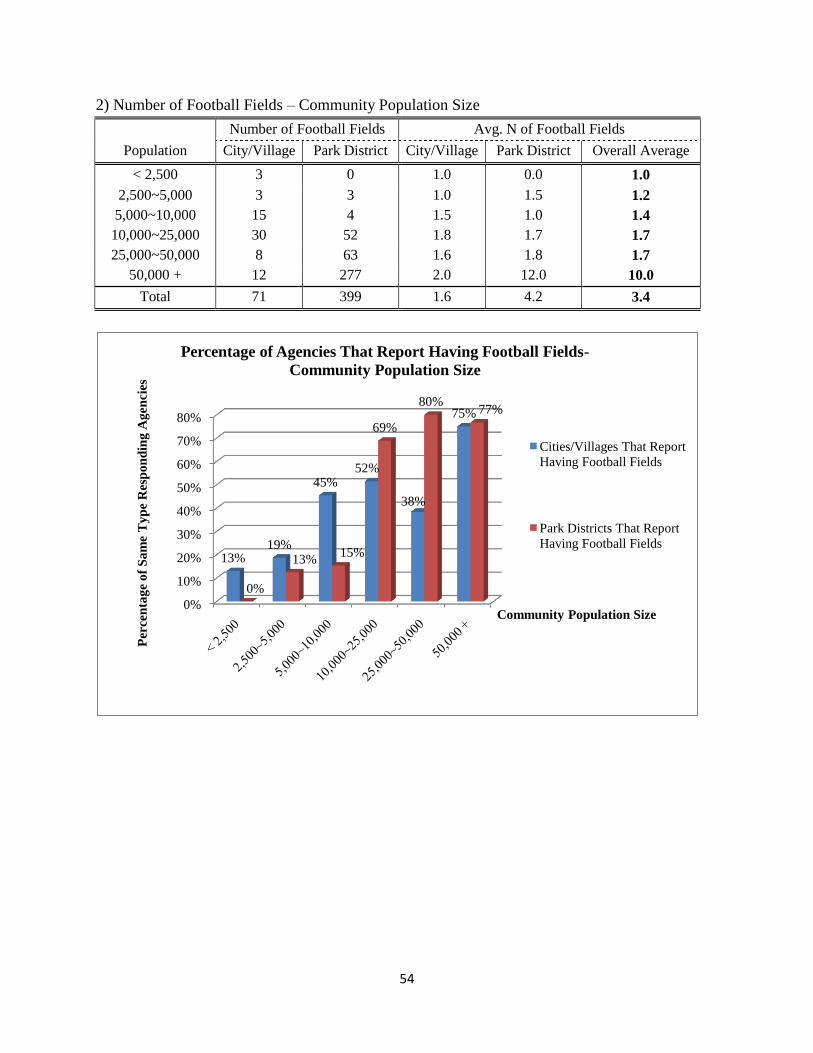
2) Number of Football Fields – Community Population Size
Number of Football Fields Avg. N of Football Fields
Population City/Village Park District City/Village Park District Overall Average
< 2,500 3 0 1.0 0.0 1.0
2,500~5,000 3 3 1.0 1.5 1.2
5,000~10,000 15 4 1.5 1.0 1.4
10,000~25,000 30 52 1.8 1.7 1.7
25,000~50,000 8 63 1.6 1.8 1.7
50,000 + 12 277 2.0 12.0 10.0
Total 71 399 1.6 4.2 3.4
0%
10%
20%
30%
40%
50%
60%
70%
80%
13%19%
45%52%
38%
75%
0%
13%15%
69%
80%77%
Per
cen
tag
e o
f S
am
e T
yp
e R
esp
on
din
g A
gen
cies
Community Population Size
Percentage of Agencies That Report Having Football Fields-
Community Population Size
Cities/Villages That Report
Having Football Fields
Park Districts That Report
Having Football Fields
55
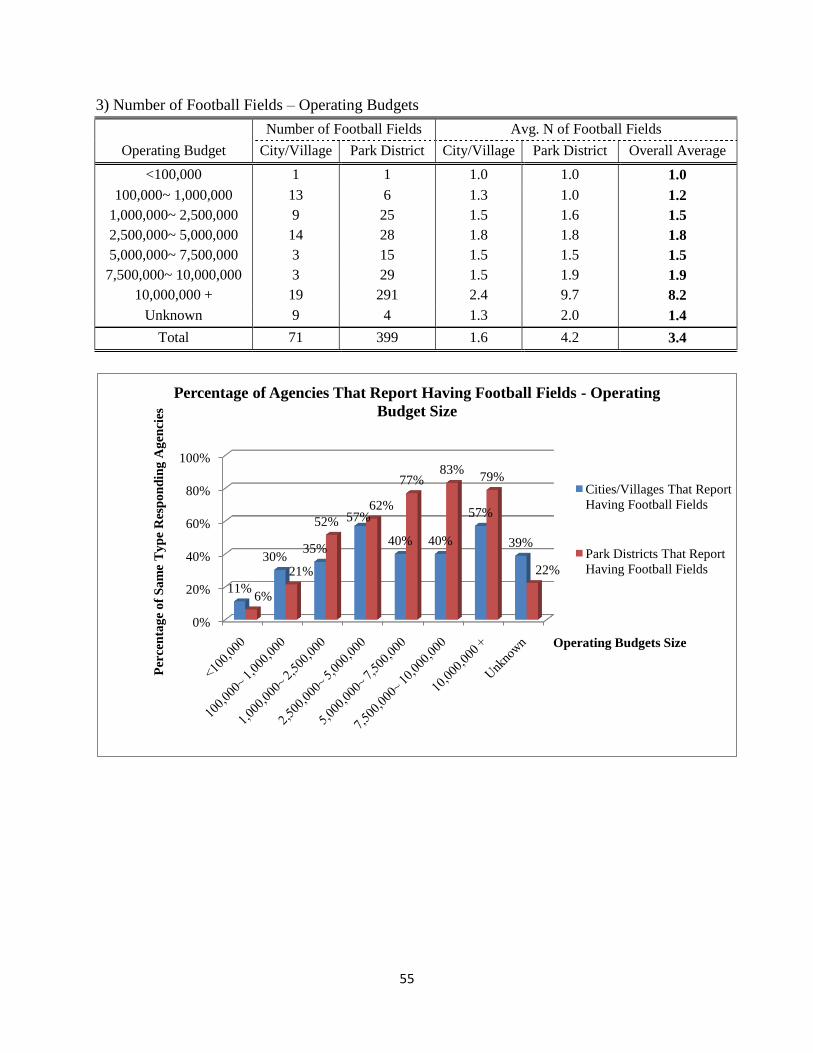
3) Number of Football Fields – Operating Budgets
Number of Football Fields Avg. N of Football Fields
Operating Budget City/Village Park District City/Village Park District Overall Average
<100,000 1 1 1.0 1.0 1.0
100,000~ 1,000,000 13 6 1.3 1.0 1.2
1,000,000~ 2,500,000 9 25 1.5 1.6 1.5
2,500,000~ 5,000,000 14 28 1.8 1.8 1.8
5,000,000~ 7,500,000 3 15 1.5 1.5 1.5
7,500,000~ 10,000,000 3 29 1.5 1.9 1.9
10,000,000 + 19 291 2.4 9.7 8.2
Unknown 9 4 1.3 2.0 1.4
Total 71 399 1.6 4.2 3.4
0%
20%
40%
60%
80%
100%
11%
30%35%
57%
40% 40%
57%
39%
6%
21%
52%
62%
77%83%
79%
22%
Per
cen
tag
e o
f S
am
e T
yp
e R
esp
on
din
g A
gen
cies
Operating Budgets Size
Percentage of Agencies That Report Having Football Fields - Operating
Budget Size
Cities/Villages That Report
Having Football Fields
Park Districts That Report
Having Football Fields
56
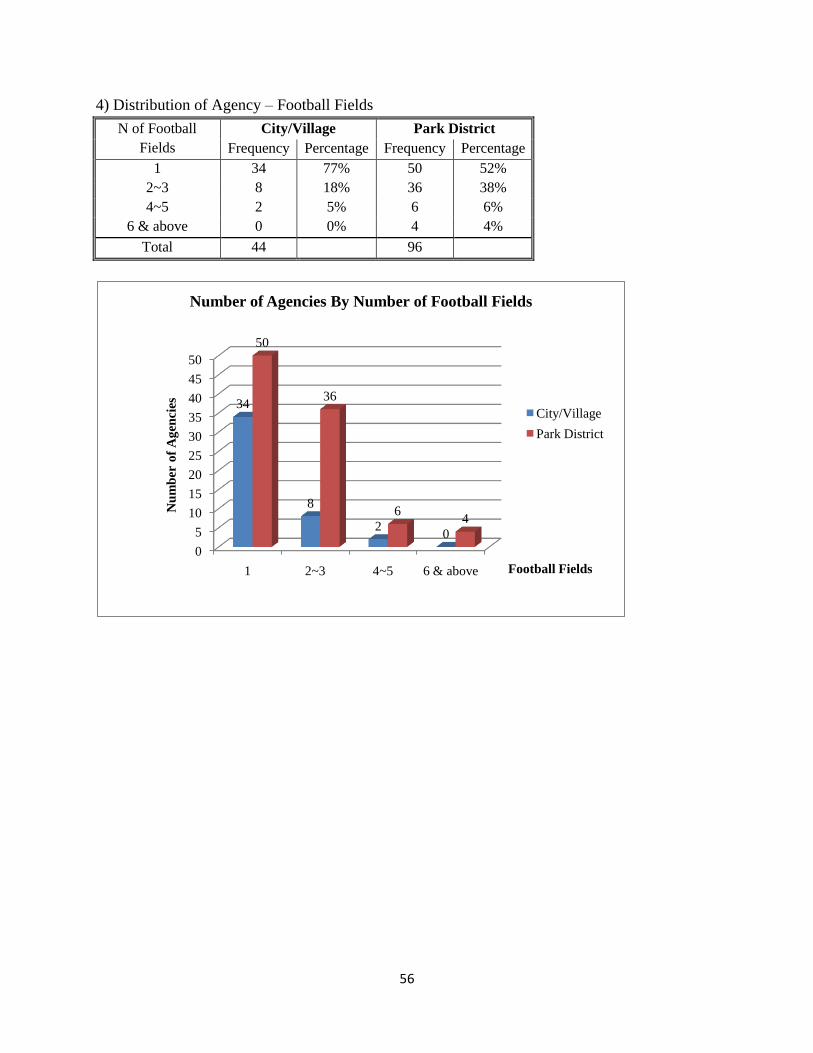
4) Distribution of Agency – Football Fields
N of Football
Fields
City/Village Park District
Frequency Percentage Frequency Percentage
1 34 77% 50 52%
2~3 8 18% 36 38%
4~5 2 5% 6 6%
6 & above 0 0% 4 4%
Total 44 96
0
5
10
15
20
25
30
35
40
45
50
1 2~3 4~5 6 & above
34
8
20
50
36
64
Nu
mb
er o
f A
gen
cies
Football Fields
Number of Agencies By Number of Football Fields
City/Village
Park District
57
VIII. Facilities
-
500
1,000
1,500
2,000
2,500
3,000
3,500
Picnic Shelters Playgrounds Dog Parks Disc Golf
Courses
Skate Parks
678 734
13 23 44
1,549
3,158
62 68 113
431
69 18 0 1
Nu
mb
er o
f F
aci
liti
esFacilities - 1
City Department Park District County
-
10
20
30
40
50
60
70
80
90
Archery Ranges Environmental/Nature
Centers
Museums Botanic
Gardens/Arboretums
2
9
19
12 16
47
87
35
2
26
10 12
Nu
mb
er o
f F
aci
liti
es
Facilities - 2
City Department Park District County
58
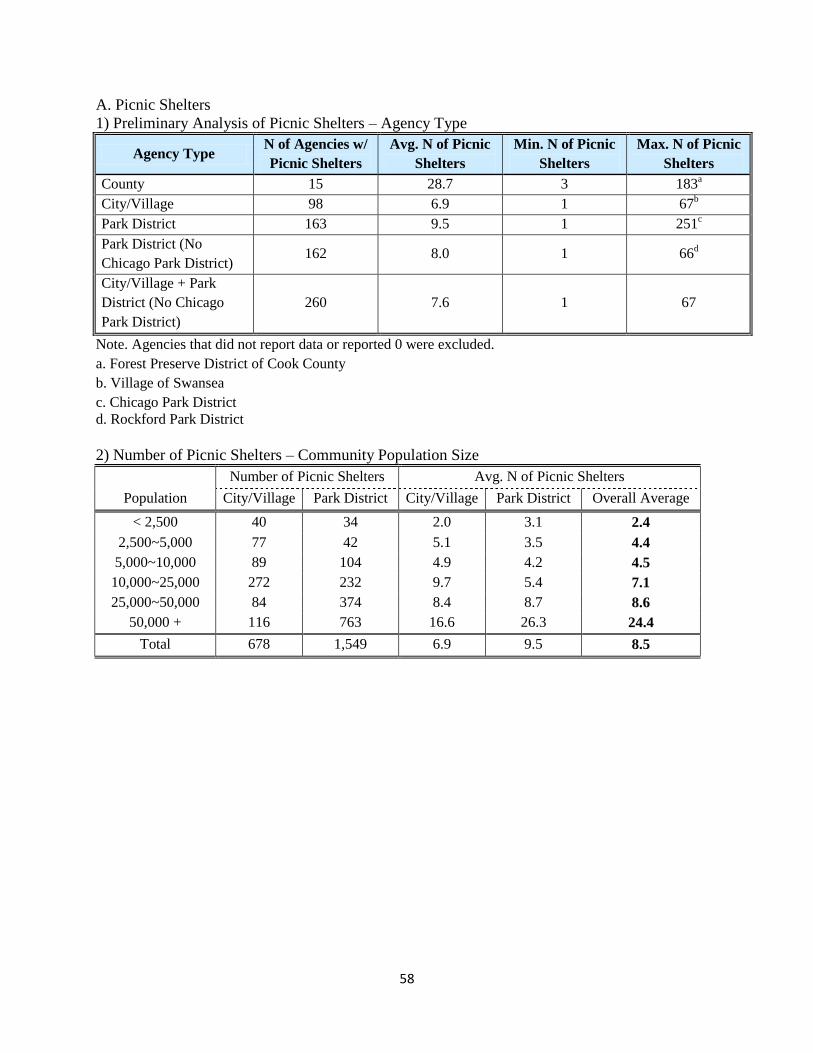
A. Picnic Shelters
1) Preliminary Analysis of Picnic Shelters – Agency Type
Agency Type N of Agencies w/
Picnic Shelters
Avg. N of Picnic
Shelters
Min. N of Picnic
Shelters
Max. N of Picnic
Shelters
County 15 28.7 3 183a
City/Village 98 6.9 1 67b
Park District 163 9.5 1 251c
Park District (No
Chicago Park District) 162 8.0 1 66
d
City/Village + Park
District (No Chicago
Park District)
260 7.6 1 67
Note. Agencies that did not report data or reported 0 were excluded.
a. Forest Preserve District of Cook County
b. Village of Swansea
c. Chicago Park District
d. Rockford Park District
2) Number of Picnic Shelters – Community Population Size
Number of Picnic Shelters Avg. N of Picnic Shelters
Population City/Village Park District City/Village Park District Overall Average
< 2,500 40 34 2.0 3.1 2.4
2,500~5,000 77 42 5.1 3.5 4.4
5,000~10,000 89 104 4.9 4.2 4.5
10,000~25,000 272 232 9.7 5.4 7.1
25,000~50,000 84 374 8.4 8.7 8.6
50,000 + 116 763 16.6 26.3 24.4
Total 678 1,549 6.9 9.5 8.5
59
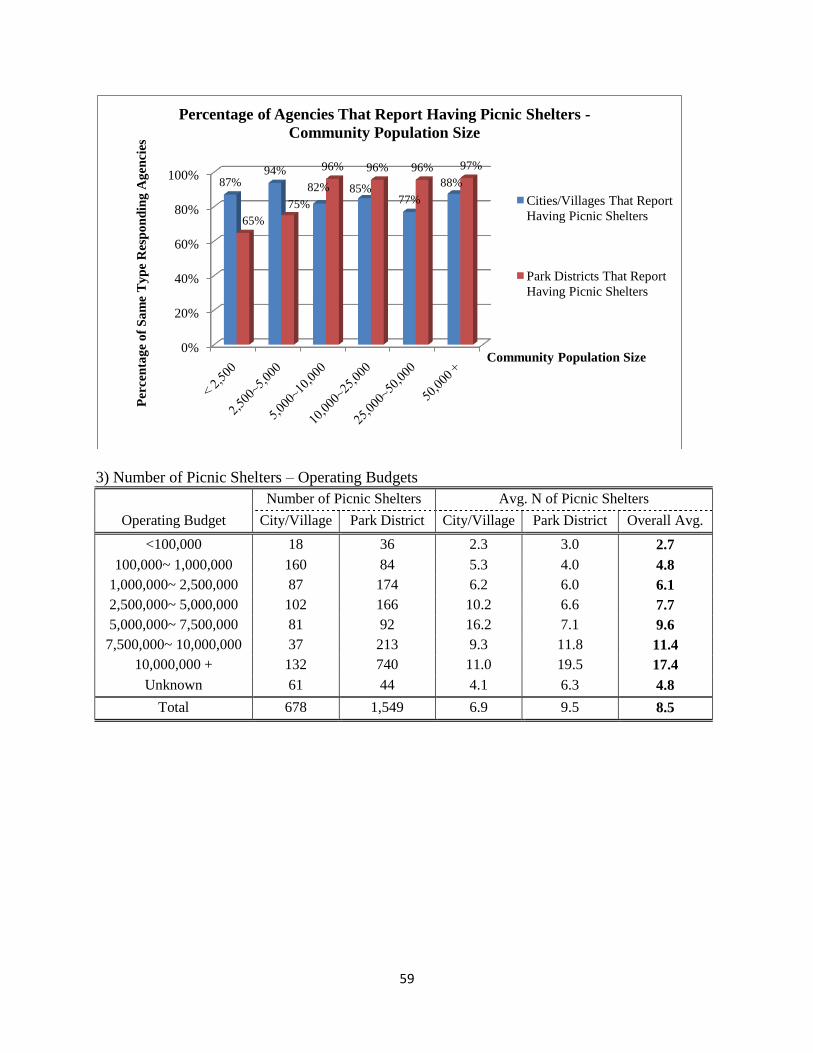
3) Number of Picnic Shelters – Operating Budgets
Number of Picnic Shelters Avg. N of Picnic Shelters
Operating Budget City/Village Park District City/Village Park District Overall Avg.
<100,000 18 36 2.3 3.0 2.7
100,000~ 1,000,000 160 84 5.3 4.0 4.8
1,000,000~ 2,500,000 87 174 6.2 6.0 6.1
2,500,000~ 5,000,000 102 166 10.2 6.6 7.7
5,000,000~ 7,500,000 81 92 16.2 7.1 9.6
7,500,000~ 10,000,000 37 213 9.3 11.8 11.4
10,000,000 + 132 740 11.0 19.5 17.4
Unknown 61 44 4.1 6.3 4.8
Total 678 1,549 6.9 9.5 8.5
0%
20%
40%
60%
80%
100%87%
94%
82% 85%77%
88%
65%
75%
96% 96% 96% 97%
Per
cen
tag
e o
f S
am
e T
yp
e R
esp
on
din
g A
gen
cies
Community Population Size
Percentage of Agencies That Report Having Picnic Shelters -
Community Population Size
Cities/Villages That Report
Having Picnic Shelters
Park Districts That Report
Having Picnic Shelters
60
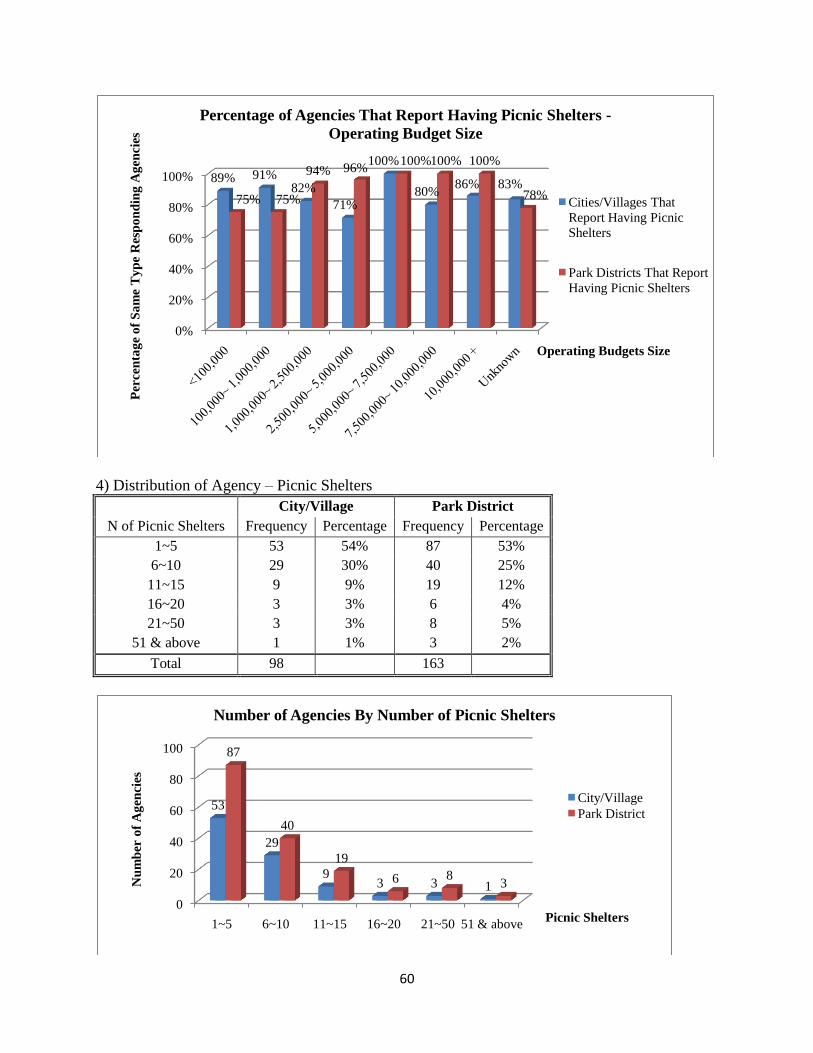
4) Distribution of Agency – Picnic Shelters
City/Village Park District
N of Picnic Shelters Frequency Percentage Frequency Percentage
1~5 53 54% 87 53%
6~10 29 30% 40 25%
11~15 9 9% 19 12%
16~20 3 3% 6 4%
21~50 3 3% 8 5%
51 & above 1 1% 3 2%
Total 98 163
0%
20%
40%
60%
80%
100% 89% 91%82%
71%
100%
80%86% 83%
75% 75%
94% 96%100%100% 100%
78%
Per
cen
tag
e o
f S
am
e T
yp
e R
esp
on
din
g A
gen
cies
Operating Budgets Size
Percentage of Agencies That Report Having Picnic Shelters -
Operating Budget Size
Cities/Villages That
Report Having Picnic
Shelters
Park Districts That Report
Having Picnic Shelters
0
20
40
60
80
100
1~5 6~10 11~15 16~20 21~50 51 & above
53
29
93 3 1
87
40
19
6 83N
um
ber
of
Ag
enci
es
Picnic Shelters
Number of Agencies By Number of Picnic Shelters
City/Village
Park District
61
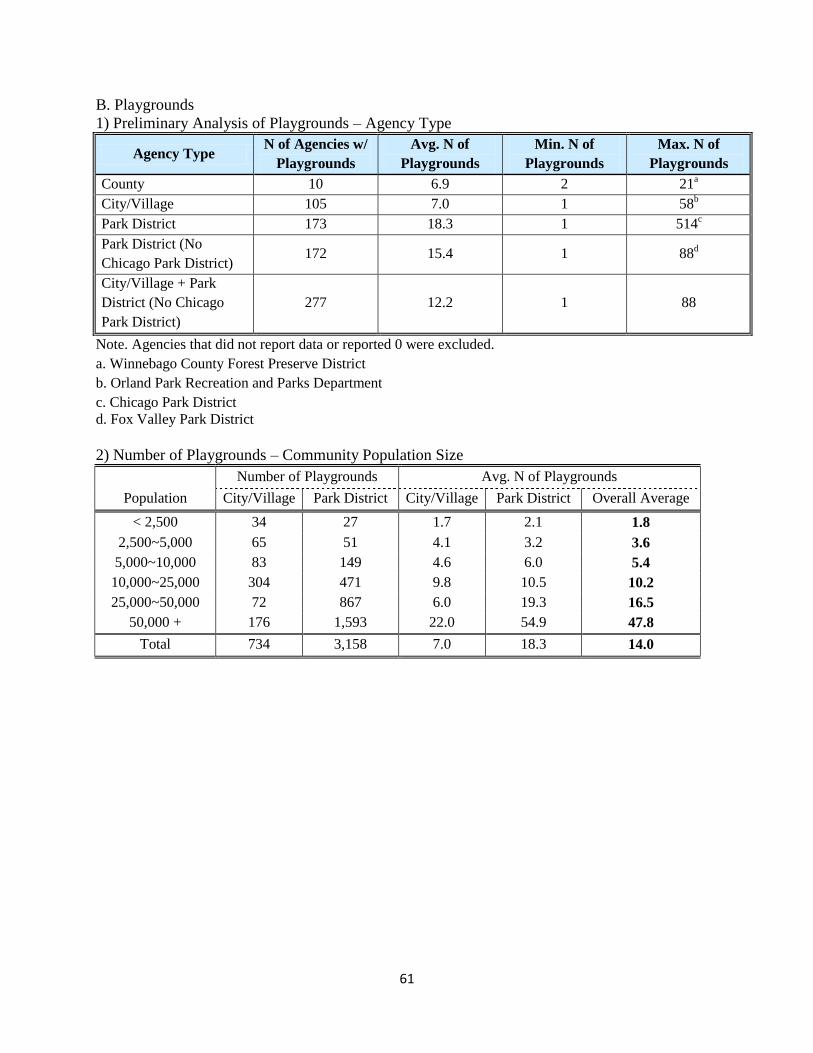
B. Playgrounds
1) Preliminary Analysis of Playgrounds – Agency Type
Agency Type N of Agencies w/
Playgrounds
Avg. N of
Playgrounds
Min. N of
Playgrounds
Max. N of
Playgrounds
County 10 6.9 2 21a
City/Village 105 7.0 1 58b
Park District 173 18.3 1 514c
Park District (No
Chicago Park District) 172 15.4 1 88
d
City/Village + Park
District (No Chicago
Park District)
277 12.2 1 88
Note. Agencies that did not report data or reported 0 were excluded.
a. Winnebago County Forest Preserve District
b. Orland Park Recreation and Parks Department
c. Chicago Park District
d. Fox Valley Park District
2) Number of Playgrounds – Community Population Size
Number of Playgrounds Avg. N of Playgrounds
Population City/Village Park District City/Village Park District Overall Average
< 2,500 34 27 1.7 2.1 1.8
2,500~5,000 65 51 4.1 3.2 3.6
5,000~10,000 83 149 4.6 6.0 5.4
10,000~25,000 304 471 9.8 10.5 10.2
25,000~50,000 72 867 6.0 19.3 16.5
50,000 + 176 1,593 22.0 54.9 47.8
Total 734 3,158 7.0 18.3 14.0
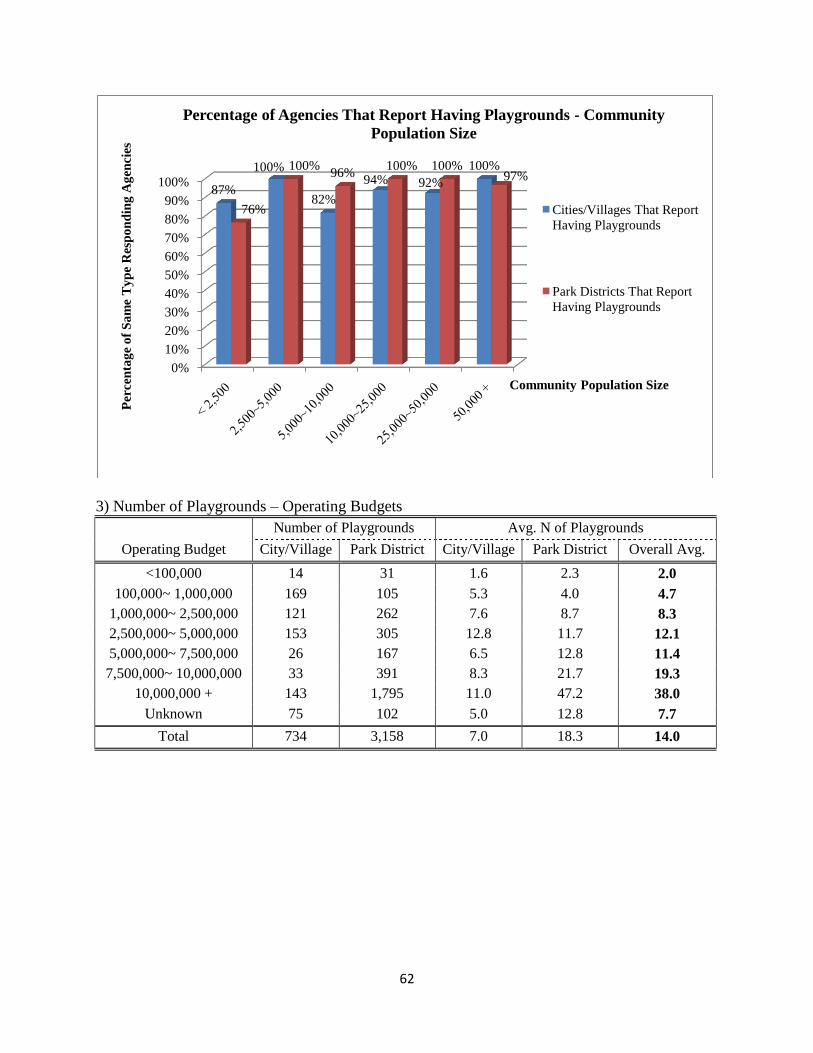
62
3) Number of Playgrounds – Operating Budgets
Number of Playgrounds Avg. N of Playgrounds
Operating Budget City/Village Park District City/Village Park District Overall Avg.
<100,000 14 31 1.6 2.3 2.0
100,000~ 1,000,000 169 105 5.3 4.0 4.7
1,000,000~ 2,500,000 121 262 7.6 8.7 8.3
2,500,000~ 5,000,000 153 305 12.8 11.7 12.1
5,000,000~ 7,500,000 26 167 6.5 12.8 11.4
7,500,000~ 10,000,000 33 391 8.3 21.7 19.3
10,000,000 + 143 1,795 11.0 47.2 38.0
Unknown 75 102 5.0 12.8 7.7
Total 734 3,158 7.0 18.3 14.0
0%
10%
20%
30%
40%
50%
60%
70%
80%
90%
100%87%
100%
82%
94% 92%
100%
76%
100%96%
100% 100%97%
Per
cen
tag
e o
f S
am
e T
yp
e R
esp
on
din
g A
gen
cies
Community Population Size
Percentage of Agencies That Report Having Playgrounds - Community
Population Size
Cities/Villages That Report
Having Playgrounds
Park Districts That Report
Having Playgrounds
63
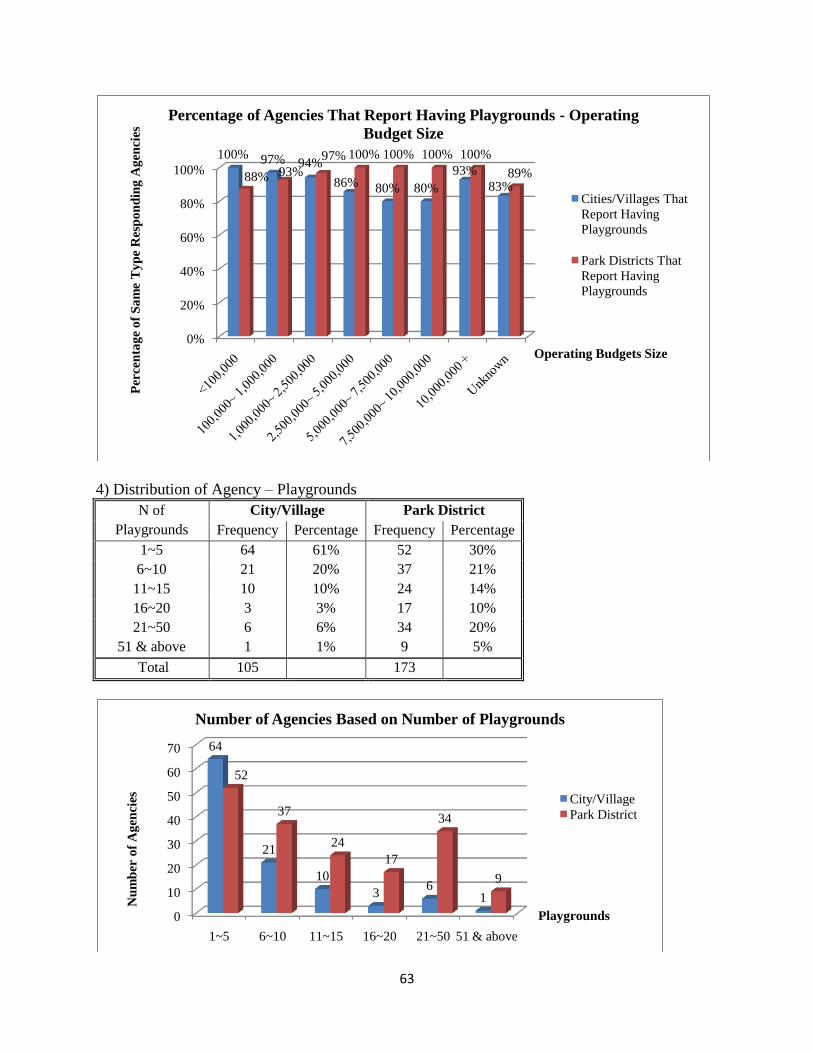
4) Distribution of Agency – Playgrounds
N of
Playgrounds
City/Village Park District
Frequency Percentage Frequency Percentage
1~5 64 61% 52 30%
6~10 21 20% 37 21%
11~15 10 10% 24 14%
16~20 3 3% 17 10%
21~50 6 6% 34 20%
51 & above 1 1% 9 5%
Total 105 173
0%
20%
40%
60%
80%
100%
100% 97% 94%
86% 80% 80%
93%
83%88% 93%
97% 100% 100% 100% 100%
89%
Per
cen
tag
e o
f S
am
e T
yp
e R
esp
on
din
g A
gen
cies
Operating Budgets Size
Percentage of Agencies That Report Having Playgrounds - Operating
Budget Size
Cities/Villages That
Report Having
Playgrounds
Park Districts That
Report Having
Playgrounds
0
10
20
30
40
50
60
70
1~5 6~10 11~15 16~20 21~50 51 & above
64
21
10
36
1
52
37
24
17
34
9
Nu
mb
er o
f A
gen
cies
Playgrounds
Number of Agencies Based on Number of Playgrounds
City/Village
Park District
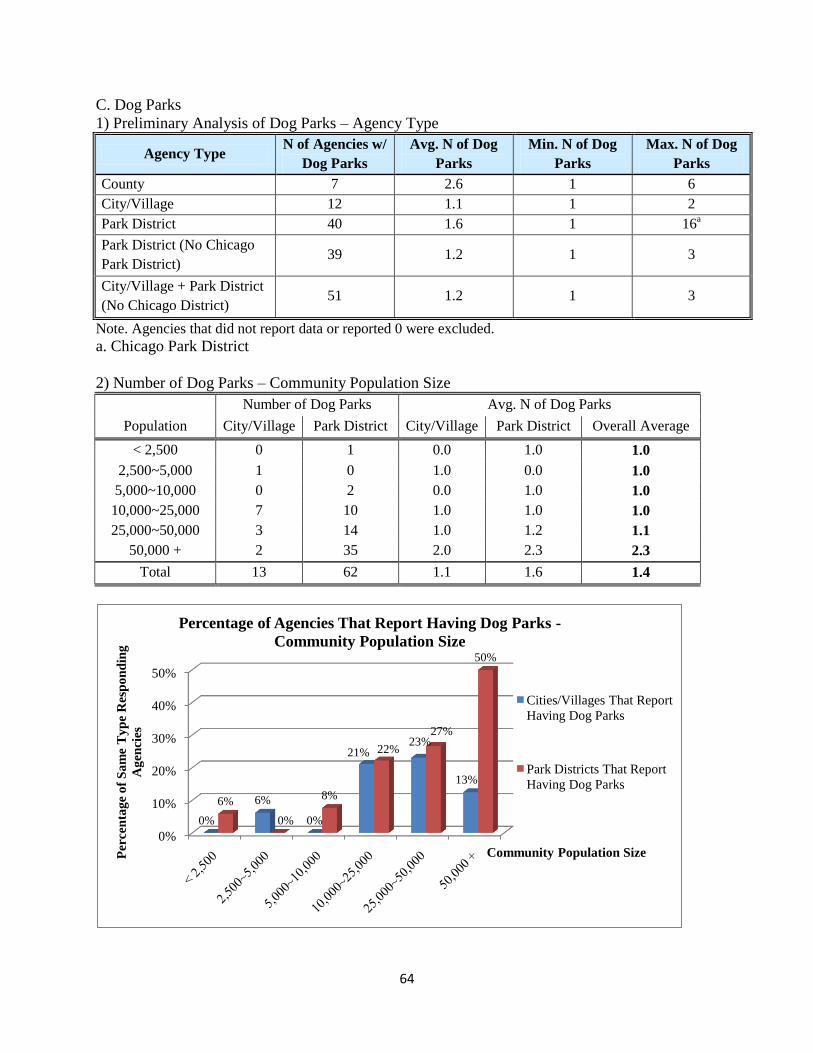
64
C. Dog Parks
1) Preliminary Analysis of Dog Parks – Agency Type
Agency Type N of Agencies w/
Dog Parks
Avg. N of Dog
Parks
Min. N of Dog
Parks
Max. N of Dog
Parks
County 7 2.6 1 6
City/Village 12 1.1 1 2
Park District 40 1.6 1 16a
Park District (No Chicago
Park District) 39 1.2 1 3
City/Village + Park District
(No Chicago District) 51 1.2 1 3
Note. Agencies that did not report data or reported 0 were excluded.
a. Chicago Park District
2) Number of Dog Parks – Community Population Size
Number of Dog Parks Avg. N of Dog Parks
Population City/Village Park District City/Village Park District Overall Average
< 2,500 0 1 0.0 1.0 1.0
2,500~5,000 1 0 1.0 0.0 1.0
5,000~10,000 0 2 0.0 1.0 1.0
10,000~25,000 7 10 1.0 1.0 1.0
25,000~50,000 3 14 1.0 1.2 1.1
50,000 + 2 35 2.0 2.3 2.3
Total 13 62 1.1 1.6 1.4
0%
10%
20%
30%
40%
50%
0%
6%
0%
21%23%
13%
6%
0%
8%
22%
27%
50%
Per
cen
tag
e o
f S
am
e T
yp
e R
esp
on
din
g
Ag
enci
es
Community Population Size
Percentage of Agencies That Report Having Dog Parks -
Community Population Size
Cities/Villages That Report
Having Dog Parks
Park Districts That Report
Having Dog Parks
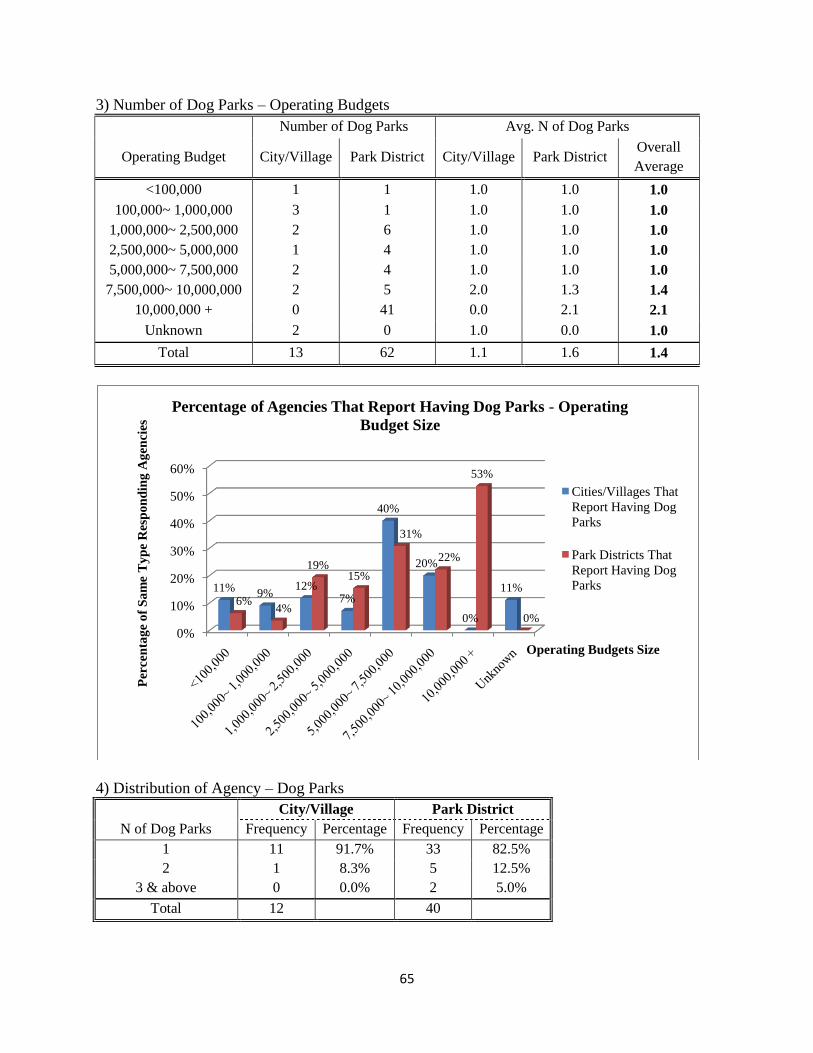
65
3) Number of Dog Parks – Operating Budgets
Number of Dog Parks Avg. N of Dog Parks
Operating Budget City/Village Park District City/Village Park District Overall
Average
<100,000 1 1 1.0 1.0 1.0
100,000~ 1,000,000 3 1 1.0 1.0 1.0
1,000,000~ 2,500,000 2 6 1.0 1.0 1.0
2,500,000~ 5,000,000 1 4 1.0 1.0 1.0
5,000,000~ 7,500,000 2 4 1.0 1.0 1.0
7,500,000~ 10,000,000 2 5 2.0 1.3 1.4
10,000,000 + 0 41 0.0 2.1 2.1
Unknown 2 0 1.0 0.0 1.0
Total 13 62 1.1 1.6 1.4
4) Distribution of Agency – Dog Parks
City/Village Park District
N of Dog Parks Frequency Percentage Frequency Percentage
1 11 91.7% 33 82.5%
2 1 8.3% 5 12.5%
3 & above 0 0.0% 2 5.0%
Total 12 40
0%
10%
20%
30%
40%
50%
60%
11%9%
12%7%
40%
20%
0%
11%6%
4%
19%15%
31%
22%
53%
0%
Per
cen
tag
e o
f S
am
e T
yp
e R
esp
on
din
g A
gen
cies
Operating Budgets Size
Percentage of Agencies That Report Having Dog Parks - Operating
Budget Size
Cities/Villages That
Report Having Dog
Parks
Park Districts That
Report Having Dog
Parks
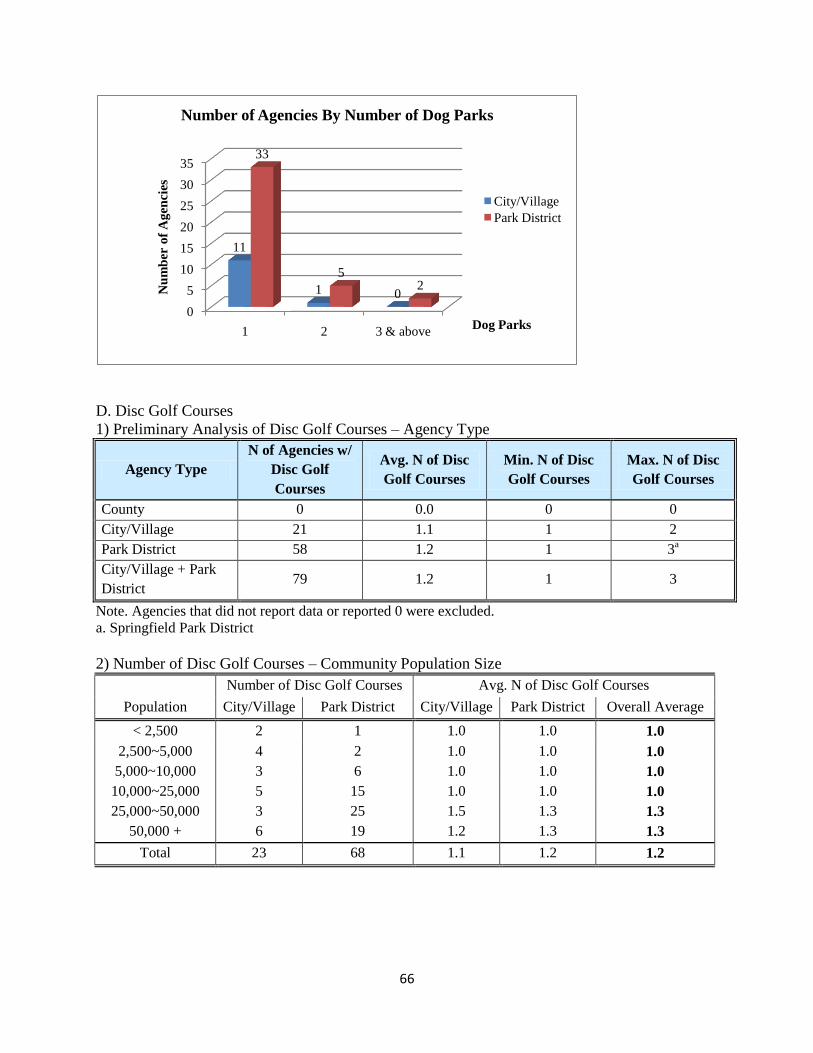
66
D. Disc Golf Courses
1) Preliminary Analysis of Disc Golf Courses – Agency Type
Agency Type
N of Agencies w/
Disc Golf
Courses
Avg. N of Disc
Golf Courses
Min. N of Disc
Golf Courses
Max. N of Disc
Golf Courses
County 0 0.0 0 0
City/Village 21 1.1 1 2
Park District 58 1.2 1 3a
City/Village + Park
District 79 1.2 1 3
Note. Agencies that did not report data or reported 0 were excluded.
a. Springfield Park District
2) Number of Disc Golf Courses – Community Population Size
Number of Disc Golf Courses Avg. N of Disc Golf Courses
Population City/Village Park District City/Village Park District Overall Average
< 2,500 2 1 1.0 1.0 1.0
2,500~5,000 4 2 1.0 1.0 1.0
5,000~10,000 3 6 1.0 1.0 1.0
10,000~25,000 5 15 1.0 1.0 1.0
25,000~50,000 3 25 1.5 1.3 1.3
50,000 + 6 19 1.2 1.3 1.3
Total 23 68 1.1 1.2 1.2
0
5
10
15
20
25
30
35
1 2 3 & above
11
1 0
33
52N
um
ber
of
Ag
enci
es
Dog Parks
Number of Agencies By Number of Dog Parks
City/Village
Park District
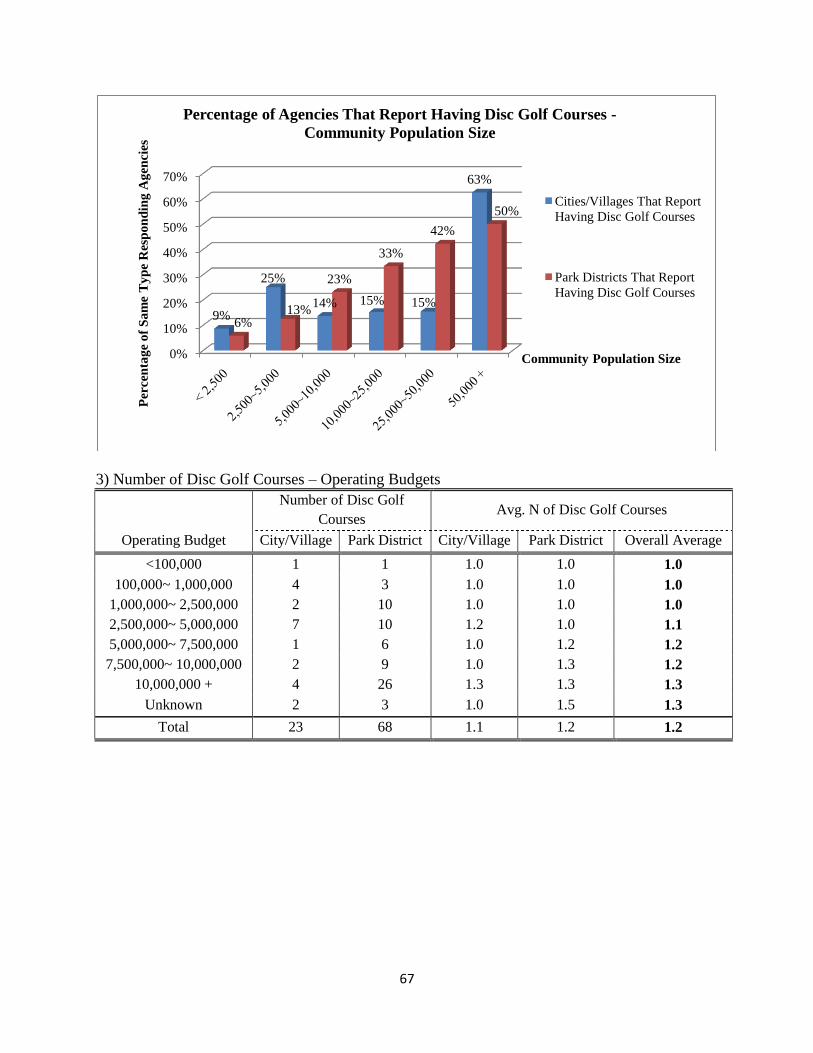
67
3) Number of Disc Golf Courses – Operating Budgets
Number of Disc Golf
Courses Avg. N of Disc Golf Courses
Operating Budget City/Village Park District City/Village Park District Overall Average
<100,000 1 1 1.0 1.0 1.0
100,000~ 1,000,000 4 3 1.0 1.0 1.0
1,000,000~ 2,500,000 2 10 1.0 1.0 1.0
2,500,000~ 5,000,000 7 10 1.2 1.0 1.1
5,000,000~ 7,500,000 1 6 1.0 1.2 1.2
7,500,000~ 10,000,000 2 9 1.0 1.3 1.2
10,000,000 + 4 26 1.3 1.3 1.3
Unknown 2 3 1.0 1.5 1.3
Total 23 68 1.1 1.2 1.2
0%
10%
20%
30%
40%
50%
60%
70%
9%
25%
14% 15% 15%
63%
6%13%
23%
33%
42%
50%
Per
cen
tag
e o
f S
am
e T
yp
e R
esp
on
din
g A
gen
cies
Community Population Size
Percentage of Agencies That Report Having Disc Golf Courses -
Community Population Size
Cities/Villages That Report
Having Disc Golf Courses
Park Districts That Report
Having Disc Golf Courses
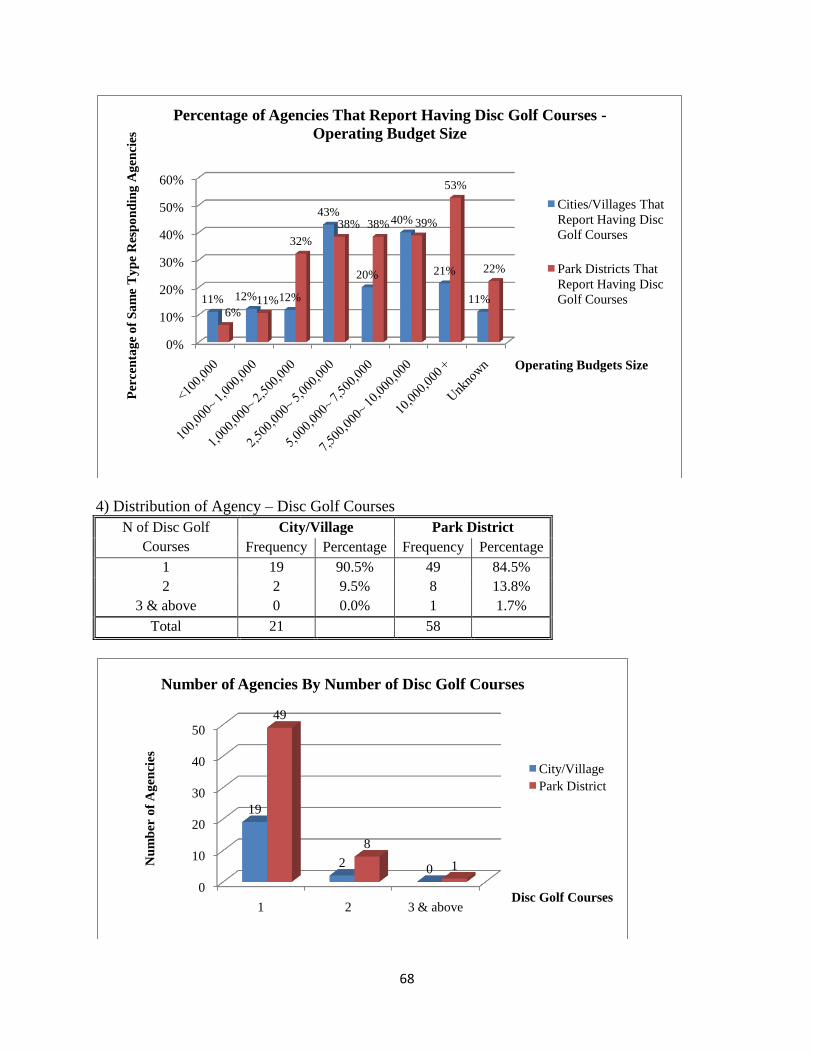
68
4) Distribution of Agency – Disc Golf Courses
N of Disc Golf
Courses
City/Village Park District
Frequency Percentage Frequency Percentage
1 19 90.5% 49 84.5%
2 2 9.5% 8 13.8%
3 & above 0 0.0% 1 1.7%
Total 21 58
0%
10%
20%
30%
40%
50%
60%
11% 12% 12%
43%
20%
40%
21%
11%6%
11%
32%
38% 38% 39%
53%
22%
Per
cen
tag
e o
f S
am
e T
yp
e R
esp
on
din
g A
gen
cies
Operating Budgets Size
Percentage of Agencies That Report Having Disc Golf Courses -
Operating Budget Size
Cities/Villages That
Report Having Disc
Golf Courses
Park Districts That
Report Having Disc
Golf Courses
0
10
20
30
40
50
1 2 3 & above
19
20
49
8
1Nu
mb
er o
f A
gen
cies
Disc Golf Courses
Number of Agencies By Number of Disc Golf Courses
City/Village
Park District
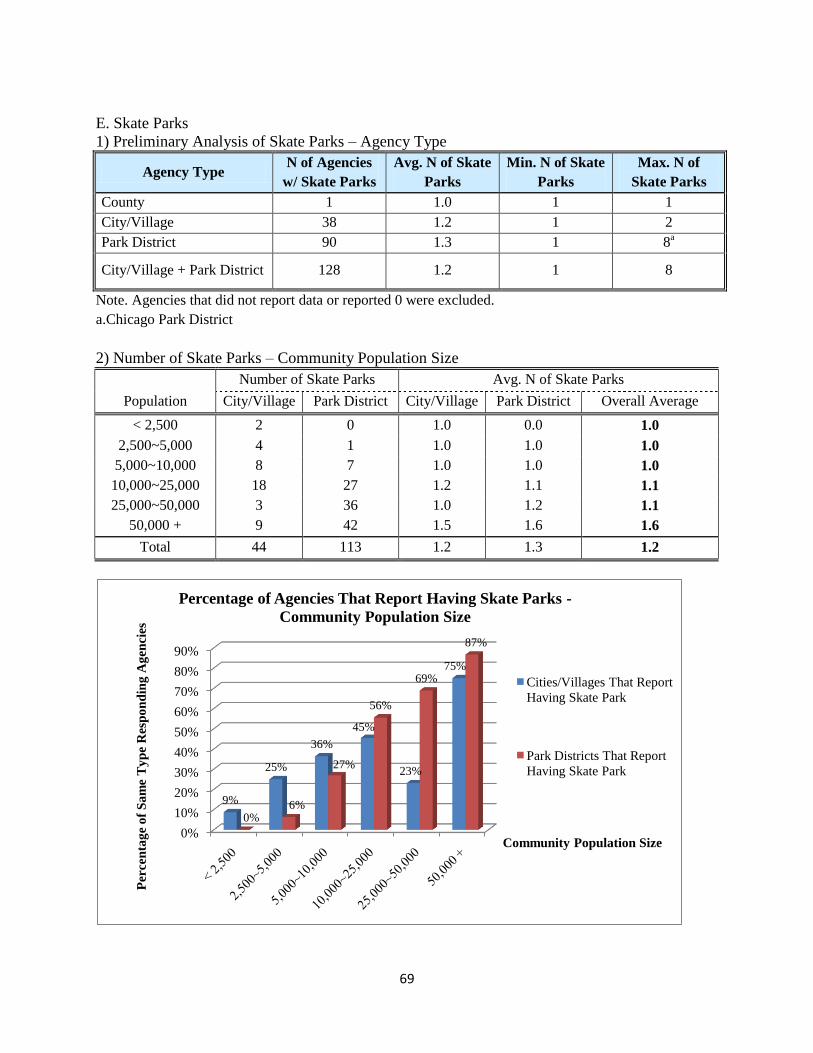
69
E. Skate Parks
1) Preliminary Analysis of Skate Parks – Agency Type
Agency Type N of Agencies
w/ Skate Parks
Avg. N of Skate
Parks
Min. N of Skate
Parks
Max. N of
Skate Parks
County 1 1.0 1 1
City/Village 38 1.2 1 2
Park District 90 1.3 1 8a
City/Village + Park District 128 1.2 1 8
Note. Agencies that did not report data or reported 0 were excluded.
a.Chicago Park District
2) Number of Skate Parks – Community Population Size
Number of Skate Parks Avg. N of Skate Parks
Population City/Village Park District City/Village Park District Overall Average
< 2,500 2 0 1.0 0.0 1.0
2,500~5,000 4 1 1.0 1.0 1.0
5,000~10,000 8 7 1.0 1.0 1.0
10,000~25,000 18 27 1.2 1.1 1.1
25,000~50,000 3 36 1.0 1.2 1.1
50,000 + 9 42 1.5 1.6 1.6
Total 44 113 1.2 1.3 1.2
0%
10%
20%
30%
40%
50%
60%
70%
80%
90%
9%
25%
36%
45%
23%
75%
0%6%
27%
56%
69%
87%
Per
cen
tag
e o
f S
am
e T
yp
e R
esp
on
din
g A
gen
cies
Community Population Size
Percentage of Agencies That Report Having Skate Parks -
Community Population Size
Cities/Villages That Report
Having Skate Park
Park Districts That Report
Having Skate Park
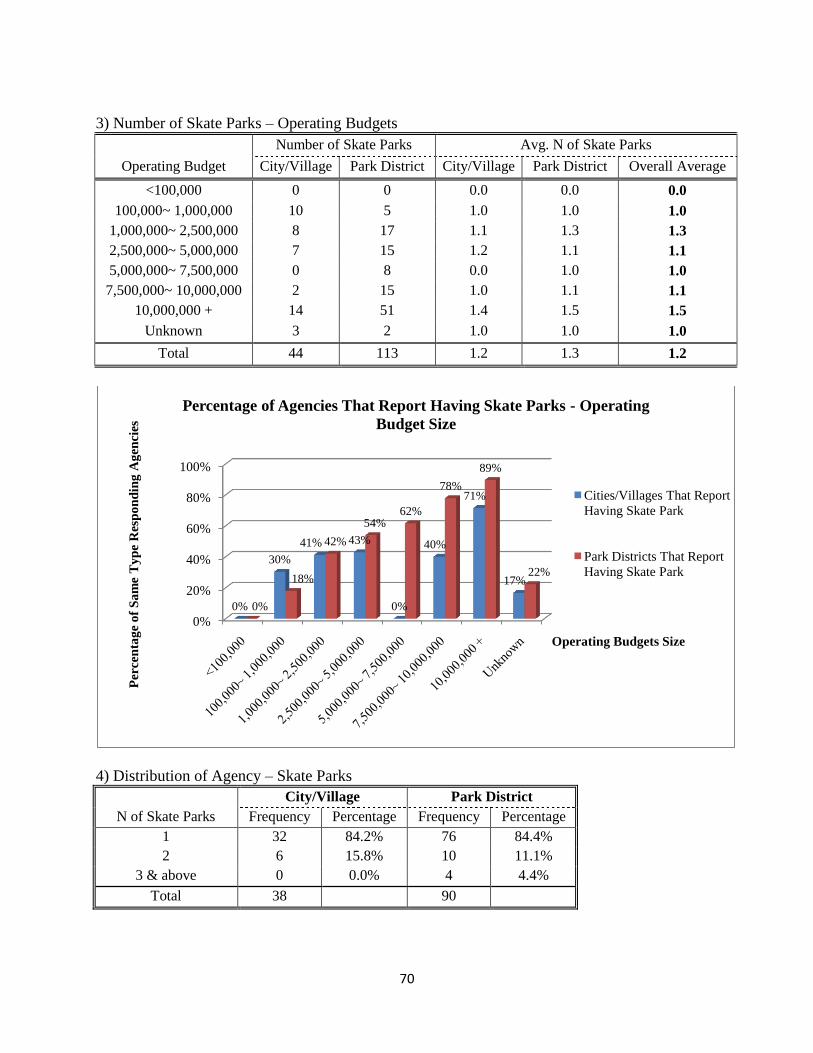
70
3) Number of Skate Parks – Operating Budgets
Number of Skate Parks Avg. N of Skate Parks
Operating Budget City/Village Park District City/Village Park District Overall Average
<100,000 0 0 0.0 0.0 0.0
100,000~ 1,000,000 10 5 1.0 1.0 1.0
1,000,000~ 2,500,000 8 17 1.1 1.3 1.3
2,500,000~ 5,000,000 7 15 1.2 1.1 1.1
5,000,000~ 7,500,000 0 8 0.0 1.0 1.0
7,500,000~ 10,000,000 2 15 1.0 1.1 1.1
10,000,000 + 14 51 1.4 1.5 1.5
Unknown 3 2 1.0 1.0 1.0
Total 44 113 1.2 1.3 1.2
4) Distribution of Agency – Skate Parks
City/Village Park District
N of Skate Parks Frequency Percentage Frequency Percentage
1 32 84.2% 76 84.4%
2 6 15.8% 10 11.1%
3 & above 0 0.0% 4 4.4%
Total 38 90
0%
20%
40%
60%
80%
100%
0%
30%
41% 43%
0%
40%
71%
17%
0%
18%
42%
54%62%
78%
89%
22%
Per
cen
tag
e o
f S
am
e T
yp
e R
esp
on
din
g A
gen
cies
Operating Budgets Size
Percentage of Agencies That Report Having Skate Parks - Operating
Budget Size
Cities/Villages That Report
Having Skate Park
Park Districts That Report
Having Skate Park
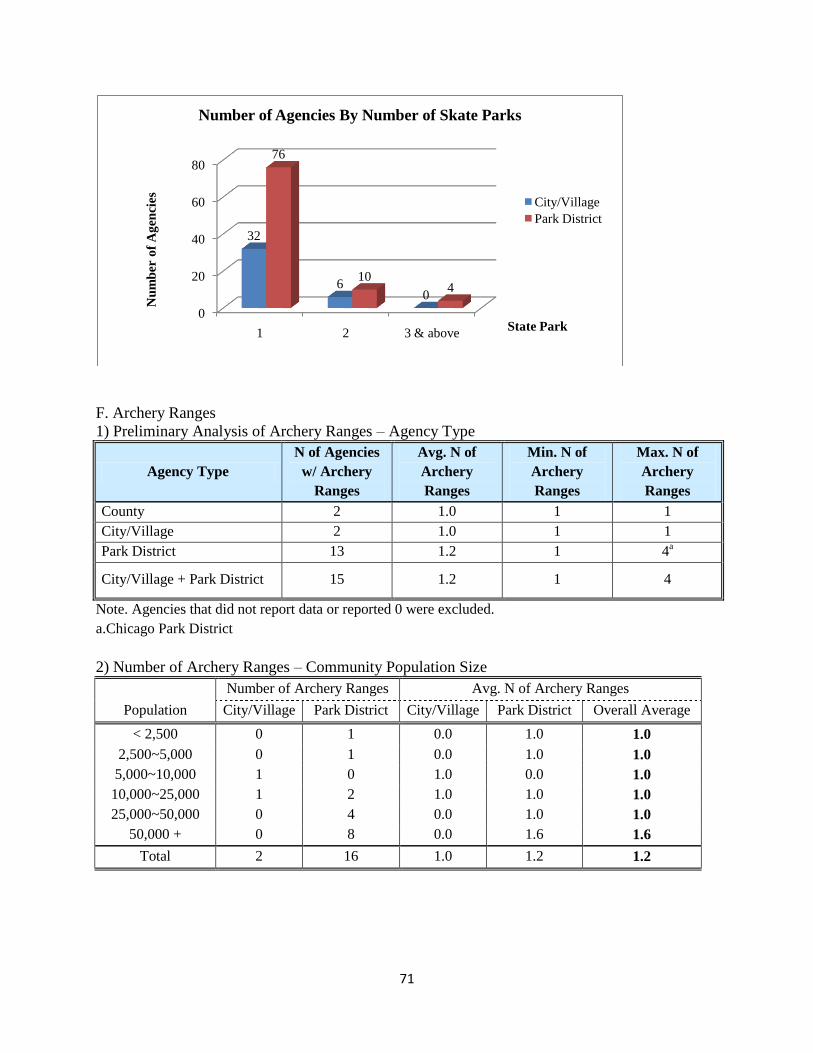
71
F. Archery Ranges
1) Preliminary Analysis of Archery Ranges – Agency Type
Agency Type
N of Agencies
w/ Archery
Ranges
Avg. N of
Archery
Ranges
Min. N of
Archery
Ranges
Max. N of
Archery
Ranges
County 2 1.0 1 1
City/Village 2 1.0 1 1
Park District 13 1.2 1 4a
City/Village + Park District 15 1.2 1 4
Note. Agencies that did not report data or reported 0 were excluded.
a.Chicago Park District
2) Number of Archery Ranges – Community Population Size
Number of Archery Ranges Avg. N of Archery Ranges
Population City/Village Park District City/Village Park District Overall Average
< 2,500 0 1 0.0 1.0 1.0
2,500~5,000 0 1 0.0 1.0 1.0
5,000~10,000 1 0 1.0 0.0 1.0
10,000~25,000 1 2 1.0 1.0 1.0
25,000~50,000 0 4 0.0 1.0 1.0
50,000 + 0 8 0.0 1.6 1.6
Total 2 16 1.0 1.2 1.2
0
20
40
60
80
1 2 3 & above
32
60
76
104
Nu
mb
er o
f A
gen
cies
State Park
Number of Agencies By Number of Skate Parks
City/Village
Park District
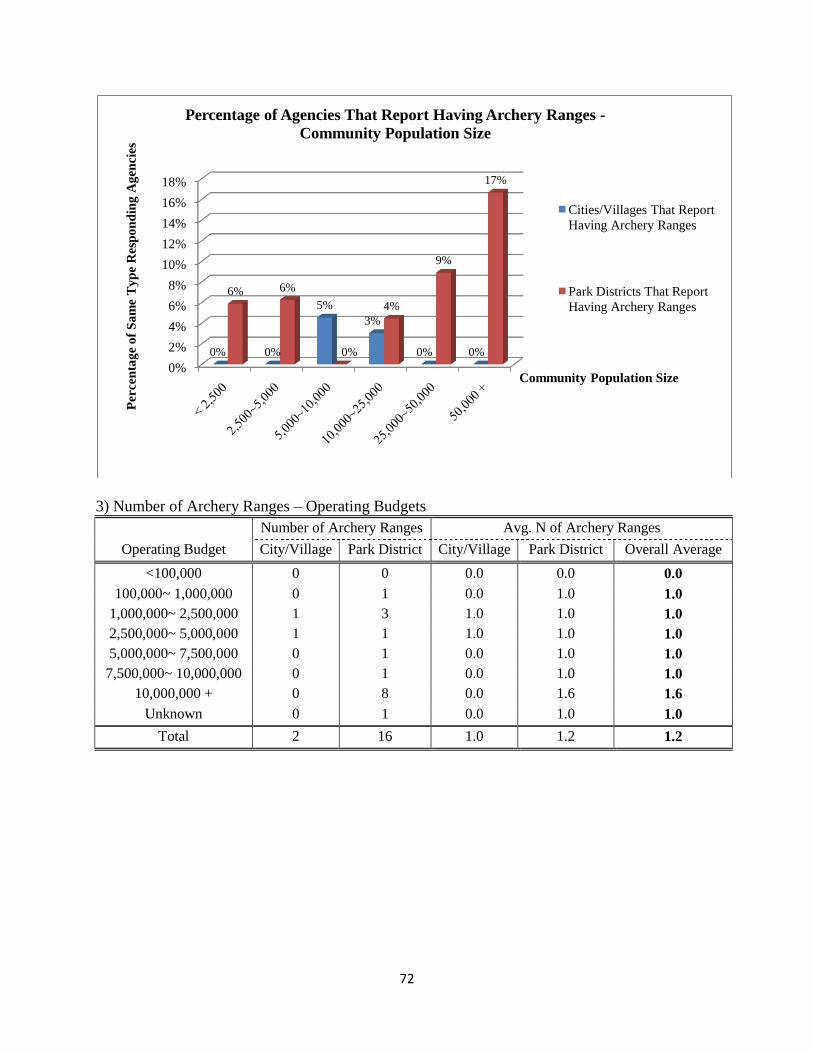
72
3) Number of Archery Ranges – Operating Budgets
Number of Archery Ranges Avg. N of Archery Ranges
Operating Budget City/Village Park District City/Village Park District Overall Average
<100,000 0 0 0.0 0.0 0.0
100,000~ 1,000,000 0 1 0.0 1.0 1.0
1,000,000~ 2,500,000 1 3 1.0 1.0 1.0
2,500,000~ 5,000,000 1 1 1.0 1.0 1.0
5,000,000~ 7,500,000 0 1 0.0 1.0 1.0
7,500,000~ 10,000,000 0 1 0.0 1.0 1.0
10,000,000 + 0 8 0.0 1.6 1.6
Unknown 0 1 0.0 1.0 1.0
Total 2 16 1.0 1.2 1.2
0%
2%
4%
6%
8%
10%
12%
14%
16%
18%
0% 0%
5%
3%
0% 0%
6% 6%
0%
4%
9%
17%
Per
cen
tag
e o
f S
am
e T
yp
e R
esp
on
din
g A
gen
cies
Community Population Size
Percentage of Agencies That Report Having Archery Ranges -
Community Population Size
Cities/Villages That Report
Having Archery Ranges
Park Districts That Report
Having Archery Ranges
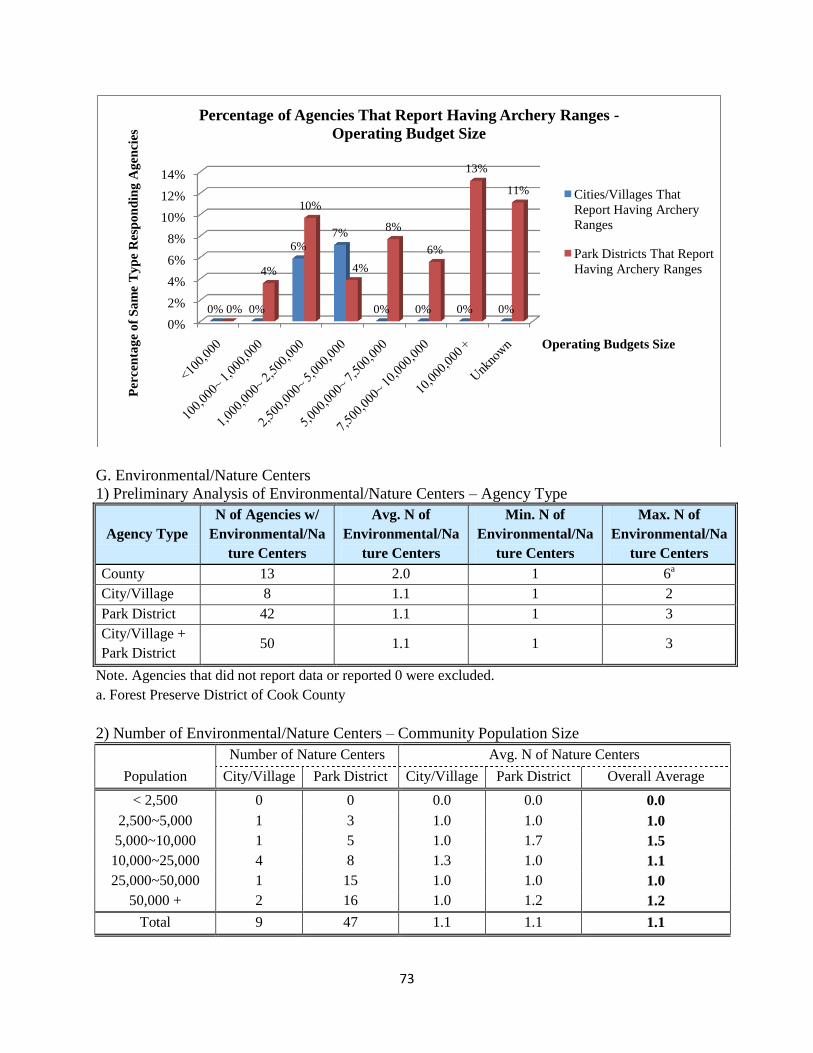
73
G. Environmental/Nature Centers
1) Preliminary Analysis of Environmental/Nature Centers – Agency Type
Agency Type
N of Agencies w/
Environmental/Na
ture Centers
Avg. N of
Environmental/Na
ture Centers
Min. N of
Environmental/Na
ture Centers
Max. N of
Environmental/Na
ture Centers
County 13 2.0 1 6a
City/Village 8 1.1 1 2
Park District 42 1.1 1 3
City/Village +
Park District 50 1.1 1 3
Note. Agencies that did not report data or reported 0 were excluded.
a. Forest Preserve District of Cook County
2) Number of Environmental/Nature Centers – Community Population Size
Number of Nature Centers Avg. N of Nature Centers
Population City/Village Park District City/Village Park District Overall Average
< 2,500 0 0 0.0 0.0 0.0
2,500~5,000 1 3 1.0 1.0 1.0
5,000~10,000 1 5 1.0 1.7 1.5
10,000~25,000 4 8 1.3 1.0 1.1
25,000~50,000 1 15 1.0 1.0 1.0
50,000 + 2 16 1.0 1.2 1.2
Total 9 47 1.1 1.1 1.1
0%
2%
4%
6%
8%
10%
12%
14%
0% 0%
6%7%
0% 0% 0% 0%0%
4%
10%
4%
8%
6%
13%
11%
Per
cen
tag
e o
f S
am
e T
yp
e R
esp
on
din
g A
gen
cies
Operating Budgets Size
Percentage of Agencies That Report Having Archery Ranges -
Operating Budget Size
Cities/Villages That
Report Having Archery
Ranges
Park Districts That Report
Having Archery Ranges
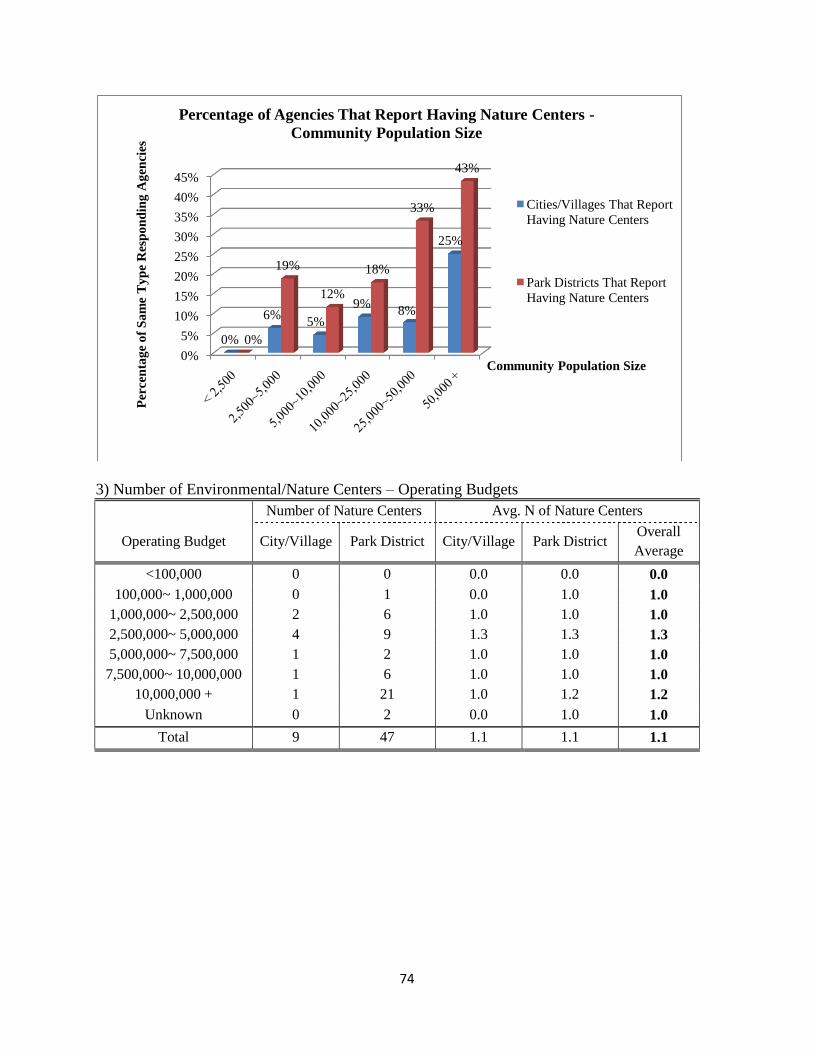
74
3) Number of Environmental/Nature Centers – Operating Budgets
Number of Nature Centers Avg. N of Nature Centers
Operating Budget City/Village Park District City/Village Park District Overall
Average
<100,000 0 0 0.0 0.0 0.0
100,000~ 1,000,000 0 1 0.0 1.0 1.0
1,000,000~ 2,500,000 2 6 1.0 1.0 1.0
2,500,000~ 5,000,000 4 9 1.3 1.3 1.3
5,000,000~ 7,500,000 1 2 1.0 1.0 1.0
7,500,000~ 10,000,000 1 6 1.0 1.0 1.0
10,000,000 + 1 21 1.0 1.2 1.2
Unknown 0 2 0.0 1.0 1.0
Total 9 47 1.1 1.1 1.1
0%
5%
10%
15%
20%
25%
30%
35%
40%
45%
0%
6%5%
9%8%
25%
0%
19%
12%
18%
33%
43%
Per
cen
tag
e o
f S
am
e T
yp
e R
esp
on
din
g A
gen
cies
Community Population Size
Percentage of Agencies That Report Having Nature Centers -
Community Population Size
Cities/Villages That Report
Having Nature Centers
Park Districts That Report
Having Nature Centers
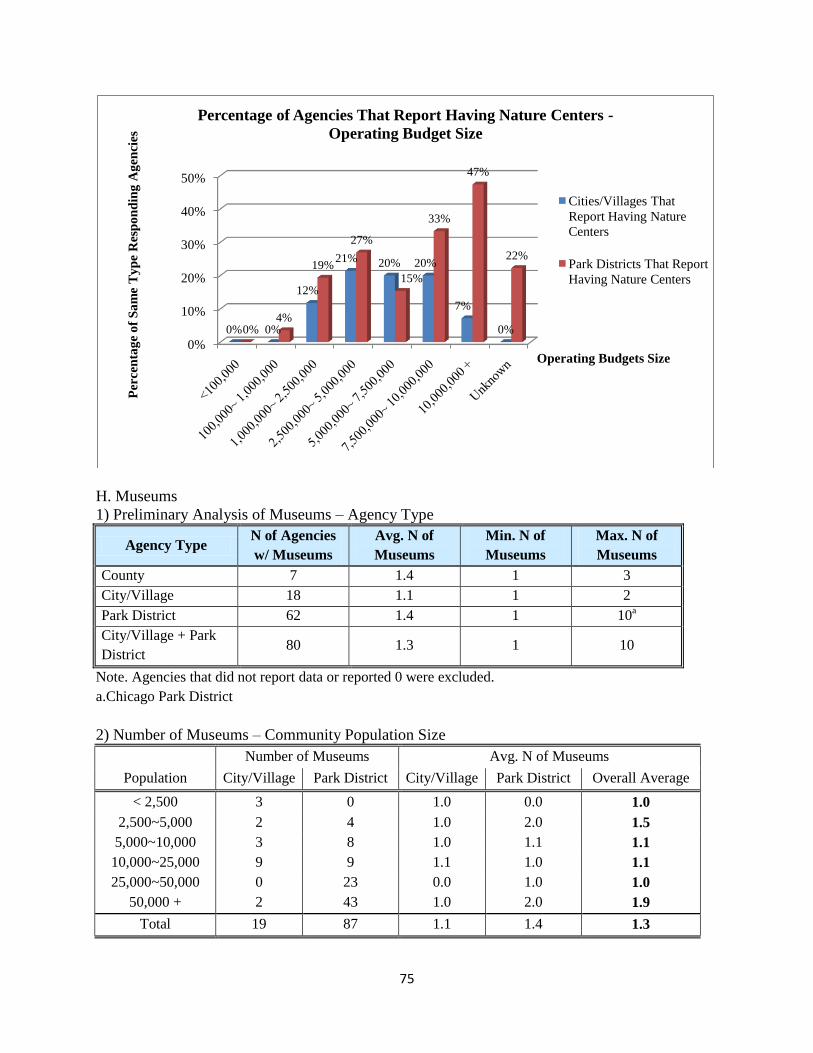
75
H. Museums
1) Preliminary Analysis of Museums – Agency Type
Agency Type N of Agencies
w/ Museums
Avg. N of
Museums
Min. N of
Museums
Max. N of
Museums
County 7 1.4 1 3
City/Village 18 1.1 1 2
Park District 62 1.4 1 10a
City/Village + Park
District 80 1.3 1 10
Note. Agencies that did not report data or reported 0 were excluded.
a.Chicago Park District
2) Number of Museums – Community Population Size
Number of Museums Avg. N of Museums
Population City/Village Park District City/Village Park District Overall Average
< 2,500 3 0 1.0 0.0 1.0
2,500~5,000 2 4 1.0 2.0 1.5
5,000~10,000 3 8 1.0 1.1 1.1
10,000~25,000 9 9 1.1 1.0 1.1
25,000~50,000 0 23 0.0 1.0 1.0
50,000 + 2 43 1.0 2.0 1.9
Total 19 87 1.1 1.4 1.3
0%
10%
20%
30%
40%
50%
0% 0%
12%
21% 20% 20%
7%
0%0%4%
19%
27%
15%
33%
47%
22%
Per
cen
tag
e o
f S
am
e T
yp
e R
esp
on
din
g A
gen
cies
Operating Budgets Size
Percentage of Agencies That Report Having Nature Centers -
Operating Budget Size
Cities/Villages That
Report Having Nature
Centers
Park Districts That Report
Having Nature Centers
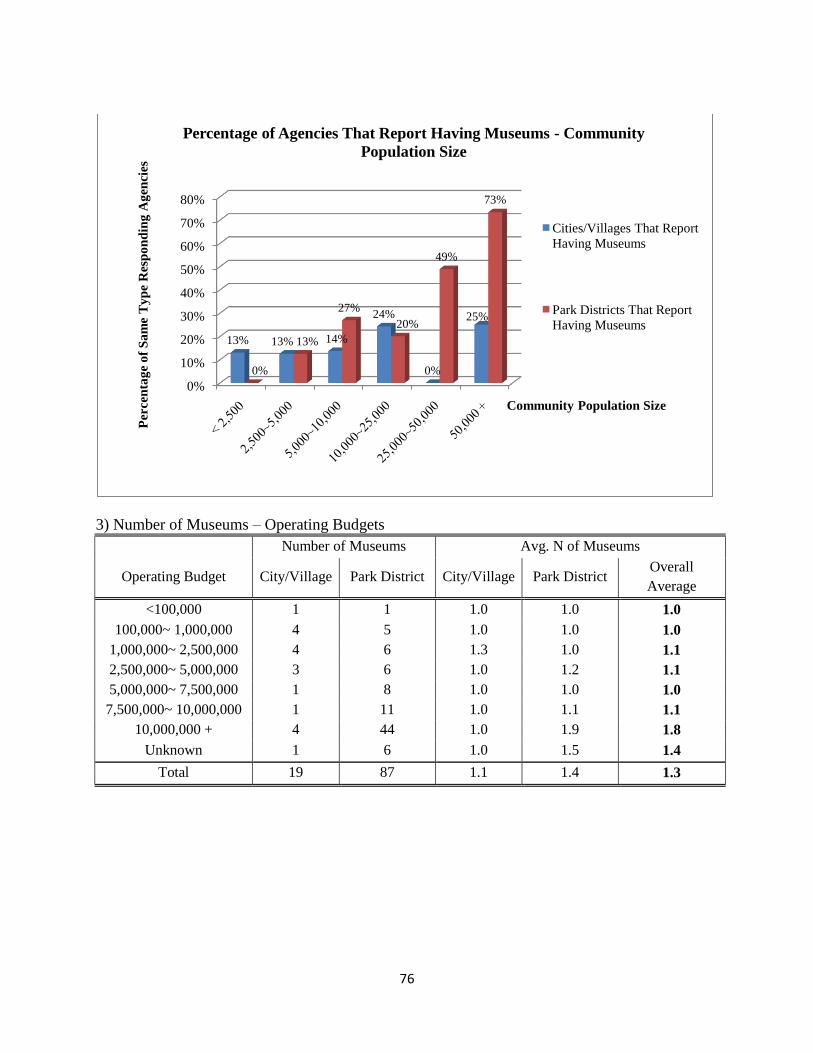
76
3) Number of Museums – Operating Budgets
Number of Museums Avg. N of Museums
Operating Budget City/Village Park District City/Village Park District Overall
Average
<100,000 1 1 1.0 1.0 1.0
100,000~ 1,000,000 4 5 1.0 1.0 1.0
1,000,000~ 2,500,000 4 6 1.3 1.0 1.1
2,500,000~ 5,000,000 3 6 1.0 1.2 1.1
5,000,000~ 7,500,000 1 8 1.0 1.0 1.0
7,500,000~ 10,000,000 1 11 1.0 1.1 1.1
10,000,000 + 4 44 1.0 1.9 1.8
Unknown 1 6 1.0 1.5 1.4
Total 19 87 1.1 1.4 1.3
0%
10%
20%
30%
40%
50%
60%
70%
80%
13% 13% 14%
24%
0%
25%
0%
13%
27%
20%
49%
73%
Per
cen
tag
e o
f S
am
e T
yp
e R
esp
on
din
g A
gen
cies
Community Population Size
Percentage of Agencies That Report Having Museums - Community
Population Size
Cities/Villages That Report
Having Museums
Park Districts That Report
Having Museums
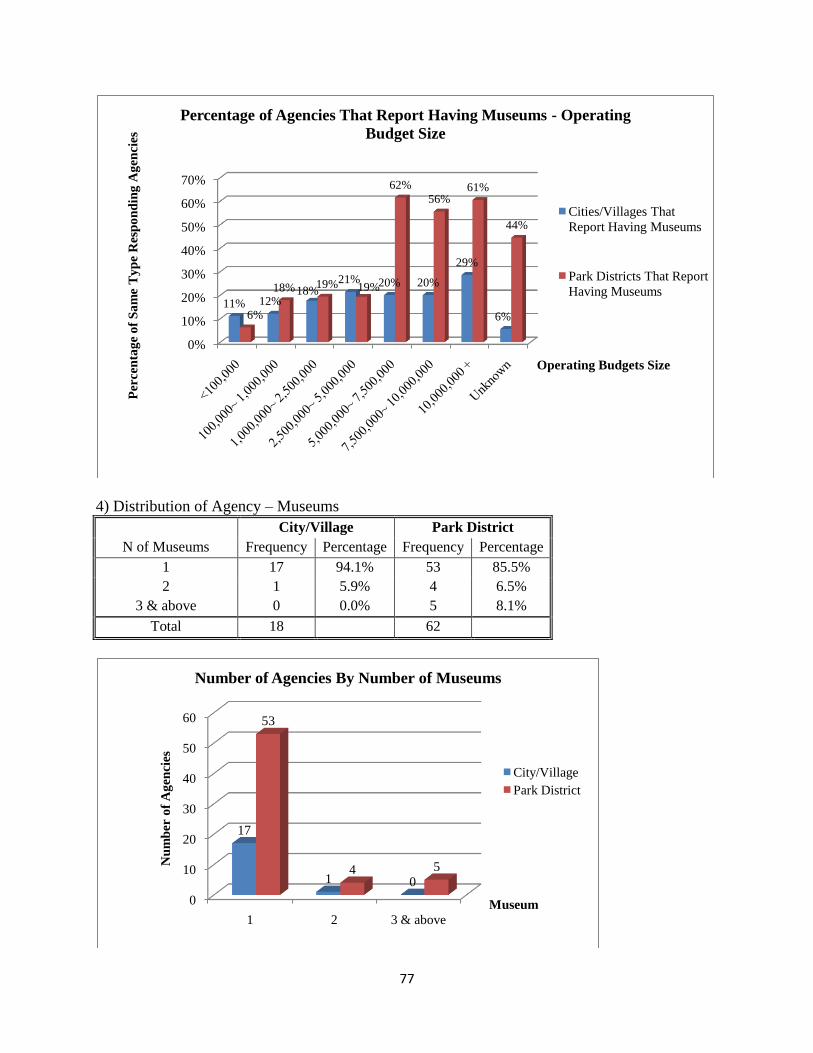
77
4) Distribution of Agency – Museums
City/Village Park District
N of Museums Frequency Percentage Frequency Percentage
1 17 94.1% 53 85.5%
2 1 5.9% 4 6.5%
3 & above 0 0.0% 5 8.1%
Total 18 62
0%
10%
20%
30%
40%
50%
60%
70%
11% 12%18%
21% 20% 20%
29%
6%6%
18% 19% 19%
62%
56%61%
44%
Per
cen
tag
e o
f S
am
e T
yp
e R
esp
on
din
g A
gen
cies
Operating Budgets Size
Percentage of Agencies That Report Having Museums - Operating
Budget Size
Cities/Villages That
Report Having Museums
Park Districts That Report
Having Museums
0
10
20
30
40
50
60
1 2 3 & above
17
1 0
53
4 5Nu
mb
er o
f A
gen
cies
Museum
Number of Agencies By Number of Museums
City/Village
Park District
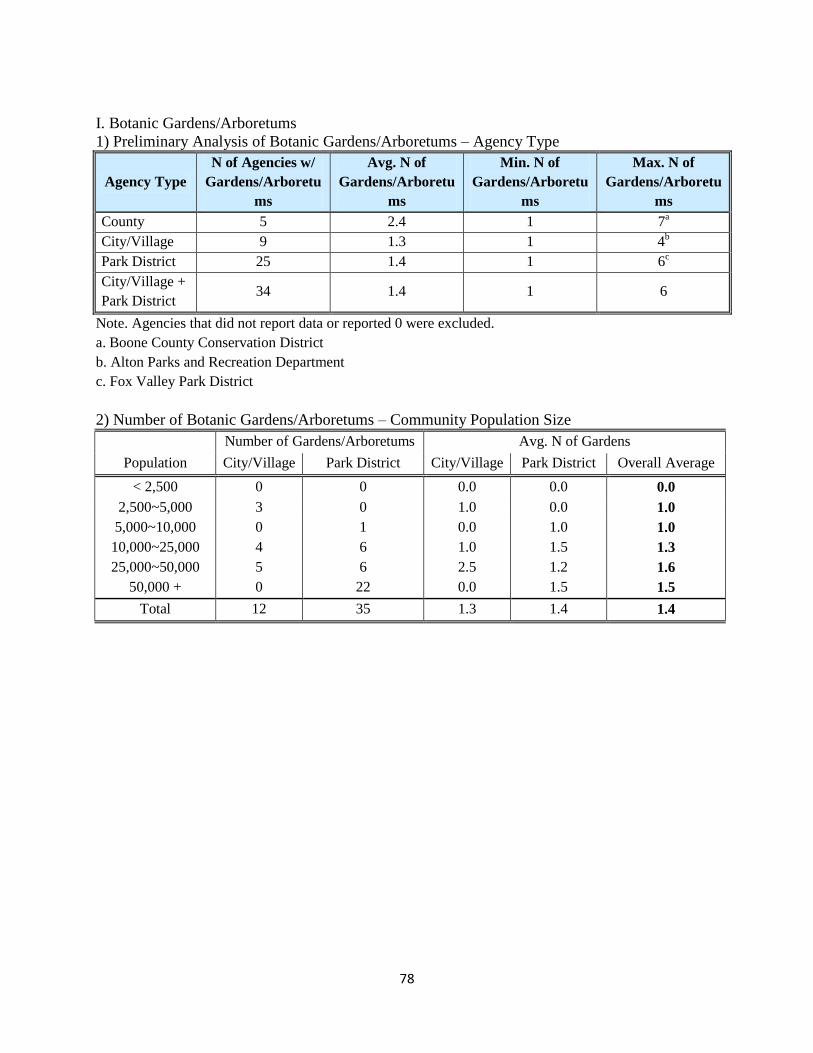
78
I. Botanic Gardens/Arboretums
1) Preliminary Analysis of Botanic Gardens/Arboretums – Agency Type
Agency Type
N of Agencies w/
Gardens/Arboretu
ms
Avg. N of
Gardens/Arboretu
ms
Min. N of
Gardens/Arboretu
ms
Max. N of
Gardens/Arboretu
ms
County 5 2.4 1 7a
City/Village 9 1.3 1 4b
Park District 25 1.4 1 6c
City/Village +
Park District 34 1.4 1 6
Note. Agencies that did not report data or reported 0 were excluded.
a. Boone County Conservation District
b. Alton Parks and Recreation Department
c. Fox Valley Park District
2) Number of Botanic Gardens/Arboretums – Community Population Size
Number of Gardens/Arboretums Avg. N of Gardens
Population City/Village Park District City/Village Park District Overall Average
< 2,500 0 0 0.0 0.0 0.0
2,500~5,000 3 0 1.0 0.0 1.0
5,000~10,000 0 1 0.0 1.0 1.0
10,000~25,000 4 6 1.0 1.5 1.3
25,000~50,000 5 6 2.5 1.2 1.6
50,000 + 0 22 0.0 1.5 1.5
Total 12 35 1.3 1.4 1.4
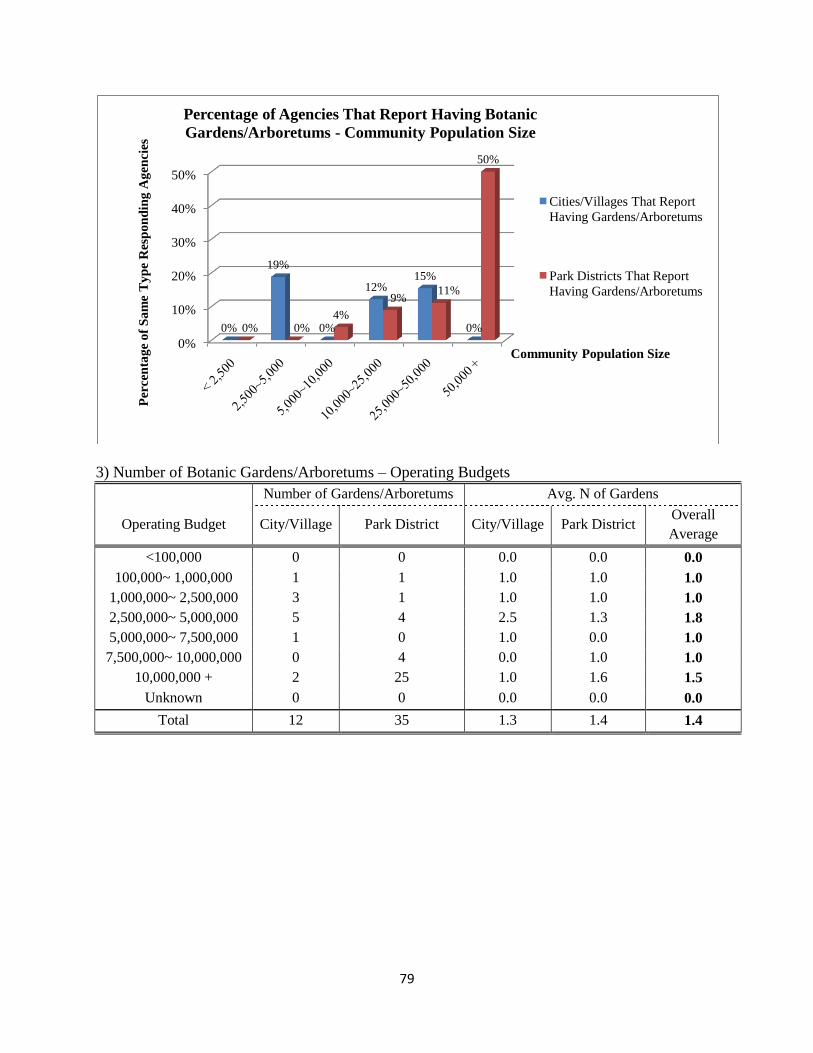
79
3) Number of Botanic Gardens/Arboretums – Operating Budgets
Number of Gardens/Arboretums Avg. N of Gardens
Operating Budget City/Village Park District City/Village Park District Overall
Average
<100,000 0 0 0.0 0.0 0.0
100,000~ 1,000,000 1 1 1.0 1.0 1.0
1,000,000~ 2,500,000 3 1 1.0 1.0 1.0
2,500,000~ 5,000,000 5 4 2.5 1.3 1.8
5,000,000~ 7,500,000 1 0 1.0 0.0 1.0
7,500,000~ 10,000,000 0 4 0.0 1.0 1.0
10,000,000 + 2 25 1.0 1.6 1.5
Unknown 0 0 0.0 0.0 0.0
Total 12 35 1.3 1.4 1.4
0%
10%
20%
30%
40%
50%
0%
19%
0%
12%15%
0%0% 0%4%
9%11%
50%
Per
cen
tag
e o
f S
am
e T
yp
e R
esp
on
din
g A
gen
cies
Community Population Size
Percentage of Agencies That Report Having Botanic
Gardens/Arboretums - Community Population Size
Cities/Villages That Report
Having Gardens/Arboretums
Park Districts That Report
Having Gardens/Arboretums
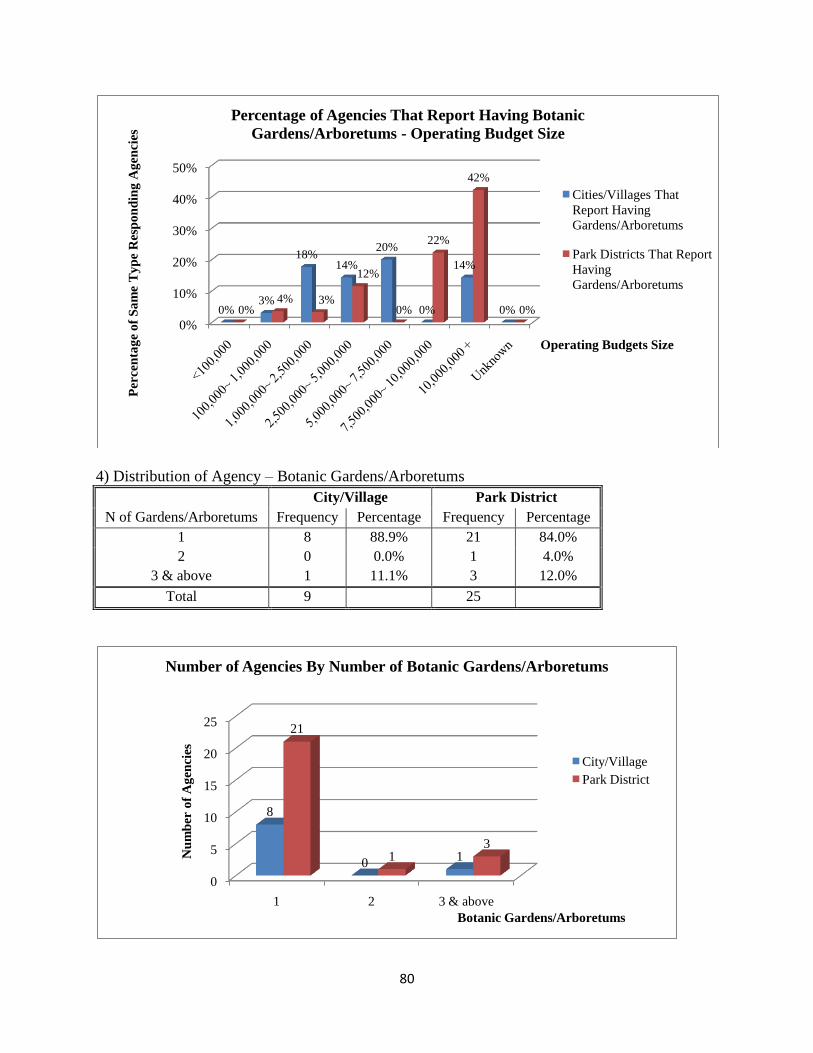
80
4) Distribution of Agency – Botanic Gardens/Arboretums
City/Village Park District
N of Gardens/Arboretums Frequency Percentage Frequency Percentage
1 8 88.9% 21 84.0%
2 0 0.0% 1 4.0%
3 & above 1 11.1% 3 12.0%
Total 9 25
0%
10%
20%
30%
40%
50%
0%3%
18%14%
20%
0%
14%
0%0%4% 3%
12%
0%
22%
42%
0%
Per
cen
tag
e o
f S
am
e T
yp
e R
esp
on
din
g A
gen
cies
Operating Budgets Size
Percentage of Agencies That Report Having Botanic
Gardens/Arboretums - Operating Budget Size
Cities/Villages That
Report Having
Gardens/Arboretums
Park Districts That Report
Having
Gardens/Arboretums
0
5
10
15
20
25
1 2 3 & above
8
01
21
13
Nu
mb
er o
f A
gen
cies
Botanic Gardens/Arboretums
Number of Agencies By Number of Botanic Gardens/Arboretums
City/Village
Park District

81
Appendix B: Survey Instruments
82
Dear Colleague:
The Office of Recreation and Park Resources (ORPR) at the University of Illinois is under contract with
the Illinois Department of Natural Resources (IDNR), Division of Planning and Division of Grant
Administration, to conduct a survey of city park and recreation departments and park districts in the
State of Illinois.
The information gathered in the survey is used by the planning Division of IDNR in the development and
updates to their Statewide Comprehensive Outdoor Recreation Plan (SCORP). The data is also used by
the Grant Division in their review processes. Any city or park district that submits a completed survey
and applies for an OSLAD grant receives extra credit in their grant review process. By filling out the
survey, you also help the Illinois Department of Natural Resources, the Office of Recreation and Park
Resources, the Illinois Municipal League (IML) and the Illinois Association of Park Districts (IAPD) develop
a more complete inventory of community park and recreation facilities in our State.
This year we ask for some information that was not included in the 2008 survey i.e. boat and canoe
launch ramps, campsites and more details concerning trails and paths. IDNR and ORPR are also
interested in identifying cities and park districts that provide “natural areas”. For the purpose of this
study, “natural areas” are defined as “space specifically preserved for the functions of habitat
restoration/preservation, species biodiversity, public health and appreciation of native plants and
wildlife.” (Barry).
A copy of the survey is enclosed. It can also be found at our website www.orpr.uiuc.edu. The survey is
on the homepage under Announcements titled “IDNR Recreation Facilities Survey”. Just click on the link
and follow the instructions to complete it.
We respectfully request that you or an appointed staff member please complete the survey on-line or
the hard copy enclosed.
If you have any questions, please contact Robin Hall through e-mail at [email protected] or by phone at
(217) 244-3891.
Thank you for your consideration and time.
Robin Hall, Director
Office of Recreation and Park Resources
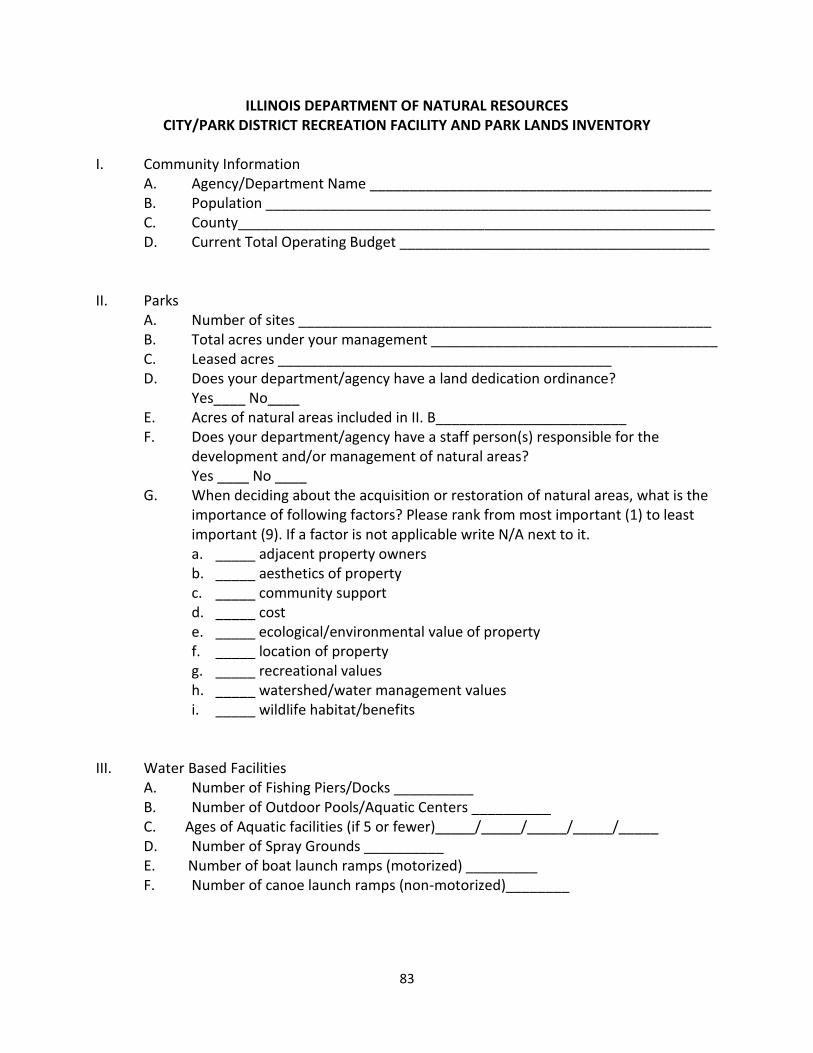
83
ILLINOIS DEPARTMENT OF NATURAL RESOURCES CITY/PARK DISTRICT RECREATION FACILITY AND PARK LANDS INVENTORY
I. Community Information A. Agency/Department Name ___________________________________________ B. Population ________________________________________________________ C. County____________________________________________________________ D. Current Total Operating Budget _______________________________________ II. Parks A. Number of sites ____________________________________________________ B. Total acres under your management ____________________________________ C. Leased acres __________________________________________ D. Does your department/agency have a land dedication ordinance? Yes____ No____
E. Acres of natural areas included in II. B________________________ F. Does your department/agency have a staff person(s) responsible for the
development and/or management of natural areas? Yes ____ No ____ G. When deciding about the acquisition or restoration of natural areas, what is the
importance of following factors? Please rank from most important (1) to least important (9). If a factor is not applicable write N/A next to it. a. _____ adjacent property owners b. _____ aesthetics of property c. _____ community support d. _____ cost e. _____ ecological/environmental value of property f. _____ location of property g. _____ recreational values h. _____ watershed/water management values i. _____ wildlife habitat/benefits
III. Water Based Facilities A. Number of Fishing Piers/Docks __________ B. Number of Outdoor Pools/Aquatic Centers __________ C. Ages of Aquatic facilities (if 5 or fewer)_____/_____/_____/_____/_____ D. Number of Spray Grounds __________ E. Number of boat launch ramps (motorized) _________ F. Number of canoe launch ramps (non-motorized)________
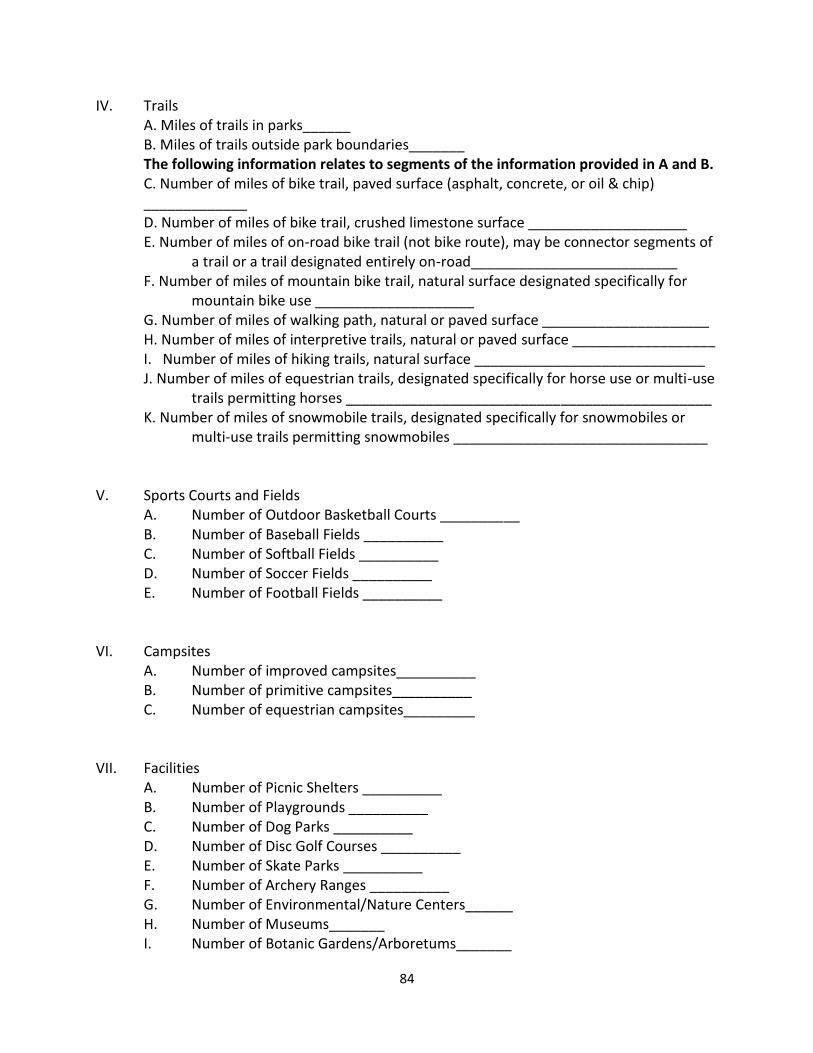
84
IV. Trails A. Miles of trails in parks______ B. Miles of trails outside park boundaries_______
The following information relates to segments of the information provided in A and B. C. Number of miles of bike trail, paved surface (asphalt, concrete, or oil & chip) _____________ D. Number of miles of bike trail, crushed limestone surface ____________________ E. Number of miles of on-road bike trail (not bike route), may be connector segments of
a trail or a trail designated entirely on-road__________________________ F. Number of miles of mountain bike trail, natural surface designated specifically for
mountain bike use ____________________ G. Number of miles of walking path, natural or paved surface _____________________ H. Number of miles of interpretive trails, natural or paved surface __________________ I. Number of miles of hiking trails, natural surface _____________________________ J. Number of miles of equestrian trails, designated specifically for horse use or multi-use
trails permitting horses ______________________________________________ K. Number of miles of snowmobile trails, designated specifically for snowmobiles or
multi-use trails permitting snowmobiles ________________________________ V. Sports Courts and Fields
A. Number of Outdoor Basketball Courts __________ B. Number of Baseball Fields __________ C. Number of Softball Fields __________
D. Number of Soccer Fields __________ E. Number of Football Fields __________ VI. Campsites
A. Number of improved campsites__________ B. Number of primitive campsites__________ C. Number of equestrian campsites_________
VII. Facilities A. Number of Picnic Shelters __________ B. Number of Playgrounds __________ C. Number of Dog Parks __________ D. Number of Disc Golf Courses __________ E. Number of Skate Parks __________ F. Number of Archery Ranges __________ G. Number of Environmental/Nature Centers______ H. Number of Museums_______ I. Number of Botanic Gardens/Arboretums_______
85
VIII. Operation questions
A. Does your department/agency have a fitness center? Yes___ No___ B. Does your department/agency have a written agreement with a hospital,
medical center, clinic, etc. that provides for the collaborative delivery of services?
Yes___ No___ IX. Contact Information of person completing this questionnaire A. Name ___________________________________________________ B. Phone Number _____________________________________________ C. Email Address _____________________________________________ D. Mail Address ______________________________________________