Embed Size (px)
Citation preview

Oklahoma City Metro
Capitalizes Upon
Momentum
Greater Oklahoma City Chamber
123 Park Ave.
Oklahoma City, OK 73102
(405) 297-8900
www.okcchamber.com
222000111000 GGGrrreeeaaattteeerrr OOOkkklllaaahhhooommmaaa CCCiiitttyyy EEEcccooonnnooommmiiiccc FFFooorrreeecccaaasssttt
Prepared by Russell Evans Director Center for Applied Economic Research Oklahoma State University Overview by Eric Long Manager, Research & Info Services Economic Development Division Greater Oklahoma City Chamber [email protected] (405) 297-8976

2010 Greater Oklahoma City Metropolitan Area Economic Forecast
2
Table of Contents
Overview .................................................................................................................................... 3
National Output .......................................................................................................................... 5
Residential Investment ............................................................................................................... 5
U.S. Employment ....................................................................................................................... 6
U.S. Unemployment Rate .......................................................................................................... 6
Money Supply vs. Excess Reserves .......................................................................................... 7
Federal Budget Surplus ............................................................................................................. 7
State Employment ...................................................................................................................... 8
State Income Growth ................................................................................................................. 8
State Retail Sales ...................................................................................................................... 9
State Summary .......................................................................................................................... 9
Oklahoma City Employment ......................................................................................................10
Oklahoma City Mining ...............................................................................................................10
Oklahoma City Manufacturing ...................................................................................................11
Oklahoma City Construction ......................................................................................................11
Oklahoma City Education & Health Services .............................................................................12
Oklahoma City Government ......................................................................................................12
Oklahoma City Income .............................................................................................................13
Oklahoma City Retail Sales.......................................................................................................14
Oklahoma City Housing ............................................................................................................14
Oklahoma City Employment Forecast Summary .......................................................................15
Oklahoma City Economic Indicators Summary ..........................................................................16

2010 Greater Oklahoma City Metropolitan Area Economic Forecast
3
Overview Oklahoma City chooses to invest in itself while much of the nation stands still The 2010 Greater Oklahoma City Economic Forecast provides a comprehensive analysis of the metro economy. It details historic trends, a snapshot of the current situation, as well as a forecast for the upcoming year. As expected, national economic conditions did catch up with Oklahoma City in late 2009. But, ironically, recessionary conditions will not be the defining story of 2009 for Oklahoma City. Instead, it will be the story of a community that recognized the long term benefits associated with investing in itself. No other city in the country did what Oklahoma City did in 2009. The leadership, citizens, and business community of Oklahoma City recognized that there are opportunities available during a global slowdown. While most of the nation has stagnated during the recession, the Oklahoma City metro has been moving forward. The specific steps taken will forever alter the future of Oklahoma City. Oklahoma City will benefit from a rare combination of public and private investment projects coming to fruition over the next several years. Specifically, the most notable projects include:
The passage of MAPS 3, a $777 million sales tax extension comprised of 8 diverse public projects including a new downtown convention center, a 70-acre world class central park, a new downtown area rail-based streetcar system, and improvements to the Oklahoma River to achieve the finest rowing racecourse in the world.
Devon Energy began construction on its 50 story, $750 million world headquarters in downtown.
Project 180 unveiled a three year, $140 million redesign of downtown streets, sidewalks, parks and plazas that will completely transform the appearance and walkability of downtown.
Realignment of the Interstate 40 Crosstown Expressway, opening up redevelopment opportunities through the “Core to Shore” project.
Continued progress associated with MAPS for Kids, a $700 million investment in the future of education that will result in the new construction or renovation of every school in the Oklahoma City school district (72 schools).
The Tinker Aerospace Complex began to fulfill expectations by adding 1,000 jobs in 2009 to the vacated GM automobile assembly plant. More jobs are expected as workload increases and public-private partnership agreements are created. The 4 million square foot plant had been purchased by the county with ownership being transferred to the military. This only strengthened the position of the state’s largest single site employer.
Focus now shifts to identifying how quickly Oklahoma City will move out of the recession as compared to other metros and the nation. As the rest of the nation entered into the recession, the risk year for Oklahoma City was generally considered to be 2010, if oil and natural gas prices did not rebound to expected levels. That continues to be the case. The region’s economy is more balanced across many sectors, but energy remains an important component. While oil prices began to climb in late 2009 and early 2010, natural gas prices also need to show continual gains to maintain employment.
2010 Greater Oklahoma City Metropolitan Area Economic Forecast
4
We anticipate job reductions in the public sector as reduced revenues are realized over the next 12-18 months. Given the large governmental sector in the Greater Oklahoma City region, this will have some impact on overall employment. However, it would be premature to estimate how this will impact the overall employment picture at this time. The past year was especially challenging for economic development projects throughout the nation. The Greater Oklahoma City region saw reductions in terms of the number of overall recruitment projects, as well as total employment gains from new to market firms. Nationally, there has been a clear shift in economic development strategies toward expansion of existing companies and entrepreneurship activities. Likewise, these efforts are of critical importance for the growth of the Greater Oklahoma City region. Of the more than 58,000 stand-alone or headquartered businesses in the Oklahoma City MSA, approximately 89% have fewer than 10 employees. Historically, recessionary times result in an uptick in the number of new business start-ups. Particular focus will be given to fostering innovation and entrepreneurship while still targeting specific firms outside the region for relocation.

2010 Greater Oklahoma City Metropolitan Area Economic Forecast
5
National Economic Conditions Recovery in 2010?
While economic data reveal a current recessionary experience not unlike previous ones, the abruptness with which the economy faltered and the fears of global credit catastrophes set it apart as the most significant economic event since the Great Depression. The effects of eroded household wealth and the loss of over 7 million payroll jobs will linger through much of the coming decade. Meanwhile, the effects of unprecedented monetary and fiscal policy as well as the erosion of
confidence in the U.S dollar as a reserve currency will linger for generations. Economic recovery is underway but is likely to proceed slowly and only then with continued support from monetary authorities. Our current forecast calls for 2.2% growth in U.S. Real GDP, well below historical trend growth. Real questions remain about the ability of the economy to generate activity of its own accord at levels consistent with significant job creation. This question is likely to remain unanswered until well into the new year.
At the heart of the financial crisis of 2008 lie years of overleveraged investments in U.S. residential real estate and the systemic mispricing of risk. Encouraged by federal programs and monetary policy, households and financial institutions expanded balance sheets to finance and refinance real estate purchases. These mortgages then became the foundation for ever more complex financial products coveted by financial institutions, brokerage houses, and fund managers. By late 2005 the residential real estate
construction sector began to contract and would continue doing so through the second quarter of 2009. In the meantime, home prices collapsed setting in motion a chain reaction that would lead previously perceived safe investments to cease trading, leaving an entire asset class, and the balance sheets replete with them, nearly impossible to value; a global credit crisis promptly ensued. While rebounding off their

2010 Greater Oklahoma City Metropolitan Area Economic Forecast
6
124.000
126.000
128.000
130.000
132.000
134.000
136.000
138.000
140.000
-5
-4
-3
-2
-1
0
1
2
3
1999 2000 2001 2002 2003 2004 2005 2006 2007 2008 2009 2010 2011
U.S
. No
n A
g Em
plo
yme
nt,
(M
il)
Pe
rce
nt
Ch
ange
, A
nn
ual
Rat
e
Figure 3: U.S. Non Ag Employment
% Change, Annual Rate U.S. Non Ag Employment
lows, residential fixed investment will grow only modestly in the near term as inventory excess and the erosion of wealth combine to dampen residential construction. Among the most pressing concerns at the national level are a jobless recovery, inflation, and a weak dollar. We address each briefly in turn to present the backdrop against which the state and local forecasts are derived. As economies emerge from recession,
the initial surge in economic activity is nearly always jobless as demand is met through productivity gains rather than new jobs. It is only as recovery persists and productivity increases are exhausted that hiring on a significant scale occurs. While measuring productivity is admittedly complicated in production processes increasingly characterized by imported inputs, we nonetheless expect productivity gains to accommodate much of the expected growth in economic activity in 2010. Indeed, given the scale of employment losses in this recession, the economy would need at least 3-5 years of robust monthly job creation to return to pre-recessionary levels. We project modest job losses to continue throughout the first half of 2010 offset by gains in the latter half of the year.
Recessionary exits are often accompanied by upticks in the unemployment rate; the reason offered by simple mathematics. The Bureau of Labor Statistics includes in its count of the unemployed only those who are willing to work, available for work should an opportunity present itself, and actively seeking employment. Workers who lose their job, grow discouraged, and abandon an active job search fall from the ranks of the unemployed despite wanting, and not having, a
job. As the labor market improves and prospects for employment return, these discouraged workers return to the labor process by way of the unemployed classification. In doing so, the unemployment rate often increases. We project job losses and discouraged workers abandoning a search will keep the unemployment rate at or above 10% for much of the year, with a labor market recovery driving the rate higher before it falls in late 2010. Our current forecast calls for an average yearly unemployment rate of 10.2%.

2010 Greater Oklahoma City Metropolitan Area Economic Forecast
7
The Federal Reserve, through a number of new credit facilities, has successfully provided support to the financial sector while staving off deflationary concerns. However, there remains an unprecedented amount of liquidity on bank balance sheets that must be absorbed by the Fed as they unwind the policies of the previous year. The situation is underscored by a Fed balance sheet that has swelled to over $2 trillion while excess reserves of financial institutions have increased similarly to roughly $1 trillion – over 50 times greater than the peak excess reserves during the post 9-11 recession! The
problems facing the Federal Reserve are now matters of logistics and timing; specifically, when and how to back away from an unprecedented expansion of the central bank’s balance sheet. At present, we expect inflation to remain well controlled in the short term, but remain concerned about inflationary pressures and/or destabilizing restrictive policy as the Fed tries to manage the recovery. Finally, a weak U.S. dollar that has contributed to commodity price increases and dollar carry trades abroad is likely to remain weak by historical standards, but strengthen modestly throughout the course of the year, driven by a combination of recovery and higher interest rates.
The combination of falling tax revenues and fiscal stimulus financing have driven Federal budget deficits to heights not seen in many decades. Current estimates put 2009 deficits at roughly 13% of GDP with projected deficits in 2010 and 2011 just above and just below 10% of GDP respectively. While large deficits are indeed potentially damaging, some perspective is required. First, in contrast to the asset collapse kicking off Japan’s “lost
decade,” this collapse is a (nearly) global phenomenon leaving the world’s developed economies with the largest deficits of recent years. Dealing with deficits will be a challenge for the next several decades, and dealing successfully would leave the U.S. economy in a continued position of relative strength. Second, outlays as a percent of GDP are up only moderately from where they have been in recent administrations, suggesting a transition to more manageable levels of debt may not be far off. Finally, and most importantly, budget deficit figures continue to be among the most widely reported and least understood releases of economic data. Only tomorrow will tell how significant are today’s deficits.

2010 Greater Oklahoma City Metropolitan Area Economic Forecast
8
Oklahoma Economic Conditions Where do we stand relative to the nation?
As an energy state, Oklahoma often lags the nation entering recessions, particularly recessions induced in part by high energy costs. Such was the case with the current recession. Falling home prices eroded the solvency of household and bank balance sheets in pockets of the country, generating secondary effects of credit tightening, declining activity, and a fall in demand for energy. It was only as oil and natural gas prices fell precipitously last fall that Oklahoma began to feel the full effects of the recession. While a robust energy sector provides some
insulation from recessions, Oklahoma is clearly not immune to the effects of a global credit crisis. Indeed, it is likely that only as revisions to state and local data are made that we will appreciate the full extent of the recession within our state. That said, it is important to remember that Oklahoma has fared much better than many parts of the nation and Oklahomans have received significant praise for their economic prudence and resiliency. Jobs contracted at an annual rate of 2% in 2009 and are expected to be flat in 2010. While our current forecast calls for a slight contraction (0.4%), a slight expansion is possible if the labor market turns a few months earlier than we project.
After nearly a decade of strong growth that brought Oklahoma per capita income to approximately 90% of U.S. per capita income, both income and wage disbursements contracted in 2009 (-1.6% and -2.8% respectively). Relative to previous recessionary experiences in the state, income contraction appears disproportionate to job losses. This likely signals revisions to the jobs data, as well as explains much of the disappearing state and local tax revenue through fiscal year 2009 and continuing in FY 2010. We forecast
only modest income growth ahead as a slow recovery, regulatory uncertainty, and tepid borrowers combine to keep commodity prices stable at levels much below their 2008 peak. While much could change in the interim, a full recovery may be as far away as 2012.
-4.0%
-2.0%
0.0%
2.0%
4.0%
6.0%
8.0%
10.0%
12.0%
Figure 8: Income and Salary Disbursments, Annual Growth
Real Personal Income, Growth W & S Disbursments, Growth
1,350
1,400
1,450
1,500
1,550
1,600
1,650
-3.00
-2.00
-1.00
0.00
1.00
2.00
3.00
Em
plo
ym
en
t (0
00
)
Pe
rce
nt
Ch
an
ge
, A
nn
ua
l R
ate
Figure 7: Wage & Salary Employment
% Change, Annual OK Wage & Salary Employment

2010 Greater Oklahoma City Metropolitan Area Economic Forecast
9
With the expansion of income through much of the decade came an expansion of retail sales. While the precipitous fall in energy prices directly impacts severance tax collections and indirectly income tax collections at the state level, it was only as the recession progressed that retail sales fell dramatically impacting the budgets of so many local governments. Retail sales contracted at an 8.5% rate in 2009 and are forecasted to be flat in 2010 as Oklahomans increase savings rates to restore household balance
sheets and prepare for uncertainty ahead. We project that while slow, the current recovery will hold with no significant secondary event in the near term. Retail sales are thus expected to show growth towards the end of 2010 and into 2011, suggesting continued tough times for municipal budgets around the state.
Oklahoma Economic Conditions: Summary The biggest obstacles facing recovery in the state are energy and fiscal budget related. The energy sector has enjoyed a recovery in commodity prices, but the drivers of this price increase remain unclear. To the extent that they represent protection against a weak dollar or bullish sentiments of recovery, current prices may prove unsustainable and yield to unwanted price volatility. Also volatile is the prospect for energy policy reform at the national level. While energy reform has taken a backseat to stimulus and health care reform, we expect the discussion to be revived at a later date. The regulatory uncertainty is particularly concerning to Oklahoma’s many small and medium sized independent producers. We expect production activity to remain relatively subdued until prices not only recover, but are stable and predictable as well. Finally, fiscal challenges at the Capitol and around the state pose challenges not just to policymakers, but also to the individuals employed in state and local service and the firms with whom they deal. A removal of state and local discretionary spending from the economy, while likely required to restore fiscal balance, will serve to partially offset the federal stimulus spending within the state. We currently anticipate a tight 2010 fiscal year before seeing some modest growth in revenues in FY 2011. Employment and Income are projected to be relatively flat with early setbacks offset by second half gains. The unemployment rate in the state is expected to increase modestly early in 2010 before dropping below 7% by late spring/early summer. Oklahoma should hold the income gains made on the nation during the last decade. Across the state, we see little in the way of further deterioration of conditions. Rather, 2010 is likely to be a year of slow recovery, with much new information revealed about the strength of the recovery globally offering a clearer insight into 2011.
0
5,000
10,000
15,000
20,000
25,000
30,000
35,000
40,000
45,000
50,000
-10.0%
-8.0%
-6.0%
-4.0%
-2.0%
0.0%
2.0%
4.0%
6.0%
8.0%
10.0%
Re
tail
Sa
les
($M
il)
Pe
rce
nt
Ch
an
ge
, A
nn
ua
l R
ate
Figure 9: State Retail Sales
% Change, Annual OK Taxable Retail Sales

2010 Greater Oklahoma City Metropolitan Area Economic Forecast
10
Oklahoma City MSA Patience Ahead…
After five years of aggressive jobs growth, the OKC MSA gave back almost 6,000 jobs in 2009 contracting at a 1% annual rate. While weakness was widespread as a result of a global credit crisis and recession, particular weakness is observed in manufacturing and will be revealed in forthcoming revisions to mining employment data. Relative strength remains in Education and Health Services consistent with broader macroeconomic trends. The 2010 forecast calls for flat jobs growth in 2010 with modest losses
early in the year offset by modest gains in the latter half of the year. While much could change in the months ahead, we presently project a mild recovery holding, but progressing slowly in 2010, with a return to moderate growth in 2011.
The mini oil and gas boom enjoyed by the state will stall until a global recovery advances. A fall in prices combined with regulatory uncertainty will conspire to limit new production and curtail workforce expansion. At present, the employment data reflect jobs growth in this sector in 2009; however, experience suggests forthcoming revisions to the data. We expect revisions early in 2010 to reflect the reality we observe around us. While prices have recovered modestly, they are forecasted to remain volatile with persistent risk to the downside if
recovery doesn’t materialize as expected. The forecast looks for continued contraction in 2010 with a 4.1% contraction. The forecast remains upbeat in the long term as we see a return to global demand in 2011 heading into 2012, with the potential for reform to highlight the role of natural gas as a bridge fuel to renewable energy. Ultimately, the mini boom is not over, just suffering from a prolonged stall.
490
500
510
520
530
540
550
560
570
580
590
-2
-1.5
-1
-0.5
0
0.5
1
1.5
2
2.5
3
Tota
l Em
plo
yme
nt,
QC
EW
Pe
rce
nt
Ch
ange
, A
nn
ual
Rat
e
Figure 10: OKC MSA Total Employment
% Change, Annual OKC MSA Employment
0
2
4
6
8
10
12
14
16
18
-15
-10
-5
0
5
10
15
20
25
Em
plo
ym
en
t (0
00
)
Pe
rce
nt
Ch
an
ge
, A
nn
ua
l R
ate
Figure 11: OKC MSA Mining Employment
% Change, Annual MSA Mining Employment

2010 Greater Oklahoma City Metropolitan Area Economic Forecast
11
Statewide patterns of manufacturing employment contraction resumed in 2009, aided by the global recession. Manufacturing remains a vital component to both the state and OKC economies even as the trend of capital for labor substitution reflects jobs weakness. The OKC MSA in particular is aided by a robust aerospace maintenance, repair, and overhaul industry that relies significantly on this industry. Manufacturing activity is supported to a significant degree by the manufacturing industry, making a
critical mass of activity essential to generating an expanding base. The forecast looks for contraction of 5.2% in 2010 with weakness lingering into 2011.
Activity surrounding the mini gas boom combined with ongoing development of the downtown area and broader commercial development fueled an expansion of construction employment through much of the decade. While the OKC MSA is not plagued with the excess residential and commercial inventory experience by much of the nation, sufficient excess inventory exists that, when combined with households restructuring spending habits and lingering concerns about national conditions, construction employment is likely to remain soft through 2010. We look for a
contraction of 2.3% in 2010 followed by modest gains in 2011.
0
10
20
30
40
50
60
-16
-14
-12
-10
-8
-6
-4
-2
0
2
4
Em
plo
ym
en
t (0
00
)
Pe
rce
nt
Ch
an
ge
, A
nn
ua
l R
ate
Figure 12: Manufacturing Employment
% Change, Annual OKC MSA Manufacturing Employment
0
5
10
15
20
25
30
-8
-6
-4
-2
0
2
4
6
8
10
Em
plo
ym
en
t (0
00
)
Pe
rce
nt
Ch
an
ge
, A
nn
ua
l R
ate
Figure 13: Construction Employment
% Change, Annual OKC MSA Construction Employment

2010 Greater Oklahoma City Metropolitan Area Economic Forecast
12
The Education and Health Services sector continues to display significant strength in the metro area economy. The sector has increased its ranks by nearly 30% in the decade from 58,000 workers to just of 75,000 employees. Within the sector, Education continues to show particular strength with a decade long expansion of nearly 77% accompanied by an equally impressive 25% expansion in Health Services. Ongoing momentum, an aging baby-boomer population, and a continuing soft labor market sending discouraged workers back to school
will propel this sector out of the recession. The 2010 forecast looks for a 2.1% expansion driven by a particularly strong increase in Education (1300 jobs). Growth momentum should extend into 2011 and beyond.
The presence of the State Capitol, federal facilities, and tribal governments combine to make Government the largest OKC Metro sector in terms of employment. The sector has increased modestly over the previous decade adding approximately 15,000 jobs, mostly at the state and local level. Federal stimulus dollars should serve to partially offset the difficulties facing the sector from declining tax revenues. It is worth noting that adjustments to employment in the public sector tend to lag private sector adjustments, and a
contraction may yet materialize. However, the data are unambiguous in pointing towards an expansion in 2009, with a modest recovery forming in 2010 combining to generate what may appear to be an unusually optimistic forecast given the recent attention to budget concerns at both the Capitol and City Hall. Indeed, if revenues don’t turn promptly and, consequently, permanent staff reductions ensue, a significant public sector contraction could result. As definitive plans, including proposed reductions and timetables are released, we will incorporate them into the model and update the forecast. At this time, however, a modest 2010 recovery would suggest employment should avoid a significant contraction even in the face of likely staff reductions to balance budgets.
0
10
20
30
40
50
60
70
80
90
0
1
2
3
4
5
6
7
Em
plo
ym
en
t, (
00
0)
% C
ha
ng
e,
An
nu
al
Ra
teFig. 14: Education & Health Services
% Change, Annual Education& Health Services Employment
-3
-2
-1
0
1
2
3
4
5
Pe
rce
nt
Ch
an
ge
, A
nn
ua
l R
ate
Fig. 15: Annual Employment Growth, Public Sector
Federal Gov., Annual Growth State&Local Gov, Annual Growth
Total Gov, Annual Growth

2010 Greater Oklahoma City Metropolitan Area Economic Forecast
13
Real per capita income growth exceeded real personal income growth through much of the period as income gains outstrip population gains. The patterns are reversed in recessions with contracting income levels weighing on per capita income growth. The experiences of 2001-2002 match closely the early estimates of 2008-2009 underscoring the unexpected reality that the current recession is not entirely unlike previous recessions in its depth. It is, however, unique in its breadth as the first global recession in the post-war era. While revisions will likely indicate a more severe experience across that
state, it is increasingly likely that the recession experience will not match in anxiety the crisis that preceded it.
MSA retail sales contracted aggressively in 2009; a trend that is likely to continue into 2010. Retail spending, driven nationally by extracting homeowner equity and locally by high energy prices and a robust economic expansion, will be subdued as Oklahomans adjust to lower levels of energy related income and seek to restore health to balance sheets damaged by the free fall in equity prices in 2008. While equity prices have recovered nicely off their lows, uncertainty breeding volatility remains leaving future conditions unclear. The
delicate balance of a secure economic foundation and optimistic consumer psychology is not likely to return until late 2010 at the earliest. We currently project retail sales to contract at a 3.3% annual rate in 2010 before showing 3% growth in 2011. Persistent weakness in retail sales will correlate with ongoing strains to metro area fiscal budgets.
-5
0
5
10
15
20
Pe
rce
nt
Ch
an
ge
, A
nn
ua
l R
ate
Figure 16: MSA Personal & Per Capita Income Growth
Real Personal Income Growth Real Per Capita Income Growth
0
2000
4000
6000
8000
10000
12000
14000
16000
18000
-4
-2
0
2
4
6
8
10
12
Re
tail
Sa
les
($M
il)
Pe
rce
nt
Ch
an
ge
, A
nn
ua
l R
ate
Figure 17: OKC MSA Retail Sales
% Change, Annual Retail Sales, OKC MSA

2010 Greater Oklahoma City Metropolitan Area Economic Forecast
14
Throughout the previous decade, retail sales growth at the state level and within the state’s largest metro areas has largely moved together. This seems not the be the case in the current recession, with the state showing a significant contraction in 2009 even as data indicate a less severe contraction in the metro areas. In contrast, the 2010 forecast looks for an easing to the contraction at the state level even as weakness lingers in the metros. While work continues on this front, we remain cautiously optimistic that retail sales contraction in the OKC MSA are
overstated and are hopeful for a more muted contraction.
Oklahoma City continues to show strength relative to the nation in local housing markets. While prices have fallen throughout most major metro areas, the OKC MSA has held on to recent appreciations. Housing prices are likely to remain stable as inventory and economic conditions keep downward pressure on prices. Like many aspects of the local economy, a full recovery and return to robust growth is not expected until 2011 and beyond.
-10
-5
0
5
10
15
Figure 18: Retail Sales, Annual Growth
Retail Sales Growth, State Retail Sales Growth, OKC Retail Sales Growth, Tulsa
0
20
40
60
80
100
120
140
160
180
200
OK
C H
PI
Figure 19: OKC MSA Housing Price Index
OKC MSA Housing Price Index

2010 Greater Oklahoma City Metropolitan Area Economic Forecast
15
Greater Oklahoma City Employment Forecast Summary (Thousands, percent change at annual rate)
Source: Bureau of Labor Statistics, OSU Center for Applied Economics Research.
eEstimate
fForecast
Sector 2000 2001 2002 2003 2004 2005 2006 2007 2008 2009e 2010f 2011f
Total 535.77 542.45 538.31 529.28 538.56 550.73 560.45 568.64 575.30 569.38 569.21 581.79
2.4% 1.2% -0.8% -1.7% 1.8% 2.3% 1.8% 1.5% 1.2% -1.0% 0.0% 2.2%
Natural Resources & Mining 6.65 7.47 7.47 7.93 9.05 10.52 12.75 14.43 16.02 16.83 16.13 16.18
11.1% 12.4% -0.1% 6.2% 14.1% 16.3% 21.2% 13.2% 11.0% 5.1% -4.1% 0.3%
Construction 22.55 23.28 22.00 22.70 23.51 25.20 26.43 26.55 27.78 27.31 26.68 27.21
5.3% 3.3% -5.5% 3.2% 3.6% 7.2% 4.9% 0.4% 4.6% -1.7% -2.3% 2.0%
Manufacturing 51.91 48.57 41.89 38.82 38.99 38.62 38.28 37.04 36.95 35.51 33.65 32.72
-2.9% -6.4% -13.7% -7.3% 0.4% -0.9% -0.9% -3.2% -0.2% -3.9% -5.2% -2.7%
Non-Durable Goods 13.97 12.72 12.02 11.28 11.48 11.64 11.27 9.57 9.36 9.45 9.18 8.95
-3.2% -8.9% -5.6% -6.1% 1.8% 1.4% -3.2% -15.1% -2.2% 1.0% -2.8% -2.5%
Durable Goods 37.95 35.85 29.88 27.54 27.51 26.98 27.01 27.48 27.59 26.05 24.47 23.77
-2.7% -5.5% -16.7% -7.8% -0.1% -1.9% 0.1% 1.7% 0.4% -5.6% -6.1% -2.8%
Trade, Transportation, & Utilities 101.96 100.71 99.12 96.97 96.82 99.00 100.31 101.21 100.52 100.21 99.74 101.22
1.9% -1.2% -1.6% -2.2% -0.2% 2.2% 1.3% 0.9% -0.7% -0.3% -0.5% 1.5%
Wholesale Trade 22.06 21.72 21.42 21.03 21.00 21.71 22.74 22.92 23.03 23.28 23.45 23.83
0.1% -1.5% -1.4% -1.8% -0.2% 3.4% 4.7% 0.8% 0.5% 1.1% 0.7% 1.6%
Retail Trade 62.61 61.65 61.50 60.63 60.40 61.42 61.56 61.99 62.12 62.45 62.33 63.12
3.2% -1.5% -0.2% -1.4% -0.4% 1.7% 0.2% 0.7% 0.2% 0.5% -0.2% 1.3%
Transportation, Warehousing, & Utilities 17.29 17.34 16.20 15.32 15.43 15.86 16.02 16.29 15.37 14.50 13.96 14.28
-0.4% 0.3% -6.6% -5.4% 0.8% 2.8% 1.0% 1.7% -5.6% -5.7% -3.7% 2.3%
Information 13.92 14.45 14.03 13.46 13.62 13.38 13.18 12.51 12.61 12.21 11.90 12.29
18.4% 3.8% -2.9% -4.1% 1.2% -1.7% -1.5% -5.1% 0.8% -3.2% -2.5% 3.3%
Financial Activities 33.72 34.36 35.34 34.88 35.38 34.51 34.48 34.37 34.03 33.58 33.50 33.62
-0.1% 1.9% 2.8% -1.3% 1.4% -2.4% -0.1% -0.3% -1.0% -1.3% -0.3% 0.4%
Finance & Insurance 22.95 23.56 24.30 24.19 24.22 23.25 23.07 23.20 23.60 23.11 23.00 22.98
-0.1% 2.6% 3.1% -0.4% 0.1% -4.0% -0.7% 0.5% 1.8% -2.1% -0.5% -0.1%
Real Estate, Rental & Leasing 10.77 10.80 11.04 10.70 11.15 11.27 11.41 11.17 10.43 10.48 10.50 10.64
0.0% 0.3% 2.2% -3.1% 4.3% 1.0% 1.3% -2.1% -6.7% 0.5% 0.2% 1.3%
Professional & Business Services 66.62 68.53 67.85 64.79 66.52 69.95 72.20 74.84 75.34 68.65 68.05 73.96
5.2% 2.9% -1.0% -4.5% 2.7% 5.2% 3.2% 3.7% 0.7% -8.9% -0.9% 8.7%
Professional, Scientific, & Technical 21.43 23.21 23.79 24.67 24.75 25.39 26.66 27.37 28.08 27.21 26.84 27.82
7.3% 8.3% 2.5% 3.7% 0.3% 2.6% 5.0% 2.7% 2.6% -3.1% -1.4% 3.7%
Mgt. of Companies & Enterprises 5.07 5.26 5.17 4.51 4.76 4.81 5.08 5.88 6.12 5.88 5.65 5.72
1.8% 3.8% -1.7% -12.9% 5.6% 1.1% 5.5% 15.9% 4.0% -3.9% -3.9% 1.2%
Admin., Support, & Waste Mgt. 40.12 40.06 38.89 35.62 37.00 39.74 40.47 41.58 41.15 35.57 35.57 40.42
4.6% -0.2% -2.9% -8.4% 3.9% 7.4% 1.9% 2.7% -1.1% -13.5% 0.0% 13.6%
Education & Health Services 58.57 60.81 64.37 65.47 67.69 69.05 70.23 72.72 75.43 75.86 77.42 80.91
0.4% 3.8% 5.9% 1.7% 3.4% 2.0% 1.7% 3.5% 3.7% 0.6% 2.1% 4.5%
Educational Services 4.72 5.00 5.39 6.52 7.27 7.64 7.46 7.87 8.15 8.37 9.63 10.65
5.0% 6.0% 7.9% 20.9% 11.5% 5.1% -2.4% 5.6% 3.5% 2.7% 15.0% 10.6%
Health Care & Social Assistance 53.86 55.82 58.98 58.95 60.42 61.41 62.77 64.84 67.28 67.48 67.79 70.26
0.0% 3.6% 5.7% -0.1% 2.5% 1.6% 2.2% 3.3% 3.8% 0.3% 0.5% 3.6%
Leisure & Hospitality 49.12 50.88 51.74 52.01 53.44 55.09 55.82 55.95 56.96 58.24 58.94 59.82
4.8% 3.6% 1.7% 0.5% 2.7% 3.1% 1.3% 0.2% 1.8% 2.2% 1.2% 1.5%
Arts, Entertain., Recreation & Accomod. 10.21 10.67 10.76 10.32 10.58 10.81 11.36 11.60 11.81 12.67 12.99 13.12
2.2% 4.5% 0.8% -4.1% 2.6% 2.1% 5.1% 2.1% 1.9% 7.2% 2.5% 1.0%
Food Services & Drinking Places 38.91 40.21 40.98 41.69 42.84 44.28 44.46 44.35 45.15 45.58 45.96 46.69
5.5% 3.3% 1.9% 1.7% 2.8% 3.4% 0.4% -0.3% 1.8% 1.0% 0.8% 1.6%
Other Services 24.07 24.23 23.96 23.48 23.21 23.19 23.00 23.20 23.46 22.86 22.63 23.03
1.9% 0.7% -1.1% -2.0% -1.1% -0.1% -0.8% 0.9% 1.1% -2.6% -1.0% 1.7%
Total Government 106.68 109.13 110.53 108.76 110.34 112.19 113.75 115.82 116.20 118.23 120.56 120.84
2.0% 2.3% 1.3% -1.6% 1.4% 1.7% 1.4% 1.8% 0.3% 1.7% 2.0% 0.2%
Federal Government 27.17 27.08 27.15 26.86 26.93 26.56 26.43 26.30 25.73 26.08 26.89 26.23
4.6% -0.3% 0.2% -1.0% 0.3% -1.4% -0.5% -0.5% -2.2% 1.4% 3.1% -2.5%
State & Local Government 79.50 82.05 83.38 81.90 83.40 85.63 87.32 89.52 90.48 92.16 93.67 94.61
1.1% 3.2% 1.6% -1.8% 1.8% 2.7% 2.0% 2.5% 1.1% 1.9% 1.6% 1.0%eEstimate
fForecast 2000 2001 2002 2003 2004 2005 2006 2007 2008 2009e 2010f 2011f
Oklahoma City MSA Non-Farm Wage & Salary Employment(Seasonally adjusted, in Thousands)
PR
IVA
TE
GO
OD
SS
ER
VIC
ES
GO
VE
RN
ME
NT
2010 Greater Oklahoma City Metropolitan Area Economic Forecast
16
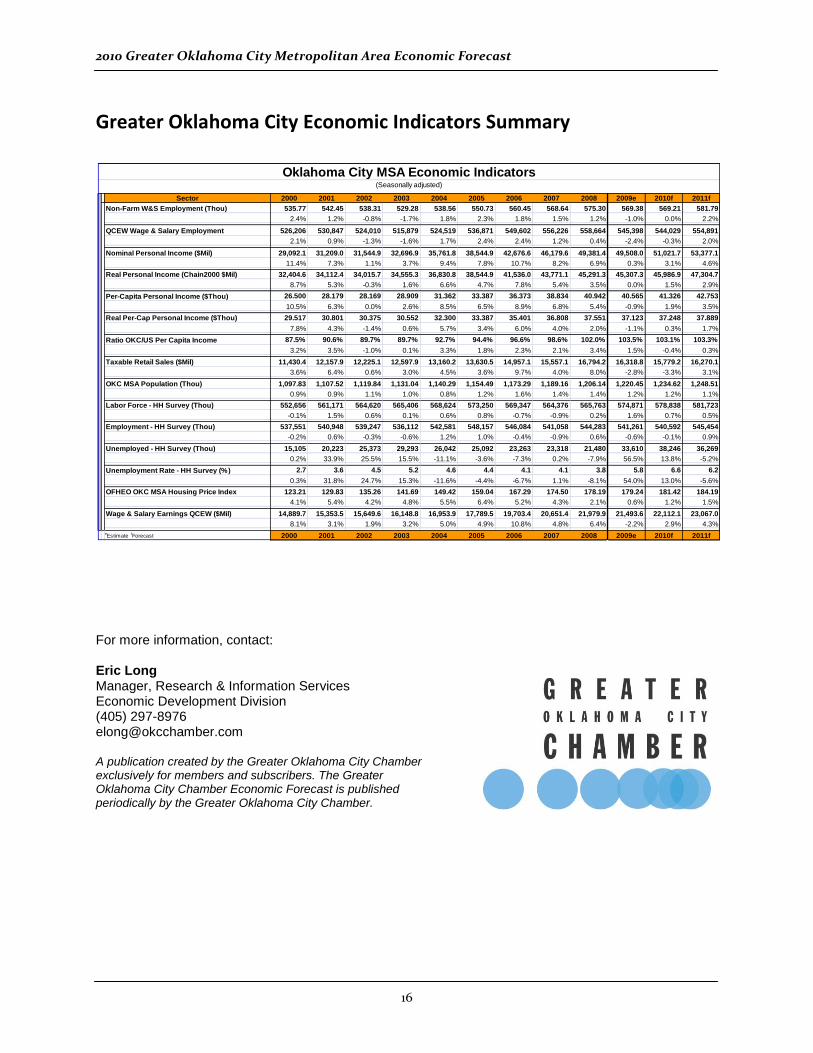
Greater Oklahoma City Economic Indicators Summary
For more information, contact: Eric Long Manager, Research & Information Services Economic Development Division (405) 297-8976 [email protected] A publication created by the Greater Oklahoma City Chamber exclusively for members and subscribers. The Greater Oklahoma City Chamber Economic Forecast is published periodically by the Greater Oklahoma City Chamber.
Sector 2000 2001 2002 2003 2004 2005 2006 2007 2008 2009e 2010f 2011f
Non-Farm W&S Employment (Thou) 535.77 542.45 538.31 529.28 538.56 550.73 560.45 568.64 575.30 569.38 569.21 581.79
2.4% 1.2% -0.8% -1.7% 1.8% 2.3% 1.8% 1.5% 1.2% -1.0% 0.0% 2.2%
QCEW Wage & Salary Employment 526,206 530,847 524,010 515,879 524,519 536,871 549,602 556,226 558,664 545,398 544,029 554,891
2.1% 0.9% -1.3% -1.6% 1.7% 2.4% 2.4% 1.2% 0.4% -2.4% -0.3% 2.0%
Nominal Personal Income ($Mil) 29,092.1 31,209.0 31,544.9 32,696.9 35,761.8 38,544.9 42,676.6 46,179.6 49,381.4 49,508.0 51,021.7 53,377.1
11.4% 7.3% 1.1% 3.7% 9.4% 7.8% 10.7% 8.2% 6.9% 0.3% 3.1% 4.6%
Real Personal Income (Chain2000 $Mil) 32,404.6 34,112.4 34,015.7 34,555.3 36,830.8 38,544.9 41,536.0 43,771.1 45,291.3 45,307.3 45,986.9 47,304.7
8.7% 5.3% -0.3% 1.6% 6.6% 4.7% 7.8% 5.4% 3.5% 0.0% 1.5% 2.9%
Per-Capita Personal Income ($Thou) 26.500 28.179 28.169 28.909 31.362 33.387 36.373 38.834 40.942 40.565 41.326 42.753
10.5% 6.3% 0.0% 2.6% 8.5% 6.5% 8.9% 6.8% 5.4% -0.9% 1.9% 3.5%
Real Per-Cap Personal Income ($Thou) 29.517 30.801 30.375 30.552 32.300 33.387 35.401 36.808 37.551 37.123 37.248 37.889
7.8% 4.3% -1.4% 0.6% 5.7% 3.4% 6.0% 4.0% 2.0% -1.1% 0.3% 1.7%
Ratio OKC/US Per Capita Income 87.5% 90.6% 89.7% 89.7% 92.7% 94.4% 96.6% 98.6% 102.0% 103.5% 103.1% 103.3%
3.2% 3.5% -1.0% 0.1% 3.3% 1.8% 2.3% 2.1% 3.4% 1.5% -0.4% 0.3%
Taxable Retail Sales ($Mil) 11,430.4 12,157.9 12,225.1 12,597.9 13,160.2 13,630.5 14,957.1 15,557.1 16,794.2 16,318.8 15,779.2 16,270.1
3.6% 6.4% 0.6% 3.0% 4.5% 3.6% 9.7% 4.0% 8.0% -2.8% -3.3% 3.1%
OKC MSA Population (Thou) 1,097.83 1,107.52 1,119.84 1,131.04 1,140.29 1,154.49 1,173.29 1,189.16 1,206.14 1,220.45 1,234.62 1,248.51
0.9% 0.9% 1.1% 1.0% 0.8% 1.2% 1.6% 1.4% 1.4% 1.2% 1.2% 1.1%
Labor Force - HH Survey (Thou) 552,656 561,171 564,620 565,406 568,624 573,250 569,347 564,376 565,763 574,871 578,838 581,723
-0.1% 1.5% 0.6% 0.1% 0.6% 0.8% -0.7% -0.9% 0.2% 1.6% 0.7% 0.5%
Employment - HH Survey (Thou) 537,551 540,948 539,247 536,112 542,581 548,157 546,084 541,058 544,283 541,261 540,592 545,454
-0.2% 0.6% -0.3% -0.6% 1.2% 1.0% -0.4% -0.9% 0.6% -0.6% -0.1% 0.9%
Unemployed - HH Survey (Thou) 15,105 20,223 25,373 29,293 26,042 25,092 23,263 23,318 21,480 33,610 38,246 36,269
0.2% 33.9% 25.5% 15.5% -11.1% -3.6% -7.3% 0.2% -7.9% 56.5% 13.8% -5.2%
Unemployment Rate - HH Survey (%) 2.7 3.6 4.5 5.2 4.6 4.4 4.1 4.1 3.8 5.8 6.6 6.2
0.3% 31.8% 24.7% 15.3% -11.6% -4.4% -6.7% 1.1% -8.1% 54.0% 13.0% -5.6%
OFHEO OKC MSA Housing Price Index 123.21 129.83 135.26 141.69 149.42 159.04 167.29 174.50 178.19 179.24 181.42 184.19
4.1% 5.4% 4.2% 4.8% 5.5% 6.4% 5.2% 4.3% 2.1% 0.6% 1.2% 1.5%
Wage & Salary Earnings QCEW ($Mil) 14,889.7 15,353.5 15,649.6 16,148.8 16,953.9 17,789.5 19,703.4 20,651.4 21,979.9 21,493.6 22,112.1 23,067.0
8.1% 3.1% 1.9% 3.2% 5.0% 4.9% 10.8% 4.8% 6.4% -2.2% 2.9% 4.3%
eEstimate
fForecast 2000 2001 2002 2003 2004 2005 2006 2007 2008 2009e 2010f 2011f
Oklahoma City MSA Economic Indicators(Seasonally adjusted)


![Towards a High Resolution Soil Moisture Map of Oklahoma...Forecast Center Stage IV data was made available by the Oklahoma Mesonet. [3] McPherson, R. A., et al., 2007: Statewide monitoring](https://img.pdfslide.us/doc/110x75/5f7f2b8c49c33b0eee7caf13/towards-a-high-resolution-soil-moisture-map-of-forecast-center-stage-iv-data.jpg)