Embed Size (px)
Citation preview
1
Good morning, we are the team from Continental México and we are here to show you the project called chemical component reduction in electronic powertrain modules.
2
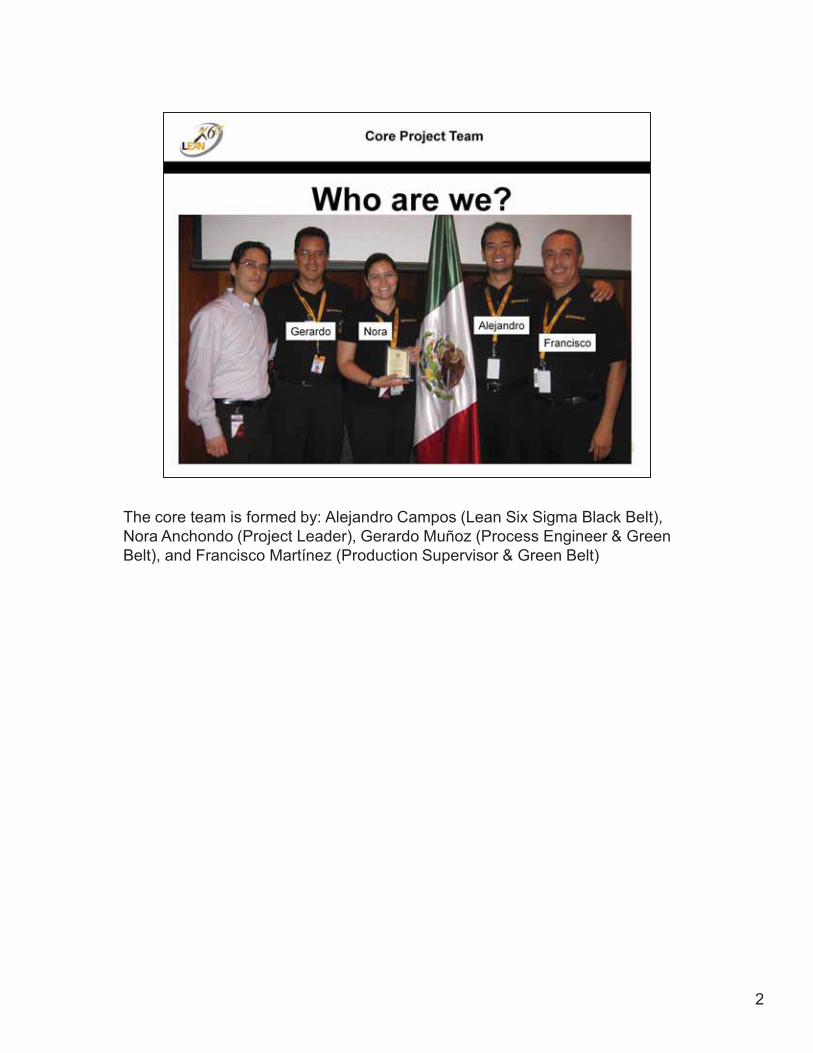
The core team is formed by: Alejandro Campos (Lean Six Sigma Black Belt), Nora Anchondo (Project Leader), Gerardo Muñoz (Process Engineer & Green Belt), and Francisco Martínez (Production Supervisor & Green Belt)
3
The extended project team was responsible for sustaining the actions implemented in this project, the replication of the approach on other Business Units in several Buildings of Continental, the communication of the results and scope of the project, and the integration of the solutions implemented in the quality, technical and R&D systems in the company.
For example, the Lean Six Sigma team was responsible for training the core team and following up the project stages.The Technical Center was responsible for the documentation and standardization of the improvements and the approach of the technical solutions for the new process stations, dispensing robots and process lines installed in the company.
4
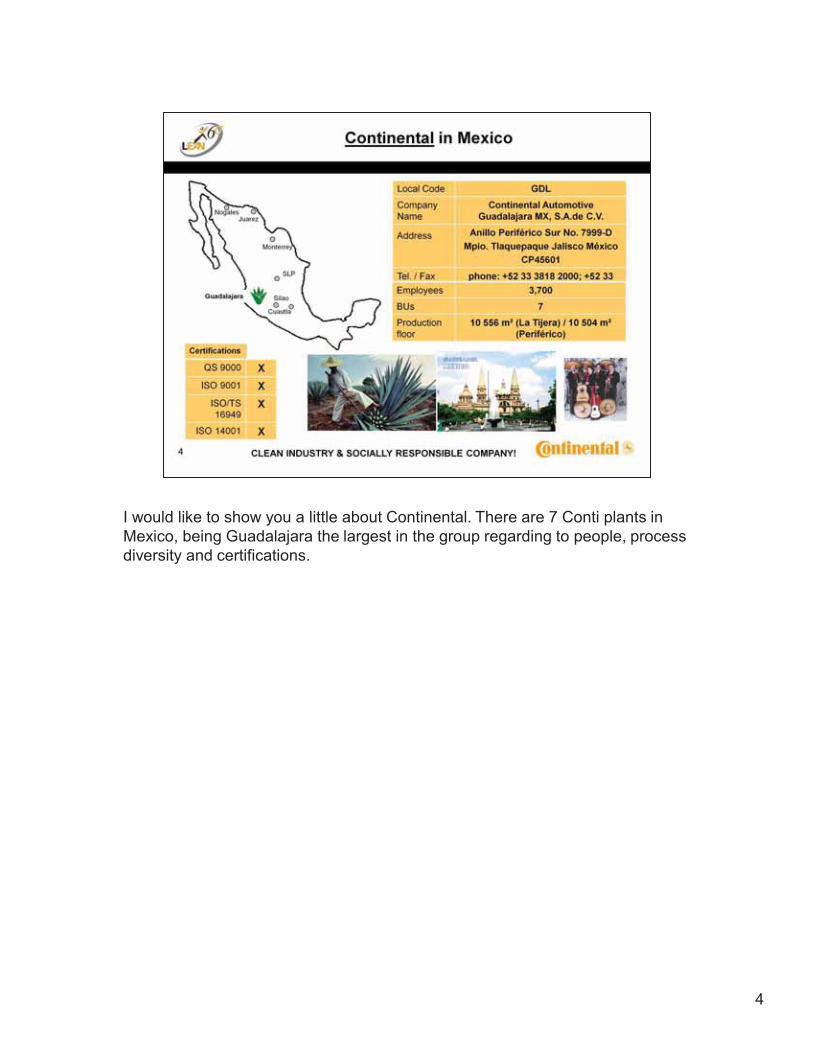
I would like to show you a little about Continental. There are 7 Conti plants in Mexico, being Guadalajara the largest in the group regarding to people, process diversity and certifications.
5
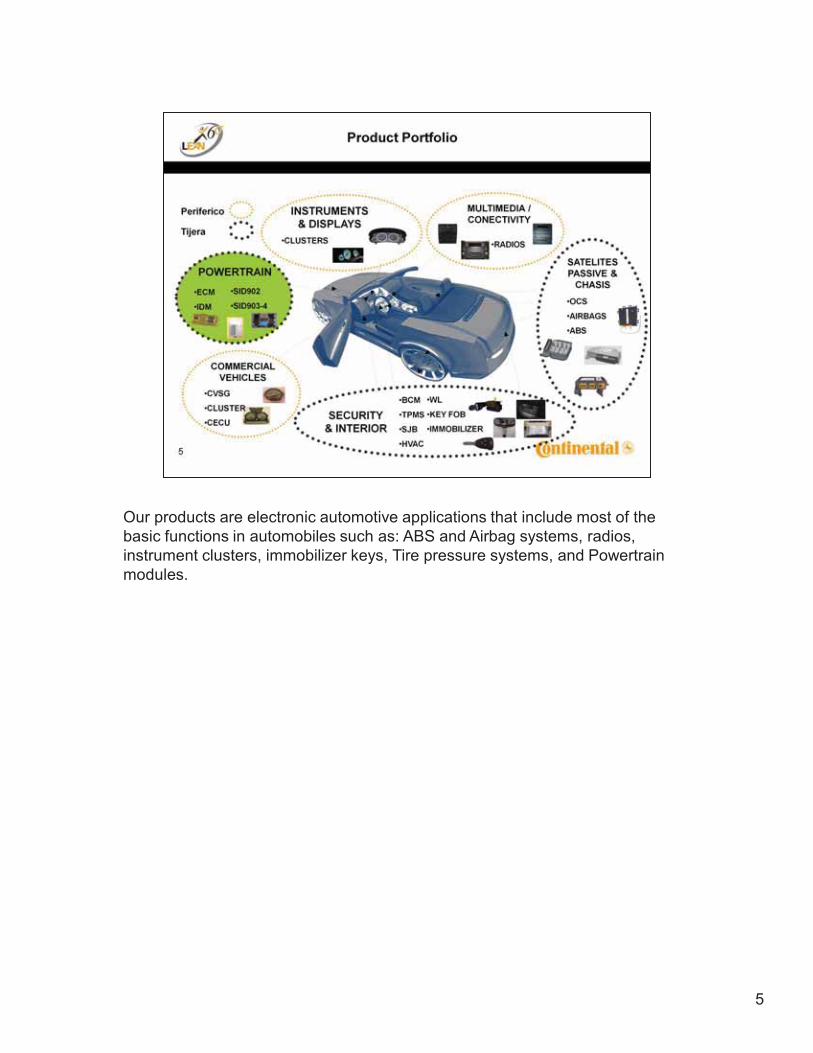
Our products are electronic automotive applications that include most of the basic functions in automobiles such as: ABS and Airbag systems, radios, instrument clusters, immobilizer keys, Tire pressure systems, and Powertrain modules.
6
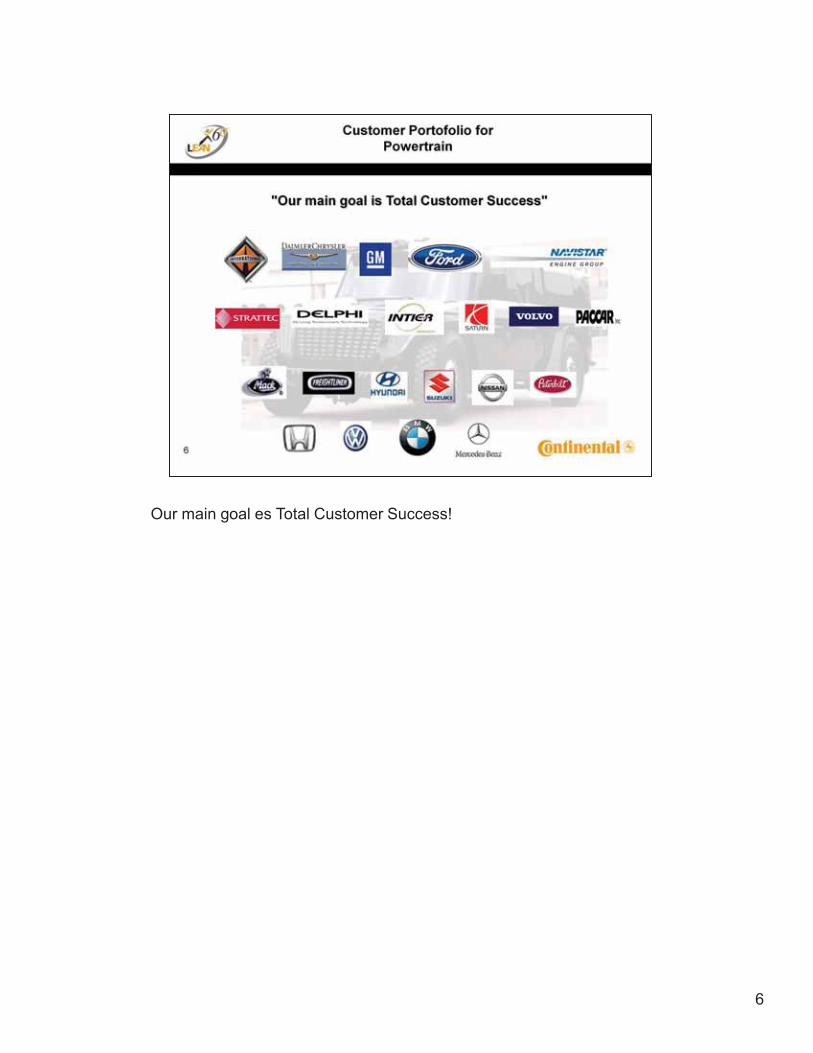
Our main goal es Total Customer Success!
7
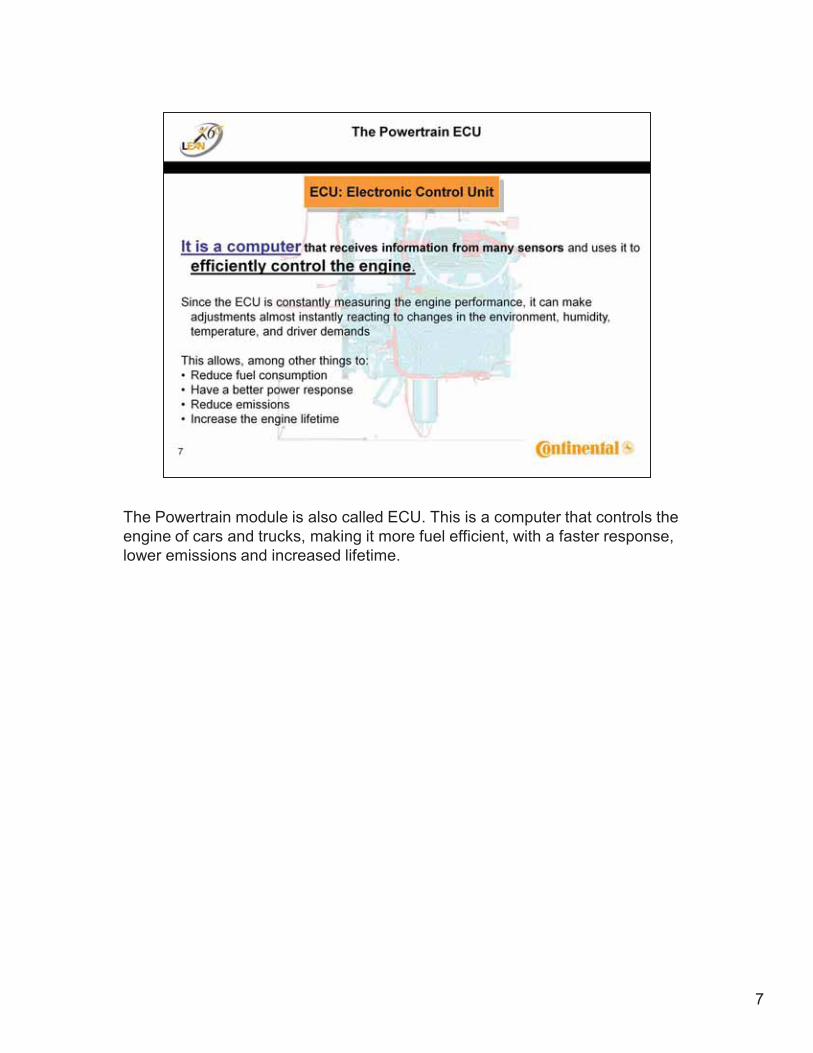
The Powertrain module is also called ECU. This is a computer that controls the engine of cars and trucks, making it more fuel efficient, with a faster response, lower emissions and increased lifetime.
8
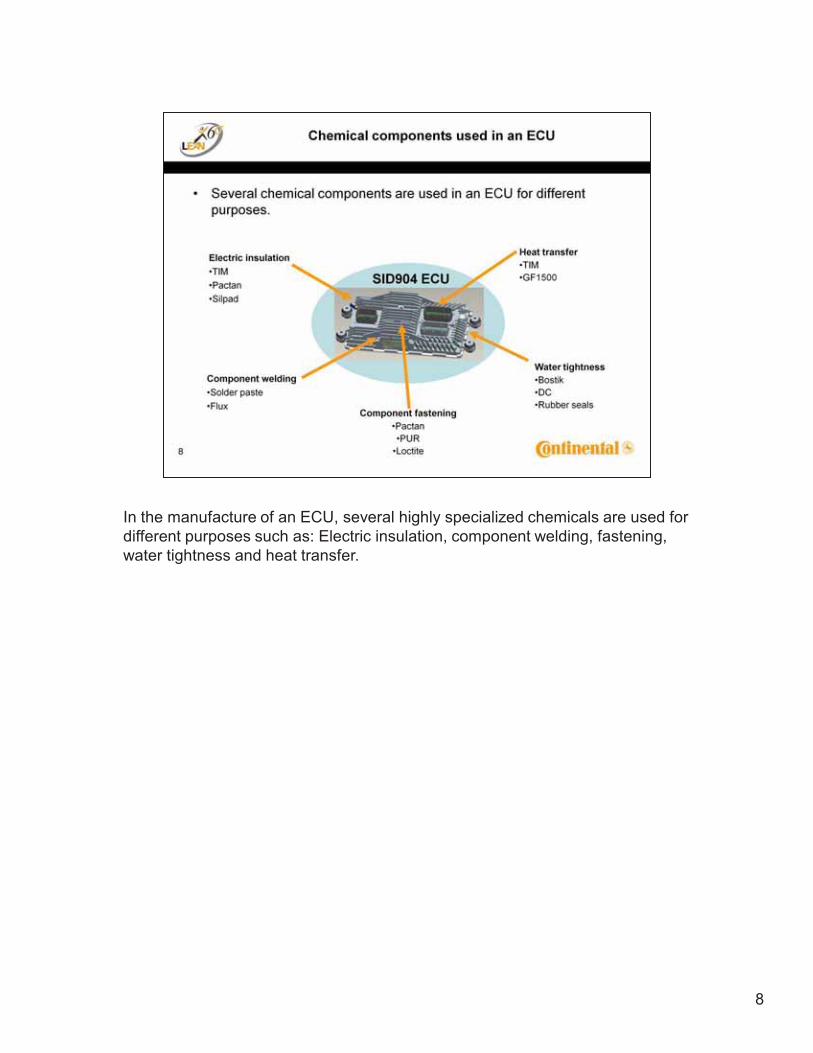
In the manufacture of an ECU, several highly specialized chemicals are used for different purposes such as: Electric insulation, component welding, fastening, water tightness and heat transfer.
9
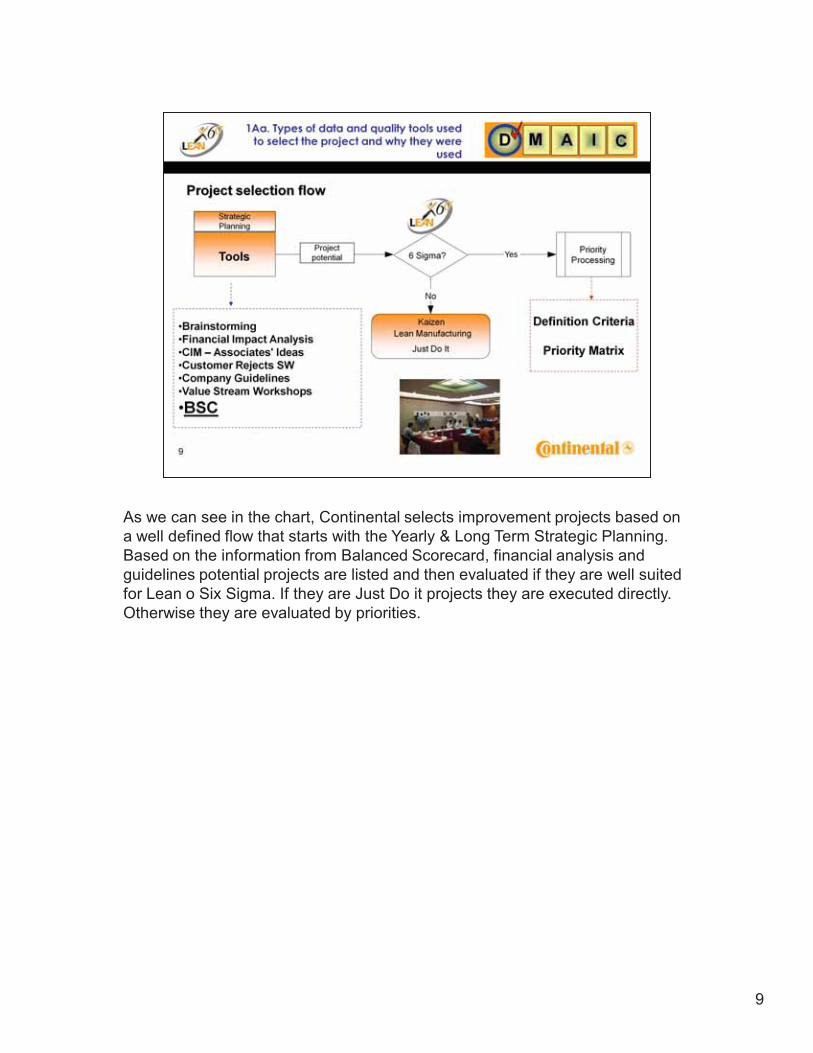
As we can see in the chart, Continental selects improvement projects based on a well defined flow that starts with the Yearly & Long Term Strategic Planning. Based on the information from Balanced Scorecard, financial analysis and guidelines potential projects are listed and then evaluated if they are well suited for Lean o Six Sigma. If they are Just Do it projects they are executed directly. Otherwise they are evaluated by priorities.
10
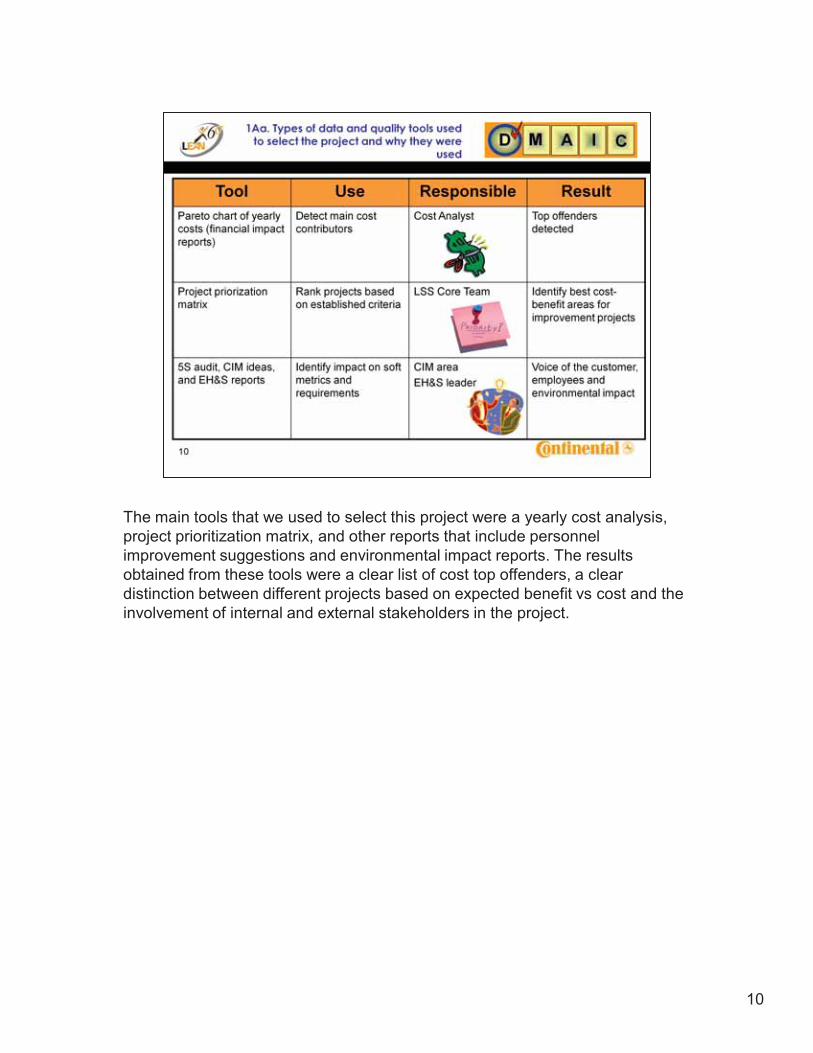
The main tools that we used to select this project were a yearly cost analysis, project prioritization matrix, and other reports that include personnel improvement suggestions and environmental impact reports. The results obtained from these tools were a clear list of cost top offenders, a clear distinction between different projects based on expected benefit vs cost and the involvement of internal and external stakeholders in the project.
11
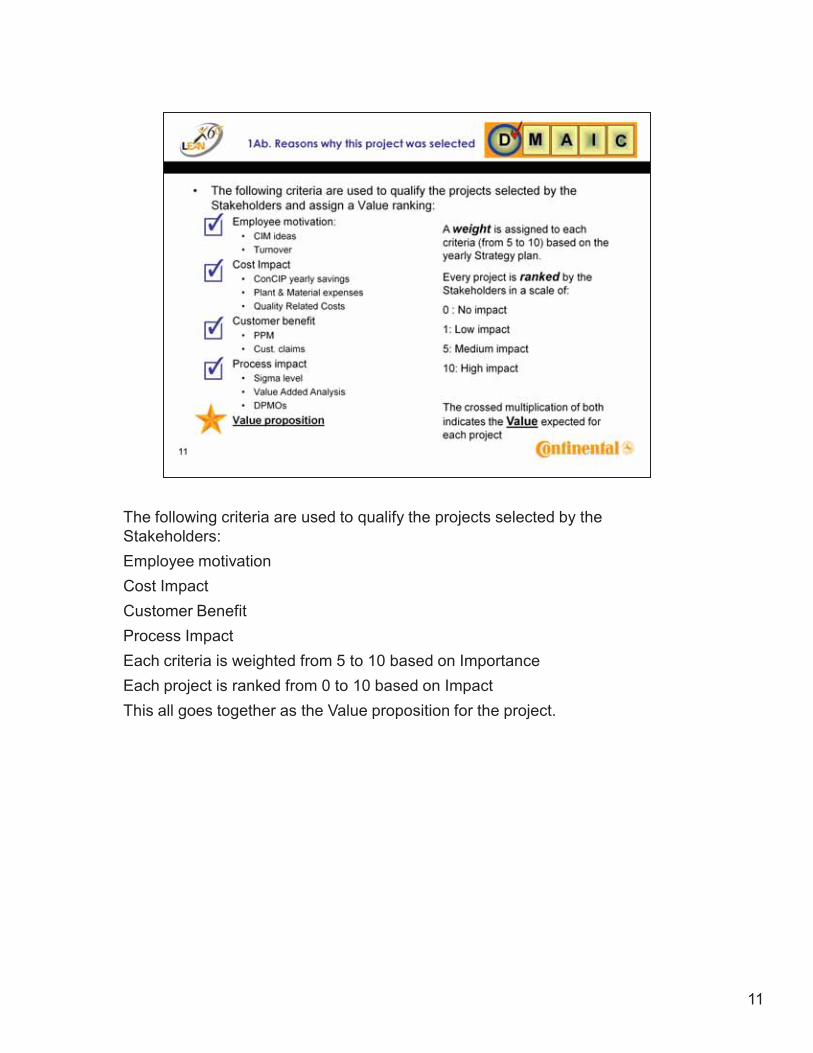
The following criteria are used to qualify the projects selected by the Stakeholders:Employee motivationCost ImpactCustomer BenefitProcess ImpactEach criteria is weighted from 5 to 10 based on ImportanceEach project is ranked from 0 to 10 based on ImpactThis all goes together as the Value proposition for the project.
12
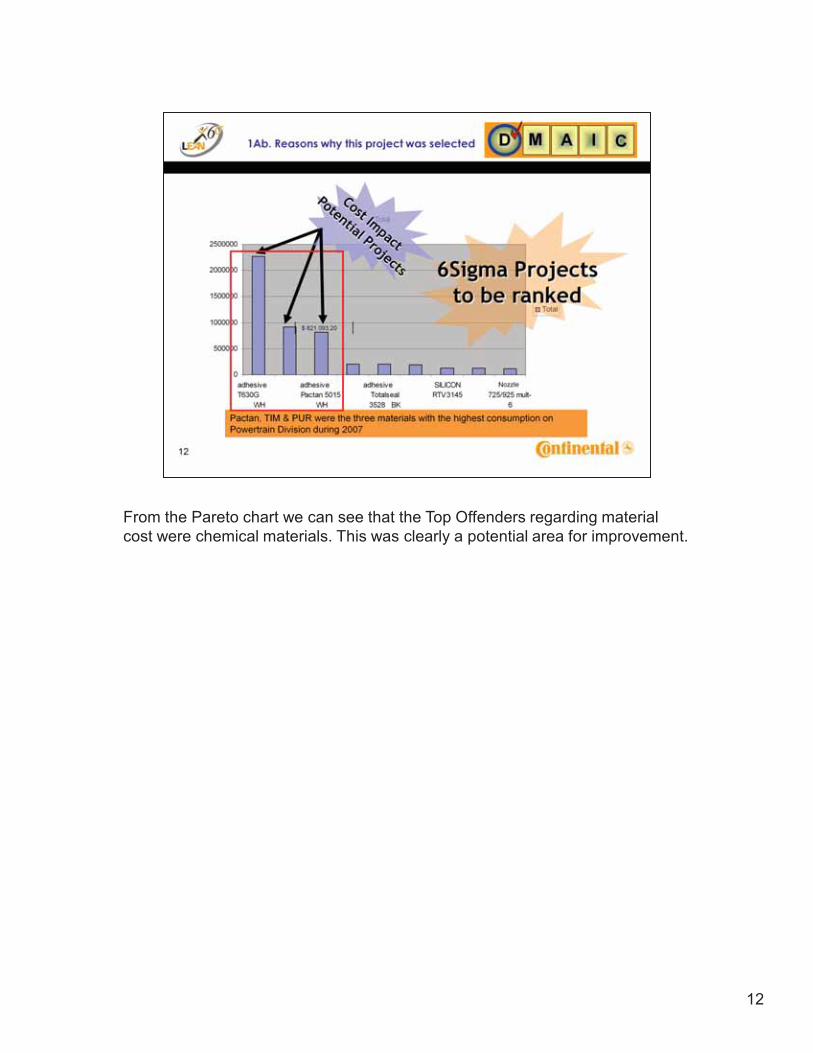
From the Pareto chart we can see that the Top Offenders regarding material cost were chemical materials. This was clearly a potential area for improvement.
13
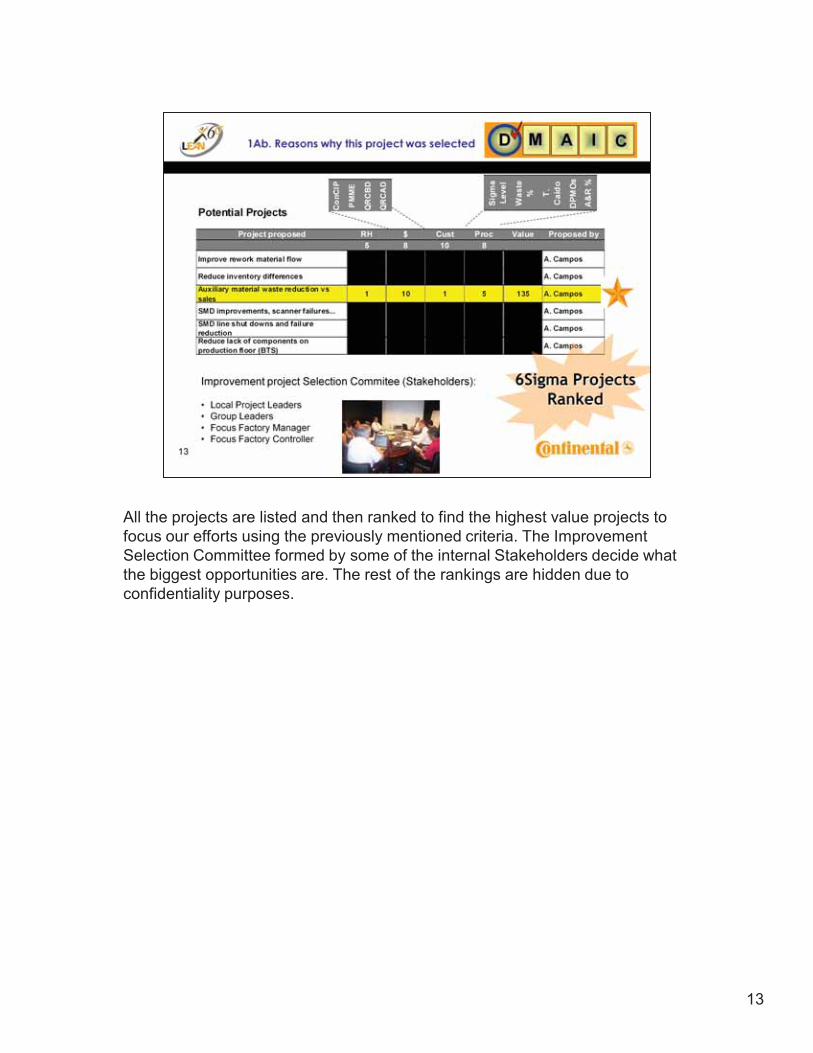
All the projects are listed and then ranked to find the highest value projects to focus our efforts using the previously mentioned criteria. The Improvement Selection Committee formed by some of the internal Stakeholders decide what the biggest opportunities are. The rest of the rankings are hidden due to confidentiality purposes.
14
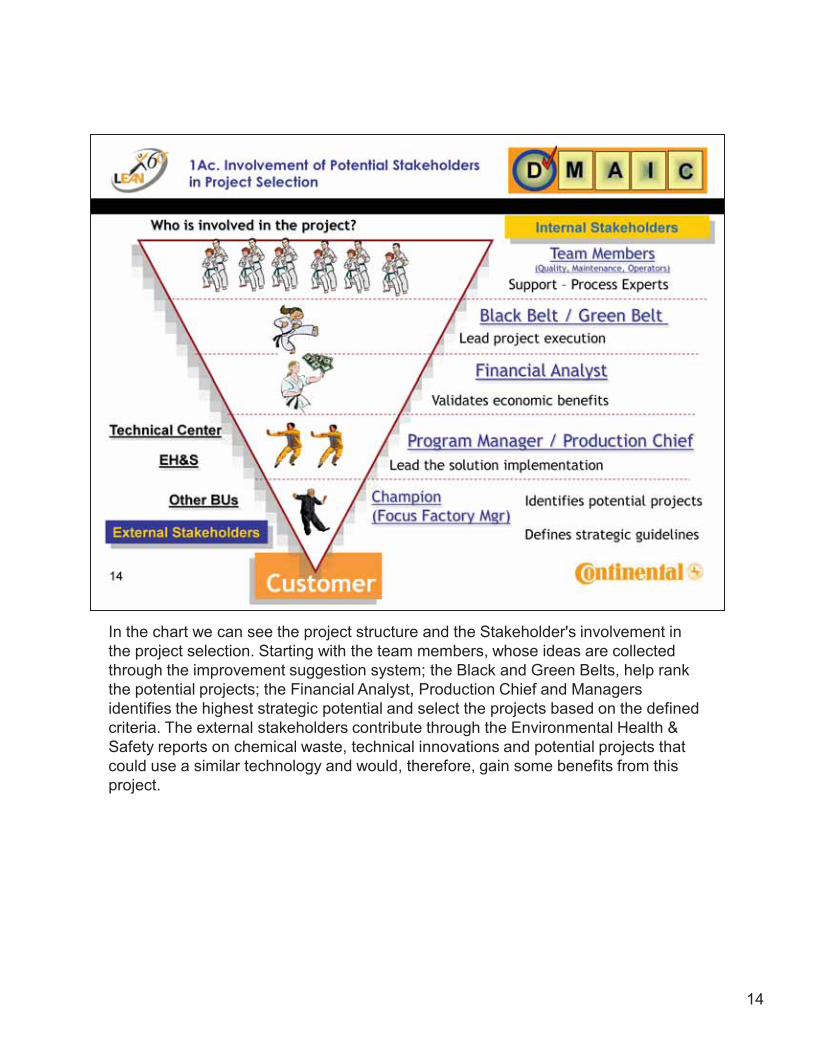
In the chart we can see the project structure and the Stakeholder's involvement in the project selection. Starting with the team members, whose ideas are collected through the improvement suggestion system; the Black and Green Belts, help rank the potential projects; the Financial Analyst, Production Chief and Managers identifies the highest strategic potential and select the projects based on the defined criteria. The external stakeholders contribute through the Environmental Health & Safety reports on chemical waste, technical innovations and potential projects that could use a similar technology and would, therefore, gain some benefits from this project.
15
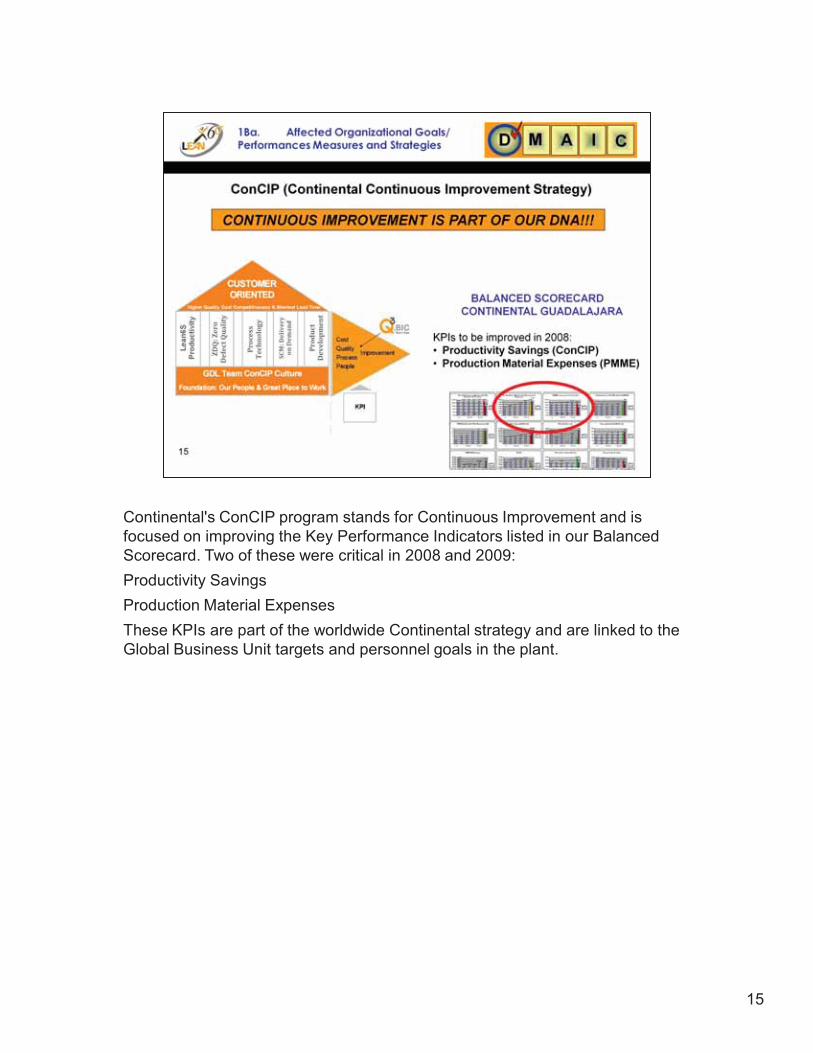
Continental's ConCIP program stands for Continuous Improvement and is focused on improving the Key Performance Indicators listed in our Balanced Scorecard. Two of these were critical in 2008 and 2009:Productivity SavingsProduction Material ExpensesThese KPIs are part of the worldwide Continental strategy and are linked to the Global Business Unit targets and personnel goals in the plant.
16
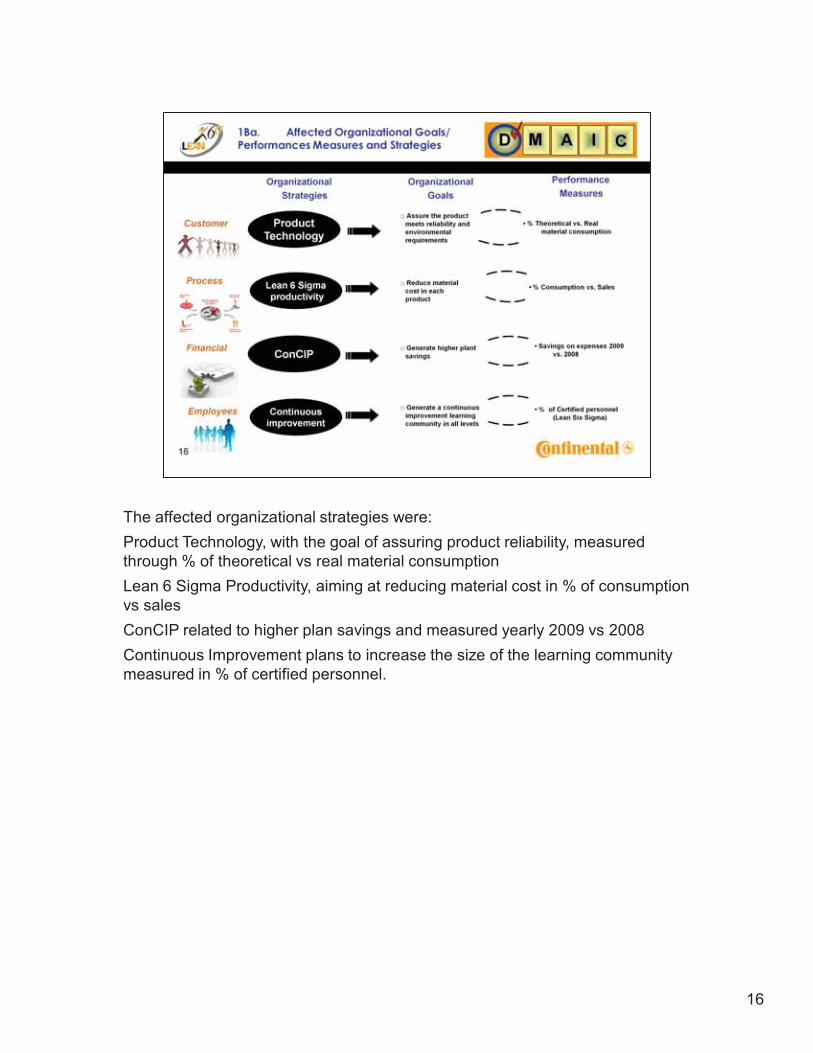
The affected organizational strategies were:Product Technology, with the goal of assuring product reliability, measured through % of theoretical vs real material consumptionLean 6 Sigma Productivity, aiming at reducing material cost in % of consumption vs salesConCIP related to higher plan savings and measured yearly 2009 vs 2008Continuous Improvement plans to increase the size of the learning community measured in % of certified personnel.
17
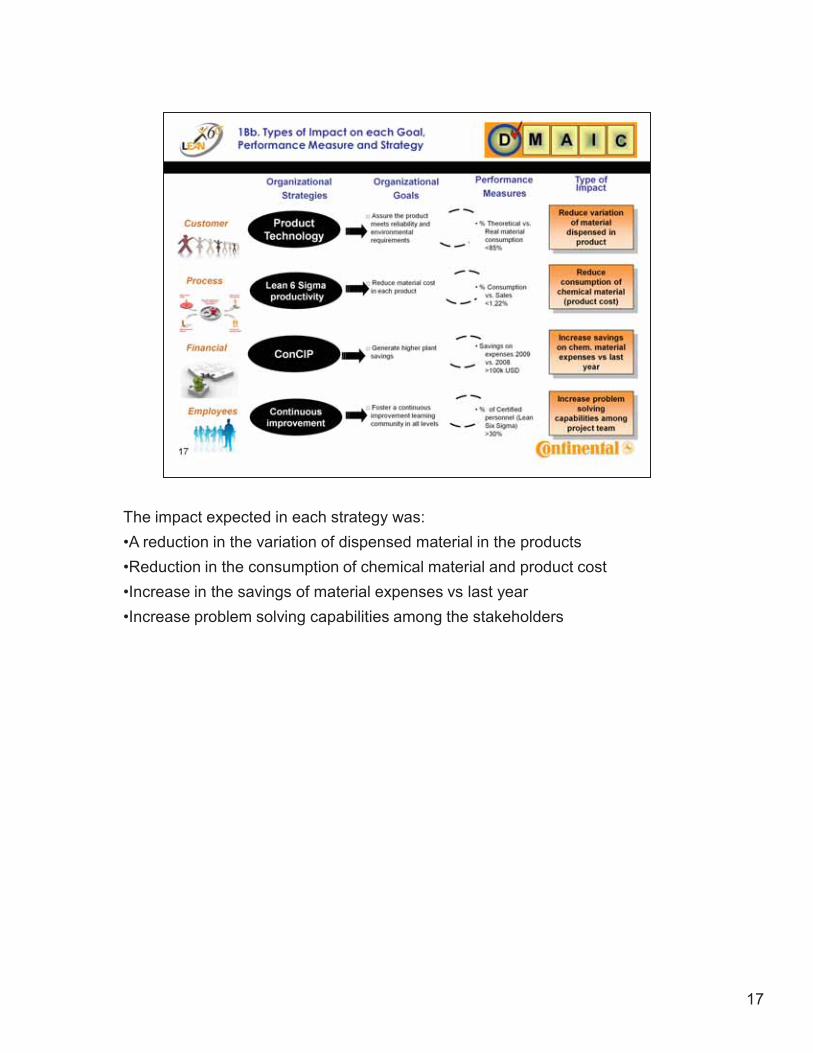
The impact expected in each strategy was:•A reduction in the variation of dispensed material in the products•Reduction in the consumption of chemical material and product cost•Increase in the savings of material expenses vs last year•Increase problem solving capabilities among the stakeholders
18
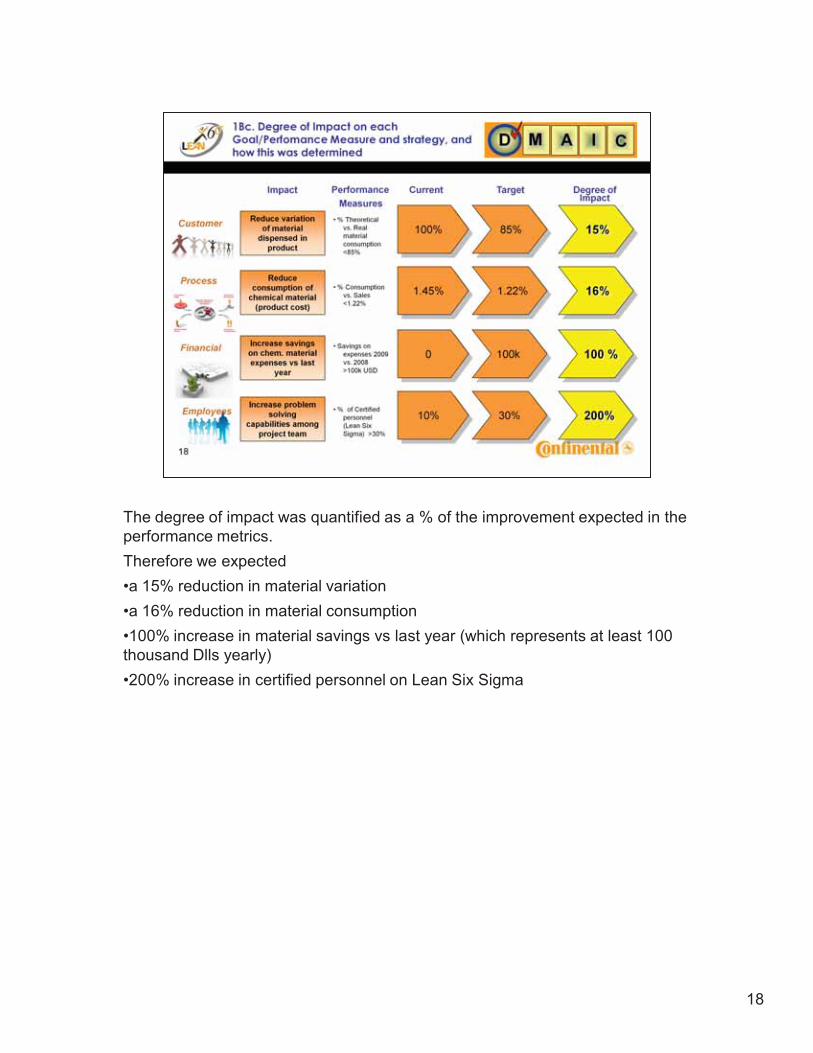
The degree of impact was quantified as a % of the improvement expected in the performance metrics.Therefore we expected•a 15% reduction in material variation•a 16% reduction in material consumption•100% increase in material savings vs last year (which represents at least 100 thousand Dlls yearly)•200% increase in certified personnel on Lean Six Sigma
19
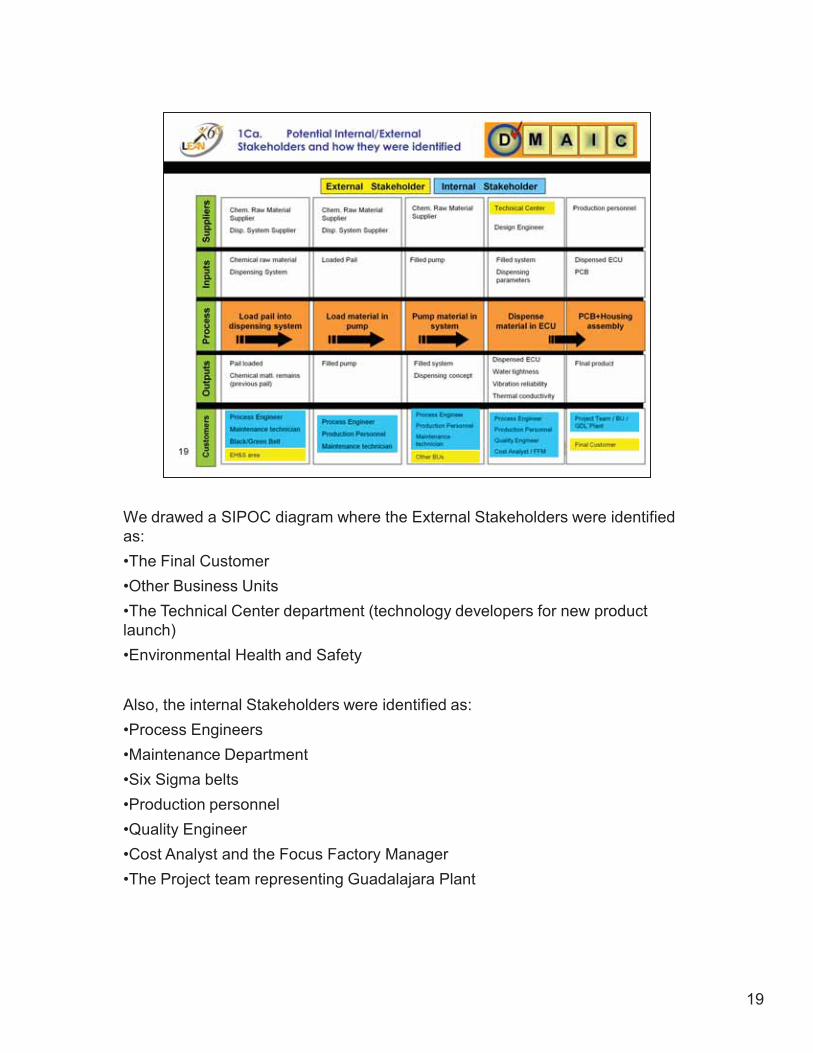
We drawed a SIPOC diagram where the External Stakeholders were identified as:•The Final Customer•Other Business Units•The Technical Center department (technology developers for new product launch)•Environmental Health and Safety
Also, the internal Stakeholders were identified as:•Process Engineers•Maintenance Department•Six Sigma belts•Production personnel•Quality Engineer•Cost Analyst and the Focus Factory Manager•The Project team representing Guadalajara Plant
20
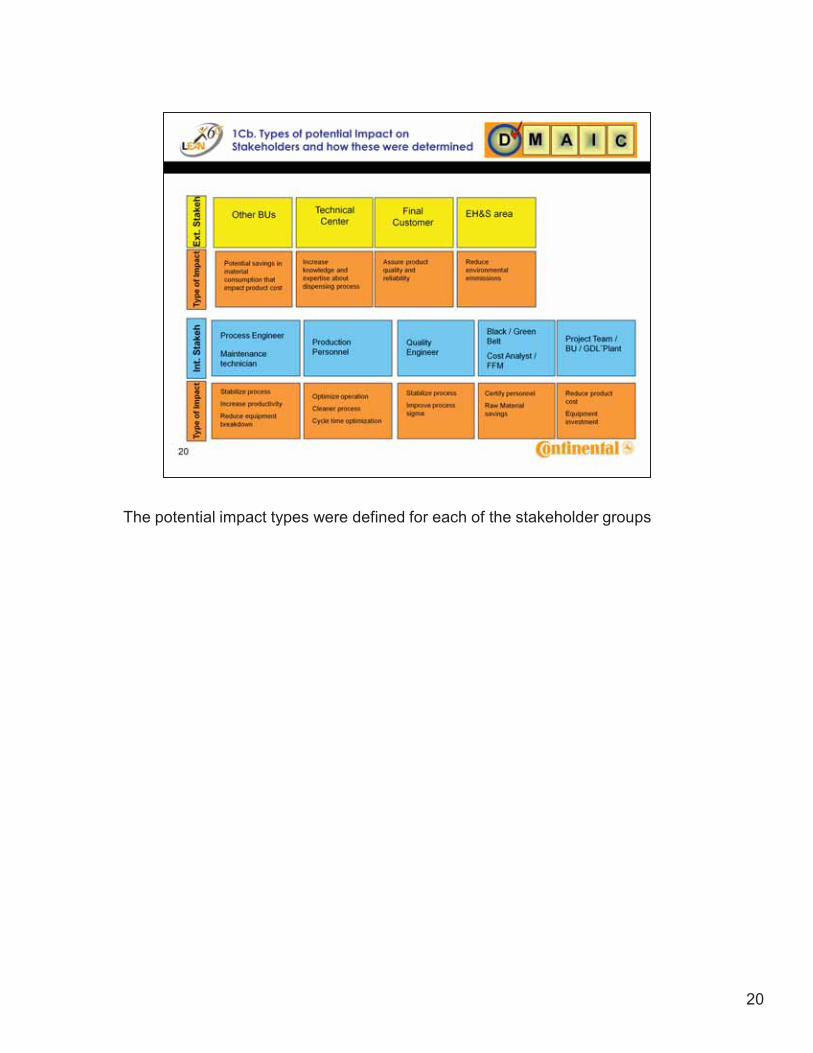
The potential impact types were defined for each of the stakeholder groups
21
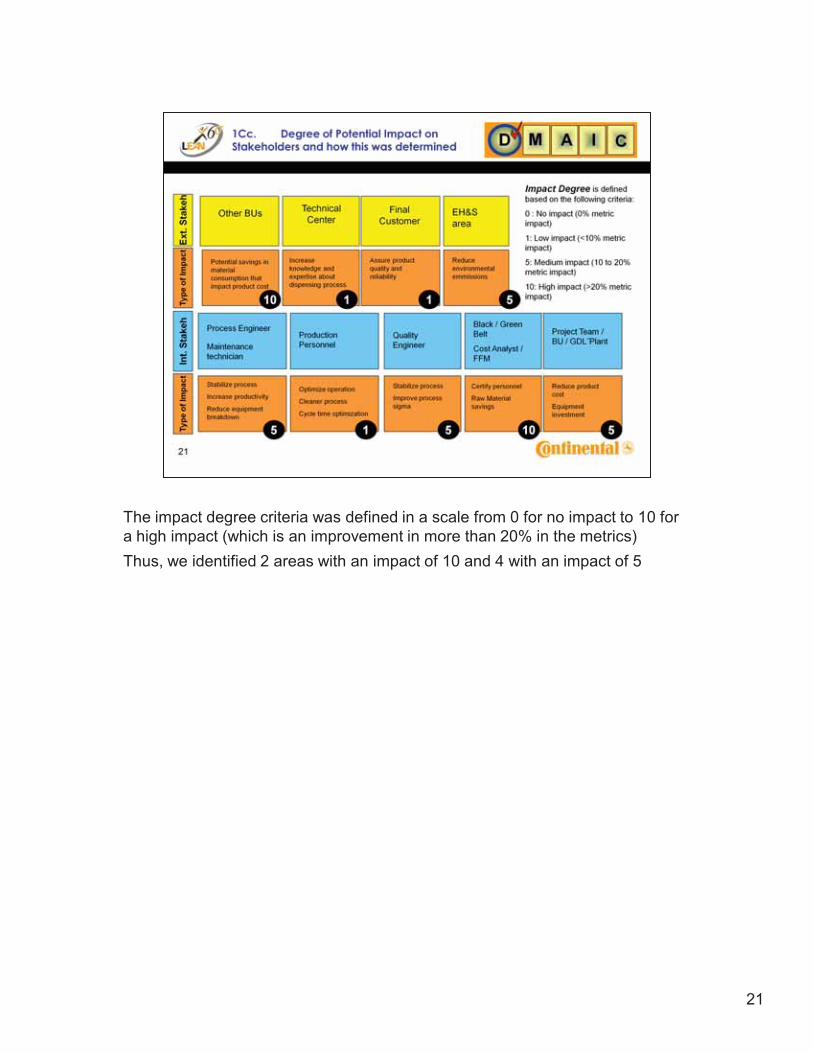
The impact degree criteria was defined in a scale from 0 for no impact to 10 for a high impact (which is an improvement in more than 20% in the metrics)Thus, we identified 2 areas with an impact of 10 and 4 with an impact of 5
22
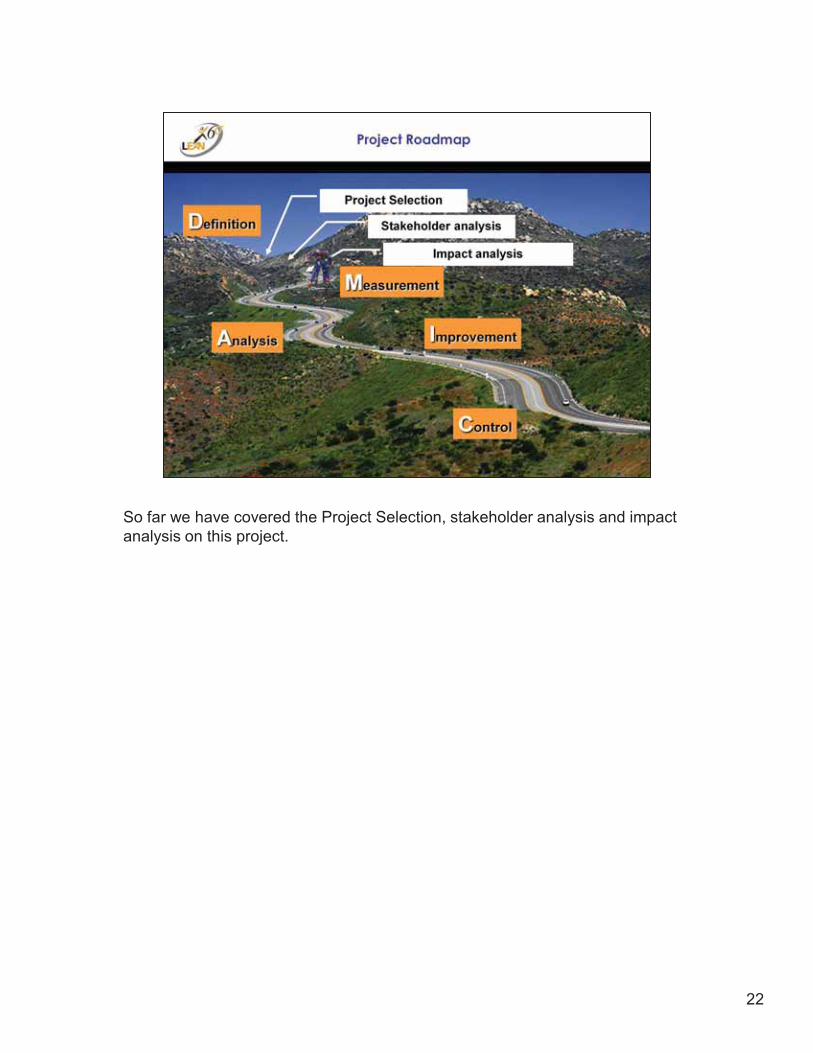
So far we have covered the Project Selection, stakeholder analysis and impact analysis on this project.
23
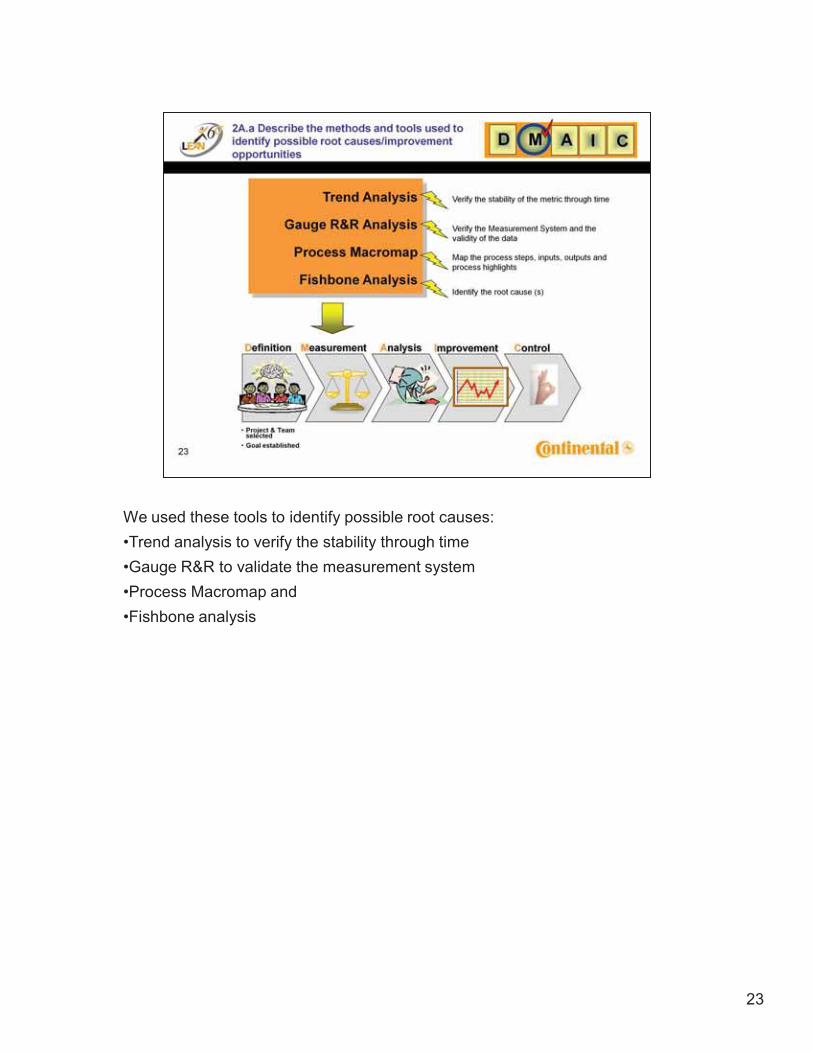
We used these tools to identify possible root causes:•Trend analysis to verify the stability through time•Gauge R&R to validate the measurement system•Process Macromap and•Fishbone analysis
24
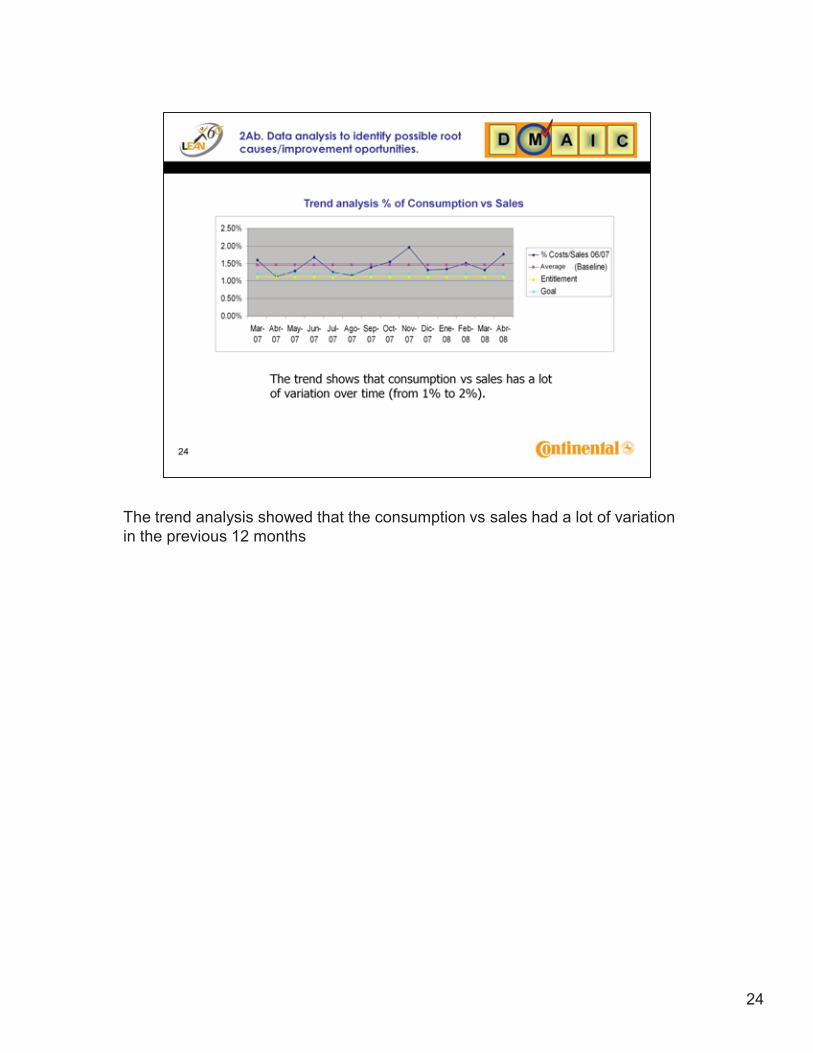
The trend analysis showed that the consumption vs sales had a lot of variation in the previous 12 months
25
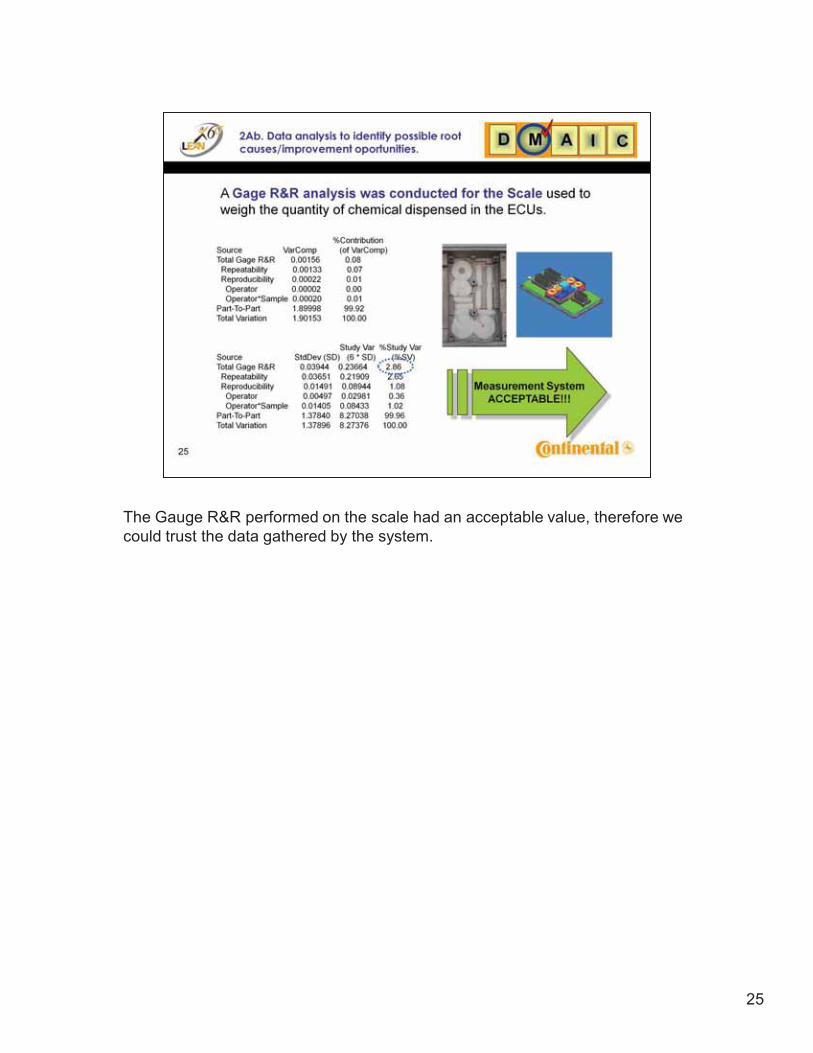
The Gauge R&R performed on the scale had an acceptable value, therefore we could trust the data gathered by the system.
26
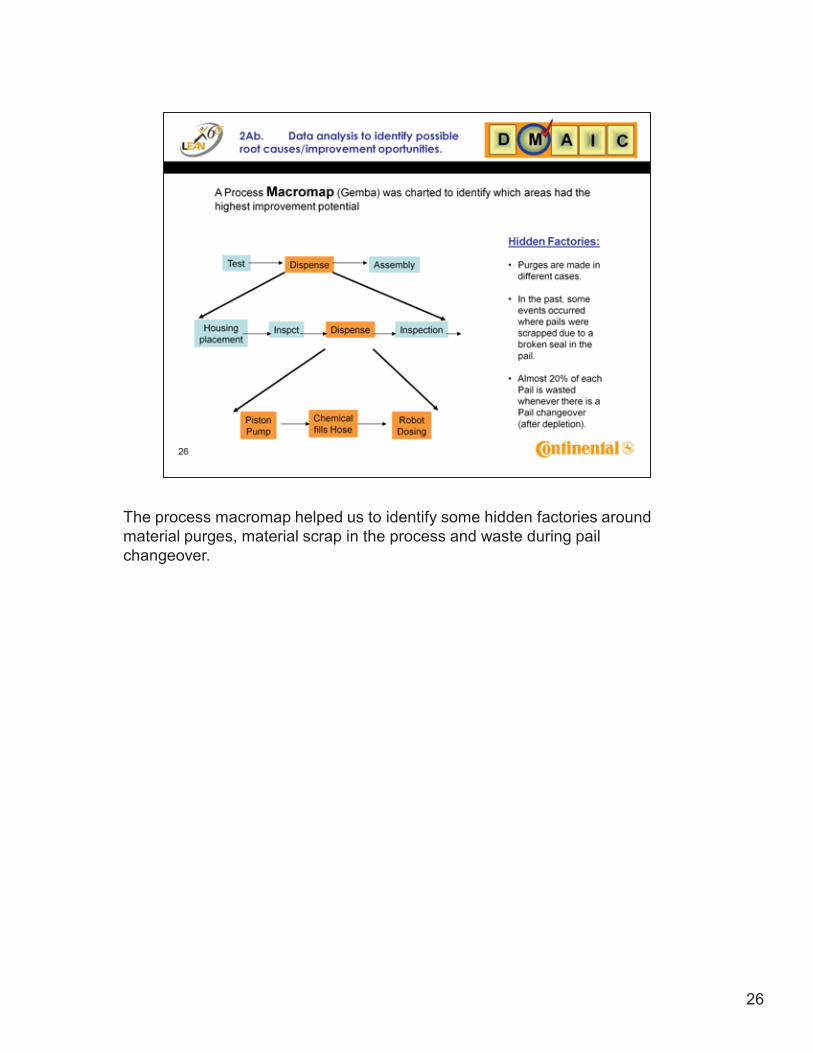
The process macromap helped us to identify some hidden factories around material purges, material scrap in the process and waste during pail changeover.
27
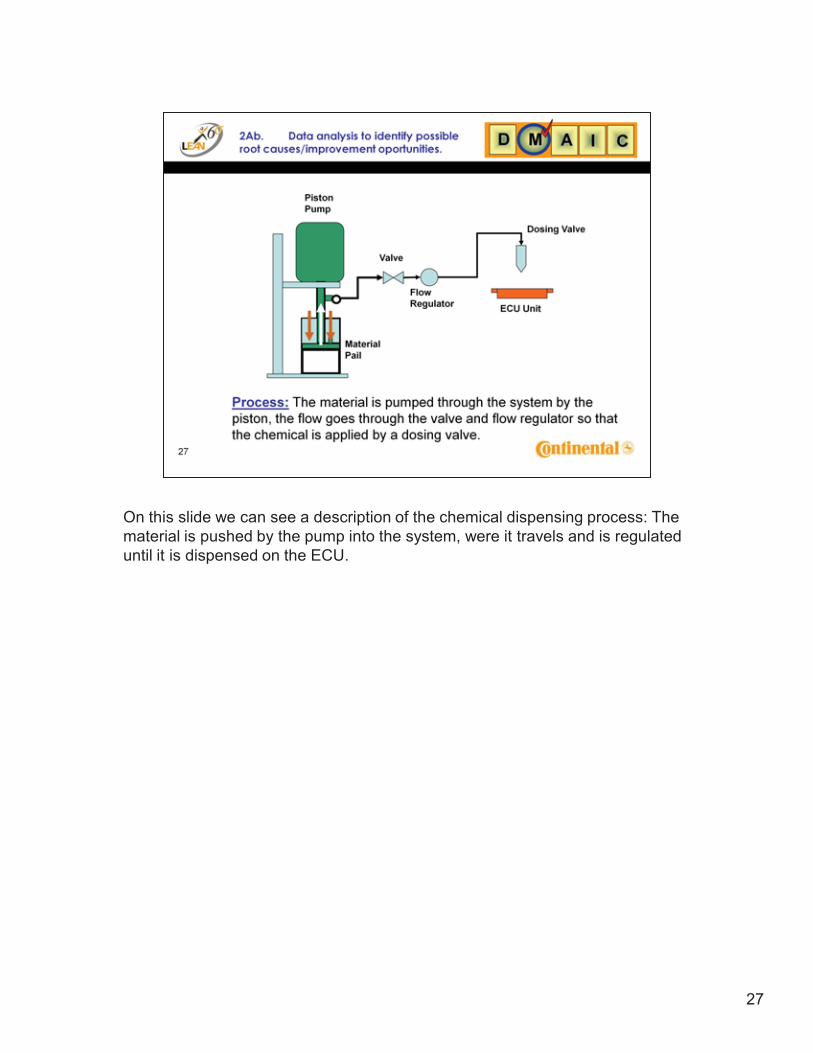
On this slide we can see a description of the chemical dispensing process: The material is pushed by the pump into the system, were it travels and is regulated until it is dispensed on the ECU.
28
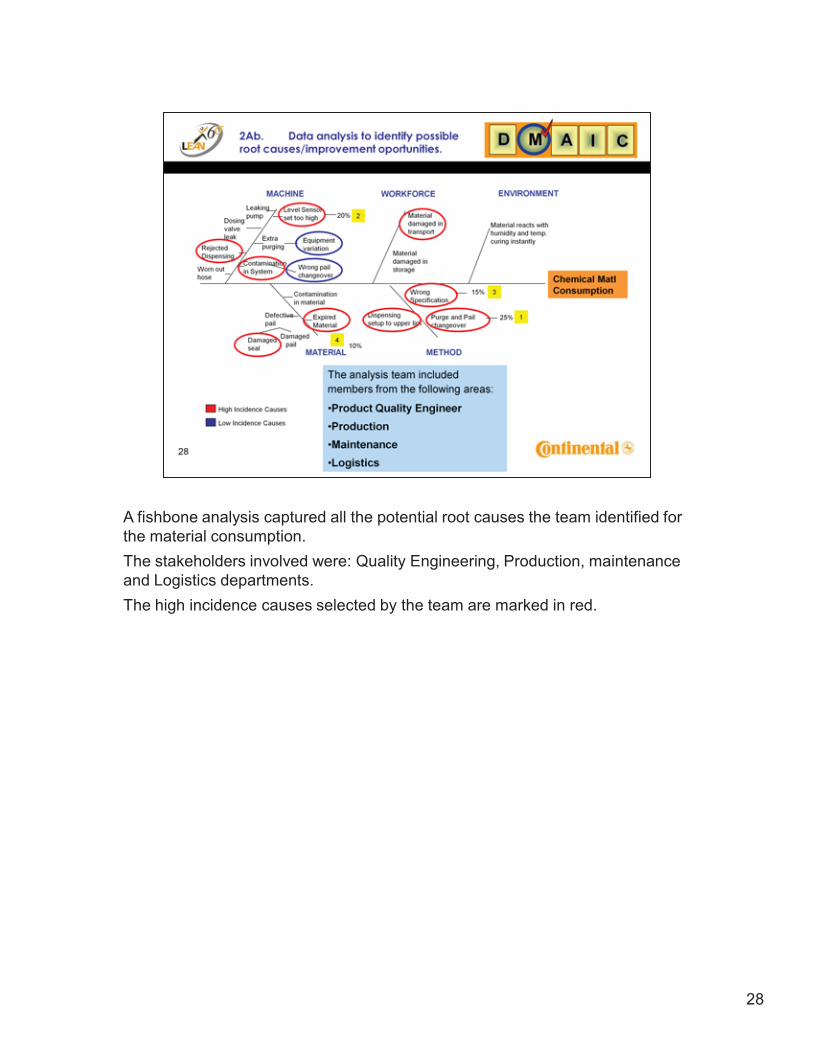
A fishbone analysis captured all the potential root causes the team identified for the material consumption.The stakeholders involved were: Quality Engineering, Production, maintenance and Logistics departments.The high incidence causes selected by the team are marked in red.
29
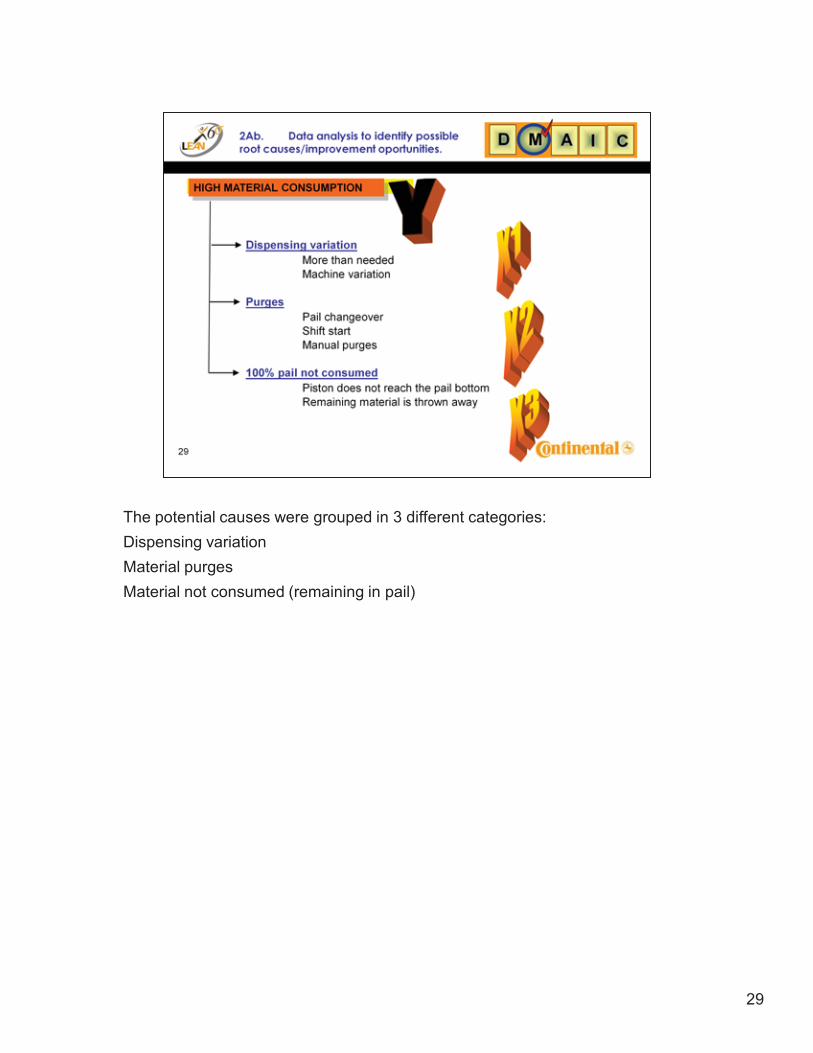
The potential causes were grouped in 3 different categories:Dispensing variationMaterial purgesMaterial not consumed (remaining in pail)
30
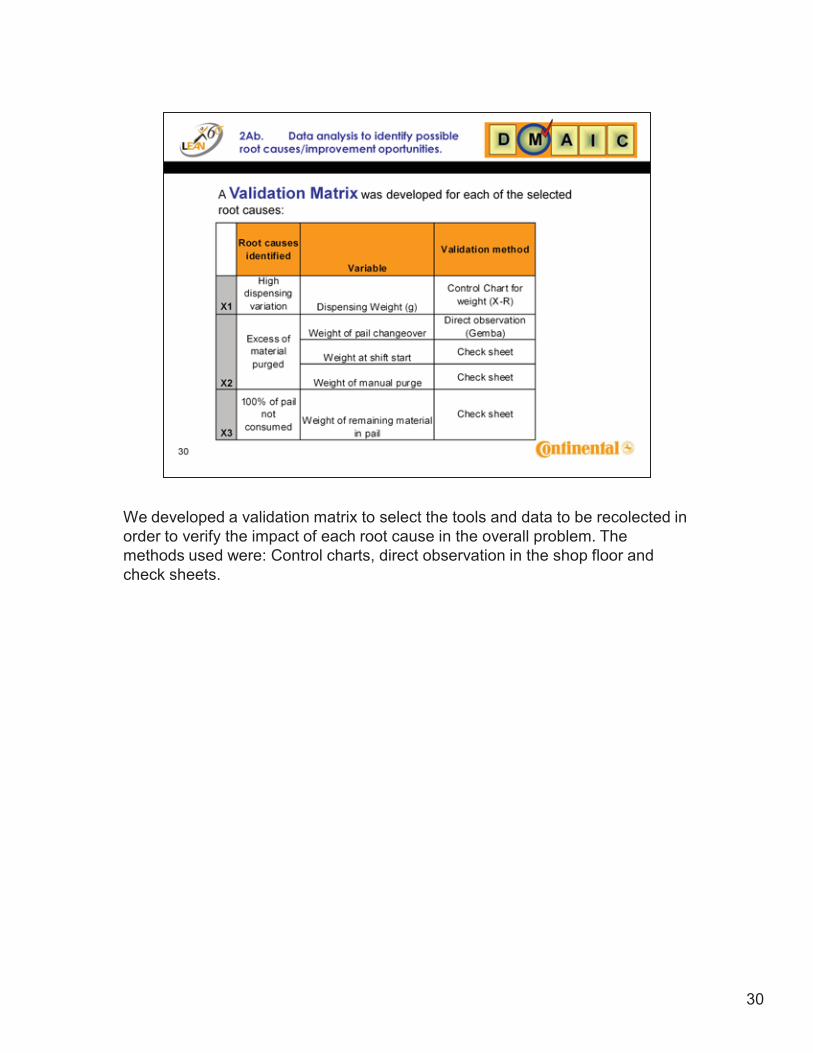
We developed a validation matrix to select the tools and data to be recolected in order to verify the impact of each root cause in the overall problem. The methods used were: Control charts, direct observation in the shop floor and check sheets.
31
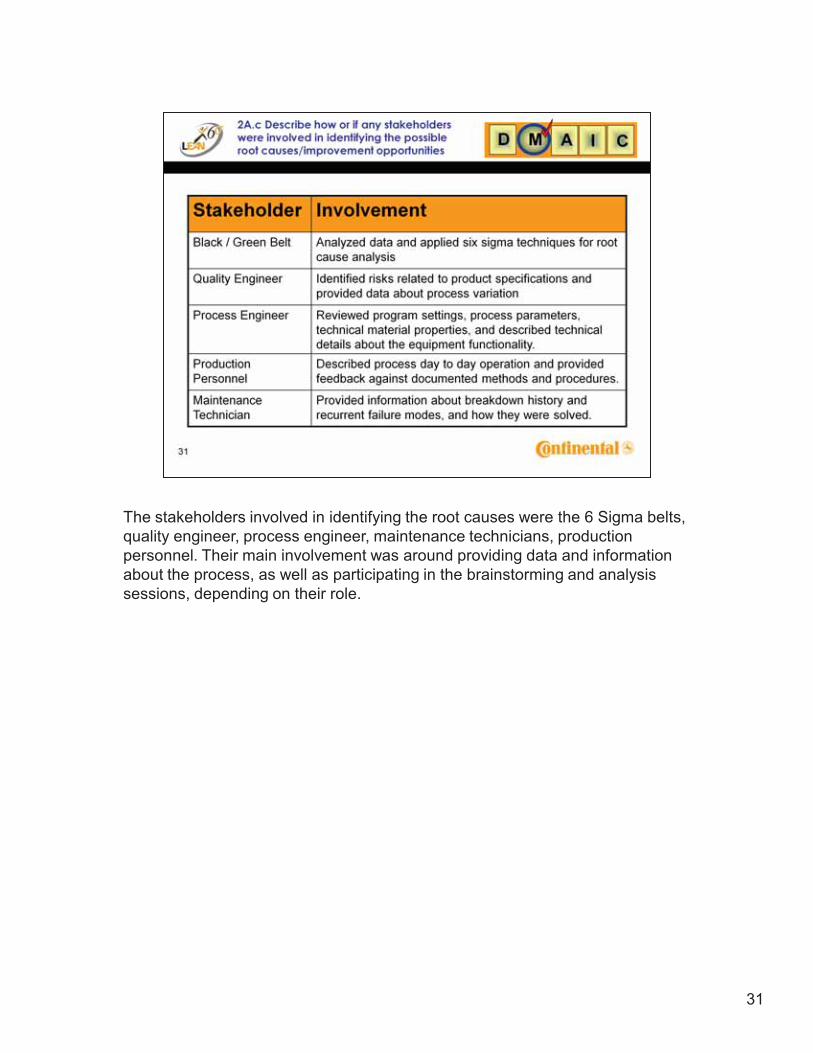
The stakeholders involved in identifying the root causes were the 6 Sigma belts, quality engineer, process engineer, maintenance technicians, production personnel. Their main involvement was around providing data and information about the process, as well as participating in the brainstorming and analysis sessions, depending on their role.
32
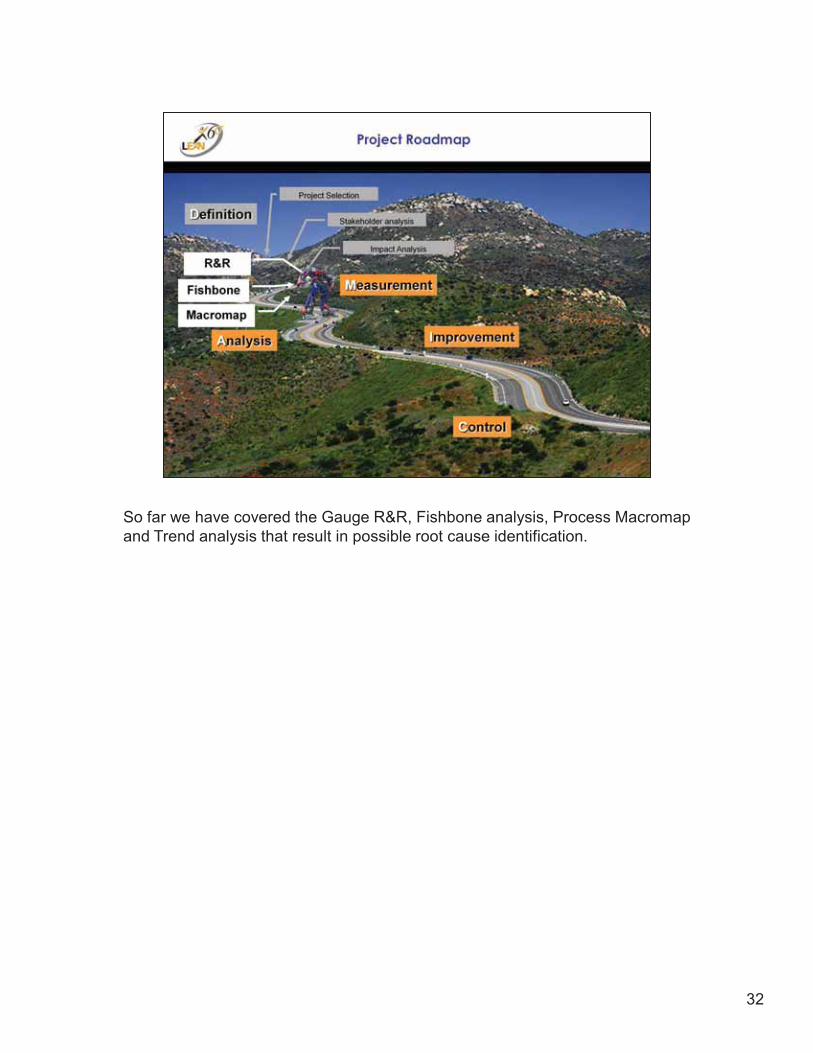
So far we have covered the Gauge R&R, Fishbone analysis, Process Macromap and Trend analysis that result in possible root cause identification.
33
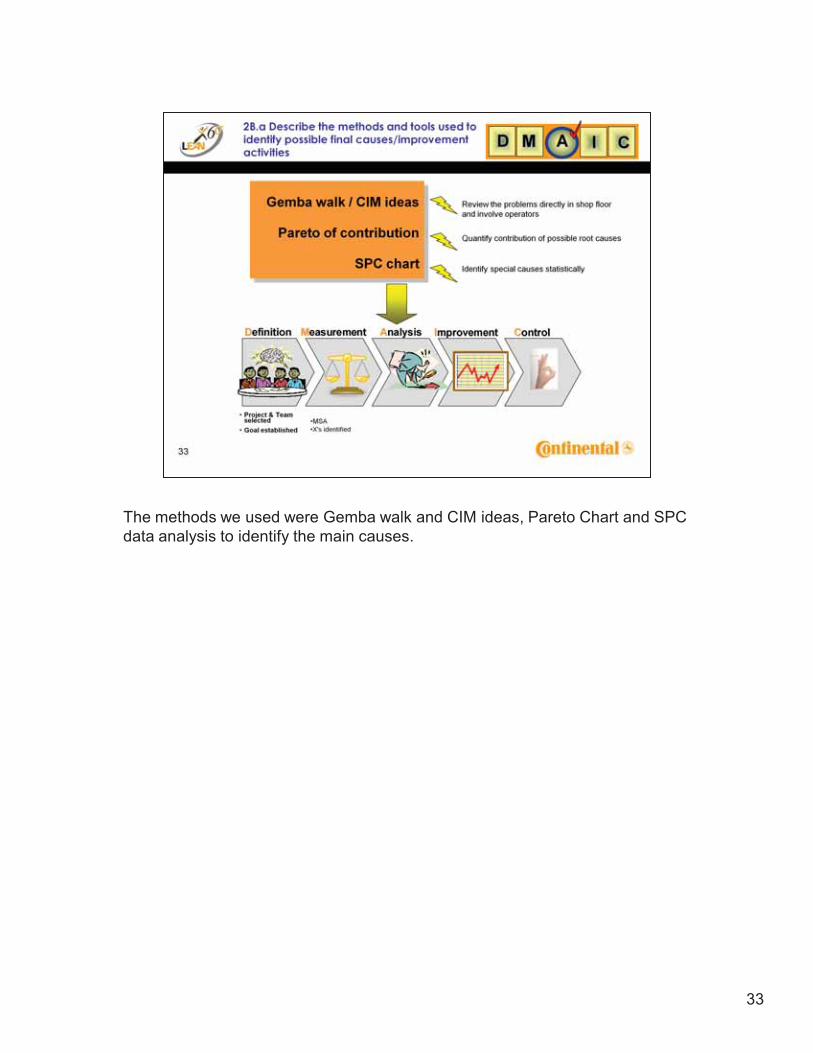
The methods we used were Gemba walk and CIM ideas, Pareto Chart and SPC data analysis to identify the main causes.
34
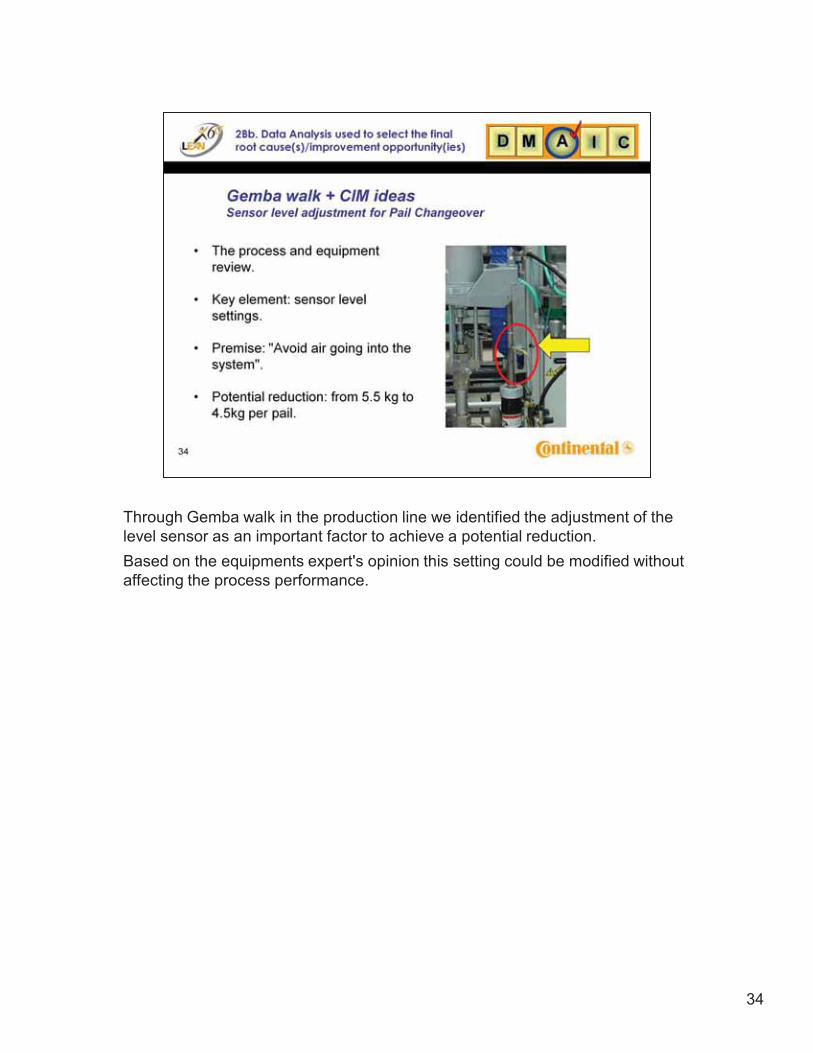
Through Gemba walk in the production line we identified the adjustment of the level sensor as an important factor to achieve a potential reduction.Based on the equipments expert's opinion this setting could be modified without affecting the process performance.
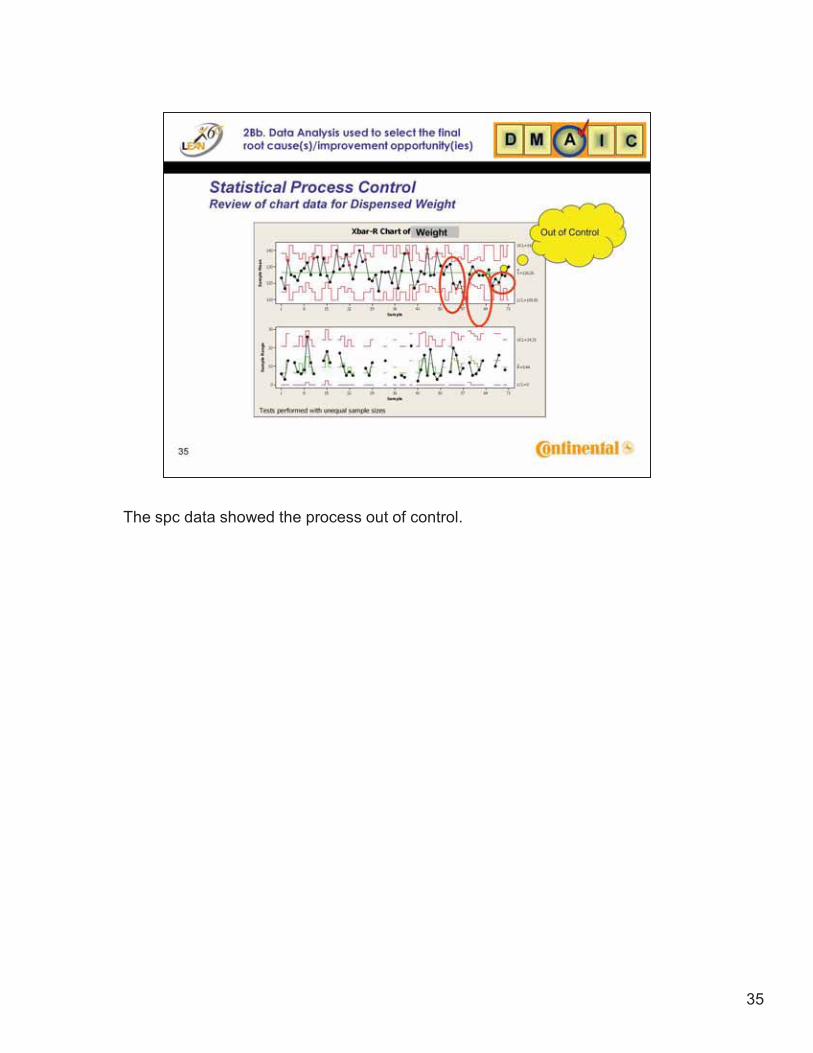
35
The spc data showed the process out of control.
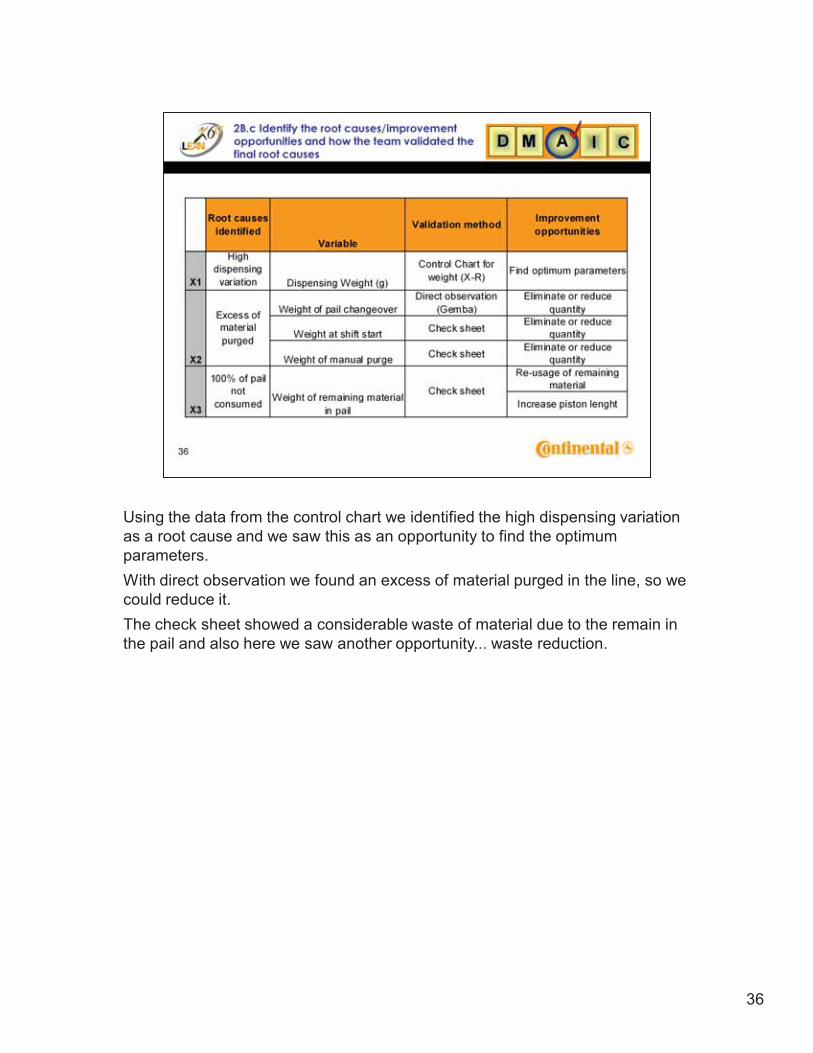
36
Using the data from the control chart we identified the high dispensing variation as a root cause and we saw this as an opportunity to find the optimum parameters.With direct observation we found an excess of material purged in the line, so we could reduce it.The check sheet showed a considerable waste of material due to the remain in the pail and also here we saw another opportunity... waste reduction.
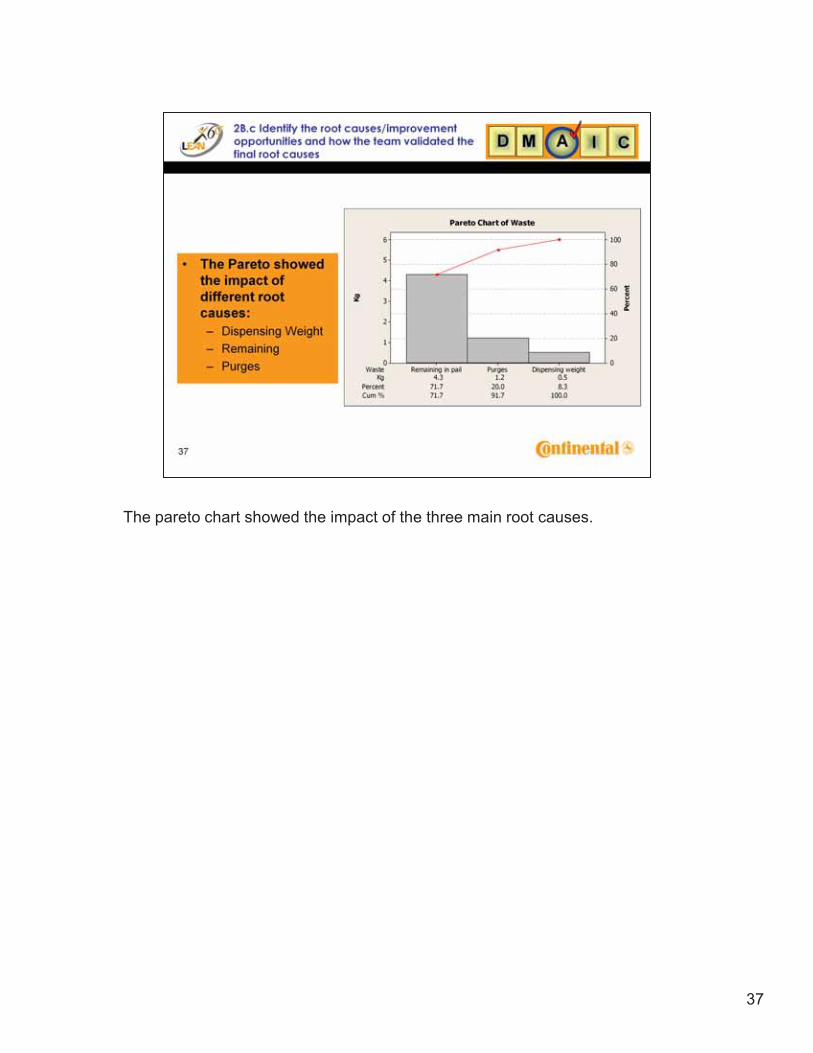
37
The pareto chart showed the impact of the three main root causes.
38
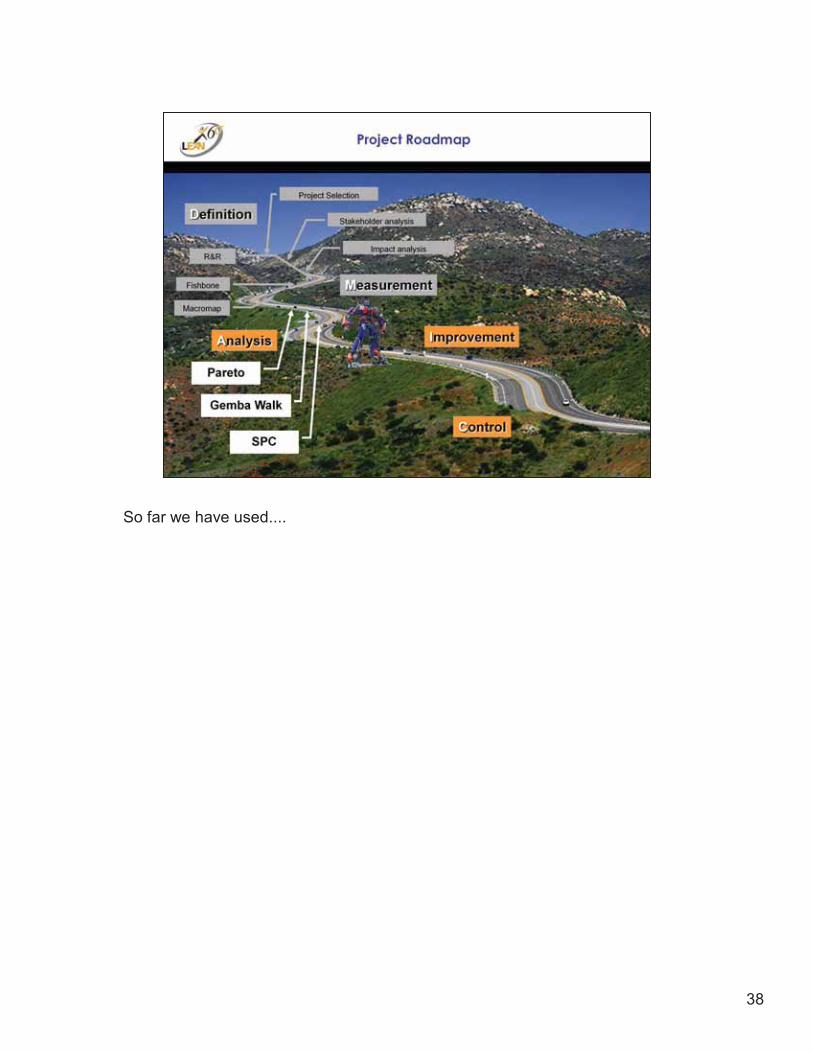
So far we have used....
39
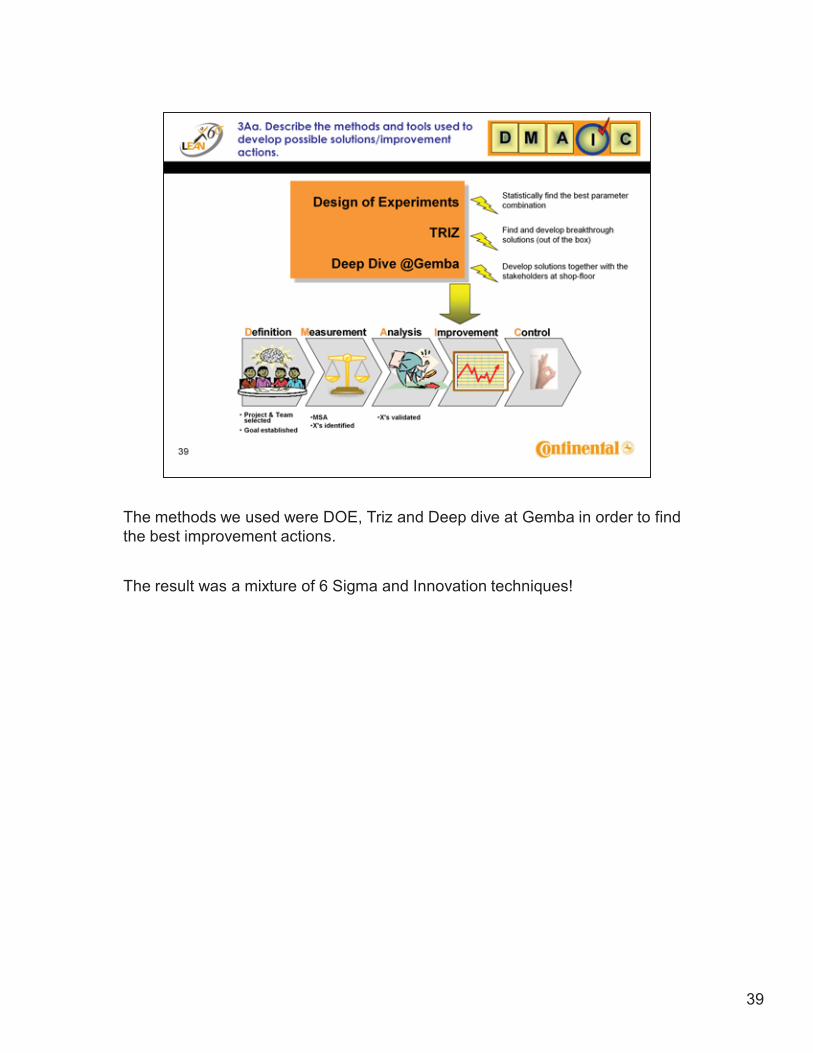
The methods we used were DOE, Triz and Deep dive at Gemba in order to find the best improvement actions.
The result was a mixture of 6 Sigma and Innovation techniques!
40
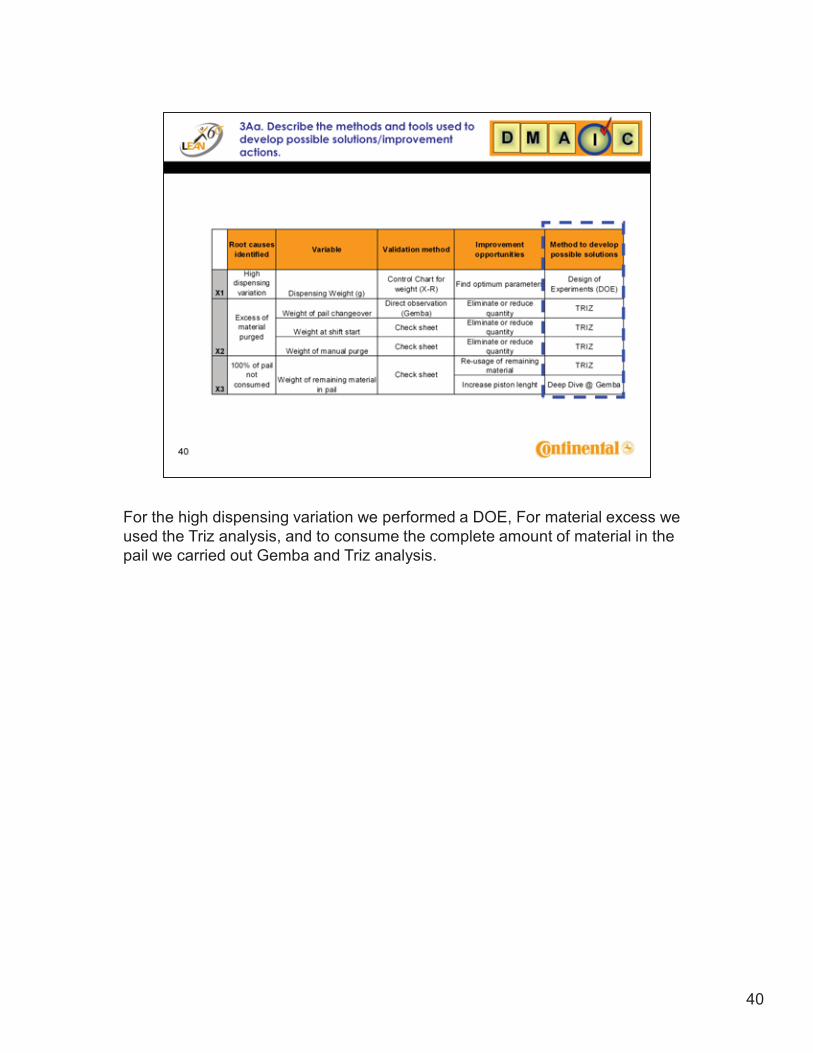
For the high dispensing variation we performed a DOE, For material excess we used the Triz analysis, and to consume the complete amount of material in the pail we carried out Gemba and Triz analysis.
41
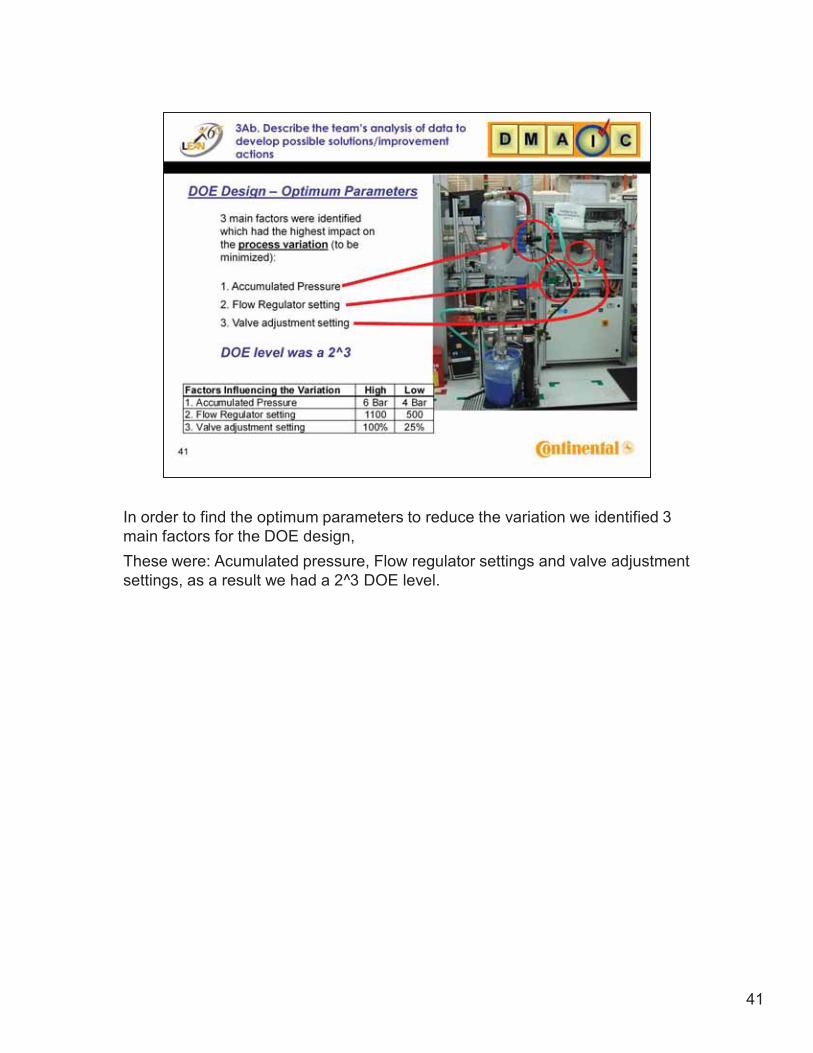
In order to find the optimum parameters to reduce the variation we identified 3 main factors for the DOE design,These were: Acumulated pressure, Flow regulator settings and valve adjustment settings, as a result we had a 2^3 DOE level.
42
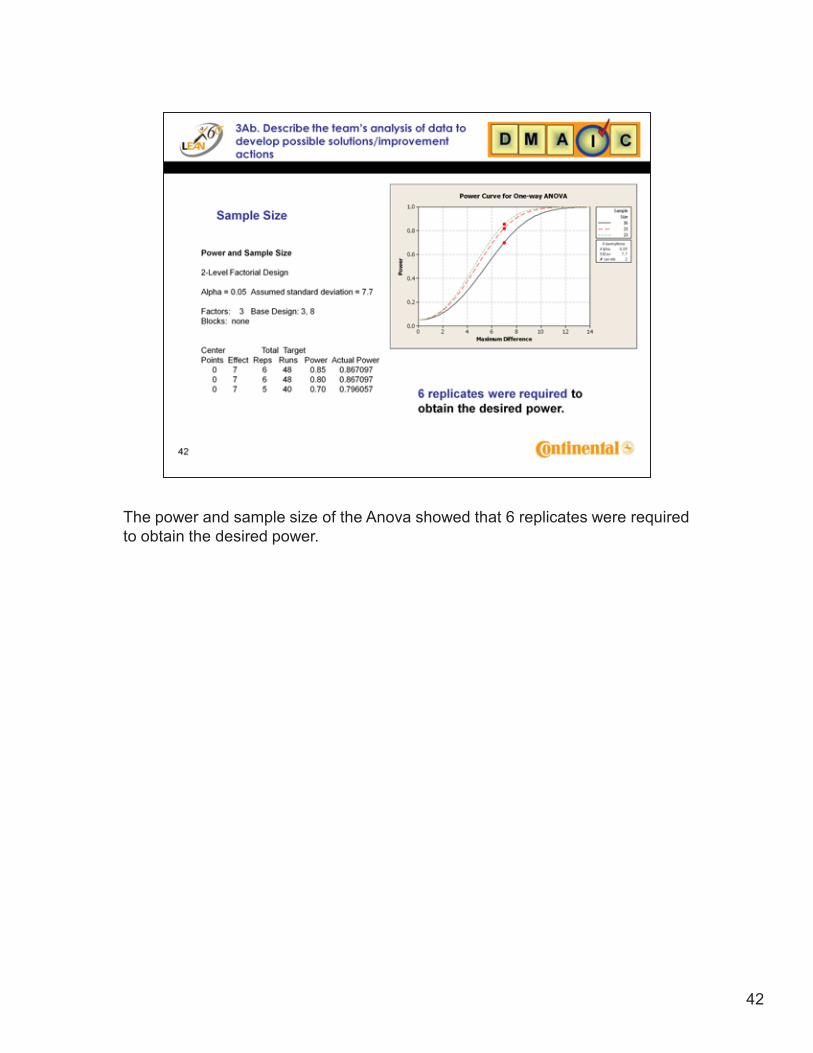
The power and sample size of the Anova showed that 6 replicates were required to obtain the desired power.
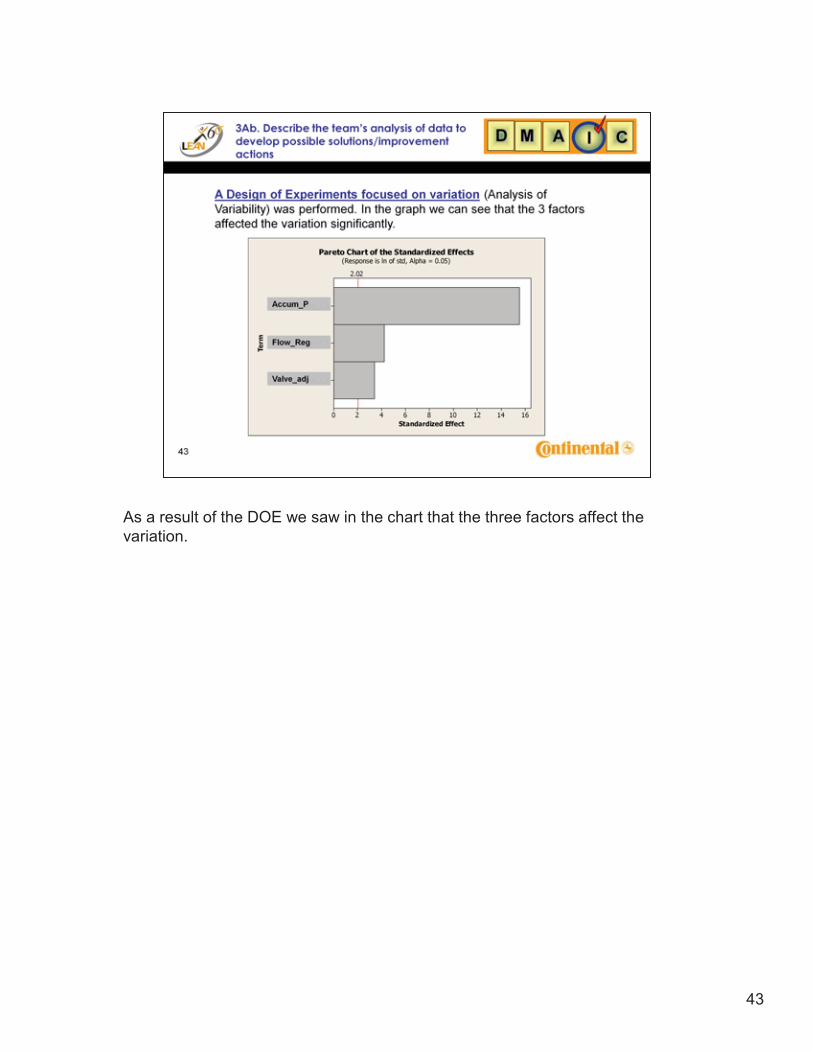
43
As a result of the DOE we saw in the chart that the three factors affect the variation.
44
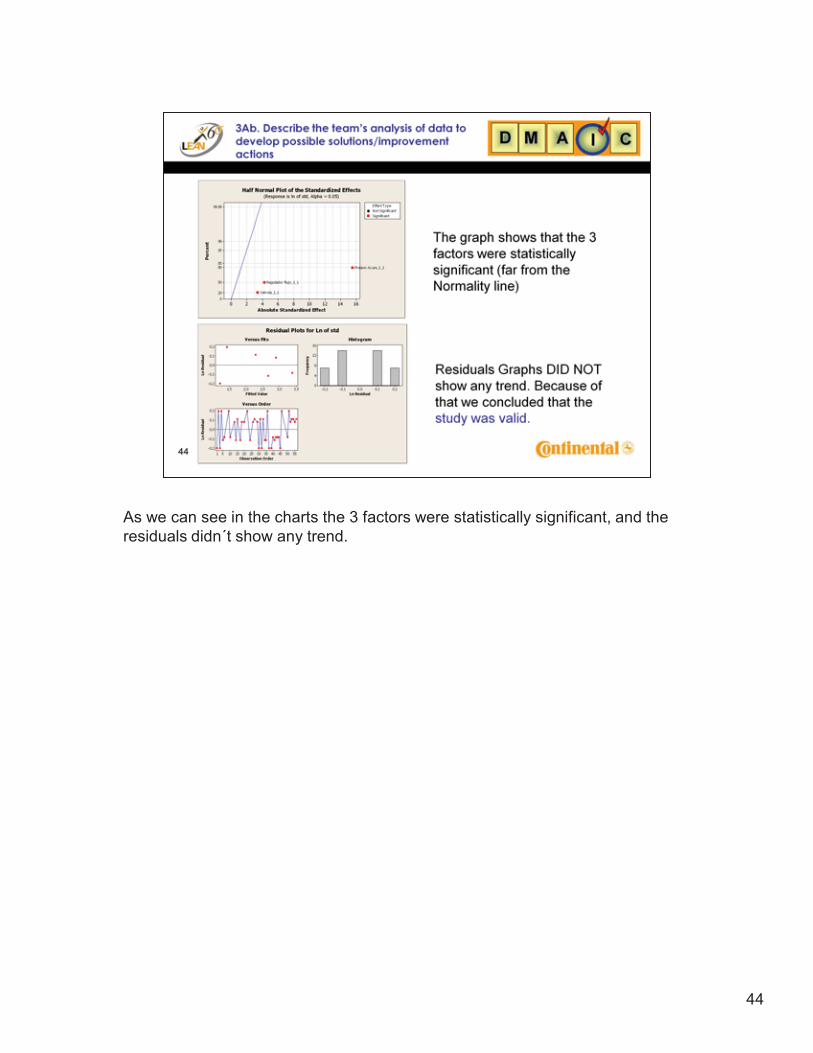
As we can see in the charts the 3 factors were statistically significant, and the residuals didn´t show any trend.
45
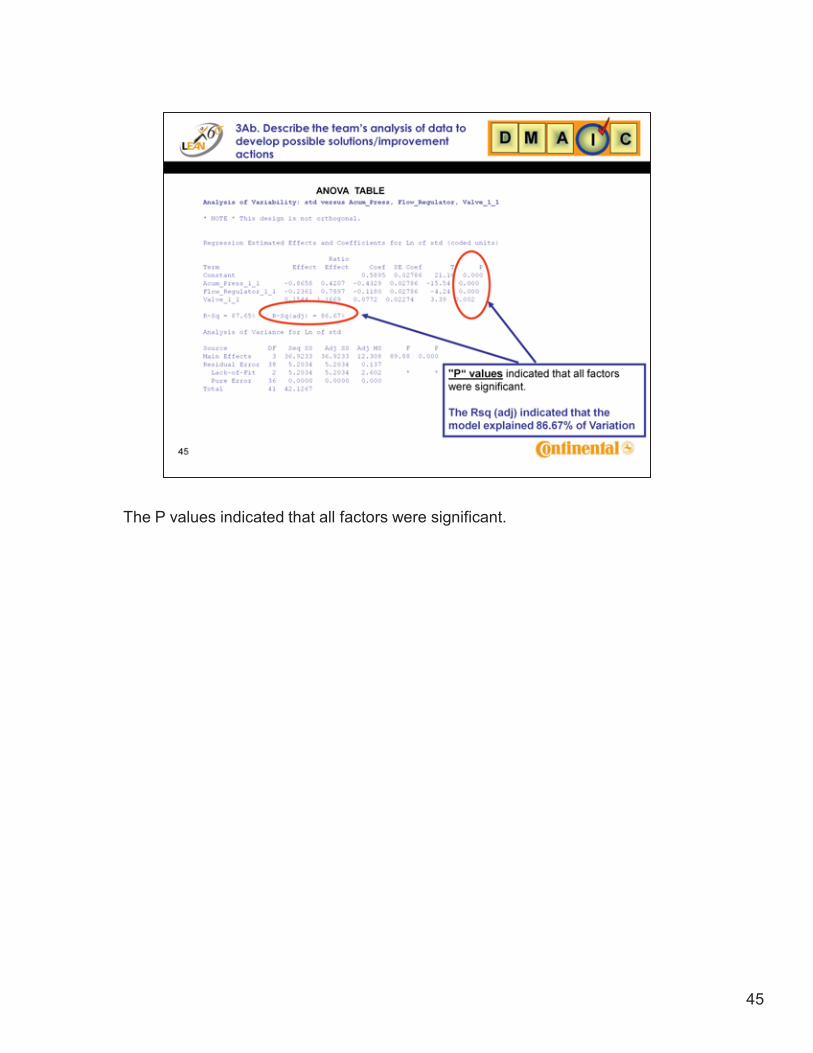
The P values indicated that all factors were significant.
46
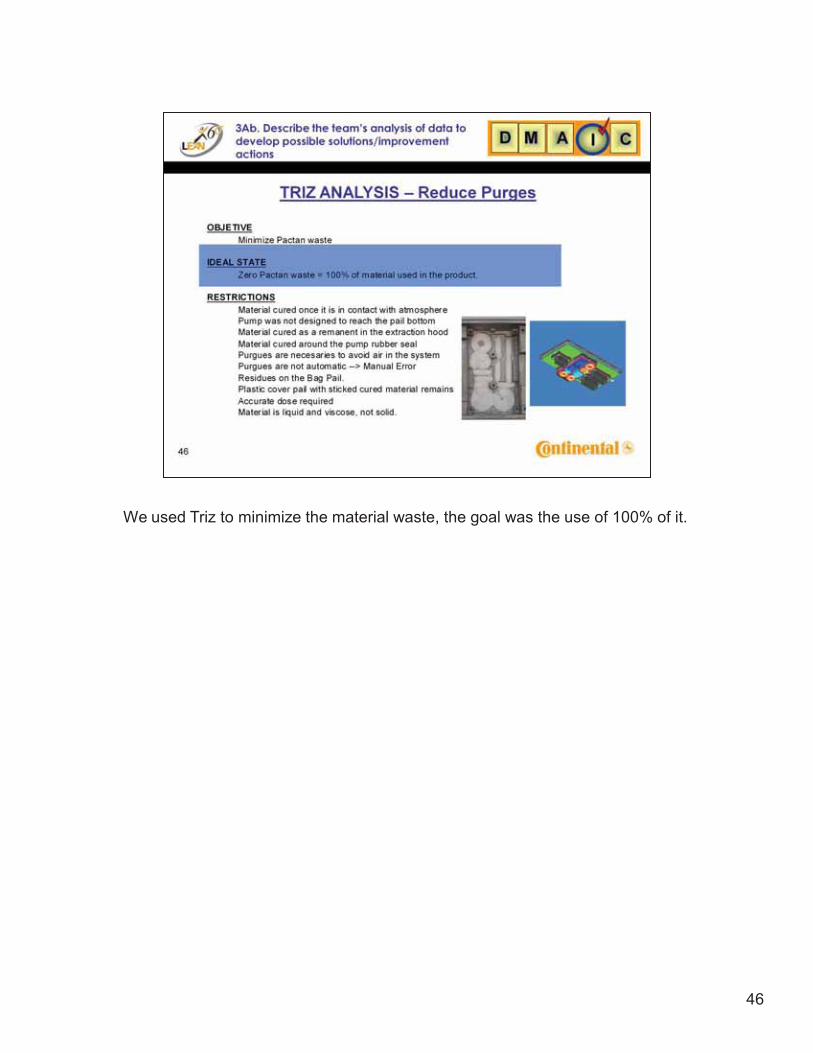
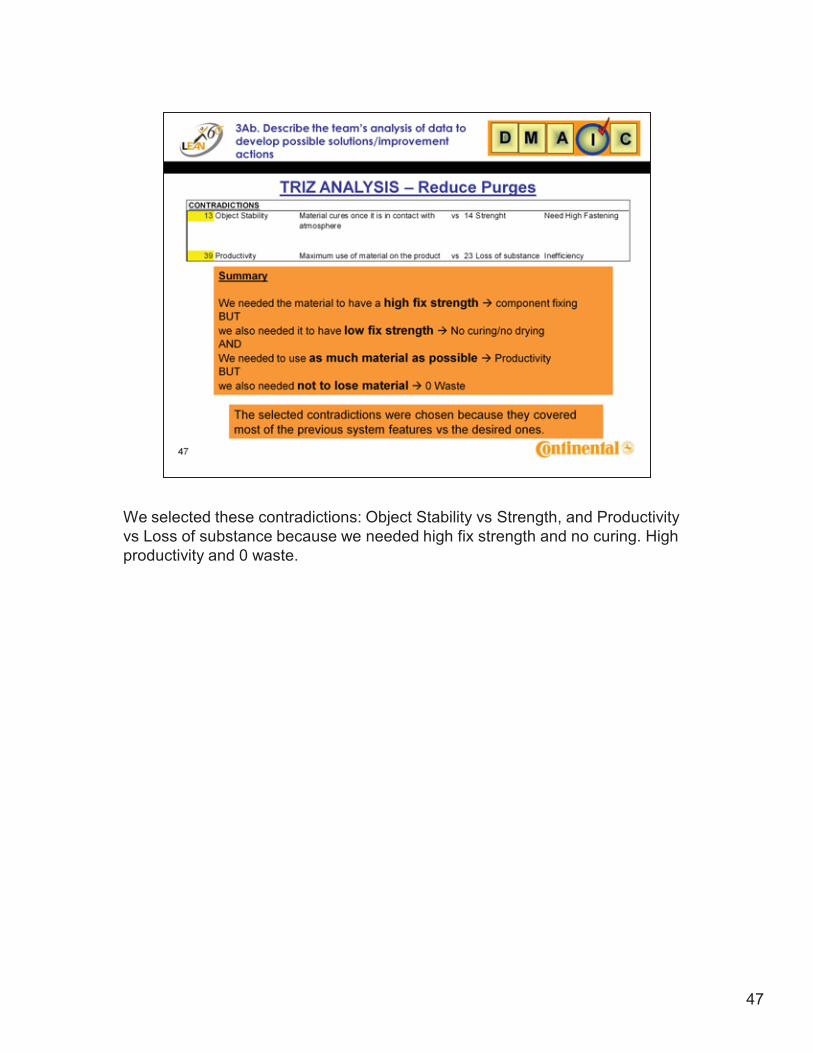
We used Triz to minimize the material waste, the goal was the use of 100% of it.
47
We selected these contradictions: Object Stability vs Strength, and Productivity vs Loss of substance because we needed high fix strength and no curing. High productivity and 0 waste.
48
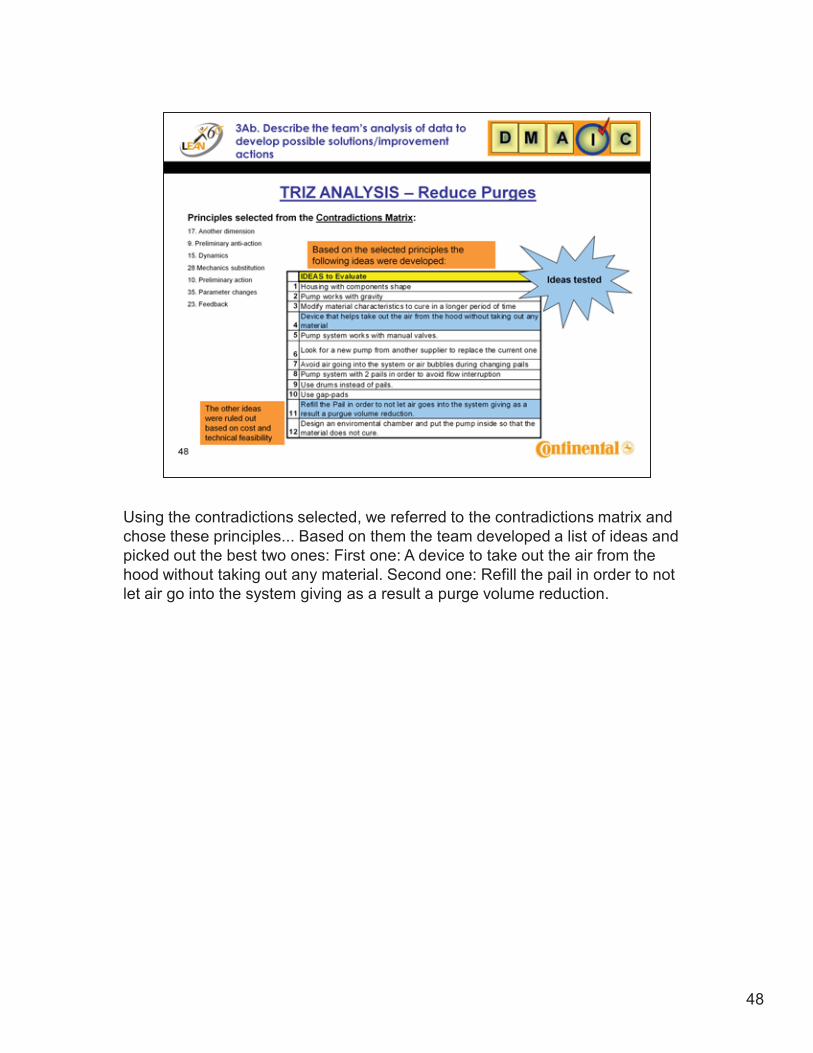
Using the contradictions selected, we referred to the contradictions matrix and chose these principles... Based on them the team developed a list of ideas and picked out the best two ones: First one: A device to take out the air from the hood without taking out any material. Second one: Refill the pail in order to not let air go into the system giving as a result a purge volume reduction.
49
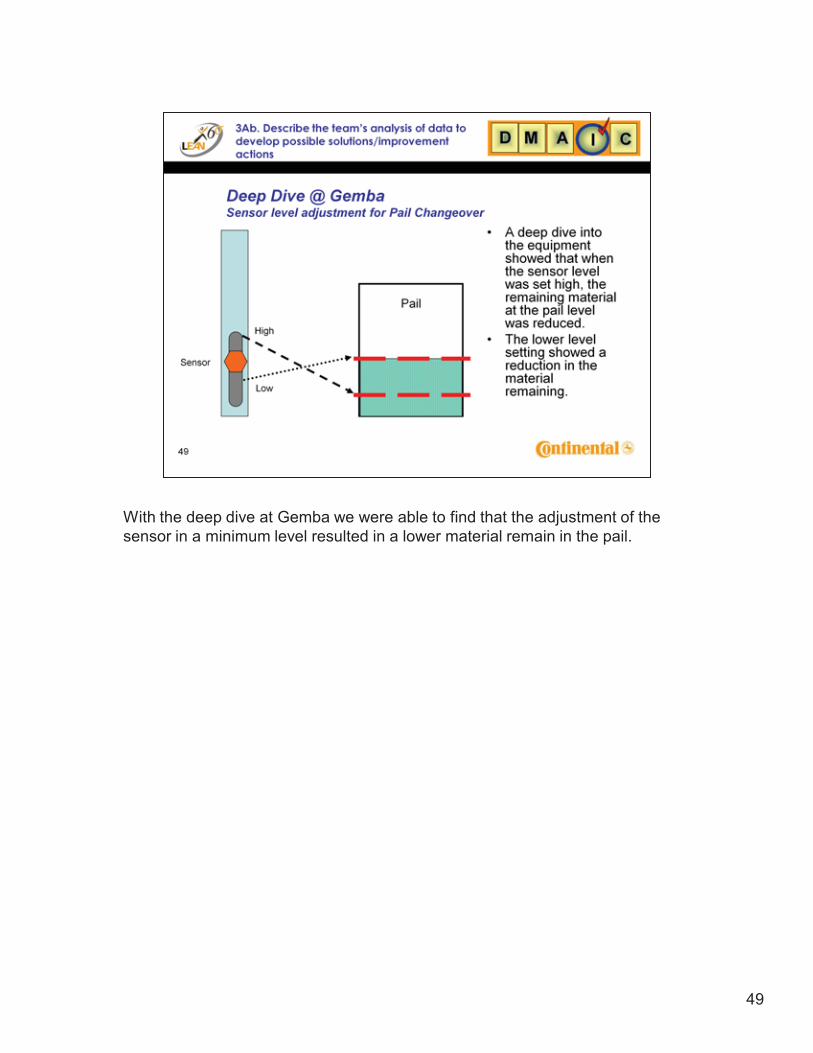
With the deep dive at Gemba we were able to find that the adjustment of the sensor in a minimum level resulted in a lower material remain in the pail.
50
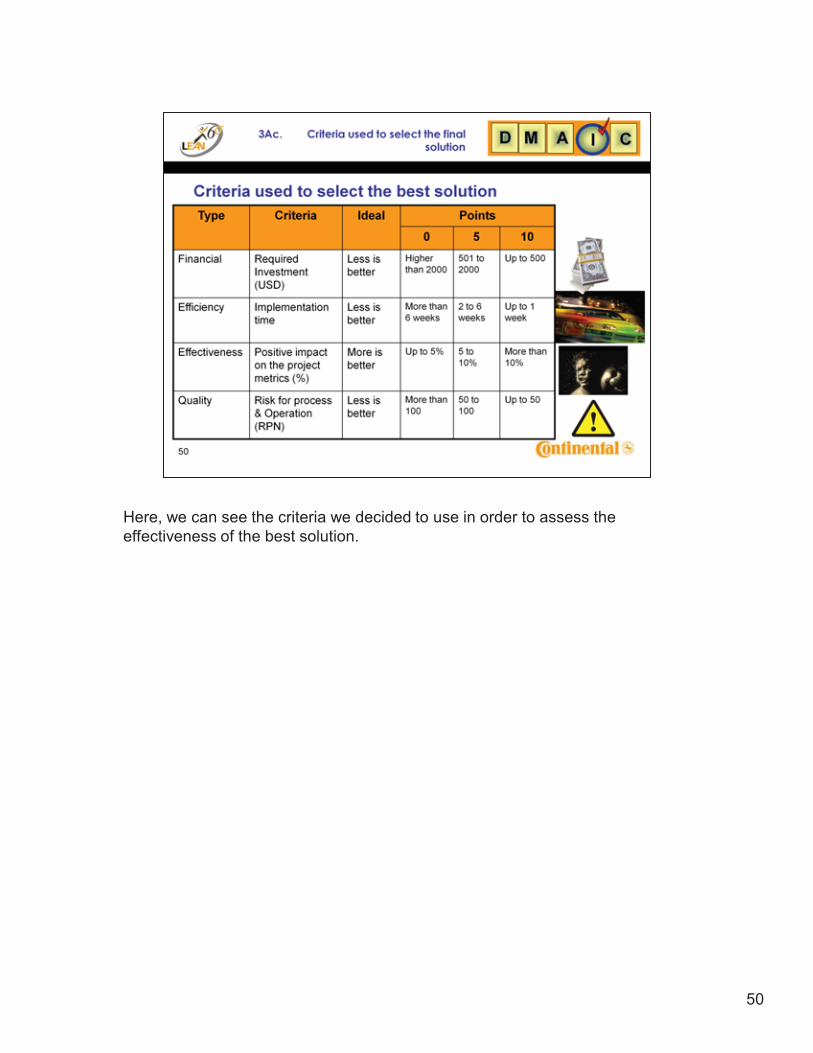
Here, we can see the criteria we decided to use in order to assess the effectiveness of the best solution.
51
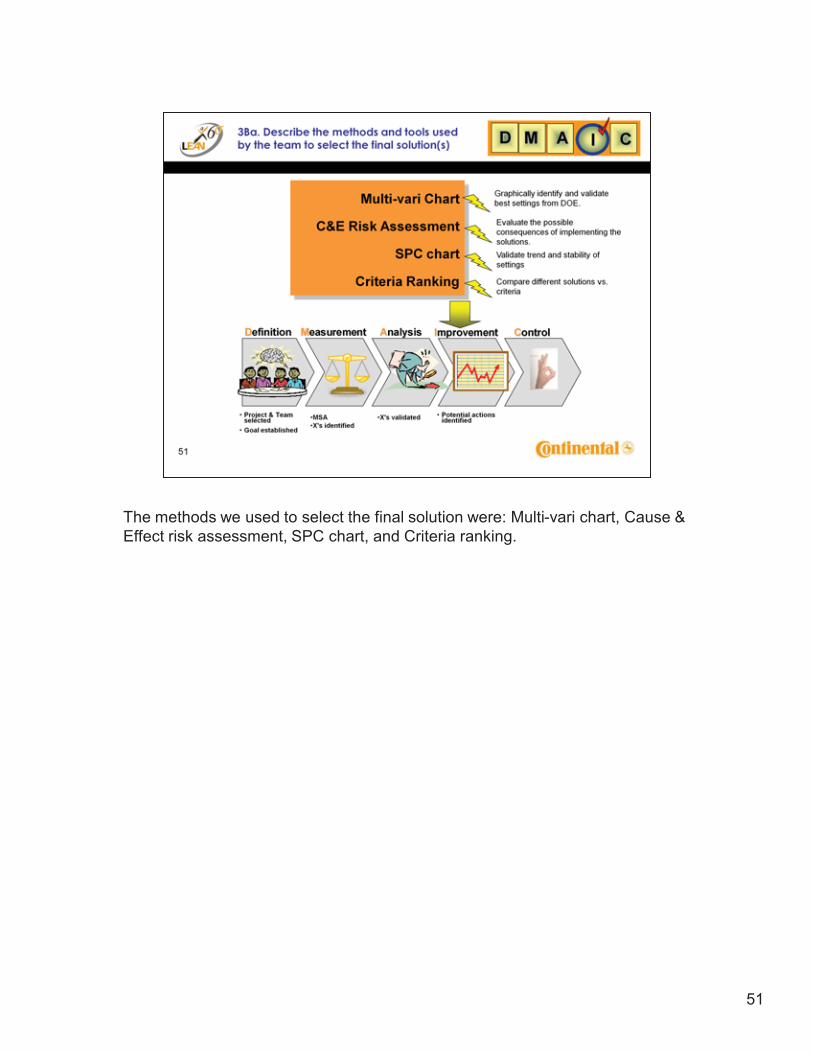
The methods we used to select the final solution were: Multi-vari chart, Cause & Effect risk assessment, SPC chart, and Criteria ranking.
52
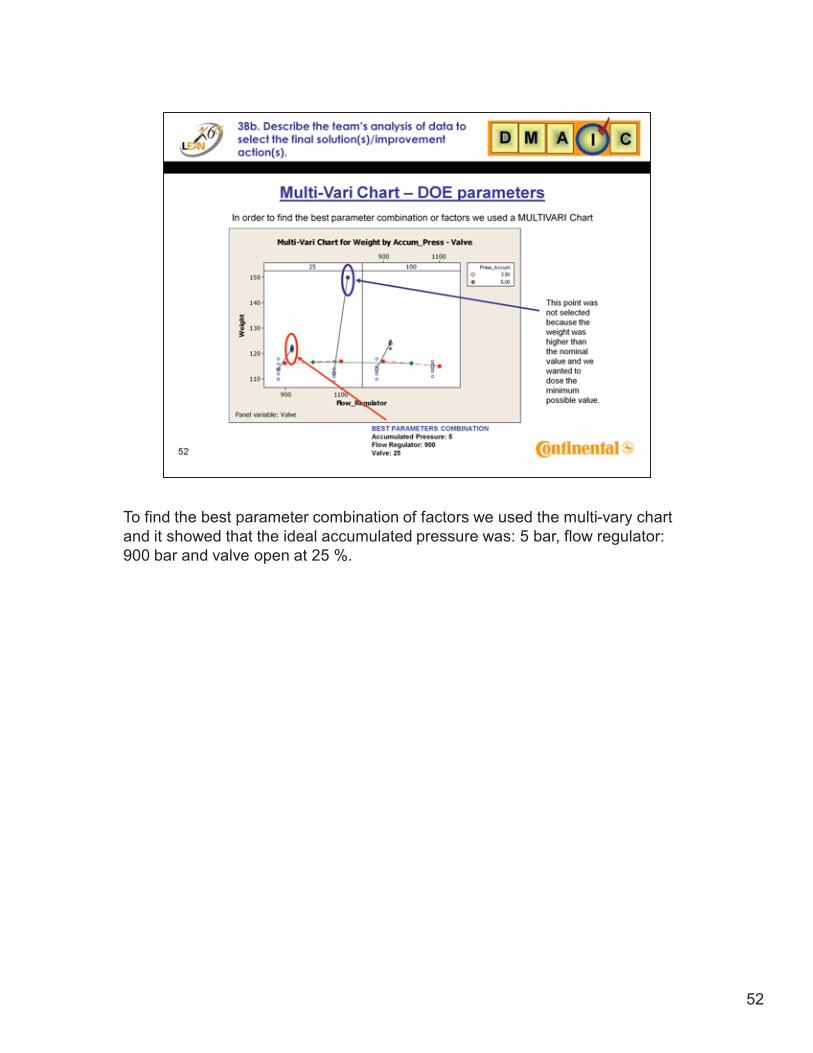
To find the best parameter combination of factors we used the multi-vary chart and it showed that the ideal accumulated pressure was: 5 bar, flow regulator: 900 bar and valve open at 25 %.
53
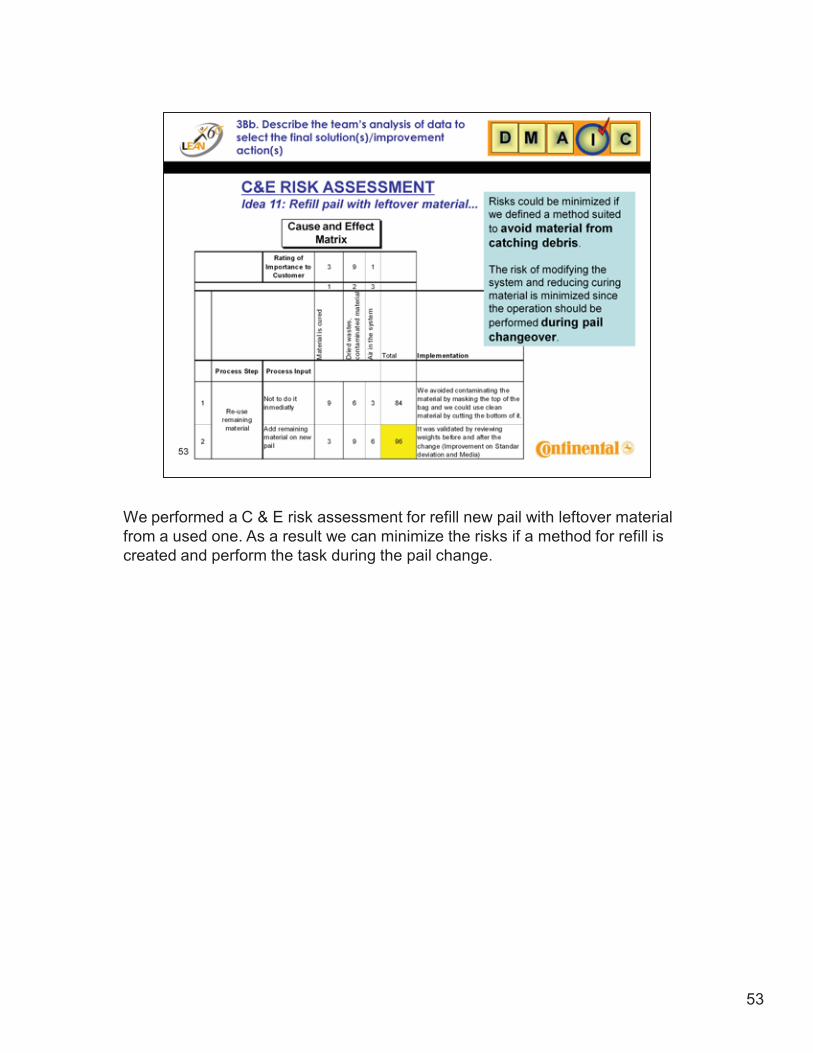
We performed a C & E risk assessment for refill new pail with leftover material from a used one. As a result we can minimize the risks if a method for refill is created and perform the task during the pail change.
54
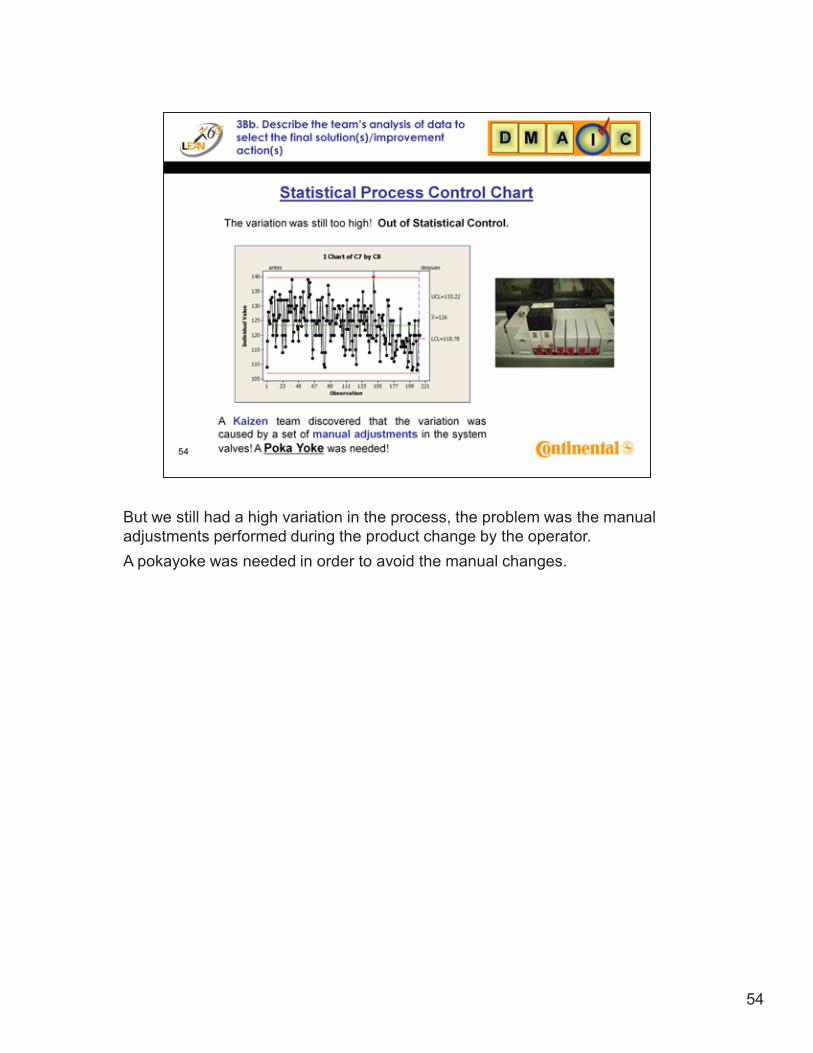
But we still had a high variation in the process, the problem was the manual adjustments performed during the product change by the operator.A pokayoke was needed in order to avoid the manual changes.
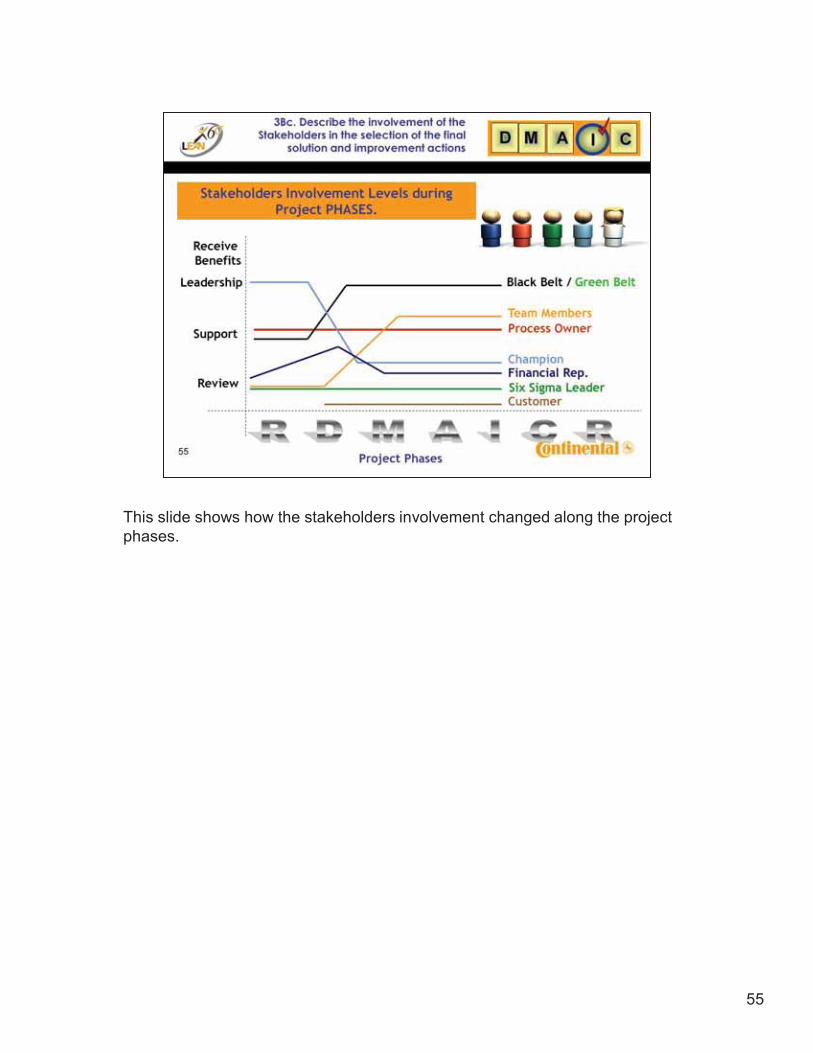
55
This slide shows how the stakeholders involvement changed along the project phases.
56
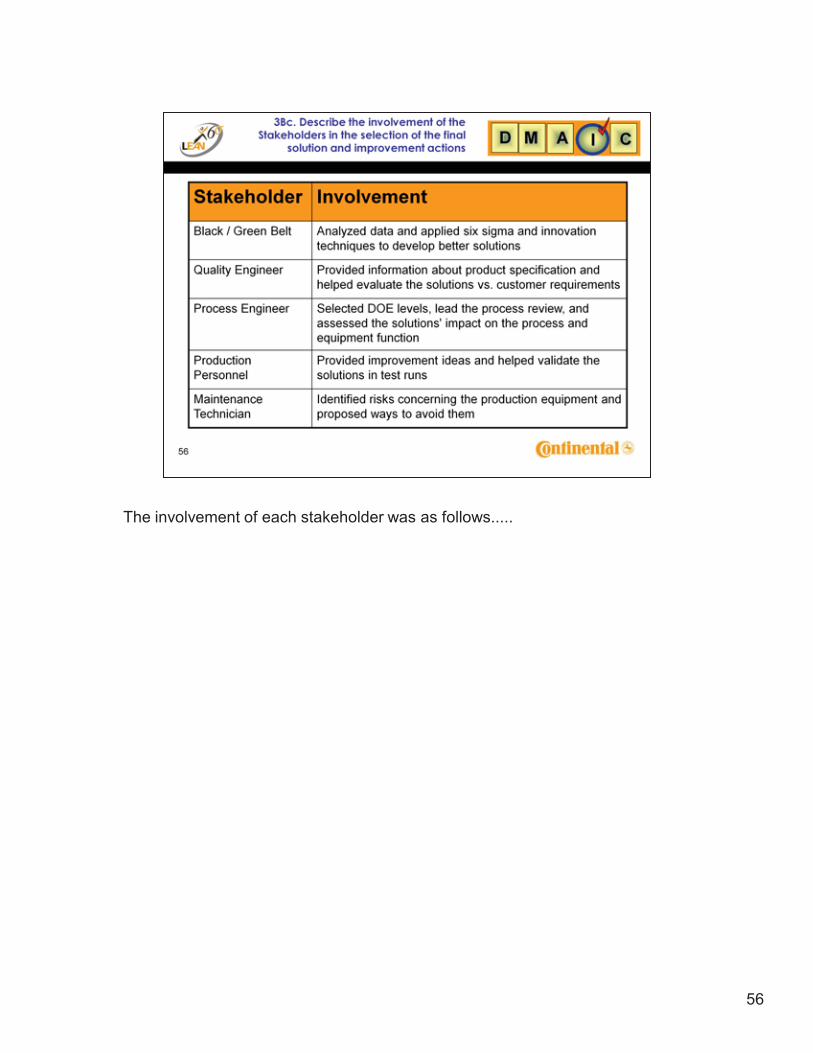
The involvement of each stakeholder was as follows.....
57
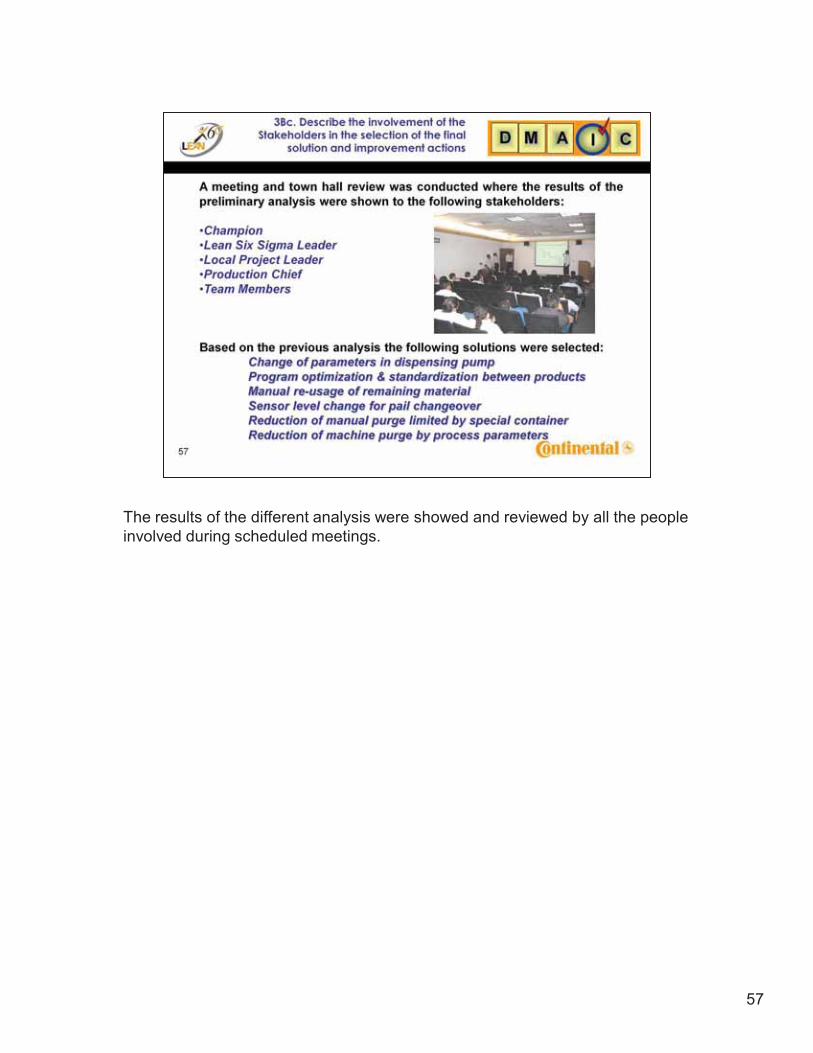
The results of the different analysis were showed and reviewed by all the people involved during scheduled meetings.
58
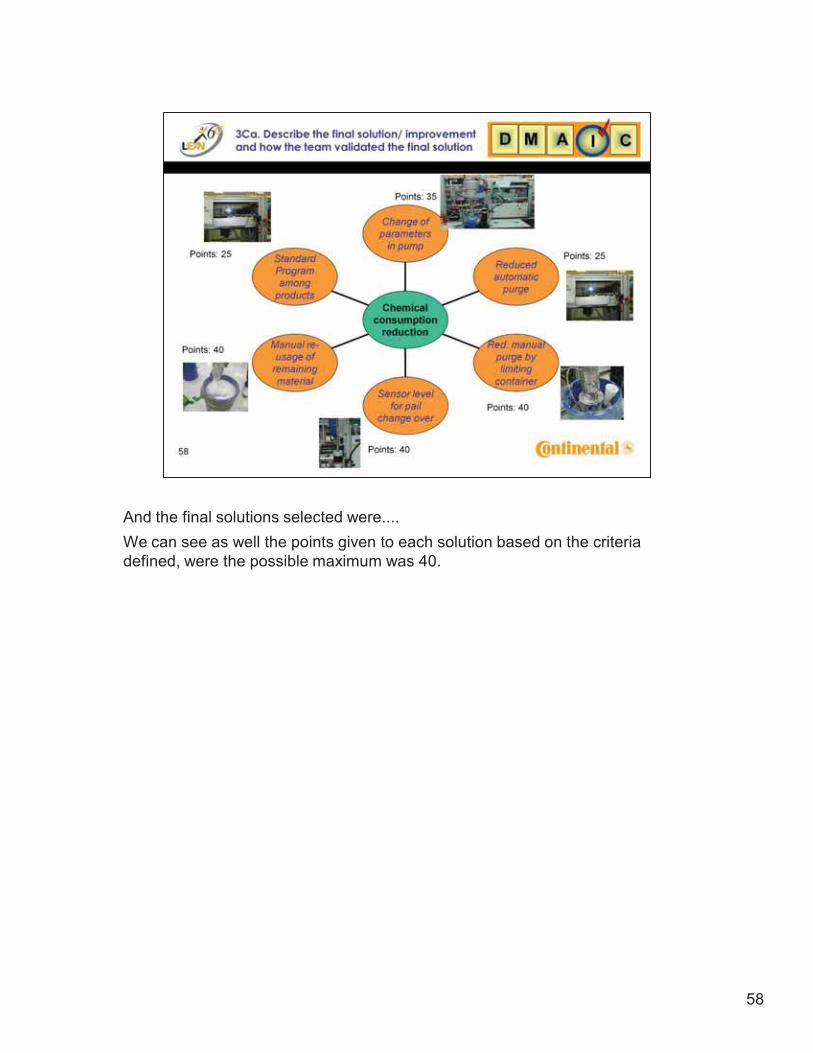
And the final solutions selected were....We can see as well the points given to each solution based on the criteria defined, were the possible maximum was 40.
59
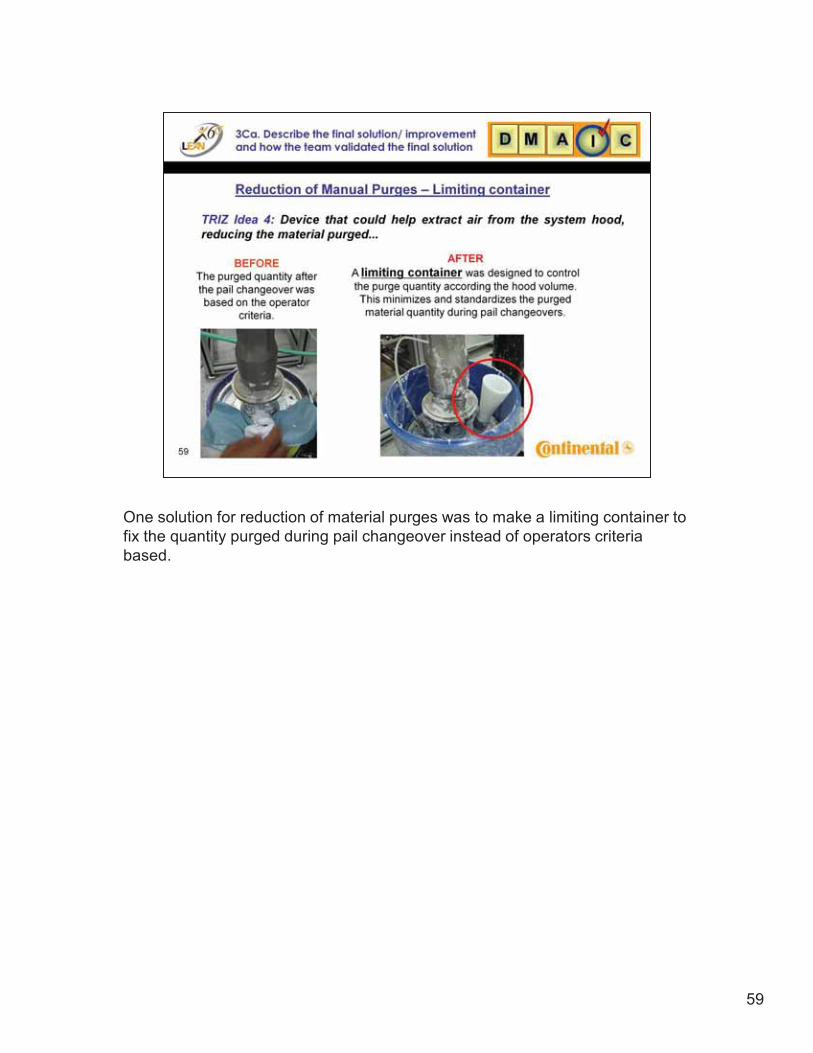
One solution for reduction of material purges was to make a limiting container to fix the quantity purged during pail changeover instead of operators criteria based.
60
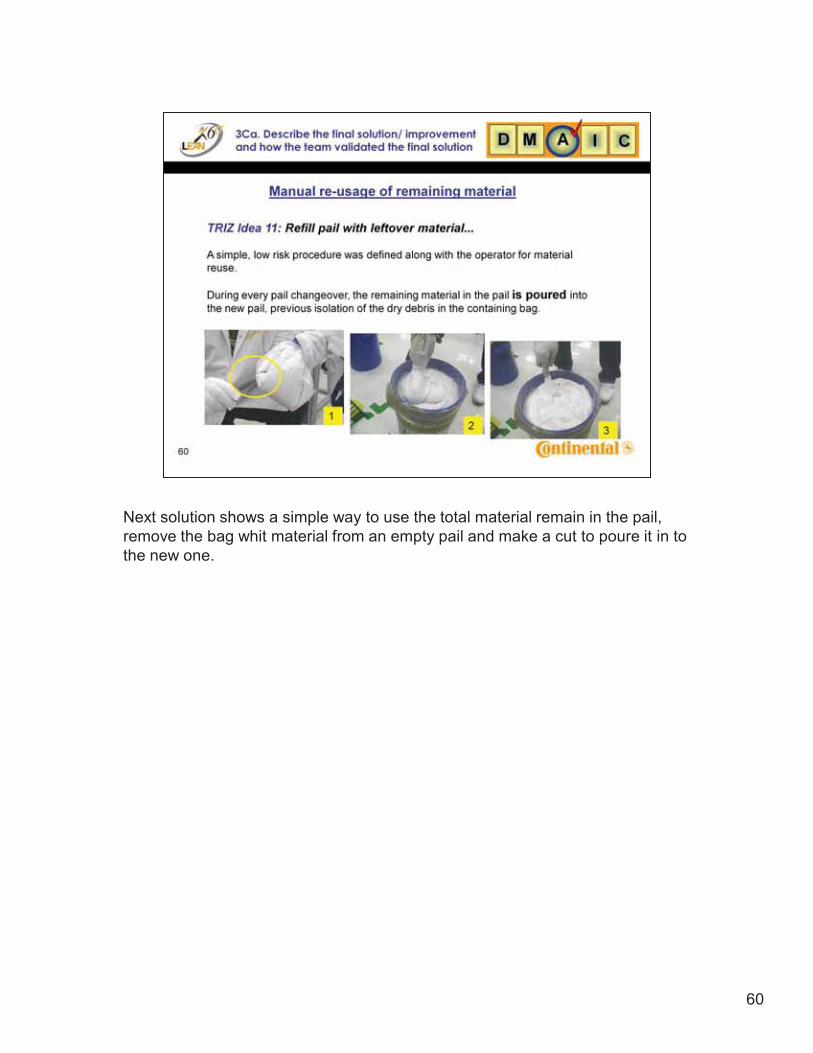
Next solution shows a simple way to use the total material remain in the pail, remove the bag whit material from an empty pail and make a cut to poure it in to the new one.
61
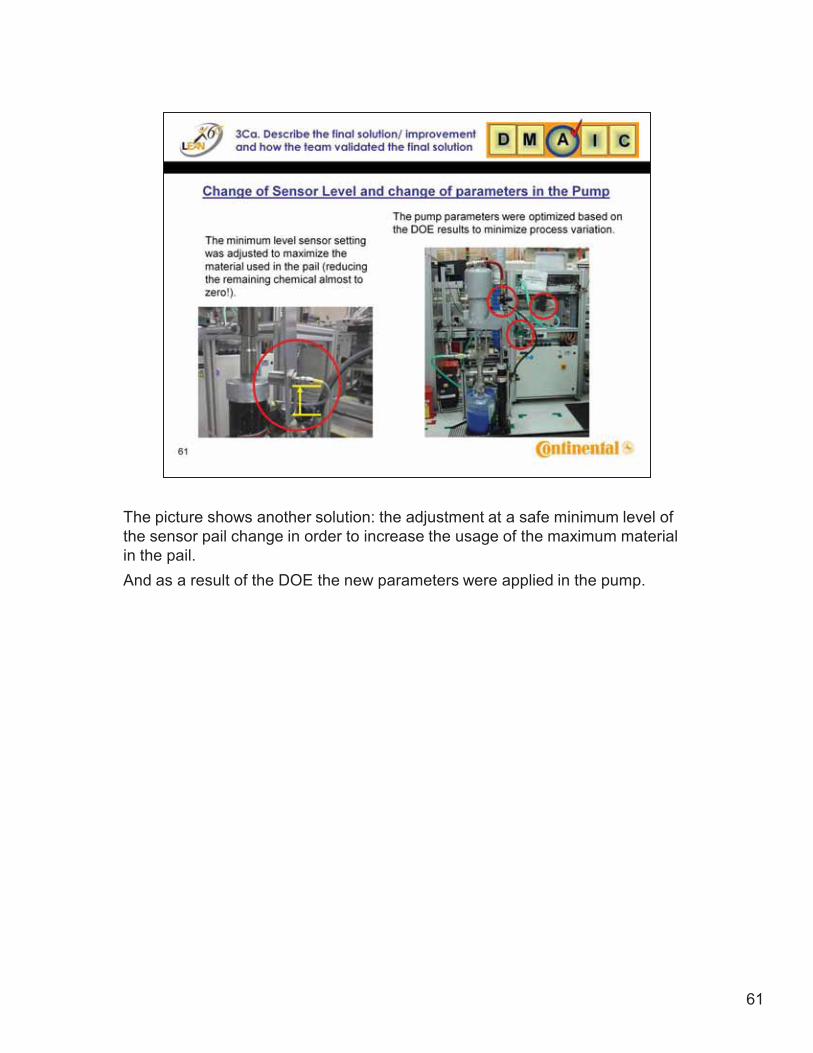
The picture shows another solution: the adjustment at a safe minimum level of the sensor pail change in order to increase the usage of the maximum material in the pail.And as a result of the DOE the new parameters were applied in the pump.
62
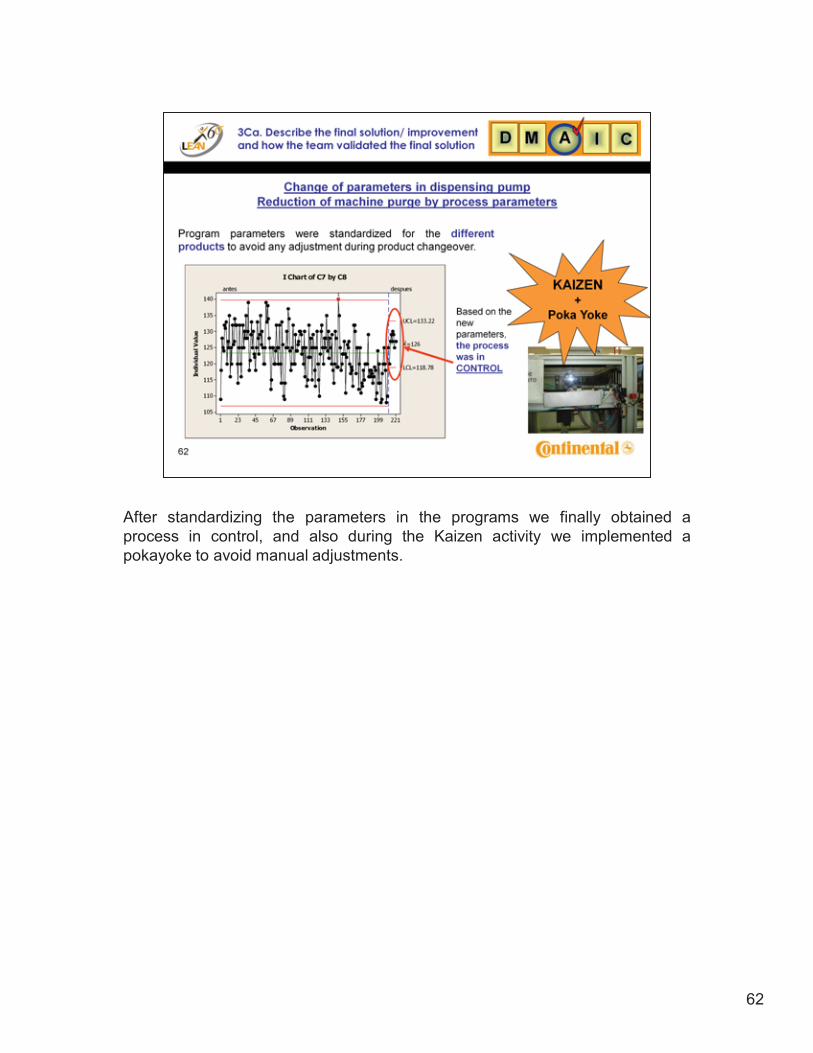
After standardizing the parameters in the programs we finally obtained aprocess in control, and also during the Kaizen activity we implemented apokayoke to avoid manual adjustments.
63
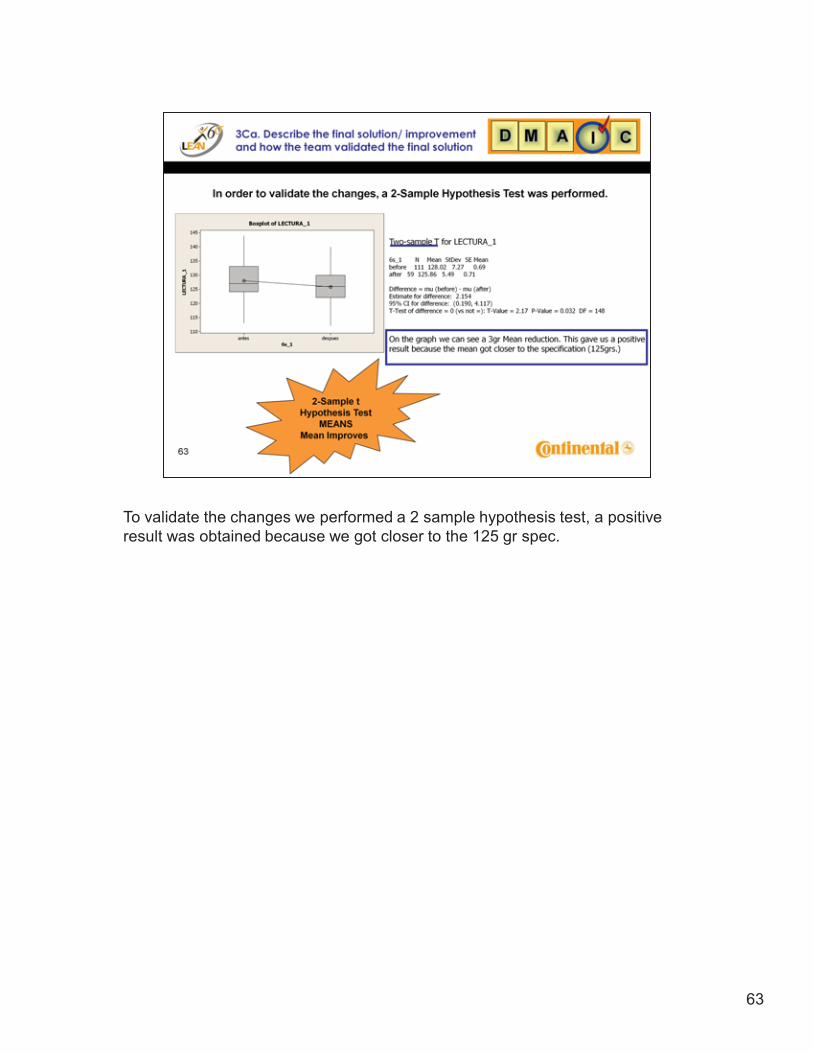
To validate the changes we performed a 2 sample hypothesis test, a positive result was obtained because we got closer to the 125 gr spec.
64
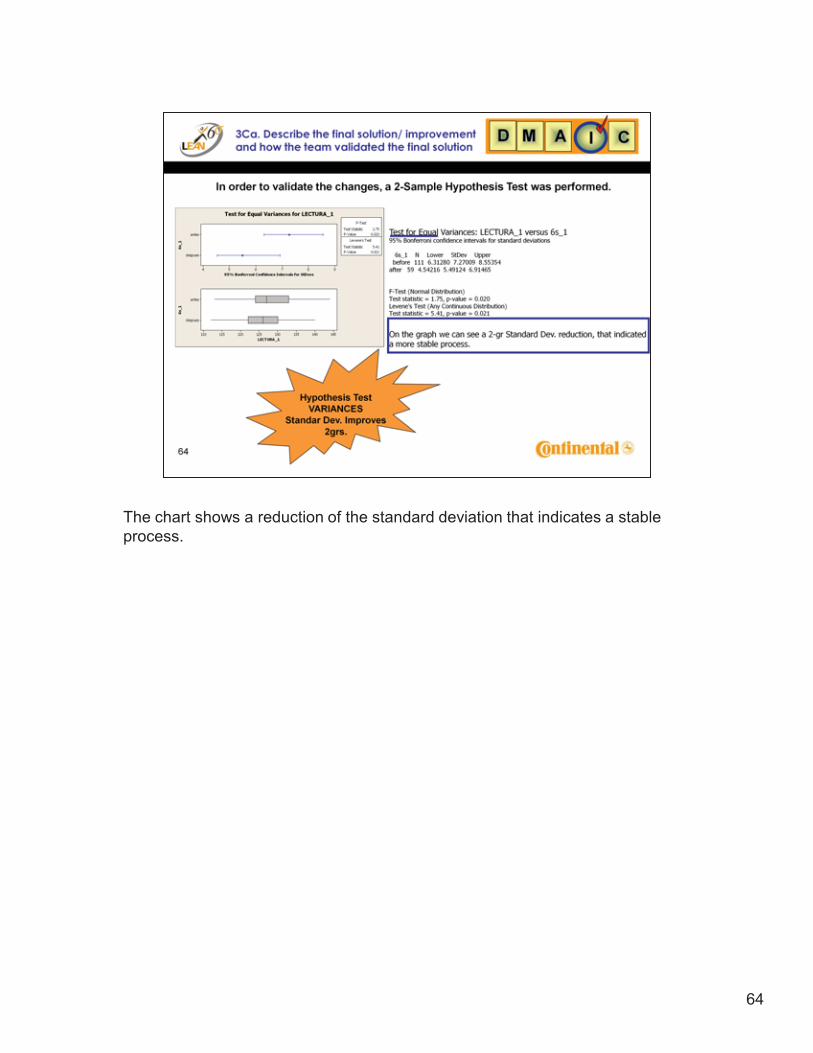
The chart shows a reduction of the standard deviation that indicates a stable process.
65
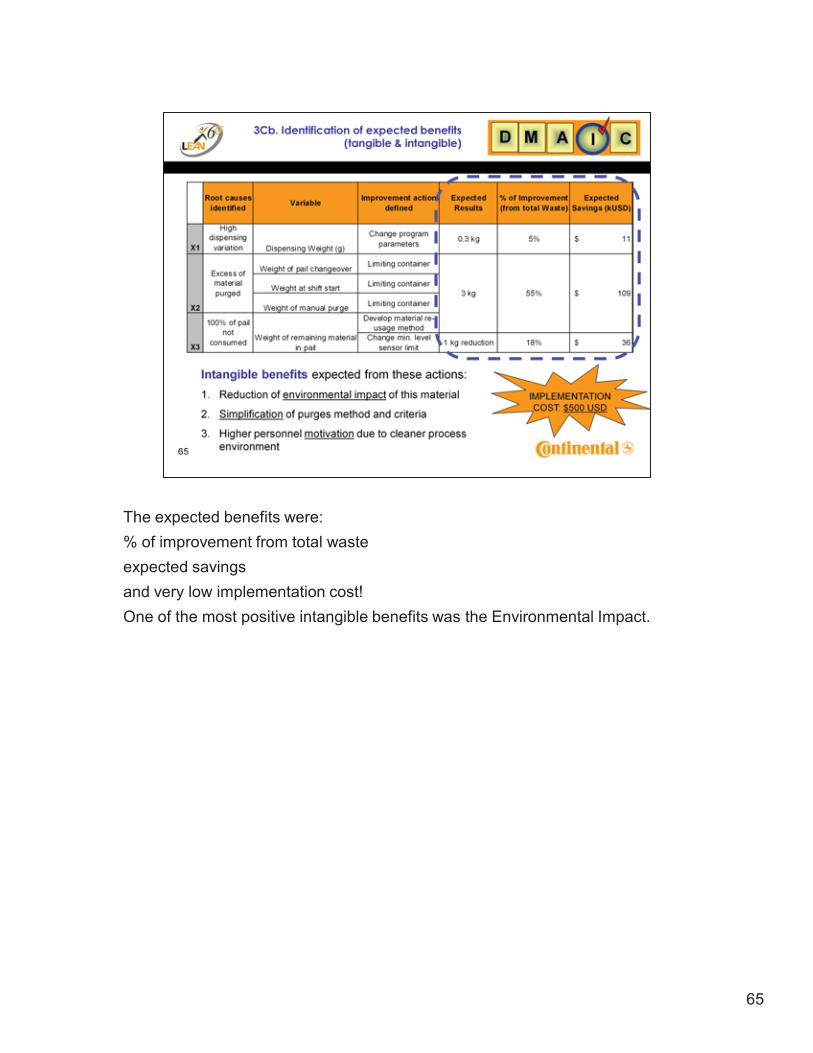
The expected benefits were:% of improvement from total wasteexpected savingsand very low implementation cost!One of the most positive intangible benefits was the Environmental Impact.
66
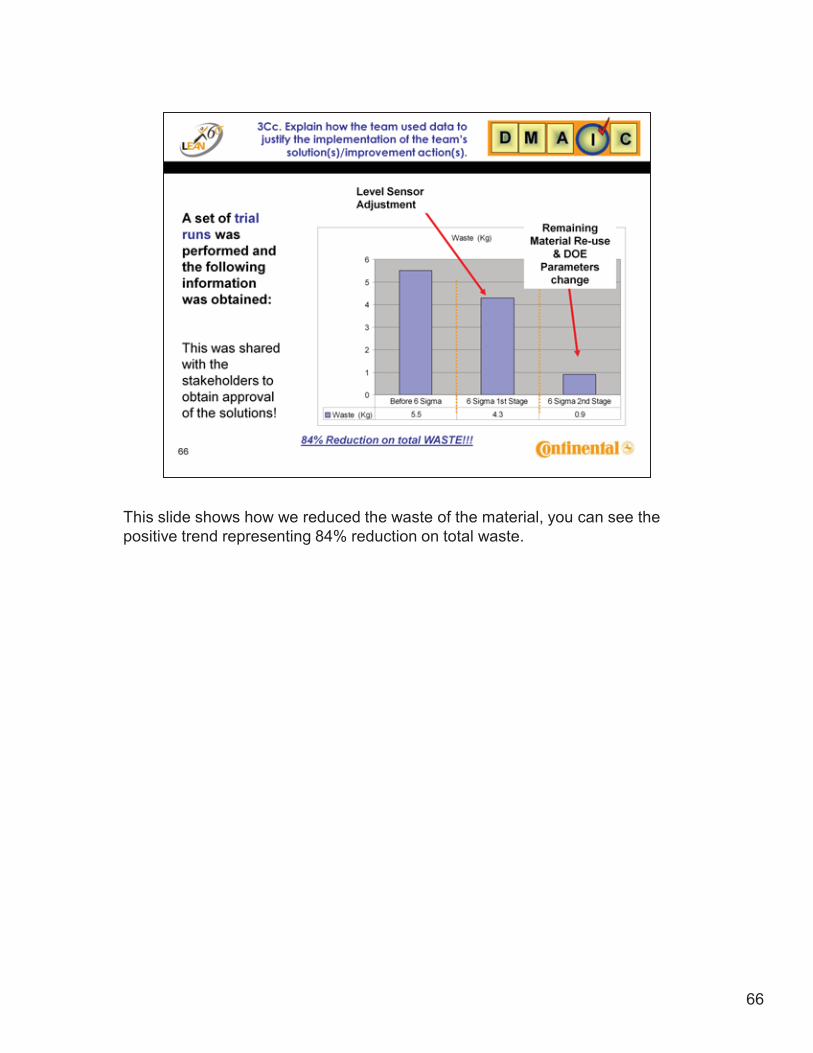
This slide shows how we reduced the waste of the material, you can see the positive trend representing 84% reduction on total waste.
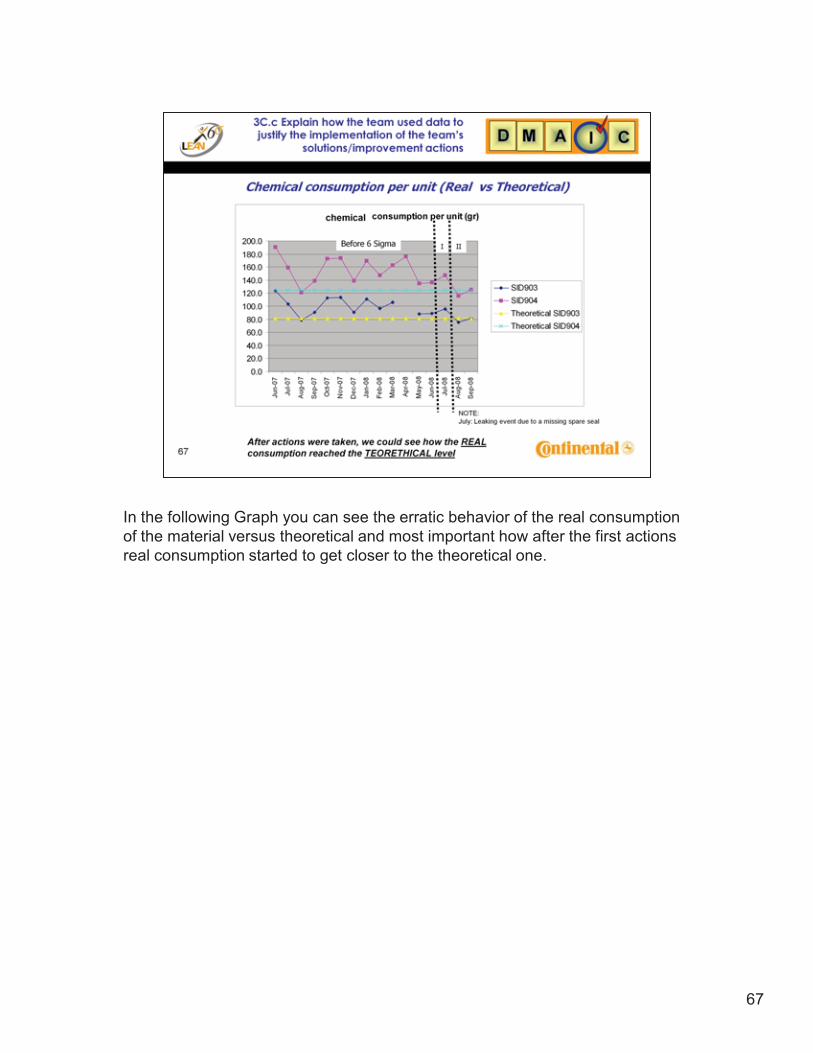
67
In the following Graph you can see the erratic behavior of the real consumption of the material versus theoretical and most important how after the first actions real consumption started to get closer to the theoretical one.
68
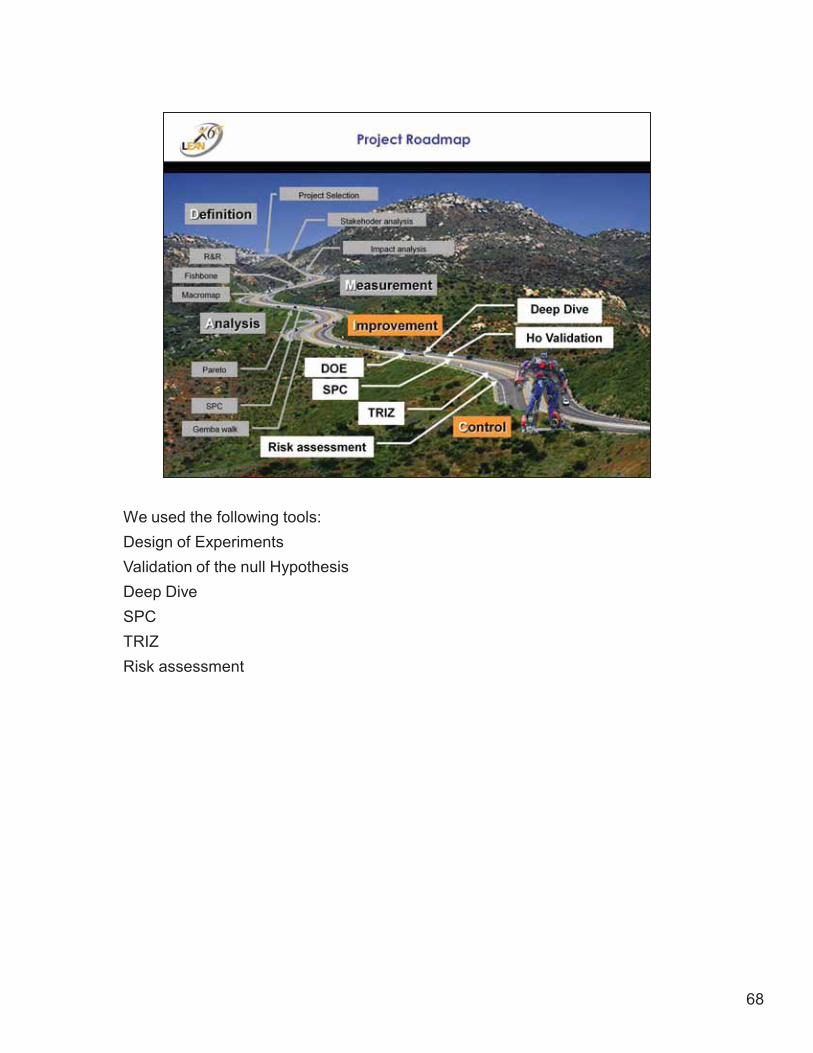
We used the following tools:Design of ExperimentsValidation of the null HypothesisDeep DiveSPCTRIZRisk assessment
69
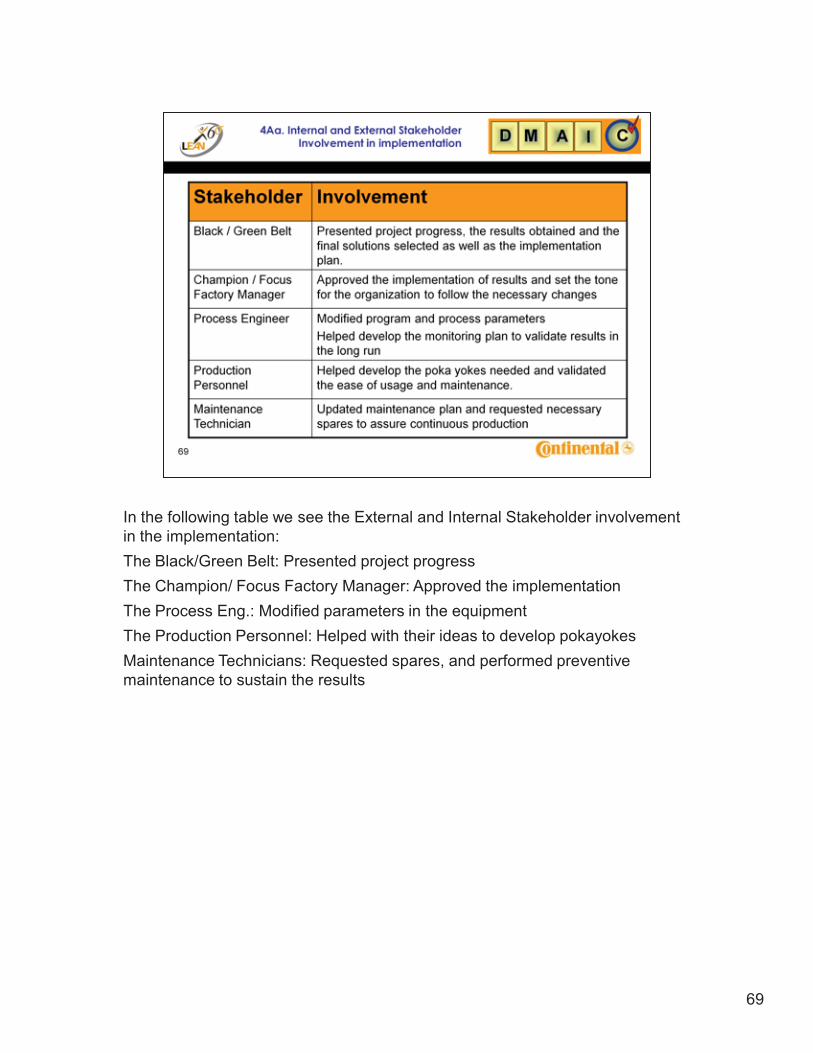
In the following table we see the External and Internal Stakeholder involvement in the implementation:The Black/Green Belt: Presented project progressThe Champion/ Focus Factory Manager: Approved the implementationThe Process Eng.: Modified parameters in the equipmentThe Production Personnel: Helped with their ideas to develop pokayokesMaintenance Technicians: Requested spares, and performed preventive maintenance to sustain the results
70
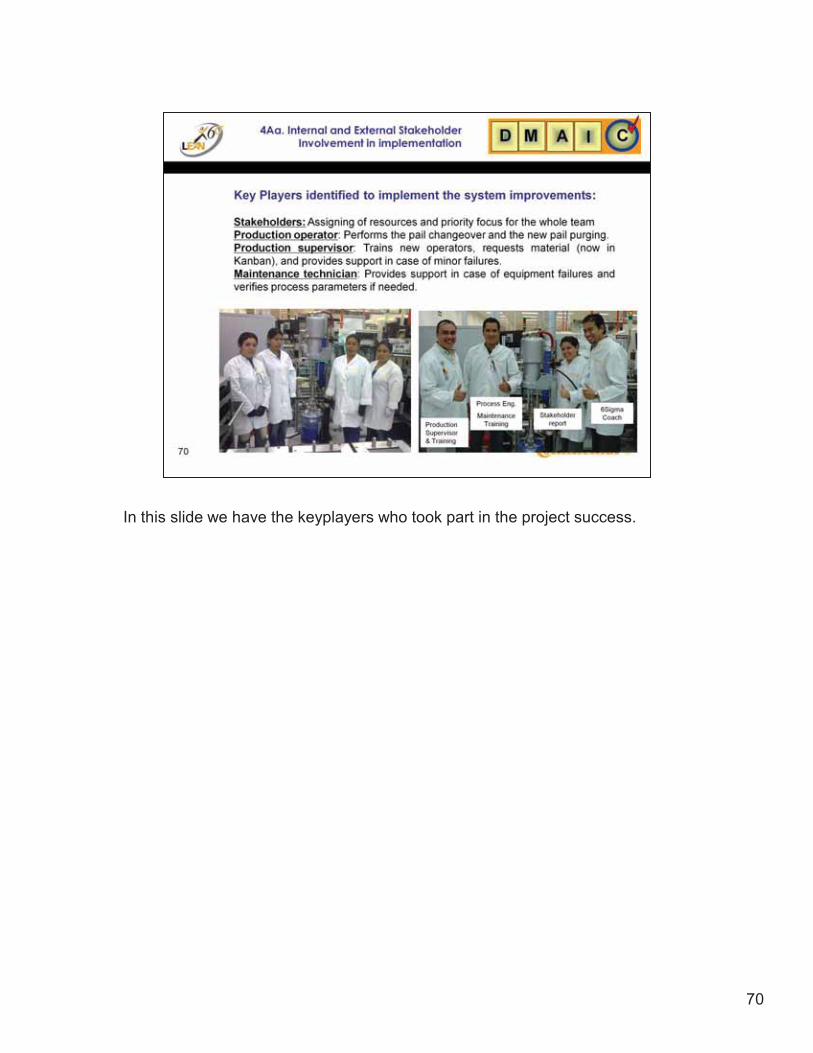
In this slide we have the keyplayers who took part in the project success.
71
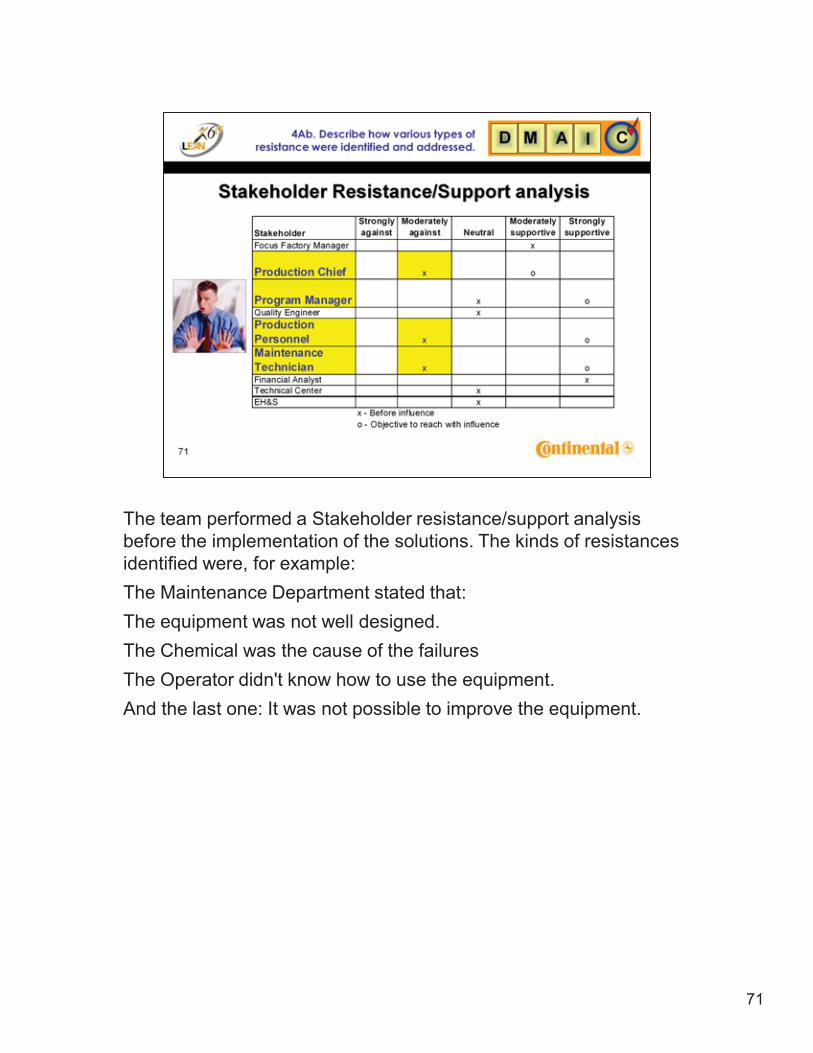
The team performed a Stakeholder resistance/support analysis before the implementation of the solutions. The kinds of resistances identified were, for example:The Maintenance Department stated that: The equipment was not well designed.The Chemical was the cause of the failuresThe Operator didn't know how to use the equipment.And the last one: It was not possible to improve the equipment.
72
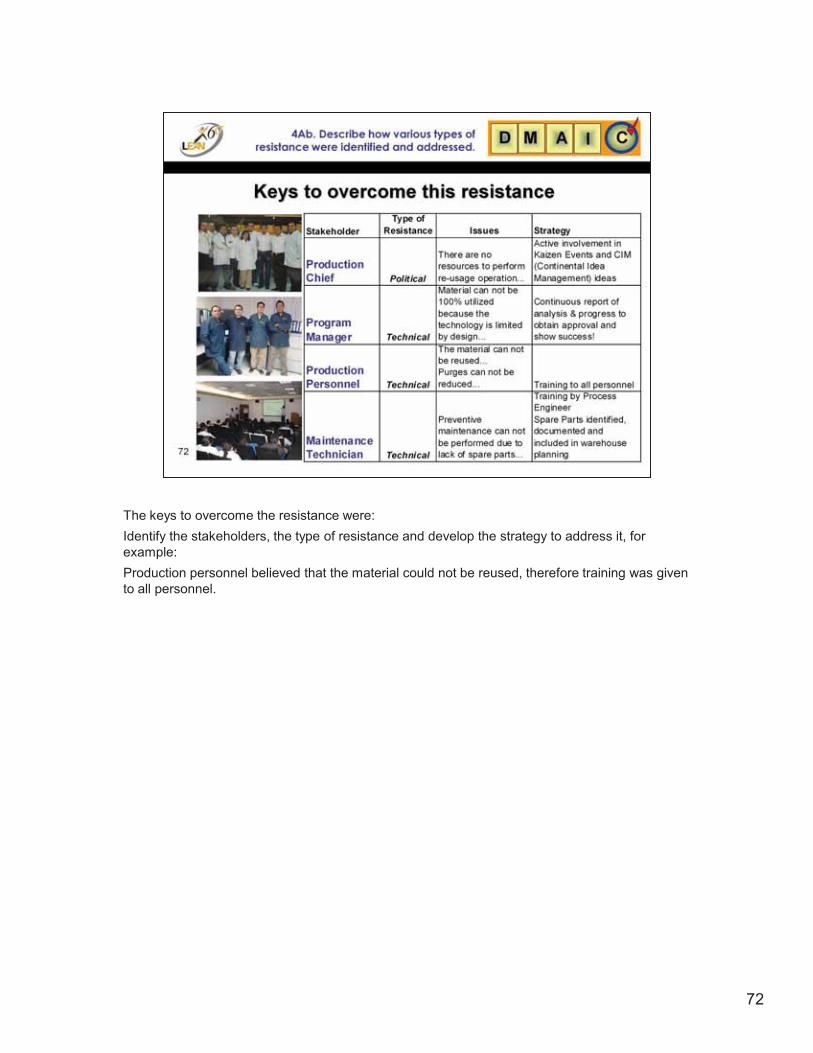
The keys to overcome the resistance were:Identify the stakeholders, the type of resistance and develop the strategy to address it, for example:Production personnel believed that the material could not be reused, therefore training was given to all personnel.
73
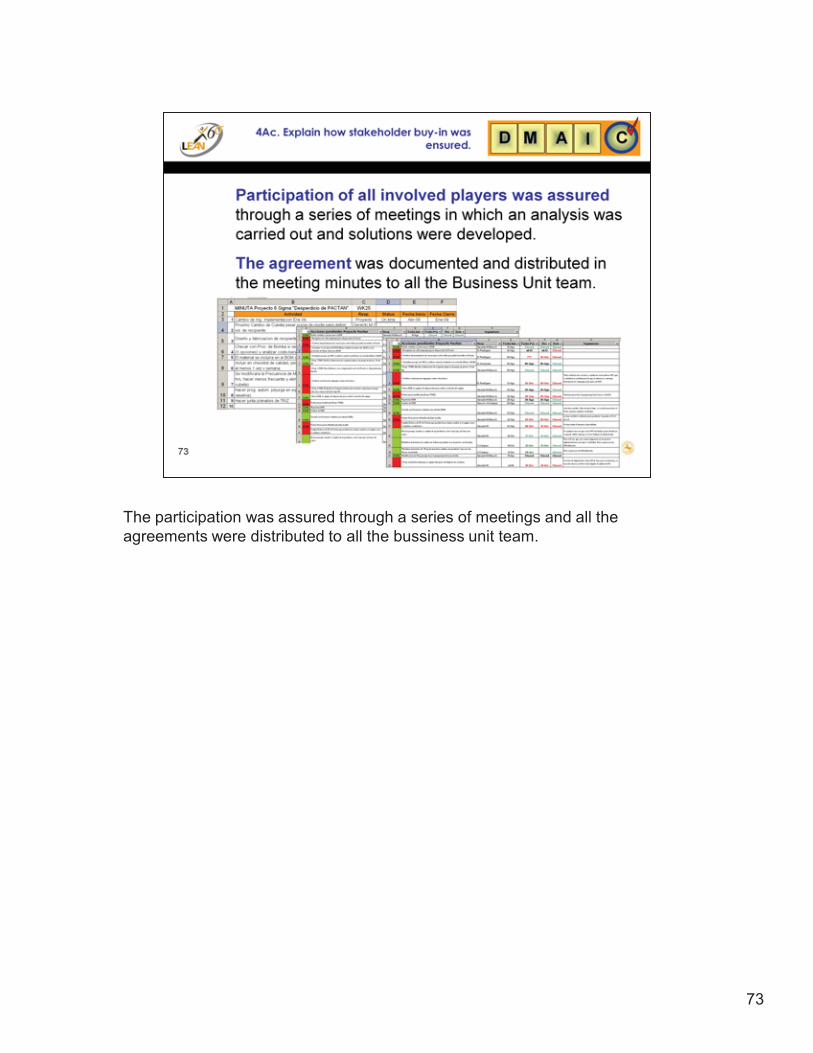
The participation was assured through a series of meetings and all the agreements were distributed to all the bussiness unit team.
74
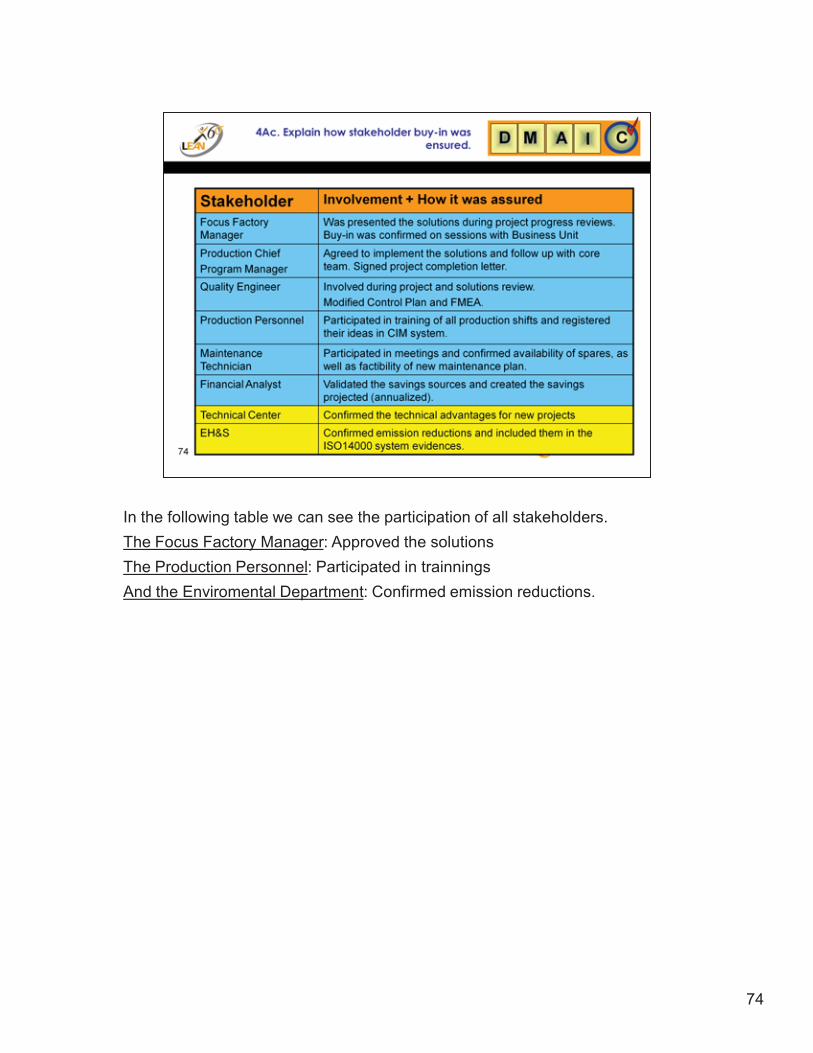
In the following table we can see the participation of all stakeholders.The Focus Factory Manager: Approved the solutionsThe Production Personnel: Participated in trainningsAnd the Enviromental Department: Confirmed emission reductions.
75
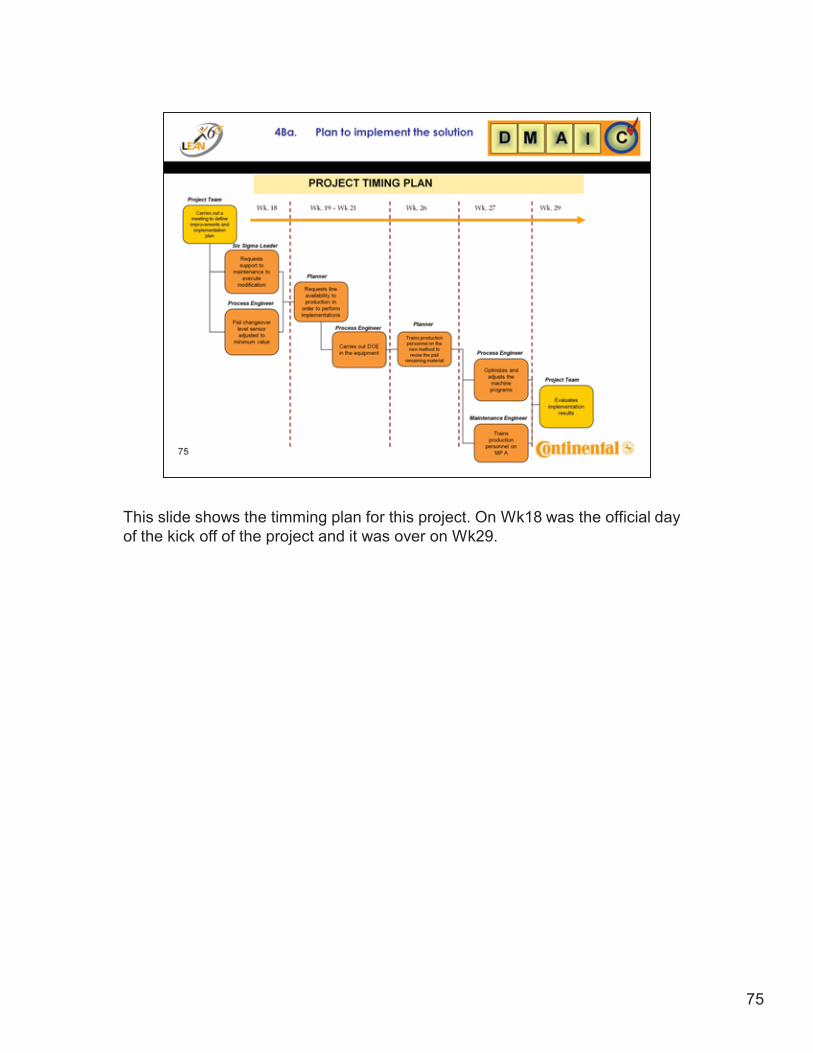
This slide shows the timming plan for this project. On Wk18 was the official day of the kick off of the project and it was over on Wk29.
76
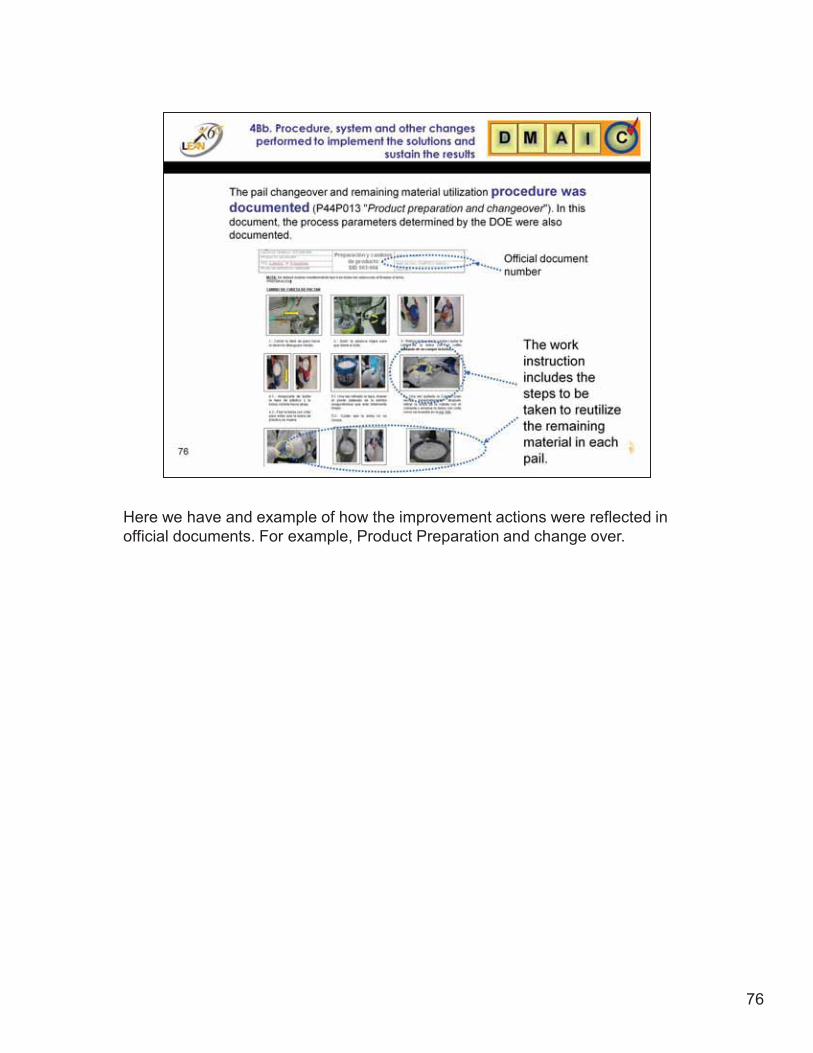
Here we have and example of how the improvement actions were reflected in official documents. For example, Product Preparation and change over.
77
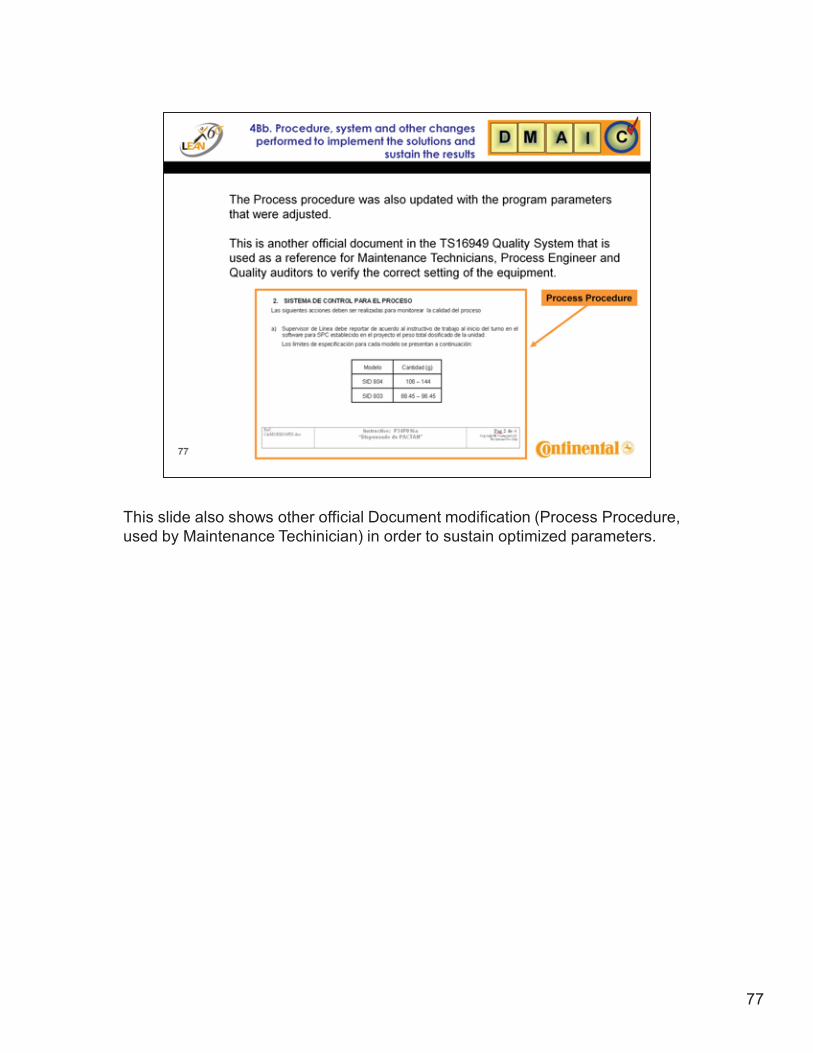
This slide also shows other official Document modification (Process Procedure, used by Maintenance Techinician) in order to sustain optimized parameters.
78
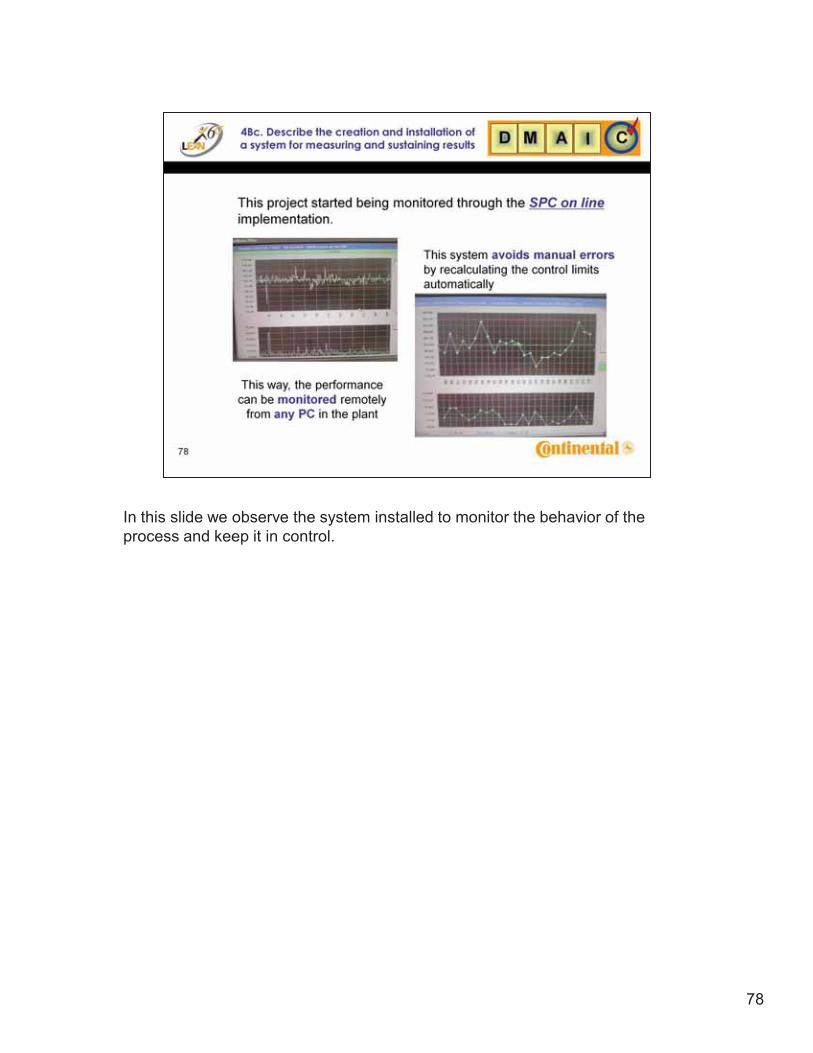
In this slide we observe the system installed to monitor the behavior of the process and keep it in control.
79
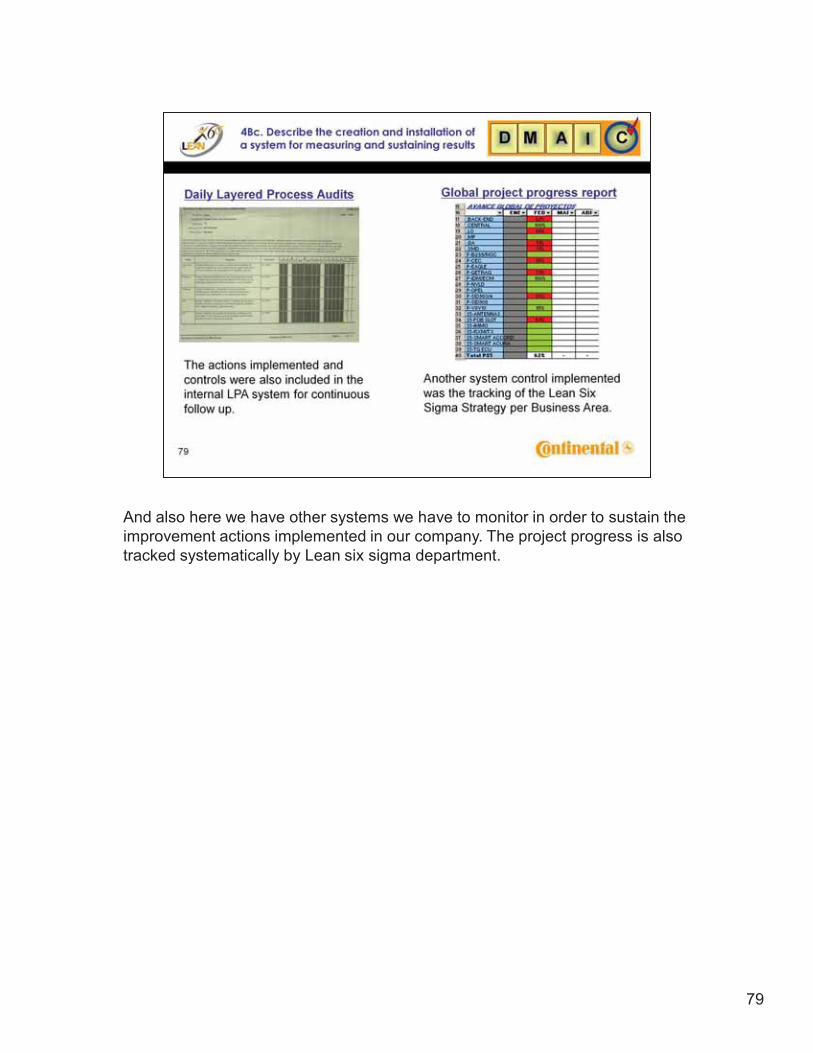
And also here we have other systems we have to monitor in order to sustain the improvement actions implemented in our company. The project progress is also tracked systematically by Lean six sigma department.
80
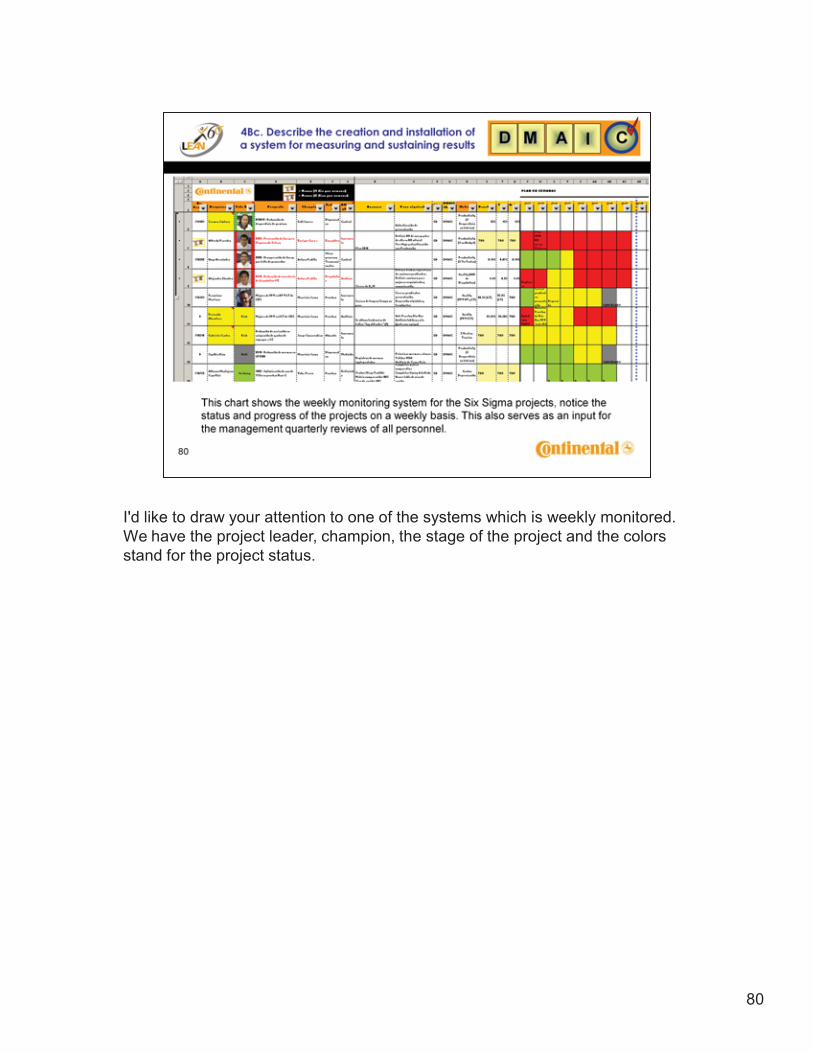
I'd like to draw your attention to one of the systems which is weekly monitored. We have the project leader, champion, the stage of the project and the colors stand for the project status.
81
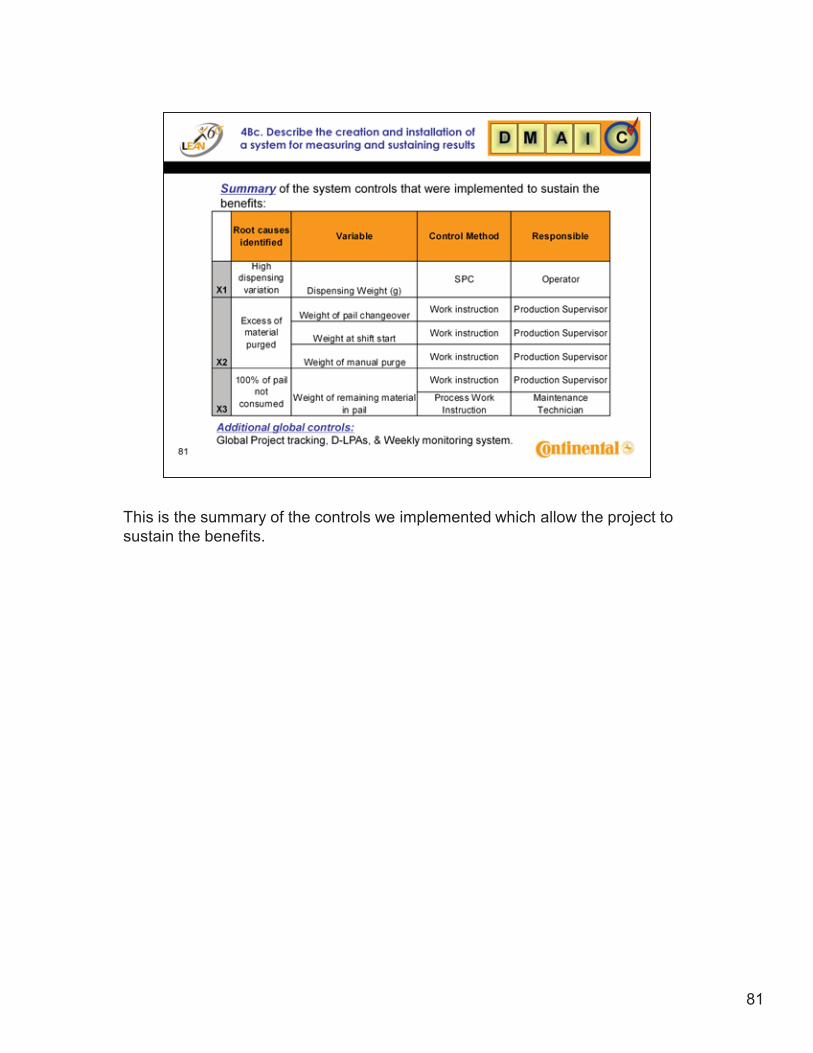
This is the summary of the controls we implemented which allow the project to sustain the benefits.
82
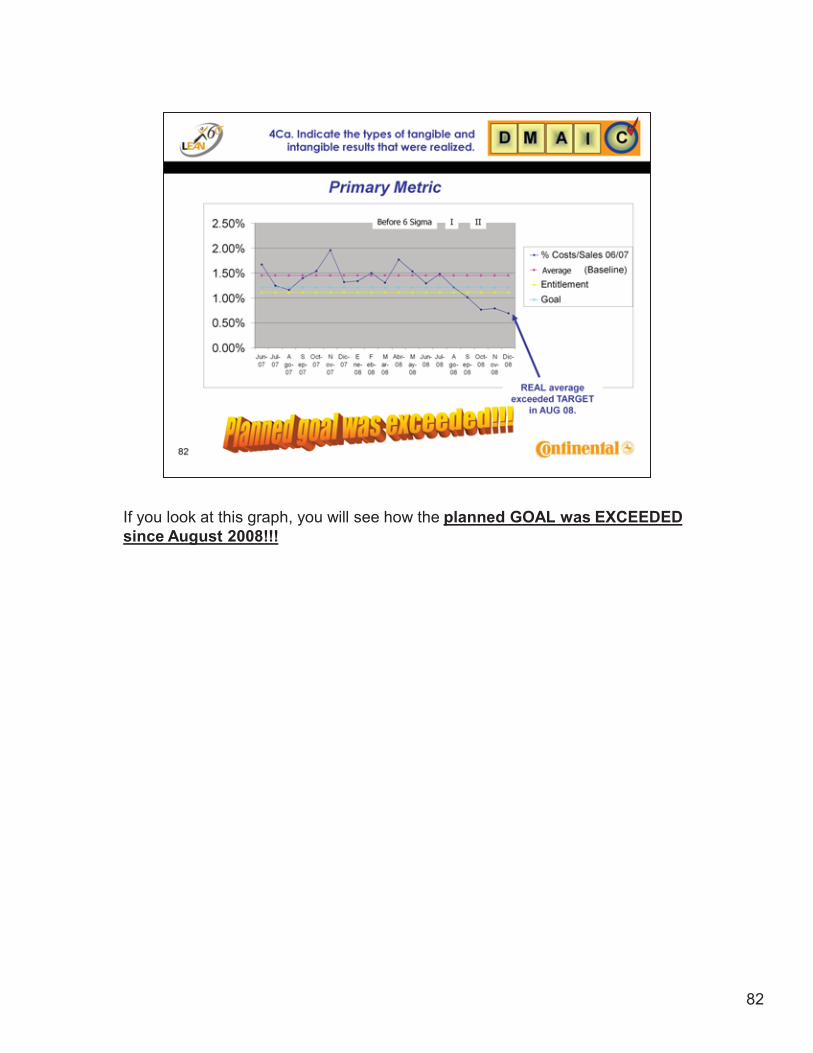
If you look at this graph, you will see how the planned GOAL was EXCEEDED since August 2008!!!
83
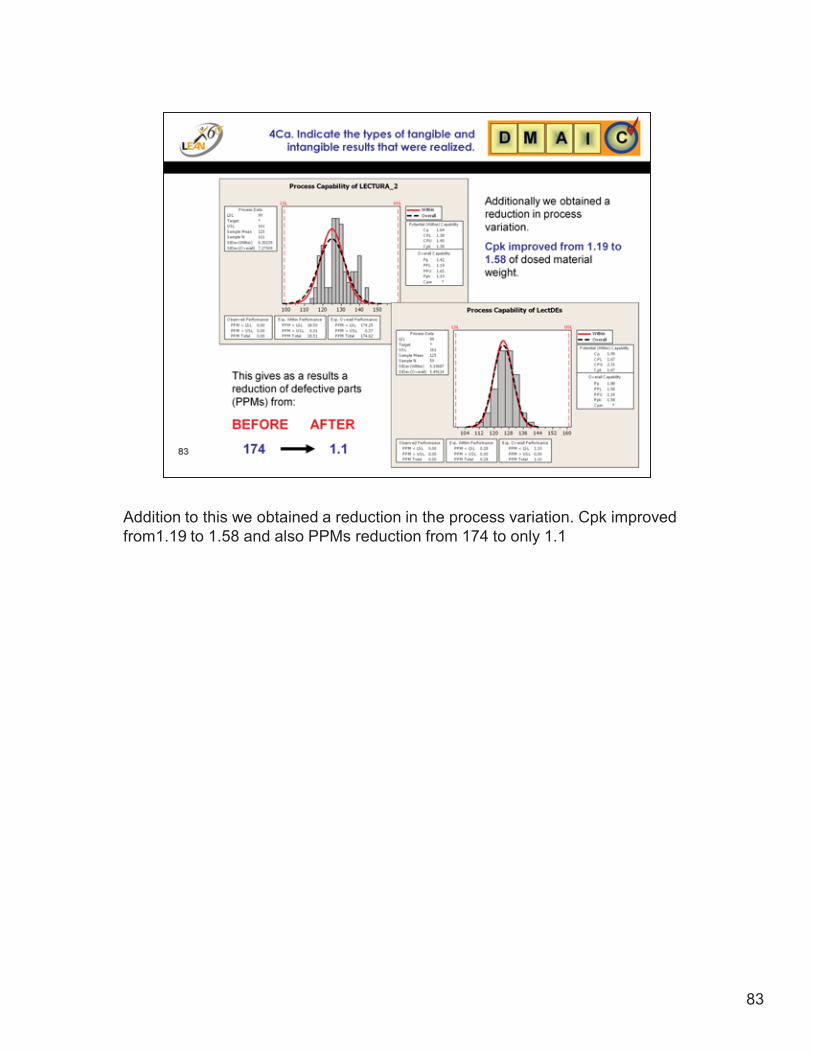
Addition to this we obtained a reduction in the process variation. Cpk improved from1.19 to 1.58 and also PPMs reduction from 174 to only 1.1
84
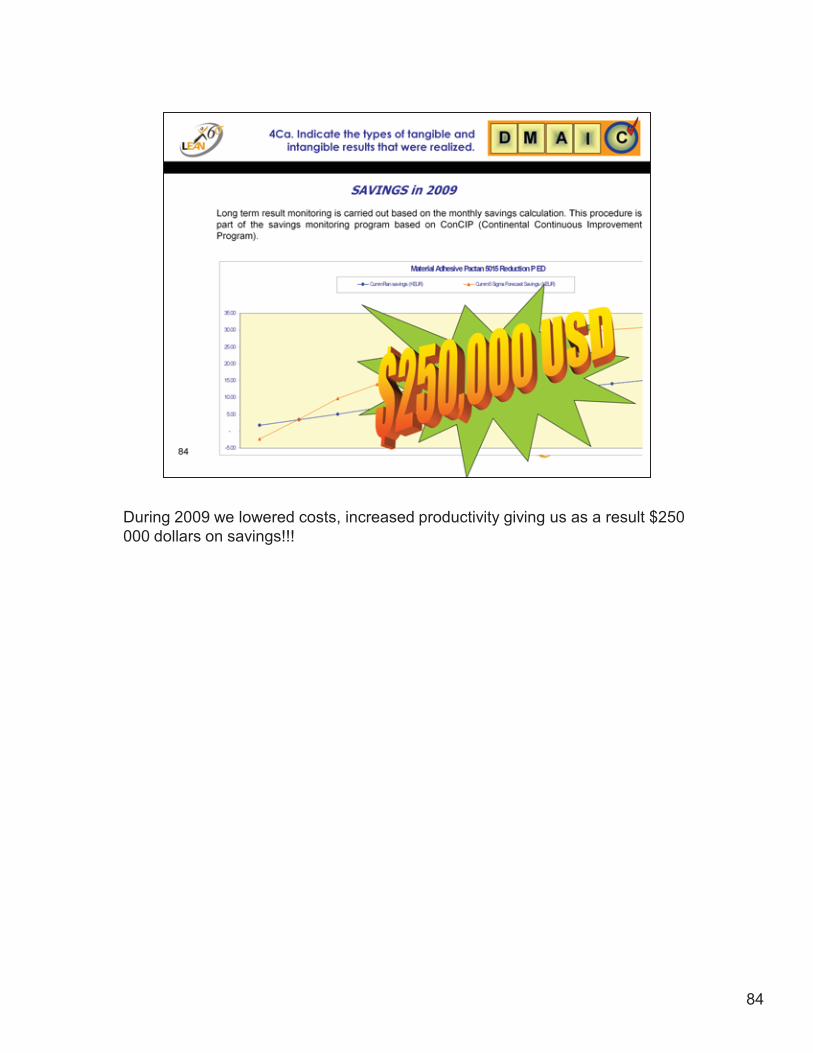
During 2009 we lowered costs, increased productivity giving us as a result $250 000 dollars on savings!!!
85
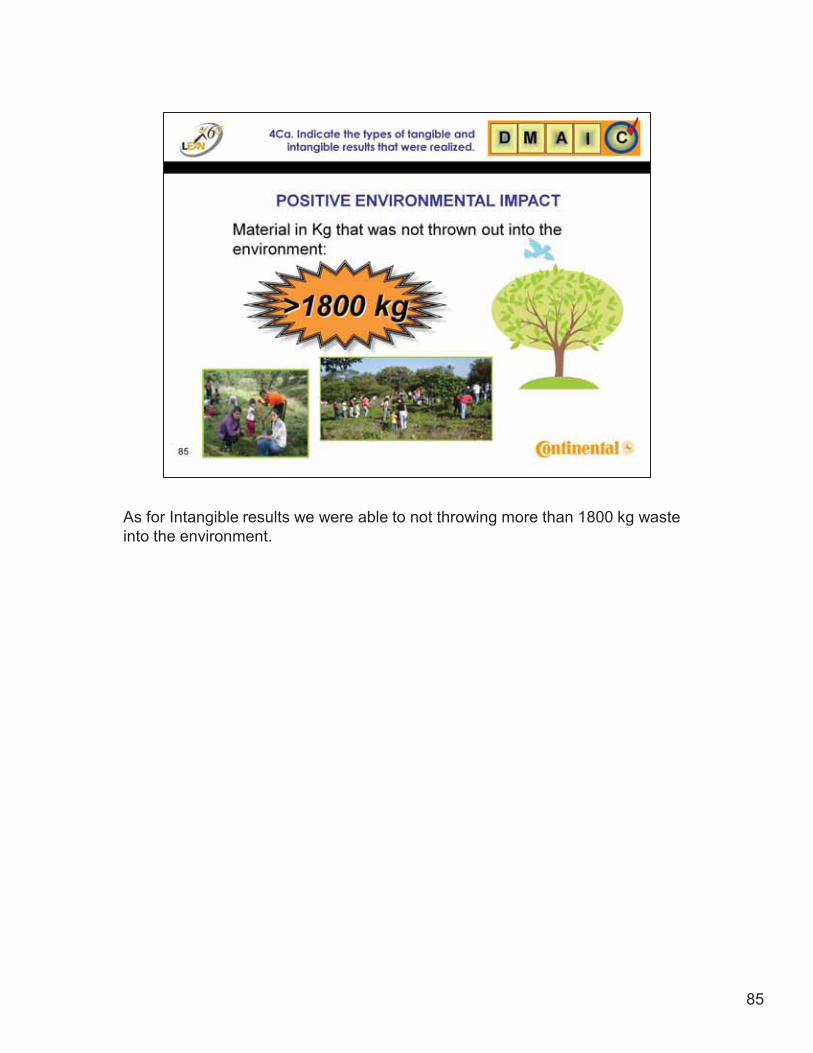
As for Intangible results we were able to not throwing more than 1800 kg waste into the environment.
86
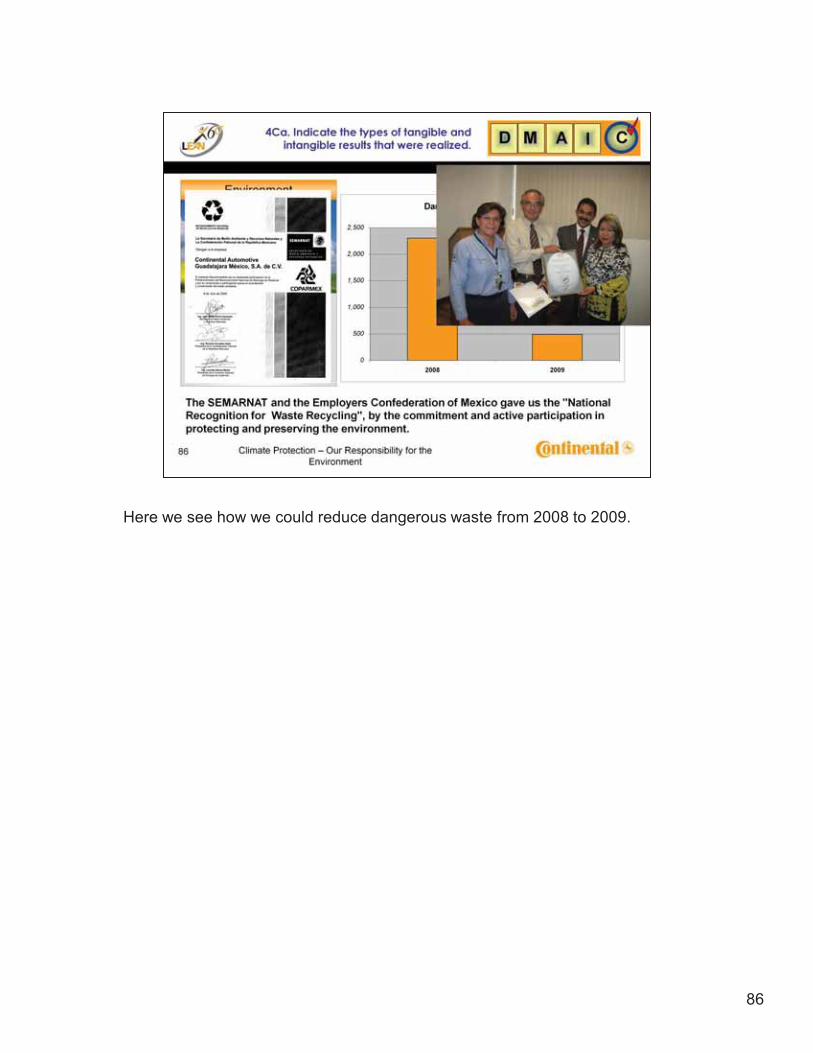
Here we see how we could reduce dangerous waste from 2008 to 2009.
87
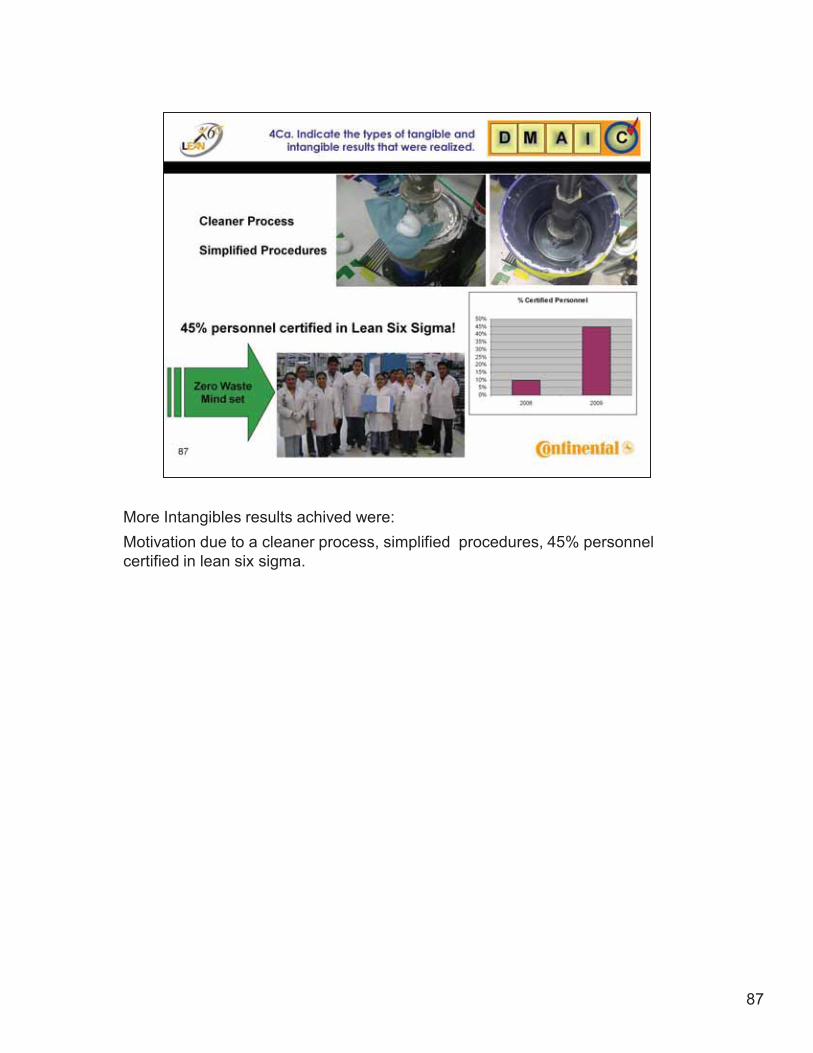
More Intangibles results achived were:Motivation due to a cleaner process, simplified procedures, 45% personnel certified in lean six sigma.
88
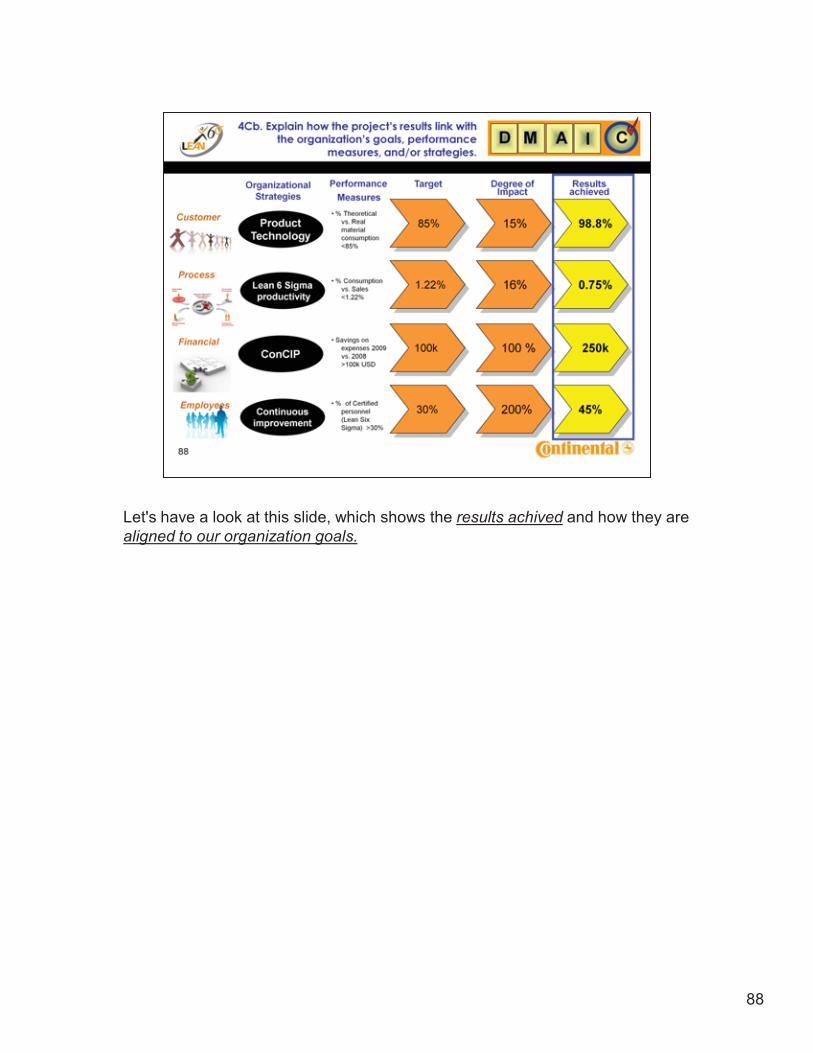
Let's have a look at this slide, which shows the results achived and how they are aligned to our organization goals.
89
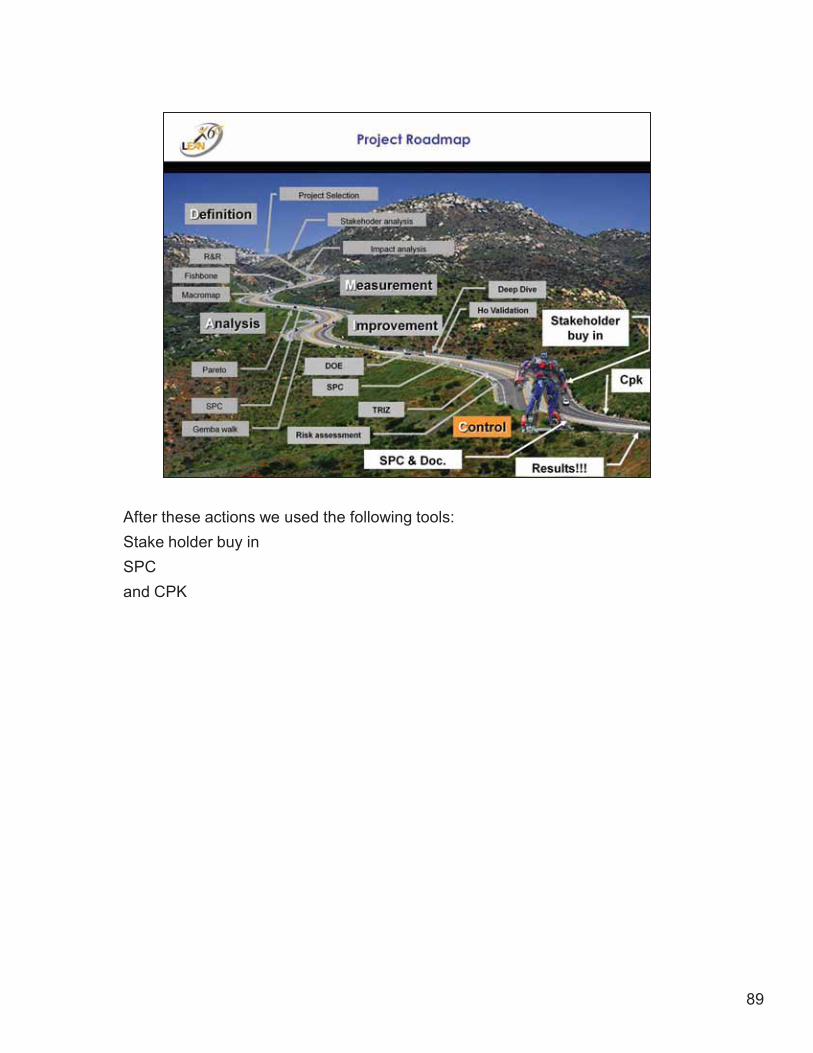
After these actions we used the following tools:Stake holder buy inSPCand CPK
90
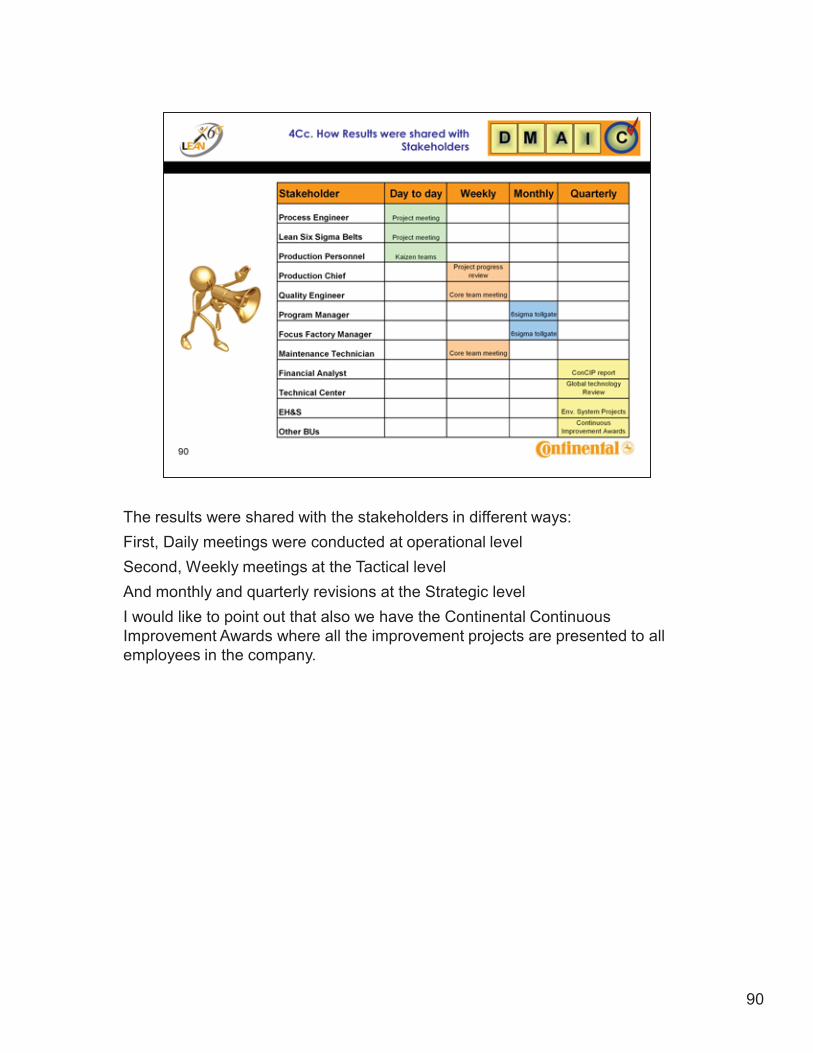
The results were shared with the stakeholders in different ways: First, Daily meetings were conducted at operational levelSecond, Weekly meetings at the Tactical levelAnd monthly and quarterly revisions at the Strategic levelI would like to point out that also we have the Continental Continuous Improvement Awards where all the improvement projects are presented to all employees in the company.
91
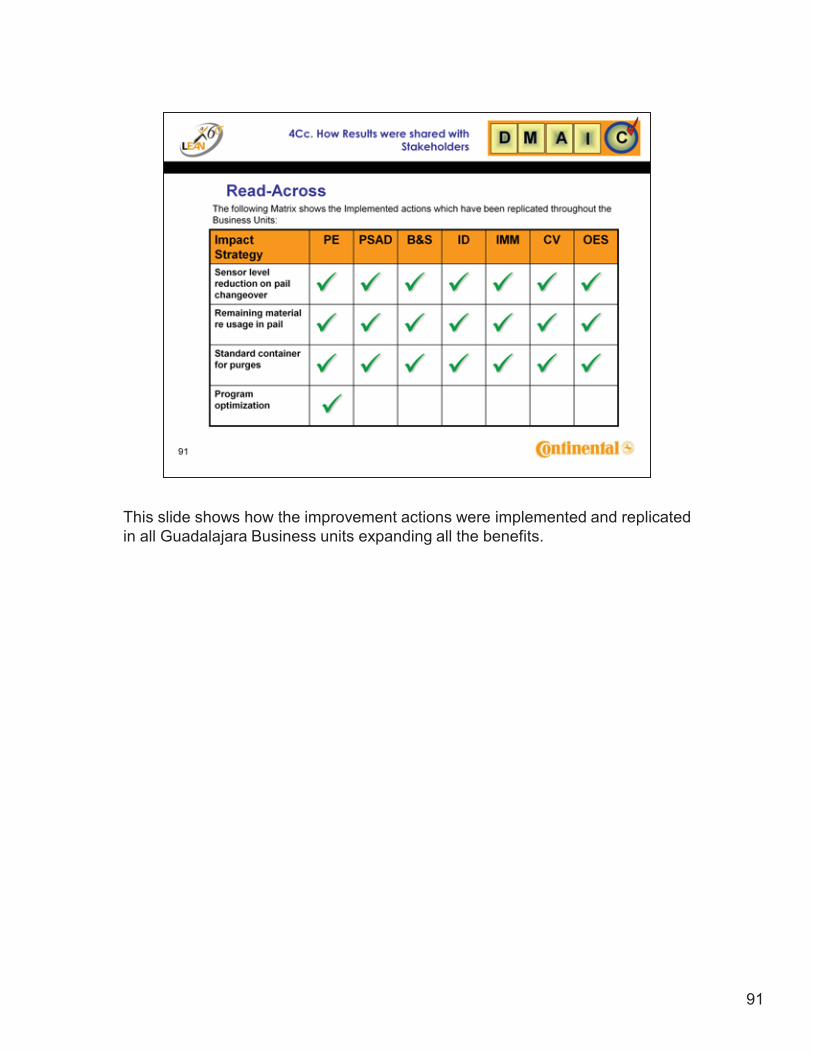
This slide shows how the improvement actions were implemented and replicated in all Guadalajara Business units expanding all the benefits.
92
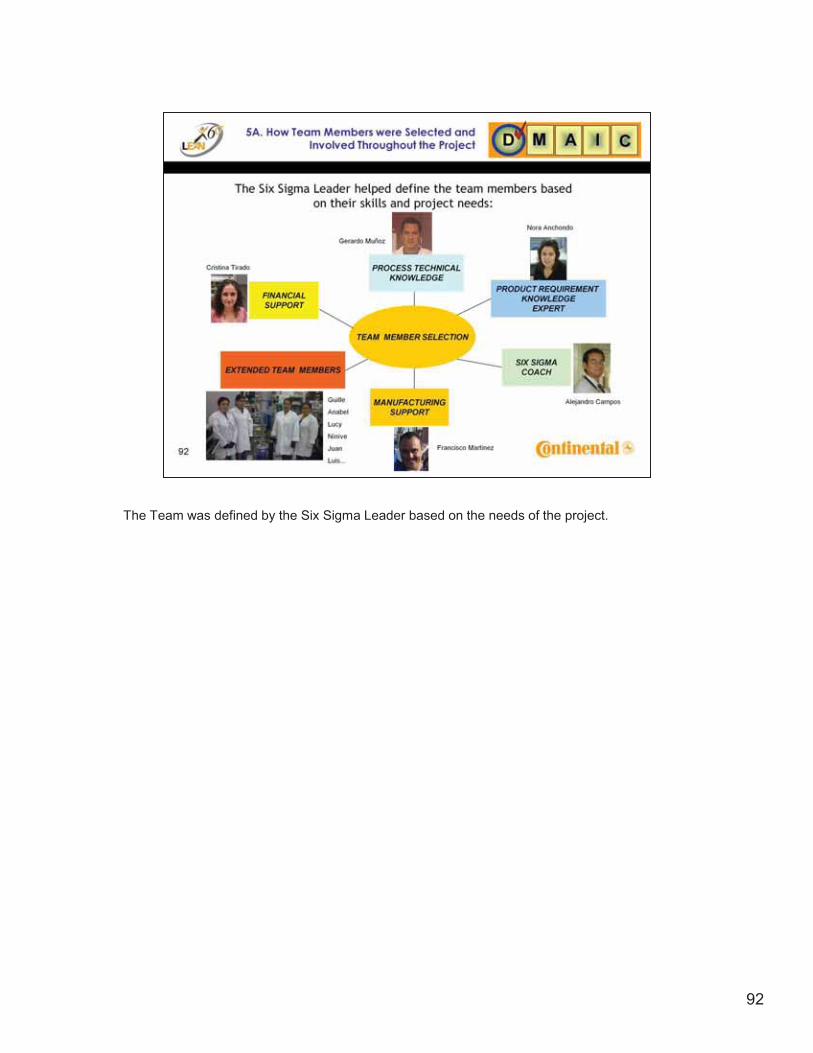
The Team was defined by the Six Sigma Leader based on the needs of the project.
93
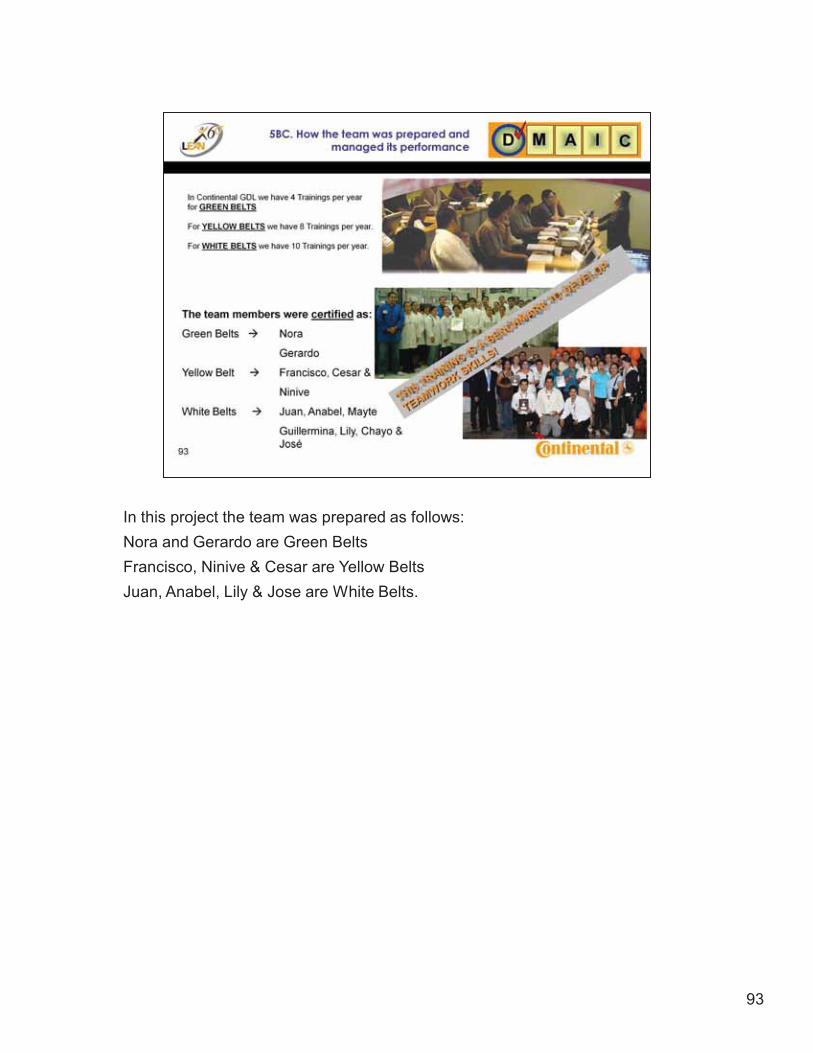
In this project the team was prepared as follows:Nora and Gerardo are Green BeltsFrancisco, Ninive & Cesar are Yellow BeltsJuan, Anabel, Lily & Jose are White Belts.
94
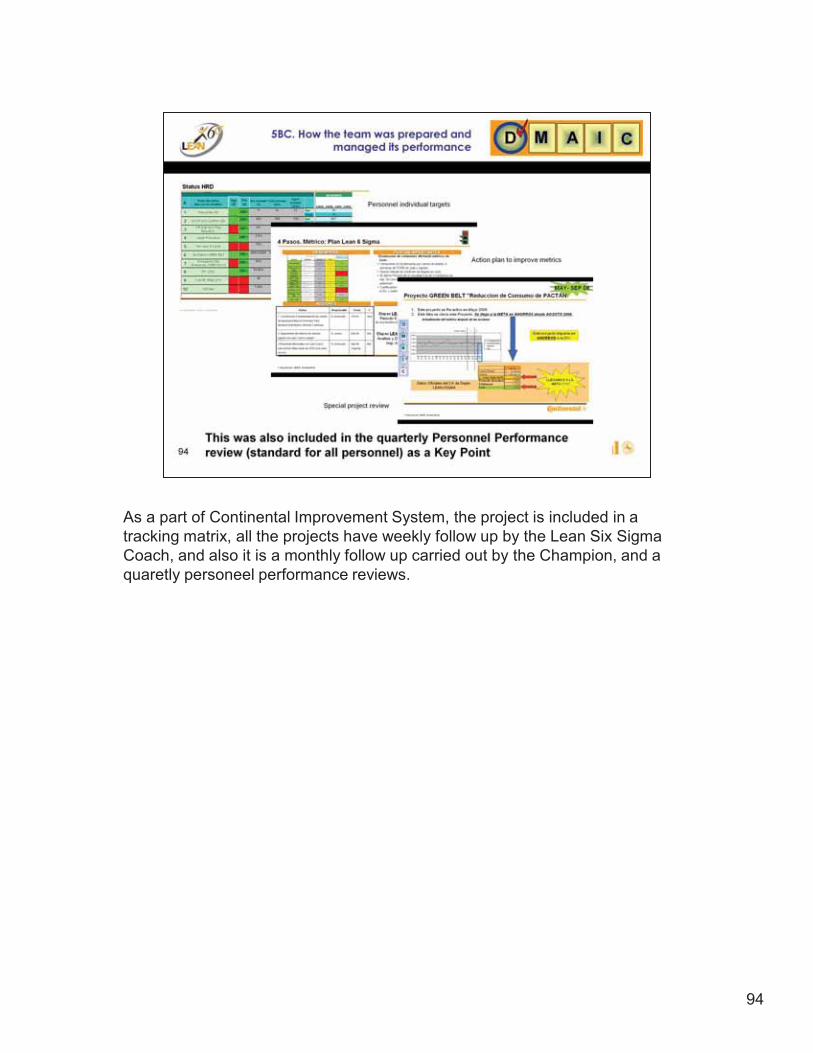
As a part of Continental Improvement System, the project is included in a tracking matrix, all the projects have weekly follow up by the Lean Six Sigma Coach, and also it is a monthly follow up carried out by the Champion, and a quaretly personeel performance reviews.
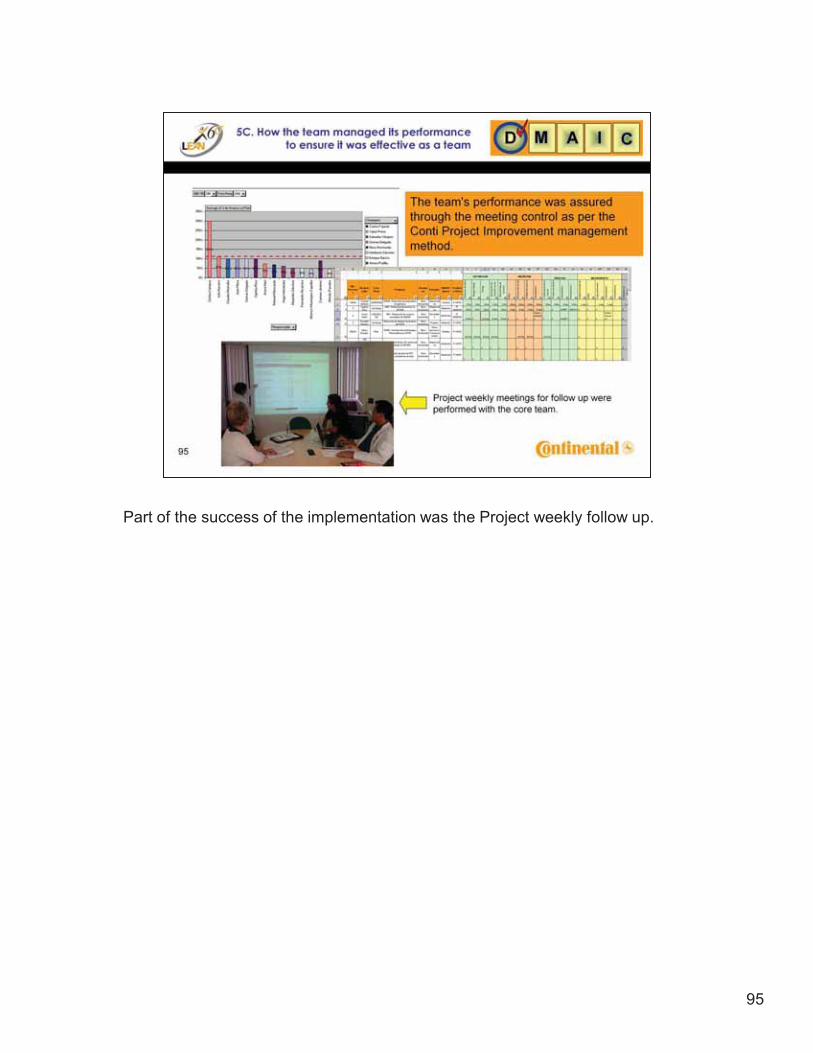
95
Part of the success of the implementation was the Project weekly follow up.
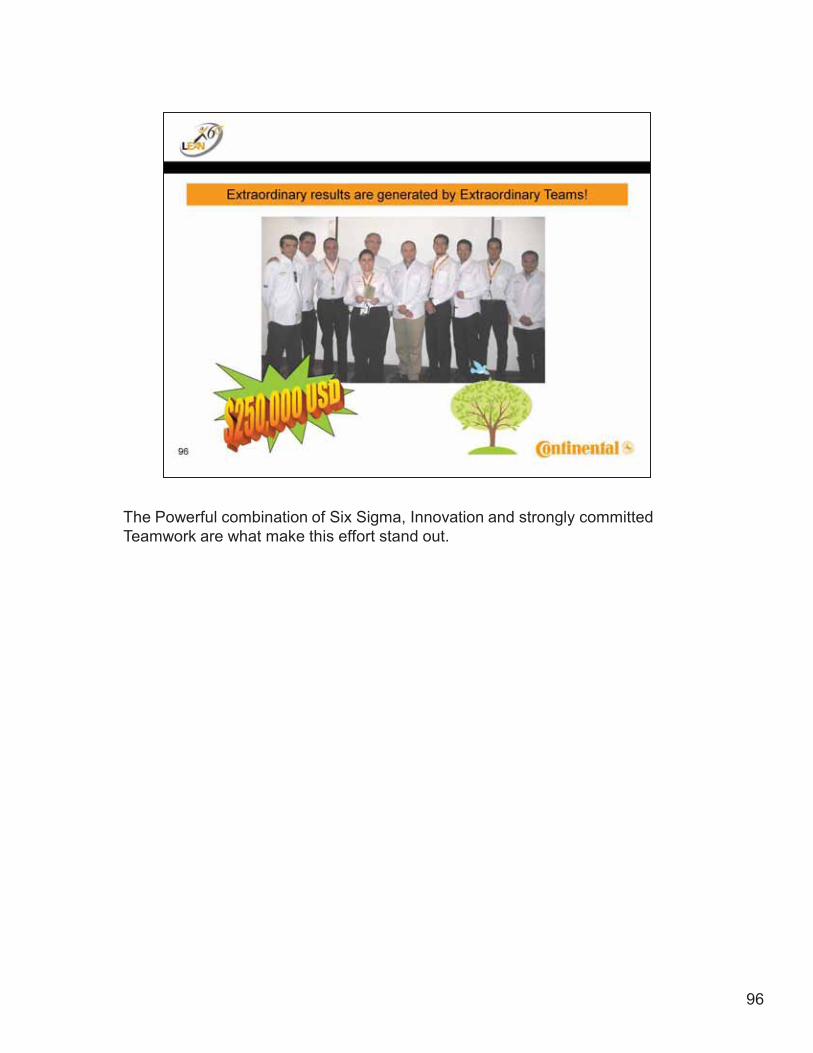
96
The Powerful combination of Six Sigma, Innovation and strongly committed Teamwork are what make this effort stand out.
97