Embed Size (px)
Citation preview
HEALTH RISK BEHAVIORS IN THE STATE OF MICHIGAN
2010 BEHAVIORAL RISK FACTOR SURVEY 24TH ANNUAL REPORT

2010 Behavioral Risk Factor Survey
in the State of Michigan
www.michigan.gov/brfs
Health Risk Behaviors
Permission is granted for the reproduction of this publication provided that all reproductions contain appropriate reference to the source through the inclusion of the following citation: Fussman C. 2011. Health Risk Behaviors in the State of Michigan: 2010 Behavioral Risk Factor Survey. 24th Annual Report. Lansing, MI: Michigan Department of Community Health, Division of Genomics, Perinatal Health, and Chronic Disease Epidemiology, Surveillance and Program Evaluation Section, Chronic Disease Epidemiology Unit. This publication was supported in part through Cooperative Agreements DP09-901 and SO11-1101 from the Centers for Disease Control and Prevention. Its contents are solely the responsibility of the authors and do not necessarily represent the official views of the Centers for Disease Control and Prevention.
Printed September 2011
RICK SNYDER Governor, State of Michigan
OLGA DAZZO
Director, Michigan Department of Community Health
JEAN C. CHABUT Deputy Director
Public Health Administration Michigan Department of Community Health
CORINNE E. MILLER, PHD
Director, Bureau of Disease Control, Prevention, and Epidemiology Michigan Department of Community Health
JANICE V. BACH, MS, CGC
Acting Director, Division of Genomics, Perinatal Health, and Chronic Disease Epidemiology Michigan Department of Community Health
CHRIS FUSSMAN, MS
Author, Chronic Disease Epidemiology Unit Michigan Department of Community Health
2010 MiBRFS
Acknowledgements
Data were collected for the 2010 Michigan Behavioral Risk Factor Survey (MiBRFS) by the Institute for Public Policy and Social Research, Office for Survey Research, at Michigan State University. The authors are grateful to Larry Hembroff, Ph.D., and his staff for conducting the survey. The assistance provided by the Behavioral Surveillance Division at the Centers for Disease Control and Prevention in Atlanta, Georgia is greatly appreciated. We are especially grateful to the residents of Michigan who agreed to participate in this survey.
iv
2010 MiBRFS
Table of Contents
Acknowledgements .................................................................................................. iv
Summary .................................................................................................................. vi
Health Status Indicators
General Health Status ......................................................................................... 1
Quality of Life ...................................................................................................... 2
Disability .............................................................................................................. 3
Weight Status ...................................................................................................... 4
No Health Care Coverage ................................................................................... 5
Limited Health Care Coverage ............................................................................ 6
Risk Behavior Indicators
No Leisure-Time Physical Activity ....................................................................... 7
Cigarette Smoking ............................................................................................... 8
Smokeless Tobacco ............................................................................................ 9
Alcohol Consumption ........................................................................................... 10
Motor Vehicle Safety ........................................................................................... 11
Clinical Preventive Practices
Routine Checkup in Past Year ........................................................................... 12
Breast Cancer Screening ................................................................................... 13
Cervical Cancer Screening ................................................................................ 14
Prostate Cancer Screening ................................................................................ 15
Colorectal Cancer Screening .............................................................................. 16
Oral Health .......................................................................................................... 17
Adult Immunizations ............................................................................................ 18
HIV Testing ......................................................................................................... 19
Chronic Conditions
Asthma in Adults ................................................................................................. 20
Asthma in Children .............................................................................................. 21
Arthritis ................................................................................................................ 22
Cardiovascular Disease ...................................................................................... 23
Diabetes .............................................................................................................. 24
Depression .......................................................................................................... 25
BRFSS Methods ...................................................................................................... 26
Bibliography ............................................................................................................. 28
v
Obese (BMI ≥ 30)
2010 MiBRFS
Summary
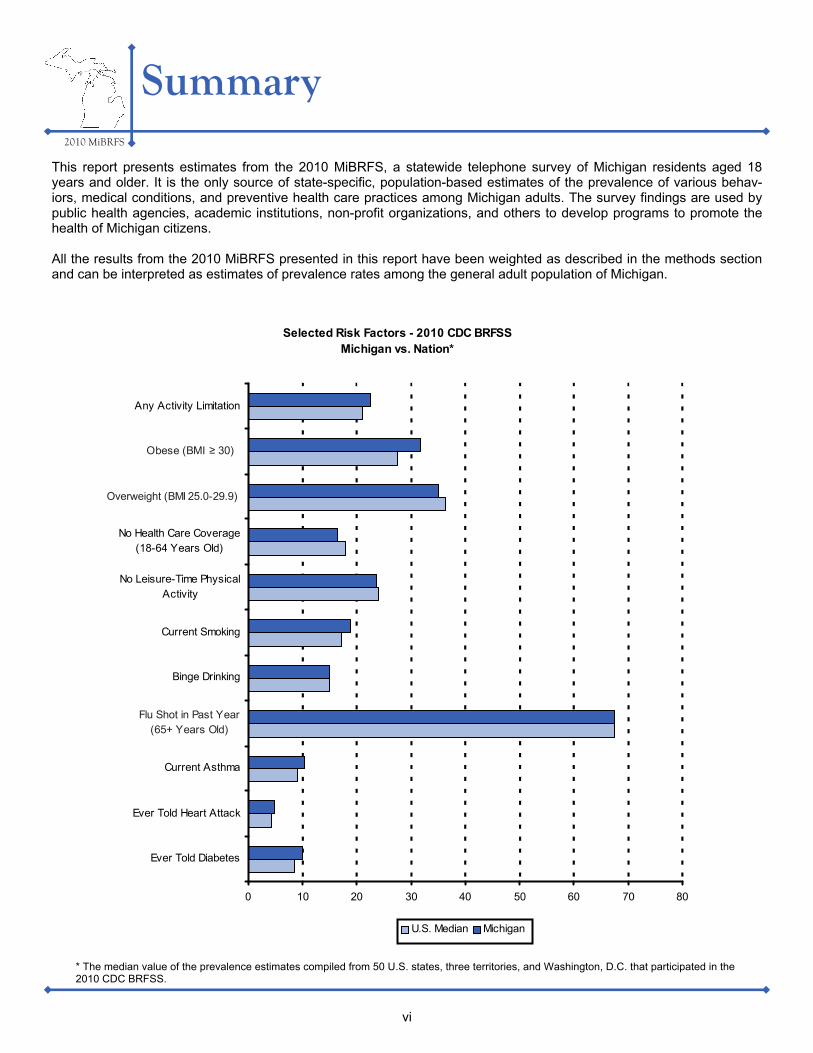
This report presents estimates from the 2010 MiBRFS, a statewide telephone survey of Michigan residents aged 18 years and older. It is the only source of state-specific, population-based estimates of the prevalence of various behav-iors, medical conditions, and preventive health care practices among Michigan adults. The survey findings are used by public health agencies, academic institutions, non-profit organizations, and others to develop programs to promote the health of Michigan citizens. All the results from the 2010 MiBRFS presented in this report have been weighted as described in the methods section and can be interpreted as estimates of prevalence rates among the general adult population of Michigan.
vi
* The median value of the prevalence estimates compiled from 50 U.S. states, three territories, and Washington, D.C. that participated in the 2010 CDC BRFSS.
Selected Risk Factors - 2010 CDC BRFSS Michigan vs. Nation*
0 10 20 30 40 50 60 70 80
Ever Told Diabetes
Ever Told Heart Attack
Current Asthma
Flu Shot in Past Year (65+ Years Old)
Binge Drinking
Current Smoking
No Leisure-Time PhysicalActivity
No Health Care Coverage(18-64 Years Old)
Overweight (BMI 25.0-29.9)
Any Activity Limitation
U.S. Median Michigan
2010 MiBRFS
Summary, continued
Public Health Implications of Findings A number of themes emerge from the findings of the 2010 MiBRFS that have implications for public health.
Obesity continues to increase among all racial/ethnic groups. In 2010, an estimated 31.7% of Michigan adults were considered obese, which represents an increase from 24.7% in 2001. The prevalence of obesity in Michigan has increased at a greater rate for Black, non-Hispanic adults (2001: 34.0% vs. 2010: 45.3%), but White, non-Hispanics (2001: 23.2% vs. 2010: 29.8%) and Hispanics (2001: 27.4% vs. 2010: 36.4%) have also reported significant increases in obesity over the past ten years. Furthermore, as the prevalence of obesity increases among the Michigan adult population, the prevalence of chronic diseases associated with obesity, such as diabetes, cardiovascular disease, and arthritis, is also increasing. MDCH has a number of programs designed to decrease obesity, increase physical activity and promote healthy eating among Michigan adults and children.
Smoking continues to decrease with assistance from the new smoke free air law. The results from the 2010 MiBRFS indicate that the prevalence of current smoking among Michigan adults has de-creased significantly since 2001 (2001: 26.1% [24.5-27.7] vs. 2010: 18.9% [17.7-20.2]). The MDCH Tobacco Program has numerous programs focusing on smoking cessation and smoke free policies. Furthermore, the Dr. Ron Davis Smoke Free Air Law was implemented on May 1, 2010. This law, which prohibits smoking in workplaces, including public build-ings, offices, restaurants and bars, has received a high approval rating since being implemented. Data from the 2010 MiBRFS focusing on public opinion toward this new law indicate that 70.4% of Michigan adults either somewhat or strongly favor this law. Furthermore, only 16.9% indicated that they either somewhat or strongly oppose the new smoke free air law. With the enforcement of our new smoke free air law along with a continued emphasis on smoking cessation, the MDCH Tobacco Program hopes that the prevalence of smoking will continue to decrease in the coming years.
Screening for Colorectal Cancer has increased dramatically over the past several years. In 2010, an estimated 57.4% of Michigan adults 50 years of age and older reported having appropriate colorectal cancer screening via endoscopy (i.e., a sigmoidoscopy in the past five years or a colonoscopy in the past ten years). When comparing this colorectal cancer screening estimate to what was reported in 2001 (40.0%), it represents a 43.5% in-crease in colorectal cancer screening by endoscopy. These results can be partially attributed to the successes of the collaboration between the MDCH Cancer Prevention and Control Section and the Michigan Cancer Consortium. This collaboration has resulted in the formation of the Colorectal Cancer Awareness Network and the development of numer-ous public service announcements and other professional and pubic education materials related to colorectal cancer screening.
Diabetes prevalence increasing while diabetes risk factors continue to be a problem. The prevalence of doctor-diagnosed diabetes has increased significantly from 7.2% (6.3-8.1) in 2001 to 10.1% (9.4-10.9) in 2010. This change represents a 40.3% increase in diabetes prevalence over the past ten years. This increase in dia-betes prevalence can be explained, in part, by the corresponding increase in the risk factors associated with diabetes (i.e., age, obesity, sedentary lifestyle, and unhealthy eating habits). Despite steady decreases in federal funding, the MDCH Diabetes and Other Chronic Diseases Section continues to partner with several internal and external coalitions, such as the Diabetes Partners in Action Coalition, to work toward reducing the impact of diabetes in Michigan.
vii
2010 MiBRFS
Summary, continued
Use of the Michigan Behavioral Risk Factor Survey MiBRFS data continue to be used in planning and evaluating programs, establishing program priorities, developing spe-cific interventions and policies, assessing trends, shaping legislation, addressing emerging public health issues, and tar-geting relevant populations. Notable examples include: • MiBRFS estimates were used to report on 14 of the 46 indicators included within the Michigan Department of Com-
munity Health, Health Policy and Planning Administration’s Michigan’s Health Profile Chartbook 2011,1 which sup-ports policy making and program planning by stressing the use of outcome indicators to measure improvements in health status.
• A wide variety of MiBRFS data are used to benchmark progress towards several of the 13 goal areas addressed by the Michigan Cancer Consortium.2 MiBRFS data focusing on screening rates for breast, cervical, colorectal, and prostate cancers, breast and ovarian cancer risk assessment, genetic testing, and adult smoking rates are routinely used by the Michigan Cancer Consortium in the evaluation of their cancer programs.
• The MiBRFS provides opportunity to add questions on emerging issues. For example, health and life insurance-related discrimination based on genetic testing results was assessed for the first time in Michigan using MiBRFS data. In addition, MiBRFS questions on cancer survivorship were included in 2010 in order to aid in further program planning.
• MiBRFS data were used extensively within the Nutrition, Physical Activity and Obesity Program’s Overweight and Obesity in Michigan: Surveillance Update 2011. MiBRFS data related to these topics were also used within several other surveillance reports throughout the year. These documents are used when establishing program priorities.
• Child and adult asthma prevalence data by demographic, socioeconomic, and geographic strata continue to be in-corporated into a comprehensive surveillance report and used in prioritizing activities and targeting populations for the statewide asthma program.
• MiBRFS data was used to measure public opinion regarding the recently passed Dr. Ron Davis Smoke Free Air Law that prohibits smoking in workplaces, including public buildings, offices, restaurants and bars. This data was used by the Tobacco Program to estimate the overall level of support for this law before and after passage.
In addition, MiBRFS data are used extensively for external presentations and publications. For example, in the last few years numerous posters have been presented at state and national conferences on subjects such as Major Depression, Tobacco, Fast Food Consumption, Sudden Cardiac Death, Disabilities, Chronic Kidney Disease, Intention to Call 911 in Response to Stroke Scenarios, and the Michigan Asthma Call-Back Survey. In addition, MiBRFS data have been used in over 30 articles by Michigan staff and researchers, including publications on work-related asthma prevalence, chronic disease-related behaviors and health among African Americans and Hispanics, public awareness and use of direct-to-consumer genetic tests, knowledge of tissue Plasminogen activator for acute stroke, fast food consumption, knowledge of stroke risk factors and warning signs by race, and the intention to call 911 in response to stroke scenarios.
Future of the Michigan Behavioral Risk Factor Survey The 2011 MiBRFS is expected to maintain the number of completed land line interviews from the 2010 survey (9,000 total), with an additional 1,700 interviews being completed for cell-phone-only households. The 2011 MiBRFS will also include oversamples for Michigan’s African American, Native American, and Hispanic populations. The 2011 question-naire will include nearly 100 state-added questions on 17 topics, such as chronic obstructive pulmonary disease, cogni-tive impairment, alcohol dependence, genomics, and cancer survivorship. The BRFSS continues to adapt to challenges and expand its utility. For example, the random-digit dialing methodology of the MiBRFS is becoming increasingly problematic because of declining participation rates and the increased use of cell phones and other communication modalities, rather than a traditional land line telephone.3 The MiBRFS will need to adapt in order to continue providing representative estimates for adults. In 2008, Michigan participated in the BRFSS cell phone pilot project which was put in place to increase the capacity of the survey by including cell-phone-only households which in turn should reach more of the younger, urban respondents that tend to be underrepresented in the current land line survey. A cell phone stratum became a permanent component of the BRFSS starting in 2009 and the percentage of MiBRFS interviews completed via cell phones has increased each year. The 2011 MiBRFS data year will be the first year in which health estimates can be calculated for the combined land line/cell phone data file.
viii
Efforts have been made to expand the range of subpopulations covered by the MiBRFS data: • The 2010 survey methodology oversamples geographic areas with a high density of African-American residents in
order to provide more precise estimates for this population. • The larger sample size in 2010 (N ~ 9,000) will allow for somewhat more precise estimates for Hispanics, especially
when multiple years of data are combined. • Since 2005, questions have been included that randomly select one child in each household and obtain demo-
graphic characteristics of that child. This information allows us to ask health-related questions about this child and then to calculate estimates for childhood conditions, such as asthma.
• An Asthma Call-Back survey that follows up on children and adults who were identified as having asthma during the BRFS interview has been conducted since 2005, allowing for collection of more detailed information on asthma man-agement, clinical care, and impact of the disease on people’s lives. It is anticipated that this methodology could be useful for other diseases and conditions in the future. The CDC has provided funding to some states to conduct in- person, follow-back surveys on specific diseases of interest.
In conclusion, the MiBRFS continues to serve the needs of public health officials, health care providers, researchers and local and state level policy makers, while presenting a number of opportunities for expanding our understanding of the risk factors and preventive behaviors for the major causes of disease and disability in Michigan.
2010 MiBRFS
Summary, continued
ix
1
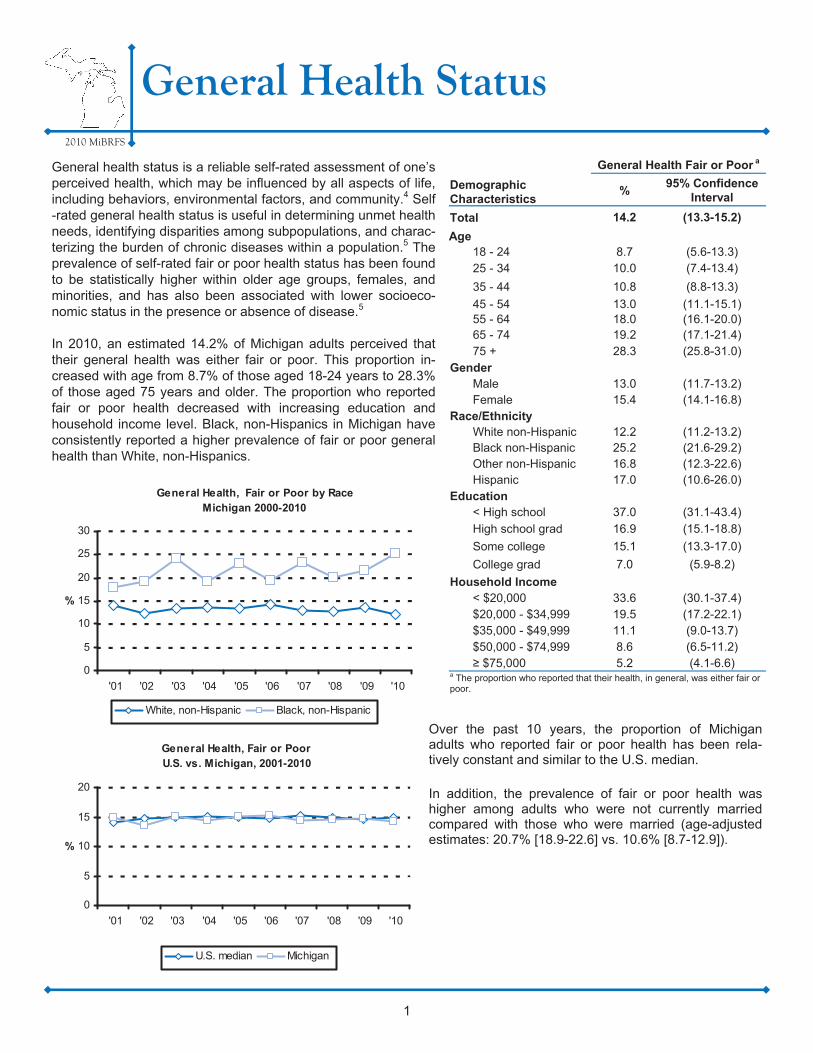
General health status is a reliable self-rated assessment of one’s perceived health, which may be influenced by all aspects of life, including behaviors, environmental factors, and community.4 Self-rated general health status is useful in determining unmet health needs, identifying disparities among subpopulations, and charac-terizing the burden of chronic diseases within a population.5 The prevalence of self-rated fair or poor health status has been found to be statistically higher within older age groups, females, and minorities, and has also been associated with lower socioeco-nomic status in the presence or absence of disease.5 In 2010, an estimated 14.2% of Michigan adults perceived that their general health was either fair or poor. This proportion in-creased with age from 8.7% of those aged 18-24 years to 28.3% of those aged 75 years and older. The proportion who reported fair or poor health decreased with increasing education and household income level. Black, non-Hispanics in Michigan have consistently reported a higher prevalence of fair or poor general health than White, non-Hispanics.
Over the past 10 years, the proportion of Michigan adults who reported fair or poor health has been rela-tively constant and similar to the U.S. median.
In addition, the prevalence of fair or poor health was higher among adults who were not currently married compared with those who were married (age-adjusted estimates: 20.7% [18.9-22.6] vs. 10.6% [8.7-12.9]).
Demographic Characteristics
General Health Fair or Poor a
% 95% Confidence
Interval
Total 14.2 (13.3-15.2)
Age 18 - 24 8.7 (5.6-13.3) 25 - 34 10.0 (7.4-13.4)
35 - 44 10.8 (8.8-13.3)
45 - 54 13.0 (11.1-15.1) 55 - 64 18.0 (16.1-20.0) 65 - 74 19.2 (17.1-21.4) 75 + 28.3 (25.8-31.0)
Gender Male 13.0 (11.7-13.2) Female 15.4 (14.1-16.8)
Race/Ethnicity White non-Hispanic 12.2 (11.2-13.2) Black non-Hispanic 25.2 (21.6-29.2) Other non-Hispanic 16.8 (12.3-22.6)
Education < High school 37.0 (31.1-43.4) High school grad 16.9 (15.1-18.8)
Some college 15.1 (13.3-17.0)
College grad 7.0 (5.9-8.2)
Household Income < $20,000 33.6 (30.1-37.4) $20,000 - $34,999 19.5 (17.2-22.1) $35,000 - $49,999 11.1 (9.0-13.7) $50,000 - $74,999 8.6 (6.5-11.2) ≥ $75,000 5.2 (4.1-6.6)
a The proportion who reported that their health, in general, was either fair or poor.
Hispanic 17.0 (10.6-26.0)
2010 MiBRFS
General Health Status
General Health, Fair or Poor U.S. vs. Michigan, 2001-2010
0
5
10
15
20
'01 '02 '03 '04 '05 '06 '07 '08 '09 '10
%
U.S. median Michigan
0
5
10
15
20
25
30
'01 '02 '03 '04 '05 '06 '07 '08 '09 '10
%
White, non-Hispanic Black, non-Hispanic
General Health, Fair or Poor by RaceMichigan 2000-2010
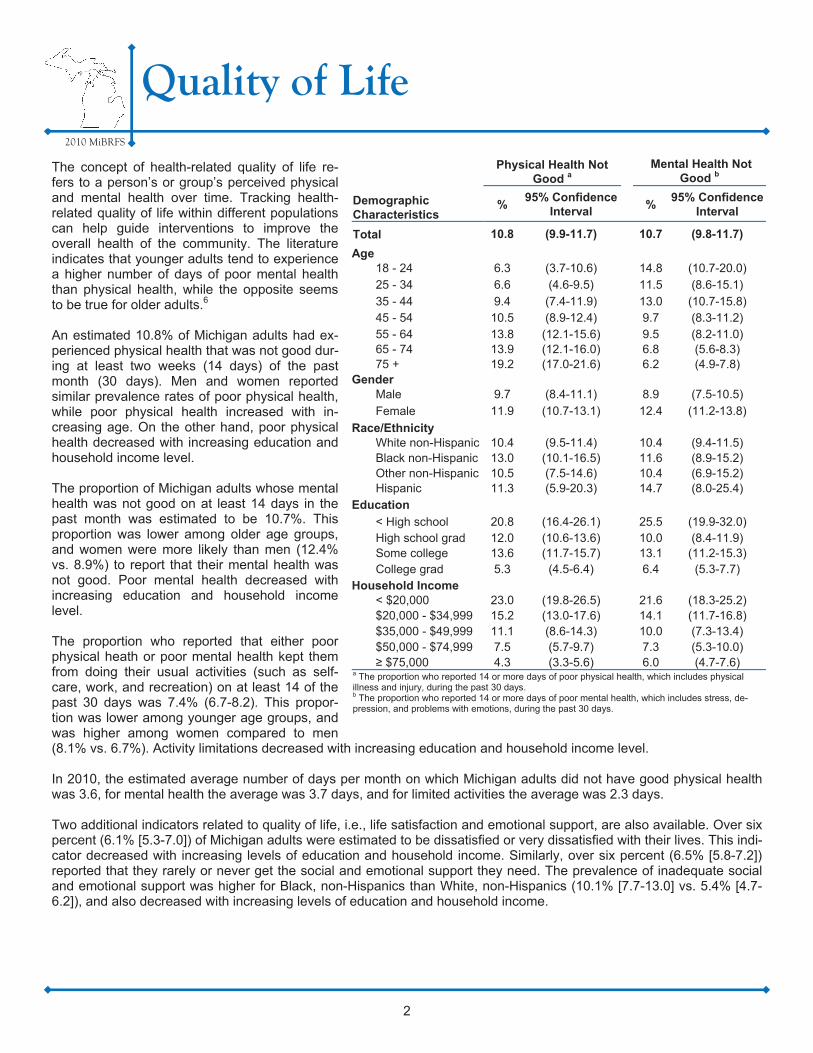
The concept of health-related quality of life re-fers to a person’s or group’s perceived physical and mental health over time. Tracking health-related quality of life within different populations can help guide interventions to improve the overall health of the community. The literature indicates that younger adults tend to experience a higher number of days of poor mental health than physical health, while the opposite seems to be true for older adults.6 An estimated 10.8% of Michigan adults had ex-perienced physical health that was not good dur-ing at least two weeks (14 days) of the past month (30 days). Men and women reported similar prevalence rates of poor physical health, while poor physical health increased with in-creasing age. On the other hand, poor physical health decreased with increasing education and household income level. The proportion of Michigan adults whose mental health was not good on at least 14 days in the past month was estimated to be 10.7%. This proportion was lower among older age groups, and women were more likely than men (12.4% vs. 8.9%) to report that their mental health was not good. Poor mental health decreased with increasing education and household income level. The proportion who reported that either poor physical heath or poor mental health kept them from doing their usual activities (such as self-care, work, and recreation) on at least 14 of the past 30 days was 7.4% (6.7-8.2). This propor-tion was lower among younger age groups, and was higher among women compared to men (8.1% vs. 6.7%). Activity limitations decreased with increasing education and household income level. In 2010, the estimated average number of days per month on which Michigan adults did not have good physical health was 3.6, for mental health the average was 3.7 days, and for limited activities the average was 2.3 days. Two additional indicators related to quality of life, i.e., life satisfaction and emotional support, are also available. Over six percent (6.1% [5.3-7.0]) of Michigan adults were estimated to be dissatisfied or very dissatisfied with their lives. This indi-cator decreased with increasing levels of education and household income. Similarly, over six percent (6.5% [5.8-7.2]) reported that they rarely or never get the social and emotional support they need. The prevalence of inadequate social and emotional support was higher for Black, non-Hispanics than White, non-Hispanics (10.1% [7.7-13.0] vs. 5.4% [4.7-6.2]), and also decreased with increasing levels of education and household income.
Demographic Characteristics
Physical Health Not Good a
Mental Health Not Good b
% 95% Confidence
Interval %
95% Confidence Interval
Total 10.8 (9.9-11.7) 10.7 (9.8-11.7)
Age 18 - 24 6.3 (3.7-10.6) 14.8 (10.7-20.0) 25 - 34 6.6 (4.6-9.5) 11.5 (8.6-15.1) 35 - 44 9.4 (7.4-11.9) 13.0 (10.7-15.8) 45 - 54 10.5 (8.9-12.4) 9.7 (8.3-11.2) 55 - 64 13.8 (12.1-15.6) 9.5 (8.2-11.0) 65 - 74 13.9 (12.1-16.0) 6.8 (5.6-8.3) 75 + 19.2 (17.0-21.6) 6.2 (4.9-7.8)
Gender Male 9.7 (8.4-11.1) 8.9 (7.5-10.5)
Female 11.9 (10.7-13.1) 12.4 (11.2-13.8)
Race/Ethnicity White non-Hispanic 10.4 (9.5-11.4) 10.4 (9.4-11.5) Black non-Hispanic 13.0 (10.1-16.5) 11.6 (8.9-15.2) Other non-Hispanic 10.5 (7.5-14.6) 10.4 (6.9-15.2)
Education
< High school 20.8 (16.4-26.1) 25.5 (19.9-32.0) High school grad 12.0 (10.6-13.6) 10.0 (8.4-11.9) Some college 13.6 (11.7-15.7) 13.1 (11.2-15.3) College grad 5.3 (4.5-6.4) 6.4 (5.3-7.7)
Household Income < $20,000 23.0 (19.8-26.5) 21.6 (18.3-25.2) $20,000 - $34,999 15.2 (13.0-17.6) 14.1 (11.7-16.8) $35,000 - $49,999 11.1 (8.6-14.3) 10.0 (7.3-13.4) $50,000 - $74,999 7.5 (5.7-9.7) 7.3 (5.3-10.0) ≥ $75,000 4.3 (3.3-5.6) 6.0 (4.7-7.6)
a The proportion who reported 14 or more days of poor physical health, which includes physical illness and injury, during the past 30 days. b The proportion who reported 14 or more days of poor mental health, which includes stress, de-pression, and problems with emotions, during the past 30 days.
Hispanic 11.3 (5.9-20.3) 14.7 (8.0-25.4)
2010 MiBRFS
Quality of Life
2
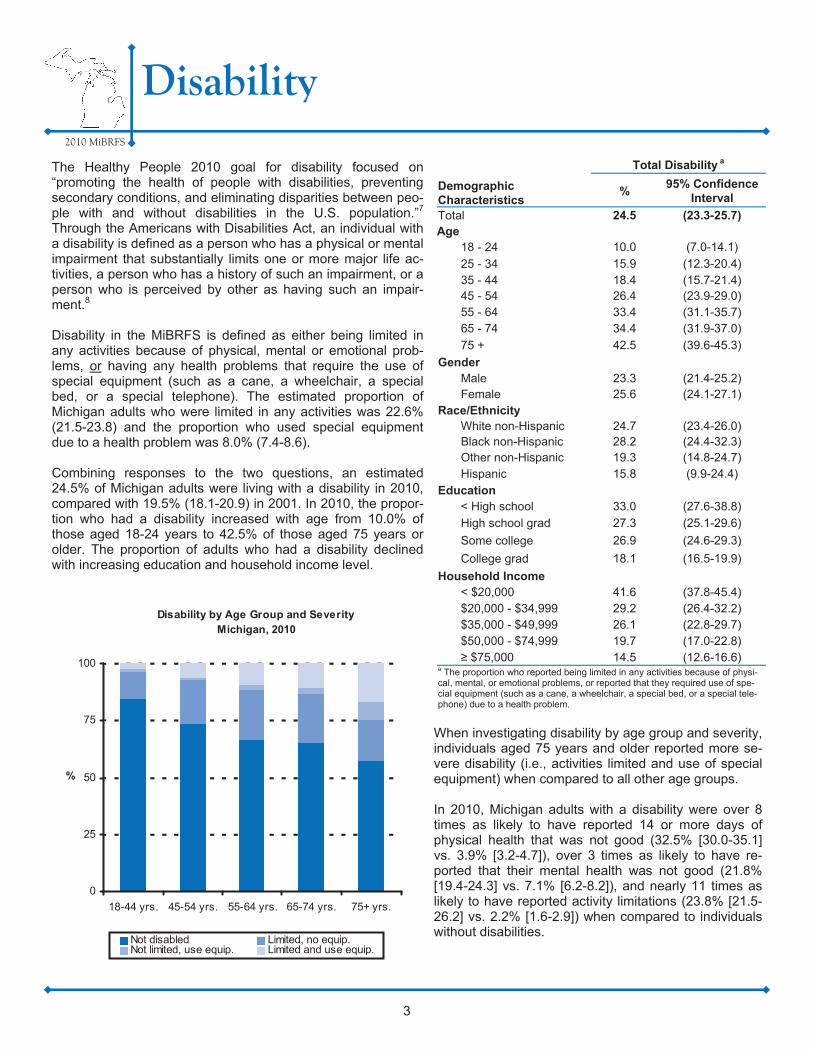
The Healthy People 2010 goal for disability focused on “promoting the health of people with disabilities, preventing secondary conditions, and eliminating disparities between peo-ple with and without disabilities in the U.S. population.”7 Through the Americans with Disabilities Act, an individual with a disability is defined as a person who has a physical or mental impairment that substantially limits one or more major life ac-tivities, a person who has a history of such an impairment, or a person who is perceived by other as having such an impair-ment.8 Disability in the MiBRFS is defined as either being limited in any activities because of physical, mental or emotional prob-lems, or having any health problems that require the use of special equipment (such as a cane, a wheelchair, a special bed, or a special telephone). The estimated proportion of Michigan adults who were limited in any activities was 22.6% (21.5-23.8) and the proportion who used special equipment due to a health problem was 8.0% (7.4-8.6). Combining responses to the two questions, an estimated 24.5% of Michigan adults were living with a disability in 2010, compared with 19.5% (18.1-20.9) in 2001. In 2010, the propor-tion who had a disability increased with age from 10.0% of those aged 18-24 years to 42.5% of those aged 75 years or older. The proportion of adults who had a disability declined with increasing education and household income level.
When investigating disability by age group and severity, individuals aged 75 years and older reported more se-vere disability (i.e., activities limited and use of special equipment) when compared to all other age groups. In 2010, Michigan adults with a disability were over 8 times as likely to have reported 14 or more days of physical health that was not good (32.5% [30.0-35.1] vs. 3.9% [3.2-4.7]), over 3 times as likely to have re-ported that their mental health was not good (21.8% [19.4-24.3] vs. 7.1% [6.2-8.2]), and nearly 11 times as likely to have reported activity limitations (23.8% [21.5-26.2] vs. 2.2% [1.6-2.9]) when compared to individuals without disabilities.
2010 MiBRFS
Disability
Demographic Characteristics
Total Disability a
% 95% Confidence
Interval
Total 24.5 (23.3-25.7) Age
18 - 24 10.0 (7.0-14.1)
25 - 34 15.9 (12.3-20.4) 35 - 44 18.4 (15.7-21.4) 45 - 54 26.4 (23.9-29.0) 55 - 64 33.4 (31.1-35.7) 65 - 74 34.4 (31.9-37.0)
75 + 42.5 (39.6-45.3)
Gender Male 23.3 (21.4-25.2) Female 25.6 (24.1-27.1)
Race/Ethnicity White non-Hispanic 24.7 (23.4-26.0) Black non-Hispanic 28.2 (24.4-32.3) Other non-Hispanic 19.3 (14.8-24.7)
Education < High school 33.0 (27.6-38.8) High school grad 27.3 (25.1-29.6)
Some college 26.9 (24.6-29.3)
College grad 18.1 (16.5-19.9)
Household Income < $20,000 41.6 (37.8-45.4) $20,000 - $34,999 29.2 (26.4-32.2) $35,000 - $49,999 26.1 (22.8-29.7) $50,000 - $74,999 19.7 (17.0-22.8) ≥ $75,000 14.5 (12.6-16.6)
a The proportion who reported being limited in any activities because of physi-cal, mental, or emotional problems, or reported that they required use of spe-cial equipment (such as a cane, a wheelchair, a special bed, or a special tele-phone) due to a health problem.
Hispanic 15.8 (9.9-24.4)
3
Disability by Age Group and SeverityMichigan, 2010
0
25
50
75
100
18-44 yrs. 45-54 yrs. 55-64 yrs. 65-74 yrs. 75+ yrs.
%
Not disabled Limited, no equip.Not limited, use equip. Limited and use equip.
2010 MiBRFS
Weight Status
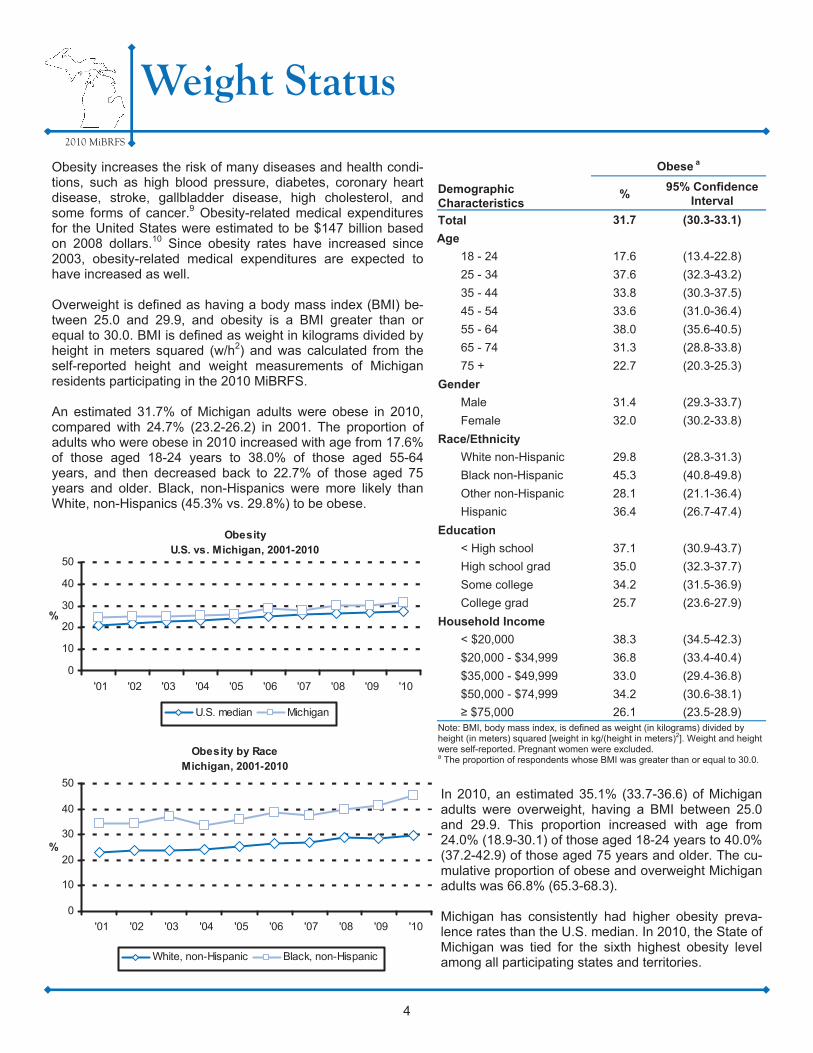
Obesity increases the risk of many diseases and health condi-tions, such as high blood pressure, diabetes, coronary heart disease, stroke, gallbladder disease, high cholesterol, and some forms of cancer.9 Obesity-related medical expenditures for the United States were estimated to be $147 billion based on 2008 dollars.10 Since obesity rates have increased since 2003, obesity-related medical expenditures are expected to have increased as well. Overweight is defined as having a body mass index (BMI) be-tween 25.0 and 29.9, and obesity is a BMI greater than or equal to 30.0. BMI is defined as weight in kilograms divided by height in meters squared (w/h2) and was calculated from the self-reported height and weight measurements of Michigan residents participating in the 2010 MiBRFS. An estimated 31.7% of Michigan adults were obese in 2010, compared with 24.7% (23.2-26.2) in 2001. The proportion of adults who were obese in 2010 increased with age from 17.6% of those aged 18-24 years to 38.0% of those aged 55-64 years, and then decreased back to 22.7% of those aged 75 years and older. Black, non-Hispanics were more likely than White, non-Hispanics (45.3% vs. 29.8%) to be obese.
In 2010, an estimated 35.1% (33.7-36.6) of Michigan adults were overweight, having a BMI between 25.0 and 29.9. This proportion increased with age from 24.0% (18.9-30.1) of those aged 18-24 years to 40.0% (37.2-42.9) of those aged 75 years and older. The cu-mulative proportion of obese and overweight Michigan adults was 66.8% (65.3-68.3). Michigan has consistently had higher obesity preva-lence rates than the U.S. median. In 2010, the State of Michigan was tied for the sixth highest obesity level among all participating states and territories.
Demographic Characteristics
Obese a
% 95% Confidence
Interval
Total 31.7 (30.3-33.1)
Age
18 - 24 17.6 (13.4-22.8)
25 - 34 37.6 (32.3-43.2)
35 - 44 33.8 (30.3-37.5)
45 - 54 33.6 (31.0-36.4)
55 - 64 38.0 (35.6-40.5)
65 - 74 31.3 (28.8-33.8)
75 + 22.7 (20.3-25.3)
Gender
Male 31.4 (29.3-33.7)
Female 32.0 (30.2-33.8)
Race/Ethnicity
White non-Hispanic 29.8 (28.3-31.3)
Black non-Hispanic 45.3 (40.8-49.8)
Other non-Hispanic 28.1 (21.1-36.4)
Education
< High school 37.1 (30.9-43.7)
High school grad 35.0 (32.3-37.7)
Some college 34.2 (31.5-36.9)
College grad 25.7 (23.6-27.9)
Household Income
< $20,000 38.3 (34.5-42.3)
$20,000 - $34,999 36.8 (33.4-40.4)
$35,000 - $49,999 33.0 (29.4-36.8)
$50,000 - $74,999 34.2 (30.6-38.1)
≥ $75,000 26.1 (23.5-28.9) Note: BMI, body mass index, is defined as weight (in kilograms) divided by height (in meters) squared [weight in kg/(height in meters)2]. Weight and height were self-reported. Pregnant women were excluded. a The proportion of respondents whose BMI was greater than or equal to 30.0.
Hispanic 36.4 (26.7-47.4)
4
ObesityU.S. vs. Michigan, 2001-2010
0
10
20
30
40
50
'01 '02 '03 '04 '05 '06 '07 '08 '09 '10
%
U.S. median Michigan
Obesity by Race Michigan, 2001-2010
0
10
20
30
40
50
'01 '02 '03 '04 '05 '06 '07 '08 '09 '10
%
White, non-Hispanic Black, non-Hispanic

2010 MiBRFS
No Health Care Coverage
Adults who do not have health care coverage are less likely to access health care services and more likely to delay get-ting needed medical attention.11 Utilization of preventive health care services, such as mammography, pap tests, prostate exams, adult vaccinations, and cholesterol tests, could reduce the prevalence and severity of diseases and chronic conditions in the United States.12 In 2010, an estimated 16.6% of Michigan adults aged 18-64 years had no health care coverage. This proportion de-creased with age from 28.4% of those aged 18-24 years to 8.8% of those aged 55-64 years. Black, non-Hispanics (21.7%) had a higher rate of non-coverage than White, non-Hispanics (14.5%). The proportion uninsured decreased with increasing education and household income levels. The highest non-coverage rates were found among younger persons, those with less education, and those living in low-income households. When lack of health insurance was ex-amined more closely among those aged 18-29 years, it was found that 27.9% (23.4-32.8) of this age group were without health insurance and that the same inverse relationships ex-isted with education and household income. The proportion with no health insurance decreased from 28.9% (16.2-46.0) among 18-29 year-olds with less than a high school degree to 11.4% (5.9-20.7) among college graduates in this age group. Similarly, 43.1% (31.9-55.0) of 18-29 year-olds living in households with incomes of less than $20,000 had no health insurance while only 8.3% (3.6-18.0) of those in the highest income group (≥ $75,000) had no health insurance. U.S. adults without health insurance are more likely than those with insurance to have more health risk factors, such as current cigarette smoking and lack of physical activity.13 In Michigan, among those aged 18-64 years who did not have health insurance, the proportion who were current smokers was 34.4% (29.7-39.3) in 2010, whereas among insured adults in the same age range, an estimated 18.8% (17.3-20.3) were current smokers. No dif-ferences in leisure-time physical ac-tivity were observed by insurance status. From 2000 to 2007 the proportion of Michigan adults aged 18 years or older who reported having no health care coverage has been relatively constant and slightly lower than the U.S. median. Over the past three years, the proportion of uninsured Michigan adults has increased to nearly that of the U.S. median.
Demographic Characteristics
No Health Care Coverage Among Adults Aged 18-64 Years a
% 95% Confidence
Interval Total 16.6 (15.1-18.1) Age
18 - 24 28.4 (23.0-34.6) 25 - 34 20.5 (16.4-25.3)
35 - 44 15.8 (13.1-19.0)
45 - 54 13.7 (11.8-15.8) 55 - 64 8.8 (7.5-10.3)
Gender Male 18.7 (16.5-21.1) Female 14.5 (12.7-16.5)
Race/Ethnicity White non-Hispanic 14.5 (13.0-16.1) Black non-Hispanic 21.7 (17.6-26.4) Other non-Hispanic 23.5 (16.7-32.1) Hispanic 29.4 (19.5-41.9)
Education < High school 26.6 (19.2-35.7) High school grad 25.6 (22.3-29.0)
Some college 18.8 (16.3-21.7)
College grad 6.0 (4.7-7.7)
Household Income < $20,000 41.4 (36.4-46.6) $20,000 - $34,999 31.7 (27.1-36.6) $35,000 - $49,999 14.7 (11.4-18.7) $50,000 - $74,999 5.9 (4.2-8.4) ≥ $75,000 2.5 (1.6-3.9)
a Among those aged 18-64, the proportion who reported having no health care coverage, including health insurance, prepaid plans such as HMOs, or govern-ment plans, such as Medicare.
5
No Health Care CoverageAmong Adults Aged 18 Years and Older
U.S. vs. Michigan, 2001-2010
0
5
10
15
20
'01 '02 '03 '04 '05 '06 '07 '08 '09 '10
%
U.S. median Michigan
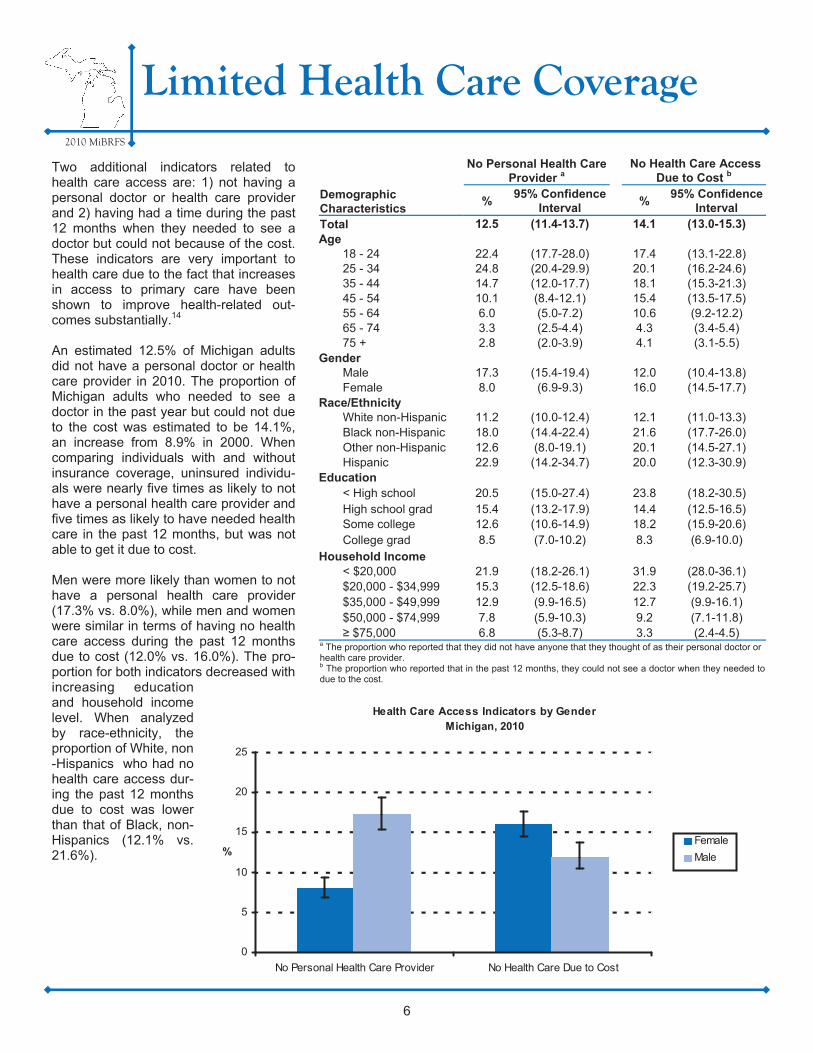
Two additional indicators related to health care access are: 1) not having a personal doctor or health care provider and 2) having had a time during the past 12 months when they needed to see a doctor but could not because of the cost. These indicators are very important to health care due to the fact that increases in access to primary care have been shown to improve health-related out-comes substantially.14 An estimated 12.5% of Michigan adults did not have a personal doctor or health care provider in 2010. The proportion of Michigan adults who needed to see a doctor in the past year but could not due to the cost was estimated to be 14.1%, an increase from 8.9% in 2000. When comparing individuals with and without insurance coverage, uninsured individu-als were nearly five times as likely to not have a personal health care provider and five times as likely to have needed health care in the past 12 months, but was not able to get it due to cost. Men were more likely than women to not have a personal health care provider (17.3% vs. 8.0%), while men and women were similar in terms of having no health care access during the past 12 months due to cost (12.0% vs. 16.0%). The pro-portion for both indicators decreased with increasing education and household income level. When analyzed by race-ethnicity, the proportion of White, non-Hispanics who had no health care access dur-ing the past 12 months due to cost was lower than that of Black, non-Hispanics (12.1% vs. 21.6%).
2010 MiBRFS
Limited Health Care Coverage
Demographic Characteristics
No Personal Health Care Provider a
No Health Care Access Due to Cost b
% 95% Confidence
Interval %
95% Confidence Interval
Total 12.5 (11.4-13.7) 14.1 (13.0-15.3) Age
18 - 24 22.4 (17.7-28.0) 17.4 (13.1-22.8) 25 - 34 24.8 (20.4-29.9) 20.1 (16.2-24.6) 35 - 44 14.7 (12.0-17.7) 18.1 (15.3-21.3) 45 - 54 10.1 (8.4-12.1) 15.4 (13.5-17.5) 55 - 64 6.0 (5.0-7.2) 10.6 (9.2-12.2) 65 - 74 3.3 (2.5-4.4) 4.3 (3.4-5.4) 75 + 2.8 (2.0-3.9) 4.1 (3.1-5.5)
Gender Male 17.3 (15.4-19.4) 12.0 (10.4-13.8) Female 8.0 (6.9-9.3) 16.0 (14.5-17.7)
Race/Ethnicity White non-Hispanic 11.2 (10.0-12.4) 12.1 (11.0-13.3) Black non-Hispanic 18.0 (14.4-22.4) 21.6 (17.7-26.0) Other non-Hispanic 12.6 (8.0-19.1) 20.1 (14.5-27.1)
Education < High school 20.5 (15.0-27.4) 23.8 (18.2-30.5) High school grad 15.4 (13.2-17.9) 14.4 (12.5-16.5) Some college 12.6 (10.6-14.9) 18.2 (15.9-20.6) College grad 8.5 (7.0-10.2) 8.3 (6.9-10.0)
Household Income < $20,000 21.9 (18.2-26.1) 31.9 (28.0-36.1) $20,000 - $34,999 15.3 (12.5-18.6) 22.3 (19.2-25.7) $35,000 - $49,999 12.9 (9.9-16.5) 12.7 (9.9-16.1) $50,000 - $74,999 7.8 (5.9-10.3) 9.2 (7.1-11.8) ≥ $75,000 6.8 (5.3-8.7) 3.3 (2.4-4.5)
a The proportion who reported that they did not have anyone that they thought of as their personal doctor or health care provider. b The proportion who reported that in the past 12 months, they could not see a doctor when they needed to due to the cost.
Hispanic 22.9 (14.2-34.7) 20.0 (12.3-30.9)
6
Health Care Access Indicators by GenderMichigan, 2010
0
5
10
15
20
25
No Personal Health Care Provider No Health Care Due to Cost
%Female
Male
Regular physical activity among adults has been shown to reduce the risk of many dis-eases including cardiovascular disease, dia-betes, colon and breast cancers, and osteopo-rosis. Keeping physically active also helps to control weight, maintain healthy bones, mus-cles, and joints, and can relieve symptoms of depression.15
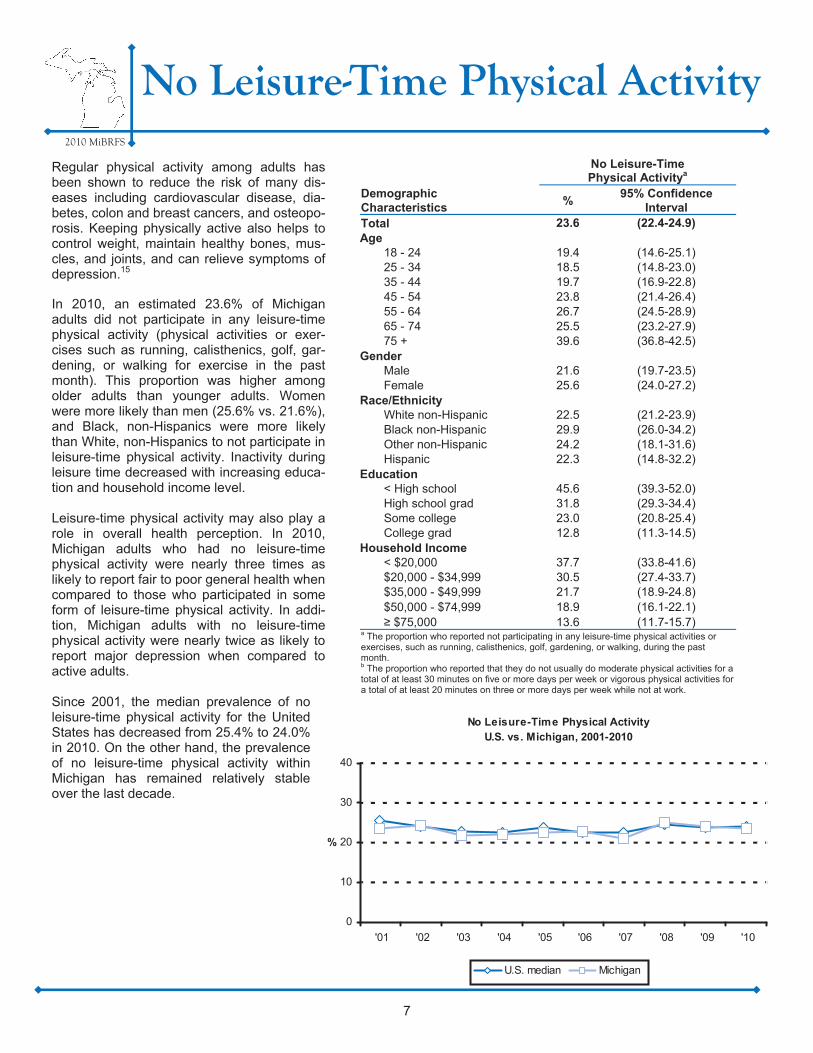
In 2010, an estimated 23.6% of Michigan adults did not participate in any leisure-time physical activity (physical activities or exer-cises such as running, calisthenics, golf, gar-dening, or walking for exercise in the past month). This proportion was higher among older adults than younger adults. Women were more likely than men (25.6% vs. 21.6%), and Black, non-Hispanics were more likely than White, non-Hispanics to not participate in leisure-time physical activity. Inactivity during leisure time decreased with increasing educa-tion and household income level. Leisure-time physical activity may also play a role in overall health perception. In 2010, Michigan adults who had no leisure-time physical activity were nearly three times as likely to report fair to poor general health when compared to those who participated in some form of leisure-time physical activity. In addi-tion, Michigan adults with no leisure-time physical activity were nearly twice as likely to report major depression when compared to active adults. Since 2001, the median prevalence of no leisure-time physical activity for the United States has decreased from 25.4% to 24.0% in 2010. On the other hand, the prevalence of no leisure-time physical activity within Michigan has remained relatively stable over the last decade.
2010 MiBRFS
No Leisure-Time Physical Activity
7
Demographic Characteristics
No Leisure-Time Physical Activitya
% 95% Confidence
Interval Total 23.6 (22.4-24.9) Age
18 - 24 19.4 (14.6-25.1) 25 - 34 18.5 (14.8-23.0) 35 - 44 19.7 (16.9-22.8) 45 - 54 23.8 (21.4-26.4) 55 - 64 26.7 (24.5-28.9) 65 - 74 25.5 (23.2-27.9) 75 + 39.6 (36.8-42.5)
Gender Male 21.6 (19.7-23.5) Female 25.6 (24.0-27.2)
Race/Ethnicity White non-Hispanic 22.5 (21.2-23.9) Black non-Hispanic 29.9 (26.0-34.2) Other non-Hispanic 24.2 (18.1-31.6) Hispanic 22.3 (14.8-32.2)
Education < High school 45.6 (39.3-52.0) High school grad 31.8 (29.3-34.4) Some college 23.0 (20.8-25.4) College grad 12.8 (11.3-14.5)
Household Income < $20,000 37.7 (33.8-41.6) $20,000 - $34,999 30.5 (27.4-33.7) $35,000 - $49,999 21.7 (18.9-24.8) $50,000 - $74,999 18.9 (16.1-22.1) ≥ $75,000 13.6 (11.7-15.7)
a The proportion who reported not participating in any leisure-time physical activities or exercises, such as running, calisthenics, golf, gardening, or walking, during the past month. b The proportion who reported that they do not usually do moderate physical activities for a total of at least 30 minutes on five or more days per week or vigorous physical activities for a total of at least 20 minutes on three or more days per week while not at work.
No Leisure-Time Physical Activity U.S. vs. Michigan, 2001-2010
0
10
20
30
40
'01 '02 '03 '04 '05 '06 '07 '08 '09 '10
%
U.S. median Michigan

Smoking contributes to the development of many kinds of chronic conditions, including cancers, respiratory dis-eases, and cardiovascular diseases, and continues to be the leading preventable cause of premature death in the United States.”16 It has been estimated that smoking costs the United States $193 billion in annual health-related eco-nomic losses and 5.1 million years of potential life lost each year.17 Current smoking status was defined as ever having smoked 100 cigarettes (five packs) in their life and smok-ing cigarettes now, either every day or on some days, whereas former smoking status was defined as having smoked at least 100 cigarettes but not currently smoking. In 2010, an estimated 18.9% of Michigan adults were cur-rent smokers, and 25.3% (24.2-26.5) were estimated to be former smokers. Men were more likely than women to be current smokers (21.0% vs. 17.0%), and former smokers (27.7% [25.8-29.6] vs. 23.1% [21.7-24.6]), while women were more likely to have never smoked (51.4% [49.0-53.7] vs. 59.9% [58.0-61.7]). Current smoking prevalence was similar among Black, non-Hispanics and White, non-Hispanics, and declined with increasing levels of educa-tion and household income. The proportion of Michigan adults who were current smok-ers has remained slightly above the U.S. median over the past decade. To achieve the Healthy People 2010 goal of a cigarette smoking prevalence of 12%, the proportion of current smokers in Michigan would have needed to drop by nearly eight percentage points over the past year.18 Unfortunately, Michigan was still 6.9 percentage points away from this goal after 2010. An estimated 62.3% (58.7-65.7) of current smokers in Michigan tried to quit smoking for one day or longer in the past year. Research has shown a potential relationship between self-rated health status and current smoking status.19 In Michigan, those who re-ported fair to poor general health were more likely to be current smokers than those who reported good to excellent general health (27.4% [24.1-30.9] vs. 17.5% [16.2-18.9]).
2010 MiBRFS
Cigarette Smoking
8
Demographic Characteristics
Current Smoking a
% 95% Confidence
Interval
Total 18.9 (17.7-20.2) Age
18 - 24 19.6 (15.2-25.0)
25 - 34 29.0 (24.2-34.3)
35 - 44 20.7 (17.9-23.9)
45 - 54 21.8 (19.6-24.2)
55 - 64 17.0 (15.2-19.0)
65 - 74 9.3 (7.8-11.0) 75 + 6.6 (5.3-8.2)
Gender Male 21.0 (19.0-23.1) Female 17.0 (15.6-18.5)
Race/Ethnicity White non-Hispanic 18.1 (16.8-19.4) Black non-Hispanic 20.7 (17.2-24.8) Other non-Hispanic 22.9 (16.7-30.5)
Education < High school 34.7 (28.7-41.2)
High school grad 26.4 (23.9-29.1)
Some college 20.0 (17.9-22.3)
College grad 8.4 (6.9-10.1)
Household Income < $20,000 33.8 (30.0-37.9) $20,000 - $34,999 25.7 (22.6-29.1) $35,000 - $49,999 19.5 (16.2-23.3) $50,000 - $74,999 14.0 (11.5-16.9) ≥ $75,000 11.0 (9.3-13.1)
a The proportion who reported that they had ever smoked at least 100 ciga-rettes (5 packs) in their life and that they smoke cigarettes now, either every day or on some days.
Hispanic 23.4 (14.9-34.7)
Current Cigarette SmokingU.S. vs. Michigan, 2001-2010
0
10
20
30
40
'01 '02 '03 '04 '05 '06 '07 '08 '09 '10
%
U.S. median Michigan
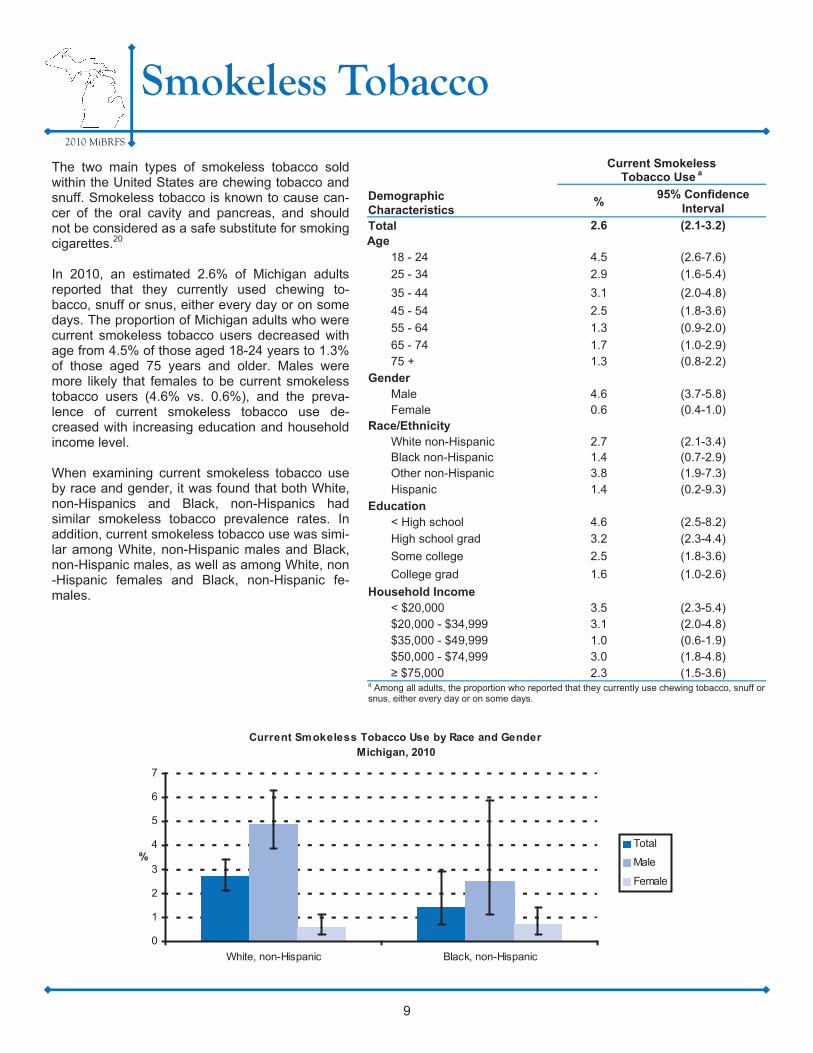
The two main types of smokeless tobacco sold within the United States are chewing tobacco and snuff. Smokeless tobacco is known to cause can-cer of the oral cavity and pancreas, and should not be considered as a safe substitute for smoking cigarettes.20 In 2010, an estimated 2.6% of Michigan adults reported that they currently used chewing to-bacco, snuff or snus, either every day or on some days. The proportion of Michigan adults who were current smokeless tobacco users decreased with age from 4.5% of those aged 18-24 years to 1.3% of those aged 75 years and older. Males were more likely that females to be current smokeless tobacco users (4.6% vs. 0.6%), and the preva-lence of current smokeless tobacco use de-creased with increasing education and household income level. When examining current smokeless tobacco use by race and gender, it was found that both White, non-Hispanics and Black, non-Hispanics had similar smokeless tobacco prevalence rates. In addition, current smokeless tobacco use was simi-lar among White, non-Hispanic males and Black, non-Hispanic males, as well as among White, non-Hispanic females and Black, non-Hispanic fe-males.
2010 MiBRFS
Smokeless Tobacco
9
Demographic Characteristics
Current Smokeless Tobacco Use a
% 95% Confidence
Interval
Total 2.6 (2.1-3.2) Age
18 - 24 4.5 (2.6-7.6)
25 - 34 2.9 (1.6-5.4)
35 - 44 3.1 (2.0-4.8)
45 - 54 2.5 (1.8-3.6)
55 - 64 1.3 (0.9-2.0)
65 - 74 1.7 (1.0-2.9) 75 + 1.3 (0.8-2.2)
Gender Male 4.6 (3.7-5.8) Female 0.6 (0.4-1.0)
Race/Ethnicity White non-Hispanic 2.7 (2.1-3.4) Black non-Hispanic 1.4 (0.7-2.9) Other non-Hispanic 3.8 (1.9-7.3)
Education < High school 4.6 (2.5-8.2) High school grad 3.2 (2.3-4.4)
Some college 2.5 (1.8-3.6)
College grad 1.6 (1.0-2.6)
Household Income < $20,000 3.5 (2.3-5.4) $20,000 - $34,999 3.1 (2.0-4.8) $35,000 - $49,999 1.0 (0.6-1.9) $50,000 - $74,999 3.0 (1.8-4.8) ≥ $75,000 2.3 (1.5-3.6)
a Among all adults, the proportion who reported that they currently use chewing tobacco, snuff or snus, either every day or on some days.
Hispanic 1.4 (0.2-9.3)
Current Smokeless Tobacco Use by Race and GenderMichigan, 2010
0
1
2
3
4
5
6
7
White, non-Hispanic Black, non-Hispanic
%Total
Male
Female
2010 MiBRFS
Alcohol Consumption
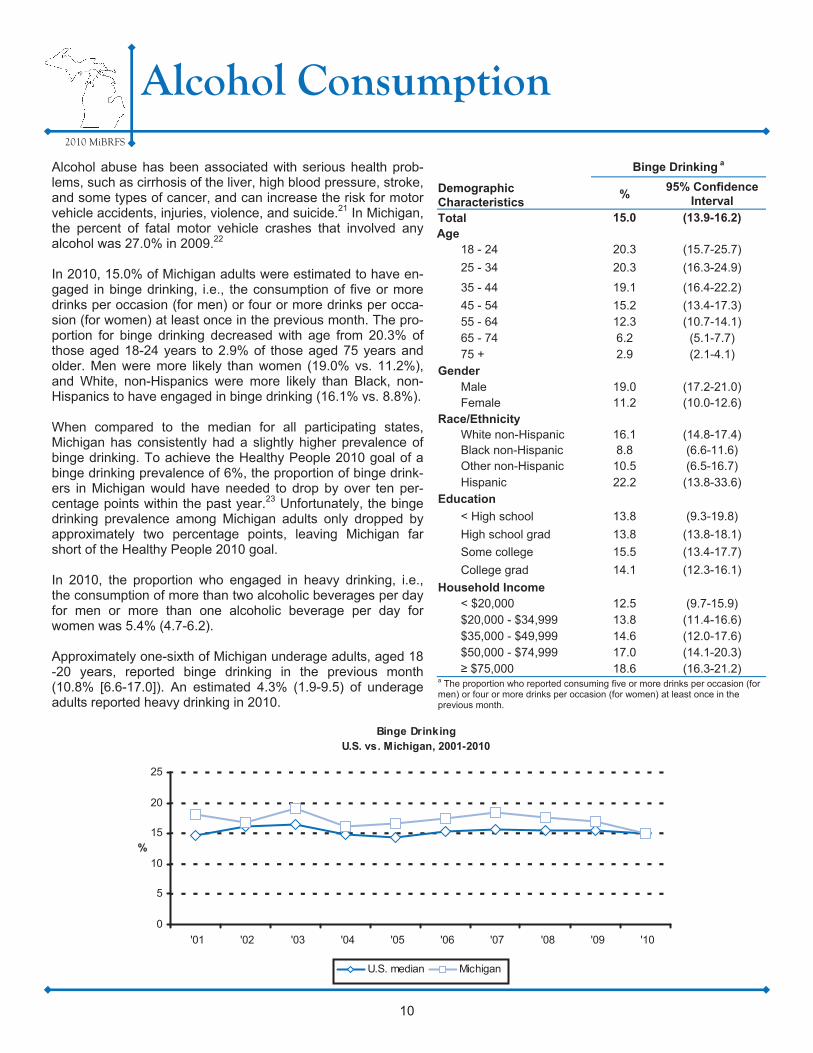
Alcohol abuse has been associated with serious health prob-lems, such as cirrhosis of the liver, high blood pressure, stroke, and some types of cancer, and can increase the risk for motor vehicle accidents, injuries, violence, and suicide.21 In Michigan, the percent of fatal motor vehicle crashes that involved any alcohol was 27.0% in 2009.22 In 2010, 15.0% of Michigan adults were estimated to have en-gaged in binge drinking, i.e., the consumption of five or more drinks per occasion (for men) or four or more drinks per occa-sion (for women) at least once in the previous month. The pro-portion for binge drinking decreased with age from 20.3% of those aged 18-24 years to 2.9% of those aged 75 years and older. Men were more likely than women (19.0% vs. 11.2%), and White, non-Hispanics were more likely than Black, non-Hispanics to have engaged in binge drinking (16.1% vs. 8.8%). When compared to the median for all participating states, Michigan has consistently had a slightly higher prevalence of binge drinking. To achieve the Healthy People 2010 goal of a binge drinking prevalence of 6%, the proportion of binge drink-ers in Michigan would have needed to drop by over ten per-centage points within the past year.23 Unfortunately, the binge drinking prevalence among Michigan adults only dropped by approximately two percentage points, leaving Michigan far short of the Healthy People 2010 goal. In 2010, the proportion who engaged in heavy drinking, i.e., the consumption of more than two alcoholic beverages per day for men or more than one alcoholic beverage per day for women was 5.4% (4.7-6.2). Approximately one-sixth of Michigan underage adults, aged 18-20 years, reported binge drinking in the previous month (10.8% [6.6-17.0]). An estimated 4.3% (1.9-9.5) of underage adults reported heavy drinking in 2010.
Demographic Characteristics
Binge Drinking a
% 95% Confidence
Interval
Total 15.0 (13.9-16.2) Age
18 - 24 20.3 (15.7-25.7)
25 - 34 20.3 (16.3-24.9)
35 - 44 19.1 (16.4-22.2)
45 - 54 15.2 (13.4-17.3) 55 - 64 12.3 (10.7-14.1) 65 - 74 6.2 (5.1-7.7) 75 + 2.9 (2.1-4.1)
Gender Male 19.0 (17.2-21.0) Female 11.2 (10.0-12.6)
Race/Ethnicity White non-Hispanic 16.1 (14.8-17.4) Black non-Hispanic 8.8 (6.6-11.6) Other non-Hispanic 10.5 (6.5-16.7)
Education
< High school 13.8 (9.3-19.8)
High school grad 13.8 (13.8-18.1)
Some college 15.5 (13.4-17.7)
College grad 14.1 (12.3-16.1)
Household Income < $20,000 12.5 (9.7-15.9) $20,000 - $34,999 13.8 (11.4-16.6) $35,000 - $49,999 14.6 (12.0-17.6) $50,000 - $74,999 17.0 (14.1-20.3) ≥ $75,000 18.6 (16.3-21.2)
a The proportion who reported consuming five or more drinks per occasion (for men) or four or more drinks per occasion (for women) at least once in the previous month.
Hispanic 22.2 (13.8-33.6)
10
Binge Drinking U.S. vs. Michigan, 2001-2010
0
5
10
15
20
25
'01 '02 '03 '04 '05 '06 '07 '08 '09 '10
%
U.S. median Michigan
2010 MiBRFS
Motor Vehicle Safety
11
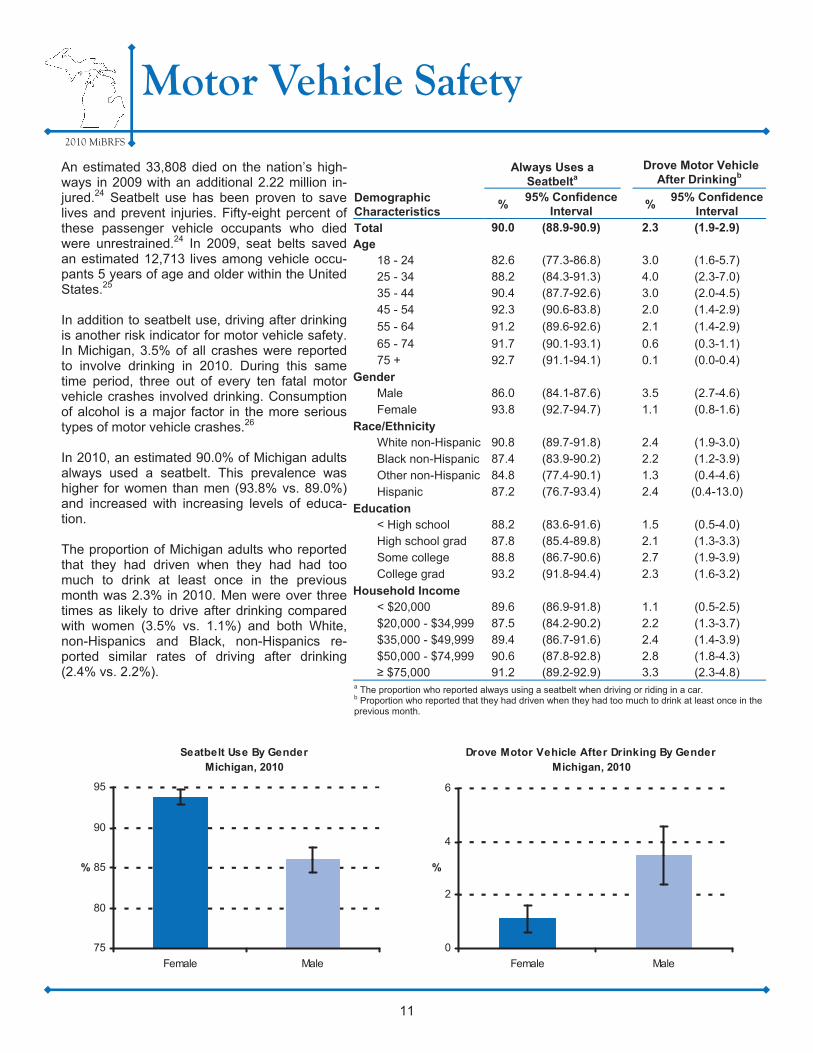
An estimated 33,808 died on the nation’s high-ways in 2009 with an additional 2.22 million in-jured.24 Seatbelt use has been proven to save lives and prevent injuries. Fifty-eight percent of these passenger vehicle occupants who died were unrestrained.24 In 2009, seat belts saved an estimated 12,713 lives among vehicle occu-pants 5 years of age and older within the United States.25 In addition to seatbelt use, driving after drinking is another risk indicator for motor vehicle safety. In Michigan, 3.5% of all crashes were reported to involve drinking in 2010. During this same time period, three out of every ten fatal motor vehicle crashes involved drinking. Consumption of alcohol is a major factor in the more serious types of motor vehicle crashes.26 In 2010, an estimated 90.0% of Michigan adults always used a seatbelt. This prevalence was higher for women than men (93.8% vs. 89.0%) and increased with increasing levels of educa-tion. The proportion of Michigan adults who reported that they had driven when they had had too much to drink at least once in the previous month was 2.3% in 2010. Men were over three times as likely to drive after drinking compared with women (3.5% vs. 1.1%) and both White, non-Hispanics and Black, non-Hispanics re-ported similar rates of driving after drinking (2.4% vs. 2.2%).
Demographic Characteristics
Always Uses a Seatbelta
Drove Motor Vehicle After Drinkingb
% 95% Confidence
Interval %
95% Confidence Interval
Total 90.0 (88.9-90.9) 2.3 (1.9-2.9) Age
18 - 24 82.6 (77.3-86.8) 3.0 (1.6-5.7) 25 - 34 88.2 (84.3-91.3) 4.0 (2.3-7.0) 35 - 44 90.4 (87.7-92.6) 3.0 (2.0-4.5) 45 - 54 92.3 (90.6-83.8) 2.0 (1.4-2.9)
55 - 64 91.2 (89.6-92.6) 2.1 (1.4-2.9)
65 - 74 91.7 (90.1-93.1) 0.6 (0.3-1.1) 75 + 92.7 (91.1-94.1) 0.1 (0.0-0.4)
Gender Male 86.0 (84.1-87.6) 3.5 (2.7-4.6) Female 93.8 (92.7-94.7) 1.1 (0.8-1.6)
Race/Ethnicity White non-Hispanic 90.8 (89.7-91.8) 2.4 (1.9-3.0) Black non-Hispanic 87.4 (83.9-90.2) 2.2 (1.2-3.9) Other non-Hispanic 84.8 (77.4-90.1) 1.3 (0.4-4.6)
Education < High school 88.2 (83.6-91.6) 1.5 (0.5-4.0) High school grad 87.8 (85.4-89.8) 2.1 (1.3-3.3) Some college 88.8 (86.7-90.6) 2.7 (1.9-3.9) College grad 93.2 (91.8-94.4) 2.3 (1.6-3.2)
Household Income < $20,000 89.6 (86.9-91.8) 1.1 (0.5-2.5) $20,000 - $34,999 87.5 (84.2-90.2) 2.2 (1.3-3.7) $35,000 - $49,999 89.4 (86.7-91.6) 2.4 (1.4-3.9) $50,000 - $74,999 90.6 (87.8-92.8) 2.8 (1.8-4.3) ≥ $75,000 91.2 (89.2-92.9) 3.3 (2.3-4.8)
a The proportion who reported always using a seatbelt when driving or riding in a car. b Proportion who reported that they had driven when they had too much to drink at least once in the previous month.
Hispanic 87.2 (76.7-93.4) 2.4 (0.4-13.0)
75
80
85
90
95
Female Male
%
Seatbelt Use By GenderMichigan, 2010
0
2
4
6
Female Male
%
Drove Motor Vehicle After Drinking By GenderMichigan, 2010
2010 MiBRFS
Routine Checkup in Past Year
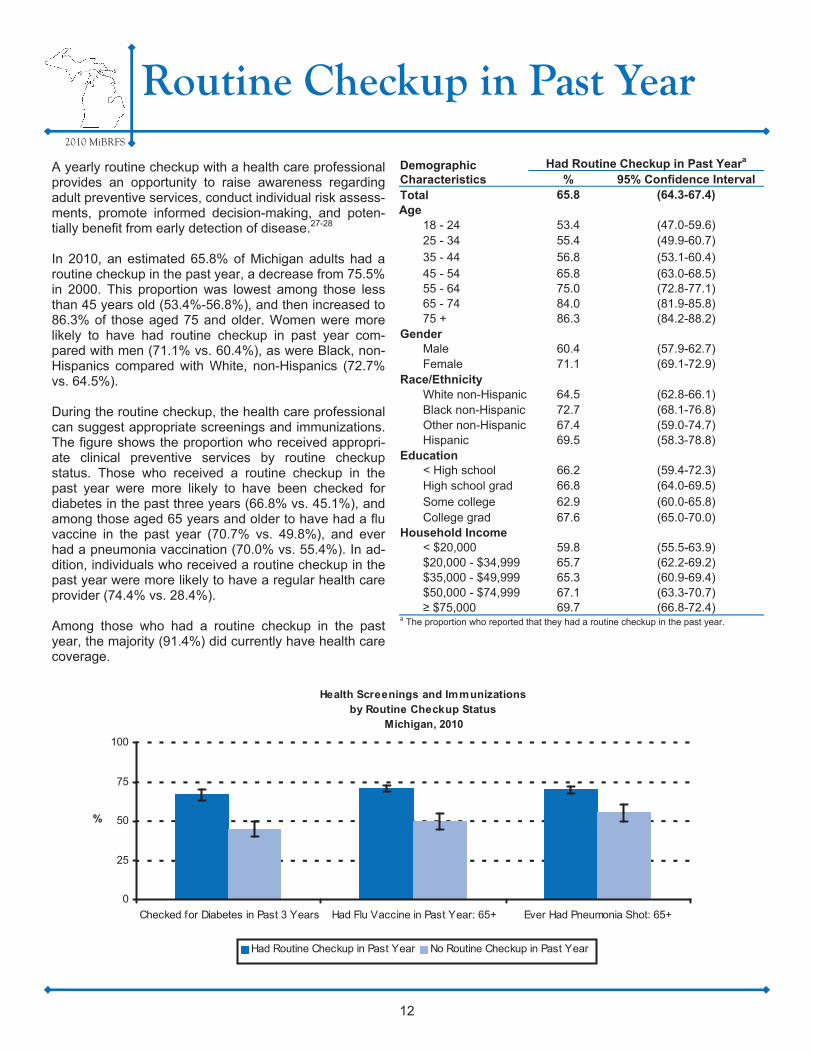
A yearly routine checkup with a health care professional provides an opportunity to raise awareness regarding adult preventive services, conduct individual risk assess-ments, promote informed decision-making, and poten-tially benefit from early detection of disease.27-28 In 2010, an estimated 65.8% of Michigan adults had a routine checkup in the past year, a decrease from 75.5% in 2000. This proportion was lowest among those less than 45 years old (53.4%-56.8%), and then increased to 86.3% of those aged 75 and older. Women were more likely to have had routine checkup in past year com-pared with men (71.1% vs. 60.4%), as were Black, non-Hispanics compared with White, non-Hispanics (72.7% vs. 64.5%). During the routine checkup, the health care professional can suggest appropriate screenings and immunizations. The figure shows the proportion who received appropri-ate clinical preventive services by routine checkup status. Those who received a routine checkup in the past year were more likely to have been checked for diabetes in the past three years (66.8% vs. 45.1%), and among those aged 65 years and older to have had a flu vaccine in the past year (70.7% vs. 49.8%), and ever had a pneumonia vaccination (70.0% vs. 55.4%). In ad-dition, individuals who received a routine checkup in the past year were more likely to have a regular health care provider (74.4% vs. 28.4%). Among those who had a routine checkup in the past year, the majority (91.4%) did currently have health care coverage.
Demographic Characteristics
Had Routine Checkup in Past Yeara
% 95% Confidence Interval Total 65.8 (64.3-67.4) Age
18 - 24 53.4 (47.0-59.6) 25 - 34 55.4 (49.9-60.7)
35 - 44 56.8 (53.1-60.4) 45 - 54 65.8 (63.0-68.5) 55 - 64 75.0 (72.8-77.1) 65 - 74 84.0 (81.9-85.8) 75 + 86.3 (84.2-88.2)
Gender Male 60.4 (57.9-62.7) Female 71.1 (69.1-72.9)
Race/Ethnicity White non-Hispanic 64.5 (62.8-66.1) Black non-Hispanic 72.7 (68.1-76.8) Other non-Hispanic 67.4 (59.0-74.7)
Education < High school 66.2 (59.4-72.3) High school grad 66.8 (64.0-69.5) Some college 62.9 (60.0-65.8) College grad 67.6 (65.0-70.0)
Household Income < $20,000 59.8 (55.5-63.9) $20,000 - $34,999 65.7 (62.2-69.2) $35,000 - $49,999 65.3 (60.9-69.4) $50,000 - $74,999 67.1 (63.3-70.7) ≥ $75,000 69.7 (66.8-72.4)
a The proportion who reported that they had a routine checkup in the past year.
Hispanic 69.5 (58.3-78.8)
12
0
25
50
75
100
Checked for Diabetes in Past 3 Years Had Flu Vaccine in Past Year: 65+ Ever Had Pneumonia Shot: 65+
%
Had Routine Checkup in Past Year No Routine Checkup in Past Year
Health Screenings and Immunizations by Routine Checkup Status
Michigan, 2010

2010 MiBRFS
Breast Cancer Screening
13
Breast cancer is the second leading cause of cancer deaths among United States women.29-30 In 2008, there were 1,471 deaths among Michigan women due to breast cancer, second only to that of lung cancer.31 Early detection of breast cancer can occur through the use of screening tools such as mam-mography and clinical breast exams. Current recommenda-tions from the American Cancer Society include that women aged 20-39 years should have a clinical or physical breast exam by a health professional every three years, and women aged 40 years and older should have both a clinical breast exam (CBE) and mammogram annually.29-30, 32 In 2010, an estimated 53.0% of Michigan women aged 40 years and older had both a clinical breast exam and mammo-gram in the past year. This proportion increased with age from 50.0% of those aged 40-49 years to 60.4% of those aged 60-69 years, then decreased to 49.3% for those aged 70 and older. Appropriate breast cancer screening increased with increasing education and household income levels. Three-quarters (69.9% [68.2-71.7]) of Michigan women had an appropriately timed CBE, i.e., within the past 3 years for women aged 18-39 years and within the past year for those 40 and older. This proportion increased with education level from 69.7% (67.8-71.6) of those who did not have a high school diploma to 79.0% (76.4-81.4) of college graduates. An estimated 61.4% (59.6-63.2) of women aged 40 years and older had a mammogram in the past year. This proportion increased with age from 55.4% (51.2-59.5) of those aged 40-49 years to 68.2% (65.1-71.2) of those aged 60-69 years and then declined to 64.7% (61.9-67.4) of those aged 70 years and older. This prevalence also increased with increasing education and household income levels. The figure to the right uses the Healthy People 2010 indicator concerning the proportion of women aged 40 years and older who have received a mammogram within the preceding two years.33 The proportion of Michigan women aged 40 years and older who have received a mammogram in the past two years has re-mained slightly above the U.S. median for the past ten years.
Demographic Characteristics
Had Clinical Breast Exam and Mammogram in Past Year Among
Women Aged 40 and Older a
% 95% Confidence
Interval
Total 53.0 (51.1-54.8)
Age
40 - 49 50.0 (45.9-54.2)
50 - 59 53.7 (50.3-57.1)
60 - 69 60.4 (57.2-63.5)
70 + 49.3 (46.4-52.3)
Race/Ethnicity
White non-Hispanic 52.6 (50.6-54.6)
Black non-Hispanic 55.5 (50.0-60.9)
Other non-Hispanic 52.3 (41.8-62.5)
Hispanic 53.4 (37.4-68.7)
Education
< High school 35.5 (29.2-42.3)
High school grad 48.2 (45.1-51.4)
Some college 53.2 (49.8-56.5)
College grad 60.3 (57.0-63.5)
Household Income
< $20,000 39.0 (35.0-43.2)
$20,000 - $34,999 47.5 (43.5-51.5)
$35,000 - $49,999 53.0 (48.2-57.8)
$50,000 - $74,999 57.2 (52.0-62.3) ≥ $75,000 63.5 (59.3-67.4)
Note: Data included diagnostic tests. a Among women aged 40 years and older, the proportion who had both a clinical breast exam and mammogram in the previous year. b The denominator in this subgroup was less than 50.
Had a Mammogram in the Past Two Years Among Women Aged 40 Years and Older
U.S. vs. Michigan, 2000-2010
50
60
70
80
90
'00 '02 '04 '06 '08 '10
%
U.S. median Michigan
2010 MiBRFS
Cervical Cancer Screening
14
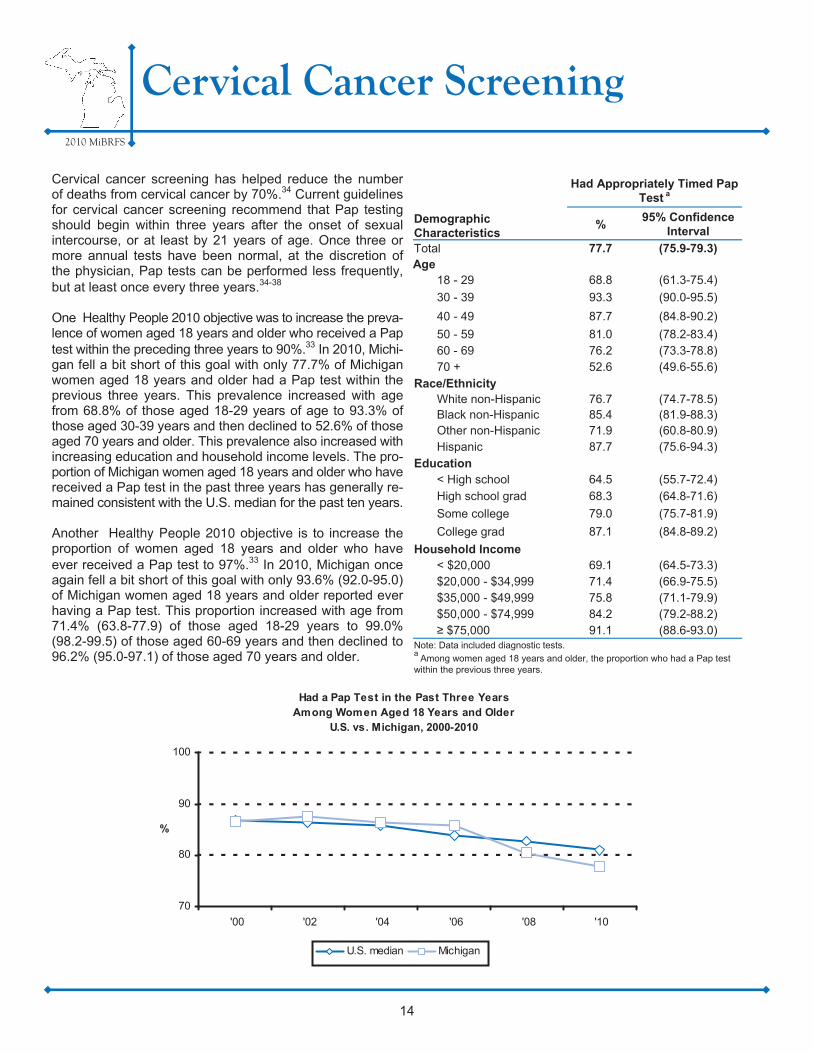
Cervical cancer screening has helped reduce the number of deaths from cervical cancer by 70%.34 Current guidelines for cervical cancer screening recommend that Pap testing should begin within three years after the onset of sexual intercourse, or at least by 21 years of age. Once three or more annual tests have been normal, at the discretion of the physician, Pap tests can be performed less frequently, but at least once every three years.34-38 One Healthy People 2010 objective was to increase the preva-lence of women aged 18 years and older who received a Pap test within the preceding three years to 90%.33 In 2010, Michi-gan fell a bit short of this goal with only 77.7% of Michigan women aged 18 years and older had a Pap test within the previous three years. This prevalence increased with age from 68.8% of those aged 18-29 years of age to 93.3% of those aged 30-39 years and then declined to 52.6% of those aged 70 years and older. This prevalence also increased with increasing education and household income levels. The pro-portion of Michigan women aged 18 years and older who have received a Pap test in the past three years has generally re-mained consistent with the U.S. median for the past ten years. Another Healthy People 2010 objective is to increase the proportion of women aged 18 years and older who have ever received a Pap test to 97%.33 In 2010, Michigan once again fell a bit short of this goal with only 93.6% (92.0-95.0) of Michigan women aged 18 years and older reported ever having a Pap test. This proportion increased with age from 71.4% (63.8-77.9) of those aged 18-29 years to 99.0% (98.2-99.5) of those aged 60-69 years and then declined to 96.2% (95.0-97.1) of those aged 70 years and older.
Demographic Characteristics
Had Appropriately Timed Pap Test a
% 95% Confidence
Interval
Total 77.7 (75.9-79.3) Age
18 - 29 68.8 (61.3-75.4)
30 - 39 93.3 (90.0-95.5)
40 - 49 87.7 (84.8-90.2)
50 - 59 81.0 (78.2-83.4) 60 - 69 76.2 (73.3-78.8) 70 + 52.6 (49.6-55.6)
Race/Ethnicity White non-Hispanic 76.7 (74.7-78.5) Black non-Hispanic 85.4 (81.9-88.3) Other non-Hispanic 71.9 (60.8-80.9) Hispanic 87.7 (75.6-94.3)
Education < High school 64.5 (55.7-72.4) High school grad 68.3 (64.8-71.6)
Some college 79.0 (75.7-81.9)
College grad 87.1 (84.8-89.2)
Household Income < $20,000 69.1 (64.5-73.3) $20,000 - $34,999 71.4 (66.9-75.5) $35,000 - $49,999 75.8 (71.1-79.9) $50,000 - $74,999 84.2 (79.2-88.2) ≥ $75,000 91.1 (88.6-93.0)
Note: Data included diagnostic tests. a
Among women aged 18 years and older, the proportion who had a Pap test within the previous three years.
Had a Pap Test in the Past Three Years Among Women Aged 18 Years and Older
U.S. vs. Michigan, 2000-2010
70
80
90
100
'00 '02 '04 '06 '08 '10
%
U.S. median Michigan
2010 MiBRFS
Prostate Cancer Screening
15
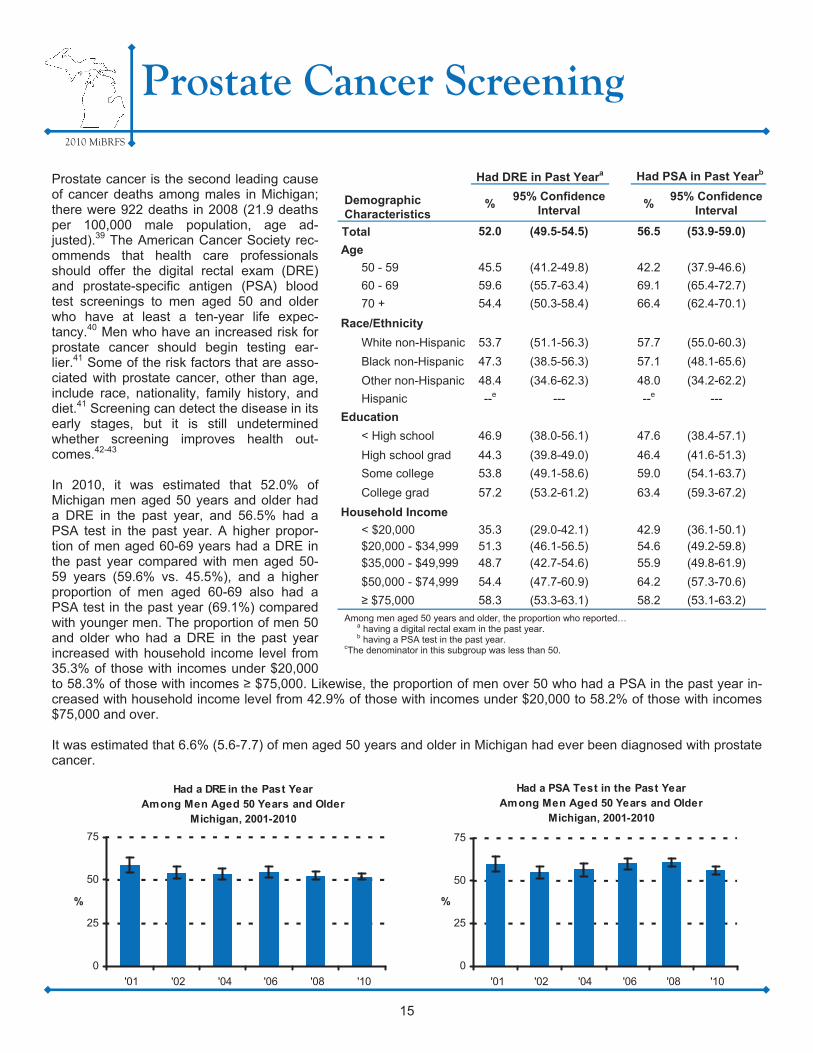
Prostate cancer is the second leading cause of cancer deaths among males in Michigan; there were 922 deaths in 2008 (21.9 deaths per 100,000 male population, age ad-justed).39 The American Cancer Society rec-ommends that health care professionals should offer the digital rectal exam (DRE) and prostate-specific antigen (PSA) blood test screenings to men aged 50 and older who have at least a ten-year life expec-tancy.40 Men who have an increased risk for prostate cancer should begin testing ear-lier.41 Some of the risk factors that are asso-ciated with prostate cancer, other than age, include race, nationality, family history, and diet.41 Screening can detect the disease in its early stages, but it is still undetermined whether screening improves health out-comes.42-43 In 2010, it was estimated that 52.0% of Michigan men aged 50 years and older had a DRE in the past year, and 56.5% had a PSA test in the past year. A higher propor-tion of men aged 60-69 years had a DRE in the past year compared with men aged 50-59 years (59.6% vs. 45.5%), and a higher proportion of men aged 60-69 also had a PSA test in the past year (69.1%) compared with younger men. The proportion of men 50 and older who had a DRE in the past year increased with household income level from 35.3% of those with incomes under $20,000 to 58.3% of those with incomes ≥ $75,000. Likewise, the proportion of men over 50 who had a PSA in the past year in-creased with household income level from 42.9% of those with incomes under $20,000 to 58.2% of those with incomes $75,000 and over. It was estimated that 6.6% (5.6-7.7) of men aged 50 years and older in Michigan had ever been diagnosed with prostate cancer.
Demographic Characteristics
Had DRE in Past Yeara Had PSA in Past Yearb
% 95% Confidence
Interval %
95% Confidence Interval
Total 52.0 (49.5-54.5) 56.5 (53.9-59.0)
Age
50 - 59 45.5 (41.2-49.8) 42.2 (37.9-46.6)
60 - 69 59.6 (55.7-63.4) 69.1 (65.4-72.7)
70 + 54.4 (50.3-58.4) 66.4 (62.4-70.1)
Race/Ethnicity
White non-Hispanic 53.7 (51.1-56.3) 57.7 (55.0-60.3)
Black non-Hispanic 47.3 (38.5-56.3) 57.1 (48.1-65.6)
Other non-Hispanic 48.4 (34.6-62.3) 48.0 (34.2-62.2)
Hispanic --e --- --e ---
Education
< High school 46.9 (38.0-56.1) 47.6 (38.4-57.1)
High school grad 44.3 (39.8-49.0) 46.4 (41.6-51.3)
Some college 53.8 (49.1-58.6) 59.0 (54.1-63.7)
College grad 57.2 (53.2-61.2) 63.4 (59.3-67.2)
Household Income
< $20,000 35.3 (29.0-42.1) 42.9 (36.1-50.1) $20,000 - $34,999 51.3 (46.1-56.5) 54.6 (49.2-59.8)
$35,000 - $49,999 48.7 (42.7-54.6) 55.9 (49.8-61.9)
$50,000 - $74,999 54.4 (47.7-60.9) 64.2 (57.3-70.6)
≥ $75,000 58.3 (53.3-63.1) 58.2 (53.1-63.2)
Among men aged 50 years and older, the proportion who reported… a having a digital rectal exam in the past year. b having a PSA test in the past year.
cThe denominator in this subgroup was less than 50.
0
25
50
75
'01 '02 '04 '06 '08 '10
%
Had a DRE in the Past Year Among Men Aged 50 Years and Older
Michigan, 2001-2010
0
25
50
75
'01 '02 '04 '06 '08 '10
%
Had a PSA Test in the Past Year Among Men Aged 50 Years and Older
Michigan, 2001-2010
2010 MiBRFS
Colorectal Cancer Screening
16
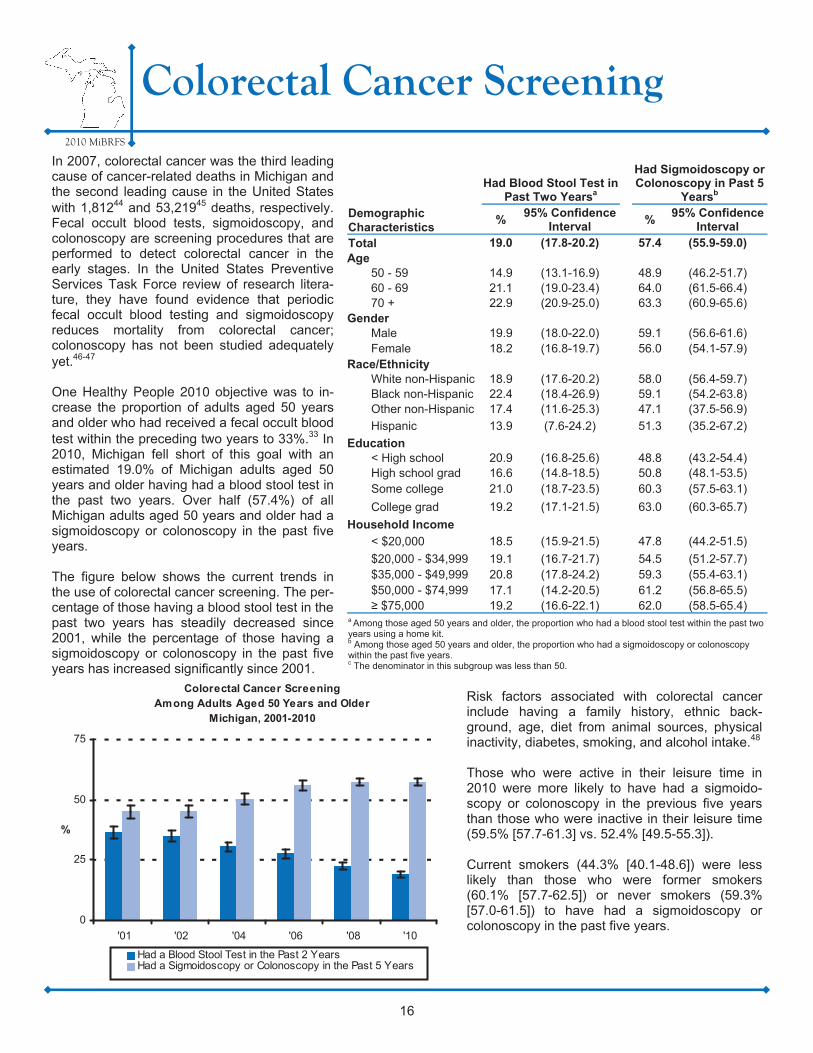
In 2007, colorectal cancer was the third leading cause of cancer-related deaths in Michigan and the second leading cause in the United States with 1,81244 and 53,21945 deaths, respectively. Fecal occult blood tests, sigmoidoscopy, and colonoscopy are screening procedures that are performed to detect colorectal cancer in the early stages. In the United States Preventive Services Task Force review of research litera-ture, they have found evidence that periodic fecal occult blood testing and sigmoidoscopy reduces mortality from colorectal cancer; colonoscopy has not been studied adequately yet.46-47 One Healthy People 2010 objective was to in-crease the proportion of adults aged 50 years and older who had received a fecal occult blood test within the preceding two years to 33%.33 In 2010, Michigan fell short of this goal with an estimated 19.0% of Michigan adults aged 50 years and older having had a blood stool test in the past two years. Over half (57.4%) of all Michigan adults aged 50 years and older had a sigmoidoscopy or colonoscopy in the past five years. The figure below shows the current trends in the use of colorectal cancer screening. The per-centage of those having a blood stool test in the past two years has steadily decreased since 2001, while the percentage of those having a sigmoidoscopy or colonoscopy in the past five years has increased significantly since 2001.
Risk factors associated with colorectal cancer include having a family history, ethnic back-ground, age, diet from animal sources, physical inactivity, diabetes, smoking, and alcohol intake.48 Those who were active in their leisure time in 2010 were more likely to have had a sigmoido-scopy or colonoscopy in the previous five years than those who were inactive in their leisure time (59.5% [57.7-61.3] vs. 52.4% [49.5-55.3]). Current smokers (44.3% [40.1-48.6]) were less likely than those who were former smokers (60.1% [57.7-62.5]) or never smokers (59.3% [57.0-61.5]) to have had a sigmoidoscopy or colonoscopy in the past five years.
Demographic Characteristics
Had Blood Stool Test in Past Two Yearsa
Had Sigmoidoscopy or Colonoscopy in Past 5
Yearsb
% 95% Confidence
Interval % 95% Confidence
Interval Total 19.0 (17.8-20.2) 57.4 (55.9-59.0) Age
50 - 59 14.9 (13.1-16.9) 48.9 (46.2-51.7) 60 - 69 21.1 (19.0-23.4) 64.0 (61.5-66.4) 70 + 22.9 (20.9-25.0) 63.3 (60.9-65.6)
Gender Male 19.9 (18.0-22.0) 59.1 (56.6-61.6) Female 18.2 (16.8-19.7) 56.0 (54.1-57.9)
Race/Ethnicity White non-Hispanic 18.9 (17.6-20.2) 58.0 (56.4-59.7) Black non-Hispanic 22.4 (18.4-26.9) 59.1 (54.2-63.8) Other non-Hispanic 17.4 (11.6-25.3) 47.1 (37.5-56.9)
Education < High school 20.9 (16.8-25.6) 48.8 (43.2-54.4) High school grad 16.6 (14.8-18.5) 50.8 (48.1-53.5) Some college 21.0 (18.7-23.5) 60.3 (57.5-63.1)
College grad 19.2 (17.1-21.5) 63.0 (60.3-65.7)
Household Income
< $20,000 18.5 (15.9-21.5) 47.8 (44.2-51.5)
$20,000 - $34,999 19.1 (16.7-21.7) 54.5 (51.2-57.7) $35,000 - $49,999 20.8 (17.8-24.2) 59.3 (55.4-63.1) $50,000 - $74,999 17.1 (14.2-20.5) 61.2 (56.8-65.5) ≥ $75,000 19.2 (16.6-22.1) 62.0 (58.5-65.4)
a Among those aged 50 years and older, the proportion who had a blood stool test within the past two years using a home kit. b Among those aged 50 years and older, the proportion who had a sigmoidoscopy or colonoscopy within the past five years. c The denominator in this subgroup was less than 50.
Hispanic 13.9 (7.6-24.2) 51.3 (35.2-67.2)
0
25
50
75
'01 '02 '04 '06 '08 '10
%
Had a Blood Stool Test in the Past 2 YearsHad a Sigmoidoscopy or Colonoscopy in the Past 5 Years
Colorectal Cancer Screening Among Adults Aged 50 Years and Older
Michigan, 2001-2010
2010 MiBRFS
Oral Health
17
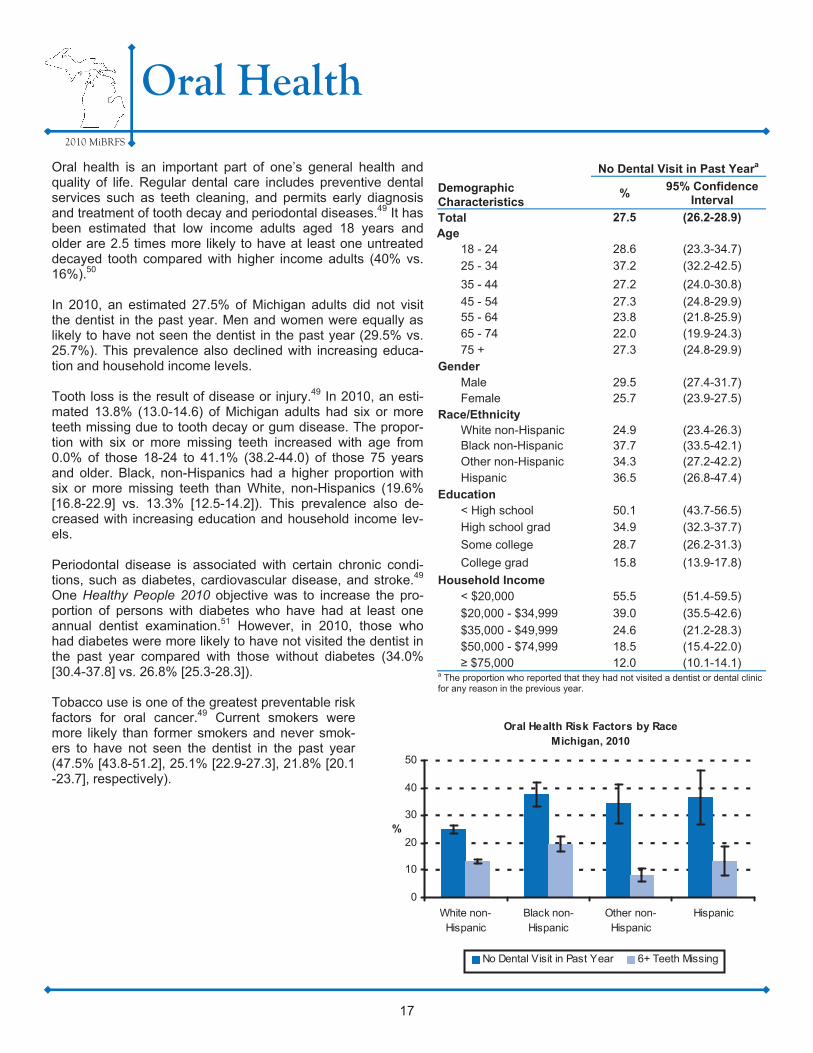
Oral health is an important part of one’s general health and quality of life. Regular dental care includes preventive dental services such as teeth cleaning, and permits early diagnosis and treatment of tooth decay and periodontal diseases.49 It has been estimated that low income adults aged 18 years and older are 2.5 times more likely to have at least one untreated decayed tooth compared with higher income adults (40% vs. 16%).50 In 2010, an estimated 27.5% of Michigan adults did not visit the dentist in the past year. Men and women were equally as likely to have not seen the dentist in the past year (29.5% vs. 25.7%). This prevalence also declined with increasing educa-tion and household income levels. Tooth loss is the result of disease or injury.49 In 2010, an esti-mated 13.8% (13.0-14.6) of Michigan adults had six or more teeth missing due to tooth decay or gum disease. The propor-tion with six or more missing teeth increased with age from 0.0% of those 18-24 to 41.1% (38.2-44.0) of those 75 years and older. Black, non-Hispanics had a higher proportion with six or more missing teeth than White, non-Hispanics (19.6% [16.8-22.9] vs. 13.3% [12.5-14.2]). This prevalence also de-creased with increasing education and household income lev-els. Periodontal disease is associated with certain chronic condi-tions, such as diabetes, cardiovascular disease, and stroke.49 One Healthy People 2010 objective was to increase the pro-portion of persons with diabetes who have had at least one annual dentist examination.51 However, in 2010, those who had diabetes were more likely to have not visited the dentist in the past year compared with those without diabetes (34.0% [30.4-37.8] vs. 26.8% [25.3-28.3]). Tobacco use is one of the greatest preventable risk factors for oral cancer.49 Current smokers were more likely than former smokers and never smok-ers to have not seen the dentist in the past year (47.5% [43.8-51.2], 25.1% [22.9-27.3], 21.8% [20.1-23.7], respectively).
Demographic Characteristics
No Dental Visit in Past Yeara
% 95% Confidence Interval
Total 27.5 (26.2-28.9) Age
18 - 24 28.6 (23.3-34.7)
25 - 34 37.2 (32.2-42.5)
35 - 44 27.2 (24.0-30.8)
45 - 54 27.3 (24.8-29.9) 55 - 64 23.8 (21.8-25.9) 65 - 74 22.0 (19.9-24.3) 75 + 27.3 (24.8-29.9)
Gender Male 29.5 (27.4-31.7) Female 25.7 (23.9-27.5)
Race/Ethnicity White non-Hispanic 24.9 (23.4-26.3) Black non-Hispanic 37.7 (33.5-42.1) Other non-Hispanic 34.3 (27.2-42.2)
Education < High school 50.1 (43.7-56.5)
High school grad 34.9 (32.3-37.7)
Some college 28.7 (26.2-31.3)
College grad 15.8 (13.9-17.8)
Household Income < $20,000 55.5 (51.4-59.5)
$20,000 - $34,999 39.0 (35.5-42.6)
$35,000 - $49,999 24.6 (21.2-28.3) $50,000 - $74,999 18.5 (15.4-22.0) ≥ $75,000 12.0 (10.1-14.1)
a The proportion who reported that they had not visited a dentist or dental clinic for any reason in the previous year.
Hispanic 36.5 (26.8-47.4)
Oral Health Risk Factors by Race Michigan, 2010
0
10
20
30
40
50
White non-Hispanic
Black non-Hispanic
Other non-Hispanic
Hispanic
%
No Dental Visit in Past Year 6+ Teeth Missing

2010 MiBRFS
Adult Immunizations
Adult immunizations against influenza and pneumococcal disease are important health indicators that need to be routinely monitored since morbidity and mortality are associated with both of these dis-eases among different demographic groups.52-53 Influenza and pneumococcal infections cause an estimated 36,000 and 40,000 deaths each year, respectively. In addition, deaths from pneumococcal in-fection account for more deaths than any other vaccine-preventable bacterial dis-ease. Approximately half of these deaths could potentially be prevented through the use of the pneumococcal vaccine.52, 54 One Healthy People 2010 objective was to ensure that 90% of adults aged 65 years and older were vaccinated annually against influenza and ever vaccinated against pneumococcal disease.55 Results from the 2010 MiBRFS indicate that 67.5% of Michigan adults aged 65 years and older were immunized against influ-enza in the past year, 67.8% had ever received a pneumococcal vaccination, and 53.9% (51.8-55.9) had received both. Although both the prevalence of current flu vaccination and the prevalence of ever receiving the pneumonia vaccine have increased significantly since 2001, the 2010 prevalence still fell short of the Healthy People 2010 goal. Another Healthy People 2010 objective was to increase the vaccination rate to 60% among those aged 18-64 years who have chronic health conditions such as diabetes and asthma.55 Among those aged 18-64 years in Michigan, an esti-mated 52.9% (47.1-58.5) of those who had diabetes had an influenza vaccina-tion in the past year compared with 29.9% (28.2-31.5) of those who did not have diabetes. Those who had current asthma in this age group were also more likely to have had an influenza vaccina-tion than those who did not have asthma (38.4% [33.4-43.6] vs. 30.9% [29.2-32.6]).
18
Demographic Characteristics
Had Flu Vaccine in Past Yeara
Ever Had Pneumonia Vaccineb
% 95% Confidence Interval % 95% Confidence
Interval Total 67.5 (65.6-69.3) 67.8 (35.8-69.6) Age
65 - 74 63.7 (61.0-66.2) 60.5 (57.8-63.2) 75 + 72.0 (69.3-74.5) 76.0 (73.4-78.4)
Gender Male 67.6 (64.5-70.6) 63.7 (60.4-66.8) Female 67.4 (65.1-69.7) 70.7 (68.4-72.9)
Race/Ethnicity White non-Hispanic 69.3 (67.3-71.3) 68.8 (66.7-70.8) Black non-Hispanic 54.8 (48.5-60.8) 56.2 (49.7-62.4) Other non-Hispanic 63.8 (50.5-75.4) 75.1 (62.4-84.6) Hispanic --c --- --c ---
Education < High school 58.0 (51.8-64.0) 62.6 (56.5-68.3) High school grad 68.8 (65.8-71.7) 69.8 (66.8-72.7) Some college 65.0 (61.0-68.7) 67.8 (63.7-71.5) College grad 71.4 (67.8-74.8) 66.7 (62.8-70.3)
Household Income < $20,000 64.5 (60.2-68.7) 67.4 (63.0-71.5) $20,000 - $34,999 65.9 (62.2-69.3) 68.1 (64.4-71.6) $35,000 - $49,999 66.6 (61.7-71.3) 69.9 (65.0-74.3) $50,000 - $74,999 73.8 (68.0-78.9) 72.6 (66.6-77.8) ≥ $75,000 71.5 (65.3-77.1) 59.4 (52.7-65.8)
a Among those aged 65 years and older, the proportion who reported that they had a flu vaccine, either by an injection in the arm or sprayed in the nose during the past 12 months. b Among those aged 65 years and older, the proportion who reported that they ever had a pneumo-coccal vaccine. c The denominator in this subgroup was less than 50.
Ever Had a Pneumococcal Vaccination Among Adults Aged 65 and Older
U.S. vs. Michigan, 2001-2010
30
40
50
60
70
'01 '02 '03 '04 '05 '06 '07 '08 '09 '10
%
U.S. median Michigan

2010 MiBRFS
HIV Testing
It is estimated that 19,500 people are living with HIV/AIDS in Michigan, 4,700 of whom do not know that they are infected.56 Early awareness of an HIV infection through HIV testing can prevent further spread of the disease, and an early start on antiretroviral therapy can increase the quality of life among those who are living with HIV/AIDS.57
In 2010, an estimated 38.0% of Michigan adults aged 18-64 years had ever been tested for HIV, apart from blood dona-tions. The prevalence of HIV testing decreased with age from 53.9% among those aged 25-34 years to 20.4% among those aged 55-64 years. Women were more likely than men (42.0% vs. 34.1%) to have ever been tested and Black, non-Hispanics were more likely than White, non-Hispanics (64.4% vs. 33.2%). Since 2001, the lifetime prevalence of HIV testing in Michigan among adults aged 18-64 years has decreased 18.8% (from 46.8% to 38.0%). The most frequently reported places where Michigan adults had their last HIV test were at a private doctor or HMO office (47.6% [44.6-50.5]), at a clinic (22.6% [20.1-25.3]), and at a hospital (16.1% [14.2-18.3]). Rapid HIV antibody tests provide results within a couple of hours. Of those tested for HIV in the past 12 months, 25.9% (20.6-31.9) reported that a rapid test was used, and 74.1% (68.1-79.4) reported that a conventional test was used.
Demographic Characteristics
Ever Had an HIV Testa
% 95% Confidence Interval
Total 38.0 (36.3-39.8) Age
18 - 24 25.4 (20.4-31.2) 25 - 34 53.9 (48.5-59.2) 35 - 44 53.0 (49.2-56.7) 45 - 54 33.9 (31.2-36.7) 55 - 64 20.4 (18.5-22.5)
Gender Male 34.1 (31.5-36.7) Female 42.0 (39.6-44.3)
Race/Ethnicity White non-Hispanic 33.2 (31.4-35.1) Black non-Hispanic 64.4 (59.4-69.1) Other non-Hispanic 40.7 (32.7-49.3) Hispanic 49.6 (37.5-61.7)
Education < High school 34.8 (27.1-43.4)
High school grad 35.1 (31.8-38.6)
Some college 39.7 (36.5-43.0)
College grad 39.4 (36.6-42.2)
Household Income < $20,000 48.4 (43.4-53.5) $20,000 - $34,999 38.2 (33.8-42.9) $35,000 - $49,999 37.3 (32.6-42.4) $50,000 - $74,999 34.5 (30.5-38.8) ≥ $75,000 38.6 (35.5-41.8)
a Among those aged 18-64 years the proportion who reported that they ever had been tested for HIV, apart from tests that were part of a blood donation.
19
Ever Tested for HIV Among Adults Aged 18-64 Years
Michigan, 2001-2010
0
20
40
60
'01 '02 '03 '04 '05 '06 '07 '08 '09 '10
%
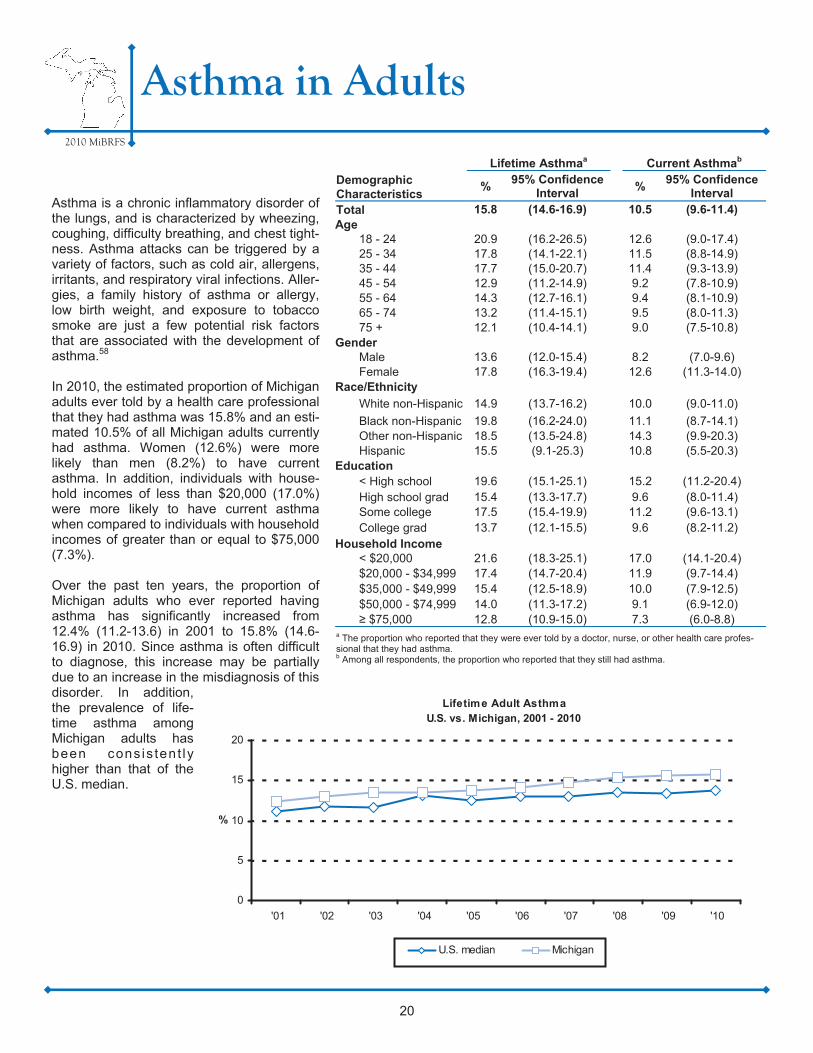
2010 MiBRFS
Asthma in Adults
Asthma is a chronic inflammatory disorder of the lungs, and is characterized by wheezing, coughing, difficulty breathing, and chest tight-ness. Asthma attacks can be triggered by a variety of factors, such as cold air, allergens, irritants, and respiratory viral infections. Aller-gies, a family history of asthma or allergy, low birth weight, and exposure to tobacco smoke are just a few potential risk factors that are associated with the development of asthma.58
In 2010, the estimated proportion of Michigan adults ever told by a health care professional that they had asthma was 15.8% and an esti-mated 10.5% of all Michigan adults currently had asthma. Women (12.6%) were more likely than men (8.2%) to have current asthma. In addition, individuals with house-hold incomes of less than $20,000 (17.0%) were more likely to have current asthma when compared to individuals with household incomes of greater than or equal to $75,000 (7.3%). Over the past ten years, the proportion of Michigan adults who ever reported having asthma has significantly increased from 12.4% (11.2-13.6) in 2001 to 15.8% (14.6-16.9) in 2010. Since asthma is often difficult to diagnose, this increase may be partially due to an increase in the misdiagnosis of this disorder. In addition, the prevalence of life-time asthma among Michigan adults has been cons is tent ly higher than that of the U.S. median.
Demographic Characteristics
Lifetime Asthmaa Current Asthmab
% 95% Confidence Interval % 95% Confidence
Interval Total 15.8 (14.6-16.9) 10.5 (9.6-11.4) Age
18 - 24 20.9 (16.2-26.5) 12.6 (9.0-17.4) 25 - 34 17.8 (14.1-22.1) 11.5 (8.8-14.9) 35 - 44 17.7 (15.0-20.7) 11.4 (9.3-13.9) 45 - 54 12.9 (11.2-14.9) 9.2 (7.8-10.9) 55 - 64 14.3 (12.7-16.1) 9.4 (8.1-10.9) 65 - 74 13.2 (11.4-15.1) 9.5 (8.0-11.3) 75 + 12.1 (10.4-14.1) 9.0 (7.5-10.8)
Gender Male 13.6 (12.0-15.4) 8.2 (7.0-9.6) Female 17.8 (16.3-19.4) 12.6 (11.3-14.0)
Race/Ethnicity
White non-Hispanic 14.9 (13.7-16.2) 10.0 (9.0-11.0)
Black non-Hispanic 19.8 (16.2-24.0) 11.1 (8.7-14.1) Other non-Hispanic 18.5 (13.5-24.8) 14.3 (9.9-20.3)
Education < High school 19.6 (15.1-25.1) 15.2 (11.2-20.4) High school grad 15.4 (13.3-17.7) 9.6 (8.0-11.4) Some college 17.5 (15.4-19.9) 11.2 (9.6-13.1) College grad 13.7 (12.1-15.5) 9.6 (8.2-11.2)
Household Income < $20,000 21.6 (18.3-25.1) 17.0 (14.1-20.4) $20,000 - $34,999 17.4 (14.7-20.4) 11.9 (9.7-14.4) $35,000 - $49,999 15.4 (12.5-18.9) 10.0 (7.9-12.5) $50,000 - $74,999 14.0 (11.3-17.2) 9.1 (6.9-12.0) ≥ $75,000 12.8 (10.9-15.0) 7.3 (6.0-8.8)
a The proportion who reported that they were ever told by a doctor, nurse, or other health care profes-sional that they had asthma. b Among all respondents, the proportion who reported that they still had asthma.
Hispanic 15.5 (9.1-25.3) 10.8 (5.5-20.3)
20
Lifetime Adult Asthma U.S. vs. Michigan, 2001 - 2010
0
5
10
15
20
'01 '02 '03 '04 '05 '06 '07 '08 '09 '10
%
U.S. median Michigan
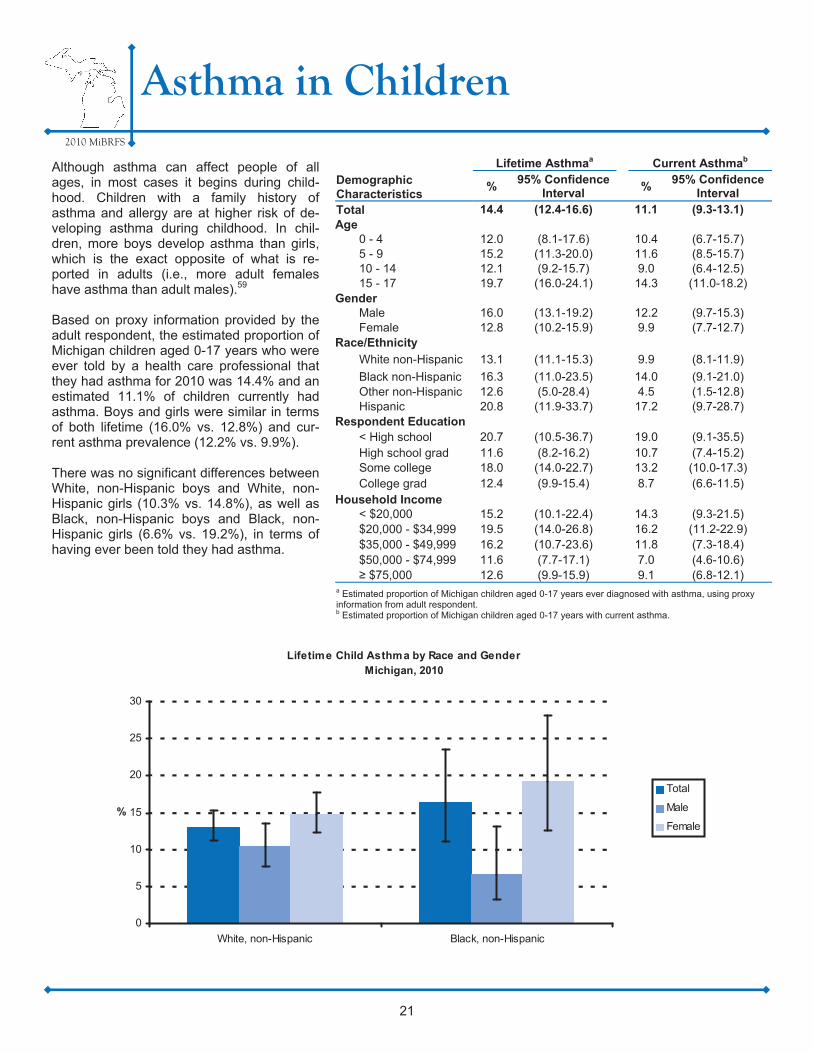
2010 MiBRFS
Asthma in Children
Although asthma can affect people of all ages, in most cases it begins during child-hood. Children with a family history of asthma and allergy are at higher risk of de-veloping asthma during childhood. In chil-dren, more boys develop asthma than girls, which is the exact opposite of what is re-ported in adults (i.e., more adult females have asthma than adult males).59
Based on proxy information provided by the adult respondent, the estimated proportion of Michigan children aged 0-17 years who were ever told by a health care professional that they had asthma for 2010 was 14.4% and an estimated 11.1% of children currently had asthma. Boys and girls were similar in terms of both lifetime (16.0% vs. 12.8%) and cur-rent asthma prevalence (12.2% vs. 9.9%). There was no significant differences between White, non-Hispanic boys and White, non-Hispanic girls (10.3% vs. 14.8%), as well as Black, non-Hispanic boys and Black, non-Hispanic girls (6.6% vs. 19.2%), in terms of having ever been told they had asthma.
Demographic Characteristics
Lifetime Asthmaa Current Asthmab
% 95% Confidence Interval % 95% Confidence
Interval Total 14.4 (12.4-16.6) 11.1 (9.3-13.1) Age
0 - 4 12.0 (8.1-17.6) 10.4 (6.7-15.7) 5 - 9 15.2 (11.3-20.0) 11.6 (8.5-15.7) 10 - 14 12.1 (9.2-15.7) 9.0 (6.4-12.5) 15 - 17 19.7 (16.0-24.1) 14.3 (11.0-18.2)
Gender Male 16.0 (13.1-19.2) 12.2 (9.7-15.3) Female 12.8 (10.2-15.9) 9.9 (7.7-12.7)
Race/Ethnicity
White non-Hispanic 13.1 (11.1-15.3) 9.9 (8.1-11.9)
Black non-Hispanic 16.3 (11.0-23.5) 14.0 (9.1-21.0) Other non-Hispanic 12.6 (5.0-28.4) 4.5 (1.5-12.8) Hispanic 20.8 (11.9-33.7) 17.2 (9.7-28.7)
Respondent Education < High school 20.7 (10.5-36.7) 19.0 (9.1-35.5) High school grad 11.6 (8.2-16.2) 10.7 (7.4-15.2) Some college 18.0 (14.0-22.7) 13.2 (10.0-17.3) College grad 12.4 (9.9-15.4) 8.7 (6.6-11.5)
Household Income < $20,000 15.2 (10.1-22.4) 14.3 (9.3-21.5) $20,000 - $34,999 19.5 (14.0-26.8) 16.2 (11.2-22.9) $35,000 - $49,999 16.2 (10.7-23.6) 11.8 (7.3-18.4) $50,000 - $74,999 11.6 (7.7-17.1) 7.0 (4.6-10.6) ≥ $75,000 12.6 (9.9-15.9) 9.1 (6.8-12.1)
a Estimated proportion of Michigan children aged 0-17 years ever diagnosed with asthma, using proxy information from adult respondent. b Estimated proportion of Michigan children aged 0-17 years with current asthma.
21
Lifetime Child Asthma by Race and GenderMichigan, 2010
0
5
10
15
20
25
30
White, non-Hispanic Black, non-Hispanic
%
Total
Male
Female
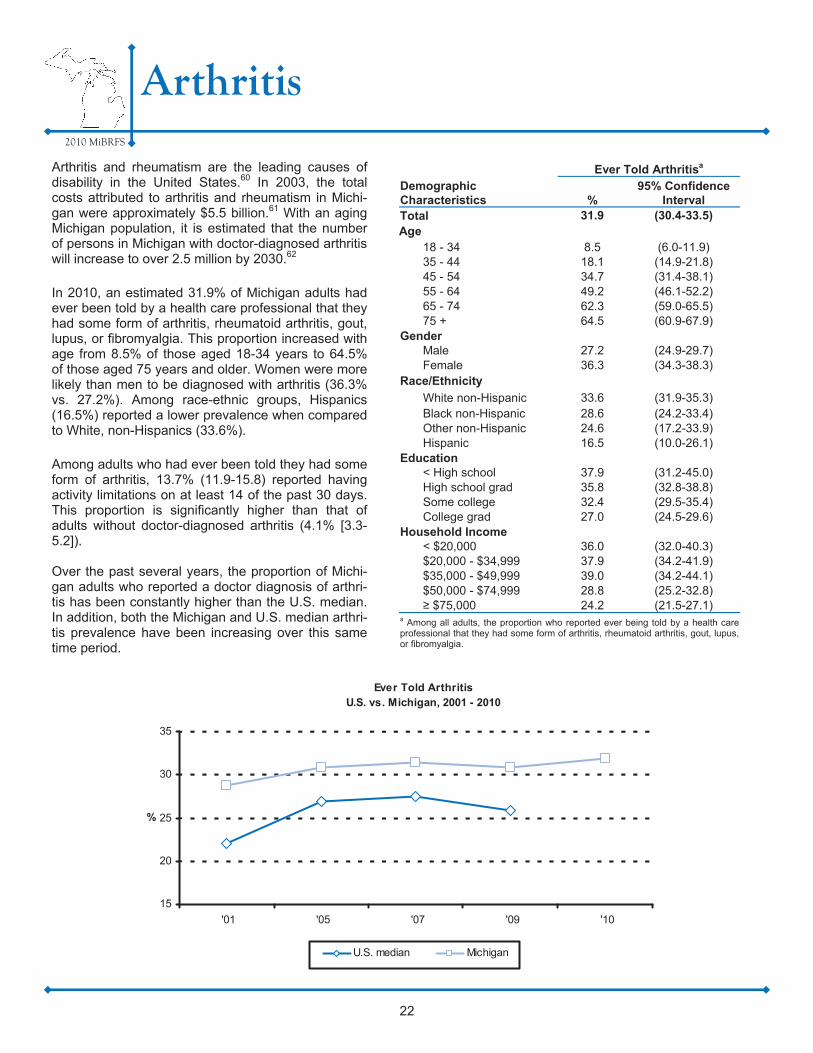
2010 MiBRFS
Arthritis
Arthritis and rheumatism are the leading causes of disability in the United States.60 In 2003, the total costs attributed to arthritis and rheumatism in Michi-gan were approximately $5.5 billion.61 With an aging Michigan population, it is estimated that the number of persons in Michigan with doctor-diagnosed arthritis will increase to over 2.5 million by 2030.62
In 2010, an estimated 31.9% of Michigan adults had ever been told by a health care professional that they had some form of arthritis, rheumatoid arthritis, gout, lupus, or fibromyalgia. This proportion increased with age from 8.5% of those aged 18-34 years to 64.5% of those aged 75 years and older. Women were more likely than men to be diagnosed with arthritis (36.3% vs. 27.2%). Among race-ethnic groups, Hispanics (16.5%) reported a lower prevalence when compared to White, non-Hispanics (33.6%).
Among adults who had ever been told they had some form of arthritis, 13.7% (11.9-15.8) reported having activity limitations on at least 14 of the past 30 days. This proportion is significantly higher than that of adults without doctor-diagnosed arthritis (4.1% [3.3-5.2]). Over the past several years, the proportion of Michi-gan adults who reported a doctor diagnosis of arthri-tis has been constantly higher than the U.S. median. In addition, both the Michigan and U.S. median arthri-tis prevalence have been increasing over this same time period.
22
Demographic Characteristics
Ever Told Arthritisa
% 95% Confidence
Interval Total 31.9 (30.4-33.5) Age
18 - 34 8.5 (6.0-11.9) 35 - 44 18.1 (14.9-21.8) 45 - 54 34.7 (31.4-38.1) 55 - 64 49.2 (46.1-52.2) 65 - 74 62.3 (59.0-65.5) 75 + 64.5 (60.9-67.9)
Gender Male 27.2 (24.9-29.7) Female 36.3 (34.3-38.3)
Race/Ethnicity
White non-Hispanic 33.6 (31.9-35.3) Black non-Hispanic 28.6 (24.2-33.4) Other non-Hispanic 24.6 (17.2-33.9) Hispanic 16.5 (10.0-26.1)
Education < High school 37.9 (31.2-45.0) High school grad 35.8 (32.8-38.8) Some college 32.4 (29.5-35.4) College grad 27.0 (24.5-29.6)
Household Income < $20,000 36.0 (32.0-40.3) $20,000 - $34,999 37.9 (34.2-41.9) $35,000 - $49,999 39.0 (34.2-44.1) $50,000 - $74,999 28.8 (25.2-32.8) ≥ $75,000 24.2 (21.5-27.1)
a Among all adults, the proportion who reported ever being told by a health care professional that they had some form of arthritis, rheumatoid arthritis, gout, lupus, or fibromyalgia.
Ever Told Arthritis U.S. vs. Michigan, 2001 - 2010
15
20
25
30
35
'01 '05 '07 '09 '10
%
U.S. median Michigan
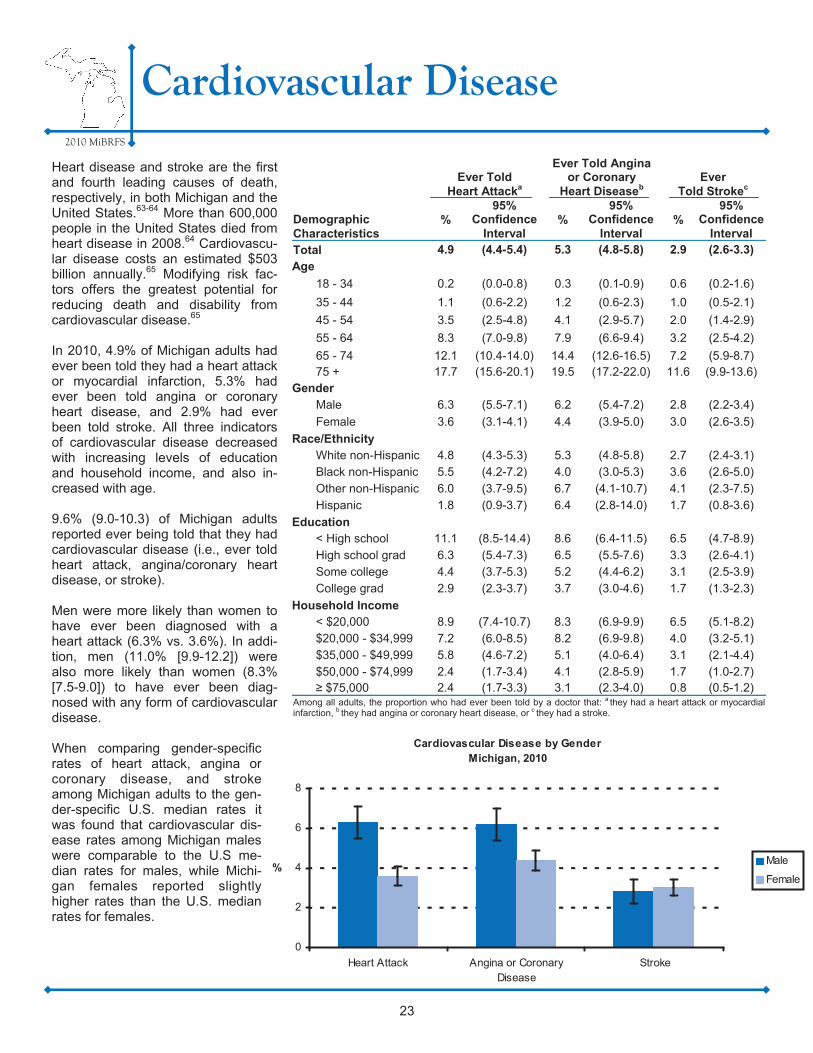
2010 MiBRFS
Cardiovascular Disease
Demographic Characteristics
Ever Told Heart Attacka
Ever Told Angina or Coronary
Heart Diseaseb Ever
Told Strokec
% 95%
Confidence Interval
% 95%
Confidence Interval
% 95%
Confidence Interval
Total 4.9 (4.4-5.4) 5.3 (4.8-5.8) 2.9 (2.6-3.3)
Age
18 - 34 0.2 (0.0-0.8) 0.3 (0.1-0.9) 0.6 (0.2-1.6)
35 - 44 1.1 (0.6-2.2) 1.2 (0.6-2.3) 1.0 (0.5-2.1)
45 - 54 3.5 (2.5-4.8) 4.1 (2.9-5.7) 2.0 (1.4-2.9)
55 - 64 8.3 (7.0-9.8) 7.9 (6.6-9.4) 3.2 (2.5-4.2)
65 - 74 12.1 (10.4-14.0) 14.4 (12.6-16.5) 7.2 (5.9-8.7) 75 + 17.7 (15.6-20.1) 19.5 (17.2-22.0) 11.6 (9.9-13.6)
Gender
Male 6.3 (5.5-7.1) 6.2 (5.4-7.2) 2.8 (2.2-3.4)
Female 3.6 (3.1-4.1) 4.4 (3.9-5.0) 3.0 (2.6-3.5)
Race/Ethnicity
White non-Hispanic 4.8 (4.3-5.3) 5.3 (4.8-5.8) 2.7 (2.4-3.1) Black non-Hispanic 5.5 (4.2-7.2) 4.0 (3.0-5.3) 3.6 (2.6-5.0) Other non-Hispanic 6.0 (3.7-9.5) 6.7 (4.1-10.7) 4.1 (2.3-7.5) Hispanic 1.8 (0.9-3.7) 6.4 (2.8-14.0) 1.7 (0.8-3.6)
Education < High school 11.1 (8.5-14.4) 8.6 (6.4-11.5) 6.5 (4.7-8.9) High school grad 6.3 (5.4-7.3) 6.5 (5.5-7.6) 3.3 (2.6-4.1) Some college 4.4 (3.7-5.3) 5.2 (4.4-6.2) 3.1 (2.5-3.9) College grad 2.9 (2.3-3.7) 3.7 (3.0-4.6) 1.7 (1.3-2.3)
Household Income < $20,000 8.9 (7.4-10.7) 8.3 (6.9-9.9) 6.5 (5.1-8.2) $20,000 - $34,999 7.2 (6.0-8.5) 8.2 (6.9-9.8) 4.0 (3.2-5.1) $35,000 - $49,999 5.8 (4.6-7.2) 5.1 (4.0-6.4) 3.1 (2.1-4.4) $50,000 - $74,999 2.4 (1.7-3.4) 4.1 (2.8-5.9) 1.7 (1.0-2.7) ≥ $75,000 2.4 (1.7-3.3) 3.1 (2.3-4.0) 0.8 (0.5-1.2)
Among all adults, the proportion who had ever been told by a doctor that: a they had a heart attack or myocardial infarction, b they had angina or coronary heart disease, or c they had a stroke.
Heart disease and stroke are the first and fourth leading causes of death, respectively, in both Michigan and the United States.63-64 More than 600,000 people in the United States died from heart disease in 2008.64 Cardiovascu-lar disease costs an estimated $503 billion annually.65 Modifying risk fac-tors offers the greatest potential for reducing death and disability from cardiovascular disease.65 In 2010, 4.9% of Michigan adults had ever been told they had a heart attack or myocardial infarction, 5.3% had ever been told angina or coronary heart disease, and 2.9% had ever been told stroke. All three indicators of cardiovascular disease decreased with increasing levels of education and household income, and also in-creased with age. 9.6% (9.0-10.3) of Michigan adults reported ever being told that they had cardiovascular disease (i.e., ever told heart attack, angina/coronary heart disease, or stroke). Men were more likely than women to have ever been diagnosed with a heart attack (6.3% vs. 3.6%). In addi-tion, men (11.0% [9.9-12.2]) were also more likely than women (8.3% [7.5-9.0]) to have ever been diag-nosed with any form of cardiovascular disease. When comparing gender-specific rates of heart attack, angina or coronary disease, and stroke among Michigan adults to the gen-der-specific U.S. median rates it was found that cardiovascular dis-ease rates among Michigan males were comparable to the U.S me-dian rates for males, while Michi-gan females reported slightly higher rates than the U.S. median rates for females.
23
Cardiovascular Disease by GenderMichigan, 2010
0
2
4
6
8
Heart Attack Angina or CoronaryDisease
Stroke
%Male
Female

2010 MiBRFS
Diabetes
Diabetes mellitus is a chronic disease characterized by high glucose levels, owing to insufficient production of insulin by the pancreas or to a reduction in the body’s ability to use in-sulin. In Michigan, diabetes was the sixth leading cause of death with 2,689 individuals in 2009 and was considered the primary cause in approximately three percent of all deaths.64 Obesity, poor diet, physical inactivity, and high blood pres-sure are just a few risk factors that are associated with the development of diabetes.66
In 2010, an estimated 10.1% of Michigan adults had ever been told by a health care professional that they have diabe-tes. This proportion increased with age from 0.7% of those aged 18-24 years to 21.5% of those aged 65-74 years. The proportion of those who had diabetes declined with increas-ing education and household income level. Black, non-Hispanics were more likely than White, non-Hispanics to have ever been told by a health care professional that they had diabetes (15.9% vs. 9.2%). In Michigan, there has been an increase in the prevalence of diabetes between 2001 and 2010 from 7.2% to 10.1%. Michi-gan’s diabetes prevalence estimate has been consistently higher than the U.S. median throughout this entire time pe-riod. Michigan adults who were obese were over two times as likely as those who were overweight and over four times as likely as those who were not overweight or obese to have diabetes in 2010 (18.3% [16.5-20.2], 8.2% [7.2-9.5], 4.4% [3.6-5.5], respectively). In addition, Michigan adults with a disability were nearly three times as likely to have ever been told they had diabetes when compared to non-disabled indi-viduals (19.8% [17.8-21.9] vs. 7.0% [6.3-7.8]).
Demographic Characteristics
Ever Told Diabetes a
% 95% Confidence
Interval
Total 10.1 (9.4-10.9) Age
18 - 24 0.7 (0.2-2.2) 25 - 34 3.9 (2.0-7.6)
35 - 44 5.8 (4.2-7.9)
45 - 54 9.8 (8.3-11.6) 55 - 64 16.6 (14.8-18.5) 65 - 74 21.5 (19.3-23.8) 75 + 20.8 (18.5-23.4)
Gender Male 11.4 (10.1-12.7) Female 9.0 (8.1-9.9)
Race/Ethnicity White non-Hispanic 9.2 (8.4-10.0) Black non-Hispanic 15.9 (13.3-19.0) Other non-Hispanic 11.3 (7.8-16.0)
Education < High school 11.2 (8.8-14.3) High school grad 13.0 (11.5-14.6)
Some college 10.8 (9.3-12.5)
College grad 6.8 (5.9-7.9)
Household Income < $20,000 15.3 (12.9-17.9) $20,000 - $34,999 12.9 (11.1-15.0) $35,000 - $49,999 10.8 (9.1-12.8) $50,000 - $74,999 8.5 (6.9-10.4) ≥ $75,000 6.2 (4.8-7.9)
a The proportion who reported that they were ever told by a doctor that they have diabetes. Adults who had been told they have prediabetes and women who had diabetes only during pregnancy were classified as not having been diagnosed.
Hispanic 9.2 (5.5-15.2)
24
Diabetes U.S. vs. Michigan, 2001-2010
0
2
4
6
8
10
12
'01 '02 '03 '04 '05 '06 '07 '08 '09 '10
%
U.S. median Michigan

2010 MiBRFS
Depression
Major depression is a common and treatable mental disorder. Current major depression is determined based on responses to the Patient Health Questionnaire 8 (PHQ-8), which covers eight of the nine criteria from the Diagnostic and Statistical Manual of Mental Disorders, Fourth Edition (DSM-IV) for di-agnosis of major depressive disorder.67-68 In 2010, an estimated 9.4% of Michigan adults were classi-fied as having major depression. This proportion decreased with age from 13.6% of those aged 18-24 years to 4.3% of those aged 75 years and older. Men and women were equally as likely to be classified with major depression (8.0% vs. 10.8%), and the prevalence of major depression de-creased significantly with increasing education and house-hold income level.
When comparing Michigan adults with and without major de-pression, those classified with major depression were signifi-cantly more likely to be smokers (38.6% [32.5-45.1] vs. 17.2% [15.7-18.8]). Furthermore, individuals with and without major depression reported similar alcohol consumption pat-terns.
There was no significant differences between White, non-Hispanic men and women (7.6% vs. 10.3%), as well as Black, non-Hispanic men and women (7.1% vs. 14.6%), in terms of being classified with major depression.
Demographic Characteristics
Major Depressiona
% 95% Confidence
Interval
Total 9.4 (8.3-10.6) Age
18 - 24 13.6 (8.9-20.2) 25 - 34 10.5 (7.1-15.1)
35 - 44 11.0 (8.6-14.0)
45 - 54 9.4 (7.6-11.6) 55 - 64 8.9 (7.3-10.7) 65 - 74 3.6 (2.6-5.0) 75 + 4.3 (2.9-6.3)
Gender Male 8.0 (6.4-9.9) Female 10.8 (9.4-12.4)
Race/Ethnicity White non-Hispanic 9.0 (7.8-10.3) Black non-Hispanic 11.2 (7.9-15.5) Other non-Hispanic 13.5 (8.0-22.0)
Education < High school 21.0 (14.9-28.7) High school grad 10.1 (8.0-12.8)
Some college 12.2 (10.0-14.8)
College grad 4.6 (3.5-5.9)
Household Income < $20,000 20.4 (16.8-24.6) $20,000 - $34,999 15.4 (12.4-19.1) $35,000 - $49,999 10.1 (6.7-15.0) $50,000 - $74,999 6.3 (4.3-9.1) ≥ $75,000 4.0 (2.7-5.8)
a Calculated from responses to Q.1-8 of the CDC BRFSS Anxiety and Depres-sion optional module. Responses in number of days were converted to points (0-1 days = 0 points, 2-6 days = 1 point, 7-11 days = 2 points, 12-14 days = 3 points). Points were summed across the eight questions and a total of 10 points or greater was classified as major depression.
Hispanic 14.3 (7.1-26.7)
25
Major Depression by Race and GenderMichigan, 2010
0
5
10
15
20
25
White, non-Hispanic Black, non-Hispanic
%
Total
Male
Female
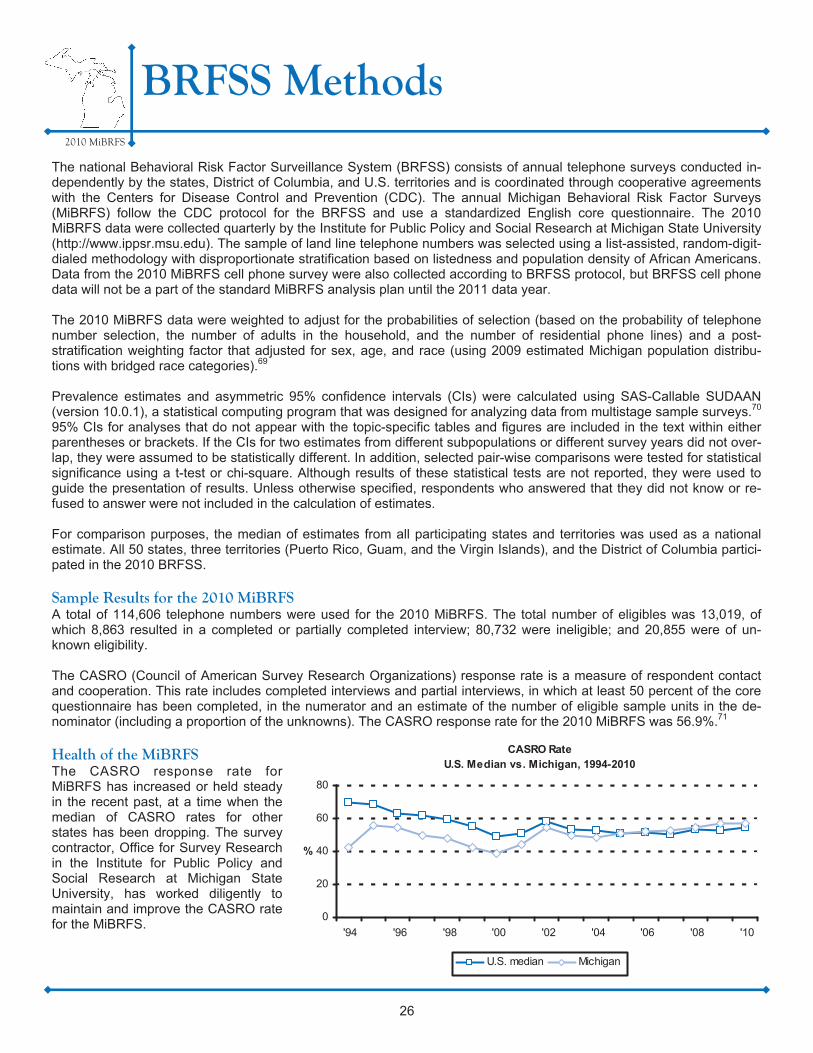
The national Behavioral Risk Factor Surveillance System (BRFSS) consists of annual telephone surveys conducted in-dependently by the states, District of Columbia, and U.S. territories and is coordinated through cooperative agreements with the Centers for Disease Control and Prevention (CDC). The annual Michigan Behavioral Risk Factor Surveys (MiBRFS) follow the CDC protocol for the BRFSS and use a standardized English core questionnaire. The 2010 MiBRFS data were collected quarterly by the Institute for Public Policy and Social Research at Michigan State University (http://www.ippsr.msu.edu). The sample of land line telephone numbers was selected using a list-assisted, random-digit-dialed methodology with disproportionate stratification based on listedness and population density of African Americans. Data from the 2010 MiBRFS cell phone survey were also collected according to BRFSS protocol, but BRFSS cell phone data will not be a part of the standard MiBRFS analysis plan until the 2011 data year.
The 2010 MiBRFS data were weighted to adjust for the probabilities of selection (based on the probability of telephone number selection, the number of adults in the household, and the number of residential phone lines) and a post-stratification weighting factor that adjusted for sex, age, and race (using 2009 estimated Michigan population distribu-tions with bridged race categories).69 Prevalence estimates and asymmetric 95% confidence intervals (CIs) were calculated using SAS-Callable SUDAAN (version 10.0.1), a statistical computing program that was designed for analyzing data from multistage sample surveys.70 95% CIs for analyses that do not appear with the topic-specific tables and figures are included in the text within either parentheses or brackets. If the CIs for two estimates from different subpopulations or different survey years did not over-lap, they were assumed to be statistically different. In addition, selected pair-wise comparisons were tested for statistical significance using a t-test or chi-square. Although results of these statistical tests are not reported, they were used to guide the presentation of results. Unless otherwise specified, respondents who answered that they did not know or re-fused to answer were not included in the calculation of estimates. For comparison purposes, the median of estimates from all participating states and territories was used as a national estimate. All 50 states, three territories (Puerto Rico, Guam, and the Virgin Islands), and the District of Columbia partici-pated in the 2010 BRFSS. Sample Results for the 2010 MiBRFS A total of 114,606 telephone numbers were used for the 2010 MiBRFS. The total number of eligibles was 13,019, of which 8,863 resulted in a completed or partially completed interview; 80,732 were ineligible; and 20,855 were of un-known eligibility. The CASRO (Council of American Survey Research Organizations) response rate is a measure of respondent contact and cooperation. This rate includes completed interviews and partial interviews, in which at least 50 percent of the core questionnaire has been completed, in the numerator and an estimate of the number of eligible sample units in the de-nominator (including a proportion of the unknowns). The CASRO response rate for the 2010 MiBRFS was 56.9%.71
Health of the MiBRFS The CASRO response rate for MiBRFS has increased or held steady in the recent past, at a time when the median of CASRO rates for other states has been dropping. The survey contractor, Office for Survey Research in the Institute for Public Policy and Social Research at Michigan State University, has worked diligently to maintain and improve the CASRO rate for the MiBRFS.
2010 MiBRFS
BRFSS Methods
26
CASRO RateU.S. Median vs. Michigan, 1994-2010
0
20
40
60
80
'94 '96 '98 '00 '02 '04 '06 '08 '10
%
U.S. median Michigan
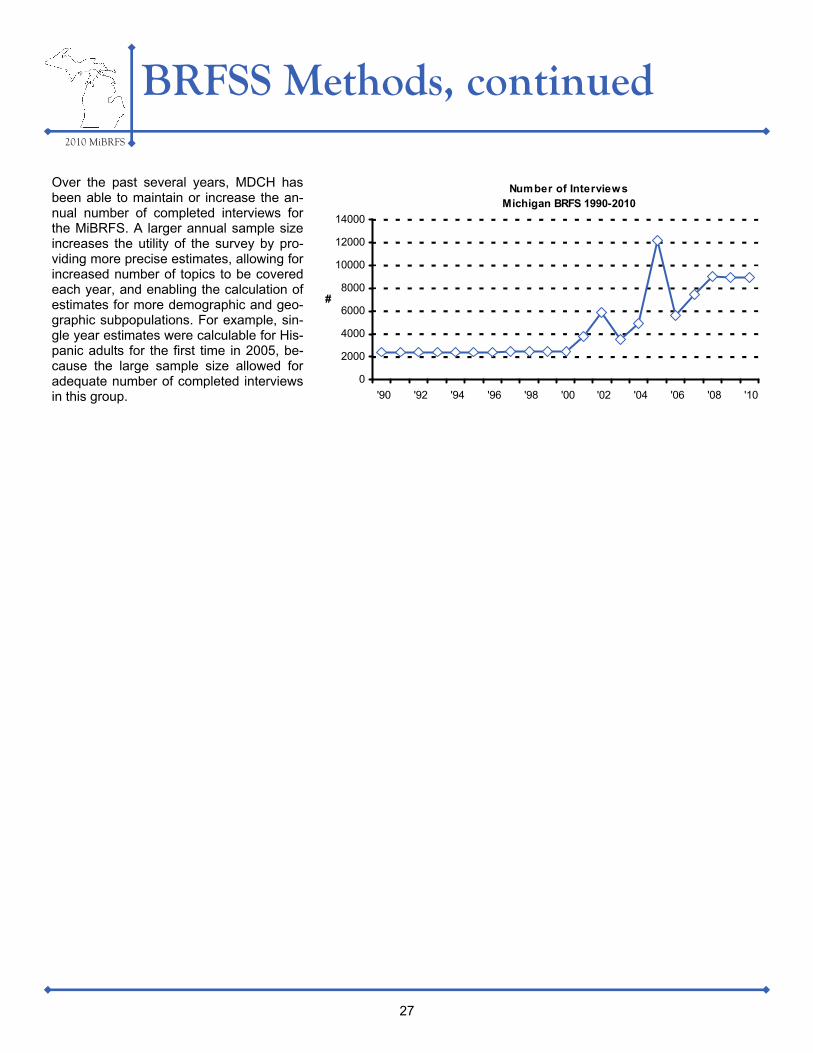
Over the past several years, MDCH has been able to maintain or increase the an-nual number of completed interviews for the MiBRFS. A larger annual sample size increases the utility of the survey by pro-viding more precise estimates, allowing for increased number of topics to be covered each year, and enabling the calculation of estimates for more demographic and geo-graphic subpopulations. For example, sin-gle year estimates were calculable for His-panic adults for the first time in 2005, be-cause the large sample size allowed for adequate number of completed interviews in this group.
2010 MiBRFS
BRFSS Methods, continued
27
0
2000
4000
6000
8000
10000
12000
14000
'90 '92 '94 '96 '98 '00 '02 '04 '06 '08 '10
#
Number of InterviewsMichigan BRFS 1990-2010

2010 MiBRFS
Bibliography
1. Michigan Department of Community Health, Health Policy and Planning Administration. 2011. Michigan’s Health Profile Chartbook 2011.
2. Michigan Cancer Consortium. 2010. Comprehensive Cancer Control Plan for Michigan: Goals (2009-2015). http://www.michigancancer.org/CancerPlan/Goals.cfm. (July 2011).
3. Link MW, Battaglia MP, Frankel MR, Osborn L, Mokdad AH. 2006. Address-based versus random-digit-dial surveys: Comparison of key health and risk indicators. Am J Epidemiol 164(10):1019-1025.
4. Office of Disease Prevention, U.S. Department of Health and Human Services. 2000. Healthy People 2010: A Sys-tematic Approach to Health Improvement. http://www.healthypeople.gov/2010/Document/html/uih/uih_2.htm. (July 2011).
5. Centers for Disease Control and Prevention. Measuring Healthy Days. Atlanta, Georgia: CDC, November 2000.
6. Centers for Disease Control and Prevention. 2011. Health-Related Quality of Life (HRQOL). http://www.cdc.gov/hrqol/key_findings.htm. (July 2011).
7. Office of Disease Prevention, U.S. Department of Health and Human Services. 2000. Healthy People 2010: Disabil-ity and Secondary Conditions. http://www.healthypeople.gov/2010/Document/HTML/Volume1/06Disability.htm. (July 2011).
8. Civil Rights Division. U.S. Department of Justice. 2005. A Guide to Disability Rights Laws. http://www.ada.gov/cguide.htm. (July 2011).
9. Centers for Disease Control and Prevention. 2011. Overweight and Obesity - Health Consequences. http://www.cdc.gov/obesity/causes/health.html. (July 2011).
10. Finkelstein EA, Trogdon JG, Cohen JW, Dietz W.. 2009. Annual Medical Spending Attributable to Obesity: Payer- and Service-specific Estimates. Health Affaris 28(5):w822-w831.
11. Hoffman C, Paradise, J. 2008. Health Insurance and Access to Health Care in the United States. Ann N Y Acad Sci 1136:149-160.
12. Agency for Healthcare Research and Quality. 2011. The Guide to Clinical Preventive Services, 2010-2011. http://www.ahrq.gov/clinic/pocketgd.htm. (July 2011).
13. National Center for Health Statistics. Health, United States, 2010: With Special Feature on Death and Dying. Hyatts-ville, MD. 2011.
14. Starfield B, Leiyu S, Macinko J. 2005. Contribution of Primary Care to Health Systems and Health. The Milbank Quarterly 83(3): 457-502.
15. Centers for Disease Control and Prevention. 2011. Physical Activity for Everyone - Physical Activity and Health. http://www.cdc.gov/physicalactivity/everyone/health/index.html. (July 2011).
16. Centers for Disease Control and Prevention. 2011. Tobacco Use - Targeting the Nation’s Leading Killer. http://www.cdc.gov/chronicdisease/resources/publications/AAG/osh.htm. (July 2011).
17. Centers for Disease Control and Prevention. Smoking-Attributable Mortality, Years of Potential Life Lost, and Pro-ductivity Losses—United States, 2000-2004. Morbidity and Mortality Weekly Report 2008;57(45):1226-8.
18. Office of Disease Prevention, U.S. Department of Health and Human Services. 2000. Healthy People 2010: Tobacco Use. http://www.healthypeople.gov/2010/Document/HTML/Volume2/27Tobacco.htm. (July 2011).
19. Gulliford MC, Sedgwick JEC, Pearce AJ. 2003. Cigarette Smoking, Health Status, Socio-economic Status and Ac-cess to Health Care in Diabetes Mellitus: A Cross-sectional Survey. BMC Health Serv Res 3(4):1-9.
28
2010 MiBRFS
Bibliography
20. National Cancer Institute. Smokeless Tobacco or Health: An International Perspective. Bethesda, MD: U.S. Depart-ment of Health and Human Services, National Institutes of Health, National Cancer Institute; 1992. (July 2011).
21. Centers for Disease Control and Prevention. 2010. Alcohol Use and Health. http://www.cdc.gov/alcohol/fact-sheets/alcohol-use.htm. (July 2011).
22. National Center for Statistics & Analysis. (2008). Fatality Analysis Reporting System Encyclopedia: Fatal Crashes and Percent Alcohol-Impaired Driving. http://www-fars.nhtsa.dot.gov/Crashes/CrashesAlcohol.aspx. (July 2011).
23. Office of Disease Prevention, U.S. Department of Health and Human Services. 2000. Healthy People 2010: Sub-stance Abuse. http://www.healthypeople.gov/2010/Document/HTML/Volume2/26Substance.htm. (July 2011).
24. National Highway Traffic Safety Administration. 2010. Traffic Safety Facts 2009: A Compilation of Motor Vehicle Data from the Fatality Analysis Reporting System and the General Estimates System. http://www-nrd.nhtsa.dot.gov/Pubs/811402EE.pdf. (July 2011).
25. National Highway Traffic Safety Administration. 2011. Traffic Safety Facts 2009: Occupant Protection. http://www-nrd.nhtsa.dot.gov/Pubs/811390.pdf. (July 2011).
26. Michigan State Police. 2011. 2010 Michigan Traffic Crash Facts - At a Glance. http://www.michigantrafficcrashfacts.org/Preliminary.htm. (July 2011).
27. Michigan Quality Improvement Consortium. 2011. About our Committee. http://www.mqic.org/index.htm. (July 2011).
28. Michigan Cancer Consortium. 2010. Comprehensive Cancer Control Plan for Michigan: 2009-2015. http://www.michigancancer.org/CancerPlan/ComprehensiveCancerControlPlan-2009-2015.cfm. (July 2011).
29. American Cancer Society. 2011. How Many Women Get Breast Cancer? http://www.cancer.org/cancer/breastcancer/overviewguide/breast-cancer-overview-key-statistics. (July 2011).
30. American Cancer Society. 2010. Cancer Facts and Figures 2010. http://www.cancer.org/acs/groups/content/@epidemiologysurveilance/documents/document/acspc-026238.pdf. (July 2011).
31. Division of Vital Records and Health Statistics, Michigan Department of Community Health. 2010. Invasive Breast Cancer Incidence and Mortality Trends, Michigan Female Residents, 1985-2008. http://www.mdch.state.mi.us/pha/osr/Cancer/stateinc.asp?CDxID=IncTrendsBreast. (July 2011).
32. Michigan Cancer Consortium. 2009. Screening Guidelines for Early Detection of Breast Cancer. http://www.michigancancer.org/PDFs/EarlyDetectionRecs/MCCBreastCaGuidelines-Dec2009.pdf. (July 2011).
33. Office of Disease Prevention, U.S. Department of Health and Human Services. 2000. Healthy People 2010: Cancer. http://www.healthypeople.gov/2010/Document/HTML/Volume1/03Cancer.htm. (July 2011).
34. National Cancer Institute. 2003. Task Force Announces New Cervical Cancer Screening Guidelines. http://www.cancer.gov/newscenter/pressreleases/2003/cervicalscreen. (July 2011).
35. Saslow D, CD Runowicz, D Solomon, et al. 2002. American Cancer Society for the Early Detection of Cervical Neo-plasia and Cancer. CA Cancer J Clin 52: 342-362.
36. U.S. Preventive Services Task Force. 2010. Screening for Cervical Cancer: Recommendations and Rationale. http://www.uspreventiveservicestaskforce.org/3rduspstf/cervcan/cervcanrr.htm. (July 2011).
37. American Cancer Society. 2010. Cancer Prevention & Early Detection Facts & Figures 2010. http://www.cancer.org/acs/groups/content/@epidemiologysurveilance/documents/document/acspc-027876.pdf. (July 2011).
38. Michigan Cancer Consortium. 2007. Recommendations for the Early Diagnosis of Cervical Cancer. http://www.michigancancer.org/PDFs/EarlyDetectionRecs/MCCCervCAGuidelines-Dec2007.pdf. (July 2011).
29

39. Division of Vital Records and Health Statistics, Michigan Department of Community Health. 2010. Invasive Prostate Cancer Incidence and Mortality Trends, Michigan Residents, 1985-2008. http://www.mdch.state.mi.us/pha/osr/ Cancer/stateinc.asp?CDxID=IncTrendsProstate. (July 2011).
40. American Cancer Society. 2011. American Cancer Society Recommendations for Prostate Cancer Early Detection. http://www.cancer.org/Cancer/ProstateCancer/MoreInformation/ProstateCancerEarlyDetection/prostate-cancer-early -detection-acs-recommendations. (July 2011).
41. American Cancer Society. 2011. What are the Risk Factors for Prostate Cancer. http://www.cancer.org/Cancer/ProstateCancer/MoreInformation/ProstateCancerEarlyDetection/prostate-cancer-early-detection-risk-factors-for-prostate-cancer. (July 2011).
42. U.S. Preventive Services Task Force: Recommendations and Rationale. Screening for Prostate Cancer - Recom-mendations and Rationale. 2003. Am Fam Physician 67(4): 787-792.
43. Wahid ZU. Task Force Finds Evidence Lacking on Whether Routine Screening for Prostate Cancer Improves Health Outcomes. 2003. Journal of the National Medical Association 95(4): A20.
44. Division of Vital Records and Health Statistics, Michigan Department of Community Health. 2010. Invasive Colorec-tal Cancer Incidence and Mortality Trends, Michigan Residents, 1985-2008. http://www.mdch.state.mi.us/pha/osr/ Cancer/stateinc.asp?CDxID=IncTrendsColo. (July 2011).
45. Centers for Disease Control and Prevention. 2010. Colorectal (Colon) Cancer - Colorectal Cancer Statistics. http://www.cdc.gov/cancer/colorectal/statistics/index.htm. (July 2011).
46. Ladabaum U, Song K. Projected National Impact of Colorectal Cancer Screening on Clinical and Economic Out-comes and Health Services Demand. 2005. Gastroenterology 129(4): 1151-1162.
47. U.S. Preventive Services Task Force. Screening for Colorectal Cancer: Recommendations and Rationale. 2002. Ann Intern Med 137(2): 129-131.
48. American Cancer Society. 2011. What are the Risk Factors for Colorectal Cancer?. http://www.cancer.org/Cancer/ColonandRectumCancer/DetailedGuide/colorectal-cancer-risk-factors. (July 2011).
49. U.S. Department of Health and Human Services. Oral Health in America: A Report of the Surgeon General. Rock-ville, MD: U.S. Department of Health and Human Services, National Institute of Dental and Craniofacial Research, National Institutes of Health, 2000.
50. Centers for Disease Control and Prevention. 2006. Fact Sheet: Oral Health for Adults. http://www.cdc.gov/OralHealth/publications/factsheets/adult.htm. (July 2011).
51. Office of Disease Prevention, U.S. Department of Health and Human Services. 2000. Healthy People 2010: Diabe-tes. http://www.healthypeople.gov/2010/Document/HTML/Volume1/05Diabetes.htm. (July 2011).
52. Fiore AE, Uyeki TM, Broder K, et al. 2010. Prevention and Control of Influenza with Vaccines: Recommendations of the Advisory Committee on Immunization Practices (ACIP), 2010. MMWR 59:1-62.
53. Centers for Disease Control and Prevention. Recommended Adult Immunizations Schedule - United States, 2011. MMWR. 2010; 60(4):1-4.
54. Centers for Disease Control and Prevention. 1997. Prevention of Pneumococcal Disease: Recommendations of the Advisory Committee on Immunization Practices. 46(RR-08):1-24.
55. Office of Disease Prevention, U.S. Department of Health and Human Services. 2000. Healthy People 2010: Immuni-zation and Infectious Diseases. http://www.healthypeople.gov/2010/Document/HTML/Volume1/14Immunization.htm. (July 2011).
2010 MiBRFS
Bibliography
30
56. Michigan Department of Community Health, Bureau of Epidemiology. 2011. Quarterly HIV/AIDS Report, Michigan. http://www.michigan.gov/documents/mdch/July_2011_358376_7.pdf. (July 2011).
57. Department of Health and Human Services, Panel for Antiretroviral Guidelines for Adults and Adolescents. 2011. Guidelines for the Use of Antiretroviral Agents in HIV-1-infected Adults and Adolescents. http://www.aidsinfo.nih.gov/contentfiles/adultandadolescentgl.pdf. (July 2011).
58. Centers for Disease Control and Prevention. 2011. Asthma. http://www.cdc.gov/asthma/. (July 2011).
59. U.S. Department of Health and Human Services, National Institutes of Health. 2011. Who Is At Risk For Asthma?. http://www.nhlbi.nih.gov/health/dci/Diseases/Asthma/Asthma_WhoIsAtRisk.html. (July 2011).
60. Centers for Disease Control and Prevention. 2011. Arthritis: The Nation’s Most Common Cause of Disability. http://www.cdc.gov/chronicdisease/resources/publications/AAG/arthritis.htm. (July 2011).
61. Yelin E, Cisternas M, Foreman A, et al. National and state medical expenditures and lost earnings attributable to arthritis and other rheumatic condition — United States, 2003. Morbidity and Mortality Weekly Report 2007;56(01):4-7. (July 2011).
62. Freedman M, Hootman JM, Helmick CG. Projected state-specific increases in self-reported doctor-diagnosed arthri-tis and arthritis-attributable activity limitations — United States, 2005-2030. Morbidity and Mortality Weekly Report 2007;56(17):423-425. (July 2011).
63. Kochanek KD, Xu J, Murphy SL, Minino AM, Kung HC. Deaths: Preliminary Data for 2009. Natl Vital Stat Rep. 2011; 59(4):1-51.
64. Michigan Department of Community Health. 2011. 2008 Michigan Resident Death File. http://http://www.mdch.state.mi.us/pha/osr/deaths/causrankcnty.asp. (July 2011).
65. Centers for Disease Control and Prevention. 2010. Heart Disease and Stroke Prevention - Addressing the Nation’s Leading Killers. http://www.cdc.gov/chronicdisease/resources/publications/AAG/dhdsp.htm. (July 2011).
66. Centers for Disease Control and Prevention. 20. Diabetes Public Health Resource - Basics About Diabetes. http://www.cdc.gov/diabetes/consumer/learn.htm. (July 2011).
67. Kroenke K, Strine TW, Spitzer RL, Williams JB, Berry JT, Mokdad AH. The PHQ-8 as a measure of current depres-sion in the general population. J Affect Disord 2009; 114:163-173.
68. American Psychiatric Association. Diagnostic and statistical manual of mental disorders, 4th ed. Washington, DC: American Psychiatric Association; 1994.
69. National Center for Health Statistics. 2010. Bridged-race Vintage 2009 postcensal population estimates for July 1, 2000 - July 1, 2009, by year, county, single-year of age, bridged-race, Hispanic origin, and sex. http://www.cdc.gov/nchs/nvss/bridged_race/data_documentation.htm#vintage2009. (February 2011).
70. Research Triangle Institute (RTI). 2008. SUDAAN Language Manual. Release 10.0. 1st Edition. Research Triangle Part, NC: RTI.
71. Centers for Disease Control and Prevention. 2011. 2010 BRFSS Summary Data Quality Report. ftp://ftp.cdc.gov/pub/Data/Brfss/2010_Summary_Data_Quality_Report.pdf. (July 2011).
2010 MiBRFS
Bibliography
31


Number of copies: 750 Total printing cost: $1950.31
Price per unit: $2.60
MDCH is an equal opportunity employer, service & program provider.