Embed Size (px)
Citation preview
2010
Annual Report
Bass Angler Information Team
64 North Union Street, Suite 551, Montgomery, Alabama 36130
B.A.I.T. Bass Anglers Information Team
2010 Annual Report
By
Damon Lee Abernethy
Fisheries Development Coordinator
Division of Wildlife and Freshwater Fisheries
Alabama Department of Conservation and Natural Resources
Funded in part by the Federal Aid to Sport Fish Restoration Program Alabama DJ/WB Project F-38
FISHERIES SECTION OFFICES
MONTGOMERY Stan Cook, Chief of Fisheries
Nick Nichols, Asst. Chief of Fisheries Joe Addison, Asst. Chief of Fisheries
Damon Abernethy, Fisheries Development (334) 242-3471
DISTRICT I Pickwick, Wilson, Wheeler, Guntersville, the
Bear Creek Lakes
Keith Floyd, Supervisor Phil Ekema, Biologist
21438 Harris Station Rd. Tanner, Ala. 35671
(256) 353-2634
DISTRICT II Weiss, Neely Henry, Logan Martin, Lay, Mitchell, Jordan, Harris, Martin, Yates,
Thurlow, Jones Bluff
Dan Catchings, Supervisor Michael Holley, Biologist Graves Lovell, Biologist
Fish Hatchery Rd. P. O. Box 158
Eastaboga, Ala. 36260 (256) 831-6860
DISTRICT III Aliceville, Gainesville, Smith, Bankhead, Holt,
Oliver, Warrior, Demopolis, Tuscaloosa, Inland
Jay Haffner, Supervisor
Vacant, Biologist 8211 McFarland Blvd. Northport, Ala. 35476
(205) 339-5716
DISTRICT IV West Point, Harding, Eufaula, Gantt, Point A,
Frank Jackson
Ken Weathers, Supervisor Rob Andress, Biologist
3520 Plaza Dr. Enterprise Ala. 36331
(334) 347-9467
DISTRICT V Claiborne, Coffeeville, Miller’s Ferry, Mobile
Delta
Dave Armstrong, Supervisor Tommy Purcell, Biologist
5093 Battleship Pkwy. P. O. Box 247
Daphne, Ala. 36526 (251) 626-5153
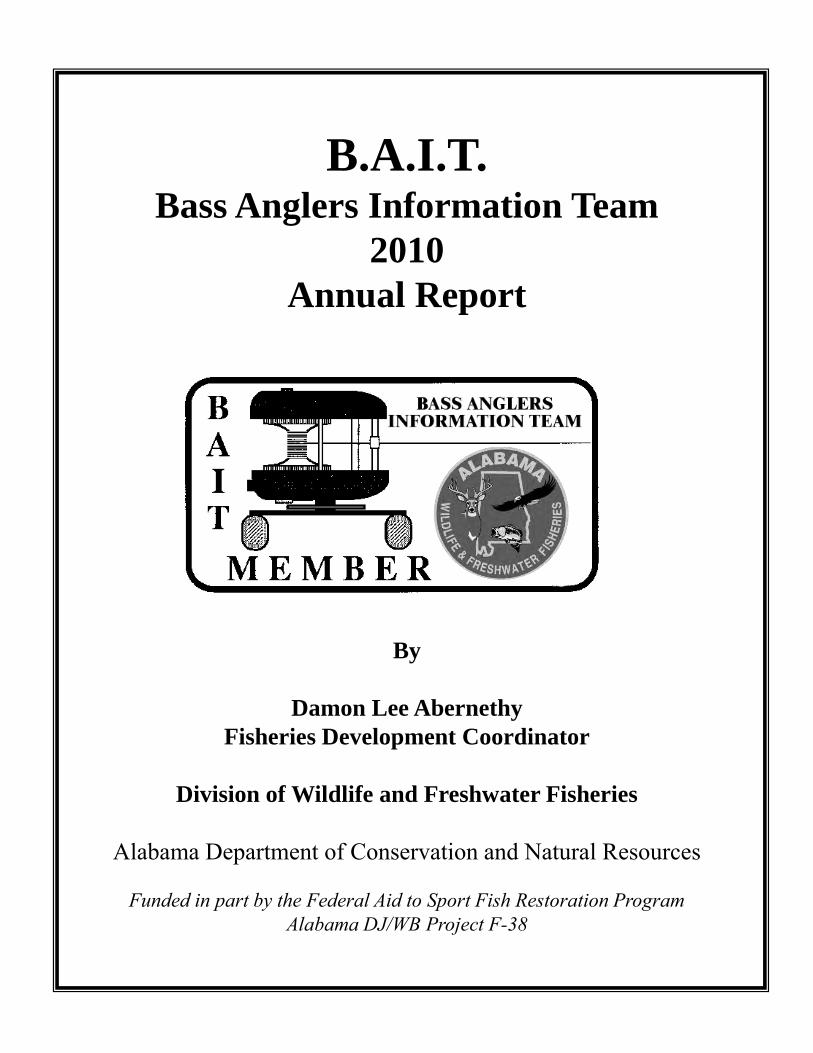
Statewide Club Tournament Results » p. 4-5, 8-25 Results from nearly 400 tournaments held in Alabama during 2010
Monthly Tournament Stats » p. 6-7, 12, 22-25 Catches reported for all major reservoirs with at least 10 reports Boating Access » p. 28 Find out what’s going on in your area
ADCNR Tournament Website » p. 27 Find tournaments or post upcoming events for all 45 reservoirs in Alabama
CONTENTS 2010 B.A.I.T. REPORT
ON THE INTERNET www.outdooralabama.com Reservoir Reports… www.outdooralabama.com/fishing/freshwater/where/reservoirs/ Angler Recognition Program… www.outdooralabama.com/fishing/freshwater/record/ B.A.I.T. Program… www.outdooralabama.com/fishing/freshwater/where/reservoirs/quality/ Limits and Regulations… www.outdooralabama.com/fishing/freshwater/regulations/ Boating Access… www.outdooralabama.com/boating/where/freshwater.cfm Tournament Listings… www.outdooralabama.com/tournaments/ Alabama Wildlife & Freshwater Fisheries • Fisheries Section • 64 N. Union St., Montgomery, Ala. 36130 • (334) 242-3471
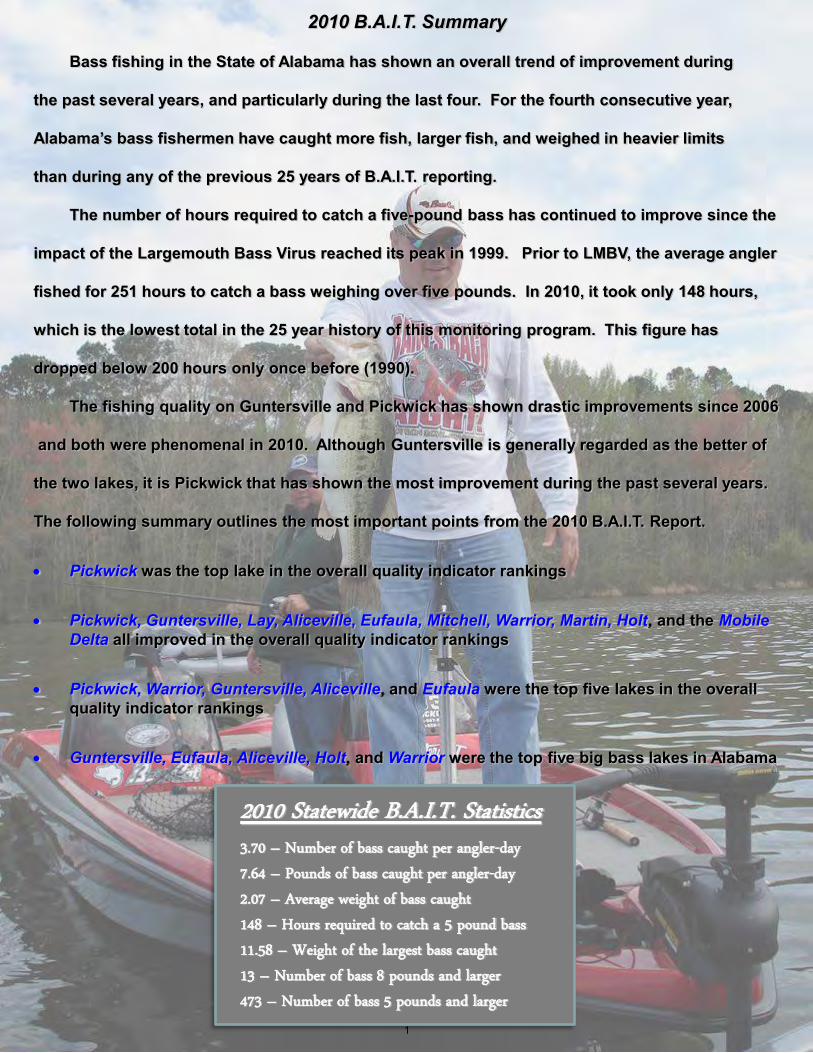
2010 B.A.I.T. Summary Bass fishing in the State of Alabama has shown an overall trend of improvement during the past several years, and particularly during the last four. For the fourth consecutive year, Alabama’s bass fishermen have caught more fish, larger fish, and weighed in heavier limits than during any of the previous 25 years of B.A.I.T. reporting. The number of hours required to catch a five-pound bass has continued to improve since the impact of the Largemouth Bass Virus reached its peak in 1999. Prior to LMBV, the average angler fished for 251 hours to catch a bass weighing over five pounds. In 2010, it took only 148 hours, which is the lowest total in the 25 year history of this monitoring program. This figure has dropped below 200 hours only once before (1990). The fishing quality on Guntersville and Pickwick has shown drastic improvements since 2006 and both were phenomenal in 2010. Although Guntersville is generally regarded as the better of the two lakes, it is Pickwick that has shown the most improvement during the past several years. The following summary outlines the most important points from the 2010 B.A.I.T. Report.
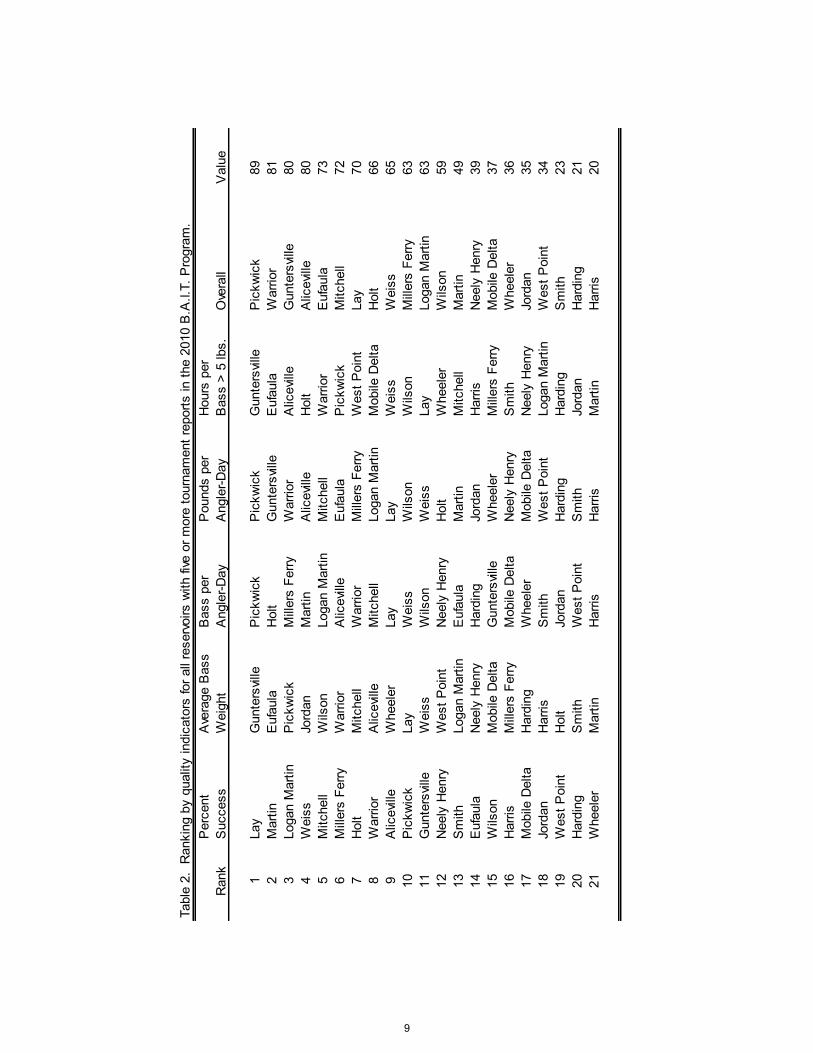
Pickwick was the top lake in the overall quality indicator rankings
Pickwick, Guntersville, Lay, Aliceville, Eufaula, Mitchell, Warrior, Martin, Holt, and the Mobile Delta all improved in the overall quality indicator rankings
Pickwick, Warrior, Guntersville, Aliceville, and Eufaula were the top five lakes in the overall quality indicator rankings
Guntersville, Eufaula, Aliceville, Holt, and Warrior were the top five big bass lakes in Alabama
2010 Statewide B.A.I.T. Statistics 3.70 – Number of bass caught per angler-day 7.64 – Pounds of bass caught per angler-day 2.07 – Average weight of bass caught 148 – Hours required to catch a 5 pound bass 11.58 – Weight of the largest bass caught 13 – Number of bass 8 pounds and larger 473 – Number of bass 5 pounds and larger 1
for accuracy and entered into a computer database. Club officers are
contacted when data are suspected to be erroneous. We compile and
analyze the data following receipt of December tournament reports.
Statewide tournament results are sorted by reservoir and by club.
To rank reservoirs, five “fishing quality” indicators were used:
percent of successful anglers (percent of anglers with one or more bass
at weigh-in), average bass weight, number of bass per angler-day,
pounds of bass per angler-day, and hours required to catch a bass five
pounds or larger. Since the length of a fishing day varies between
tournaments, an angler-day is defined as one angler fishing for ten
hours. In this report, an angler-day may simply be referred to as a
“day” of fishing. A minimum of five tournaments for an individual
reservoir is considered necessary for minimum confidence in each
reservoir dataset. Reservoirs with five or more tournament reports are
ranked for each of the quality indicators. Values are assigned to each
rank and an overall rank is determined for each reservoir by summing
the values of the five quality indicators. This ranking system is intended
to be a quick reference for club tournament site selection. It does not
constitute a “best and worst” list of Alabama reservoirs and should not
be interpreted that way.
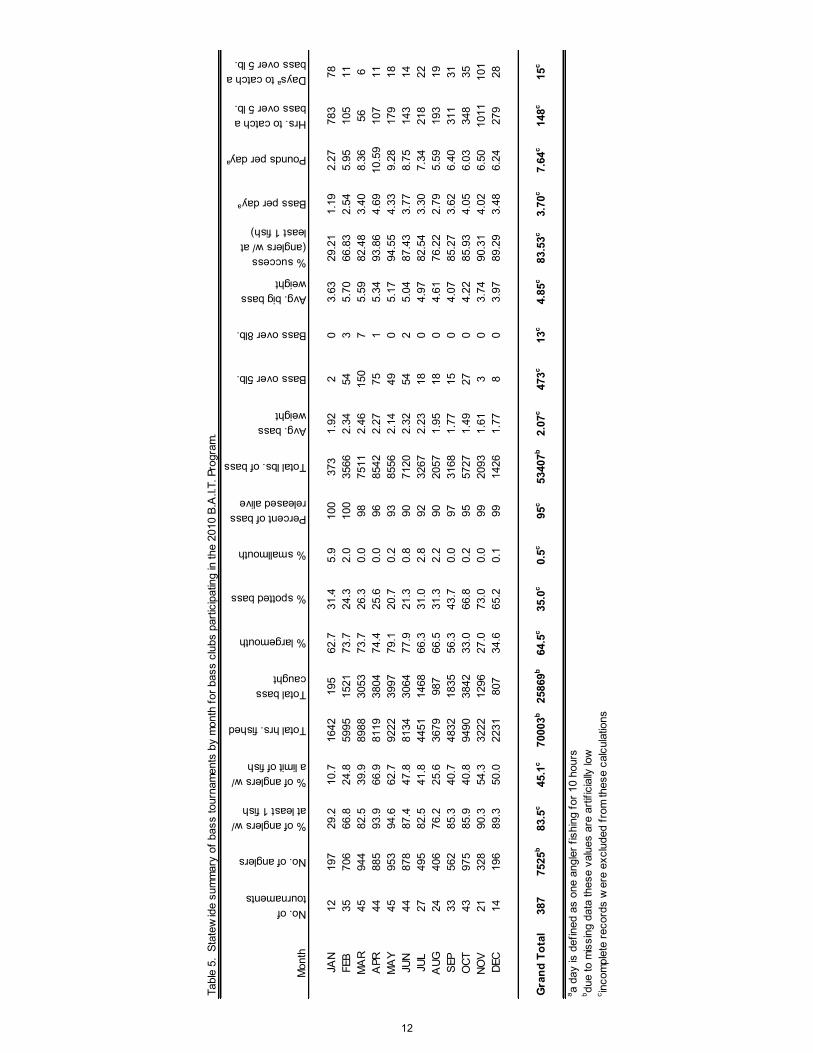
Tournament results were also broken down by month for each
reservoir with 10 or more reports. This section was intended to aid
clubs in scheduling tournaments since the quality of fishing can vary
considerably from one season to the next on any given reservoir. It
also allows anglers to better understand their chances of achieving a
particular goal (i.e., catching a big bass) on a given lake by studying in
detail how anglers performed during each month of the year. When
studying this section of the report, be aware that some months are
represented by only one tournament, which may not be a good
indicator of the overall quality of fishing during that month.
The printing of the 2010 B.A.I.T. Annual Report marks the
twenty-fifth year of the B.A.I.T. Program. The objective of the program
since its inception has been to gather information on bass populations
by combining the efforts of bass club members and state fisheries
biologists. The B.A.I.T. Program summarizes catch data on reservoir
bass populations that are collected and provided to us by participating
clubs. This information is used by state fisheries biologists in
combination with data from other sources as a basis for fisheries
management decisions. Bass anglers use the report to establish future
tournament sites, or to locate a reservoir that provides a particular type
of fishing.
Through 2010, we have summarized 12,137 tournament reports.
Anglers have spent 2,666,546 hours collecting data for this program.
They have contributed data from 642,718 bass that weighed 1,117,424
pounds.
This report also contains information related to the Alabama
Division of Wildlife & Freshwater Fisheries’ Boating Access
Maintenance and Development Program which maintains over 120
boating access areas statewide. The accomplishments made by this
program during 2010 may be of particular interest to tournament bass
anglers and their organizations. In addition, details of the Angler
Recognition Program administered by the Alabama Division of Wildlife
& Freshwater Fisheries can be found here as well.
Every year, we attempt to maintain the support of the previous
year’s clubs and to enlist the support of new clubs through public
meetings, news releases and letters. Participating club officers or
tournament directors are sent the previous year’s annual report and
tournament report postcards to be completed following each
tournament. Clubs are assigned individual numbers to insure
confidentiality. As tournament cards are received, they are checked
Introduction & Methods
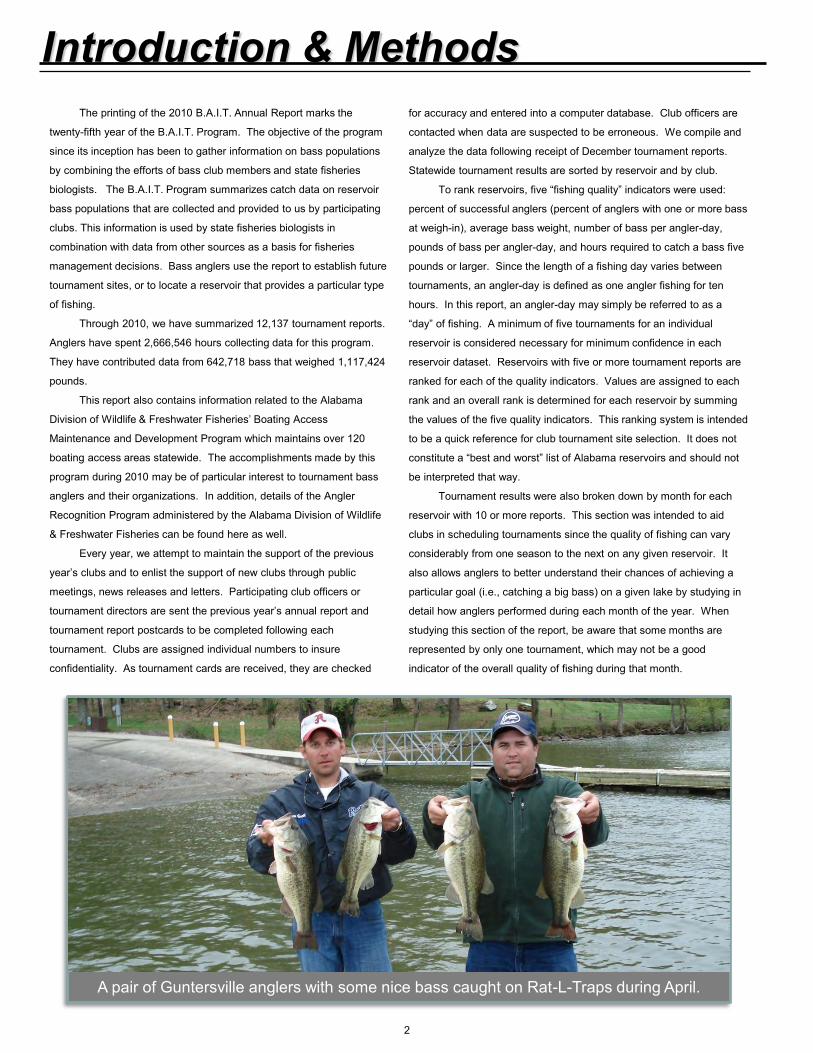
A pair of Guntersville anglers with some nice bass caught on Rat-L-Traps during April.
2
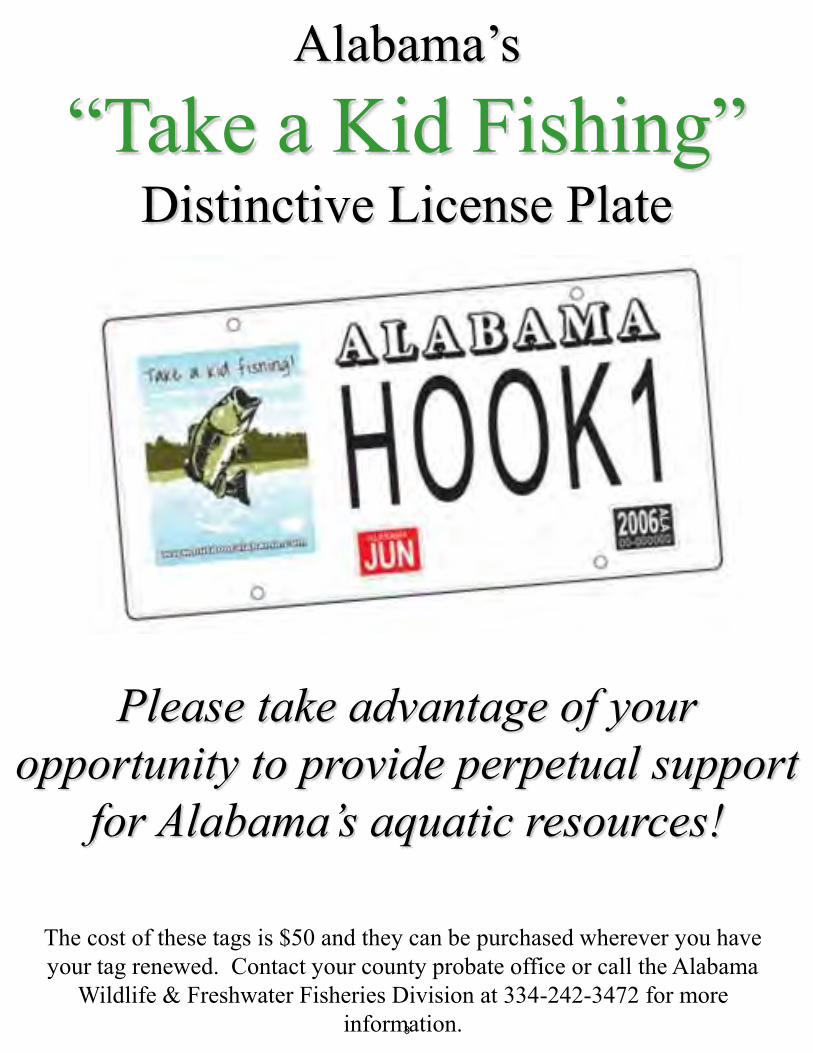
Alabama’s “Take a Kid Fishing”
Distinctive License Plate
Please take advantage of your opportunity to provide perpetual support
for Alabama’s aquatic resources!
The cost of these tags is $50 and they can be purchased wherever you have your tag renewed. Contact your county probate office or call the Alabama
Wildlife & Freshwater Fisheries Division at 334-242-3472 for more information. 3
Average catch rates in 2010 for both number (3.70) and pounds (7.64)
of bass per angler-day were the highest since the B.A.I.T. Program began in
1986. Compared to 2009, ten lakes improved in overall fishing success in
2010. The most notable improvements were on Warrior, Aliceville, and
Eufaula, which all moved into the top 5 in the overall rankings (Table 2). The
number of bass caught per angler-day on these three lakes increased by
Mississippi Department of Wildlife, Fisheries, and Parks. Without their
support, several Alabama reservoirs would not have been well represented
in the quality indicator rankings (Table 2). Once again, we must stress that
reports from more locations increase the capability of the summaries to
reflect actual fish population conditions and not just a good or poor day's
fifty six reports from
Alabama waters were
received from Dr. Carl
Quertermus of the
University of West
Georgia, who
summarizes tournament
data from the Georgia
Bass Federation; and
another 56 reports were
received from Biologist
Larry Pugh, with the
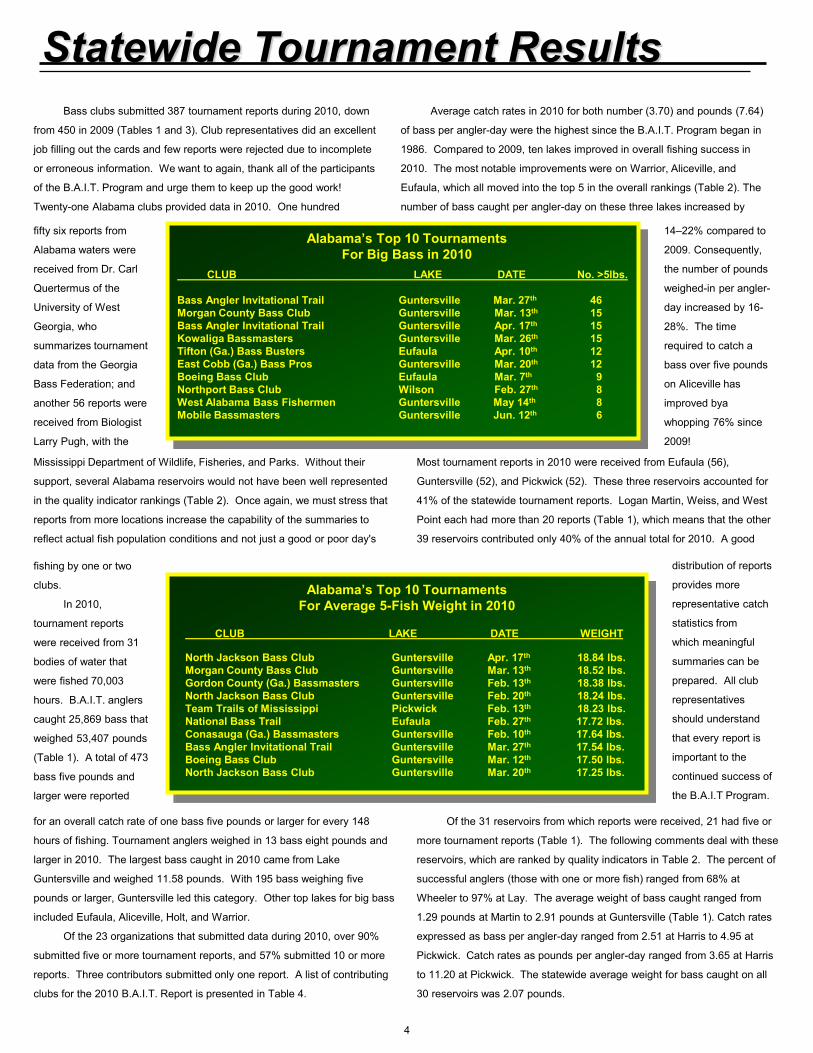
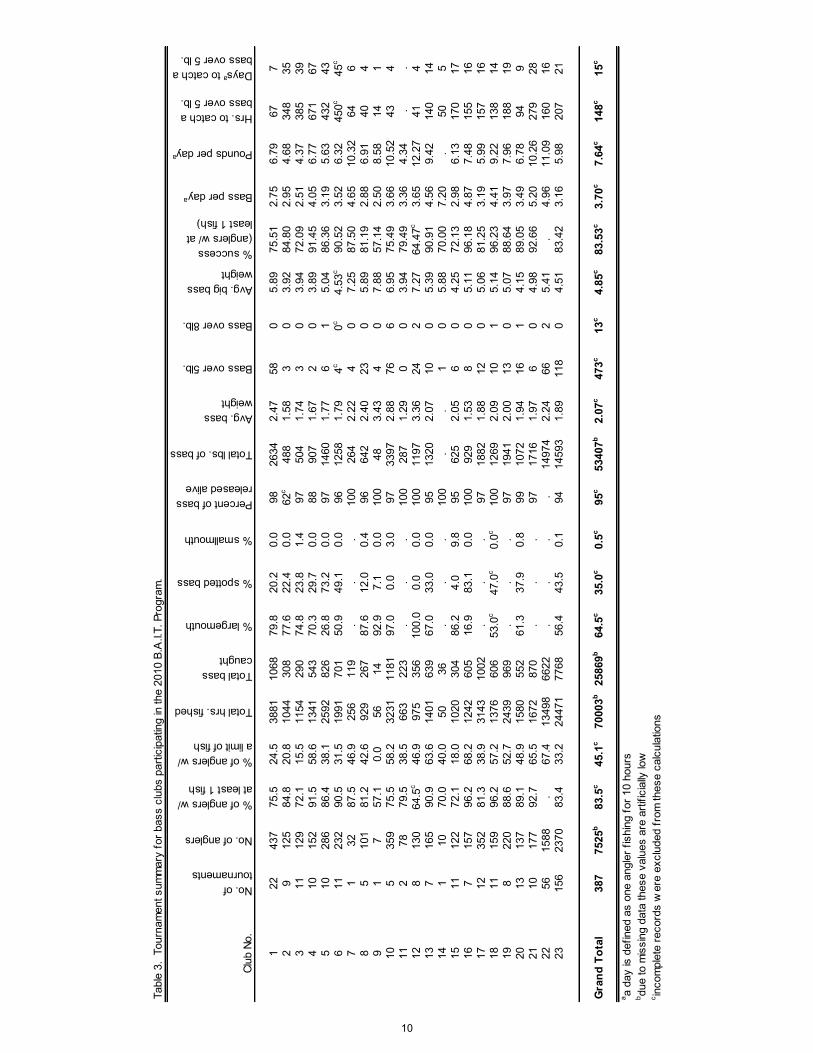
Bass clubs submitted 387 tournament reports during 2010, down
from 450 in 2009 (Tables 1 and 3). Club representatives did an excellent
job filling out the cards and few reports were rejected due to incomplete
or erroneous information. We want to again, thank all of the participants
of the B.A.I.T. Program and urge them to keep up the good work!
Twenty-one Alabama clubs provided data in 2010. One hundred
for an overall catch rate of one bass five pounds or larger for every 148
hours of fishing. Tournament anglers weighed in 13 bass eight pounds and
larger in 2010. The largest bass caught in 2010 came from Lake
Guntersville and weighed 11.58 pounds. With 195 bass weighing five
pounds or larger, Guntersville led this category. Other top lakes for big bass
included Eufaula, Aliceville, Holt, and Warrior.
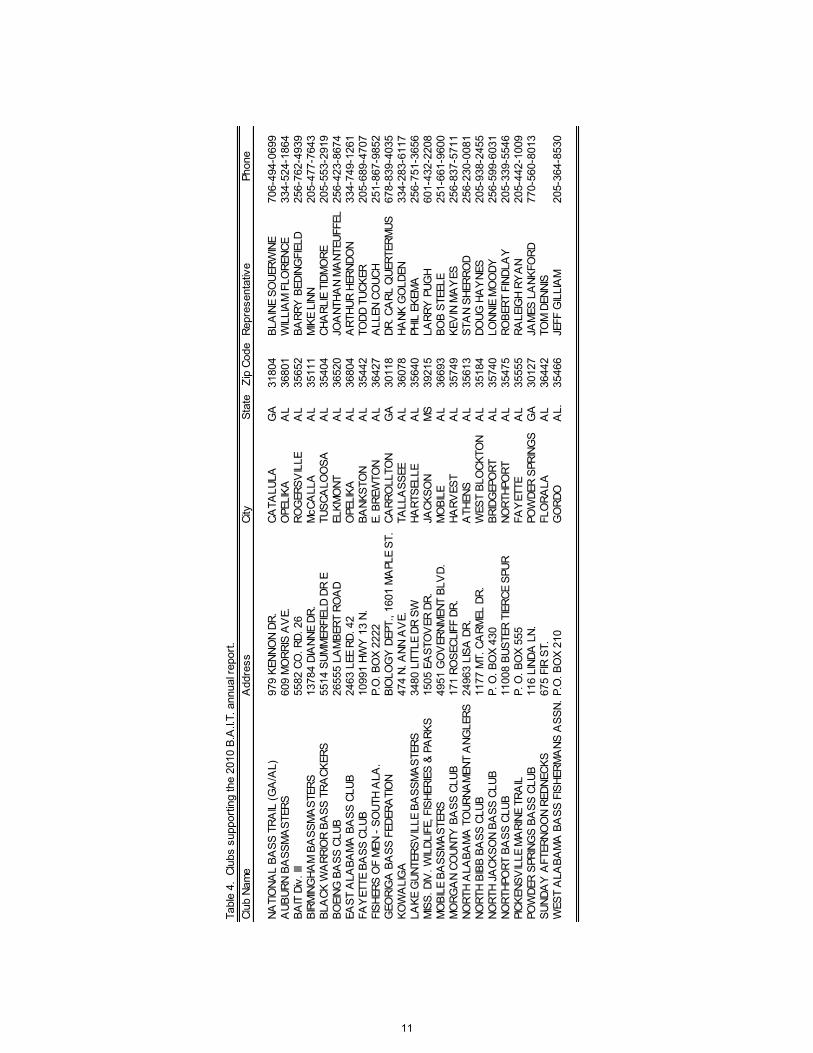
Of the 23 organizations that submitted data during 2010, over 90%
submitted five or more tournament reports, and 57% submitted 10 or more
reports. Three contributors submitted only one report. A list of contributing
clubs for the 2010 B.A.I.T. Report is presented in Table 4.
fishing by one or two
clubs.
In 2010,
tournament reports
were received from 31
bodies of water that
were fished 70,003
hours. B.A.I.T. anglers
caught 25,869 bass that
weighed 53,407 pounds
(Table 1). A total of 473
bass five pounds and
larger were reported
14–22% compared to
2009. Consequently,
the number of pounds
weighed-in per angler-
day increased by 16-
28%. The time
required to catch a
bass over five pounds
on Aliceville has
improved bya
whopping 76% since
2009!
Most tournament reports in 2010 were received from Eufaula (56),
Guntersville (52), and Pickwick (52). These three reservoirs accounted for
41% of the statewide tournament reports. Logan Martin, Weiss, and West
Point each had more than 20 reports (Table 1), which means that the other
39 reservoirs contributed only 40% of the annual total for 2010. A good
distribution of reports
provides more
representative catch
statistics from
which meaningful
summaries can be
prepared. All club
representatives
should understand
that every report is
important to the
continued success of
the B.A.I.T Program.
Of the 31 reservoirs from which reports were received, 21 had five or
more tournament reports (Table 1). The following comments deal with these
reservoirs, which are ranked by quality indicators in Table 2. The percent of
successful anglers (those with one or more fish) ranged from 68% at
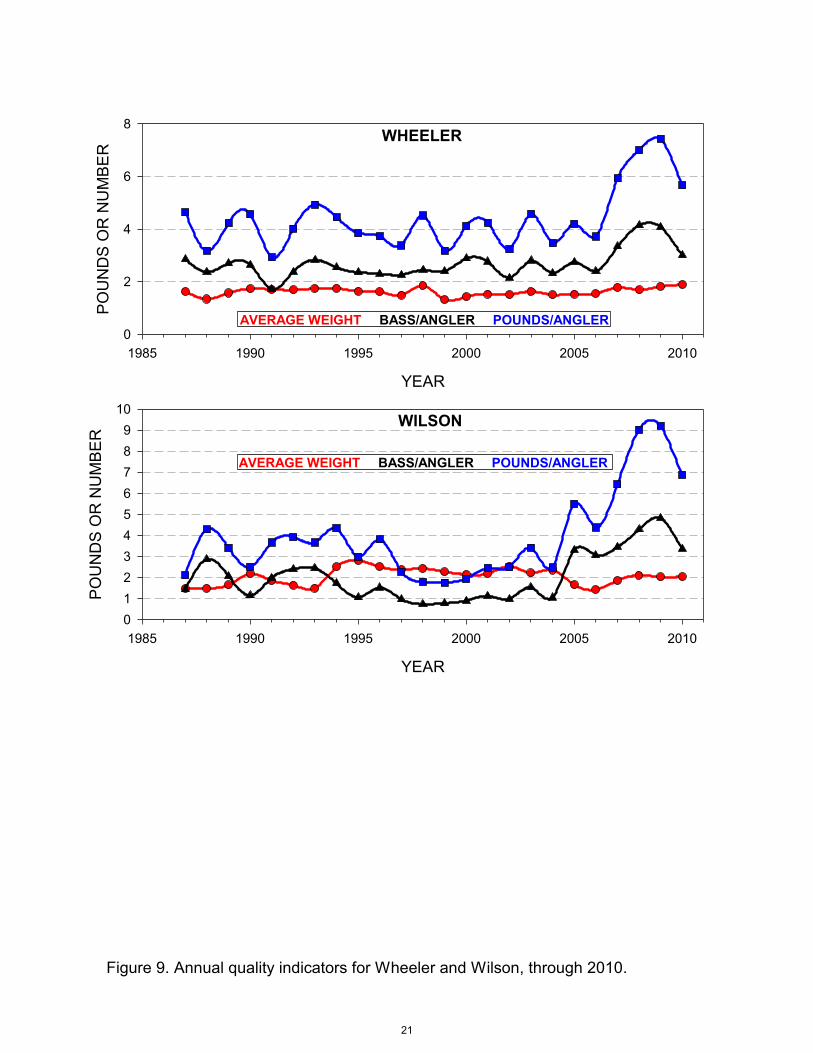
Wheeler to 97% at Lay. The average weight of bass caught ranged from
1.29 pounds at Martin to 2.91 pounds at Guntersville (Table 1). Catch rates
expressed as bass per angler-day ranged from 2.51 at Harris to 4.95 at
Pickwick. Catch rates as pounds per angler-day ranged from 3.65 at Harris
to 11.20 at Pickwick. The statewide average weight for bass caught on all
30 reservoirs was 2.07 pounds.
CLUB LAKE DATE WEIGHT North Jackson Bass Club Guntersville Apr. 17th 18.84 lbs. Morgan County Bass Club Guntersville Mar. 13th 18.52 lbs. Gordon County (Ga.) Bassmasters Guntersville Feb. 13th 18.38 lbs. North Jackson Bass Club Guntersville Feb. 20th 18.24 lbs. Team Trails of Mississippi Pickwick Feb. 13th 18.23 lbs. National Bass Trail Eufaula Feb. 27th 17.72 lbs. Conasauga (Ga.) Bassmasters Guntersville Feb. 10th 17.64 lbs. Bass Angler Invitational Trail Guntersville Mar. 27th 17.54 lbs. Boeing Bass Club Guntersville Mar. 12th 17.50 lbs. North Jackson Bass Club Guntersville Mar. 20th 17.25 lbs.
Alabama’s Top 10 Tournaments For Average 5-Fish Weight in 2010
CLUB LAKE DATE No. >5lbs. Bass Angler Invitational Trail Guntersville Mar. 27th 46 Morgan County Bass Club Guntersville Mar. 13th 15 Bass Angler Invitational Trail Guntersville Apr. 17th 15 Kowaliga Bassmasters Guntersville Mar. 26th 15 Tifton (Ga.) Bass Busters Eufaula Apr. 10th 12 East Cobb (Ga.) Bass Pros Guntersville Mar. 20th 12 Boeing Bass Club Eufaula Mar. 7th 9 Northport Bass Club Wilson Feb. 27th 8 West Alabama Bass Fishermen Guntersville May 14th 8 Mobile Bassmasters Guntersville Jun. 12th 6
Alabama’s Top 10 Tournaments For Big Bass in 2010
Statewide Tournament Results
4
Overall, Pickwick accumulated more quality indicator points (89) than
any other reservoir in Alabama, replacing Millers Ferry from 2009. Warrior
(81), Guntersville (80), Aliceville (80), and Eufaula (73) rounded out the top
five.
Readers should note that the primary intent of Table 2 is not to
determine the overall “best” reservoir, but to characterize the fishery of
each reservoir. Anglers should first review the quality indicator that is most
important to them. The overall rating would be used to narrow choices. For
example, if an angler wanted to have the best chance to catch a bass
greater than 5 pounds, then Guntersville would be the first choice, followed
by Eufaula and Aliceville. Clubs interested in having all its members catch
good quality stringers would look at the pounds per angler-day rankings to
find that Pickwick, Guntersville, and Warrior offer the best opportunity. If
catching lots of bass is important, then Pickwick, Holt, and Millers Ferry
would be the best destination based upon their bass per angler-day
rankings.
Bass data, as expressed in the B.A.I.T. report from reservoirs with
harvest restrictions or length limits, will be biased since the data is a function
of the restrictions. Length limits are imposed to increase the number of fish
below a minimum length or within a specified length range (slot limit) which
should eventually result in a greater supply of bass above the limit. Because
all minimum lengths and length ranges will be above the 12-inch limit self-
imposed by most tournaments, the restrictions will reduce the total harvest in
numbers and possibly pounds. However, those fish weighed in will be larger
(longer) by virtue of the minimum length or slot limit. In the B.A.I.T. Report,
length limit lakes should rank high for average weight and near the bottom
for percent success and bass per angler-day. For instance, bass per angler-
day averaged 3.70 statewide in 2010; but for Guntersville and Eufaula, it
was 3.04 and 3.22, respectively. Statewide average weight was 2.07
pounds for all reservoirs combined; but 2.39 pounds at Eufaula and 2.91
pounds at Guntersville. These average weights were higher primarily
because anglers must release the smaller fish due to the minimum length
limits. Length limits remained in effect during 2010 on West Point (14-inch
minimum on largemouth), Wilson (14-inch minimum on smallmouth),
Guntersville (15-inch minimum on largemouth and smallmouth), Eufaula (14-
inch minimum on largemouth), Demopolis (14-inch minimum on all black
bass), Pickwick (14-inch minimum on smallmouth), Little Bear Creek (13- to
16-inch slot on largemouth), Smith (13- to 15-inch slot on all black bass),
and Harris (13- to 16-inches on largemouth).
Bass fishing in Alabama has continued to improve with 2010 generally
scoring the highest marks since the Alabama Division of Wildlife &
Freshwater Fisheries began keeping records in 1986. Alabama’s bass
fishermen caught more fish, larger fish, and weighed in more cumulative
weight than during any of the previous 25 years of B.A.I.T. reporting. This is
the fourth consecutive year this trend of improvement has been evident in
the B.A.I.T. reporting. Even the number of hours required to catch a five
pound bass was the lowest since we began keeping records in 1986.
The average number of hours (effort) needed to catch a five-pound
and larger bass dramatically increased beginning in 1998 due to the
presence of the Largemouth Bass Virus (LMBV), and reached its peak of
837 the following year. From 1999 through 2010, the amount of effort
required to catch a bass over five pounds has decreased from 837 hours to
148 hours (Figure 1).
Although there have been no recent outbreaks of LMBV, there are still
indications that this disease may be impacting our bass populations by
elevating natural mortality rates above what was observed prior to its
introduction; so, please report any unusual bass die-offs to your district
fisheries office, and never move fish from one body of water to another.
The graphs throughout this report provide a historical record of how
your favorite waters have performed in the B.A.I.T. Program. A few words of
caution - these graphs are not restricted to bodies of water with five or more
tournaments. Data points for some years may be represented by only a few
tournaments. However, those situations are restricted to those water bodies
that generally have not been included in the quality indicator rankings in
Table 2. You can use these graphs to predict future fishing by looking for
trends.
Good luck fishing, and don’t forget to take a child with you and
introduce him or her to your sport. Our children are our future anglers and
stewards of Alabama’s resources. To obtain more information on Alabama’s
fisheries resources, visit the Alabama Department of Conservation and
Natural Resources Internet Homepage: www.outdooralabama.com.
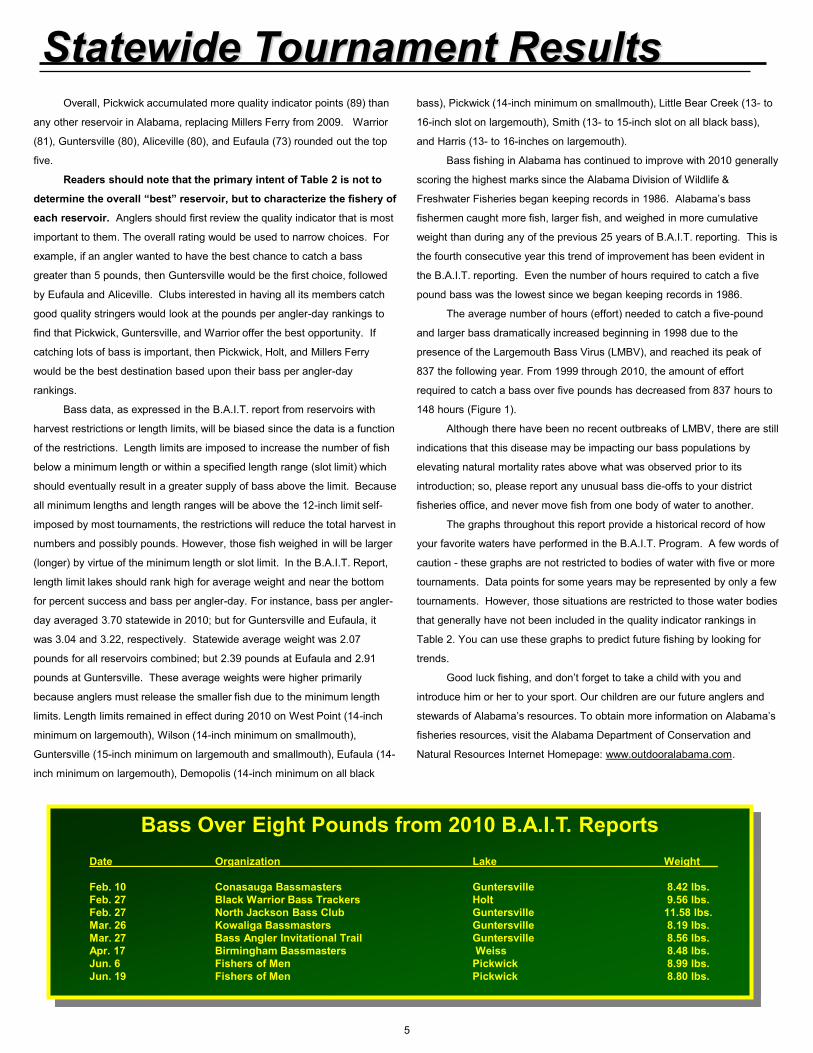
Date Organization Lake Weight___ Feb. 10 Conasauga Bassmasters Guntersville 8.42 lbs. Feb. 27 Black Warrior Bass Trackers Holt 9.56 lbs. Feb. 27 North Jackson Bass Club Guntersville 11.58 lbs. Mar. 26 Kowaliga Bassmasters Guntersville 8.19 lbs. Mar. 27 Bass Angler Invitational Trail Guntersville 8.56 lbs. Apr. 17 Birmingham Bassmasters Weiss 8.48 lbs. Jun. 6 Fishers of Men Pickwick 8.99 lbs. Jun. 19 Fishers of Men Pickwick 8.80 lbs.
Bass Over Eight Pounds from 2010 B.A.I.T. Reports
Statewide Tournament Results
5
In this section, reservoirs with at least 20 reports are discussed in
detail and often refer to the monthly tournament results. Table 6 provides
monthly catch information for all reservoirs with at least 10 reports.
Eufaula
We received 56 tournament reports from this reservoir that were
held during every month, with the majority (17) occurring in April. A total of
901 tournament anglers fished for 9,246 hours to catch 2,974 bass that
averaged 2.39 pounds (Table 6). This was the second consecutive year
since 1993 that the average size of bass caught during tournaments did
not decrease. From 1993 to 2008, the average size dropped from 3.44 to
2.13 pounds. It should be noted that the minimum length limit was lowered
from 16-in. to 14-in. during the same period, which resulted in anglers
bringing a higher proportion of smaller fish to the scales. A reduction in
fertility levels and the increase in abundance of smaller spotted bass in the
Chattahoochee River watershed has also been attributed to this decline in
average fish size.
The number of spotted bass weighed in during Eufaula tournaments
had been hovering at or below 20% for the past several years, but in 2010,
that percentage dropped to 10%. As usual, the majority of those fish were
caught during cooler weather in fall and winter.
The data from Eufaula suggested that the best fishing occurred from
February through July, but catch rates were poor during the fall and winter.
It appeared that the early pre-spawn and post-spawn/shad spawn offered
anglers the best opportunity to catch a bass over five pounds. It took the
average angler about 9 days of fishing to catch a bass over five pounds,
which was a 40% improvement over 2009 figures.
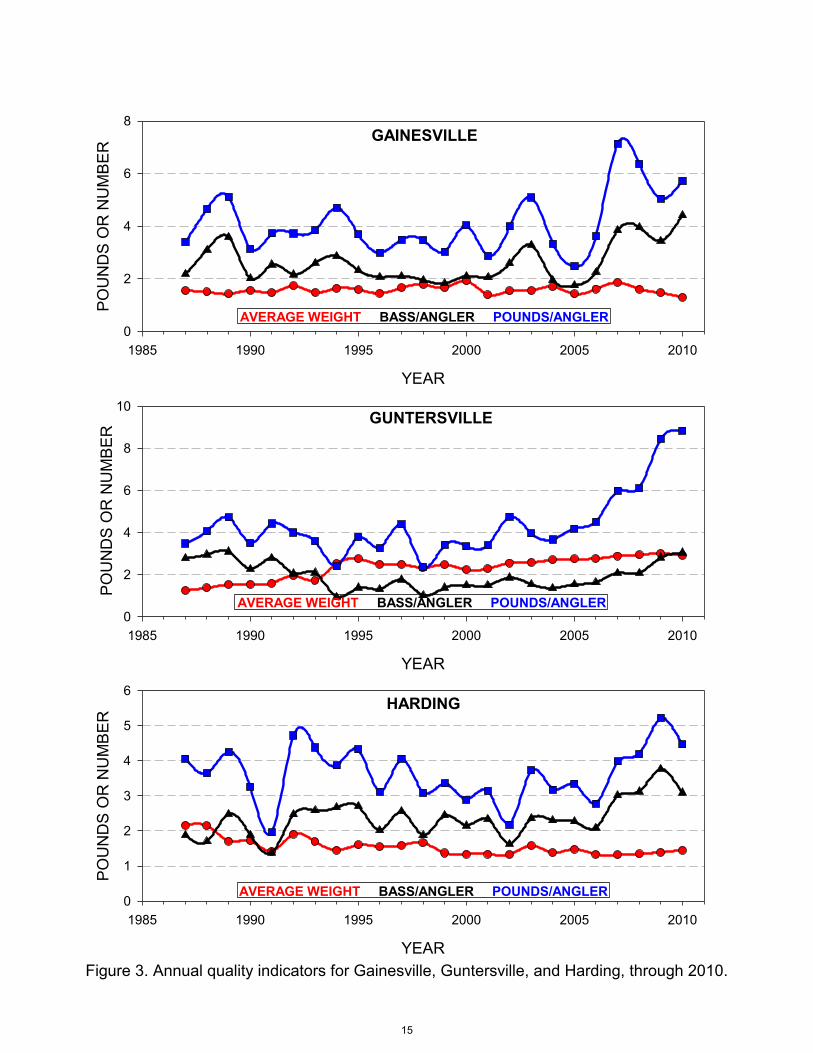
Guntersville
Fifty-two tournament reports were received from this reservoir that
were held during every month except December. The majority of
tournaments occurred in March (11) and May (11). A total of 1,063
tournament anglers fished for 10,993 hours, catching 3,343 bass that
averaged 2.91 pounds (Table 6). The average number of fish weighed-in
by each angler was 3.04, with an average bag weight of 8.84 pounds.
Nearly 83% of Guntersville’s bass fishermen weighed-in at least one fish in
2010, which is similar to the previous year. Anglers’ creels were comprised
of largemouth bass (99%) and spotted bass only.
Compared to tournament data collected since 1986, this year was
very impressive with all quality indicators being well above the 25-yr.
average, with the length of time required to catch a bass over five pounds
being only 56 hours! The abundance of aquatic vegetation on
Guntersville was fairly stable for a number of years, which likely has
contributed to recent angler success. However, changing weather patterns
may cause a decline in the abundance of aquatic vegetation in the coming
years.
March offered anglers the best opportunity to catch bass over five
pounds, but numerous big bass were caught from February through June.
Anglers fished for an average of only two and a half days to catch a bass
over five pounds in March. Catch rates for big bass were lowest during the
late summer and fall, with the average angler fishing for close to a month
to catch one bass over five pounds. Few spotted bass were caught from
Guntersville, but the majority were taken during the late summer and fall.
March through June were probably the best months overall for bass fishing
at Guntersville, but fishing got progressively worse from July on. During
the prime fishing season, anglers had excellent catch rates and weighed-in
an average of 10.6 pounds per angler. Only 2-4 days of fishing was
required to catch a bass over five pounds from March through May.
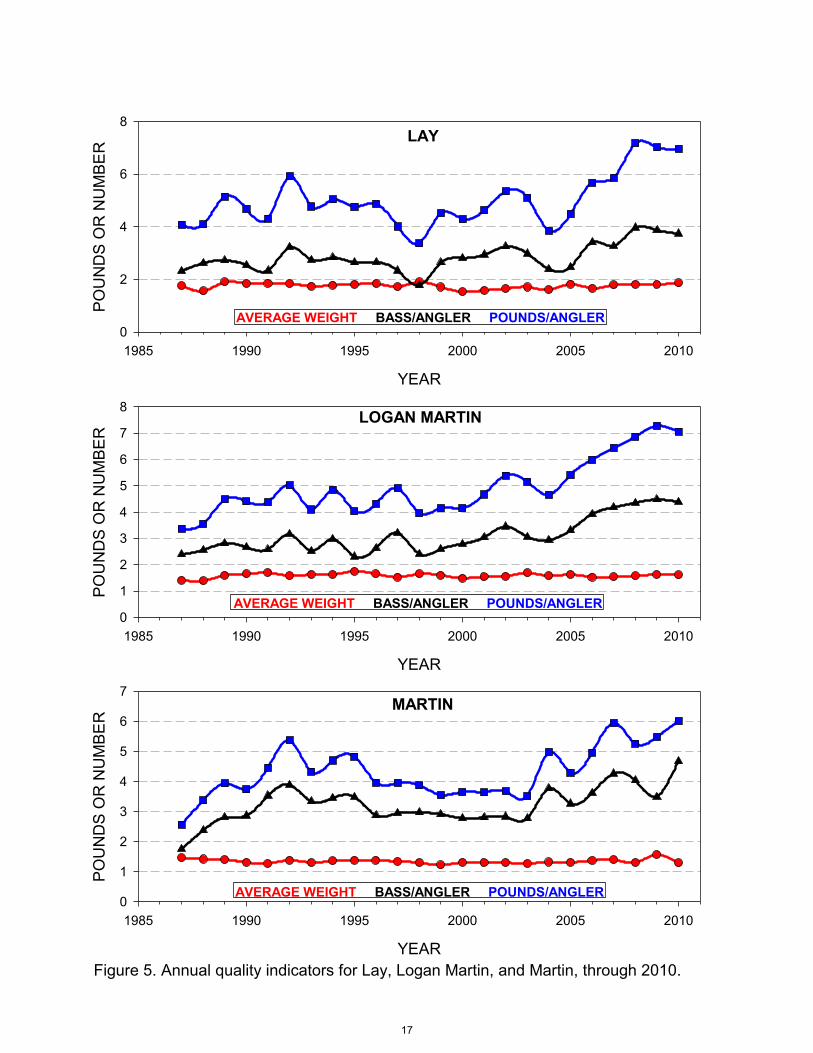
Logan Martin
During 2010, we received 21 tournament reports from this reservoir
that were held during every month except January and February. The
majority (4) occurred in May. A total of 363 anglers fished for 3,382 hours,
catching 1,486 bass that averaged 1.61 pounds (Table 6). Catch rates
(4.39 bass per angler-day) and average bass weight were similar to those
of 2009. Average bass weight was just shy of the 25-yr high.
Logan Martin was a popular tournament destination throughout the
year, and the ratio of spots to largemouths was a little greater than 3:1, but
varied considerably from month to month. Months with colder water
temperatures tended to produce the highest percentage of spotted bass.
Catch rates were good throughout the year, but average weight of
bass was lowest during the warmer months.
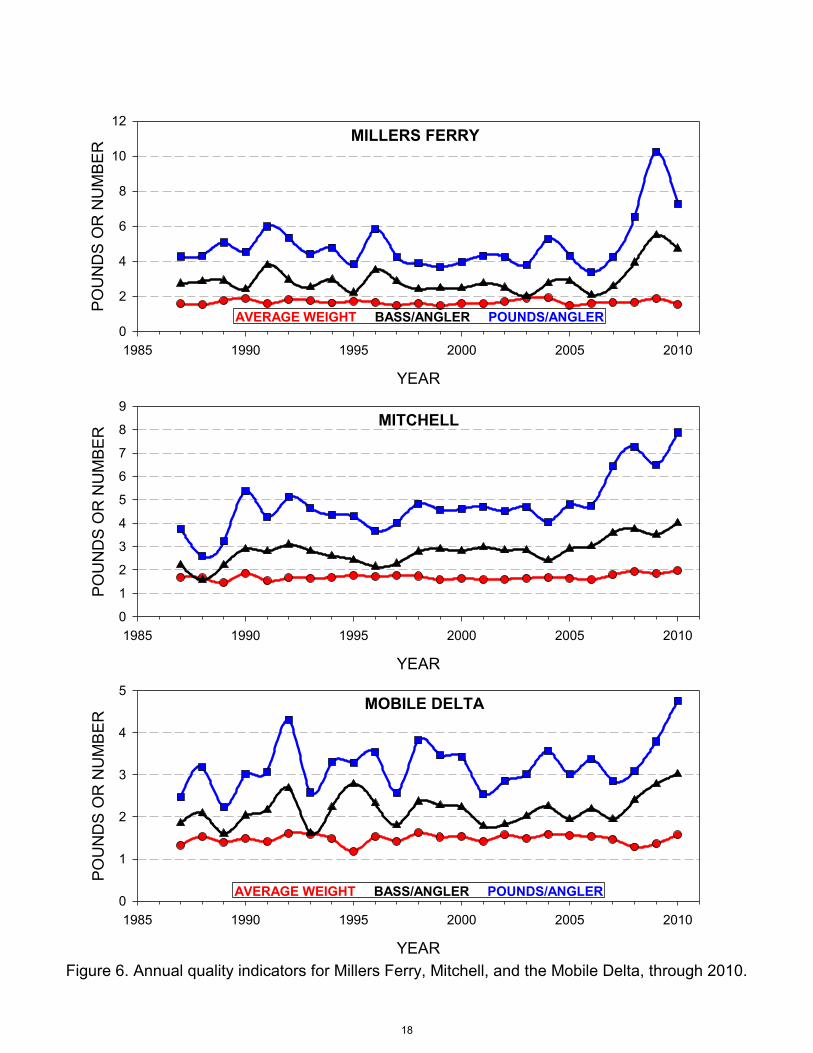
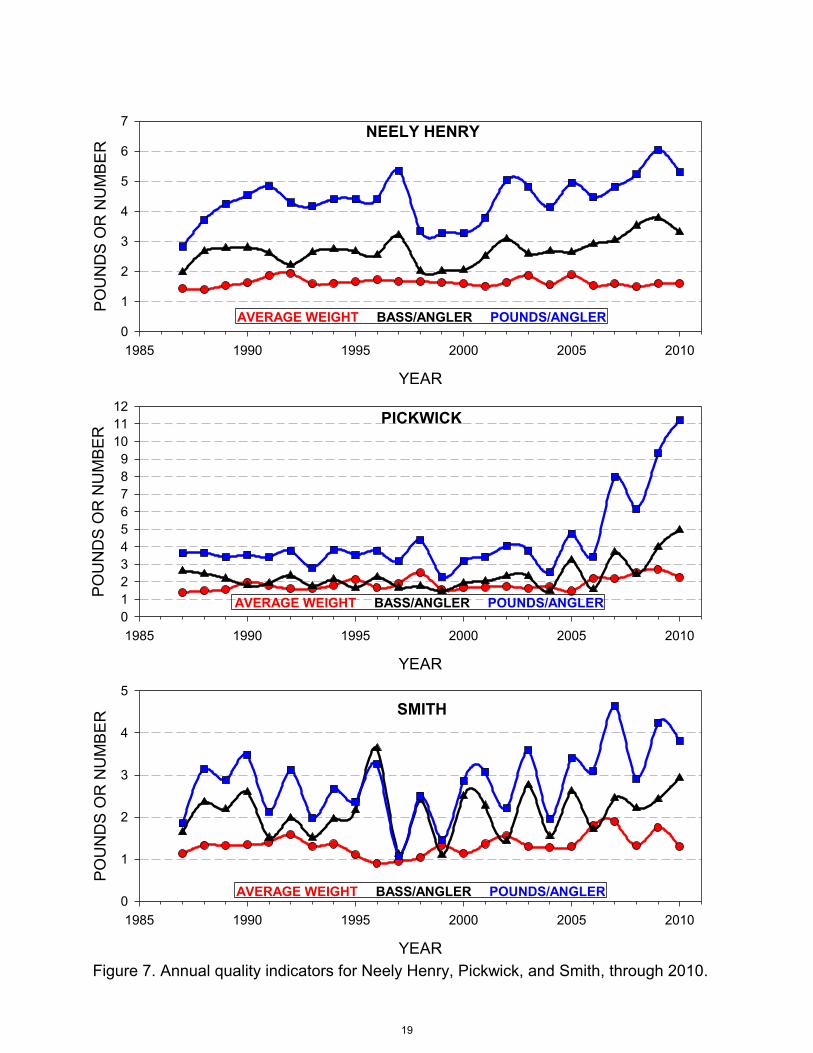
Pickwick
Fifty-two tournament reports were received, representing every
month except December. The majority of tournaments were held in
June(8) and October (8). 1,510 anglers fished for 12,845 hours catching
6,294 bass that weighed 14,383 pounds. Almost 27% of the bass weighed
in were smallmouth bass, which is a 40% increase over 2009.
During 2010, the average size of bass caught declined by 17%, but
still far exceeded the 25-year average for this reservoir. The number of
bass weighed in per angler-day was 4.95 in 2010, which was more than
double the 25-year average for the lake. Likewise, the number of pounds
weighed in per angler-day was exceptional at over 11 pounds, which made
Pickwick the only reservoir in Alabama to break the double digit mark in
2010. Bass over 5 pounds were common on Pickwick, but not plentiful
enough to be considered a premiere big bass lake. However, it did
produce two of the State’s thirteen bass over 8 pounds, so the potential to
catch a trophy fish certainly exists.
The recent expansion of hydrilla in the mid-lake area has offered a
popular pattern for bass anglers, and the area from Wilson Dam down to
the lower end of Seven Mile Island is popular with smallmouth anglers.
Monthly Tournament Stats
6
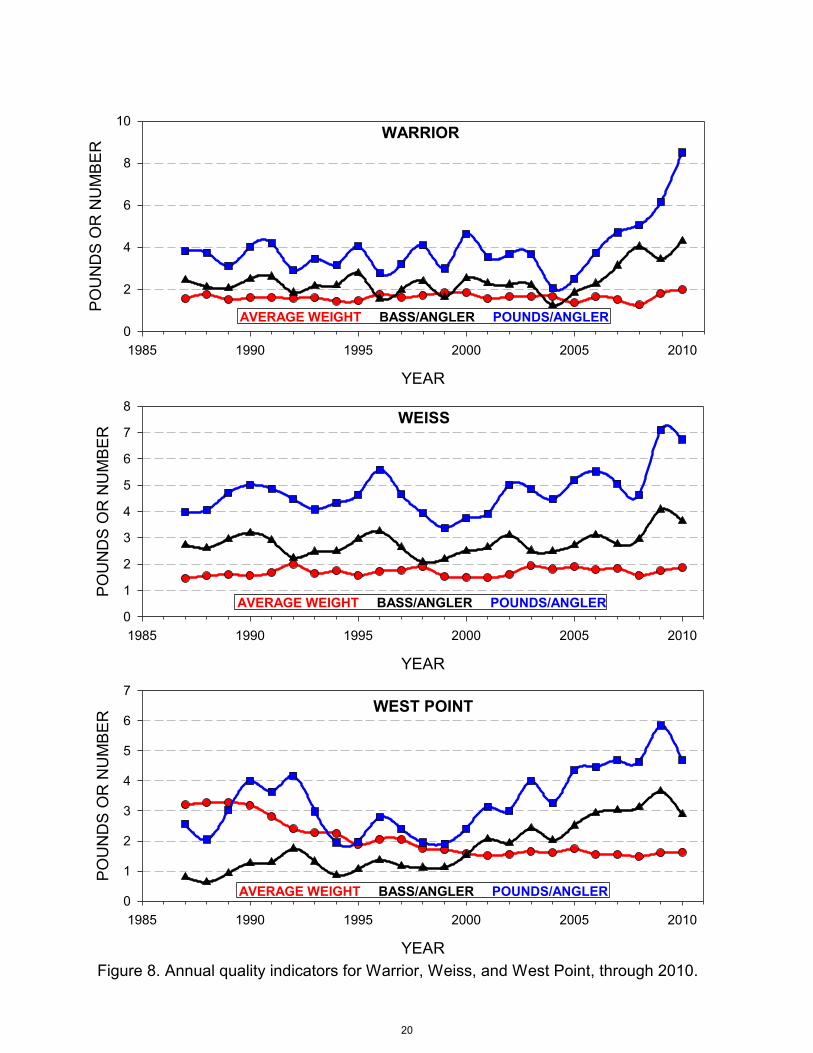
Weiss
Twenty-two tournaments were reported during each month from
March through October, but most tournaments occurred in May (7). Four
hundred twenty anglers fished for 3,756 hours to catch 1,369 bass that
weighed 2,455 pounds, with an average size of 1 lb. 14 oz.
Catch-rates fell slightly, but remained well above the 25-yr.
average for this reservoir. The fishery at Weiss was split equally
between largemouth and spotted bass, which remained fairly consistent
throughout the year.
The frequency of bass over five pounds was very similar to the 25-
yr. average, and the time required to catch them was 235 hours. The
number of bass caught per angler-day (3.64) and the number of pounds
per angler-day (6.74 pounds) were both down from 2009, but that year
produced all-time highs for these values.
West Point
During 2010, we received 26 tournament reports with the majority
(6) occurring in September. A total of 338 anglers fished for 3,027 hours,
catching 873 bass that averaged 1.63 pounds each (Table 6). Over 70%
of the bass weighed-in on West Point were spotted bass.
The number of bass caught per angler-day (2.88) was down
almost 20%, but was still more than one fish higher than the historical
average. The number of pounds weighed-in per angler-day (4.69) was
down more than a pound from the previous year, which was the highest
on record.
The number of hours required to catch a bass over five pounds
(202) equaled 2009, which was a significant improvement over previous
years; however, this value does not approach those experienced during
the glory days of the late 1980’s.
Monthly Tournament Stats
7
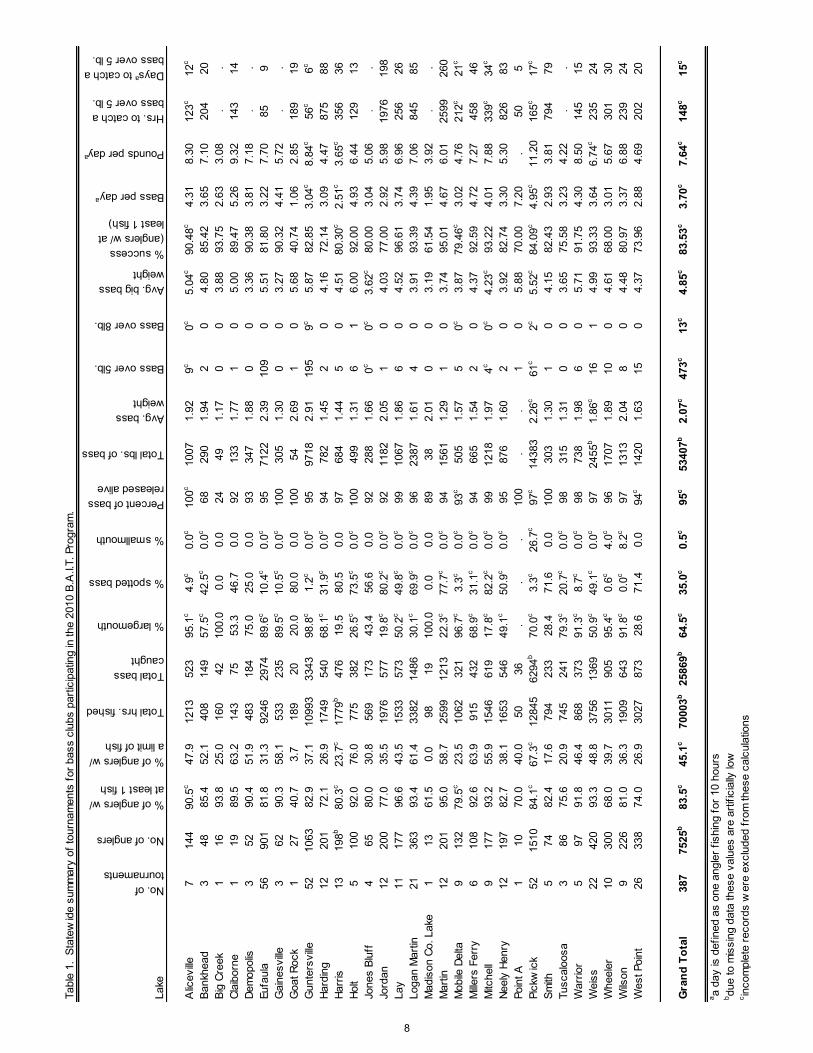
Tabl
e 1.
Sta
tew
ide
sum
mar
y of
tour
nam
ents
for b
ass
club
s pa
rtici
patin
g in
the
2010
B.A
.I.T.
Pro
gram
.
Lake
No. of tournaments
No. of anglers
% of anglers w/ at least 1 fish
% of anglers w/ a limit of fish
Total hrs. fished
Total bass caught
% largemouth
% spotted bass
% smallmouth
Percent of bass released alive
Total lbs. of bass
Avg. bass weight
Bass over 5lb.
Bass over 8lb.
Avg. big bass weight
% success (anglers w/ at least 1 fish)
Bass per daya
Pounds per daya
Hrs. to catch a bass over 5 lb.
Daysa to catch a bass over 5 lb.
Alic
eville
714
490
.5c
47.9
1213
523
95.1
c4.
9c0.
0c10
0c10
071.
929c
0c5.
04c
90.4
8c4.
318.
3012
3c12
c
Bank
head
348
85.4
52.1
408
149
57.5
c42
.5c
0.0c
6829
01.
942
04.
8085
.42
3.65
7.10
204
20Bi
g Cr
eek
116
93.8
25.0
160
4210
0.0
0.0
0.0
2449
1.17
00
3.88
93.7
52.
633.
08.
.Cl
aibo
rne
119
89.5
63.2
143
7553
.346
.70.
092
133
1.77
10
5.00
89.4
75.
269.
3214
314
Dem
opol
is3
5290
.451
.948
318
475
.025
.00.
093
347
1.88
00
3.36
90.3
83.
817.
18.
.Eu
faul
a56
901
81.8
31.3
9246
2974
89.6
c10
.4c
0.0c
9571
222.
3910
90
5.51
81.8
03.
227.
7085
9G
aine
sville
362
90.3
58.1
533
235
89.5
c10
.5c
0.0c
100
305
1.30
00
3.27
90.3
24.
415.
72.
.G
oat R
ock
127
40.7
3.7
189
2020
.080
.00.
010
054
2.69
10
5.68
40.7
41.
062.
8518
919
Gun
ters
ville
5210
6382
.937
.110
993
3343
98.8
c1.
2c0.
0c95
9718
2.91
195
9c5.
8782
.85
3.04
c8.
84c
56c
6c
Hard
ing
1220
172
.126
.917
4954
068
.1c
31.9
c0.
0c94
782
1.45
20
4.16
72.1
43.
094.
4787
588
Harr
is13
198b
80.3
c23
.7c
1779
b47
619
.580
.50.
097
684
1.44
50
4.51
80.3
0c2.
51c
3.65
c35
636
Holt
510
092
.076
.077
538
226
.5c
73.5
c0.
0c10
049
91.
316
16.
0092
.00
4.93
6.44
129
13Jo
nes
Bluf
f4
6580
.030
.856
917
343
.456
.60.
092
288
1.66
0c0c
3.62
c80
.00
3.04
5.06
..
Jord
an12
200
77.0
35.5
1976
577
19.8
c80
.2c
0.0c
9211
822.
051
04.
0377
.00
2.92
5.98
1976
198
Lay
1117
796
.643
.515
3357
350
.2c
49.8
c0.
0c99
1067
1.86
60
4.52
96.6
13.
746.
9625
626
Loga
n M
artin
2136
393
.461
.433
8214
8630
.1c
69.9
c0.
0c96
2387
1.61
40
3.91
93.3
94.
397.
0684
585
Mad
ison
Co.
Lak
e1
1361
.50.
098
1910
0.0
0.0
0.0
8938
2.01
00
3.19
61.5
41.
953.
92.
.M
artin
1220
195
.058
.725
9912
1322
.3c
77.7
c0.
0c94
1561
1.29
10
3.74
95.0
14.
676.
0125
9926
0M
obile
Del
ta9
132
79.5
c23
.510
6232
196
.7c
3.3c
0.0c
93c
505
1.57
50c
3.87
79.4
6c3.
024.
7621
2c21
c
Mille
rs F
erry
610
892
.663
.991
543
268
.9c
31.1
c0.
0c94
665
1.54
20
4.37
92.5
94.
727.
2745
846
Mitc
hell
917
793
.255
.915
4661
917
.8c
82.2
c0.
0c99
1218
1.97
4c0c
4.23
c93
.22
4.01
7.88
339c
34c
Neel
y He
nry
1219
782
.738
.116
5354
649
.1c
50.9
c0.
0c95
876
1.60
20
3.92
82.7
43.
305.
3082
683
Poin
t A1
1070
.040
.050
36.
..
100
..
10
5.88
70.0
07.
20.
505
Pick
wic
k52
1510
84.1
c67
.3c
1284
562
94b
70.0
c3.
3c26
.7c
97c
1438
32.
26c
61c
2c5.
52c
84.0
9c4.
95c
11.2
016
5c17
c
Smith
574
82.4
17.6
794
233
28.4
71.6
0.0
100
303
1.30
10
4.15
82.4
32.
933.
8179
479
Tusc
aloo
sa3
8675
.620
.974
524
179
.3c
20.7
c0.
0c98
315
1.31
00
3.65
75.5
83.
234.
22.
.W
arrio
r5
9791
.846
.486
837
391
.3c
8.7c
0.0c
9873
81.
986
05.
7191
.75
4.30
8.50
145
15W
eiss
2242
093
.348
.837
5613
6950
.9c
49.1
c0.
0c97
2455
b1.
86c
161
4.99
93.3
33.
646.
74c
235
24W
heel
er10
300
68.0
39.7
3011
905
95.4
c0.
6c4.
0c96
1707
1.89
100
4.61
68.0
03.
015.
6730
130
Wils
on9
226
81.0
36.3
1909
643
91.8
c0.
0c8.
2c97
1313
2.04
80
4.48
80.9
73.
376.
8823
924
Wes
t Poi
nt26
338
74.0
26.9
3027
873
28.6
71.4
0.0
94c
1420
1.63
150
4.37
73.9
62.
884.
6920
220
Gra
nd T
otal
387
7525
b83
.5c
45.1
c70
003b
2586
9b64
.5c
35.0
c0.
5c95
c53
407b
2.07
c47
3c13
c4.
85c
83.5
3c3.
70c
7.64
c14
8c15
c
a a da
y is
def
ined
as
one
angl
er fi
shin
g fo
r 10
hour
sb du
e to
mis
sing
dat
a th
ese
valu
es a
re a
rtific
ially
low
c inco
mpl
ete
reco
rds
wer
e ex
clud
ed fr
om th
ese
calc
ulat
ions
8
Tabl
e 2.
Ran
king
by
qual
ity in
dica
tors
for a
ll re
serv
oirs
with
five
or m
ore
tour
nam
ent r
epor
ts in
the
2010
B.A
.I.T.
Pro
gram
.P
erce
ntA
vera
ge B
ass
Bas
s pe
rP
ound
s pe
rH
ours
per
Ran
kS
ucce
ssW
eigh
tA
ngle
r-Day
Ang
ler-D
ayB
ass
> 5
lbs.
Ove
rall
Val
ue
1La
yG
unte
rsvil
leP
ickw
ick
Pic
kwic
kG
unte
rsvil
leP
ickw
ick
892
Mar
tinE
ufau
laH
olt
Gun
ters
ville
Euf
aula
War
rior
813
Loga
n M
artin
Pic
kwic
kM
iller
s Fe
rryW
arrio
rA
licev
ille
Gun
ters
ville
804
Wei
ssJo
rdan
Mar
tinA
licev
ille
Hol
tA
licev
ille
805
Mitc
hell
Wils
onLo
gan
Mar
tinM
itche
llW
arrio
rE
ufau
la73
6M
iller
s Fe
rryW
arrio
rA
licev
ille
Euf
aula
Pic
kwic
kM
itche
ll72
7H
olt
Mitc
hell
War
rior
Mill
ers
Ferry
Wes
t Poi
ntLa
y70
8W
arrio
rA
licev
ille
Mitc
hell
Loga
n M
artin
Mob
ile D
elta
Hol
t66
9A
licev
ille
Whe
eler
Lay
Lay
Wei
ssW
eiss
6510
Pic
kwic
kLa
yW
eiss
Wils
onW
ilson
Mill
ers
Ferry
6311
Gun
ters
ville
Wei
ssW
ilson
Wei
ssLa
yLo
gan
Mar
tin63
12N
eely
Hen
ryW
est P
oint
Nee
ly H
enry
Hol
tW
heel
erW
ilson
5913
Sm
ithLo
gan
Mar
tinE
ufau
laM
artin
Mitc
hell
Mar
tin49
14E
ufau
laN
eely
Hen
ryH
ardi
ngJo
rdan
Har
risN
eely
Hen
ry39
15W
ilson
Mob
ile D
elta
Gun
ters
ville
Whe
eler
Mill
ers
Ferry
Mob
ile D
elta
3716
Har
risM
iller
s Fe
rryM
obile
Del
taN
eely
Hen
ryS
mith
Whe
eler
3617
Mob
ile D
elta
Har
ding
Whe
eler
Mob
ile D
elta
Nee
ly H
enry
Jord
an35
18Jo
rdan
Har
risS
mith
Wes
t Poi
ntLo
gan
Mar
tinW
est P
oint
3419
Wes
t Poi
ntH
olt
Jord
anH
ardi
ngH
ardi
ngS
mith
2320
Har
ding
Sm
ithW
est P
oint
Sm
ithJo
rdan
Har
ding
2121
Whe
eler
Mar
tinH
arris
Har
risM
artin
Har
ris20
9
Tabl
e 3.
Tou
rnam
ent s
umm
ary
for b
ass
club
s pa
rtici
patin
g in
the
2010
B.A
.I.T.
Pro
gram
.
Club
No.
No. of tournaments
No. of anglers
% of anglers w/ at least 1 fish
% of anglers w/ a limit of fish
Total hrs. fished
Total bass caught
% largemouth
% spotted bass
% smallmouth
Percent of bass released alive
Total lbs. of bass
Avg. bass weight
Bass over 5lb.
Bass over 8lb.
Avg. big bass weight
% success (anglers w/ at least 1 fish)
Bass per daya
Pounds per daya
Hrs. to catch a bass over 5 lb.
Daysa to catch a bass over 5 lb.
122
437
75.5
24.5
3881
1068
79.8
20.2
0.0
9826
342.
4758
05.
8975
.51
2.75
6.79
677
29
125
84.8
20.8
1044
308
77.6
22.4
0.0
62c
488
1.58
30
3.92
84.8
02.
954.
6834
835
311
129
72.1
15.5
1154
290
74.8
23.8
1.4
9750
41.
743
03.
9472
.09
2.51
4.37
385
394
1015
291
.558
.613
4154
370
.329
.70.
088
907
1.67
20
3.89
91.4
54.
056.
7767
167
510
286
86.4
38.1
2592
826
26.8
73.2
0.0
9714
601.
776
15.
0486
.36
3.19
5.63
432
436
1123
290
.531
.519
9170
150
.949
.10.
096
1258
1.79
4c0c
4.53
c90
.52
3.52
6.32
450c
45c
71
3287
.546
.925
611
9.
..
100
264
2.22
40
7.25
87.5
04.
6510
.32
646
85
101
81.2
42.6
929
267
87.6
12.0
0.4
9664
22.
4023
05.
8981
.19
2.88
6.91
404
91
757
.10.
056
1492
.97.
10.
010
048
3.43
40
7.88
57.1
42.
508.
5814
110
535
975
.558
.232
3111
8197
.00.
03.
097
3397
2.88
766
6.95
75.4
93.
6610
.52
434
112
7879
.538
.566
322
3.
..
100
287
1.29
00
3.94
79.4
93.
364.
34.
.12
813
064
.5c
46.9
975
356
100.
00.
00.
010
011
973.
3624
27.
2764
.47c
3.65
12.2
741
413
716
590
.963
.614
0163
967
.033
.00.
095
1320
2.07
100
5.39
90.9
14.
569.
4214
014
141
1070
.040
.050
36.
..
100
..
10
5.88
70.0
07.
20.
505
1511
122
72.1
18.0
1020
304
86.2
4.0
9.8
9562
52.
056
04.
2572
.13
2.98
6.13
170
1716
715
796
.268
.212
4260
516
.983
.10.
010
092
91.
538
05.
1196
.18
4.87
7.48
155
1617
1235
281
.338
.931
4310
02.
..
9718
821.
8812
05.
0681
.25
3.19
5.99
157
1618
1115
996
.257
.213
7660
653
.0c
47.0
c0.
0c10
012
692.
0910
15.
1496
.23
4.41
9.22
138
1419
822
088
.652
.724
3996
9.
..
9719
412.
0013
05.
0788
.64
3.97
7.96
188
1920
1313
789
.148
.915
8055
261
.337
.90.
899
1072
1.94
161
4.15
89.0
53.
496.
7894
921
1017
792
.765
.516
7287
0.
..
9717
161.
976
04.
9892
.66
5.20
10.2
627
928
2256
1588
.67
.413
498
6622
..
..
1497
42.
2466
25.
41.
4.96
11.0
916
016
2315
623
7083
.433
.224
471
7768
56.4
43.5
0.1
9414
593
1.89
118
04.
5183
.42
3.16
5.98
207
21
Gra
nd T
otal
387
7525
b83
.5c
45.1
c70
003b
2586
9b64
.5c
35.0
c0.
5c95
c53
407b
2.07
c47
3c13
c4.
85c
83.5
3c3.
70c
7.64
c14
8c15
c
a a da
y is
def
ined
as
one
angl
er fi
shin
g fo
r 10
hour
sb du
e to
mis
sing
dat
a th
ese
valu
es a
re a
rtific
ially
low
c inco
mpl
ete
reco
rds
wer
e ex
clud
ed fr
om th
ese
calc
ulat
ions
10
Club
Nam
eA
ddre
ssCi
tySt
ate
Zip
Code
Repr
esen
tativ
ePh
one
NATI
ONA
L BA
SS T
RAIL
(GA
/AL)
979
KENN
ON
DR.
CATA
LULA
GA
3180
4BL
AIN
E SO
UERW
INE
706-
494-
0699
AUB
URN
BASS
MA
STER
S60
9 M
ORR
IS A
VE.
OPE
LIKA
AL
3680
1W
ILLI
AM
FLO
RENC
E33
4-52
4-18
64BA
IT D
iv. I
II55
82 C
O. R
D. 2
6RO
GER
SVIL
LEA
L35
652
BARR
Y B
EDIN
GFI
ELD
256-
762-
4939
BIRM
ING
HAM
BA
SSM
AST
ERS
1378
4 DI
ANN
E DR
.M
cCA
LLA
AL
3511
1M
IKE
LINN
205-
477-
7643
BLA
CK W
ARR
IOR
BASS
TRA
CKER
S55
14 S
UMM
ERFI
ELD
DR E
TUSC
ALO
OSA
AL
3540
4CH
ARL
IE T
IDM
ORE
205-
553-
2919
BOEI
NG B
ASS
CLU
B26
555
LAM
BERT
RO
AD
ELKM
ONT
AL
3652
0JO
ANT
HAN
MA
NTEU
FFEL
256-
423-
8674
EAST
ALA
BAM
A B
ASS
CLU
B24
63 L
EE R
D. 4
2O
PELI
KAA
L36
804
ART
HUR
HERN
DON
334-
749-
1261
FAY
ETTE
BA
SS C
LUB
1099
1 HW
Y 1
3 N.
BANK
STO
NA
L35
442
TODD
TUC
KER
205-
689-
4707
FISH
ERS
OF
MEN
- SO
UTH
ALA
.P.
O. B
OX
2222
E. B
REW
TON
AL
3642
7A
LLEN
CO
UCH
251-
867-
9852
GEO
RIG
A B
ASS
FED
ERA
TIO
NBI
OLO
GY
DEP
T., 1
601
MA
PLE
ST.
CARR
OLL
TON
GA
3011
8DR
. CA
RL Q
UERT
ERM
US67
8-83
9-40
35KO
WA
LIG
A47
4 N.
ANN
AV
E.TA
LLA
SSEE
AL
3607
8HA
NK G
OLD
EN33
4-28
3-61
17LA
KE G
UNTE
RSV
ILLE
BA
SSM
AST
ERS
3480
LIT
TLE
DR S
WHA
RTSE
LLE
AL
3564
0PH
IL E
KEM
A25
6-75
1-36
56M
ISS.
DIV
. WIL
DLIF
E, F
ISHE
RIES
& P
ARK
S15
05 E
AST
OV
ER D
R.JA
CKSO
NM
S39
215
LARR
Y P
UGH
601-
432-
2208
MO
BILE
BA
SSM
AST
ERS
4951
GO
VER
NMEN
T BL
VD.
MO
BILE
AL
3669
3BO
B ST
EELE
251-
661-
9600
MO
RGA
N CO
UNTY
BA
SS C
LUB
171
ROSE
CLIF
F DR
.HA
RVES
TA
L35
749
KEV
IN M
AY
ES25
6-83
7-57
11NO
RTH
ALA
BAM
A T
OUR
NAM
ENT
ANG
LERS
2496
3 LI
SA D
R.A
THEN
SA
L35
613
STA
N SH
ERRO
D25
6-23
0-00
81NO
RTH
BIBB
BA
SS C
LUB
1177
MT.
CA
RMEL
DR.
WES
T BL
OCK
TON
AL
3518
4DO
UG H
AY
NES
205-
938-
2455
NORT
H JA
CKSO
N BA
SS C
LUB
P. O
. BO
X 43
0BR
IDG
EPO
RTA
L35
740
LONN
IE M
OO
DY25
6-59
9-60
31NO
RTHP
ORT
BA
SS C
LUB
1100
8 BU
STER
TIE
RCE
SPUR
NORT
HPO
RTA
L35
475
ROBE
RT F
INDL
AY
205-
339-
5546
PICK
ENSV
ILLE
MA
RINE
TRA
ILP.
O. B
OX
555
FAY
ETTE
AL
3555
5RA
LEIG
H RY
AN
205-
442-
1009
POW
DER
SPRI
NGS
BASS
CLU
B11
6 LI
NDA
LN.
POW
DER
SPRI
NGS
GA
3012
7JA
MES
LA
NKFO
RD77
0-56
0-80
13SU
NDA
Y A
FTER
NOO
N RE
DNEC
KS67
5 FI
R ST
.FL
ORA
LAA
L36
442
TOM
DEN
NIS
WES
T A
LABA
MA
BA
SS F
ISHE
RMA
NS A
SSN.
P.O
. BO
X 21
0G
ORD
OA
L.35
466
JEFF
GIL
LIA
M20
5-36
4-85
30
Tabl
e 4.
Clu
bs s
uppo
rting
the
2010
B.A
.I.T.
ann
ual r
epor
t.
11
Tabl
e 5.
Sta
tew
ide
sum
mar
y of
bas
s to
urna
men
ts b
y m
onth
for b
ass
club
s pa
rtici
patin
g in
the
2010
B.A
.I.T.
Pro
gram
.
Mon
th
No. of tournaments
No. of anglers
% of anglers w/ at least 1 fish
% of anglers w/ a limit of fish
Total hrs. fished
Total bass caught
% largemouth
% spotted bass
% smallmouth
Percent of bass released alive
Total lbs. of bass
Avg. bass weight
Bass over 5lb.
Bass over 8lb.
Avg. big bass weight
% success (anglers w/ at least 1 fish)
Bass per daya
Pounds per daya
Hrs. to catch a bass over 5 lb.
Daysa to catch a bass over 5 lb.
JAN
1219
729
.210
.716
4219
562
.731
.45.
910
037
31.
922
03.
6329
.21
1.19
2.27
783
78FE
B35
706
66.8
24.8
5995
1521
73.7
24.3
2.0
100
3566
2.34
543
5.70
66.8
32.
545.
9510
511
MA
R45
944
82.5
39.9
8988
3053
73.7
26.3
0.0
9875
112.
4615
07
5.59
82.4
83.
408.
3656
6A
PR44
885
93.9
66.9
8119
3804
74.4
25.6
0.0
9685
422.
2775
15.
3493
.86
4.69
10.5
910
711
MA
Y45
953
94.6
62.7
9222
3997
79.1
20.7
0.2
9385
562.
1449
05.
1794
.55
4.33
9.28
179
18JU
N44
878
87.4
47.8
8134
3064
77.9
21.3
0.8
9071
202.
3254
25.
0487
.43
3.77
8.75
143
14JU
L27
495
82.5
41.8
4451
1468
66.3
31.0
2.8
9232
672.
2318
04.
9782
.54
3.30
7.34
218
22A
UG24
406
76.2
25.6
3679
987
66.5
31.3
2.2
9020
571.
9518
04.
6176
.22
2.79
5.59
193
19SE
P33
562
85.3
40.7
4832
1835
56.3
43.7
0.0
9731
681.
7715
04.
0785
.27
3.62
6.40
311
31O
CT43
975
85.9
40.8
9490
3842
33.0
66.8
0.2
9557
271.
4927
04.
2285
.93
4.05
6.03
348
35NO
V21
328
90.3
54.3
3222
1296
27.0
73.0
0.0
9920
931.
613
03.
7490
.31
4.02
6.50
1011
101
DEC
1419
689
.350
.022
3180
734
.665
.20.
199
1426
1.77
80
3.97
89.2
93.
486.
2427
928
Gra
nd T
otal
387
7525
b83
.5c
45.1
c70
003b
2586
9b64
.5c
35.0
c0.
5c95
c53
407b
2.07
c47
3c13
c4.
85c
83.5
3c3.
70c
7.64
c14
8c15
c
a a da
y is
def
ined
as
one
angl
er fi
shin
g fo
r 10
hour
sb du
e to
mis
sing
dat
a th
ese
valu
es a
re a
rtific
ially
low
c inco
mpl
ete
reco
rds
wer
e ex
clud
ed fr
om th
ese
calc
ulat
ions
12
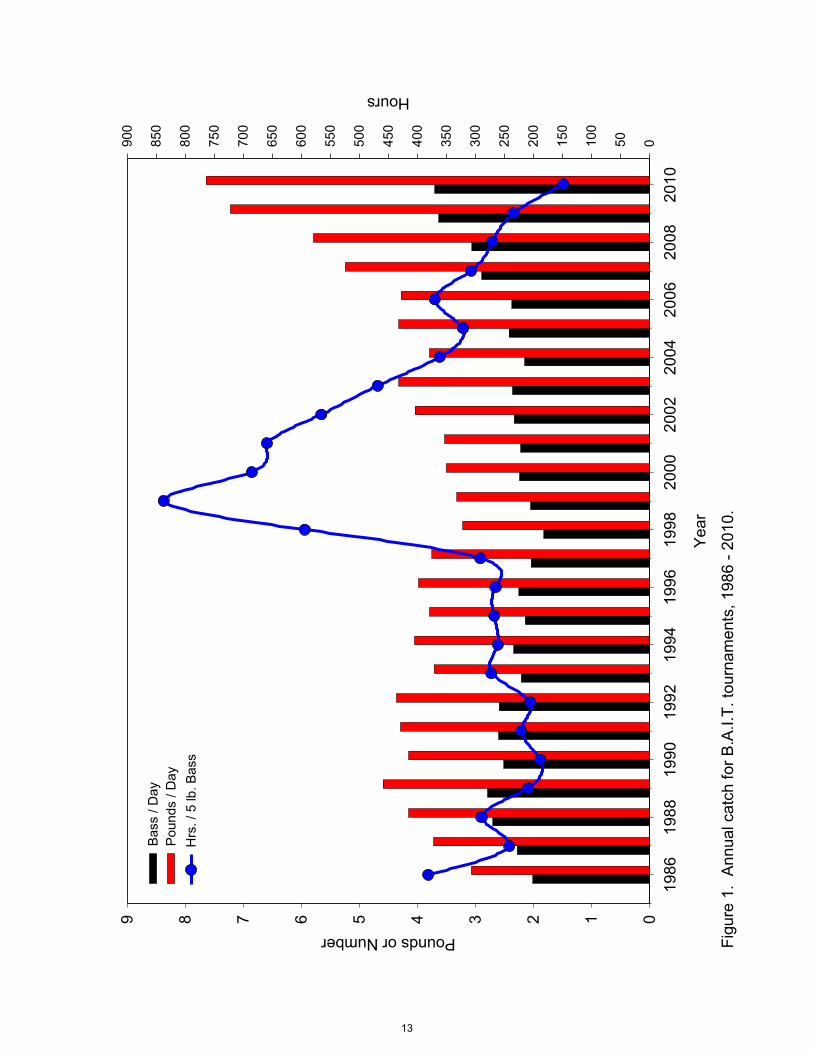
Figu
re 1
. A
nnua
l cat
ch fo
r B.A
.I.T.
tour
nam
ents
, 198
6 - 2
010.
Year
1986
1988
1990
1992
1994
1996
1998
2000
2002
2004
2006
2008
2010
Pounds or Number
0123456789Ba
ss /
Day
Poun
ds /
Day
Hours
050100
150
200
250
300
350
400
450
500
550
600
650
700
750
800
850
900
Hrs
. / 5
lb. B
ass
13
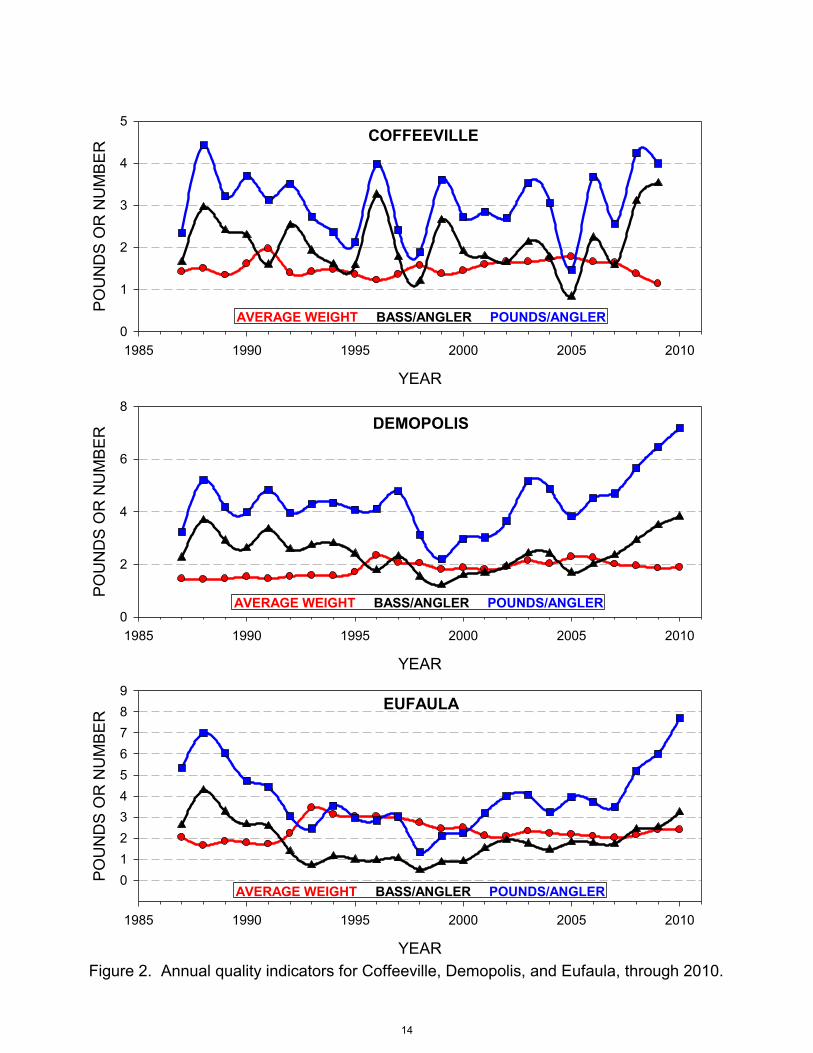
Figure 2. Annual quality indicators for Coffeeville, Demopolis, and Eufaula, through 2010.
YEAR
1985 1990 1995 2000 2005 2010
PO
UN
DS
OR
NU
MB
ER
0
1
2
3
4
5
YEAR
1985 1990 1995 2000 2005 2010
PO
UN
DS
OR
NU
MB
ER
0
2
4
6
8
AVERAGE WEIGHT BASS/ANGLER POUNDS/ANGLER
COFFEEVILLE
AVERAGE WEIGHT BASS/ANGLER POUNDS/ANGLER
DEMOPOLIS
YEAR
1985 1990 1995 2000 2005 2010
PO
UN
DS
OR
NU
MB
ER
0123456789
EUFAULA
AVERAGE WEIGHT BASS/ANGLER POUNDS/ANGLER
14
YEAR
1985 1990 1995 2000 2005 2010
PO
UN
DS
OR
NU
MB
ER
0
2
4
6
8
YEAR
1985 1990 1995 2000 2005 2010
PO
UN
DS
OR
NU
MB
ER
0
2
4
6
8
10
AVERAGE WEIGHT BASS/ANGLER POUNDS/ANGLER
GAINESVILLE
AVERAGE WEIGHT BASS/ANGLER POUNDS/ANGLER
GUNTERSVILLE
YEAR
1985 1990 1995 2000 2005 2010
PO
UN
DS
OR
NU
MB
ER
0
1
2
3
4
5
6HARDING
AVERAGE WEIGHT BASS/ANGLER POUNDS/ANGLER
Figure 3. Annual quality indicators for Gainesville, Guntersville, and Harding, through 2010.
15
YEAR
1985 1990 1995 2000 2005 2010
PO
UN
DS
OR
NU
MB
ER
0
1
2
3
4
5
6
7
YEAR
1985 1990 1995 2000 2005 2010
PO
UN
DS
OR
NU
MB
ER
0
1
2
3
4
5
6
7
8
AVERAGE WEIGHT BASS/ANGLER POUNDS/ANGLER
HARRIS
AVERAGE WEIGHT BASS/ANGLER POUNDS/ANGLER
JONES BLUFF
YEAR
1985 1990 1995 2000 2005 2010
PO
UN
DS
OR
NU
MB
ER
0
1
2
3
4
5
6
7
8JORDAN
AVERAGE WEIGHT BASS/ANGLER POUNDS/ANGLER
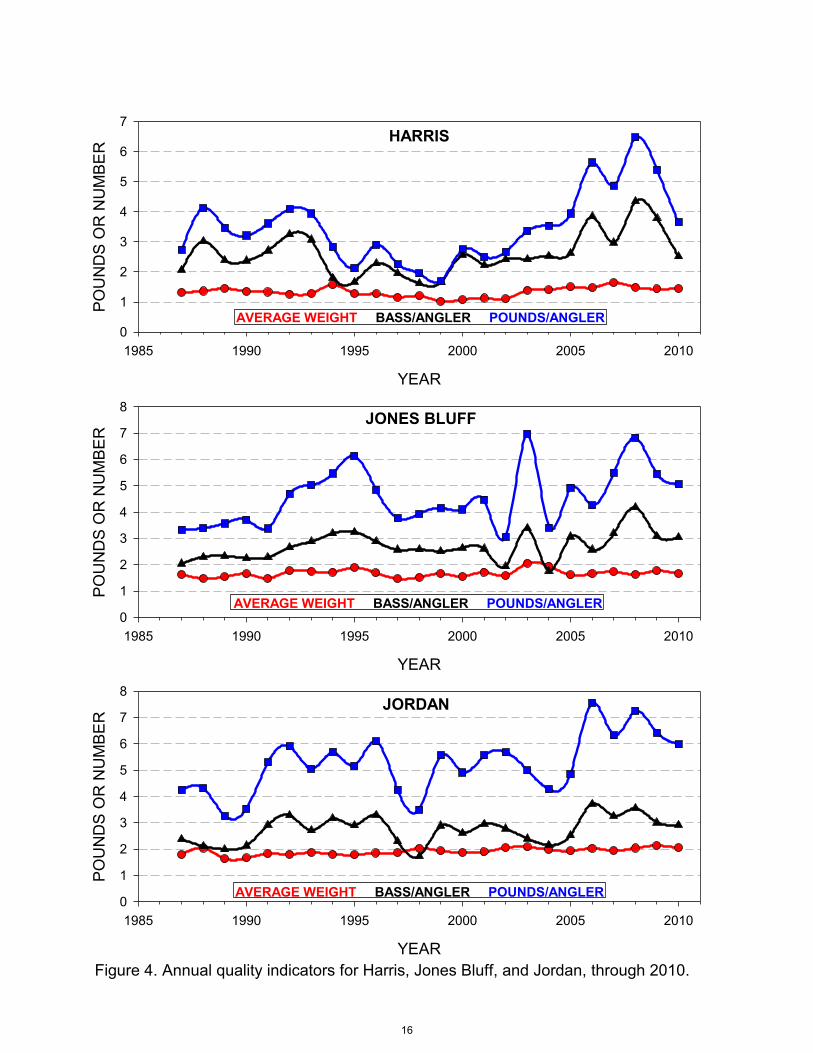
Figure 4. Annual quality indicators for Harris, Jones Bluff, and Jordan, through 2010.
16
YEAR
1985 1990 1995 2000 2005 2010
PO
UN
DS
OR
NU
MB
ER
0
2
4
6
8
YEAR
1985 1990 1995 2000 2005 2010
PO
UN
DS
OR
NU
MB
ER
0
1
2
3
4
5
6
7
8
AVERAGE WEIGHT BASS/ANGLER POUNDS/ANGLER
LAY
AVERAGE WEIGHT BASS/ANGLER POUNDS/ANGLER
LOGAN MARTIN
YEAR
1985 1990 1995 2000 2005 2010
PO
UN
DS
OR
NU
MB
ER
0
1
2
3
4
5
6
7MARTIN
AVERAGE WEIGHT BASS/ANGLER POUNDS/ANGLER
Figure 5. Annual quality indicators for Lay, Logan Martin, and Martin, through 2010.
17
AVERAGE WEIGHT BASS/ANGLER POUNDS/ANGLER
MITCHELL
YEAR
1985 1990 1995 2000 2005 2010
PO
UN
DS
OR
NU
MB
ER
0
1
2
3
4
5MOBILE DELTA
AVERAGE WEIGHT BASS/ANGLER POUNDS/ANGLER
Figure 6. Annual quality indicators for Millers Ferry, Mitchell, and the Mobile Delta, through 2010.
YEAR
1985 1990 1995 2000 2005 2010
PO
UN
DS
OR
NU
MB
ER
0
2
4
6
8
10
12
YEAR
1985 1990 1995 2000 2005 2010
PO
UN
DS
OR
NU
MB
ER
0
1
2
3
4
5
6
7
8
9
AVERAGE WEIGHT BASS/ANGLER POUNDS/ANGLER
MILLERS FERRY
MITCHELL
18
YEAR
1985 1990 1995 2000 2005 2010
PO
UN
DS
OR
NU
MB
ER
0
1
2
3
4
5
6
7
YEAR
1985 1990 1995 2000 2005 2010
PO
UN
DS
OR
NU
MB
ER
0123456789
101112
AVERAGE WEIGHT BASS/ANGLER POUNDS/ANGLER
NEELY HENRY
AVERAGE WEIGHT BASS/ANGLER POUNDS/ANGLER
PICKWICK
YEAR
1985 1990 1995 2000 2005 2010
PO
UN
DS
OR
NU
MB
ER
0
1
2
3
4
5SMITH
AVERAGE WEIGHT BASS/ANGLER POUNDS/ANGLER
Figure 7. Annual quality indicators for Neely Henry, Pickwick, and Smith, through 2010.
19
YEAR
1985 1990 1995 2000 2005 2010
PO
UN
DS
OR
NU
MB
ER
0
2
4
6
8
10
YEAR
1985 1990 1995 2000 2005 2010
PO
UN
DS
OR
NU
MB
ER
0
1
2
3
4
5
6
7
8
AVERAGE WEIGHT BASS/ANGLER POUNDS/ANGLER
WARRIOR
AVERAGE WEIGHT BASS/ANGLER POUNDS/ANGLER
WEISS
YEAR
1985 1990 1995 2000 2005 2010
PO
UN
DS
OR
NU
MB
ER
0
1
2
3
4
5
6
7WEST POINT
AVERAGE WEIGHT BASS/ANGLER POUNDS/ANGLER
Figure 8. Annual quality indicators for Warrior, Weiss, and West Point, through 2010.
20
YEAR
1985 1990 1995 2000 2005 2010
PO
UN
DS
OR
NU
MB
ER
0
2
4
6
8
YEAR
1985 1990 1995 2000 2005 2010
PO
UN
DS
OR
NU
MB
ER
0123456789
10
AVERAGE WEIGHT BASS/ANGLER POUNDS/ANGLER
WHEELER
AVERAGE WEIGHT BASS/ANGLER POUNDS/ANGLER
WILSON
Figure 9. Annual quality indicators for Wheeler and Wilson, through 2010.
21
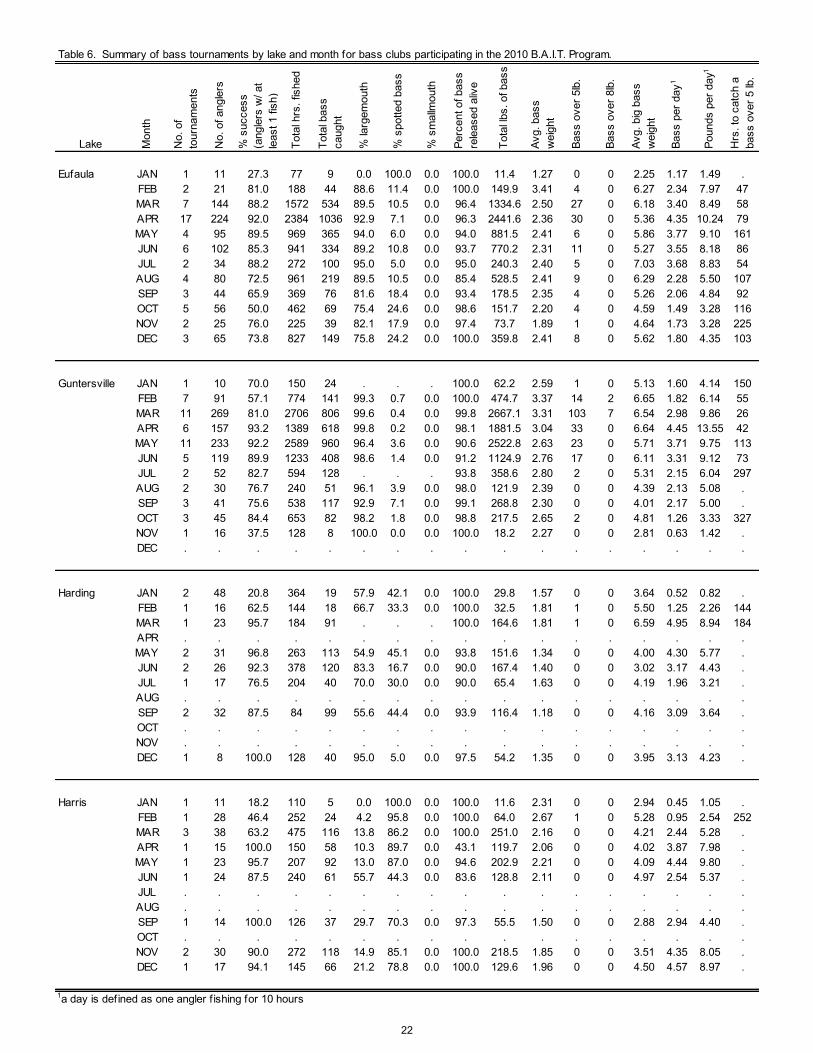
Table 6. Summary of bass tournaments by lake and month for bass clubs participating in the 2010 B.A.I.T. Program.
Lake Mon
th
No.
of
tour
nam
ents
No.
of a
ngle
rs
% s
ucce
ss
(ang
lers
w/ a
t le
ast 1
fish
)
Tota
l hrs
. fis
hed
Tota
l bas
s ca
ught
% la
rgem
outh
% s
potte
d ba
ss
% s
mal
lmou
th
Perc
ent o
f bas
s re
leas
ed a
live
Tota
l lbs.
of b
ass
Avg.
bas
s w
eigh
t
Bass
ove
r 5lb
.
Bass
ove
r 8lb
.
Avg.
big
bas
s w
eigh
t
Bass
per
day
1
Poun
ds p
er d
ay1
Hrs
. to
catc
h a
bass
ove
r 5 lb
.
Eufaula JAN 1 11 27.3 77 9 0.0 100.0 0.0 100.0 11.4 1.27 0 0 2.25 1.17 1.49 .FEB 2 21 81.0 188 44 88.6 11.4 0.0 100.0 149.9 3.41 4 0 6.27 2.34 7.97 47MAR 7 144 88.2 1572 534 89.5 10.5 0.0 96.4 1334.6 2.50 27 0 6.18 3.40 8.49 58APR 17 224 92.0 2384 1036 92.9 7.1 0.0 96.3 2441.6 2.36 30 0 5.36 4.35 10.24 79MAY 4 95 89.5 969 365 94.0 6.0 0.0 94.0 881.5 2.41 6 0 5.86 3.77 9.10 161JUN 6 102 85.3 941 334 89.2 10.8 0.0 93.7 770.2 2.31 11 0 5.27 3.55 8.18 86JUL 2 34 88.2 272 100 95.0 5.0 0.0 95.0 240.3 2.40 5 0 7.03 3.68 8.83 54AUG 4 80 72.5 961 219 89.5 10.5 0.0 85.4 528.5 2.41 9 0 6.29 2.28 5.50 107SEP 3 44 65.9 369 76 81.6 18.4 0.0 93.4 178.5 2.35 4 0 5.26 2.06 4.84 92OCT 5 56 50.0 462 69 75.4 24.6 0.0 98.6 151.7 2.20 4 0 4.59 1.49 3.28 116NOV 2 25 76.0 225 39 82.1 17.9 0.0 97.4 73.7 1.89 1 0 4.64 1.73 3.28 225DEC 3 65 73.8 827 149 75.8 24.2 0.0 100.0 359.8 2.41 8 0 5.62 1.80 4.35 103
Guntersville JAN 1 10 70.0 150 24 . . . 100.0 62.2 2.59 1 0 5.13 1.60 4.14 150FEB 7 91 57.1 774 141 99.3 0.7 0.0 100.0 474.7 3.37 14 2 6.65 1.82 6.14 55MAR 11 269 81.0 2706 806 99.6 0.4 0.0 99.8 2667.1 3.31 103 7 6.54 2.98 9.86 26APR 6 157 93.2 1389 618 99.8 0.2 0.0 98.1 1881.5 3.04 33 0 6.64 4.45 13.55 42MAY 11 233 92.2 2589 960 96.4 3.6 0.0 90.6 2522.8 2.63 23 0 5.71 3.71 9.75 113JUN 5 119 89.9 1233 408 98.6 1.4 0.0 91.2 1124.9 2.76 17 0 6.11 3.31 9.12 73JUL 2 52 82.7 594 128 . . . 93.8 358.6 2.80 2 0 5.31 2.15 6.04 297AUG 2 30 76.7 240 51 96.1 3.9 0.0 98.0 121.9 2.39 0 0 4.39 2.13 5.08 .SEP 3 41 75.6 538 117 92.9 7.1 0.0 99.1 268.8 2.30 0 0 4.01 2.17 5.00 .OCT 3 45 84.4 653 82 98.2 1.8 0.0 98.8 217.5 2.65 2 0 4.81 1.26 3.33 327NOV 1 16 37.5 128 8 100.0 0.0 0.0 100.0 18.2 2.27 0 0 2.81 0.63 1.42 .DEC . . . . . . . . . . . . . . . . .
Harding JAN 2 48 20.8 364 19 57.9 42.1 0.0 100.0 29.8 1.57 0 0 3.64 0.52 0.82 .FEB 1 16 62.5 144 18 66.7 33.3 0.0 100.0 32.5 1.81 1 0 5.50 1.25 2.26 144MAR 1 23 95.7 184 91 . . . 100.0 164.6 1.81 1 0 6.59 4.95 8.94 184APR . . . . . . . . . . . . . . . . .MAY 2 31 96.8 263 113 54.9 45.1 0.0 93.8 151.6 1.34 0 0 4.00 4.30 5.77 .JUN 2 26 92.3 378 120 83.3 16.7 0.0 90.0 167.4 1.40 0 0 3.02 3.17 4.43 .JUL 1 17 76.5 204 40 70.0 30.0 0.0 90.0 65.4 1.63 0 0 4.19 1.96 3.21 .AUG . . . . . . . . . . . . . . . . .SEP 2 32 87.5 84 99 55.6 44.4 0.0 93.9 116.4 1.18 0 0 4.16 3.09 3.64 .OCT . . . . . . . . . . . . . . . . .NOV . . . . . . . . . . . . . . . . .DEC 1 8 100.0 128 40 95.0 5.0 0.0 97.5 54.2 1.35 0 0 3.95 3.13 4.23 .
Harris JAN 1 11 18.2 110 5 0.0 100.0 0.0 100.0 11.6 2.31 0 0 2.94 0.45 1.05 .FEB 1 28 46.4 252 24 4.2 95.8 0.0 100.0 64.0 2.67 1 0 5.28 0.95 2.54 252MAR 3 38 63.2 475 116 13.8 86.2 0.0 100.0 251.0 2.16 0 0 4.21 2.44 5.28 .APR 1 15 100.0 150 58 10.3 89.7 0.0 43.1 119.7 2.06 0 0 4.02 3.87 7.98 .MAY 1 23 95.7 207 92 13.0 87.0 0.0 94.6 202.9 2.21 0 0 4.09 4.44 9.80 .JUN 1 24 87.5 240 61 55.7 44.3 0.0 83.6 128.8 2.11 0 0 4.97 2.54 5.37 .JUL . . . . . . . . . . . . . . . . .AUG . . . . . . . . . . . . . . . . .SEP 1 14 100.0 126 37 29.7 70.3 0.0 97.3 55.5 1.50 0 0 2.88 2.94 4.40 .OCT . . . . . . . . . . . . . . . . .NOV 2 30 90.0 272 118 14.9 85.1 0.0 100.0 218.5 1.85 0 0 3.51 4.35 8.05 .DEC 1 17 94.1 145 66 21.2 78.8 0.0 100.0 129.6 1.96 0 0 4.50 4.57 8.97 .
1a day is defined as one angler f ishing for 10 hours
22
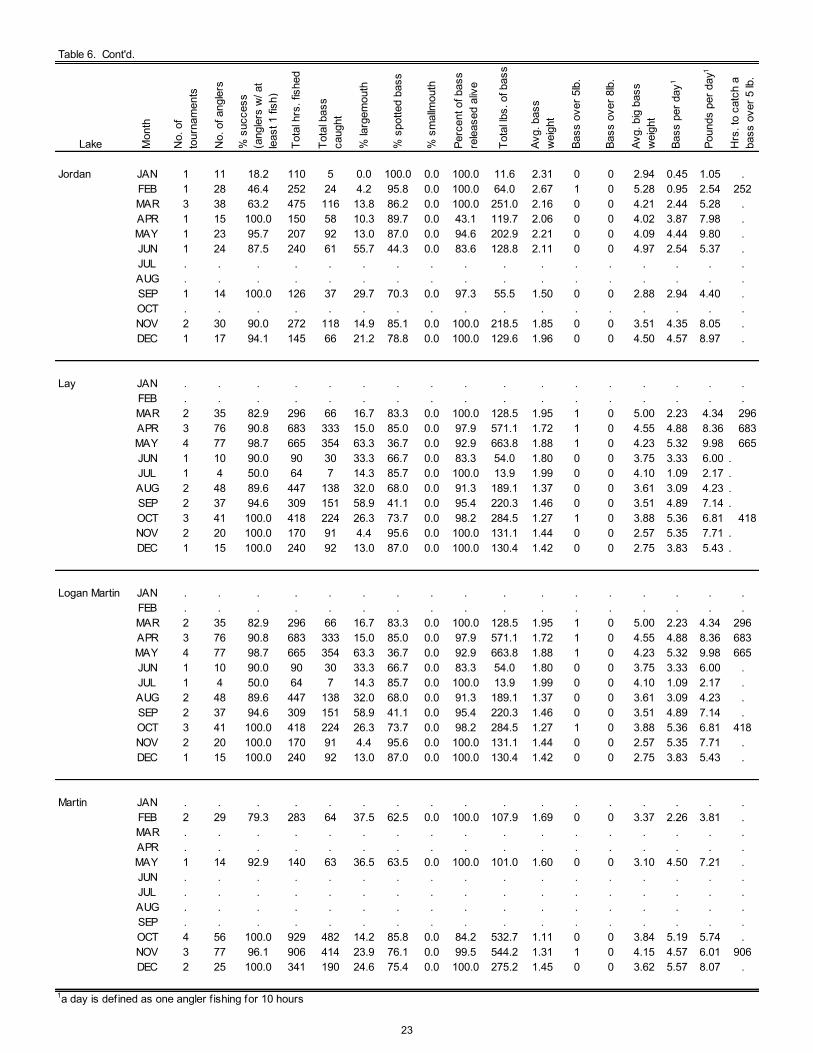
Table 6. Cont'd.
Lake Mon
th
No.
of
tour
nam
ents
No.
of a
ngle
rs
% s
ucce
ss
(ang
lers
w/ a
t le
ast 1
fish
)
Tota
l hrs
. fis
hed
Tota
l bas
s ca
ught
% la
rgem
outh
% s
potte
d ba
ss
% s
mal
lmou
th
Perc
ent o
f bas
s re
leas
ed a
live
Tota
l lbs.
of b
ass
Avg.
bas
s w
eigh
t
Bass
ove
r 5lb
.
Bass
ove
r 8lb
.
Avg.
big
bas
s w
eigh
t
Bass
per
day
1
Poun
ds p
er d
ay1
Hrs
. to
catc
h a
bass
ove
r 5 lb
.
Jordan JAN 1 11 18.2 110 5 0.0 100.0 0.0 100.0 11.6 2.31 0 0 2.94 0.45 1.05 .FEB 1 28 46.4 252 24 4.2 95.8 0.0 100.0 64.0 2.67 1 0 5.28 0.95 2.54 252MAR 3 38 63.2 475 116 13.8 86.2 0.0 100.0 251.0 2.16 0 0 4.21 2.44 5.28 .APR 1 15 100.0 150 58 10.3 89.7 0.0 43.1 119.7 2.06 0 0 4.02 3.87 7.98 .MAY 1 23 95.7 207 92 13.0 87.0 0.0 94.6 202.9 2.21 0 0 4.09 4.44 9.80 .JUN 1 24 87.5 240 61 55.7 44.3 0.0 83.6 128.8 2.11 0 0 4.97 2.54 5.37 .JUL . . . . . . . . . . . . . . . . .AUG . . . . . . . . . . . . . . . . .SEP 1 14 100.0 126 37 29.7 70.3 0.0 97.3 55.5 1.50 0 0 2.88 2.94 4.40 .OCT . . . . . . . . . . . . . . . . .NOV 2 30 90.0 272 118 14.9 85.1 0.0 100.0 218.5 1.85 0 0 3.51 4.35 8.05 .DEC 1 17 94.1 145 66 21.2 78.8 0.0 100.0 129.6 1.96 0 0 4.50 4.57 8.97 .
Lay JAN . . . . . . . . . . . . . . . . .FEB . . . . . . . . . . . . . . . . .MAR 2 35 82.9 296 66 16.7 83.3 0.0 100.0 128.5 1.95 1 0 5.00 2.23 4.34 296APR 3 76 90.8 683 333 15.0 85.0 0.0 97.9 571.1 1.72 1 0 4.55 4.88 8.36 683MAY 4 77 98.7 665 354 63.3 36.7 0.0 92.9 663.8 1.88 1 0 4.23 5.32 9.98 665JUN 1 10 90.0 90 30 33.3 66.7 0.0 83.3 54.0 1.80 0 0 3.75 3.33 6.00 .JUL 1 4 50.0 64 7 14.3 85.7 0.0 100.0 13.9 1.99 0 0 4.10 1.09 2.17 .AUG 2 48 89.6 447 138 32.0 68.0 0.0 91.3 189.1 1.37 0 0 3.61 3.09 4.23 .SEP 2 37 94.6 309 151 58.9 41.1 0.0 95.4 220.3 1.46 0 0 3.51 4.89 7.14 .OCT 3 41 100.0 418 224 26.3 73.7 0.0 98.2 284.5 1.27 1 0 3.88 5.36 6.81 418NOV 2 20 100.0 170 91 4.4 95.6 0.0 100.0 131.1 1.44 0 0 2.57 5.35 7.71 .DEC 1 15 100.0 240 92 13.0 87.0 0.0 100.0 130.4 1.42 0 0 2.75 3.83 5.43 .
Logan Martin JAN . . . . . . . . . . . . . . . . .FEB . . . . . . . . . . . . . . . . .MAR 2 35 82.9 296 66 16.7 83.3 0.0 100.0 128.5 1.95 1 0 5.00 2.23 4.34 296APR 3 76 90.8 683 333 15.0 85.0 0.0 97.9 571.1 1.72 1 0 4.55 4.88 8.36 683MAY 4 77 98.7 665 354 63.3 36.7 0.0 92.9 663.8 1.88 1 0 4.23 5.32 9.98 665JUN 1 10 90.0 90 30 33.3 66.7 0.0 83.3 54.0 1.80 0 0 3.75 3.33 6.00 .JUL 1 4 50.0 64 7 14.3 85.7 0.0 100.0 13.9 1.99 0 0 4.10 1.09 2.17 .AUG 2 48 89.6 447 138 32.0 68.0 0.0 91.3 189.1 1.37 0 0 3.61 3.09 4.23 .SEP 2 37 94.6 309 151 58.9 41.1 0.0 95.4 220.3 1.46 0 0 3.51 4.89 7.14 .OCT 3 41 100.0 418 224 26.3 73.7 0.0 98.2 284.5 1.27 1 0 3.88 5.36 6.81 418NOV 2 20 100.0 170 91 4.4 95.6 0.0 100.0 131.1 1.44 0 0 2.57 5.35 7.71 .DEC 1 15 100.0 240 92 13.0 87.0 0.0 100.0 130.4 1.42 0 0 2.75 3.83 5.43 .
Martin JAN . . . . . . . . . . . . . . . . .FEB 2 29 79.3 283 64 37.5 62.5 0.0 100.0 107.9 1.69 0 0 3.37 2.26 3.81 .MAR . . . . . . . . . . . . . . . . .APR . . . . . . . . . . . . . . . . .MAY 1 14 92.9 140 63 36.5 63.5 0.0 100.0 101.0 1.60 0 0 3.10 4.50 7.21 .JUN . . . . . . . . . . . . . . . . .JUL . . . . . . . . . . . . . . . . .AUG . . . . . . . . . . . . . . . . .SEP . . . . . . . . . . . . . . . . .OCT 4 56 100.0 929 482 14.2 85.8 0.0 84.2 532.7 1.11 0 0 3.84 5.19 5.74 .NOV 3 77 96.1 906 414 23.9 76.1 0.0 99.5 544.2 1.31 1 0 4.15 4.57 6.01 906DEC 2 25 100.0 341 190 24.6 75.4 0.0 100.0 275.2 1.45 0 0 3.62 5.57 8.07 .
1a day is defined as one angler f ishing for 10 hours
23
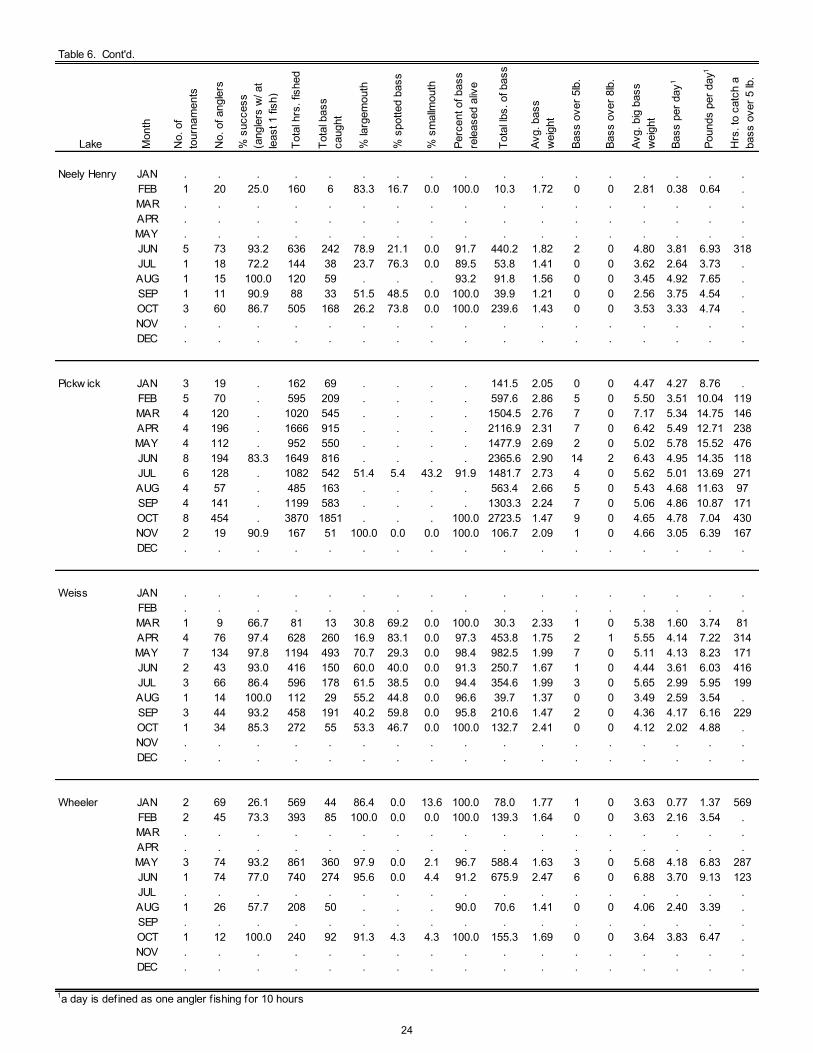
Table 6. Cont'd.
Lake Mon
th
No.
of
tour
nam
ents
No.
of a
ngle
rs
% s
ucce
ss
(ang
lers
w/ a
t le
ast 1
fish
)
Tota
l hrs
. fis
hed
Tota
l bas
s ca
ught
% la
rgem
outh
% s
potte
d ba
ss
% s
mal
lmou
th
Perc
ent o
f bas
s re
leas
ed a
live
Tota
l lbs.
of b
ass
Avg.
bas
s w
eigh
t
Bass
ove
r 5lb
.
Bass
ove
r 8lb
.
Avg.
big
bas
s w
eigh
t
Bass
per
day
1
Poun
ds p
er d
ay1
Hrs
. to
catc
h a
bass
ove
r 5 lb
.
Neely Henry JAN . . . . . . . . . . . . . . . . .FEB 1 20 25.0 160 6 83.3 16.7 0.0 100.0 10.3 1.72 0 0 2.81 0.38 0.64 .MAR . . . . . . . . . . . . . . . . .APR . . . . . . . . . . . . . . . . .MAY . . . . . . . . . . . . . . . . .JUN 5 73 93.2 636 242 78.9 21.1 0.0 91.7 440.2 1.82 2 0 4.80 3.81 6.93 318JUL 1 18 72.2 144 38 23.7 76.3 0.0 89.5 53.8 1.41 0 0 3.62 2.64 3.73 .AUG 1 15 100.0 120 59 . . . 93.2 91.8 1.56 0 0 3.45 4.92 7.65 .SEP 1 11 90.9 88 33 51.5 48.5 0.0 100.0 39.9 1.21 0 0 2.56 3.75 4.54 .OCT 3 60 86.7 505 168 26.2 73.8 0.0 100.0 239.6 1.43 0 0 3.53 3.33 4.74 .NOV . . . . . . . . . . . . . . . . .DEC . . . . . . . . . . . . . . . . .
Pickw ick JAN 3 19 . 162 69 . . . . 141.5 2.05 0 0 4.47 4.27 8.76 .FEB 5 70 . 595 209 . . . . 597.6 2.86 5 0 5.50 3.51 10.04 119MAR 4 120 . 1020 545 . . . . 1504.5 2.76 7 0 7.17 5.34 14.75 146APR 4 196 . 1666 915 . . . . 2116.9 2.31 7 0 6.42 5.49 12.71 238MAY 4 112 . 952 550 . . . . 1477.9 2.69 2 0 5.02 5.78 15.52 476JUN 8 194 83.3 1649 816 . . . . 2365.6 2.90 14 2 6.43 4.95 14.35 118JUL 6 128 . 1082 542 51.4 5.4 43.2 91.9 1481.7 2.73 4 0 5.62 5.01 13.69 271AUG 4 57 . 485 163 . . . . 563.4 2.66 5 0 5.43 4.68 11.63 97SEP 4 141 . 1199 583 . . . . 1303.3 2.24 7 0 5.06 4.86 10.87 171OCT 8 454 . 3870 1851 . . . 100.0 2723.5 1.47 9 0 4.65 4.78 7.04 430NOV 2 19 90.9 167 51 100.0 0.0 0.0 100.0 106.7 2.09 1 0 4.66 3.05 6.39 167DEC . . . . . . . . . . . . . . . . .
Weiss JAN . . . . . . . . . . . . . . . . .FEB . . . . . . . . . . . . . . . . .MAR 1 9 66.7 81 13 30.8 69.2 0.0 100.0 30.3 2.33 1 0 5.38 1.60 3.74 81APR 4 76 97.4 628 260 16.9 83.1 0.0 97.3 453.8 1.75 2 1 5.55 4.14 7.22 314MAY 7 134 97.8 1194 493 70.7 29.3 0.0 98.4 982.5 1.99 7 0 5.11 4.13 8.23 171JUN 2 43 93.0 416 150 60.0 40.0 0.0 91.3 250.7 1.67 1 0 4.44 3.61 6.03 416JUL 3 66 86.4 596 178 61.5 38.5 0.0 94.4 354.6 1.99 3 0 5.65 2.99 5.95 199AUG 1 14 100.0 112 29 55.2 44.8 0.0 96.6 39.7 1.37 0 0 3.49 2.59 3.54 .SEP 3 44 93.2 458 191 40.2 59.8 0.0 95.8 210.6 1.47 2 0 4.36 4.17 6.16 229OCT 1 34 85.3 272 55 53.3 46.7 0.0 100.0 132.7 2.41 0 0 4.12 2.02 4.88 .NOV . . . . . . . . . . . . . . . . .DEC . . . . . . . . . . . . . . . . .
Wheeler JAN 2 69 26.1 569 44 86.4 0.0 13.6 100.0 78.0 1.77 1 0 3.63 0.77 1.37 569FEB 2 45 73.3 393 85 100.0 0.0 0.0 100.0 139.3 1.64 0 0 3.63 2.16 3.54 .MAR . . . . . . . . . . . . . . . . .APR . . . . . . . . . . . . . . . . .MAY 3 74 93.2 861 360 97.9 0.0 2.1 96.7 588.4 1.63 3 0 5.68 4.18 6.83 287JUN 1 74 77.0 740 274 95.6 0.0 4.4 91.2 675.9 2.47 6 0 6.88 3.70 9.13 123JUL . . . . . . . . . . . . . . . . .AUG 1 26 57.7 208 50 . . . 90.0 70.6 1.41 0 0 4.06 2.40 3.39 .SEP . . . . . . . . . . . . . . . . .OCT 1 12 100.0 240 92 91.3 4.3 4.3 100.0 155.3 1.69 0 0 3.64 3.83 6.47 .NOV . . . . . . . . . . . . . . . . .DEC . . . . . . . . . . . . . . . . .
1a day is defined as one angler f ishing for 10 hours
24
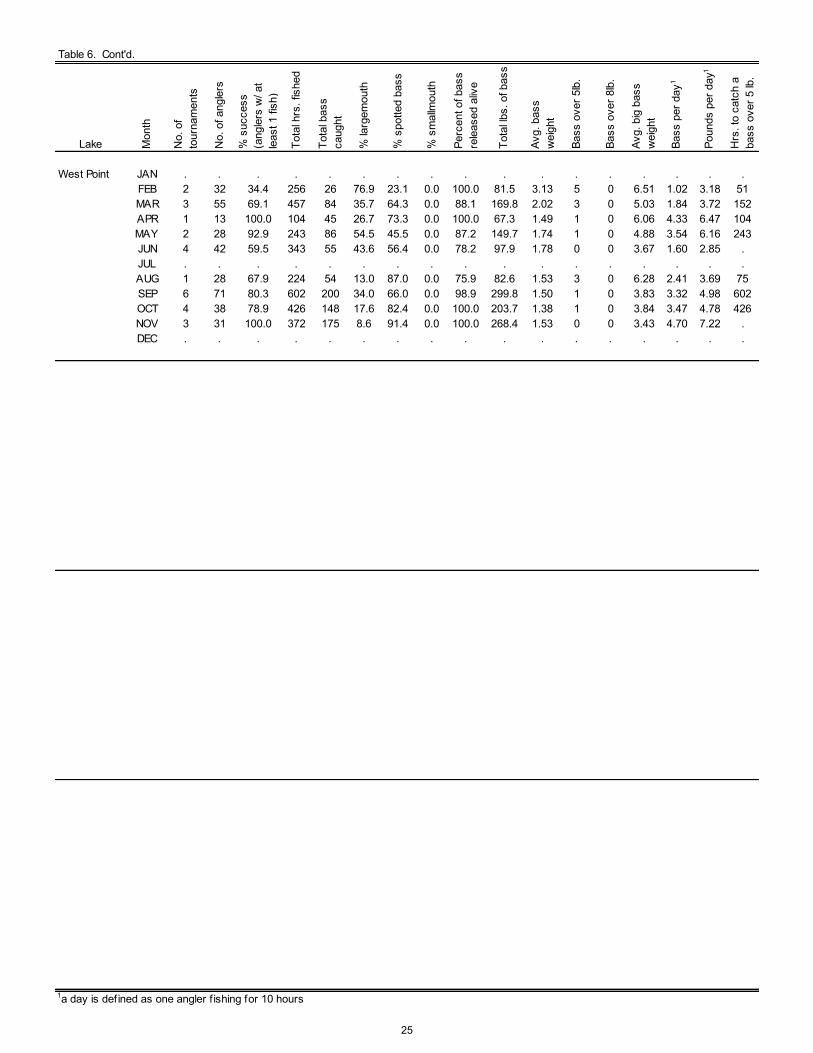
Table 6. Cont'd.
Lake Mon
th
No.
of
tour
nam
ents
No.
of a
ngle
rs
% s
ucce
ss
(ang
lers
w/ a
t le
ast 1
fish
)
Tota
l hrs
. fis
hed
Tota
l bas
s ca
ught
% la
rgem
outh
% s
potte
d ba
ss
% s
mal
lmou
th
Perc
ent o
f bas
s re
leas
ed a
live
Tota
l lbs.
of b
ass
Avg.
bas
s w
eigh
t
Bass
ove
r 5lb
.
Bass
ove
r 8lb
.
Avg.
big
bas
s w
eigh
t
Bass
per
day
1
Poun
ds p
er d
ay1
Hrs
. to
catc
h a
bass
ove
r 5 lb
.
West Point JAN . . . . . . . . . . . . . . . . .FEB 2 32 34.4 256 26 76.9 23.1 0.0 100.0 81.5 3.13 5 0 6.51 1.02 3.18 51MAR 3 55 69.1 457 84 35.7 64.3 0.0 88.1 169.8 2.02 3 0 5.03 1.84 3.72 152APR 1 13 100.0 104 45 26.7 73.3 0.0 100.0 67.3 1.49 1 0 6.06 4.33 6.47 104MAY 2 28 92.9 243 86 54.5 45.5 0.0 87.2 149.7 1.74 1 0 4.88 3.54 6.16 243JUN 4 42 59.5 343 55 43.6 56.4 0.0 78.2 97.9 1.78 0 0 3.67 1.60 2.85 .JUL . . . . . . . . . . . . . . . . .AUG 1 28 67.9 224 54 13.0 87.0 0.0 75.9 82.6 1.53 3 0 6.28 2.41 3.69 75SEP 6 71 80.3 602 200 34.0 66.0 0.0 98.9 299.8 1.50 1 0 3.83 3.32 4.98 602OCT 4 38 78.9 426 148 17.6 82.4 0.0 100.0 203.7 1.38 1 0 3.84 3.47 4.78 426NOV 3 31 100.0 372 175 8.6 91.4 0.0 100.0 268.4 1.53 0 0 3.43 4.70 7.22 .DEC . . . . . . . . . . . . . . . . .
1a day is defined as one angler f ishing for 10 hours
25
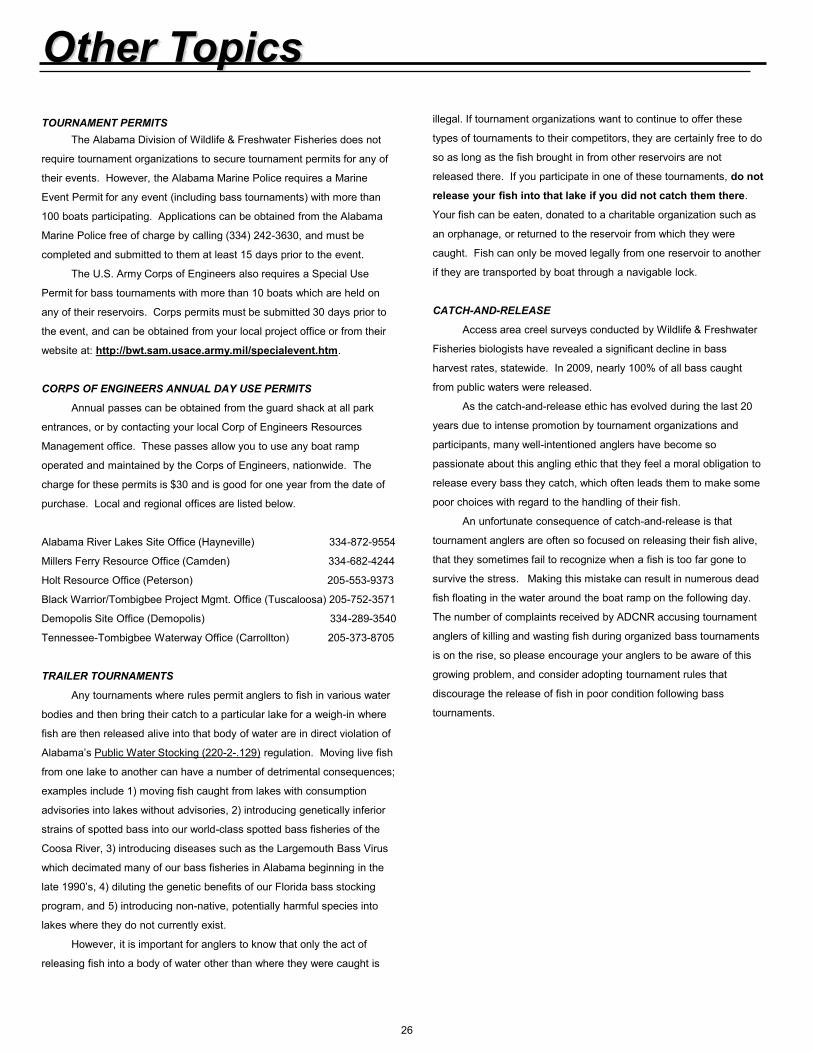
Other Topics TOURNAMENT PERMITS The Alabama Division of Wildlife & Freshwater Fisheries does not
require tournament organizations to secure tournament permits for any of
their events. However, the Alabama Marine Police requires a Marine
Event Permit for any event (including bass tournaments) with more than
100 boats participating. Applications can be obtained from the Alabama
Marine Police free of charge by calling (334) 242-3630, and must be
completed and submitted to them at least 15 days prior to the event.
The U.S. Army Corps of Engineers also requires a Special Use
Permit for bass tournaments with more than 10 boats which are held on
any of their reservoirs. Corps permits must be submitted 30 days prior to
the event, and can be obtained from your local project office or from their
website at: http://bwt.sam.usace.army.mil/specialevent.htm.
CORPS OF ENGINEERS ANNUAL DAY USE PERMITS
Annual passes can be obtained from the guard shack at all park
entrances, or by contacting your local Corp of Engineers Resources
Management office. These passes allow you to use any boat ramp
operated and maintained by the Corps of Engineers, nationwide. The
charge for these permits is $30 and is good for one year from the date of
purchase. Local and regional offices are listed below.
Alabama River Lakes Site Office (Hayneville) 334-872-9554
Millers Ferry Resource Office (Camden) 334-682-4244
Holt Resource Office (Peterson) 205-553-9373
Black Warrior/Tombigbee Project Mgmt. Office (Tuscaloosa) 205-752-3571
Demopolis Site Office (Demopolis) 334-289-3540
Tennessee-Tombigbee Waterway Office (Carrollton) 205-373-8705
TRAILER TOURNAMENTS
Any tournaments where rules permit anglers to fish in various water
bodies and then bring their catch to a particular lake for a weigh-in where
fish are then released alive into that body of water are in direct violation of
Alabama’s Public Water Stocking (220-2-.129) regulation. Moving live fish
from one lake to another can have a number of detrimental consequences;
examples include 1) moving fish caught from lakes with consumption
advisories into lakes without advisories, 2) introducing genetically inferior
strains of spotted bass into our world-class spotted bass fisheries of the
Coosa River, 3) introducing diseases such as the Largemouth Bass Virus
which decimated many of our bass fisheries in Alabama beginning in the
late 1990’s, 4) diluting the genetic benefits of our Florida bass stocking
program, and 5) introducing non-native, potentially harmful species into
lakes where they do not currently exist.
However, it is important for anglers to know that only the act of
releasing fish into a body of water other than where they were caught is
illegal. If tournament organizations want to continue to offer these
types of tournaments to their competitors, they are certainly free to do
so as long as the fish brought in from other reservoirs are not
released there. If you participate in one of these tournaments, do not
release your fish into that lake if you did not catch them there.
Your fish can be eaten, donated to a charitable organization such as
an orphanage, or returned to the reservoir from which they were
caught. Fish can only be moved legally from one reservoir to another
if they are transported by boat through a navigable lock.
CATCH-AND-RELEASE
Access area creel surveys conducted by Wildlife & Freshwater
Fisheries biologists have revealed a significant decline in bass
harvest rates, statewide. In 2009, nearly 100% of all bass caught
from public waters were released.
As the catch-and-release ethic has evolved during the last 20
years due to intense promotion by tournament organizations and
participants, many well-intentioned anglers have become so
passionate about this angling ethic that they feel a moral obligation to
release every bass they catch, which often leads them to make some
poor choices with regard to the handling of their fish.
An unfortunate consequence of catch-and-release is that
tournament anglers are often so focused on releasing their fish alive,
that they sometimes fail to recognize when a fish is too far gone to
survive the stress. Making this mistake can result in numerous dead
fish floating in the water around the boat ramp on the following day.
The number of complaints received by ADCNR accusing tournament
anglers of killing and wasting fish during organized bass tournaments
is on the rise, so please encourage your anglers to be aware of this
growing problem, and consider adopting tournament rules that
discourage the release of fish in poor condition following bass
tournaments.
26
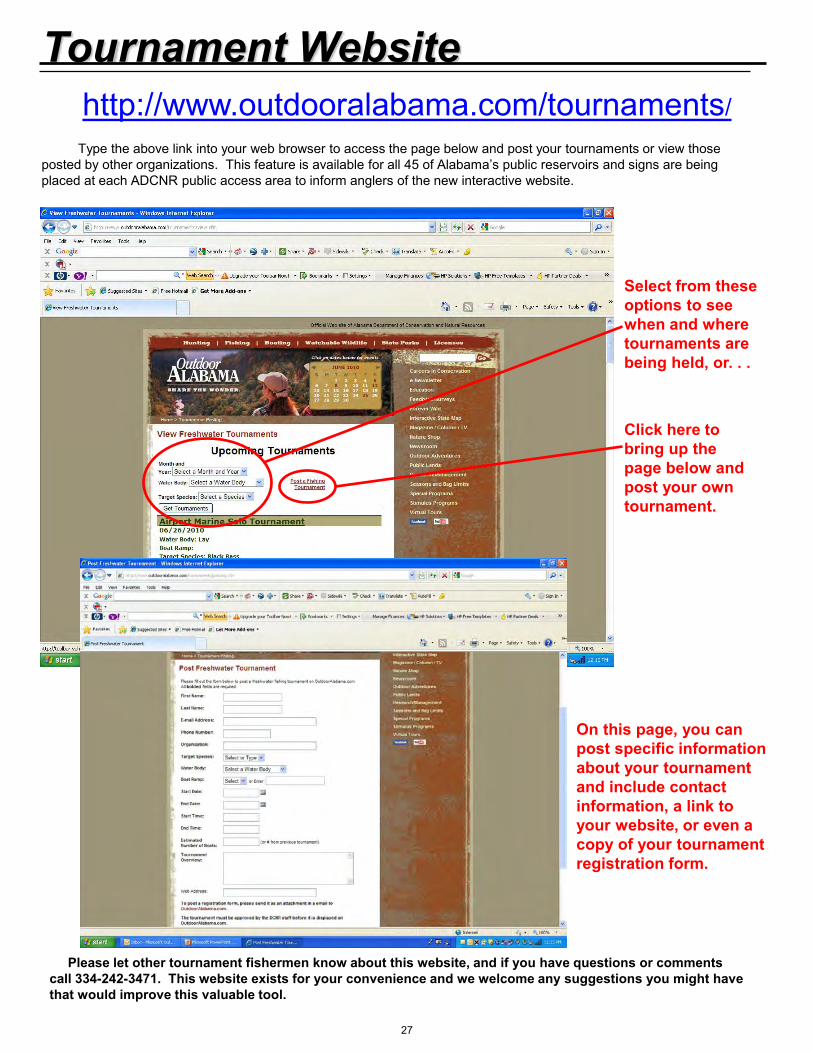
Tournament Website
Please let other tournament fishermen know about this website, and if you have questions or comments call 334-242-3471. This website exists for your convenience and we welcome any suggestions you might have that would improve this valuable tool.
http://www.outdooralabama.com/tournaments/ Type the above link into your web browser to access the page below and post your tournaments or view those posted by other organizations. This feature is available for all 45 of Alabama’s public reservoirs and signs are being placed at each ADCNR public access area to inform anglers of the new interactive website.
Select from these options to see when and where tournaments are being held, or. . .
Click here to bring up the page below and post your own tournament.
On this page, you can post specific information about your tournament and include contact information, a link to your website, or even a copy of your tournament registration form.
27

Boating Access
The Bonner’s Point Public Boat Ramp at Lake Jordan in Elmore Co.
The Alabama Division of Wildlife &
Freshwater Fisheries maintains over 120 public
boating access areas statewide. Several of
these facilities received upgrades during 2010.
Higgins Ferry (Lake Mitchell)
With this facility being the only major
public boat ramp on Lake Mitchell, it gets a
tremendous amount of use throughout the year.
For ages, anglers have complained about the
difficulty associated with backing their boats
down this ramp, particularly at night. The
problems resulted from the fact that anglers
temporarily loose sight of their trailers as they
drop off the slope leading down to the water.
This of course resulted in anglers taking more
time to launch and retrieve their boats, which
ultimately led to long launch lines during periods
of heavy use.
In order to remedy this problem, the
crown of the ramp was lowered 2.5 feet and the
contour of the launching slab was flattened to
during the winter of 2009-10. These damages were addressed in
similar fashion to those at Lay Dam. A large concrete area was
poured in front of the ramp and the parking area was repaved with a
durable asphalt surface. Repairs were also made to the courtesy
docks.
Bonner’s Point (Lake Jordan)
This access area underwent major renovations, which were
completed during 2010. The swimming area was replaced with a
modern, four-lane launching slab and two, one hundred foot floating
courtesy piers (pictured above). A walkway connects the tournament
pavilion to a floating courtesy pier so that weigh-ins can be conducted
with ease. The old boat ramp and associated piers were left in place
and are now dedicated for handicapped access. Access to and from
the new launching slab was achieved by adding new access roads to
improve traffic flow.
Other Projects (Statewide)
Parking lots were repaired at four access areas, and parking
spots were re-striped at nine locations. Wooden courtesy piers were
repaired and treated with sealant at twenty-four facilities. Leases for
the Jackson City Boat Ramp on the Tombigbee River in Clarke Co.,
and the Selma City Access on the Alabama River in Dallas Co., both
expired and were not renewed. These facilities are now managed
and maintained by the respective city governments.
create a gentle curve with a grade transitioning from 2 – 15 %.
Bollards were also added, which flank both sides of the ramp making
it much easier for boaters to sense the orientation of the trailer to the
launching slab. The lower parking lot was also repaved and widened
by up to 8 feet to create more room in areas where space was limited.
B. B. Comer & Browns Creek (Lake Guntersville)
Both of the facilities were repaved during 2010. The old chip-
and-seal surface was replaced with four inches of modern asphalt
with a durable wearing surface. Parking was reconfigured and new
striping was applied.
Lay Dam (Lay Lake)
The parking surface at this facility was in disrepair prior to the
winter of 2009-10. Water that had seeped under the parking lot
through potholes froze and expanded during the extremely cold
temperatures and broke the surface into many small pieces. The
worst damage was directly in front of the ramp where bilge water
mixed with oil and gas is often emptied onto the parking lot creating
the first signs of potholes. To prevent this from happening in the
future, concrete was placed in the area immediately in from of the
ramp because of its increased durability. The remainder of the
parking area was also repaved and new striping laid down.
Halawakee Creek (Lake Harding)
Freezing water also did severe damage to parts of this facility
28

The Department of Conservation and Natural Resources does not discriminate on the basis of race, color, religion, age, gender, national origin, or disability in its hiring
or employment practices nor in admission to, or operations of its programs, services, or activities. This publication is available in alternative formats.

SP
ORTFISH
RES
TORAT
ION