Embed Size (px)
Citation preview

U.S. Offshore Wind’s $200Bn+ Supply Chain Opportunity
PREDICTIVE RESEARCH for energy & industrials
Daniel Cruise, [email protected]
Joseph Triepke, [email protected]
Taylor Jacobs, Research [email protected]

2
1. Executive Summary
2. A $200bn+ Supply Chain Opportunity
3. Company Detail
4. U.S. Offshore Wind Power Outlook
Table Of Contents

3
Most of the research to date on U.S. offshore wind power (US OW) addresses governmental action and the status of widely publicized East Coast wind farm projects. In this report, we tackle the missing link that doesn’t exist yet and thus doesn't get the airtime it deserves –domestic supply chain.
• Immature supply chain poses the biggest risk to US OW generation goals
• US OW supply chain capex could total $200bn+ through 2035, higher than $100-$150 that most participants anticipate
• Lium’s US OW boat database shows urgent vessel construction needs with only 1 of the 23 global WTIVs we track located in the US today (need as many as 8 through 2035)
• Public turbine providers (GE, SGRE, VWS) are the most obvious beneficiaries (30% of wind farm spend)…
• …But hundreds of companies - public (ie NETI, NOV, GFI, HLX) and private - are developing business in emerging US OW supply / service niches
• Lium MODELS shows enough progress CAN BE MADE towards supply chain maturation by 2030 to maintain confidence in the Biden administration’s 30GW target
Executive Summary

Section 1:
U.S. Offshore Wind Power Is A$200bn+ Supply Chain Opportunity Through 2035
4

Title Text
5
Turbines In U.S. Waters Today…
Title Text
6
…Turbines In U.S. Waters By 2030

Title Text
7
Lofty Goals, But No Supply Chain? That’s A Problem…Aggressive US OW State and Federal mandates have been widely publicized. One big problem is… there is no domestic supply chain in place. Onshore wind, European offshore wind, and diverse U.S. manufacturing / logistics infrastructure will be leveraged; however, supply chain is a hole in the US OW growth roadmap. Less than 10 wind turbines are installed in US waters now. By 2035, there will be thousands.
42
30,000
45,000
0
10,000
20,000
30,000
40,000
50,000
20
21
20
22
20
23
20
24
20
25
20
26
20
27
20
28
20
29
20
30
20
31
20
32
20
33
20
34
20
35
Ca
pa
cit
y (M
W)
U.S. Offshore Wind Online Today vs. 2035 Target Source: Lium LLC
Title Text
8
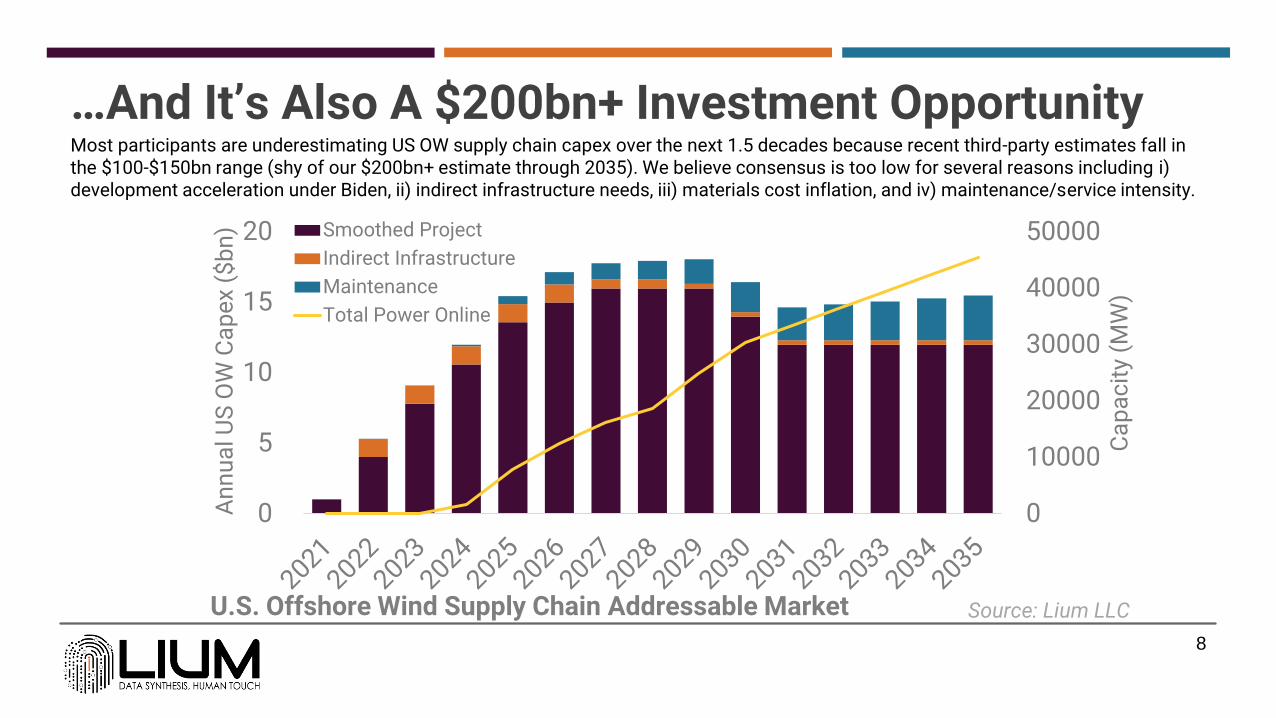
…And It’s Also A $200bn+ Investment OpportunityMost participants are underestimating US OW supply chain capex over the next 1.5 decades because recent third-party estimates fall in the $100-$150bn range (shy of our $200bn+ estimate through 2035). We believe consensus is too low for several reasons including i) development acceleration under Biden, ii) indirect infrastructure needs, iii) materials cost inflation, and iv) maintenance/service intensity.
0
10000
20000
30000
40000
50000
0
5
10
15
20
Ca
pa
cit
y (M
W)
An
nu
al U
S O
W C
ap
ex
($b
n) Smoothed Project
Indirect Infrastructure
Maintenance
Total Power Online
U.S. Offshore Wind Supply Chain Addressable Market Source: Lium LLC

Title Text
9
Easy Money Available For US OW Supply Chain Build-outBetween record-high renewable energy fund raising, green bonds, and government spending on renewables, capital is readily available for the US OW supply chain build-out. Each quarter, tens of billions of dollars are pouring into sustainable funds. We expect US OW-specific funds to emerge, following EU OW precedent. On the government side, DOE launched a $3bn US OW loan program, Biden’s $1T infra bill has grid upgrade earmarks benefitting US OW, and East Coast states are sinking hundreds of millions into port upgrades.
0
50
100
150
200
250
300
350
1Q19 2Q19 3Q19 4Q19 1Q20 2Q20 3Q20 4Q20 1Q21 2Q21
As
se
ts (
$B
n)
US Sustainable Fund Trends Source: Morningstar, Lium LLC
Up
Ne
arl
y 2
x T
TM
Title Text
10
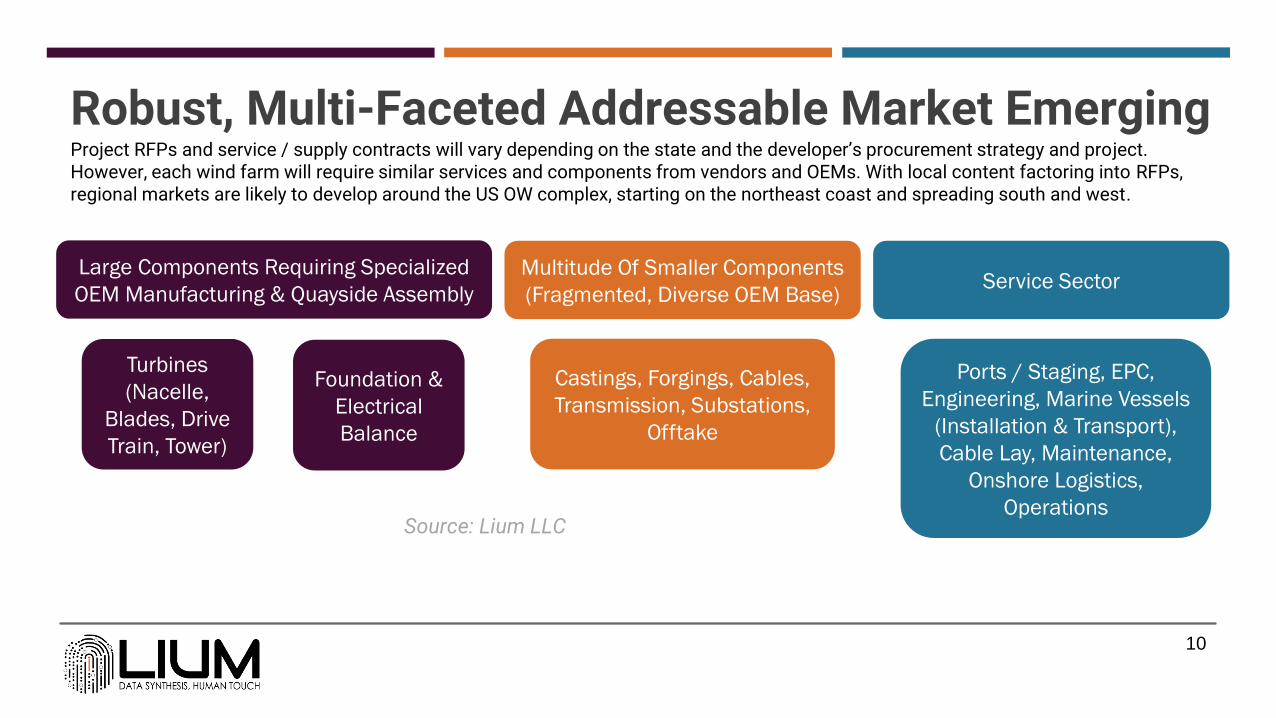
Robust, Multi-Faceted Addressable Market EmergingProject RFPs and service / supply contracts will vary depending on the state and the developer’s procurement strategy and project. However, each wind farm will require similar services and components from vendors and OEMs. With local content factoring into RFPs, regional markets are likely to develop around the US OW complex, starting on the northeast coast and spreading south and west.
Turbines
(Nacelle,
Blades, Drive
Train, Tower)
Foundation &
Electrical
Balance
Large Components Requiring Specialized
OEM Manufacturing & Quayside Assembly
Castings, Forgings, Cables,
Transmission, Substations,
Offtake
Multitude Of Smaller Components
(Fragmented, Diverse OEM Base)
Ports / Staging, EPC,
Engineering, Marine Vessels
(Installation & Transport),
Cable Lay, Maintenance,
Onshore Logistics,
Operations
Service Sector
Source: Lium LLC

“Title Text
11
Cost Components In Wind Farm CapexAlthough thousands of variables can impact project costs (and thus the addressable market for various supply chain verticals), we’ve constructed in broad strokes a “typical” wind farm AFE below. These estimates represent an average fixed foundation East Coast wind farm about 20 miles from shore built with 12MW turbines.
Major/Specialized Components
Misc./Smaller Components
Services
Installation Services
Operations, Maintenance, Service (OMS)
Project ManagementCastings/ForgingsSubsea Cables
SubstationsOther Components
Blades, Tower, Misc.
Drive Train
Foundation
"Typical" US East Coast Wind Farm Investment Detail Source: Lium LLC

Title Text
12
Local Footprint Will Factor Into Contract AwardsLocalized roofline, as well as component standardization for multi-project developers, are both likely to underpin some competitive advantage for vendors when it comes to winning supply / service contract awards. In turbine packages, SGRE has had good wins in VA, NY, and RI/CT while GE’s wins have come in NJ and MA. Vestas just won a project in NJ as well. NC is one state to watch with no clear frontrunner yet as projects there are earlier stage than in the states higher on the coast.
0
1,000
2,000
3,000
4,000
5,000
6,000
7,000
MA NC NY NJ VA DE/MD RI/CT ME
Ea
st
Co
as
t W
ind
Pip
elin
e (
MW
)
GE SGRE VWS Unawarded
Turbine Share By State For East Coast Pipeline Source: Lium LLC

Title Text
13
US OW Will Fuel Domestic Manufacturing ResurgenceRapid US OW growth will include a focus by developers on local content. Domestic component sourcing is expected to translate into material new demand for domestic manufacturing. Two new US factories are likely to be built for each major windfarm component (i.e.wind turbine nacelles, blades, towers, foundations, and subsea cables). Foundries, assembly, mills, etc. will also benefit – case in point is the recently announced US Wind plan to revitalize a historic but closed Baltimore steel facility, Sparrows Point.
11mm tons of steel to be
consumed through 2035
(6yrs of an avg steel mill’s output)
$6bn+ to be invested in factories,
ports, vessels, and grid
connections
Source: Lium LLC
Title Text
14
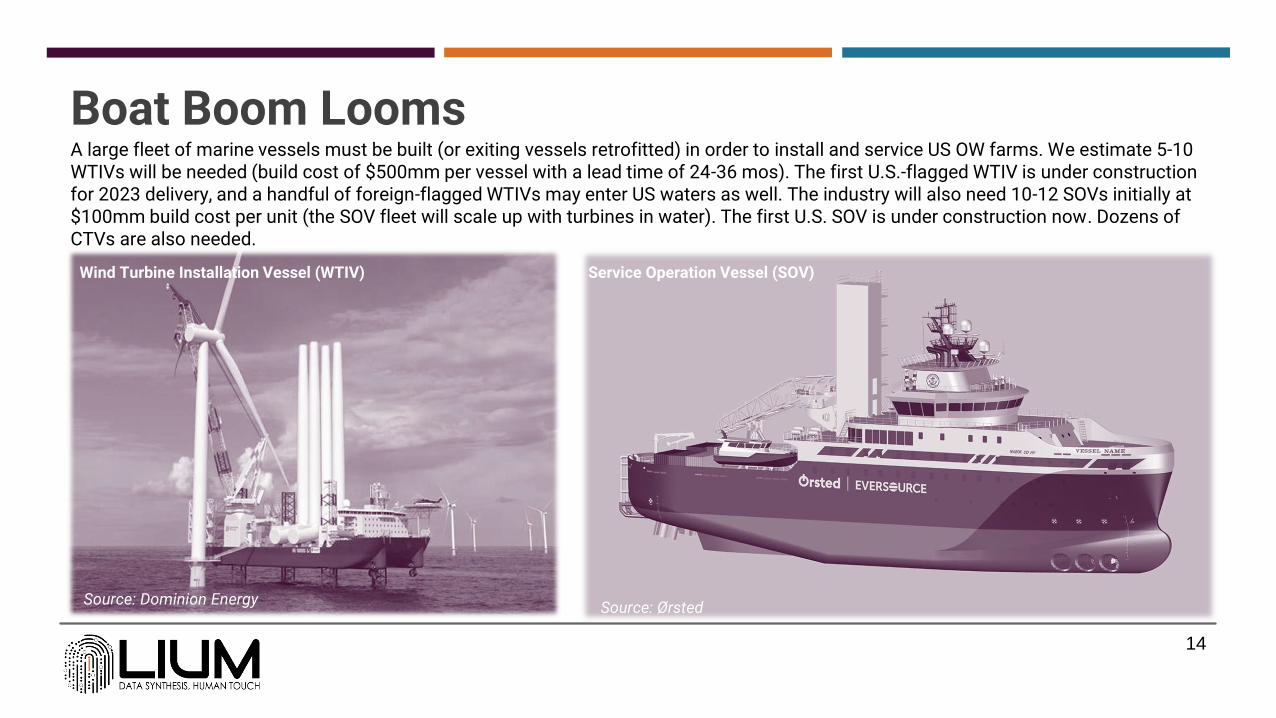
Boat Boom LoomsA large fleet of marine vessels must be built (or exiting vessels retrofitted) in order to install and service US OW farms. We estimate 5-10 WTIVs will be needed (build cost of $500mm per vessel with a lead time of 24-36 mos). The first U.S.-flagged WTIV is under construction for 2023 delivery, and a handful of foreign-flagged WTIVs may enter US waters as well. The industry will also need 10-12 SOVs initially at $100mm build cost per unit (the SOV fleet will scale up with turbines in water). The first U.S. SOV is under construction now. Dozens of CTVs are also needed.
Source: ØrstedSource: Dominion Energy
Wind Turbine Installation Vessel (WTIV) Service Operation Vessel (SOV)

Title Text
15
Marine Market Wrinkles From Jones Act & Big TurbinesThe Jones Act requires goods shipped between U.S. ports use ships built, owned, and operated by U.S. citizens. Thus, US OW cannot utilize foreign-flagged SOVs and CTVs due to the coastwise nature of those vessels’ operations. Larger, more costly WTIVs are a gray area – a hybrid solution is legal where U.S.-flagged feeder vessels ferry components to foreign-flagged WTIVs for turbine installation. However, we expect global utilization of “super-spec” WTIVs to tighten through 2030 because installing larger new-gen turbines exceeds the capabilities of older gen WTIVs. Leveraging Lium’s WTIV database, there are currently 23 WTIVs (outside of China) capable of working in the US market by 2024/2025 (most will be kept busy overseas) with only one U.S. flagged - Dominion’s newbuild. More new construction is needed.
0
5
10
15
20
Nu
mb
er
of
ves
se
ls
WTIV Fleet Source: Lium LLC
Int'l Fleet Excluding China
United States Fleet

Title Text
16
Needful Port & Grid Upgrades Are Moving AheadMultiple states are investing in port upgrades to accommodate offshore wind including quayside assembly, storage, shipyards, receiving, shipping, docking, fabrication, etc. Below is a map and table of some of the recently approved improvements. On the grid front, the $1 trillion bipartisan infrastructure bill has $73 billion allocated for grid modernization – better handling of renewables intermittency from this spend will be good for US OW.
Denotes announced port investment
Planned but unspecific port investments (NY, MA)

Title Text
17
Jobs JuggernautMeeting the 30GW by 2030 US OW goal will create 45,000+ jobs with 30,000+ additional indirect jobs created. US OW workforce will have a heavy weighting towards transferrable skills that can be hired from other industries – such as manufacturing, construction, electricians, engineering, marine, and logistics. This reduces the risk of growth bottlenecks from workforce creation. Notably, LinkedIn already shows US OW with more openings than onshore wind and about the same as utility solar.
0
1,000
2,000
3,000
4,000J
ob
Op
en
ing
s
LinkedIn US Job Listings By Keyword Search (Aug. 2021) Source: Lium LLC

Section 2:
Company Detail
18

Title Text
19
Turbine Providers Are Most Recognizable Participant…Turbine providers are often recognized by investors as the “face” of the offshore wind supply chain. This is because they are large and publicly traded with onshore wind and international offshore wind success under their belts and turbine awards are visible. They will collect a large chunk of US OW capex spend, potentially up to 30% of direct project spend, or $40-$50bn, through 2035.
GE35%
Vestas17%
Siemens Gamesa
48%
Known East Coast Awards (9GW) Source: Lium LLC

Title Text
20
…But Other Publics Have Exposure To US OW Supply Chain Too…In this slide, we have listed some of the public companies OTHER THAN turbine suppliers and developers that have exposure to US OW supply chain. Many of these are names that energy specialists will recognize from the O&G industry who are pivoting towards US OW and energy transition verticals, leveraging their installed base of manufacturing or logistics assets to serve the renewable energy sector.

Title Text
21
…And Hundreds Of Privates Are Vying For Share We reviewed supplier registries compiled by 3 different organizations, including state energy agencies, identifying more than 770 unique companies that have registered hoping to secure new business as the US OW supply chain market takes off. While there is some overlap in services provided by many of these firms, this chart aggregates the databases to show participant concentration across product / service lines for this universe of potential suppliers.
Consulting 21%
Marine Ops, Const.
11%
Manufacturing, Fabrication
24%
Transmission, Grid, Cables
14%
Other30%
Emerging Competitive Landscape (Number Of Firms) Source: Lium LLC

Section 3:
U.S. Offshore Wind Power Outlook
22

Title Text
23
30GW By 2030 Attainable…Biden’s 30 GW of offshore wind power by 2030 power was met with skepticism by some; however, we believed this would be attainable from the day it was announced (in fact, we called the target light in an April 2021 - link). On the East Coast alone, we have eyes on 30 projects / project phases that amount to 25GW of power slated for COD by 2030. To get to the 30 GW by 2030 target, we expect to add a) more East Coast power as new leasing rounds and projects are announced over the next couple years and b) US OW power on the WestCoast (which could easily see 5+GW in the water by 2030 between CA, HI, and OR). The supply chain analysis in this report shows enough progress in different directions to increase our conviction in the industry’s ability to meet the Federal 2030 goal.
See US OW Project-By-
Project Status Here

Title Text
24
…But Beware Near-term Timeline SlippageWe have already moved our estimated start date for several projects in the orderbook back a year later than guidance due to our expectation that near-term dates will slip until supply chain catches up to demand. Vineyard Wind is an example of a project with recent slippage disclosed, and we believe other dates will slip between 2021-2025. This is to be expected as the supply chain buildout needs to catch up with development timelines - something we expect to happen by the middle of the decade, in plenty of time to hit the 30GW by 2030 target.
0
10
20
30C
ap
ac
ity
(GW
)DE CTMA DE / MDMD MENC NJNY OHRI RI/CTCA HIVA Cum. U.S. Online
COD For The Visible U.S. Offshore Wind Pipeline Source:
Lium LLC

Title Text
25
Growth Catalysts MultiplyingIn addition to well documented progress on the East Coast, US OW is also gaining traction on the West Coast. Catalysts to watch in the near term include more lease auctions, progress in big call areas like NY Bight, turbine awards and supply chain progress, and BOEM environmental assessments. Click the button for a coast-to-coast catalyst summary…
Coast-to-Coast
Catalyst Summary

Title Text
26
US GOM Emerging As A Wildcard Region For US OWThis summer, BOEM began to assess interest in potential offshore wind development in the US Gulf of Mexico (GOM) and formed a task force to coordinate a renewable energy push here. We are less optimistic about US OW prospects in the GOM than the coasts due toresource patterns and offtake economics, but this is an emerging wildcard region to watch especially given the heavy installed base of O&G assets / infrastructure here, some of which can be repurposed for US OW activity.

27
US Offshore Wind Project Database
Related Predictive Data

Title Text
28
DisclosuresLium LLC is an independent research provider. The Company is not a member of the FINRA or the SIPC and is not a registered broker dealer or investment adviser. The Company has no other regulated or unregulated business activities which conflict with its provision of independent research. No employee or member of Lium LLC, or immediate family member thereof, exercises investment discretion over, or holds any position in, securities of any issuer analyzed by the Company.
Nothing contained this Report should be construed as any offer to sell, or any solicitation of an offer to buy, any security or investment. Any research or other material received should not be construed as individualized investment advice. Investment decisions should be made as part of an overall portfolio strategy and you should consult with a professional financial advisor, legal and tax advisor prior to making any investment decision. Lium LLC shall not be liable for any direct or indirect, incidental or consequential loss or damage (including loss of profits, revenue or goodwill) arising from any investment decisions based on information or research obtained from the Company.
This Report is produced and copyrighted by Lium LLC, and any unauthorized use, duplication, redistribution or disclosure is prohibited by law and can result in prosecution. The opinions and information contained herein have been obtained or derived from sources believed to be reliable, but Lium LLC makes no representation as to their timeliness, accuracy or completeness or for their fitness for any particular purpose. This Report is not an offer to sell or a solicitation of an offer to buy any security. The information presented in this Report is for general information only and does not specifically address individual investment objectives, financial situations or the particular needs of any specific person who may receive this Report. Investing in any security or investment strategies discussed may not be suitable for you and it is recommended that you consult an independent investment advisor. Nothing in this Report constitutes individual investment, legal or tax advice. Lium LLC may issue or may have issued other reports that are inconsistent with or may reach different conclusions and opinions than those represented in this Report, and all opinions are reflective of judgments made on the original date of publication. Those reports may reflect the different assumptions, views and analytical methods of the analysts who prepared them and Lium LLC is under no obligation to ensure that other reports are brought to the attention of any recipient of this Report or to update or keep current the information contained in other reports so that such information is consistent with, or not contrary to, the information contained in this Report. Lium LLC shall accept no liability for any loss arising from the use of this report, nor shall Lium LLC treat all recipients of this report as customers simply by virtue of their receipt of this material. Investments involve risk and an investor may incur either profits or losses. Past performance should not be taken as an indication or guarantee of future performance. No Lium LLC officers, employees, agents and/or affiliates may serve as officers or directors of covered companies, or may own more than one percent of a covered company’s stock.