Embed Size (px)
Citation preview
Ireland’s Solar ValueChain Opportunity

This report was prepared by the Sustainable Energy Authority
of Ireland (SEAI) with input and analysis from Ricardo Energy
& Environment. The study was informed by inputs from
stakeholders from research and industry with expertise in
solar PV. SEAI is grateful to all stakeholders who took part
in the workshop and interviews, with particular thanks to
representatives from IDA Ireland, Enterprise Ireland, Science
Foundation Ireland, Dublin Institute of Technology, Nines
Photovoltaics, BNRG, redT Energy, Electronic Concepts Ltd, the
Irish Solar Energy Association, Kingspan ESB, Lightsource, Dublin
City University, Waterford IT, University College Dublin, University
of Limerick and Trinity College Dublin. A full list of stakeholders
consulted can be found in Appendix C.
April 2017
Acknowledgements

Contents
Executive Summary 4
1. Introduction 11
2. Solar PV Status in Ireland 15
2.1 Current Measures Promoting Solar PV in Ireland 18
3. Mapping the Solar PV ‘Wider Value Chain’ 21
3.1 Value Distribution Assessment 23
3.2 Wider Value Chain Maps 24
4. Strengths & Opportunities 33
4.1 Value Chain Strengths 34
4.2 Value Chain Opportunities 38
5. Value Proposition 41
5.1 Uptake Scenarios 42
5.2 Market Size Scenarios 43
5.3 Irish Market Share 50
6. Priorities and Next Steps 53
7. Conclusion 55
Appendices
Appendix A: Value Distribution Maps for different 56
scenarios and applications
Appendix B: Source of Market Data 72
Appendix C: Stakeholders Consulted 73
4
Executive Summary
The study highlights the scope for Ireland to
become more than just a ‘technology-taker’
in the solar PV sector and identifies several
priorities to help maximise the role Irish
research and industry can play.
The study builds on SEAI’s previous report
Ireland’s Sustainable Energy Supply Chain
Opportunity1 which looked at Ireland’s place
in the value chains of major sustainable
energy products and services.
A Growing Global Market for Solar PV
Solar PV is positioned to become one of
the most important energy technologies
in meeting global sustainable energy and
climate commitments. In the period since
2010 solar PV has been the fastest growing
power generation technology worldwide
in terms of new capacity additions per year,
and projections2 by the International Energy
Agency (IEA) foresee this trend continuing.
Ireland has a small but growing solar PV
deployment industry with just over 6MWp
(Megawatt Peak) installed to date, almost
entirely on rooftops. Ireland’s Energy White
Paper3 recognises an increasing role for
solar power in the future Irish energy mix
and its contribution will grow, especially as
system costs continue to decline. Given the
projected scale of the future solar market in
Europe and worldwide4 there is also growing
interest from Irish research and industry in
the opportunities to capture some of the
value of this global market.
The Solar PV Value Chain
The uptake of the technology worldwide
has spawned a global industry in the
manufacture and deployment of solar PV
systems. When considering the opportunities
for businesses and researchers arising from
the proliferation of a new technology on a
global scale it is tempting to fixate on the
components and services which form the
conventional supply chain – in the case of
solar PV: the silicon cells, modules, racking
and electronics of which the systems
comprise. These are the most visible
elements of a technology and typically
constitute a large share of the value of the
overall market (typically around 70% of the
capital investment in a PV system is spread
across the supply chains for these products5 ).
However these sectors tend to be dominated
by a few big players and barriers to entry are
often high.
Where the market for a high-value
technology is large it can be advantageous
to broaden consideration to the ‘wider
value chain’ for the technology which
encompasses the whole range of products
and services which add value. For solar PV
this includes activities such as research and
development into new materials, product
design and testing, supporting software
and controls, maintenance services, and
developing other enabling products, e.g.
storage technologies. Know-how from
sectors where Irish industry and research
is strong can potentially be applied in this
wider value chain to allow them to capture a
portion of a rapidly growing global market.
Furthermore, Irish organisations can position
themselves to capture a significant share of
the domestic solar PV market as it grows and
maximise the benefits for Irish businesses, the
research sector and communities.
Strengths and Opportunities
There are several Irish companies and
researchers already actively contributing
to the solar value chain in areas as diverse
as process engineering, control and
monitoring, system design and integration,
installation and maintenance, battery
storage, and materials research. A number
of such organisations are featured in case
studies in this report, with others identified
in the bullets overleaf. Consultation with
stakeholders working in solar PV and related
sectors helped identify several areas of
opportunity for Irish research and industry
based on strengths in related sectors and
technologies, and considering the position of
incumbents and other markets.
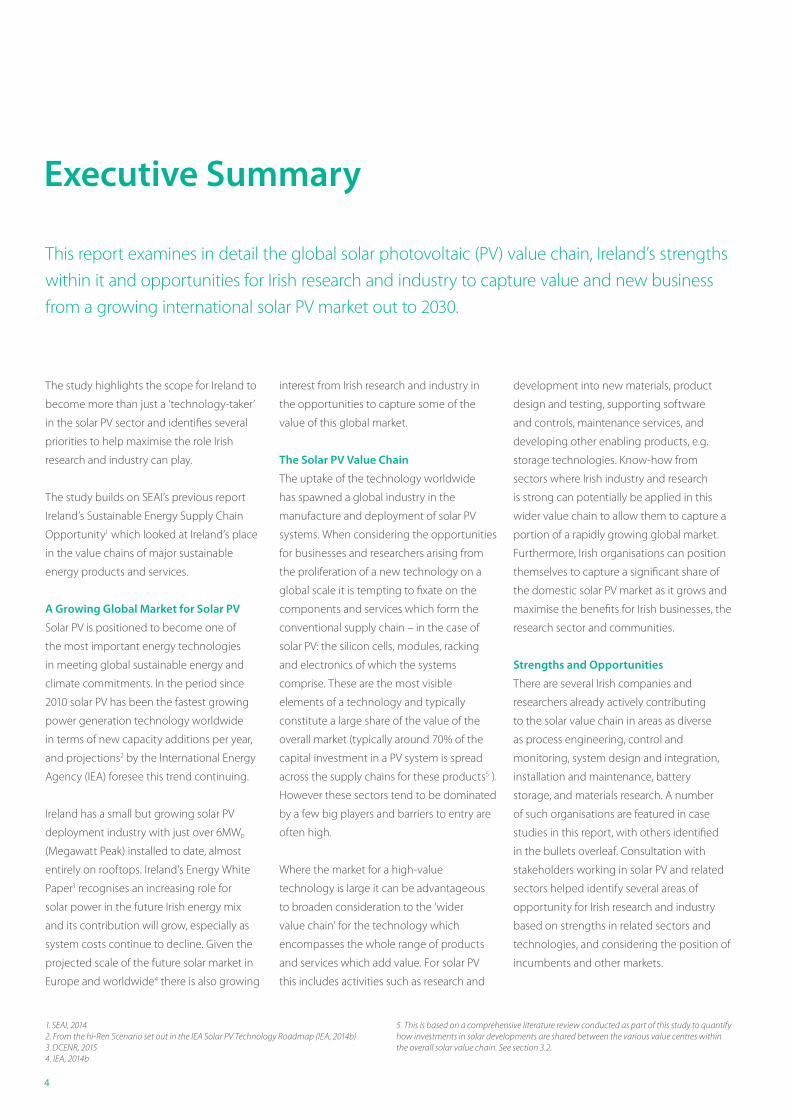
This report examines in detail the global solar photovoltaic (PV) value chain, Ireland’s strengths
within it and opportunities for Irish research and industry to capture value and new business
from a growing international solar PV market out to 2030.
1. SEAI, 2014 2. From the hi-Ren Scenario set out in the IEA Solar PV Technology Roadmap (IEA, 2014b) 3. DCENR, 2015 4. IEA, 2014b
5. This is based on a comprehensive literature review conducted as part of this study to quantify how investments in solar developments are shared between the various value centres within the overall solar value chain. See section 3.2.
5
Sustainable Energy Authority of Ireland
IRELAND’S SOLAR VALUE CHAIN OPPORTUNITY
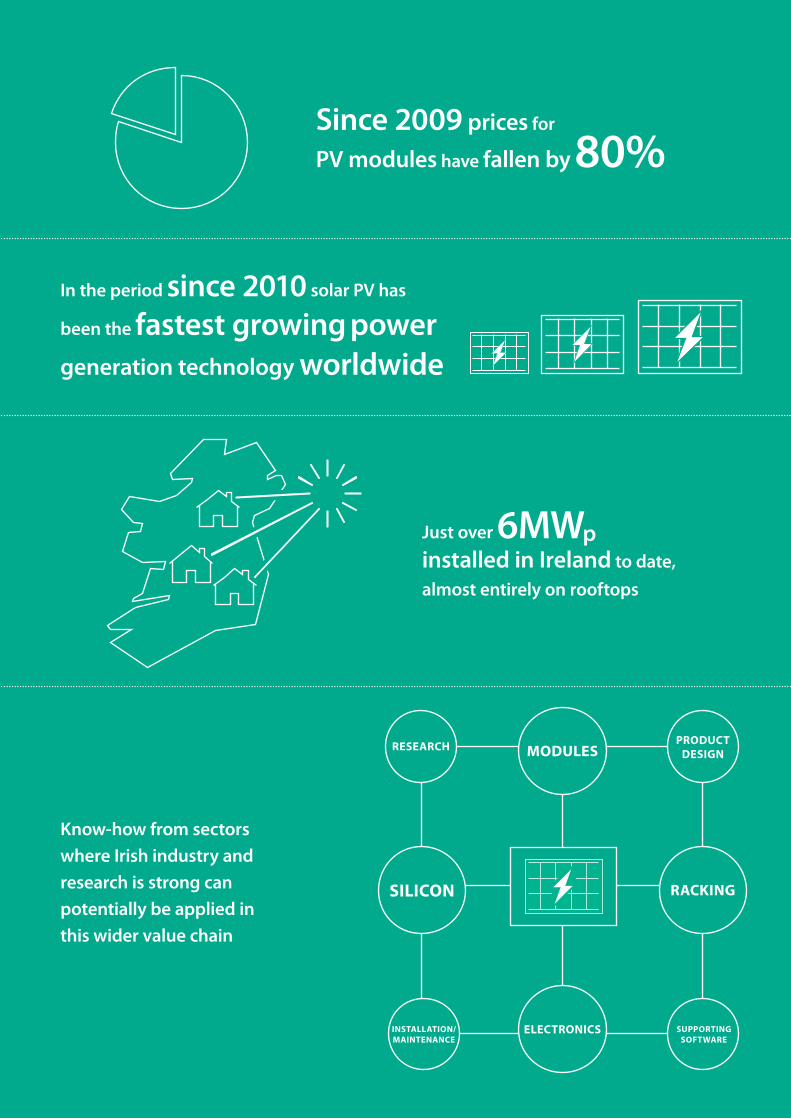
In the period since 2010 solar PV has
been the fastest growing power
generation technology worldwide
SILICON
RESEARCH PRODUCT DESIGN
SUPPORTING SOFTWARE
INSTALLATION/ MAINTENANCE
ELECTRONICS
RACKING
MODULES
Know-how from sectors
where Irish industry and
research is strong can
potentially be applied in
this wider value chain
Since 2009 prices for
PV modules have fallen by 80%
Just over 6MWp installed in Ireland to date,
almost entirely on rooftops
6
EXECUTIVE SUMMARY
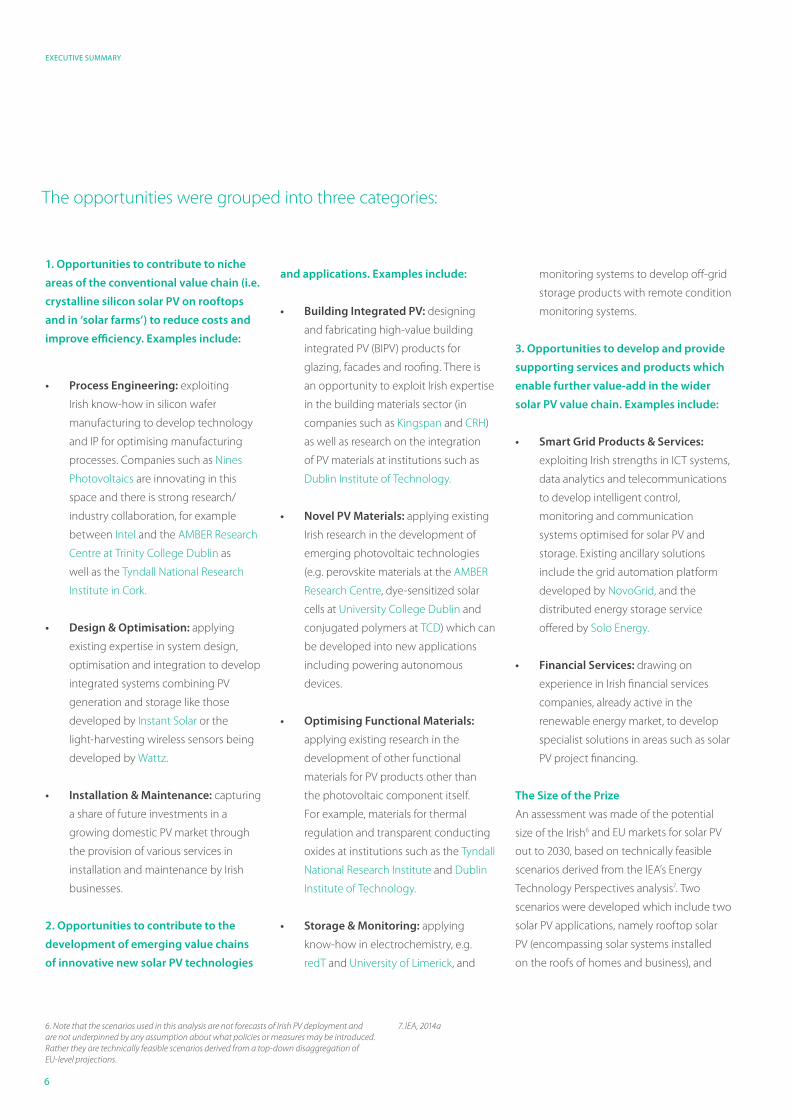
1. Opportunities to contribute to niche
areas of the conventional value chain (i.e.
crystalline silicon solar PV on rooftops
and in ‘solar farms’) to reduce costs and
improve efficiency. Examples include:
• Process Engineering: exploiting
Irish know-how in silicon wafer
manufacturing to develop technology
and IP for optimising manufacturing
processes. Companies such as Nines
Photovoltaics are innovating in this
space and there is strong research/
industry collaboration, for example
between Intel and the AMBER Research
Centre at Trinity College Dublin as
well as the Tyndall National Research
Institute in Cork.
• Design & Optimisation: applying
existing expertise in system design,
optimisation and integration to develop
integrated systems combining PV
generation and storage like those
developed by Instant Solar or the
light-harvesting wireless sensors being
developed by Wattz.
• Installation & Maintenance: capturing
a share of future investments in a
growing domestic PV market through
the provision of various services in
installation and maintenance by Irish
businesses.
2. Opportunities to contribute to the
development of emerging value chains
of innovative new solar PV technologies
and applications. Examples include:
• Building Integrated PV: designing
and fabricating high-value building
integrated PV (BIPV) products for
glazing, facades and roofing. There is
an opportunity to exploit Irish expertise
in the building materials sector (in
companies such as Kingspan and CRH)
as well as research on the integration
of PV materials at institutions such as
Dublin Institute of Technology.
• Novel PV Materials: applying existing
Irish research in the development of
emerging photovoltaic technologies
(e.g. perovskite materials at the AMBER
Research Centre, dye-sensitized solar
cells at University College Dublin and
conjugated polymers at TCD) which can
be developed into new applications
including powering autonomous
devices.
• Optimising Functional Materials:
applying existing research in the
development of other functional
materials for PV products other than
the photovoltaic component itself.
For example, materials for thermal
regulation and transparent conducting
oxides at institutions such as the Tyndall
National Research Institute and Dublin
Institute of Technology.
• Storage & Monitoring: applying
know-how in electrochemistry, e.g.
redT and University of Limerick, and
monitoring systems to develop off-grid
storage products with remote condition
monitoring systems.
3. Opportunities to develop and provide
supporting services and products which
enable further value-add in the wider
solar PV value chain. Examples include:
• Smart Grid Products & Services:
exploiting Irish strengths in ICT systems,
data analytics and telecommunications
to develop intelligent control,
monitoring and communication
systems optimised for solar PV and
storage. Existing ancillary solutions
include the grid automation platform
developed by NovoGrid, and the
distributed energy storage service
offered by Solo Energy.
• Financial Services: drawing on
experience in Irish financial services
companies, already active in the
renewable energy market, to develop
specialist solutions in areas such as solar
PV project financing.
The Size of the Prize
An assessment was made of the potential
size of the Irish6 and EU markets for solar PV
out to 2030, based on technically feasible
scenarios derived from the IEA’s Energy
Technology Perspectives analysis7. Two
scenarios were developed which include two
solar PV applications, namely rooftop solar
PV (encompassing solar systems installed
on the roofs of homes and business), and
6. Note that the scenarios used in this analysis are not forecasts of Irish PV deployment and are not underpinned by any assumption about what policies or measures may be introduced. Rather they are technically feasible scenarios derived from a top-down disaggregation of EU-level projections.
7. IEA, 2014a
The opportunities were grouped into three categories:
7
Sustainable Energy Authority of Ireland
IRELAND’S SOLAR VALUE CHAIN OPPORTUNITY
ground mount solar PV (larger solar farms
connected to the grid or directly to a source
of demand). The two scenarios used are
based on analysis from the IEA’s ‘6 degree
scenario’ (6DS) and the ‘high renewables
scenario’ (hi-RenS) which represent futures
with low and high ambitions respectively
with regards to solar PV deployment in
Europe.
The analysis, based on an extensive literature
review under this study, determined how
investments in solar PV in both scenarios
are distributed across the various lifecycle
stages of the value chain, e.g. planning and
permitting, design, installation and operation.
A further level of granularity within each
lifecycle stage was explored to determine
how these investments are typically
spread amongst the products and services
within them, e.g. planning and permitting
encompasses project management, technical
support, financial support, local authority
permits and insurance costs. By assessing
how the total investment in the Irish and EU
solar PV markets will be distributed across
the various products and services within
the value chain, it is possible to estimate the
value proposition for Irish businesses active
in these areas.
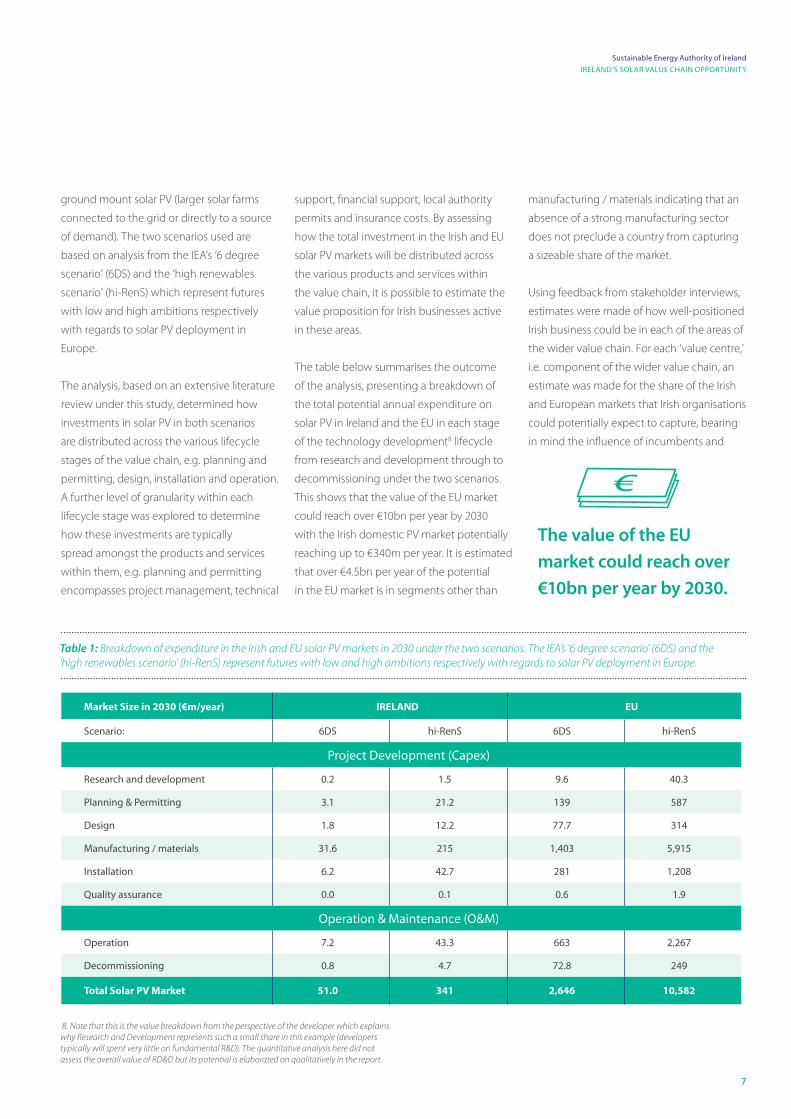
The table below summarises the outcome
of the analysis, presenting a breakdown of
the total potential annual expenditure on
solar PV in Ireland and the EU in each stage
of the technology development8 lifecycle
from research and development through to
decommissioning under the two scenarios.
This shows that the value of the EU market
could reach over €10bn per year by 2030
with the Irish domestic PV market potentially
reaching up to €340m per year. It is estimated
that over €4.5bn per year of the potential
in the EU market is in segments other than
manufacturing / materials indicating that an
absence of a strong manufacturing sector
does not preclude a country from capturing
a sizeable share of the market.
Using feedback from stakeholder interviews,
estimates were made of how well-positioned
Irish business could be in each of the areas of
the wider value chain. For each ‘value centre,’
i.e. component of the wider value chain, an
estimate was made for the share of the Irish
and European markets that Irish organisations
could potentially expect to capture, bearing
in mind the influence of incumbents and
Table 1: Breakdown of expenditure in the Irish and EU solar PV markets in 2030 under the two scenarios. The IEA’s ‘6 degree scenario’ (6DS) and the ‘high renewables scenario’ (hi-RenS) represent futures with low and high ambitions respectively with regards to solar PV deployment in Europe.
8. Note that this is the value breakdown from the perspective of the developer which explains why Research and Development represents such a small share in this example (developers typically will spent very little on fundamental R&D). The quantitative analysis here did not assess the overall value of RD&D but its potential is elaborated on qualitatively in the report.
The value of the EU
market could reach over
€10bn per year by 2030.
Market Size in 2030 (€m/year) IRELAND EU
Scenario: 6DS hi-RenS 6DS hi-RenS
Project Development (Capex)
Research and development 0.2 1.5 9.6 40.3
Planning & Permitting 3.1 21.2 139 587
Design 1.8 12.2 77.7 314
Manufacturing / materials 31.6 215 1,403 5,915
Installation 6.2 42.7 281 1,208
Quality assurance 0.0 0.1 0.6 1.9
Operation & Maintenance (O&M)
Operation 7.2 43.3 663 2,267
Decommissioning 0.8 4.7 72.8 249
Total Solar PV Market 51.0 341 2,646 10,582
8
EXECUTIVE SUMMARY
preferences for local suppliers in the EU market.
Combining these estimates with the market
size estimates set out overleaf gives a sense
of the potential size of the prize for Irish
businesses if they were to actively pursue
relevant opportunities in the solar PV
industry in the EU market.
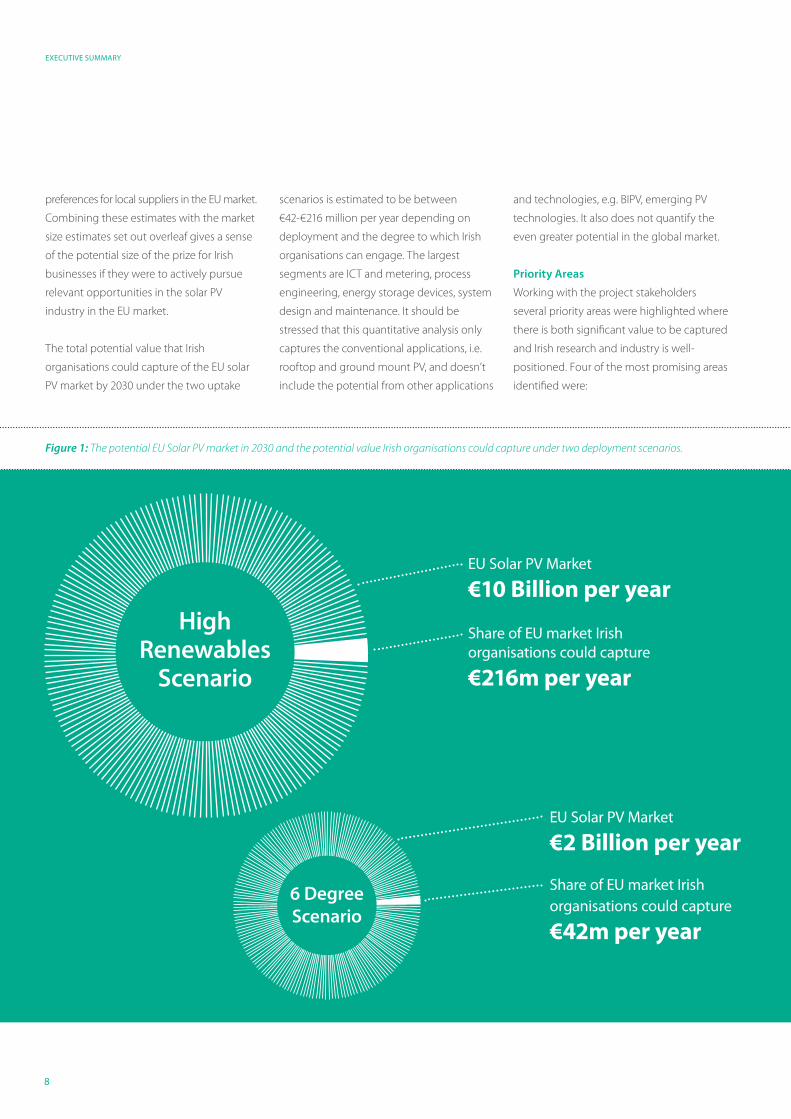
The total potential value that Irish
organisations could capture of the EU solar
PV market by 2030 under the two uptake
scenarios is estimated to be between
€42-€216 million per year depending on
deployment and the degree to which Irish
organisations can engage. The largest
segments are ICT and metering, process
engineering, energy storage devices, system
design and maintenance. It should be
stressed that this quantitative analysis only
captures the conventional applications, i.e.
rooftop and ground mount PV, and doesn’t
include the potential from other applications
and technologies, e.g. BIPV, emerging PV
technologies. It also does not quantify the
even greater potential in the global market.
Priority Areas
Working with the project stakeholders
several priority areas were highlighted where
there is both significant value to be captured
and Irish research and industry is well-
positioned. Four of the most promising areas
identified were:
Figure 1: The potential EU Solar PV market in 2030 and the potential value Irish organisations could capture under two deployment scenarios.
Share of EU market Irish organisations could capture
€42m per year
EU Solar PV Market
€2 Billion per year
Share of EU market Irish organisations could capture
€216m per year
EU Solar PV Market
€10 Billion per yearHigh
Renewables Scenario
6 DegreeScenario
9
Sustainable Energy Authority of Ireland
IRELAND’S SOLAR VALUE CHAIN OPPORTUNITY
• Building Integrated PV: Stakeholders
identified the opportunity to marry
Irish strengths in building materials
and materials research to design and
develop BIPV products and services.
Supporting research and demonstration
projects focused on integrating PV
technology within building materials,
such as glazing, facades and roofing
products, should be an area of priority
for Irish solar research.
• Materials R&D: Given the anticipated
scale of the global PV market it would
be a missed opportunity were Ireland
not to apply its world leading materials
research to applicable areas of the
value chain. This includes research into
novel PV materials, such as perovskites,
quantum dots and conjugated
polymers, other semiconductor
materials, nanomaterials and transparent
conducting oxides. Research on such
materials and their applications in the PV
sector should continue to be supported.
• Process Engineering: There is potential
for Irish research and industry to export
expertise in optimising silicon wafer
manufacturing. While Ireland does
not have a strong manufacturing base
compared with other countries, there
is scope to develop technology and
IP for optimising processing, in what is
potentially a very large market.
• Smart Grid Products & Services:
The analysis suggests that the overall
EU market for ICT and metering systems
for solar PV could be over €300m per
year by 2030. Developing solutions to
manage and control the integration of
PV and storage in the grid plays to Irish
research strengths in ICT, data analytics
and telecommunications.
Next Steps
Simply knowing what is possible does not
lead to real world impact. There are a range
of actions that need to be taken in order for
Ireland to play an active role in the global
solar PV sector, exporting products and
services, and maximising the extent to which
Irish business captures the investment in
domestic PV systems. Positive steps can
be taken by public agencies, the research
community and industry to help unlock the
opportunities in these priority areas and in
others, including:
• Establishing a solar PV forum bringing
together industry and research
communities on a regular basis could
generate opportunities for collaboration
and knowledge transfer.
• Targeted support via the SEAI RD&D
programme for both fundamental
research and projects demonstrating
viability in the priority areas identified
in this report would represent the most
effective use of supports.
• Stakeholders interviewed highlighted
non-financial barriers to the
development of a domestic solar
PV market. A healthy home market
could help Irish business to advance
their positions within the wider
value chain. Some barriers which
stakeholders requested are reviewed
include planning and grid connection
requirements for PV, and development
of standards and training for installation.
• Funding and supports for start-ups
are available via Enterprise Ireland
and the opportunity areas in the PV
value chain identified in this study
should be recognised as relevant for
Ireland. Stakeholders called for greater
collaboration between Irish research
and industry in developing new
enterprises in the solar PV space and
both groups should seek out these
opportunities and avail of enterprise
supports where appropriate.
• Given that solar PV is poised to become
one of the most important energy
technologies of the 21st Century, there
is a need to ensure that Irish citizens
have access to good information
on the technology to help inform
any investment decisions. SEAI will
endeavour to provide appropriate
updated guidance on the technology
for interested stakeholders.
10
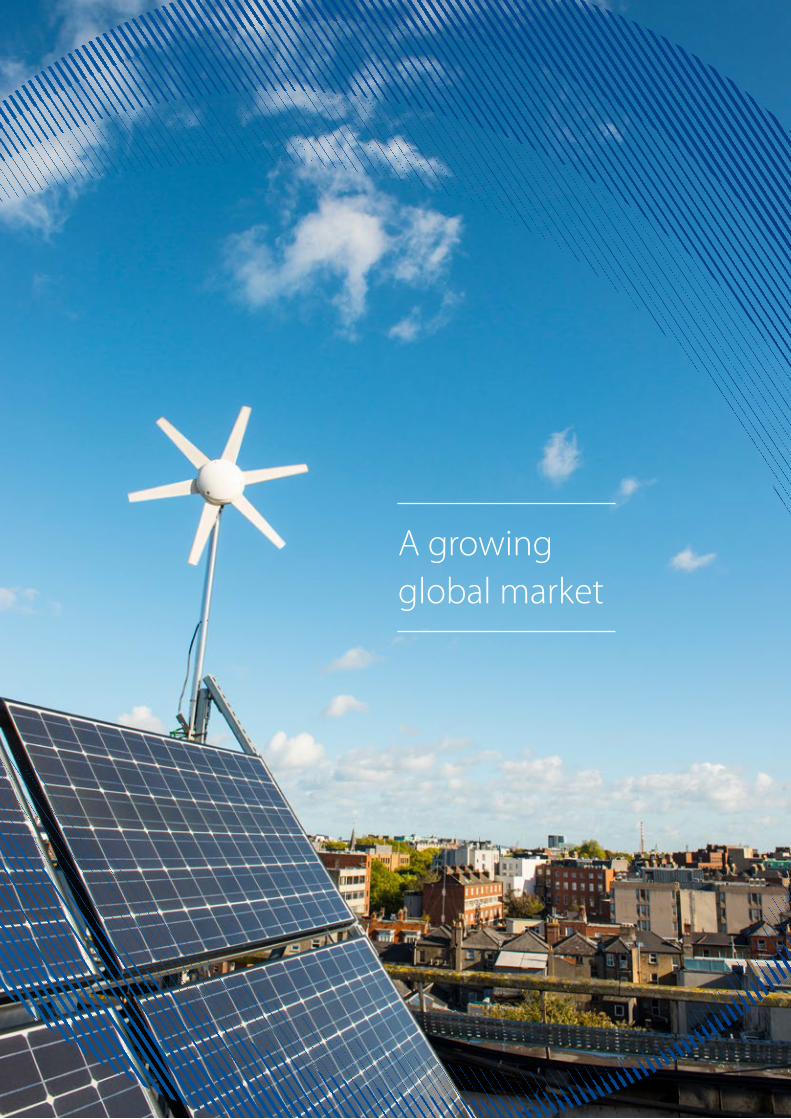
1. INTRODUCTION
A growing global market
11
Sustainable Energy Authority of Ireland
IRELAND’S SOLAR VALUE CHAIN OPPORTUNITY
Introduction
Solar Photovoltaic (PV) technologies are among the most
exciting options for decarbonising the global energy system.
The technology has seen a remarkable uptake worldwide in
recent years, growing from just 4.5GWp cumulative capacity in
2005 to over 240GWp by the end of 2015.9
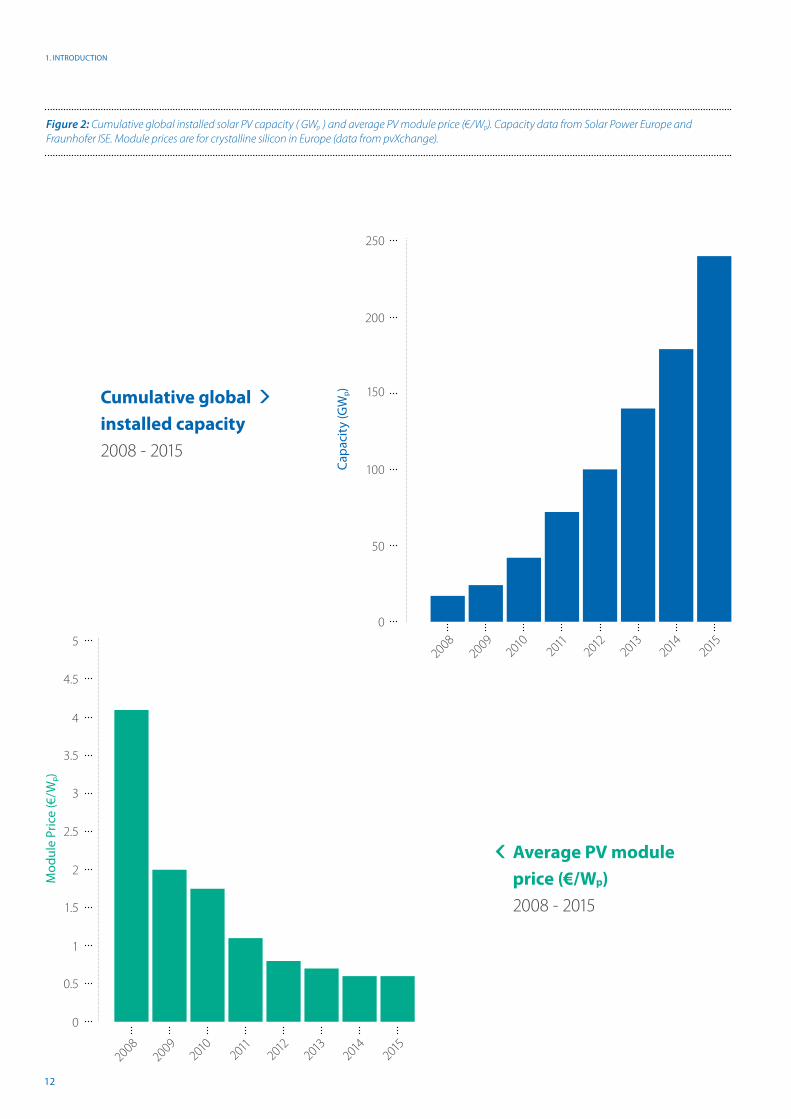
From the period since 2010 solar PV has been the fastest growing power generation
technology worldwide in terms of new capacity additions per year. The growth has been
largely driven by economic support schemes such as feed-In-tariffs and tax incentives in
certain markets. These schemes have facilitated a marked reduction in solar PV system costs
achieved through the scale-up of solar module manufacturing and deployment activities,
as well as technology and supply chain innovation – since 2009, prices for PV modules have
fallen by 80%.10 The technology is positioned to become one of the most important energy
technologies in meeting global climate commitments, with the more ambitious projections11
by the International Energy Agency foreseeing over 1,700GWp of total capacity worldwide
by 2030.
Ireland has a small but growing industry in solar PV deployment with just over 6MWp installed
to date, almost entirely on rooftops. Ireland’s Energy White Paper12 recognises an increasing
role for solar power in the future Irish energy mix and its contribution will grow, especially
as system costs continue to decline. Given the scale of the future solar market in Europe and
worldwide there is also growing interest from Irish research and industry in the opportunities
to capture some of the value of this global market. There is potential for Irish know-how in
sectors such as materials research, semiconductors, ICT, building materials, and energy storage
to add value to solar PV systems deployed across the globe.
One can consider the wider solar PV ‘value chain,’ a term which encompasses not just the
conventional supply chain, but any products or services which add value to the PV system by
improving performance or reducing costs. While the traditional crystalline silicon PV modules
will likely continue to be mass-manufactured in China and Taiwan, there are components,
services, new materials and new products which innovators in Ireland are well-positioned to
contribute and consequently capture a portion of a very large market.
1
9. IEA-PVPS, 2016 10. IRENA, 2016 11. From the hi-Ren Scenario set out in the IEA Solar PV Technology Roadmap (IEA, 2014b) 12. DCENR, 2015
12
1. INTRODUCTION
Figure 2: Cumulative global installed solar PV capacity ( GWp ) and average PV module price (€/Wp). Capacity data from Solar Power Europe and
Fraunhofer ISE. Module prices are for crystalline silicon in Europe (data from pvXchange).
Cumulative global installed capacity 2008 - 2015
Average PV module price (€/Wp)
2008 - 2015
20080
50
100
150
200
250
2009201
0201
1201
2201
3201
4201
5
Cap
acit
y (G
Wp)
20082009
2010
2011
2012
2013
2014
2015
Mod
ule
Pric
e (€
/Wp)
0
1
2
3
4
5
0.5
1.5
2.5
3.5
4.5
13
Sustainable Energy Authority of Ireland
IRELAND’S SOLAR VALUE CHAIN OPPORTUNITY
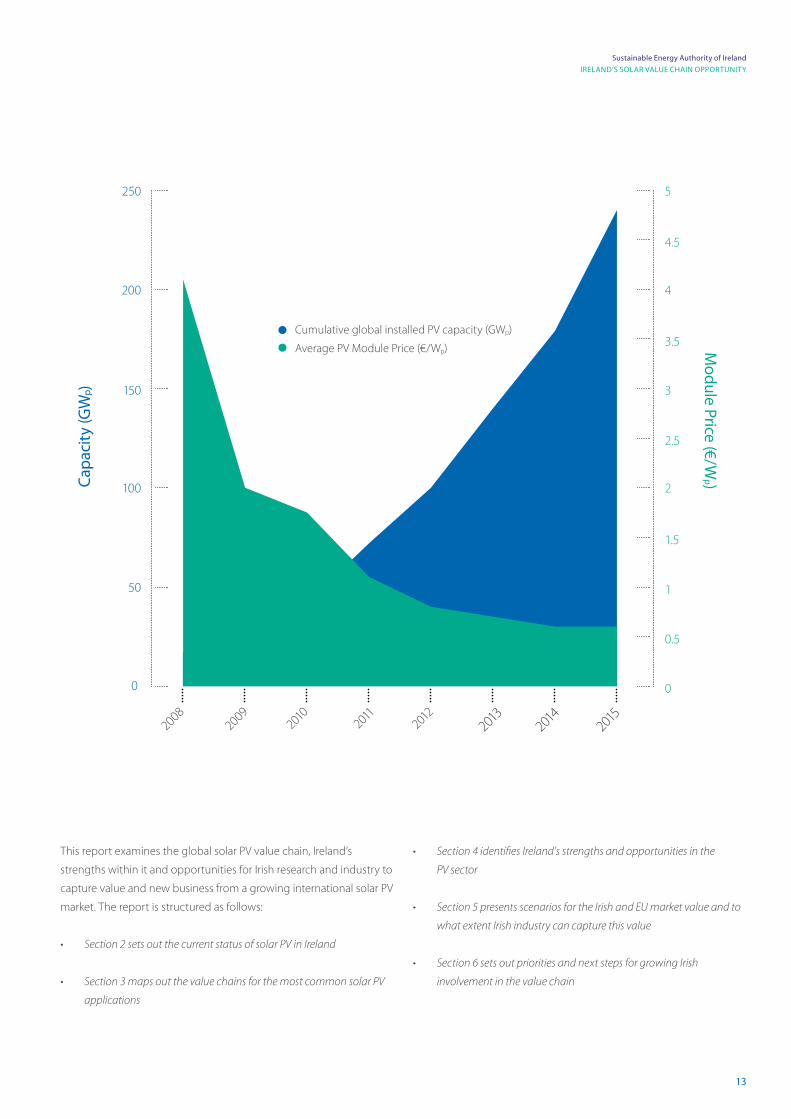
This report examines the global solar PV value chain, Ireland’s
strengths within it and opportunities for Irish research and industry to
capture value and new business from a growing international solar PV
market. The report is structured as follows:
• Section 2 sets out the current status of solar PV in Ireland
• Section 3 maps out the value chains for the most common solar PV
applications
• Section 4 identifies Ireland’s strengths and opportunities in the
PV sector
• Section 5 presents scenarios for the Irish and EU market value and to
what extent Irish industry can capture this value
• Section 6 sets out priorities and next steps for growing Irish
involvement in the value chain
0 0
100 2
150 3
200 4
250 5
50 1
0.5
1.5
2.5
3.5
4.5
2008
Cumulative global installed PV capacity (GWp)
Average PV Module Price (€/Wp)
2009201
0201
1201
2201
3201
4201
5
Cap
acit
y (G
Wp)
Module Price (€/W
p )
14
2. SOLAR PV STATUS IN IRELAND
The growing role of solar PV in Ireland
15
Sustainable Energy Authority of Ireland
IRELAND’S SOLAR VALUE CHAIN OPPORTUNITY
Solar PV Status in Ireland
2
Ireland currently has a small but growing industry in solar
PV deployment with just over 6MWp installed as of the end
of 2016.13
It may not initially seem like an obvious location for the deployment of a technology which
relies on plentiful sunlight for optimal operation, but recent improvements in the technology
performance and reductions in system cost have made solar PV an increasingly viable
option in northern European countries. Throughout Europe there is a growing recognition
of the importance of this technology in the renewable energy mix and its potential
complementarity with other intermittent renewable energy technologies such as wind and
hydropower. Solar PV is recognised as a mature technology which can contribute to meeting
Member State renewable energy targets, including those in Ireland.
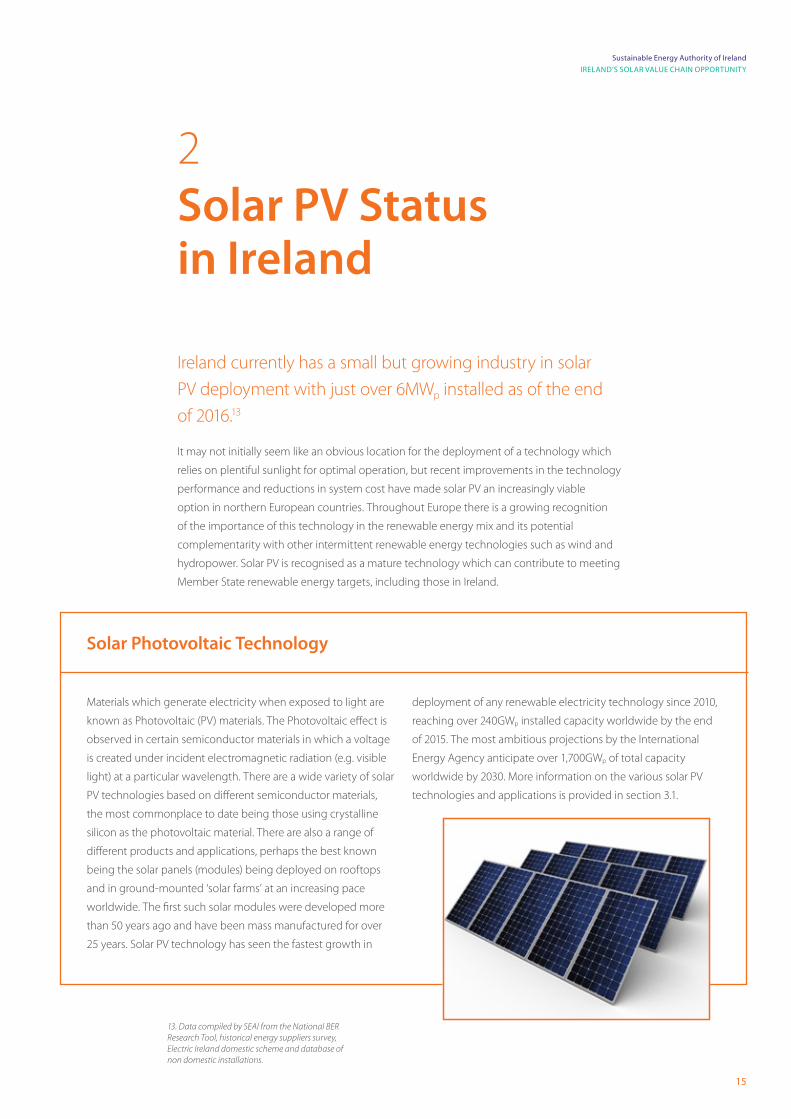
Materials which generate electricity when exposed to light are
known as Photovoltaic (PV) materials. The Photovoltaic effect is
observed in certain semiconductor materials in which a voltage
is created under incident electromagnetic radiation (e.g. visible
light) at a particular wavelength. There are a wide variety of solar
PV technologies based on different semiconductor materials,
the most commonplace to date being those using crystalline
silicon as the photovoltaic material. There are also a range of
different products and applications, perhaps the best known
being the solar panels (modules) being deployed on rooftops
and in ground-mounted ‘solar farms’ at an increasing pace
worldwide. The first such solar modules were developed more
than 50 years ago and have been mass manufactured for over
25 years. Solar PV technology has seen the fastest growth in
deployment of any renewable electricity technology since 2010,
reaching over 240GWp installed capacity worldwide by the end
of 2015. The most ambitious projections by the International
Energy Agency anticipate over 1,700GWp of total capacity
worldwide by 2030. More information on the various solar PV
technologies and applications is provided in section 3.1.
Solar Photovoltaic Technology
13. Data compiled by SEAI from the National BER Research Tool, historical energy suppliers survey, Electric Ireland domestic scheme and database of non domestic installations.
16
2. SOLAR PV STATUS IN IRELAND
Domestic Rooftops
The main driver for uptake at present is Part L of the domestic
building regulations which covers the conservation of fuel and energy
in dwellings. This requires a proportion of the energy consumption
(electricity, space heating, hot water) of a dwelling to be provided by
renewable energy sources. In the absence of renewable heating the
minimum requirement for electricity is 4kWh/m2/year. In many cases
the installation of solar PV modules on new homes is the most cost
effective means of meeting this requirement. In 2015, for example,
almost half of all new houses (i.e. non-apartments) registered on
the Building Energy Rating (BER) database included solar PV, with an
average array size of 1.2kWp.
Commercial & Public Sector Rooftops
Larger rooftop arrays are also beginning to appear in Ireland as
PV systems become an increasingly worthwhile investment for
businesses and public bodies. Several large systems have been
installed recently with grant support from SEAI, including a 300kWp
system installed on the headquarters of Kingspan Insulation in
Castleblaney, and a 250kWp array on the roofs of Iverk Produce’s
cold storage sheds at the O’Shea family farm in Piltown, Co. Kilkenny
(see text boxes). As solar PV system costs have come down they
are reaching a point where the installation of arrays on commercial
rooftops where there is a consistent daytime electricity demand can
represent an economically beneficial investment.
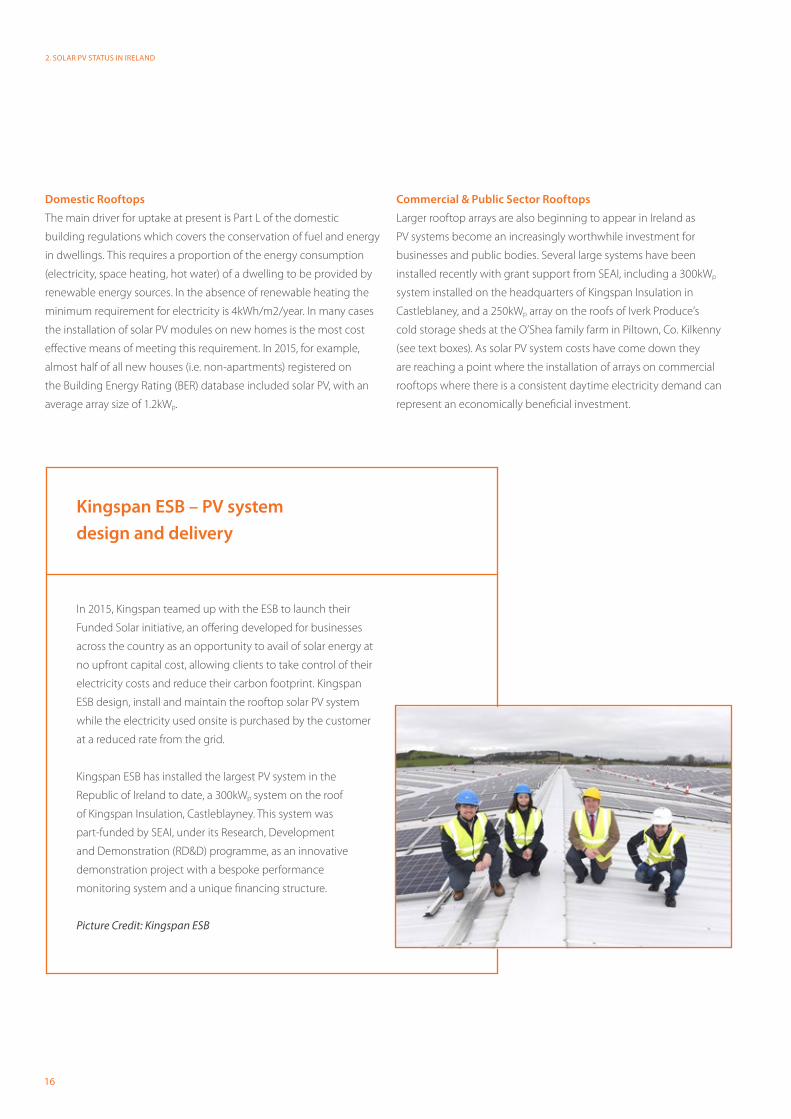
In 2015, Kingspan teamed up with the ESB to launch their
Funded Solar initiative, an offering developed for businesses
across the country as an opportunity to avail of solar energy at
no upfront capital cost, allowing clients to take control of their
electricity costs and reduce their carbon footprint. Kingspan
ESB design, install and maintain the rooftop solar PV system
while the electricity used onsite is purchased by the customer
at a reduced rate from the grid.
Kingspan ESB has installed the largest PV system in the
Republic of Ireland to date, a 300kWp system on the roof
of Kingspan Insulation, Castleblayney. This system was
part-funded by SEAI, under its Research, Development
and Demonstration (RD&D) programme, as an innovative
demonstration project with a bespoke performance
monitoring system and a unique financing structure.
Picture Credit: Kingspan ESB
Kingspan ESB – PV system
design and delivery
17
Sustainable Energy Authority of Ireland
IRELAND’S SOLAR VALUE CHAIN OPPORTUNITY
Ground Mount Systems
Interest has also grown in Ireland in the development of larger solar
arrays mounted directly on the ground as opposed to on rooftops –
such ‘ground mount’ solar arrays are typically deployed at scales of
several MWp, and often referred to as ‘solar farms.’ A large number of
applications for grid connection and planning have been submitted
for such developments in Ireland, with growing interest from a
number of solar developers. Ireland now has a dedicated trade
association, the Irish Solar Energy Association, promoting ground
mount solar as well as rooftop and other PV applications.
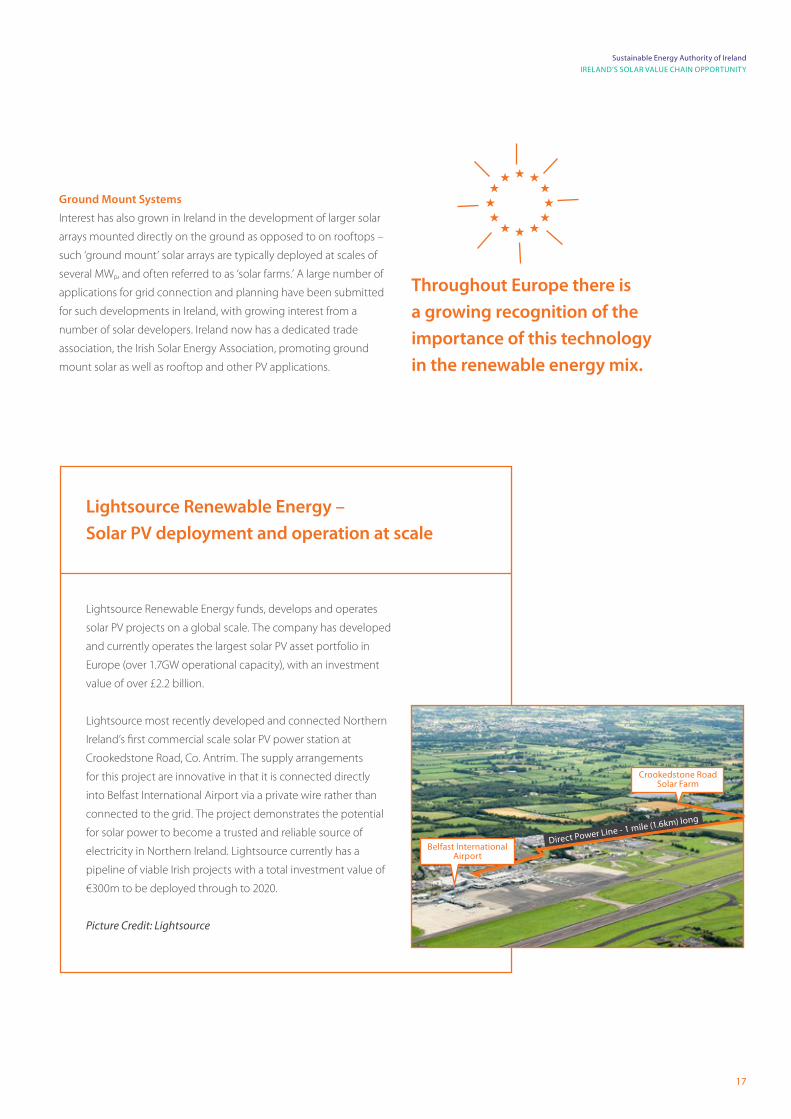
Lightsource Renewable Energy funds, develops and operates
solar PV projects on a global scale. The company has developed
and currently operates the largest solar PV asset portfolio in
Europe (over 1.7GW operational capacity), with an investment
value of over £2.2 billion.
Lightsource most recently developed and connected Northern
Ireland’s first commercial scale solar PV power station at
Crookedstone Road, Co. Antrim. The supply arrangements
for this project are innovative in that it is connected directly
into Belfast International Airport via a private wire rather than
connected to the grid. The project demonstrates the potential
for solar power to become a trusted and reliable source of
electricity in Northern Ireland. Lightsource currently has a
pipeline of viable Irish projects with a total investment value of
€300m to be deployed through to 2020.
Picture Credit: Lightsource
Lightsource Renewable Energy –
Solar PV deployment and operation at scale
Throughout Europe there is
a growing recognition of the
importance of this technology
in the renewable energy mix.
Direct Power Line - 1 mile (1.6km) long
Crookedstone Road Solar Farm
Belfast International Airport
18
2. SOLAR PV STATUS IN IRELAND
• Domestic Building Regulations: The energy contribution of a solar
PV array may be included in the calculation of the renewable energy
contribution within a building to comply with Part L of the Building
Regulations for new buildings. Solar PV may, in many cases, represent
the least cost option for meeting this renewable energy requirement.
Since 2013 almost 4,000 new dwellings recorded in the BER database
have included some solar PV generating capacity.
• Accelerated Capital Allowances: Solar PV products meeting the
required European and international standards can be registered on
the SEAI Triple E Register for accredited energy-efficient equipment.
Companies paying corporation tax, sole-traders and non-corporates
that purchase listed solar PV products can qualify for a favourable
depreciation regime under the Accelerated Capital Allowances
scheme, and for VAT refunds when installed for agricultural use by
farmers.
• SEAI RD&D Programme: SEAI has committed almost €1m
of RD&D funding to solar PV projects since 2005, including an
unprecedented €250k in 2015. This includes grants for research as well
as demonstration projects. Solar energy was identified as one of the
target research areas in the 2016 application guidelines..
• Better Energy Communities: The Better Energy Communities
(BEC) programme supports community energy efficiency projects.
Over 15,000 homes and hundreds of community, private and public
buildings have received energy efficiency upgrades through BEC. The
programme has also supported projects to deploy renewable energy
technologies such as solar PV within communities. Examples include
a 40kWp PV array in Waterford IT and a 250kWp system on O’Shea’s
farm, Kilkenny..
• Building Energy Rating: The Building Energy Rating (BER) of
households which install solar PV is given a boost. Microgeneration
technologies such as solar PV can increase the dwelling BER if
appropriately sized – typically a 2kWp rooftop PV system will give
a boost of around 20 kWh/m2/year. For a typical detached B1
rated dwelling built after 2005 this would raise its BER to an A3.
A methodology for the estimation of this is included within the
associated Dwellings Energy Assessment Procedure (DEAP) software.
• Home Renovation Incentive: The Home Renovation Incentive
(HRI) scheme currently provides for tax relief for Homeowners and
Landlords by way of an Income Tax credit at 13.5% of qualifying
expenditure on repair, renovation or improvement works carried out
on a main home or rental property by qualifying Contractor. Tax relief
can be claimed on qualifying expenditure over €4,405 (before VAT at
13.5%) per property. Supply and fitting of solar panels is covered by
the scheme.
• Standards Development: SEAI formed a Standards Development
Group to develop FETAC micro-generation award standards for
installer training courses, including courses for solar PV installers.
Final award specifications were provided to FETAC for training
awards, which are now FETAC accredited, for two courses
(Implementation of micro solar PV systems and Electrical Installation
of micro-generators).
2.1Current Measures Promoting Solar PV in Ireland
SEAI has committed almost €1m
of RD&D funding to solar PV projects.
Support for and recognition of the technology in Ireland has been
demonstrated in a variety of ways to date, including:
19
Sustainable Energy Authority of Ireland
IRELAND’S SOLAR VALUE CHAIN OPPORTUNITY
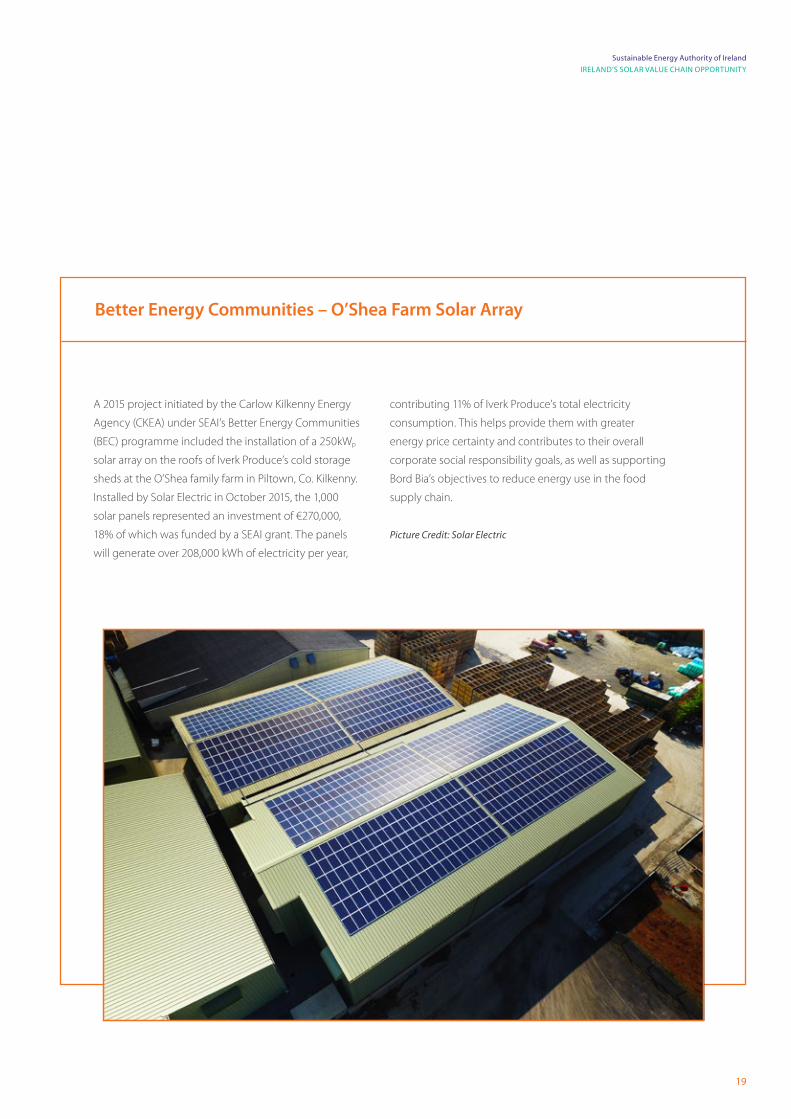
A 2015 project initiated by the Carlow Kilkenny Energy
Agency (CKEA) under SEAI’s Better Energy Communities
(BEC) programme included the installation of a 250kWp
solar array on the roofs of Iverk Produce’s cold storage
sheds at the O’Shea family farm in Piltown, Co. Kilkenny.
Installed by Solar Electric in October 2015, the 1,000
solar panels represented an investment of €270,000,
18% of which was funded by a SEAI grant. The panels
will generate over 208,000 kWh of electricity per year,
contributing 11% of Iverk Produce’s total electricity
consumption. This helps provide them with greater
energy price certainty and contributes to their overall
corporate social responsibility goals, as well as supporting
Bord Bia’s objectives to reduce energy use in the food
supply chain.
Picture Credit: Solar Electric
Better Energy Communities – O’Shea Farm Solar Array
20
3. MAPPING THE SOLAR PV 'WIDER VALUE CHAIN'
The distribution of investments in solar PV across the value chain
21
Sustainable Energy Authority of Ireland
IRELAND’S SOLAR VALUE CHAIN OPPORTUNITY
Mapping the Solar PV ‘Wider Value Chain’
3
When considering the opportunities for businesses and
researchers arising from the proliferation of a new technology
on a global scale it is tempting to fixate on the components
and services which form the conventional supply chain
– in the case of solar PV: the silicon, modules, mounting
equipment, and electronics of which the systems comprise.
These are the most visible elements of a technology and typically constitute a large share of
the value of the overall market, but their provision tends to be dominated by a few big players
and barriers to entry are often high.
Where the market for a high-value technology is large it can be advantageous to broaden
consideration to the ‘value chain’ for the technology – the range of services and products
that add value to a product, including activities such as research and development, product
design and testing, and project management. One can further consider the ‘wider value chain’,
encompassing a range of activities and products in supporting sectors which enable further
value-add, such as accompanying software and hardware, maintenance services and research
into new materials.
This report is concerned with the wider value chain for solar PV and the place of Irish business
and research within it. Irish firms have the potential to occupy niches in the wider value chain
that may seem like less significant aspects of the PV market, but when export potential to
a global market is considered it can scale to represent significant business opportunities.
The quantitative element of this report examines the solar PV ‘wider value chain’ from the
perspective of the developer or owner of a solar PV system, exploring how the investment
made in the development, operation and maintenance of a rooftop or ground mount system
flows through the various parts of the value chain. The analysis is extended to encompass
supporting/enabling activities which stand to benefit from the burgeoning global solar PV
sector such as electricity storage technologies and R&D into new functional materials. This
analysis does not encompass every component of the ‘wider value chain’ for solar PV, but is
limited to those which are directly impacted by the investments made by the developer.
This section maps out all of the component parts (referred to here as ‘value centres’) of the
rooftop and ground mount solar value chains. It then identifies how investment in solar PV
systems is distributed between these value centres, in order to subsequently determine the
scale of the opportunity for Irish industry and research within each of these areas.
22
3. MAPPING THE SOLAR PV 'WIDER VALUE CHAIN'
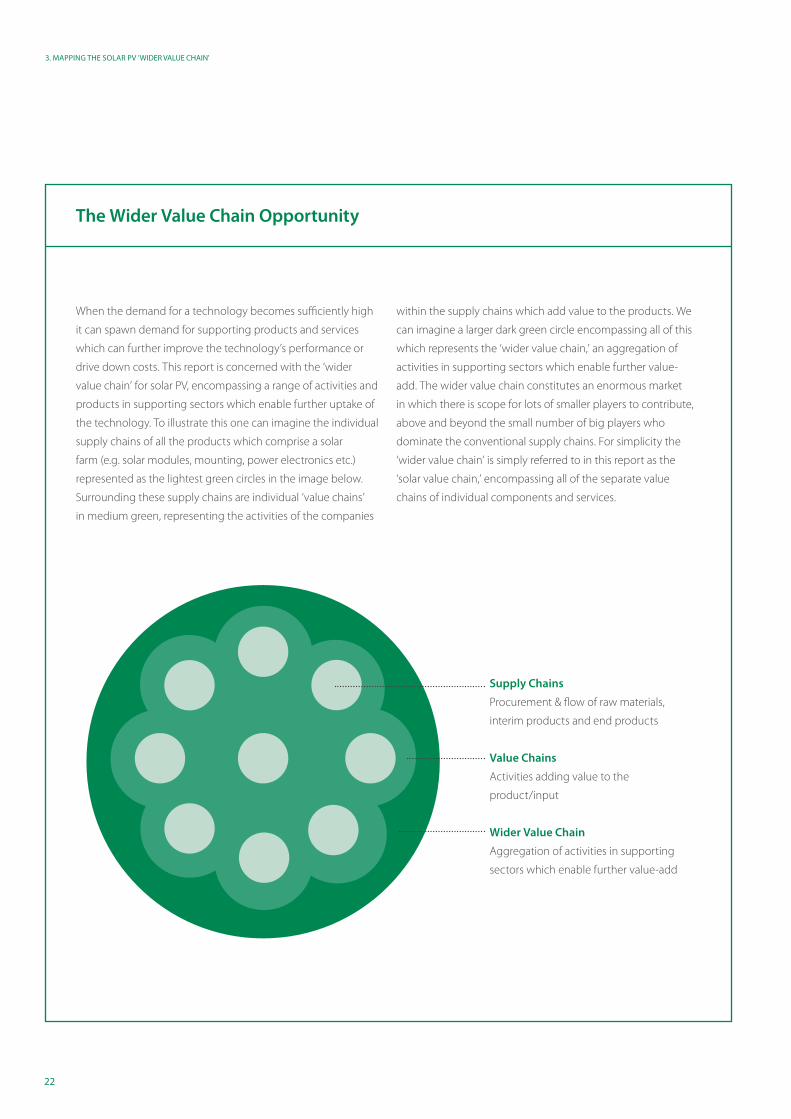
When the demand for a technology becomes sufficiently high
it can spawn demand for supporting products and services
which can further improve the technology’s performance or
drive down costs. This report is concerned with the ‘wider
value chain’ for solar PV, encompassing a range of activities and
products in supporting sectors which enable further uptake of
the technology. To illustrate this one can imagine the individual
supply chains of all the products which comprise a solar
farm (e.g. solar modules, mounting, power electronics etc.)
represented as the lightest green circles in the image below.
Surrounding these supply chains are individual ‘value chains’
in medium green, representing the activities of the companies
within the supply chains which add value to the products. We
can imagine a larger dark green circle encompassing all of this
which represents the ‘wider value chain,’ an aggregation of
activities in supporting sectors which enable further value-
add. The wider value chain constitutes an enormous market
in which there is scope for lots of smaller players to contribute,
above and beyond the small number of big players who
dominate the conventional supply chains. For simplicity the
‘wider value chain’ is simply referred to in this report as the
‘solar value chain,’ encompassing all of the separate value
chains of individual components and services.
The Wider Value Chain Opportunity
Supply Chains
Procurement & flow of raw materials,
interim products and end products
Value Chains
Activities adding value to the
product/input
Wider Value Chain
Aggregation of activities in supporting
sectors which enable further value-add
23
Sustainable Energy Authority of Ireland
IRELAND’S SOLAR VALUE CHAIN OPPORTUNITY
A definitive breakdown of how the value of
an investment in a solar PV development
is distributed across all components (‘value
centres’) of the wider value chain does not
exist since costs will vary depending on
system size, design, technology, location and
operation. For the purposes of this analysis
two solar PV archetypes have been selected
capturing the most typical installations:
1. Rooftop: A grid-connected, rooftop crystalline silicon array
sized between 1-50kWp.
2. Ground Mount: A grid-connected, ground mounted
crystalline silicon array sized between 5-10MWp.
These two archetypes cover a large share of the capacity expected to
be deployed in the European and Irish markets. A distinction is often
made between the domestic and commercial rooftop markets, but
for simplicity in this report a generic ‘rooftop’ solar value chain14 is
considered, taking an average of the typical system sizes for domestic
and commercial installations. Likewise, ground mount PV arrays sized
at <5MWp and >10MWp are commonplace across Europe, but the
above archetype is chosen to represent a typical installation.
There are a wide range of other solar PV applications at a variety of
scales including building integrated photovoltaics (BIPV), remote solar
PV, concentrated solar PV and floating solar PV arrays. There are also a
variety of other photovoltaic materials such as thin-film technologies
like Cadmium Telluride (CdTe) and emerging novel materials such as
dye-sensitised solar cells (DSSC) and perovskite solar cells. Many of
these applications and technologies show tremendous promise but
their future market share is impossible to determine. Therefore these
applications and technologies have been considered qualitatively in
this report (see section 4) while the market value analysis (section 5.2)
focuses on the ‘conventional’ crystalline silicon modules in these two
most common applications.
A comprehensive literature review was conducted15 to quantify
how investments in solar developments are shared between the
various value centres within the overall value chain. A range of
sources classifying and quantifying the value chain were assessed,
focusing on EU studies compiling cost data from developers and
manufacturer.16 The literature review and subsequent consultation
with stakeholders from the Irish solar industry led to a mapping of the
rooftop and ground mount value chains (from the perspective of the
owner/developer) classified into eight different ‘lifecycle stages’ of the
project and technology:
1. Research & Development
2. Planning
3. Project Design
4. Manufacturing
5. Installation
6. Quality Assurance
7. Operation
8. Decommissioning
Beneath these major headings, a more detailed cost breakdown
structure was used to capture the costs associated with key products,
services, and components involved at each stage of the lifecycle –
these components are referred to here as ‘value centres.’ This cost
structure was adjusted in light of data availability, with some value
centres being combined or eliminated, and others being sub-divided
where more detailed cost data was available. Aggregating all of the
cost data allowed for the following estimates to be made for each
value centre:
• For all Operation and Maintenance (O&M) value centres,
a percentage share of the annual project operating and
maintenance costs
• For all other value centres, a percentage share of the total project
capital costs
3.1 Value Distribution Assessment
14. For simplicity the ‘wider value chain’ is simply referred to here as the ‘solar value chain’. 15. The value chain modelling in sections 3-5 was conducted by Ricardo Energy & Environment 16. A summary of the main sources reviewed and applied to the analysis is provided in Appendix B
24
3. MAPPING THE SOLAR PV 'WIDER VALUE CHAIN'
3.2Wider Value Chain Maps
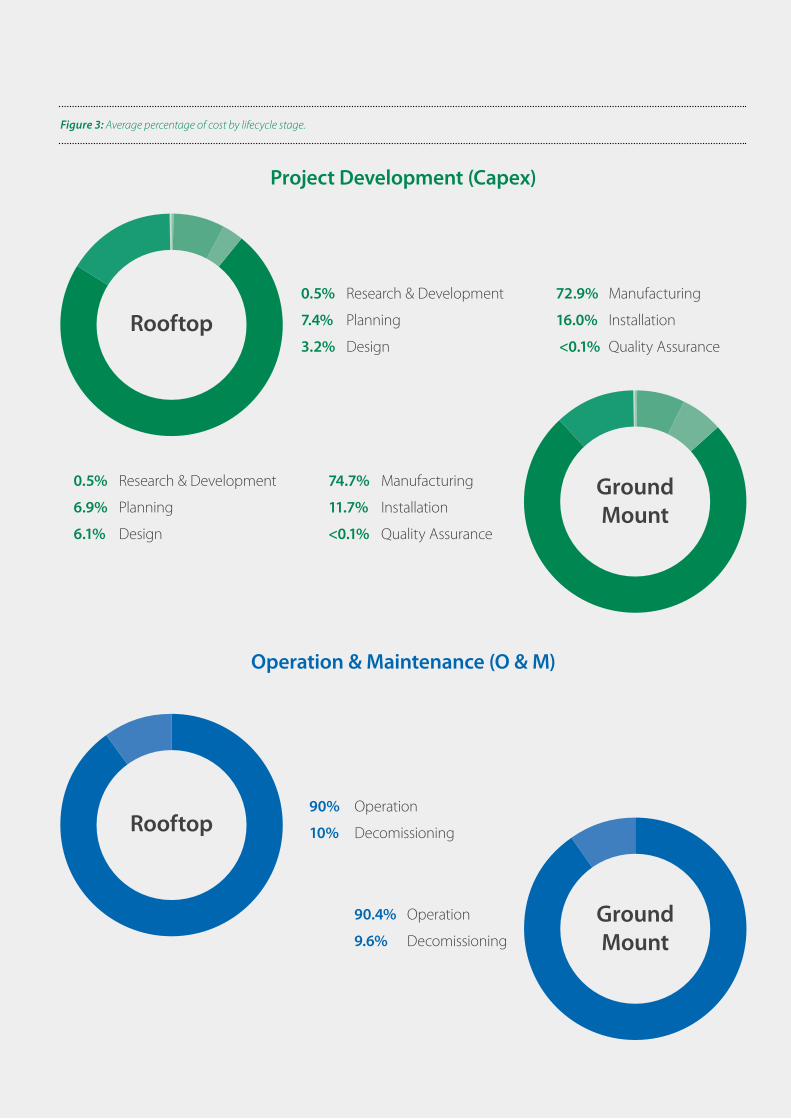
The breakdown opposite demonstrates
that the majority of the capital spending on
solar developments is used to finance the
manufacturing of the relevant hardware.
Note again that this is the value breakdown
from the perspective of the developer which
explains why Research and Development
represents such a small share in this
example. Developers typically will spent
very little on fundamental R&D. In this
example the R&D lifecycle stage represents
any spending by developers on exploring
options with new technologies and thus
constitutes only a small part of the wider
value chain from their perspective. Note
that spending on R&D in solar PV comes
from other sources (including public money
and investments made by technology
developers) which aren’t captured here.
Furthermore, successfully translating R&D in
new PV technologies and applications can
open up entirely new markets, the value of
which are not quantified here. Therefore the
opportunities for value to be captured in
the commercialisation of R&D are not fully
captured in these charts.
Successfully translating R&D in new PV
technologies and applications can open
up entire new markets.
The solar PV value chain maps for rooftop and ground mount applications are presented in
Figure 4 and Figure 5 respectively. The average percentage of capital costs or annual O&M
costs incurred in each value centre of the chain is overlaid on the map. The charts opposite
summarise the typical average breakdown by lifecycle stage for each archetype
25
Sustainable Energy Authority of Ireland
IRELAND’S SOLAR VALUE CHAIN OPPORTUNITY
0.5% Research & Development
7.4% Planning
3.2% Design
72.9% Manufacturing
16.0% Installation
<0.1% Quality Assurance
90% Operation
10% Decomissioning
90.4% Operation
9.6% Decomissioning
0.5% Research & Development
6.9% Planning
6.1% Design
74.7% Manufacturing
11.7% Installation
<0.1% Quality Assurance
Project Development (Capex)
Operation & Maintenance (O & M)
Rooftop
Rooftop
Ground Mount
Ground Mount
Figure 3: Average percentage of cost by lifecycle stage.
26
3. MAPPING THE SOLAR PV 'WIDER VALUE CHAIN'
Preliminaries Design & Manufacturing
Owner/Developer
Installation & Quality Assurance O & M
Research &Development
Novel PVMaterials
New ProductDevelopment
ProjectManagement
ProjectManagementSystem Design Electrical
EquipmentQA Related
Products/Services Maintenance Recycling
BuildingIntegrated PV
FinancialAdviser/Services
Hardware Testing& Certification PV Panels Commissioning
Engineers Insurance Project Management
EnergyStorage
TechnicalAdvisers
MountingSystems
ElectricalEngineering
Metering &Communications
Local AuthorityPermits
Insurance
Thin FilmTechnology
3rd GenerationTechnology
Multi-JunctionCells
Lead Acid Batteries
Li-Ion Batteries
Other StorageTechnologies
ICT & MeteringSystems
Control &Instrumentation
Inverters
Energy StorageDevices
CombinerBoxes
LV & DCEquipment
Solar Cells
MobileAssembly
ProcessEngineering
EquipmentWarranties
PerformanceGuarantees
Other FunctionalMaterials
RooftopMounting Aggregators
Planning &Permitting Design Manufacturing/
Materials Installation QualityAssurance Operation Decommissioning
100%
7.9%
0.5%
<0.1% 0.5%
<0.1%
<0.1%
<0.1%
<0.1%
<0.1%
<0.1%
<0.1%
<0.1%
<0.1%
0.5% 3.2% 22.9% 0.7% <0.1% 72%
1% <0.1% 36.9% 1.3% 10.8%
4.8% 13.1% 5.2% 7.2%
1.1%
<0.1%
8.8% <0.1%
9.0%
1%
10%90%<0.1%16%72.9%3.2%7.4%
1.4%
8.4%
1.0%
2.0%
4.6%
5.5%
14.2%
2.2%
20.5%
<0.1%
<0.1%
76.1% 16% 100%
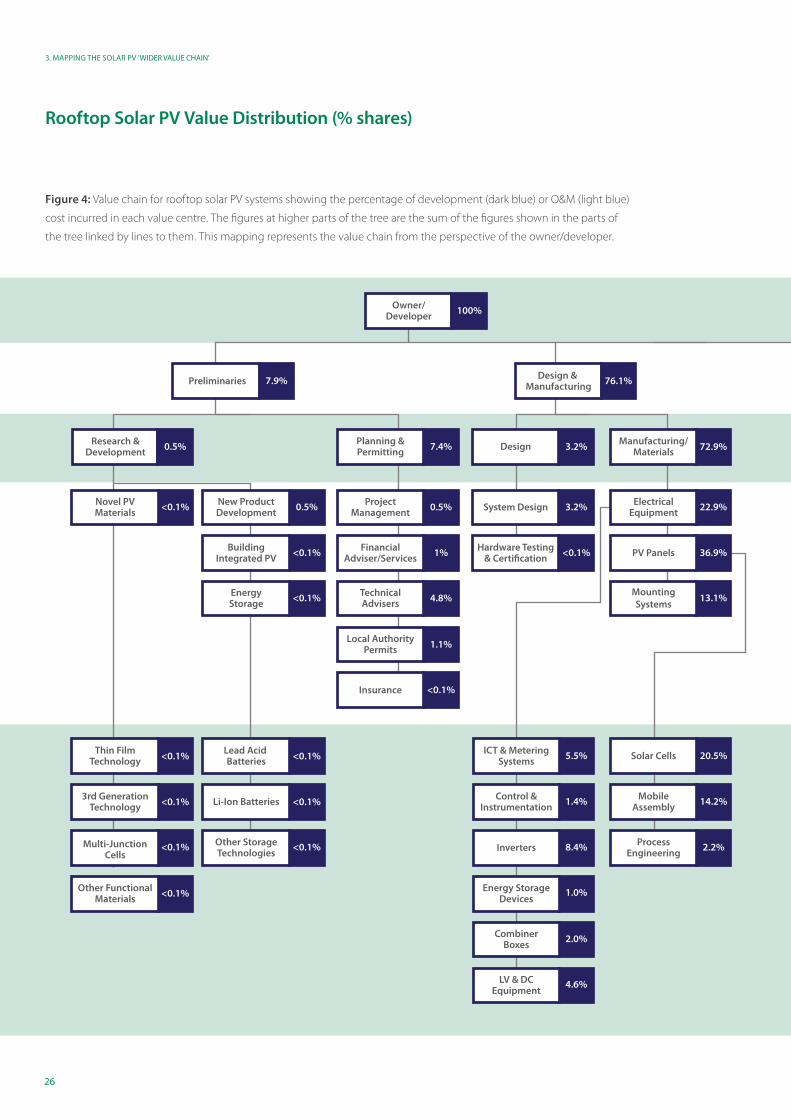
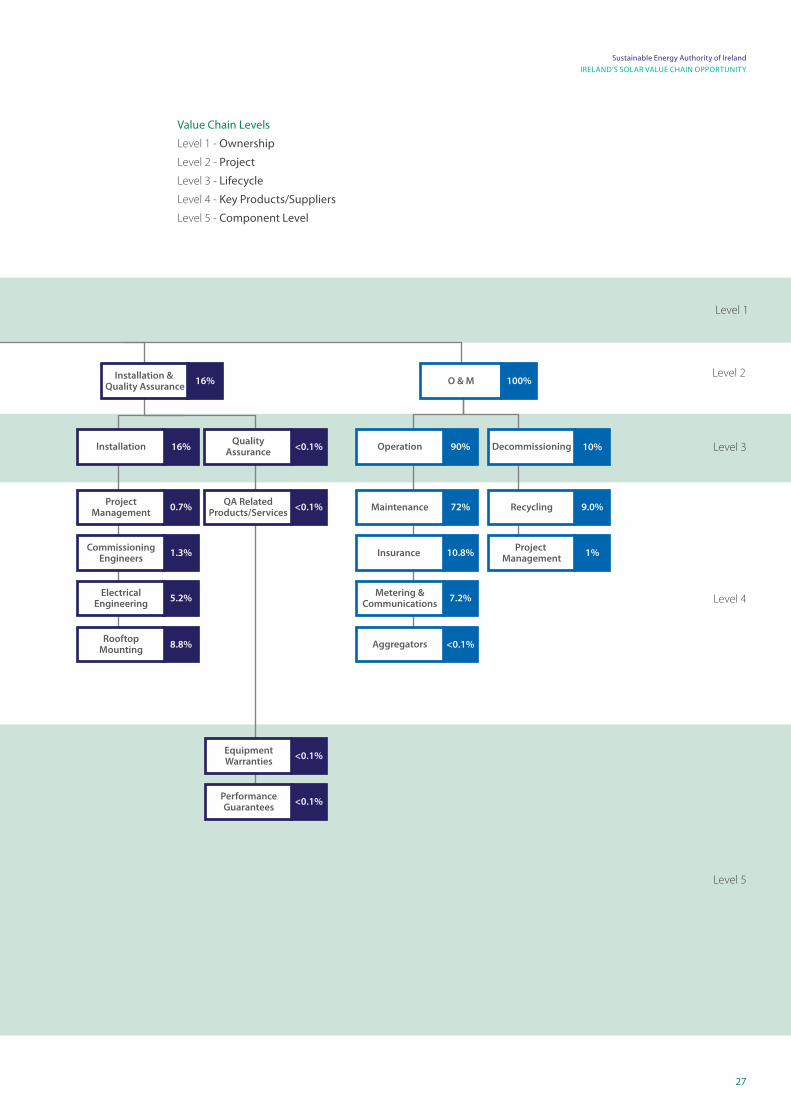
Rooftop Solar PV Value Distribution (% shares)
Figure 4: Value chain for rooftop solar PV systems showing the percentage of development (dark blue) or O&M (light blue)
cost incurred in each value centre. The figures at higher parts of the tree are the sum of the figures shown in the parts of
the tree linked by lines to them. This mapping represents the value chain from the perspective of the owner/developer.
27
Sustainable Energy Authority of Ireland
IRELAND’S SOLAR VALUE CHAIN OPPORTUNITY
Preliminaries Design & Manufacturing
Owner/Developer
Installation & Quality Assurance O & M
Research &Development
Novel PVMaterials
New ProductDevelopment
ProjectManagement
ProjectManagementSystem Design Electrical
EquipmentQA Related
Products/Services Maintenance Recycling
BuildingIntegrated PV
FinancialAdviser/Services
Hardware Testing& Certification PV Panels Commissioning
Engineers Insurance Project Management
EnergyStorage
TechnicalAdvisers
MountingSystems
ElectricalEngineering
Metering &Communications
Local AuthorityPermits
Insurance
Thin FilmTechnology
3rd GenerationTechnology
Multi-JunctionCells
Lead Acid Batteries
Li-Ion Batteries
Other StorageTechnologies
ICT & MeteringSystems
Control &Instrumentation
Inverters
Energy StorageDevices
CombinerBoxes
LV & DCEquipment
Solar Cells
MobileAssembly
ProcessEngineering
EquipmentWarranties
PerformanceGuarantees
Other FunctionalMaterials
RooftopMounting Aggregators
Planning &Permitting Design Manufacturing/
Materials Installation QualityAssurance Operation Decommissioning
100%
7.9%
0.5%
<0.1% 0.5%
<0.1%
<0.1%
<0.1%
<0.1%
<0.1%
<0.1%
<0.1%
<0.1%
<0.1%
0.5% 3.2% 22.9% 0.7% <0.1% 72%
1% <0.1% 36.9% 1.3% 10.8%
4.8% 13.1% 5.2% 7.2%
1.1%
<0.1%
8.8% <0.1%
9.0%
1%
10%90%<0.1%16%72.9%3.2%7.4%
1.4%
8.4%
1.0%
2.0%
4.6%
5.5%
14.2%
2.2%
20.5%
<0.1%
<0.1%
76.1% 16% 100%
Level 1
Level 2
Level 3
Level 4
Level 5
Value Chain Levels
Level 1 - Ownership
Level 2 - Project
Level 3 - Lifecycle
Level 4 - Key Products/Suppliers
Level 5 - Component Level
28
3. MAPPING THE SOLAR PV 'WIDER VALUE CHAIN'
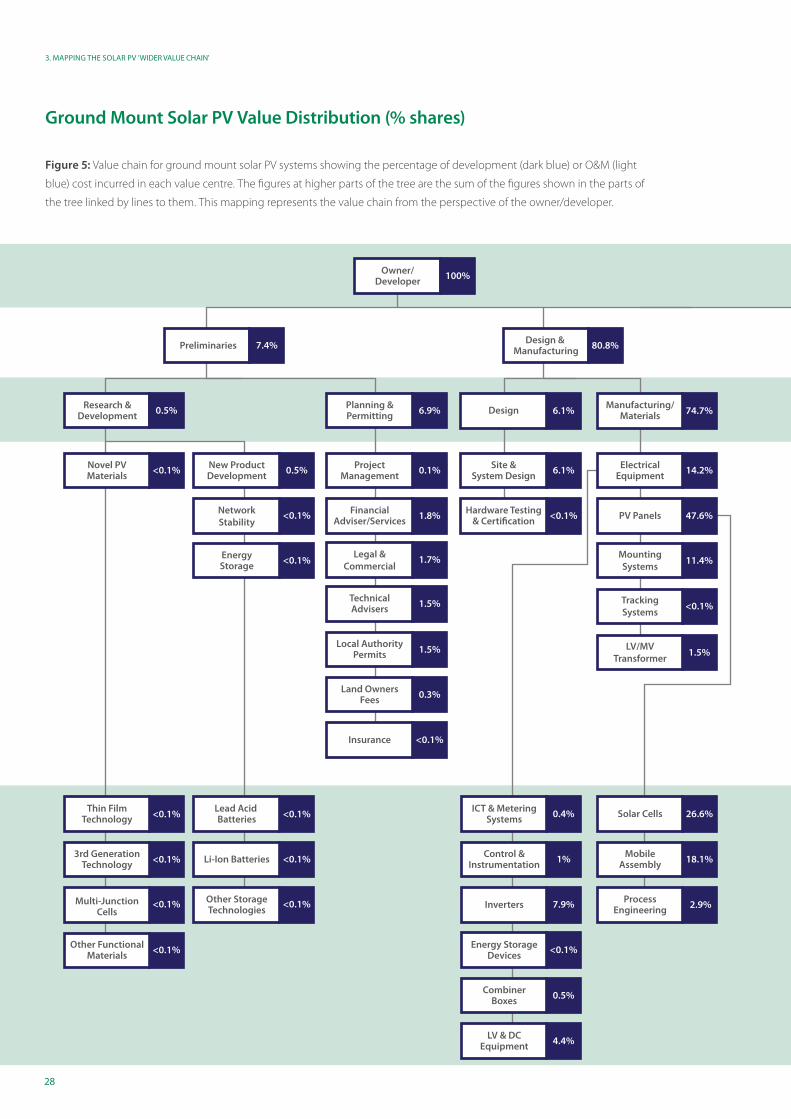
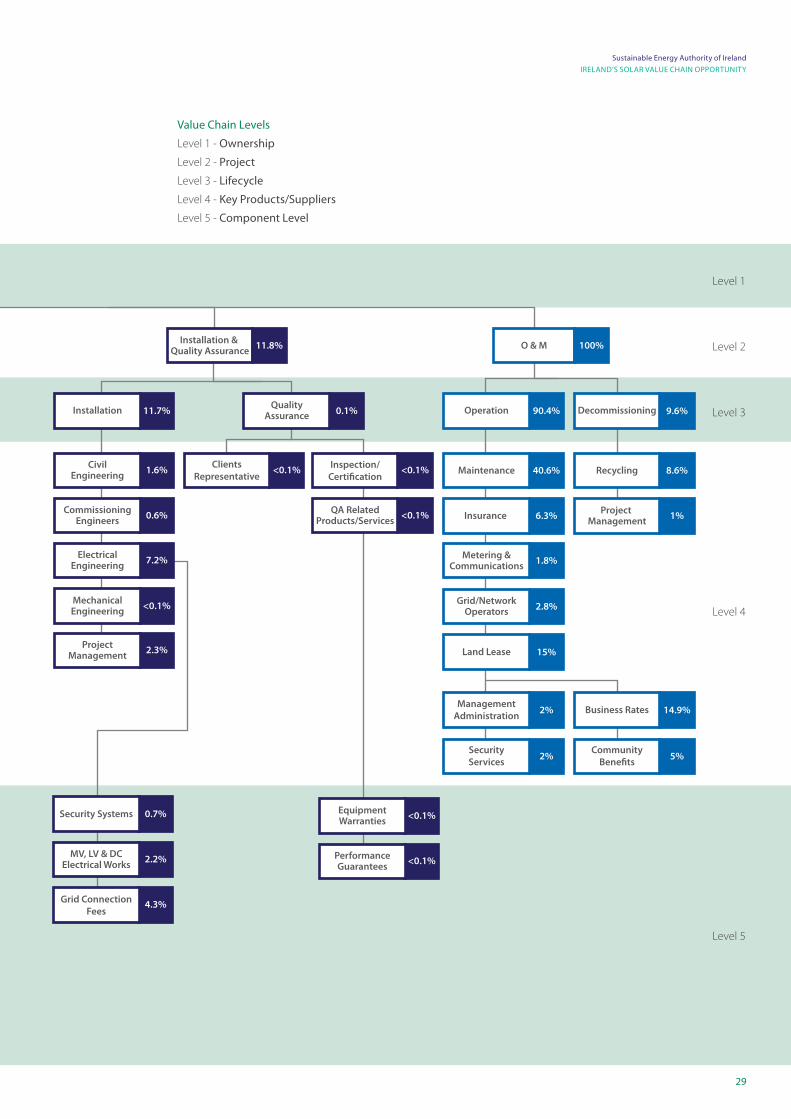
Ground Mount Solar PV Value Distribution (% shares)
Figure 5: Value chain for ground mount solar PV systems showing the percentage of development (dark blue) or O&M (light
blue) cost incurred in each value centre. The figures at higher parts of the tree are the sum of the figures shown in the parts of
the tree linked by lines to them. This mapping represents the value chain from the perspective of the owner/developer.
Preliminaries Design & Manufacturing
Owner/Developer
Installation & Quality Assurance O & M
Research &Development
Novel PVMaterials
New ProductDevelopment
ProjectManagement
ProjectManagement
Site &System Design
ElectricalEquipment Maintenance Recycling
NetworkStability
FinancialAdviser/Services
Hardware Testing& Certification PV Panels
CommissioningEngineers Insurance Project
Management
EnergyStorage
TechnicalAdvisers
MountingSystems
ElectricalEngineering
Metering &Communications
Grid/NetworkOperators
Local AuthorityPermits
Land OwnersFees
Thin FilmTechnology
3rd GenerationTechnology
Multi-JunctionCells
Lead Acid Batteries
Li-Ion Batteries
Other StorageTechnologies
ICT & MeteringSystems
Control &Instrumentation
Inverters
Energy StorageDevices
CombinerBoxes
LV & DCEquipment
Solar Cells
MobileAssembly
ProcessEngineering
Other FunctionalMaterials
MechanicalEngineering
Planning &Permitting Design Manufacturing/
Materials Installation QualityAssurance Operation Decommissioning
100%
7.4%
0.5%
<0.1% 0.5%
<0.1%
<0.1%
<0.1%
<0.1%
<0.1%
<0.1%
<0.1%
<0.1%
<0.1%
0.1% 6.1% 14.2%
2.3%
CivilEngineering 1.6%
QA RelatedProducts/Services <0.1%
Inspection/Certification
<0.1% 40.6%
1.8% <0.1% 47.6% 0.6% 6.3%
1.5%
Legal &Commercial
1.7% 11.4%
TrackingSystems
<0.1%
LV/MVTransformer
1.5%
7.2% 1.8%
1.5%
0.3%
Insurance <0.1%
2.8%
Land Lease 15%
ManagementAdministration
2% Business Rates 14.9%
SecurityServices
2%Community
Benefits5%
8.6%
1%
9.6%90.4%0.1%
ClientsRepresentative
<0.1%
11.7%74.7%6.1%6.9%
1%
7.9%
<0.1%
0.5%
4.4%
0.4%
18.1%
2.9%
26.6% Security Systems
MV, LV & DCElectrical Works
Grid ConnectionFees
2.2%
4.3%
0.7%
PerformanceGuarantees <0.1%
EquipmentWarranties <0.1%
80.8% 11.8% 100%
<0.1%
29
Sustainable Energy Authority of Ireland
IRELAND’S SOLAR VALUE CHAIN OPPORTUNITY
Level 1
Level 2
Level 3
Level 4
Level 5
Preliminaries Design & Manufacturing
Owner/Developer
Installation & Quality Assurance O & M
Research &Development
Novel PVMaterials
New ProductDevelopment
ProjectManagement
ProjectManagement
Site &System Design
ElectricalEquipment Maintenance Recycling
NetworkStability
FinancialAdviser/Services
Hardware Testing& Certification PV Panels
CommissioningEngineers Insurance Project
Management
EnergyStorage
TechnicalAdvisers
MountingSystems
ElectricalEngineering
Metering &Communications
Grid/NetworkOperators
Local AuthorityPermits
Land OwnersFees
Thin FilmTechnology
3rd GenerationTechnology
Multi-JunctionCells
Lead Acid Batteries
Li-Ion Batteries
Other StorageTechnologies
ICT & MeteringSystems
Control &Instrumentation
Inverters
Energy StorageDevices
CombinerBoxes
LV & DCEquipment
Solar Cells
MobileAssembly
ProcessEngineering
Other FunctionalMaterials
MechanicalEngineering
Planning &Permitting Design Manufacturing/
Materials Installation QualityAssurance Operation Decommissioning
100%
7.4%
0.5%
<0.1% 0.5%
<0.1%
<0.1%
<0.1%
<0.1%
<0.1%
<0.1%
<0.1%
<0.1%
<0.1%
0.1% 6.1% 14.2%
2.3%
CivilEngineering 1.6%
QA RelatedProducts/Services <0.1%
Inspection/Certification
<0.1% 40.6%
1.8% <0.1% 47.6% 0.6% 6.3%
1.5%
Legal &Commercial
1.7% 11.4%
TrackingSystems
<0.1%
LV/MVTransformer
1.5%
7.2% 1.8%
1.5%
0.3%
Insurance <0.1%
2.8%
Land Lease 15%
ManagementAdministration
2% Business Rates 14.9%
SecurityServices
2%Community
Benefits5%
8.6%
1%
9.6%90.4%0.1%
ClientsRepresentative
<0.1%
11.7%74.7%6.1%6.9%
1%
7.9%
<0.1%
0.5%
4.4%
0.4%
18.1%
2.9%
26.6% Security Systems
MV, LV & DCElectrical Works
Grid ConnectionFees
2.2%
4.3%
0.7%
PerformanceGuarantees <0.1%
EquipmentWarranties <0.1%
80.8% 11.8% 100%
<0.1%
Value Chain Levels
Level 1 - Ownership
Level 2 - Project
Level 3 - Lifecycle
Level 4 - Key Products/Suppliers
Level 5 - Component Level
30
3. MAPPING THE SOLAR PV 'WIDER VALUE CHAIN'
• The manufacturing/materials lifecycle stage accounts for the
majority of the capital investment in PV systems, demonstrating that
those involved in the hardware supply chain stand to capture the
most value from the global PV market. It is the solar cells themselves
which account for the largest share of any value centre, but the
module assembly value centre also accounts for a sizeable share.
This includes the value added in assembling PV modules, but also
the value in all the other materials embedded in the PV panel. Given
that this accounts for between 14-18% of the overall investment it is
potentially lucrative to occupy even a very minor part of this supply
chain. Materials such as transparent conducting oxides (TCOs) and
anti-reflective (AR) coatings, for example, constitute some of this
value and suppliers of such materials stand to benefit from a growing
industry seeking marginal efficiency gains and cost reductions.
• Electrical equipment can account for 14-23% of the capital
investment in PV systems, the majority of which lies with the
inverters (~8%). Around 1% of the value of capital investments in PV
systems can be expected to go towards control and instrumentation
systems. Although small when compared to other value centres, this
constitutes a sizeable industry in the context of a global PV market.
• In the rooftop PV archetype it is assumed that energy storage
devices account for just 1% of the investment – this is based on an
assumption of a very small battery (1.2kWh / 1kWp) being included
in a small number (<5%) of installations. This is small compared
to some of the most recent high-end products for home energy
storage (e.g. the Tesla Powerwall 2 is rated at 13.5kWh / 7kWp). Also,
the penetration figure could be significantly higher if domestic/
commercial energy storage systems become more cost effective at
larger capacities and become a natural complement to PV modules.
• Process engineering (i.e. the development and sale of machinery/
systems for manufacturing) accounts for around 2% of the
investment. This highlights the opportunities in contributing to
improving and optimising manufacturing techniques.
• Site and system design accounts for over 6% of the value of ground
mount investments. Optimising system design (including integration
of ancillary equipment such as tracking, monitoring and storage)
can increase the competitiveness of a project and is thus a valuable
service.
• Electrical engineering works account for 5-7% of project value,
although this will vary greatly depending on the country. This is
dominated by grid connection fees, thus there is a driver to limit these
costs through co-location of solar farms with an existing electricity
demand.
• Within O&M, metering and communications can account for 2-7%
of annual costs and there could be space for innovation in delivering
these services more effectively.
Reflecting on the features of this mapping can generate some insights:
The manufacturing/materials lifecycle
stage accounts for the majority of
the capital investment in PV systems,
demonstrating that those involved in the
hardware supply chain stand to capture
the most value from the global PV market.

Prospects for Irish research and industry
33
Sustainable Energy Authority of Ireland
IRELAND’S SOLAR VALUE CHAIN OPPORTUNITY
Strengths & Opportunities
4
The idea of Ireland playing a role in serving the global solar
PV value chain does not appear immediately obvious.
With the bulk of solar module manufacturing capacity located in Asia, and the know-how in
deploying rooftop and ground mount arrays at scale hosted in European, North American
and Australasian countries where uptake has been concentrated to date, it is easy to classify
Ireland as a technology-taker with almost no proactive role in the value chain. However, there
are several Irish companies and researchers already actively contributing across the solar
value chain (see section 4.1). In addition there are other sectors, including IT, semiconductors,
and materials research, in which Ireland has expertise which could be transferable to the solar
PV market. Irish industry and research can be players in the PV market in several ways:
• By contributing to niche areas of the conventional value chain (i.e. crystalline silicon solar PV)
to reduce costs and improve efficiency
• By contributing to the development of emerging value chains of innovative new solar PV
technologies and applications
• By developing and providing supporting services and products which enable further value-
add in the wider solar PV value chain
In order to identify the areas of strength and corresponding opportunities for Irish industry
and research a comprehensive stakeholder engagement exercise was undertaken. Part of this
exercise consisted of interviews with a selection of senior researchers from Irish universities,
developers of innovative technologies/services in the PV sector, and stakeholders engaged
in the deployment of solar PV in Ireland and elsewhere. In addition, SEAI hosted an expert
stakeholder workshop to gather a wider set of views of stakeholders from across the entire
solar value chain. This section summarises the key outcomes of this stakeholder engagement
process, highlighting the areas where Ireland demonstrates some strength, and identifying
potential opportunities in applying these strengths in the solar market.
34
4. STRENGTHS & OPPORTUNITIES
4.1Value Chain Strengths
Research & Development
Research and Development: Across its
research institutions Ireland has considerable
expertise in several applicable fields:
• Design of and research into advanced
materials including nanomaterials
and semiconductors. There is strong
research/industry collaboration in the
semiconductor sector, for example
between Intel and the AMBER Research
Centre at Trinity College Dublin (TCD) as
well as the Tyndall National Research
Institute in Cork.
• Novel PV materials, including for example,
work on perovskite materials at the
AMBER Research Centre, Dye-Sensitized
Solar Cells at University College Dublin
(UCD), quantum dots at Dublin Institute
of Technology (DIT), and conjugated
polymers at Trinity College Dublin (TCD).
• Thermal regulation, including research in
DIT and at the Solar Energy Applications
Group at TCD into phase change materials
for thermal control in Building Integrated
PV (BIPV).
• Photonics research including research
into improving light harvesting and
luminescence at Tyndall National Institute
and CAPPA at Cork Institute of Technology
(CIT).
• Electrochemistry research applicable to
energy storage, including research on high
energy density electrolytes at University of
Limerick (UL).
• Research into wireless sensor technologies
including work at the WiSAR Lab based
in the Letterkenny Institute of Technology.
Irish startup Wattz is exploring how
wireless sensors could be powered through
the integration of solar cell technology.
Building Materials
Ireland has a history of innovation in the
building materials sector, with companies
such as Kingspan and CRH designing and
developing new products. A strong know-
how in product design, development and
integration could be brought to bear in new
PV applications.
Systems Integration & Optimisation
Irish design know-how also extends to
system design, integration and optimisation.
Integrated energy generation and storage
systems have been developed at several
research institutions and by Irish firms such
as Instant Solar.
ICT Systems & Analytics
Irish companies are developing a range
of monitoring, optimisation, control and
communication systems for renewable
electricity generators to support the creation
of a smart grid. For example, NovoGrid, is
developing grid automation solutions to
maximise renewable generation output,
and Solo Energy provides distributed
energy storage solutions to better manage
renewable generation. A dedicated industry
association Smart Grid Ireland pulls together
much of the Irish research and industry
organisations innovating in smart grid
activities. The Smart Grid Implementation
Group which comprises Eirgrid and ESB
Networks, as well as Smart Grid Ireland, SEAI,
DCCAE, Enterprise Ireland, SFI and IDA, serves
to identify research opportunities, assist in
trials and testing, and develop Ireland's Smart
Grid Roadmap to 2050.
Process Engineering
Know-how in the optimisation of
manufacturing processes has been
cultivated at several Irish research institutions
and at firms such as Nines Photovoltaics
who have developed novel dry etching
equipment and texturing technology for
silicon wafers.
High-value Manufacturing Base
Ireland has several well established
manufacturing companies with expertise
in the production of electronics,
semiconductors, software and high-value
materials engineering. This includes major
semiconductor manufacturers such as Intel
and Analog Devices, as well as electronic
component manufacturers such as
Electronic Concepts Ltd who already
supply capacitors for inverters used in
solar PV applications.
Onshore Wind
Given Ireland’s position as one of the world
leaders in onshore wind deployment, Irish
The project stakeholders identified a range of areas where Ireland has
particular strengths which can be transferable to the PV sector:
35
Sustainable Energy Authority of Ireland
IRELAND’S SOLAR VALUE CHAIN OPPORTUNITY
firms have unique experience and know-how across the whole
project development lifecycle for wind. This includes Irish
engineering and construction companies who bring project
management and engineering experience, but also Irish firms
with asset management and legal expertise related to renewable
electricity development. Project development know-how from
these disciplines is potentially transferable to the deployment of
other technologies.
Education
Irish third-level institutions have an excellent track record
of providing education and training in science technology,
engineering and mathematics (STEM), and in supporting the
work of innovative researchers and entrepreneurs active in solar
PV and related technological areas. In terms of research impact,
Irish universities are now in the top 1% research institutions in
the world in 18 fields including environment/ecology, materials
science and engineering, and the number of citations per Irish
research paper exceeds that of the France, Germany and UK .
Ireland’s Business Case
Enterprise Ireland and IDA Ireland have previously put forward
a more general case for doing business in Ireland in renewable
energy. These include Ireland’s experience accommodating large
penetrations of renewable electricity on its grid; a well-educated
workforce with excellent track record in science, technology,
engineering and mathematics (STEM); tax credits for research,
development and innovation; 12.5% corporation tax rate;
English-speaking; access to the European market.
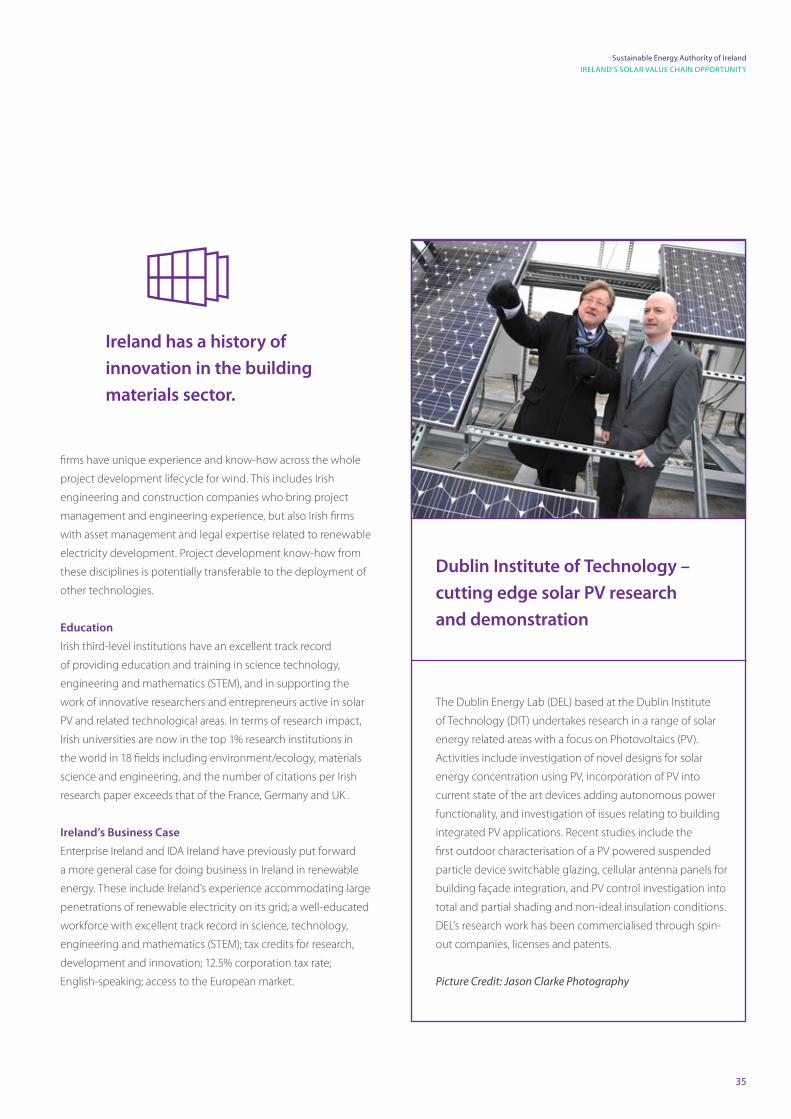
Dublin Institute of Technology –
cutting edge solar PV research
and demonstration
The Dublin Energy Lab (DEL) based at the Dublin Institute
of Technology (DIT) undertakes research in a range of solar
energy related areas with a focus on Photovoltaics (PV).
Activities include investigation of novel designs for solar
energy concentration using PV, incorporation of PV into
current state of the art devices adding autonomous power
functionality, and investigation of issues relating to building
integrated PV applications. Recent studies include the
first outdoor characterisation of a PV powered suspended
particle device switchable glazing, cellular antenna panels for
building façade integration, and PV control investigation into
total and partial shading and non-ideal insulation conditions.
DEL’s research work has been commercialised through spin-
out companies, licenses and patents.
Picture Credit: Jason Clarke Photography
Ireland has a history of
innovation in the building
materials sector.
36
4. STRENGTHS & OPPORTUNITIES
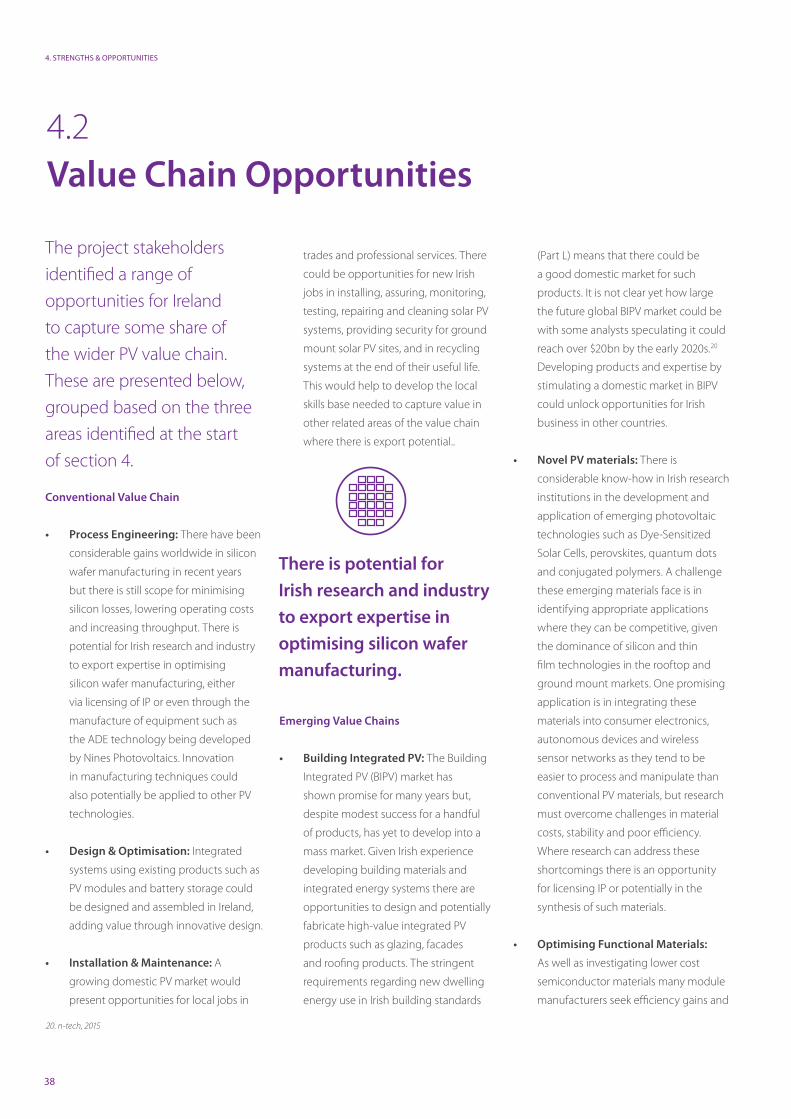
redT is an energy storage technology company set up in Dublin
in 2009. redT provides its customers with energy storage
systems which are based on vanadium redox flow battery (VRFB)
technology. The systems are deployed for use across a variety of
applications including renewable energy systems, utility-scale
grid balancing, off-grid telecom sites, integration with diesel
generating sets, and for sites with unreliable grid connection. Its
storage solution has been used in tandem with solar PV as part of
the European Commission’s PV CROPS project in Evora, Portugal.
redT have worked with the University of Limerick to
commercialise research into electrolyte optimisation. They are
also carrying out research to improve stability and working to
develop a new low-cost high-performance membrane. Red
T Energy has secured international patents (around 30 -35
worldwide) mostly related to the cell stack..
Picture Credit: redT
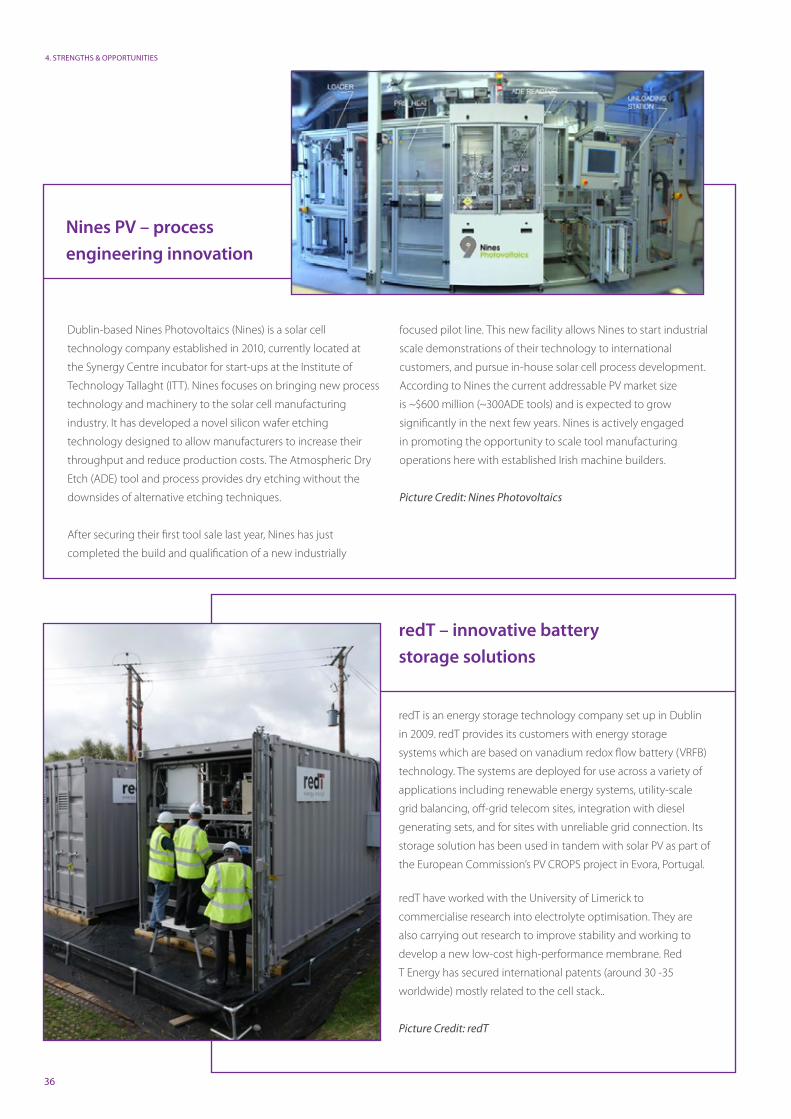
Dublin-based Nines Photovoltaics (Nines) is a solar cell
technology company established in 2010, currently located at
the Synergy Centre incubator for start-ups at the Institute of
Technology Tallaght (ITT). Nines focuses on bringing new process
technology and machinery to the solar cell manufacturing
industry. It has developed a novel silicon wafer etching
technology designed to allow manufacturers to increase their
throughput and reduce production costs. The Atmospheric Dry
Etch (ADE) tool and process provides dry etching without the
downsides of alternative etching techniques.
After securing their first tool sale last year, Nines has just
completed the build and qualification of a new industrially
focused pilot line. This new facility allows Nines to start industrial
scale demonstrations of their technology to international
customers, and pursue in-house solar cell process development.
According to Nines the current addressable PV market size
is ~$600 million (~300ADE tools) and is expected to grow
significantly in the next few years. Nines is actively engaged
in promoting the opportunity to scale tool manufacturing
operations here with established Irish machine builders.
Picture Credit: Nines Photovoltaics
redT – innovative battery
storage solutions
Nines PV – process
engineering innovation

38
4. STRENGTHS & OPPORTUNITIES
The project stakeholders
identified a range of
opportunities for Ireland
to capture some share of
the wider PV value chain.
These are presented below,
grouped based on the three
areas identified at the start
of section 4.
Conventional Value Chain
• Process Engineering: There have been
considerable gains worldwide in silicon
wafer manufacturing in recent years
but there is still scope for minimising
silicon losses, lowering operating costs
and increasing throughput. There is
potential for Irish research and industry
to export expertise in optimising
silicon wafer manufacturing, either
via licensing of IP or even through the
manufacture of equipment such as
the ADE technology being developed
by Nines Photovoltaics. Innovation
in manufacturing techniques could
also potentially be applied to other PV
technologies.
• Design & Optimisation: Integrated
systems using existing products such as
PV modules and battery storage could
be designed and assembled in Ireland,
adding value through innovative design.
• Installation & Maintenance: A
growing domestic PV market would
present opportunities for local jobs in
trades and professional services. There
could be opportunities for new Irish
jobs in installing, assuring, monitoring,
testing, repairing and cleaning solar PV
systems, providing security for ground
mount solar PV sites, and in recycling
systems at the end of their useful life.
This would help to develop the local
skills base needed to capture value in
other related areas of the value chain
where there is export potential..
Emerging Value Chains
• Building Integrated PV: The Building
Integrated PV (BIPV) market has
shown promise for many years but,
despite modest success for a handful
of products, has yet to develop into a
mass market. Given Irish experience
developing building materials and
integrated energy systems there are
opportunities to design and potentially
fabricate high-value integrated PV
products such as glazing, facades
and roofing products. The stringent
requirements regarding new dwelling
energy use in Irish building standards
(Part L) means that there could be
a good domestic market for such
products. It is not clear yet how large
the future global BIPV market could be
with some analysts speculating it could
reach over $20bn by the early 2020s.20
Developing products and expertise by
stimulating a domestic market in BIPV
could unlock opportunities for Irish
business in other countries.
• Novel PV materials: There is
considerable know-how in Irish research
institutions in the development and
application of emerging photovoltaic
technologies such as Dye-Sensitized
Solar Cells, perovskites, quantum dots
and conjugated polymers. A challenge
these emerging materials face is in
identifying appropriate applications
where they can be competitive, given
the dominance of silicon and thin
film technologies in the rooftop and
ground mount markets. One promising
application is in integrating these
materials into consumer electronics,
autonomous devices and wireless
sensor networks as they tend to be
easier to process and manipulate than
conventional PV materials, but research
must overcome challenges in material
costs, stability and poor efficiency.
Where research can address these
shortcomings there is an opportunity
for licensing IP or potentially in the
synthesis of such materials.
• Optimising Functional Materials:
As well as investigating lower cost
semiconductor materials many module
manufacturers seek efficiency gains and
4.2 Value Chain Opportunities
There is potential for
Irish research and industry
to export expertise in
optimising silicon wafer
manufacturing.
20. n-tech, 2015
39
Sustainable Energy Authority of Ireland
IRELAND’S SOLAR VALUE CHAIN OPPORTUNITY
cost reductions from other functional materials in their products.
Work at Irish research institutions into other materials such as
anti-reflective coatings, transparent constructing oxides for thin
film PV, and phase change materials for thermal regulation in
concentrated solar PV could help contribute to further efficiency
gains in emerging technologies.
• Storage & Monitoring: Know-how in electrochemistry
in Ireland is already being applied to develop new storage
solutions. The battery storage market is poised for major
growth with demand for home, business and off-grid
storage solutions swelling. There could be opportunities for
Irish companies in system design, high-value component
manufacture and IP licensing. In particular, strengths in Irish
research in battery storage, wireless sensors, and control and
monitoring systems could allow for opportunities in designing
and developing off-grid storage products with remote condition
monitoring systems.
Supporting Services
• Smart Grid Products & Services: As solar PV becomes cost
competitive in more and more markets its penetration in the
generation mix will grow, introducing challenges in managing
its intermittency. These challenges present opportunities
to exploit Irish strengths in ICT systems, data analytics and
telecommunications which will enable more effective use
of electricity generated from PV. This includes intelligent
monitoring and control systems, energy storage management
systems, demand side management (DSM) controls, and active
grid control systems. In this area, Irish companies can apply
the practical experience gained in managing high levels of
intermittent renewables and growing experience in integrating
storage solutions, to take a technical lead in developing and
testing new products for the EU market. The development of the
DS3 programme as well as the future roll out of smart meters in
Ireland will also present opportunities in this space.
• Financial Services: There will be opportunities for Irish financial
services companies, already active in the renewable energy
market, to develop specialist solutions in areas such as solar PV
project financing and insurance for manufacturers, installers,
developers and home owners. There could also be opportunities
for fund and asset management based companies in Ireland
(e.g. solar YieldCo).
NovoGrid – optimising output for
renewable generators
Novogrid is a spin-out company from the school of electrical
and electronic engineering in University College Dublin
(UCD) established in 2014. It develops a range of grid
automation solutions targeted at maximising renewable
generation output onto the grid. Its control platform,
AVA (Active Voltage Assessment), dynamically modifies
the generator’s electrical output in synergy with the grid
variations enabling the generator to export more electricity
and increase annual revenue. Detailed power flow analysis
conducted by NovoGrid as part of an SEAI-funded project,
under its Research, Development and Demonstration
programme, determined that its AVA platform could improve
the annual output of a 5MWp solar farm by 0.6% via a
reduction in electrical network losses.
Picture Credit: Nick Bradshaw, Fotonic

40
5. VALUE PROPOSITION
The size of the prize for Irish organisations
41
Sustainable Energy Authority of Ireland
IRELAND’S SOLAR VALUE CHAIN OPPORTUNITY
Value Proposition
5
The appeal of exploring niche areas of the solar value chain
where Irish organisations can apply their know-how is that
capturing even a minor share of a very large and rapidly
growing global market could generate many millions of euros
in revenues for Irish business
Irish organisations can also position themselves to capture a significant share of the domestic
solar PV market as it grows and maximise the benefits for Irish businesses, communities and
society as a whole.
In order to get some sense of the possible size of the prize for Irish business and research, this
section considers scenarios for the Irish and EU21 solar PV markets out to 2030. The analysis is
intended to present an ‘order of magnitude’ assessment only, as opposed to forecasting the
future market sizes based on specific policy, economic and technical assumptions.
21. EU27 + UK
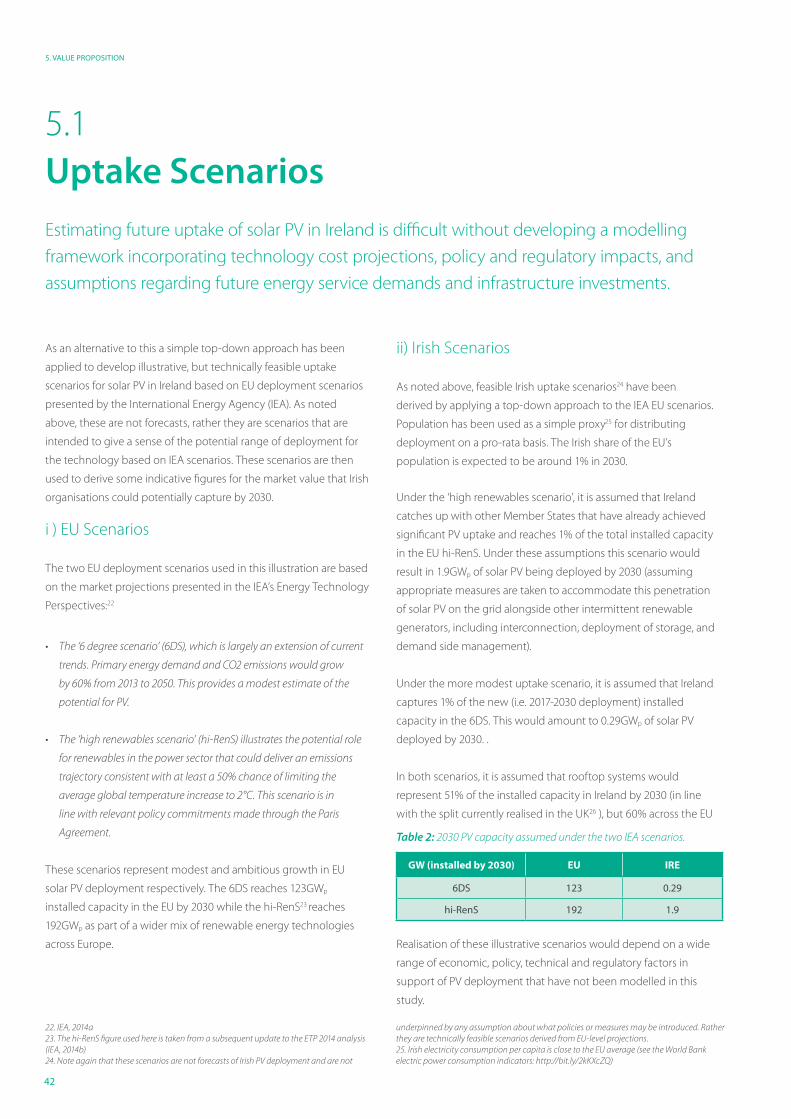
42
5. VALUE PROPOSITION
Estimating future uptake of solar PV in Ireland is difficult without developing a modelling
framework incorporating technology cost projections, policy and regulatory impacts, and
assumptions regarding future energy service demands and infrastructure investments.
As an alternative to this a simple top-down approach has been
applied to develop illustrative, but technically feasible uptake
scenarios for solar PV in Ireland based on EU deployment scenarios
presented by the International Energy Agency (IEA). As noted
above, these are not forecasts, rather they are scenarios that are
intended to give a sense of the potential range of deployment for
the technology based on IEA scenarios. These scenarios are then
used to derive some indicative figures for the market value that Irish
organisations could potentially capture by 2030.
i ) EU Scenarios
The two EU deployment scenarios used in this illustration are based
on the market projections presented in the IEA’s Energy Technology
Perspectives:22
• The ‘6 degree scenario’ (6DS), which is largely an extension of current
trends. Primary energy demand and CO2 emissions would grow
by 60% from 2013 to 2050. This provides a modest estimate of the
potential for PV.
• The ‘high renewables scenario’ (hi-RenS) illustrates the potential role
for renewables in the power sector that could deliver an emissions
trajectory consistent with at least a 50% chance of limiting the
average global temperature increase to 2°C. This scenario is in
line with relevant policy commitments made through the Paris
Agreement.
These scenarios represent modest and ambitious growth in EU
solar PV deployment respectively. The 6DS reaches 123GWp
installed capacity in the EU by 2030 while the hi-RenS23 reaches
192GWp as part of a wider mix of renewable energy technologies
across Europe.
ii) Irish Scenarios
As noted above, feasible Irish uptake scenarios24 have been
derived by applying a top-down approach to the IEA EU scenarios.
Population has been used as a simple proxy25 for distributing
deployment on a pro-rata basis. The Irish share of the EU’s
population is expected to be around 1% in 2030.
Under the ‘high renewables scenario’, it is assumed that Ireland
catches up with other Member States that have already achieved
significant PV uptake and reaches 1% of the total installed capacity
in the EU hi-RenS. Under these assumptions this scenario would
result in 1.9GWp of solar PV being deployed by 2030 (assuming
appropriate measures are taken to accommodate this penetration
of solar PV on the grid alongside other intermittent renewable
generators, including interconnection, deployment of storage, and
demand side management).
Under the more modest uptake scenario, it is assumed that Ireland
captures 1% of the new (i.e. 2017-2030 deployment) installed
capacity in the 6DS. This would amount to 0.29GWp of solar PV
deployed by 2030. .
In both scenarios, it is assumed that rooftop systems would
represent 51% of the installed capacity in Ireland by 2030 (in line
with the split currently realised in the UK26 ), but 60% across the EU
Realisation of these illustrative scenarios would depend on a wide
range of economic, policy, technical and regulatory factors in
support of PV deployment that have not been modelled in this
study.
GW (installed by 2030) EU IRE
6DS 123 0.29
hi-RenS 192 1.9
5.1Uptake Scenarios
Table 2: 2030 PV capacity assumed under the two IEA scenarios.
22. IEA, 2014a 23. The hi-RenS figure used here is taken from a subsequent update to the ETP 2014 analysis (IEA, 2014b) 24. Note again that these scenarios are not forecasts of Irish PV deployment and are not
underpinned by any assumption about what policies or measures may be introduced. Rather they are technically feasible scenarios derived from EU-level projections. 25. Irish electricity consumption per capita is close to the EU average (see the World Bank electric power consumption indicators: http://bit.ly/2kKXcZQ)
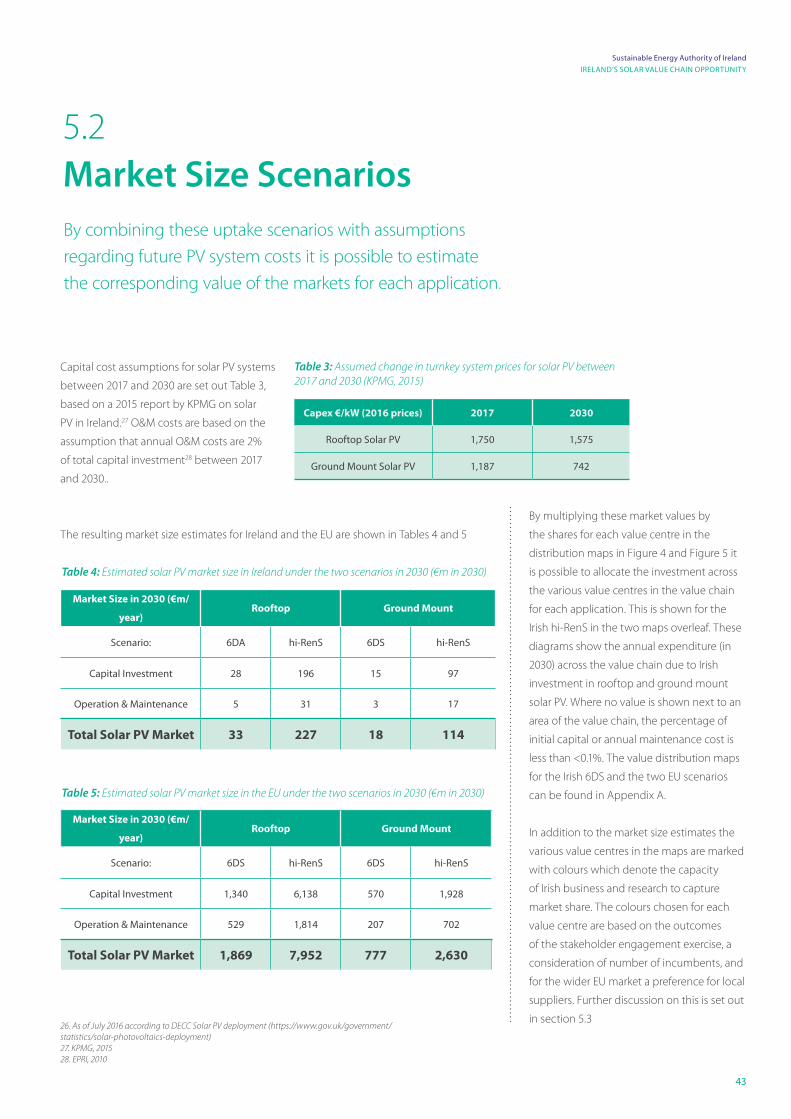
43
Sustainable Energy Authority of Ireland
IRELAND’S SOLAR VALUE CHAIN OPPORTUNITY
By combining these uptake scenarios with assumptions
regarding future PV system costs it is possible to estimate
the corresponding value of the markets for each application.
Capital cost assumptions for solar PV systems
between 2017 and 2030 are set out Table 3,
based on a 2015 report by KPMG on solar
PV in Ireland.27 O&M costs are based on the
assumption that annual O&M costs are 2%
of total capital investment28 between 2017
and 2030..
The resulting market size estimates for Ireland and the EU are shown in Tables 4 and 5
Capex €/kW (2016 prices) 2017 2030
Rooftop Solar PV 1,750 1,575
Ground Mount Solar PV 1,187 742
5.2Market Size Scenarios
Table 3: Assumed change in turnkey system prices for solar PV between 2017 and 2030 (KPMG, 2015)
Table 4: Estimated solar PV market size in Ireland under the two scenarios in 2030 (€m in 2030)
Table 5: Estimated solar PV market size in the EU under the two scenarios in 2030 (€m in 2030)
Market Size in 2030 (€m/
year)Rooftop Ground Mount
Scenario: 6DA hi-RenS 6DS hi-RenS
Capital Investment 28 196 15 97
Operation & Maintenance 5 31 3 17
Total Solar PV Market 33 227 18 114
Market Size in 2030 (€m/
year) Rooftop Ground Mount
Scenario: 6DS hi-RenS 6DS hi-RenS
Capital Investment 1,340 6,138 570 1,928
Operation & Maintenance 529 1,814 207 702
Total Solar PV Market 1,869 7,952 777 2,630
26. As of July 2016 according to DECC Solar PV deployment (https://www.gov.uk/government/ statistics/solar-photovoltaics-deployment) 27. KPMG, 2015 28. EPRI, 2010
By multiplying these market values by
the shares for each value centre in the
distribution maps in Figure 4 and Figure 5 it
is possible to allocate the investment across
the various value centres in the value chain
for each application. This is shown for the
Irish hi-RenS in the two maps overleaf. These
diagrams show the annual expenditure (in
2030) across the value chain due to Irish
investment in rooftop and ground mount
solar PV. Where no value is shown next to an
area of the value chain, the percentage of
initial capital or annual maintenance cost is
less than <0.1%. The value distribution maps
for the Irish 6DS and the two EU scenarios
can be found in Appendix A.
In addition to the market size estimates the
various value centres in the maps are marked
with colours which denote the capacity
of Irish business and research to capture
market share. The colours chosen for each
value centre are based on the outcomes
of the stakeholder engagement exercise, a
consideration of number of incumbents, and
for the wider EU market a preference for local
suppliers. Further discussion on this is set out
in section 5.3
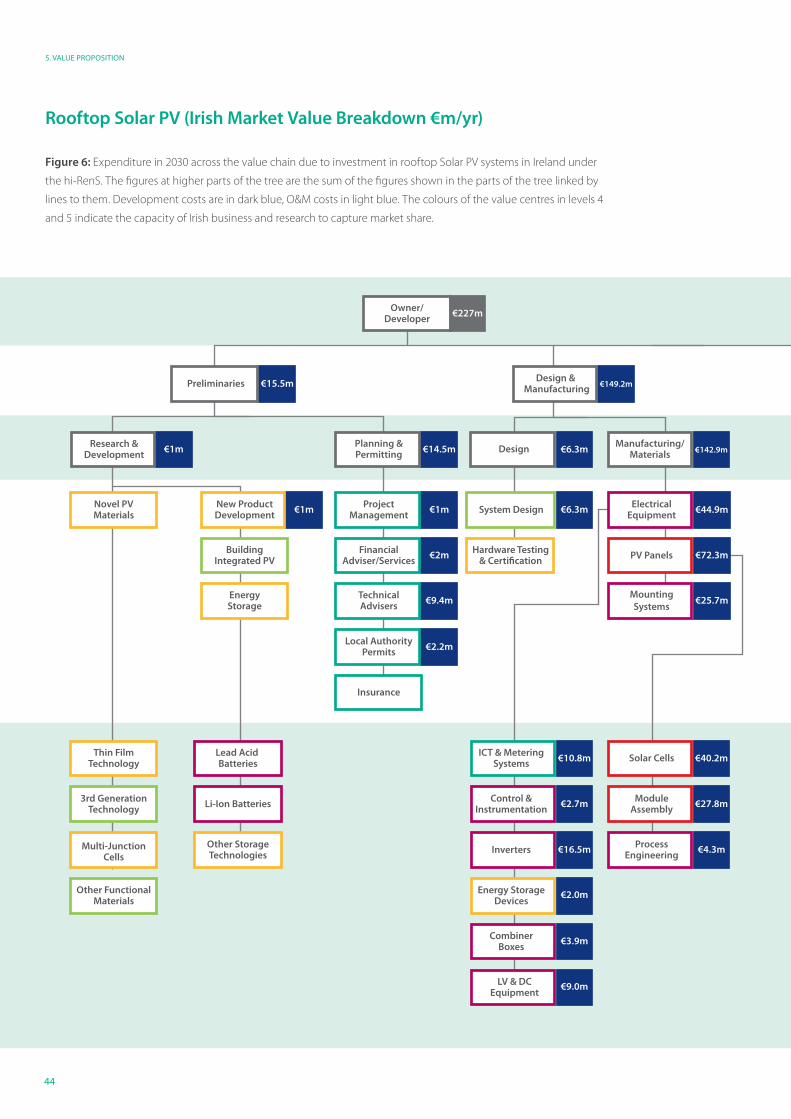
44
5. VALUE PROPOSITION
€31.4mPreliminaries
Owner/Developer
Installation & Quality Assurance O & M
Novel PVMaterials
New ProductDevelopment
ProjectManagement
ProjectManagementSystem Design QA Related
Products/Services Maintenance Recycling
BuildingIntegrated PV
FinancialAdviser/Services
Hardware Testing& Certification PV Panels Commissioning
Engineers Insurance Project Management
EnergyStorage
TechnicalAdvisers
MountingSystems
ElectricalEngineering
Metering &Communications
Local AuthorityPermits
Insurance
Thin FilmTechnology
3rd GenerationTechnology
Multi-JunctionCells
Lead Acid Batteries
Li-Ion Batteries
Other StorageTechnologies
ICT & MeteringSystems
Control &Instrumentation
Inverters
Energy StorageDevices
CombinerBoxes
LV & DCEquipment
Solar Cells
ModuleAssembly
ProcessEngineering
EquipmentWarranties
PerformanceGuarantees
Other FunctionalMaterials
RooftopMounting Aggregators
Planning &Permitting Design Manufacturing/
Materials Installation QualityAssurance Operation Decommissioning
€227m
€1m
€1m €1m €6.3m €1.4m €22.3m
€2m €72.3m €2.5m €3.3m
€9.4m €25.7m €10.2m €2.2m
€2.2m €17.2m
€2.8m
€0.3m
€3.1m€27.9m€142.9m€6.3m€14.5m
€2.7m
€16.5m
€2.0m
€3.9m
€9.0m
€10.8m
€27.8m
€4.3m
€40.2m
€149.2m €31m
Research &Development
Design & Manufacturing€15.5m
€44.9m
€31.4m
ElectricalEquipment
Rooftop Solar PV (Irish Market Value Breakdown €m/yr)
Figure 6: Expenditure in 2030 across the value chain due to investment in rooftop Solar PV systems in Ireland under
the hi-RenS. The figures at higher parts of the tree are the sum of the figures shown in the parts of the tree linked by
lines to them. Development costs are in dark blue, O&M costs in light blue. The colours of the value centres in levels 4
and 5 indicate the capacity of Irish business and research to capture market share.
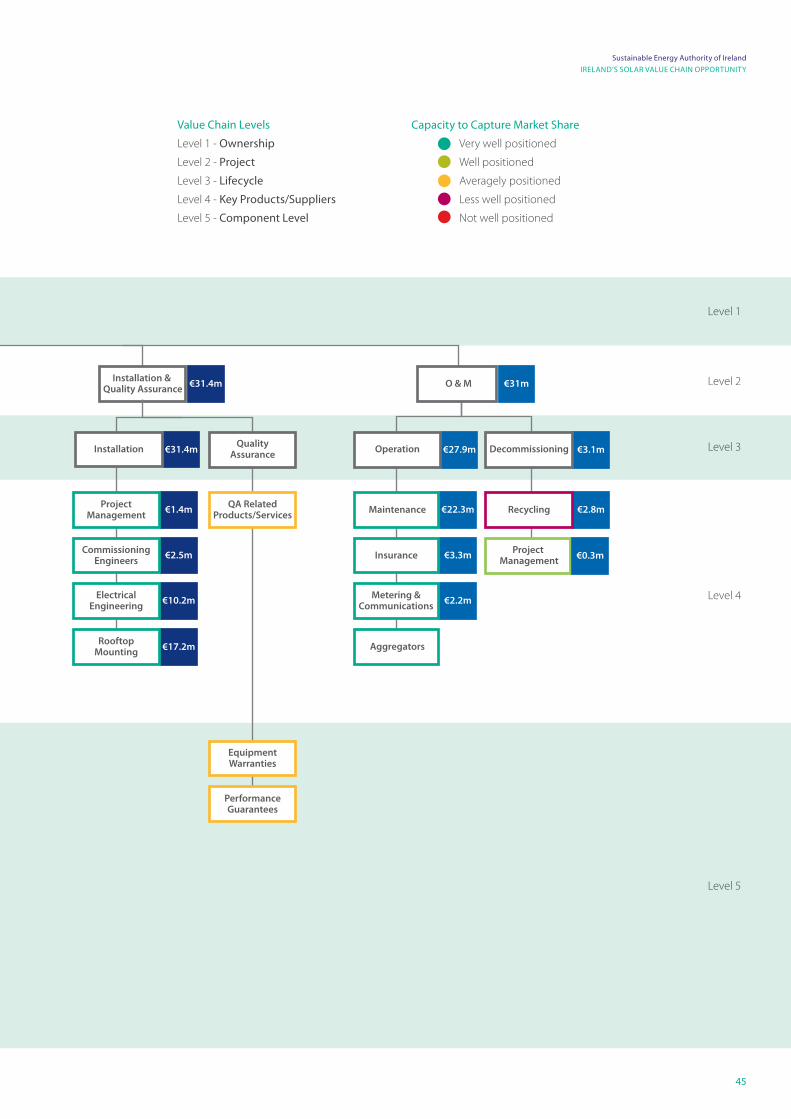
45
Sustainable Energy Authority of Ireland
IRELAND’S SOLAR VALUE CHAIN OPPORTUNITY
€31.4mPreliminaries
Owner/Developer
Installation & Quality Assurance O & M
Novel PVMaterials
New ProductDevelopment
ProjectManagement
ProjectManagementSystem Design QA Related
Products/Services Maintenance Recycling
BuildingIntegrated PV
FinancialAdviser/Services
Hardware Testing& Certification PV Panels Commissioning
Engineers Insurance Project Management
EnergyStorage
TechnicalAdvisers
MountingSystems
ElectricalEngineering
Metering &Communications
Local AuthorityPermits
Insurance
Thin FilmTechnology
3rd GenerationTechnology
Multi-JunctionCells
Lead Acid Batteries
Li-Ion Batteries
Other StorageTechnologies
ICT & MeteringSystems
Control &Instrumentation
Inverters
Energy StorageDevices
CombinerBoxes
LV & DCEquipment
Solar Cells
ModuleAssembly
ProcessEngineering
EquipmentWarranties
PerformanceGuarantees
Other FunctionalMaterials
RooftopMounting Aggregators
Planning &Permitting Design Manufacturing/
Materials Installation QualityAssurance Operation Decommissioning
€227m
€1m
€1m €1m €6.3m €1.4m €22.3m
€2m €72.3m €2.5m €3.3m
€9.4m €25.7m €10.2m €2.2m
€2.2m €17.2m
€2.8m
€0.3m
€3.1m€27.9m€142.9m€6.3m€14.5m
€2.7m
€16.5m
€2.0m
€3.9m
€9.0m
€10.8m
€27.8m
€4.3m
€40.2m
€149.2m €31m
Research &Development
Design & Manufacturing€15.5m
€44.9m
€31.4m
ElectricalEquipment
Value Chain Levels
Level 1 - Ownership
Level 2 - Project
Level 3 - Lifecycle
Level 4 - Key Products/Suppliers
Level 5 - Component Level
Capacity to Capture Market Share
Very well positioned
Well positioned
Averagely positioned
Less well positioned
Not well positioned
Level 1
Level 2
Level 3
Level 4
Level 5
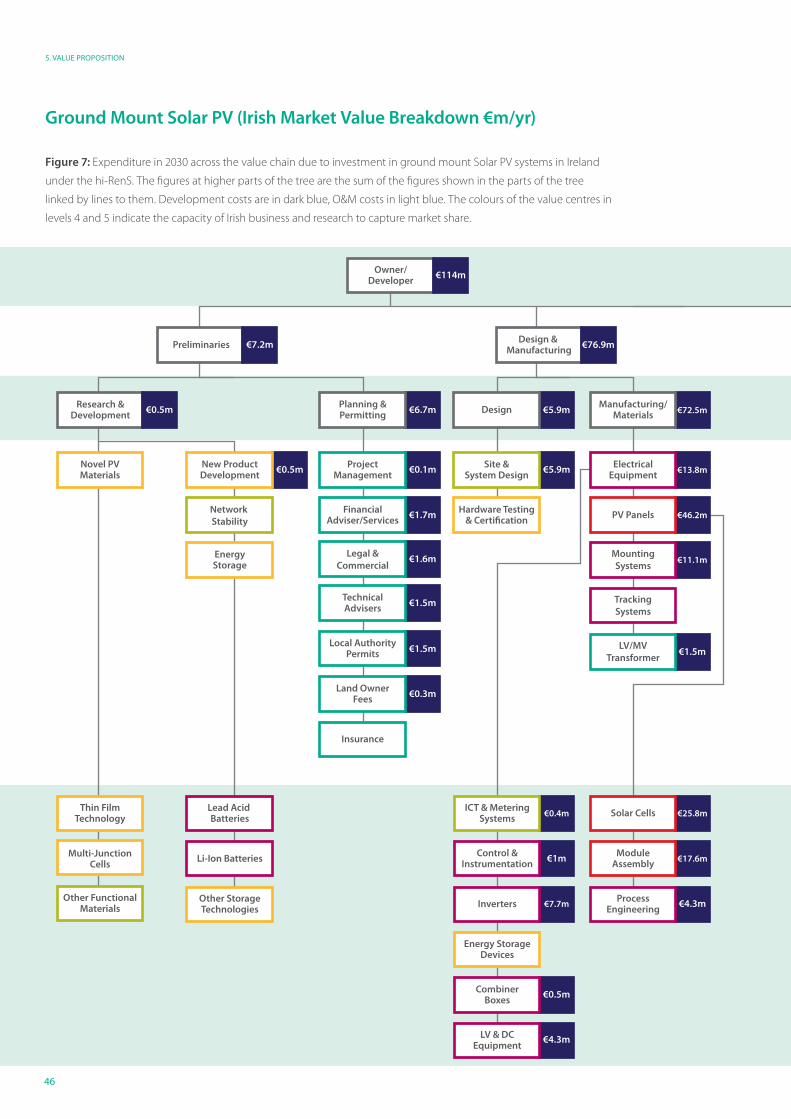
46
5. VALUE PROPOSITION
Ground Mount Solar PV (Irish Market Value Breakdown €m/yr)
Figure 7: Expenditure in 2030 across the value chain due to investment in ground mount Solar PV systems in Ireland
under the hi-RenS. The figures at higher parts of the tree are the sum of the figures shown in the parts of the tree
linked by lines to them. Development costs are in dark blue, O&M costs in light blue. The colours of the value centres in
levels 4 and 5 indicate the capacity of Irish business and research to capture market share.
Preliminaries Design & Manufacturing
Owner/Developer
Installation & Quality Assurance O & M
Research &Development
Novel PVMaterials
New ProductDevelopment
ProjectManagement
ProjectManagement
Site &System Design
ElectricalEquipment Maintenance Recycling
Network Stability
FinancialAdviser/Services
Hardware Testing& Certification PV Panels
CommissioningEngineers Insurance Project
Management
EnergyStorage
TechnicalAdvisers
MountingSystems
ElectricalEngineering
Metering &Communications
Grid/NetworkOperators
Local AuthorityPermits
Land OwnerFees
Thin FilmTechnology
Multi-JunctionCells
Lead Acid Batteries
Li-Ion Batteries
Other StorageTechnologies
ICT & MeteringSystems
Control &Instrumentation
Inverters
Energy StorageDevices
CombinerBoxes
LV & DCEquipment
Solar Cells
ModuleAssembly
ProcessEngineering
Other FunctionalMaterials
MechanicalEngineering
Planning &Permitting Design Manufacturing/
Materials Installation QualityAssurance Operation Decommissioning
€114m
€7.2m
€0.5m
€0.5m €0.1m €5.9m €13.8m
€2.2m
CivilEngineering €1.6m
QA RelatedProducts/Services
Inspection/Certification
€6.9m
€1.7m €46.2m €0.6m €1.1m
€1.5m
Legal &Commercial
€1.6m €11.1m
TrackingSystems
LV/MVTransformer
€1.5m
€7.0m €0.3m
€1.5m
€0.3m
Insurance
€0.5m
Land Lease €2.6m
ManagementAdministration
€0.3m Business Rates €2.5m
SecurityServices
€0.3mCommunity
Benefits€0.9m
€1.5m
€0.2m
€1.6m€15.4m€0.1m
Client’sRepresentative
€0.1m
€11.3m€72.5m€5.9m€6.7m
€1m
€7.7m
€0.5m
€4.3m
€0.4m
€17.6m
€4.3m
€25.8m Security Systems
MV, LV & DCElectrical Works
Grid ConnectionFees
€2.1m
€4.2m
€0.7m
PerformanceGuarantees
EquipmentWarranties
€76.9m €11.4m €17m
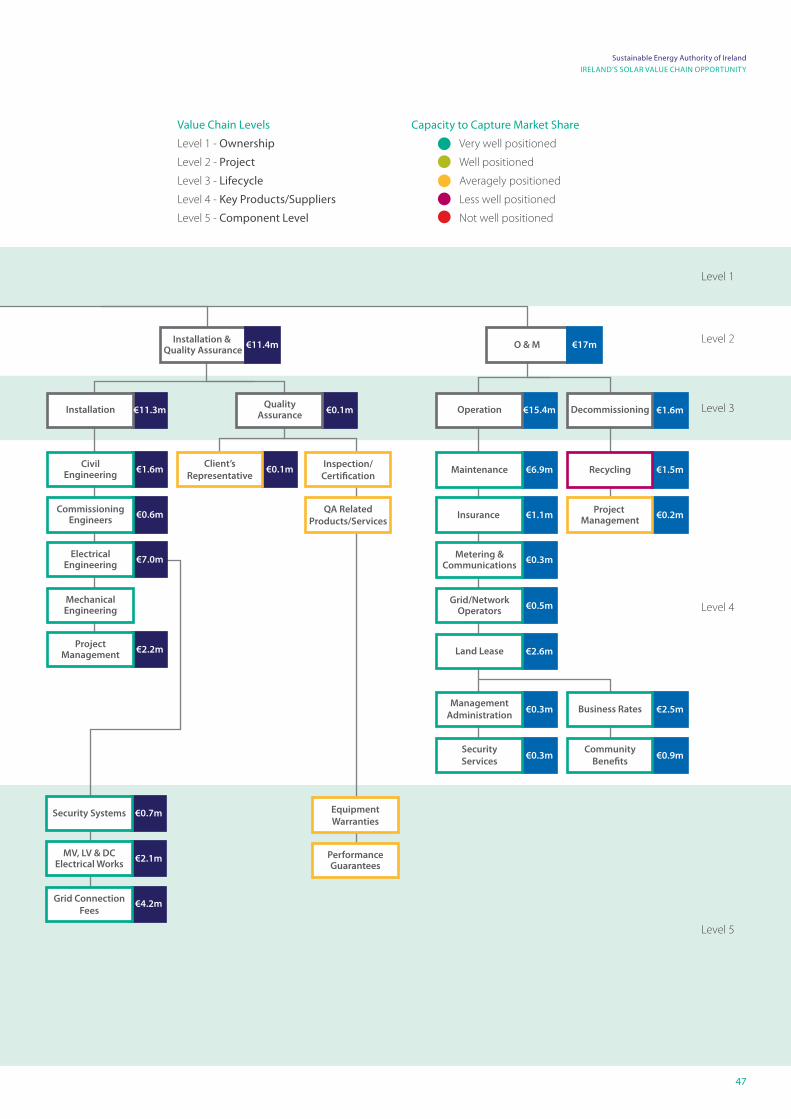
47
Sustainable Energy Authority of Ireland
IRELAND’S SOLAR VALUE CHAIN OPPORTUNITY
Preliminaries Design & Manufacturing
Owner/Developer
Installation & Quality Assurance O & M
Research &Development
Novel PVMaterials
New ProductDevelopment
ProjectManagement
ProjectManagement
Site &System Design
ElectricalEquipment Maintenance Recycling
Network Stability
FinancialAdviser/Services
Hardware Testing& Certification PV Panels
CommissioningEngineers Insurance Project
Management
EnergyStorage
TechnicalAdvisers
MountingSystems
ElectricalEngineering
Metering &Communications
Grid/NetworkOperators
Local AuthorityPermits
Land OwnerFees
Thin FilmTechnology
Multi-JunctionCells
Lead Acid Batteries
Li-Ion Batteries
Other StorageTechnologies
ICT & MeteringSystems
Control &Instrumentation
Inverters
Energy StorageDevices
CombinerBoxes
LV & DCEquipment
Solar Cells
ModuleAssembly
ProcessEngineering
Other FunctionalMaterials
MechanicalEngineering
Planning &Permitting Design Manufacturing/
Materials Installation QualityAssurance Operation Decommissioning
€114m
€7.2m
€0.5m
€0.5m €0.1m €5.9m €13.8m
€2.2m
CivilEngineering €1.6m
QA RelatedProducts/Services
Inspection/Certification
€6.9m
€1.7m €46.2m €0.6m €1.1m
€1.5m
Legal &Commercial
€1.6m €11.1m
TrackingSystems
LV/MVTransformer
€1.5m
€7.0m €0.3m
€1.5m
€0.3m
Insurance
€0.5m
Land Lease €2.6m
ManagementAdministration
€0.3m Business Rates €2.5m
SecurityServices
€0.3mCommunity
Benefits€0.9m
€1.5m
€0.2m
€1.6m€15.4m€0.1m
Client’sRepresentative
€0.1m
€11.3m€72.5m€5.9m€6.7m
€1m
€7.7m
€0.5m
€4.3m
€0.4m
€17.6m
€4.3m
€25.8m Security Systems
MV, LV & DCElectrical Works
Grid ConnectionFees
€2.1m
€4.2m
€0.7m
PerformanceGuarantees
EquipmentWarranties
€76.9m €11.4m €17m
Level 1
Level 2
Level 3
Level 4
Level 5
Value Chain Levels
Level 1 - Ownership
Level 2 - Project
Level 3 - Lifecycle
Level 4 - Key Products/Suppliers
Level 5 - Component Level
Capacity to Capture Market Share
Very well positioned
Well positioned
Averagely positioned
Less well positioned
Not well positioned
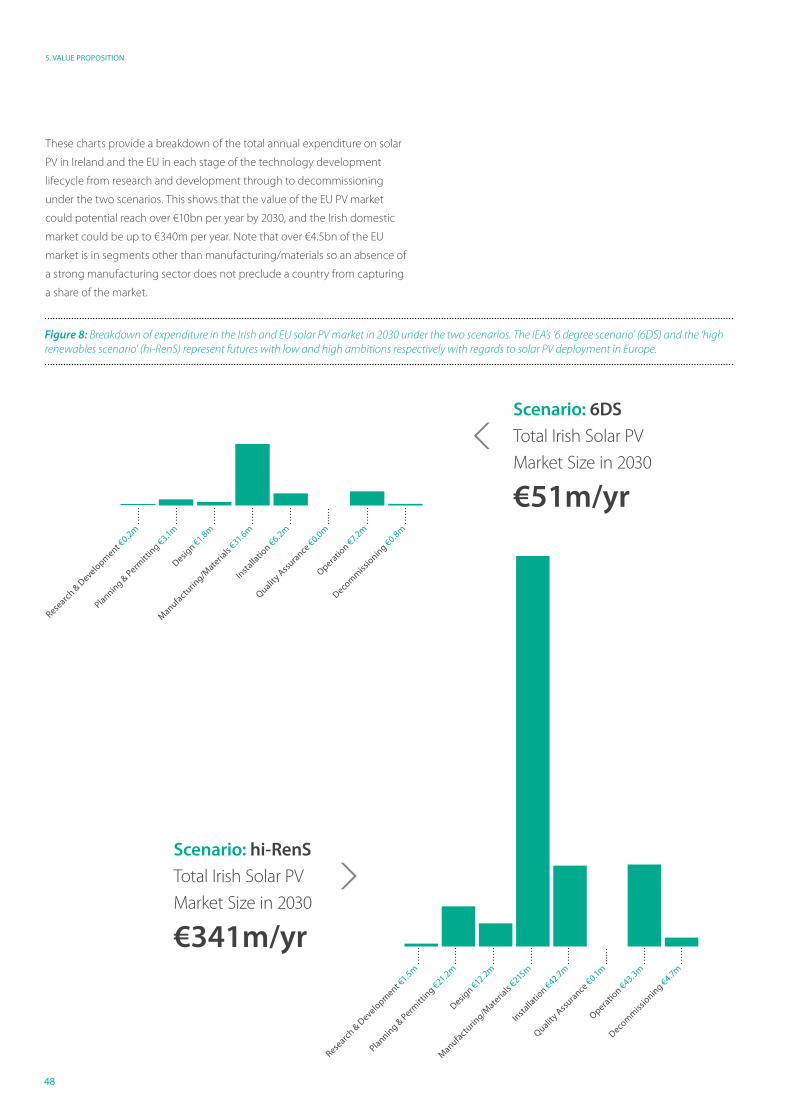
48
5. VALUE PROPOSITION
These charts provide a breakdown of the total annual expenditure on solar
PV in Ireland and the EU in each stage of the technology development
lifecycle from research and development through to decommissioning
under the two scenarios. This shows that the value of the EU PV market
could potential reach over €10bn per year by 2030, and the Irish domestic
market could be up to €340m per year. Note that over €4.5bn of the EU
market is in segments other than manufacturing/materials so an absence of
a strong manufacturing sector does not preclude a country from capturing
a share of the market.
Scenario: 6DS
Total Irish Solar PV
Market Size in 2030
€51m/yr
Scenario: hi-RenS
Total Irish Solar PV
Market Size in 2030
€341m/yr
Figure 8: Breakdown of expenditure in the Irish and EU solar PV market in 2030 under the two scenarios. The IEA’s ‘6 degree scenario’ (6DS) and the ‘high renewables scenario’ (hi-RenS) represent futures with low and high ambitions respectively with regards to solar PV deployment in Europe.
Research &
Develo
pment €
0.2m
Design €1.8m
Insta
llatio
n €6.2m
Operatio
n €7.2m
Planning &
Permitt
ing €3.1m
Manufa
cturin
g/Mate
rials
€31.6m
Quality A
ssura
nce €0.0m
Decom
miss
ionin
g €0.8m
Research &
Develo
pment €
1.5m
Design €12.2m
Insta
llatio
n €42.7m
Operatio
n €43.3m
Planning &
Permitt
ing €21.2m
Manufa
cturin
g/Mate
rials
€215m
Quality A
ssura
nce €0.1m
Decom
miss
ionin
g €4.7m
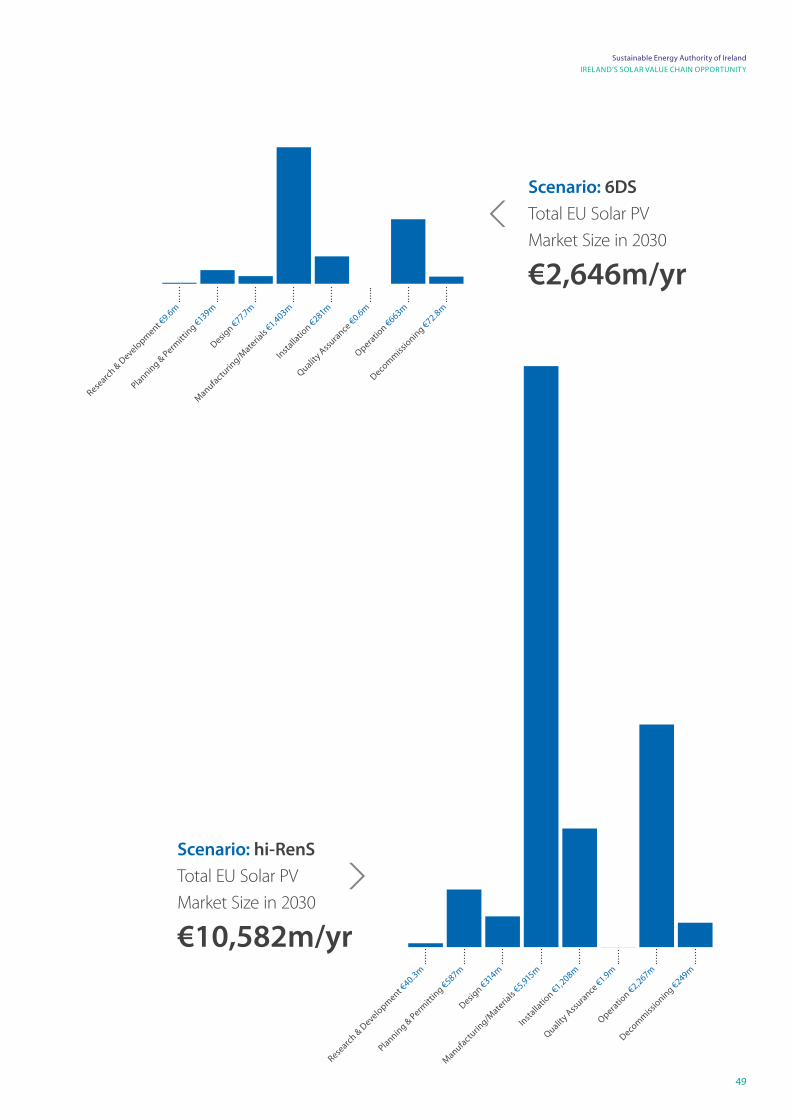
49
Sustainable Energy Authority of Ireland
IRELAND’S SOLAR VALUE CHAIN OPPORTUNITY
Scenario: 6DS
Total EU Solar PV
Market Size in 2030
€2,646m/yr
Scenario: hi-RenS
Total EU Solar PV
Market Size in 2030
€10,582m/yr
Research &
Develo
pment €
40.3m
Design €314m
Insta
llatio
n €1,208m
Operatio
n €2,267m
Planning &
Permitt
ing €587m
Manufa
cturin
g/Mate
rials
€5,915m
Quality A
ssura
nce €1.9m
Decom
miss
ionin
g €249m
Research &
Develo
pment €
9.6m
Design €77.7
m
Insta
llatio
n €281m
Operatio
n €663m
Planning &
Permitt
ing €139m
Manufa
cturin
g/Mate
rials
€1,403m
Quality A
ssura
nce €0.6m
Decom
miss
ionin
g €72.8m
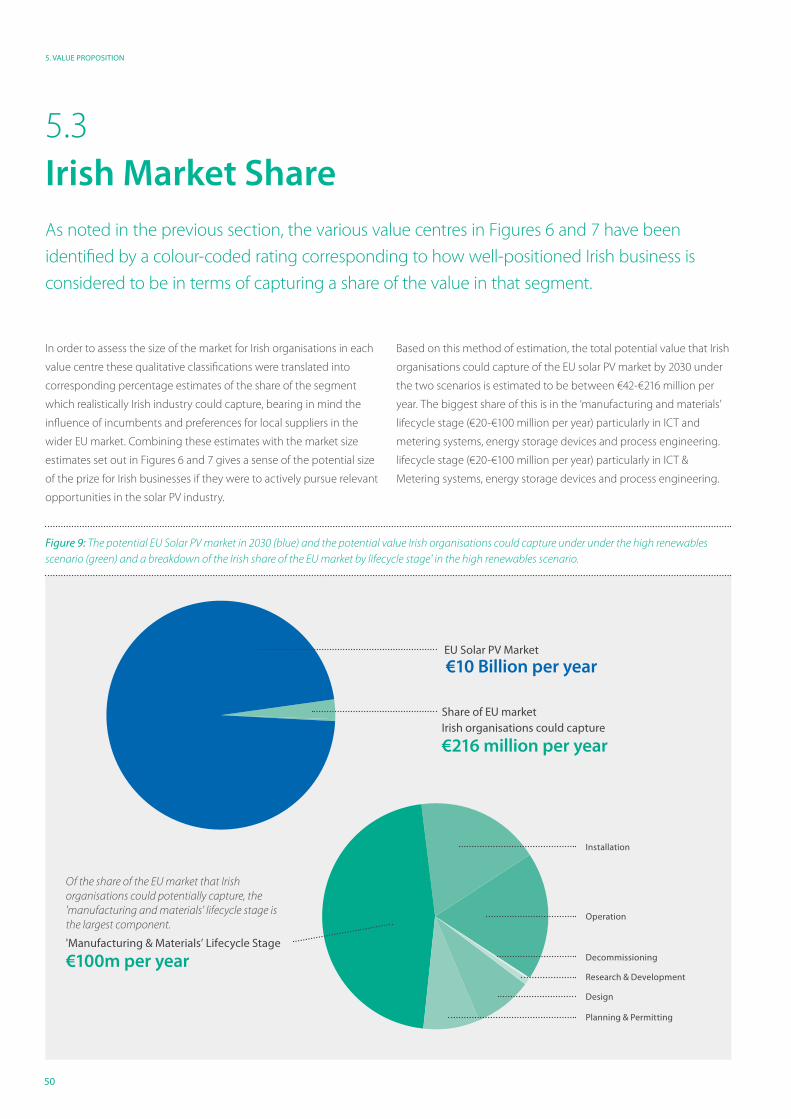
50
5. VALUE PROPOSITION
In order to assess the size of the market for Irish organisations in each
value centre these qualitative classifications were translated into
corresponding percentage estimates of the share of the segment
which realistically Irish industry could capture, bearing in mind the
influence of incumbents and preferences for local suppliers in the
wider EU market. Combining these estimates with the market size
estimates set out in Figures 6 and 7 gives a sense of the potential size
of the prize for Irish businesses if they were to actively pursue relevant
opportunities in the solar PV industry.
Based on this method of estimation, the total potential value that Irish
organisations could capture of the EU solar PV market by 2030 under
the two scenarios is estimated to be between €42-€216 million per
year. The biggest share of this is in the ‘manufacturing and materials’
lifecycle stage (€20-€100 million per year) particularly in ICT and
metering systems, energy storage devices and process engineering.
lifecycle stage (€20-€100 million per year) particularly in ICT &
Metering systems, energy storage devices and process engineering.
5.3 Irish Market Share
EU Solar PV Market
€10 Billion per year
Share of EU market Irish organisations could capture
€216 million per year
Of the share of the EU market that Irish organisations could potentially capture, the 'manufacturing and materials' lifecycle stage is the largest component.
'Manufacturing & Materials’ Lifecycle Stage
€100m per year
Figure 9: The potential EU Solar PV market in 2030 (blue) and the potential value Irish organisations could capture under under the high renewables scenario (green) and a breakdown of the Irish share of the EU market by lifecycle stage' in the high renewables scenario.
As noted in the previous section, the various value centres in Figures 6 and 7 have been
identified by a colour-coded rating corresponding to how well-positioned Irish business is
considered to be in terms of capturing a share of the value in that segment.
Research & Development
Design
Installation
Operation
Planning & Permitting
Decommissioning

51
Sustainable Energy Authority of Ireland
IRELAND’S SOLAR VALUE CHAIN OPPORTUNITY
52
6. PRIORITIES & NEXT STEPS
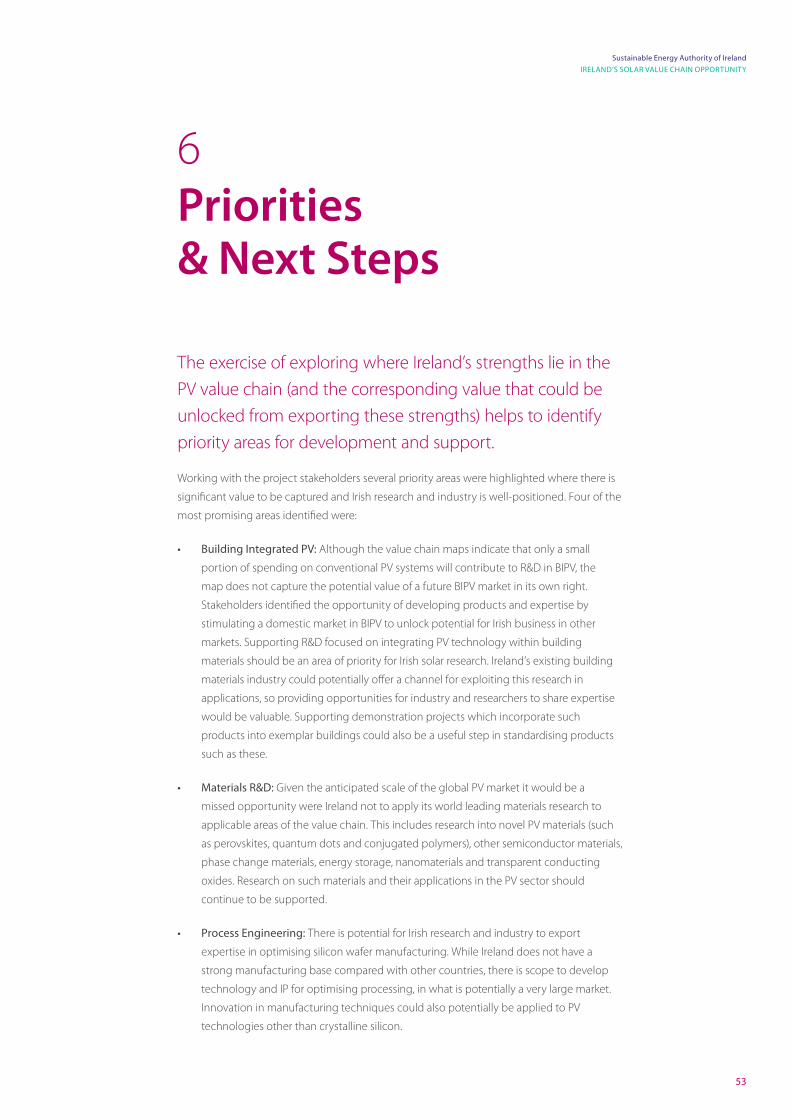
53
Sustainable Energy Authority of Ireland
IRELAND’S SOLAR VALUE CHAIN OPPORTUNITY
Priorities & Next Steps
6
The exercise of exploring where Ireland’s strengths lie in the
PV value chain (and the corresponding value that could be
unlocked from exporting these strengths) helps to identify
priority areas for development and support.
Working with the project stakeholders several priority areas were highlighted where there is
significant value to be captured and Irish research and industry is well-positioned. Four of the
most promising areas identified were:
• Building Integrated PV: Although the value chain maps indicate that only a small
portion of spending on conventional PV systems will contribute to R&D in BIPV, the
map does not capture the potential value of a future BIPV market in its own right.
Stakeholders identified the opportunity of developing products and expertise by
stimulating a domestic market in BIPV to unlock potential for Irish business in other
markets. Supporting R&D focused on integrating PV technology within building
materials should be an area of priority for Irish solar research. Ireland’s existing building
materials industry could potentially offer a channel for exploiting this research in
applications, so providing opportunities for industry and researchers to share expertise
would be valuable. Supporting demonstration projects which incorporate such
products into exemplar buildings could also be a useful step in standardising products
such as these.
• Materials R&D: Given the anticipated scale of the global PV market it would be a
missed opportunity were Ireland not to apply its world leading materials research to
applicable areas of the value chain. This includes research into novel PV materials (such
as perovskites, quantum dots and conjugated polymers), other semiconductor materials,
phase change materials, energy storage, nanomaterials and transparent conducting
oxides. Research on such materials and their applications in the PV sector should
continue to be supported.
• Process Engineering: There is potential for Irish research and industry to export
expertise in optimising silicon wafer manufacturing. While Ireland does not have a
strong manufacturing base compared with other countries, there is scope to develop
technology and IP for optimising processing, in what is potentially a very large market.
Innovation in manufacturing techniques could also potentially be applied to PV
technologies other than crystalline silicon.
54
6. PRIORITIES & NEXT STEPS
• Smart grid products and services: The value chains maps for
Europe (see Appendix A) suggest that the market for ICT and
metering systems for solar PV could be over €300m per year
by 2030. This is identified as Ireland’s strongest area for export
potential in the conventional PV supply chain and is thus an
area which deserves attention. This is also an important field
at a domestic level, already being applied in managing high
penetrations of wind generation in Ireland and integrating with
storage solutions. Consideration should be given to funding
research projects which focus on developing Ireland’s capability
in smart grid products and services, specifically tailored to
managing generation and consumption of electricity from PV to
minimise the impact on the grid.
There are several positive steps which can be taken by public
agencies, the research community and industry to help unlock the
opportunities in these priority areas and in others. These include:
• Establishing a Research / Industry Forum: A solar PV forum
bringing together industry and research communities on a
regular basis could generate opportunities for collaboration
and knowledge transfer. Initiating such a forum could serve as a
first step in identifying strategic areas of focus for the sector in
Ireland, and potentially develop a case for funding a dedicated
research cluster in solar PV research and applications.
• RD&D Support: A wide variety of solar PV research and
demonstration projects have been supported through
SEAI’s RD&D programme to date. Targeted support for both
fundamental research and projects demonstrating viability in the
priority areas identified in this report would represent the most
effective use of supports.
• Addressing Barriers to Deployment: Stakeholders interviewed
highlighted non-financial barriers to the development
of a domestic solar PV market. A healthy home market
makes developing and testing new products and services
(and cultivating the skillset needed to deploy them) more
straightforward. It also opens up opportunities for local trades
and businesses to capture value, particularly in planning, design,
installation and maintenance of PV systems. At the rooftop
scale non-financial barriers which could be addressed include
reviewing the limits on system size before planning permission
is required and ensuring appropriate standards and training
are introduced to maintain quality. For ground mount systems
stakeholders identified complications in the grid connection
process as the primary barrier which needs to be reviewed.
• Enterprise Support: Funding and supports for start-ups is
available via Enterprise Ireland and the opportunity areas in the
PV value chain identified in this study should be recognised as
relevant for Ireland. Stakeholders called for greater collaboration
between Irish research and industry in developing new
enterprises in the solar PV space and both groups should seek
out these opportunities and avail of enterprise supports.
• Informing on Solar PV: Solar PV will be one of the most
important energy technologies in meeting global climate
commitments and there is strategic value in ensuring that solar
PV features as part of relevant engineering curricula in Ireland.
Stakeholders identified a value in PhD funding for research
exploring PV materials and applications. In addition it is also
important that information on solar PV is readily available to the
general public to help inform any investment decisions. SEAI
will endeavour to provide appropriate updated guidance on the
technology for interested stakeholders.
Conclusion7
The analysis in this report suggests that the market in the EU alone
could be over €10bn per year by 2030 and potentially up to €340m in
Ireland. If Irish industry and research could claim even a portion of this
market in a few key areas of the wider value chain it could generate
significant new business.
There are already several Irish businesses and researchers contributing
to global solar PV supply chains but there is a lot more scope
for innovation drawing on existing strengths. Consultation with
stakeholders from research and industry identified several areas of
opportunity in the wider solar PV value chain where Ireland is well-
positioned to unlock considerable value, including:
• Conventional Value Chain: By contributing in niche areas of
the conventional (i.e. crystalline silicon) solar PV value chain,
including innovation in process engineering, designing and
optimising integrated systems, and installation and maintenance
of PV systems.
• Emerging Value Chains: by contributing to the development of
innovative new solar PV technologies and applications including
Building Integrated PV, novel PV materials, other functional
materials, and storage and monitoring technologies.
• Supporting Services: By developing supporting services and
products which enable further value-add in the wider solar PV
value chain, including smart grid products and services.
The total potential value that Irish organisations could capture of
the EU solar PV market by 2030 under two deployment scenarios
is estimated to be between €42-€216 million per year. This gives a
sense of the potential size of the prize for Irish business if they actively
pursue relevant opportunities in the solar PV industry.
Working with the project stakeholders several priority areas were
highlighted where there is significant value to be captured and
Irish research and industry is well-positioned. The most promising
priority areas identified are Building Integrated PV, materials R&D with
applications in solar PV, process engineering, and smart grid products
and services. There are several positive steps which can be taken by
public agencies, the research community and industry to help unlock
the opportunities in these priority areas and in others. These include
the need to establish a solar PV research/industry forum for sharing
knowledge, providing targeted RD&D support, and addressing
barriers to domestic PV deployment to allow local supply chains to
develop.
Finally, given that solar PV is poised to become one of the most
important energy technologies of the 21st Century, there is a need
to ensure that Irish citizens have access to good information on the
technology to help inform any investment decisions, and there is also
strategic value in ensuring that solar PV features as part of relevant
engineering curricula in Ireland.
Solar PV is currently the fastest growing power generation technology worldwide
and is positioned to become one of the most important global energy technologies
of the 21st century.
55
Sustainable Energy Authority of Ireland
IRELAND’S SOLAR VALUE CHAIN OPPORTUNITY
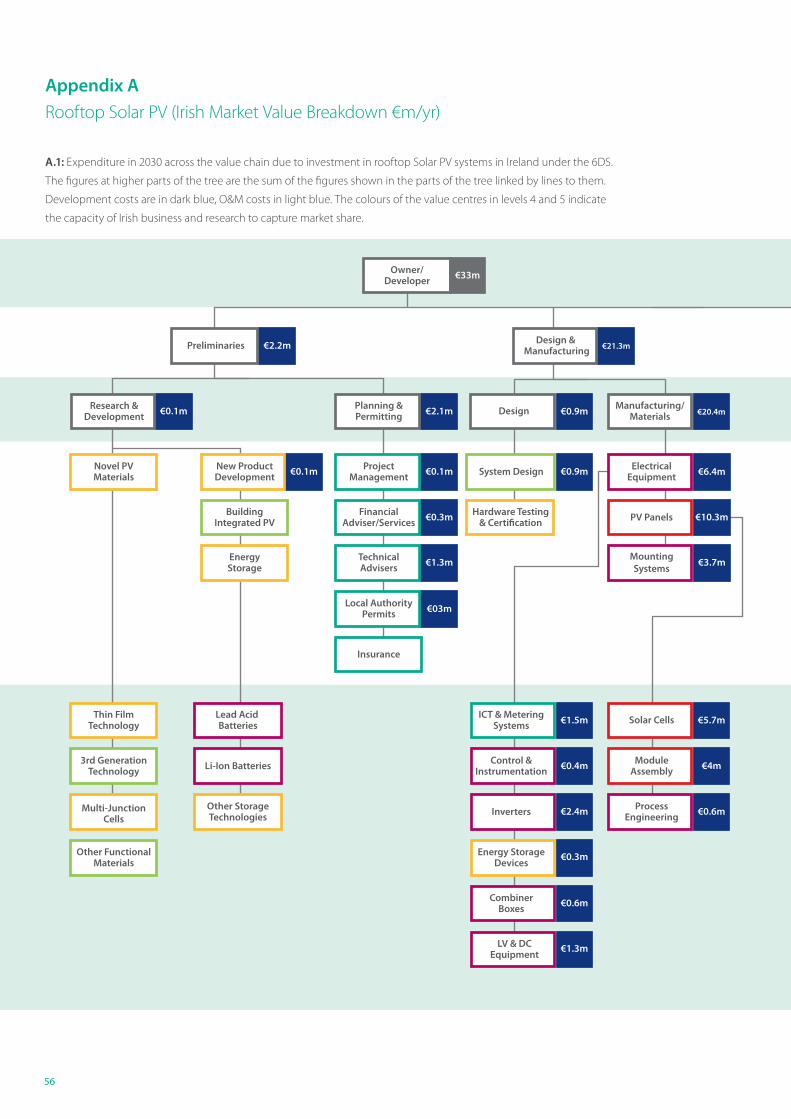
56
€4.5mPreliminaries
Owner/Developer
Installation & Quality Assurance O & M
Novel PVMaterials
New ProductDevelopment
ProjectManagement
ProjectManagementSystem Design QA Related
Products/Services Maintenance Recycling
BuildingIntegrated PV
FinancialAdviser/Services
Hardware Testing& Certification PV Panels Commissioning
Engineers Insurance Project Management
EnergyStorage
TechnicalAdvisers
MountingSystems
ElectricalEngineering
Metering &Communications
Local AuthorityPermits
Insurance
Thin FilmTechnology
3rd GenerationTechnology
Multi-JunctionCells
Lead Acid Batteries
Li-Ion Batteries
Other StorageTechnologies
ICT & MeteringSystems
Control &Instrumentation
Inverters
Energy StorageDevices
CombinerBoxes
LV & DCEquipment
Solar Cells
ModuleAssembly
ProcessEngineering
EquipmentWarranties
PerformanceGuarantees
Other FunctionalMaterials
RooftopMounting Aggregators
Planning &Permitting Design Manufacturing/
Materials Installation QualityAssurance Operation Decommissioning
€33m
€0.1m
€0.1m €0.1m €0.9m €0.2m €3.6m
€0.3m €10.3m €0.4m €0.5m
€1.3m €3.7m €1.5m €0.4m
€03m €2.5m
€0.5m
€0.1m
€0.5m€4.5m€20.4m€0.9m€2.1m
€0.4m
€2.4m
€0.3m
€0.6m
€1.3m
€1.5m
€4m
€0.6m
€5.7m
€21.3m €5m
Research &Development
Design & Manufacturing€2.2m
€6.4m
€4.5m
ElectricalEquipment
Appendix A
Rooftop Solar PV (Irish Market Value Breakdown €m/yr)
A.1: Expenditure in 2030 across the value chain due to investment in rooftop Solar PV systems in Ireland under the 6DS.
The figures at higher parts of the tree are the sum of the figures shown in the parts of the tree linked by lines to them.
Development costs are in dark blue, O&M costs in light blue. The colours of the value centres in levels 4 and 5 indicate
the capacity of Irish business and research to capture market share.
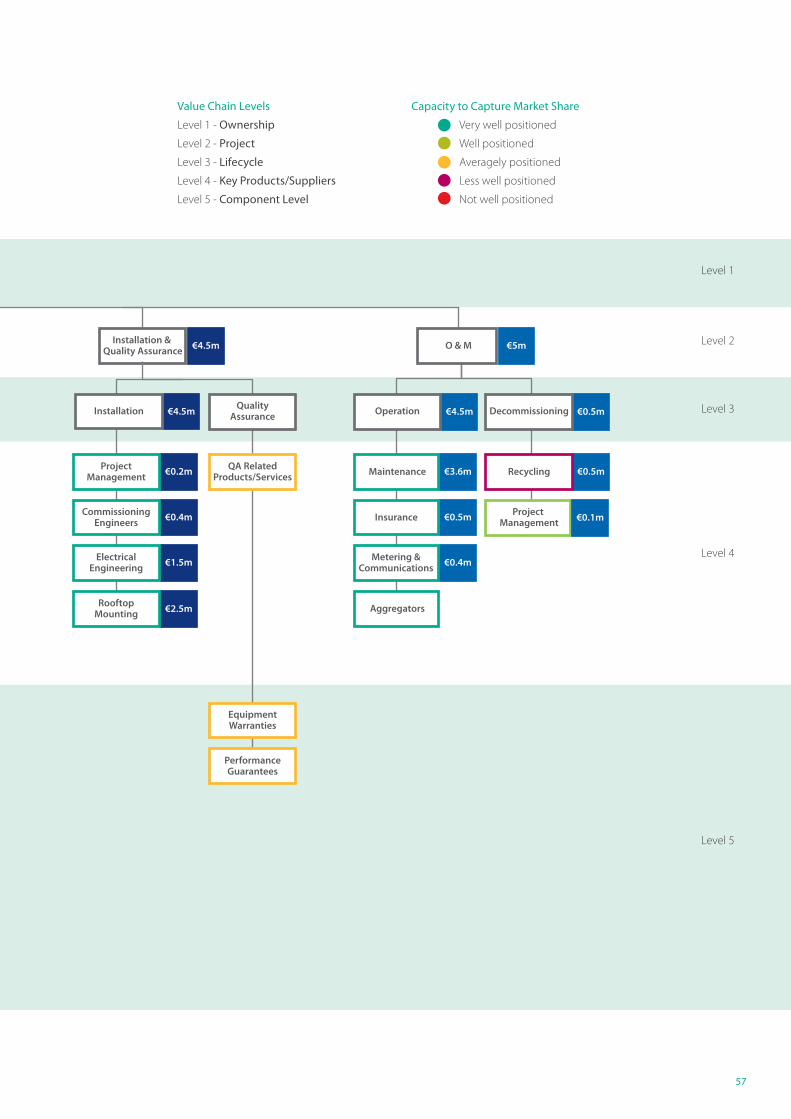
Level 1
Level 2
Level 3
Level 4
Level 5
57
€4.5mPreliminaries
Owner/Developer
Installation & Quality Assurance O & M
Novel PVMaterials
New ProductDevelopment
ProjectManagement
ProjectManagementSystem Design QA Related
Products/Services Maintenance Recycling
BuildingIntegrated PV
FinancialAdviser/Services
Hardware Testing& Certification PV Panels Commissioning
Engineers Insurance Project Management
EnergyStorage
TechnicalAdvisers
MountingSystems
ElectricalEngineering
Metering &Communications
Local AuthorityPermits
Insurance
Thin FilmTechnology
3rd GenerationTechnology
Multi-JunctionCells
Lead Acid Batteries
Li-Ion Batteries
Other StorageTechnologies
ICT & MeteringSystems
Control &Instrumentation
Inverters
Energy StorageDevices
CombinerBoxes
LV & DCEquipment
Solar Cells
ModuleAssembly
ProcessEngineering
EquipmentWarranties
PerformanceGuarantees
Other FunctionalMaterials
RooftopMounting Aggregators
Planning &Permitting Design Manufacturing/
Materials Installation QualityAssurance Operation Decommissioning
€33m
€0.1m
€0.1m €0.1m €0.9m €0.2m €3.6m
€0.3m €10.3m €0.4m €0.5m
€1.3m €3.7m €1.5m €0.4m
€03m €2.5m
€0.5m
€0.1m
€0.5m€4.5m€20.4m€0.9m€2.1m
€0.4m
€2.4m
€0.3m
€0.6m
€1.3m
€1.5m
€4m
€0.6m
€5.7m
€21.3m €5m
Research &Development
Design & Manufacturing€2.2m
€6.4m
€4.5m
ElectricalEquipment
Value Chain Levels
Level 1 - Ownership
Level 2 - Project
Level 3 - Lifecycle
Level 4 - Key Products/Suppliers
Level 5 - Component Level
Capacity to Capture Market Share
Very well positioned
Well positioned
Averagely positioned
Less well positioned
Not well positioned
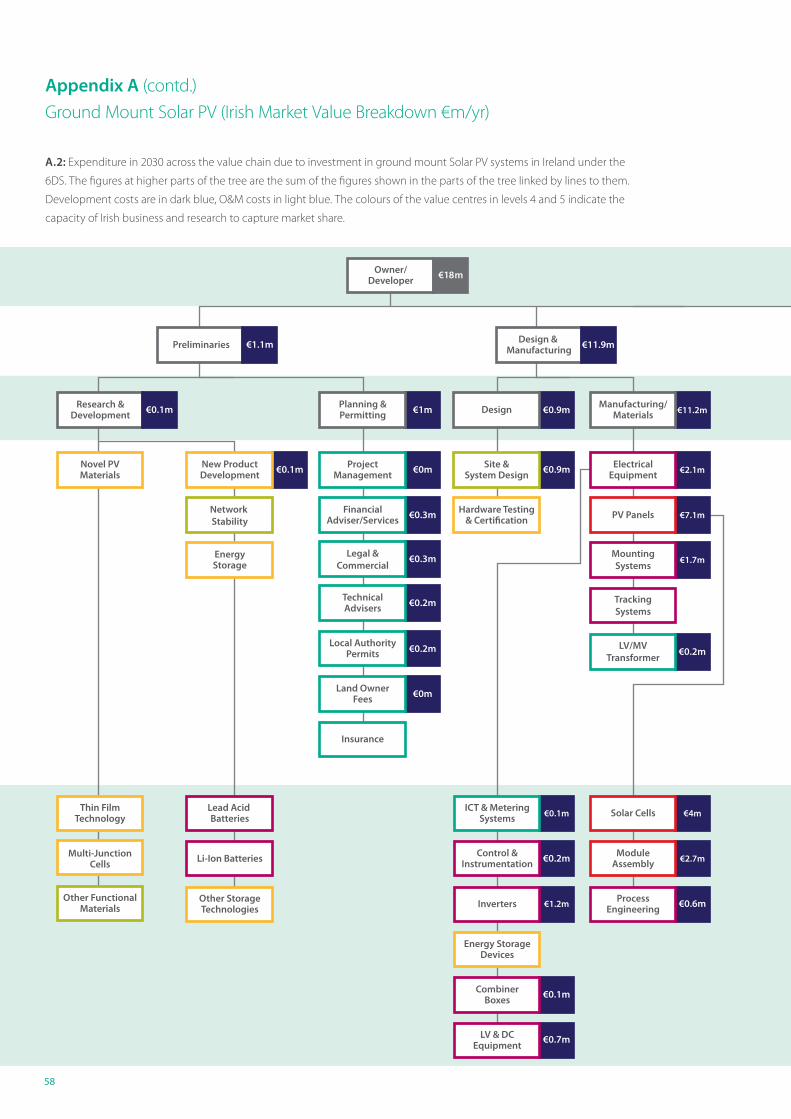
58
Appendix A (contd.)
Ground Mount Solar PV (Irish Market Value Breakdown €m/yr)
A.2: Expenditure in 2030 across the value chain due to investment in ground mount Solar PV systems in Ireland under the
6DS. The figures at higher parts of the tree are the sum of the figures shown in the parts of the tree linked by lines to them.
Development costs are in dark blue, O&M costs in light blue. The colours of the value centres in levels 4 and 5 indicate the
capacity of Irish business and research to capture market share.
Preliminaries Design & Manufacturing
Owner/Developer
Installation & Quality Assurance O & M
Research &Development
Novel PVMaterials
New ProductDevelopment
ProjectManagement
ProjectManagement
Site &System Design
ElectricalEquipment Maintenance Recycling
Network Stability
FinancialAdviser/Services
Hardware Testing& Certification PV Panels
CommissioningEngineers Insurance Project
Management
EnergyStorage
TechnicalAdvisers
MountingSystems
ElectricalEngineering
Metering &Communications
Grid/NetworkOperators
Local AuthorityPermits
Land OwnerFees
Thin FilmTechnology
Multi-JunctionCells
Lead Acid Batteries
Li-Ion Batteries
Other StorageTechnologies
ICT & MeteringSystems
Control &Instrumentation
Inverters
Energy StorageDevices
CombinerBoxes
LV & DCEquipment
Solar Cells
ModuleAssembly
ProcessEngineering
Other FunctionalMaterials
MechanicalEngineering
Planning &Permitting Design Manufacturing/
Materials Installation QualityAssurance Operation Decommissioning
€18m
€1.1m
€0.1m
€0.1m €0m €0.9m €2.1m
€0.3m
CivilEngineering €0.2m
QA RelatedProducts/Services
Inspection/Certification
€1.2m
€0.3m €7.1m €0.1m €0.2m
€0.2m
Legal &Commercial
€0.3m €1.7m
TrackingSystems
LV/MVTransformer
€0.2m
€1.1m €0.1m
€0.2m
€0m
Insurance
€0.1m
Land Lease €0.5m
ManagementAdministration
€0.1m Business Rates €0.4m
SecurityServices
€0.1mCommunity
Benefits€0.2m
€0.3m
€0m
€0.3m€2.7m€0m
Client’sRepresentative
€0m
€1.8m€11.2m€0.9m€1m
€0.2m
€1.2m
€0.1m
€0.7m
€0.1m
€2.7m
€0.6m
€4m Security Systems
MV, LV & DCElectrical Works
Grid ConnectionFees
€0.3m
€0.6m
€0.1m
PerformanceGuarantees
EquipmentWarranties
€11.9m €1.8m €3m

59
Preliminaries Design & Manufacturing
Owner/Developer
Installation & Quality Assurance O & M
Research &Development
Novel PVMaterials
New ProductDevelopment
ProjectManagement
ProjectManagement
Site &System Design
ElectricalEquipment Maintenance Recycling
Network Stability
FinancialAdviser/Services
Hardware Testing& Certification PV Panels
CommissioningEngineers Insurance Project
Management
EnergyStorage
TechnicalAdvisers
MountingSystems
ElectricalEngineering
Metering &Communications
Grid/NetworkOperators
Local AuthorityPermits
Land OwnerFees
Thin FilmTechnology
Multi-JunctionCells
Lead Acid Batteries
Li-Ion Batteries
Other StorageTechnologies
ICT & MeteringSystems
Control &Instrumentation
Inverters
Energy StorageDevices
CombinerBoxes
LV & DCEquipment
Solar Cells
ModuleAssembly
ProcessEngineering
Other FunctionalMaterials
MechanicalEngineering
Planning &Permitting Design Manufacturing/
Materials Installation QualityAssurance Operation Decommissioning
€18m
€1.1m
€0.1m
€0.1m €0m €0.9m €2.1m
€0.3m
CivilEngineering €0.2m
QA RelatedProducts/Services
Inspection/Certification
€1.2m
€0.3m €7.1m €0.1m €0.2m
€0.2m
Legal &Commercial
€0.3m €1.7m
TrackingSystems
LV/MVTransformer
€0.2m
€1.1m €0.1m
€0.2m
€0m
Insurance
€0.1m
Land Lease €0.5m
ManagementAdministration
€0.1m Business Rates €0.4m
SecurityServices
€0.1mCommunity
Benefits€0.2m
€0.3m
€0m
€0.3m€2.7m€0m
Client’sRepresentative
€0m
€1.8m€11.2m€0.9m€1m
€0.2m
€1.2m
€0.1m
€0.7m
€0.1m
€2.7m
€0.6m
€4m Security Systems
MV, LV & DCElectrical Works
Grid ConnectionFees
€0.3m
€0.6m
€0.1m
PerformanceGuarantees
EquipmentWarranties
€11.9m €1.8m €3m
Level 1
Level 2
Level 3
Level 4
Level 5
Value Chain Levels
Level 1 - Ownership
Level 2 - Project
Level 3 - Lifecycle
Level 4 - Key Products/Suppliers
Level 5 - Component Level
Capacity to Capture Market Share
Very well positioned
Well positioned
Averagely positioned
Less well positioned
Not well positioned
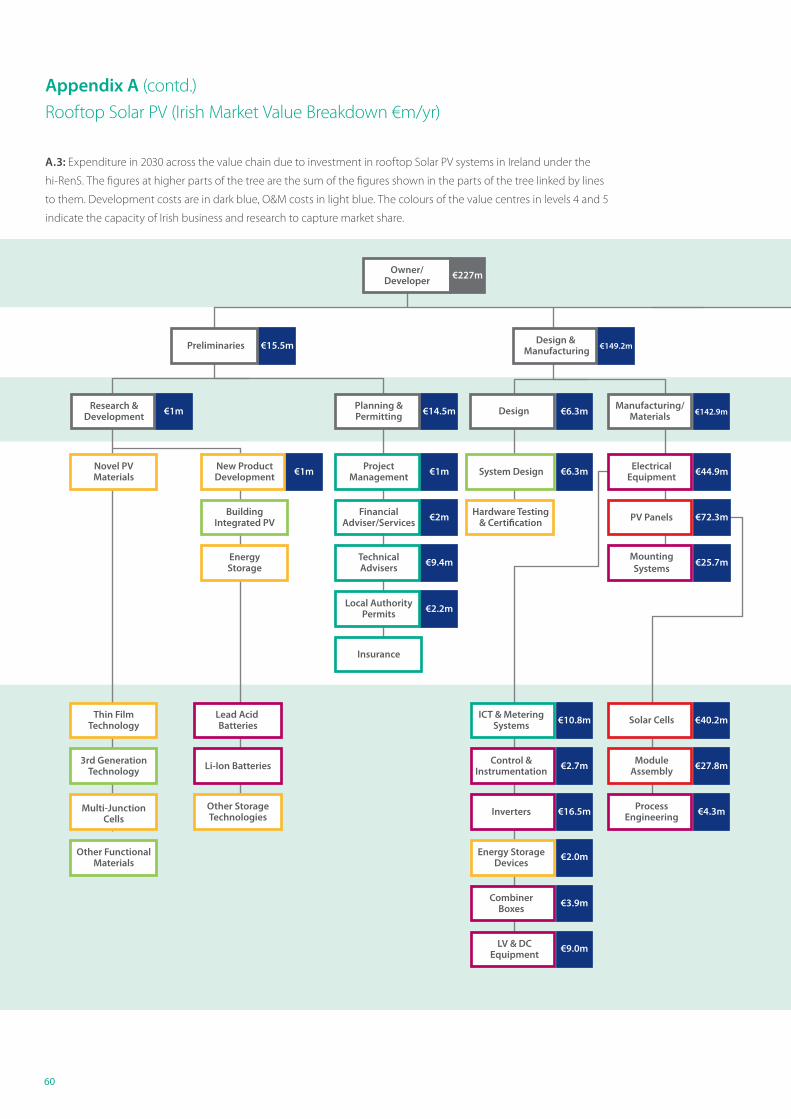
60
Appendix A (contd.)
Rooftop Solar PV (Irish Market Value Breakdown €m/yr)
A.3: Expenditure in 2030 across the value chain due to investment in rooftop Solar PV systems in Ireland under the
hi-RenS. The figures at higher parts of the tree are the sum of the figures shown in the parts of the tree linked by lines
to them. Development costs are in dark blue, O&M costs in light blue. The colours of the value centres in levels 4 and 5
indicate the capacity of Irish business and research to capture market share.
€31.4mPreliminaries
Owner/Developer
Installation & Quality Assurance O & M
Novel PVMaterials
New ProductDevelopment
ProjectManagement
ProjectManagementSystem Design QA Related
Products/Services Maintenance Recycling
BuildingIntegrated PV
FinancialAdviser/Services
Hardware Testing& Certification PV Panels Commissioning
Engineers Insurance Project Management
EnergyStorage
TechnicalAdvisers
MountingSystems
ElectricalEngineering
Metering &Communications
Local AuthorityPermits
Insurance
Thin FilmTechnology
3rd GenerationTechnology
Multi-JunctionCells
Lead Acid Batteries
Li-Ion Batteries
Other StorageTechnologies
ICT & MeteringSystems
Control &Instrumentation
Inverters
Energy StorageDevices
CombinerBoxes
LV & DCEquipment
Solar Cells
ModuleAssembly
ProcessEngineering
EquipmentWarranties
PerformanceGuarantees
Other FunctionalMaterials
RooftopMounting Aggregators
Planning &Permitting Design Manufacturing/
Materials Installation QualityAssurance Operation Decommissioning
€227m
€1m
€1m €1m €6.3m €1.4m €22.3m
€2m €72.3m €2.5m €3.3m
€9.4m €25.7m €10.2m €2.2m
€2.2m €17.2m
€2.8m
€0.3m
€3.1m€27.9m€142.9m€6.3m€14.5m
€2.7m
€16.5m
€2.0m
€3.9m
€9.0m
€10.8m
€27.8m
€4.3m
€40.2m
€149.2m €31m
Research &Development
Design & Manufacturing€15.5m
€44.9m
€31.4m
ElectricalEquipment

61
€31.4mPreliminaries
Owner/Developer
Installation & Quality Assurance O & M
Novel PVMaterials
New ProductDevelopment
ProjectManagement
ProjectManagementSystem Design QA Related
Products/Services Maintenance Recycling
BuildingIntegrated PV
FinancialAdviser/Services
Hardware Testing& Certification PV Panels Commissioning
Engineers Insurance Project Management
EnergyStorage
TechnicalAdvisers
MountingSystems
ElectricalEngineering
Metering &Communications
Local AuthorityPermits
Insurance
Thin FilmTechnology
3rd GenerationTechnology
Multi-JunctionCells
Lead Acid Batteries
Li-Ion Batteries
Other StorageTechnologies
ICT & MeteringSystems
Control &Instrumentation
Inverters
Energy StorageDevices
CombinerBoxes
LV & DCEquipment
Solar Cells
ModuleAssembly
ProcessEngineering
EquipmentWarranties
PerformanceGuarantees
Other FunctionalMaterials
RooftopMounting Aggregators
Planning &Permitting Design Manufacturing/
Materials Installation QualityAssurance Operation Decommissioning
€227m
€1m
€1m €1m €6.3m €1.4m €22.3m
€2m €72.3m €2.5m €3.3m
€9.4m €25.7m €10.2m €2.2m
€2.2m €17.2m
€2.8m
€0.3m
€3.1m€27.9m€142.9m€6.3m€14.5m
€2.7m
€16.5m
€2.0m
€3.9m
€9.0m
€10.8m
€27.8m
€4.3m
€40.2m
€149.2m €31m
Research &Development
Design & Manufacturing€15.5m
€44.9m
€31.4m
ElectricalEquipment
Level 1
Level 2
Level 3
Level 4
Level 5
Value Chain Levels
Level 1 - Ownership
Level 2 - Project
Level 3 - Lifecycle
Level 4 - Key Products/Suppliers
Level 5 - Component Level
Capacity to Capture Market Share
Very well positioned
Well positioned
Averagely positioned
Less well positioned
Not well positioned
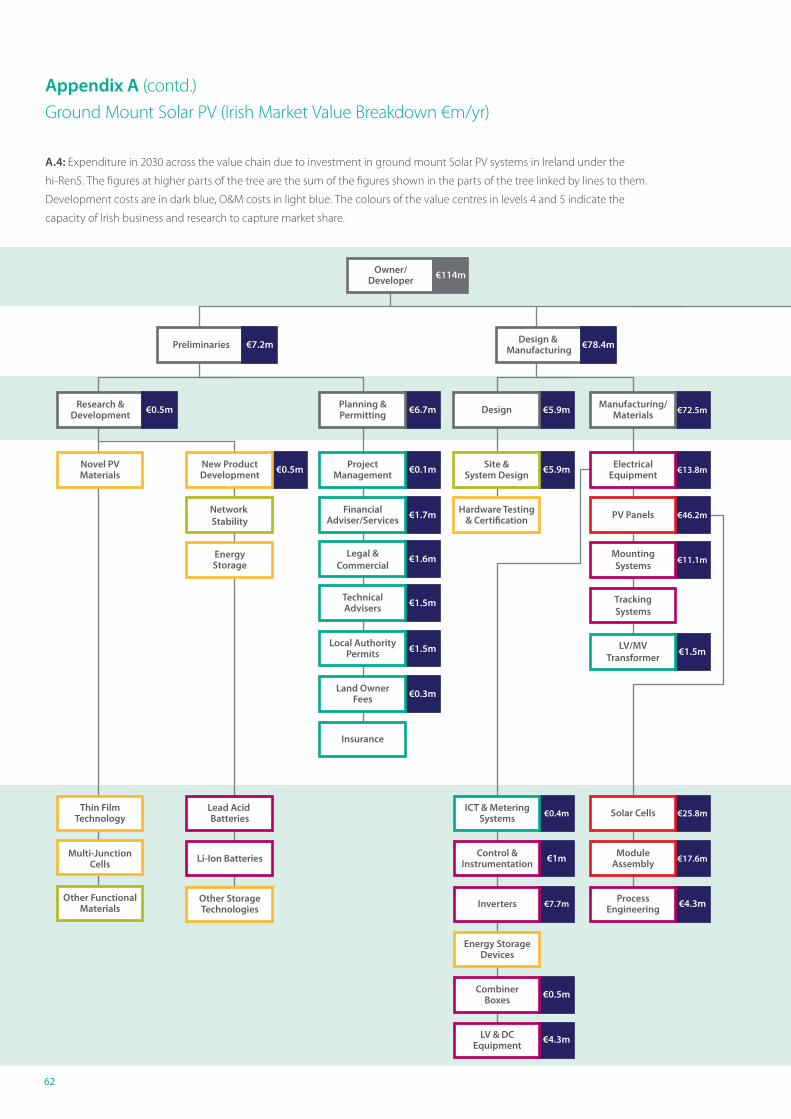
62
Preliminaries Design & Manufacturing
Owner/Developer
Installation & Quality Assurance O & M
Research &Development
Novel PVMaterials
New ProductDevelopment
ProjectManagement
ProjectManagement
Site &System Design
ElectricalEquipment Maintenance Recycling
Network Stability
FinancialAdviser/Services
Hardware Testing& Certification PV Panels
CommissioningEngineers Insurance Project
Management
EnergyStorage
TechnicalAdvisers
MountingSystems
ElectricalEngineering
Metering &Communications
Grid/NetworkOperators
Local AuthorityPermits
Land OwnerFees
Thin FilmTechnology
Multi-JunctionCells
Lead Acid Batteries
Li-Ion Batteries
Other StorageTechnologies
ICT & MeteringSystems
Control &Instrumentation
Inverters
Energy StorageDevices
CombinerBoxes
LV & DCEquipment
Solar Cells
ModuleAssembly
ProcessEngineering
Other FunctionalMaterials
MechanicalEngineering
Planning &Permitting Design Manufacturing/
Materials Installation QualityAssurance Operation Decommissioning
€114m
€7.2m
€0.5m
€0.5m €0.1m €5.9m €13.8m
€2.2m
CivilEngineering €1.6m
QA RelatedProducts/Services
Inspection/Certification
€6.9m
€1.7m €46.2m €0.6m €1.1m
€1.5m
Legal &Commercial
€1.6m €11.1m
TrackingSystems
LV/MVTransformer
€1.5m
€7.0m €0.3m
€1.5m
€0.3m
Insurance
€0.5m
Land Lease €2.6m
ManagementAdministration
€0.3m Business Rates €2.5m
SecurityServices
€0.3mCommunity
Benefits€0.9m
€1.5m
€0.2m
€1.6m€15.4m€0.1m
Client’sRepresentative
€0.1m
€11.3m€72.5m€5.9m€6.7m
€1m
€7.7m
€0.5m
€4.3m
€0.4m
€17.6m
€4.3m
€25.8m Security Systems
MV, LV & DCElectrical Works
Grid ConnectionFees
€2.1m
€4.2m
€0.7m
PerformanceGuarantees
EquipmentWarranties
€78.4m €11.4m €17m
Appendix A (contd.)
Ground Mount Solar PV (Irish Market Value Breakdown €m/yr)
A.4: Expenditure in 2030 across the value chain due to investment in ground mount Solar PV systems in Ireland under the
hi-RenS. The figures at higher parts of the tree are the sum of the figures shown in the parts of the tree linked by lines to them.
Development costs are in dark blue, O&M costs in light blue. The colours of the value centres in levels 4 and 5 indicate the
capacity of Irish business and research to capture market share.
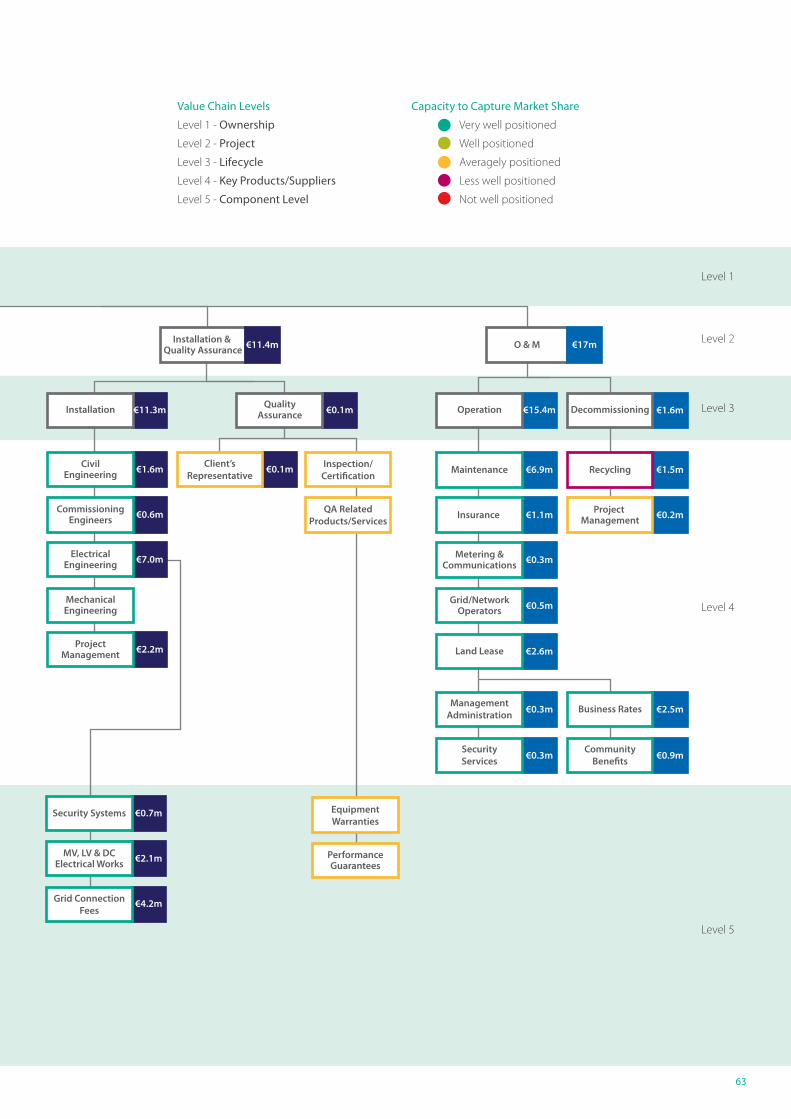
63
Preliminaries Design & Manufacturing
Owner/Developer
Installation & Quality Assurance O & M
Research &Development
Novel PVMaterials
New ProductDevelopment
ProjectManagement
ProjectManagement
Site &System Design
ElectricalEquipment Maintenance Recycling
Network Stability
FinancialAdviser/Services
Hardware Testing& Certification PV Panels
CommissioningEngineers Insurance Project
Management
EnergyStorage
TechnicalAdvisers
MountingSystems
ElectricalEngineering
Metering &Communications
Grid/NetworkOperators
Local AuthorityPermits
Land OwnerFees
Thin FilmTechnology
Multi-JunctionCells
Lead Acid Batteries
Li-Ion Batteries
Other StorageTechnologies
ICT & MeteringSystems
Control &Instrumentation
Inverters
Energy StorageDevices
CombinerBoxes
LV & DCEquipment
Solar Cells
ModuleAssembly
ProcessEngineering
Other FunctionalMaterials
MechanicalEngineering
Planning &Permitting Design Manufacturing/
Materials Installation QualityAssurance Operation Decommissioning
€114m
€7.2m
€0.5m
€0.5m €0.1m €5.9m €13.8m
€2.2m
CivilEngineering €1.6m
QA RelatedProducts/Services
Inspection/Certification
€6.9m
€1.7m €46.2m €0.6m €1.1m
€1.5m
Legal &Commercial
€1.6m €11.1m
TrackingSystems
LV/MVTransformer
€1.5m
€7.0m €0.3m
€1.5m
€0.3m
Insurance
€0.5m
Land Lease €2.6m
ManagementAdministration
€0.3m Business Rates €2.5m
SecurityServices
€0.3mCommunity
Benefits€0.9m
€1.5m
€0.2m
€1.6m€15.4m€0.1m
Client’sRepresentative
€0.1m
€11.3m€72.5m€5.9m€6.7m
€1m
€7.7m
€0.5m
€4.3m
€0.4m
€17.6m
€4.3m
€25.8m Security Systems
MV, LV & DCElectrical Works
Grid ConnectionFees
€2.1m
€4.2m
€0.7m
PerformanceGuarantees
EquipmentWarranties
€78.4m €11.4m €17m
Level 1
Level 2
Level 3
Level 4
Level 5
Value Chain Levels
Level 1 - Ownership
Level 2 - Project
Level 3 - Lifecycle
Level 4 - Key Products/Suppliers
Level 5 - Component Level
Capacity to Capture Market Share
Very well positioned
Well positioned
Averagely positioned
Less well positioned
Not well positioned
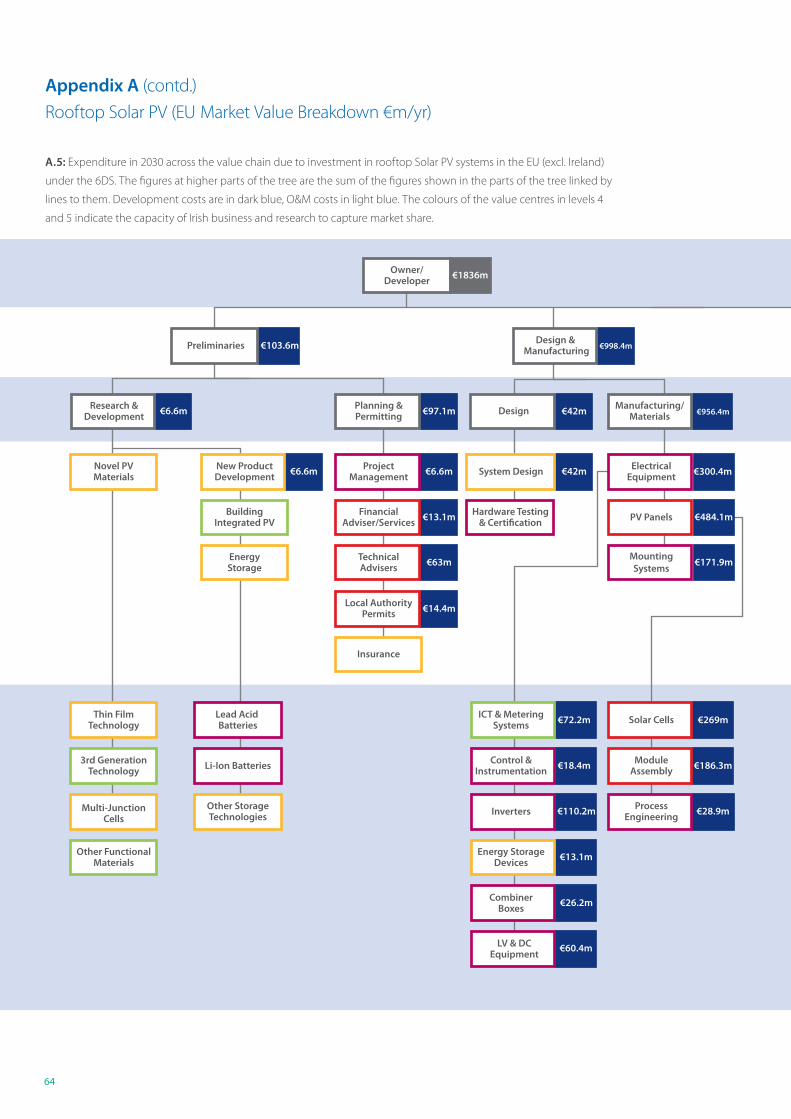
64
Appendix A (contd.)
Rooftop Solar PV (EU Market Value Breakdown €m/yr)
A.5: Expenditure in 2030 across the value chain due to investment in rooftop Solar PV systems in the EU (excl. Ireland)
under the 6DS. The figures at higher parts of the tree are the sum of the figures shown in the parts of the tree linked by
lines to them. Development costs are in dark blue, O&M costs in light blue. The colours of the value centres in levels 4
and 5 indicate the capacity of Irish business and research to capture market share.
€209.9mPreliminaries
Owner/Developer
Installation & Quality Assurance O & M
Novel PVMaterials
New ProductDevelopment
ProjectManagement
ProjectManagementSystem Design QA Related
Products/Services Maintenance Recycling
BuildingIntegrated PV
FinancialAdviser/Services
Hardware Testing& Certification PV Panels Commissioning
Engineers Insurance Project Management
EnergyStorage
TechnicalAdvisers
MountingSystems
ElectricalEngineering
Metering &Communications
Local AuthorityPermits
Insurance
Thin FilmTechnology
3rd GenerationTechnology
Multi-JunctionCells
Lead Acid Batteries
Li-Ion Batteries
Other StorageTechnologies
ICT & MeteringSystems
Control &Instrumentation
Inverters
Energy StorageDevices
CombinerBoxes
LV & DCEquipment
Solar Cells
ModuleAssembly
ProcessEngineering
EquipmentWarranties
PerformanceGuarantees
Other FunctionalMaterials
RooftopMounting Aggregators
Planning &Permitting Design Manufacturing/
Materials Installation QualityAssurance Operation Decommissioning
€1836m
€6.6m
€6.6m €6.6m €42m €9.2m €377.3m
€13.1m €484.1m €17.1m €56.6m
€63m €171.9m €68.2m €37.7m
€14.4m €115.5m
€47.2m
€5.2m
€52.4m€956.4m€42m€97.1m
€18.4m
€110.2m
€13.1m
€26.2m
€60.4m
€72.2m
€186.3m
€28.9m
€269m
€998.4m €524m
Research &Development
Design & Manufacturing€103.6m
€300.4m
€209.9m
ElectricalEquipment
€471.6m
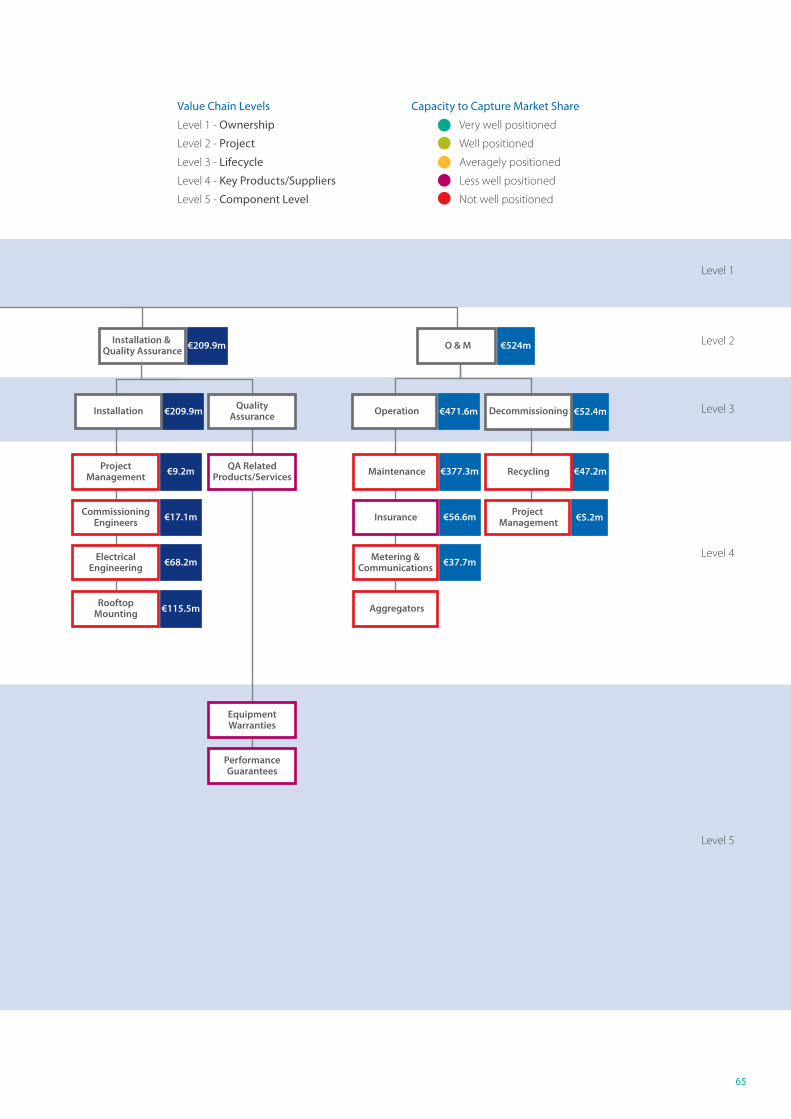
Level 1
Level 2
Level 3
Level 4
Level 5
65
€209.9mPreliminaries
Owner/Developer
Installation & Quality Assurance O & M
Novel PVMaterials
New ProductDevelopment
ProjectManagement
ProjectManagementSystem Design QA Related
Products/Services Maintenance Recycling
BuildingIntegrated PV
FinancialAdviser/Services
Hardware Testing& Certification PV Panels Commissioning
Engineers Insurance Project Management
EnergyStorage
TechnicalAdvisers
MountingSystems
ElectricalEngineering
Metering &Communications
Local AuthorityPermits
Insurance
Thin FilmTechnology
3rd GenerationTechnology
Multi-JunctionCells
Lead Acid Batteries
Li-Ion Batteries
Other StorageTechnologies
ICT & MeteringSystems
Control &Instrumentation
Inverters
Energy StorageDevices
CombinerBoxes
LV & DCEquipment
Solar Cells
ModuleAssembly
ProcessEngineering
EquipmentWarranties
PerformanceGuarantees
Other FunctionalMaterials
RooftopMounting Aggregators
Planning &Permitting Design Manufacturing/
Materials Installation QualityAssurance Operation Decommissioning
€1836m
€6.6m
€6.6m €6.6m €42m €9.2m €377.3m
€13.1m €484.1m €17.1m €56.6m
€63m €171.9m €68.2m €37.7m
€14.4m €115.5m
€47.2m
€5.2m
€52.4m€956.4m€42m€97.1m
€18.4m
€110.2m
€13.1m
€26.2m
€60.4m
€72.2m
€186.3m
€28.9m
€269m
€998.4m €524m
Research &Development
Design & Manufacturing€103.6m
€300.4m
€209.9m
ElectricalEquipment
€471.6m
Value Chain Levels
Level 1 - Ownership
Level 2 - Project
Level 3 - Lifecycle
Level 4 - Key Products/Suppliers
Level 5 - Component Level
Capacity to Capture Market Share
Very well positioned
Well positioned
Averagely positioned
Less well positioned
Not well positioned
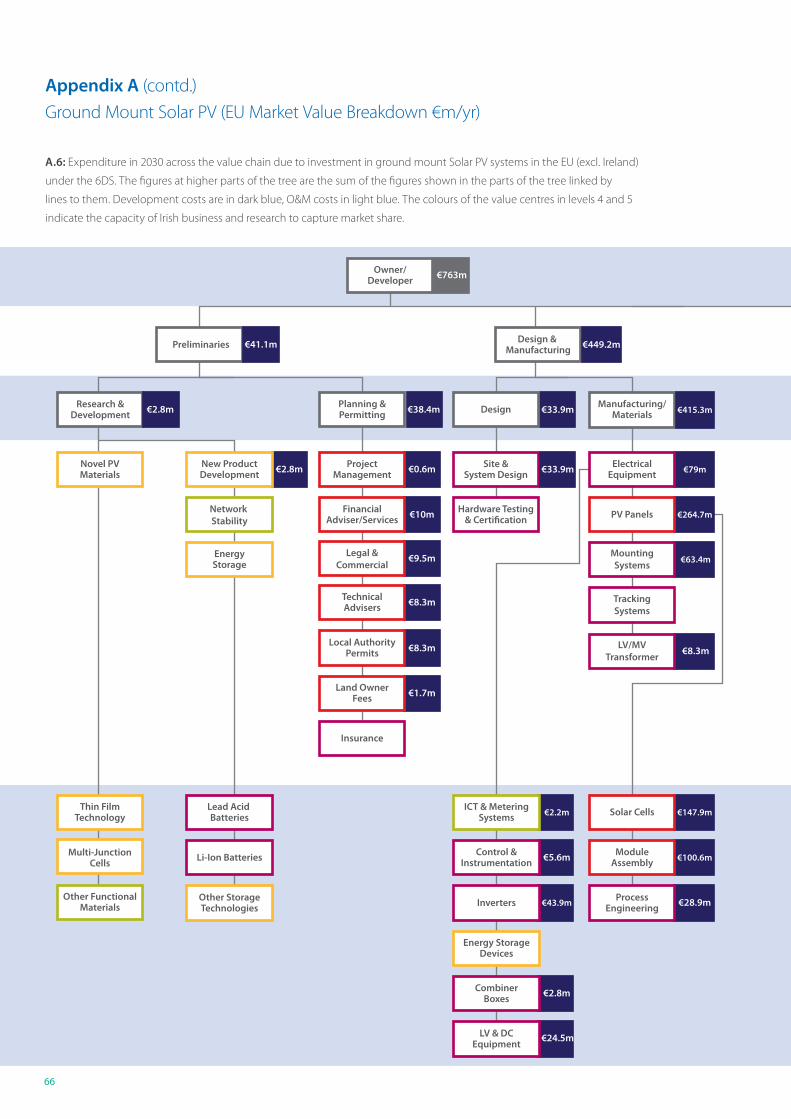
66
Preliminaries Design & Manufacturing
Owner/Developer
Installation & Quality Assurance O & M
Research &Development
Novel PVMaterials
New ProductDevelopment
ProjectManagement
ProjectManagement
Site &System Design
ElectricalEquipment Maintenance Recycling
Network Stability
FinancialAdviser/Services
Hardware Testing& Certification PV Panels
CommissioningEngineers Insurance Project
Management
EnergyStorage
TechnicalAdvisers
MountingSystems
ElectricalEngineering
Metering &Communications
Grid/NetworkOperators
Local AuthorityPermits
Land OwnerFees
Thin FilmTechnology
Multi-JunctionCells
Lead Acid Batteries
Li-Ion Batteries
Other StorageTechnologies
ICT & MeteringSystems
Control &Instrumentation
Inverters
Energy StorageDevices
CombinerBoxes
LV & DCEquipment
Solar Cells
ModuleAssembly
ProcessEngineering
Other FunctionalMaterials
MechanicalEngineering
Planning &Permitting Design Manufacturing/
Materials Installation QualityAssurance Operation Decommissioning
€763m
€41.1m
€2.8m
€2.8m €0.6m €79m
€12.8m
CivilEngineering €8.9m
QA RelatedProducts/Services
Inspection/Certification
€84m
€10m €264.7m €3.3m €13m
€8.3m
Legal &Commercial
€9.5m €63.4m
TrackingSystems
LV/MVTransformer
€8.3m
€40m €3.7m
€8.3m
€1.7m
Insurance
€5.8m
Land Lease €31.1m
ManagementAdministration
€4.1m Business Rates €30.8m
SecurityServices
€4.1mCommunity
Benefits€10.4m
€17.8m
€2.1m
€19.9m€187.1m€0.6m
Client’sRepresentative
€0.6m
€65.1m€33.9m
€5.6m
€43.9m
€2.8m
€24.5m
€2.2m
€100.6m
€28.9m
€147.9m Security Systems
MV, LV & DCElectrical Works
Grid ConnectionFees
€12.2m
€23.9m
€3.9m
PerformanceGuarantees
EquipmentWarranties
€65.6m €207m
€38.4m
€449.2m
€415.3m
€33.9m
Appendix A (contd.)
Ground Mount Solar PV (EU Market Value Breakdown €m/yr)
A.6: Expenditure in 2030 across the value chain due to investment in ground mount Solar PV systems in the EU (excl. Ireland)
under the 6DS. The figures at higher parts of the tree are the sum of the figures shown in the parts of the tree linked by
lines to them. Development costs are in dark blue, O&M costs in light blue. The colours of the value centres in levels 4 and 5
indicate the capacity of Irish business and research to capture market share.
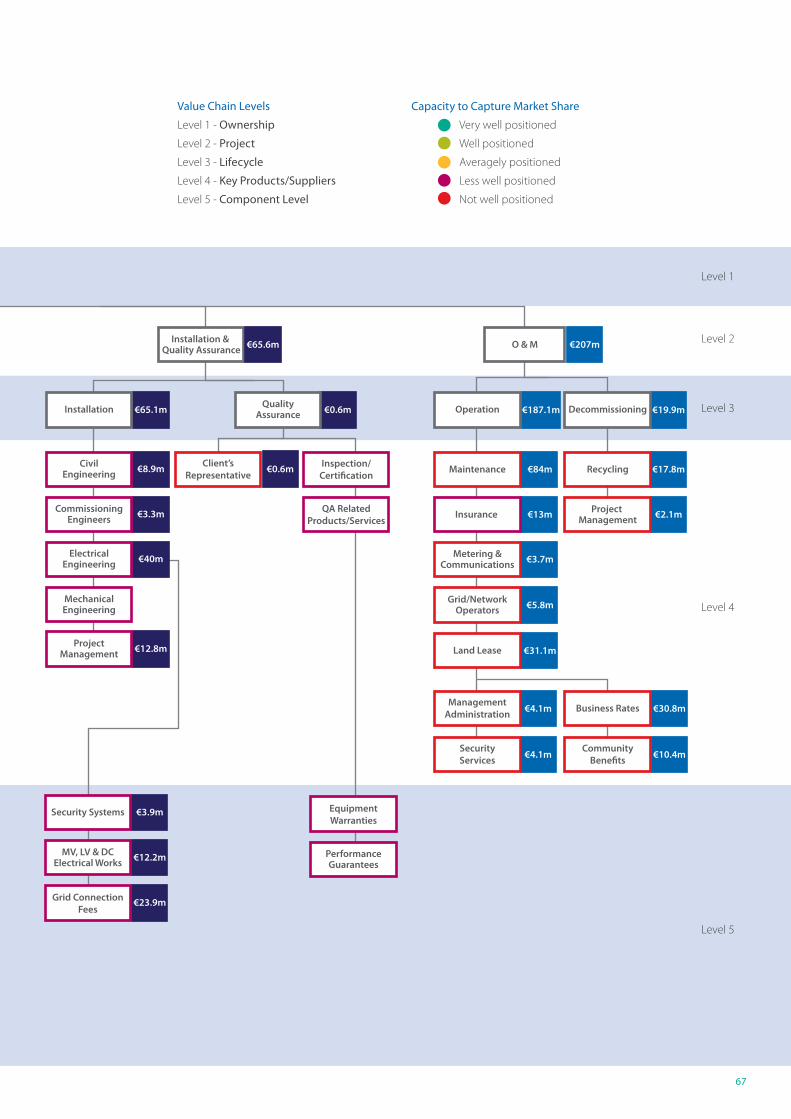
67
Preliminaries Design & Manufacturing
Owner/Developer
Installation & Quality Assurance O & M
Research &Development
Novel PVMaterials
New ProductDevelopment
ProjectManagement
ProjectManagement
Site &System Design
ElectricalEquipment Maintenance Recycling
Network Stability
FinancialAdviser/Services
Hardware Testing& Certification PV Panels
CommissioningEngineers Insurance Project
Management
EnergyStorage
TechnicalAdvisers
MountingSystems
ElectricalEngineering
Metering &Communications
Grid/NetworkOperators
Local AuthorityPermits
Land OwnerFees
Thin FilmTechnology
Multi-JunctionCells
Lead Acid Batteries
Li-Ion Batteries
Other StorageTechnologies
ICT & MeteringSystems
Control &Instrumentation
Inverters
Energy StorageDevices
CombinerBoxes
LV & DCEquipment
Solar Cells
ModuleAssembly
ProcessEngineering
Other FunctionalMaterials
MechanicalEngineering
Planning &Permitting Design Manufacturing/
Materials Installation QualityAssurance Operation Decommissioning
€763m
€41.1m
€2.8m
€2.8m €0.6m €79m
€12.8m
CivilEngineering €8.9m
QA RelatedProducts/Services
Inspection/Certification
€84m
€10m €264.7m €3.3m €13m
€8.3m
Legal &Commercial
€9.5m €63.4m
TrackingSystems
LV/MVTransformer
€8.3m
€40m €3.7m
€8.3m
€1.7m
Insurance
€5.8m
Land Lease €31.1m
ManagementAdministration
€4.1m Business Rates €30.8m
SecurityServices
€4.1mCommunity
Benefits€10.4m
€17.8m
€2.1m
€19.9m€187.1m€0.6m
Client’sRepresentative
€0.6m
€65.1m€33.9m
€5.6m
€43.9m
€2.8m
€24.5m
€2.2m
€100.6m
€28.9m
€147.9m Security Systems
MV, LV & DCElectrical Works
Grid ConnectionFees
€12.2m
€23.9m
€3.9m
PerformanceGuarantees
EquipmentWarranties
€65.6m €207m
€38.4m
€449.2m
€415.3m
€33.9m
Level 1
Level 2
Level 3
Level 4
Level 5
Value Chain Levels
Level 1 - Ownership
Level 2 - Project
Level 3 - Lifecycle
Level 4 - Key Products/Suppliers
Level 5 - Component Level
Capacity to Capture Market Share
Very well positioned
Well positioned
Averagely positioned
Less well positioned
Not well positioned
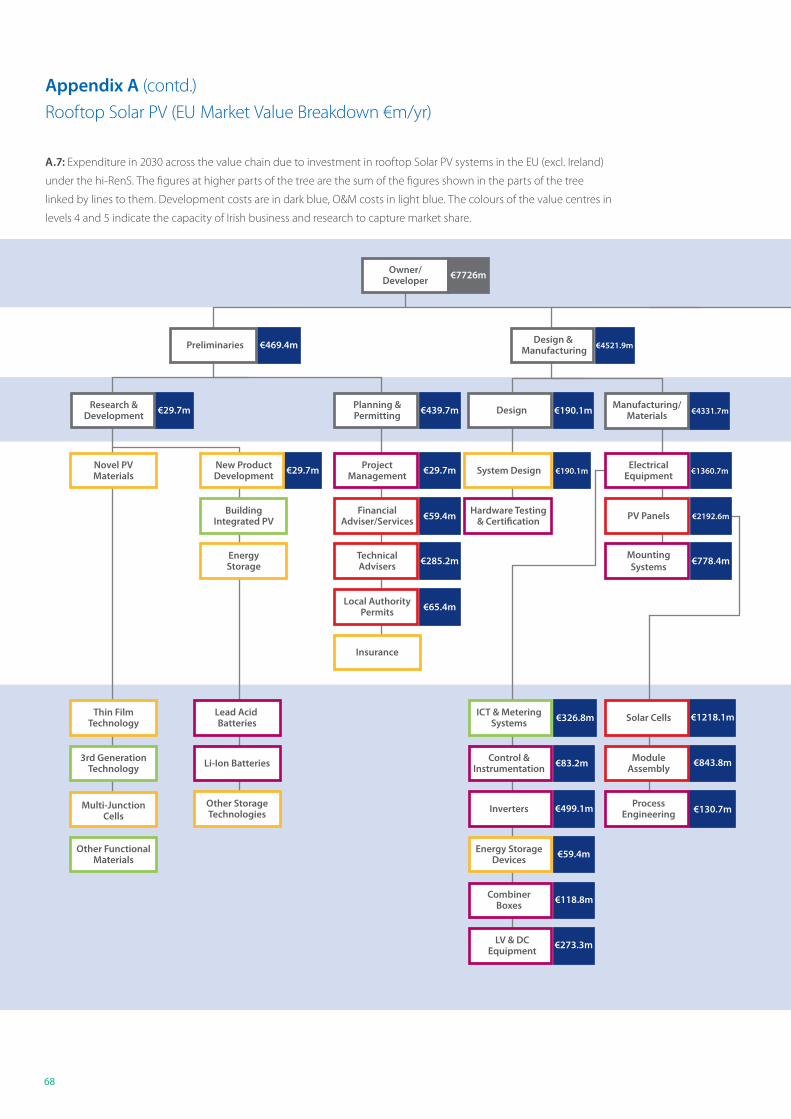
68
Appendix A (contd.)
Rooftop Solar PV (EU Market Value Breakdown €m/yr)
A.7: Expenditure in 2030 across the value chain due to investment in rooftop Solar PV systems in the EU (excl. Ireland)
under the hi-RenS. The figures at higher parts of the tree are the sum of the figures shown in the parts of the tree
linked by lines to them. Development costs are in dark blue, O&M costs in light blue. The colours of the value centres in
levels 4 and 5 indicate the capacity of Irish business and research to capture market share.
€950.7mPreliminaries
Owner/Developer
Installation & Quality Assurance O & M
Novel PVMaterials
New ProductDevelopment
ProjectManagement
ProjectManagementSystem Design QA Related
Products/Services Maintenance Recycling
BuildingIntegrated PV
FinancialAdviser/Services
Hardware Testing& Certification PV Panels Commissioning
Engineers Insurance Project Management
EnergyStorage
TechnicalAdvisers
MountingSystems
ElectricalEngineering
Metering &Communications
Local AuthorityPermits
Insurance
Thin FilmTechnology
3rd GenerationTechnology
Multi-JunctionCells
Lead Acid Batteries
Li-Ion Batteries
Other StorageTechnologies
ICT & MeteringSystems
Control &Instrumentation
Inverters
Energy StorageDevices
CombinerBoxes
LV & DCEquipment
Solar Cells
ModuleAssembly
ProcessEngineering
EquipmentWarranties
PerformanceGuarantees
Other FunctionalMaterials
RooftopMounting Aggregators
Planning &Permitting Design Manufacturing/
Materials Installation QualityAssurance Operation Decommissioning
€7726m
€29.7m
€29.7m €29.7m €190.1m €41.6m €1284.5m
€59.4m €2192.6m €77.2m €192.7m
€285.2m €778.4m €309m €128.4m
€65.4m €522.9m
€160.6m
€17.8m
€178.4m€4331.7m€190.1m€439.7m
€83.2m
€499.1m
€59.4m
€118.8m
€273.3m
€326.8m
€843.8m
€130.7m
€1218.1m
€4521.9m €1784m
Research &Development
Design & Manufacturing€469.4m
€1360.7m
€950.7m
ElectricalEquipment
€1605.6m
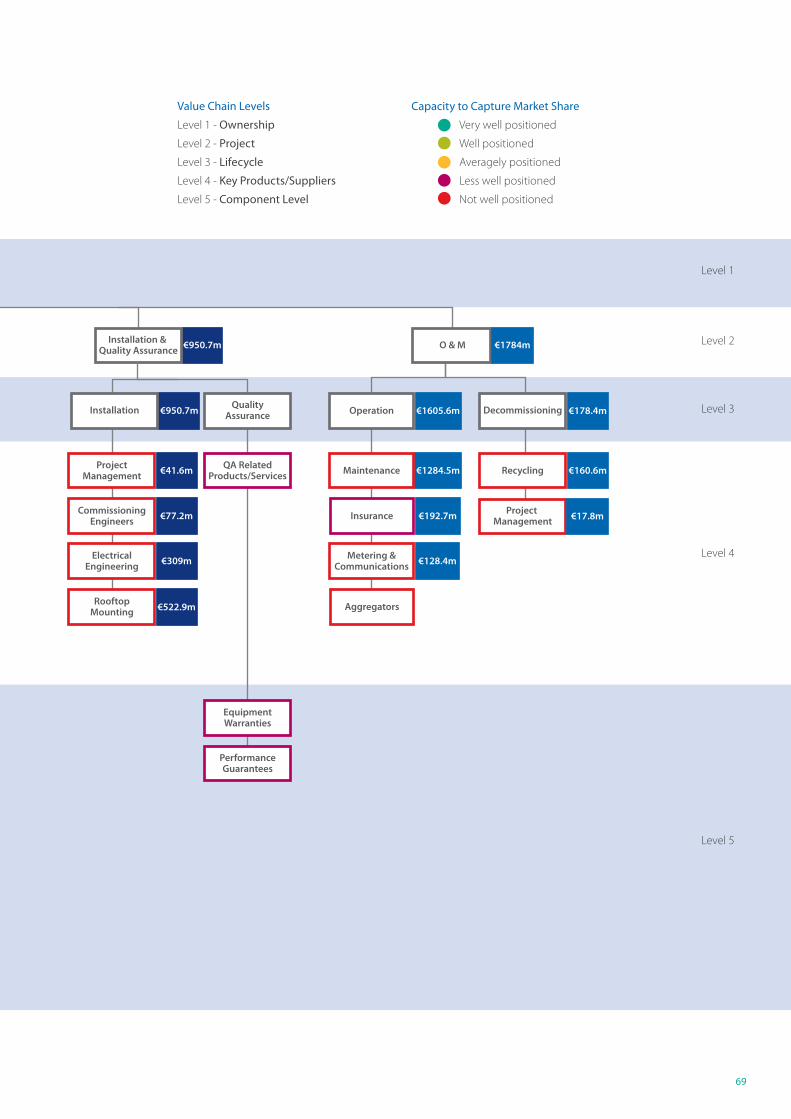
69
€950.7mPreliminaries
Owner/Developer
Installation & Quality Assurance O & M
Novel PVMaterials
New ProductDevelopment
ProjectManagement
ProjectManagementSystem Design QA Related
Products/Services Maintenance Recycling
BuildingIntegrated PV
FinancialAdviser/Services
Hardware Testing& Certification PV Panels Commissioning
Engineers Insurance Project Management
EnergyStorage
TechnicalAdvisers
MountingSystems
ElectricalEngineering
Metering &Communications
Local AuthorityPermits
Insurance
Thin FilmTechnology
3rd GenerationTechnology
Multi-JunctionCells
Lead Acid Batteries
Li-Ion Batteries
Other StorageTechnologies
ICT & MeteringSystems
Control &Instrumentation
Inverters
Energy StorageDevices
CombinerBoxes
LV & DCEquipment
Solar Cells
ModuleAssembly
ProcessEngineering
EquipmentWarranties
PerformanceGuarantees
Other FunctionalMaterials
RooftopMounting Aggregators
Planning &Permitting Design Manufacturing/
Materials Installation QualityAssurance Operation Decommissioning
€7726m
€29.7m
€29.7m €29.7m €190.1m €41.6m €1284.5m
€59.4m €2192.6m €77.2m €192.7m
€285.2m €778.4m €309m €128.4m
€65.4m €522.9m
€160.6m
€17.8m
€178.4m€4331.7m€190.1m€439.7m
€83.2m
€499.1m
€59.4m
€118.8m
€273.3m
€326.8m
€843.8m
€130.7m
€1218.1m
€4521.9m €1784m
Research &Development
Design & Manufacturing€469.4m
€1360.7m
€950.7m
ElectricalEquipment
€1605.6m
Level 1
Level 2
Level 3
Level 4
Level 5
Value Chain Levels
Level 1 - Ownership
Level 2 - Project
Level 3 - Lifecycle
Level 4 - Key Products/Suppliers
Level 5 - Component Level
Capacity to Capture Market Share
Very well positioned
Well positioned
Averagely positioned
Less well positioned
Not well positioned
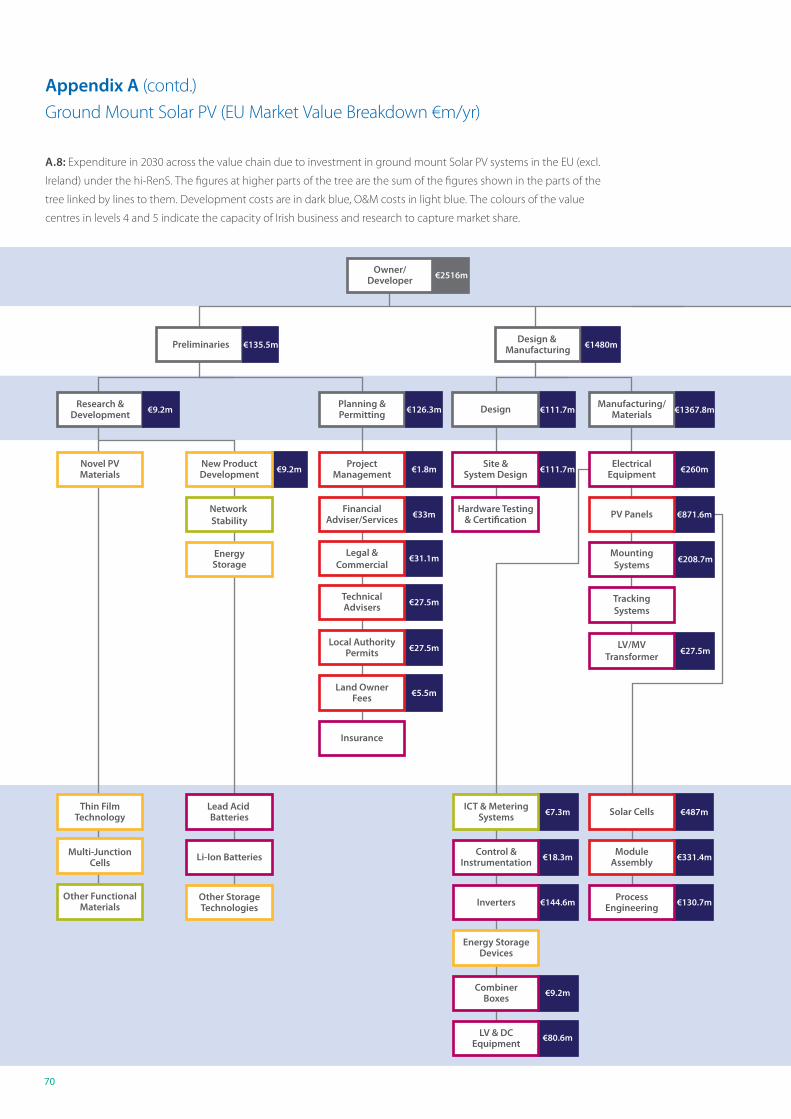
70
Preliminaries Design & Manufacturing
Owner/Developer
Installation & Quality Assurance O & M
Research &Development
Novel PVMaterials
New ProductDevelopment
ProjectManagement
ProjectManagement
Site &System Design
ElectricalEquipment Maintenance Recycling
Network Stability
FinancialAdviser/Services
Hardware Testing& Certification PV Panels
CommissioningEngineers Insurance Project
Management
EnergyStorage
TechnicalAdvisers
MountingSystems
ElectricalEngineering
Metering &Communications
Grid/NetworkOperators
Local AuthorityPermits
Land OwnerFees
Thin FilmTechnology
Multi-JunctionCells
Lead Acid Batteries
Li-Ion Batteries
Other StorageTechnologies
ICT & MeteringSystems
Control &Instrumentation
Inverters
Energy StorageDevices
CombinerBoxes
LV & DCEquipment
Solar Cells
ModuleAssembly
ProcessEngineering
Other FunctionalMaterials
MechanicalEngineering
Planning &Permitting Design Manufacturing/
Materials Installation QualityAssurance Operation Decommissioning
€2516m
€135.5m
€9.2m
€9.2m €1.8m €260m
€42.1m
CivilEngineering €29.3m
QA RelatedProducts/Services
Inspection/Certification
€277.7m
€33m €871.6m €11m €43.1m
€27.5m
Legal &Commercial
€31.1m €208.7m
TrackingSystems
LV/MVTransformer
€27.5m
€131.8m €12.3m
€27.5m
€5.5m
Insurance
€19.2m
Land Lease €102.6m
ManagementAdministration
€13.7m Business Rates €101.9m
SecurityServices
€13.7mCommunity
Benefits€34.2m
€58.8m
€6.8m
€65.7m€618.3m€1.8m
Client’sRepresentative
€1.8m
€214.2m€111.7m
€18.3m
€144.6m
€9.2m
€80.6m
€7.3m
€331.4m
€130.7m
€487m Security Systems
MV, LV & DCElectrical Works
Grid ConnectionFees
€40.3m
€78.7m
€12.8m
PerformanceGuarantees
EquipmentWarranties
€216.1m €684m
€126.3m
€1480m
€1367.8m
€111.7m
Appendix A (contd.)
Ground Mount Solar PV (EU Market Value Breakdown €m/yr)
A.8: Expenditure in 2030 across the value chain due to investment in ground mount Solar PV systems in the EU (excl.
Ireland) under the hi-RenS. The figures at higher parts of the tree are the sum of the figures shown in the parts of the
tree linked by lines to them. Development costs are in dark blue, O&M costs in light blue. The colours of the value
centres in levels 4 and 5 indicate the capacity of Irish business and research to capture market share.
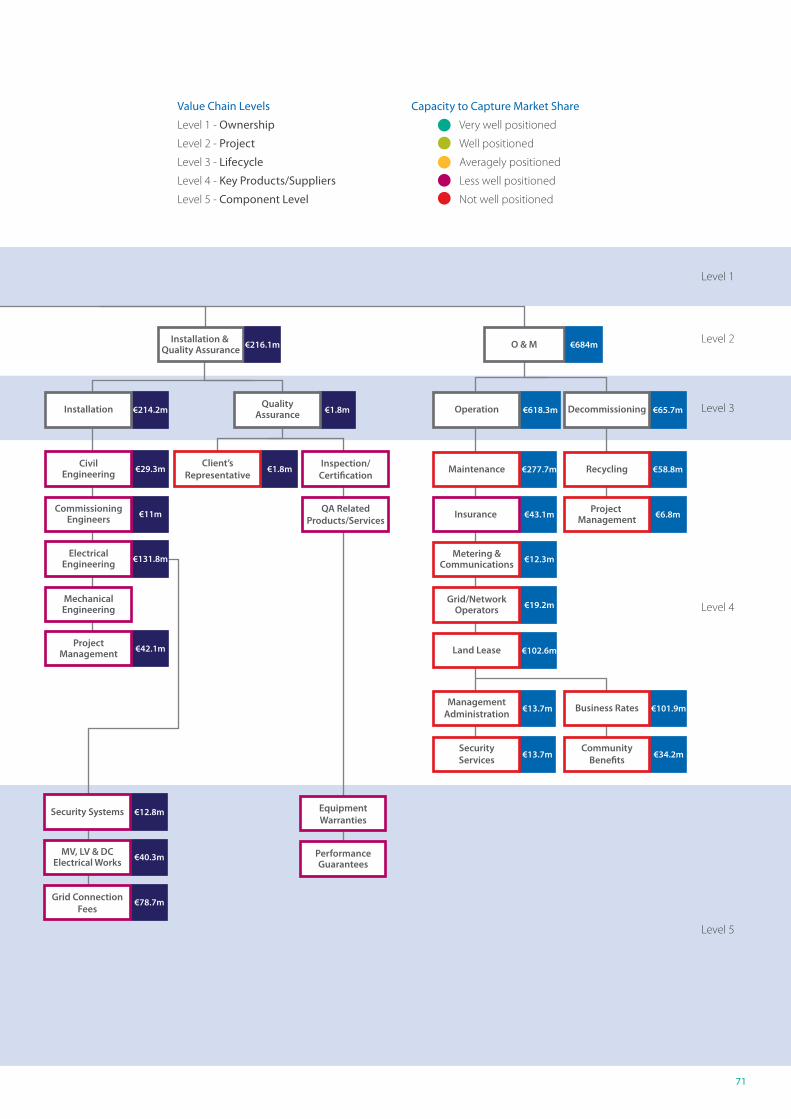
71
Preliminaries Design & Manufacturing
Owner/Developer
Installation & Quality Assurance O & M
Research &Development
Novel PVMaterials
New ProductDevelopment
ProjectManagement
ProjectManagement
Site &System Design
ElectricalEquipment Maintenance Recycling
Network Stability
FinancialAdviser/Services
Hardware Testing& Certification PV Panels
CommissioningEngineers Insurance Project
Management
EnergyStorage
TechnicalAdvisers
MountingSystems
ElectricalEngineering
Metering &Communications
Grid/NetworkOperators
Local AuthorityPermits
Land OwnerFees
Thin FilmTechnology
Multi-JunctionCells
Lead Acid Batteries
Li-Ion Batteries
Other StorageTechnologies
ICT & MeteringSystems
Control &Instrumentation
Inverters
Energy StorageDevices
CombinerBoxes
LV & DCEquipment
Solar Cells
ModuleAssembly
ProcessEngineering
Other FunctionalMaterials
MechanicalEngineering
Planning &Permitting Design Manufacturing/
Materials Installation QualityAssurance Operation Decommissioning
€2516m
€135.5m
€9.2m
€9.2m €1.8m €260m
€42.1m
CivilEngineering €29.3m
QA RelatedProducts/Services
Inspection/Certification
€277.7m
€33m €871.6m €11m €43.1m
€27.5m
Legal &Commercial
€31.1m €208.7m
TrackingSystems
LV/MVTransformer
€27.5m
€131.8m €12.3m
€27.5m
€5.5m
Insurance
€19.2m
Land Lease €102.6m
ManagementAdministration
€13.7m Business Rates €101.9m
SecurityServices
€13.7mCommunity
Benefits€34.2m
€58.8m
€6.8m
€65.7m€618.3m€1.8m
Client’sRepresentative
€1.8m
€214.2m€111.7m
€18.3m
€144.6m
€9.2m
€80.6m
€7.3m
€331.4m
€130.7m
€487m Security Systems
MV, LV & DCElectrical Works
Grid ConnectionFees
€40.3m
€78.7m
€12.8m
PerformanceGuarantees
EquipmentWarranties
€216.1m €684m
€126.3m
€1480m
€1367.8m
€111.7m
Level 1
Level 2
Level 3
Level 4
Level 5
Value Chain Levels
Level 1 - Ownership
Level 2 - Project
Level 3 - Lifecycle
Level 4 - Key Products/Suppliers
Level 5 - Component Level
Capacity to Capture Market Share
Very well positioned
Well positioned
Averagely positioned
Less well positioned
Not well positioned
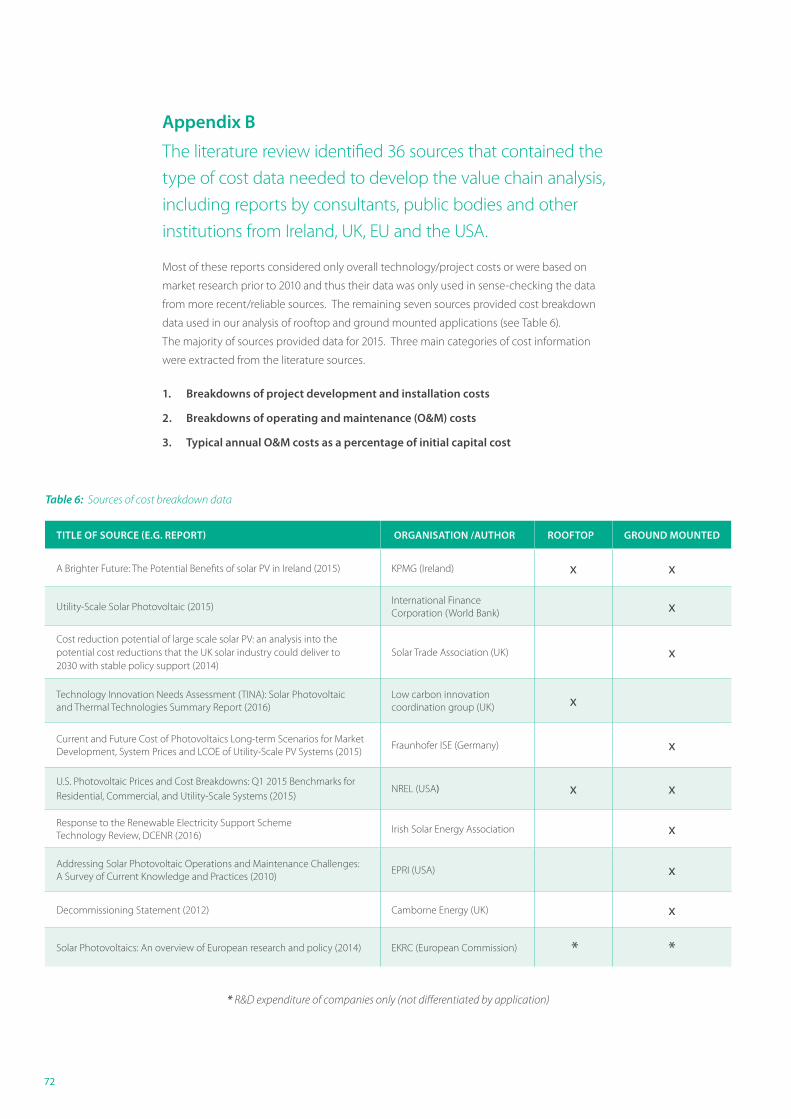
72
Appendix B
The literature review identified 36 sources that contained the
type of cost data needed to develop the value chain analysis,
including reports by consultants, public bodies and other
institutions from Ireland, UK, EU and the USA.
Most of these reports considered only overall technology/project costs or were based on
market research prior to 2010 and thus their data was only used in sense-checking the data
from more recent/reliable sources. The remaining seven sources provided cost breakdown
data used in our analysis of rooftop and ground mounted applications (see Table 6).
The majority of sources provided data for 2015. Three main categories of cost information
were extracted from the literature sources.
1. Breakdowns of project development and installation costs
2. Breakdowns of operating and maintenance (O&M) costs
3. Typical annual O&M costs as a percentage of initial capital cost
Table 6: Sources of cost breakdown data
* R&D expenditure of companies only (not differentiated by application)
TITLE OF SOURCE (E.G. REPORT) ORGANISATION /AUTHOR ROOFTOP GROUND MOUNTED
A Brighter Future: The Potential Benefits of solar PV in Ireland (2015) KPMG (Ireland) x x
Utility-Scale Solar Photovoltaic (2015)International Finance Corporation (World Bank) x
Cost reduction potential of large scale solar PV: an analysis into the potential cost reductions that the UK solar industry could deliver to 2030 with stable policy support (2014)
Solar Trade Association (UK) x
Technology Innovation Needs Assessment (TINA): Solar Photovoltaic and Thermal Technologies Summary Report (2016)
Low carbon innovation coordination group (UK) x
Current and Future Cost of Photovoltaics Long-term Scenarios for Market Development, System Prices and LCOE of Utility-Scale PV Systems (2015)
Fraunhofer ISE (Germany) x
U.S. Photovoltaic Prices and Cost Breakdowns: Q1 2015 Benchmarks for Residential, Commercial, and Utility-Scale Systems (2015)
NREL (USA) x x
Response to the Renewable Electricity Support Scheme Technology Review, DCENR (2016)
Irish Solar Energy Association x
Addressing Solar Photovoltaic Operations and Maintenance Challenges: A Survey of Current Knowledge and Practices (2010)
EPRI (USA) x
Decommissioning Statement (2012) Camborne Energy (UK) x
Solar Photovoltaics: An overview of European research and policy (2014) EKRC (European Commission) * *
73
Appendix C Stakeholders Consulted: SEAI is grateful to the following
stakeholders for their input:
Brian Norton, DIT`
Ciaran Arthur, IDA
Ciaran O'Shaugnessy, CER
Conor Gibney, Electronic Concepts Ltd
Daniel Sharpe, Instant Solar
David Maguire, BNRG
Don MacElroy, UCD
Edward Duffy, Nines Photovoltaics
Fergus Sharkey, Kingspan ESB
Han Vos, DCU
John Ward, RedT Energy
Joseph O'Mahony, Waterford Institute of Technology
Karsten Fleischer, TCD
Kevin Ryan, UL
Lisa Ryan, UCD
Lorcan Brennan, TCD
Mark O’Malley, UCD
Mary Price, DCU
Mazhar Bari, SolarPrint
Mel Courtney, Kingspan
Michael Norton, Solar Electric
Paul Manning, NovoGrid
Robert Guilmartin, Kingspan
Sarah La Monaca, UCD
Sarah McCormack, TCD
Sean Ward, CER
Shafi Khadem, IERC
Tom Loughrey, Lightsource
Bibliography
DCENR. (2015). White Paper - Ireland's Transition
to a Low Carbon Energy Future.
DECC. (2012). Solar PV Cost Update. http://bit.
ly/1OgPb3o.
DECC. (2015). Solar PV Cost Data. http://bit.
ly/1ZmFgiO.
EPRI. (2010). Addressing Solar Photovoltaic
Operations and Maintenance Challenges.
EurObserv'ER. (2016). Photovoltaic Barometer.
IEA. (2014a). Energy Technology Perspectives.
https://www.iea.org/etp/etp2014/.
IEA. (2014b). Technology Roadmap - Solar PV
Energy. http://bit.ly/1zp91C8.
IEA-PVPS. (2016). 2015 Snapshot of Global
Photovoltaic Markets.
IRENA. (2016, June 15). Average Costs for Solar
and Wind Electricity Could Fall 59% by 2025 .
Retrieved from IRENA: http://bit.ly/1rplHLc
JRC. (2016). PVGIS - Europe. Retrieved from
http://re.jrc.ec.europa.eu/pvgis/apps4/pvest.
php#
KPMG. (2015). A Brighter Future - The Potential
Benefits of Solar PV in Ireland.
n-tech. (2015). BIPV Technologies & Markets,
2015-2022.
SEAI. (2014). Ireland's Sustainable Energy Supply
Chain Opportunity.

Bibliography

t +353 1 8082100 f +353 1 8082002
Sustainable Energy Authority of Ireland Wilton Park House, Wilton Place, Dublin 2, Ireland
e [email protected] w www.seai.ie
@seai_ie