Embed Size (px)
Citation preview

The Promise of Different Types of Environmental Management Systems for Voluntary Governance
Younsung Kim Department of Environmental Science & Policy
George Mason University 10504 Captain John Smith Ct.
Fairfax, VA 22030 Voice: 703.888.6736 • 703.272.7101
Nicole Darnall1 Department of Environmental Science & Policy
George Mason University 10541 School Street Fairfax, VA 22030
Voice: 703.349.1233 • 703.993.3819 Fax: 703.993.1066 [email protected]
Paper prepared for presentation at Environmental Policy: A Multinational Conference on Policy Analysis and Teaching Methods and The Association of Public Policy Analysis and Management,
Seoul, Korea, June 2009
1 The author thanks the Organisation for Economic Co-operation and Development (OECD) Environmental Directorate for partial funding of this research.

1
The Promise of Different Types of Environmental Management Systems
for Voluntary Governance
Abstract
In spite of firms’ global interest in adopting environment management systems (EMSs), there is
little information about which types of EMSs are associated with greater environmental
improvements. This research compares the environmental performance of facilities that adopt
self-declared EMSs, complete EMSs, and ISO 14001-certified EMSs across multiple
environmental impacts. We analyze these relationships using a two-stage model to control for
selection bias, and OECD survey data for manufacturing facilities in Canada, France, Germany,
Hungary, Japan, Norway, and the United States. Our findings indicate that adoption of all three
EMSs is related to facilities’ reductions in natural resource uses, solid waste, wastewater effluent,
local air pollution, and global air pollutants. However, there lacks strong evidence that ISO
14001-certified EMSs lead to superior environmental improvements than other types of EMSs.
Keywords: Environmental management system, environmental performance, motivations, ISO
14001, EMS adoption

2
The Promise of Different Types of Environmental Management Systems
for Voluntary Governance
INTRODUCTION
In many countries environmental policy has taken the form of mandatory command and
control regulations in which governments prescribe legally binding performance standards such
as emission limits and/or the use of “best available” production technologies (Khanna, 2001).
While this approach of government endorsement has been successful in reducing the
environmental impacts of industrial activities (Press & Mazmanian, 2006), it has been criticized
because it does not promote source reduction. Instead, the traditional regulatory approach
emphasizes end-of-pipe pollution control, which imposes high pollution abatement costs on both
firms and regulators (Khanna, 2001).
Against this backdrop, many initiatives have emerged that encourage firms to self-
regulate environmental performance (Mazurek, 1998; Carraro & Leveque, 1999). In particular,
federal and state-level governments, industry associations and nonprofit organizations are
promoting the merits of firms adopting voluntary-based environmental management systems
(EMSs) (Coglianese & Nash, 2001; Khanna & Anton, 2002; Mazurek, 2002). For instance, the
U.S. Environmental Protection Agency (EPA) supports and promotes the development and use
of EMSs because they encourage the integration of a full range of environmental considerations
into an organization’s central mission, which can improve environmental performance (EPA,
2005).
However, questions exist about the effectiveness of firms’ efforts to self-regulate their
environmental impacts by way of EMSs. While some previous studies show that they have

3
promise (e.g., Arimura, Hibiki & Katayama, 2008, Potoski & Prakash 2005a, 2005b; Russo,
2002), others are less optimistic (Dahlstrom, Howes, Leinster, & Skea, 2003; King, Lenox &
Terlaak, 2005; Ziegler & Rennings, 2004). Moreover, these previous studies have generally
assessed the merits of ISO 14001-certified EMSs, which are EMSs that undergo third-party
audits to ensure conformance to an international EMS standard. However, most companies that
adopt an EMS do not seek ISO 14001 certification, and many other companies implement only
portions of an EMS.
Understanding how variations in EMS adoption are related to subsequent environmental
performance is important because government programs that encourage EMS adoption generally
do not require ISO 14001 certification, but endorse a more generic EMS. As such, evaluations of
ISO 14001-certified firms offer only a partial picture of the potential promise that EMSs hold for
policy practice.
Moreover, studies assessing EMS effectiveness generally have assessed changes to one
environmental medium (toxic releases) (King et al., 2005; Potoski & Prakash, 2005a) or the
extent to which EMSs help companies comply with environmental laws (Potoski & Prakash,
2005b). However, EMSs are integrated management systems that can affect numerous aspects of
a company’s environmental behavior that are designed to help companies move beyond mere
compliance with environmental laws. As such, assessing whether EMS adoption affects firms’
emissions related to one environmental medium or compliance may underestimate the potential
ability that these management systems may have for reducing firms’ overall environmental
impacts.
Finally, to our knowledge, previous studies examining the effects of ISO 14001
certification on firms’ environmental performance have assessed firm behavior within a single

4
country (e.g. Arimura et al., 2008, King et al., 2005; Potoski & Prakash 2005a, 2005b). Yet
EMSs are being adopted globally, and many governments are encouraging their use. An
international view of their potential for improving the environment therefore would be useful to
governments and business managers worldwide.
This paper addresses these issues by examining the broader landscape of EMS adoption
and its relationship with firms’ environmental performance. It assesses firms’ environmental
performance across five areas of environmental impacts— natural resource use, solid waste
generation, and discharge of wastewater effluent, local and regional air pollution, and global
pollutants. These relationships are examined for manufacturing facilities operating in Canada,
France, Germany, Hungary, Japan, Norway, and the United States, by drawing on survey data
collected by the Organisation for Economic Co-operation and Development (OECD) and using
estimation techniques that control for selection bias associated with the EMS adoption decision.
EMSs AND ENVIRONMENTAL PERFORMANCE
EMSs are systems of management processes that enable organizations to continually
reduce their impact to the natural environment. Most EMSs involve implementing a written
environmental policy, training employees regarding environmental concerns, employing internal
environmental audits, and developing environmental performance indicators and goals
(Netherwood, 1998). However, there often is variation in how these practices are utilized, in
large part, because EMSs arise in different organizational settings and organizations adhere to
different types of EMS standards (Coglianese & Nash, 2001). Other EMSs require facilities to
obtain external certification by independent third party auditors (Starkey, 1998). As a
consequence, the typical approach of asking facilities whether they have adopted an EMS fails to
account for the completeness of the EMS in that some facilities implement more of these

5
environmental practices than others (Darnall, Henriques & Sadorsky, 2008). In spite of these
variations, all EMSs are principally designed to improve the environmental performance of
organizations that adopt them.
EMSs and Environmental Performance
At the most basic level an EMS can help organizations ensure that their management
practices conform to environmental regulations. However, the EMS structure also encourages
facilities to prevent pollution by substituting unregulated for regulated inputs and by eliminating
some regulated processes altogether. As a result, some enterprises may no longer be subject to
some costly regulatory mandates. Further, EMSs assist enterprises to scrutinize their internal
operations, engage employees in environmental issues, continually monitor their progress, and
increase their knowledge about their operations. All of these actions also can help organizations
improve their internal operations, achieve greater efficiencies, and thus create opportunities to
improve their environmental performance by way of pollution prevention.
In other instances, EMSs have the potential to encourage organizations to adopt more
sophisticated environmental strategies that build on their basic pollution prevention principles.
For example, as part of their EMS, some enterprises may implement life cycle cost analysis and
assess their activities at each step of their value chain—from raw materials access to disposition
of used products (Allenby, 1991; Fiksel, 1993). These more advanced environmental strategies
leverage basic pollution prevention principles, but also extend them by integrating external
stakeholders into product design and development processes (Allenby, 1991). By using these
advanced strategies, organizations can eliminate environmentally hazardous production
processes, redesign existing product systems to reduce life cycle impacts, and develop new
products with lower life cycle costs (Hart, 1995). Such actions represent a significant departure

6
from basic pollution prevention principles because they offer a vehicle for organizations to
assess all aspects of their operations jointly, thus minimizing the shift of environmental harms
from one subsystem to another (Shrivastava, 1995). In the process, EMSs can assist the whole
organization in achieving greater organizational efficiency (Welford, 1992) and continual
environmental improvement. For these reasons, we hypothesize that facilities that adopt an EMS
are more likely to improve their environmental performance.
Hypothesis 1: Organizations that adopt an EMS (of any sort) are more likely to improve their
environmental performance.
However, as mentioned previously, not all EMSs are designed similarly, and these design
variations may be associated with differences in environmental outcomes. We anticipate that
organizations that seek certification of their EMSs have a greater level of commitment towards
the environment which is associated with greater environmental improvements. There are several
reasons for our position. The first relates to the institutional structure of certified EMSs. The
certification process is generally comprised of two stages. During the first stage, called the initial
assessment, the organization’s EMS documentation is reviewed by an independent auditor. The
auditor identifies a range of issues to examine further in the second stage of the audit (Morrison,
Cushing, Day, & Speir, 2000). The second-stage audit is performed on location. All non-
conformances with the standard are documented and brought to the attention of the organization,
and the audit team produces a report detailing the findings—conformances and non-
conformances—in addition to a recommendation for or against certification (Morrison et al.,
2000). Upon completion of the audit report, a member of the registrar organization (who did not
participate in the audit) independently reviews the report and makes a final decision on whether
to grant certification (Morrison et al., 2000). Over time, certified organizations are required to

7
demonstrate the continued functioning of their EMSs in order to maintain their certification. This
process helps organizations attend to their environmental concerns because they fear that
someone might expose their shortcomings (Rondinelli & Vastag, 2000). At the same time, third
party auditors are often more effective monitors than the organizations themselves (Rondinelli &
Vastag, 2000), which may lead to greater environmental performance outcomes than are
obtained from non-certified EMSs.
The second reason why we anticipate that organizations which certify their EMSs have a
greater likelihood of achieving greater environmental improvements relates to the fact that
certification can be costly. Certification requires significant documentation (taking up to two
years to produce), multiple environmental assessments and dozens of meetings between
managers, executives and employees beyond what is typically required by non-certified EMSs
(Darnall & Edwards, 2006). Actual costs of certification can range from $29 - $88 per employee,
beyond the cost of implementing a typical EMS, depending on the organization’s structure and
complexity (Darnall & Edwards, 2006). Organizations accrue these costs each time they re-
certify their EMS. Because of these costs, organizations that seek certification may have better
managerial support to maintain the system and achieve the EMS’ environmental goals.
Finally, organizations that certify their EMS are more likely to have enhanced visibility
for their environmental practices because certification lists are available through auditors and
online services. Because of this greater visibility, organizations may feel greater external
pressure to address environmental concerns that are important to external stakeholders. As such,
the scope of certified organizations’ proactive environmental efforts may be greater. Additionally,
organizations that certify their EMS may perceive they have greater external pressure to maintain
their certification. Such pressures derive from concerns related to forgoing certification once it

8
has been obtained. In such instances, these organizations may be vulnerable to greater unwanted
attention from critical stakeholders such as customers, regulators or environmental groups. In
order to avoid enhanced external scrutiny that may come with a failed certification, organizations
that implement a certified EMS have a greater incentive to meet their environmental goals.
For all these reasons, we hypothesize that organizations which adopt certified EMSs are
more likely to improve their environmental performance than organizations that adopt non-
certified EMSs.
Hypothesis 2. Organizations that adopt certified EMSs are more likely to improve their
environmental performance than organizations that adopt non-certified EMSs.
MOTIVATIONS FOR EMS ADOPTION
Before exploring the relationship between an organizations EMS adoption and its
environmental performance, it is necessary to consider whether organizations that adopt an EMS
do so because of factors that are correlated with environmental performance. If these correlations
exist, they must be addressed empirically.
Organizations whose industrial activities impact the natural environment are anticipated
to be motivated by varying degrees of perceived stakeholder influences to improve their likely
environmental performance. Stakeholders can be defined as ‘‘any group or individual who can
affect or is affected by the achievement of an organization’s objectives” (Freeman, 1984, p. 46).
In general, there are two groups of stakeholders that influence organizations: internal
and external stakeholders. Internal stakeholders include shareholders, management and non-
management employees (Waddock & Graves, 1997). These internal stakeholders, which include
parent companies, have a direct economic stake in the organization and are typically located
within the organization (Freeman, 1984). In contrast, external stakeholders have more limited

9
control of central organizational resources (Mitchell, Agle, & Wood, 1997; Sharma & Henriques,
2005). External stakeholder pressures originate from regulators and environmental interest
groups (Darnall et al., 2008). Each of these stakeholder pressures are discussed below.
Parent company pressures
Previous research has shown that influence from parent companies is a key determinant
to organizations adopting an EMS. Some parent companies may mandate that their operational
units adopt a certified EMS, while other parent companies may influence facility-level
environmental activities simply by encouraging EMS adoption in the absence of a corporate
mandate (Darnall, 2006). Given that EMS adoption requires organization-wide commitment and
incurs costs, which entail staff time, documentation, materials and equipment, training, and
environmental consultants (Kollman & Prakash, 2001), support and leadership from parent
company is anticipated to increase the likelihood that facilities adopt an EMS.
Regulatory Pressures
Other stakeholder pressures are derived from environmental regulators. For instance,
organizations must comply with environmental regulations or face the threat of regulators
levying legal action, penalties and fines (Henriques & Sadorsky, 1996). Failure to yield to
regulatory stakeholders leaves organizations vulnerable to individual or class action lawsuits.
Such threats, although infrequent, can be devastating to an organization’s public image, customer
relations and external legitimacy (Power, 1997). As a consequence, organizations may adopt
EMSs as one means to preempt these regulatory threats.
Other regulatory influences are less coercive and more incentive-based. For instance,
regulators are offering incentives to encourage organizations to adopt EMSs. Regulators’
rationale for providing these incentives is the belief that EMSs can prevent larger environmental

10
mishaps (Stafford, 2005). These incentives may encourage organizations to adopt an EMS.
In still other instances organizations yield to stakeholder influences from regulators in an
effort to maintain or improve their informal relationships (Stafford, 2005) and accrue political
capital. For example, by adopting an EMS, organizations may be able to form collaborative
relationships with government to more easily and explore more non-regulatory ways in which
government can encourage greater environmental improvements (Darnall et al., 2008). These
collaborations can promote environmental learning, capacity-building (Darnall & Edwards,
2006), and trust between organizations and regulators (Hoffman, 2000). A good reputation with
regulators also may give organizations greater political capital when negotiating with
government officials about the terms of forthcoming regulations.
Environmental group pressures
External stakeholders’ influences originating from the broader social context (Henriques
& Sadorsky, 1999; Power, 1997; Wilmshurst & Frost, 2000) may also encourage facilities to
adopt an EMS. Constituents in the social context include environmental groups (Hoffman, 2000)
that generally utilize indirect approaches to influence organizational behavior (Sharma &
Henriques, 2005). Such actions include public protests and calls for engagement. In particular,
increased public protests may be due to highly publicized stories of catastrophic environmental
disasters such as the Union Carbide toxic gas leak in Bhopal, and the Exxon Valdez oil spill,
which have personalized the importance of organizations’ environmental management activities
(Rajan, 2001). Further, environmental groups may publicize information that could persuade
consumers to favor the products of companies that have demonstrated a stronger regard for the
environment (Gould, Schnaiberg, & Weinberg, 1996). In other instances, they may encourage
consumers to boycott products of organizations and neutralize attempts that these organizations

11
may take to promote their environmentally proactive management practices.
RESEARCH METHODS
Data
To evaluate our hypotheses, we relied on a twelve-page survey data derived from the
OECD Environment Directorate and university researchers from Canada, France, Germany,
Hungary, Japan, Norway and the U.S. The OECD survey was pre-tested in France, Canada and
Japan before it was finalized. Prior to its dissemination, the survey was translated into each
country’s official language and validated for accuracy. The survey consisted of six major
sections. Each section gathered information about facilities’ environmental practices, their
environmental performance, stakeholders’ influences or motivations on environmental practices,
nature of environmental policy that affects each facility, facility characteristics, and firm
characteristics.
In 2003, surveys were sent to individuals who worked in manufacturing facilities having
at least 50 employees and who were responsible for the facility’s environmental activities. The
manufacturing sector was selected because it is commonly accepted that these industries produce
more air, land, and water pollution than service facilities (Stead & Stead, 1992). The OECD sent
two follow-up mailings to prompt additional responses. A total of 4,187 facility managers
completed the survey. The response rate was 24.7 percent which is similar to previous studies of
organizations’ environmental practices (e.g. Christmann, 2000; Delmas & Keller, 2005; Melnyk,
Sroufe & Calantone, 2003), where response rate were 20.1, 11.2 and 10.3 percent, respectively.
Almost half of the sample consisted of either small- or medium-sized enterprises (<250
employees).
Respondents were identified by relying on public databases within each country. For

12
instance, the Hungarian population was identified using data from the Hungarian Central
Statistical Office and the Canadian population was identified using Dun & Bradstreet data. In
France, Germany, Japan, Norway and the USA, the OECD surveyed the population of
manufacturing facilities with more than 50 employees. Because of resource constraints, the
OECD utilized random sampling of the same types of respondents to collect its data in Canada
and Hungary.
Previous research assessing environmental performance has been performed
predominantly using the U.S. EPA Toxic Release Inventory (TRI) emissions data (Anton et al,
2004, King et al., 2005, Potoski & Prakash, 2005a). TRI data are publicly available and contain
information of facilities’ releases of nearly 650 chemicals, which provide a good proxy measure
for a facility’s environmental impacts related to toxic chemicals. However, toxic releases offer
only a partial view of a facility’s overall environmental performance. Moreover, TRI data are not
collected in all countries, which make it difficult to evaluate the effectiveness of EMSs in an
international setting. In a similar way, previous studies that evaluate the relationship between
EMSs adoption and environmental performance have focused on certified EMSs (King et al.,
2005, Potoski & Prakash, 2005a; 2005b). By utilizing the OECD survey data, examines both
certified and uncertified EMSs across multiple environmental impacts.
To check for common method variance, we relied on the post-hoc Harman’s single-
factor test (Podsakoff & Organ, 1986). The basic assumption of this test is that if a substantial
amount of common method variance is present, a factor analysis of all the data will result in a
single factor accounting for the majority of the covariance in the independent and dependent
variables. The results of Harman’s single-factor test revealed that no single factor accounted for
the majority of the variance in the variables, offering evidence that this type bias was not a

13
concern. Social desirability bias was addressed by ensuring anonymity for all respondents. We
also found no evidence that respondents always over or under reported data in a consistent
manner since there were wide variations in facility responses. The OECD examined non-
response bias by evaluating the general distribution of its survey respondents. It assessed the
industry representation and facility size of the survey sample relative to the distribution of
facilities in the broader population, and found no statistically significant differences (Johnstone,
et al., 2007). Issues related to generalizability were less of a concern because the OECD survey
had broad applicability in that it targeted large and small operations across multiple industry
sectors and countries.
Measures for Environmental Performance Equation
Dependent Variables. A facility’s environmental performance may be influenced both
by the use of natural resources (e.g., energy and water) and by the facilities’ output levels to
environmental medium (i.e., air, water, land). Environmental performance was measured using
the OECD survey question which asked: “Has your facility experienced a change in the
environmental impacts per unit of output of production processes in the last three years with
respect to the following areas of impact?” We assessed five environmental impacts: (1) natural
resource use, (2) wastewater effluent, (3) solid waste generation; (4) local or regional air
pollutants, and (5) global pollutants (e.g., greenhouse gases). Facility mangers replied using a
five-point scale indicating whether their impacts had “decreased significantly,” “decreased,”
incurred “no change,” “increased,” or “increased significantly” per unit of output. To concentrate
the analysis on whether or not environmental impacts had decreased per unit of output, we
recoded environmental performance into a binary variable by combining the first two categories
and the last three (1=significant decrease or decrease, 0=no change, increase or insignificant

14
increase).
Independent Variables. To construct EMS adoption measures, we categorized EMSs in
three ways: self-designated, complete, and certified EMSs. Self-designated and complete EMSs
are both uncertified EMSs. The former was constructed by relying on an OECD survey question
which asked, “Has your facility actually implemented an environmental management system?”
Responses were coded 1 (=Yes) or 0 (=No).
To respond to concerns that a facility may claim to have an EMS when it only has
portions of one, we considered the completeness of facilities’ EMSs. The completeness of a
facility’s EMS is an unobserved quality (Darnall et al., 2008). However, it can be measured by
examining a facility’s diverse environmental practices (Khanna & Anton, 2002). To develop our
second EMS measure, complete EMS, we relied on OECD survey data that asked facility
managers whether they had implemented four different environmental practices that have been
recognized as core components of different types of EMSs: written environmental policy,
environmental training program in place for employees, internal environmental audits
(Netherwood, 1998), and environmental performance indicators/goals (Coglianese & Nash,
2001). Facilities responded by indicating 1 (=Yes) or 0 (=No). In instances where facilities had
implemented all four practices, we considered it to have a complete EMS. To address concerns
that facilities which adopt certified EMSs may also have a complete EMS, we eliminated these
facilities from this variable grouping.
To construct our third measure, certified EMS, we relied on OECD survey data that asked
facility mangers whether or not their facilities’ EMS was certified to ISO 14001, the
international EMS standard. Responses were also coded 1 (=Yes) or 0 (=No). To address
concerns that facilities which adopt a self-designated EMS or a complete (but uncertified) EMS

15
may be included in the “No” grouping, we eliminated these facilities from this comparison.
Control Variables. Regulated facilities often report that the stringency of the
environmental regulatory system is a primary motivator for their proactive environmental
activities (Darnall, 2009). Facilities were asked to describe the environmental policy regime to
which they were subject. Respondents indicated whether the environmental policy regime was
“not particularly stringent in that obligations can be met with relative ease,” “moderately
stringent in that it requires some managerial and technological responses,” or “very stringent in
that it has a great deal of influence on decision-making within the facility.” Responses were
coded 1, 2 and 3, respectively. “Moderately stringent” and “very stringent” were then combined
to account for whether facilities reported the regulatory system was “stringent” or not.
To address the potential concern that this variable might be based on managerial
perception rather than actual regulatory stringency, we compared the responses of facilities in
more polluting industrial sectors to those operating in cleaner industrial sectors. Polluting
industries are more heavily regulated and therefore subject to a more stringent environmental
policy regime, whereas less polluting industries are not regulated to the same extent and subject
to a less stringent environmental policy regime. Relying on existing taxonomies of US
manufacturing sectors (Mani & Wheeler, 1997; Gallagher & Ackerman, 2000), “polluting”
industries were classified as pulp and paper, chemical, petroleum refining, primary metal and
basic metal industries. “Clean” sectors consisted of fabricated metal products, industrial
machinery, electronics, transportation equipment, instrumentation, and textile sectors. We
performed a chi-square test, comparing sector groupings with the reported stringency of their
environmental policy regime. The results showed that dirty sectors reported that the stringency of
their environmental policy regime was greater than facilities operating in clean sectors (p<.0001),

16
therefore adding confidence to the accuracy of our measure.
The natural logarithm of the number of employees in a facility was used as a measure of
facility size. Dummy variables were included to control for industry effects and country effects.
The chemical sector was the omitted sector dummy and the U.S. was the omitted country dummy
variable.
Measures for Environmental Adoption Equation
The relationship between EMS adoption and environmental performance is subject to
selection bias in that firms will “self-select” into voluntary adoption of EMS because of observed
or unobserved characteristics that are correlated with their environmental performance. To
address this potential problem, we accounted for the factors that might affect facilities’ decisions
to adopt a facility adopted a self-designated, complete, or ISO 14001-certified EMS. We utilized
the same form of these six environmental performance measures that was described earlier in our
discussion related to Measures for Environmental Performance Equation.
Instrumental Variable. Some local governments encourage facilities to adopt EMS by
financially supporting the adoption of EMSs (Arimura et al., 2008). If an EMS is adopted,
governments often reduce the frequency of regulatory inspections. Hence, these initiatives are
expected to have direct effects on the adoption of EMS. However, programs do not request
improvement in environmental impacts. Following Arimura, Hibiki & Katayama (2008) we
therefore assume that “assistance program by local government” does not directly affect
environmental performance. In the OECD survey data, managers were asked whether the local
regulatory authorities have programs and policies in place to encourage their facility to use an
EMS. Responses were coded as binary (1=Yes, 0=No).
Independent variables. Parent company influences on facilities’ environmental practices
17
were accounted for by using OECD survey data that asked facility managers how important they
considered the influence of corporate headquarters on the environmental practices of their
facility (Darnall, 2006). Facility managers reported that these influences were “not applicable or
not important,” “moderately important,” or “very important.” These influences were coded 1, 2,
and 3, respectively.
In estimating the impact of regulatory stringency on EMS adoption, we relied on the
same OECD variable discussed earlier, which asked environmental managers to describe the
environmental policy regime to which they were subject. Responses were coded as binary
(1=stringent, 0=not stringent,). To account for the pressure from environmental interest groups,
the OECD asked facility managers how important they consider the influence of environmental
groups on the environmental practices of their facility (Darnall, 2006). Responses were coded on
three point scales (1=not important, 2=moderately important, and 3=very important).
Control Variables. Previous research suggests that adopting an EMS has the potential
to enhance an organization’s environment-friendly image (Bansal & Hunter, 2003). Facilities
operating in a competitive or global market are more likely to adopt EMSs in order to be
recognized as being green or environment-friendly. Likewise, publicly traded or multinational
organizations that are more sensitive to brand image are more likely to encourage their facilities
to adopt EMSs. For these reasons, we included a set of dummies to account for market scope,
market concentration, whether a facility’s parent company are publicly traded, and whether a
firm’s head office is in a foreign country. Finally, additional facility heterogeneities were
controlled using industry, country dummies, and facility size (logged number of employees).
Table 1 describes the distribution of all explanatory variables included in both EMS
adoption and environmental performance equations.

18
Analytic Method
The relationship between EMS adoption and environmental performance was analyzed
using bivariate probit estimation which belongs to the general class of simultaneous equation
models as the Heckman selection model (Baum, 2006). While both Heckman selection and
bivariate probit models can control for self selection, bivariate probit was chosen because
facilities’ decision to adopt an EMS is a binary endogenous variable and our measures for
environmental performance were not continuous.
In a bivariate probit model, there are two probability equations (Maddala, 1983); a first
reduced form equation for the potentially endogenous dummy (1) and a second structural form
equation determining the outcome of interest (2),
Y1* = b1 X1i + u1 (1)
Y2* = b2 X2i + u2= δ1Y1+δ2Z2+u2 (2)
where Y1, Y2 are observed as 1 if their latent variables Y1*, Y2
* are positive and zero otherwise.
(Y1=0 if Y1* ≤0, Y1=1 if Y1
* > 0, Y2=0 if Y2* ≤0, Y2=1 if Y2
* > 0). In the equations, X1 and Z2
are vectors of exogenous variables, b1and δ2 are parameter vectors, δ1 is a scalar parameter, b2 =
(δ1, δ2), and the error terms (u1, u2) are identically distributed as bivariate normal with zero mean,
unit variance and correlation coefficient ρ.
As the random error terms (u1, u2) are assumed to be correlated, a correlation of
equations’ disturbance plays an important role in the bivariate probit model.
ρ = Cov (u1, u2 ) ≠ 0
That is, the covariance of (u1, ue2) equals a constant rather than zero, as is assumed in the
case of the individual probit models2. Therefore, if ρ ≠ 0, the two probit equations can be jointly
2 The statistical test for ρ=0 provides an indication of the interdependence of the two equations.

19
determined and coefficients will be estimated in a two-stage process in which the second
equation is observed conditional on the outcome of the first. In this study, the correlation of the
error terms may be likely in that unobserved factors that caused facilities to adopt EMSs are
likely to influence their environmental performance.
To account for the selection bias associated with EMS adoption, we needed to add at
least an exogenous instrument (X1), which was correlated with the first equation (estimating
EMS adoption) but is not correlated with second equation (estimating EMS performance). The
variable we used was whether or not EMS adoption assistance programs were offered by local
governments since it is not directly related to environmental performance (Arimura et al., 2008),
as described earlier. This variable was not included in our second stage environmental
performance equation. In the absence of controlling for endogeneity, a simple probit model
examining the relationship between EMS adoption and environmental performance will yield
estimates that potentially overestimate our relationships of interest (Monfardini & Radice, 2008).
We developed fifteen bivariate probit model specifications that estimated the relationship
between our three types of EMSs and five different environmental performance variables. Model
significance in bivariate probit estimation was determined by evaluating the Wald chi-square
values for each of the models.
RESULTS
Environmental Performance Equations
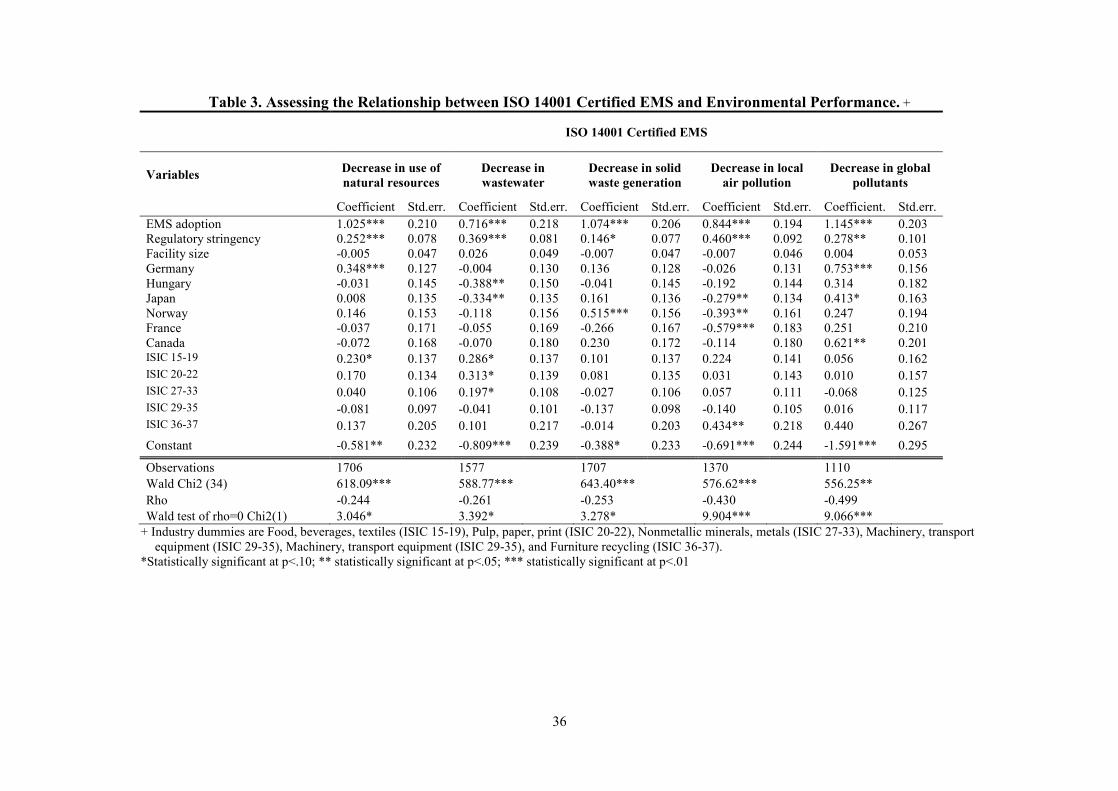
Table 2 and Table 3 present estimated coefficients of the environmental performance
equations. The Wald chi-square statistics were significant at p<.01 across all models. In
examining the model coefficients, the results show that both complete and ISO-14001 certified
EMS adoption were associated with increased environmental performance (p<.01). Facilities that
20
adopted a self-identified EMS showed positive relationships with decreased environmental
impacts in natural resource use, solid waste generation, air pollution, and global pollutants
(p<0.1-1.0). These findings offer evidence in support of hypothesis 1, suggesting that facilities
that have any type of EMS is more likely to decrease all five types of environmental impacts.
-INSERT TABLE 2 & 3 ABOUT HERE-
Our results also show that holding other variables constant, regulatory stringency was
positively related with environmental performance (p<.01- .10), in 12 of our 15 models. These
findings suggest that facilities which reported that their environmental policy regime is stringent
are more likely to decrease their environmental impacts.
Facility size had no significant effect on reductions in environmental impacts across all
models. Related to the country dummies, the results were very varied. In case of ISO-14001
certification, the U.S. facilities were more likely to reduce their environmental impacts on local
air pollution than Japanese, Norwegian and French facilities (p <.01-.05), whereas the U.S.
facilities were less likely to decrease their environmental impacts on natural resource use and
global pollutants than German facilities (p<.01).
To further investigate the differential effect of EMS adoption on reductions in
environmental impact, we examined the marginal effects of complete and ISO 14001-certified
EMSs (Table 4). Marginal effects were estimated using bivariate probit post-estimation tools. In
estimating the effects of ISO 14001-certified EMS on environmental performance, we observed
varying effects (from 0.267-0.396) of ISO 14001 certification on five different types of
environmental impacts. The adoption of ISO 14001 is associated with a 39.6% increased
predicted probability of reducing global air pollutants compared to EMS non-adopters; and a
26.7% increased predicted probability of decreasing wastewater effluent. Similarly, facilities that

21
adopted complete EMS increased the predicted probability of reducing their environmental
impacts by 26.9% to 40.8%.
In comparing the marginal effects of certified and complete EMSs, the key finding is
that ISO 14001 showed a relatively greater association with decreases in natural resource use,
while a complete EMS showed a greater association with reductions in local air pollution than
ISO 14001. In other words, facilities that adopted ISO 14001-certified EMSs were associated
with a 5.3% (0.374 minus 0.321) greater reduction in natural resource use over facilities that
adopted complete EMSs. However, a complete EMS was associated with an 8.2% (0.391 minus
0.309) greater reduction in local air pollutants. For other environmental impacts (wastewater
effluent, solid waste generation, and global air pollutants), facilities that adopted complete and
ISO 14001-certified EMS behaved similarly. As such, these results offer little evidence in
support of hypothesis 2, which states that facilities with certified EMSs are more likely to
improve their environmental performance rather than facilities with uncertified EMSs.
EMS Adoption Equations
Estimated coefficients of the adoption equations are presented in Table 5 for uncertified
EMS and Table 6 for certified EMS. Across all models, assistance programs by local regulatory
authorities appear to promote both certified and uncertified EMS adoption as indicated by the
positive and significant coefficients (p<.01). These results illustrate that local government
assistance programs satisfy a condition as a relevant instrument3 in which an exogenous
instrument should be strongly correlated with an endogenous variable. These results also suggest
that there is an indirect effect of assistance programs on facilities’ environmental performance
3 As excluded instruments (Z) are used to consistently estimate an impact of an endogenous variable XT on Y (in Y= b0 + bTXT+ bcXC + e), they should satisfy two assumptions: (1) excluded instruments are uncorrelated with the error term (e), but strongly correlated with endogenous variable XT. If there is more than one instrument for an endogenous variable, it can be statistically tested by over-identification test (Nichols, 2007).

22
and assistance programs are valid as an environmental policy tool.
-INSERT TABLE 5 & 6 ABOUT HERE-
The results further show that parent company pressures were highly associated with
facilities’ EMS adoption, indicating that facilities which reported their parent companies had a
greater degree of influence on their environmental practices were more likely to adopt EMSs
(p<.01). Related to regulatory stringency, the results were varied depending on the type of EMS
that facilities adopted. Regulatory stringency had a very strong positive relationship with
facilities’ decision to complete EMSs (p<.01), whereas a stringent regulatory regime had a
relatively weak (p<0.5-.10) or no relationship with facilities’ decisions to certify ISO 14001 or to
adopt self-identified EMSs. There was no statistical significance between environmental group
pressures and facilities’ decision to adopt all types of EMSs.
Related to our control variables, facility size was associated with facilities’ EMS
adoption and ISO 14001 certification (p<.01). Market scope at the global level was associated
with the adoption of a complete EMS and ISO 14001-certification (p<.01), as was the presence
of a parent company characteristics (p<.01), and whether or not the facility was part of a publicly
traded firm (p<.01-.05, respectively).
Related to our country dummy variables, the U.S. facilities were more likely to adopt
complete EMSs than facilities in France, German, Canada, Hungary, Japan, and Norway (p<0.1-
1.0) and, Japanese facilities are more likely to certify ISO 14001 than the U.S. facilities (p<0.1).
DISCUSSION AND CONCLUSIONS
This study evaluates the effects of EMS adoption on environmental performance. It
shows that multiple types of EMSs—self-designated, complete, and ISO 14001-certified—are
associated with facilities’ reductions in environmental impacts related to their natural resource
23
uses, solid waste generation, wastewater effluent, local air pollution, and global air pollutants.
The findings exist even after controlling for selection biases associated with EMS adoption
decisions.
These findings are important because they offer a broader understanding of the potential
EMSs in achieving societal objectives for a cleaner environment. They also extend previous
studies that have evaluated the effects of EMSs (King et al., 2005; Potoski & Prakash, 2005a;
2005b) by assessing a range of environmental impacts and multiple types of EMSs (Arimura et
al., 2008; Dahlstrom et al., 2003; King et al., 2005; Potoski & Prakash, 2005a; 2005b). Since our
findings showed that all three EMSs are related to reductions in a variety of environmental
impacts, this study offers support for the idea that EMSs may be important voluntary governance
options.
However, our findings underscore the need for careful interpretation, since regulatory
stringency was also directly associated with facilities’ environmental performance. That is, in the
absence of traditional regulatory pressures, it seems uncertain whether facilities will be
motivated to adopt an EMS (of any sort). These findings have important implications to public
policy. Environmental regulation is predicated on market failure theory. Under this view, price
signals in prevailing markets do not capture the full cost that stems from the production of a
good, but rather some of the production costs are imposed on society at large. Regulation is an
attempt to reduce pollution in that it creates incentives by imposing costs on facilities that pollute.
However, political forces consistently push to reduce the stringency of environmental regulations.
This research offers reason to pause in response to these pressures since regulatory stringency is
an important factor associated with facility-level actions to improve environmental performance.
These findings also support conventional arguments that market failures can be remedied

24
through the use of coercive regulation. However, some coercive regulations impose more
transaction costs on firms than others, and less costly regulations may be equally (or more)
effective at delivering equivalent environmental value. For instance, reflexive regulatory systems
create incentives and procedures that induce organizations to assess their actions (hence the
reflexivity) and adjust them to achieve socially desirable goals, rather than relying on coercive
rules and laws (Fiorino, 2006). Therefore, some reflexive policies and programs, like those that
encourage EMS adoption, may achieve equivalent environmental outcomes and allow
organizations to benefit financially from their green production activities. Future research should
study this issue to a greater degree.
This research contributes to our understanding of different types of EMSs and
relationship towards improved environmental performance. By comparing the marginal effects
among a variety of EMSs—self-designated, complete, and certified—we found that externally
accredited EMSs are not always related to greater environmental performance in all aspects of
the environment. We conjectured that EMSs with external certification would be more likely to
improve environmental performance because of their institutional structure. Our findings show
facilities having ISO 14001 EMSs are more likely to reduce the impact of natural resource uses
than facilities with complete EMSs by 5.3%. However, facilities that adopted complete EMSs are
more likely to decrease impact in local or regional air pollution than facilities having ISO 14001
by 8.2%. Facilities that adopted complete and ISO 14001-certified EMS behaved similarly in
regards to their reductions in wastewater effluent, solid waste generation, and global air
pollutants. These mixed findings offer insufficient support our proposition that EMSs with
greater external credibility are associated with greater reductions in environmental impacts. They
suggest that facilities may not need to certify their EMSs to derive environmental performance

25
benefits inasmuch as they implement a written environmental policy, environmental training
program, internal audits, and environmental performance indicators/goals. Governments that
have developed programs that encourage facilities to adopt non-certified EMSs may therefore
have greater confidence in their approach in that these EMSs and certified EMSs are related to
environmental improvements in a similar way.
Alternatively, our findings may suggest that the institutional structure of ISO 14001 is not
strong enough to lead to superior environmental gains. For instance, third party auditors do not
make available their audit results or specific information about an organization’s environmental
objectives, targets and goals public. Rather, it is the responsibility of the certified organization to
make audit information publicly accessible, which rarely occurs. Moreover, facilities that certify
to ISO 14001 also rarely lose their certification and lists of facilities that do are not published.
These features diminish the institutional strength of the EMS standard and potentially are related
to our weaker findings.
This research also contributes to public policy scholarship by offering evidence that EMS
adoption is strongly related to local governments’ EMS assistance programs. Such programs
include government-funded grants and technical assistance (Darnall, 2003). For instance, in the
U.S., the Environmental Protection Agency (EPA), in partnership with state-level environmental
agencies, has encouraged facilities to adopt EMSs by offering EMS support grants and staff-
sponsored technical assistance (USEPA, 2001). These programs may be particularly useful at
encouraging EMS adoption in facilities that have limited complementary resources and
capabilities, such as prior experiences with pollution prevention or quality management systems
(Darnall, 2006).
Future research would benefit from studying our relationships of interest using

26
secondary data. Such an examination most likely would need to take place for facilities within a
single country since environmental ministries use different metrics and indicators to assess
environmental performance, which makes a cross-country evaluation problematic.
In sum, this research offers evidence of the relationship between EMS adoption and
environmental performance. It takes an important step by considering this issue across multiple
countries as well as by assessing the extent to which EMSs are related to numerous types of
environmental impacts. Our findings show that self-designated, complete and ISO 14001-
certified EMS are all related to reductions in use of natural resources, solid waste, wastewater
effluent, local air pollution, and global air pollutants, controlling for facilities decisions to adopt
EMSs. However, there is limited evidence for the notion that ISO 14001-certified EMSs lead to
superior environmental improvements over other types of EMSs.

27
References
Allenby, B. (1991). Design for environment: a tool whose time has come. SSA Journal,
September, 5–9.
Anton, W.Q., Deltas, G., & Khanna, M., (2004). Incentives for environmental self regulation and
implications for environmental performance. Journal of Environmental Economics and
Management, 48 (1), 632-654.
Arimura, T.H., Hibiki, A., & Katayama, H. (2008). Is a voluntary approach an effective
environmental policy instrument? A case for environmental management systems. Journal
of Environmental Economics and Management, 55, 281-295
Bansal, P., & Hunter, T. (2003). Strategic explanations for the early adoption of ISO 14001.
Journal of Business Ethics, 46 (3), 289-99.
Bansal, P., & Roth, K. (2000). Why companies go green: a model of ecological responsiveness.
Academy of Management Journal, 43(4), 717-736.
Baum, C.F. (2006). An introduction to modern econometrics using stata. College Station, TX:
Stata press.
Carraro, C., & Leveque, F. (1999). Voluntary approaches in environmental policy, Dordrecht:
Kluwer Academic Publishers.
Christmann, P. (2000). Effects of ‘best practices’ of environmental management on cost
competitiveness: The role of complementary assets. Academy of Management Journal, 43,
663-880.
Coglianese, C., & Nash, J. (2001). Environmental management system and the new policy
agenda, In C. Coglianese, & J. Nash (Eds.), Regulation from the inside: Can environmental
management system achieve policy goals (pp.1-25). Washington, DC: Resources for the
28
Future.
Dahlstrom, K., Howes, C., Leinster, O, & Skea, J. (2003). Environmental management systems
and company performance: assessing the case for extending risk-based regulation.
European Environment, 13, 187-203.
Darnall, N. (2003). Motivations for participating in a voluntary environmental initiative: the
Multi-state Working Group and EPA’s EMS pilot program. In S. Sharma, & M. Starik
(Eds.), Research in Corporate Sustainability (pp. 123–154), Boston, MA: Edward Elgar.
Darnall, N. (2006). Why firms mandate ISO 14001 certification. Business & Society 45: 354-381.
Darnall, N., & Edwards D. (2006). Predicting the cost of environmental management system
adoption: The role of capabilities, resources, and ownership structure. Strategic
Management Journal, 27, 301–320.
Darnall, N., Henriques, I., & Sadorsky, P. (2008). Do environmental management systems
improve business performance in an international setting? Journal of International
Management, 14, 364-376.
Darnall, N. (2009). Environmental regulations, green production offsets and organizations’
financial performance. Public Administration Review, 69, 418-434.
Delmas, M., & Keller, A. (2005). Free riding in voluntary environmental programs: The case of
the U.S. EPA Wastewise program, Policy Sciences, 38, 91-106.
Fiksel, J. (1993). Design for environment: the new quality imperative. Corporate Environmental
Strategy, 1, 49–55.
Fiorino, D.J. (2006). The new environmental regulation. Cambridge, MA: MIT Press.
Freeman, R.E. (1984). Strategic management: a stakeholder approach. Boston, MA: Pitman.
Gallagher, K.P., & Ackerman, F. (2000). Trade liberalization and pollution intensive industry in

29
developing countries: A partial equilibrium approach. In The environmental assessment of
trade liberalization agreements. Paris: OECD.
Gould, K.A., Schnaiberg, A., & Weinberg, A.S. (1996). Local Environmental Struggles: Citizens
activism in the treadmill of production, Cambridge, MA: Cambridge University Press.
Hart, S. (1995). A natural-resource-based view of the firm. Academy of Management Review, 20,
986–1014.
Henriques, I., & Sadorsky, P., (1996). The determinants of an environmentally responsive firm:
An empirical study, Journal of Environmental Economics and Management, 30, 381-395
Hibiki, A., & Arimura, T.H. (2004). Environmental policies and firm-level management
practices in Japan. OECD Working Paper, Retrieved from
http://www.oecd.org/dataoecd/22/29/31650143.pdf.
Hoffman, A. (1997). From heresy to dogma: An institutional history of corporate
environmentalism. San Francisco: New Lexington Press.
Hoffman, A. (2000). Competitive environmental strategy: A guide to the changing business
landscape. Washington, DC: Island Press
Johnstone, N., Serravalle, C., Scapecchi, P., & Labonne, J. (2007). Project background, overview
of the data and summary results. In N. Johnstone (Ed.), Environmental policy and
corporate behavior (pp. 1-33). Northampton, MA: Edward Elgar Publishing, in association
with Organisation for Economic Co-Operation and Development (OECD).
Kennedy, P. (2003). A Guide to econometrics. Cambridge, MA: MIT Press.
Khanna, M. (2001). Non-mandatory approaches to environmental protection. Journal of
Economic Surveys, 15(3), 291-324.
Khanna M., & Anton W.R.Q. (2002). Corporate environmental management: Regulatory and
30
market-based incentives, Land Economics, 78, 539-558.
King, A., Lenox, M., & Terlaak, A. (2005). The strategic use of decentralized institutions:
Exploring certification with the ISO 14001 management standard. Academy of
Management Journal, 48, 1091-1106.
Kollman, K., & Prakash, A. (2001). Green by choice? Cross-national variations in firms’
responses to EMS-based environmental regimes. World Politics, 53, 399-430.
Maddala, G.S. (1983). Limited dependent and qualitative variables in econometrics, Cambridge,
MA: Cambridge University Press.
Mani, M., & Wheeler, D. (1997). In search of pollution havens? Dirty industry migration in the
world economy. World Bank, Working Paper, No. 16. Washington, DC: World Bank.
Mazurek, J. (1998). The use of unilateral agreements in the United States: The responsible care
initiative. ENV/EPOC/ GEEI (98) 25/ /Final, Paris: OECD.
Mazurek, J. (2002), Government sponsored voluntary programs for firms: An initial survey. In
Dietz T., Stern, P.C. (Eds.), New tools for environmental protection: Education,
information and voluntary measures, Washington, DC: National Academy Press.
Melnyk, S.A., Sroufe, R.P., & Calantone R.L. (2003). Assessing the impact of environmental
management systems on corporate and environmental performance, Journal of Operations
Management, 21, 329-351.
Mitchell, R.K., Agle, B.R., & Wood, D.J. (1997). Toward a theory of stakeholder identification
and salience: Defining the principle of who and what really counts. Academy of
Management Review, 22, 853-886.
Monfardini C., & Radice, R. (2008). Testing exogeneity in the bivariate probit model: A Monte
Carlo study. Oxford Bulletin of Economics and Statistics, 70(2), 271-282.

31
Morrison J., Cushing K., Day Z., & Speir, J. (2000). Managing a better environment:
Opportunities and obstacles for ISO 14001. In Public Policy and Commerce. Oakland, CA:
Pacific Institute for Studies in Development, Environment and Security.
Netherwood, A. (1998). Environmental management systems. In Corporate environmental
management (Vol.1) (pp. 35–58), Earthscan: London.
Nichols, A. (2007). Causal inference with observational data. Stata Journal 7(4): 507-541.
Podsakoff, P.M., & Organ, D.W. (1986). Self-reports in organizational research. Journal of
Management, 12, 531-544.
Potoski, M., & Prakash, A. (2005a). Covenants with weak swords: ISO 14001 and facilities'
environmental performance. Journal of Policy Analysis and Management, 24, 745-769.
Potoski, M., & Prakash, A. (2005b). Green clubs and voluntary governance: ISO 14001 and
firms' regulatory compliance. American Journal of Political Science, 49, 235-248.
Power, M. (1997). The audit society: rituals of verification. London: Oxford University Press.
Press, D., & Mazmanian, D.A., (2006). The greening industry: Combining government
regulation and voluntary strategies. In N.J. Vig & M.E. Kraft (Eds.), Environmental policy:
New directions for the twenty-first century (pp. 264-287), Washington DC: CQ Press.
Rajan, S.R., (2001). What Disasters tell us about environmental violence: the Bhopal gas
disaster? In M. Watts & N. Peluso (Eds.), Violent Environments, Ithaca: Cornell University
Press.
Rondinelli, D., & Vastag, G. (2000). Panacea, common sense, or just a label? The value of ISO
14001 environmental management systems. European Management Journal, 16(5), 499-
510.
Russo, M.V. (2002). Institutional change and theories of organizational strategy: ISO 14001 and

32
toxic emissions in the electronics industry, In D. Nagao (Ed.), Academy of Management
Best Papers Proceedings (pp. PA1-6), Denver: Academy of Management.
Sharma, S., & Henriques, I. (2005). Stakeholder influences on sustainability practices in the
Canadian forest products industry. Strategic Management Journal, 26, 159-180.
Shrivastava, P. (1995). Ecocentric management for a risk society. Academy of Management
Review, 20, 118–137.
Stafford, S.L. (2005). Does self-policing help the environment? EPA’s audit policy and
hazardous waste compliance. Vermont Journal of Environmental Law 6, Retrieved from
http://www.vjel.org/articles/articles/Stafford11FIN.htm.
Starkey, R. (1998). The standardization of environmental management systems: ISO 14001, ISO
14004 and EMAS. In R. Welford (Ed.), Corporate environmental management (Vol. 1)
(pp.61–89), London: Earthscan.
Stead, W.E., & Stead, J. (1992). Management for a small planet. Newbury Park: Sage
Publications,
U.S. Environmental Protection Agency. (2001). Action plan for promoting the use of
environmental management systems. Washington, DC: US EPA.
U.S. Environmental Protection Agency. (2005). United States Environmental Protection Agency
position statement on Environmental Management Systems (EMSs), December 13,
http://www.epa.gov/EMS/docs/positionstatement-20051215.pdf, last accessed May 15,
2009.
Waddock, S.A., & Graves, S.B. (1997). Finding the link between stakeholder relations and
quality of management. Journal of Investing, 6, 20-24.
Welford, R. (ed.). (1998). Corporate environmental management (Vol 1). London: Earthscan.

33
Wilmshurst, T.D., & Frost, G.R., (2000). Corporate environmental reporting: A test of
legitimacy theory. Accounting, Auditing and Accountability Journal, 13, 10-26.
Ziegler, A., & Rennings K. (2004). Determinants of environmental innovations in Germany: do
organizational measures matter? A discrete choice Analysis at the Firm level, ZEW (Center
for European Economic Research) Discussion Paper No.04-30, Mannheim, Germany:
ZEW.

34
Table 1. Descriptive statistics for explanatory variables. Variable Mean Standard Min Max Complete EMS adoption 0.277 0.448 0 1 Self-identified EMS adoption 0.295 0.456 0 1 ISO 14001 certification 0.341 0.474 0 1 Assistance programs by local governments 0.211 0.408 0 1 Regulatory stringency 0.622 0.485 0 1 Parent company pressure 2.347 0.694 1 3 Environmental interest group pressure 1.714 0.700 1 3 Market scope 0.499 0.500 0 1 Market concentration 0.729 0.445 0 1 Number of employees (Log) 5.106 1.047 0.693 10.262 Publicly traded 0.167 0.373 0 1 Firm's head office is in a foreign country 0.120 0.325 0 1 Food, beverage, textiles (ISIC15-19) 0.151 0.358 0 1 Pulp, paper, publishing, print (ISIC 20-22) 0.105 0.306 0 1 Nonmetallic minerals, metals (ISIC27-33) 0.236 0.424 0 1 Machinery, transport equip. (ISIC 29-35) 0.310 0.463 0 1 Furniture recycling (ISIC 36-37) 0.032 0.176 0 1 U.S. 0.117 0.321 0 1 Germany 0.215 0.411 0 1 Hungary 0.111 0.315 0 1 Japan 0.358 0.479 0 1 Norway 0.074 0.262 0 1 France 0.064 0.245 0 1 Canada 0.061 0.240 0 1

35
Table 2. Assessing the Relationship between Complete and Self-identified EMSs… and Environmental Performance
… Complete EMS denotes that facility has implemented four practices that have been recognized as important components of different types of EMSs: written environmental policy, environmental training program in place for employees, internal environmental audits (Netherwood, 1998), and environmental performance indicators/goals (Coglianese & Nash, 2001). Self-identified EMS indicates that facility indicates that it has adopted an EMS that may or may not include all four components of a comprehensive EMS.
… … Industry dummies are Food, beverages, textiles (ISIC 15-19), Pulp, paper, print (ISIC 20-22), Nonmetallic minerals, metals (ISIC 27-33), Machinery, transport equipment (ISIC 29-35), Machinery, transport equipment (ISIC 29-35), and Furniture recycling (ISIC 36-37).
*Statistically significant at p<.10; ** statistically significant at p<.05; *** statistically significant at p<.01
Complete EMS Self-identified EMS Variables Decrease in
use of natural resources
Decrease in wastewater
Decrease in solid waste generation
Decrease in local air pollution
Decrease in global
pollutants
Decrease in use of natural
resources
Decrease in wastewater
Decrease in solid waste generation
Decrease in local air pollution
Decrease in global
pollutants Coef. Std.err. Coef. Std.er
rCoef. Std.er
r.Coef. Std.er
r.Coef.Std.err. Coef. Std.er
r. Coef. Std.er
r. Coef. Std.er
r. Coef. Std.er
r Coef. Std.e
rr. EMS adoption 0.863*** 0.228 0.710*** 0.239 1.157*** 0.210 1.052*** 0.186 1.082*** 0.222 0.946*** 0.276 0.511 0.364 1.140*** 0.236 1.047*** 0.281 0.689* 0.412 Regulatory stringency 0.211*** 0.074 0.354*** 0.077 0.071 0.072 0.324*** 0.086 0.114 0.094 0.257*** 0.086 0.486*** 0.091 0.088 0.081 0.379*** 0.102 0.284** 0.117
Facility size 0.054 0.039 0.05 0.042 0.022 0.039 0.016 0.037 0.051 0.044 0.037 0.042 0.055 0.045 -0.005 0.040 0.057 0.046 0.058 0.054
Germany 0.481*** 0.094 0.112 0.099 0.184 0.095 0.150 0.098 0.509*** 0.110 0.674*** 0.156 0.134 0.198 0.343** 0.158 0.510*** 0.170 0.593*** 0.208
Hungary 0.223* 0.126 -0.181 0.137 0.202 0.125 0.105 0.123 0.144 0.154 0.325* 0.183 -0.227 0.219 0.215 0.178 0.397** 0.192 0.003 0.242
Japan 0.431*** 0.104 0.009 0.113 0.468*** 0.103 0.158 0.106 0.486*** 0.114 0.132 0.145 -0.149 0.169 0.026 0.145 0.144 0.157 0.005 0.185
Norway 0.351*** 0.123 0.154 0.128 0.638*** 0.122 -0.132 0.135 0.169 0.157 0.361* 0.181 0.276 0.214 0.576*** 0.171 0.267 0.209 0.105 0.262
France 0.307** 0.129 0.196 0.131 -0.040 0.127 -0.179 0.138 0.166 0.160 0.188 0.151 -0.092 0.163 -0.320** 0.154 -0.243 0.176 -0.169 0.207
Canada 0.092 0.128 0.212 0.135 0.302** 0.127 -0.051 0.133 0.185 0.143 -0.042 0.150 0.07 0.161 -0.006 0.145 -0.244 0.159 -0.144 0.179 ISIC 15-19 0.155 0.109 0.232** 0.112 0.004 0.109 0.175 0.111 0.026 0.131 0.235* 0.122 0.169 0.133 0.148 0.119 0.081 0.134 -0.136 0.161 ISIC 20-22 0.14 0.113 0.237** 0.118 0.105 0.112 0.174 0.117 0.113 0.131 0.181 0.129 0.119 0.138 0.135 0.126 0.096 0.142 -0.046 0.167 ISIC 27-33 0.013 0.090 0.237** 0.093 -0.029 0.089 0.131 0.092 0.030 0.106 0.071 0.110 0.186 0.118 0.049 0.108 0.144 0.117 -0.033 0.139 ISIC 29-35 -0.034 0.083 -0.013 0.087 -0.094 0.082 -0.116 0.089 0.036 0.098 -0.115 0.106 -0.193* 0.114 -0.16 0.103 -0.202* 0.118 -0.095 0.140 ISIC 36-37 0.146 0.166 -0.03 0.180 0.159 0.163 0.538*** 0.171 0.456** 0.205 0.108 0.198 -0.42 0.230 0.063 0.190 0.479** 0.218 0.281 0.264
Constant -0.997***0.173 -1.098*** 0.181 -0.643*** 0.172 -1.038*** 0.184 -1.548*** 0.213 -1.089*** 0.231 -1.052*** 0.263 -0.577** 0.228 -1.412*** 0.249 -1.428*** 0.296
Observations 2314 2149 2328 1900 1545 1515 1393 1527 1191 956 Wald Chi2 (34) 637.8*** 647.97*** 730.38*** 727.59*** 560.22*** 452.84*** 414.37*** 506.82*** 447.44*** 258.20*** Rho -0.257 -0.213 -0.389 -0.511 -0.446 -0.422 -0.175 -0.559 -0.561 -0.259 Wald test of rho=0 Chi2(1) 2.765*** 1.192 6.055** 12.738*** 7.222*** 4.652** 0.593 9.233*** 6.841*** 0.946
36
Table 3. Assessing the Relationship between ISO 14001 Certified EMS and Environmental Performance. +
ISO 14001 Certified EMS
Variables Decrease in use of
natural resources Decrease in wastewater
Decrease in solid waste generation
Decrease in local air pollution
Decrease in global pollutants
Coefficient Std.err. Coefficient Std.err. Coefficient Std.err. Coefficient Std.err. Coefficient. Std.err. EMS adoption 1.025*** 0.210 0.716*** 0.218 1.074*** 0.206 0.844*** 0.194 1.145*** 0.203 Regulatory stringency 0.252*** 0.078 0.369*** 0.081 0.146* 0.077 0.460*** 0.092 0.278** 0.101 Facility size -0.005 0.047 0.026 0.049 -0.007 0.047 -0.007 0.046 0.004 0.053 Germany 0.348*** 0.127 -0.004 0.130 0.136 0.128 -0.026 0.131 0.753*** 0.156 Hungary -0.031 0.145 -0.388** 0.150 -0.041 0.145 -0.192 0.144 0.314 0.182 Japan 0.008 0.135 -0.334** 0.135 0.161 0.136 -0.279** 0.134 0.413* 0.163 Norway 0.146 0.153 -0.118 0.156 0.515*** 0.156 -0.393** 0.161 0.247 0.194 France -0.037 0.171 -0.055 0.169 -0.266 0.167 -0.579*** 0.183 0.251 0.210 Canada -0.072 0.168 -0.070 0.180 0.230 0.172 -0.114 0.180 0.621** 0.201 ISIC 15-19 0.230* 0.137 0.286* 0.137 0.101 0.137 0.224 0.141 0.056 0.162 ISIC 20-22 0.170 0.134 0.313* 0.139 0.081 0.135 0.031 0.143 0.010 0.157 ISIC 27-33 0.040 0.106 0.197* 0.108 -0.027 0.106 0.057 0.111 -0.068 0.125 ISIC 29-35 -0.081 0.097 -0.041 0.101 -0.137 0.098 -0.140 0.105 0.016 0.117 ISIC 36-37 0.137 0.205 0.101 0.217 -0.014 0.203 0.434** 0.218 0.440 0.267 Constant -0.581** 0.232 -0.809*** 0.239 -0.388* 0.233 -0.691*** 0.244 -1.591*** 0.295
Observations 1706 1577 1707 1370 1110 Wald Chi2 (34) 618.09*** 588.77*** 643.40*** 576.62*** 556.25** Rho -0.244 -0.261 -0.253 -0.430 -0.499 Wald test of rho=0 Chi2(1) 3.046* 3.392* 3.278* 9.904*** 9.066***
+ Industry dummies are Food, beverages, textiles (ISIC 15-19), Pulp, paper, print (ISIC 20-22), Nonmetallic minerals, metals (ISIC 27-33), Machinery, transport equipment (ISIC 29-35), Machinery, transport equipment (ISIC 29-35), and Furniture recycling (ISIC 36-37).
*Statistically significant at p<.10; ** statistically significant at p<.05; *** statistically significant at p<.01

37
Table 4. Estimated Marginal Effects of Complete and ISO 14001-Certified EMSs…
Dependent variable ISO Certified EMS Complete EMS Differences in Marginal
Effects (a) – (b) Coefficient (a) Standard error Coefficient (b) Standard error Natural resource use 0.374*** 0.022 0.321*** 0.014 0.053 Wastewater effluent 0.267*** 0.016 0.269*** 0.010 -0.002 Solid waste generation 0.385*** 0.025 0.408*** 0.028 -0.023 Local air pollution 0.309*** 0.023 0.391*** 0.013 -0.082 Global air pollutants 0.396*** 0.033 0.388*** 0.023 0.008 … For each coefficient in (a) and (b), observations are different. Marginal effect is defined as average changes in probability of
environmental performance=1 given a change from EMS adoption=0 to EMS adoption=1. * Statistically significant at p<.10; ** statistically significant at p<.05; *** statistically significant at p<.01

38
Table 5. Predicting Facilities’ Complete and Self-identified EMS Adoption Complete EMS Self-identified EMS
Variables Decrease in use of natural
resources
Decrease in wastewater
Decrease in solid waste generation
Decrease in local air pollution
Decrease in global
pollutants
Decrease in use
of natural resources
Decrease in wastewater
Decrease in solid waste generation
Decrease in local air pollution
Decrease in global
pollutants Coef. Std.err
. Coef. Std.er
r. Coef. Std.er
r. Coef. Std.er
r. Coef. Std.er
r. Coef. Std.err
. Coef. Std.er
r. Coef. Std.er
r. Coef. Std.er
r. Coef. Std.er
r. Local government program
0.264***
0.068 0.290***
0.070 0.284***
0.067 0.262***
0.070 0.200** 0.079 0.399***
0.089 0.427***
0.093 0.434***
0.085 0.390***
0.100 0.342***
0.112 Parent Company Pressure
0.340***
0.048 0.329***
0.051 0.322***
0.047 0.361***
0.050 0.368***
0.056 0.317***
0.057 0.327***
0.062 0.302***
0.055 0.331***
0.063 0.352***
0.072 Regulatory stringency 0.292**
* 0.074 0.248**
* 0.078 0.291**
* 0.073 0.301**
* 0.083 0.359**
* 0.090 0.165* 0.090 0.09 0.095 0.173* 0.089 0.101 0.102 0.107 0.113
Env. Group Pressure 0.008 0.044 0.001 0.047 0.007 0.043 -0.008 0.046 0.043 0.054 0.019 0.055 -0.008 0.059 0.04 0.053 -0.004 0.061 -0.008 0.072 Market scope 0.127**
* 0.032 0.122**
* 0.033 0.118**
* 0.031 0.121**
* 0.033 0.133**
* 0.038 0.081** 0.038 0.071* 0.042 0.058 0.037 0.078* 0.043 0.085* 0.049
Market concentration 0.020 0.038 0.011 0.039 0.008 0.037 0.012 0.039 0.024 0.045 0.010 0.046 -0.002 0.050 -0.003 0.044 0.019 0.050 0.014 0.059 Publicly traded 0.256**
* 0.076 0.222**
* 0.077 0.252**
* 0.074 0.165** 0.079 0.128 0.086 0.065 0.105 0.047 0.111 0.068 0.100 0.033 0.112 0.061 0.128
Foreign head office 0.288***
0.083 0.250***
0.086 0.253***
0.083 0.353***
0.087 0.358***
0.101 0.156 0.108 0.191* 0.114 0.126 0.105 0.193* 0.116 0.206 0.138 Facility size 0.271**
* 0.030 0.300**
* 0.031 0.280**
* 0.030 0.235**
* 0.032 0.258**
* 0.035 0.174**
* 0.039 0.175**
* 0.041 0.182**
* 0.039 0.172**
* 0.043 0.167**
* 0.047
France - 0.131 - 0.133 - 0.129 - 0.141 - 0.159 -0.074 0.160 -0.154 0.165 -0.086 0.157 -0.057 0.179 -0.133 0.195 Canada - 0.130 - 0.139 - 0.129 - 0.136 - 0.149 -0.309* 0.153 -0.245 0.165 -0.219 0.153 -0.11 0.169 -0.072 0.182 Germany -
0.372**0.097 -
0.355**0.100 -
0.367**0.097 -
0.373**0.105 -
0.356**0.118 -
1.056**0.129 -
1.073**0.134 -
1.003**0.128 -
1.054**0.142 -
1.007**0.157
Hungary -0.612**
0.123 -0.702**
0.127 -0.648**
0.122 -0.643**
0.124 -0.688**
0.150 -0.998**
0.162 -1.065**
0.166 -0.967**
0.157 -1.069**
0.169 -0.848**
0.193 Japan -
0.279** 0.105 -
0.336**0.109 -
0.312** 0.105 -
0.290**0.108 -
0.286** 0.117 -0.204 0.147 -0.279* 0.152 -0.22 0.146 -0.216 0.156 -0.166 0.167
Norway -0.235 0.133 -0.254* 0.138 -0.250* 0.131 -0.295**
0.143 -0.335**
0.161 -0.775**
0.172 -0.885**
0.182 -0.796**
0.170 -0.949**
0.192 -0.877**
0.214 ISIC 15-19 -
0.524**0.107 -
0.534**0.110 -
0.538**0.107 -
0.514**0.116 -
0.531**0.130 -
0.436**0.129 -
0.438**0.134 -
0.451**0.128 -
0.404** 0.143 -0.25 0.157
ISIC 20-22 -0.350**
0.117 -0.366**
0.123 -0.346**
0.116 -0.266**
0.123 -0.220 0.138 -0.158 0.143 -0.096 0.151 -0.188 0.142 -0.106 0.156 0.104 0.174 ISIC 27-33 -
0.388**0.089 -
0.407**0.093 -
0.354**0.089 -
0.351**0.095 -
0.379**0.107 -
0.361**0.115 -
0.367**0.120 -
0.364**0.114 -
0.270** 0.125 -0.146 0.138
ISIC 29-35 -0.204**
0.086 -0.204**
0.091 -0.168 0.086 -0.163**
0.093 -0.128 0.105 -0.089 0.113 -0.024 0.119 -0.061 0.112 0.058 0.126 0.189 0.141 ISIC 36-37 -
0.385** 0.178 -0.275 0.190 -0.385* 0.175 -0.344* 0.187 -0.158 0.218 -0.105 0.222 0.066 0.244 -0.058 0.212 -0.008 0.241 0.231 0.278
Constant -2.824**
0.244 -2.853**
0.256 -2.780**
0.241 -2.611**
0.259 -2.893**
0.285 -1.852**
0.322 -1.727**
0.342 -1.832**
0.317 -1.849**
0.353 -2.010**
0.396
Observations 2314 2149 2328 1900 1545 1515 1393 1527 1191 956 Wald Chi2 (34) 637.8**
* 647.97*
** 730.38*
** 727.59*
** 560.22*
** 452.84*
** 414.37*
** 506.82*
** 447.44*
** 258.20*
**
Rho -0.257 -0.213 -0.389 -0.511 -0.446 -0.422 -0.175 -0.559 -0.561 -0.259 Wald test of rho=0 Chi2(1)
2.765***
1.192 6.055** 12.738***
7.222***
4.652** 0.593 9.233***
6.841***
0.946 * Statistically significant at p<.10; ** statistically significant at p<.05; *** statistically significant at p<.01 + Industry dummies are Food, beverages, textiles (ISIC 15-19), Pulp, paper, print (ISIC 20-22), Nonmetallic minerals, metals (ISIC 27-33), Machinery, transport
equipment (ISIC 29-35), Machinery, transport equipment (ISIC 29-35), and Furniture recycling (ISIC 36-37).

39
Table 6. Predicting Facilities’ ISO 14001 Adoption ISO 14001 Certified EMS
Variables Decrease in use of natural resources
Decrease in wastewater
Decrease in solid waste generation
Decrease in local air pollution
Decrease in global pollutants
Coefficient Std.err. Coefficient
Std.err. Coefficient Std.err. Coefficient
Std.err.
Coefficient Std.err. Local government program 0.416*** 0.087 0.407*** 0.090 0.381*** 0.087 0.416*** 0.092 0.418*** 0.102 Regulatory stringency 0.179** 0.087 0.112 0.091 0.158 0.086 0.142 0.099 0.195 0.108 Parent company pressure 0.477*** 0.058 0.483*** 0.061 0.460*** 0.058 0.539*** 0.063 0.551*** 0.068 Environmental interest group pressure -0.043 0.055 -0.023 0.057 -0.023 0.055 -0.035 0.059 -0.008 0.069 Market scope 0.140*** 0.040 0.127*** 0.042 0.129*** 0.040 0.115*** 0.043 0.118* 0.050 Market concentration 0.049 0.046 0.056 0.048 0.036 0.046 0.069 0.050 0.077 0.056 Publicly traded 0.315*** 0.099 0.296*** 0.100 0.295*** 0.098 0.252** 0.104 0.205 0.114 Foreign head office 0.345*** 0.102 0.289*** 0.105 0.311*** 0.102 0.370*** 0.109 0.446*** 0.127 Number of employees (Log) 0.415*** 0.038 0.426*** 0.040 0.423*** 0.038 0.378*** 0.041 0.395*** 0.046 France 0.342* 0.194 0.382** 0.193 0.338* 0.190 0.445** 0.204 0.307 0.228 Canada -0.080 0.190 0.023 0.201 -0.044 0.190 0.069 0.202 0.088 0.220 Germany -0.064 0.143 -0.095 0.146 -0.105 0.143 -0.120 0.150 -0.074 0.168 Hungary 0.151 0.167 0.025 0.170 0.081 0.165 0.070 0.168 0.035 0.199 Japan 1.226*** 0.158 1.166*** 0.160 1.149*** 0.157 1.198*** 0.161 1.276*** 0.177 Norway 0.504*** 0.176 0.510*** 0.181 0.455*** 0.174 0.465** 0.186 0.600** 0.205 Food, beverage, textiles (ISIC 15-19) -0.994*** 0.134 -0.964*** 0.138 -1.010*** 0.135 -0.948*** 0.145 -0.961*** 0.165 Pulp, paper, publishing, print (ISIC 20-22)
-0.451*** 0.144 -0.414*** 0.150 -0.429*** 0.143 -0.310** 0.154 -0.120 0.168 Nonmetallic minerals, metals (ISIC, 27-33)
-0.472*** 0.108 -0.442*** 0.113 -0.437*** 0.108 -0.393*** 0.117 -0.348** 0.130 Machinery, transport equip. (ISIC 29-35)
-0.157 0.105 -0.109 0.111 -0.150 0.105 -0.054 0.116 0.043 0.131 Furniture recycling (ISIC 36-37) -0.285 0.220 -0.124 0.230 -0.284 0.216 -0.153 0.234 -0.284 0.282 Constant -4.409*** 0.322 -4.438*** 0.332 -4.326*** 0.319 -4.327*** 0.347 -4.639*** 0.380 Observations 1706 1577 1707 1370 1110 Wald Chi2 (34) 618.09*** 588.77*** 643.40*** 576.62*** 556.25** Rho -0.244 -0.261 -0.253 -0.430 -0.499 Wald test of rho=0 Chi2(1) 3.046* 3.392* 3.278* 9.904*** 9.066*** *Statistically significant at p<.10; ** statistically significant at p<.05; *** statistically significant at p<.01