Embed Size (px)
Citation preview
2009 REMOTE SENSING
Human Impact on Environment
Presented byMark A. Van HeckeNational Event SupervisorEarth-Space Science Event Trainer
Anchor Bay High SchoolFair Haven, MI
OBJECTIVES:• Review the causes and consequences
of global warming• Create a Point Designation Grid used to
locate features on remote sensing images
• Measure distance and area on remote sensing images
• Analyze remote sensing images using the five factors of image analysis
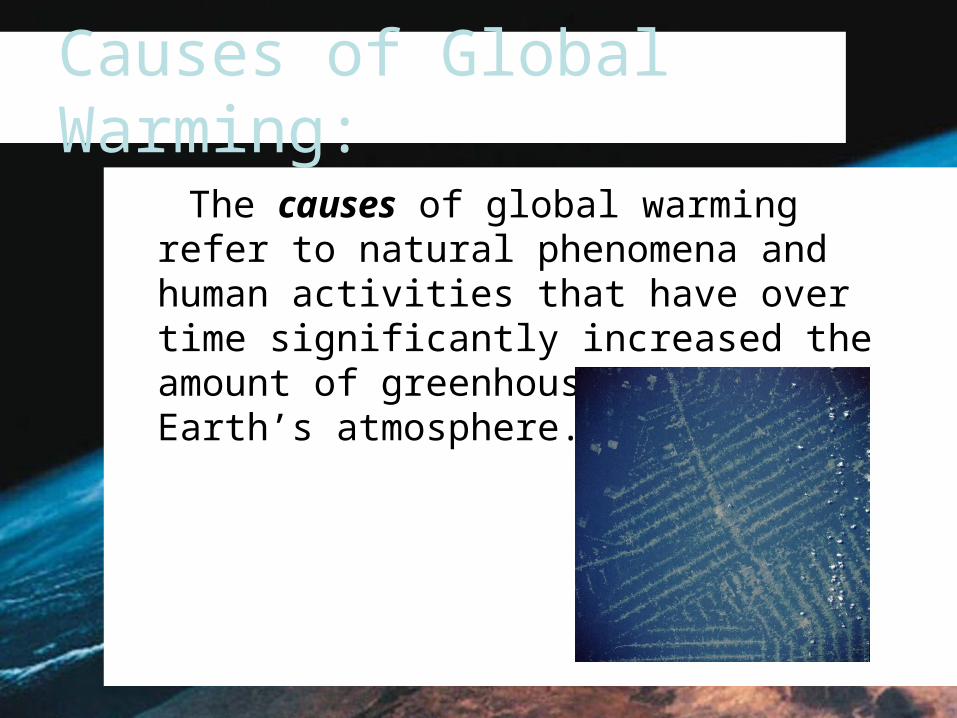
Causes of Global Warming:
The causes of global warming refer to natural phenomena and human activities that have over time significantly increased the amount of greenhouse gases in Earth’s atmosphere.
Causes of Global Warming:
These include:
• Natural CO2 emissions from volcanoes• Deforestation• Human activities including the burning
of fossil fuels
Creating a Point Designation Grid (PDG):
Remote sensing images are rarely the same scale as maps of the same location.
In the military, Point Designation Grids (PDG) are often created to locate features on images
Creating a Point Designation Grid:
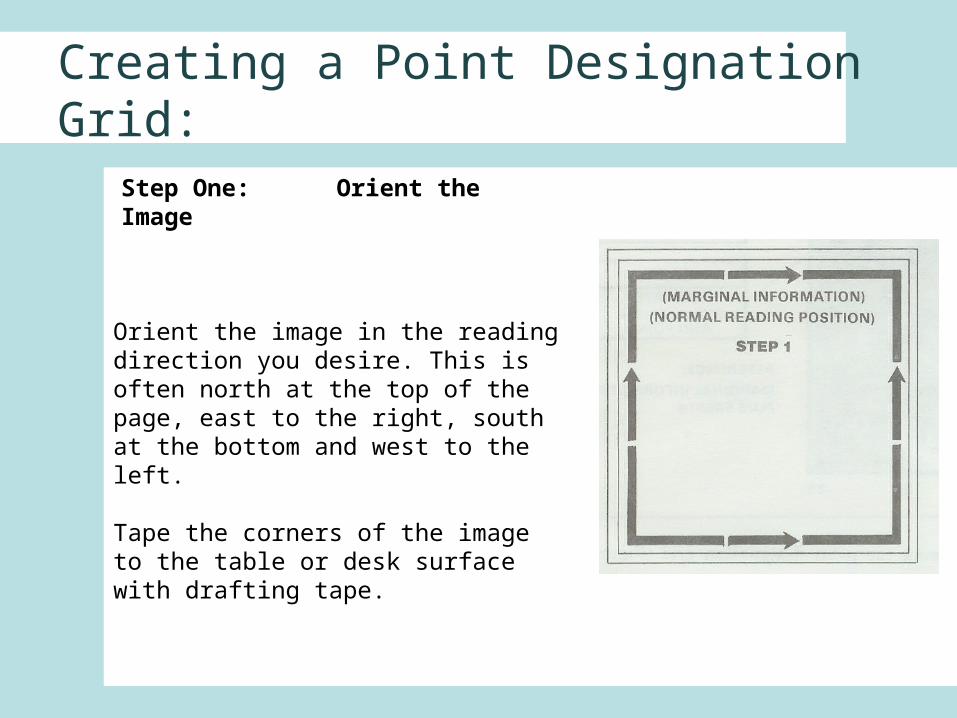
Orient the image in the reading direction you desire. This is often north at the top of the page, east to the right, south at the bottom and west to the left.
Tape the corners of the image to the table or desk surface with drafting tape.
Step One: Orient the Image
Creating a Point Designation Grid:
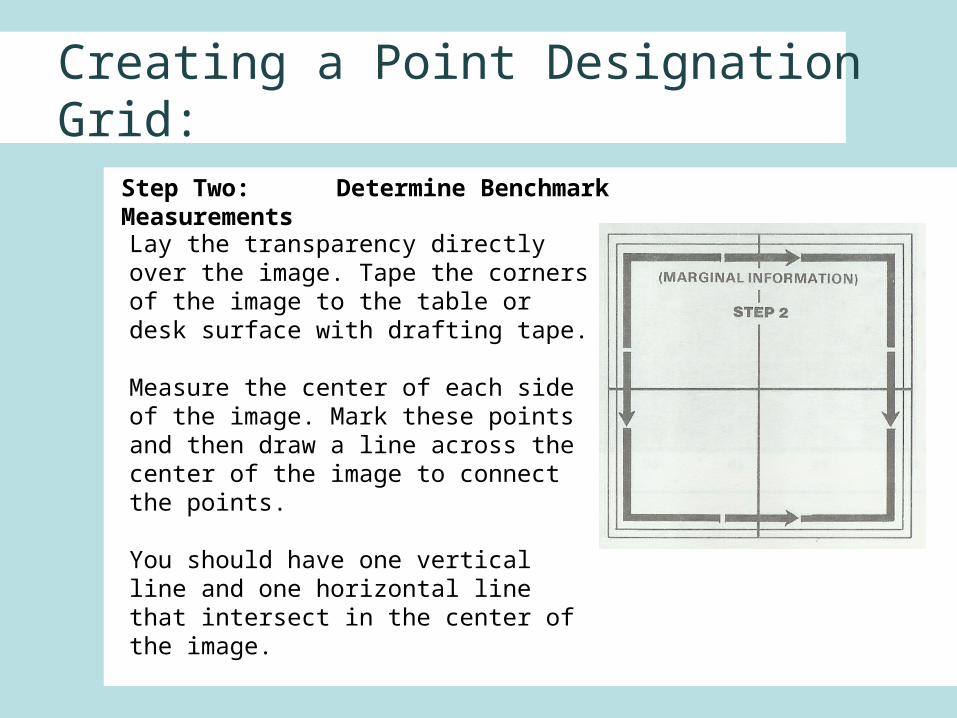
Step Two: Determine Benchmark MeasurementsLay the transparency directly over the image. Tape the corners of the image to the table or desk surface with drafting tape.
Measure the center of each side of the image. Mark these points and then draw a line across the center of the image to connect the points.
You should have one vertical line and one horizontal line that intersect in the center of the image.
Creating a Point Designation Grid:
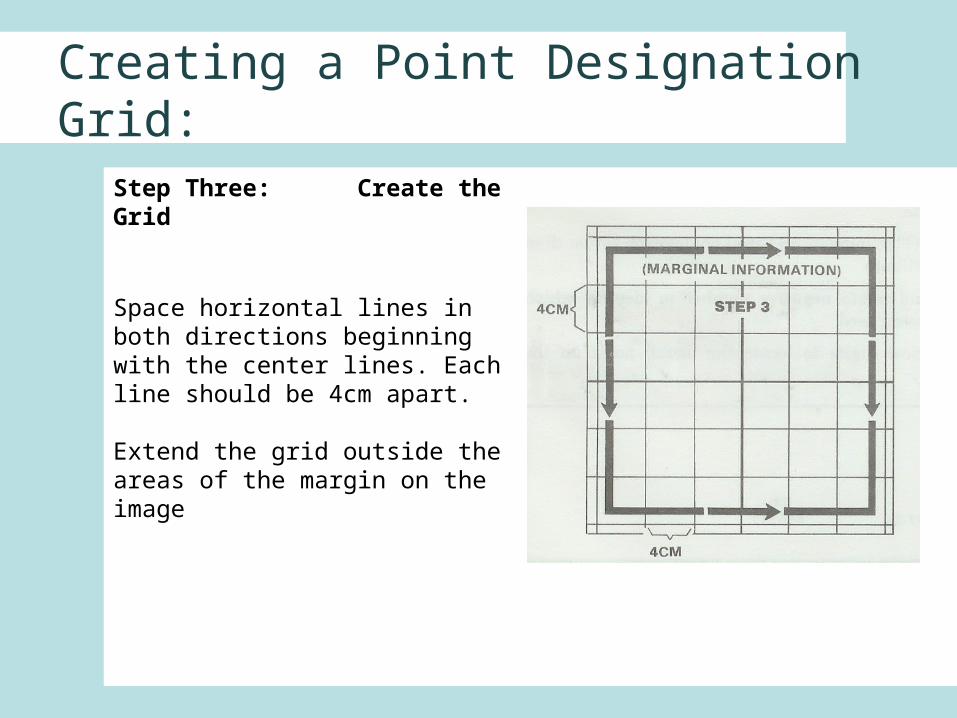
Step Three: Create the Grid
Space horizontal lines in both directions beginning with the center lines. Each line should be 4cm apart.
Extend the grid outside the areas of the margin on the image
Creating a Point Designation Grid:
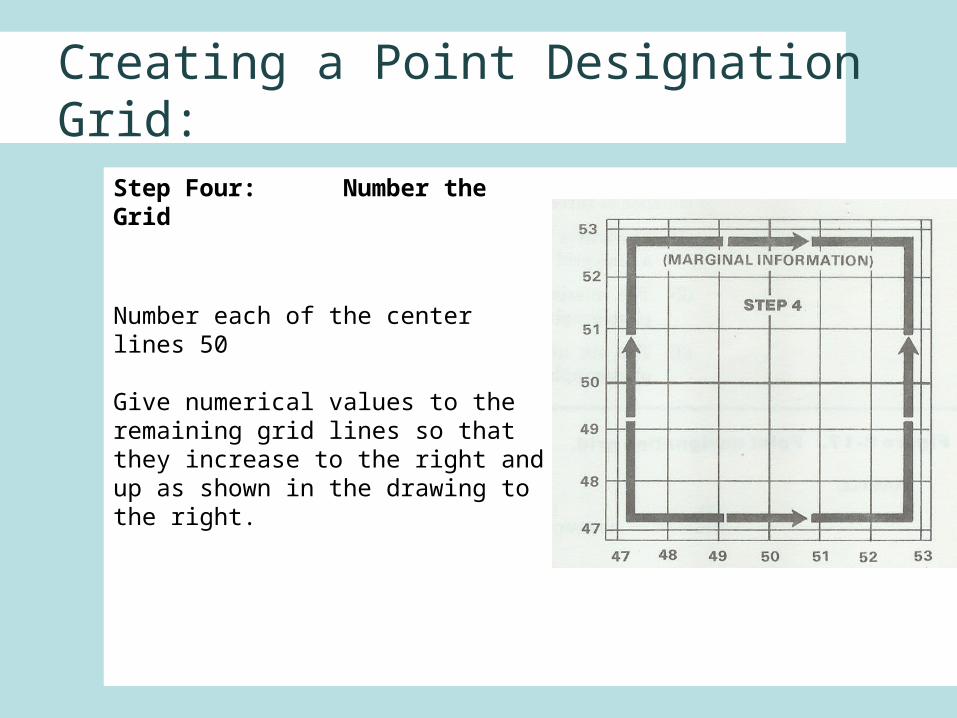
Step Four: Number the Grid
Number each of the center lines 50
Give numerical values to the remaining grid lines so that they increase to the right and up as shown in the drawing to the right.
Creating a Point Designation Grid:
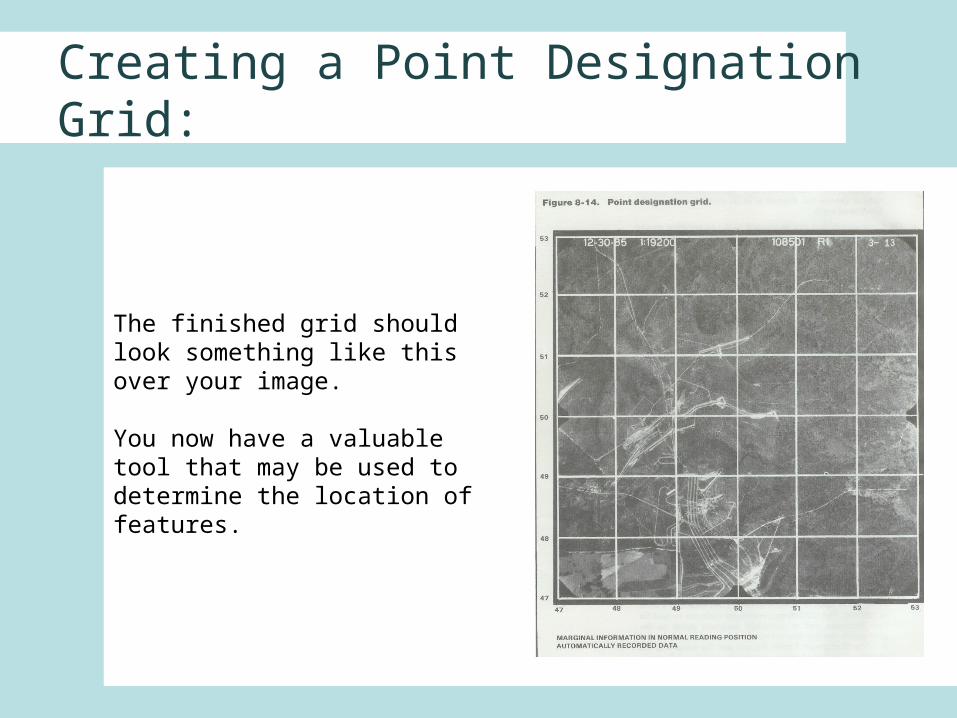
The finished grid should look something like this over your image.
You now have a valuable tool that may be used to determine the location of features.
Locating Features with a PDG:
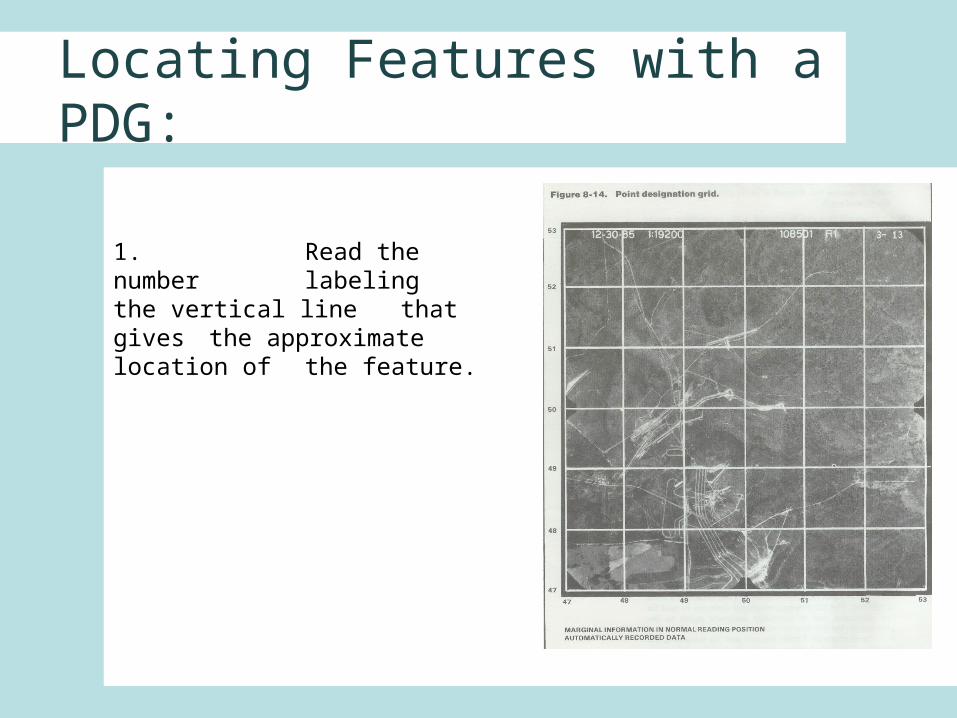
1. Read the number labeling the vertical line
that gives the approximate location of the feature.
Locating Features with a PDG:
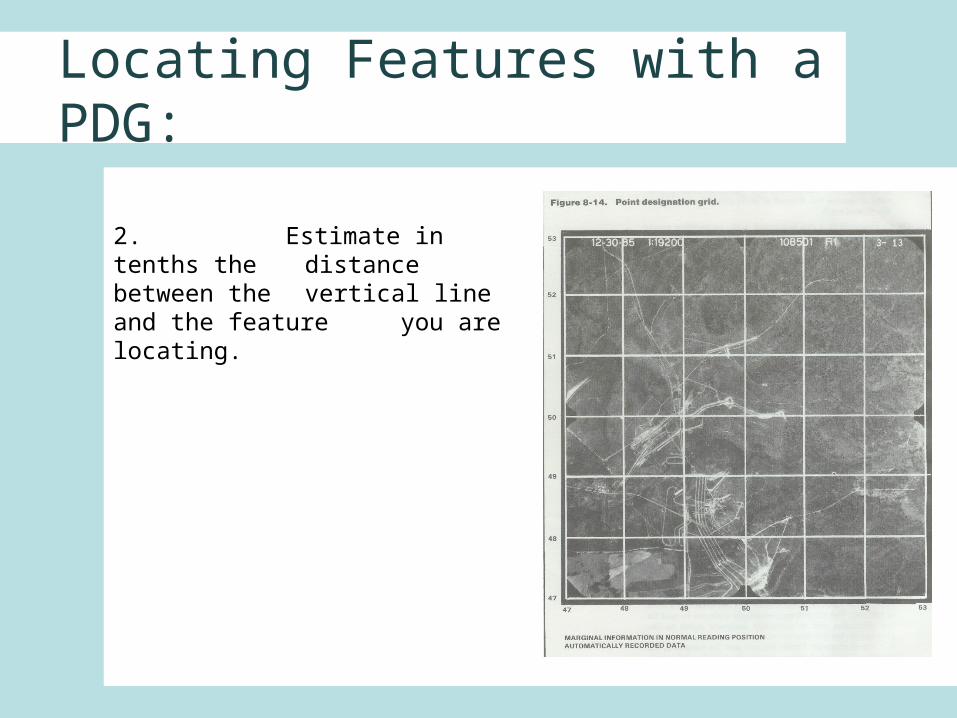
2. Estimate in tenths the distance between the vertical line and the feature you are locating.
Locating Features with a PDG:
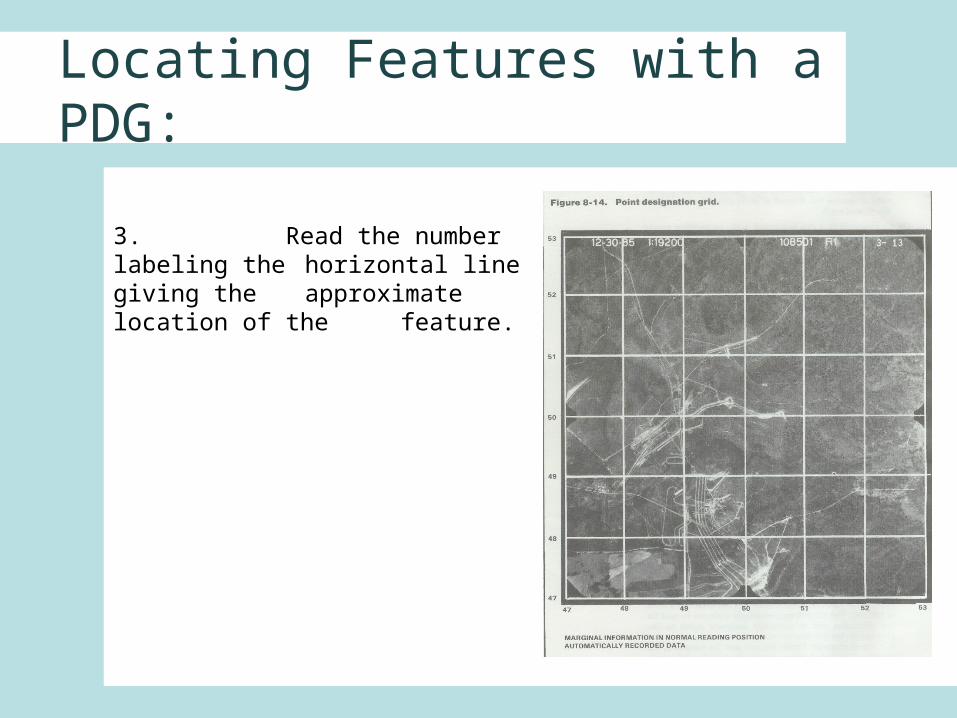
3. Read the number labeling the horizontal line giving the
approximate location of the feature.
Locating Features with a PDG:
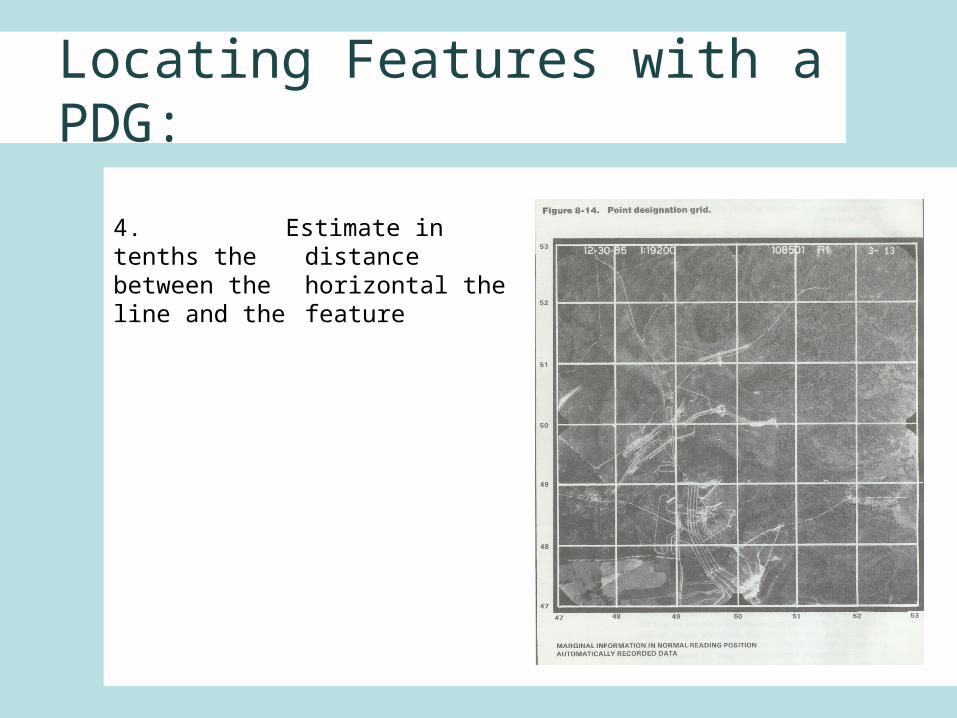
4. Estimate in tenths the distance between the horizontal the line and the feature
Locating Features with a PDG:
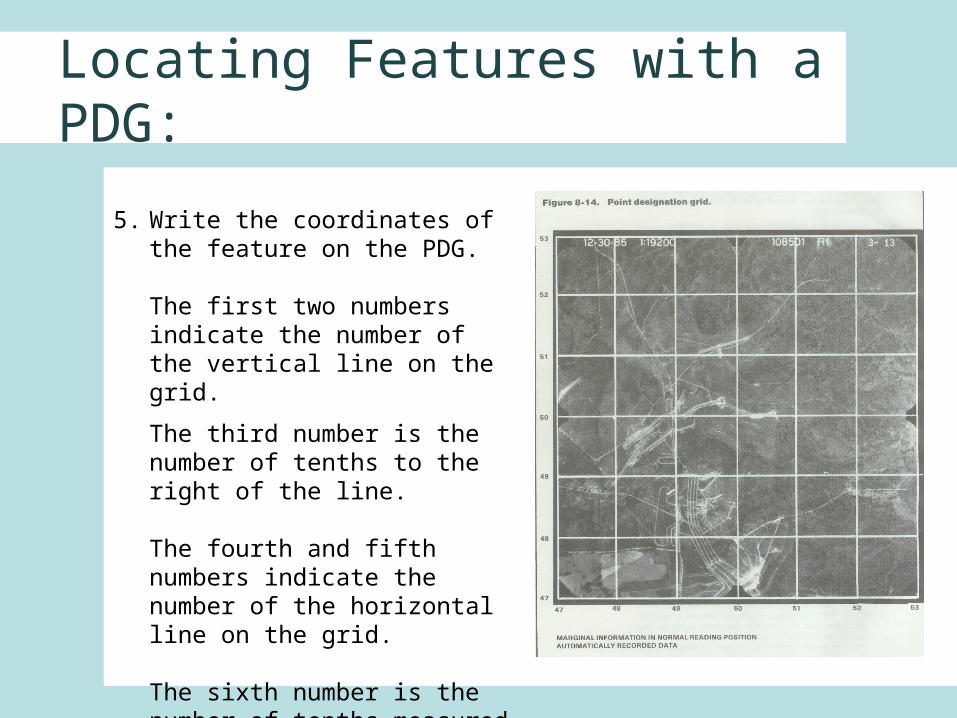
5. Write the coordinates of the feature on the PDG.
The first two numbers indicate the number of the vertical line on the grid.
The third number is the number of tenths to the right of the line.
The fourth and fifth numbers indicate the number of the horizontal line on the grid.
The sixth number is the number of tenths measured upward from the horizontal line.
Consequences of Global Warming:
The consequences of global warming refer to phenomena that may be attributed to an increase in mean temperature.These include:
• Destruction of phytoplankton• Extreme weather events and changes in
established weather patterns• Release of benthic methane • Increased acidity of ocean waters• Extinction of Species
Destruction of Phytoplankton:
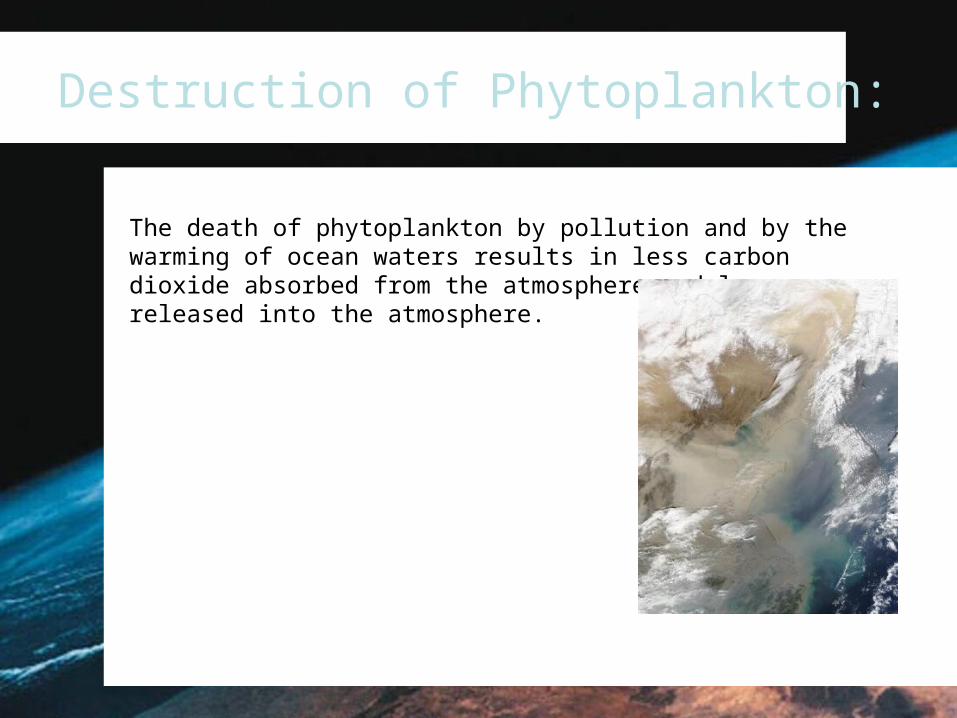
The death of phytoplankton by pollution and by the warming of ocean waters results in less carbon dioxide absorbed from the atmosphere and less oxygen released into the atmosphere.
Destruction of Phytoplankton:
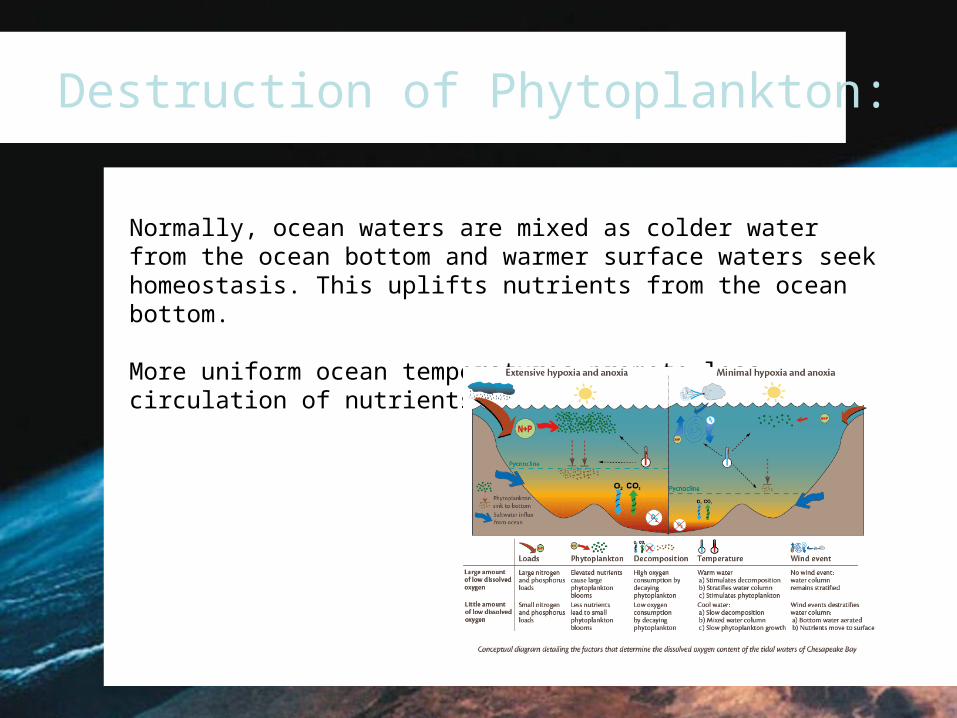
Normally, ocean waters are mixed as colder water from the ocean bottom and warmer surface waters seek homeostasis. This uplifts nutrients from the ocean bottom.
More uniform ocean temperatures promote less circulation of nutrients and less carbon absorption.
Destruction of Phytoplankton:
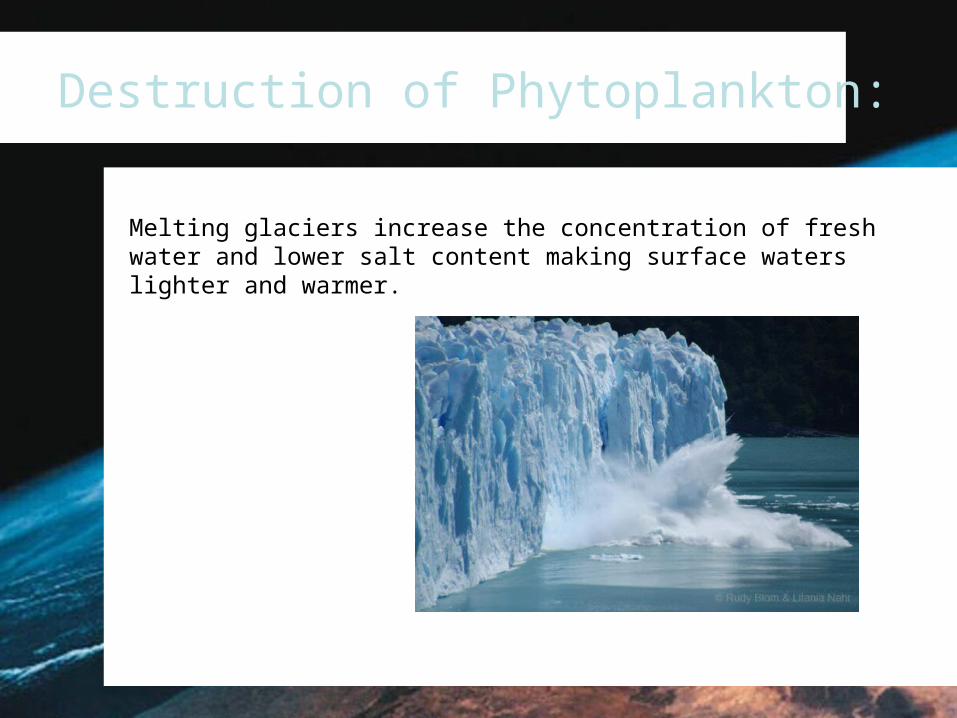
Melting glaciers increase the concentration of fresh water and lower salt content making surface waters lighter and warmer.
Extreme Weather Events:
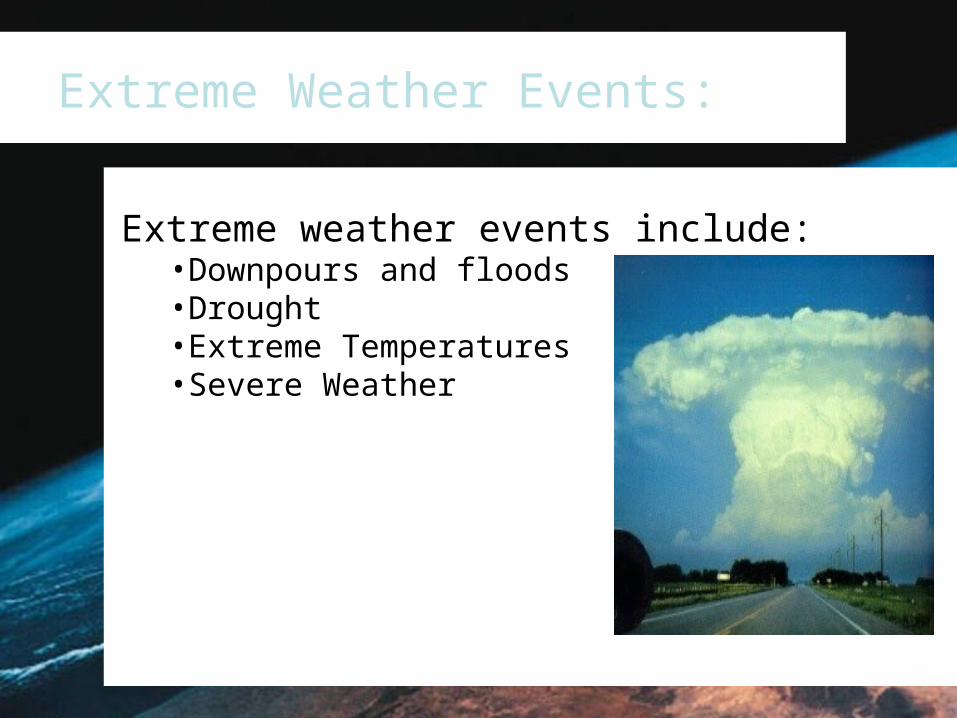
Extreme weather events include:•Downpours and floods•Drought•Extreme Temperatures•Severe Weather
Downpours and Floods:
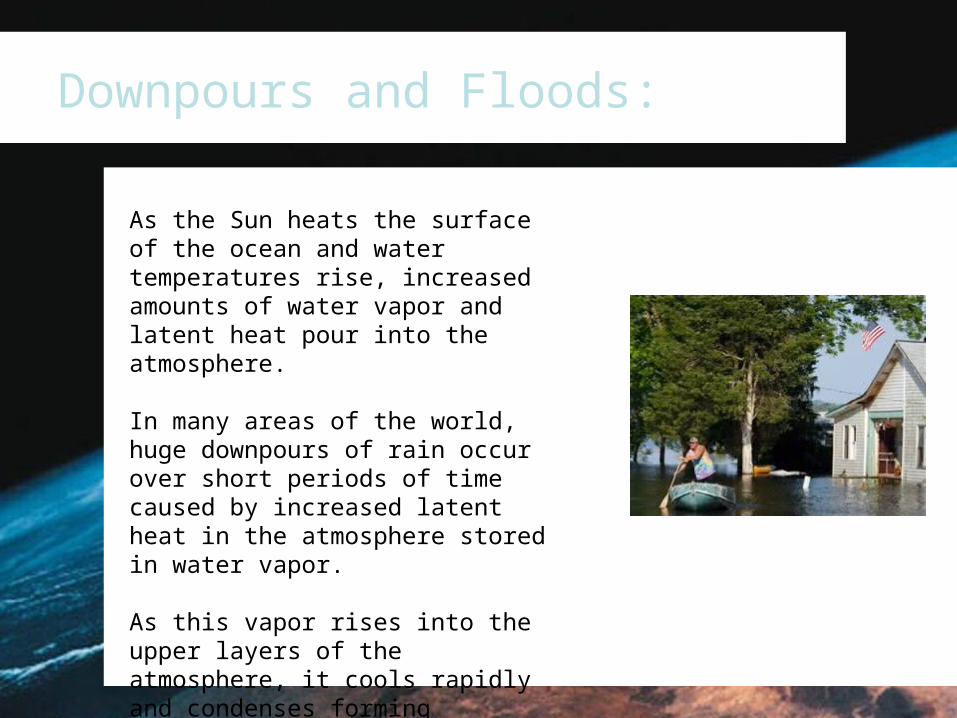
As the Sun heats the surface of the ocean and water temperatures rise, increased amounts of water vapor and latent heat pour into the atmosphere.
In many areas of the world, huge downpours of rain occur over short periods of time caused by increased latent heat in the atmosphere stored in water vapor.
As this vapor rises into the upper layers of the atmosphere, it cools rapidly and condenses forming downpours and resulting floods.
Downpours and Floods:
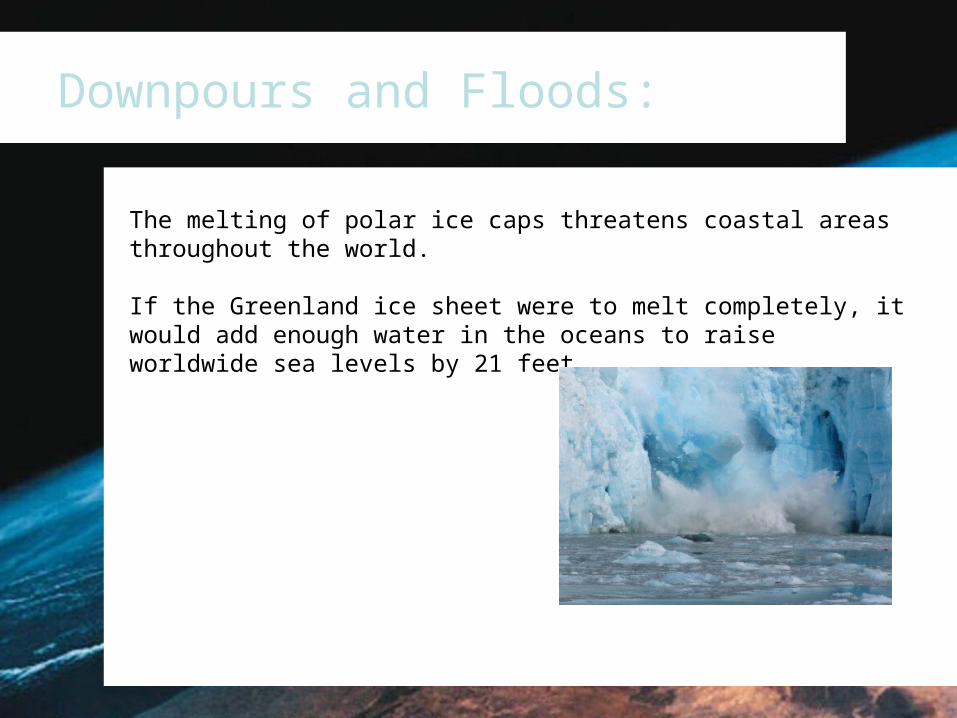
The melting of polar ice caps threatens coastal areas throughout the world.
If the Greenland ice sheet were to melt completely, it would add enough water in the oceans to raise worldwide sea levels by 21 feet.
Drought:
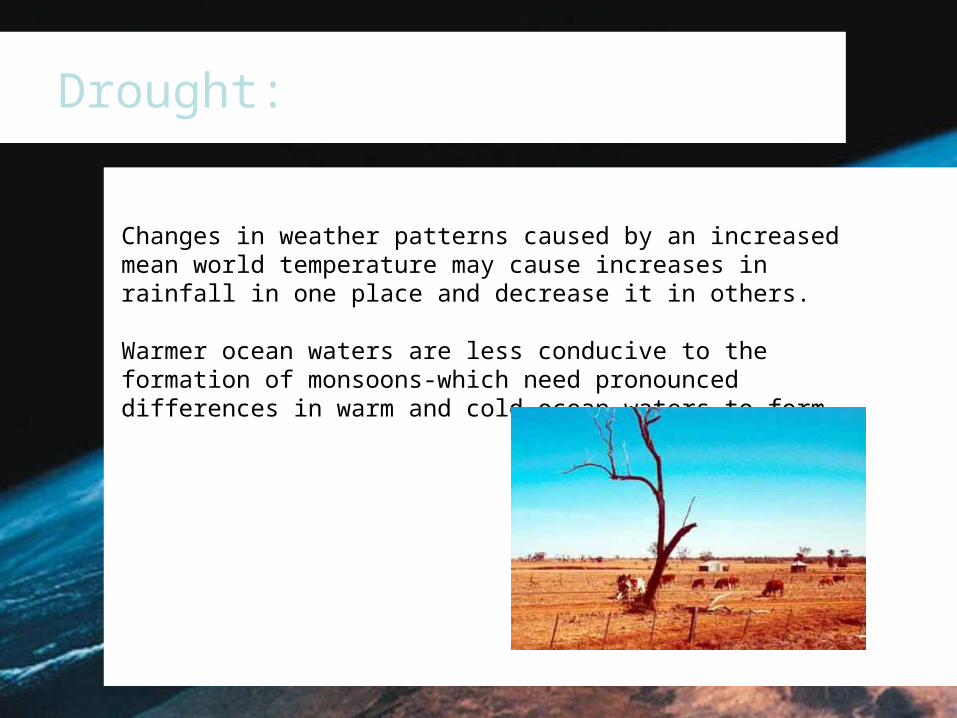
Changes in weather patterns caused by an increased mean world temperature may cause increases in rainfall in one place and decrease it in others.
Warmer ocean waters are less conducive to the formation of monsoons-which need pronounced differences in warm and cold ocean waters to form.
Extreme Temperatures:
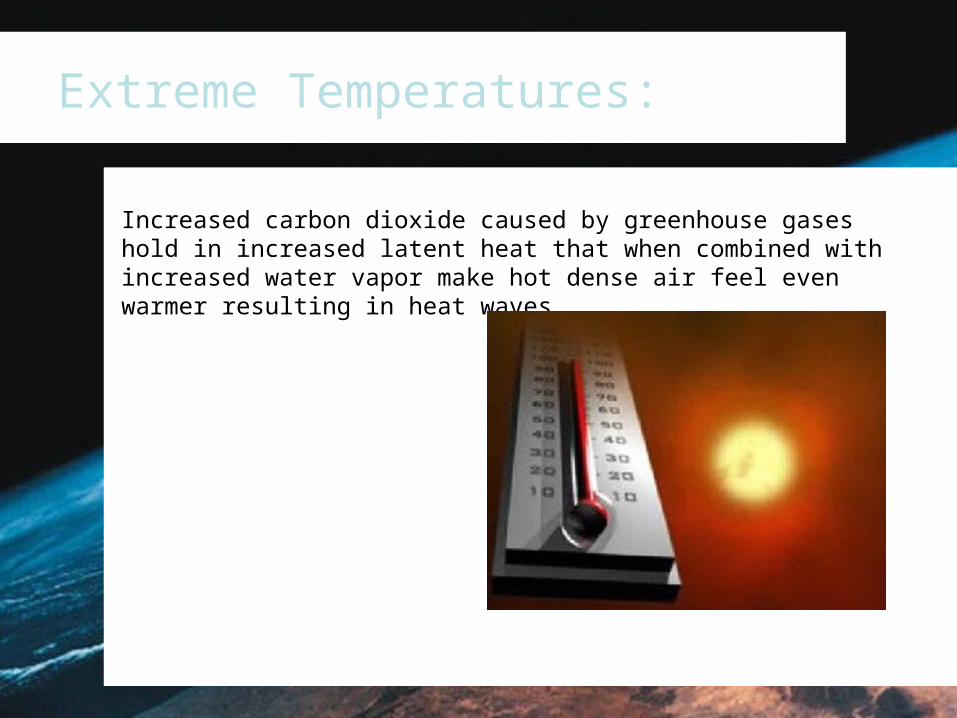
Increased carbon dioxide caused by greenhouse gases hold in increased latent heat that when combined with increased water vapor make hot dense air feel even warmer resulting in heat waves.
Extreme Temperatures:
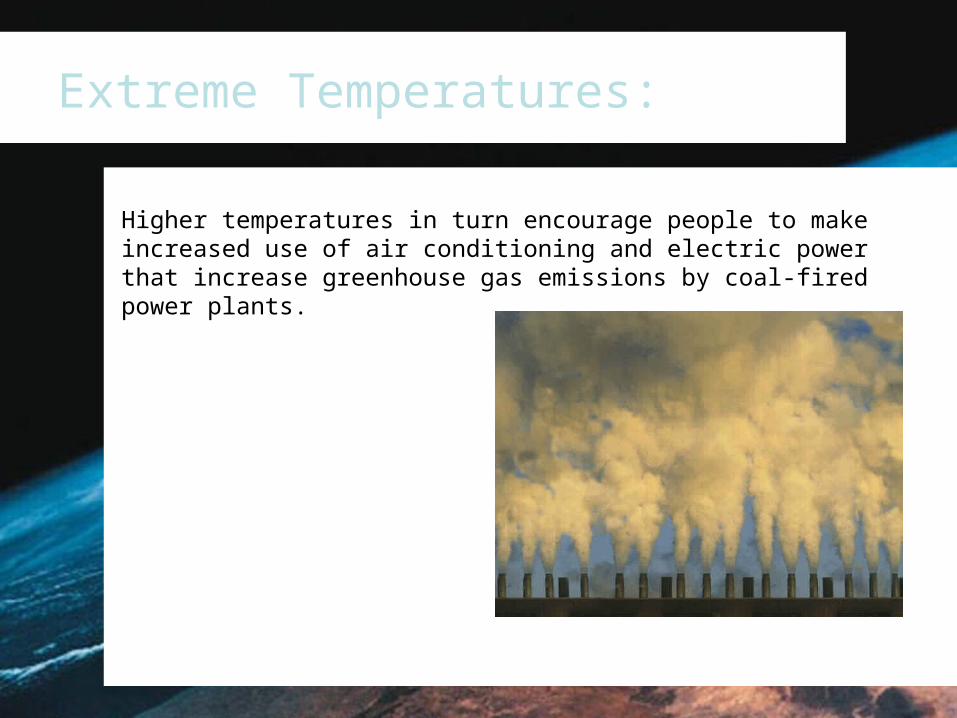
Higher temperatures in turn encourage people to make increased use of air conditioning and electric power that increase greenhouse gas emissions by coal-fired power plants.
Severe Weather:
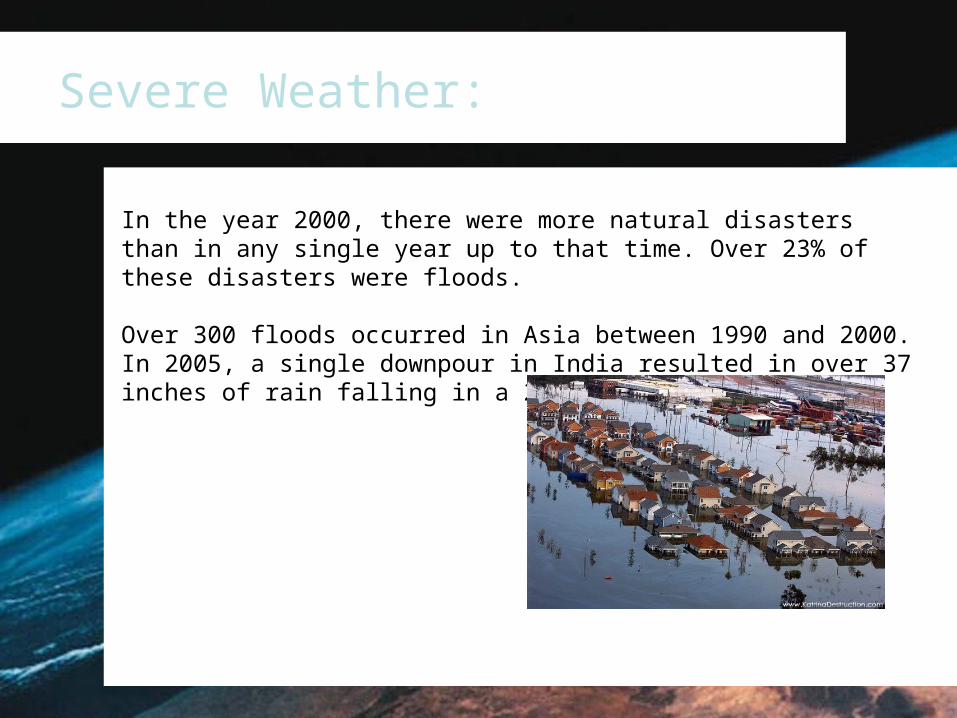
In the year 2000, there were more natural disasters than in any single year up to that time. Over 23% of these disasters were floods.
Over 300 floods occurred in Asia between 1990 and 2000. In 2005, a single downpour in India resulted in over 37 inches of rain falling in a 24-hour period.
Severe Weather:
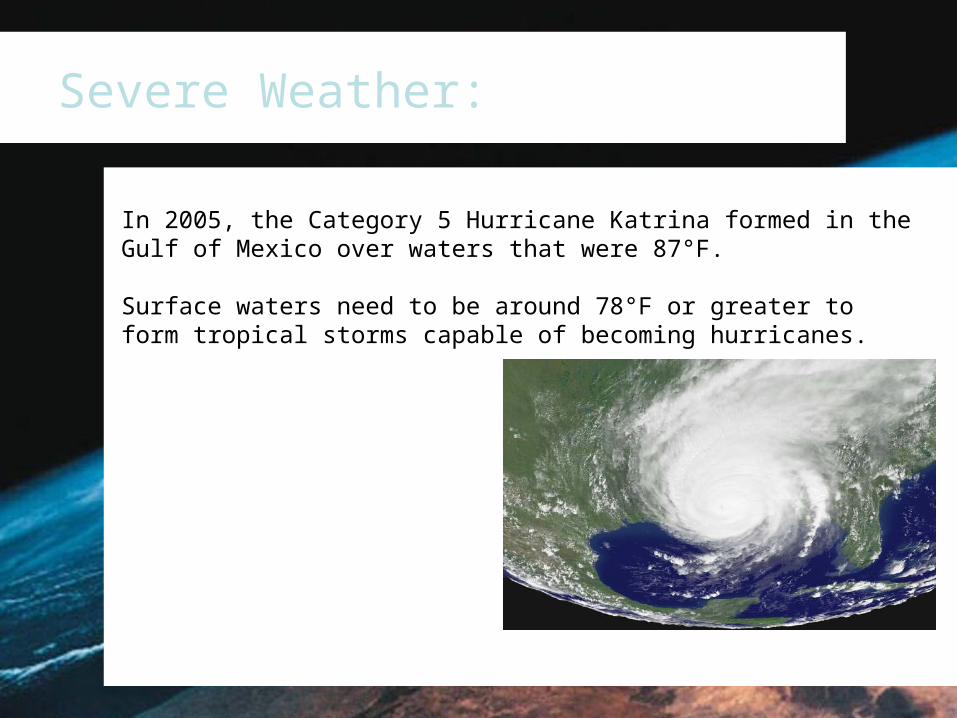
In 2005, the Category 5 Hurricane Katrina formed in the Gulf of Mexico over waters that were 87°F.
Surface waters need to be around 78°F or greater to form tropical storms capable of becoming hurricanes.
Release of Benthic Methane:
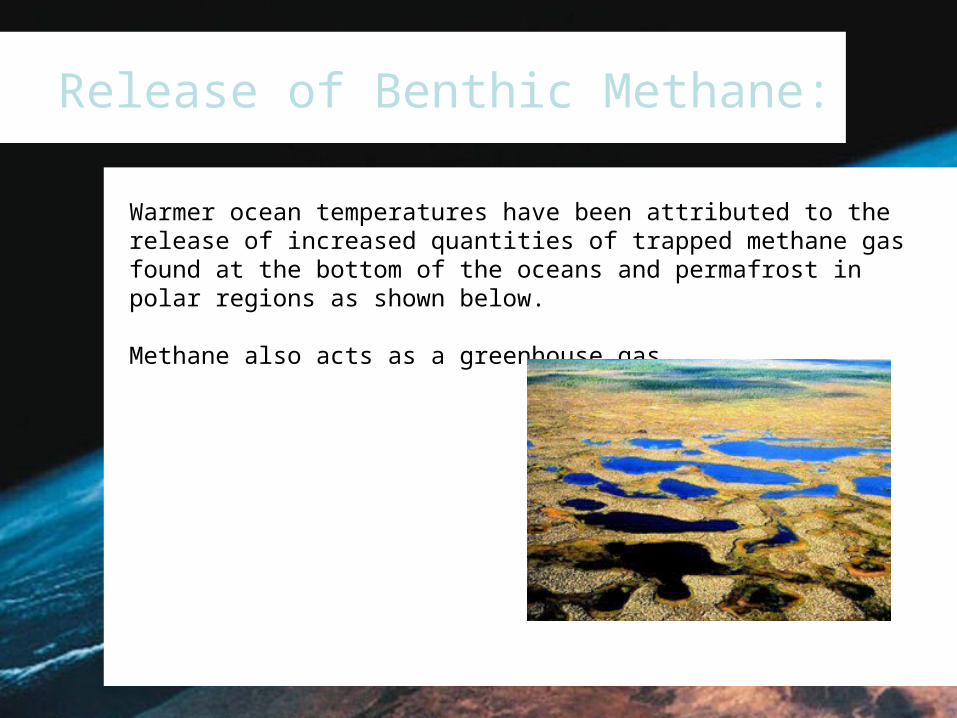
Warmer ocean temperatures have been attributed to the release of increased quantities of trapped methane gas found at the bottom of the oceans and permafrost in polar regions as shown below.
Methane also acts as a greenhouse gas.
Increased Acidity of Ocean Waters:
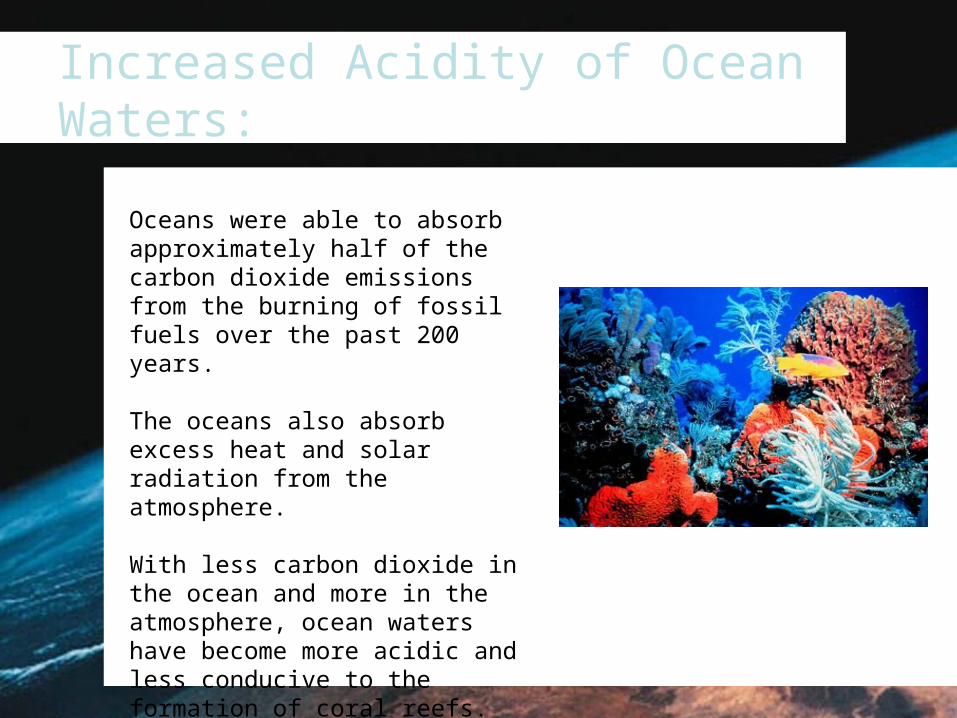
Oceans were able to absorb approximately half of the carbon dioxide emissions from the burning of fossil fuels over the past 200 years.
The oceans also absorb excess heat and solar radiation from the atmosphere.
With less carbon dioxide in the ocean and more in the atmosphere, ocean waters have become more acidic and less conducive to the formation of coral reefs.
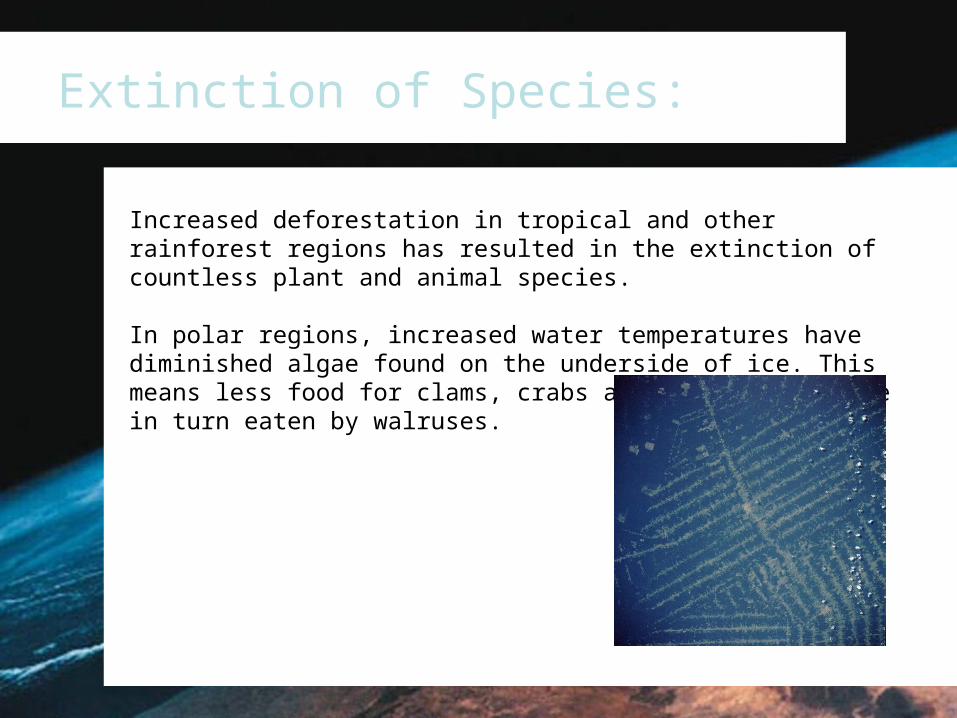
Extinction of Species:
Increased deforestation in tropical and other rainforest regions has resulted in the extinction of countless plant and animal species.
In polar regions, increased water temperatures have diminished algae found on the underside of ice. This means less food for clams, crabs and mussels that are in turn eaten by walruses.
Extinction of Species:
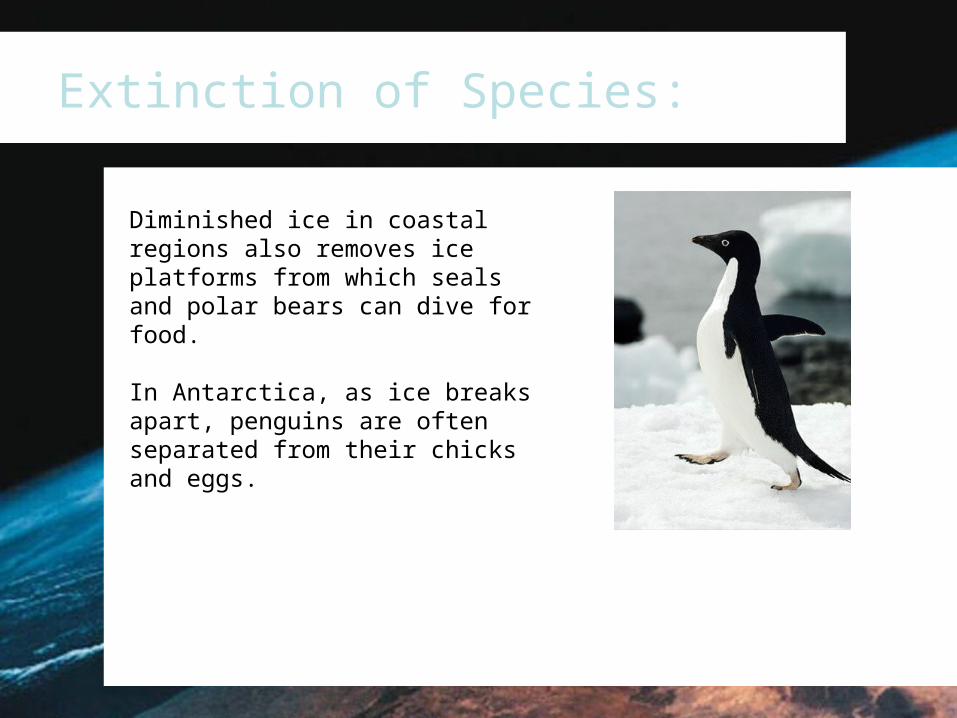
Diminished ice in coastal regions also removes ice platforms from which seals and polar bears can dive for food.
In Antarctica, as ice breaks apart, penguins are often separated from their chicks and eggs.
Consequences of Global Warming:
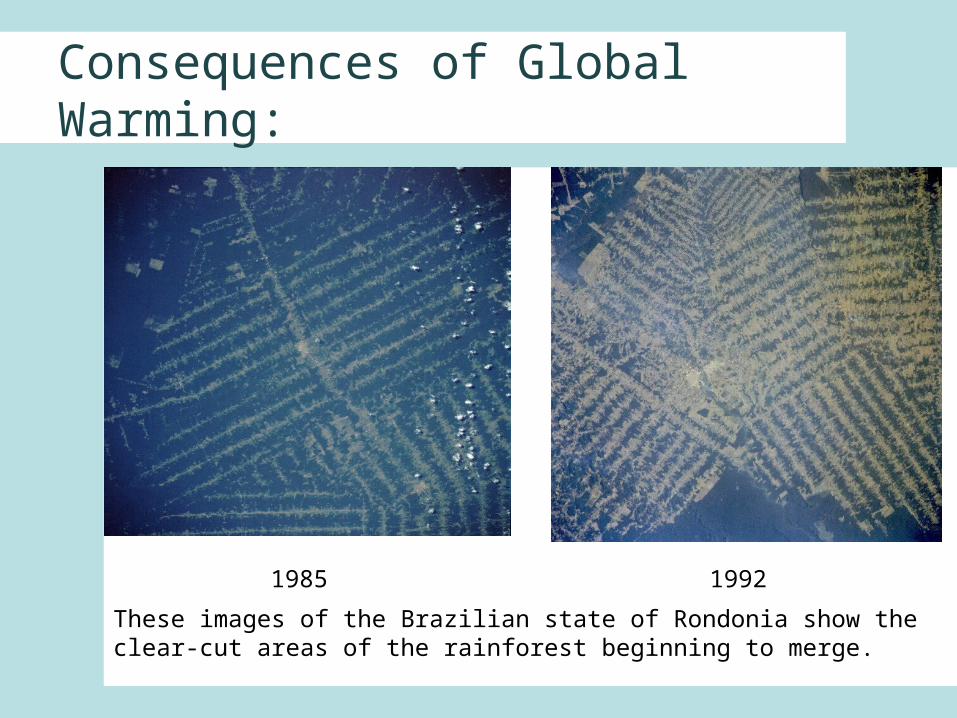
1985 1992
These images of the Brazilian state of Rondonia show the clear-cut areas of the rainforest beginning to merge.
Consequences of Global Warming:
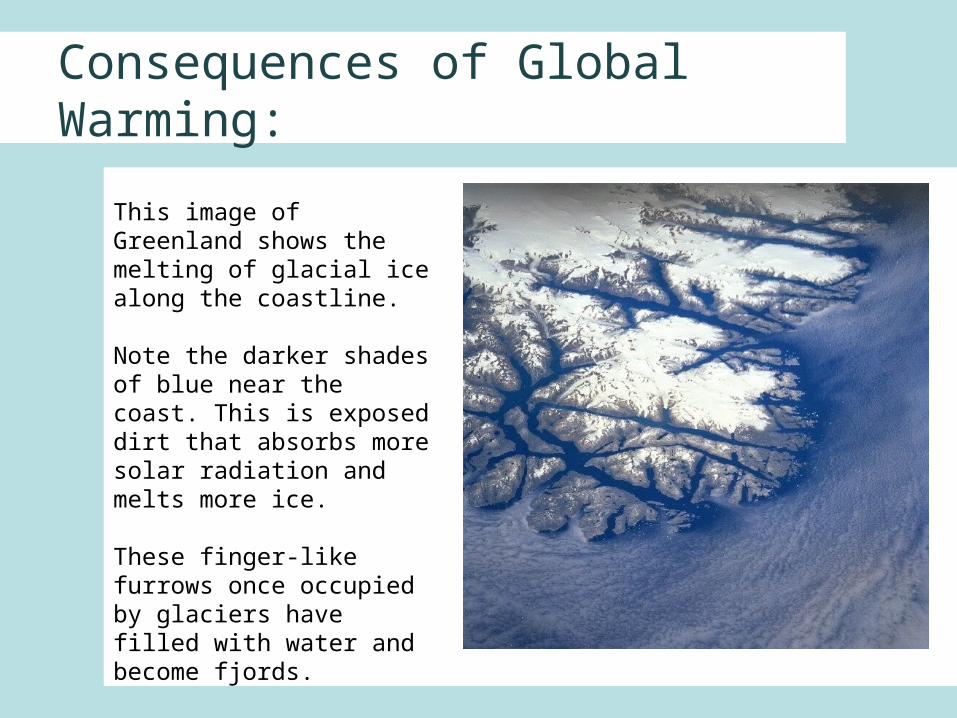
This image of Greenland shows the melting of glacial ice along the coastline.
Note the darker shades of blue near the coast. This is exposed dirt that absorbs more solar radiation and melts more ice.
These finger-like furrows once occupied by glaciers have filled with water and become fjords.
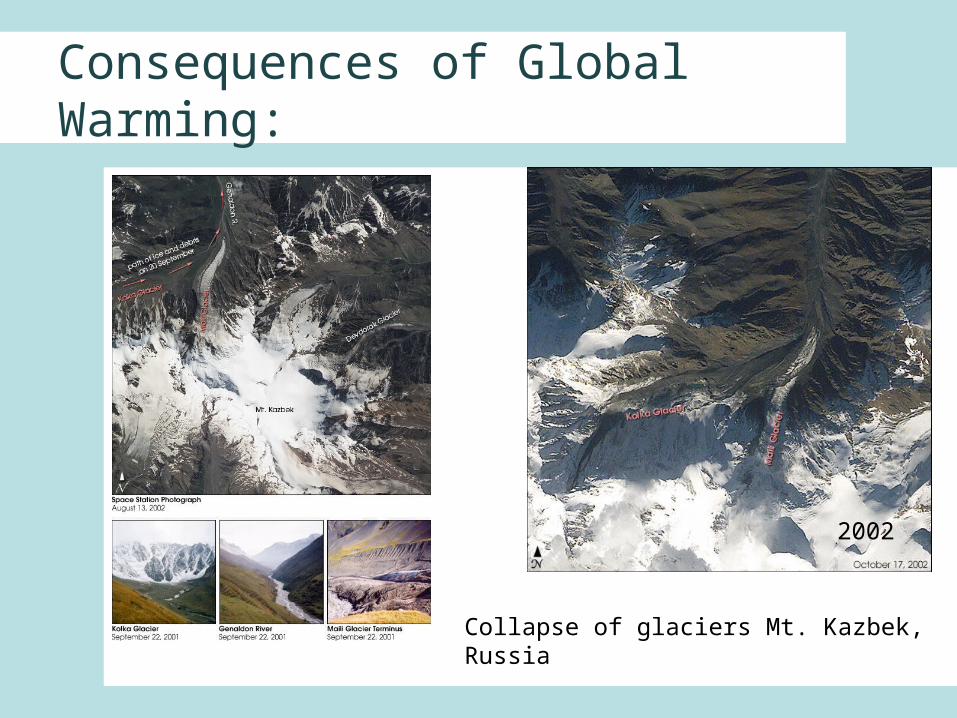
Consequences of Global Warming:
Collapse of glaciers Mt. Kazbek, Russia
2002
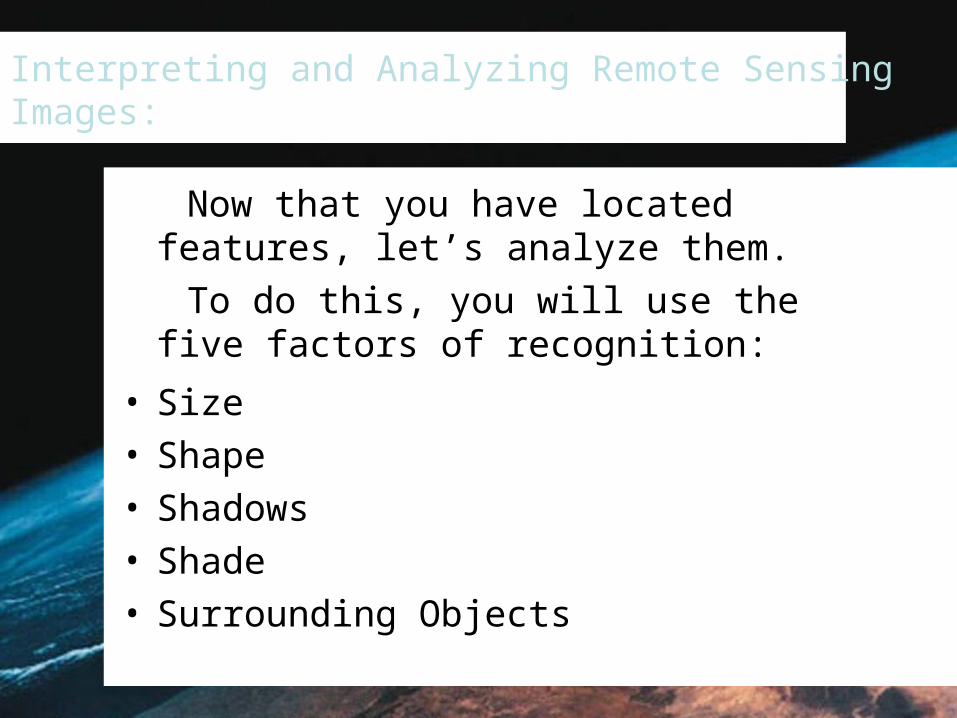
Interpreting and Analyzing Remote Sensing Images:
Now that you have located features, let’s analyze them.
To do this, you will use the five factors of recognition:
• Size• Shape• Shadows• Shade• Surrounding Objects
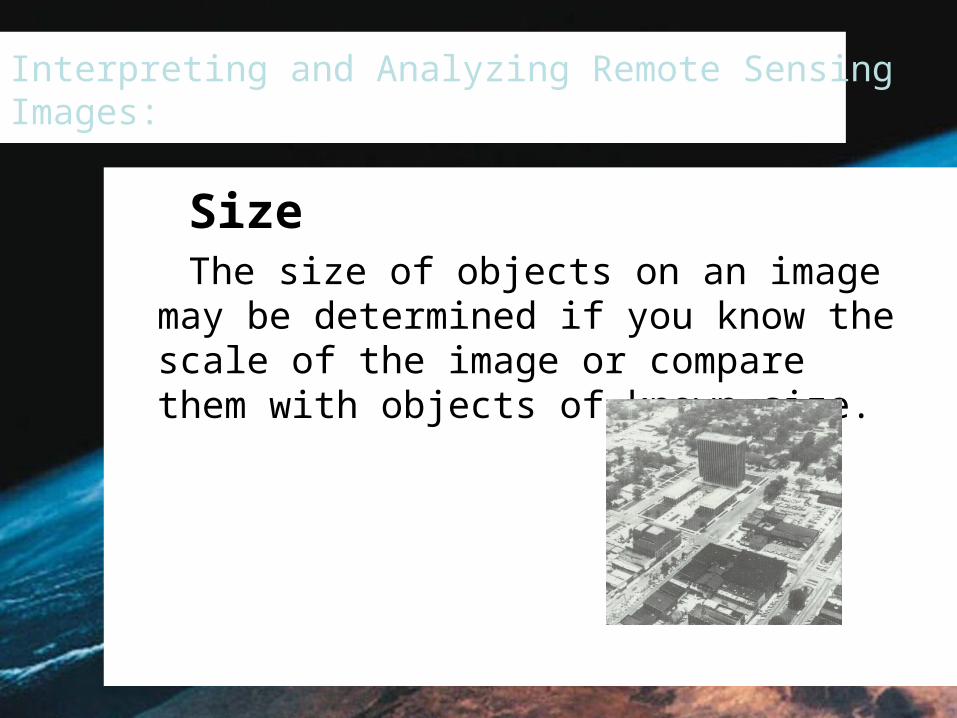
Interpreting and Analyzing Remote Sensing Images:
Size The size of objects on an image may be
determined if you know the scale of the image or compare them with objects of known size.
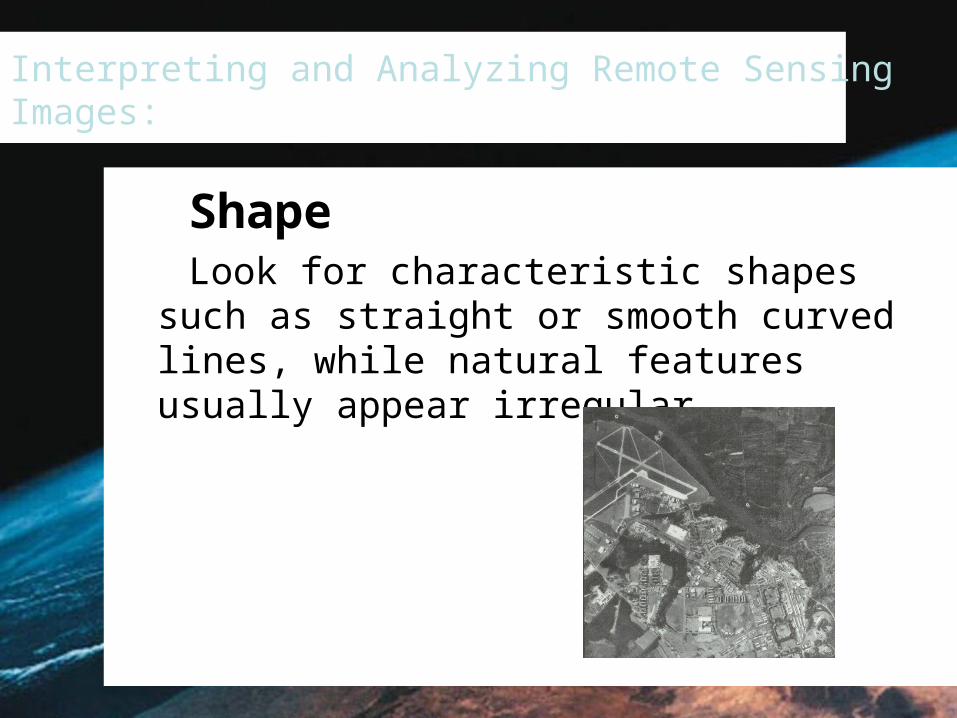
Interpreting and Analyzing Remote Sensing Images:
Shape Look for characteristic shapes such as
straight or smooth curved lines, while natural features usually appear irregular
Interpreting and Analyzing Remote Sensing Images:
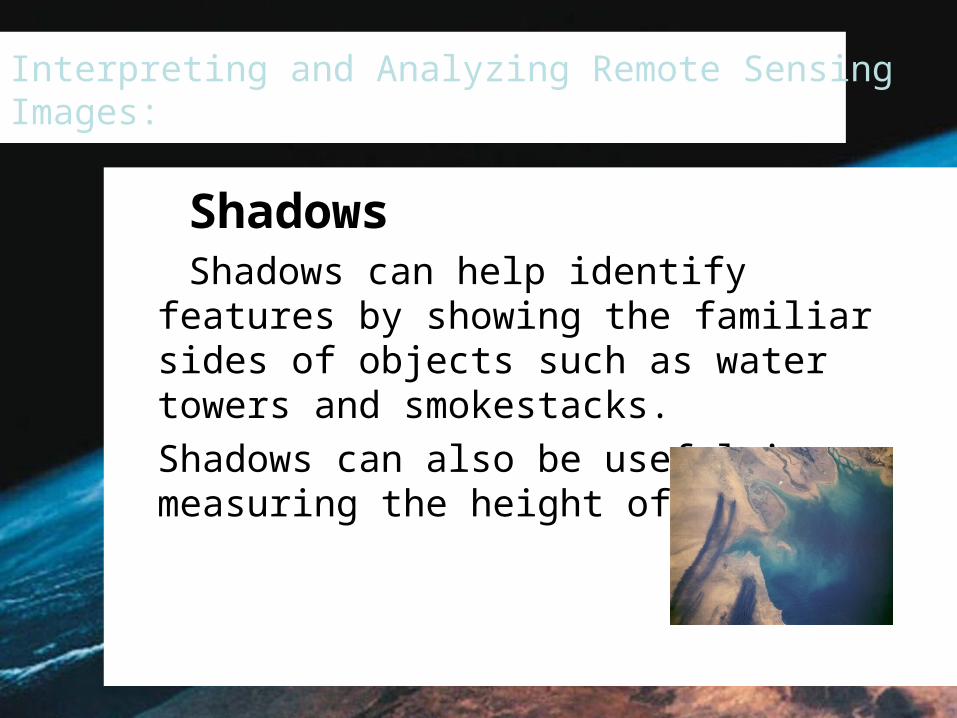
Shadows Shadows can help identify features by
showing the familiar sides of objects such as water towers and smokestacks.Shadows can also be useful in measuring the height of objects.
Interpreting and Analyzing Remote Sensing Images:
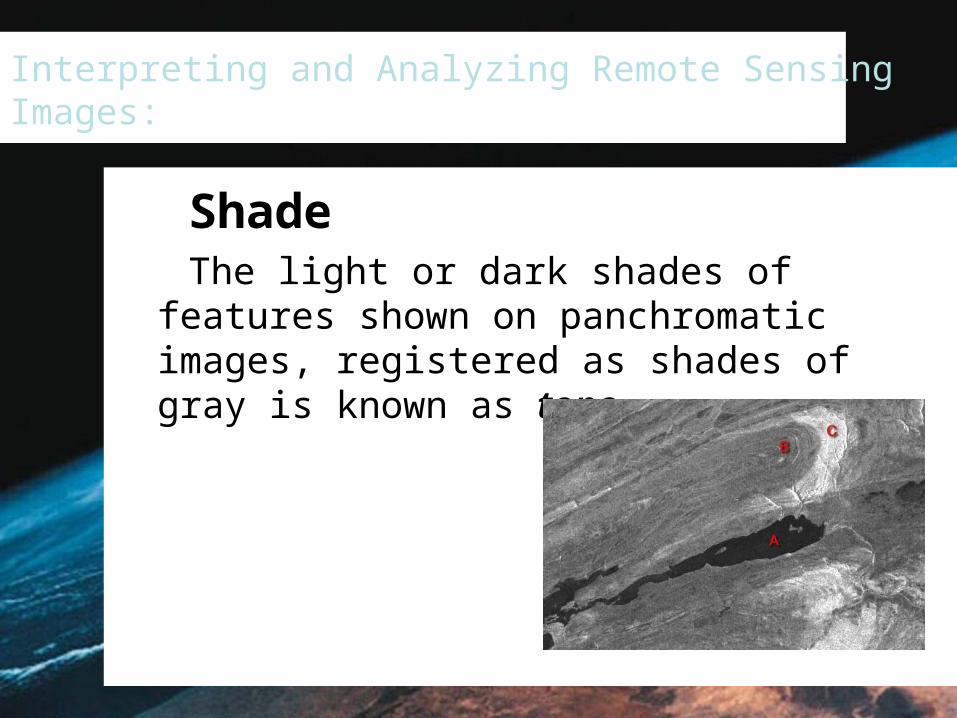
Shade The light or dark shades of features
shown on panchromatic images, registered as shades of gray is known as tone.
Interpreting and Analyzing Remote Sensing Images:
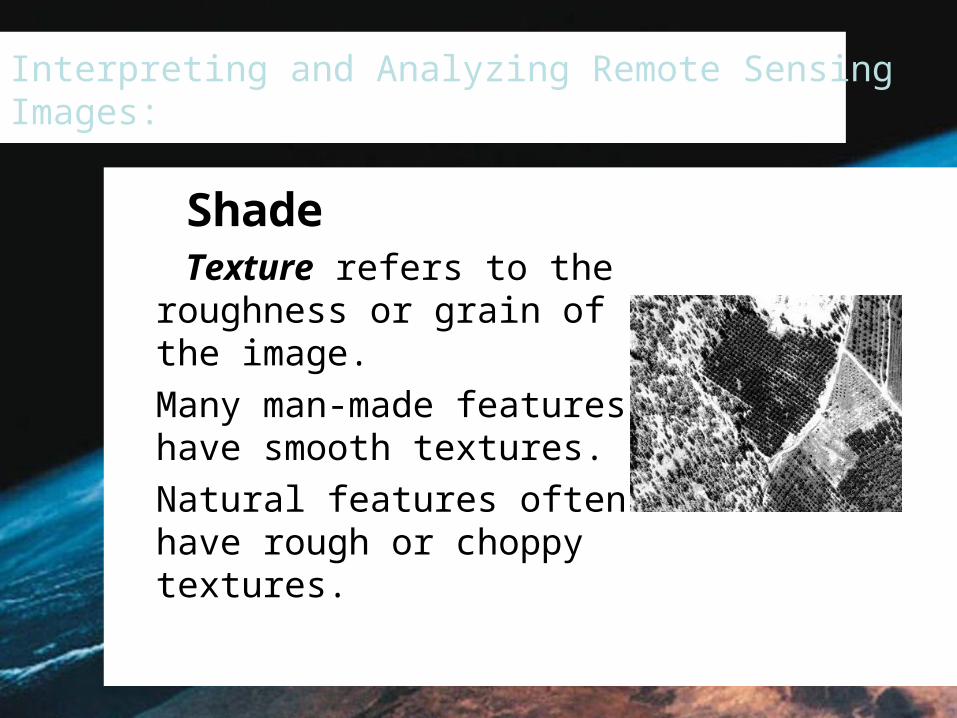
Shade Texture refers to the
roughness or grain of the image. Many man-made features have smooth textures.Natural features often have rough or choppy textures.
Interpreting and Analyzing Remote Sensing Images:
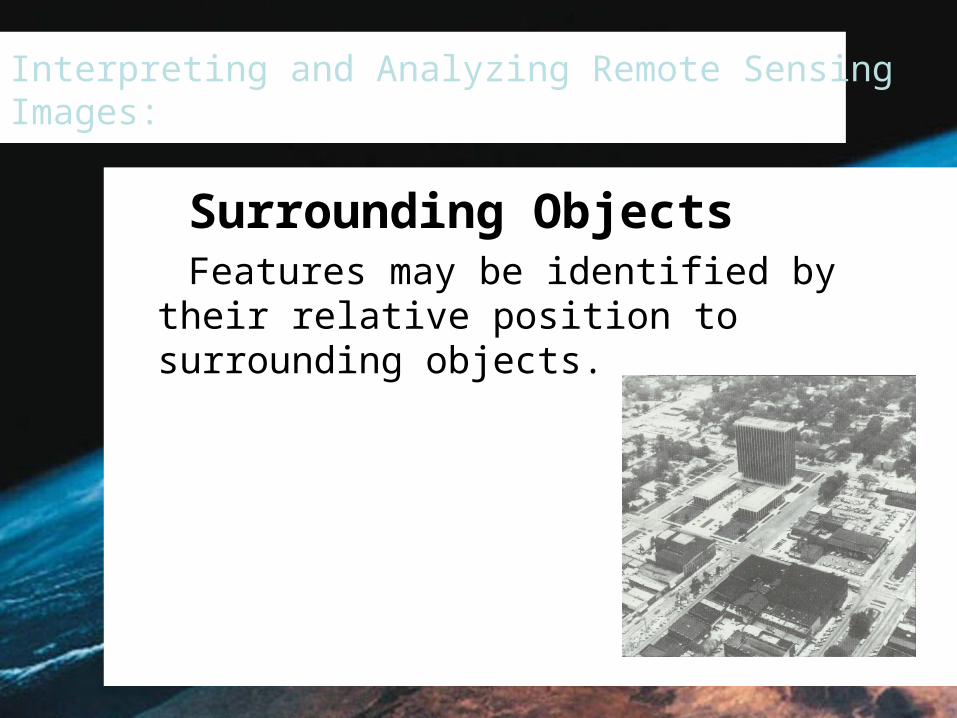
Surrounding Objects Features may be identified by their
relative position to surrounding objects.
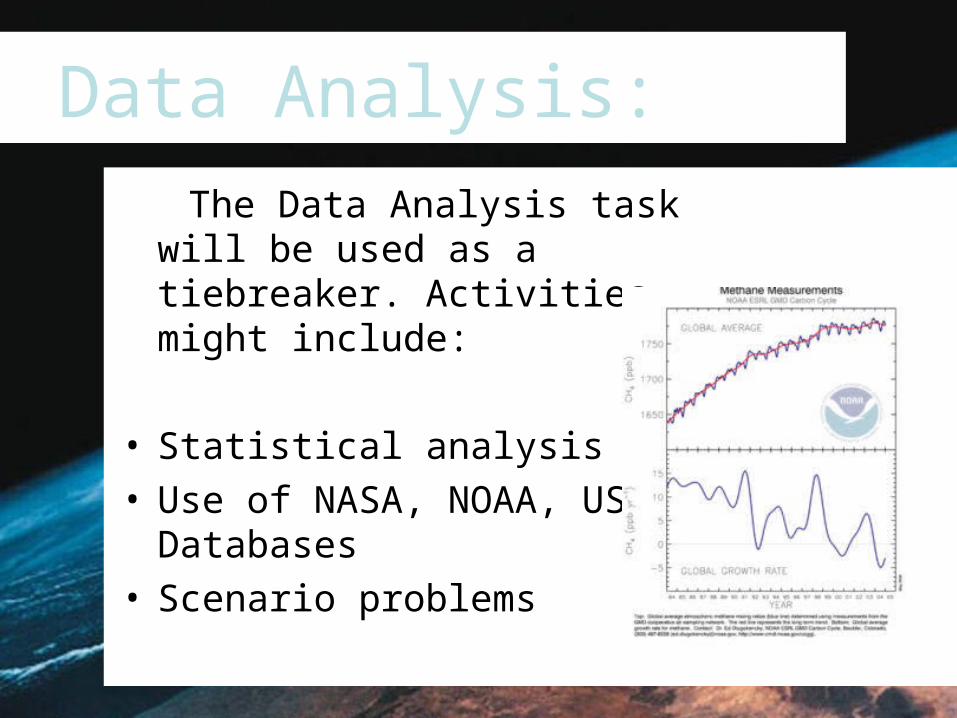
Data Analysis: The Data Analysis task will
be used as a tiebreaker. Activities might include:
• Statistical analysis• Use of NASA, NOAA, USGS
Databases• Scenario problems
CONCLUSION:Remember the three event parameters:• Use of remote sensing images to
identify natural and human activities that affect the environment
• Use of remote sensing images to identify and analyze the effect of natural and human activities that affect the environment
• Analysis of charts, tables and graphs