Embed Size (px)
Citation preview
2009 Online Traders World Expo Presentation
Dow Jones Industrial Average Layout for 2009
By Robert Giordano
Unfortunately due to unforeseen circumstances I was unable to attend (via guest speaker)
the January 2009 “Traders World Online Expo.” However I still feel most can benefit
from the research by placing it online for all to read.
Start….
What I’m going to do over the next hour is to answer the following 4 questions to the best
of my ability.
First..…….…Who were the Masters?
Second..…….What I feel they believed?
Third…….…What is Gann Grids Ultra?
Forth……….Why did I build the software?
Several actual cycle examples of the Dow Jones industrial averages dating back to
1928 will also be viewed at the end of this presentation.
In the early part of 1993 I became interested in becoming a technical research specialist
and sought as much information as I could find at the time. I researched countless books,
courses and articles while at the same time testing dozens of technical forecasting
systems. But what I came to realize after about a year and a half of intense study was that
most if not all systems just seem to fall short in actual trading results.
It was only after I began testing the tools and techniques written about by the masters
that my trading slowly start to improve.
Q1 But who are the masters…..
Well, what I found after my research was that the names of W D Gann, R N Elliot, and
George Bayer stood out among the rest as being the best of the best within the field of
technical analysis and forecasting.
But why…What was discovered was each in their own way had a larger then life Bio
along with having an astonishing track record of forecasting market turns weeks and at
times months in advance…Documented!!
To me this was reason enough to dig deeper into their methods.
However, the fact that Gann and Bayer used a kind of astronomy to generate parts of
their forecasts didn’t sit well with me at first, in fact to me at that time the whole subject
was nothing more then superstition and mumbo jumbo rather then an actual science.
However……what I did eventually begin to see after 3 years of trial and error research
on their systems was Gann spoke freely about many natural and interesting laws such as
the laws of vibrations, the laws of geometrical angles, range divisions, time cycles, and
natural time sequencing followed by an introduction to his master calculators.
He also held a unique understanding of astronomy and astrology as explained in several
examples of planets having a direct relationship to price support and resistance levels
along with other astronomical calculations.
It started to become clear to me at this point that his understanding of astronomy was
more of a hard factual science that could be back tested and confirmed, rather then just
chart interpretations of pending doom and gloom. His type of astrological forecasting was
more of an astronomical method with straight forward rules rather then what would be
given from most street corner astrologers both around at that time or even today …… I
was intrigued!
Now George Bayer spoke of Hebrew letters, graphical ellipses on specially sized chart
paper, large amounts of astronomical observations on what he felt were the keys to
unlocking most markets price and time reversal periods. His research was on aspect
timing using the planets and hot zodiac degrees locations, theory behind solar and lunar
eclipses in forecasting along with something he called his 5 fold horoscope.
He also felt many ancient metaphysical texts where filled with hidden secrets of natural
time cycles as explained in his various books and courses. He also stated this was the
origin of his unique research and astronomical trading tool applications.
R N Elliot believed his research on the natural coincidences of a special number cycle
was consistent with not just the fluctuations of our universal markets but also tied directly
into nature herself. He found that the Fibonacci sequence, the golden ratio, and a distinct
number pattern found within his pyramid research were all around him all the time.
He found the sacred sequences of numbers in natural plant growth, sea shell spirals,
vortex spirals, planet rotation cycles, sacred architectural geometry, musical note
intonations and galactic progressions.
Now, being a skeptic not to mention having no idea what each was trying to convey in
my earlier research had led me to begin testing each and every tool in exactly the way
instructed to do by each within their various books and courses.
And to my surprise I found many of the mathematical cycle methods and astronomical
tool applications did in fact work…. and at times work well!!
(But found all the tool applications discussed by each needed to tested and combined at
the same time in order to get the best results.)

However was each trader a 100% accurate all the time?…..NO……!
As a matter of fact most researchers including myself believe each was only about 60-
70% accurate at their very best and their systems both then and now need to be combined
with solid money management techniques and systems in order to stay alive.
However is being 60-70% accurate good enough to make profits in trading?
The answer is of emphatically………. YES!!
And it seems that this is what the master’s seemingly brought to the table within their
personal research and trading records.
Q2 The million dollar question!! Now, most of my students have asked me at one point or another why was their system so
different and where could they have possibly learned it?
The closest I have come to answering that question is:
It’s my personal belief that each in their own way was a true speculator and gambler….
and as such each instinctively knew that the laws of statistical analysis would give them
the much needed edge to stay alive and even profit from when done correctly.
Each felt just as professional gamblers know after many years of play just how and when
to stack the technical odds in their favor first before placing a bet. The masters also
understood that every subject which discussed cycle analysis and market timing no matter
how odd or strange needed to be examined, tested and if worked mastered with the
astronomical and mathematical methods being no exception.
Over the years I found many metaphysical titles (recommended reading list along with
others) dating back from the 1850’s to the present holding many clues to their unique
energy date research. Each book is just filled with the importance of astronomical
observations as being clues and keys to the timing of various events throughout history.
And to confirm this… anyone whom ever researched the masters recommended reading
list can plainly see that a metaphysical and scientific link is interwoven within their
trading methods, and the odd titled texts written by such authors as Johndro, Sepharial,
Jenson, Dewey, Gillen and many others were only small pieces to a much larger subject.
On another interesting note ….A potential link between Gann’s research was found in a
book first published in 1949 though written many years earlier called “The Cosmic
Doctrine”. In this book Dion Fortune a true occult master examines and explains several
unique spiral charts called “The Ring Pass Not”. She explained in this unique research
that each spiral had a much larger cosmic connection then most I have reviewed over the
years. To me each chart also looks uncannily like Gann’s spiral 9, 4 and hexagon charts
of which so much emphasis was placed within his cosmic and astrological research.
However, to them stock trading was still nothing more than stacking the technical odds
first before placing a trade (a very mundane strategy). Each also knew very well that ALL
the tools must be combined at the same time as no one tool was accurate enough to be
used alone.
(It is evident that each only used the dates and prices which clustered together in large
numbers after primary research which gave them in my opinion their highly accurate and
documented forecasts.)
But does astronomy really work in forecasting?
Now my personal opinion on the subject is:
This subject cannot and should not be used alone ……and it is NOT the “Holy Grail” to
forecasting. There are just way too many variables within that science for it to be used as
a dependable or reliable science alone.
However not to say it doesn’t work….. Many people including myself over the years
have done extensive research proving that this is… a very REAL and at times a very
accurate science.
As a matter of fact I use it all the time within my own personal research as I found it to be
a truly indispensable science when used correctly. However, understanding its pitfalls it
is only used after my primary cycle research had been done first.
Q3 What is Gann Grids Ultra
Gann Grids Ultra has 2 versions…. a Basic version which is a non astro version and an
Advanced version which includes all the astro technical tools found to work best along
with all the basic versions applications.
Each application is unique to the software and was built by us at Pivot Point Research to
help expedite the technical requirements for the “Pivot Point Proprietary Trading
Systems”…………Taught by us on a 1 to 1 basis.
Each unique software package helps research and test the highest percentage worthy
forecasting tools learned within the masters works along with many other user friendly
technical applications.
The primary goal of this software is to set up actual price and time forecasting models for
most stocks, commodities and indexes along with finding unique sets of stop loss order
locations.
Q4 Why did I develop the software?
For me it was only after I began to scale and re-scale the price and time charts using a
prototype of the new "Gann Grids Print Programs" that I actually began to see the true
value of their master overlays and indicators.
I also began to see that most stocks, commodities and indexes worked primarily off
different price and time harmonic proportions that could only be found through this type
of trial and error research.
However every tool learned needed to be painstakingly drawn on the blank charts by
hand and tested 1 by 1. This research just took too long on multiple research applications
and projects to be useful.
Though I did learn a great deal hand drawing all the applications on the printed charts I
however felt a new shortcut was needed. To me testing the key concepts which in my
opinion held several of the secret ideas hidden within the planetary price channels so
vaguely spoken of by WD Gann in his astro letters, the general concept behind the Elliot
wave price/time periods, and the George Bayer astronomical chart patterns was my main
priority.
However….with the new Gann Grids software package there’s no need to hand draw the
applications read about within their various books and courses on the print version's
charts!! You can now view most of the highest percentage worthy odd stacking systems
one at a time or all at once on screen with a simple click of a button!
2009 Dow Jones Industrial Average updated article
6 Reasons for support at 7150-7225 on the Dow Jones Industrial Averages!
Presented to Traders World in Oct 2008
6 Reasons for support at 7150-7225 on the Dow Jones Industrial Averages was an article
written for Traders World magazine in Oct 2008. The following addition expands on that
article showing several new and unique Gann Grid techniques highlighting 2009 as being
an extremely volatile year.
Reason 1
Most have come to realize over the past several months that our financial markets are
showing extreme volatility in regards to DAILY price swing fluctuations …….But why?
Playing with the Dow Jones industrial Average on a monthly chart and looking for some
key support or resistance levels using the Gann Grids Ultra software several unique
discoveries were found.
What was discovered after applying Gann’s master squares as overlays along with others
(90, 144, 52 and 14,407 the square of the high) I found the square of 144 was by far the
most consistent in both time and price fluctuations then all the others!
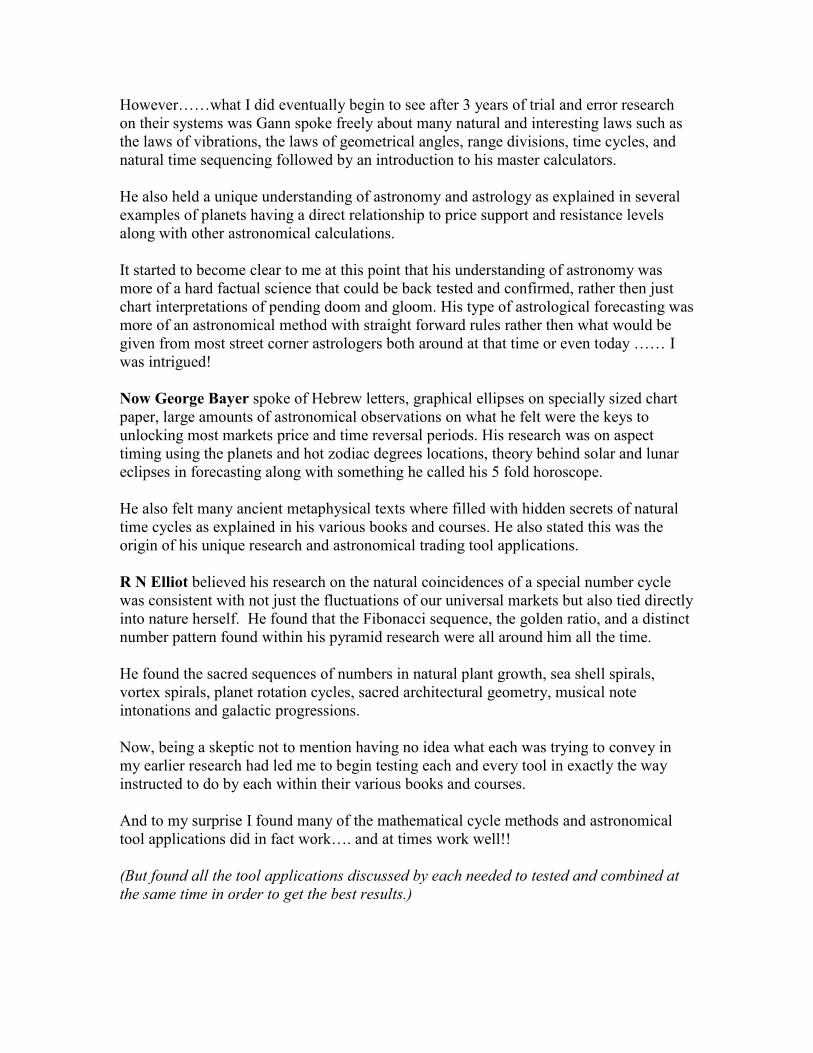
As the following charts will show, when starting the 144 square on the Dow’s Oct 2002
Low of 7177 and FINDING the proper price scale we see Oct 2008 is exactly 72 months
or dead center of the square of 144 in TIME and coming very close to the exact bottom of
the square located at 7225 in PRICE!
We can also very clearly see that starting on the Oct 2002 low the 2-1 and the 1-1 angle
consistently show almost every major support and resistance level to date.
If the 144 square is to be consistent into the end of 2008-2009 a price target between
7150-7225 is eminent.
Reason 2 Using Gann and RN Elliot’s high price division rule of 50% we see if we divide the all-
time Dow high of 14225 made in Oct 2007 by 2 we see a major support level at around
7112.
It’s also an exact 100% retracement of the last major AB swing Range or a double bottom
back to the last market low in 2002.
Reason 3
You may also note that the October 2002 low is the 5 year anniversary month to the 2007
top, 7 years from the 2000 top, 6 years to the 72 month mark or 50% of the square of 144
and Oct 2008 is the exact 1 year anniversary to the 2007 top all of which indicate extreme
volatility!
Reason 4 After researching the properties of numerical squares in relation to price support and
resistance levels in both price and time I found the concept to be a fairly accurate tool.
If we take the number 85 and square it in price we also see that 85x85 = 7225
A perfect square!
7200 is also exactly 20 full cycles of 360 up in price from zero and 7385 is 19 full cycles
down from the 14225 top.
On a positive note …….The above research comfortably shows that a price level of
7150-7250 is a sound reaction level for a potential rallying point for the Dow to advance
from…..At least for the short term!
On a negative note …….However, if the Dow Jones breaks bellow this level by more
the n 200-270 points within the next 3 months (Oct- Dec 08) it will place the price swing
well into the second square of 144 heading down with no support until 3900!!!
Each square’s major angles then become resistance levels rather then support into 2009,
10 and possibly beyond.
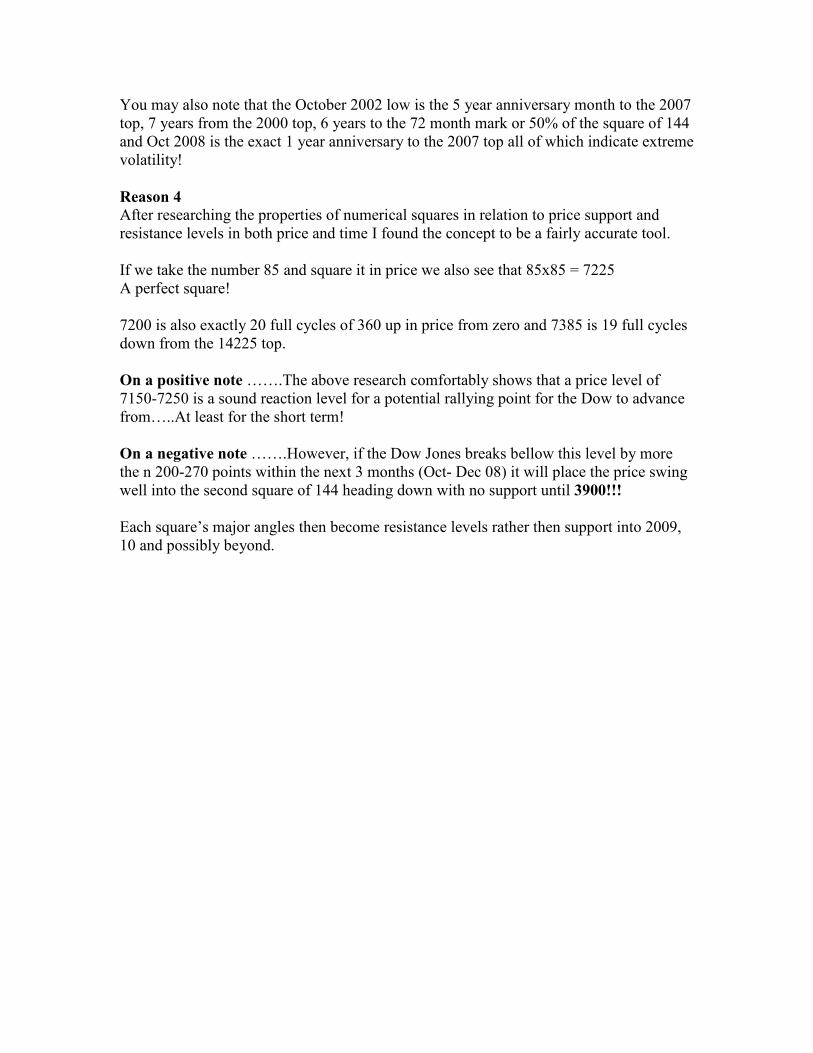
Reason 5
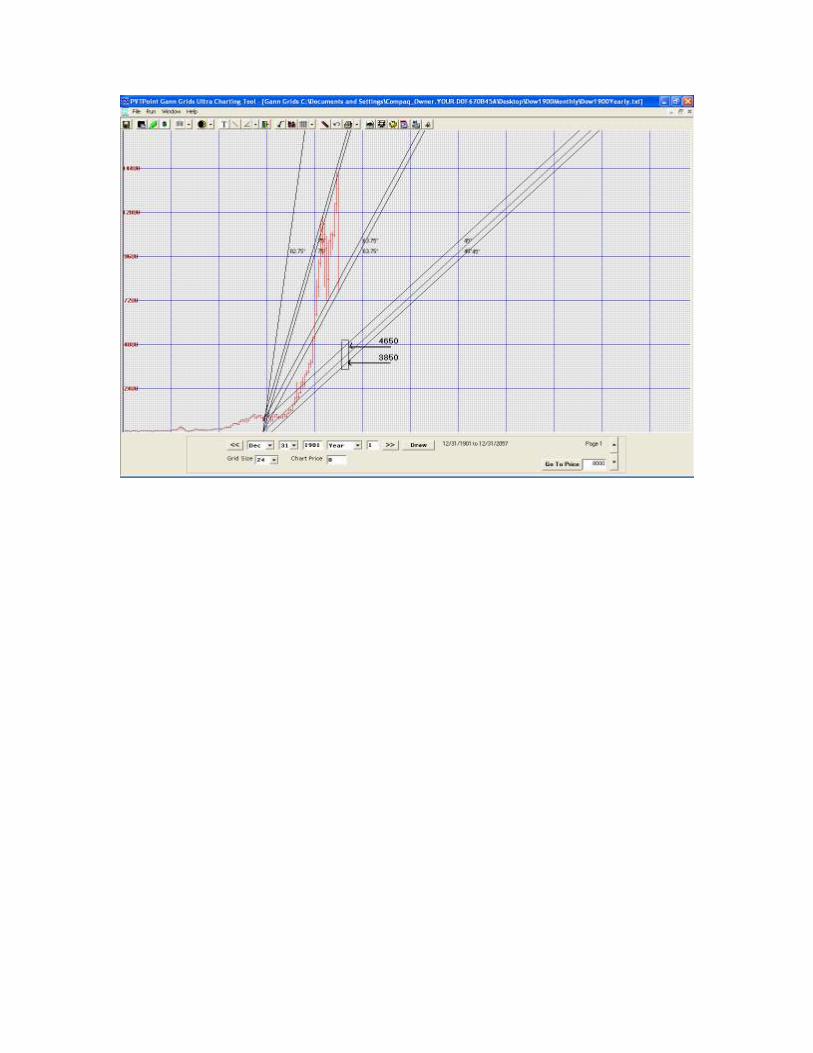
We also see when we start multiple Gann angles from the 1970 and 74 lows at “0”and the
exact bottoms (they seem to work best), several support and resistance levels are also
present on this yearly chart again showing if the 7125 number is crossed the next support
is between 4650-3850 depending on the year. Each year in the down market will hold a
slightly different bottom number as the angles show.
Dow Jones Yearly chart starting in 1900-2008 (Presented in Oct 2008)
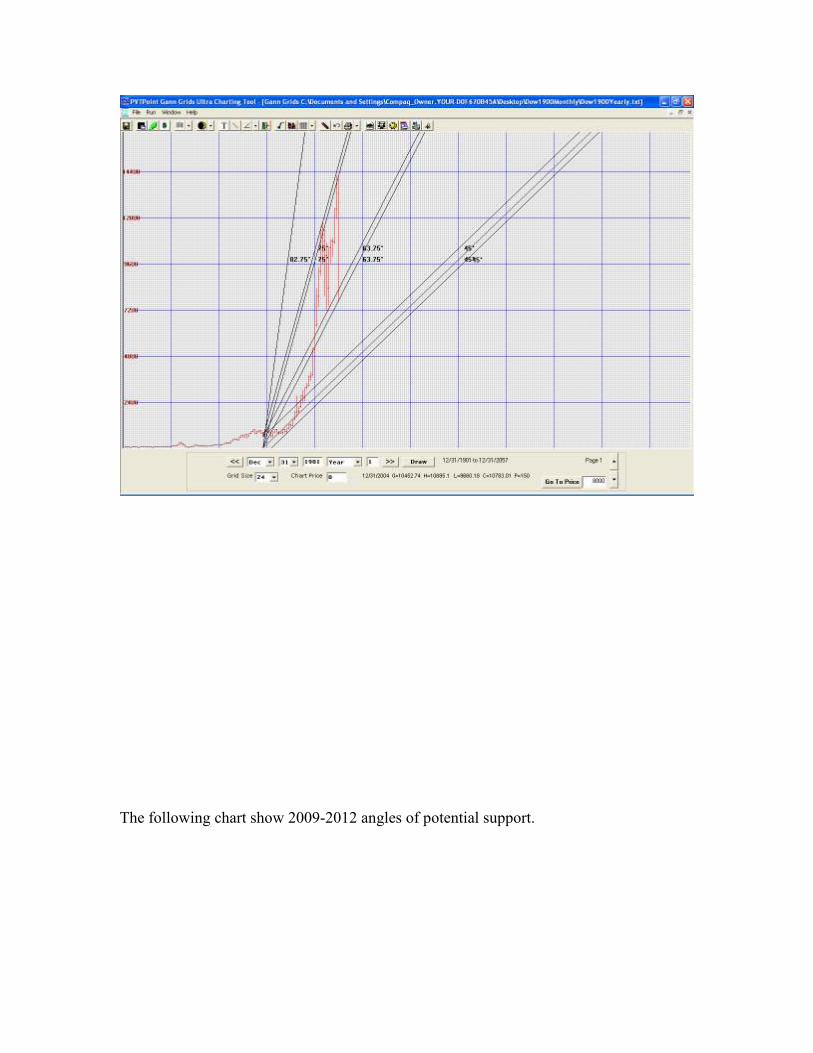
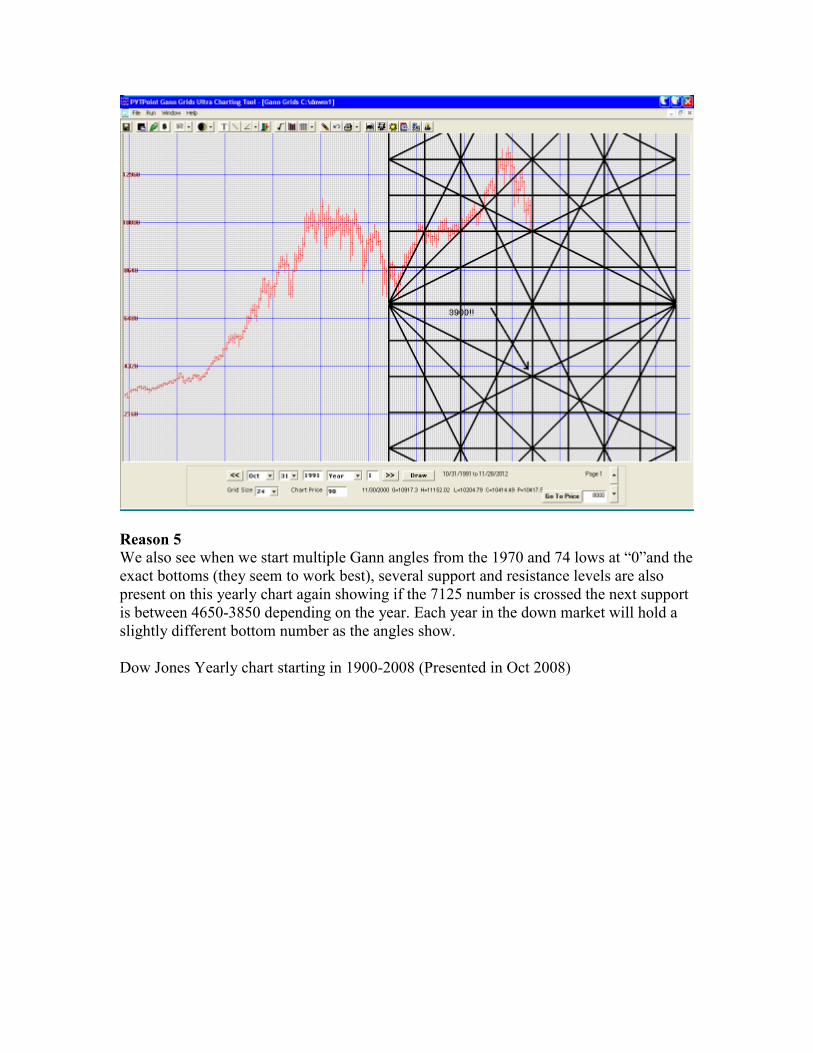
The following chart show 2009-2012 angles of potential support.
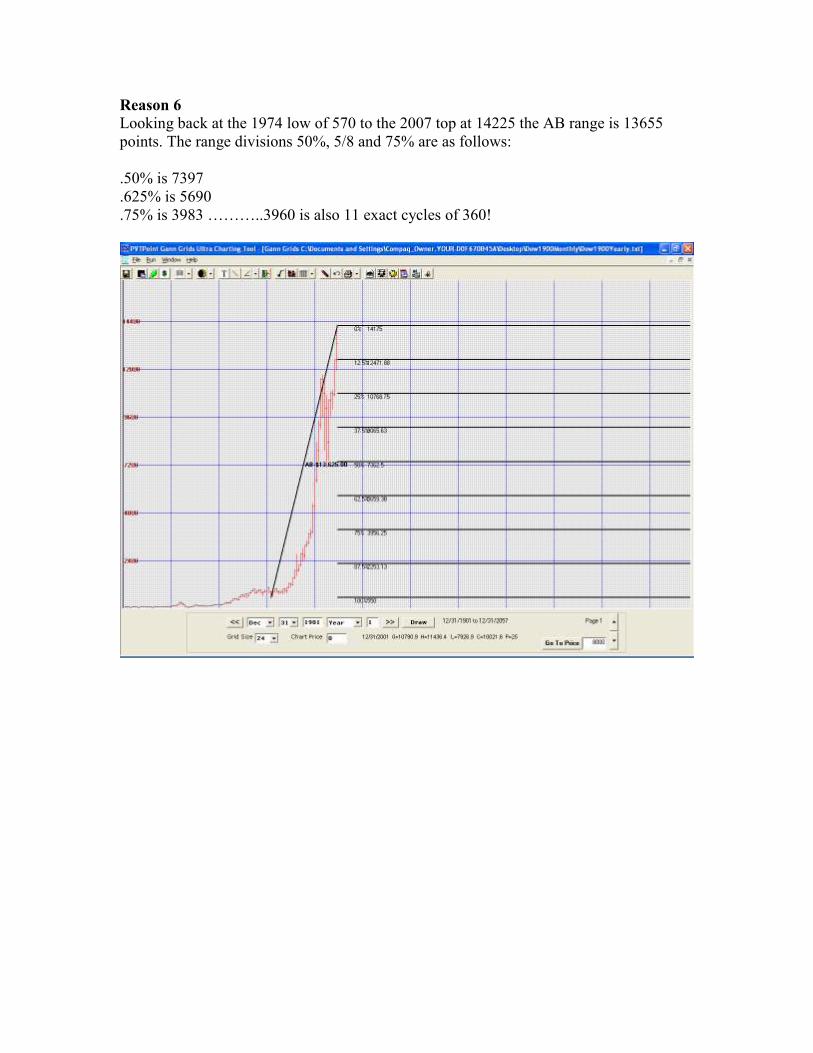
Reason 6
Looking back at the 1974 low of 570 to the 2007 top at 14225 the AB range is 13655
points. The range divisions 50%, 5/8 and 75% are as follows:
.50% is 7397
.625% is 5690
.75% is 3983 ………..3960 is also 11 exact cycles of 360!
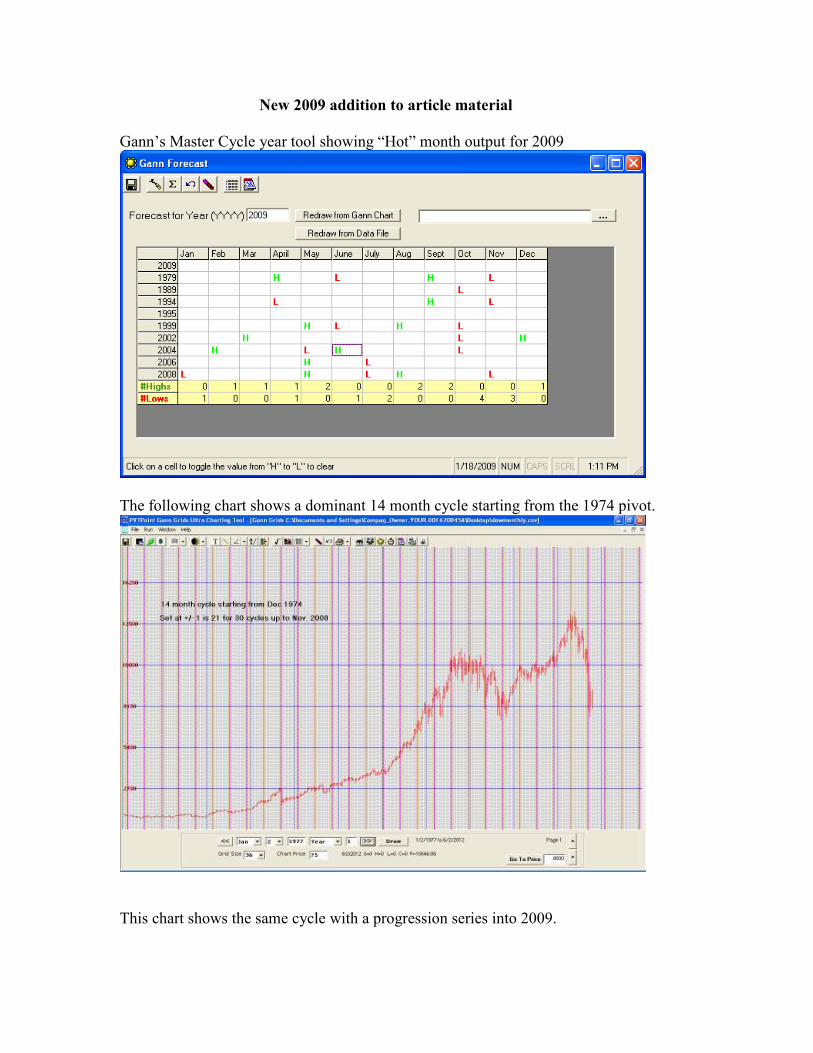
New 2009 addition to article material
Gann’s Master Cycle year tool showing “Hot” month output for 2009
The following chart shows a dominant 14 month cycle starting from the 1974 pivot.
This chart shows the same cycle with a progression series into 2009.
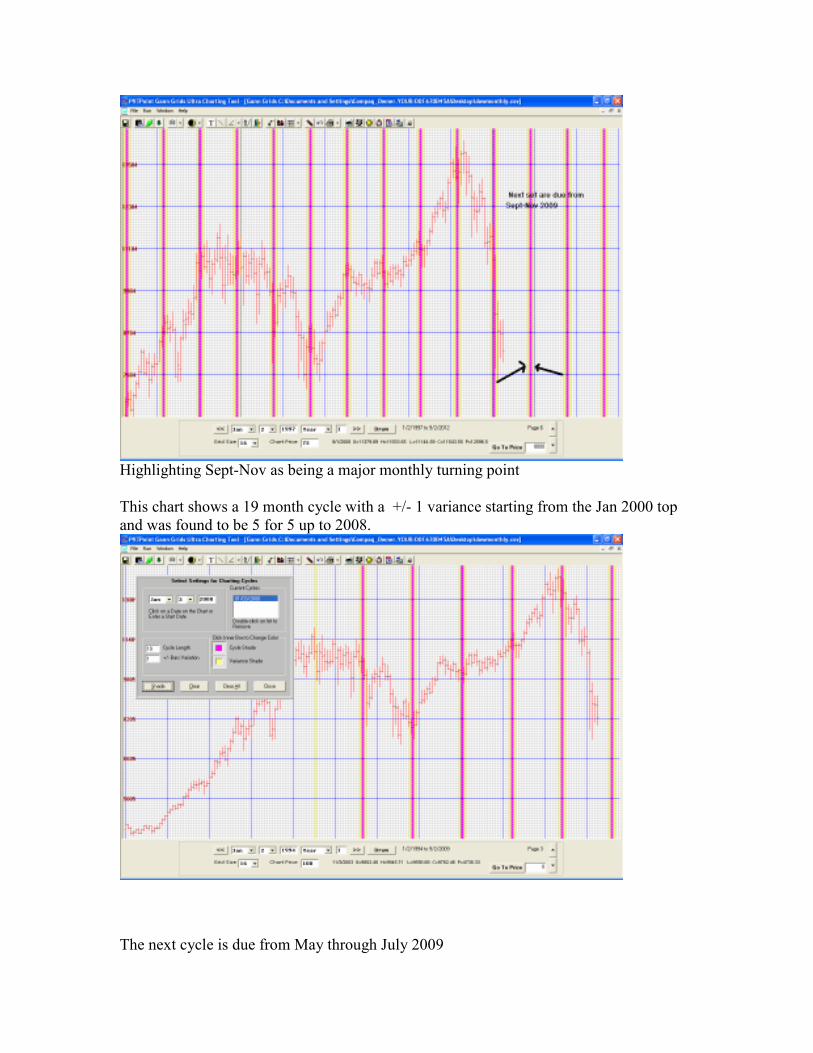
Highlighting Sept-Nov as being a major monthly turning point
This chart shows a 19 month cycle with a +/- 1 variance starting from the Jan 2000 top
and was found to be 5 for 5 up to 2008.
The next cycle is due from May through July 2009
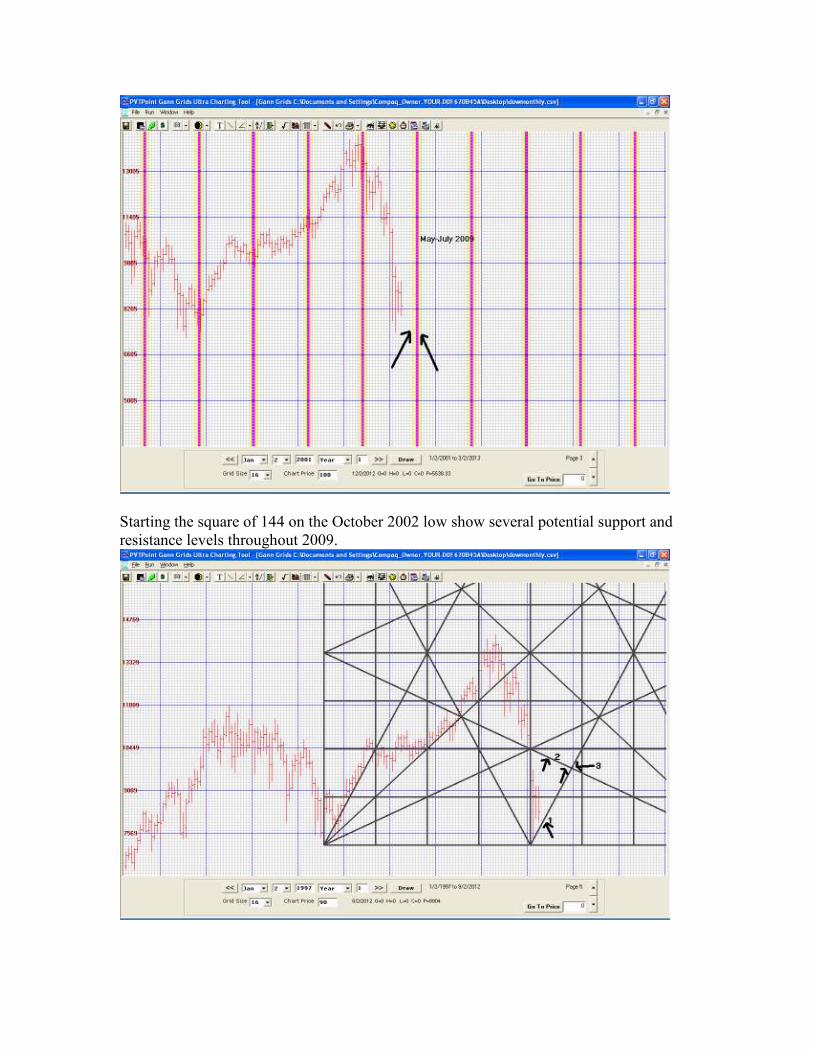
Starting the square of 144 on the October 2002 low show several potential support and
resistance levels throughout 2009.
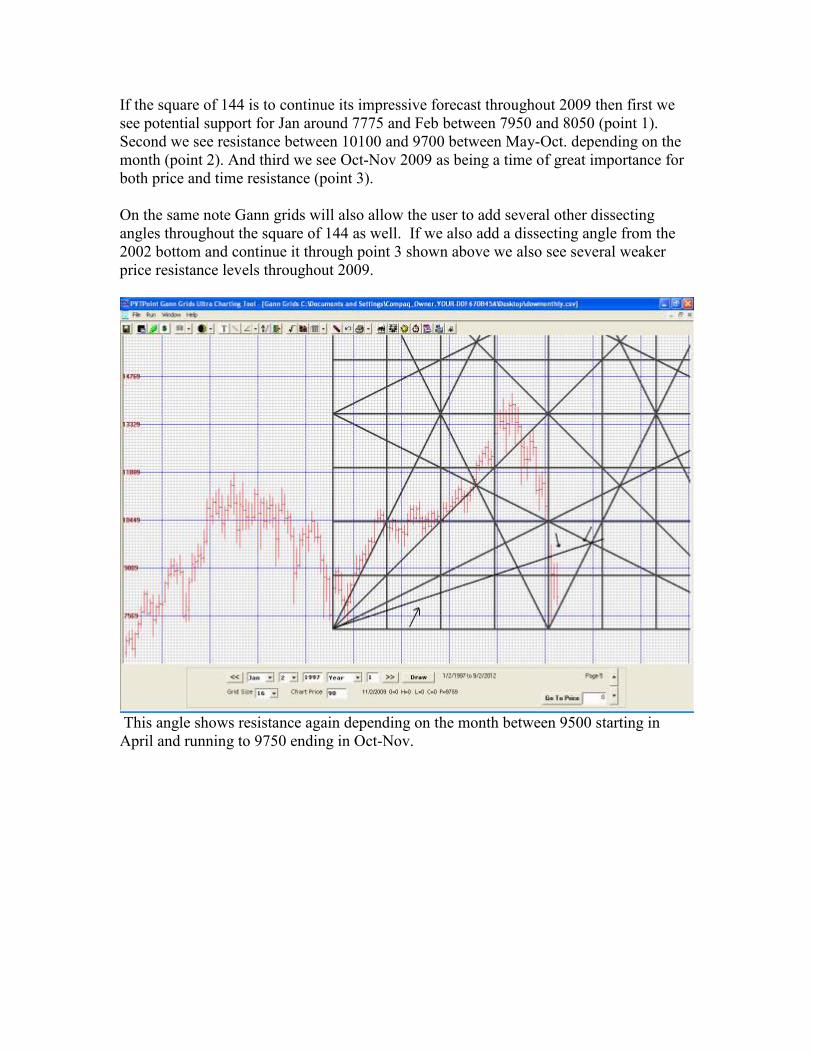
If the square of 144 is to continue its impressive forecast throughout 2009 then first we
see potential support for Jan around 7775 and Feb between 7950 and 8050 (point 1).
Second we see resistance between 10100 and 9700 between May-Oct. depending on the
month (point 2). And third we see Oct-Nov 2009 as being a time of great importance for
both price and time resistance (point 3).
On the same note Gann grids will also allow the user to add several other dissecting
angles throughout the square of 144 as well. If we also add a dissecting angle from the
2002 bottom and continue it through point 3 shown above we also see several weaker
price resistance levels throughout 2009.
This angle shows resistance again depending on the month between 9500 starting in
April and running to 9750 ending in Oct-Nov.
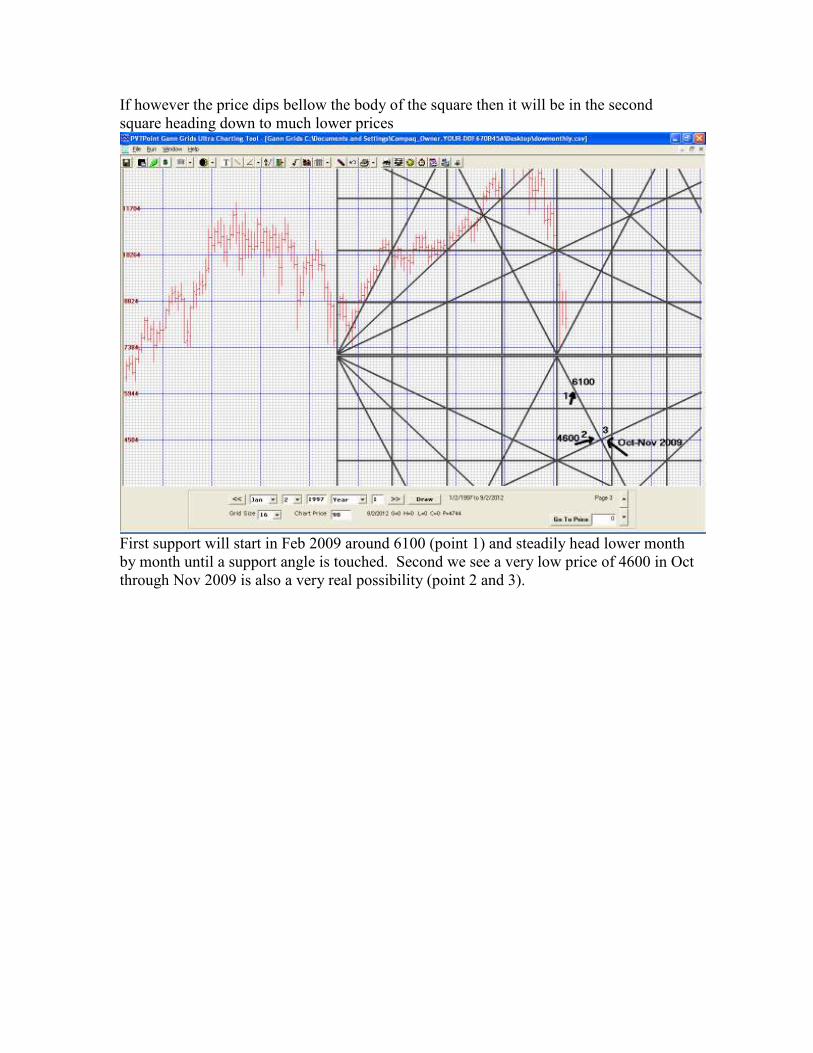
If however the price dips bellow the body of the square then it will be in the second
square heading down to much lower prices
First support will start in Feb 2009 around 6100 (point 1) and steadily head lower month
by month until a support angle is touched. Second we see a very low price of 4600 in Oct
through Nov 2009 is also a very real possibility (point 2 and 3).
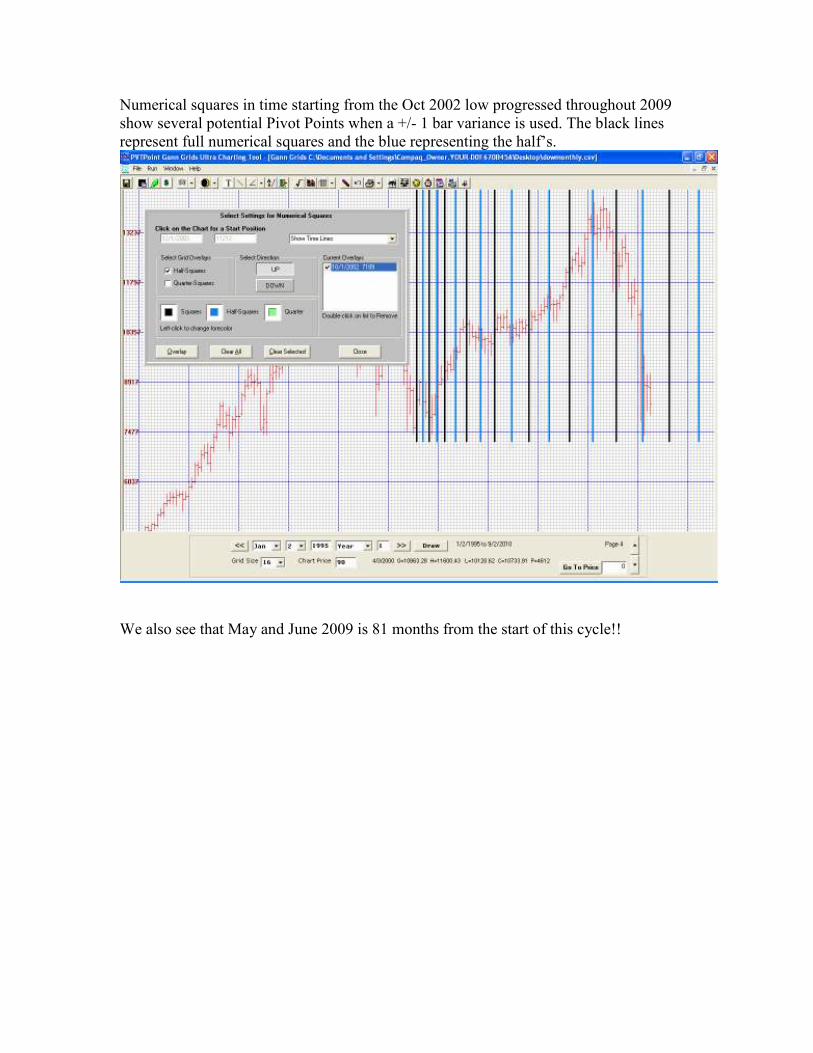
Numerical squares in time starting from the Oct 2002 low progressed throughout 2009
show several potential Pivot Points when a +/- 1 bar variance is used. The black lines
represent full numerical squares and the blue representing the half’s.
We also see that May and June 2009 is 81 months from the start of this cycle!!
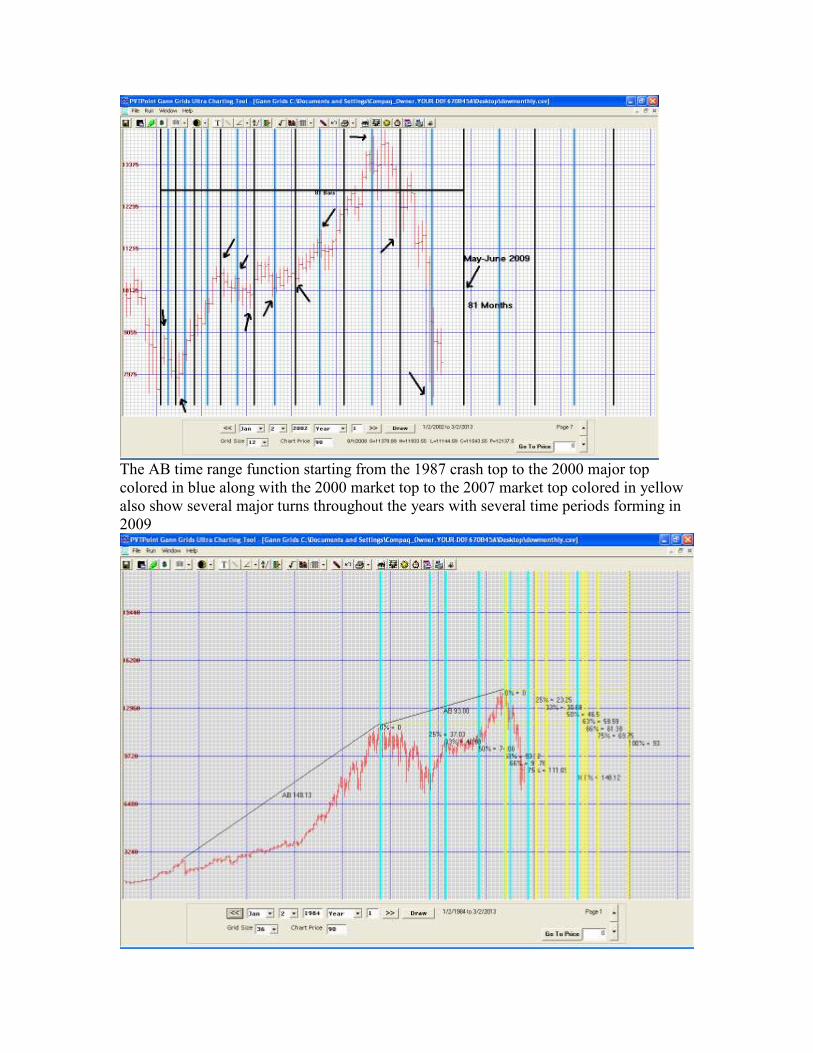
The AB time range function starting from the 1987 crash top to the 2000 major top
colored in blue along with the 2000 market top to the 2007 market top colored in yellow
also show several major turns throughout the years with several time periods forming in
2009
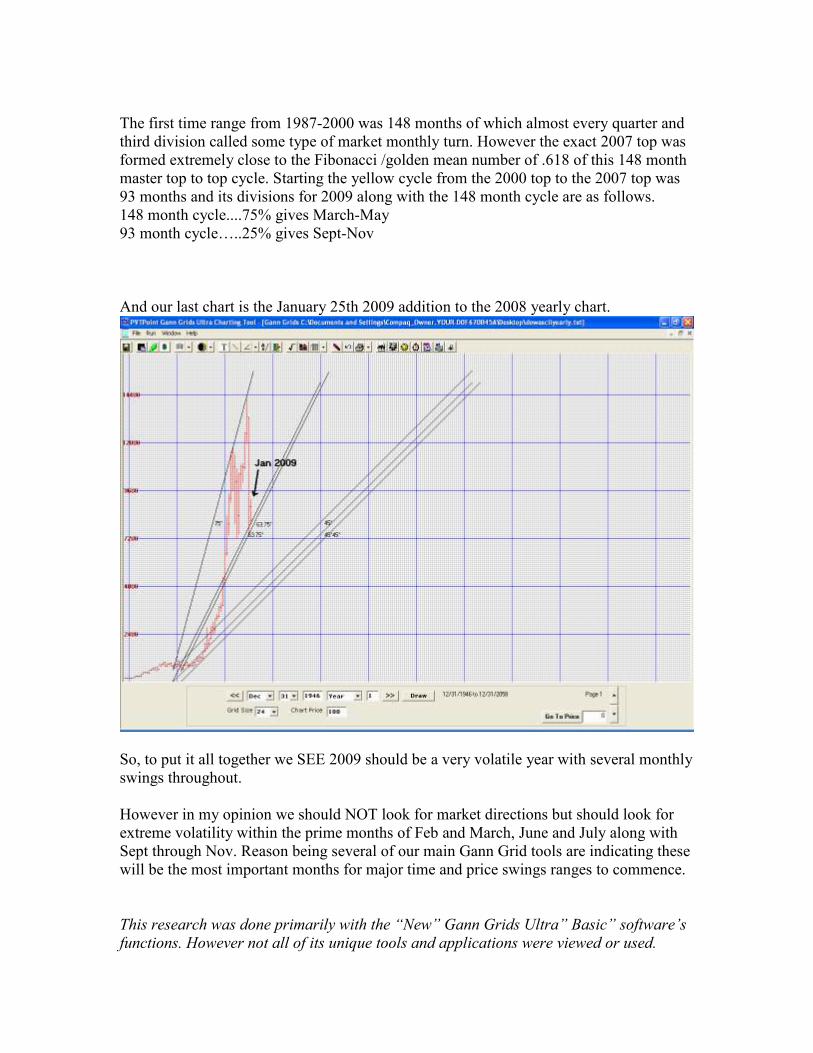
The first time range from 1987-2000 was 148 months of which almost every quarter and
third division called some type of market monthly turn. However the exact 2007 top was
formed extremely close to the Fibonacci /golden mean number of .618 of this 148 month
master top to top cycle. Starting the yellow cycle from the 2000 top to the 2007 top was
93 months and its divisions for 2009 along with the 148 month cycle are as follows.
148 month cycle....75% gives March-May
93 month cycle…..25% gives Sept-Nov
And our last chart is the January 25th 2009 addition to the 2008 yearly chart.
So, to put it all together we SEE 2009 should be a very volatile year with several monthly
swings throughout.
However in my opinion we should NOT look for market directions but should look for
extreme volatility within the prime months of Feb and March, June and July along with
Sept through Nov. Reason being several of our main Gann Grid tools are indicating these
will be the most important months for major time and price swings ranges to commence.
This research was done primarily with the “New” Gann Grids Ultra” Basic” software’s
functions. However not all of its unique tools and applications were viewed or used.
Astro research example done by “Advanced” version’s output.
It is ONLY after the monthly, weekly and daily cycles are found first as shown above
should the “Astro” energy date research featured within the “Advanced” version’s
functions be attempted.
It is only after both sciences are researched, understood and incorporated within the
master forecasting system taught by us at Pivot Point Research will the true forecasting
power of the software potentially become a very real and at times a very profitable
science.
The New Volatility Special Sales Price for GGU’S “Basic” version is only $179.95
I feel the real million dollar question is can you afford not to own it?
Thank You
Robert Giordano
www.pvtpointmktres.com
The following is an excerpt from a mini astrological research project posted on my
webpage done in July 2008 This is an overview of a research project done on July 8
th 2008 and sent via Email on July
10 2008 for the stock Disney (Symbol DIS). It was sent to a good friend and in my opinion master Astro research specialist in his own right….Mitch Lewis. Mitch Lewis is also the editor of a very insightful monthly news letter called “Living by Starlight”. Follow the dates and reasoning behind this forecast done by us at Pivot Point research given several months prior the completion of each……… Hey Mitch Ok, got some good stuff According to the astro and non astro research the HOT dates for the upcoming months 7/18-22 8/6-15 ..Very important! 9/21-24 10/13-19 also very important Multiple energy dates are culminating within them, both mundane and unique to Disney's price and time fluctuations I found Gio, xxx/Venus, xxx/Venus, and xxx/Uranus when combined along with Helio, xxx/Mercury/Pluto around the same day + or - 2 day was about 70% accurate in the past 30 years for forecasting main weekly and monthly swings. We also have a 24 week cycle with a +/- 2 variance also working at about 70% starting at its main top in May 2000. Using Gann's cycle year research we see Aug and Oct to be critical months for its trend change as well.
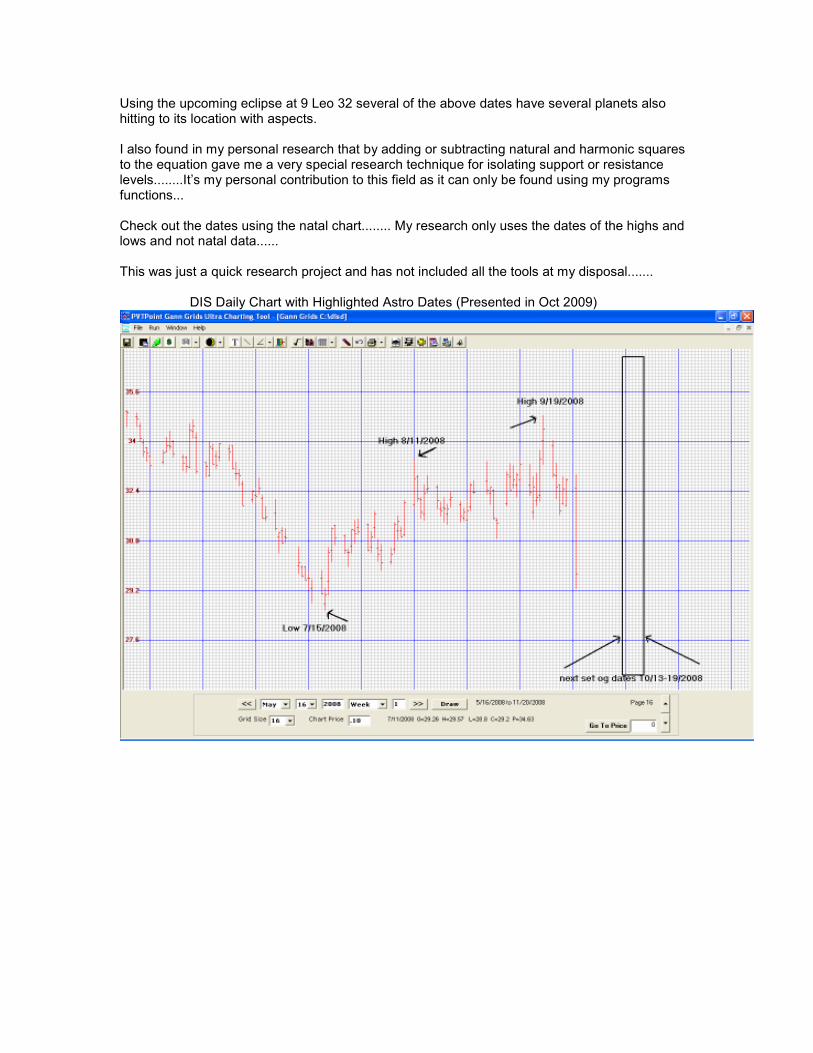
Using the upcoming eclipse at 9 Leo 32 several of the above dates have several planets also hitting to its location with aspects. I also found in my personal research that by adding or subtracting natural and harmonic squares to the equation gave me a very special research technique for isolating support or resistance levels........It’s my personal contribution to this field as it can only be found using my programs functions... Check out the dates using the natal chart........ My research only uses the dates of the highs and lows and not natal data...... This was just a quick research project and has not included all the tools at my disposal....... DIS Daily Chart with Highlighted Astro Dates (Presented in Oct 2009)
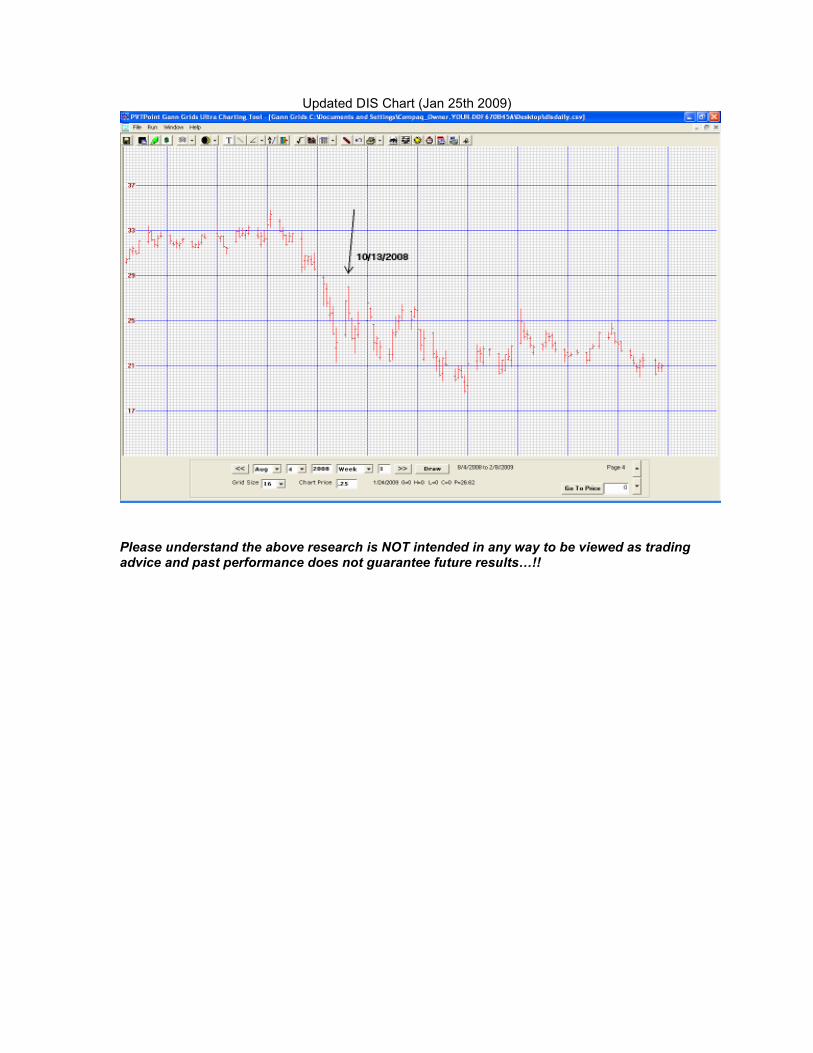
Updated DIS Chart (Jan 25th 2009)
Please understand the above research is NOT intended in any way to be viewed as trading advice and past performance does not guarantee future results…!!