Embed Size (px)
Citation preview
2009 Indiana Self-Sufficiency
Standard
1
The 2009 report was made
possible through generous
support from:
2
About the Self-Sufficiency
Standard• Developed and authored by Dr. Diana
Pearce
• The 2009 Indiana Self-Sufficiency
Standard is the fourth edition.
• Indiana is one of 37 states and the District
of Columbia with a Self-Sufficiency
Standard.
3
What is the Self-Sufficiency
Standard?
• Measures how much a family of a certain
composition in a given geographic location
needs to meet their basic needs without
government or private subsides.
• The Standard is calculated for 70 family
types in each of Indiana’s 92 counties.
4
Methodology and Assumptions
Making the Standard as consistent and accurate as possible,
yet varied by geography and the age of children, requires
meeting several different criteria. To the extent possible, the
data used in the Self-Sufficiency Standard are:
• collected or calculated using standardized or equivalent
methodology nationwide;
• obtained from scholarly or credible sources such as the
U.S. Census Bureau;
• updated annually*; and
• geographically- and/or age-specific, as appropriate.
* While the formulas and calculations for the Standard are updated
annually, the Indiana specific numbers are only updated every 3 years. 5
Housing Costs
• Fair Market Rents as calculated annually by the
Department of Housing and Urban Development (HUD)
• National Low Income Housing Coalition (NLIHC) Median
Gross Rents for each of the counties included in the
metropolitan areas
• To determine the number of bedrooms required for a
family, the Standard assumes that parents and children
do not share the same bedroom and no more than two
children share a bedroom.
6
Child Care Costs
• The Indiana Child Care Market Rate Survey was
prepared for the Indiana Family and Social Services
Administration (2008-2009)
• Assumes children are cared for at paid in-home daycare
facilities, or some type of daycare center– infant rates (0 up to 3 years of age) were calculated using the cost of
full-time care at licensed in home care facilities
– Preschooler rates (3 to 5 years of age) were calculated using the cost of
full-time care at a licensed center.
– schoolage children rates (6 to 12years) were calculated using part-time
licensed center care rates (to reflect before and after school care costs)
7
Food Costs
• The USDA Low-Cost Food Plan (June 2009)
• Costs of feeding children vary by number of children and age of the
children
• Costs of feeding adults vary by number and gender
– Single adult households = adult male
– Single parent households = adult female
– Two-parent households =1 adult male 1 adult female
• Geographically variations calculated by using the ACCRA Cost of
Living Index, published by the Council for Community and Economic
Research.
8
Transportation Costs
• The Standard assumes all workers use private transportation
(i.e. they own and maintain a car).
– One adult households are assume to own one car
– Two adult households are assume to own two cars
• Driving Cost data comes from the American Automobile
Association is used.
• Commuting Distances are calculated using national data from
the National Household Travel Survey 2001.
• Average Insurance Premiums are calculated with state data
from a survey conducted by the National Association of
Insurance Commissioners
9
Health Care Costs
• Employer-Sponsored Health Insurance for workers and their
families
– In Indiana the full-time worker’s employer pays an average of
79% of premiums for the worker and 77% of premiums for the
family.
• Premiums are obtained from The Henry J. Kaiser Foundation
State Health Facts online (individual and family premiums)
and by Anthem Blue Cross Blue Shield
• Out-of-Pocket expenses are also factored in, the data comes
from the Medical Expenditure Panel Survey (MEPS)
10
Miscellaneous Costs
• These costs are calculated by taking 10% of all other
costs
• This contains all other essential costs
– Clothing and shoes,
– Paper products,
– Diapers,
– Nonprescription medicines,
– Cleaning products,
– Hygiene items, and
– Telephone service
• It does not include recreation, entertainment, savings, or
debt repayment
11
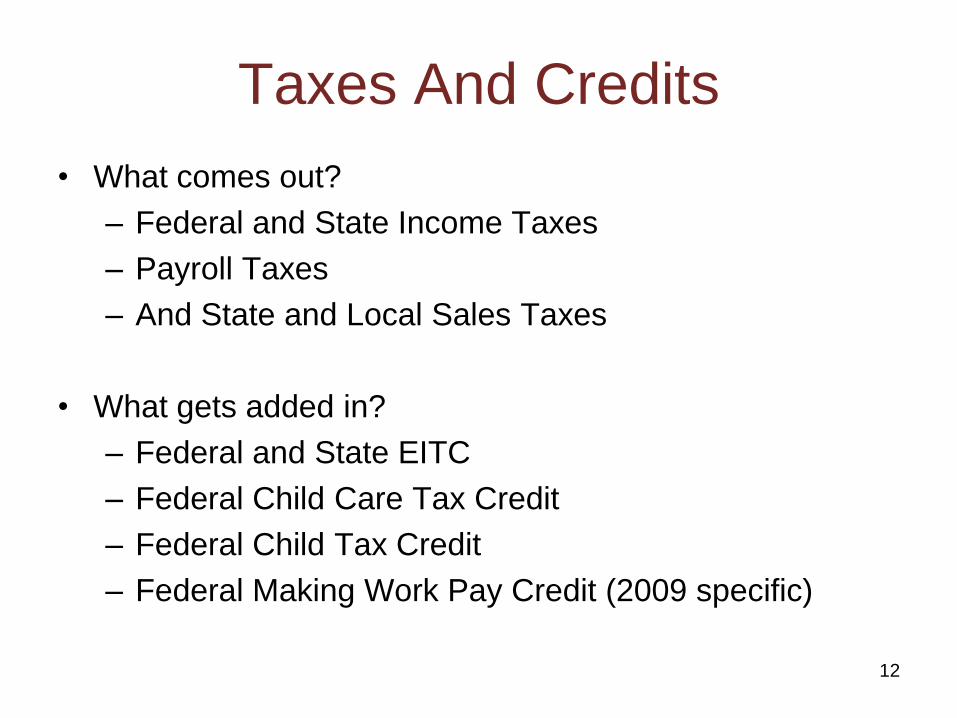
Taxes And Credits
• What comes out?
– Federal and State Income Taxes
– Payroll Taxes
– And State and Local Sales Taxes
• What gets added in?
– Federal and State EITC
– Federal Child Care Tax Credit
– Federal Child Tax Credit
– Federal Making Work Pay Credit (2009 specific)
12
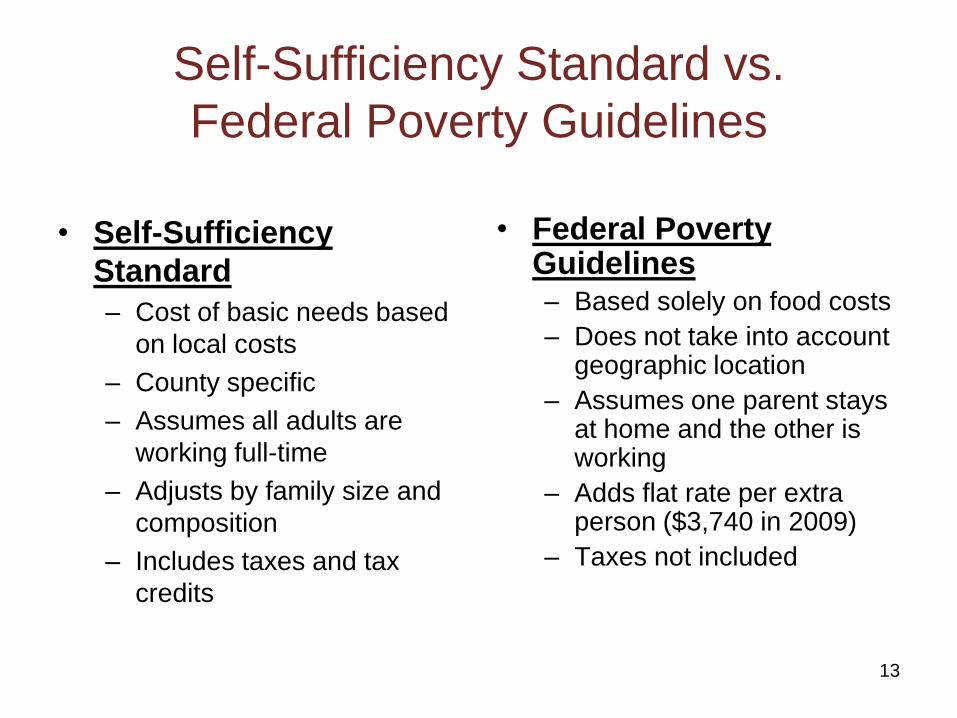
Self-Sufficiency Standard vs.
Federal Poverty Guidelines
• Self-Sufficiency
Standard
– Cost of basic needs based
on local costs
– County specific
– Assumes all adults are
working full-time
– Adjusts by family size and
composition
– Includes taxes and tax
credits
• Federal Poverty Guidelines– Based solely on food costs
– Does not take into account geographic location
– Assumes one parent stays at home and the other is working
– Adds flat rate per extra person ($3,740 in 2009)
– Taxes not included
13
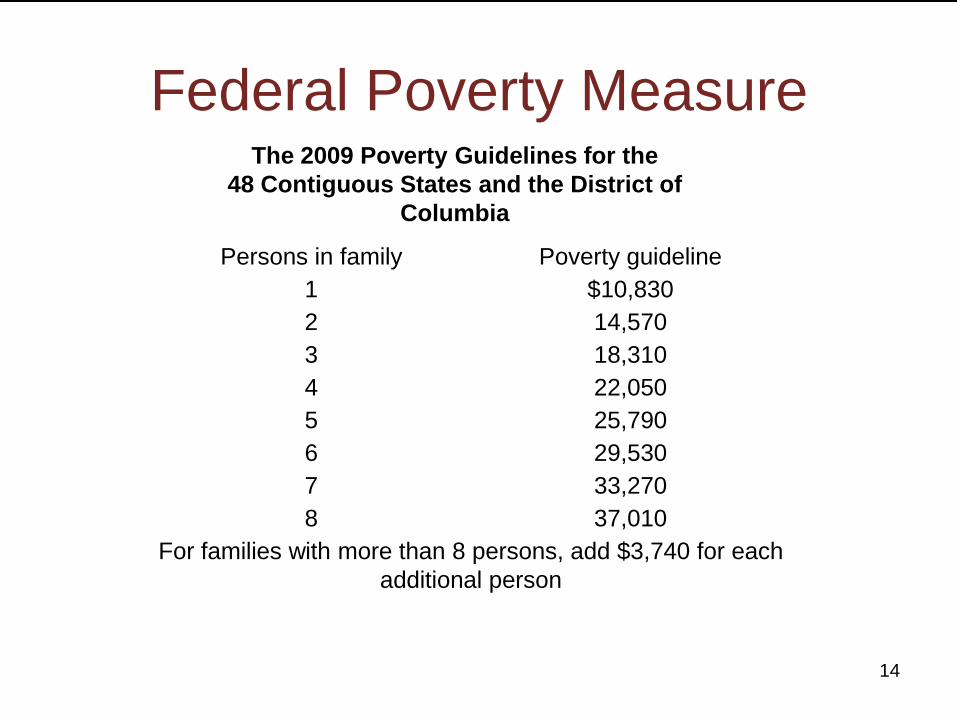
Federal Poverty Measure
14
Persons in family Poverty guideline
1 $10,830
2 14,570
3 18,310
4 22,050
5 25,790
6 29,530
7 33,270
8 37,010
For families with more than 8 persons, add $3,740 for each
additional person
The 2009 Poverty Guidelines for the
48 Contiguous States and the District of
Columbia
15
16
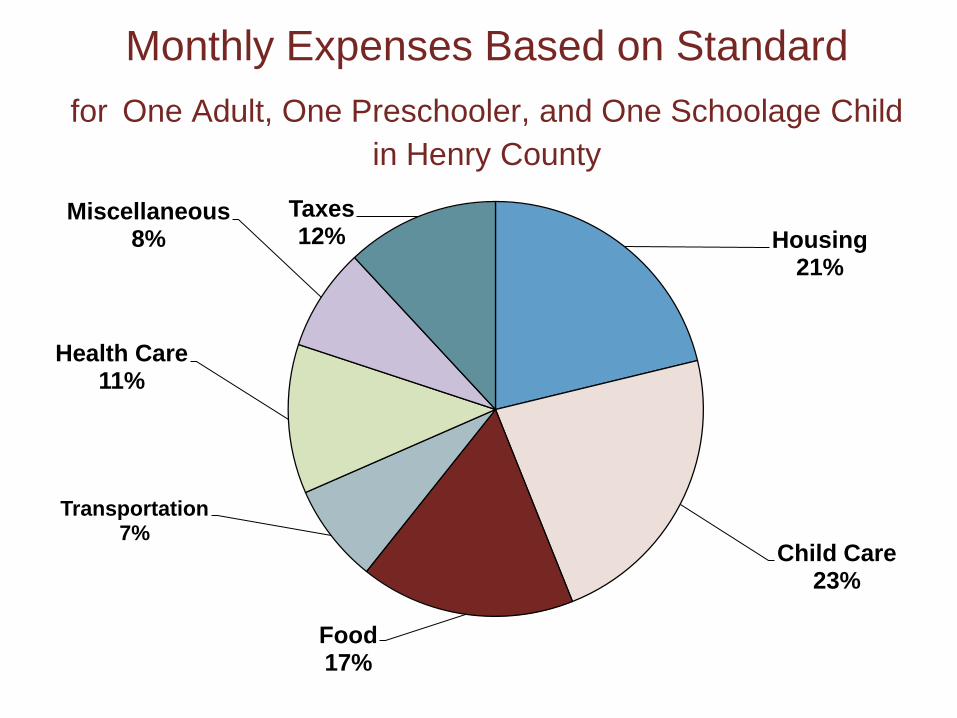
Monthly Expenses Based on Standard
for One Adult, One Preschooler, and One Schoolage Child
in Henry County
Housing21%
Child Care23%
Food17%
Transportation7%
Health Care11%
Miscellaneous8%
Taxes12%
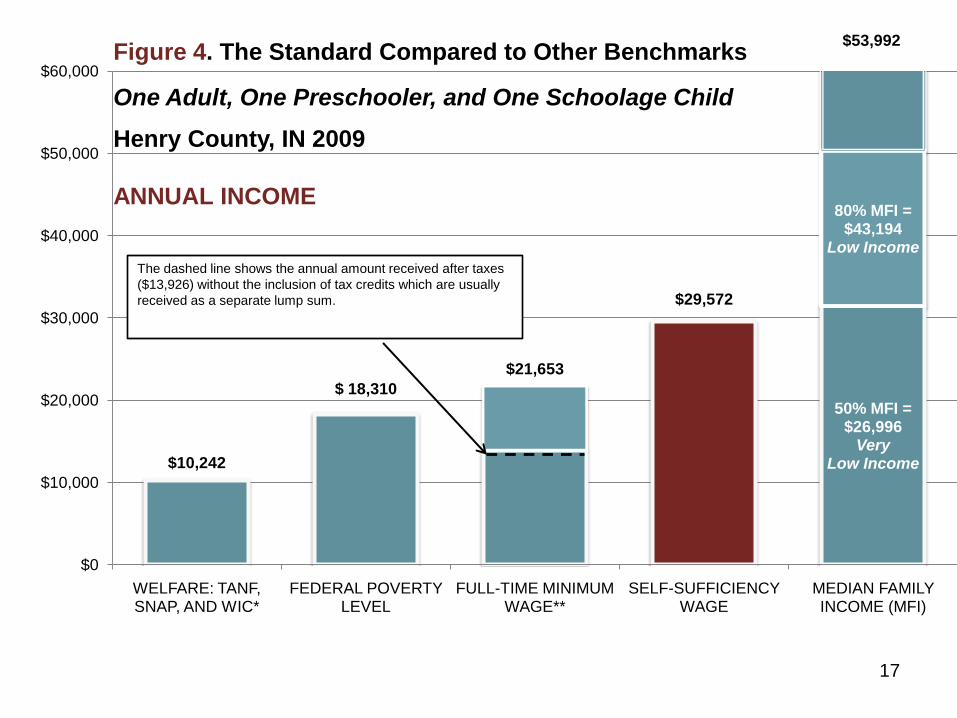
50% MFI =$26,996
VeryLow Income
80% MFI = $43,194
Low Income
$10,242
$ 18,310
$21,653
$29,572
$53,992
$0
$10,000
$20,000
$30,000
$40,000
$50,000
$60,000
WELFARE: TANF, SNAP, AND WIC*
FEDERAL POVERTY LEVEL
FULL-TIME MINIMUM WAGE**
SELF-SUFFICIENCY WAGE
MEDIAN FAMILY INCOME (MFI)
Figure 4. The Standard Compared to Other Benchmarks
One Adult, One Preschooler, and One Schoolage Child
Henry County, IN 2009
ANNUAL INCOME
The dashed line shows the annual amount received after taxes
($13,926) without the inclusion of tax credits which are usually
received as a separate lump sum.
17
Definitions of Poverty
• Severe Poverty –below 50% of the Federal Poverty
Guidelines
• Poverty–below 100% of the Federal Poverty Guidelines
• Low-Income –below 200% of the Federal Poverty
Guidelines
• Self-Sufficient –approx. at or above 200% the Federal
Poverty Guidelines
18
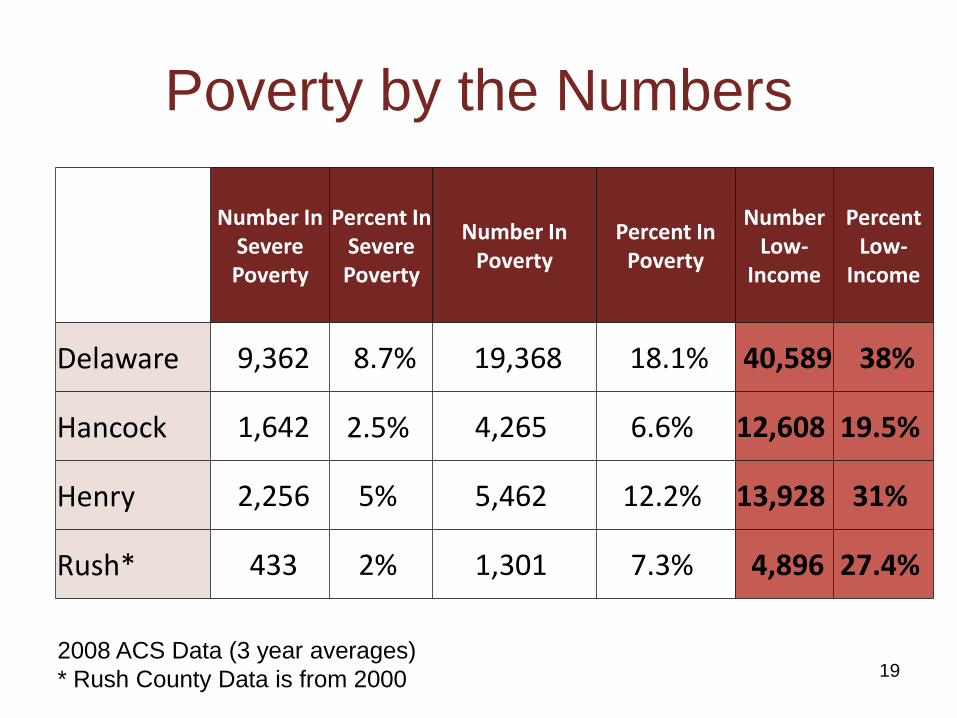
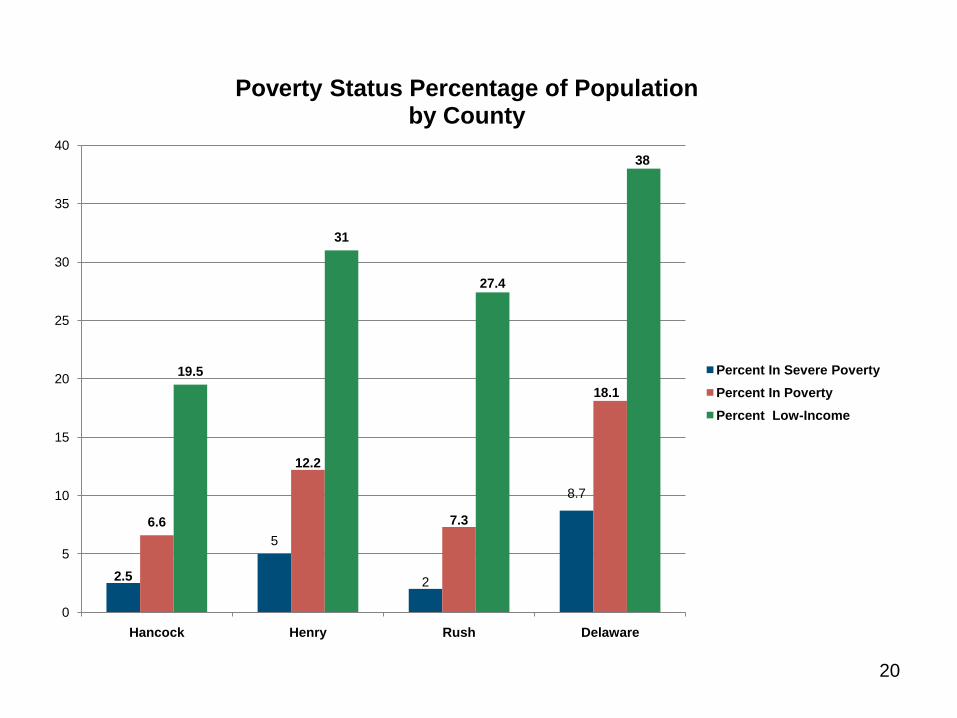
Poverty by the Numbers
19
Number In SeverePoverty
Percent In SeverePoverty
Number InPoverty
Percent InPoverty
Number Low-
Income
Percent Low-
Income
Delaware 9,362 8.7% 19,368 18.1% 40,589 38%
Hancock 1,642 2.5% 4,265 6.6% 12,608 19.5%
Henry 2,256 5% 5,462 12.2% 13,928 31%
Rush* 433 2% 1,301 7.3% 4,896 27.4%
2008 ACS Data (3 year averages)
* Rush County Data is from 2000
20
2.5
5
2
8.7
6.6
12.2
7.3
18.1
19.5
31
27.4
38
0
5
10
15
20
25
30
35
40
Hancock Henry Rush Delaware
Poverty Status Percentage of Populationby County
Percent In Severe Poverty
Percent In Poverty
Percent Low-Income
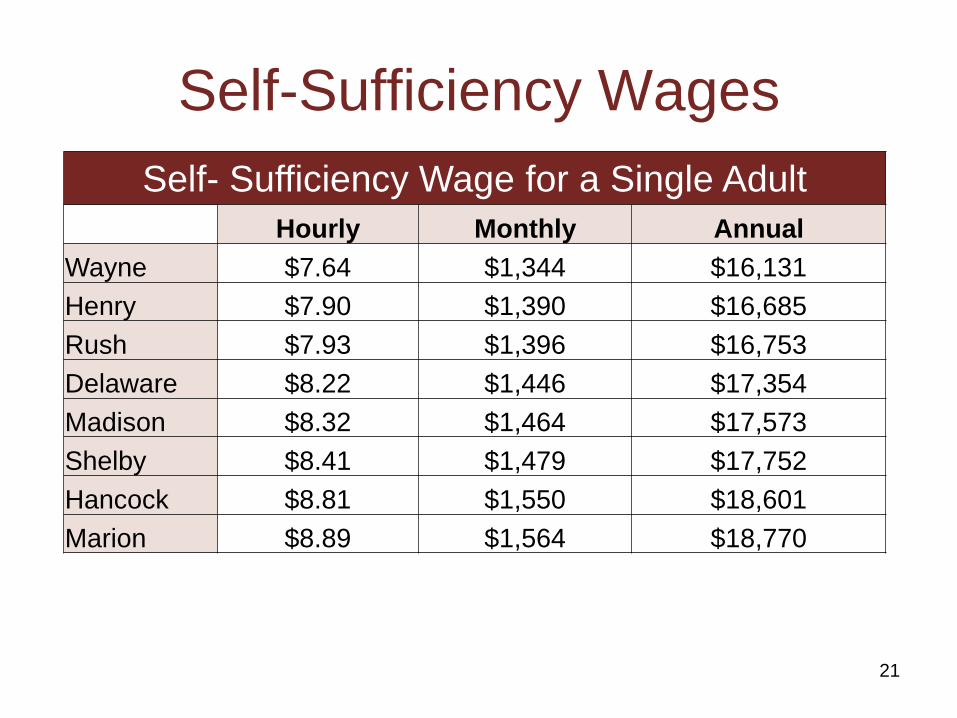
Self-Sufficiency Wages
Self- Sufficiency Wage for a Single Adult
Hourly Monthly Annual
Wayne $7.64 $1,344 $16,131
Henry $7.90 $1,390 $16,685
Rush $7.93 $1,396 $16,753
Delaware $8.22 $1,446 $17,354
Madison $8.32 $1,464 $17,573
Shelby $8.41 $1,479 $17,752
Hancock $8.81 $1,550 $18,601
Marion $8.89 $1,564 $18,770
21
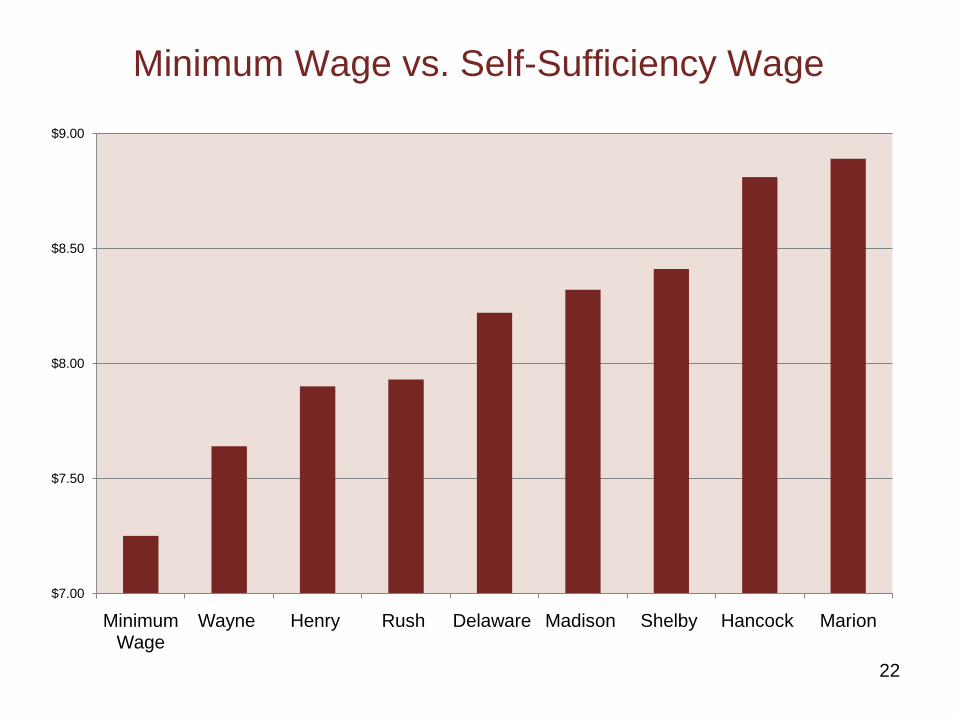
Minimum Wage vs. Self-Sufficiency Wage
$7.00
$7.50
$8.00
$8.50
$9.00
Minimum Wage
Wayne Henry Rush Delaware Madison Shelby Hancock Marion
22
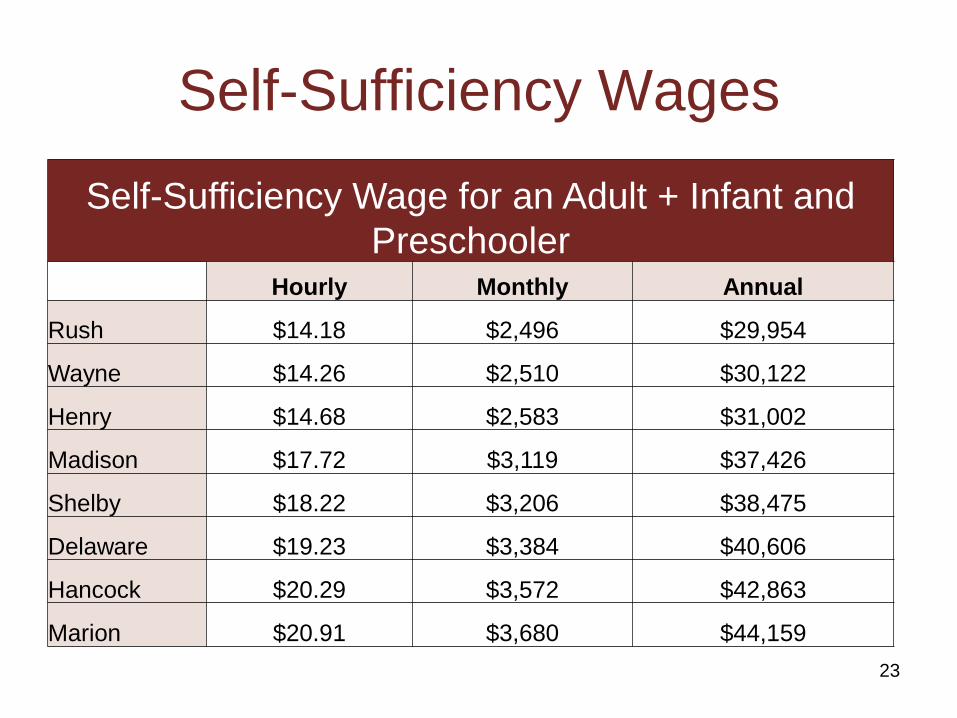
Self-Sufficiency Wages
Self-Sufficiency Wage for an Adult + Infant and
PreschoolerHourly Monthly Annual
Rush $14.18 $2,496 $29,954
Wayne $14.26 $2,510 $30,122
Henry $14.68 $2,583 $31,002
Madison $17.72 $3,119 $37,426
Shelby $18.22 $3,206 $38,475
Delaware $19.23 $3,384 $40,606
Hancock $20.29 $3,572 $42,863
Marion $20.91 $3,680 $44,159
23
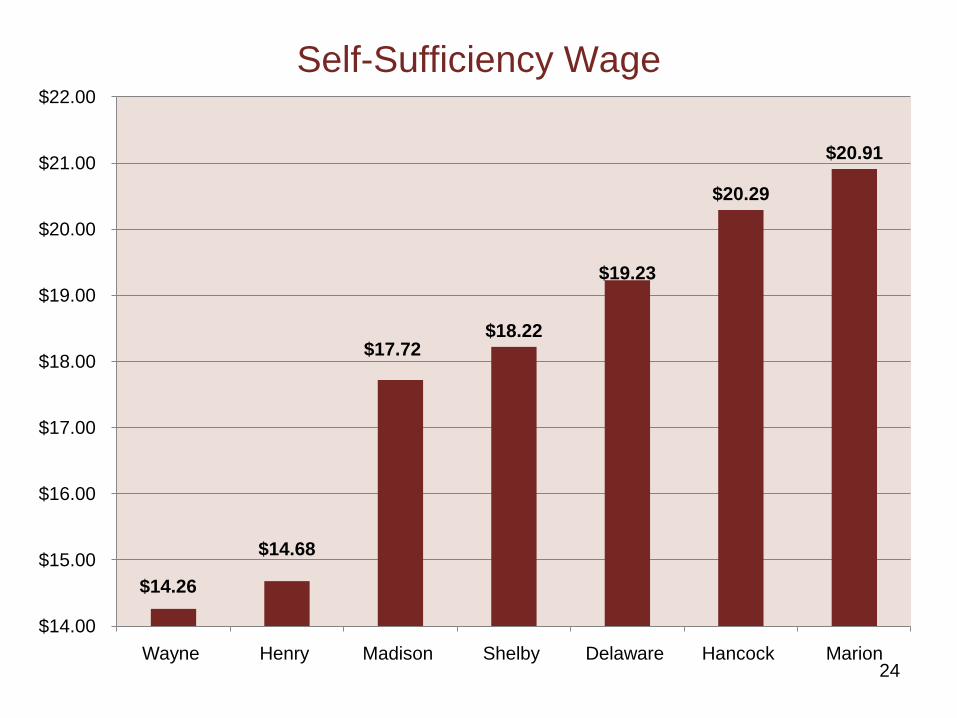
Self-Sufficiency Wage
$14.26
$14.68
$17.72 $18.22
$19.23
$20.29
$20.91
$14.00
$15.00
$16.00
$17.00
$18.00
$19.00
$20.00
$21.00
$22.00
Wayne Henry Madison Shelby Delaware Hancock Marion24
• In addition to the report, the Institute is updating the
Self-Sufficiency Calculator which is a interactive version
of the Standard which includes all 70 family types for all
92 counties
• Link it to your web site
• The calculator is available at:
http://www.indianaselfsufficiencystandard.org/
• Expanded capabilities which include linking to jobs and
education that pay those wages will be available in 2011
Indiana Self-Sufficiency Standard Calculator
25
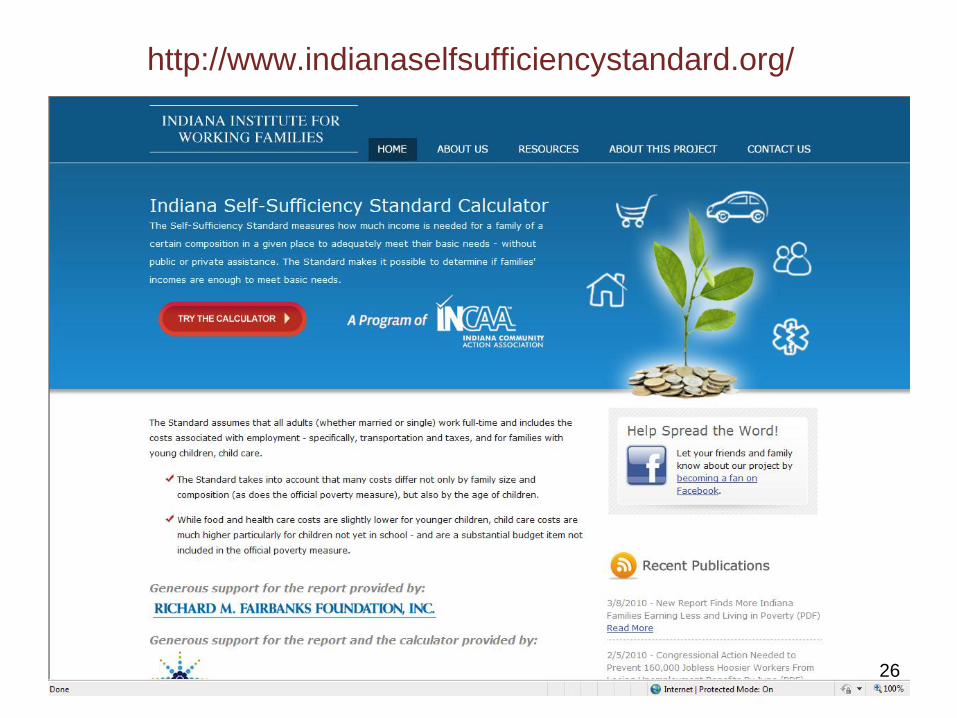
http://www.indianaselfsufficiencystandard.org/
26
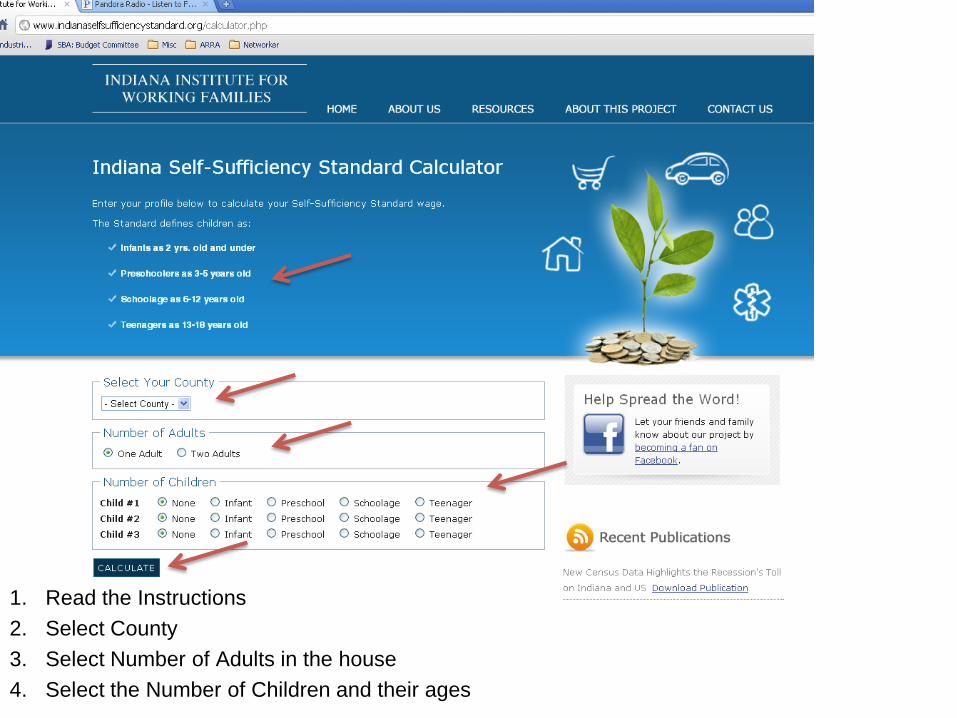
1. Read the Instructions
2. Select County
3. Select Number of Adults in the house
4. Select the Number of Children and their ages27
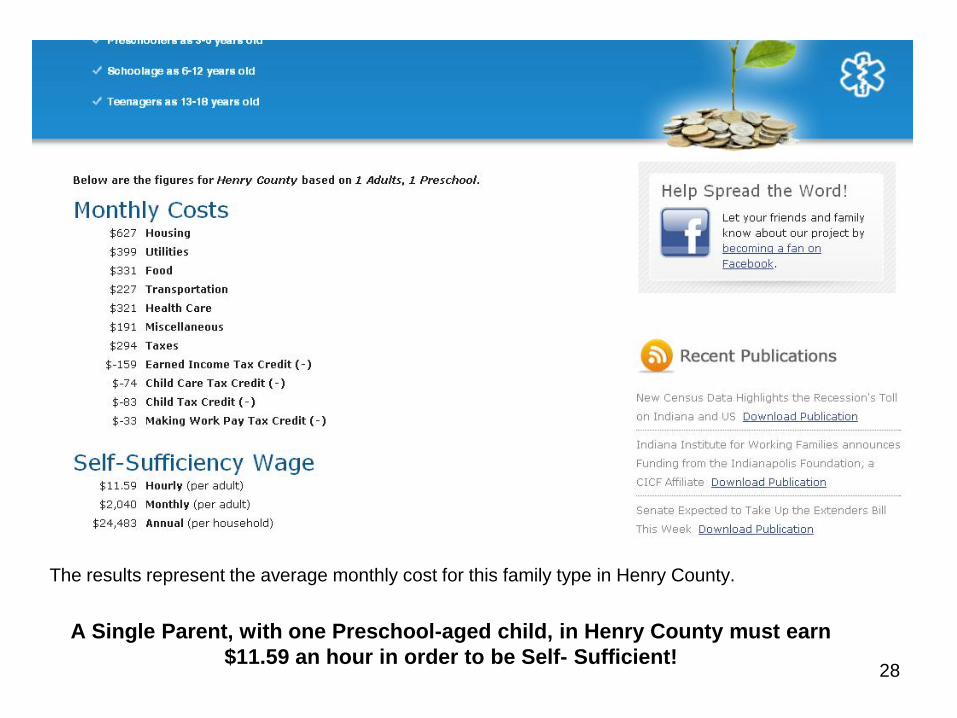
The results represent the average monthly cost for this family type in Henry County.
A Single Parent, with one Preschool-aged child, in Henry County must earn
$11.59 an hour in order to be Self- Sufficient! 28
How is the Standard being used
in Indiana?• For education and advocacy – in
Jeffersonville, IN
• As a counseling tool – by a Workforce
Investment Board
• To set public policy – Dave Sikes, Lake
Area United Way
29
How can you use the Standard?
• Education
• Program and Policy
Development
• Determination of Need
• Service Delivery
• Evaluation
• Targeting Resources
– Job Training
– Education
• Counseling Tool
• Wage-Setting
• Supports Research
30
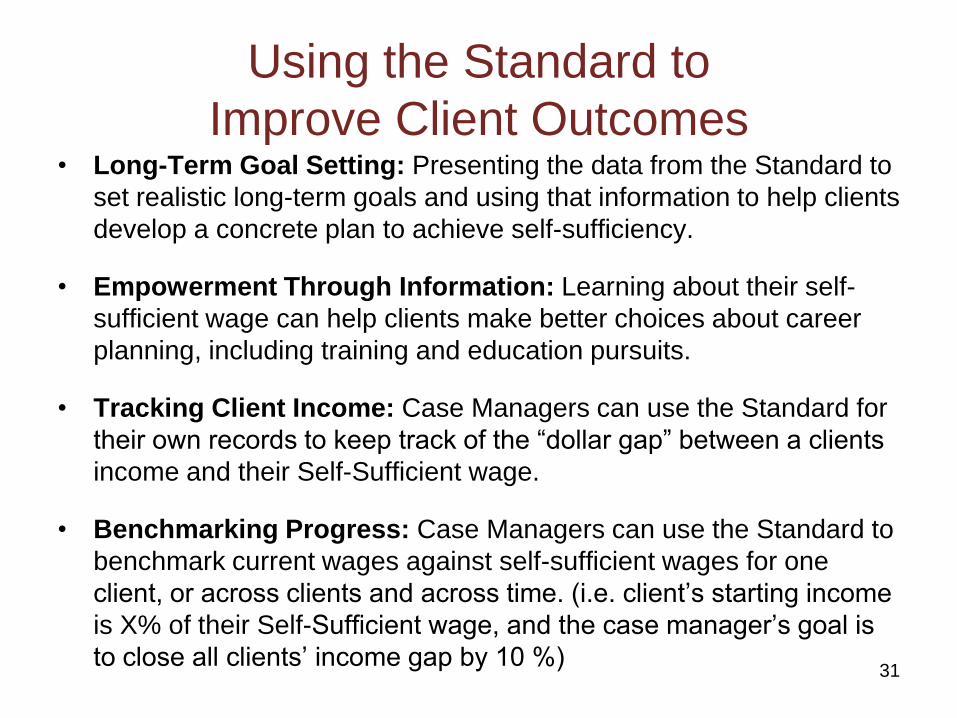
Using the Standard to
Improve Client Outcomes• Long-Term Goal Setting: Presenting the data from the Standard to
set realistic long-term goals and using that information to help clients
develop a concrete plan to achieve self-sufficiency.
• Empowerment Through Information: Learning about their self-
sufficient wage can help clients make better choices about career
planning, including training and education pursuits.
• Tracking Client Income: Case Managers can use the Standard for
their own records to keep track of the “dollar gap” between a clients
income and their Self-Sufficient wage.
• Benchmarking Progress: Case Managers can use the Standard to
benchmark current wages against self-sufficient wages for one
client, or across clients and across time. (i.e. client’s starting income
is X% of their Self-Sufficient wage, and the case manager’s goal is
to close all clients’ income gap by 10 %) 31
Questions and Answers
32

For more information
• Please contact us:
1845 W. 18th St.
Indianapolis, IN 46202
317-638-4232
www.incap.org
33