Embed Size (px)
Citation preview
The Self-Sufficiency STandard for mARYLAND 2012Prepared for the Maryland community action Partnership
mARYLAND CommuNitY ACtioN PARtNeRshiPThe Maryland Community Action Partnership (MCAP) is a nonprofit, association that advocates on behalf of
Maryland’s low-income families to ensure their voice is heard at the local, state and national levels. In addition
MCAP supports the mission and activities of Community Action Agencies throughout the state.
The State Association is composed of 16 community action agencies, 13 of which provide direct human
services and three (3) are governmental agencies, together they work to lead families to self-sufficiency and
independence of public programs.
The State Association provides technical assistance and training to the board of directors and staffs of these
agencies, as well as, to other nonprofit organizations with similar missions who may partner with community
action agencies.
For more information on the Maryland Community Action Partnership please visit www.maryland-cap.org.
the CeNteR foR WomeN’s WeLfAReThe Center for Women’s Welfare at the University of Washington School of Social Work is devoted to furthering
the goal of economic justice for women and their families. The main work of the Center focuses on the
development of the Self-Sufficiency Standard. Under the direction of Dr. Diana Pearce, the Center partners with
a range of government, non-profit, women’s, children’s, and community-based groups to:
research and evaluate public policy related to income adequacy;•create tools to assess and establish income adequacy; and•develop programs and policies that strengthen public investment in low-income women, children, •and families.
For more information about the Center’s programs, or work related to the Self-Sufficiency Standard, call
(206) 685-5264. This report and more can be viewed at www.selfsufficiencystandard.org.
Center for Women’s Welfare…advancing economic justice through research and the Sel f-Sufficiency Standard
The Self-Sufficiency STandard for Maryland 2012By Diana m. Pearce, PhD • february 2012
DiReCtoR, CeNteR foR WomeN’s WeLfARe
uNiVeRsitY of WAshiNGtoN sChooL of soCiAL WoRK
PRePAReD foR
the mARYLAND CommuNitY ACtioN PARtNeRshiP

The Self-Sufficiency Standard for Maryland 2012©2012 diana Pearce and the Maryland community action Partnership

Pre face
The 2012 Self-Sufficiency Standard for Maryland measures how much income a family of
a certain composition in a given place must earn to meet their basic needs. Employers,
advocates, and legislators can use it to evaluate wages, provide career counseling, and create
programs that lead to economic self-sufficiency for working families.
The Self-Sufficiency Standard for Maryland 2012 is the third calculation of this data. Previous
calculations were published in 2001 and 2007. As with all Self-Sufficiency Standard reports, this
one was authored by Dr. Diana M. Pearce and produced by the Center for Women’s Welfare at
the University of Washington. This report, plus tables providing county specific information for
70 family types, is available online at www.selfsufficiencystandard.org and at
www.maryland-cap.org.
A former Montgomery Maryland resident, Dr. Diana Pearce developed the Self-Sufficiency
Standard while she was the Director of the Women and Poverty Project at Wider Opportunities
for Women (WOW). The Ford Foundation provided funding for the Standard’s original
development. WOW established the national Family Economic Self-Sufficiency Project,
now known as the Family Economic Security (FES) Project, in 1996 in partnership with
the Ms. Foundation for Women, the Corporation for Enterprise Development, and the
National Economic Development and Law Center (now the Insight Center for Community
Economic Development). Over 2,500 community and state-based organizations and agencies,
representing a broad range of sectors, are connected through the FES Project network. For
more information about the FES Project, visit the website: www.wowonline.org/
ourprograms/fess or contact the Family Economic Security Project at (202) 464-1596.
Over the past 15 years, the Standard has been calculated in 37 states as well as the District
of Columbia and New York City. Its use has revolutionized the way policies and programs for
low-income workers are structured and what it means to be in need in the United States.
For further information about any of the other states with the Standard, including the latest
reports, the Standard data itself, and related reports such as demographic reports (which
analyze how many and which households are above and below the Standard), please see
www.selfsufficiencystandard.org. A list of Self-Sufficiency Standard state partners is also
available at this website, or contact Lisa Manzer with the Center at (206) 685-5264/lmanzer@
uw.edu, or the report author and Center Director, Dr. Diana Pearce, at (206) 616-2850/
Acknowled gement s
The Self-Sufficiency Standard for Maryland 2012 has been prepared collaboratively by Sarah
Lowry and Lisa Manzer at the University of Washington Center for Women’s Welfare, and
Zenobia Williams of the Maryland Community Action Partnership. This project was made
possible with support from the Maryland Department of Housing and Community Development.
A number of other people have also contributed to the development of the Standard, its
calculation, and/or the writing of state reports over the past 16 years. Jennifer Brooks,
Maureen Golga, and Kate Farrar, former Directors of Self-Sufficiency Programs and Policies at
WOW, were key to the early development of initiatives that promoted the concept of self-
sufficiency and the use of the Standard, and were instrumental in facilitating and nurturing
state coalitions. Additional past contributors to the Standard have included Laura Henze
Russell, Janice Hamilton Outtz, Roberta Spalter-Roth, Antonia Juhasz, Alice Gates, Alesha
Durfee, Melanie Lavelle, Nina Dunning, Maureen Newby, and Seook Jeong.
The conclusions and opinions contained within this document do not necessarily reflect the
opinions of those listed above. Any mistakes are the author’s responsibility.
e xecut i ve summar y
The Maryland Community Action Partnership publishes the Self-Sufficiency Standard for
Maryland in an effort to ensure the best tools are available to help Maryland families and
individuals make progress toward real economic security. The result is a comprehensive,
credible, and user-friendly tool. The Self-Sufficiency Standard not only provides a measure
of income adequacy, but it is also a versatile and useful tool in promoting family economic
security. The Standard provides the means to analyze which costs are contributing most to
family budget constraints, as well as which programs and policies are helping families make
ends meet. As Maryland recovers from the economic downturn, long-term economic prosperity
will require responsible planning that puts all Marylanders on the path to self-sufficiency.
The Self-Sufficiency Standard for Maryland 2012 describes how much income families of
various sizes and compositions need to make ends meet without public or private assistance in
each county of Maryland. The Self-Sufficiency Standard is a measure of economic security that
is based on the costs of the basic needs for working families: housing, child care, food, health
care, transportation, and miscellaneous items as well as the cost of taxes and the impact of
tax credits.
The Self-Sufficiency Standard for Maryland 2012 defines the income needed to realistically
support a family, without public or private assistance. For most workers throughout Maryland,
the Self-Sufficiency Standard shows that earnings well above the official Federal Poverty Level
are nevertheless far below what is needed to meet families’ basic needs.
The Self-Sufficiency Standard for Maryland 2012 report begins with an explanation of how the
Self-Sufficiency Standard is a unique and important measure of income adequacy. The report
leads readers through a description of what a self-sufficient wage is for Maryland families and
how it differs depending on family type and geographic area. The report compares Maryland
to other places in the United States, demonstrates how the Standard has changed in Maryland
over time, and compares the Maryland Standard to other commonly used benchmarks of
income. For families without adequate income, the report models how public supports, such
as child care assistance, can be a valuable resource to help families cover their basic needs as
they move towards self-sufficiency.
The appendices include a detailed explanation of the methodology used to calculate the
Maryland Standard and a discussion of how the Self-Sufficiency Standard can be used in
Maryland as a tool to aid in counseling clients, evaluate program performance, inform policy
making, and improve poverty research. Appendix D provides detailed tables of the costs of
meeting basic needs and the Self-Sufficiency Wages for eight selected family types in every
county of Maryland. The data from these tables—for 70 family types in every county of
Maryland—is available at www.selfsufficiencystandard.org/pubs.html.
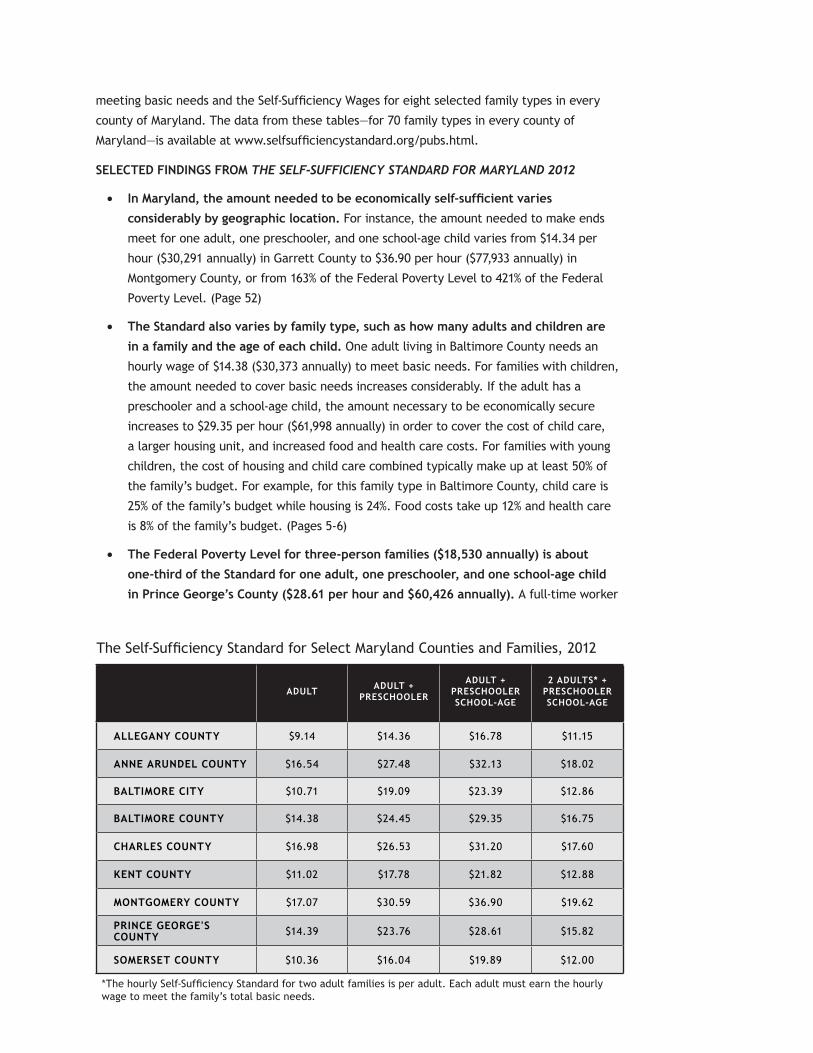
seLeCteD fiNDiNGs fRom THE SELF-SUFFICIENCY STANDARD FOR MARYLAND 2012
In Maryland, the amount needed to be economically self-sufficient varies •considerably by geographic location. For instance, the amount needed to make ends
meet for one adult, one preschooler, and one school-age child varies from $14.34 per
hour ($30,291 annually) in Garrett County to $36.90 per hour ($77,933 annually) in
Montgomery County, or from 163% of the Federal Poverty Level to 421% of the Federal
Poverty Level. (Page 52)
the standard also varies by family type, such as how many adults and children are •in a family and the age of each child. One adult living in Baltimore County needs an
hourly wage of $14.38 ($30,373 annually) to meet basic needs. For families with children,
the amount needed to cover basic needs increases considerably. If the adult has a
preschooler and a school-age child, the amount necessary to be economically secure
increases to $29.35 per hour ($61,998 annually) in order to cover the cost of child care,
a larger housing unit, and increased food and health care costs. For families with young
children, the cost of housing and child care combined typically make up at least 50% of
the family’s budget. For example, for this family type in Baltimore County, child care is
25% of the family’s budget while housing is 24%. Food costs take up 12% and health care
is 8% of the family’s budget. (Pages 5-6)
the federal Poverty Level for three-person families ($18,530 annually) is about •one-third of the standard for one adult, one preschooler, and one school-age child
in Prince George’s County ($28.61 per hour and $60,426 annually). A full-time worker
The Self-Sufficiency Standard for Select Maryland Counties and Families, 2012
ADuLt ADuLt + PResChooLeR
ADuLt +PResChooLeR sChooL-AGe
2 ADuLts* + PResChooLeR sChooL-AGe
ALLeGANY CouNtY $9.14 $14.36 $16.78 $11.15
ANNe ARuNDeL CouNtY $16.54 $27.48 $32.13 $18.02
BALtimoRe CitY $10.71 $19.09 $23.39 $12.86
BALtimoRe CouNtY $14.38 $24.45 $29.35 $16.75
ChARLes CouNtY $16.98 $26.53 $31.20 $17.60
KeNt CouNtY $11.02 $17.78 $21.82 $12.88
moNtGomeRY CouNtY $17.07 $30.59 $36.90 $19.62
PRiNCe GeoRGe's CouNtY $14.39 $23.76 $28.61 $15.82
someRset CouNtY $10.36 $16.04 $19.89 $12.00
*The hourly Self-Sufficiency Standard for two adult families is per adult. Each adult must earn the hourly wage to meet the family’s total basic needs.
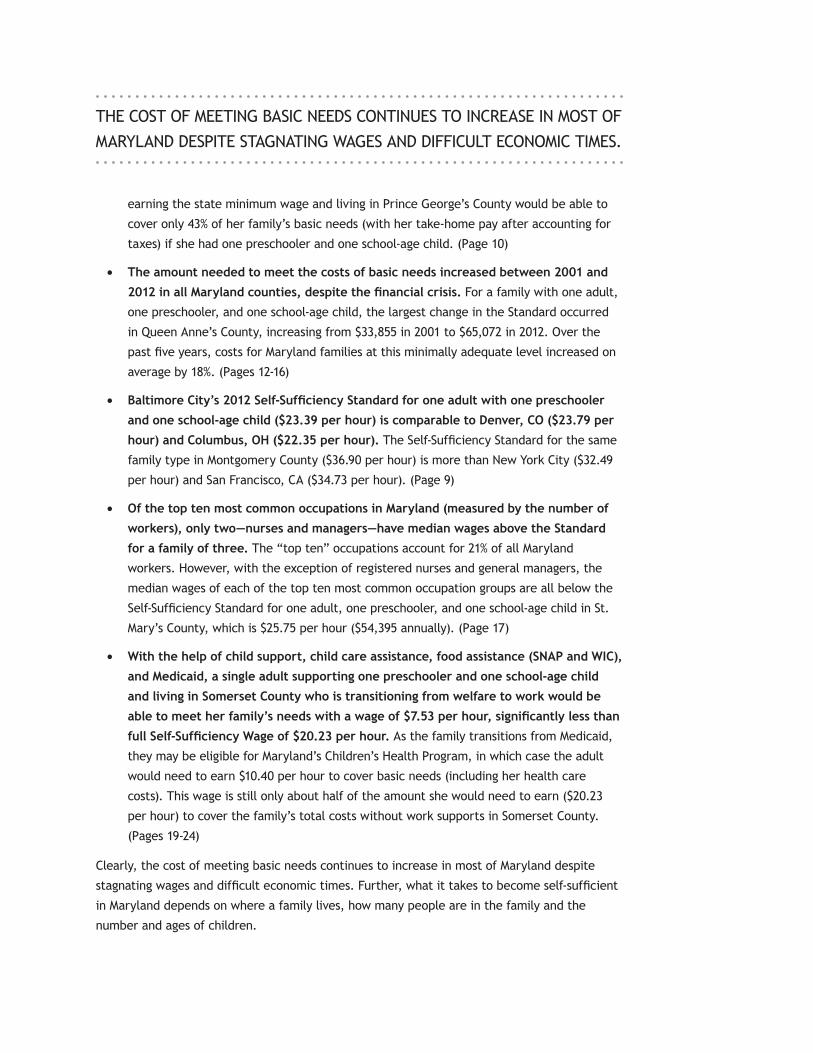
earning the state minimum wage and living in Prince George’s County would be able to
cover only 43% of her family’s basic needs (with her take-home pay after accounting for
taxes) if she had one preschooler and one school-age child. (Page 10)
the amount needed to meet the costs of basic needs increased between 2001 and •2012 in all Maryland counties, despite the financial crisis. For a family with one adult,
one preschooler, and one school-age child, the largest change in the Standard occurred
in Queen Anne’s County, increasing from $33,855 in 2001 to $65,072 in 2012. Over the
past five years, costs for Maryland families at this minimally adequate level increased on
average by 18%. (Pages 12-16)
Baltimore City’s 2012 Self-Sufficiency Standard for one adult with one preschooler •and one school-age child ($23.39 per hour) is comparable to Denver, Co ($23.79 per
hour) and Columbus, oh ($22.35 per hour). The Self-Sufficiency Standard for the same
family type in Montgomery County ($36.90 per hour) is more than New York City ($32.49
per hour) and San Francisco, CA ($34.73 per hour). (Page 9)
of the top ten most common occupations in maryland (measured by the number of •workers), only two—nurses and managers—have median wages above the standard
for a family of three. The “top ten” occupations account for 21% of all Maryland
workers. However, with the exception of registered nurses and general managers, the
median wages of each of the top ten most common occupation groups are all below the
Self-Sufficiency Standard for one adult, one preschooler, and one school-age child in St.
Mary’s County, which is $25.75 per hour ($54,395 annually). (Page 17)
With the help of child support, child care assistance, food assistance (sNAP and WiC), •and medicaid, a single adult supporting one preschooler and one school-age child
and living in somerset County who is transitioning from welfare to work would be
able to meet her family’s needs with a wage of $7.53 per hour, significantly less than
full Self-Sufficiency Wage of $20.23 per hour. As the family transitions from Medicaid,
they may be eligible for Maryland’s Children’s Health Program, in which case the adult
would need to earn $10.40 per hour to cover basic needs (including her health care
costs). This wage is still only about half of the amount she would need to earn ($20.23
per hour) to cover the family’s total costs without work supports in Somerset County.
(Pages 19-24)
Clearly, the cost of meeting basic needs continues to increase in most of Maryland despite
stagnating wages and difficult economic times. Further, what it takes to become self-sufficient
in Maryland depends on where a family lives, how many people are in the family and the
number and ages of children.
THE COST OF MEETING BASIC NEEDS CONTINUES TO INCREASE IN MOST OF
MARYLAND DESPITE STAGNATING WAGES AND DIFFICULT ECONOMIC TIMES.
WhAt the seLf-suffiCieNCY stANDARD meANs foR mARYLAND
Closing the wage gap between current wages and the Self-Sufficiency Standard requires both
reducing costs and raising incomes.
reducinG coSTS means ensuring families that are struggling to retain employment and cover
basic costs have access to work supports—such as child care assistance, food benefits, and the
Earned Income Tax Credit—that offer stability and resources while they become self-sufficient.
Most individuals cannot achieve self-sufficiency through stopgap measures or in a single step,
but require transitional work supports and the removal of barriers and/or guidance to help
meet monthly expenses as families work towards self-sufficiency over time.
raiSinG incoMeS means enhancing skills as well as improving access to jobs that pay self-
sufficiency wages and have career potential. A strong economy will mean good jobs that pay
self-sufficient wages and a workforce with the skills necessary to fill those jobs. Key to raising
incomes is access to education, training, and jobs that provide real potential for skill and
career advancement over the long term. Further, public policies that value the goal of making
work pay are necessary to ensure access to jobs with self-sufficient wages.
The Self-Sufficiency Standard can be used as a tool to:
Evaluate proposed policy changes,•Target resources towards job training for fields that pay Self-Sufficiency Wages,•Evaluate outcomes for clients in employment programs, and•Serve as a counseling tool in work training programs. •
The Self-Sufficiency Standard is currently used to better understand issues of income
adequacy, analyze policy, and help individuals striving to be self-sufficient. Community
organizations, academic researchers, policy institutes, legal advocates, training providers,
community action agencies, and state and local officials, among others, are using the Self-
Sufficiency Standard.

table o f Content s
introduction • 1
how is the Maryland Standard calculated? • 3
how Much is the Minimum in Maryland? • 5
How do Family Budgets Change As Families Grow? • 7
how does Maryland compare to other States? • 9
How Does the Self-Sufficiency Standard Compare to Other Benchmarks of Income? • 10
How has the Standard Changed Over Time in Maryland? • 12
The Wage Gap: How Does the Self-Sufficiency Standard compare to Maryland’s Top occupations? • 17
Closing the Wage Gap: Reducing Costs • 19
Closing the Wage Gap: Raising Incomes • 25
How has the Self-Sufficiency Standard Been Used? • 28
Moving Towards Economic Security • 29
conclusion • 33
endnotes • 34
Appendix A: Methodology, Assumptions, and Sources • 36
Appendix B: Examples of How the Standard Has Been Used • 44
Appendix C: Federal Approaches to Measuring Poverty • 50
Appendix D: The Self-Sufficiency Standard for Select family Types in Maryland • 55
Appendix E: Impact of Work Supports on Wage Adequacy • 69


Evenwithoutjoblossorhomeforeclosure,theGreatRecessionhasimpactedthelivesofAmericanhouseholdsacrosstheeconomyinmanyways.Weenteredtheeconomiccrisiswithstagnatingwagesandwideningincomeinequality,andthesetrendscontinue.Asaresult,millionsfindthatevenwithfull-timejobstheyareunabletostretchtheirwagestopayforbasicnecessities.Inaddition,inmanyplacesinMaryland,evenaswageshavebeenstagnatingorfalling,costshavecontinuedtorise,makingitevenmoredifficulttomeettherisingcostsoffood,housing,transportation,healthcare,andotheressentials.
Toproperlydescribethegrowinggapbetweensluggishwagesandeverincreasingexpensesrequiresanaccuratemeasureofincomeadequacy,onethatisconsistentovertimeandacrossspace.TheSelf-SufficiencyStandardrepresentssuchameasure.TheStandardtracksandcalculatesthetruecostoflivingfacingAmericanfamilies,illuminatingtheeconomic“crunch”experiencedbysomanyfamiliestoday.1
The Self-Sufficiency Standard for Maryland 2012definestheamountofincomenecessarytomeetthebasicneedsofMarylandfamilies,differentiatedbyfamilytypeandwheretheylive.TheStandardcalculatesthecostsofsixbasicneedsplustaxesandtaxcredits.Itassumesthefullcostofeachneed,withouthelpfrompublicsubsidies(e.g.,publichousing,Medicaid,orchildcareassistance)orprivate/informalassistance(e.g.,unpaidbabysittingbyarelativeorfriend,foodfromfoodbanks,orsharedhousing).
ThisreportpresentstheStandardandwhatitmeansforMarylandfamilies.Belowisasummaryofthesectionsincludedinthisreport:
TheintroductionexplainstheuniquefeaturesoftheSelf-SufficiencyStandardandhowitis• calculated.Themainbodydetailswhataself-sufficientincomeisforMarylandfamilies,describeshow• theStandardvariesbyfamilytypeandcounty,andcomparestheMarylandStandardtootherplacesacrosstheUnitedStates.
introduction
The Self-Sufficiency Standard measures how much income a family of a certain
composition in a given place needs to adequately meet their basic needs—without
public or private assistance.
2 — the seLf-suffiCieNCY stANDARD foR mARYLAND
AdditionalsectionstrackhowtheMarylandStandard• haschangedoverthepast11years,andhowtheStandardcomparestoothercommonbenchmarksofincome.Theconclusiondiscusseshowworksupportscanhelp• familiesmovetowardself-sufficiencyaswellasstrategiesforclosingthegapbetweenprevailingwagesandtheSelf-SufficiencyStandard.
Thisreportalsohasseveralappendices:
AppendixAprovidesadetaileddescriptionofthedata• andsourcesusedtocalculatetheStandard.AppendixBexplainsthevariouswaysofusingthe• Standardtoinformpolicymaking,counselclients,evaluateprograms,andimprovepovertyresearch.AppendixCexplainsfederalapproachestomeasuring• povertyandshowstheMarylandSelf-SufficiencyStandardforselectfamilytypesasapercentageoftheFederalPovertyLevel.AppendixDprovidesdetailedtablesoftheSelf-• SufficiencyStandardforeightselectfamilytypesineachMarylandcounty.AppendixEshowsthedatabehindthefigure:• Impact of Work Supports on Wage Adequacy.
A ReAL-WoRLD APPRoACh to meAsuRiNG NeeDTheSelf-SufficiencyStandardisauniquemeasureofincomeadequacythatusesamodern,comprehensive,anddetailedapproachtodeterminewhatittakesfortoday’sfamiliestomakeendsmeet.ThekeyelementsoftheStandardthatdistinguishitfromothermeasuresofincomeadequacyorpovertyarethefollowing:
A foCus oN moDeRN fAmiLies With WoRKiNG ADuLts. BecausepaidemploymentisthenormforthemajorityoffamiliestodayintheUnitedStates,2theStandardassumesalladultsworktosupporttheirfamilies,andthusincludesthecostsofwork-relatedexpensessuchaschildcare,taxes,andtransportation.
GeoGRAPhiC VARiAtioN iN Costs. TheStandardusesgeographicallyspecificcoststhatarecalculatedatthecountyorsub-countylevelasdataavailabilityallows.
VARiAtioN BY fAmiLY ComPositioN. Becausethecostsofsomebasicneedsvarysubstantiallybytheageofchildren,theStandardvariesbyboththenumberofchildrenandbytheageofchildren.Whilefoodandhealthcarecostsareslightlylowerforyoungerchildren,childcarecostsaregenerallymuchhigher—particularlyforchildrennotyetinschool—andthereforebecomeasubstantialbudgetitemforworkerswithyoungchildren.
iNDiViDuAL AND iNDePeNDeNt PRiCiNG of eACh Cost. Ratherthanassumethatanyoneitemisafixedpercentageoffamilybudgets,theStandardcalculatestherealcostsofmeetingeachofthemajorbudgetitemsfamiliesencounter,includinghousing,childcare,food,healthcare,transportation,miscellaneousitems,andtaxes.Thecostsaresetataminimallyadequatelevel,whichisdeterminedwheneverpossiblebyusingwhatgovernmentsourceshavedeterminedareminimallyadequateforthosereceivingassistance,e.g.,childcaresubsidybenefitlevels.
tAxes AND tAx CReDits ARe iNCLuDeD As BuDGet items. Insteadofcalculatingneeds“pretax,”taxes(plustaxcredits),areincludedasbudgetitems,includingstateandlocalsalestax,payroll(includingSocialSecurityandMedicare)taxes,federalandstateincometaxes,andtaxcredits.
PeRmits moDeLiNG of the imPACt of suBsiDies, tAxes, AND tAx CReDits. BecausetheStandardspecifiestherealcostofeachmajornecessity,itispossibletomodeltheimpactofspecificsubsidies(suchastheSupplementalNutritionAssistanceProgram,childcareassistance,orMedicaid)aswellastheimpactoftaxesandtaxcreditsonreducing(orincreasing)costswhenevaluatingtheadequacyofagivenwageforagivenfamily.
Altogether,theaboveelementsoftheStandardmakeitamoredetailedandcomprehensivemeasureofincomeadequacythantheFederalPovertyLevel.AppendixCprovidesamoredetailedexplanationofthefederalapproachestomeasuringpoverty,includingtheFederalPovertyLevelandtheSupplementalPovertyMeasure,andhowtheStandardcontrastswitheachapproach.
the seLf-suffiCieNCY stANDARD foR mARYLAND — 3
SinceHUDcalculatesonlyonesetofFMRsforanentiremetropolitanarea,inmultiplecountymetropolitanareastheStandardusescounty-levelmediangrossrentsfromtheU.S.CensusBureau’sAmericanCommunitySurvey(ACS)tovarytheFMRhousingcostsoftheindividualcountieswithinthemetropolitanarea.
ChiLD CARe. Tocalculatethecostofchildcare,theStandardutilizesmarket-ratecosts(definedasthe75thpercentile)bysetting,age,andgeographiclocation.Moststates,includingMaryland,conductorcommissionmarket-ratesurveysforsettingchildcareassistancereimbursementrates.
TheMarylandStandardassumesinfantsreceivechildcareinfamilydaycare.Preschoolersareassumedtoreceivecareinachildcarecenter.Costsforschool-agechildrenassumetheyreceivecarebeforeandafterschool(part-time)inachildcarecenter.
fooD. TheStandardusestheU.S.DepartmentofAgriculture(USDA)Low-CostFoodPlanforfoodcosts.TheLow-CostFoodPlanwasdesignedtomeetminimumnutritionalstandardsusingrealisticassumptionsaboutfoodpreparationtimeandconsumptionpatterns.However,itisstillaveryconservativeestimateoffoodcosts.Forinstance,theLow-CostFoodPlandoesnotallowforanytake-out,fast-food,orrestaurantmeals—norforcoffee,tea,orsodadrinks.
Tovarycostswithinstates,geographicdifferencesinfoodcostsarecalculatedusingtheACCRACostofLivingIndex,fromtheCouncilforCommunityandEconomicResearchanddatafromtheEconomicResearchService.
tRANsPoRtAtioN. Ifthereisan“adequate”publictransportationsysteminagivenarea,theStandardassumesworkersusepublictransportationtogettoandfromwork.Apublictransportationsystemisconsidered“adequate”ifitisusedby7%ormoreoftheworkingpopulationinagivencounty.BaltimoreCity,MontgomeryCounty,andPrinceGeorge’sCountyhaveover7%publictransportationuse;therefore,transportationcostsarebasedonpublictransitintheseareaswhileprivatetransportationisassumedforallothercountiesinMaryland.
ThegoalforcreatingtheSelf-SufficiencyStandardistocalculatetheamountneededtomeeteachbasicneedataminimallyadequatelevel,withoutpublicorprivateassistance,andtodosoinawaythatmakestheStandardasconsistentandaccurateaspossible,yetvariedbygeographyandfamilycomposition.Inselectingdatasources,tothemaximumextentpossible,thedatausedintheSelf-SufficiencyStandardmeetthefollowingcriteria:
collectedorcalculatedusingstandardizedorequivalent• methodologynationwide;obtainedfromscholarlyorcrediblesourcessuchasthe• U.S.CensusBureau;calculatedtomeetagivenneedataminimallyadequate• level,usuallybyorforagovernmentaidagency;updatedregularly;and,• geographically-and/orage-specific,asappropriate.•
TheSelf-SufficiencyStandardiscalculatedfor70differentfamilytypesforallMarylandcountiesandsomesub-countyareas.Familytypesrangefromoneadultwithnochildren,tooneadultwithoneinfant,oneadultwithonepreschooler,andsoforth,uptotwo-adultfamilieswiththreeteenagers.
TheSelf-SufficiencyStandardassumesadulthouseholdmembersworkfull-time and therefore includes all major costs associated with employment for adult household members(i.e.,taxes,transportation,andchildcareforfamilieswithyoungchildren).ThedatacomponentsoftheStandardandtheassumptionsincludedinthecalculationsaredescribedbelow(moredetailedinformationisincludedinAppendix A: Methodology, Assumptions, and Sources).
housiNG. Forhousingcosts,theStandardusesthemostrecentFairMarketRents(FMRs),whicharecalculatedannuallybytheU.S.DepartmentofHousingandUrbanDevelopment(HUD)foreachstate’smetropolitanandnon-metropolitanareas.FMRsincludeutilities(excepttelephoneandcable)andreflectthecostofhousingthatmeetsbasicstandardsofdecency.FMRsaregenerallysetatthe40thpercentile,meaningthat40%ofthehousinginagivenareaislessexpensivethantheFMR.However,inMaryland,halfofthecountiesaresetatthe50thpercentile.
how is the maryland standard Calculated?
4 — the seLf-suffiCieNCY stANDARD foR mARYLAND
Privatetransportationcostsarebasedontheaveragecostsofowningandoperatingacar.Onecarisassumedforhouseholdswithoneadult,andtwocarsareassumedforhouseholdswithtwoadults.Per-milecosts(e.g.,gas,oil,tires,andmaintenance)arecalculatedfromtheAmericanAutomobileAssociation.CommutingdistanceiscomputedfromtheNationalHouseholdTravelSurvey.
Autoinsurancepremiumsaretheaveragepremiumcostforagivenstate,calculatedbytheNationalAssociationofInsuranceCommissioners.Within-statevariationinautoinsurancepremiumsiscalculatedusingsamplepremiumsfortheautomobileinsurancecompanieswiththelargestmarketsharesinthestate.
Toestimatethefixedcostsofcarownership(e.g.,license,registration,repairs,monthlypayments)theStandardusesConsumerExpenditureSurveyamountsforfamilieswithincomesbetweenthe20thand40thpercentile.Theinitialcostofpurchasingacarisnotincluded.
heALth CARe. TheStandardassumesthatanintegralpartofaSelf-SufficiencyWageisemployer-sponsoredhealthinsuranceforworkersandtheirfamilies.Healthcarepremiumsarethestatewideaveragepaidbyworkersforsingleadultsandforfamilies,fromthenationalMedicalExpenditurePanelSurvey(MEPS),whichis73%ofthepremiumforfamilycoverageinMaryland.3Premiumsarevariedbycountyusingsampleinsuranceratesforthetopmarketsharecompaniesinthestate.Healthcarecostsalsoincluderegionalout-of-pocketcostscalculatedforadults,infants,preschoolers,school-agechildren,andteenagersobtainedfromtheMEPS,adjustedbyCensusregionusingtheMEPSHouseholdComponentAnalyticalTool,andadjustedforinflationusingtheMedicalCareConsumerPriceIndex.ForMarylandfamilieswithoutemployer-sponsoredhealthinsurance,thecostofhealthcarewouldlikelybehigher,causinganincreaseinthetotalincomeneededtobeself-sufficient.
misCeLLANeous. Miscellaneousexpensesarecalculatedbytaking10%ofallothercosts.Thisexpensecategoryconsistsofallotheressentialsincludingclothing,shoes,paperproducts,diapers,nonprescriptionmedicines,cleaningproducts,householditems,personalhygieneitems,andtelephoneservice.Itdoesnotallowforrecreation,entertainment,savings,ordebtrepayment.
tAxes. Taxesincludefederalincometax,payrolltaxes,andstateandlocalsalestaxeswhereapplicable.Additionally,theStandardincludesfederal,state,andlocaltaxcredits.TaxcreditscalculatedfortheMarylandStandardinclude:thefederalChildandDependentCareTaxCredit(referredtointheStandardastheChildCareTaxCreditorCCTC);thefederalEarnedIncomeTaxCredit(EITC);andthefederalChildTaxCredit(CTC).Notethatpropertytaxesareassumedtobeincludedinthecostofhousing,asaregasolinetaxesinthecostoftransportation.
Table 1. items included in the standard
Cost WhAt is iNCLuDeD iN eACh BuDGet item?
housiNGYES: Rent and Utilities
NO: Cable or telephone
ChiLD CARe
YES: Full-time family day care for infants, full-time center care for preschoolers, and before and after school care for school-age children
NO: After school programs for teenagers, extracurricular activities, babysitting when not at work
fooDYES: Food for home preparation
NO: Take-out, fast-food, or restaurant meals
tRANsPoRtAtioN
YES: The cost of owning a car (per adult)—insurance, gas, oil, registration, etc.—or public transportation when adequate. The car or public transit is used only for commuting to and from work and day care plus a weekly shopping trip
NO: Non-essential travel, vacations, etc.
heALth CARe
YES: Employer-sponsored health insurance & out-of-pocket costs
NO: Health savings account, gym memberships, individual health insurance
tAxes
YES: Federal and state income tax and tax credits, payroll taxes, and state and local sales taxes
NO: Itemized deductions, tax preparation fees or other taxes (property taxes are included in housing costs and gasoline taxes in transportation)
misCeLLANeous
YES: Clothing, shoes, paper products, diapers, nonprescription medicines, cleaning products, household items, personal items, and telephone service
NO: Recreation, entertainment, savings, emergencies, debt repayment, pets, education/training, gifts, broadband/internet, student loan repayment
Detailed information on the methodology of the Self-Sufficiency Standard and the Maryland specific data sources, are included in Appendix A: Methodology, Assumptions, and Sources.
the seLf-suffiCieNCY stANDARD foR mARYLAND — 5
how much is the minimum in maryland?Theamountofmoneyfamiliesneedtobeeconomicallyself-sufficientvariessubstantiallydependingonfamilysizeandthegeographicregionofresidence.Forexample,Table 2showsthatinBaltimoreCountytheSelf-SufficiencyStandardvariessubstantiallydependingonfamilytype:
Asingleadultneedstoearn$14.38perhourworking• full-timetobeabletomeethisorherbasicneeds.Oneparentcaringforapreschool-agedchildneedsto• earn$24.45perhourtobeself-sufficient.Oneparentwithtwochildren—apreschoolerandschool-• agechild—needs$29.35perhourtomeetherfamily’sbasicneeds.Thisfamilyrequires,ataminimum,theequivalentofoverfourfull-timeminimumwagejobsinMaryland.4
Twoparentswithonepreschoolerandoneschool-age• childeachneedtoearn$16.75perhourworkingfull-timetomeettheirfamily’sbasicneeds.
Inadditiontovaryingbyfamilycomposition,theSelf-SufficiencyStandardalsovariesbygeographiclocation.ThemapinFigure 1visuallydisplaysthegeographicvariationinthecostofmeetingbasicneedsacrossMaryland’scountiesforfamilieswithoneadultandonepreschooler.Figure1groupscountiesintofourSelf-SufficiencyWageranges.
The2012MarylandSelf-SufficiencyStandardforasingleadultwithonepreschoolerrangesfrom$26,847to$64,606annuallydependingonthecounty.Thecounties
Table 2. The Self-Sufficiency Standard for Select Family Types* Monthly Expenses and Shares of Total Budgets Baltimore County, MD 2012
moNthLY Costs
oNe ADuLt oNe ADuLt, oNe PResChooLeR
oNe ADuLt, oNe PResChooLeR,
oNe sChooL-AGe
tWo ADuLts, oNe PResChooLeR,
oNe sChooL-AGe
Costs % Costs % Costs % Costs %
housing $1,039 41 $1,248 29 $1,248 24 $1,248 21
Child Care $0 0 $781 18 $1,302 25 $1,302 22
food $262 10 $398 9 $596 12 $819 14
transportation $323 13 $331 8 $331 6 $630 11
health Care $156 6 $396 9 $419 8 $482 8
miscellaneous $178 7 $315 7 $390 8 $448 8
taxes $573 23 $969 23 $1,147 22 $1,235 21
earned income tax Credit (-) $0 0 $0 0 $0 0 $0 0
Child Care tax Credit (-) $0 0 ($50) -1 ($100) -2 ($100) -2
Child tax Credit (-) $0 0 ($83) -2 ($167) -3 ($167) -3
totAL PeRCeNt 100 100 100 100
seLf-suffiCieNCY WAGe
houRLY** $14.38 $24.45 $29.35 $16.75
moNthLY $2,531 $4,304 $5,166 $5,897
ANNuAL $30,373 $51,648 $61,998 $70,768
* The Standard is calculated by adding expenses and taxes and subtracting tax credits. The “Taxes” row includes federal and state income taxes (including federal income taxes) and payroll taxes.** The hourly wage is calculated by dividing the monthly wage by 176 hours (8 hours per day times 22 days per month).*** The hourly wage for families with two adults represents the hourly wage that each adult would need to earn, while the monthly and annual wages represent both parents’ wages combined.Note: Totals may not add exactly due to rounding.
6 — the seLf-suffiCieNCY stANDARD foR mARYLAND
inthegroupwiththehighestSelf-SufficiencyStandardsareconcentratedinthecentralregionofMaryland.ThecountiesofAnneArundel,Charles,Howard,andMontgomeryhavethehighestSelf-SufficiencyStandardsinthestate,rangingfrom$56,039(Charles)to$64,606(Montgomery).
ThesecondmostexpensiveareasinMaryland(withannualSelf-SufficiencyWagesbetween$46,672and$54,667)arealsolocatedinthecentralregionofMarylandandareprimarilylocatedinthegreaterWashington,DCandBaltimoremetropolitanareas.Baltimore,Calvert,Carroll,Frederick,Harford,PrinceGeorge’s,QueenAnne’s,andSt.Mary’scountiesarepartofthisgroup.
ThethirdmostexpensiveareasinMaryland(withannualSelf-SufficiencyWagesbetween$35,246and$43,407)
Figure 1. Map of Counties by Level of Annual Self-Sufficiency Wage One Adult and One Preschooler, MD 2012
aretheeasternshorecountiesofCecil,Kent,Talbot,Caroline,Dorchester,Wicomico,andWorcester,alongwithWashingtonCountytothewestandBaltimoreCity.
TheleastexpensivegroupofcountiesinMaryland,withSelf-SufficiencyWageslessthan$33,873foranadultwithonepreschooler,includethetwowesterncountiesofGarrettandAlleganyandthesoutheasternshorecountyofSomerset.GarrettCountyistheleastexpensivecountyforthisfamilytypeinMaryland.
The aMounT of Money faMilieS need To
BE ECONOMICALLY SELF-SUFFICIENT vARIES
SUBSTANTIALLY DEPENDING ON FAMILY SIZE
AND THE GEOGRAPHIC REGION OF RESIDENCE.
Less than $35,000
$35,000 - $44,000
$45,000 - $55,000
$56,000 or moreONE ADULT + ONE PRESCHOOLER
Allegany
AnneArundel
Baltimore
Calvert
Caroline
CarrollCecil
CharlesDorchester
Frederick
Garrett Harford
Howard Kent
Montgomery
PrinceGeorge's
QueenAnne's
St. Mary's
Somerset
Talbot
Washington
Wicomico
Worcester
Baltimore City
the seLf-suffiCieNCY stANDARD foR mARYLAND — 7
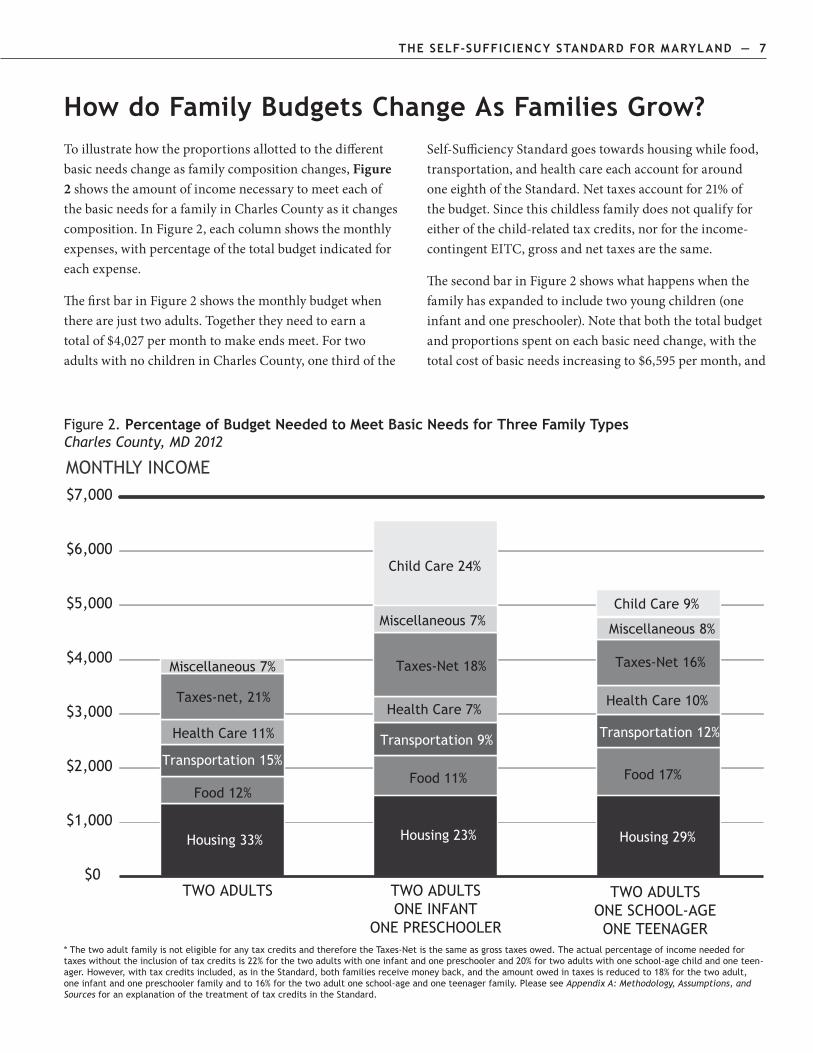
how do family Budgets Change As families Grow?Toillustratehowtheproportionsallottedtothedifferentbasicneedschangeasfamilycompositionchanges,Figure 2showstheamountofincomenecessarytomeeteachofthebasicneedsforafamilyinCharlesCountyasitchangescomposition.InFigure2,eachcolumnshowsthemonthlyexpenses,withpercentageofthetotalbudgetindicatedforeachexpense.
ThefirstbarinFigure2showsthemonthlybudgetwhentherearejusttwoadults.Togethertheyneedtoearnatotalof$4,027permonthtomakeendsmeet.FortwoadultswithnochildreninCharlesCounty,onethirdofthe
Self-SufficiencyStandardgoestowardshousingwhilefood,transportation,andhealthcareeachaccountforaroundoneeighthoftheStandard.Nettaxesaccountfor21%ofthebudget.Sincethischildlessfamilydoesnotqualifyforeitherofthechild-relatedtaxcredits,norfortheincome-contingentEITC,grossandnettaxesarethesame.
ThesecondbarinFigure2showswhathappenswhenthefamilyhasexpandedtoincludetwoyoungchildren(oneinfantandonepreschooler).Notethatboththetotalbudgetandproportionsspentoneachbasicneedchange,withthetotalcostofbasicneedsincreasingto$6,595permonth,and
Figure 2. Percentage of Budget Needed to meet Basic Needs for three family types Charles County, MD 2012
* The two adult family is not eligible for any tax credits and therefore the Taxes-Net is the same as gross taxes owed. The actual percentage of income needed for taxes without the inclusion of tax credits is 22% for the two adults with one infant and one preschooler and 20% for two adults with one school-age child and one teen-ager. However, with tax credits included, as in the Standard, both families receive money back, and the amount owed in taxes is reduced to 18% for the two adult, one infant and one preschooler family and to 16% for the two adult one school-age and one teenager family. Please see Appendix A: Methodology, Assumptions, and Sources for an explanation of the treatment of tax credits in the Standard.
Housing 33% Housing 23% Housing 29%
Child Care 24%
Food 12%Food 11% Food 17%
Transportation 15%Transportation 9% Transportation 12%Health Care 11%
Health Care 7%Health Care 10%Taxes-net, 21%
Taxes-Net 18% Taxes-Net 16%Miscellaneous 7%
Miscellaneous 7% Miscellaneous 8%
$0
$1,000
$2,000
$3,000
$4,000
$5,000
$6,000
$7,000
TWO ADULTS TWO ADULTSONE INFANT
ONE PRESCHOOLER
TWO ADULTSONE SCHOOL-AGEONE TEENAGER
MONTHLY INCOME
Child Care 9%

8 — the seLf-suffiCieNCY stANDARD foR mARYLAND
theproportionofincomeallottedshiftingwiththeadditionofchildcare.Indeed,childcarealoneaccountsfornearlyaquarterofthefamily’sbudgetand47%goestowardschildcareandhousingcombined.Thisisquitecommon:familieswithtwochildren(whenatleastoneisunderschool-age)generallyneedtobudgetroughlyhalftheirincomeforhousingandchildcareexpensesalone.
Foodcostsare11%oftotalincome,muchlowerthanthe33%assumedbythemethodologyoftheFederalPovertyLevel,andsimilartothenationalaverageexpenditureonfood,whichwas13%in2010.5
Healthcaretakesupasmallerproportionofthefamilybudgetat7%oftotalincome,includingboththeemployee’sshareofthehealthcarepremium,andoutofpocketcosts.6
Nettaxesforthefamilynowreflectataxburdenthatisreducedto18%withtheoffsettingeffectsofthechildcare
andchildtaxcredits.Notethattaxcreditsaretreatedasiftheywerereceivedmonthly,althoughcreditsaregenerallynotreceiveduntilthefollowingyearwhentaxesarefiled.Ifitwereassumed,asisgenerallythecaseformostfamilies,thattaxcreditsarereceivedannuallyinalumpsum,thenthemonthlytaxburdenwouldbe22%ofthetotalcostsforthisfamily.
Asthechildrengrowolderandnolongerneedasmuchchildcare,thefamily’sbudgetshiftsagain.ThethirdbarinFigure2showstheproportionofincomespentoneachbasicneedforafamilywithaschool-agechildandateenagerinCharlesCounty.Thetotalcostofbasicneedsdropsto$5,295permonth;thedecreasedamountforchildcarefortheschool-agechildaccountsforjust9%ofthisminimumbudgetforthisfamilytype,amuchsmallerproportionthanwasnecessarywhenthechildrenwereyounger.Incontrast,foodaccountsforalargerproportionofthebudget,at17%,inpartduetoincreasedfoodcostsfortheteenager.
Nettaxesareshownas16%ofthefamily’sbudget.Ifitwereassumed,assuggestedabove,thattaxcreditsarereceivedannuallyinalumpsum,thenthemonthlytaxburdenwouldbe20%ofthetotalcostsfortwoadultswithoneschool-agechildandoneteenager.
faMilieS wiTh Two children (when one
iS under School-aGe) Generally need To
BUDGET HALF THEIR INCOME ON HOUSING AND
CHILD CARE ExPENSES ALONE.
the seLf-suffiCieNCY stANDARD foR mARYLAND — 9
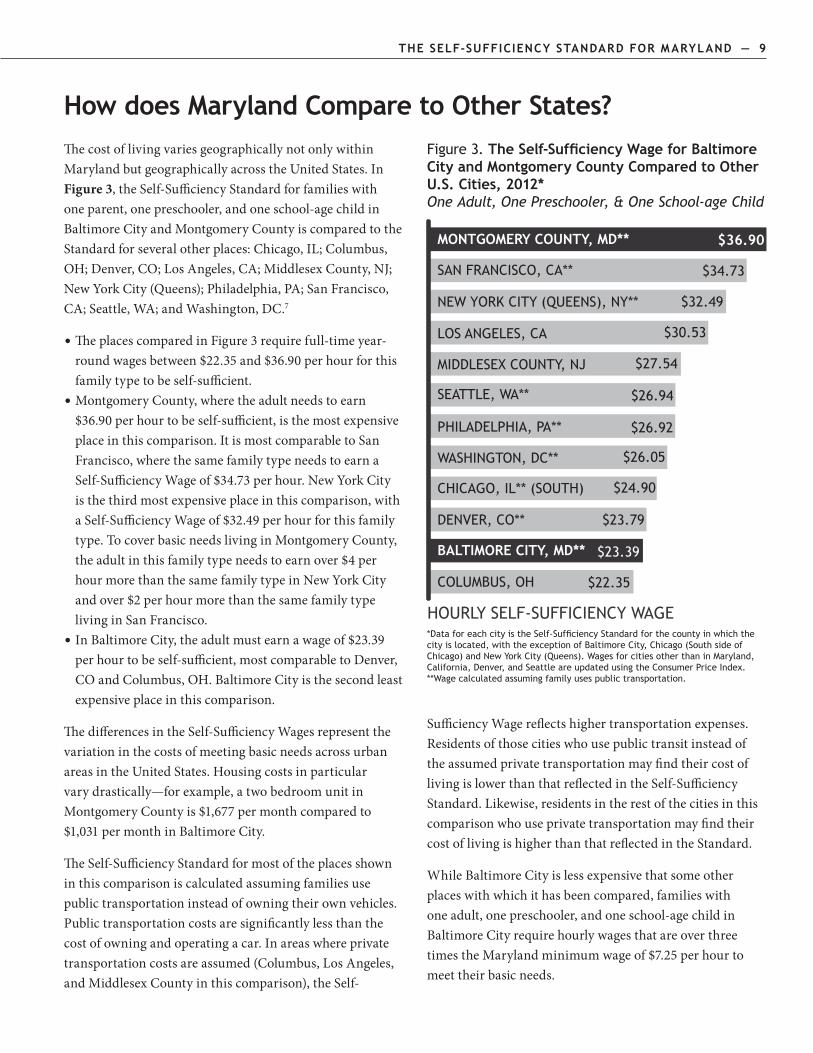
how does maryland Compare to other states?ThecostoflivingvariesgeographicallynotonlywithinMarylandbutgeographicallyacrosstheUnitedStates.InFigure 3,theSelf-SufficiencyStandardforfamilieswithoneparent,onepreschooler,andoneschool-agechildinBaltimoreCityandMontgomeryCountyiscomparedtotheStandardforseveralotherplaces:Chicago,IL;Columbus,OH;Denver,CO;LosAngeles,CA;MiddlesexCounty,NJ;NewYorkCity(Queens);Philadelphia,PA;SanFrancisco,CA;Seattle,WA;andWashington,DC.7
TheplacescomparedinFigure3requirefull-timeyear-• roundwagesbetween$22.35and$36.90perhourforthisfamilytypetobeself-sufficient.MontgomeryCounty,wheretheadultneedstoearn• $36.90perhourtobeself-sufficient,isthemostexpensiveplaceinthiscomparison.ItismostcomparabletoSanFrancisco,wherethesamefamilytypeneedstoearnaSelf-SufficiencyWageof$34.73perhour.NewYorkCityisthethirdmostexpensiveplaceinthiscomparison,withaSelf-SufficiencyWageof$32.49perhourforthisfamilytype.TocoverbasicneedslivinginMontgomeryCounty,theadultinthisfamilytypeneedstoearnover$4perhourmorethanthesamefamilytypeinNewYorkCityandover$2perhourmorethanthesamefamilytypelivinginSanFrancisco.InBaltimoreCity,theadultmustearnawageof$23.39• perhourtobeself-sufficient,mostcomparabletoDenver,COandColumbus,OH.BaltimoreCityisthesecondleastexpensiveplaceinthiscomparison.
ThedifferencesintheSelf-SufficiencyWagesrepresentthevariationinthecostsofmeetingbasicneedsacrossurbanareasintheUnitedStates.Housingcostsinparticularvarydrastically—forexample,atwobedroomunitinMontgomeryCountyis$1,677permonthcomparedto$1,031permonthinBaltimoreCity.
TheSelf-SufficiencyStandardformostoftheplacesshowninthiscomparisoniscalculatedassumingfamiliesusepublictransportationinsteadofowningtheirownvehicles.Publictransportationcostsaresignificantlylessthanthecostofowningandoperatingacar.Inareaswhereprivatetransportationcostsareassumed(Columbus,LosAngeles,andMiddlesexCountyinthiscomparison),theSelf-
Figure 3. The Self-Sufficiency Wage for Baltimore City and montgomery County Compared to other u.s. Cities, 2012* One Adult, One Preschooler, & One School-age Child
*Data for each city is the Self-Sufficiency Standard for the county in which the city is located, with the exception of Baltimore City, Chicago (South side of Chicago) and New York City (Queens). Wages for cities other than in Maryland, California, Denver, and Seattle are updated using the Consumer Price Index. **Wage calculated assuming family uses public transportation.
HOURLY SELF-SUFFICIENCY WAGE
$22.35
$23.39
$23.79
$24.90
$26.05
$26.92
$26.94
$27.54
$30.53
$32.49
$34.73
$36.90
COLUMBUS, OH
BALTIMORE CITY, MD**
DENVER, CO**
CHICAGO, IL** (SOUTH)
WASHINGTON, DC**
PHILADELPHIA, PA**
SEATTLE, WA**
MIDDLESEX COUNTY, NJ
LOS ANGELES, CA
NEW YORK CITY (QUEENS), NY**
SAN FRANCISCO, CA**
MONTGOMERY COUNTY, MD**
SufficiencyWagereflectshighertransportationexpenses.ResidentsofthosecitieswhousepublictransitinsteadoftheassumedprivatetransportationmayfindtheircostoflivingislowerthanthatreflectedintheSelf-SufficiencyStandard.Likewise,residentsintherestofthecitiesinthiscomparisonwhouseprivatetransportationmayfindtheircostoflivingishigherthanthatreflectedintheStandard.
WhileBaltimoreCityislessexpensivethatsomeotherplaceswithwhichithasbeencompared,familieswithoneadult,onepreschooler,andoneschool-agechildinBaltimoreCityrequirehourlywagesthatareoverthreetimestheMarylandminimumwageof$7.25perhourtomeettheirbasicneeds.
10 — the seLf-suffiCieNCY stANDARD foR mARYLAND the seLf-suffiCieNCY stANDARD foR mARYLAND — 11
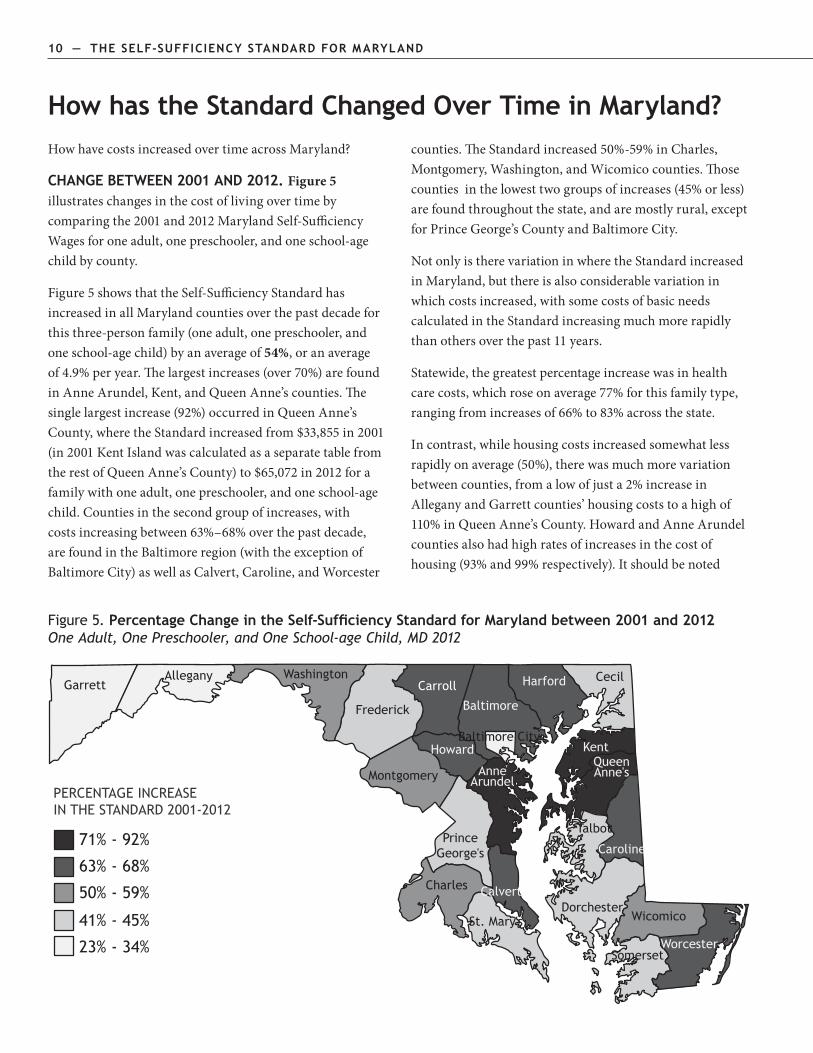
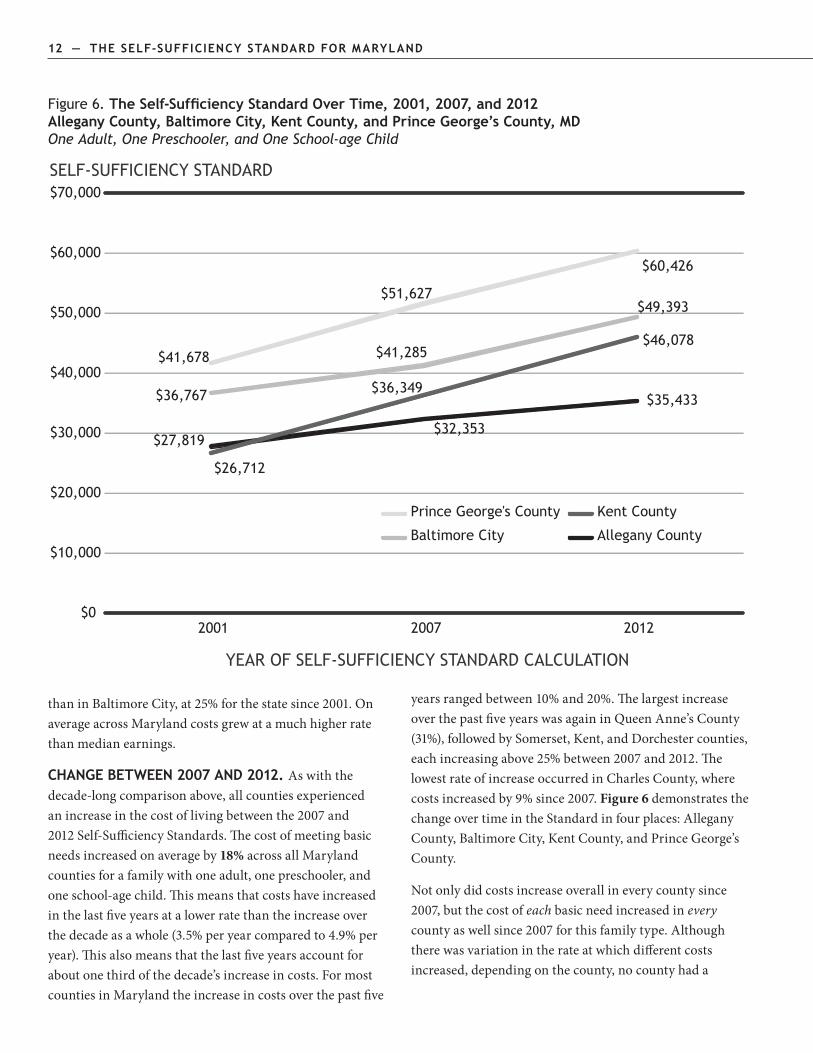
how has the standard Changed over time in maryland?HowhavecostsincreasedovertimeacrossMaryland?
ChANGe BetWeeN 2001 AND 2012. Figure 5illustrateschangesinthecostoflivingovertimebycomparingthe2001and2012MarylandSelf-SufficiencyWagesforoneadult,onepreschooler,andoneschool-agechildbycounty.
Figure5showsthattheSelf-SufficiencyStandardhasincreasedinallMarylandcountiesoverthepastdecadeforthisthree-personfamily(oneadult,onepreschooler,andoneschool-agechild)byanaverageof54%,oranaverageof4.9%peryear.Thelargestincreases(over70%)arefoundinAnneArundel,Kent,andQueenAnne’scounties.Thesinglelargestincrease(92%)occurredinQueenAnne’sCounty,wheretheStandardincreasedfrom$33,855in2001(in2001KentIslandwascalculatedasaseparatetablefromtherestofQueenAnne’sCounty)to$65,072in2012forafamilywithoneadult,onepreschooler,andoneschool-agechild.Countiesinthesecondgroupofincreases,withcostsincreasingbetween63%–68%overthepastdecade,arefoundintheBaltimoreregion(withtheexceptionofBaltimoreCity)aswellasCalvert,Caroline,andWorcester
counties.TheStandardincreased50%-59%inCharles,Montgomery,Washington,andWicomicocounties.Thosecountiesinthelowesttwogroupsofincreases(45%orless)arefoundthroughoutthestate,andaremostlyrural,exceptforPrinceGeorge’sCountyandBaltimoreCity.
NotonlyistherevariationinwheretheStandardincreasedinMaryland,butthereisalsoconsiderablevariationinwhichcostsincreased,withsomecostsofbasicneedscalculatedintheStandardincreasingmuchmorerapidlythanothersoverthepast11years.
Statewide,thegreatestpercentageincreasewasinhealthcarecosts,whichroseonaverage77%forthisfamilytype,rangingfromincreasesof66%to83%acrossthestate.
Incontrast,whilehousingcostsincreasedsomewhatlessrapidlyonaverage(50%),therewasmuchmorevariationbetweencounties,fromalowofjusta2%increaseinAlleganyandGarrettcounties’housingcoststoahighof110%inQueenAnne’sCounty.HowardandAnneArundelcountiesalsohadhighratesofincreasesinthecostofhousing(93%and99%respectively).Itshouldbenoted
Figure 5. Percentage Change in the Self-Sufficiency Standard for Maryland between 2001 and 2012 One Adult, One Preschooler, and One School-age Child, MD 2012
Allegany
AnneArundel
Baltimore
Calvert
Caroline
CarrollCecil
Charles
Dorchester
Frederick
Garrett Harford
Howard Kent
Montgomery
PrinceGeorge's
QueenAnne's
St. Mary's
Somerset
Talbot
Washington
Wicomico
Worcester
Baltimore City
71% - 92%
63% - 68%
50% - 59%
41% - 45%
23% - 34%
PERCENTAGE INCREASE IN THE STANDARD 2001-2012
10 — the seLf-suffiCieNCY stANDARD foR mARYLAND the seLf-suffiCieNCY stANDARD foR mARYLAND — 11
thatthemethodologyforcalculatinghousingcostshaschangedsomewhatsincethe2001Standard.VariationinthecostofhousingwithinmetropolitanareaswithmultiplecountiesarenowcalculatedusingmedianrentdatafromtheAmericanCommunitySurvey,whilein2001variationwascalculatedusingPublicHousingAuthoritypaymentstandards.
Childcarecostsincreasedataratesimilartobutslightlyhigherthanhousing,57%,butalsowithconsiderablevariabilityacrosscounties,rangingfrom28%to115%.KentandQueenAnne’scountiesexperiencedthehighestincreasesinchildcare(115%and91%respectively)whileDorchesterincreasedatthelowestrate(28%).
Transportationcostsincreased20%onaverageincountiesthatrelyonprivatetransportationforgettingtoandfromwork.HoweverBaltimoreCity,MontgomeryCounty,andPrinceGeorge’sCountyswitchedfromanassumptionofprivatetransportationin2001toanassumptionofpublictransportationin2012(reflectingincreaseduseofpublictransportationforcommuting)causingtransportationcoststodecreasesince2001inthesethreecounties.
Overthepastdecadefoodcostsincreasedonaverage47%acrossthestate.Therewaslessvariationintheratesofincreaseinthecostoffood,rangingfrom36%(GarrettCounty)to51%withfoodcostsincreasingby45%to50%inmostcounties.Notethatfoodcostswerenotvariedbycountyinthe2001Standard.
Onaverage,taxesincreasedatarateof71%acrossthestatesince2001.Theincreaseintaxesisprimarilyduetoincreasedcostspushingfamiliesintohighertaxbrackets.However,someofthetaxincreasewasoffsetbypolicychangesthatexpandedtaxcredits.Inparticular,boththeChildCareTaxCreditandtheChildTaxCreditincreasedsubstantiallyforthisfamilytype(withtheamountdependentontotalincomeneededforallexpenses).
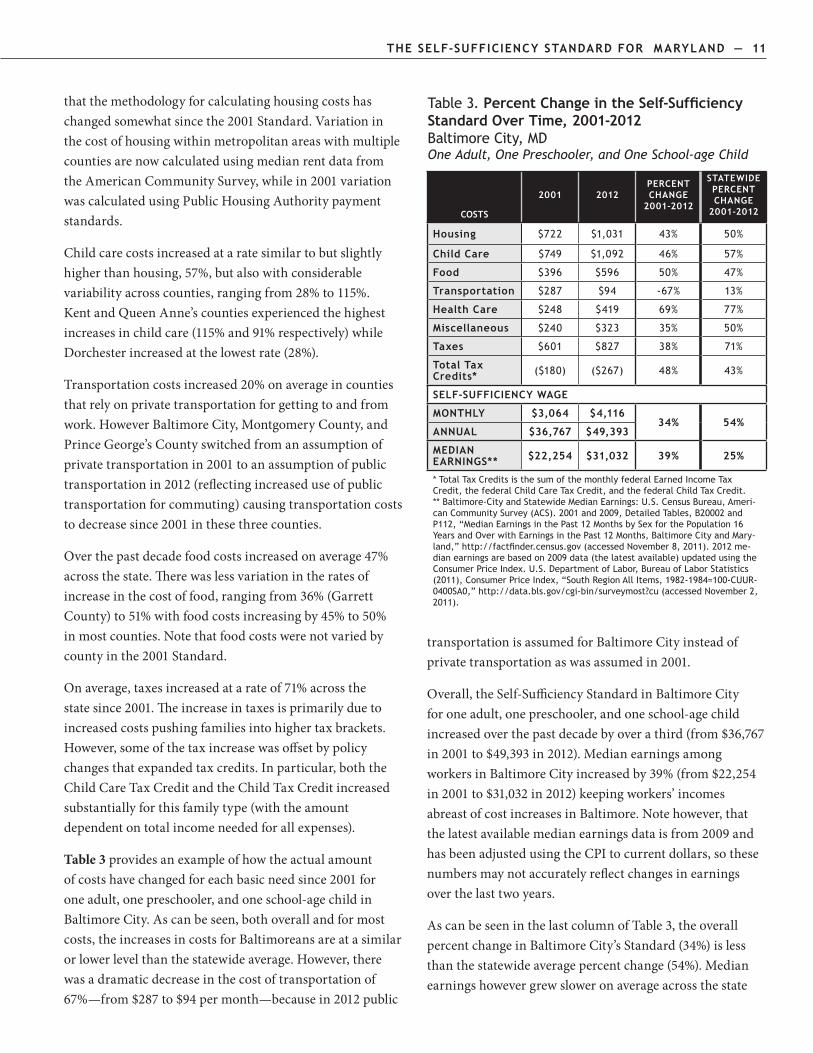
Table 3providesanexampleofhowtheactualamountofcostshavechangedforeachbasicneedsince2001foroneadult,onepreschooler,andoneschool-agechildinBaltimoreCity.Ascanbeseen,bothoverallandformostcosts,theincreasesincostsforBaltimoreansareatasimilarorlowerlevelthanthestatewideaverage.However,therewasadramaticdecreaseinthecostoftransportationof67%—from$287to$94permonth—becausein2012public
Table 3. Percent Change in the Self-Sufficiency standard over time, 2001-2012 Baltimore City, MD One Adult, One Preschooler, and One School-age Child
Costs
2001 2012PeRCeNt ChANGe
2001-2012
stAteWiDePeRCeNt ChANGe
2001-2012
housing $722 $1,031 43% 50%
Child Care $749 $1,092 46% 57%
food $396 $596 50% 47%
transportation $287 $94 -67% 13%
health Care $248 $419 69% 77%
miscellaneous $240 $323 35% 50%
taxes $601 $827 38% 71%
total tax Credits* ($180) ($267) 48% 43%
seLf-suffiCieNCY WAGe
moNthLY $3,064 $4,11634% 54%
ANNuAL $36,767 $49,393
meDiAN eARNiNGs** $22,254 $31,032 39% 25%
* Total Tax Credits is the sum of the monthly federal Earned Income Tax Credit, the federal Child Care Tax Credit, and the federal Child Tax Credit. ** Baltimore-City and Statewide Median Earnings: U.S. Census Bureau, Ameri-can Community Survey (ACS). 2001 and 2009, Detailed Tables, B20002 and P112, “Median Earnings in the Past 12 Months by Sex for the Population 16 Years and Over with Earnings in the Past 12 Months, Baltimore City and Mary-land,” http://factfinder.census.gov (accessed November 8, 2011). 2012 me-dian earnings are based on 2009 data (the latest available) updated using the Consumer Price Index. U.S. Department of Labor, Bureau of Labor Statistics (2011), Consumer Price Index, “South Region All Items, 1982-1984=100-CUUR-0400SA0,” http://data.bls.gov/cgi-bin/surveymost?cu (accessed November 2, 2011).
transportationisassumedforBaltimoreCityinsteadofprivatetransportationaswasassumedin2001.
Overall,theSelf-SufficiencyStandardinBaltimoreCityforoneadult,onepreschooler,andoneschool-agechildincreasedoverthepastdecadebyoverathird(from$36,767in2001to$49,393in2012).MedianearningsamongworkersinBaltimoreCityincreasedby39%(from$22,254in2001to$31,032in2012)keepingworkers’incomesabreastofcostincreasesinBaltimore.Notehowever,thatthelatestavailablemedianearningsdataisfrom2009andhasbeenadjustedusingtheCPItocurrentdollars,sothesenumbersmaynotaccuratelyreflectchangesinearningsoverthelasttwoyears.
AscanbeseeninthelastcolumnofTable3,theoverallpercentchangeinBaltimoreCity’sStandard(34%)islessthanthestatewideaveragepercentchange(54%).Medianearningshowevergrewsloweronaverageacrossthestate
12 — the seLf-suffiCieNCY stANDARD foR mARYLAND the seLf-suffiCieNCY stANDARD foR mARYLAND — 13
thaninBaltimoreCity,at25%forthestatesince2001.OnaverageacrossMarylandcostsgrewatamuchhigherratethanmedianearnings.
ChANGe BetWeeN 2007 AND 2012. Aswiththedecade-longcomparisonabove,allcountiesexperiencedanincreaseinthecostoflivingbetweenthe2007and2012Self-SufficiencyStandards.Thecostofmeetingbasicneedsincreasedonaverageby18%acrossallMarylandcountiesforafamilywithoneadult,onepreschooler,andoneschool-agechild.Thismeansthatcostshaveincreasedinthelastfiveyearsatalowerratethantheincreaseoverthedecadeasawhole(3.5%peryearcomparedto4.9%peryear).Thisalsomeansthatthelastfiveyearsaccountforaboutonethirdofthedecade’sincreaseincosts.FormostcountiesinMarylandtheincreaseincostsoverthepastfive
yearsrangedbetween10%and20%.ThelargestincreaseoverthepastfiveyearswasagaininQueenAnne’sCounty(31%),followedbySomerset,Kent,andDorchestercounties,eachincreasingabove25%between2007and2012.ThelowestrateofincreaseoccurredinCharlesCounty,wherecostsincreasedby9%since2007.Figure 6 demonstratesthechangeovertimeintheStandardinfourplaces:AlleganyCounty,BaltimoreCity,KentCounty,andPrinceGeorge’sCounty.
Notonlydidcostsincreaseoverallineverycountysince2007,butthecostofeachbasicneedincreasedineverycountyaswellsince2007forthisfamilytype.Althoughtherewasvariationintherateatwhichdifferentcostsincreased,dependingonthecounty,nocountyhada
Figure 6. The Self-Sufficiency Standard Over Time, 2001, 2007, and 2012 Allegany County, Baltimore City, Kent County, and Prince George’s County, mD One Adult, One Preschooler, and One School-age Child
SELF-SUFFICIENCY STANDARD
$27,819$32,353
$35,433$36,767
$41,285
$49,393
$26,712
$36,349
$46,078$41,678
$51,627
$60,426
$0
$10,000
$20,000
$30,000
$40,000
$50,000
$60,000
$70,000
2001 2007 2012
Allegany CountyBaltimore City
Kent CountyPrince George's County
YEAR OF SELF-SUFFICIENCY STANDARD CALCULATION
12 — the seLf-suffiCieNCY stANDARD foR mARYLAND the seLf-suffiCieNCY stANDARD foR mARYLAND — 13
Figure 7. CPI*-Measured Inflation Underestimates Real Cost of Living Increases: A Comparison of the Self-Sufficiency Standard and the Consumer Price Index, 2001-2012 Kent County and Prince George’s County, MD One Adult, One Preschooler, and One School-age Child
* U.S. Department of Labor, Bureau of Labor Statistics, Consumer Price Index, “South Region All Items, 1982-84=100-CUURA101SAO,” http://data.bls.gov/cgi-bin/sur-veymost (accessed November 2, 2011).** Since the CPI does not incorporate taxes or tax credits, these items have been taken out of the Self-Sufficiency Standard for the comparison figure.
ANNUAL INCOME
$0
$10,000
$20,000
$30,000
$40,000
$50,000
$60,000
2001 2007 2012
Kent County 2001 Standard updated to 2012 using the CPIKent County 2012 Self-Sufficiency Standard**
Prince George's County 2001 Standard updated to 2012 using the CPIPrince George's County 2012 Self-Sufficiency Standard**
decreaseinanycosts(withtheexceptionoftaxes,whichdecreasedslightlyinAlleganyandGarrettcounties).
Onaverageacrossthestate,besidestaxes,transportationhasthehighestrateofincreaseamongbasicneeds,increasinginallMarylandcountiesatanaveragerateof20%since2007.NotethatBaltimoreCity,MontgomeryCounty,andPrinceGeorge’sCountyarecalculatedassumingpublictransportationinboththe2007and2012Standards;and,thecostofpublictransportationincreasedby17%inBaltimoreCityandby58%inMontgomeryandPrinceGeorge’scountiesbetween2007and2012.Allotherbasicneedsincreasedbyaverageratesbetween8%(food)and18%(childcare)since2007.
Overall,thetrendsoffallinghousepricesanddecliningearningscharacterizedbytheGreatRecessionmightleadonetoexpectfallingcosts.Infact,inallMarylandcounties
thecostofbasicneedssuchashousing,childcare,food,healthcare,andtransportationincreasedforfamilieswithoneadult,onepreschooler,andoneschool-agechildsincethestartoftheGreatRecession.Thus,thesedatashowthatinreality,thecostofmeetingmostbasicneedshasincreasedinallcountiesinMarylandsince2007,resultinginanoverallaverageincreaseof18%intheStandardacrossMarylandforthisfamilytype.
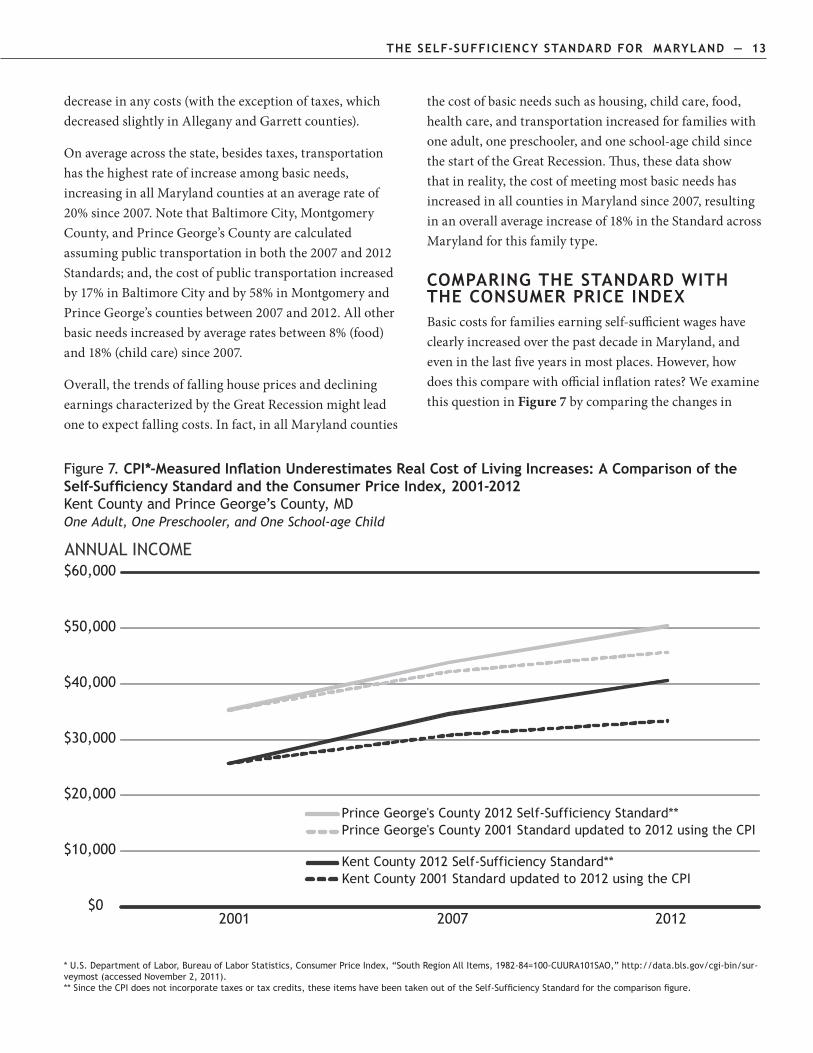
ComPARiNG the stANDARD With the CoNsumeR PRiCe iNDexBasiccostsforfamiliesearningself-sufficientwageshaveclearlyincreasedoverthepastdecadeinMaryland,andeveninthelastfiveyearsinmostplaces.However,howdoesthiscomparewithofficialinflationrates?WeexaminethisquestioninFigure 7bycomparingthechangesin

14 — the seLf-suffiCieNCY stANDARD foR mARYLAND
theSelf-SufficiencyStandardinKentCountyandPrinceGeorge’sCountyforoneadult,onepreschooler,andoneschool-agechildtotherateofinflationasmeasuredbytheU.S.DepartmentofLabor’sConsumerPriceIndex(CPI)overthepastdecade.TheCPIisameasureoftheaveragechangesinthepricespaidbyurbanconsumersforgoodsandservices.SincetheCPIdoesnotincorporatetaxesortaxcredits,forcomparisonpurposestheseitemshavebeentakenoutoftheStandard.
Whenthe2001Self-SufficiencyStandardforKentCounty($25,696peryearwhenadjustedtoexcludetaxesandtaxcredits)isinflatedusingtheSouthRegionConsumerPriceIndex,theamountestimatedtomeetbasicneedsin2012is$33,251peryear.10UsingtheCPIresultsina29%changeinthecostofbasicneedssince2001,anannualaveragerateof2.7%.However,theactual2012KentCountyStandard(adjustedtoexcludetaxes/taxcredits)is$40,537peryearforthisfamilytype,a58%increaseoverthelastdecadeoranannualaveragerateof5.3%.InPrinceGeorge’sCounty,
whentheadjusted2001Standard($35,188peryearwithouttaxes/taxcredits)isinflatedto2012usingtheCPI,theestimatedcostofmeetingbasicneedsis$45,534.However,theactualStandardfor2012is$50,204inPrinceGeorge’sCounty,anincreaseof43%,or3.9%annuallyonaverage.
Insum,Figure7demonstratesthattherateofinflationasmeasuredbytheCPIsignificantlyunderestimatestherisingcostsofbasicneeds;insteadofrisingbytheCPIaverageannualrateof2.7%,costsactuallyrosebyannualaverageratesof5.3%inKentCountyand3.9%inPrinceGeorge’sCounty.Indeed,forthisfamilytypeinKentCounty,whentheStandardisupdatedusingtheCPI,theofficialmeasureofinflationunderestimatestheincreaseincostsforthisfamilytypebyover$7,000since2001.Thatis,trackingcostsusingtheCPIunderestimatestherealincreasesincostsfacedbyMarylandfamiliesatthislevel,leavingthemthousandsofdollarsshortofwhattheyneedtobeself-sufficient.
the seLf-suffiCieNCY stANDARD foR mARYLAND — 15
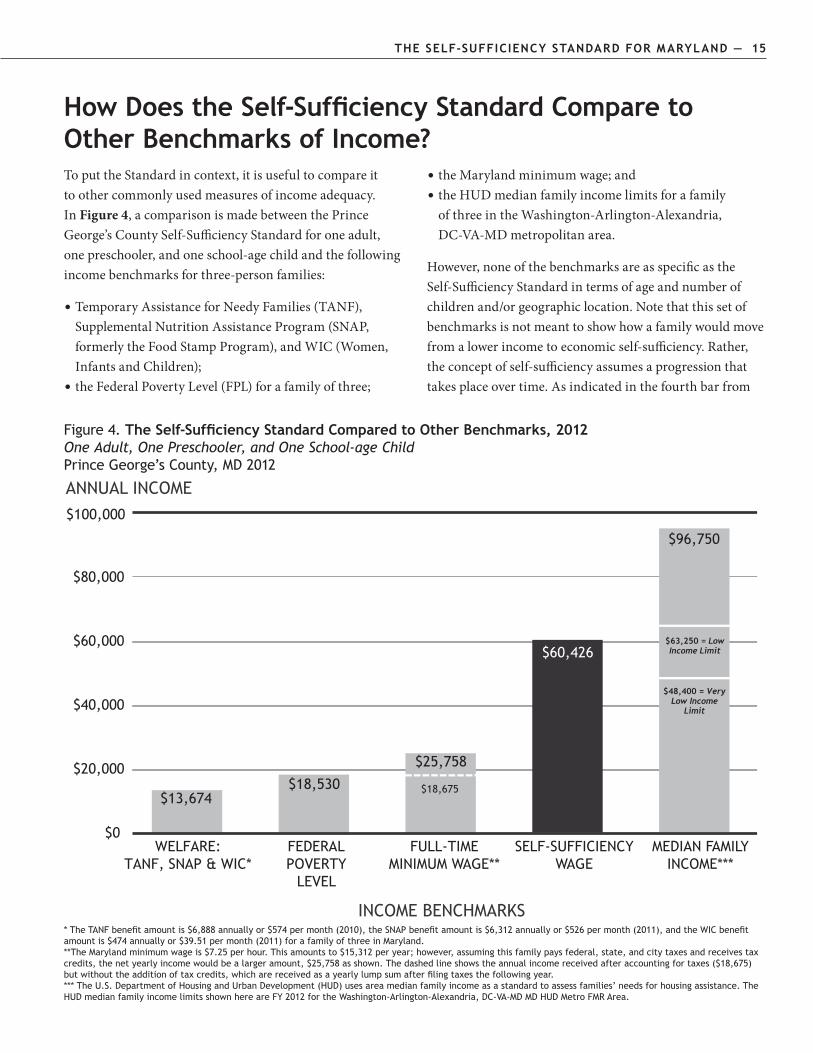
How Does the Self-Sufficiency Standard Compare to other Benchmarks of income?ToputtheStandardincontext,itisusefultocompareittoothercommonlyusedmeasuresofincomeadequacy.InFigure 4,acomparisonismadebetweenthePrinceGeorge’sCountySelf-SufficiencyStandardforoneadult,onepreschooler,andoneschool-agechildandthefollowingincomebenchmarksforthree-personfamilies:
TemporaryAssistanceforNeedyFamilies(TANF),• SupplementalNutritionAssistanceProgram(SNAP,formerlytheFoodStampProgram),andWIC(Women,InfantsandChildren);theFederalPovertyLevel(FPL)forafamilyofthree;•
theMarylandminimumwage;and• theHUDmedianfamilyincomelimitsforafamily• ofthreeintheWashington-Arlington-Alexandria,DC-VA-MDmetropolitanarea.
However,noneofthebenchmarksareasspecificastheSelf-SufficiencyStandardintermsofageandnumberofchildrenand/orgeographiclocation.Notethatthissetofbenchmarksisnotmeanttoshowhowafamilywouldmovefromalowerincometoeconomicself-sufficiency.Rather,theconceptofself-sufficiencyassumesaprogressionthattakesplaceovertime.Asindicatedinthefourthbarfrom
Figure 4. The Self-Sufficiency Standard Compared to Other Benchmarks, 2012 One Adult, One Preschooler, and One School-age Child Prince George’s County, MD 2012
* The TANF benefit amount is $6,888 annually or $574 per month (2010), the SNAP benefit amount is $6,312 annually or $526 per month (2011), and the WIC benefit amount is $474 annually or $39.51 per month (2011) for a family of three in Maryland.**The Maryland minimum wage is $7.25 per hour. This amounts to $15,312 per year; however, assuming this family pays federal, state, and city taxes and receives tax credits, the net yearly income would be a larger amount, $25,758 as shown. The dashed line shows the annual income received after accounting for taxes ($18,675) but without the addition of tax credits, which are received as a yearly lump sum after filing taxes the following year.*** The U.S. Department of Housing and Urban Development (HUD) uses area median family income as a standard to assess families’ needs for housing assistance. The HUD median family income limits shown here are FY 2012 for the Washington-Arlington-Alexandria, DC-vA-MD MD HUD Metro FMR Area.
ANNUAL INCOME
$13,674$18,530
$25,758
$60,426
$96,750
$0
$20,000
$40,000
$60,000
$80,000
$63,250 = Low Income Limit
$48,400 = VeryLow Income
Limit
$18,675
WELFARE:TANF, SNAP & WIC*
FEDERALPOVERTY
LEVEL
FULL-TIMEMINIMUM WAGE**
SELF-SUFFICIENCYWAGE
MEDIAN FAMILYINCOME***
INCOME BENCHMARKS
$100,000
16 — the seLf-suffiCieNCY stANDARD foR mARYLAND
theleftinFigure4,theSelf-SufficiencyWageforthisfamilytypeinPrinceGeorge’sCountyis$60,426peryear.
tANf, sNAP AND WiC. ThefirstbarontheleftinFigure4demonstratestheincomeofthebasicpublicassistancepackage,includingthecashvalueofSNAP(formerlyfoodstamps),WIC,andTANF,andassumingnootherincome.Thetotalpublicassistancepackageamountsto$13,674peryearforthree-personfamiliesinMaryland.Thispublicassistancepackageisjust23%oftheSelf-SufficiencyStandardforathree-personfamilyinPrinceGeorge’sCountyandis74%oftheFPLforathree-personfamily.
feDeRAL PoVeRtY LeVeL. AccordingtotheFederalPovertyLevel,afamilyconsistingofoneadultandtwochildrenwouldbeconsidered“poor”withanincomeof$18,530annuallyorlessin2011—regardlessofwheretheylive,ortheageoftheirchildren.TheFPLforthree-personfamiliesisjust31%oftheSelf-SufficiencyStandardforfamilieswithoneadult,onepreschooler,andoneschool-agechildlivinginPrinceGeorge’sCounty.
Statewide,theSelf-SufficiencyStandardforafamilywithoneadult,onepreschooler,andoneschool-agechildrangesfrom163%oftheFPLinGarrettCountyto421%oftheFPLinMontgomeryCounty.TableC-1 (in Appendix C: Federal Approaches to Measuring Poverty)detailsthepercentageoftheFPLneededtomeetbasicneedsbycountyandforseveralfamilytypes.
miNimum WAGe. Maryland’sminimumwageis$7.25perhour.Afull-timeminimumwageworkerearns$15,312peryear.Aftersubtractingpayrolltaxes(SocialSecurityandMedicare)andaddingtaxcreditswheneligible,aworkingparentwithonepreschoolerandoneschool-agechildwouldhaveanetcashincomeof$25,758peryear.Thisamountismorethantheworker’searningsalonebecausethetaxcreditsforwhichthefamilyqualifiesaremorethanthetaxesowed.
Afull-timejobattheminimumwageprovides43%oftheamountneededtobeself-sufficientforthisfamilytypeinPrinceGeorge’sCountyifthefamilyreceivesallofthetaxcreditsforwhichtheymightbeeligible.However,ifitisassumedthattheworkerpaystaxesmonthlythroughwithholdings,butdoesnotreceivetaxcreditsonamonthlybasis(asistrueofmostworkers),hertake-homeincomewouldbe$18,675duringtheyear,shownbythedashedlineonthethirdbar.WithoutincludingtheimpactoftaxcreditsineithertheminimumwageorSelf-SufficiencyStandardincome(butstillaccountingforpaymentoftaxes),aminimumwagejobamountstojust31%oftheSelf-SufficiencyStandardforthisfamilytypeinPrinceGeorge’sCounty.
meDiAN fAmiLY iNCome Limits. Medianfamilyincome(halfofanarea’sfamilieshaveincomesabovethisamountandhalfhaveincomesbelowthisamount)isaroughmeasureoftherelativecostoflivinginanarea.TheU.S.DepartmentofHousingandUrbanDevelopment(HUD)usesareamedianfamilyincometocalculateincomelimitstoassessfamilies’needsforhousingassistance.TheFiscalYear2012HUDmedianincomeforathree-personfamilyintheWashington-Arlington-Alexandria,DC-VA-MDis$96,750annually.8HUDincomelimitsdefine“lowincome”three-personfamiliesintheWashington-Arlington-Alexandria,DC-VA-MDmetropolitanareaasthosewithincomesbetween$48,400and$63,250,whilethoseconsidered“verylowincome”haveincomesbetween$29,050and$48,400,andthosewithincomesbelow$29,050areconsidered“extremelylowincome.”9TheSelf-SufficiencyStandardof$60,426forthisfamilytypeinPrinceGeorge’sCountyisbetweentheHUD“lowincome”and“verylowincome”limits,demonstratingthattheStandardisaconservativemeasureoftheminimumrequiredtobeself-sufficientinPrinceGeorge’sCounty.
the seLf-suffiCieNCY stANDARD foR mARYLAND — 17
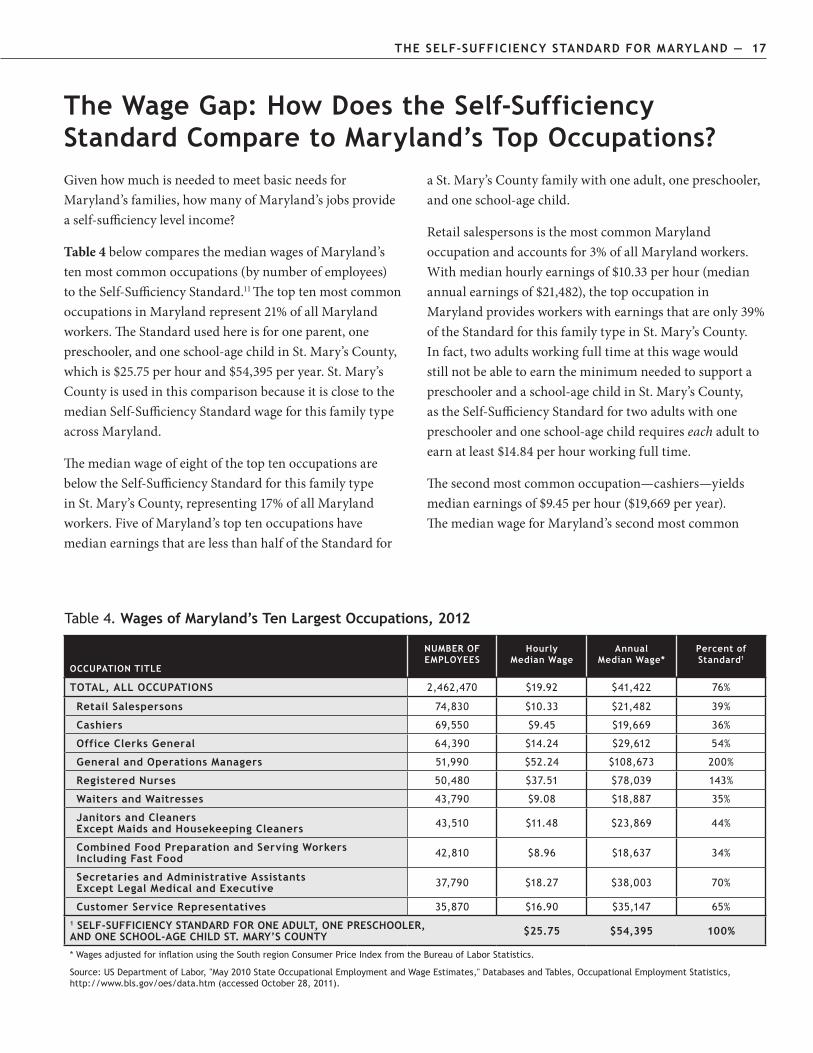
The Wage Gap: How Does the Self-Sufficiency standard Compare to maryland’s top occupations?GivenhowmuchisneededtomeetbasicneedsforMaryland’sfamilies,howmanyofMaryland’sjobsprovideaself-sufficiencylevelincome?
Table 4belowcomparesthemedianwagesofMaryland’stenmostcommonoccupations(bynumberofemployees)totheSelf-SufficiencyStandard.11ThetoptenmostcommonoccupationsinMarylandrepresent21%ofallMarylandworkers.TheStandardusedhereisforoneparent,onepreschooler,andoneschool-agechildinSt.Mary’sCounty,whichis$25.75perhourand$54,395peryear.St.Mary’sCountyisusedinthiscomparisonbecauseitisclosetothemedianSelf-SufficiencyStandardwageforthisfamilytypeacrossMaryland.
ThemedianwageofeightofthetoptenoccupationsarebelowtheSelf-SufficiencyStandardforthisfamilytypeinSt.Mary’sCounty,representing17%ofallMarylandworkers.FiveofMaryland’stoptenoccupationshavemedianearningsthatarelessthanhalfoftheStandardfor
aSt.Mary’sCountyfamilywithoneadult,onepreschooler,andoneschool-agechild.
RetailsalespersonsisthemostcommonMarylandoccupationandaccountsfor3%ofallMarylandworkers.Withmedianhourlyearningsof$10.33perhour(medianannualearningsof$21,482),thetopoccupationinMarylandprovidesworkerswithearningsthatareonly39%oftheStandardforthisfamilytypeinSt.Mary’sCounty.Infact,twoadultsworkingfulltimeatthiswagewouldstillnotbeabletoearntheminimumneededtosupportapreschoolerandaschool-agechildinSt.Mary’sCounty,astheSelf-SufficiencyStandardfortwoadultswithonepreschoolerandoneschool-agechildrequireseach adulttoearnatleast$14.84perhourworkingfulltime.
Thesecondmostcommonoccupation—cashiers—yieldsmedianearningsof$9.45perhour($19,669peryear).ThemedianwageforMaryland’ssecondmostcommon
Table 4. Wages of maryland’s ten Largest occupations, 2012
oCCuPAtioN titLe
NumBeR of emPLoYees
hourly median Wage
Annual median Wage*
Percent of standard1
totAL, ALL oCCuPAtioNs 2,462,470 $19.92 $41,422 76%
Retail salespersons 74,830 $10.33 $21,482 39%
Cashiers 69,550 $9.45 $19,669 36%
office Clerks General 64,390 $14.24 $29,612 54%
General and operations managers 51,990 $52.24 $108,673 200%
Registered Nurses 50,480 $37.51 $78,039 143%
Waiters and Waitresses 43,790 $9.08 $18,887 35%
Janitors and Cleaners except maids and housekeeping Cleaners 43,510 $11.48 $23,869 44%
Combined food Preparation and serving Workers including fast food 42,810 $8.96 $18,637 34%
secretaries and Administrative Assistants except Legal medical and executive 37,790 $18.27 $38,003 70%
Customer service Representatives 35,870 $16.90 $35,147 65%1 seLf-suffiCieNCY stANDARD foR oNe ADuLt, oNe PResChooLeR, AND oNe sChooL-AGe ChiLD st. mARY’s CouNtY $25.75 $54,395 100%
* Wages adjusted for inflation using the South region Consumer Price Index from the Bureau of Labor Statistics.
Source: US Department of Labor, "May 2010 State Occupational Employment and Wage Estimates," Databases and Tables, Occupational Employment Statistics, http://www.bls.gov/oes/data.htm (accessed October 28, 2011).

18 — the seLf-suffiCieNCY stANDARD foR mARYLAND
occupationfallsshortofself-sufficiencybynearly$35,000annuallyforthisSt.Mary’sCountyfamilyofthree.
Onlytwoofthetopoccupations,generalandoperationsmanagersandregisterednurses,yieldearningsthatareabovetheminimumrequiredtomeetbasicneedsinSt.Mary’sCountyforthisthree-personfamily.RegisterednursesinMarylandhaveamedianincomeof$78,039peryear,whichis143%oftheSelf-SufficiencyStandardforthisfamilytypeinSt.Mary’sCounty.Generalandoperationsmanagersearnamedianincomeof$108,673annually,or200%oftheStandardinSt.Mary’sCountyforthisthree-personfamily.However,thesetwooccupationstogethermakeuponlyabout4%ofallMarylandworkers.
AlthoughtheirmedianwagesarelessthantheStandard,secretariesandadministrativeassistantsearnthenexthighestmedianwagesofthetoptenoccupations.At$18.27perhour($38,003annually),theirmedianwagesareabouthalfthatofregisterednursesandaboutonethirdofgeneralandoperationsmanagers.Asingleparentwithapreschoolerandschool-agechildearningthemedianwageforsecretariesandadministrativeassistantswouldearn70%ofthewageneededtobeself-sufficientinSt.Mary’sCounty.
only Two of Maryland’S Ten MoST
COMMON OCCUPATIONS HAvE MEDIAN WAGES
THAT ARE ABOvE THE MINIMUM LEvEL OF
SELF-SUFFICIENCY.
Thus,onlytwoofMaryland’stenmostcommonoccupationshavewagesthatareabovetheminimumlevelofself-sufficiency.Inaddition,mostjoblossesoftheGreatRecessionwereinhigher-wageindustriesyetastheeconomyrecoversthemostjobgainshavebeeninlower-wageindustries.12Workersthathavelosttheirjobsorareworkinginlow-wageindustriesoftencannotaffordtheirhousing,foodandchildcare,muchlessotherexpenses,andareforcedtochoosebetweenbasicneeds.ThisanalysisofthewagesofthemostcommonMarylandoccupationsdemonstratesthattheeconomicinsecurityfacedbysomanyworkersisnotareflectionofalackofworkeffortbutsimplythatwagesaretoolowinmanyMarylandoccupations.
Therearetwobasicapproachestoclosetheincomegapbetweenlow-wageworkandwhatitreallytakestomakeendsmeet:reducecostsorraiseincomes.Thenexttwosectionswilldiscussstrategiesusedineachoftheseapproaches.Thefirstapproachreliesonshort-termstrategiestoreducecoststemporarilythroughworksupports(subsidies),suchasfoodandchildcareassistance.Strategiesforthesecondapproach,raisingincomes,includelonger-termapproachessuchasincreasingeducationlevels,incumbentworkerprograms,andnontraditionaljobtracks.Reducingcostsandraisingincomesarenotnecessarilymutuallyexclusive,butcanoccursequentiallyorintandem.Forexample,someparentsmayreceiveeducationandtrainingthatleadstoanewjobyetcontinuetosupplementtheirincomesbyworksupportsuntiltheirwagesreachtheself-sufficiencylevel.
the seLf-suffiCieNCY stANDARD foR mARYLAND — 19
WhiletheSelf-SufficiencyStandardprovidestheamountofincomethatmeetsfamilies’basicneedswithoutpublicorprivateassistance,manyfamiliescannotachieveself-sufficiencyimmediately.“Worksupports”canhelpworkingfamiliesachievestabilitywithoutneedingtochoosebetweenbasicneeds,suchasscrimpingonnutrition,livinginovercrowdedorsubstandardhousing,orleavingchildreninunsafeand/ornon-stimulatingenvironments.Worksupportscanalsoofferstabilitytohelpafamilyretainemployment,anecessaryconditionforimprovingwages.ThissectionmodelshowworksupportstemporarilyreducefamilyexpensesuntiltheyareabletoearnSelf-SufficiencyWages,thusclosingthegapbetweenactualwagesandwhatitreallytakestomakeendsmeet.
Worksupportsincludeprogramssuchas:
childcareassistance(MarylandChildCareSubsidy[CCS]• Program)healthcare(MedicaidandMaryland’sChildren’sHealth• Program[MCHP]),foodassistance(SNAP,whichinMarylandiscalled• theFoodSupplementProgram[FSP],andtheWomen,InfantsandChildren[WIC]Program),housingassistance(includingSection8vouchersand• publichousing).
Althoughnotaworksupportperse,childsupportisalsomodeledasitassistsfamiliesinmeetingbasicneeds.
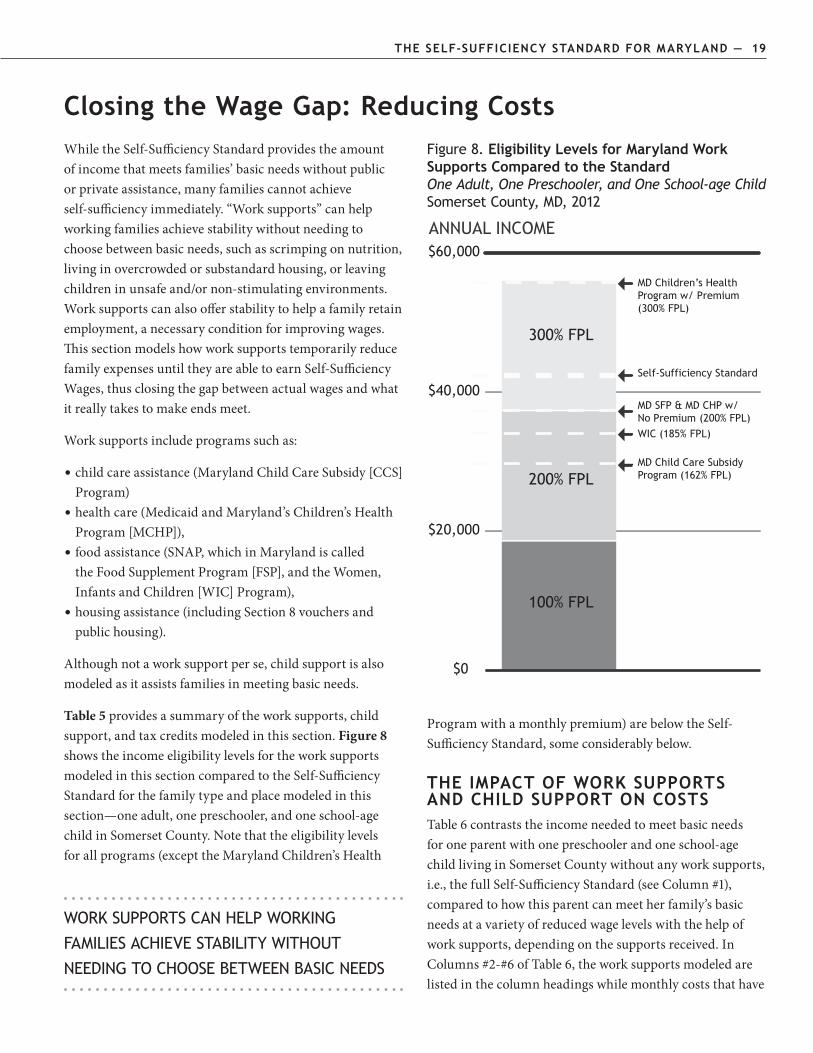
Table 5providesasummaryoftheworksupports,childsupport,andtaxcreditsmodeledinthissection. Figure 8showstheincomeeligibilitylevelsfortheworksupportsmodeledinthissectioncomparedtotheSelf-SufficiencyStandardforthefamilytypeandplacemodeledinthissection—oneadult,onepreschooler,andoneschool-agechildinSomersetCounty.Notethattheeligibilitylevelsforallprograms(excepttheMarylandChildren’sHealth
Closing the Wage Gap: Reducing Costs
WORK SUPPORTS CAN HELP WORKING
FAMILIES ACHIEvE STABILITY WITHOUT
NEEDING TO CHOOSE BETWEEN BASIC NEEDS
Programwithamonthlypremium)arebelowtheSelf-SufficiencyStandard,someconsiderablybelow.
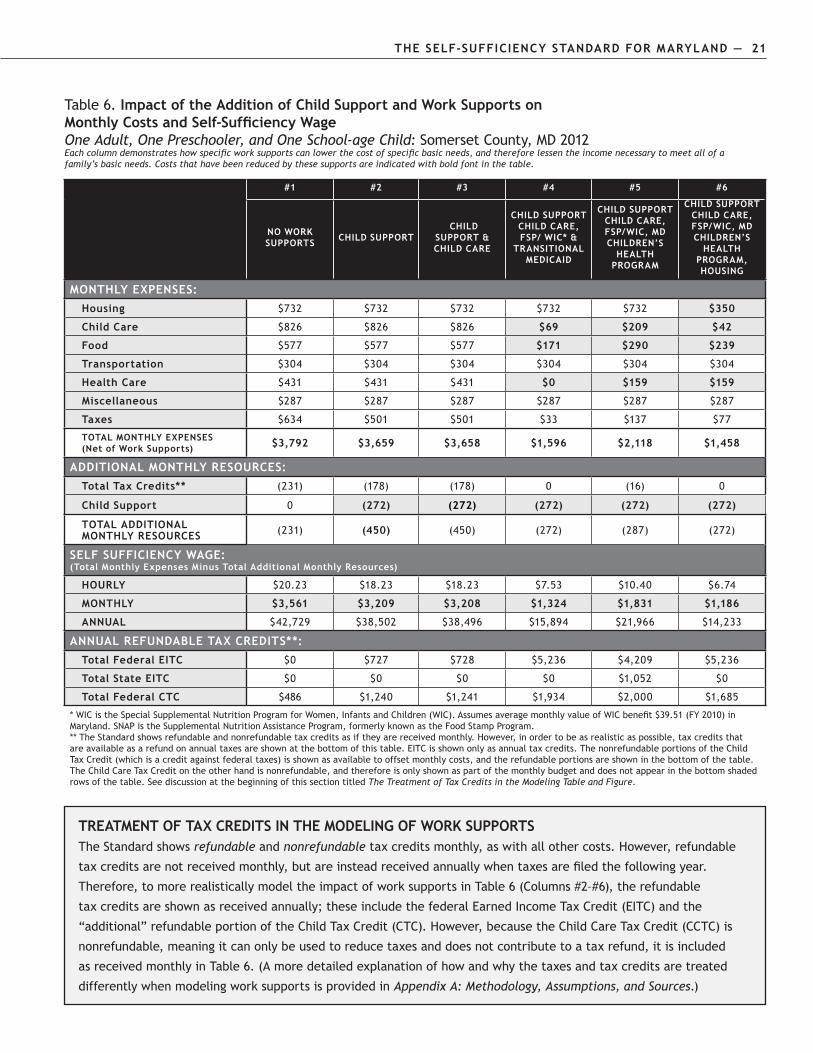
the imPACt of WoRK suPPoRts AND ChiLD suPPoRt oN CostsTable6contraststheincomeneededtomeetbasicneedsforoneparentwithonepreschoolerandoneschool-agechildlivinginSomersetCountywithoutanyworksupports,i.e.,thefullSelf-SufficiencyStandard(seeColumn#1),comparedtohowthisparentcanmeetherfamily’sbasicneedsatavarietyofreducedwagelevelswiththehelpofworksupports,dependingonthesupportsreceived.InColumns#2-#6ofTable6,theworksupportsmodeledarelistedinthecolumnheadingswhilemonthlycoststhathave
Figure 8. eligibility Levels for maryland Work supports Compared to the standard One Adult, One Preschooler, and One School-age Child Somerset County, MD, 2012
ANNUAL INCOME
MD Child Care SubsidyProgram (162% FPL)
WIC (185% FPL)
MD SFP & MD CHP w/No Premium (200% FPL)
Self-Sufficiency Standard
MD Children’s HealthProgram w/ Premium(300% FPL)
$0
$20,000
$40,000
$60,000
100% FPL
200% FPL
300% FPL

20 — the seLf-suffiCieNCY stANDARD foR mARYLAND the seLf-suffiCieNCY stANDARD foR mARYLAND — 21
beenreducedbyworksupportsareindicatedwithboldfontinthetable.
No WoRK suPPoRts (CoLumN #1). Column#1ofTable6showstheSelf-SufficiencyStandardforfamilieswithoneadult,onepreschooler,andoneschool-agechildlivinginSomersetCounty.Withouttheassistanceofanywork(orother)supportstoreducecosts,thisfamilytypehas
monthlychildcareexpensesof$826andmonthlyhousingcostsof$732.TheadultinthisfamilymustearnaSelf-SufficiencyWageof$3,561permonthor$20.23perhourworkingfull-timetomeetthefamily’sbasicneedswithoutthehelpofpublicorprivateassistance.
ChiLD suPPoRt (CoLumN #2). TheaverageamountreceivedbyfamiliesparticipatingintheChildSupport
Table 5. summary of maryland Work supports, Child support, and tax Credits
WoRK suPPoRt PRoGRAm BeNefit iNCome eLiGiBiLitY
ChiLD CARe AssistANCe (mARYLAND ChiLD CARe suBsiDY [CCs] PRoGRAm)
child care costs are reduced to a monthly co-payment which is dependent on income level, family size, number of children in care, and geographic region of the state.
Eligibility for Maryland's (CCS) Program is $29,990 for a family of three, which is about 162% of the FPL.
housiNG AssistANCe (seCtioN 8 housiNG ChoiCe VouCheRs AND PuBLiC housiNG)
Housing costs are typically set at 30% of adjusted gross income.
Households may be eligible with incomes that are 80% of area median income ($51,600 in Somerset County for a family of three). However, due to limited funding most new program participants must have income below 30% of area median income ($19,350 in Somerset County for a family of three).
meDiCAiD Health care benefits are fully subsidized. Adult parents: income up to 100% FPL. Pregnant and postpartum women: income up to 185% FPL.Children under 5: income up to 133% FPL. Children 6-18: income up to 100% FPL.
ChiLDReN's heALth iNsuRANCe PRoGRAm (mARYLAND's ChiLDReN's heALth PRoGRAm [mChP])
Health care benefits for children under 19 years of age and pregnant women. Monthly premiums vary from $0 to $67 dependent on income.
Families are eligible for no monthly premium with income at or below 200% of the FPL, or $37,060 for a family of three. Families are eligible with a monthly premium with income up to $55,590 or 300% of the FPL.
suPPLemeNtAL NutRitioN AssistANCe PRoGRAm (mARYLAND fooD suPPLemeNt PRoGRAm [fsP])
Maximum benefit for a family of 3: $526 per month.Maximum benefit for a family of 4: $668 per month.Average FSP benefit per household in Maryland is $275.27 per month.
Families must earn gross income less than 200% of the FPL to be eligible and must also meet net income (gross income minus allowable deductions) guidelines.
sPeCiAL suPPLemeNtAL NutRitioN PRoGRAm foR WomeN, iNfANts, AND ChiLDReN (WiC)
Average monthly benefit of $39.51 in Maryland for purchasing supplemental nutritious foods. Also includes breastfeeding support and health education.
Pregnant and postpartum women and children up to age 5: at or below 185% FPL.
ChiLD suPPoRt Average payment is $271.62 per month in Maryland. No income limit.
feDeRAL tAx CReDits
feDeRAL eARNeD iNCome tAx CReDit (eitC)
Max benefit for families with 1 child: $3,169 per year. Max benefit for families with 2 children: $5,236 per year. Max benefit for families with 3+ children: $5,891 per year.
1 parent family with 1 child: up to $36,920. 1 parent family with 2 children: up to $41,952. 1 parent family with 3+ children: up to $45,060.
feDeRAL ChiLD AND DePeNDeNt CARe tAx CReDit (CCtC)
Credit is 20%-35% of child care costs depending on income level with maximum amount of child care costs of $3,000 for one child and up to $6,000 for two or more children. Credit is nonrefundable.
No income limit.
feDeRAL ChiLD tAx CReDit (CtC) Up to $1,000 annual tax credit per child. Married filing jointly: up to $110,000. Head of Household: up to $55,000. All others: up to $75,000. Refundable limited to earnings over $3,000.
stAte tAx CReDits
mARYLAND eARNeD iNCome tAx CReDit (eitC)
The state EITC is 50% of the Federal EITC benefit. The local EITC varies based on the local income tax rate. The Montgomery County Working Families Income Supplement is 67% of the State EITC benefit.
Maryland has a state and local refundable and a non-refundable Earned Income Tax Credit. Eligibility based on federal receipt of the EITC.
mARYLAND stAte ChiLD CARe tAx CReDit (CCtC)
The Md ccTc is a percent of the federal ccTc claimed, depending on income.
Maryland has a state Child Care Tax Credit. Federal adjusted gross income must be less than $50,000 to qualify for the state credit.
mARYLAND stAte PoVeRtY LeVeL tAx CReDit
The MD Poverty Level Tax Credit is a non-refundable credit that is 5% of earned income.
Maryland has a state Poverty Level Credit. Federal adjusted gross income and earned income must be less than the federal FPL.
Note: Eligibility and benefits for work supports and tax credits change routinely—typically yearly. The information reported in Table 5 represents eligibility and ben-efit guidelines for 2011. The 2011 Federal Poverty Level (FPL) for a family of three is $18,530 (annual income). See http://aspe.hhs.gov/poverty/11poverty.shtml.
20 — the seLf-suffiCieNCY stANDARD foR mARYLAND the seLf-suffiCieNCY stANDARD foR mARYLAND — 21
Table 6. impact of the Addition of Child support and Work supports on Monthly Costs and Self-Sufficiency Wage One Adult, One Preschooler, and One School-age Child: Somerset County, MD 2012 Each column demonstrates how specific work supports can lower the cost of specific basic needs, and therefore lessen the income necessary to meet all of a family’s basic needs. Costs that have been reduced by these supports are indicated with bold font in the table.
#1 #2 #3 #4 #5 #6
No WoRK suPPoRts ChiLD suPPoRt
ChiLD suPPoRt & ChiLD CARe
ChiLD suPPoRt ChiLD CARe, fsP/ WiC* &
tRANsitioNAL meDiCAiD
ChiLD suPPoRt ChiLD CARe, fsP/WiC, mD ChiLDReN’s
heALth PRoGRAm
ChiLD suPPoRt ChiLD CARe, fsP/WiC, mD ChiLDReN’s
heALth PRoGRAm, housiNG
MONTHLY EXPENSES:housing $732 $732 $732 $732 $732 $350
Child Care $826 $826 $826 $69 $209 $42
food $577 $577 $577 $171 $290 $239
transportation $304 $304 $304 $304 $304 $304
health Care $431 $431 $431 $0 $159 $159
miscellaneous $287 $287 $287 $287 $287 $287
taxes $634 $501 $501 $33 $137 $77
totAL moNthLY exPeNses (Net of Work supports) $3,792 $3,659 $3,658 $1,596 $2,118 $1,458
ADDITIONAL MONTHLY RESOURCES:total tax Credits** (231) (178) (178) 0 (16) 0
Child support 0 (272) (272) (272) (272) (272)
totAL ADDitioNAL moNthLY ResouRCes (231) (450) (450) (272) (287) (272)
SELF SUFFICIENCY WAGE:(total monthly expenses minus total Additional monthly Resources)
houRLY $20.23 $18.23 $18.23 $7.53 $10.40 $6.74
moNthLY $3,561 $3,209 $3,208 $1,324 $1,831 $1,186
ANNuAL $42,729 $38,502 $38,496 $15,894 $21,966 $14,233
ANNUAL REFUNDABLE TAX CREDITS**:total federal eitC $0 $727 $728 $5,236 $4,209 $5,236
total state eitC $0 $0 $0 $0 $1,052 $0
total federal CtC $486 $1,240 $1,241 $1,934 $2,000 $1,685
* WIC is the Special Supplemental Nutrition Program for Women, Infants and Children (WIC). Assumes average monthly value of WIC benefit $39.51 (FY 2010) in Maryland. SNAP is the Supplemental Nutrition Assistance Program, formerly known as the Food Stamp Program.** The Standard shows refundable and nonrefundable tax credits as if they are received monthly. However, in order to be as realistic as possible, tax credits that are available as a refund on annual taxes are shown at the bottom of this table. EITC is shown only as annual tax credits. The nonrefundable portions of the Child Tax Credit (which is a credit against federal taxes) is shown as available to offset monthly costs, and the refundable portions are shown in the bottom of the table. The Child Care Tax Credit on the other hand is nonrefundable, and therefore is only shown as part of the monthly budget and does not appear in the bottom shaded rows of the table. See discussion at the beginning of this section titled The Treatment of Tax Credits in the Modeling Table and Figure.
tReAtmeNt of tAx CReDits iN the moDeLiNG of WoRK suPPoRtsThe Standard shows refundable and nonrefundable tax credits monthly, as with all other costs. However, refundable
tax credits are not received monthly, but are instead received annually when taxes are filed the following year.
Therefore, to more realistically model the impact of work supports in Table 6 (Columns #2–#6), the refundable
tax credits are shown as received annually; these include the federal Earned Income Tax Credit (EITC) and the
“additional” refundable portion of the Child Tax Credit (CTC). However, because the Child Care Tax Credit (CCTC) is
nonrefundable, meaning it can only be used to reduce taxes and does not contribute to a tax refund, it is included
as received monthly in Table 6. (A more detailed explanation of how and why the taxes and tax credits are treated
differently when modeling work supports is provided in Appendix A: Methodology, Assumptions, and Sources.)
22 — the seLf-suffiCieNCY stANDARD foR mARYLAND the seLf-suffiCieNCY stANDARD foR mARYLAND — 23
EnforcementPrograminMarylandis$272permonth(seeColumn#2).13Addingchildsupportreducesthewageneededbythisparenttomeetbasicneedsto$3,209permonthand$18.23perhour.Notethatchildsupportreducesthewagesneededbymorethantheamountofchildsupportalonebecauseitalsoreducestaxes.Childsupportpaymentsfromabsent,non-custodialparentscanbeavaluableadditiontofamilybudgets,evenincaseswherethenon-custodialparent’sincomeisrelativelylow.
ChiLD CARe & ChiLD suPPoRt (CoLumN #3). Sincechildcareisoneofthemajorexpensesforfamilieswithchildren,theadditionofachildcaresubsidyoftenprovidesthegreatestfinancialreliefofanysingleworksupport.Familiesofthreewithincomesupto162%oftheFPLareeligibleforMaryland’sChildCareSubsidy(CCS)Program.14InColumn#3,childcareassistanceismodeled,howeverthefamily’sincomeisbeyondtheeligibilitylevelandthefamilydoesnotqualifyforchildcareassistance.
ChiLD suPPoRt, ChiLD CARe, fsP/WiC, & meDiCAiD (CoLumN #4). Foradultsmovingfromwelfaretowork,childcareassistance,foodassistance,andMedicaidcomprisethetypical“package”ofbenefits.AssumingtransitionalMedicaidcoversallofthefamily’shealthcareexpenses,healthcarecostsarereducedfrom$394permonthtozeroinColumn#4.15Foodcostsarereducedfrom$577to$171permonthwiththeadditionalresourcesprovidedbytheMarylandFoodSupplementProgram[FSP]andWICbenefits.16TheCCSProgramreducesthefamily’schildcarecopaymentto$69permonthinColumn#4.ThecombinedeffectofMedicaid,nutrition(FSP/WIC),andchildcareassistancereducethewagerequiredtomeetbasicneedsto$1,324permonth.Withthehelpofthesecrucialworksupports,thisSomersetCountyfamilymakingthetransitionfrompublicassistance(TANF)toself-sufficiencywouldbeabletomeetthefamily’sbasicneedsatastartingwageof$7.53perhour.
ChiLD suPPoRt, ChiLD CARe, fsP/WiC, & mARYLAND ChiLDReN’s heALth PRoGRAm (CoLumN #5). WhenemployersdonotofferfamilyhealthcoverageandifthefamilyisineligibleforMedicaid,childreninfamilieswithincomeupto200%oftheFPLareeligibleforhealthinsurancewithnopremiumsandchildreninfamilieswithincomebetween200%and300%oftheFPLareeligibleforlow-costpremiumsthrough
Maryland’sChildren’sHealthProgram(MCHP).17Column#5showsthesameworksupportpackageasColumn#4,exceptthatinsteadofMedicaidforthewholefamily,MCHPhasbeensubstitutedforthechildren.Theadultinthisfamilytypestillpaysforthecostofherownhealthcare(thepremiumofheremployer-providedhealthinsuranceandherout-of-pocketcosts).Asaresult,thefamily’stotalmonthlycostofhealthcareinColumn#5isequaltotheadult’spremium(plusheroutofpocketcosts)of$159permonth.Thecostoffoodis$290permonthandthechildcareco-paymentis$209permonth.Withthehelpofchildcare,nutrition(FSP/WIC),andMarylandChildren’sHealthProgram,theparentneedstoearn$1,831permonthtomeetbasicneeds.
housiNG, ChiLD suPPoRt, ChiLD CARe, fsP/WiC, & mARYLAND’s ChiLDReN’s heALth PRoGRAm (CoLumN #6). ComparingColumn#5toColumn#6showshowmuchhousingassistancecanhelpfamilieswithlimitedincomemeetbasicneeds.Byreducingthecostofhousingto30%ofincome,housingcostsdropfrom$732to$350permonth.18Withthefullbenefitpackage,aparentwithonepreschoolerandoneschool-agechildlivinginSomersetCountycanmeetbasicneedswithanincomeof$1,186permonthor$6.74perhourworkingfulltime.Thisistheequivalentofworkingaminimumwagejobatabout90%time,or36hoursaweek.
Assumingthefamilyreceivesrefundabletaxcreditsannually(insteadofmonthlyasshownintheStandard)andtheadultworksfull-timeatthesewagesthroughouttheyear,theannualamountsoftherefundabletaxcreditsareshownintheshadedrowsatthebottomofthetableforColumns#2-#6.Withoutanyworksupports,andearningenoughtomeetthefamily’sbasicneeds,showninColumn#1,thefamily’sincomeistoohightoqualifyforEITC,buttheyareeligibleforanannualchildtaxcreditof$486.InColumn#6inwhichthemostextensiveworksupportpackageismodeled,theparentiseligiblefornearly$7,000inannualrefundabletaxcredits.
usiNG WoRK suPPoRts to iNCReAse WAGe ADeQuACY WhileTable6showshowchildsupportandworksupportsreducethewageneeded,Figure 9startswithspecificwagesandasks“Howadequatearethesewagesinmeetinga
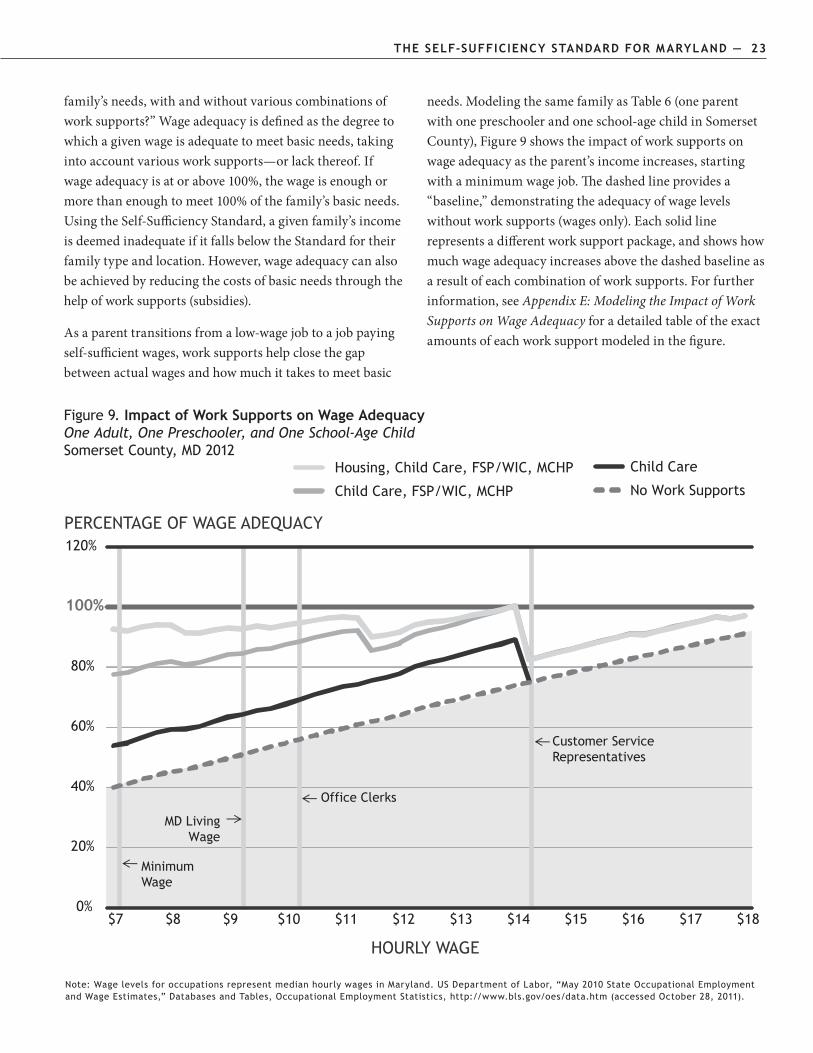
22 — the seLf-suffiCieNCY stANDARD foR mARYLAND the seLf-suffiCieNCY stANDARD foR mARYLAND — 23
family’sneeds,withandwithoutvariouscombinationsofworksupports?”Wageadequacyisdefinedasthedegreetowhichagivenwageisadequatetomeetbasicneeds,takingintoaccountvariousworksupports—orlackthereof.Ifwageadequacyisatorabove100%,thewageisenoughormorethanenoughtomeet100%ofthefamily’sbasicneeds.UsingtheSelf-SufficiencyStandard,agivenfamily’sincomeisdeemedinadequateifitfallsbelowtheStandardfortheirfamilytypeandlocation.However,wageadequacycanalsobeachievedbyreducingthecostsofbasicneedsthroughthehelpofworksupports(subsidies).
Asaparenttransitionsfromalow-wagejobtoajobpayingself-sufficientwages,worksupportshelpclosethegapbetweenactualwagesandhowmuchittakestomeetbasic
needs.ModelingthesamefamilyasTable6(oneparentwithonepreschoolerandoneschool-agechildinSomersetCounty),Figure9showstheimpactofworksupportsonwageadequacyastheparent’sincomeincreases,startingwithaminimumwagejob.Thedashedlineprovidesa“baseline,”demonstratingtheadequacyofwagelevelswithoutworksupports(wagesonly).Eachsolidlinerepresentsadifferentworksupportpackage,andshowshowmuchwageadequacyincreasesabovethedashedbaselineasaresultofeachcombinationofworksupports.Forfurtherinformation,seeAppendix E: Modeling the Impact of Work Supports on Wage Adequacyforadetailedtableoftheexactamountsofeachworksupportmodeledinthefigure.
Figure 9. impact of Work supports on Wage Adequacy One Adult, One Preschooler, and One School-Age Child Somerset County, MD 2012
0%
20%
40%
60%
80%
100%
120%
$7 $8 $9 $10 $11 $12 $13 $14 $15 $16 $17 $18
Housing, Child Care, FSP/WIC, MCHP
Child Care, FSP/WIC, MCHP
Child Care
No Work Supports
Office Clerks
MD LivingWage
MinimumWage
Customer ServiceRepresentatives
HOURLY WAGE
PERCENTAGE OF WAGE ADEQUACY
Note: Wage levels for occupations represent median hourly wages in Maryland. US Department of Labor, “May 2010 State Occupational Employment and Wage Estimates,” Databases and Tables, Occupational Employment Statistics, http://www.bls.gov/oes/data.htm (accessed October 28, 2011).
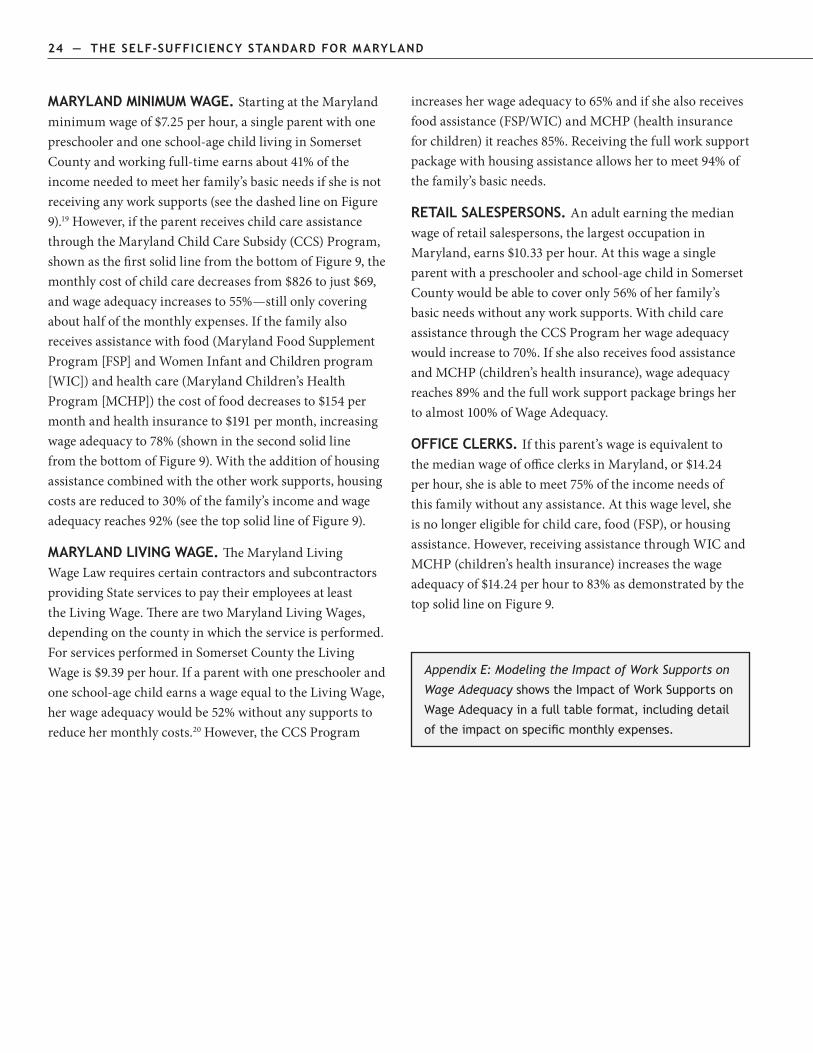
24 — the seLf-suffiCieNCY stANDARD foR mARYLAND
Appendix E: Modeling the Impact of Work Supports on
Wage Adequacy shows the Impact of Work Supports on
Wage Adequacy in a full table format, including detail
of the impact on specific monthly expenses.
mARYLAND miNimum WAGe. StartingattheMarylandminimumwageof$7.25perhour,asingleparentwithonepreschoolerandoneschool-agechildlivinginSomersetCountyandworkingfull-timeearnsabout41%oftheincomeneededtomeetherfamily’sbasicneedsifsheisnotreceivinganyworksupports(seethedashedlineonFigure9).19However,iftheparentreceiveschildcareassistancethroughtheMarylandChildCareSubsidy(CCS)Program,shownasthefirstsolidlinefromthebottomofFigure9,themonthlycostofchildcaredecreasesfrom$826tojust$69,andwageadequacyincreasesto55%—stillonlycoveringabouthalfofthemonthlyexpenses.Ifthefamilyalsoreceivesassistancewithfood(MarylandFoodSupplementProgram[FSP]andWomenInfantandChildrenprogram[WIC])andhealthcare(MarylandChildren’sHealthProgram[MCHP])thecostoffooddecreasesto$154permonthandhealthinsuranceto$191permonth,increasingwageadequacyto78%(showninthesecondsolidlinefromthebottomofFigure9).Withtheadditionofhousingassistancecombinedwiththeotherworksupports,housingcostsarereducedto30%ofthefamily’sincomeandwageadequacyreaches92%(seethetopsolidlineofFigure9).
mARYLAND LiViNG WAGe. TheMarylandLivingWageLawrequirescertaincontractorsandsubcontractorsprovidingStateservicestopaytheiremployeesatleasttheLivingWage.TherearetwoMarylandLivingWages,dependingonthecountyinwhichtheserviceisperformed.ForservicesperformedinSomersetCountytheLivingWageis$9.39perhour.Ifaparentwithonepreschoolerandoneschool-agechildearnsawageequaltotheLivingWage,herwageadequacywouldbe52%withoutanysupportstoreducehermonthlycosts.20However,theCCSProgram
increasesherwageadequacyto65%andifshealsoreceivesfoodassistance(FSP/WIC)andMCHP(healthinsuranceforchildren)itreaches85%.Receivingthefullworksupportpackagewithhousingassistanceallowshertomeet94%ofthefamily’sbasicneeds.
RetAiL sALesPeRsoNs. Anadultearningthemedianwageofretailsalespersons,thelargestoccupationinMaryland,earns$10.33perhour.Atthiswageasingleparentwithapreschoolerandschool-agechildinSomersetCountywouldbeabletocoveronly56%ofherfamily’sbasicneedswithoutanyworksupports.WithchildcareassistancethroughtheCCSProgramherwageadequacywouldincreaseto70%.IfshealsoreceivesfoodassistanceandMCHP(children’shealthinsurance),wageadequacyreaches89%andthefullworksupportpackagebringshertoalmost100%ofWageAdequacy.
offiCe CLeRKs. Ifthisparent’swageisequivalenttothemedianwageofofficeclerksinMaryland,or$14.24perhour,sheisabletomeet75%oftheincomeneedsofthisfamilywithoutanyassistance.Atthiswagelevel,sheisnolongereligibleforchildcare,food(FSP),orhousingassistance.However,receivingassistancethroughWICandMCHP(children’shealthinsurance)increasesthewageadequacyof$14.24perhourto83%asdemonstratedbythetopsolidlineonFigure9.
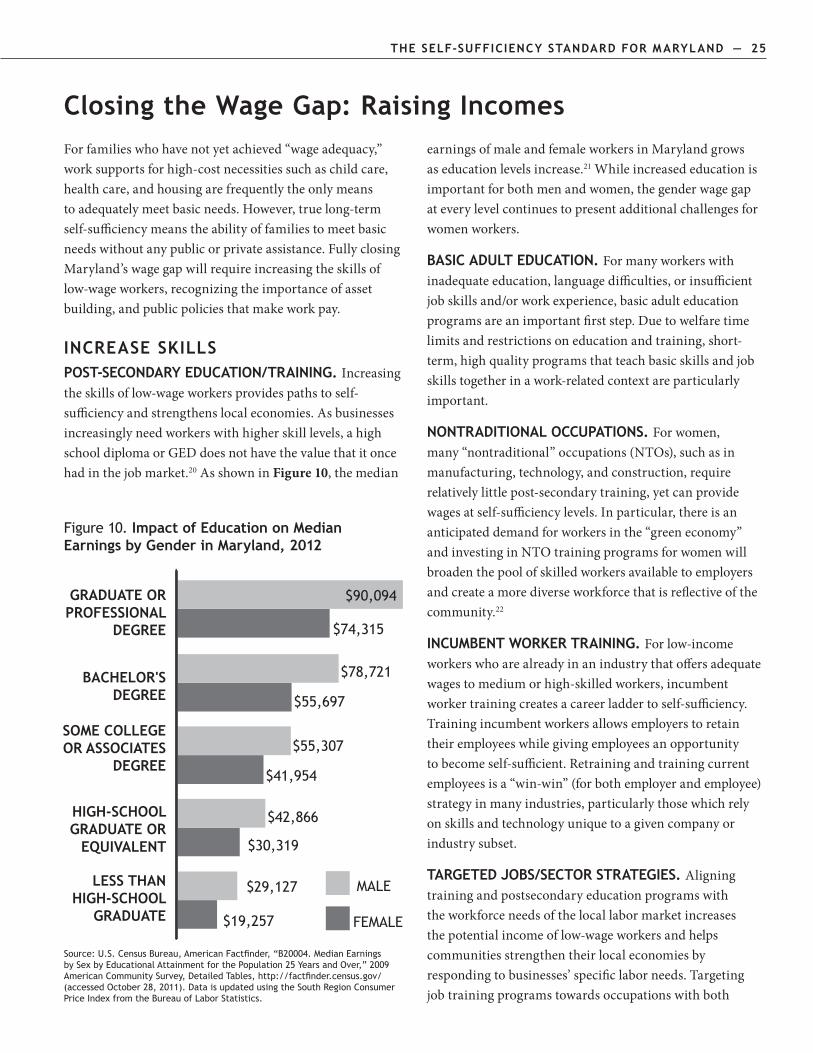
the seLf-suffiCieNCY stANDARD foR mARYLAND — 25
Closing the Wage Gap: Raising IncomesForfamilieswhohavenotyetachieved“wageadequacy,”worksupportsforhigh-costnecessitiessuchaschildcare,healthcare,andhousingarefrequentlytheonlymeanstoadequatelymeetbasicneeds.However,truelong-termself-sufficiencymeanstheabilityoffamiliestomeetbasicneedswithoutanypublicorprivateassistance.FullyclosingMaryland’swagegapwillrequireincreasingtheskillsoflow-wageworkers,recognizingtheimportanceofassetbuilding,andpublicpoliciesthatmakeworkpay.
iNCReAse sKiLLs Post-seCoNDARY eDuCAtioN/tRAiNiNG. Increasingtheskillsoflow-wageworkersprovidespathstoself-sufficiencyandstrengthenslocaleconomies.Asbusinessesincreasinglyneedworkerswithhigherskilllevels,ahighschooldiplomaorGEDdoesnothavethevaluethatitoncehadinthejobmarket.20AsshowninFigure 10,themedian
earningsofmaleandfemaleworkersinMarylandgrowsaseducationlevelsincrease.21Whileincreasededucationisimportantforbothmenandwomen,thegenderwagegapateverylevelcontinuestopresentadditionalchallengesforwomenworkers.
BAsiC ADuLt eDuCAtioN. Formanyworkerswithinadequateeducation,languagedifficulties,orinsufficientjobskillsand/orworkexperience,basicadulteducationprogramsareanimportantfirststep.Duetowelfaretimelimitsandrestrictionsoneducationandtraining,short-term,highqualityprogramsthatteachbasicskillsandjobskillstogetherinawork-relatedcontextareparticularlyimportant.
NoNtRADitioNAL oCCuPAtioNs. Forwomen,many“nontraditional”occupations(NTOs),suchasinmanufacturing,technology,andconstruction,requirerelativelylittlepost-secondarytraining,yetcanprovidewagesatself-sufficiencylevels.Inparticular,thereisananticipateddemandforworkersinthe“greeneconomy”andinvestinginNTOtrainingprogramsforwomenwillbroadenthepoolofskilledworkersavailabletoemployersandcreateamorediverseworkforcethatisreflectiveofthecommunity.22
iNCumBeNt WoRKeR tRAiNiNG. Forlow-incomeworkerswhoarealreadyinanindustrythatoffersadequatewagestomediumorhigh-skilledworkers,incumbentworkertrainingcreatesacareerladdertoself-sufficiency.Trainingincumbentworkersallowsemployerstoretaintheiremployeeswhilegivingemployeesanopportunitytobecomeself-sufficient.Retrainingandtrainingcurrentemployeesisa“win-win”(forbothemployerandemployee)strategyinmanyindustries,particularlythosewhichrelyonskillsandtechnologyuniquetoagivencompanyorindustrysubset.
tARGeteD JoBs/seCtoR stRAteGies. Aligningtrainingandpostsecondaryeducationprogramswiththeworkforceneedsofthelocallabormarketincreasesthepotentialincomeoflow-wageworkersandhelpscommunitiesstrengthentheirlocaleconomiesbyrespondingtobusinesses’specificlaborneeds.Targetingjobtrainingprogramstowardsoccupationswithboth
Source: U.S. Census Bureau, American Factfinder, “B20004. Median Earnings by Sex by Educational Attainment for the Population 25 Years and Over,” 2009 American Community Survey, Detailed Tables, http://factfinder.census.gov/ (accessed October 28, 2011). Data is updated using the South Region Consumer Price Index from the Bureau of Labor Statistics.
Figure 10. impact of education on median earnings by Gender in maryland, 2012
FEMALE
MALE
$19,257
$30,319
$41,954
$55,697
$74,315
$29,127
$42,866
$55,307
$78,721
GRADUATE ORPROFESSIONAL
DEGREE
BACHELOR'SDEGREE
SOME COLLEGEOR ASSOCIATES
DEGREE
HIGH-SCHOOLGRADUATE OR
EQUIVALENT
LESS THANHIGH-SCHOOL
GRADUATE
$90,094
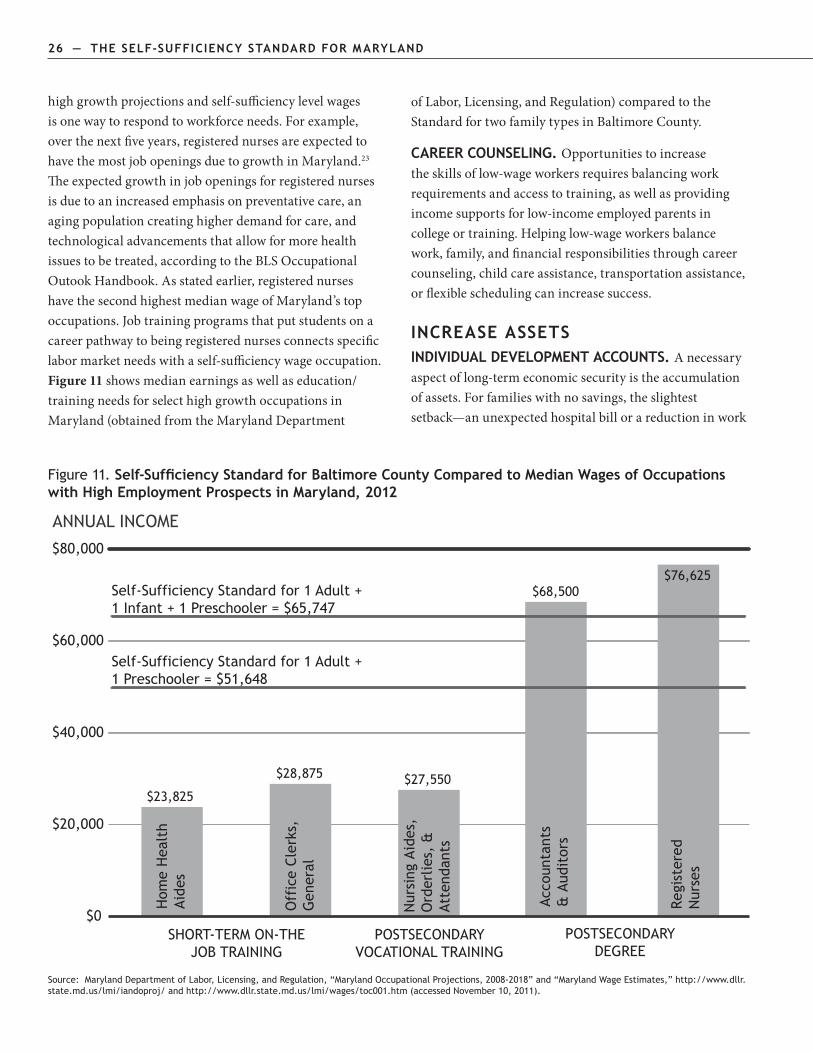
26 — the seLf-suffiCieNCY stANDARD foR mARYLAND the seLf-suffiCieNCY stANDARD foR mARYLAND — 27
highgrowthprojectionsandself-sufficiencylevelwagesisonewaytorespondtoworkforceneeds.Forexample,overthenextfiveyears,registerednursesareexpectedtohavethemostjobopeningsduetogrowthinMaryland.23Theexpectedgrowthinjobopeningsforregisterednursesisduetoanincreasedemphasisonpreventativecare,anagingpopulationcreatinghigherdemandforcare,andtechnologicaladvancementsthatallowformorehealthissuestobetreated,accordingtotheBLSOccupationalOutookHandbook.Asstatedearlier,registerednurseshavethesecondhighestmedianwageofMaryland’stopoccupations.Jobtrainingprogramsthatputstudentsonacareerpathwaytobeingregisterednursesconnectsspecificlabormarketneedswithaself-sufficiencywageoccupation.Figure 11showsmedianearningsaswellaseducation/trainingneedsforselecthighgrowthoccupationsinMaryland(obtainedfromtheMarylandDepartment
ofLabor,Licensing,andRegulation)comparedtotheStandardfortwofamilytypesinBaltimoreCounty.
CAReeR CouNseLiNG. Opportunitiestoincreasetheskillsoflow-wageworkersrequiresbalancingworkrequirementsandaccesstotraining,aswellasprovidingincomesupportsforlow-incomeemployedparentsincollegeortraining.Helpinglow-wageworkersbalancework,family,andfinancialresponsibilitiesthroughcareercounseling,childcareassistance,transportationassistance,orflexibleschedulingcanincreasesuccess.
iNCReAse AssetsiNDiViDuAL DeVeLoPmeNt ACCouNts. Anecessaryaspectoflong-termeconomicsecurityistheaccumulationofassets.Forfamilieswithnosavings,theslightestsetback—anunexpectedhospitalbillorareductioninwork
Source: Maryland Department of Labor, Licensing, and Regulation, “Maryland Occupational Projections, 2008-2018” and “Maryland Wage Estimates,” http://www.dllr.state.md.us/lmi/iandoproj/ and http://www.dllr.state.md.us/lmi/wages/toc001.htm (accessed November 10, 2011).
Figure 11. Self-Sufficiency Standard for Baltimore County Compared to Median Wages of Occupations with high employment Prospects in maryland, 2012
ANNUAL INCOME
$23,825
$28,875 $27,550
$68,500$76,625
$0
$20,000
$40,000
$60,000
$80,000
Hom
e H
ealt
hAi
des
Off
ice
Cler
ks,
Gen
eral
Nur
sing
Aid
es,
Ord
erlie
s, &
Atte
ndan
ts
Acco
unta
nts
& A
udit
ors
Regi
ster
edN
urse
s
SHORT-TERM ON-THEJOB TRAINING
POSTSECONDARYVOCATIONAL TRAINING
POSTSECONDARYDEGREE
Self-Sufficiency Standard for 1 Adult + 1 Infant + 1 Preschooler = $65,747
Self-Sufficiency Standard for 1 Adult +1 Preschooler = $51,648
26 — the seLf-suffiCieNCY stANDARD foR mARYLAND the seLf-suffiCieNCY stANDARD foR mARYLAND — 27
hours—cantriggeramajorfinancialcrisis.Onemethodthatencouragesassetbuildingforlow-wageworkersareIndividualDevelopmentAccount(IDA)programs.IDAsaresavingsaccountswherefamiliesmakeregularcontributionswhicharethenmatchedbycontributionsfromapublicorprivateentityandmanagedbycommunity-basedorganizations.Thesavingscanonlybeusedforcertainobjectives,onesthatenhancelong-termeconomicsecurity,suchasthedownpaymentforahouse,paymentforhighereducation,orstart-upcostsforasmallbusiness.
RAise WAGesLiViNG WAGes. Asdemonstratedinthisreport,eventwoadultsworkingfull-timemusteachearnwellbeyondaminimumwagetomeettheirfamily’sbasicneeds.Higherwagescanhaveapositiveimpactnotonlyforworkersbutalsofortheiremployersbydecreasingturnover,increasingworkexperience,andreducingtrainingandrecruitmentcosts.Onemethodtoincreasesalariesoflow-wageworkers
istoincreasetheminimumwage.LocalizedLivingWagelawsareanotherapproachtoraisingwagesofworkers.Theselawsmandatethatpublicemployeesaswellascontractorsandemployersreceivingpublicsubsidiespaya“livingwage,”thusimpactingprivatesectoraswellaspublicsectorwages.Additionally,accordingtotheBureauofLaborStatisticsandtheU.S.DepartmentofLabor,unionrepresentationofworkersalsoleadstohigherwagesandbetterbenefits.24
PAY eQuitY LAWs. Payequitylawsrequireemployerstoassessandcompensatejobsbasedonskills,effort,responsibility,andworkingconditions,andnotbasedonthegenderorrace/ethnicityofthejob’soccupants.25Womenandpeopleofcoloralltoooftenfaceartificialbarrierstoemployment—barriersnotaddressedbytaxcreditsortrainingandeducationstrategies.Itisimportanttorecognizethatnotallbarrierstoself-sufficiencylieintheindividualpersonsand/orfamiliesseekingself-sufficiency.
mARYLAND LiViNG WAGe
In Maryland, the Living Wage Law requires certain state services contractors and subcontractors to pay their
employees at least the Living Wage. There are two Maryland Living Wages, either $12.49 or $9.39 per hour depending
on the jurisdiction in which the service is performed, effective September 2011.a Montgomery County and Baltimore
City each have their own living wage requirements as well. In Montgomery County the Wage Requirements Law
requires certain county contract providers to pay at least the Living Wage, which is $13.20 per hour through June 30,
2012.b Baltimore City also has a City Living Wage, required of certain service contracts. Currently the Baltimore City
Living Wage rate is $10.59 through June 30, 2012.c
a. There are two wage “tiers” established in Maryland. Tier 1 includes Montgomery County, Prince George’s County, Howard County, Baltimore County, Baltimore City, and Anne Arundel County. Tier 2 is comprised of the rest of Maryland counties not included in Tier 1. The living wage rate for Tier 1 is $12.49 per hour and the rate for Tier 2 is $9.39 per hour effective September 27, 2011. Maryland Department of Labor, Licensing, and Regulation, Division of Labor and Industry, “Maryland’s Living Wage Frequently Asked Questions,” http://www.dllr.state.md.us/labor/prev/livingwagefaqs.shtml#1 (accessed December 19, 2011).
b. Montgomery County Maryland, Office of Business Relations and Requirements, “Wage Requirements Law Frequently Asked Questions,” http://www.montgomerycountymd.gov/mcgtmpl.asp?url=/content/DGS/Dir/OBRC/livingwage.asp (accessed December 19, 2011).
c. Baltimore City, Office Of Civil Rights And Wage Enforcement, Wage Commission, Programs, “Living Wage,” http://www.baltimore city.gov/Government/BoardsandCommissions/OfficeofCivilRightsandWageEnforcement/WageCommission/Programs.aspx (accessed December 19, 2011).
28 — the seLf-suffiCieNCY stANDARD foR mARYLAND
Finally,theSelf-SufficiencyStandardcanbeusedtoevaluate outcomes forclientsinarangeofemploymentprograms,fromshort-termjobsearchandplacementprograms,toprogramsprovidingextensiveeducationorjobtraining.ByevaluatingwageoutcomesintermsoftheStandard,programsareusingameasureoftrueeffectiveness.Suchevaluationscanhelpredirectresourcestoapproachesthatresultinimprovedoutcomesforparticipants.
PoLiCY ANALYsis. TheSelf-SufficiencyStandardhasbeenusedasatooltoevaluatetheimpactofcurrentandproposedpolicychanges.Asshownintheprevioussection,Closing the Wage Gap: Reducing Costs,theStandardcanbeusedtoevaluatetheimpactofavarietyofworksupports(SNAP/FoodStampProgram,Medicaid)orpolicyoptions(changesinchildcareco-payments,taxreformortaxcredits)onafamily’sbudget.
eCoNomiC DeVeLoPmeNt. TheSelf-SufficiencyStandardhasbeenusedtoevaluatestateandlocalleveleconomicdevelopmentproposals.UsingtheStandardcanhelpdetermineifbusinessesseekingtaxbreaksorothergovernmentsubsidieswill,orwillnot,createjobsthatpay“livingwages.”Ifnot,employeesmayneedpublicworksupportstobeabletomeettheirbasicneeds,essentiallyprovidinga“doublesubsidy”forbusinesses.CommunitiescanusetheStandardtoevaluateeconomicdevelopmentproposalsandtheirnetpositiveornegativeeffectonthelocaleconomy,aswellastheimpactonthewell-beingofpotentialworkersandtheirfamilies.
WhiletheSelf-SufficiencyStandardisanalternativemeasureofincomeadequacythatismoreaccurate,up-to-date,andgeographicallyspecific,itismorethananimprovedmeasure.TheStandardisalsoatoolthatcanbeusedacrossawidearrayofsettingstobenchmark,evaluate,educate,andilluminate.Belowwebrieflyoutlinesomeoftheseuses.Formoredetailandexamples,thereaderisreferredto Appendix B,whichincludesmanymoreexamplesofthewaysinwhichprogramsandpersonshaveappliedtheSelf-SufficiencyStandardintheirwork.Inaddition,referencesandwebsitesareprovidedforfurtherexplorationofspecificexamples.
emPLoYmeNt PRoGRAms. TheSelf-SufficiencyStandardhasbeenusedinemploymentprogramstodeterminewhichindividualsareeligibleand/ormostinneedofspecificsupportortrainingservices,todeterminetrainingandcounselingneeds,andtomeasuretheeffectivenessofemploymentprograms.
Forexample,theSelf-SufficiencyStandardhasbeenusedtotarget job training resources.Usinga“targetedjobsstrategy,”theStandardhelpstomatchjobseekerswithemploymentthatpaysSelf-SufficiencyWages.Throughanevaluationofthelocallabormarketandavailablejobtrainingandeducationinfrastructurejobseekersarematchedtoemploymentwithfamily-sustainingwages.Throughthisanalysisitispossibletodeterminethejobsandsectorsonwhichtotargettrainingandeducationresources.
Additionally,asacounseling tool theSelf-SufficiencyStandardhelpsparticipantsinworkandtrainingprogramsaccessbenefitsanddevelopstrategiestobecomeself-sufficient.Computer-basedcounselingtoolsallowuserstoevaluatepossiblewages,thencompareinformationonavailableprogramsandworksupportstotheirowncostsandneeds.Thesetoolsintegrateawidevarietyofdatanotusuallybroughttogether,allowingclientstoaccessinformationaboutthebenefitsofvariousprogramsandworksupportsthatcanmovethemtowardseconomicself-sufficiency.
how has the self-sufficiency standard Been used?
CAse hiGhLiGht
In Washington State, the Workforce Development
Council of Seattle-King County adopted the Self-
Sufficiency Standard as its official measure of self-
sufficiency and uses the Standard as a program
evaluation benchmark and counseling tool shifting
their focus from job placement alone to long-term
economic self-sufficiency.
the seLf-suffiCieNCY stANDARD foR mARYLAND — 29
moving towards economic securityAttainingincomeattheSelf-SufficiencyStandardlevelmeansbeingabletomeetone’sbasicneedsandnothavingtochoosebetweenbasicnecessities(suchaschildcareversusfood,orhousingversushealthcare).Atthesametime,theStandardisadmittedlyaconservative measure.Itisa“barebones”budgetwithcostssetatminimallyadequatelevels,nottheaverage,withnoextras.Forexample,thefoodbudgethasnotake-outorrestaurantfood,notevenapizzaoracupofcoffee.
TheStandardisconservativenotonlyinthesensethatitcalculatesthebareminimum,butalsobecauseitdoesnotincludeanysavingsandinvestmentsthatarenecessarytomovebeyondabasicneedsleveloverthelongrun.Belowwediscussfourdifferenttypesoffuture-orientedspending/savingsthatmovefamiliestowardincreasedeconomicsecurity:savingforemergencies,meetingthecostofbig-ticketitems,investinginpost-secondaryeducation/training,andsavingforretirement.
Notethatwedonotprescribewhatchoicesfamiliesshouldmake,aseachfamilymustmaketheirownchoicesregardinghowbesttobalancecurrentneedsagainstthefuture.Onceafamilyhassecuredtheincometomeettheirbasicneeds,thentheymustdecidewhatwill,fortheirparticularcircumstances,bestsetthemontheroadtolong-termeconomicsecurity.Forsomefamilies,thismightbeprecautionarysavings,bothtomeetimmediateunforeseeablecosts(suchasacarbreakdown),andlongtermforeseeablecostssuchasretirement.Forothers,payingoffdebtsmaybethefirstpriority.Forstillothers,havingabitextrabeyondthebasicminimummayenablethefamilytomove,leavinganabusivepartneroraproblematicneighborhood,thustakingafirstandcrucialsteptowardslong-termeconomicsecurity.Whatchoicesfamiliesmakedependsonpersonalcharacteristicssuchasageoftheadults,familycompositionchanges(marriage,divorce,birthofachild),orneighborhood/communitycontextandeconomy.Thusforexample,foryoungadults,investingineducationmayhaveahigherpriority,whileforolderadults,retirementsavingsmaybeofprimaryimportance.
sAViNG foR emeRGeNCies. Forallfamilies,havingsavingstomeetunexpectedemergenciesisanimportant
steptowardseconomicsecurity.Whetheritisanaccident,unemployment,anunexpectedlossofafamilymember(throughdivorce,disease,desertion,ordeath),theunforeseenhappens,andislikelytohaveagreaterfinancialimpactonlowincomefamilies.26Thishaslongbeenrecognizedascrucialbymanyanti-povertyorganizations,asevidencedbythemanyprogramsthatencourageliquidsavingsonaregularbasis,evenatverylowlevels.27
meetiNG the Cost of “BiG tiCKet” items. TheStandardcoverstheongoingcostofmeetingdaytodayexpenses,butdoesnotaddress“lumpsum”needs,forexample,topurchaseacarorreplacearefrigerator.Unlesspublictransportationisadequate,theStandardassumesthatadultswilluseacartogettoandfromwork,andforshopping;itcoversthecostofmaintaining,insuring,andrunningacar,butnottheinitialpurchase.Likewise,majorappliancesarepresumedtobefunctioning,sothecostsofelectricityandfuelarecovered,butnotthecostofpurchasingsuchappliances.
Thesinglebiggestpurchase,“bigticket”item,formostfamiliesisthepurchaseofahome.Again,theStandardpresumesthatallhouseholdsarerenters,andeventhen,onlyincludesthecostofmonthlyrentandutilities,butnotdeposits(suchas“firstandlastmonthrent”ordamagedeposits)sometimesrequiredtorentanapartmentorhouse.Althoughacquiringsufficientmeanstobuyratherthanrentmaytakeconsiderableresources,owningahomehasbeenconsideredpartofthe“AmericanDream”,andaninvestmentthatcanprovidesecurity.Itmayalso,dependingontheparticularlocalhousingmarket,costlesstoownthanrentwhenincometaximpactssuchasthemortgagedeductionaretakenintoconsideration.Homeownershipmayprovidemoresecurity,particularlyiffamiliesareable
once a faMily haS Secured The incoMe To
MEET THEIR BASIC NEEDS, THEN THEY MUST
DECIDE WHAT WILL, FOR THEIR PARTICULAR
CIRCUMSTANCES, BEST SET THEM ON THE
ROAD TO LONG-TERM ECONOMIC SECURITY.
30 — the seLf-suffiCieNCY stANDARD foR mARYLAND the seLf-suffiCieNCY stANDARD foR mARYLAND — 31
tosecurelongtermfixedmortgagepayments,thusnotbeingsubjecttorentincreases.
Atthesametime,forthoselivinginareaswithfalteringeconomiesanddecliningjobopportunities,suchlongterminvestmentsmayhinderflexibilitytorespondtochanginglabormarketconditionsandopportunities.Whethertoaimforhomeownershipasameanstoincreasedeconomicsecurityisachoiceeachfamilymustmake,dependingontheirowncircumstancesaswellasthelocaleconomyandhousingmarket.
iNVestiNG iN Post-seCoNDARY eDuCAtioN AND/oR tRAiNiNG. Investmentinwhateconomistscall“humancapital”,thatis,educationandjobskills,isprobablythemostcrucialforachievingtrueeconomicsecurity.Truelong-termself-sufficiencyincreasinglyrequireshumancapitalinvestmentsthatenhanceskillsaswellasimproveaccesstojobswithcareerpotential.Intoday’seconomy,onecannoteasilymaintainandmovebeyondself-sufficiencywithoutatechnologicallyadvancedandbroad-basededucation,whichcanprovidetheflexibilitytomoveintonew,innovative,ornontraditionaljobsandcareers.ThismeansthatahighschooldegreeorG.E.D.,whileessential,isincreasinglynotenough,evenwithskill-impartinghighschoollevelvocationaleducation.
Giventhis,humancapitalinvestmentrequiresattendingpost-secondaryvocationaltraininginspecializedinstitutions,communitycollegewhichprovidestwo-yearAssociateDegreesorcertificatesinspecializedfields,orafour-yearcollegeoruniversity.Almostallpost-secondaryeducationortrainingrequireresourcesfortuition,andthusrequiremonetaryinvestment.Atthesametime,theindividual“owns”theinvestmentinthesensethatitcannotbetakenaway,anditwillgenerallynotlosevalue,ascanhappenwithsomekindsofinvestments(suchashousingorpensionplans).Altogether,investmentineducationandtrainingprovidesthemostflexibilityforadaptationtoaneconomywherejobrequirementsareshiftingevermorerapidly.
Justasitisfortheadults,securingadvancededucationandtrainingforthenextgenerationisanimportantinvestmentforthefuture,withchildrenandyoungadultsevenlessabletoaccesstheresourcestomakethesecrucialinvestments.
sAViNG foR RetiRemeNt. Savingsforretirementarethelongesttermsavings,andmayseemliketheleastimportant,particularlyforyoungerworkers.Yetsubstantialdatasuggeststhatevenwithoutanychangesinthefuture,SocialSecuritycurrentlydoesnotprovideadequateincomeformostindividualsduringretirement.Althoughitisthelargestsourceofincomeforbothmenandwomenover65,morethanearnings,pensions,andassetscombined,mosteldersfindthemselvesjustbarelyaboveofficialpoverty.28Inaddition,althoughMedicarewasoriginallyintendedtomeetelders’medicalneedsoncetheywerenolongercoveredbyemployer-providedhealthbenefits,increasinglyMedicaredoesnotcoverallsuchcosts,suchthateldersarespendingincreasinglyhigherproportionoftheirincomeonhealthcarecosts.29Indeed,recentresearchusingtheSupplementalPovertyMeasure,whichtakesintoaccounttheimpactof“necessaryexpenditures”,findsthathealthexpendituresbytheelderlypushmanybelowtheofficialpovertylevel,substantiallyincreasingtheproportionoftheelderlydeemed“poor”bythispovertymeasure.30Thussavingforretirementiscrucialforachievingeconomicsecuritybeyondtheworkingyears.
ACHIEVING ECONOMIC SECURITY: stAKehoLDeR suPPoRts foR fAmiLiesEachindividualandfamilymustmakethedecisionshowbesttosaveand/orinvesttomovetowardseconomicsecurityinthefutureforthemselvesandtheirfamilies.Butthistaskisnotonethattheymustdoalone,andinfact,thereisawiderangeofsupportsandinstitutionsthatwillamplify,support,andenhancesuchindividualefforts.JustasachievingSelf-SufficiencyWagesinvolvesarangeofstakeholders,asdescribedabove,thesameistrueforeconomicsecurity.
True lonG-TerM Self-Sufficiency
increaSinGly requireS huMan caPiTal
INvESTMENTS THAT ENHANCE SKILLS AS WELL
AS IMPROvE ACCESS TO JOBS WITH CAREER
POTENTIAL.

30 — the seLf-suffiCieNCY stANDARD foR mARYLAND the seLf-suffiCieNCY stANDARD foR mARYLAND — 31
emPLoYeRs. Firstistheroleoftheemployer.Severalkeycomponentsofeconomicsecurityareemployment-based,includinghealthinsurance,SocialSecurityandMedicare,andunemploymentinsurance.Asstatedabove,theStandardalreadyincorporatestheemployeeshareofemployer-providedhealthinsurance,thusdefiningaSelf-SufficiencyStandardjobasincludinghealthinsurance.Likewise,itisassumedthatboththeemployerandemployeepaySocialSecurityandMedicaretaxes.(Thatis,Self-SufficiencyStandardwagesarenot“cash”orunder-the-tablewages,withnodeductionsforSocialSecurityandMedicare.)Withsuchcoverage,workersareassuredthatiftheybecomedisabledatanyage,orwhentheyreachretirementage,theywillthenbeentitledtotheincomesupportandhealthcarecoveragethattheyhavepaidintoovertheirworkinglives.Finally,althoughitdoesnotshowasacostintheStandard,itisalsoassumedthataStandardjobincludesunemploymentinsurancecoverage(unemploymentinsuranceispaidforbyemployersthroughapayrolltaxontheirpayrolls).Nevertheless,itisreasonabletoassumethataStandardlevelwageshouldincludesuchcoverageagainstjobloss,justashealthinsuranceandSocialSecurity/Medicareinsureagainstincomelossduetohealthcarecosts,disabilityoroldage.
GoVeRNmeNt. Secondistheroleofthegovernment.AlreadydiscussedaresuchinsuranceprogramsasSocialSecurityandMedicareforretirement/disability,whichnotonlyinsureagainstoldage,butprovidea“floor”intermsofincome,anduniversalhealthcoveragefortheelderly,respectively.Asecondmajorsourceofgovernmentsupportforeconomicsecurityisthetaxsystem,operatingthroughdeductionsandtaxcredits.Althoughnotwidelyrecognized,mortgagedeductionsintheincometaxprovidesubstantialamountsof“matching”fundsforsavingsforhousinginvestment.Dependingonthetaxbracket,thisdeductionalone“saves”Americantaxpayers$104.5billionandthussupportsinvestmentinhomeownership.31Aswithmosttaxdeductionsandcredits,however,thisishighlyskewedtohigher-incomefamilies.Atthesametime,FHAandotherprogramshaveenabledlow-incomefamiliestobecomehomeownerswithlowerdownpaymentsandfavorableterms.32
Akeysourceofgovernmentsupportforsavingsforlow-incomefamiliesaretaxcredits,particularlytheEITCand
ChildTaxCredit.Becausetheyarenowreceivedaslumpsumpaymentswhenfamiliesfiletheirincometaxes,theyactasforcedsavings.Indeed,studieshaveshownthatfamiliesoftenseethesetaxrefundsassavings.33Whiletheymaybeusedtoeitherpaydowndebt(oftenmedicaldebt)ormakemajorpurchases,interesthasincreasedamongserviceproviderstocapitalizeonthisopportunitytousethesecreditpaymentstosetupsavingsprograms.
Athirdsourceofsupportforfutureinvestmentsaregovernmentsupportofhighereducationthrougheducationalloansandparticularlyforlow-incomefamilies,Pellgrants.Thelatterprovideresourcesfortuitionandbooks,andmakeitpossibleformillionsofstudents,bothadultlearnersreturningtoschoolandthenextgeneration,tocontinuetheireducationbeyondhighschool.
CommuNitY. Thethirdtypeofstakeholderprovidingsupportisthelocalcommunity,includingpublicand/orprivatecommunityorganizationsandprograms.AgoodexampleisIDAprograms,describedabove,whichencouragesavingsthroughmatchingprogramsunderwrittenbyfoundationsand/orstategovernments.Othersourcesarelocalscholarshipfunds(e.g.,Kiwanis)andentrepreneurshipprograms,suchasJuniorAchievement.Somelocalprogramsaddressspecificneeds,suchasprogramslikeHabitatforHumanitythathelpfamiliesbecomehomeowners,orprogramsthathelpsecurecarsorcarpoolingtoincreaseaccesstojobs,particularlyinareaswithlimitedpublictransportation.
the futuRe AND eCoNomiC seCuRitYAswelooktothefuture,thetrendsforthosestrivingtoachieveeconomicsecurityaremixedatbest.Ontheonehand,therehasbeenrecognitionoftheimportanceofsavings,investment,andparticularlyeducationandtrainingaskeytoachievingeconomicsecurity,sothatlowincomeprogramshaverelaxedrestrictionsonassetsorsavingsaccounts.
Likewise,changesunderthePatientProtectionandAffordableCareAct(PPACA)willbroadencoverageandregulateprovisionofservicesunderhealthinsurance,thusextendinghealthinsurancetomorepeople.34Finally,recentreformsincludedinthe2009AmericanRecovery

32 — the seLf-suffiCieNCY stANDARD foR mARYLAND
andReinvestmentAct(ARRA)extendedunemploymentinsurancetomoreworkersinmanystates,suchasbroadeningeligibilityforpart-timeworkers.35
Atthesametime,abroadertrendistheshiftingofriskfromcorporationsandgovernmenttoindividuals.Forexample,employershavecutoreliminatedhealthinsurancecoverage,reducedoreliminatedpensions,andstructuredjobsastemporaryorcontractworksoasnottoincurunemploymentinsurancecoveragewhenlayoffsoccur.Thisdeclineinemployer-providedhealthinsurancecouldaccelerateundertheexpandedcoverageunderPPACA,forcingfamiliesintotheindividualmarketandthehealthexchanges(withunknownbuthighlyvariablestatebystateeffectsonthecoststofamiliesinpremiums,whichthoughsubsidized,maystillbegreaterthanthroughemployment).
Furthermore,adirecteffectoftheGreatRecession,andthehousing/foreclosurecrisis,istogreatlylimittheaccess
oflowincomefamiliestolower-costhomemortgages.Notonlyincomerequirementsbutalsodownpayment,creditrating,andotherrequirementshavebeenseverelytightened,makingitmuchmoredifficultforfamiliestobecomehomeownersintheforeseeablefuture.Andingeneral,theGreatRecessionhasledtocutbacksinmanyprograms,particularlyatthestatelevel,suchastheMarylandChildCareSubsidyprogram,whichimplementedawaitinglistfornewprogramparticipantsinearly2011duetoreducedfundingcombinedwithcaseloadincreases.36
Lookingtothefuture,publicpolicyproposalstorestrictaccessto,and/ordecreasebenefitsinawiderangeoffederalprogramsfromSocialSecuritytofoodstamps,suggestthatachievingeconomicsecuritywillcontinuetobeachallenge.Atthesametime,itisalsoclearthatthisisnotachallengethatindividualsmustfacealone,butonewhereemployers,thegovernment,andthecommunitycananddocontributetowardsachievingeconomicsecurity.
ConclusionAsMarylandrecoversfromtheGreatRecession,long-termeconomicprosperitywillrequireresponsibleactionatthestateandcommunitylevelthatputsallMarylandersonthepathtoself-sufficiency.AstrongeconomymeansgoodjobsthatpaySelf-SufficiencyStandardwagesandaworkforcewiththeskillsnecessarytofillthosejobs.The Self-Sufficiency Standard for Maryland 2012definestheincomeneededtorealisticallysupportafamily,withoutpublicorprivateassistanceinMaryland.Formostworkers,theSelf-SufficiencyStandardshowsthatearningsabovetheofficialFederalPovertyLevelareneverthelessfarbelowwhatisneededtomeetfamilies’basicneeds.
AlthoughtheSelf-SufficiencyStandarddeterminesanadequatewagelevelwithoutpublicbenefits,itdoesnotimplythatpublicworksupportsareinappropriateorunnecessaryforMarylandfamilies.ForworkerswithwagesbelowtheSelf-SufficiencyStandard,publicsubsidiesforhigh-costnecessitiessuchaschildcare,healthcare,andhousingarecriticaltomeetingbasicneeds,retainingjobsandadvancingintheworkforce.ByutilizingtheSelf-SufficiencyStandard,Marylandhastheopportunitytolaythefoundationtoachieveastrongworkforceandthrivingcommunities.
TheSelf-SufficiencyStandardiscurrentlybeingusedtobetterunderstandissuesofincomeadequacy,toanalyzepolicy,andtohelpindividualsstrivingtobeself-sufficient.Communityorganizations,academicresearchers,policyinstitutes,legaladvocates,trainingproviders,communityactionagencies,andstateandlocalofficials,amongothers,areusingtheSelf-SufficiencyStandard.
In addition to Maryland, the Standard has been calculated for Alabama, Arizona, California, Colorado,
Connecticut, Delaware, Florida, Georgia, Hawaii, Illinois, Indiana, Iowa, Kentucky, Louisiana,
Massachusetts, Mississippi, Missouri, Montana, Nebraska, Nevada, New Jersey, New York, North
Carolina, Oklahoma, Ohio, Oregon, Pennsylvania, South Dakota, Tennessee, Texas, Utah, virginia,
Washington, West virginia, Wisconsin, Wyoming, and the Washington, D.C. metropolitan area.
For further information about the Standard, how it is calculated or used, or the findings reported here,
as well as information about other states or localities, contact Dr. Diana Pearce at [email protected] or
(206) 616-2850, or the Center for Women’s Welfare staff at (206) 685-5264, or visit
www.selfsufficiencystandard.org.
for more information on The Self-Sufficiency Standard for Maryland 2012, or to find out more about the
programs at the Maryland Community Action Partnership, contact
(410) 740-3027, or visit http://www.maryland-cap.org/.
34 — the seLf-suffiCieNCY stANDARD foR mARYLAND the seLf-suffiCieNCY stANDARD foR mARYLAND — 35
endnotes 1.JaredBernstein,Crunch: Why Do I Feel so Squeezed (and other Unsolved Economic Mysteries)(SanFrancisco,CA:Berrett-KoehlerPublishers,Inc.,2008).
2.AccordingtotheU.S.BureauofLaborStatistics,bothparentswereemployedin58%oftwo-parentfamilieswithchildrenin2010.Likewise,67%ofsinglemotherswithchildrenwereemployedin2010and76%ofsinglefatherswithchildrenwereemployedin2010.Althoughabout74%ofemployedwomenwithchildrenunder18yearsofageworkedfull-timein2010,workingpart-timeisclearlythedesirableoptionundermanycircumstancessuchaswhenthechildrenareveryyoungorinneedofspecialcare,orwhenaffordable/appropriatechildcareisnotavailable.Formanylow-incomemothersitisequallyclearthateconomicnecessity,aswellastheTANFrequirementsthatlimitbenefitsandstipulatethatrecipientsparticipateinjobsearches,precludethisoption.U.S.DepartmentofLabor,BureauofLaborStatistics,“EmploymentCharacteristicsofFamiliesin2010,”EconomicNewsReleases,EmploymentandUnemployment,http://www.bls.gov/news.release/pdf/famee.pdf(accessedJune1,2011).
3.U.S.DepartmentofHealthandHumanServices,AgencyforHealthcareResearchandQuality,CenterforFinancing,Access,andCostTrends,“TableII.D.3:PercentofTotalPremiumsContributedbyEmployeesEnrolledinFamilyCoverageatPrivate-SectorEstablishmentsthatOfferHealthInsurancebyFirmSizeandState:UnitedStates,2009,”MedicalExpenditurePanelSurvey-InsuranceComponent,http://www.meps.ahrq.gov/mepsweb/data_stats/quick_tables_results.jsp?component=2&subcomponent=2&year=2009&tableSeries=2&tableSubSeries=CDE&searchText=&searchMethod=1&Action=Search(accessedSeptember23,2011).
4.The2011Marylandstateminimumwageis$7.25perhour.MarylandDepartmentofLabor,Licensing,andRegulation,DivisionofLaborandIndustry,“WageandHourFactSheet,”WageandHour,http://www.dllr.state.md.us/labor/wages/(accessedSeptember26,2011).
5.In2010theaverageconsumerexpenditureonfoodwas$6,129peryearor12.7%oftotalexpenditures.U.S.DepartmentofLabor,BureauofLaborStatistics,“ConsumerExpendituresin2010,”http://www.bls.gov/news.release/cesan.nr0.htm(accessedNovember10,2011).
6.Healthcarepremiumsarethestatewideaveragepaidbyworkersforsingleadultsandforfamilies,fromthenationalMedicalExpenditurePanelSurvey(MEPS),whichis73%ofthepremiumforfamilycoverageinMaryland.
7.TheSelf-SufficiencyWageforeachoftheseplaceshasbeenupdatedtocurrentdollarsusingtheConsumerPriceIndexfortheappropriateregions.U.S.DepartmentofLabor,BureauofLaborStatistics,“Northeast/Midwest/South/WestRegionsAllItems,1982-84=100-CUURA101SA0,”ConsumerPriceIndex,http://data.bls.gov/cgi-bin/surveymost?cu(accessedNovember1,2011).
8.TheHUDmedianincomelimitforathree-personfamilyintheWashington-Arlington-Alexandria,DC-VA-MDMDHUDMetroFMRAreais$76,050annually.U.S.DepartmentofHousingandUrbanDevelopment,“FY2012IncomeLimitsSummary,
Washington-Arlington-Alexandria,DC-VA-MDMDHUDMetroFMRArea,”FY2012IncomeLimitsDocumentationSystem,http://www.huduser.org(accessedDecember15,2011).
9.Althoughtheseincomelimitsarebasedon80%,50%,and30%ofthemedianincome,thefinalincomelimitbenchmarksarecalculatedaftervariousadjustmentsareaccountedfor,suchashighorlowhousingcostadjustments.Thereforethefinalincomelimitsarenotnecessarilyanexactpercentoftheoriginalmedianincome.Mosthousingassistanceislimitedtothe“VeryLowIncome”category,andinsomeinstancestothe“ExtremelyLowIncome”category.U.S.DepartmentofHousingandUrbanDevelopment,“FY2011IncomeLimitsSummary,Baltimore-TowsonHUDFMRArea”FY2011IncomeLimitsDocumentationSystem,http://www.huduser.org(accessedNovember2,2011).
10.U.S.DepartmentofLabor,BureauofLaborStatistics,“SouthRegionAllItems,1982-84=100-CUURA101SA0,”ConsumerPriceIndex,http://data.bls.gov/cgi-bin/surveymost?cu(accessedNovember1,2011).
11.MedianwagesofMaryland’stopoccupationscomefromtheBureauofLaborStatisticsOccupationalEmploymentStatisticssurveyandareupdatedforinflationusingtheConsumerPriceIndex.U.S.DepartmentofLabor,BureauofLaborStatistics,“May2010OccupationalEmploymentandWageEstimates:Maryland,”OccupationalEmploymentStatistics,http://www.bls.gov/oes/(accessedOctober28,2011).U.S.DepartmentofLabor,BureauofLaborStatistics,“SouthRegionAllItems,1982-84=100-CUURA101SA0,”ConsumerPriceIndex,http://data.bls.gov/cgi-bin/surveymost?cu(accessedOctober28,2011).
12.NationalEmploymentLawProject,“AYearofUnbalancedGrowth:Industries,Wages,andtheFirst12MonthsofJobGrowthAftertheGreatRecession,”DataBrief,http://www.nelp.org/page/-/Justice/2011/UnbalancedGrowthFeb2011.pdf?nocdn=1(accessedJune1,2011).
13.U.S.DepartmentofHealthandHumanServices,AdministrationforChildren&Families,OfficeofChildSupportEnforcement,“FY2008AnnualReporttoCongress,”Tables4,14,15,and61,http://www.acf.hhs.gov/programs/cse/pubs/2011/reports/fy2008_annual_report/(accessedJune1,2011).DatahasbeeninflatedusingtheBureauofLaborStatistics,ConsumerPriceIndex.U.S.DepartmentofLabor,BureauofLaborStatistics,“SouthRegionAllItems,1982-84=100-CUURA101SA0,”ConsumerPriceIndex,http://data.bls.gov/cgi-bin/surveymost?cu(accessedSeptember26,2011).
14.MarylandStateDepartmentofEducation,ChildCareSubsidyBranch,“MarylandChildCareSubsidyProgram,”http://www.marylandpublicschools.org/MSDE/divisions/child_care/subsidy/ccs.htm(accessedSeptember26,2011).
15.FamiliesthatentertheworkforcefromTANFareusuallyeligibleforcontinuedcoveragebyMedicaidforthemselvesandtheirchildrenforupto12monthsthroughtheTransitionalMedicaidprogram.MarylandDepartmentofHealthandMentalHygiene,“MarylandMedicalAssistanceforFamilies,”(accessedNovember10,2011).
16.MarylandDepartmentofHumanResources,“FoodSupplementProgram,”Eligibility,(accessedNovember10,2011).
34 — the seLf-suffiCieNCY stANDARD foR mARYLAND the seLf-suffiCieNCY stANDARD foR mARYLAND — 35
USDAFoodandNutritionServices,“HowtoApply:WICIncomeEligibilityGuidelines2011-2012,”http://www.fns.usda.gov/wic/howtoapply/incomeguidelines11-12.htm(accessedJune1,2011).
17.MarylandDepartmentofHealthandMentalHygiene,Maryland’sChildren’sHealthProgram(MCHP),“MonthlyIncomeandAssetsGuidelinesMedicalCarePrograms,”http://www.dhmh.state.md.us/mma/pdf/2011/IncomeAssetGuidelines-2011.pdf(accessedSeptember26,2011).
18.U.S.DepartmentofHousingandUrbanDevelopment,“HousingChoiceVouchersFactSheet,”TopicAreas,HousingChoiceVoucherProgramSection8,http://portal.hud.gov/portal/page/portal/HUD/topics/housing_choice_voucher_program_section_8(accessedJune1,2011).
19.The2011Marylandstateminimumwageis$7.25perhour.MarylandDepartmentofLabor,Licensing,andRegulation,DivisionofLaborandIndustry,WageandHour,“WageandHourFactSheet,”http://www.dllr.state.md.us/labor/wages/(accessedSeptember26,2011).
20.HarryHolzer&RobertLerman,“America’sForgottenMiddleSkillJobs:EducationandTrainingRequirementsintheNextDecadeandBeyond,”TheWorkforceAlliance(2007),Washington,D.C.,http://www.urban.org/UploadedPDF/411633_forgottenjobs.pdf(accessedJune1,2011).
21.U.S.CensusBureau,“B20004.MedianEarningsbySexbyEducationalAttainmentforthePopulation25YearsandOver,”2009AmericanCommunitySurvey1-YrEstimates,DetailedTables,http://factfinder.census.gov/(accessedOctober28,2011).
22.TheU.S.DepartmentofLaborFY2010budgetincluded$500million(appropriatedthroughtheAmericanRecoveryandReinvestmentAct)forcompetitivegrantstotrainworkersforgreenjobsand$50millionforgreenjobsemploymentandtraininginitiatives.U.S.DepartmentofLabor,“SecretaryHildaL.SolisUnveilsU.S.DepartmentofLabor’sBudgetforFiscalYear2010,”NewsReleaseNumber09-0489-NAT,http://www.dol.gov/opa/media/press/oasam/OASAM20090489.htm(accessedJune1,2011).SeeWiderOpportunitiesforWomen’sGreenInitiativeformoreinformationabouthowwomencanenterandbenefitfromthegreeneconomy,athttp://www.wowonline.org/green_members/main.asp.
23.MarylandDepartmentofLabor,Licensing,andRegulation,DivisionofWorkforceDevelopmentandAdultLearning,“MarylandOccupationalProjections,2008-2018,”http://www.dllr.state.md.us/lmi/iandoproj/(accessedNovember7,2011).
24.In2010,unionworkersaveraged$26.04perhour,comparedto$20.46fornonunionworkers.U.S.DepartmentofLabor,BureauofLaborStatistics,“NationalCompensationSurvey:OccupationalWagesintheUnitedStates,2010,”http://www.bls.gov/ncs/ncswage2010.htm(accessedJune1,2011).In2010,aunionemployee’saverageshareofemployer-sponsoredhealthinsurancewas11%ofthemedicalcarepremiumforsinglecoverageand17%forfamilycoverage,comparedwithanonunionemployee’saverageshareof21%and33%forsingleandfamilypremiums,respectively.U.S.DepartmentofLabor,BureauofLaborStatistics,“EmployeeBenefitsinintheUnitedStates,March2010,”http://www.bls.gov/ncs/ebs/sp/ebnr0016.pdf(accessedJune1,2011).
25.FormoreinformationonpayequityseetheNationalCommitteeonPayEquityathttp://www.pay-equity.org.
26.GregoryMillsandJoeAmick,TheUrbanInstitute,“CanSavingsHelpOvercomeIncomeInstability?”Brief18,December2010,http://www.urban.org/UploadedPDF/412290-savings-overcome-income-instability.pdf(accessedNovember28,2011).
27.Forexample,seeresearchandprogramsonassetbuildingat:CorporationforEnterpriseDevelopment(CFED),http://cfed.org/;NewAmericaFoundation,http://assets.newamerica.net/dashboard;and,UrbanInstitute,http://www.urban.org/projects/opportunity/index.cfm.
28.InstituteforWomen’sPolicyResearch,“QuickFigures:ExcerptedfromtheReport,SocialSecurityEspeciallyVitaltoWomenandPeopleofColor,MenIncreasinglyReliant”,http://www.iwpr.org/publications/pubs/figures-excerpted-from-the-report-social-security-especially-vital-to-women-and-people-of-color-men-increasingly-reliant/at_download/file(accessedFebruary2011).
29.PatriciaNeuman,JulietteCubanski,KatherineA.Desmond,&ThomasH.Rice“HowMuch‘SkinInTheGame’DoMedicareBeneficiariesHave?TheIncreasingFinancialBurdenOfHealthCareSpending,1997–2003,”HealthAffairs,26,no9,(2007):1692-1701doi:10.1377/hlthaff.26.6.1692.
30.U.S.CensusBureau,KathleenShort,“TheResearchSupplementalPovertyMeasure:2010,”CurrentPopulationReports,November2011,http://www.census.gov/prod/2011pubs/p60-241.pdf(accessedNovember28,2011).
31.ChristianHilber&TraceyTurner,“TheMortgageInterestDeductionanditsImpactonHomeownershipDecisions,”SpacialEconomicsResearchCentre(2010),http://www.spatialeconomics.ac.uk/textonly/SERC/publications/download/sercdp0055.pdf(accessedJuly27,2011).
32.Forexample,theHUDHomeownershipVoucherProgramallowspublichousingagenciestheoptiontoallowaparticipantspaymentsubsidytobeusedtowardsfirst-timehomebuyinginsteadofrent.SeeU.S.DepartmentofHousingandUrbanDevelopment,“HomeownershipVouchers,”http://portal.hud.gov/hudportal/HUD?src=/program_offices/public_indian_housing/programs/hcv/homeownership(accessedAugust4,2011).
33.JenniferRomichandThomasWeisner,“HowFamiliesViewandUsetheEITC:TheCaseforLump-SumDelivery,”NationalTaxJournal,53(4)(part2)(2000):1107-1134;hereaftercitedasHowFamiliesViewandUsetheEITC.
34.U.S.Congress,House,2010,“CompilationofPatientProtectionandAffordableCareAct,”HR3590,111thCongress,2ndSession,http://docs.house.gov/energycommerce/ppacacon.pdf(accessedJuly27,2011).Additionally,detailsofACAcanbefoundathttp://www.healthcare.gov/law/introduction/index.html.
35.U.S.Congress,House,2009,“AmericanRecoveryandReinvestmentActof2009,”HR1,111thCongress,1stSession,http://www.gpo.gov/fdsys/pkg/BILLS-111hr1enr/pdf/BILLS-111hr1enr.pdf(accessedJuly27,2011).FormoreinformationontheimpactofARRAseewww.recovery.org.
36.MarylandStateDepartmentofEducation,ChildCareSubsidyBranch“PressRelease-ChildCareSubsidyImplementsaWaitingList,”http://www.marylandpublicschools.org/NR/rdonlyres/4BBFF303-3B56-47A0-AE08-4A31D1A265AC/27635/WaitingList.pdf(accessedNovember28,2011).

36 — the seLf-suffiCieNCY stANDARD foR mARYLAND the seLf-suffiCieNCY stANDARD foR mARYLAND — 37
Appendix A: Methodology, Assumptions, and SourcesThisappendixexplainsthemethodology,assumptions,andsourcesusedtocalculatetheStandard.Webeginwithadiscussionofourgeneralapproach,followedbythespecificsofhoweachcostiscalculated,endingwithalistofdatasources.MakingtheStandardasconsistentandaccurateaspossible,yetvariedbygeographyandtheageofchildren,requiresmeetingseveraldifferentcriteria.Totheextentpossible,thedatausedintheSelf-SufficiencyStandardare:
collectedorcalculatedusingstandardizedorequivalent• methodologynationwide;obtainedfromscholarlyorcrediblesourcessuchasthe• U.S.CensusBureau;updatedregularly;and,• geographically-and/orage-specific,asappropriate.•
Coststhatvarysubstantiallybyplace,suchashousingandchildcare,arecalculatedatthemostgeographicallyspecificlevelforwhichdataisavailable.Othercosts,suchashealthcare,food,andtransportation,arevariedgeographicallytotheextentthereisvariationandappropriatedataavailable.Inaddition,asimprovedorstandardizeddatasourcesbecomeavailable,themethodologyusedbytheStandardisrefinedaccordingly,resultinginanimprovedStandardthatiscomparableacrossplaceaswellastime.
TheSelf-SufficiencyStandardiscalculatedfor70differentfamilytypesforeachcountyinMaryland.The70differentfamilytypesrangefromasingleadultwithnochildren,tooneadultwithoneinfant,oneadultwithonepreschooler,andsoforth,uptotwo-adultfamilieswiththreeteenagers.TheSelf-SufficiencyStandardcanalsobecalculatedforlargerandmulti-generationalfamilies.ThecostofeachbasicneedandtheSelf-SufficiencyWagesforeightselectedfamilytypesforeachcountyinMarylandareincludedinAppendixDofthisreport.
TheSelf-SufficiencyStandardassumesadulthouseholdmembersworkfull-timeandtherefore includes all major costs associated with employment for every adult household member(i.e.,taxes,transportation,andchildcareforfamilieswithyoungchildren).TheSelf-SufficiencyStandarddoesnotcalculatecostsforadultswithdisabilitiesorelderlyhouseholdmemberswhonolongerwork.Itshouldbenoted
thatforfamilieswithpersonswithdisabilitiesorelderlyfamilymemberstherearecoststhattheStandarddoesnotaccountfor,suchasincreasedtransportationandhealthcarecosts.
TheStandardassumesadultswork8hoursperdayfor22dayspermonthand12monthsperyear.EachcostcomponentintheStandardisfirstcalculatedasamonthlycost.HourlyandannualSelf-SufficiencyWagesarecalculatedbasedonthemonthlyStandardbydividingthemonthlySelf-SufficiencyStandardby176hourspermonthtoobtainthehourlywageandby12monthsperyeartoobtaintheannualwage.
ThecomponentsofThe Self-Sufficiency Standard for Maryland 2012 andtheassumptionsincludedinthecalculationsaredescribedbelow.
housiNGTheStandardusesthemostrecentFiscalYear(FY)FairMarketRents(FMRs),calculatedannuallybytheU.S.DepartmentofHousingandUrbanDevelopment(HUD),tocalculatehousingcostsforeachstate’smetropolitanandnon-metropolitanareas.Section8(c)(1)oftheUnitedStatesHousingActof1937(USHA)requirestheSecretarytopublishFairMarketRents(FMRs)periodically,butnotlessthanannually,tobeeffectiveonOctober1ofeachyear.OnOctober1,2011,HUDpublishedfinalFMRsforfiscalyear2012.Housingcostsinthe2012MarylandSelf-SufficiencyStandardarecalculatedusingtheFY2012HUDFairMarketRents.
TheFMRsarecalculatedforMetropolitanStatisticalAreas(MSAs),HUDMetroFMRAreas(HMFAs),andnon-metropolitancounties.ThetermMSAisusedforallmetropolitanareas.TheyarealsoknownasCore-BasedStatisticalAreas(CBSAs),andiftheyareparticularlylarge(withapopulationcoreofatleast2.5million),theymaybedividedinto“MetropolitanDivisions”(i.e.,HMFAs).
AnnualFMRs,usedtodeterminethelevelofrentforthosereceivinghousingassistancethroughSection8vouchers,arebasedondatafromthe2000decennialcensus,thebiannualAmericanHousingSurvey,andrandomdigit
36 — the seLf-suffiCieNCY stANDARD foR mARYLAND the seLf-suffiCieNCY stANDARD foR mARYLAND — 37
dialingtelephonesurveys,updatedforinflation.Thesurveysampleincludesrenterswhohaverentedtheirunitwithinthelasttwoyears,excludingnewhousing(twoyearsoldorless),substandardhousing,andpublichousing.FMRs,whichincludeutilities(excepttelephoneandcable),areintendedtoreflectthecostofhousingthatmeetsminimumstandardsofdecency.Inmostcases,FMRsaresetatthe40thpercentile;meaning40%ofthehousinginagivenareaislessexpensivethantheFMR.aInMaryland,justoverhalfofthecountyFMRsaresetatthe40thpercentile,andtheremainderareatthe50thpercentile.
HUDcalculatesonesetofFMRsforanentiremetropolitanarea.InMarylandtherearetwoMSAswithmorethanonecountysharingthesameFMRs(Baltimore-TowsonMDHUDMetroFMRAreaandWashington-Arlington-AlexandriaDC-VA-MDHUDMetroFMRArea).Inordertodifferentiatethecostofhousingbycounty,theStandardusesmediangrossrentratiosbycountycalculatedfromtheU.S.CensusBureau’s2007-2009AmericanCommunitySurvey(ACS)Estimates.
Todeterminethenumberofbedroomsrequiredforafamily,theStandardassumesthatparentsandchildrendonotsharethesamebedroomandnomorethantwochildrenshareabedroom.Therefore,theStandardassumesthatsinglepersonsandcoupleswithoutchildrenhaveone-bedroomunits,familieswithoneortwochildrenrequiretwobedrooms,andfamilieswiththreechildrenrequirethreebedrooms.Becausetherearefewefficiencies(studioapartments)insomeareas,andtheirqualityisveryuneven,theSelf-SufficiencyStandardusesone-bedroomunitsforthesingleadultandchildlesscouple.
DAtA souRCes
Housing Costs. U.S.DepartmentofHousingandUrbanDevelopment,“ScheduleB:FY2012FinalFairMarketRentsforExistingHousing,”DataSets,FairMarketRents,http://www.huduser.org/portal/datasets/fmr.html(accessedOctober3,2011).
County-Level Housing Costs. U.S.CensusBureau,American“Factfinder,B25064MedianGrossRent,”2007-2009AmericanCommunitySurvey3-YearEstimates,DetailedTables,http://factfinder.census.gov/(accessedOctober3,2011).
ChiLD CARe. TheFamilySupportAct,ineffectfrom1988untilwelfarereformin1996,requiredstatestoprovidechildcareassistanceatmarket-rateforlow-incomefamiliesinemploymentand/oreducationandtraining.Stateswerealsorequiredtoconductcostsurveysbiannuallytodeterminethemarket-rate(definedasthe75thpercentile)bysetting,age,andgeographicallocationorsetastatewiderate.bManystates,includingMaryland,havecontinuedtoconductorcommissionthesurveysonaregularbasis.DataforMarylandchildcarecostsisfromtheMarylandCommitteeforChildren’sCost of Care Report: Statewide Cost of Care Report by Jurisdiction.
Carebyfamilyrelativesaccountsforthelargestproportionofcareforchildrenlessthanthreeyearsofage(30%comparedto15%infamilydaycareand18%inchildcarecenters).cHowever,sinceoneofthebasicassumptionsoftheStandardisthatitprovidesthecostsofmeetingneedswithoutpublicorprivatesubsidies,the“privatesubsidy”offreeorlowcostchildcareprovidedbyrelativesandothersisnotassumed.
Thusthequestionbecomes,whichpaidsettingismostusedforinfants(definedaschildrenunderthree),familydaycareorcentercare?Someproportionofrelativecareispaidcare,withestimatesrangingfromone-fourthtomorethanhalf.Inaddition,asubstantialproportionofrelativecaregiversalsoprovidecarefornon-relativechildren.dAsaresult,relativecare,whenpaidfor,closelyresemblesthefamilydaycarehomesetting.
Whenevenaminimalproportionofrelativecareisaddedtothepaidfamilydaycaresettingamount(e.g.,itisassumedthatjust20%ofrelativecareispaid),thenthiscombinedgrouping(familydaycarehomespluspaidrelativecare)becomesthemostcommonpaiddaycaresettingforinfants.Thatis,15%ofchildreninfamilydaycareplus(atleast)6%whoareinrelativecare(20%ofthe30%)totals21%,andthusismorethanthe18%ofinfantswhoareinpaidcareinchildcarecenters.e
Forchildrenthreeandfouryearsold,however,clearlythemostcommonchildcarearrangementisthechildcarecenter,accountingfor42%ofthecare(comparedto12%infamilychildcareand23%inrelativecare).f
38 — the seLf-suffiCieNCY stANDARD foR mARYLAND the seLf-suffiCieNCY stANDARD foR mARYLAND — 39
FortheMaryland2012Standard,infantrates(definedbytheStandardasbirthupto3yearsofage)arecalculatedusingtheaverageofthe75thpercentilecostoflicensedfamilycareratesforinfantsandtoddlers.Maryland’s75thpercentilelicensedcentercareratesareusedtocalculatechildcarecostsforpreschoolers(definedas3to5yearsofagebytheStandard).Costsforschool-agechildrenarebasedonschoolyear75thpercentilelicensedcentercarerates(definedas6to12yearsbytheStandard).
DAtA souRCes
Child Care Costs. MarylandFamilyNetwork,“CostofCareReport,”October2011,personalcommunicationwithArnaGriffith,DirectorLOCATE:ChildCare,MarylandFamilyNetwork(October10,2011).
fooDAlthoughtheSupplementalNutritionAssistanceProgram(SNAP,formerlytheFoodStampProgram)usestheU.S.DepartmentofAgriculture(USDA)ThriftyFoodPlantocalculatebenefits,theStandardusestheLow-CostFoodPlanforfoodcosts.WhilebothoftheseUSDAdietsweredesignedtomeetminimumnutritionalstandards,SNAP(whichisbasedontheThriftyFoodPlan)isintendedtobeonlyatemporarysafetynet.g
TheLow-CostFoodPlanis25%higherthantheThriftyFoodPlan,andisbasedonmorerealisticassumptionsaboutfoodpreparationtimeandconsumptionpatterns,whilestillbeingaveryconservativeestimateoffoodcosts.Forinstance,theLow-CostFoodPlandoesnotallowforanytake-out,fast-food,orrestaurantmeals,eventhough,accordingtotheConsumerExpenditureSurvey,theaverageAmericanfamilyspendsabout41%oftheirfoodbudgetonfoodpreparedawayfromhome.h
TheUSDALow-CostFoodPlanvariesbymonthanddoesnotgiveanannualaveragefoodcost,sotheStandardfollowstheSNAPprotocolofusingJunedataofthecurrentyeartorepresenttheannualaverage.The2012MarylandStandardusesdataforJune2011.
BoththeLow-CostFoodPlanandtheStandard’sbudgetcalculationsvaryfoodcostsbythenumberandagesofchildrenandthenumberandgenderofadults.TheStandardassumesthatasingle-personhouseholdisone
adultfemaleandatwo-parenthouseholdisassumedtoincludeoneadultfemaleandoneadultmale.
Within-stategeographicdifferencesinfoodcostsfortheMarylandStandardarevariedusingtheACCRACostofLivingIndex,publishedbytheCouncilforCommunityandEconomicResearch,anddatafromtheU.S.DepartmentofAgricultureEconomicResearchServicebasedontheQualityFood-at-HomePriceDatabase(QFAHPD).
TheACCRAgroceryindexisstandardizedtopricegroceryitemsregardlessoftheshopper’ssocio-economicstatus.TheACCRA2010annualaveragecostofgroceriesindexisappliedtotwourbanareasinMaryland:theBaltimore-TowsonmetropolitanareaandtheBethesda-Gaithersburg-Frederickmetropolitandivision.
TheQFAHPDprices52separatefoodgroupsin35marketgroupsthatcoverall48contiguousStates.UsingtheQFAHPD,theUSDAEconomicResearchServicepricedoutthecostoftheThriftyFoodPlanforafamilyoffourineachofthe35marketgroupsfrom2002-2006.CountiesnotincludedintheACCRAurbanareaslistedaboveareappliedaratiobasedonthisdatafromtheEconomicResearchService.
DAtA souRCes
Food Costs. U.S.DepartmentofAgriculture,CenterforNutritionPolicyandPromotion,“OfficialUSDAFoodPlans:CostofFoodatHomeatFourLevels,U.S.Average,June2011,”http://www.cnpp.usda.gov/Publications/FoodPlans/2011/CostofFoodJun11.pdf(accessedJuly27,2011).
ACCRA County-Level Food Cost Ratio. CouncilforCommunityandEconomicResearch,ACCRA,“ACCRACostofLivingIndex:2010AnnualAverageSection2Index,”http://www.c2er.org(accessedMay31,2011).
USDA County-Level Food Cost Ratio. “ThriftyFoodPlanbyMarketGroup,”U.S.DepartmentofAgriculture,EconomicResearchService,PersonalCommunicationwithChristianGregory,ResearchEconomist,[email protected](receivedMay24,2011).JessicaTodd,LisaMancino,EphraimLeibtag,&ChristinaTripodo,“MethodologyBehindtheQuarterlyFood-at-HomePriceDatabase,”TechnicalBulletinNo.1926,U.S.Departmentof
38 — the seLf-suffiCieNCY stANDARD foR mARYLAND the seLf-suffiCieNCY stANDARD foR mARYLAND — 39
Agriculture,EconomicResearchService,April2010,http://www.ers.usda.gov/Publications/TB1926/(accessedAugust3,2011).
tRANsPoRtAtioNPuBLiC tRANsPoRtAtioN. Ifthereisan“adequate”publictransportationsysteminagivenarea,itisassumedthatworkersusepublictransportationtogettoandfromwork.Apublictransportationsystemisconsidered“adequate”ifitisusedbyasubstantialpercentageoftheworkingpopulationtocommutetowork.AccordingtoastudybytheInstituteofUrbanandRegionalDevelopment,UniversityofCalifornia,ifabout7%ofthetotalpublicusespublictransportationtocommutetoworkthat“translates”toapproximately30%ofthelow-andmoderate-incomepopulation.iTheStandardassumesprivatetransportation(acar)wherepublictransportationusetocommutetoworkislessthan7%.InMaryland,publictransportationisassumedforBaltimoreCity,MontgomeryCounty,andPrinceGeorge’sCountybasedoncommutingdatafromthe2007-2009AmericanCommunitySurvey.
Thecostofpublictransportationiscalculatedassumingwithincountytravel.InBaltimoreCitythecostperadultisbasedonanunlimitedusezone1commuterbuspassfromtheMarylandTransitAuthority.InbothMontgomeryandPrinceGeorge’scountiesthecostperadultiscalculatedasthemonthlypricecalculatedfordailycommutetripsthroughWashingtonMetropolitanTransitArea.CommutetripsarecalculatedassumingthedailyuseofbothMetroRailandMetroBustoandfromworkduringpeakhourswiththeuseofasmartcard(enablesadiscountontransfersbetweenrailandbus).
PRiVAte tRANsPoRtAtioN. Forprivatetransportation,theStandardassumesthatadultsneedacartogettoandfromwork.Privatetransportationcostsarebasedontheaveragecostsofowningandoperatingacar.Onecarisassumedforhouseholdswithoneadultandtwocarsareassumedforhouseholdswithtwoadults.Itisunderstoodthatthecar(s)willbeusedtocommutetoandfromworkfivedaysperweek,plusonetripperweekforshoppinganderrands.Inaddition,oneparentineachhouseholdwithyoungchildrenisassumedtohaveaslightlylongerweekdaytriptoallowfor“linking”tripstoadaycaresite.Per-miledrivingcosts(e.g.,gas,oil,tires,andmaintenance)arefrom
theAmericanAutomobileAssociation.Thecommutingdistanceiscomputedfromthe2009NationalHouseholdTravelSurvey(NHTS).
TheautoinsurancepremiumistheaveragepremiumcostforagivenstatefromtheNationalAssociationofInsuranceCommissioners(NAIC)2008StateAveragesExpendituresandPremiumsforPersonalAutomobileInsurance.Tocreatewithinstatevariation(regionalorcounty)inautoinsurancepremiums,ratiosarecreatedusingsamplepremiumsfromthetopmarketsharecompaniesinMaryland.InMaryland,ratioswerecreatedusingquotesfromtheMarylandInsuranceAdministration’s2011reportAuto Insurance: A Comparison Guide to Rates.
Thefixedcostsofcarownershipsuchasfire,theft,propertydamageandliabilityinsurance,license,registration,taxes,repairs,monthlypayments,andfinancechargesarealsoincludedinthecostofprivatetransportationfortheStandard.However,theinitialcostofpurchasingacarisnot.Fixedcostsarefromthe2010ConsumerExpenditureSurveydataforfamilieswithincomesbetweenthe20thand40thpercentilelivingintheCensusSouthregionoftheU.S.Autoinsurancepremiumsandfixedautocostsareadjustedforinflationusingthemostrecentandarea-specificConsumerPriceIndex.
DAtA souRCes
Public Transportation Use. BaltimoreCity:MarylandTransitAuthority,PassStore,https://mta.maryland.gov/pass-store(accessedSeptember23,2011).MontgomeryandPrinceGeorge’scounties:WashingtonMetropolitanTransitArea,MetroBusandMetroRailFares,http://www.wmata.com/fares/(accessedSeptember23,2011).
Auto Insurance Premium. NationalAssociationofInsuranceCommissioners,“AverageExpendituresforAutoInsurancebyState,2008,”InsuranceInformationInstitute,http://www.iii.org/media/facts/statsbyissue/auto(accessedOctober17,2011).
County-Level Insurance Premium.MarylandInsuranceAdministration,“AutoInsurance,AComparisonGuidetoRates,”http://www.mdinsurance.state.md.us/sa/docs/documents/consumer/publicnew/autorateguide8-11complete.pdf.
40 — the seLf-suffiCieNCY stANDARD foR mARYLAND the seLf-suffiCieNCY stANDARD foR mARYLAND — 41
Market Share. MarylandInsuranceAdministration,“2010ReportontheEffectofCompetitiveRatingontheInsuranceMarketsofMaryland,”http://www.msa.md.gov/megafile/msa/speccol/sc5300/sc5339/000113/013000/013718/unrestricted/20110545e.pdf(accessedSeptember23,2011).
Distance to Work. U.S.DepartmentofTransportation,2009NationalHouseholdTransportationSurvey,“AveragePersonTripLength(TripPurpose:to/fromWork),”OnlineAnalysisTools,http://www.nhts.ornl.gov(accessedSeptember23,2011).
Fixed Auto Costs.CalculatedandadjustedforregionalinflationusingBureauofLaborStatisticsdataqueryfortheConsumerExpenditureSurvey.U.S.DepartmentofLabor,BureauofLaborStatistics,“OtherVehicleExpenses,”ConsumerExpenditureSurvey2010,CEDatabases,http://www.bls.gov/data/(accessedOctober17,2011).
Per Mile Costs. AmericanAutomobileAssociation,“YourDrivingCosts,”2011Edition,AAAAssociationCommunication,http://www.aaaexchange.com/Assets/Files/201145734460.DrivingCosts2011.pdf(accessedApril15,2011).
Inflation.U.S.DepartmentofLabor,BureauofLaborStatistics,“ConsumerPriceIndex–AllUrbanConsumers,U.S.cityaverage,”ConsumerPriceIndex,CPIDatabases,http://www.bls.gov/cpi/home.htm(accessedOctober17,2011).
heALth CAReTheStandardassumesthatanintegralpartofaSelf-SufficiencyWageisemployer-sponsoredhealthinsuranceforworkersandtheirfamilies.InMaryland,76%ofnon-elderlyindividualsinhouseholdswithatleastonefull-timeworkerhaveemployer-sponsoredhealthinsurance(nationally68%haveemployersponsoredhealthinsurance).oThefull-timeworker’semployerpaysanaverageof78%oftheinsurancepremiumfortheemployeeand73%forthefamilyinMaryland.Nationally,theemployerpays80%oftheinsurancepremiumfortheemployeeand73%oftheinsurancepremiumforthefamily.j
HealthcarepremiumsareobtainedfromtheMedicalExpenditurePanelSurvey(MEPS),InsuranceComponentproducedbytheAgencyforHealthcareResearchand
Quality,CenterforFinancing,Access,andCostTrends.TheMEPShealthcarepremiumsaretheaverageemployment-basedhealthpremiumpaidbyastate’sresidentsforasingleadultandforafamily.InMarylandtheaveragemonthlypremiumpaidbytheemployeeis$90forasingleadultand$311forafamily.ThepremiumcostsarethenadjustedforinflationusingtheMedicalCareServicesConsumerPriceIndex.
Tovarypremiumcostsbycountyorregionswithinthestate,theStandardusesaveragepremiumsfromthehealthcareinsurancecompanieswiththelargestmarketsharesorwiththewidestcoverage.Forthe2012MarylandStandardvariationacrossthestateinthecostofhealthinsurancewascalculatedusingsamplepremiumsfortheMaryland’sComprehensiveStandardHealthBenefitPlanobtainedfromtheMarylandInsuranceAdministration’s2011guide,Health Care for Small Employers (With Sample Premiums).
Healthcarecostsalsoincluderegionalout-of-pocketcostscalculatedforadults,infants,preschoolers,school-agechildren,andteenagers.Dataforout-of-pockethealthcarecosts(byage)arealsoobtainedfromtheMEPS,adjustedbyCensusregionusingtheMEPSHouseholdComponentAnalyticalTool,andadjustedforinflationusingtheMedicalCareConsumerPriceIndex.
NotethatalthoughtheStandardassumesemployer-sponsoredhealthcoverage,notallworkershaveaccesstoaffordablehealthinsurancecoveragethroughtheiremployers.Thosewhodonothaveaccesstoaffordablehealthinsurancethroughtheiremployersmusteitherpurchasetheirowncoverageordowithouthealthinsurance.Whenanindividualorafamilycannotaffordtopurchasehealthcoverage,anillnessorinjurycanbecomeaveryseriousfinancialcrisis.Likewise,aserioushealthconditioncanmakeitextremelyexpensivetopurchaseindividualcoverage.However,in2014thePatientProtectionandAffordableCareActwillrequireindividualswhocanaffordittoeitherobtainminimalhealthinsuranceorcontributeafeetowardsthecostsofuninsuredAmericans.kBy2014theAffordableCareActwillalsoprohibitalldiscriminationagainstpre-existingconditions;and,inthemeantime,statescanopttoparticipateinaPre-ExistingConditionInsurancePlan,whichprovidescoverageoptionsforpeoplewhohavebeenwithouthealthinsuranceforsixmonthsduetoapre-existingcondition.l
40 — the seLf-suffiCieNCY stANDARD foR mARYLAND the seLf-suffiCieNCY stANDARD foR mARYLAND — 41
tReAtmeNt of tAx CReDits iN moDeLiNG tABLe AND fiGuReThe Standard shows refundable and nonrefundable tax credits as if they are received monthly. However, for the
work supports modeled in Table 6 (Columns # 2–#6), the refundable federal Earned Income Tax Credit (EITC), and the
“additional” refundable portion of the Child Tax Credit (CTC), are shown as received annually. However, the Child Care
Tax Credit (CCTC) is nonrefundable, meaning it can only be used to reduce taxes and does not contribute to a tax
refund. Therefore, it is shown as a monthly credit against federal taxes in both the Self-Sufficiency Standard and in the
modeling columns of Table 6.
The tax credits are calculated this way in Table 6 in order to be as realistic as possible. Until recently, a family
could receive part of their EITC on a monthly basis (called Advance EITC), but many workers preferred to receive it
annually as a lump sum. In fact, nearly all families received the EITC as a single payment the following year when they
filed their tax returns.a Many families preferred to use the EITC as “forced savings” to pay for larger items that are
important family needs, such as paying the security deposit for housing, buying a car, or settling debts.b Therefore, in
Columns #2-#6 of Table 6, the total amount of the refundable federal EITC the family would receive annually (when
they file their taxes) are shown in the shaded rows at the bottom of the table instead of being shown monthly as in the
Self-Sufficiency Standard column. This is based on the assumption that the adult works at this same wage, full-time, for
the year.
Like the EITC, the federal CTC is shown as received monthly in the Self-Sufficiency Standard. However, for the modeled
work support columns, the CTC is split into two amounts with only the portion that can be used to offset any remaining
(after the CCTC) taxes owed shown monthly, while the “additional” refundable portion of the CTC is shown as a lump
sum received annually in the shaded rows at the bottom of Table 6.
a. Some workers may have been unaware of the advance payment option, and others may had employers who did not participate. Also, research has shown that families make financial decisions based on receipt of the EITC (together with tax refunds) when they file their taxes early in the following year. Jennifer Romich and Thomas Weisner, “How Families view and Use the EITC: The Case for Lump-Sum Delivery,” National Tax Journal, 53(4) (part 2) (2000): 1107-1134; hereafter cited as How Families view and Use the EITC.
b. How Families view and Use the EITC.
DAtA souRCes
Out-of-Pocket Costs. U.S.DepartmentofHealthandHumanServices,AgencyforHealthcareResearchandQuality,CenterforFinancing,Access,andCostTrends,MedicalExpenditurePanelSurvey-HouseholdComponentAnalyticalTool,“TotalAmountPaidbySelf/Family,allTypesofService,2008,”MEPSnetHC,http://www.meps.ahrq.gov/mepsweb/data_stats/MEPSnetHC.jsp(accessedJune2,2011).
Premiums. U.S.DepartmentofHealthandHumanServices,AgencyforHealthcareResearchandQuality,CenterforFinancing,Access,andCostTrends,“TablesII.C.2andII.D.2:AverageTotalEmployeeContribution(inDollars)perEnrolledEmployeeforSingle/FamilyCoverageatPrivate-SectorEstablishmentsthatOfferHealthInsurancebyFirmSizeandState,UnitedStates,2010,”
MedicalExpenditurePanelSurvey-InsuranceComponent,http://www.meps.ahrq.gov/mepsweb/data_stats/quick_tables_results.jsp?component=2&subcomponent=2&year=2010&tableSeries=2&tableSubSeries=CDE&searchText=&searchMethod=1&Action=Search(accessedAugust8,2011).
Inflation.U.S.DepartmentofLabor,BureauofLaborStatistics,“ConsumerPriceIndex–AllUrbanConsumers,U.S.CityAverage,”MedicalCareServices(forpremiums)andMedicalServices(forout-of-pocketcosts),http://www.bls.gov/cpi/(accessedNovember1,2011).
Regional Ratios. MarylandInsuranceAdministration,“HealthCarriersforSmallEmployers(withSamplePremiums),”http://mhcc.maryland.gov/smallgroup/mia_rateguide.pdf(accessedSeptember15,2011).
42 — the seLf-suffiCieNCY stANDARD foR mARYLAND the seLf-suffiCieNCY stANDARD foR mARYLAND — 43
misCeLLANeousThisexpensecategoryconsistsofallotheressentialsincludingclothing,shoes,paperproducts,diapers,nonprescriptionmedicines,cleaningproducts,householditems,personalhygieneitems,andtelephoneservice.
Miscellaneousexpensesarecalculatedbytaking10%ofallothercosts.Thispercentageisaconservativeestimateincomparisontoestimatesinotherbasicneedsbudgets,whichcommonlyuse15%andaccountforothercostssuchasrecreation,entertainment,savings,ordebtrepayment.m
tAxesTaxescalculatedintheStandardincludefederalandstateincometax,payrolltaxes,andstateandlocalsalestaxwhereapplicable.FederalpayrolltaxesforSocialSecurityandMedicarearecalculatedat7.65%ofeachdollarearned.Althoughthefederalincometaxrateishigherthanthepayrolltaxrate,federalexemptionsanddeductionsaresubstantial.Asaresult,whilepayrolltaxispaidoneverydollarearned,mostfamilieswillnotowefederalincometaxonthefirst$10,000to$15,000ormore,thusloweringtheeffectivefederaltaxratetoabout7%forsomefamilytypes.Whenapplicable,incometaxcalculationsfortheStandardincludestateandlocalincometax.InMaryland,stateincometaxesvarybetween2%and6.25%dependingonincome.Additionally,Marylandhaslocalincometaxesthatvarybetween1.215%and3.2%.
Indirecttaxes(e.g.,propertytaxespaidbythelandlordonhousing)areassumedtobeincludedinthepriceofhousingpassedonbythelandlordtothetenant.Taxesongasolineandautomobilesareincludedinthecalculatedcostofowningandrunningacar.
Marylandhasa6%statesalesandusetax.
DAtA souRCes
Federal Income Tax. InternalRevenueService,“1040Instructions,”http://www.irs.gov/pub/irs-pdf/i1040gi.pdf(accessedApril21,2011).InternalRevenueService,“RevenueProcedure2011-12,”http://www.irs.gov/pub/irs-drop/rp-11-12.pdf(accessedApril21,2011).
State Income Tax. ComptrollerofMaryland,“Maryland2010StateandLocalTaxForms&Instructions,”http://
forms.marylandtaxes.com/current_forms/Resident_booklet.pdf(accessed0915/11).
State Sales and Use Tax.ComptrollerofMaryland,SpotlightonMarylandTaxes,“SalesandUseTax,”http://individuals.marylandtaxes.com/usetax/default.asp(accessedSeptember15,2011).
tAx CReDits
TheStandardincludesfederaltaxcredits(theEarnedIncomeTaxCredit,theChildCareTaxCredit,andtheChildTaxCredit)andapplicablestatetaxcredits.TaxcreditsareshownasreceivedmonthlyintheStandard.
The Earned Income Tax Credit(EITC),orasitisalsocalled,theEarnedIncomeCredit,isafederaltaxrefundintendedtooffsetthelossofincomefrompayrolltaxesowedbylow-incomeworkingfamilies.TheEITCisa“refundable”taxcredit,meaningworkingadultsmayreceivethetaxcreditwhetherornottheyoweanyfederaltaxes.Marylandhasanonrefundableandpartiallyrefundableearnedincometaxcreditatthestateandlocallevel.
The Child Care Tax Credit (CCTC),alsoknownastheChildandDependentCareTaxCredit,isafederaltaxcreditthatallowsworkingparentstodeductapercentageoftheirchildcarecostsfromthefederalincometaxestheyowe.LiketheEITC,theCCTCisdeductedfromthetotalamountofmoneyafamilyneedstobeself-sufficient.UnliketheEITC,thefederalCCTCisnotarefundablefederaltaxcredit;thatis,afamilymayonlyreceivetheCCTCasacreditagainstfederalincometaxesowed.Therefore,familieswhooweverylittleornothinginfederalincometaxeswillreceivelittleornoCCTC.In2011,upto$3,000inchildcarecostswasdeductibleforonequalifyingchildandupto$6,000fortwoormorequalifyingchildren.MarylandalsohasastateCCTC.
The Child Tax Credit (CTC)isliketheEITCinthatitisarefundablefederaltaxcredit.In2011,theCTCprovidedparentswithadeductionof$1,000foreachchildunder17yearsold,or15%ofearnedincomeover$3,000,whicheverwasless.FortheStandard,theCTCisshownasreceivedmonthly.
MarylandalsohasaStateandLocalPovertyLevelCreditforfamilieswithincomesbelowthefederalpovertylevel
42 — the seLf-suffiCieNCY stANDARD foR mARYLAND the seLf-suffiCieNCY stANDARD foR mARYLAND — 43
andarenter’screditforlow-incomefamilieswithdependentchildren.
DAtA souRCes
Federal Child Care Tax Credit.InternalRevenueService,“Publication503.ChildandDependentCareExpenses,”http://www.irs.gov/pub/irs-pdf/p503.pdf(accessedApril21,2011).
Federal Child Tax Credit.InternalRevenueService,“Publication972.ChildTaxCredit,”http://www.irs.gov/pub/irs-pdf/p972.pdf(accessedApril21,2011).U.S.LibraryofCongress,Thomas,“TitleV:AdditionalTaxReliefandOtherTaxProvisions,Sec.501,”http://thomas.loc.gov/(accessedApril21,2011).
Federal Earned Income Tax Credit. InternalRevenueService,“Publication596.EarnedIncomeCredit,”http://www.irs.gov/pub/irs-pdf/p596.pdf(accessedApril21,2011).InternalRevenueService,“EITCforIndividuals.EITCthresholdsandtaxlawupdates,”http://www.irs.gov/individuals/article/0,,id=150513,00.html(April21,2011).InternalRevenueService,“RevisedProcedures2009-50,Section3.2010AdjustedItems,”Publications,Indexofpub/irs-pub/,Administrative,Procedural,andMisc.,http://www.irs.gov/pub/irs-drop/rp-09-50.pdf(April21,2011).
Federal Tax Credits (General). InternalRevenueService,“1040Instructions,”http://www.irs.gov/pub/irs-pdf/i1040gi.pdf(accessedApril21,2011).
Maryland Tax Credits.ComptrollerofMaryland,“Maryland2010StateandLocalTaxForms&Instructions,”http://forms.marylandtaxes.com/current_forms/Resident_booklet.pdf(accessedSeptember15,2011).
eNDNotes foR APPeNDix Aa.U.S.HousingandUrbanDevelopment,“FairMarketRentsfortheSection8HousingAssistancePaymentsProgram,”DataSets,FairMarketRents:Overview(2007),http://www.huduser.org/datasets/fmr/fmrover_071707R2.doc(accessedAugust17,2010).
b.U.S.GovernmentPrintingOffice,GPOAccess,“Section9.ChildCare,”108thCongress2004HouseWaysandMeansCommitteeGreenBook,Search:ChildCare,http://www.gpoaccess.gov/wmprints/search2.html(accessedAugust17,2010).
c.JeffreyCapizzanoetal.,“ChildCareArrangementsforChildrenunderFive:VariationacrossStates,”TheUrbanInstitute,NewFederalism:NationalSurveyofAmerica’sFamiliesSeriesB,No.B-7(March2007)p.8,http://www.urban.org/url.cfm?ID=309438
(accessedAugust17,2010);hereaftercitedasChildCareArrangements.Capizzanonotesina2004reportanalyzingupdatedNationalSurveyofAmerica’sFamiliesdata“…thereseemstohavebeenlittlechangeinthedistributionofchildcarearrangementsamongbothlow-andhigher-incomefamiliesfrom1999to2002.”JeffreyCapizzanoandGinaAdams,“ChildreninLow-IncomeFamiliesAreLessLikelytoBeinCenter-BasedChildCare,”TheUrbanInstitute,SnapshotsofAmerica’sFamiliesIIIno.16(2004)p.2,http://www.urban.org/url.cfm?ID=310923(accessedAugust17,2010);hereaftercitedasChildreninLow-IncomeFamilies.
d.ChildCareArrangementsandChildreninLow-IncomeFamilies.
e.ChildCareArrangements,p.8.
f.ChildCareArrangements,p.8.
g.FoodResearchandActionCenter,“SNAP/FoodStamps,”FederalFood/NutritionPrograms,http://frac.org/federal-foodnutrition-programs/snapfood-stamps/(accessedDecember13,2010).
h.U.S.DepartmentofLabor,BureauofLaborStatistics,“ConsumerExpendituresin2010,”EconomicNewsRelease,http://www.bls.gov/news.release/cesan.nr0.htm(accessedNovember10,2011).
i.ChrisPorterandElizabethDeakin,SocioeconomicandJourney-to-workData:ACompendiumforthe35LargestU.S.MetropolitanAreas(Berkeley:InstituteofUrbanandRegionalDevelopment,UniversityofCalifornia,1995).
j.TheHenryJ.KaiserFoundationStateHealthFactsOnline,“Maryland:Employer-SponsoredCoverageRatesfortheNonelderlybyFamilyWorkStatus,States(2008-2009),U.S.(2009),”HealthCoverageandtheUninsured(2008-2009),http://www.statehealthfacts.org/profileind.jsp?rgn=49&cat=3&ind=150(accessedOctober17,2011).
k.OfficeoftheLegislativeCounsel,111thCongress2ndSession,CompilationofPatientProtectionandAffordableCareAct,“RequirementtoMaintainMinimumEssentialCoverage,”Part1IndividualResponsibility,Section1501,pg143,http://docs.house.gov/energycommerce/ppacacon.pdf(accessedAugust31,2010).
l.OfficeoftheLegislativeCounsel,111thCongress2ndSession,CompilationofPatientProtectionandAffordableCareAct,“ImmediateAccesstoInsuranceforUninsuredAmericanswithaPreexistingCondition,”Title1—Quality,AffordableHealthCareforAllAmericans,Section1101,pg30,http://docs.house.gov/energycommerce/ppacacon.pdf(accessedAugust31,2010).
m.ConstanceF.CitroandRobertT.Michael,eds.,MeasuringPoverty:ANewApproach(Washington,DC:NationalAcademyPress,1995),http://www.census.gov/hhes/poverty/povmeas/toc.html(accessedAugust12,2010).
44 — the seLf-suffiCieNCY stANDARD foR mARYLAND the seLf-suffiCieNCY stANDARD foR mARYLAND — 45
TheStandardisatoolthatcanbeusedacrossawidearrayofsettingstobenchmark,evaluate,educate,andilluminate.Belowweprovidespecificexamplesofsomeoftheseuses—withreferencesandwebsiteaddresses—sothatyoucanexploretheseusesaswellascontactprogramsandpersonswhohaveappliedtheSelf-SufficiencyStandardintheirwork.
AssessmeNt of PuBLiC PoLiCY oPtioNsThe Self-Sufficiency Standard has been used as a tool to evaluate the impact of current and proposed policy changes.Asinthemodelingtablesinthisreport,theStandardcanbeusedtoevaluatetheimpactofavarietyofworksupports(SNAP/FoodStampProgram,Medicaid)orpolicyoptions(changesinchildcareco-payments,taxreformortaxcredits)onfamilybudgets.
TheSelf-SufficiencyStandardforMassachusettswas• usedintheCrittentonWomen’sUnion2007report,Unlocking the Doors to Higher Education and Training for Massachusetts’ Working Poor Familiestoadvocatefortuition-freecommunitycollegeeducationandotherwaystoaddressfinancialbarrierstoeducationinMassachusetts,citingtheneedforpost-secondaryeducationandtraininginordertoacquireSelf-SufficiencyWagejobs(seewww.liveworkthrive.org/research_and_tools/reports_and_publications/The_Massachusetts_Working_Poor_Families_Project_Report).
InColorado,theColoradoCenteronLawandPolicy• usedtheColoradoSelf-SufficiencyStandardtodeterminetheimpactofaffordablehousingonfamilystabilityandupwardmobility.Inaddition,theColoradoDivisionofHousingusedinformationfromtheColoradoSelf-SufficiencyStandardinits2002statewidereportHousing Colorado: The Challenge for a Growing State(seehttp://dola.colorado.gov/cdh/researchers/documents/HousingColo02.pdf).
InMaryland,AdvocatesforChildrenandYouthused• theSelf-SufficiencyStandardintheirMaryland Can Do Better for Childrencampaign,athree-yearplantoaddresscriticalneedsofchildrenandtheirfamiliesby2010.
Duringthe2007specialsessionoftheMarylandGeneralAssembly,thecampaignutilizedtheSelf-SufficiencyStandardforeachofMaryland’s24jurisdictionstosuccessfullyadvocateforexpandedRefundableEarnedIncomeTaxCreditsforlow-incomefamilies(seewww.acy.org).
InDecember2005,theHumanServicesCoalitionof• DadeCountyinFloridaissuedapolicybrieftitledNonprofits, Government, and The New War on Poverty: Beating the Odds in a Global Economy,whichusedtheStandardtoexamineFlorida’shumanservicessectorfromaneconomicandcommunityperspective.FormoreinformationontheHumanServicesCoalitionofDadeCounty,seewww.hscdade.org.
InPennsylvania,manygroups,includingPathWaysPA,• haveusedtheStandardtomodeltheimpactofastateEarnedIncomeTaxCreditontheabilityofafamilytoreachself-sufficientwages(seewww.pathwayspa.org).
WhentheOklahomaDepartmentofHumanServices• proposedlargeincreasesinchildcareco-payments,theOklahomaCommunityActionProject(CAP)ofTulsaCountyusedanalysisbasedontheSelf-SufficiencyStandardintheirreport,Increased Child Care Co-Payments Threaten Access to Care for Low Income Families,resultingintheDepartmentrescindingtheproposedincreases.FormoreinformationabouttheworkoftheCommunityActionProjectofTulsaCounty,seewww.captc.org.
eVALuAtioN of eCoNomiC DeVeLoPmeNt PRoPosALsThe Self-Sufficiency Standard has been used to evaluate state and local level economic development proposals.UsingtheStandardcanhelpdetermineifbusinessesseekingtaxbreaksorothergovernmentsubsidieswill,orwillnot,createjobsthatpay“livingwages.”IfthejobstobecreatedpaywagesthatarebelowtheStandardsothattheemployeeswillneedpublicworksupportstobeabletomeettheirbasicneeds,thenewbusinessisessentiallyseekinga“doublesubsidy.”Economicdevelopmentproposalscanbeevaluatedfortheirnetpositiveornegativeeffectonthe
Appendix B: Examples of How the Standard Has Been Used
44 — the seLf-suffiCieNCY stANDARD foR mARYLAND the seLf-suffiCieNCY stANDARD foR mARYLAND — 45
localeconomy,aswellasonthewell-beingofthepotentialworkersandtheirfamilies.
Colorado’sFortCarsonisoneofthefirstmilitarybasesto• considerreviewingitsvendorcontractsusingtheSelf-SufficiencyStandard.Theirsustainabilityplanwouldseekvendorswhopay“livablewages”totheiremployees,asdefinedbytheStandard.
InNebraska,theNebraskaAppleseedCenterhas• developedasetofjobqualitystandardsthatcorporationsshouldfollowpriortoreceivingpublicfunds(seewww.neappleseed.org).
TheDelawareEconomicDevelopmentOfficehasusedthe• DelawareSelf-SufficiencyStandardtoevaluatestrategicfundgrantapplicationsinordertofocusitsresourcesonqualityemploymentgrowth.
tARGetiNG of JoB tRAiNiNG ResouRCesThe Self-Sufficiency Standard has been used to target job training resources.Usingatargetedjobsstrategy,theStandardhelpstomatchjobseekerswithemploymentthatpaysSelf-SufficiencyWages.Throughanevaluationofthelocallabormarketandavailablejobtrainingandeducationinfrastructure,theskillsandgeographiclocationofcurrentorpotentialworkersareevaluatedandjobseekersarematchedtoemploymentwithfamily-sustainingwages.Throughthisanalysisitispossibletodeterminethejobsandsectorsonwhichtotargettrainingandeducationresources.
InWashington,D.C.,theStandardwasusedinthe2000• WorkforceInvestmentActstatute,whichrequiresthattheWorkforceInvestmentBoardtargetjob-trainingdollarsinhigh-growthoccupationsandassessthequalityofthejobsinordertomeetthewageandsupportiveserviceneedsofjobseekers.ToseeamoredetaileddescriptionoftheDistrictofColumbia’sWorkforceInvestmentActgotowww.does.dc.gov/does/cwp/view,a,1233,q,538387.asp.
eVALuAtioN of emPLoYmeNt PRoGRAm outComesThe Self-Sufficiency Standard can be used to evaluate outcomes for clients in a range of employment programs,fromshort-termjobsearchandplacementprogramsto
programsprovidingextensiveeducationorjobtraining.ByevaluatingwageoutcomesintermsoftheStandard,programsareusingameasureoftrueeffectiveness.Suchevaluationscanhelpredirectresourcestoapproachesthatresultinimprovedoutcomesforparticipants.
InWashingtonState,theWorkforceDevelopment• CouncilofSeattle-KingCountyadoptedtheSelf-SufficiencyStandardasitsofficialmeasureofself-sufficiencyandusestheStandardasaprogramevaluationbenchmark.UsingdatacollectedbycaseworkersandtheonlineSelf-SufficiencyStandardCalculator,theCouncildemonstratestheimpactofitseducationandtrainingprogramsontheachievementofself-sufficiencybyitsparticipants.FormoreinformationontheWorkforceDevelopmentCouncilofSeattle-KingCounty,seewww.seakingwdc.org.(Seecasehighlightonpage28.)
UnderitsWorkforceInvestmentAct,theChicago• WorkforceInvestmentBoardadoptedtheSelf-SufficiencyStandardasitsself-sufficiencybenchmark.FormoreinformationonChicago’sWorkforceInvestmentAct,seewww.cityofchicago.org.
TheColoradoCenteronLawandPolicysuccessfully• lobbiedtheEasternRegionalWorkforceBoardinFortMorgan,ColoradotoofficiallyadopttheSelf-SufficiencyStandardtodetermineeligibilityforintensiveand/ortrainingservices(seewww.yourworkforcecenter.com/other/ruralconsortium/other/WIA%205%20YR%20Plan.htm).
tARGetiNG eDuCAtioN ResouRCesThe Self-Sufficiency Standard helps demonstrate the pay-off for investing in education and trainingsuchaspost-secondaryeducationandtraining,includingtrainingforoccupationsthatarenontraditionalforwomenandpeopleofcolor.
Forexample,theMissouriWomen’sCouncilofthe• DepartmentofEconomicDevelopmentusedtheStandardtobeginaprogramforlow-incomewomenthatpromotesnontraditionalcareerdevelopment,leadingtojobspayingSelf-SufficiencyWages.FormoreinformationontheMissouriWomen’sCouncilseewww.womenscouncil.org/about_WC.htm.

46 — the seLf-suffiCieNCY stANDARD foR mARYLAND the seLf-suffiCieNCY stANDARD foR mARYLAND — 47
InCalifornia’sSantaClaraCounty,theSelf-Sufficiency• Standardwasusedinasectoralemploymentinterventionanalysisthatfocusedontheavailabilityofnontraditionaljobs,thegeographicalspreadofthosejobs,theavailabilityoftrainingresources,andwagerates.Theanalysisledtoacurriculumandcounselortrainingpackagethattargetedtransportationjobsandprovided$140,000tothecommunitycollegesystemtoexplorehowtostrengthenpreparationforthesejobs(seewww.insightcced.org).
FollowingthereleaseoftheCrittentonWomen’sUnion• (CWU)2005reportAchieving Success in the New Economy: Which Jobs Help Women Reach Economic Self Sufficiency,CWUhasestablishedanonlineHotJobsforWomenguide.UsingtheSelf-SufficiencyStandardforMassachusetts,theonlineguideassistswomeninidentifyingjobsinhighdemandthatpaySelf-SufficiencyWages,yetrequiretwoyearsorlessinfull-timeeducationortraining(seewww.liveworkthrive.org/research_and_tools/hot_jobs).
InConnecticut,theSelf-SufficiencyStandardhasbeen• adoptedatthestatelevelsince1998.Ithasbeenusedinplanningstate-supportedjobtraining,placementandemploymentretentionprograms,andhasbeendistributedtoallstateagenciesthatcounselindividualsseekingeducation,training,oremployment.Connecticut’sPermanentCommissionontheStatusofWomenregularlyusestheSelf-SufficiencyStandardinlegislativetestimony(seehttp://ctpcsw.com/).
InNewYork,theStandardhasbeenusedinmodeling• servicesforyoungadultsincareereducationtodemonstratehowtheirfuturecareerchoicesandeducationalpathsmightimpacttheirabilitytosupportafuturefamilyortoaddresschangingfamilydynamics.TheStandardhasalsobeenusedinNewYorkforjobreadinessplanningforwomenseekingskilledemployment.
InDelaware,theStandardwasusedtotrainpeoplefrom• thedevelopmentaldisabilitycommunityonhowtoretaintheirbenefitswhenreturningtotheworkforce.
DeteRmiNAtioN of NeeD foR seRViCes The Self-Sufficiency Standard has been used to determine which individuals are eligible and/or most in need of specific support or training services.
Forexample,inVirginia,VoicesforVirginia’sChildren• successfullyadvocatedforthestate’sTANFAuthorizationCommitteetousetheVirginiaSelf-SufficiencyStandardasatoolforsettingeligibilityguidelines.FormoreinformationontheprogramsofVoicesforVirginia’sChildrengotowww.vakids.org/work/fes.htm.
TheConnecticutLegislatureenactedastatestatutethat• identified“theunder-employedworker”asanindividualwithouttheskillsnecessarytoearnawageequaltotheSelf-SufficiencyStandard.Thestatutedirectedstatewideworkforceplanningboardstorecommendfundingtoassistsuchworkers(seewww.larcc.org/documents/mapping_change_2002.pdf).
TheDirectorofHumanResourcesandHumanServices• forNevadaincorporatedtheNevadaSelf-SufficiencyStandardintoNevada’s2005needsprojections.Additionally,theDirectorusedtheStandardintherecommendationsrelatedtocaseloads.
CouNseLiNG tooL foR PARtiCiPANts iN WoRK & tRAiNiNG PRoGRAmsThe Self-Sufficiency Standard has been used as a counseling tool to help participants in work and training programs access benefits and develop strategies to become self-sufficient.Computer-basedcounselingtoolsallowuserstoevaluatepossiblewages,thencompareinformationonavailableprogramsandworksupportstotheirowncostsandneeds.Computer-basedSelf-SufficiencyCalculators,forusebycounselorswithclientsandthepublic,havebeendevelopedforIllinois,NewYork,Oregon,Pennsylvania,WashingtonState,theBayAreainCalifornia,ColoradoandWashington,D.C.Thesetoolsintegrateawidevarietyofdatanotusuallybroughttogether,allowingclientstoaccessinformationaboutthebenefitsofvariousprogramsandworksupportsthatcanmovethemtowardsself-sufficiency.Throughonlinecalculators,clientsareempoweredwith
46 — the seLf-suffiCieNCY stANDARD foR mARYLAND the seLf-suffiCieNCY stANDARD foR mARYLAND — 47
informationandtoolsthatallowthemtodevelopandtestouttheirownstrategiesforachievingself-sufficientincomes.
Forexample,inWashingtonState,astatewideSelf-• SufficiencyCalculatorisusedacrossworkforcecouncilsasacounselingtoolandcanbeviewedatwww.thecalculator.org(seecasehighlightonpage28).Additionally,theSnohomishCountyWorkforceDevelopmentCouncilinWashingtonhasdevelopedaself-sufficiencymatrixthatisusedincasemanagement.Theself-sufficiencymatrixcanbeusedasacasemanagementtool,aself-assessmenttool,ameasurementtool,andacommunicationtool.Thematrixiscomposedof25keyoutcomescales(e.g.,employmentstability,education,Englishlanguageskills,lifeskills,andchildcare).Thescalesarebasedonacontinuumof“incrisis”to“thriving.”Thecasemanagerworkswiththecustomertoscorethescalesandmonitorprogress.Tolearnmoreaboutthematrix,pleasevisitwww.worksourceonline.com/js/documents/Instructions.pdf.
PathWaysPAoffers• The Pennsylvania Online Training and Benefits Eligibility Tool,aninteractivecareer-counselingtoolbasedonthe2010PennsylvaniaSelf-SufficiencyStandard.Theonlinecounselingtoolcanbeusedbycounselorsandclientstotesttheabilityofvariouswagestomeetafamily’sself-sufficiencyneeds,aswellaswhattrainingprogramstheymightbeeligibleforattheircurrentwage.Thistoolalsoallowsclientstoapplyforbenefitsimmediatelyorforcounselorstodosoonaclient’sbehalf.The Pennsylvania Online Training and Benefits Eligibility Toolcanbefoundatwww.pathwayspa.org.
TheOregon• Prosperity Planner,acalculatorbasedonthe2011OregonSelf-SufficiencyStandardcanbefoundatwww.prosperityplanner.org.
TheDenverCountyOfficeofEconomicDevelopment,• DivisionofWorkforceDevelopmentusestheSelf-SufficiencyStandardaswellastheColoradoEconomicSelf-SufficiencyStandardCalculatortoinformparticipantsaboutthecareerchoicesthatwillmovethemtowardeconomicself-sufficiency.TheWorkplaceCenterattheCommunityCollegeofDenverutilizestheColoradoEconomicSelf-SufficiencyStandard
Calculatortocounselparticipantsoncareerchoices,realwagedeterminationandavoidingpotentialobstaclestoeconomicself-sufficiencysuchasthesystemic“cliffeffect”builtintomanyworksupportprograms.TheColoradoCenteronLawandPolicyhoststheColoradoSelf-SufficiencyCalculatoratwww.coloradoselfsufficiencystandardcalculator.org/ColoradoCalculator/Home.aspx.
VirginiaKidsdeveloped• The Self-Sufficiency Standard for Virginia – Budget Worksheet Exerciseasacounselingtool(seehttp://www.vakids.org/pubs/FES/budget_worksheet_exercise.htm).
IntheD.C.MetropolitanArea,WiderOpportunitiesfor• WomendevelopedandpilotedaTeenCurriculumbasedontheStandardthateducatesadolescentsaboutcareerchoices,lifedecisions,andself-sufficiency(seewww.wowonline.org).Additionally,theWashington,D.C.MetroAreaSelf-SufficiencyCalculatorcanbefoundatwww.dcmassc.org.
InNewYorktheWomen’sCenterforEducationand• CareerAdvancementhasusedtheStandardtotraincounselorstobettercommunicateideasaboutSelf-Sufficiencyandeconomicissueswiththeirclientsandassessbenefiteligibility.TheWomen’sCenterforEducationandCareerAdvancementalsohostsanonlineSelf-SufficiencyCalculatorfortheCityofNewYork.TheCalculatorfortheCityofNewYorkcanbeaccessedatwww.wceca.org/index.html.
TheSocialImpactResearchCenterattheHeartland• AllianceforHumanNeedsandHumanRightshostsThe Illinois Self-Sufficiency Calculatoratwww.ilcalculator.org/.
TheCaliforniaBayAreaSelf-SufficiencyCalculator,• The Calculator,canbefoundatwww.insightcced.org/index.php/insight-communities/cfess/calculator.
PuBLiC eDuCAtioNThe Self-Sufficiency Standard has been used as a public education tool.Asaneducationtool,theStandardhelpsthepublicatlargeunderstandwhatisinvolvedinmakingthetransitiontoself-sufficiency.ForemployerstheStandardcanbeusedtodemonstratetheimportanceofproviding

48 — the seLf-suffiCieNCY stANDARD foR mARYLAND the seLf-suffiCieNCY stANDARD foR mARYLAND — 49
benefits,especiallyhealthcare,whichhelpfamiliesmeettheirneeds.Asaneducationtoolforserviceproviders,theStandardcanshowhowthevariouscomponentsofsocialservicesfittogether,helpingtofacilitatethecoordinationofarangeofservicesandsupports.Forpolicymakersandlegislators,theStandardasaneducationtoolshowsboththeneedforandtheimpactofworksupportprogramsonlow-wageworkers’familybudgets.
Forexample,VoicesforUtahChildrendistributed• copiesoftheUtahSelf-SufficiencyStandardtostatelegislatorsandcandidatesduringthe2003legislativesessiontoframeadiscussionaboutincreasingfundingforUtah’sChildren’sHealthInsuranceProgram.FormoreinformationonVoicesforUtahChildrengotowww.utahchildren.org.
InSeattle,bookmarksweredistributedduringtherunof• aplaybasedonNickel and Dimed: On (Not) Getting By in America,abookbyBarbaraEhrenreichthatexploresthestrugglesconfrontedbylow-wageworkers.AcomputerwithamockwebsiteallowedparticipantstoentertheirincomesandcomparethemtotheStandardandbegintounderstandtheplightofworkingfamilies.
MassFESS(hostedbytheCrittentonWomen’sUnion)• developedanEconomicSelf-SufficiencyStandardCurriculumthatcanbeusedbyorganizationstosupporttheirworkincareerdevelopment,education/training,economicliteracy,livingwagecampaigns,andothertypesofcommunityorganizing,policymakingandadvocacyefforts.ForinformationontheCrittentonWomen’sUnion,seewww.liveworkthrive.org.
InaninitiativestartedattheUniversityofWashington• SchoolofSocialWork,policymakersparticipateinthe“Walk-A-Mile”program,wherethey“walk”intheshoesofwelfarerecipientsbylivingonaSNAPbudgetforonemonth.TheWashingtonStandardwasusedtodevelopeducationaltoolsusedbypolicymakersabouttheimpactofbenefitsonfamilybudgets.
TheWisconsinWomen’sNetworkdistributedthe• WisconsinSelf-SufficiencyStandardtoitsmanyandvariedwomen’scoalitionmembers,manyofwhomcontinuetofindausefortheStandardintheiradvocacywork.TheWisconsinWomen’sNetworkwebsitecanbeaccessedatwww.wiwomensnetwork.org.
CReAte GuiDeLiNes foR WAGe-settiNGThe Self-Sufficiency Standard has been used as a guideline for wage-setting.Bydeterminingthewagesnecessarytomeetbasicneeds,theStandardprovidesinformationforsettingwagestandards.
Forexample,VanderbiltUniversityinTennesseeusesthe• Standardtoeducateemployeesandadministratorsabouttheneedtoincreasethetake-homepayofservicestaff.Formoreinformationgotohttp://studentorgs.vanderbilt.edu/students4livingwage/info.php.
Employersandeducationalinstitutionshaveusedthe• Self-SufficiencyStandardtosetorganizationalwagestandardsinColorado.TheintroductionoftheSelf-SufficiencyStandardinPitkinCounty,Coloradohasencouragedcountycommissionersanddirectorstoreviewcurrentpayscalesandworksupportpolicies.
TheStandardhasbeenusedinCalifornia,Illinois,New• York,NewJersey,Hawaii,Nebraska,SouthDakota,Tennessee,Virginia,andWashingtonStatetoadvocateforhigherwagesthroughLivingWageordinancesandinnegotiatinglaborunionagreements(seewww.ncsl.org/default.aspx?tabid=13394).
AttherequestofthestateofCalifornia,theCenterforthe• ChildCareWorkforceusedtheSelf-SufficiencyStandardin2002todevelopspecificsalaryguidelinesbycounty(seewww.ccw.org/data.html).
InMaryland,theCenterforPovertySolutionsand• AdvocatesforChildrenandYouth(amongotherorganizations)proposedstatelegislationthatwouldrequiretheMarylandSecretaryofBudgetandManagementtoconsideraspecifiedSelf-SufficiencyStandardwhensettingoramendingapayrateandrequirethatastateemployeewhosepayrateislessthantheSelf-SufficiencyStandardreceiveaspecifiedpayincrease.FormoreinformationonAdvocatesforChildrenandYouth,seewww.acy.org.
InCalifornia,theNationalEconomicDevelopmentand• LawCenter(nowtheInsightCenterforCommunityEconomicDevelopment,orInsightCCED)usedtheSelf-SufficiencyStandardinawageanalysisofUniversityofCaliforniaserviceworkers,entitledHigh Ideals, Low
48 — the seLf-suffiCieNCY stANDARD foR mARYLAND the seLf-suffiCieNCY stANDARD foR mARYLAND — 49
Pay.TheStandardwasusedtoassessthedegreetowhichUniversityofCaliforniaserviceworkers’wagesaresufficienttoprovidethebasicneedsforemployeesandtheirfamilies.InsightCCEDrecommendstheUniversityofCaliforniaconsiderusingtheStandardtodetermineandadoptlivingwagepolicies(seewww.insightcced.org).
TheSelf-SufficiencyStandardwasanintegraltoolfor• increasingHawaii’sminimumwageto$6.75onJanuary1,2006and$7.25onJanuary1,2007.
GeorgetownUniversitystudentsendedaninedayhunger• strikewhentheUniversityadministrationagreedtoimprovewagesforthelow-paidcustodial,foodservice,andsecurityworkers.ThestudentgrouputilizedtheSelf-SufficiencyStandardfortheDistrictofColumbiaintheircampaignadvocacy.Thenegotiatedagreementincludedraisingtheminimumhourlywageto$13beginningJuly2006andannualwageadjustmentsbasedontheConsumerPriceIndex.
suPPoRt ReseARChBecause the Self-Sufficiency Standard provides an accurate and specific measure of income adequacy, it is frequently used in research.TheStandardprovidesameansofestimatinghowpovertydiffersfromplacetoplaceandamongdifferentfamilytypes.TheStandardalsoprovidesameanstomeasuretheadequacyofvariousworksupports,suchaschildsupportorchildcareassistance,givenafamily’sincome,placeofresidence,andcomposition.
Forexample,theSelf-SufficiencyStandardhasbeen• usedtoexaminethecostofhealthinsuranceinWashingtonandMassachusetts.Income Adequacy and the Affordability of Health Insurance in Washington StateandtheHealth Economic Sufficiency Standard for MassachusettsusedtheStandardtoexaminethecostofhealthinsurancefordifferentfamilytypes,withvaryinghealthstatusesandhealthcarecoverage,indifferentlocations(seewww.wowonline.org/ourprograms/fess/state-resources/documents/MAHealthEconomicSelf-SufficiencyStandard.pdf).
PathWaysPAcitestheSelf-SufficiencyStandard• frequentlyinitspublications,includingInvesting in Pennsylvania’s Families: Economic Opportunities for All,apolicypublicationlookingattheneedsofworkingfamiliesinPennsylvaniaearninglessthan200%oftheFederalPovertyLevel(seewww.pathwayspa.org/InvestingPAFamily_Aug_2_2007.pdf).PathWaysPAalsousestheStandardasameasureagainstwhichtobasetaxcredits,healthcarereform,andotherneeds.
Inseveralstates,theSelf-SufficiencyStandardhasbeen• usedalongwithdatafromtheU.S.CensusBureautomeasurethenumberoffamiliesaboveandbelowtheSelf-SufficiencyStandard,aswellasthecharacteristicsofthoseaboveandbelowtheStandard,suchasrace,ethnicity,familytype,education,andemployment.ThesedemographicreportshavebeenpublishedbytheCenterforWomen’sWelfareforsevenstates,suchasthereportOverlooked and Undercounted 2009: Struggling to Make Ends Meet in California(seewww.selfsufficiencystandard.org/pubs.html#addpubs).
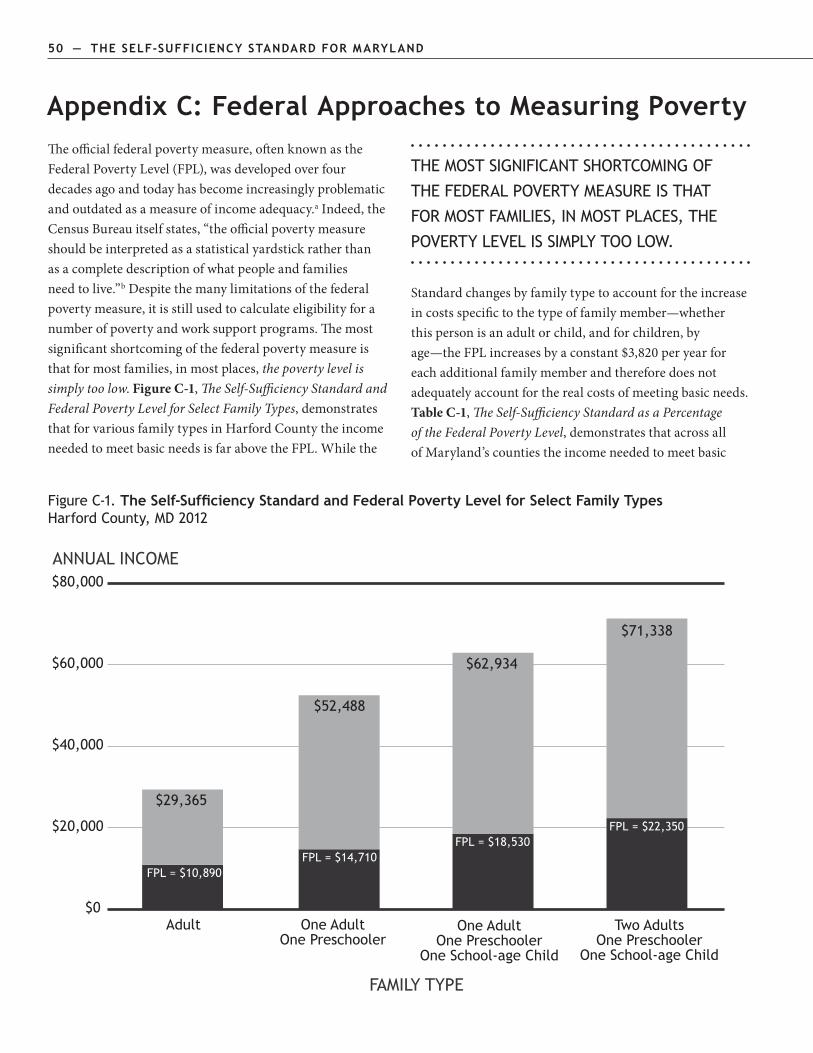
50 — the seLf-suffiCieNCY stANDARD foR mARYLAND the seLf-suffiCieNCY stANDARD foR mARYLAND — 51
Theofficialfederalpovertymeasure,oftenknownastheFederalPovertyLevel(FPL),wasdevelopedoverfourdecadesagoandtodayhasbecomeincreasinglyproblematicandoutdatedasameasureofincomeadequacy.aIndeed,theCensusBureauitselfstates,“theofficialpovertymeasureshouldbeinterpretedasastatisticalyardstickratherthanasacompletedescriptionofwhatpeopleandfamiliesneedtolive.”bDespitethemanylimitationsofthefederalpovertymeasure,itisstillusedtocalculateeligibilityforanumberofpovertyandworksupportprograms.Themostsignificantshortcomingofthefederalpovertymeasureisthatformostfamilies,inmostplaces,the poverty level is simply too low. Figure C-1,The Self-Sufficiency Standard and Federal Poverty Level for Select Family Types,demonstratesthatforvariousfamilytypesinHarfordCountytheincomeneededtomeetbasicneedsisfarabovetheFPL.Whilethe
Appendix C: Federal Approaches to Measuring Poverty
Standardchangesbyfamilytypetoaccountfortheincreaseincostsspecifictothetypeoffamilymember—whetherthispersonisanadultorchild,andforchildren,byage—theFPLincreasesbyaconstant$3,820peryearforeachadditionalfamilymemberandthereforedoesnotadequatelyaccountfortherealcostsofmeetingbasicneeds.Table C-1,The Self-Sufficiency Standard as a Percentage of the Federal Poverty Level,demonstratesthatacrossallofMaryland’scountiestheincomeneededtomeetbasic
The MoST SiGnificanT ShorTcoMinG of
THE FEDERAL POvERTY MEASURE IS THAT
FOR MOST FAMILIES, IN MOST PLACES, THE
POvERTY LEvEL IS SIMPLY TOO LOW.
Figure C-1. The Self-Sufficiency Standard and Federal Poverty Level for Select Family Types Harford County, MD 2012
ANNUAL INCOME
$0
$20,000
$40,000
$60,000
$80,000
FPL = $10,890FPL = $14,710
FPL = $18,530FPL = $22,350
$52,488
$62,934
$71,338
$29,365
Adult One AdultOne Preschooler
One AdultOne Preschooler
One School-age Child
Two AdultsOne Preschooler
One School-age Child
FAMILY TYPE
50 — the seLf-suffiCieNCY stANDARD foR mARYLAND the seLf-suffiCieNCY stANDARD foR mARYLAND — 51
needsisfarabovetheFPL,indicatingthatfamiliesacrossMarylandcanhaveincomesabovethefederalpovertymeasureandyetlacksufficientresourcestoadequatelymeettheirbasicneeds.Forthisreason,mostassistanceprogramsuseamultipleofthefederalpovertymeasuretodetermineneed.Forinstance,children’shealthinsurancewithnoorlow-costpremiumsisavailablethroughMaryland’sChildren’sHealthProgram(MCHP)forfamilieswithincomesupto300%oftheFPL.c
However,simplyraisingthepovertylevel,orusingamultipleoftheFPL,cannotsolvethestructuralproblemsinherentintheofficialpovertymeasure.Inadditiontothefundamentalproblemofbeingtoolow,therearefivebasicmethodologicalproblemswiththefederalpovertymeasure.
First, the measure is based on the cost of a single item—food—rather than a “market basket” of all basic needs.Overfourdecadesago,whentheFederalPovertyLevelwasfirstdevelopedbyMollieOrshansky,foodwastheonlybudgetitemforwhichthecostofmeetingaminimalstandard,inthiscasenutrition,wasknown.(TheDepartmentofAgriculturehaddeterminedhouseholdfoodbudgetsbasedonnutritionalstandards.)KnowingthattheaverageAmericanfamilyspentathirdoftheirbudgetonfood,Orshanskyreasonedthatmultiplyingthefoodbudgetbythreewouldyieldanestimateoftheamountneededtomeetotherbasicneeds,andthusthisbecamethebasisoftheFPL.d
Second, the measure’s methodology is “ frozen,” not allowing for changes in the relative cost of food or non-food items, nor the addition of new necessary costs.Sinceitwasdeveloped,thepovertylevelhasonlybeenupdatedannuallyusingtheConsumerPriceIndex.Asaresult,thepercentageofthehouseholdbudgetdevotedtofoodhasremainedatone-thirdoftheFPLeventhoughAmericanfamiliesnowspendanaverageofonly13%oftheirincomeonfood.eAtthesametime,othercostshaverisenmuchfaster—suchashealthcare,housing,andmorerecentlyfoodandenergy—andnewcostshavearisen,suchaschildcareandtaxes.Noneofthesechangesare,orcanbe,reflectedinthefederalpovertymeasurebasedona“frozen”methodology.
Third, the federal poverty measure is dated, implicitly using the demographic model of a two-parent family with a “stay-at-home” wife, or if a single parent, implicitly assumes
she is not employed.ThisfamilydemographicnolongerreflectstherealityofthemajorityofAmericanfamiliestoday.AccordingtotheU.S.BureauofLaborStatistics,bothparentswereemployedin58%oftwo-parentfamilieswithchildrenin2010.Likewise,67%ofsinglemotherswithchildrenwereemployedin2010and76%ofsinglefatherswithchildrenwereemployedin2010.fThus,paidemploymentanditsassociatedcostssuchaschildcare,transportation,andtaxesisthenormforthemajorityoffamiliestodayratherthantheexception.Moreover,whenthepovertymeasurewasfirstdeveloped,theseemployment-relateditemswerenotasignificantexpenseformostfamilies:taxeswererelativelylow,transportationwasinexpensive,andchildcareforfamilieswithyoungchildrenwasnotcommon.However,todaytheseexpensesaresubstantial,andbornebymostfamilies,andthusthesecostsshouldbeincludedinamodernpovertymeasure.
Fourth, the poverty measure does not vary by geographic location.Thatis,thefederalpovertymeasureisthesamewhetheronelivesinLouisianaorintheSanFranciscoBayAreaofCalifornia(withAlaskaandHawaiitheonlyexceptionstotherule).However,housinginthemostexpensiveareasoftheUnitedStatescostsoverthreetimesasmuchasintheleastexpensiveareas.gEvenwithinstates,costsvaryconsiderably:inMaryland,thecostofatwo-bedroomrentalinColumbiaCity($1,587permonth)isthreetimesthecostofthesamesizerentalinAlleganyorGarrettcounties($584permonth).
Finally, the federal poverty measure provides no information or means to track changes in specific costs (suchashousing,childcare,etc.),northeimpactofsubsidies,taxes,and/ortaxcreditsthatreduce(orincrease)thesecosts.Thefederalpovertymeasuredoesnotallowfordetermininghowspecificcostsriseorfallovertime.Likewise,whenassessingtheimpactofsubsidies,taxes,andtaxcredits,povertymeasurescannottracetheimpacttheyhaveonnetcostsunlesstheyareexplicitlyincludedinthemeasureitself.
Fortheseandotherreasons,manyresearchersandanalystshaveproposedrevisingthefederalpovertymeasure.Suggestedchangeswouldreflecttwenty-firstcenturyneeds,incorporategeographicallybaseddifferencesincosts,andrespondtochangesovertime.h
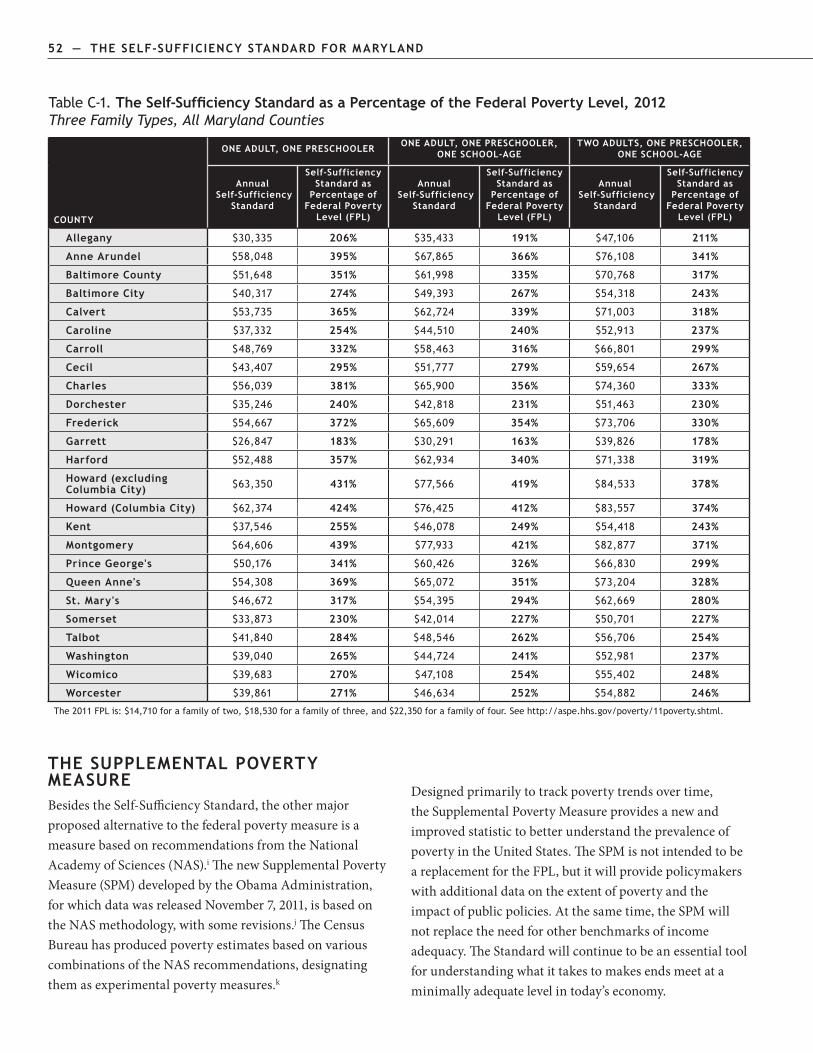
52 — the seLf-suffiCieNCY stANDARD foR mARYLAND the seLf-suffiCieNCY stANDARD foR mARYLAND — 53
Table C-1. The Self-Sufficiency Standard as a Percentage of the Federal Poverty Level, 2012 Three Family Types, All Maryland Counties
CouNtY
oNe ADuLt, oNe PResChooLeR oNe ADuLt, oNe PResChooLeR, oNe sChooL-AGe
tWo ADuLts, oNe PResChooLeR, oNe sChooL-AGe
Annual self-sufficiency
standard
self-sufficiency standard as
Percentage of federal Poverty
Level (fPL)
Annual self-sufficiency
standard
self-sufficiency standard as
Percentage of federal Poverty
Level (fPL)
Annual self-sufficiency
standard
self-sufficiency standard as
Percentage of federal Poverty
Level (fPL)
Allegany $30,335 206% $35,433 191% $47,106 211%
Anne Arundel $58,048 395% $67,865 366% $76,108 341%
Baltimore County $51,648 351% $61,998 335% $70,768 317%
Baltimore City $40,317 274% $49,393 267% $54,318 243%
Calvert $53,735 365% $62,724 339% $71,003 318%
Caroline $37,332 254% $44,510 240% $52,913 237%
Carroll $48,769 332% $58,463 316% $66,801 299%
Cecil $43,407 295% $51,777 279% $59,654 267%
Charles $56,039 381% $65,900 356% $74,360 333%
Dorchester $35,246 240% $42,818 231% $51,463 230%
frederick $54,667 372% $65,609 354% $73,706 330%
Garrett $26,847 183% $30,291 163% $39,826 178%
harford $52,488 357% $62,934 340% $71,338 319%
howard (excluding Columbia City) $63,350 431% $77,566 419% $84,533 378%
howard (Columbia City) $62,374 424% $76,425 412% $83,557 374%
Kent $37,546 255% $46,078 249% $54,418 243%
montgomery $64,606 439% $77,933 421% $82,877 371%
Prince George's $50,176 341% $60,426 326% $66,830 299%
Queen Anne's $54,308 369% $65,072 351% $73,204 328%
st. mary's $46,672 317% $54,395 294% $62,669 280%
somerset $33,873 230% $42,014 227% $50,701 227%
talbot $41,840 284% $48,546 262% $56,706 254%
Washington $39,040 265% $44,724 241% $52,981 237%
Wicomico $39,683 270% $47,108 254% $55,402 248%
Worcester $39,861 271% $46,634 252% $54,882 246%
The 2011 FPL is: $14,710 for a family of two, $18,530 for a family of three, and $22,350 for a family of four. See http://aspe.hhs.gov/poverty/11poverty.shtml.
the suPPLemeNtAL PoVeRtY meAsuReBesidestheSelf-SufficiencyStandard,theothermajorproposedalternativetothefederalpovertymeasureisameasurebasedonrecommendationsfromtheNationalAcademyofSciences(NAS).iThenewSupplementalPovertyMeasure(SPM)developedbytheObamaAdministration,forwhichdatawasreleasedNovember7,2011,isbasedontheNASmethodology,withsomerevisions.jTheCensusBureauhasproducedpovertyestimatesbasedonvariouscombinationsoftheNASrecommendations,designatingthemasexperimentalpovertymeasures.k
Designedprimarilytotrackpovertytrendsovertime,theSupplementalPovertyMeasureprovidesanewandimprovedstatistictobetterunderstandtheprevalenceofpovertyintheUnitedStates.TheSPMisnotintendedtobeareplacementfortheFPL,butitwillprovidepolicymakerswithadditionaldataontheextentofpovertyandtheimpactofpublicpolicies.Atthesametime,theSPMwillnotreplacetheneedforotherbenchmarksofincomeadequacy.TheStandardwillcontinuetobeanessentialtoolforunderstandingwhatittakestomakesendsmeetataminimallyadequatelevelintoday’seconomy.

52 — the seLf-suffiCieNCY stANDARD foR mARYLAND the seLf-suffiCieNCY stANDARD foR mARYLAND — 53
APPeNDix C eNDNotesa.Therearetwofederalmeasurementsofpoverty.AdetailedmatrixofpovertythresholdsiscalculatedeachyearbytheU.S.CensusBureau,whichvariesbythenumberofadultsandthenumberofchildreninthehousehold,andbyageforoneandtwoadulthouseholds.Thethresholdisusedtocalculatethenumberofpeopleinpovertyforthepreviousyear.Theotherformofthepovertymeasureiscalledthe“federalpovertyguidelines”orthe“FederalPovertyLevel”(FPG/FPL).TheFPLiscalculatedbytheU.S.DepartmentofHealthandHumanServiceseachFebruaryandisprimarilyusedbyfederalandstateprogramstodetermineeligibilityand/orcalculatebenefits,suchasforSNAP(formerlytheFoodStampsProgram).TheFPLonlyvariesbyfamilysize,regardlessofcomposition;the2011FPLforafamilyofthreeis$18,530.TheStandardreferencestheFPLinthisreport.Formoreinformationaboutthefederalpovertymeasurements,seehttp://aspe.hhs.gov/poverty/faq.shtml#thriftyandhttp://aspe.hhs.gov/poverty/11poverty.shtml.
b.CarmenDeNavas-Walt,BernadetteProctor,andCherylHill-Lee,“Income,Poverty,andHealthInsuranceCoverageintheU.S.:2004,”U.S.CensusBureau,CurrentPopulationReports,SeriesP60-229,Washington,D.C.(U.S.GovernmentPrintingOffice),http://www.census.gov/prod/2005pubs/p60-229.pdf(accessedSeptember14,2005).
c.MarylandDepartmentofHealthandMentalHygiene,Maryland’sChildren’sHealthProgram(MCHP),“MonthlyIncomeandAssetGuidelinesMedicalCarePrograms,”http://www.dhmh.state.md.us/mma/pdf/2011/IncomeAssetGuidelines-2011.pdf(accessedSeptember26,2011).
d.U.S.DepartmentofHealthandHumanServices,“FrequentlyAskedQuestionsRelatedtothePovertyGuidelinesandPoverty,”http://aspe.hhs.gov/poverty/faq.shtml(accessedDecember14,2010).
e.In2010theaverageconsumerexpenditureonfoodwas$6,129peryearor12.7%oftotalexpenditures.U.S.DepartmentofLabor,BureauofLaborStatistics,“ConsumerExpendituresin2010,”http://www.bls.gov/news.release/cesan.nr0.htm(accessedNovember10,2011).
f.U.S.DepartmentofLabor,U.S.BureauofLaborStatistics,“EmploymentCharacteristicsofFamilies-2010,”http://www.bls.gov/news.release/pdf/famee.pdf(accessedJune1,2011).
g.Usingthe2012FairMarketRents,thecostofhousing(includingutilities)atthe40thpercentile,foratwo-bedroomunitinthemostexpensiveplace—theSanFranciscometropolitanarea—is$1,905permonth.Thisisnearlyfourtimesasmuchastheleastexpensivehousinginthecountry,foundinseveralcountiesinKentucky,wheretwo-bedroomunitscost$491permonth.U.S.HousingandUrbanDevelopmentDepartment,“FairMarketRents,”http://www.huduser.org/datasets/fmr.html(accessedNovember10,2011).
h.OneofthefirstpersonstoadvocateimplementingchangesovertimeintotheFederalPovertyLevelwasPatriciaRuggles,authorofDrawing the Line.Ruggles’workandtheanalysesofmanyothersaresummarizedinMeasuring Poverty: A New Approach.ConstanceCitroandRobertMichael,Eds.,“MeasuringPoverty:ANewApproach,”Washington,D.C.:NationalAcademyPress,http://www.census.gov/hhes/www/povmeas/toc.html(accessedNovember10,2010);hereaftercitedasMeasuringPoverty.
i.MeasuringPoverty.
j.U.S.DepartmentofCommerce,U.S.CensusBureau,“ObservationsfromtheInteragencyTechnicalWorkingGrouponDevelopingaSupplementalPovertyMeasure,”PovertyMeasurementStudiesandAlternativeMeasures,http://www.census.gov/hhes/www/povmeas/povmeas.html(accessedMarch15,2010).U.S.DepartmentofCommerce,U.S.CensusBureau,“Webinar:SupplementalPovertyMeasureResearch,”http://www.census.gov/newsroom/releases/archives/news_conferences/2011-11-04_spm_webinar.html(accessedNovember10,2011).
k.KathleenShortandTeresaGarner,“CreatingaConsistentPovertyMeasureOverTimeUsingNASProcedures:1996-2005,”U.S.CensusBureau,WorkingPaperSeries,PovertyThresholds,http://www.census.gov/hhes/www/povmeas/papers/experimental_measures_96_05v7.pdf(accessedMarch30,2010).

Appendix D: The Self-Sufficiency Standard for Select family Types in Maryland

56 — the seLf-suffiCieNCY stANDARD foR mARYLAND the seLf-suffiCieNCY stANDARD foR mARYLAND — 57
Table 1 The Self-Sufficiency Standard for Allegany County, MD 2012
MonThly coSTS adultAdult +
Preschooler
Adult + infant
Preschooler
Adult + Preschooler School-age
Adult + School-age Teenager
2 Adults + infant
2 Adults+ infant
Preschooler
2 Adults +Preschooler School-age
Housing $498 $584 $584 $584 $584 $584 $584 $584
child care $0 $529 $985 $817 $288 $456 $985 $817
food $253 $385 $506 $577 $668 $615 $725 $793
Transportation $292 $300 $300 $300 $300 $566 $566 $566
health care $153 $387 $400 $411 $442 $450 $462 $474
Miscellaneous $120 $219 $277 $269 $228 $267 $332 $323
Taxes $293 $363 $478 $397 $254 $497 $670 $636
earned income Tax Credit (-) $0 -$88 -$66 -$114 -$256 -$41 $0 -$1
child care Tax Credit (-) $0 -$68 -$115 -$120 -$60 -$55 -$100 -$100
Child Tax Credit (-) $0 -$83 -$167 -$167 -$167 -$83 -$167 -$167
Self-Sufficiency waGe
hourly $9.14 $14.36 $18.08 $16.78 $12.95 $9.25 $11.53 $11.15
per adult per adult per adult
MonThly $1,609 $2,528 $3,182 $2,953 $2,280 $3,257 $4,058 $3,926
annual $19,310 $30,335 $38,179 $35,433 $27,356 $39,085 $48,691 $47,106
Table 2 The Self-Sufficiency Standard for Anne Arundel County, MD 2012
MonThly coSTS adultAdult +
Preschooler
Adult + infant
Preschooler
Adult + Preschooler School-age
Adult + School-age Teenager
2 Adults + infant
2 Adults+ infant
Preschooler
2 Adults +Preschooler School-age
Housing $1,308 $1,571 $1,571 $1,571 $1,571 $1,571 $1,571 $1,571
child care $0 $827 $1,688 $1,318 $490 $861 $1,688 $1,318
food $262 $398 $522 $596 $690 $636 $749 $819
Transportation $299 $307 $307 $307 $307 $582 $582 $582
health care $156 $396 $408 $419 $450 $459 $471 $482
Miscellaneous $202 $350 $450 $421 $351 $411 $506 $477
Taxes $684 $1,122 $1,502 $1,290 $996 $1,221 $1,499 $1,361
earned income Tax Credit (-) $0 $0 $0 $0 $0 $0 $0 $0
child care Tax Credit (-) $0 -$50 -$100 -$100 -$50 -$50 -$100 -$100
Child Tax Credit (-) $0 -$83 -$167 -$167 -$167 -$83 -$167 -$167
Self-Sufficiency waGe
hourly $16.54 $27.48 $35.12 $32.13 $26.36 $15.93 $19.31 $18.02
per adult per adult per adult
MonThly $2,910 $4,837 $6,181 $5,655 $4,639 $5,607 $6,798 $6,342
annual $34,924 $58,048 $74,173 $67,865 $55,667 $67,280 $81,581 $76,108

56 — the seLf-suffiCieNCY stANDARD foR mARYLAND the seLf-suffiCieNCY stANDARD foR mARYLAND — 57
Table 3 The Self-Sufficiency Standard for Baltimore County, MD 2012
MonThly coSTS adultAdult +
Preschooler
Adult + infant
Preschooler
Adult + Preschooler School-age
Adult + School-age Teenager
2 Adults + infant
2 Adults+ infant
Preschooler
2 Adults +Preschooler School-age
Housing $1,039 $1,248 $1,248 $1,248 $1,248 $1,248 $1,248 $1,248
child care $0 $781 $1,584 $1,302 $521 $803 $1,584 $1,302
food $262 $398 $522 $596 $690 $636 $749 $819
Transportation $323 $331 $331 $331 $331 $630 $630 $630
health care $156 $396 $408 $419 $450 $459 $471 $482
Miscellaneous $178 $315 $409 $390 $324 $378 $468 $448
Taxes $573 $969 $1,243 $1,147 $878 $1,075 $1,333 $1,235
earned income Tax Credit (-) $0 $0 $0 $0 $0 $0 $0 $0
child care Tax Credit (-) $0 -$50 -$100 -$100 -$50 -$50 -$100 -$100
Child Tax Credit (-) $0 -$83 -$167 -$167 -$167 -$83 -$167 -$167
Self-Sufficiency waGe
hourly $14.38 $24.45 $31.13 $29.35 $24.01 $14.47 $17.66 $16.75
per adult per adult per adult
MonThly $2,531 $4,304 $5,479 $5,166 $4,225 $5,094 $6,215 $5,897
annual $30,373 $51,648 $65,747 $61,998 $50,704 $61,132 $74,584 $70,768
Table 4 The Self-Sufficiency Standard for Baltimore City, MD 2012
MonThly coSTS adultAdult +
Preschooler
Adult + infant
Preschooler
Adult + Preschooler School-age
Adult + School-age Teenager
2 Adults + infant
2 Adults+ infant
Preschooler
2 Adults +Preschooler School-age
Housing $859 $1,031 $1,031 $1,031 $1,031 $1,031 $1,031 $1,031
child care $0 $658 $1,331 $1,092 $434 $673 $1,331 $1,092
food $262 $398 $522 $596 $690 $636 $749 $819
Transportation $94 $94 $94 $94 $94 $187 $187 $187
health care $156 $396 $408 $419 $450 $459 $471 $482
Miscellaneous $137 $258 $339 $323 $270 $299 $377 $361
Taxes $378 $664 $907 $827 $554 $689 $898 $821
earned income Tax Credit (-) $0 $0 $0 $0 -$53 $0 $0 $0
child care Tax Credit (-) $0 -$55 -$100 -$100 -$58 -$50 -$100 -$100
Child Tax Credit (-) $0 -$83 -$167 -$167 -$167 -$83 -$167 -$167
Self-Sufficiency waGe
hourly $10.71 $19.09 $24.80 $23.39 $18.45 $10.91 $13.57 $12.86
per adult per adult per adult
MonThly $1,885 $3,360 $4,365 $4,116 $3,247 $3,840 $4,776 $4,526
annual $22,615 $40,317 $52,382 $49,393 $38,961 $46,077 $57,317 $54,318

58 — the seLf-suffiCieNCY stANDARD foR mARYLAND the seLf-suffiCieNCY stANDARD foR mARYLAND — 59
Table 5 The Self-Sufficiency Standard for Calvert County, MD 2012
MonThly coSTS adultAdult +
Preschooler
Adult + infant
Preschooler
Adult + Preschooler School-age
Adult + School-age Teenager
2 Adults + infant
2 Adults+ infant
Preschooler
2 Adults +Preschooler School-age
Housing $1,292 $1,465 $1,465 $1,465 $1,465 $1,465 $1,465 $1,465
child care $0 $694 $1,468 $1,150 $456 $774 $1,468 $1,150
food $253 $385 $506 $577 $668 $615 $725 $793
Transportation $304 $312 $312 $312 $312 $592 $592 $592
health care $159 $407 $420 $431 $462 $471 $482 $494
Miscellaneous $201 $326 $417 $394 $336 $392 $473 $449
Taxes $684 $1,021 $1,279 $1,165 $936 $1,142 $1,356 $1,240
earned income Tax Credit (-) $0 $0 $0 $0 $0 $0 $0 $0
child care Tax Credit (-) $0 -$50 -$100 -$100 -$50 -$50 -$100 -$100
Child Tax Credit (-) $0 -$83 -$167 -$167 -$167 -$83 -$167 -$167
Self-Sufficiency waGe
hourly $16.44 $25.44 $31.82 $29.70 $25.11 $15.11 $17.89 $16.81
per adult per adult per adult
MonThly $2,893 $4,478 $5,600 $5,227 $4,419 $5,318 $6,296 $5,917
annual $34,721 $53,735 $67,205 $62,724 $53,027 $63,818 $75,547 $71,003
Table 6 The Self-Sufficiency Standard for Caroline County, MD 2012
MonThly coSTS adultAdult +
Preschooler
Adult + infant
Preschooler
Adult + Preschooler School-age
Adult + School-age Teenager
2 Adults + infant
2 Adults+ infant
Preschooler
2 Adults +Preschooler School-age
Housing $737 $862 $862 $862 $862 $862 $862 $862
child care $0 $477 $984 $825 $347 $506 $984 $825
food $254 $386 $507 $579 $670 $617 $727 $795
Transportation $294 $302 $302 $302 $302 $571 $571 $571
health care $159 $407 $420 $431 $462 $471 $482 $494
Miscellaneous $144 $243 $307 $300 $264 $303 $363 $355
Taxes $407 $574 $724 $678 $481 $696 $814 $776
earned income Tax Credit (-) $0 $0 $0 $0 -$89 $0 $0 $0
child care Tax Credit (-) $0 -$58 -$100 -$100 -$60 -$50 -$100 -$100
Child Tax Credit (-) $0 -$83 -$167 -$167 -$167 -$83 -$167 -$167
Self-Sufficiency waGe
hourly $11.34 $17.68 $21.81 $21.07 $17.46 $11.06 $12.88 $12.53
per adult per adult per adult
MonThly $1,995 $3,111 $3,839 $3,709 $3,073 $3,892 $4,535 $4,409
annual $23,943 $37,332 $46,068 $44,510 $36,874 $46,707 $54,425 $52,913

58 — the seLf-suffiCieNCY stANDARD foR mARYLAND the seLf-suffiCieNCY stANDARD foR mARYLAND — 59
Table 7 The Self-Sufficiency Standard for Carroll County, MD 2012
MonThly coSTS adultAdult +
Preschooler
Adult + infant
Preschooler
Adult + Preschooler School-age
Adult + School-age Teenager
2 Adults + infant
2 Adults+ infant
Preschooler
2 Adults +Preschooler School-age
Housing $919 $1,103 $1,103 $1,103 $1,103 $1,103 $1,103 $1,103
child care $0 $804 $1,580 $1,287 $483 $776 $1,580 $1,287
food $262 $398 $522 $596 $690 $636 $749 $819
Transportation $300 $307 $307 $307 $307 $583 $583 $583
health care $153 $387 $400 $411 $442 $450 $462 $474
Miscellaneous $163 $300 $391 $370 $303 $355 $448 $427
Taxes $508 $898 $1,165 $1,063 $771 $974 $1,245 $1,141
earned income Tax Credit (-) $0 $0 $0 $0 $0 $0 $0 $0
child care Tax Credit (-) $0 -$50 -$100 -$100 -$50 -$50 -$100 -$100
Child Tax Credit (-) $0 -$83 -$167 -$167 -$167 -$83 -$167 -$167
Self-Sufficiency waGe
hourly $13.09 $23.09 $29.56 $27.68 $22.06 $13.48 $16.77 $15.81
per adult per adult per adult
MonThly $2,304 $4,064 $5,203 $4,872 $3,883 $4,744 $5,903 $5,567
annual $27,651 $48,769 $62,431 $58,463 $46,596 $56,926 $70,836 $66,801
Table 8 The Self-Sufficiency Standard for Cecil County, MD 2012
MonThly coSTS adultAdult +
Preschooler
Adult + infant
Preschooler
Adult + Preschooler School-age
Adult + School-age Teenager
2 Adults + infant
2 Adults+ infant
Preschooler
2 Adults +Preschooler School-age
Housing $899 $1,075 $1,075 $1,075 $1,075 $1,075 $1,075 $1,075
child care $0 $577 $1,210 $990 $412 $633 $1,210 $990
food $254 $386 $507 $579 $670 $617 $727 $795
Transportation $278 $286 $286 $286 $286 $544 $544 $544
health care $159 $407 $420 $431 $462 $471 $482 $494
Miscellaneous $159 $273 $350 $336 $291 $334 $404 $390
Taxes $481 $746 $952 $886 $700 $862 $1,019 $951
earned income Tax Credit (-) $0 $0 $0 $0 $0 $0 $0 $0
child care Tax Credit (-) $0 -$50 -$100 -$100 -$50 -$50 -$100 -$100
Child Tax Credit (-) $0 -$83 -$167 -$167 -$167 -$83 -$167 -$167
Self-Sufficiency waGe
hourly $12.67 $20.55 $25.76 $24.52 $20.90 $12.51 $14.76 $14.12
per adult per adult per adult
MonThly $2,230 $3,617 $4,533 $4,315 $3,679 $4,403 $5,195 $4,971
annual $26,755 $43,407 $54,397 $51,777 $44,146 $52,830 $62,338 $59,654

60 — the seLf-suffiCieNCY stANDARD foR mARYLAND the seLf-suffiCieNCY stANDARD foR mARYLAND — 61
Table 9 The Self-Sufficiency Standard for Charles County, MD 2012
MonThly coSTS adultAdult +
Preschooler
Adult + infant
Preschooler
Adult + Preschooler School-age
Adult + School-age Teenager
2 Adults + infant
2 Adults+ infant
Preschooler
2 Adults +Preschooler School-age
Housing $1,341 $1,520 $1,520 $1,520 $1,520 $1,520 $1,520 $1,520
child care $0 $748 $1,580 $1,250 $501 $832 $1,580 $1,250
food $253 $385 $506 $577 $668 $615 $725 $793
Transportation $314 $321 $321 $321 $321 $611 $611 $611
health care $159 $407 $420 $431 $462 $471 $482 $494
Miscellaneous $207 $338 $435 $410 $347 $405 $492 $467
Taxes $715 $1,083 $1,414 $1,249 $993 $1,212 $1,452 $1,330
earned income Tax Credit (-) $0 $0 $0 $0 $0 $0 $0 $0
child care Tax Credit (-) $0 -$50 -$100 -$100 -$50 -$50 -$100 -$100
Child Tax Credit (-) $0 -$83 -$167 -$167 -$167 -$83 -$167 -$167
Self-Sufficiency waGe
hourly $16.98 $26.53 $33.69 $31.20 $26.12 $15.72 $18.74 $17.60
per adult per adult per adult
MonThly $2,988 $4,670 $5,929 $5,492 $4,597 $5,532 $6,595 $6,197
annual $35,859 $56,039 $71,152 $65,900 $55,167 $66,381 $79,145 $74,360
Table 10 The Self-Sufficiency Standard for Dorchester County, MD 2012
MonThly coSTS adultAdult +
Preschooler
Adult + infant
Preschooler
Adult + Preschooler School-age
Adult + School-age Teenager
2 Adults + infant
2 Adults+ infant
Preschooler
2 Adults +Preschooler School-age
Housing $613 $781 $781 $781 $781 $781 $781 $781
child care $0 $477 $984 $825 $347 $506 $984 $825
food $254 $386 $507 $579 $670 $617 $727 $795
Transportation $296 $304 $304 $304 $304 $575 $575 $575
health care $159 $407 $420 $431 $462 $471 $482 $494
Miscellaneous $132 $236 $300 $292 $256 $295 $355 $347
Taxes $348 $511 $677 $628 $414 $657 $777 $739
earned income Tax Credit (-) $0 -$22 $0 $0 -$131 $0 $0 $0
child care Tax Credit (-) $0 -$60 -$100 -$105 -$63 -$50 -$100 -$100
Child Tax Credit (-) $0 -$83 -$167 -$167 -$167 -$83 -$167 -$167
Self-Sufficiency waGe
hourly $10.24 $16.69 $21.05 $20.27 $16.34 $10.71 $12.54 $12.18
per adult per adult per adult
MonThly $1,803 $2,937 $3,705 $3,568 $2,875 $3,769 $4,414 $4,289
annual $21,634 $35,246 $44,462 $42,818 $34,502 $45,228 $52,974 $51,463
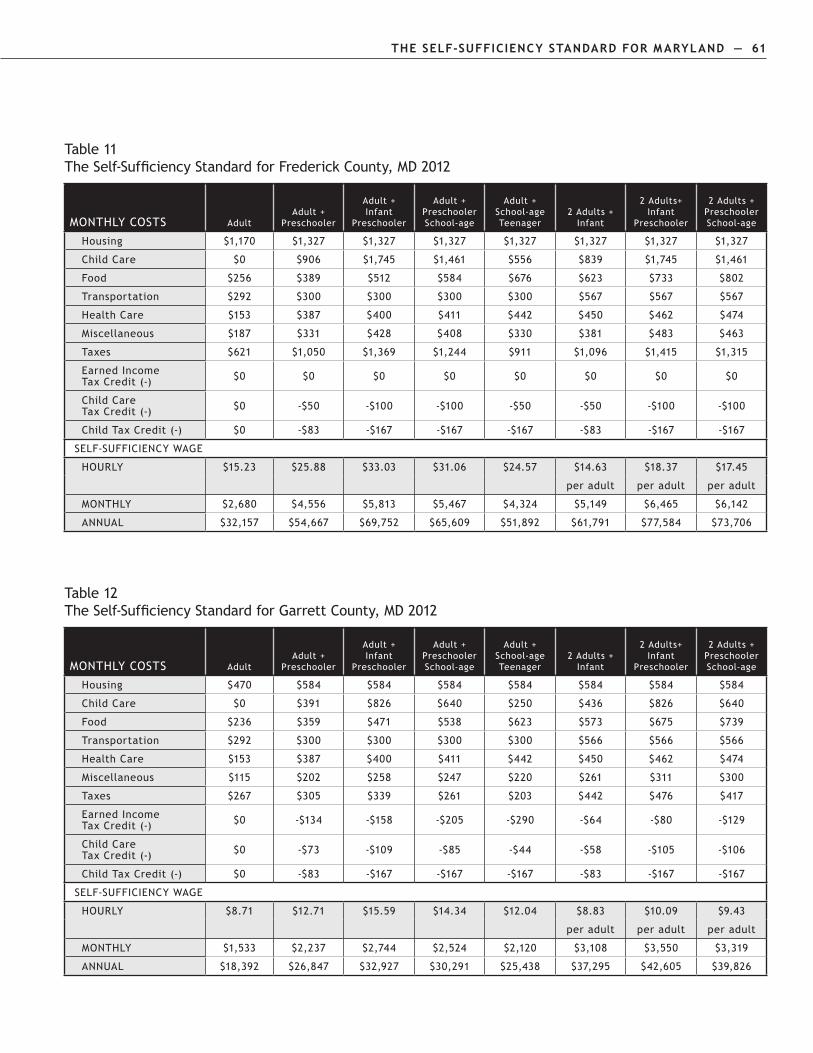
60 — the seLf-suffiCieNCY stANDARD foR mARYLAND the seLf-suffiCieNCY stANDARD foR mARYLAND — 61
Table 11 The Self-Sufficiency Standard for Frederick County, MD 2012
MonThly coSTS adultAdult +
Preschooler
Adult + infant
Preschooler
Adult + Preschooler School-age
Adult + School-age Teenager
2 Adults + infant
2 Adults+ infant
Preschooler
2 Adults +Preschooler School-age
Housing $1,170 $1,327 $1,327 $1,327 $1,327 $1,327 $1,327 $1,327
child care $0 $906 $1,745 $1,461 $556 $839 $1,745 $1,461
food $256 $389 $512 $584 $676 $623 $733 $802
Transportation $292 $300 $300 $300 $300 $567 $567 $567
health care $153 $387 $400 $411 $442 $450 $462 $474
Miscellaneous $187 $331 $428 $408 $330 $381 $483 $463
Taxes $621 $1,050 $1,369 $1,244 $911 $1,096 $1,415 $1,315
earned income Tax Credit (-) $0 $0 $0 $0 $0 $0 $0 $0
child care Tax Credit (-) $0 -$50 -$100 -$100 -$50 -$50 -$100 -$100
Child Tax Credit (-) $0 -$83 -$167 -$167 -$167 -$83 -$167 -$167
Self-Sufficiency waGe
hourly $15.23 $25.88 $33.03 $31.06 $24.57 $14.63 $18.37 $17.45
per adult per adult per adult
MonThly $2,680 $4,556 $5,813 $5,467 $4,324 $5,149 $6,465 $6,142
annual $32,157 $54,667 $69,752 $65,609 $51,892 $61,791 $77,584 $73,706
Table 12 The Self-Sufficiency Standard for Garrett County, MD 2012
MonThly coSTS adultAdult +
Preschooler
Adult + infant
Preschooler
Adult + Preschooler School-age
Adult + School-age Teenager
2 Adults + infant
2 Adults+ infant
Preschooler
2 Adults +Preschooler School-age
Housing $470 $584 $584 $584 $584 $584 $584 $584
child care $0 $391 $826 $640 $250 $436 $826 $640
food $236 $359 $471 $538 $623 $573 $675 $739
Transportation $292 $300 $300 $300 $300 $566 $566 $566
health care $153 $387 $400 $411 $442 $450 $462 $474
Miscellaneous $115 $202 $258 $247 $220 $261 $311 $300
Taxes $267 $305 $339 $261 $203 $442 $476 $417
earned income Tax Credit (-) $0 -$134 -$158 -$205 -$290 -$64 -$80 -$129
child care Tax Credit (-) $0 -$73 -$109 -$85 -$44 -$58 -$105 -$106
Child Tax Credit (-) $0 -$83 -$167 -$167 -$167 -$83 -$167 -$167
Self-Sufficiency waGe
hourly $8.71 $12.71 $15.59 $14.34 $12.04 $8.83 $10.09 $9.43
per adult per adult per adult
MonThly $1,533 $2,237 $2,744 $2,524 $2,120 $3,108 $3,550 $3,319
annual $18,392 $26,847 $32,927 $30,291 $25,438 $37,295 $42,605 $39,826
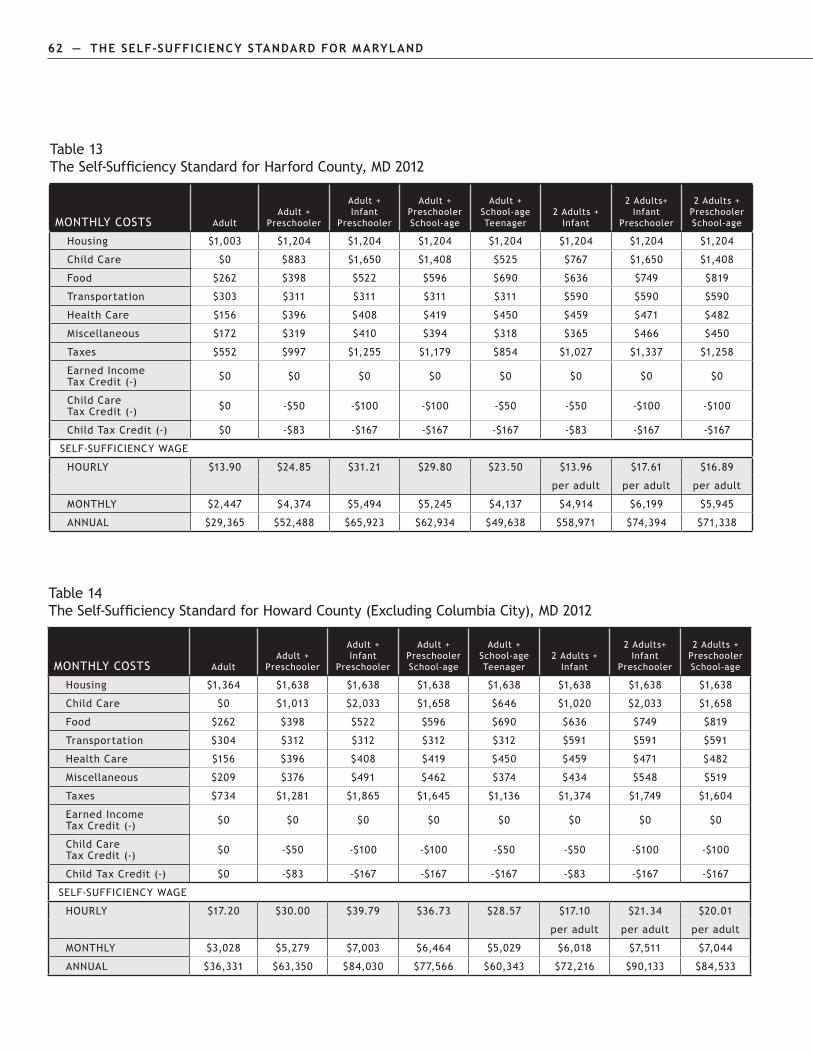
62 — the seLf-suffiCieNCY stANDARD foR mARYLAND the seLf-suffiCieNCY stANDARD foR mARYLAND — 63
Table 14 The Self-Sufficiency Standard for Howard County (Excluding Columbia City), MD 2012
MonThly coSTS adultAdult +
Preschooler
Adult + infant
Preschooler
Adult + Preschooler School-age
Adult + School-age Teenager
2 Adults + infant
2 Adults+ infant
Preschooler
2 Adults +Preschooler School-age
Housing $1,364 $1,638 $1,638 $1,638 $1,638 $1,638 $1,638 $1,638
child care $0 $1,013 $2,033 $1,658 $646 $1,020 $2,033 $1,658
food $262 $398 $522 $596 $690 $636 $749 $819
Transportation $304 $312 $312 $312 $312 $591 $591 $591
health care $156 $396 $408 $419 $450 $459 $471 $482
Miscellaneous $209 $376 $491 $462 $374 $434 $548 $519
Taxes $734 $1,281 $1,865 $1,645 $1,136 $1,374 $1,749 $1,604
earned income Tax Credit (-) $0 $0 $0 $0 $0 $0 $0 $0
child care Tax Credit (-) $0 -$50 -$100 -$100 -$50 -$50 -$100 -$100
Child Tax Credit (-) $0 -$83 -$167 -$167 -$167 -$83 -$167 -$167
Self-Sufficiency waGe
hourly $17.20 $30.00 $39.79 $36.73 $28.57 $17.10 $21.34 $20.01
per adult per adult per adult
MonThly $3,028 $5,279 $7,003 $6,464 $5,029 $6,018 $7,511 $7,044
annual $36,331 $63,350 $84,030 $77,566 $60,343 $72,216 $90,133 $84,533
Table 13 The Self-Sufficiency Standard for Harford County, MD 2012
MonThly coSTS adultAdult +
Preschooler
Adult + infant
Preschooler
Adult + Preschooler School-age
Adult + School-age Teenager
2 Adults + infant
2 Adults+ infant
Preschooler
2 Adults +Preschooler School-age
Housing $1,003 $1,204 $1,204 $1,204 $1,204 $1,204 $1,204 $1,204
child care $0 $883 $1,650 $1,408 $525 $767 $1,650 $1,408
food $262 $398 $522 $596 $690 $636 $749 $819
Transportation $303 $311 $311 $311 $311 $590 $590 $590
health care $156 $396 $408 $419 $450 $459 $471 $482
Miscellaneous $172 $319 $410 $394 $318 $365 $466 $450
Taxes $552 $997 $1,255 $1,179 $854 $1,027 $1,337 $1,258
earned income Tax Credit (-) $0 $0 $0 $0 $0 $0 $0 $0
child care Tax Credit (-) $0 -$50 -$100 -$100 -$50 -$50 -$100 -$100
Child Tax Credit (-) $0 -$83 -$167 -$167 -$167 -$83 -$167 -$167
Self-Sufficiency waGe
hourly $13.90 $24.85 $31.21 $29.80 $23.50 $13.96 $17.61 $16.89
per adult per adult per adult
MonThly $2,447 $4,374 $5,494 $5,245 $4,137 $4,914 $6,199 $5,945
annual $29,365 $52,488 $65,923 $62,934 $49,638 $58,971 $74,394 $71,338
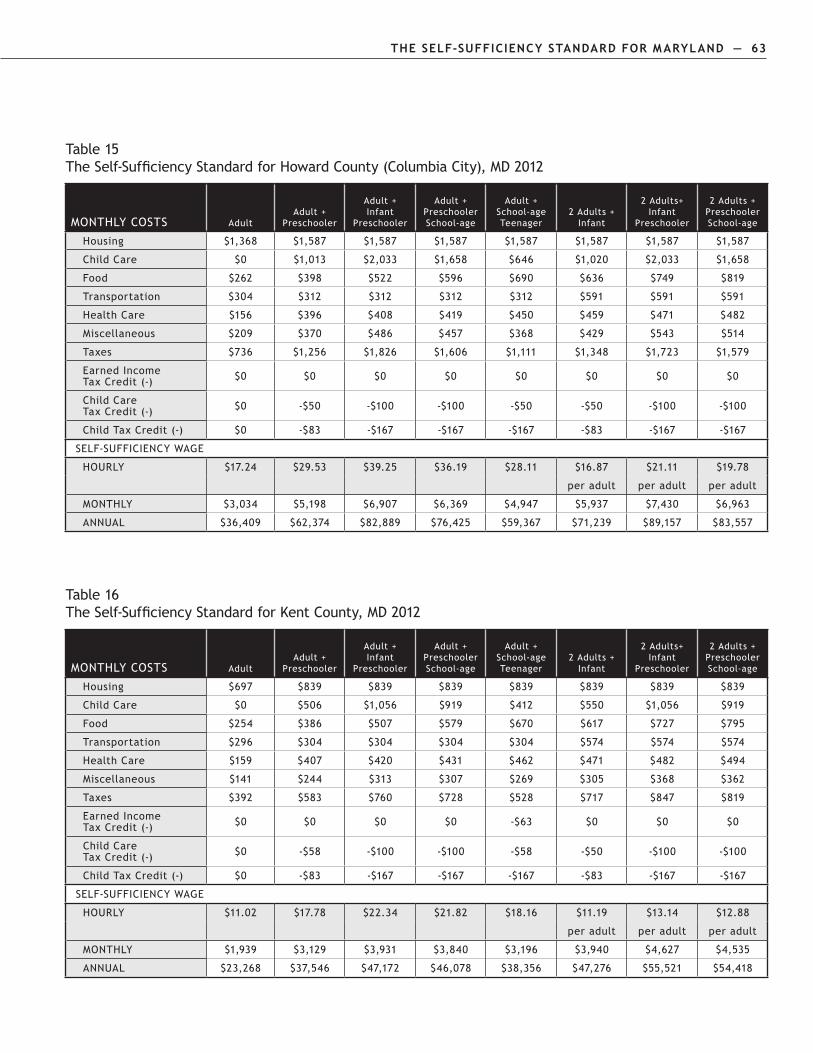
62 — the seLf-suffiCieNCY stANDARD foR mARYLAND the seLf-suffiCieNCY stANDARD foR mARYLAND — 63
Table 15 The Self-Sufficiency Standard for Howard County (Columbia City), MD 2012
MonThly coSTS adultAdult +
Preschooler
Adult + infant
Preschooler
Adult + Preschooler School-age
Adult + School-age Teenager
2 Adults + infant
2 Adults+ infant
Preschooler
2 Adults +Preschooler School-age
Housing $1,368 $1,587 $1,587 $1,587 $1,587 $1,587 $1,587 $1,587
child care $0 $1,013 $2,033 $1,658 $646 $1,020 $2,033 $1,658
food $262 $398 $522 $596 $690 $636 $749 $819
Transportation $304 $312 $312 $312 $312 $591 $591 $591
health care $156 $396 $408 $419 $450 $459 $471 $482
Miscellaneous $209 $370 $486 $457 $368 $429 $543 $514
Taxes $736 $1,256 $1,826 $1,606 $1,111 $1,348 $1,723 $1,579
earned income Tax Credit (-) $0 $0 $0 $0 $0 $0 $0 $0
child care Tax Credit (-) $0 -$50 -$100 -$100 -$50 -$50 -$100 -$100
Child Tax Credit (-) $0 -$83 -$167 -$167 -$167 -$83 -$167 -$167
Self-Sufficiency waGe
hourly $17.24 $29.53 $39.25 $36.19 $28.11 $16.87 $21.11 $19.78
per adult per adult per adult
MonThly $3,034 $5,198 $6,907 $6,369 $4,947 $5,937 $7,430 $6,963
annual $36,409 $62,374 $82,889 $76,425 $59,367 $71,239 $89,157 $83,557
Table 16 The Self-Sufficiency Standard for Kent County, MD 2012
MonThly coSTS adultAdult +
Preschooler
Adult + infant
Preschooler
Adult + Preschooler School-age
Adult + School-age Teenager
2 Adults + infant
2 Adults+ infant
Preschooler
2 Adults +Preschooler School-age
Housing $697 $839 $839 $839 $839 $839 $839 $839
child care $0 $506 $1,056 $919 $412 $550 $1,056 $919
food $254 $386 $507 $579 $670 $617 $727 $795
Transportation $296 $304 $304 $304 $304 $574 $574 $574
health care $159 $407 $420 $431 $462 $471 $482 $494
Miscellaneous $141 $244 $313 $307 $269 $305 $368 $362
Taxes $392 $583 $760 $728 $528 $717 $847 $819
earned income Tax Credit (-) $0 $0 $0 $0 -$63 $0 $0 $0
child care Tax Credit (-) $0 -$58 -$100 -$100 -$58 -$50 -$100 -$100
Child Tax Credit (-) $0 -$83 -$167 -$167 -$167 -$83 -$167 -$167
Self-Sufficiency waGe
hourly $11.02 $17.78 $22.34 $21.82 $18.16 $11.19 $13.14 $12.88
per adult per adult per adult
MonThly $1,939 $3,129 $3,931 $3,840 $3,196 $3,940 $4,627 $4,535
annual $23,268 $37,546 $47,172 $46,078 $38,356 $47,276 $55,521 $54,418
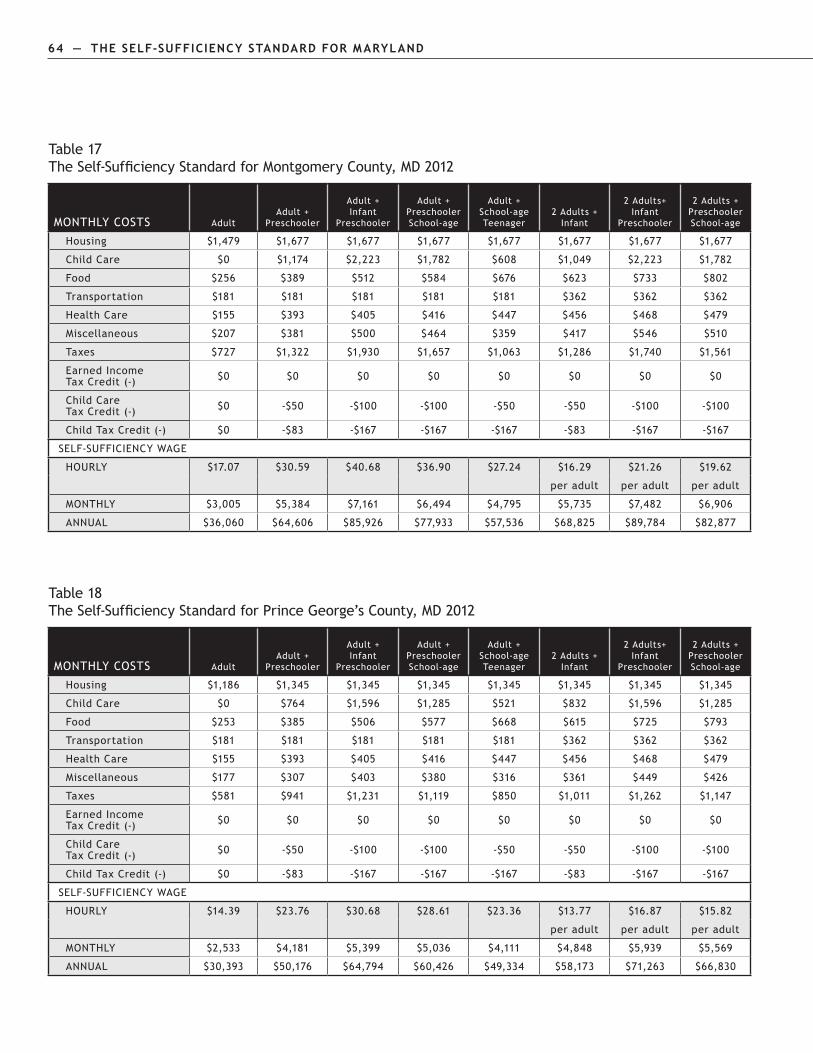
64 — the seLf-suffiCieNCY stANDARD foR mARYLAND the seLf-suffiCieNCY stANDARD foR mARYLAND — 65
Table 18 The Self-Sufficiency Standard for Prince George’s County, MD 2012
MonThly coSTS adultAdult +
Preschooler
Adult + infant
Preschooler
Adult + Preschooler School-age
Adult + School-age Teenager
2 Adults + infant
2 Adults+ infant
Preschooler
2 Adults +Preschooler School-age
Housing $1,186 $1,345 $1,345 $1,345 $1,345 $1,345 $1,345 $1,345
child care $0 $764 $1,596 $1,285 $521 $832 $1,596 $1,285
food $253 $385 $506 $577 $668 $615 $725 $793
Transportation $181 $181 $181 $181 $181 $362 $362 $362
health care $155 $393 $405 $416 $447 $456 $468 $479
Miscellaneous $177 $307 $403 $380 $316 $361 $449 $426
Taxes $581 $941 $1,231 $1,119 $850 $1,011 $1,262 $1,147
earned income Tax Credit (-) $0 $0 $0 $0 $0 $0 $0 $0
child care Tax Credit (-) $0 -$50 -$100 -$100 -$50 -$50 -$100 -$100
Child Tax Credit (-) $0 -$83 -$167 -$167 -$167 -$83 -$167 -$167
Self-Sufficiency waGe
hourly $14.39 $23.76 $30.68 $28.61 $23.36 $13.77 $16.87 $15.82
per adult per adult per adult
MonThly $2,533 $4,181 $5,399 $5,036 $4,111 $4,848 $5,939 $5,569
annual $30,393 $50,176 $64,794 $60,426 $49,334 $58,173 $71,263 $66,830
Table 17 The Self-Sufficiency Standard for Montgomery County, MD 2012
MonThly coSTS adultAdult +
Preschooler
Adult + infant
Preschooler
Adult + Preschooler School-age
Adult + School-age Teenager
2 Adults + infant
2 Adults+ infant
Preschooler
2 Adults +Preschooler School-age
Housing $1,479 $1,677 $1,677 $1,677 $1,677 $1,677 $1,677 $1,677
child care $0 $1,174 $2,223 $1,782 $608 $1,049 $2,223 $1,782
food $256 $389 $512 $584 $676 $623 $733 $802
Transportation $181 $181 $181 $181 $181 $362 $362 $362
health care $155 $393 $405 $416 $447 $456 $468 $479
Miscellaneous $207 $381 $500 $464 $359 $417 $546 $510
Taxes $727 $1,322 $1,930 $1,657 $1,063 $1,286 $1,740 $1,561
earned income Tax Credit (-) $0 $0 $0 $0 $0 $0 $0 $0
child care Tax Credit (-) $0 -$50 -$100 -$100 -$50 -$50 -$100 -$100
Child Tax Credit (-) $0 -$83 -$167 -$167 -$167 -$83 -$167 -$167
Self-Sufficiency waGe
hourly $17.07 $30.59 $40.68 $36.90 $27.24 $16.29 $21.26 $19.62
per adult per adult per adult
MonThly $3,005 $5,384 $7,161 $6,494 $4,795 $5,735 $7,482 $6,906
annual $36,060 $64,606 $85,926 $77,933 $57,536 $68,825 $89,784 $82,877
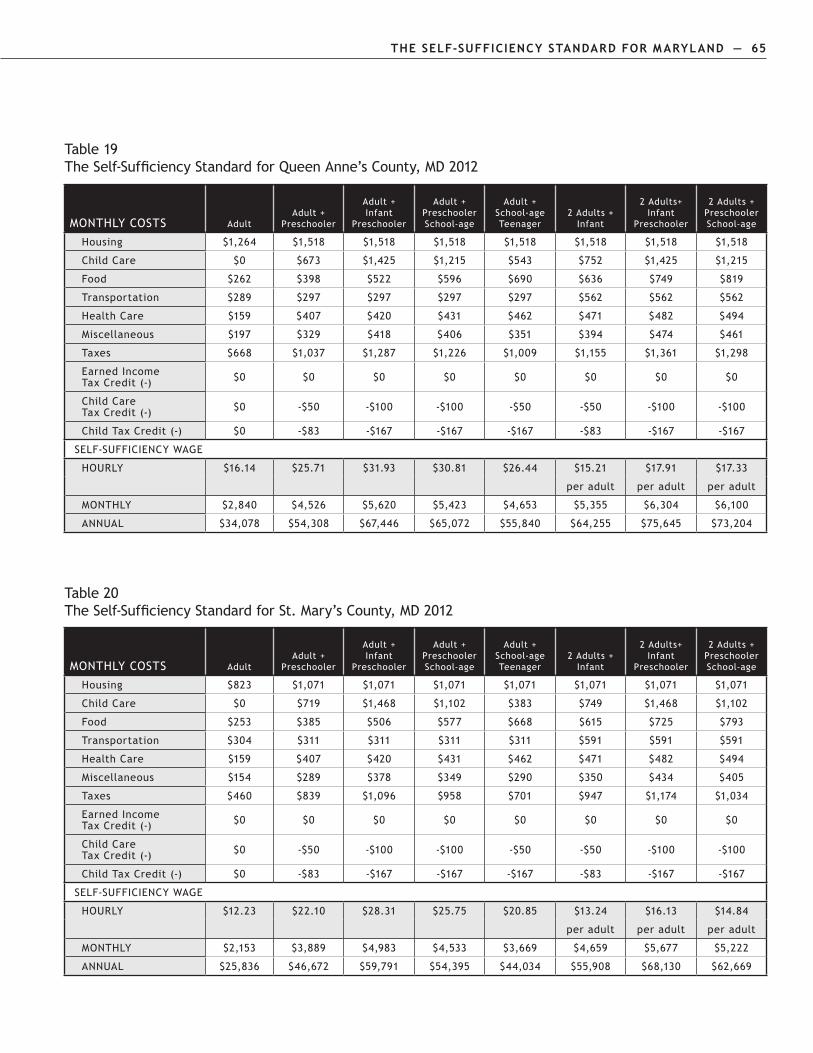
64 — the seLf-suffiCieNCY stANDARD foR mARYLAND the seLf-suffiCieNCY stANDARD foR mARYLAND — 65
Table 19 The Self-Sufficiency Standard for Queen Anne’s County, MD 2012
MonThly coSTS adultAdult +
Preschooler
Adult + infant
Preschooler
Adult + Preschooler School-age
Adult + School-age Teenager
2 Adults + infant
2 Adults+ infant
Preschooler
2 Adults +Preschooler School-age
Housing $1,264 $1,518 $1,518 $1,518 $1,518 $1,518 $1,518 $1,518
child care $0 $673 $1,425 $1,215 $543 $752 $1,425 $1,215
food $262 $398 $522 $596 $690 $636 $749 $819
Transportation $289 $297 $297 $297 $297 $562 $562 $562
health care $159 $407 $420 $431 $462 $471 $482 $494
Miscellaneous $197 $329 $418 $406 $351 $394 $474 $461
Taxes $668 $1,037 $1,287 $1,226 $1,009 $1,155 $1,361 $1,298
earned income Tax Credit (-) $0 $0 $0 $0 $0 $0 $0 $0
child care Tax Credit (-) $0 -$50 -$100 -$100 -$50 -$50 -$100 -$100
Child Tax Credit (-) $0 -$83 -$167 -$167 -$167 -$83 -$167 -$167
Self-Sufficiency waGe
hourly $16.14 $25.71 $31.93 $30.81 $26.44 $15.21 $17.91 $17.33
per adult per adult per adult
MonThly $2,840 $4,526 $5,620 $5,423 $4,653 $5,355 $6,304 $6,100
annual $34,078 $54,308 $67,446 $65,072 $55,840 $64,255 $75,645 $73,204
Table 20 The Self-Sufficiency Standard for St. Mary’s County, MD 2012
MonThly coSTS adultAdult +
Preschooler
Adult + infant
Preschooler
Adult + Preschooler School-age
Adult + School-age Teenager
2 Adults + infant
2 Adults+ infant
Preschooler
2 Adults +Preschooler School-age
Housing $823 $1,071 $1,071 $1,071 $1,071 $1,071 $1,071 $1,071
child care $0 $719 $1,468 $1,102 $383 $749 $1,468 $1,102
food $253 $385 $506 $577 $668 $615 $725 $793
Transportation $304 $311 $311 $311 $311 $591 $591 $591
health care $159 $407 $420 $431 $462 $471 $482 $494
Miscellaneous $154 $289 $378 $349 $290 $350 $434 $405
Taxes $460 $839 $1,096 $958 $701 $947 $1,174 $1,034
earned income Tax Credit (-) $0 $0 $0 $0 $0 $0 $0 $0
child care Tax Credit (-) $0 -$50 -$100 -$100 -$50 -$50 -$100 -$100
Child Tax Credit (-) $0 -$83 -$167 -$167 -$167 -$83 -$167 -$167
Self-Sufficiency waGe
hourly $12.23 $22.10 $28.31 $25.75 $20.85 $13.24 $16.13 $14.84
per adult per adult per adult
MonThly $2,153 $3,889 $4,983 $4,533 $3,669 $4,659 $5,677 $5,222
annual $25,836 $46,672 $59,791 $54,395 $44,034 $55,908 $68,130 $62,669
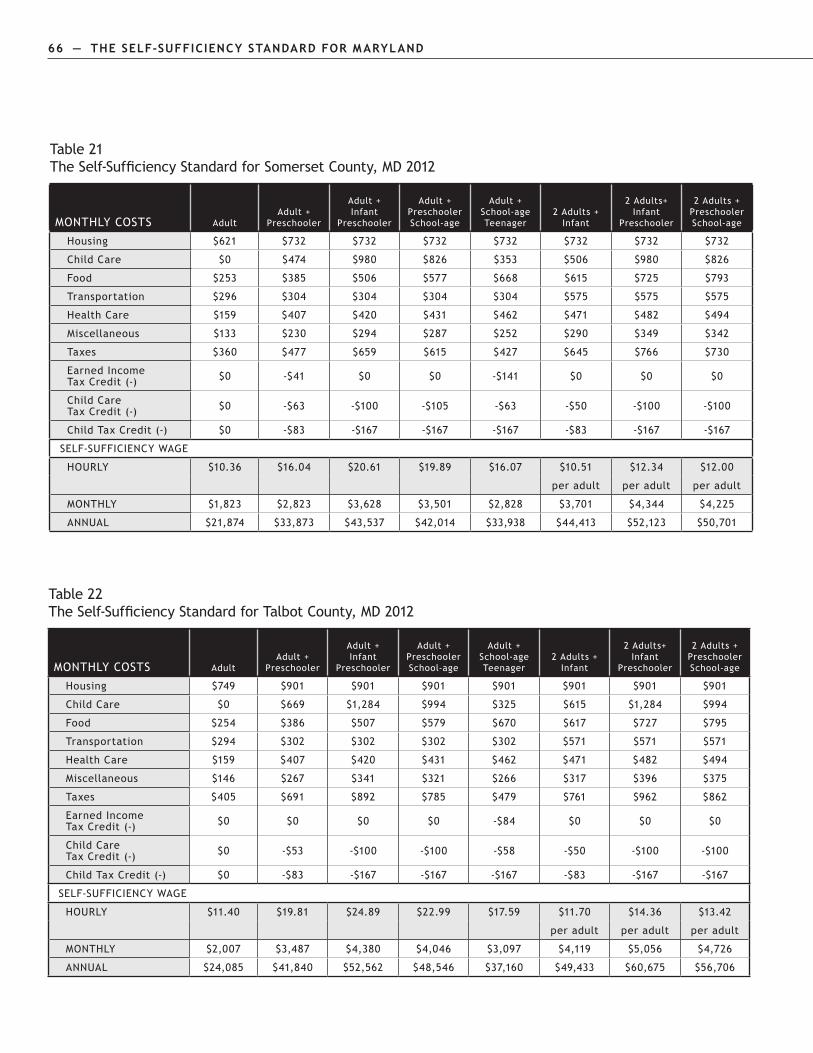
66 — the seLf-suffiCieNCY stANDARD foR mARYLAND the seLf-suffiCieNCY stANDARD foR mARYLAND — 67
Table 22 The Self-Sufficiency Standard for Talbot County, MD 2012
MonThly coSTS adultAdult +
Preschooler
Adult + infant
Preschooler
Adult + Preschooler School-age
Adult + School-age Teenager
2 Adults + infant
2 Adults+ infant
Preschooler
2 Adults +Preschooler School-age
Housing $749 $901 $901 $901 $901 $901 $901 $901
child care $0 $669 $1,284 $994 $325 $615 $1,284 $994
food $254 $386 $507 $579 $670 $617 $727 $795
Transportation $294 $302 $302 $302 $302 $571 $571 $571
health care $159 $407 $420 $431 $462 $471 $482 $494
Miscellaneous $146 $267 $341 $321 $266 $317 $396 $375
Taxes $405 $691 $892 $785 $479 $761 $962 $862
earned income Tax Credit (-) $0 $0 $0 $0 -$84 $0 $0 $0
child care Tax Credit (-) $0 -$53 -$100 -$100 -$58 -$50 -$100 -$100
Child Tax Credit (-) $0 -$83 -$167 -$167 -$167 -$83 -$167 -$167
Self-Sufficiency waGe
hourly $11.40 $19.81 $24.89 $22.99 $17.59 $11.70 $14.36 $13.42
per adult per adult per adult
MonThly $2,007 $3,487 $4,380 $4,046 $3,097 $4,119 $5,056 $4,726
annual $24,085 $41,840 $52,562 $48,546 $37,160 $49,433 $60,675 $56,706
Table 21 The Self-Sufficiency Standard for Somerset County, MD 2012
MonThly coSTS adultAdult +
Preschooler
Adult + infant
Preschooler
Adult + Preschooler School-age
Adult + School-age Teenager
2 Adults + infant
2 Adults+ infant
Preschooler
2 Adults +Preschooler School-age
Housing $621 $732 $732 $732 $732 $732 $732 $732
child care $0 $474 $980 $826 $353 $506 $980 $826
food $253 $385 $506 $577 $668 $615 $725 $793
Transportation $296 $304 $304 $304 $304 $575 $575 $575
health care $159 $407 $420 $431 $462 $471 $482 $494
Miscellaneous $133 $230 $294 $287 $252 $290 $349 $342
Taxes $360 $477 $659 $615 $427 $645 $766 $730
earned income Tax Credit (-) $0 -$41 $0 $0 -$141 $0 $0 $0
child care Tax Credit (-) $0 -$63 -$100 -$105 -$63 -$50 -$100 -$100
Child Tax Credit (-) $0 -$83 -$167 -$167 -$167 -$83 -$167 -$167
Self-Sufficiency waGe
hourly $10.36 $16.04 $20.61 $19.89 $16.07 $10.51 $12.34 $12.00
per adult per adult per adult
MonThly $1,823 $2,823 $3,628 $3,501 $2,828 $3,701 $4,344 $4,225
annual $21,874 $33,873 $43,537 $42,014 $33,938 $44,413 $52,123 $50,701
66 — the seLf-suffiCieNCY stANDARD foR mARYLAND the seLf-suffiCieNCY stANDARD foR mARYLAND — 67
Table 23 The Self-Sufficiency Standard for Washington County, MD 2012
MonThly coSTS adultAdult +
Preschooler
Adult + infant
Preschooler
Adult + Preschooler School-age
Adult + School-age Teenager
2 Adults + infant
2 Adults+ infant
Preschooler
2 Adults +Preschooler School-age
Housing $658 $842 $842 $842 $842 $842 $842 $842
child care $0 $608 $1,194 $883 $276 $586 $1,194 $883
food $253 $385 $506 $577 $668 $615 $725 $793
Transportation $286 $293 $293 $293 $293 $555 $555 $555
health care $153 $387 $400 $411 $442 $450 $462 $474
Miscellaneous $135 $252 $323 $301 $252 $305 $378 $355
Taxes $365 $625 $820 $686 $432 $714 $893 $781
earned income Tax Credit (-) $0 $0 $0 $0 -$139 $0 $0 $0
child care Tax Credit (-) $0 -$55 -$100 -$100 -$63 -$50 -$100 -$100
Child Tax Credit (-) $0 -$83 -$167 -$167 -$167 -$83 -$167 -$167
Self-Sufficiency waGe
hourly $10.51 $18.48 $23.36 $21.18 $16.12 $11.18 $13.58 $12.54
per adult per adult per adult
MonThly $1,850 $3,253 $4,111 $3,727 $2,837 $3,934 $4,781 $4,415
annual $22,197 $39,040 $49,332 $44,724 $34,045 $47,212 $57,375 $52,981
Table 24 The Self-Sufficiency Standard for Wicomico County, MD 2012
MonThly coSTS adultAdult +
Preschooler
Adult + infant
Preschooler
Adult + Preschooler School-age
Adult + School-age Teenager
2 Adults + infant
2 Adults+ infant
Preschooler
2 Adults +Preschooler School-age
Housing $778 $914 $914 $914 $914 $914 $914 $914
child care $0 $533 $1,127 $892 $358 $593 $1,127 $892
food $253 $385 $506 $577 $668 $615 $725 $793
Transportation $296 $304 $304 $304 $304 $575 $575 $575
health care $159 $407 $420 $431 $462 $471 $482 $494
Miscellaneous $149 $254 $327 $312 $271 $317 $382 $367
Taxes $437 $647 $852 $763 $560 $788 $926 $850
earned income Tax Credit (-) $0 $0 $0 $0 -$48 $0 $0 $0
child care Tax Credit (-) $0 -$55 -$100 -$100 -$55 -$50 -$100 -$100
Child Tax Credit (-) $0 -$83 -$167 -$167 -$167 -$83 -$167 -$167
Self-Sufficiency waGe
hourly $11.77 $18.79 $23.76 $22.30 $18.56 $11.76 $13.82 $13.12
per adult per adult per adult
MonThly $2,072 $3,307 $4,182 $3,926 $3,267 $4,139 $4,865 $4,617
annual $24,863 $39,683 $50,187 $47,108 $39,199 $49,670 $58,378 $55,402
68 — the seLf-suffiCieNCY stANDARD foR mARYLAND
Table 25 The Self-Sufficiency Standard for Worcester County, MD 2012
MonThly coSTS adultAdult +
Preschooler
Adult + infant
Preschooler
Adult + Preschooler School-age
Adult + School-age Teenager
2 Adults + infant
2 Adults+ infant
Preschooler
2 Adults +Preschooler School-age
Housing $781 $905 $905 $905 $905 $905 $905 $905
child care $0 $584 $1,199 $912 $328 $615 $1,199 $912
food $253 $385 $506 $577 $668 $615 $725 $793
Transportation $296 $304 $304 $304 $304 $575 $575 $575
health care $159 $407 $420 $431 $462 $471 $482 $494
Miscellaneous $149 $259 $333 $313 $267 $318 $389 $368
Taxes $402 $616 $821 $711 $450 $731 $887 $794
earned income Tax Credit (-) $0 $0 $0 $0 -$90 $0 $0 $0
child care Tax Credit (-) $0 -$55 -$100 -$100 -$60 -$50 -$100 -$100
Child Tax Credit (-) $0 -$83 -$167 -$167 -$167 -$83 -$167 -$167
Self-Sufficiency waGe
hourly $11.59 $18.87 $23.99 $22.08 $17.42 $11.64 $13.91 $12.99
per adult per adult per adult
MonThly $2,041 $3,322 $4,221 $3,886 $3,067 $4,096 $4,896 $4,573
annual $24,487 $39,861 $50,657 $46,634 $36,800 $49,158 $58,749 $54,882

the seLf-suffiCieNCY stANDARD foR mARYLAND — 69
Appendix E. impact of Work supports on Wage Adequacy One Adult, One Preschooler, and One School-age Child Somerset County, MD 2012
#1 #2 #3 #4
maryland 2011 minimum Wage maryland Living Wage
median hourly Wage of maryland occupations
Retail salesperson office Clerks
HOURLY WAGE: $7.25 $9.39 $10.33 $14.24
TOTAL MONTHLY INCOME: $1,276 $1,653 $1,818 $2,506
PANEL A: NO WORk SUPPORTS
MONTHLY COSTS:
housing $732 $732 $732 $732
Child Care $826 $826 $826 $826
food $577 $577 $577 $577
transportation $304 $304 $304 $304
health Care $431 $431 $431 $431
miscellaneous $287 $287 $287 $287
taxes ($72) $37 $78 $269
tax Credits (-) * $0 $0 ($14) ($83)
totAL moNthLY exPeNses $3,085 $3,195 $3,221 $3,344
shoRtfALL (-) oR suRPLus ($1,809) ($1,542) ($1,403) ($838)
WAGe ADeQuACY total income/total expenses 41% 52% 56% 75%
PANEL B: WORkING CONNNECTIONS CHILD CARE ASSISTANCE
MONTHLY COSTS:
housing $732 $732 $732 $732
Child Care $69 $170 $209 $826
food $577 $577 $577 $577
transportation $304 $304 $304 $304
health Care $431 $431 $431 $431
miscellaneous $287 $287 $287 $287
taxes ($72) $37 $78 $269
tax Credits (-) * $0 $0 ($14) ($83)
totAL moNthLY exPeNses $2,328 $2,539 $2,604 $3,344
shoRtfALL (-) oR suRPLus ($1,052) ($886) ($786) ($838)
WAGe ADeQuACY total income/total expenses 55% 65% 70% 75%
ANNUAL REFUNDABLE TAX CREDITS*:
Annual federal eitC $5,236 $4,659 $4,241 $2,501
Annual state eitC $0 $0 $0 $625
Annual federal CtC $1,847 $2,000 $2,000 $2,000
* The Standard shows refundable and nonrefundable tax credits as if they are received monthly. However, in order to be as realistic as possible, tax credits that are available as a refund on annual taxes are shown at the bottom of this table. EITC is shown only as an annual tax credits. The nonrefundable portions of the Child Tax Credit (which is a credit against federal taxes) is shown as available to offset monthly costs, and the refundable portions are shown in the bottom of the table. The Child Care Tax Credit on the other hand is nonrefundable, and therefore is only shown as part of the monthly budget and does not appear in the bottom shaded rows of the table. See the discussion in Appendix A: Methodology, Assumptions, and Sources titled Treatment of Tax Credits in the Modeling Table and Wage Adequacy Figure.
Appendix E: Impact of Work Supports on Wage Adequacy

70 — the seLf-suffiCieNCY stANDARD foR mARYLAND
Table E-1 Continued. impact of Work supports on Wage Adequacy One Adult, One Preschooler, and One School-age Child Somerset County, MD 2012
#1 #2 #3 #4
maryland 2011 minimum Wage maryland Living Wage
median hourly Wage of maryland occupations
Retail salesperson office Clerks
HOURLY WAGE: $7.25 $9.39 $10.33 $14.24
TOTAL MONTHLY INCOME: $1,276 $1,653 $1,818 $2,506
PANEL C: CHILD CARE, SNAP/ WIC*, & MARYLAND CHILDREN’S HEALTH PROGRAM
MONTHLY COSTS:
housing $732 $732 $732 $732
Child Care $69 $170 $209 $826
food $154 $244 $286 $537
transportation $304 $304 $304 $304
health Care $159 $159 $159 $159
miscellaneous $287 $287 $287 $287
taxes ($72) $37 $78 $269
tax Credits (-) * $0 $0 ($14) ($83)
totAL moNthLY exPeNses $1,633 $1,934 $2,041 $3,032
shoRtfALL (-) oR suRPLus ($357) ($281) ($223) ($526)
WAGe ADeQuACY total income/total expenses 78% 85% 89% 83%
PANEL D: HOUSING, CHILD CARE, SNAP/ WIC*, & mARYLAND ChiLDReN’s heALth PRoGRAm
MONTHLY COSTS:
housing $383 $496 $545 $732
Child Care $69 $170 $209 $826
food $253 $313 $341 $537
transportation $304 $304 $304 $304
health Care $159 $159 $159 $159
miscellaneous $287 $287 $287 $287
taxes ($72) $37 $78 $269
tax Credits (-) * $0 $0 ($14) ($83)
totAL moNthLY exPeNses $1,382 $1,766 $1,909 $3,032
shoRtfALL (-) oR suRPLus ($106) ($114) ($91) ($526)
WAGe ADeQuACY total income/total expenses 92% 94% 95% 83%
ANNUAL REFUNDABLE TAX CREDITS*:
Annual federal eitC $5,236 $4,659 $4,241 $2,501
Annual state eitC $0 $0 $0 $625
Annual federal CtC $1,847 $2,000 $2,000 $2,000
* The Standard shows refundable and nonrefundable tax credits as if they are received monthly. However, in order to be as realistic as possible, tax credits that are available as a refund on annual taxes are shown at the bottom of this table. EITC is shown only as an annual tax credits. The nonrefundable portions of the Child Tax Credit (which is a credit against federal taxes) is shown as available to offset monthly costs, and the refundable portions are shown in the bottom of the table. The Child Care Tax Credit on the other hand is nonrefundable, and therefore is only shown as part of the monthly budget and does not appear in the bottom shaded rows of the table. See the discussion in Appendix A: Methodology, Assumptions, and Sources titled Treatment of Tax Credits in the Modeling Table and Wage Adequacy Figure.

A bout the AuthorDiana M. Pearce, PhD teaches at the School of Social Work, University of Washington in Seattle, Washington,
and is Director of the Center for Women’s Welfare. Recognized for coining the phrase “the feminization of
poverty,” Dr. Pearce founded and directed the Women and Poverty Project at Wider Opportunities for Women
(WOW). She has written and spoken widely on women’s poverty and economic inequality, including testimony
before Congress and the President’s Working Group on Welfare Reform. While at WOW, Dr. Pearce conceived
and developed the methodology for the Self-Sufficiency Standard and first published results in 1996 for Iowa
and California. Her areas of expertise include low-wage and part-time employment, unemployment insurance,
homelessness, and welfare reform as they impact women. Dr. Pearce has helped found and lead several
coalitions, including the Women, Work and Welfare Coalition and the Women and Job Training Coalition. She
received her PhD degree in Sociology and Social Work from the University of Michigan.

Center for Women’s Welfare…advancing economic justice through research and the Sel f-Sufficiency Standard