Embed Size (px)
Citation preview
2009 Full-year results presentation
Analysts’ & Media Conference CallBasel, 16 February 2010
2STRAUMANN 16 February 2010Copyright Straumann. All rights reserved.
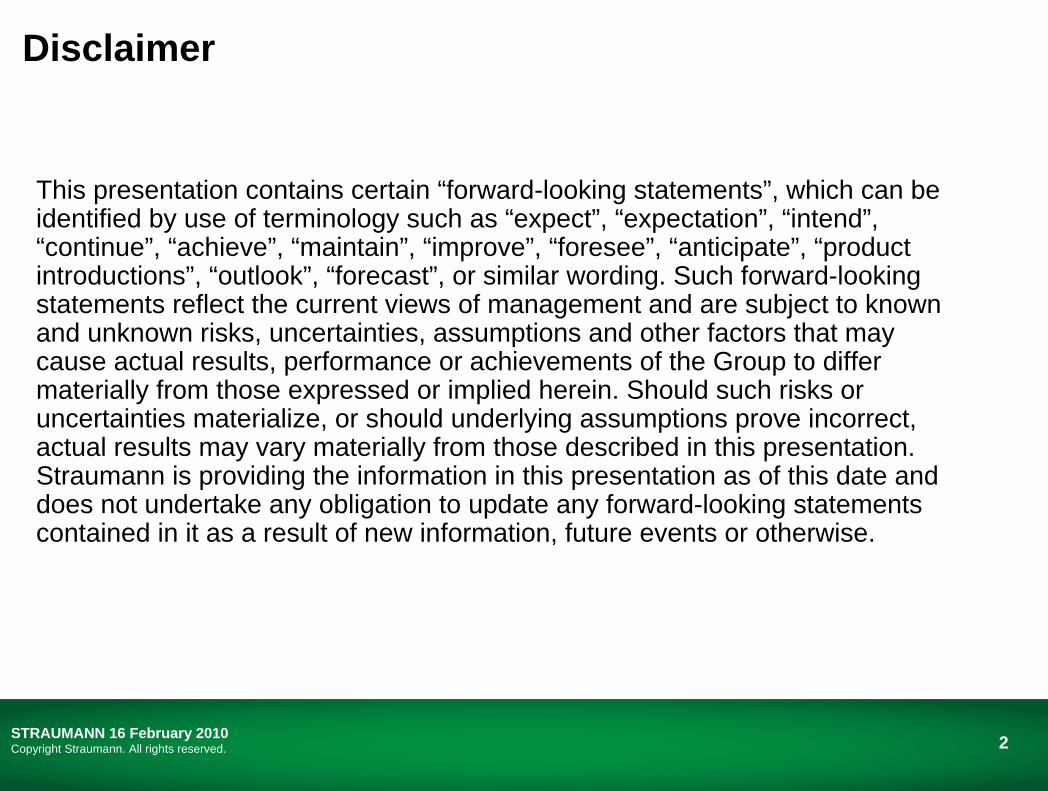
Disclaimer
This presentation contains certain “forward-looking statements”, which can be identified by use of terminology such as “expect”, “expectation”, “intend”, “continue”, “achieve”, “maintain”, “improve”, “foresee”, “anticipate”, “product introductions”, “outlook”, “forecast”, or similar wording. Such forward-looking statements reflect the current views of management and are subject to known and unknown risks, uncertainties, assumptions and other factors that may cause actual results, performance or achievements of the Group to differ materially from those expressed or implied herein. Should such risks or uncertainties materialize, or should underlying assumptions prove incorrect, actual results may vary materially from those described in this presentation. Straumann is providing the information in this presentation as of this date and does not undertake any obligation to update any forward-looking statements contained in it as a result of new information, future events or otherwise.

3STRAUMANN 16 February 2010Copyright Straumann. All rights reserved.
Full-year highlights
Business performance
Product highlights and milestones
Outlook
Questions & answers
Agenda
Full-year highlights
Gilbert AchermannPresident & CEO
5STRAUMANN 16 February 2010Copyright Straumann. All rights reserved.
-15%
-5%
5%
15%
25%
Q1 Q2 Q3 Q4 Q1 Q2 Q3 Q4 Q1 Q2 Q3 Q4
Straumann Other leading implant companies*
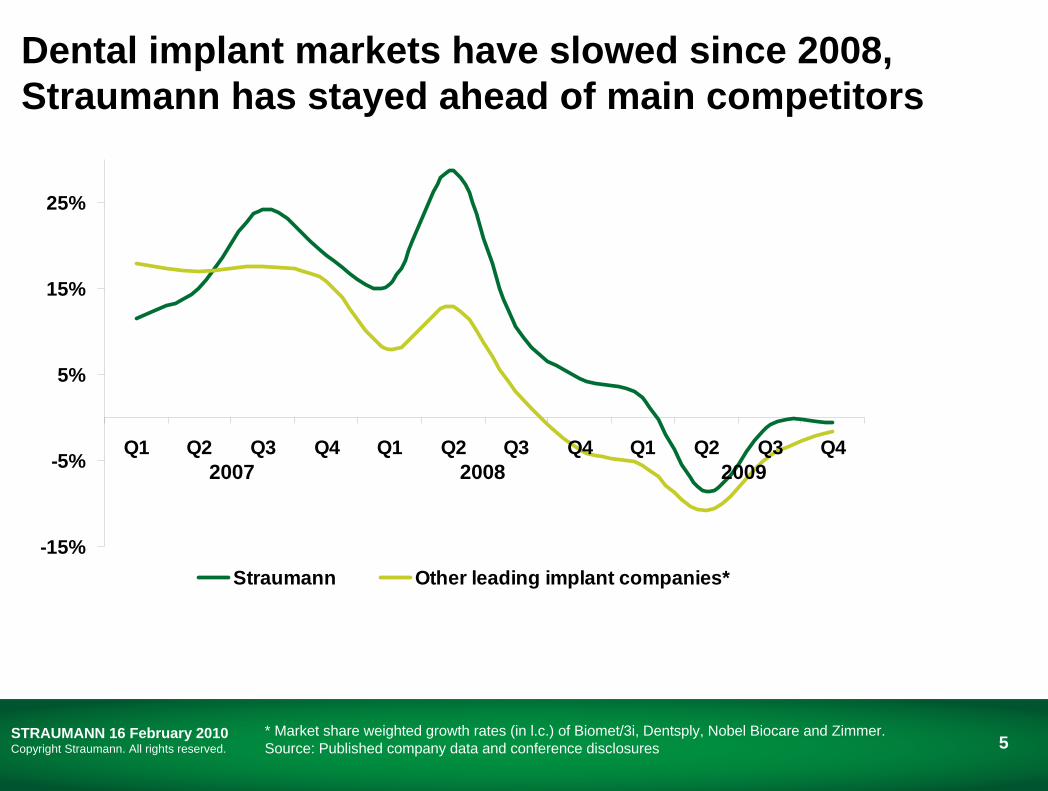
Dental implant markets have slowed since 2008, Straumann has stayed ahead of main competitors
* Market share weighted growth rates (in l.c.) of Biomet/3i, Dentsply, Nobel Biocare and Zimmer. Source: Published company data and conference disclosures
2007 2008 2009
6STRAUMANN 16 February 2010Copyright Straumann. All rights reserved.
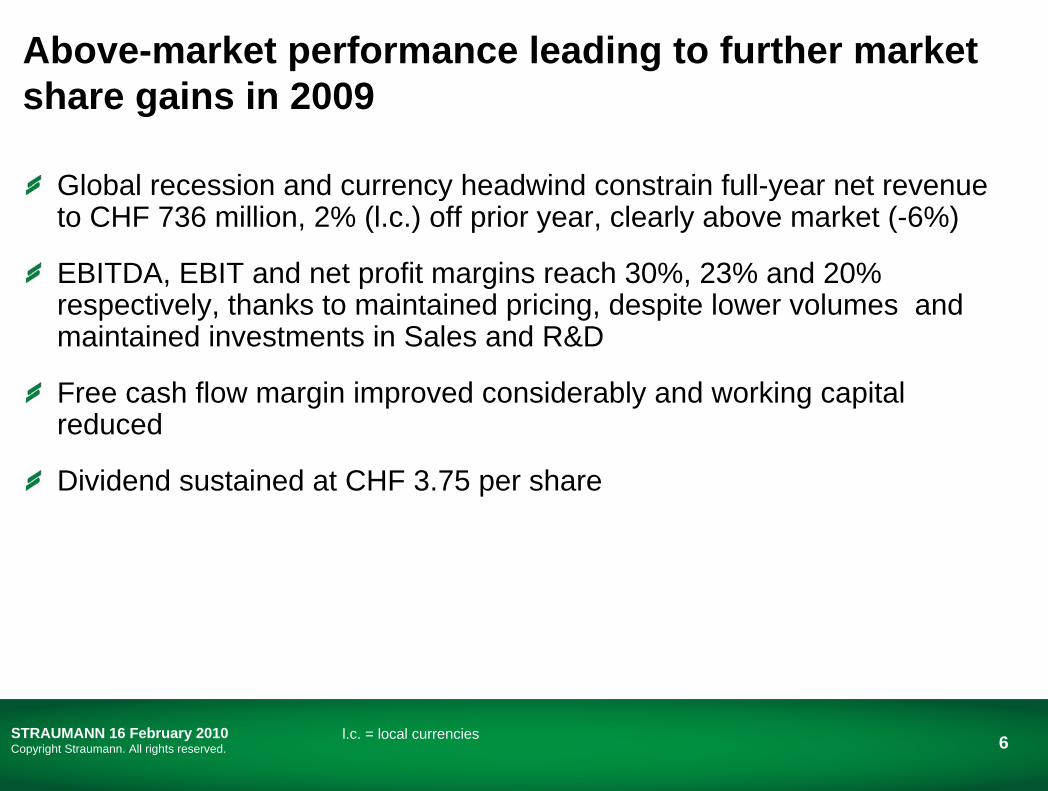
Above-market performance leading to further market share gains in 2009
Global recession and currency headwind constrain full-year net revenue to CHF 736 million, 2% (l.c.) off prior year, clearly above market (-6%)
EBITDA, EBIT and net profit margins reach 30%, 23% and 20% respectively, thanks to maintained pricing, despite lower volumes and maintained investments in Sales and R&D
Free cash flow margin improved considerably and working capital reduced
Dividend sustained at CHF 3.75 per share
l.c. = local currencies
7STRAUMANN 16 February 2010Copyright Straumann. All rights reserved.
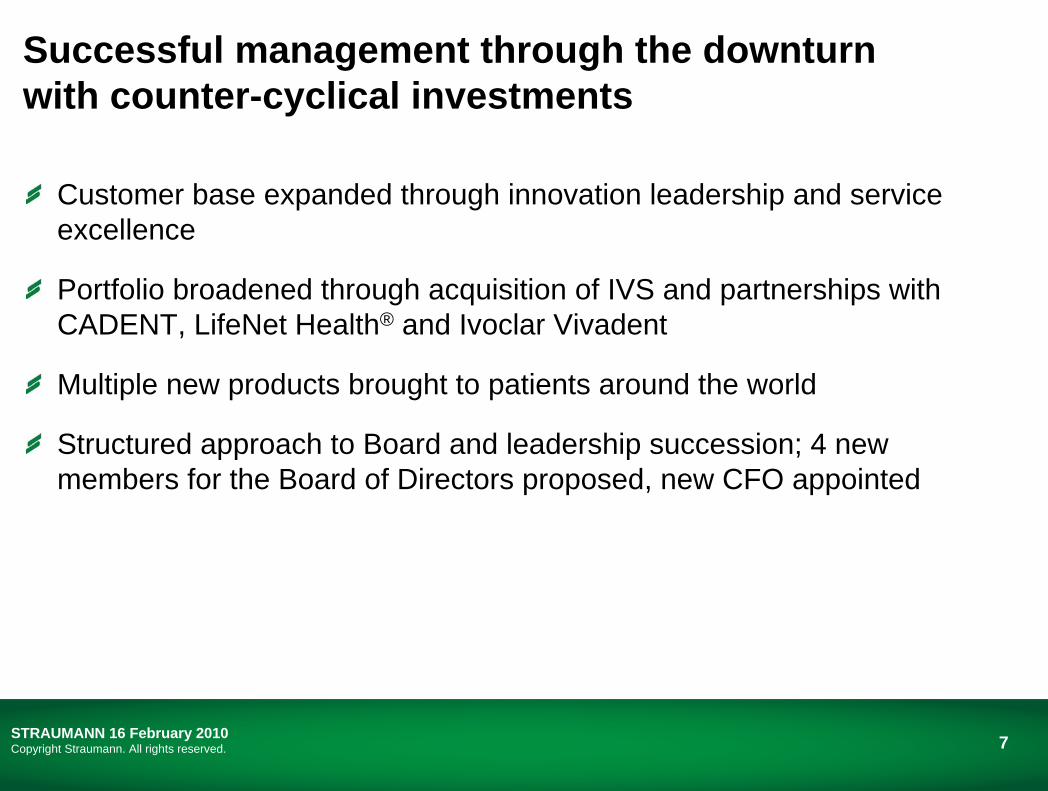
Customer base expanded through innovation leadership and serviceexcellence
Portfolio broadened through acquisition of IVS and partnerships with CADENT, LifeNet Health® and Ivoclar Vivadent
Multiple new products brought to patients around the world
Structured approach to Board and leadership succession; 4 new members for the Board of Directors proposed, new CFO appointed
Successful management through the downturn with counter-cyclical investments

Business performance
Beat SpalingerChief Financial Officer
9STRAUMANN 16 February 2010Copyright Straumann. All rights reserved.
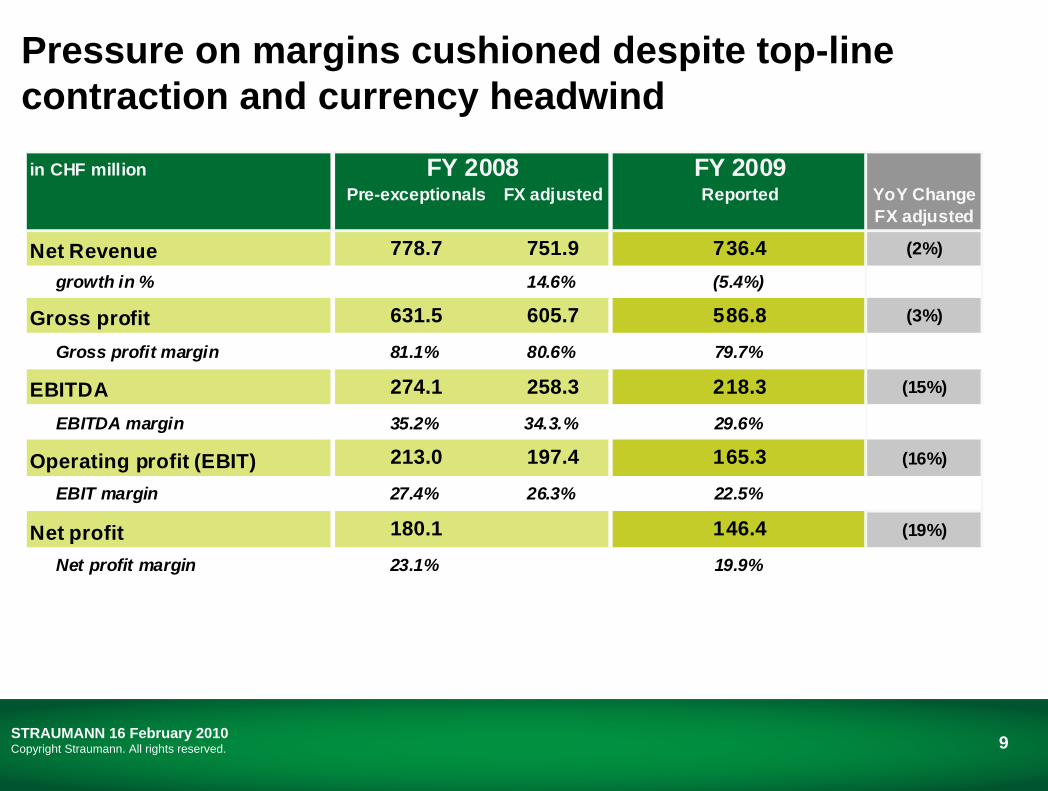
Pressure on margins cushioned despite top-line contraction and currency headwind
in CHF million FY 2009Pre-exceptionals FX adjusted Reported YoY Change
FX adjusted
Net Revenue 778.7 751.9 736.4 (2%)
growth in % 14.6% (5.4%)
Gross profit 631.5 605.7 586.8 (3%)
Gross profit margin 81.1% 80.6% 79.7%
EBITDA 274.1 258.3 218.3 (15%)
EBITDA margin 35.2% 34.3.% 29.6%
Operating profit (EBIT) 213.0 197.4 165.3 (16%)
EBIT margin 27.4% 26.3% 22.5%
Net profit 180.1 146.4 (19%)
Net profit margin 23.1% 19.9%
FY 2008
10STRAUMANN 16 February 2010Copyright Straumann. All rights reserved.
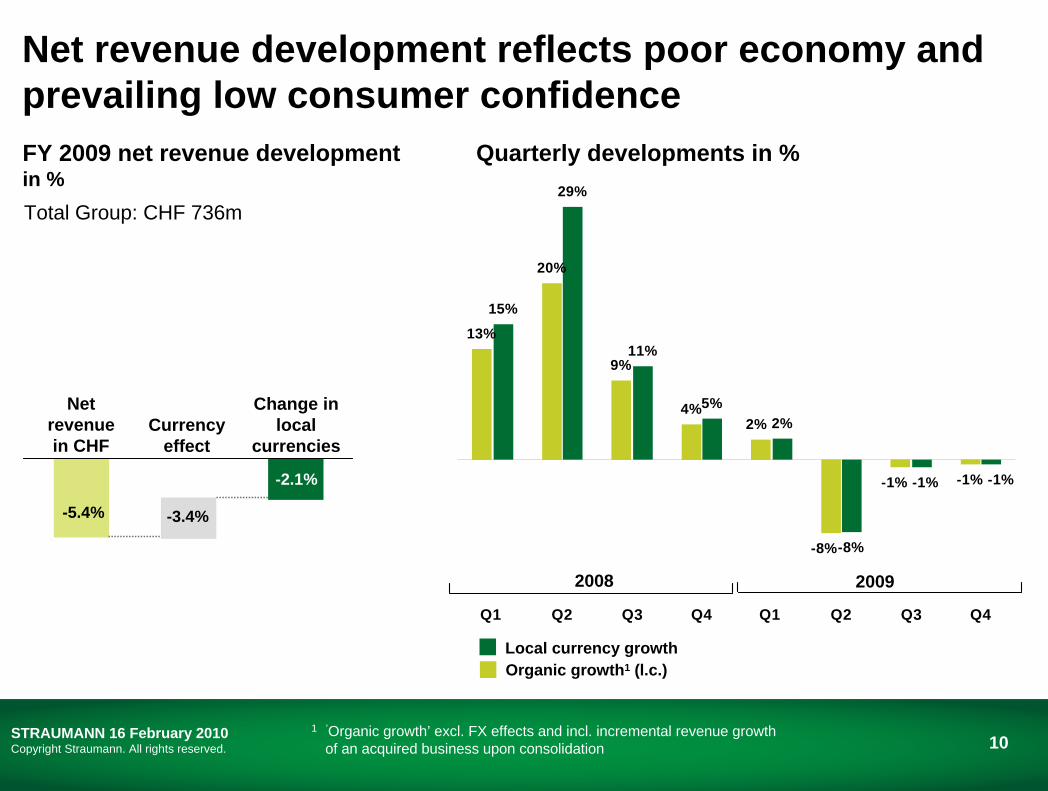
13%
20%
9%
4%
-1%
15%
29%
11%
5%2%
-8%-8%
2%
-1% -1%-1%
Q1 Q2 Q3 Q4 Q1 Q2 Q3 Q4
Organic growth1 (l.c.)Local currency growth
2008 2009
Change in local
currencies
Net revenue in CHF
Currency effect
-5.4% -3.4%
-2.1%
FY 2009 net revenue developmentin %
Quarterly developments in %
Total Group: CHF 736m
1 ’Organic growth’ excl. FX effects and incl. incremental revenue growthof an acquired business upon consolidation
Net revenue development reflects poor economy and prevailing low consumer confidence
11STRAUMANN 16 February 2010Copyright Straumann. All rights reserved.
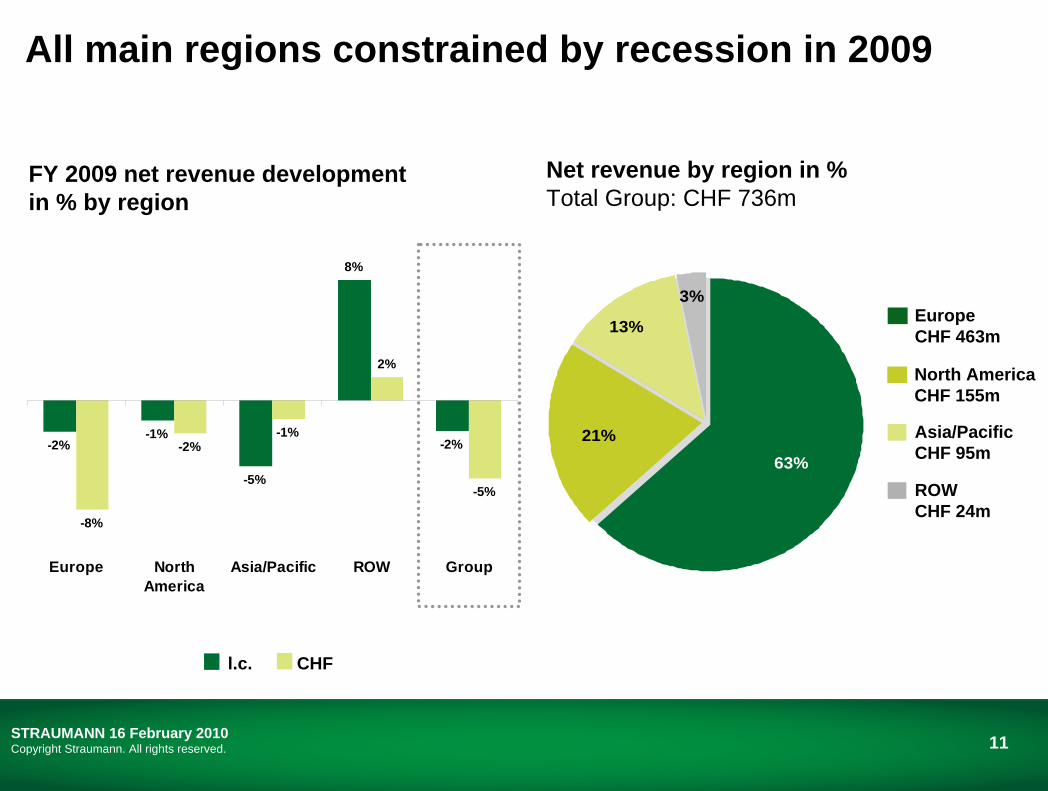
-2%-1%
-5%
8%
-2%
-8%
-2%-1%
2%
-5%
Europe NorthAmerica
Asia/Pacific ROW Group
All main regions constrained by recession in 2009
21%
13%
63%
3%EuropeCHF 463m
North AmericaCHF 155m
Asia/PacificCHF 95m
ROWCHF 24m
Net revenue by region in % Total Group: CHF 736m
FY 2009 net revenue developmentin % by region
l.c. CHF
12STRAUMANN 16 February 2010Copyright Straumann. All rights reserved.
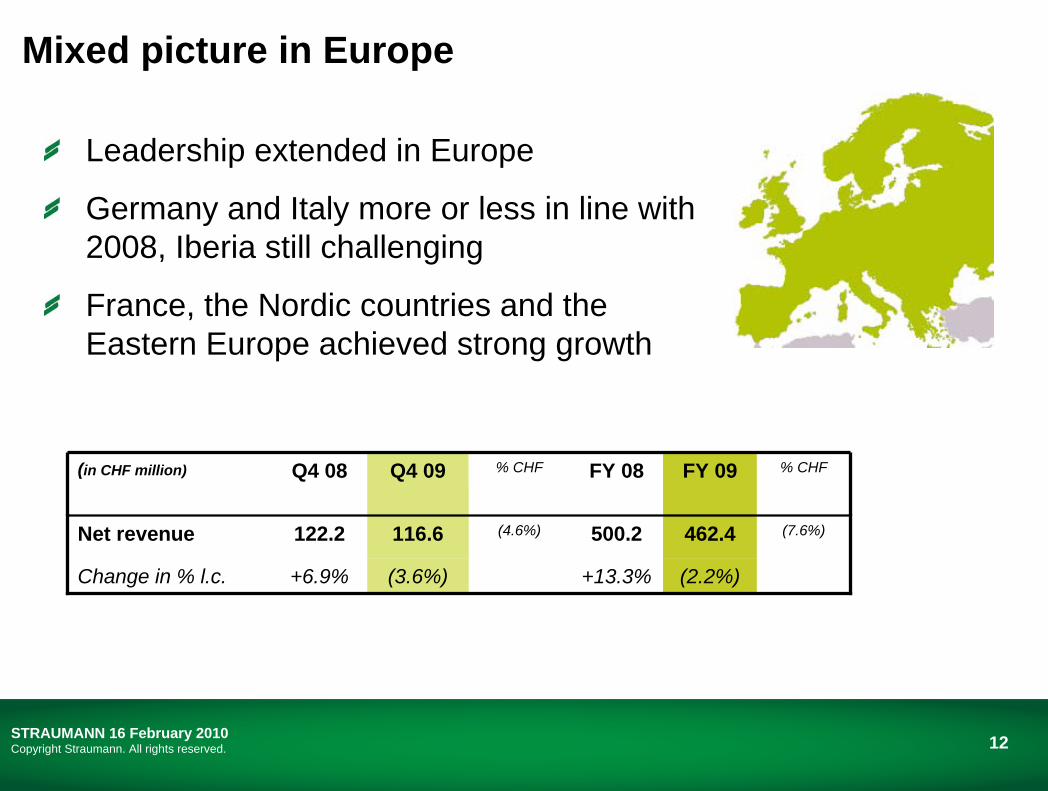
Mixed picture in Europe
Leadership extended in Europe
Germany and Italy more or less in line with 2008, Iberia still challenging
France, the Nordic countries and the Eastern Europe achieved strong growth
(2.2%)
462.4
FY 09
(3.6%)
116.6
Q4 09
+13.3%
(4.6%)
% CHF
+6.9%
122.2
Q4 08
Change in % l.c.
(7.6%)500.2Net revenue
% CHFFY 08(in CHF million)
13STRAUMANN 16 February 2010Copyright Straumann. All rights reserved.
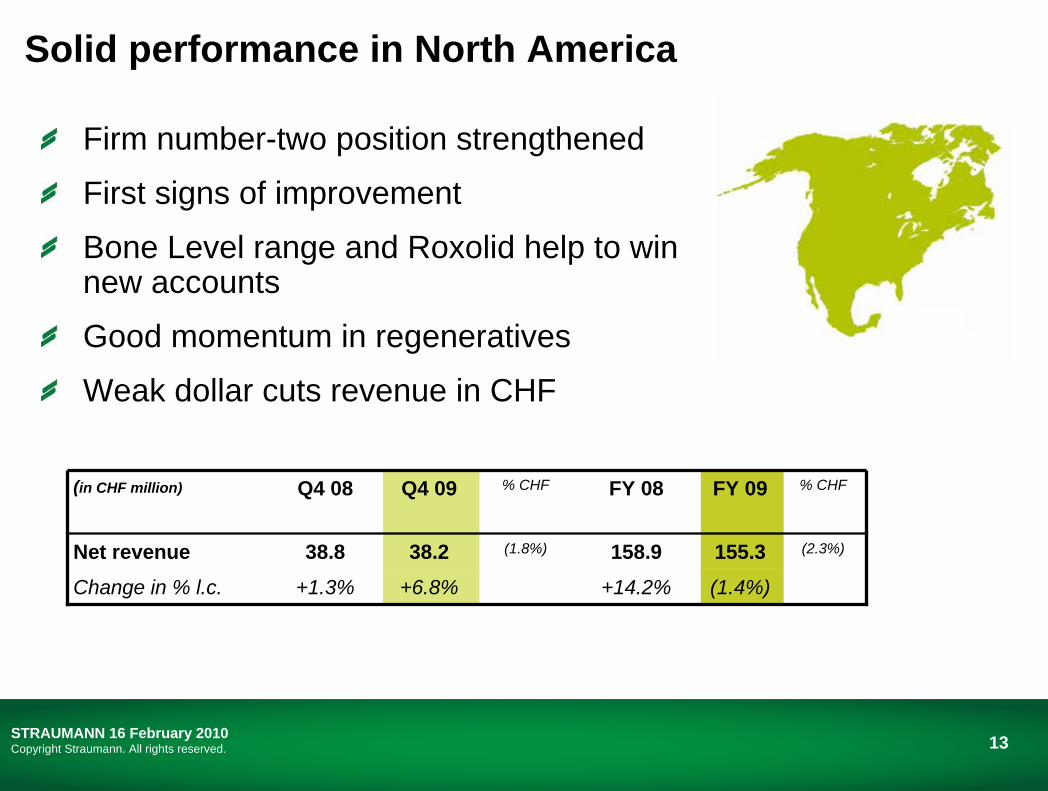
Solid performance in North America
Firm number-two position strengthened
First signs of improvement
Bone Level range and Roxolid help to win new accounts
Good momentum in regeneratives
Weak dollar cuts revenue in CHF
(1.4%)
155.3
FY 09
+6.8%
38.2
Q4 09
+14.2%
(1.8%)
% CHF
+1.3%
38.8
Q4 08
Change in % l.c.
(2.3%)158.9Net revenue
% CHFFY 08(in CHF million)
14STRAUMANN 16 February 2010Copyright Straumann. All rights reserved.
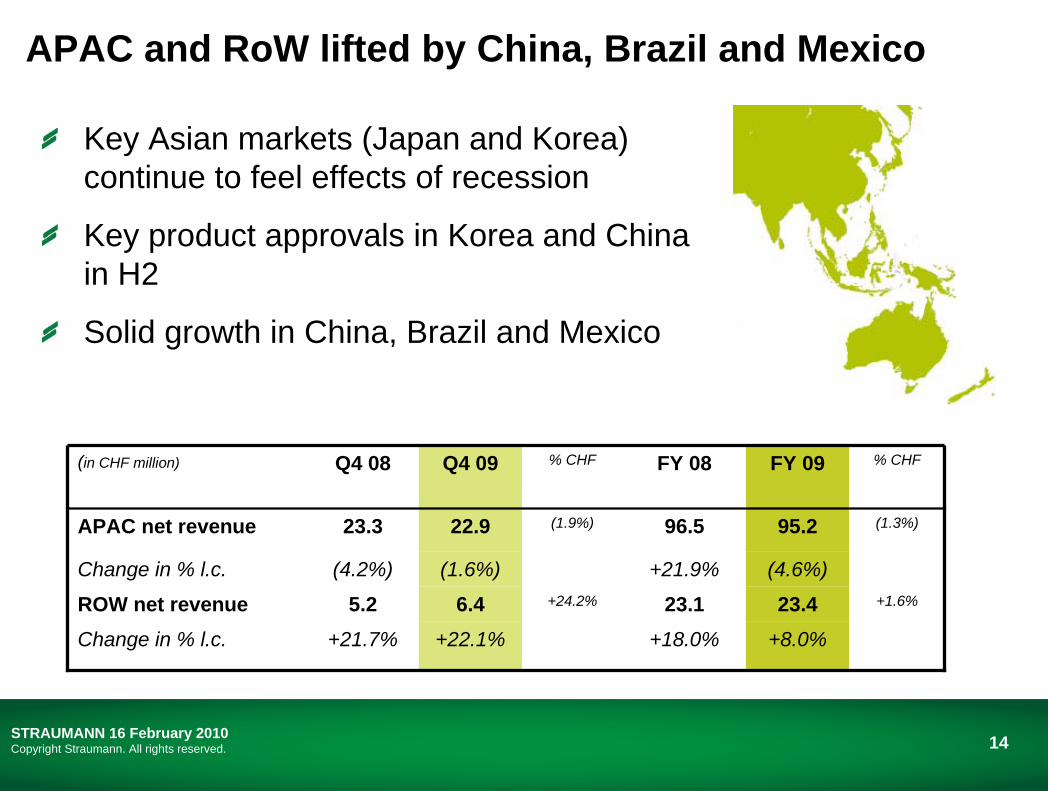
APAC and RoW lifted by China, Brazil and Mexico
Key Asian markets (Japan and Korea) continue to feel effects of recession
Key product approvals in Korea and Chinain H2
Solid growth in China, Brazil and Mexico
+8.0%
23.4(4.6%)
95.2
FY 09
+22.1%
6.4(1.6%)
22.9
Q4 09
+18.0%
23.1+21.9%
96.5
FY 08
+24.2%
(1.9%)
% CHF
+1.6%5.2ROW net revenue+21.7%Change in % l.c.
(4.2%)
23.3
Q4 08
Change in % l.c.
(1.3%)APAC net revenue
% CHF(in CHF million)
15STRAUMANN 16 February 2010Copyright Straumann. All rights reserved.
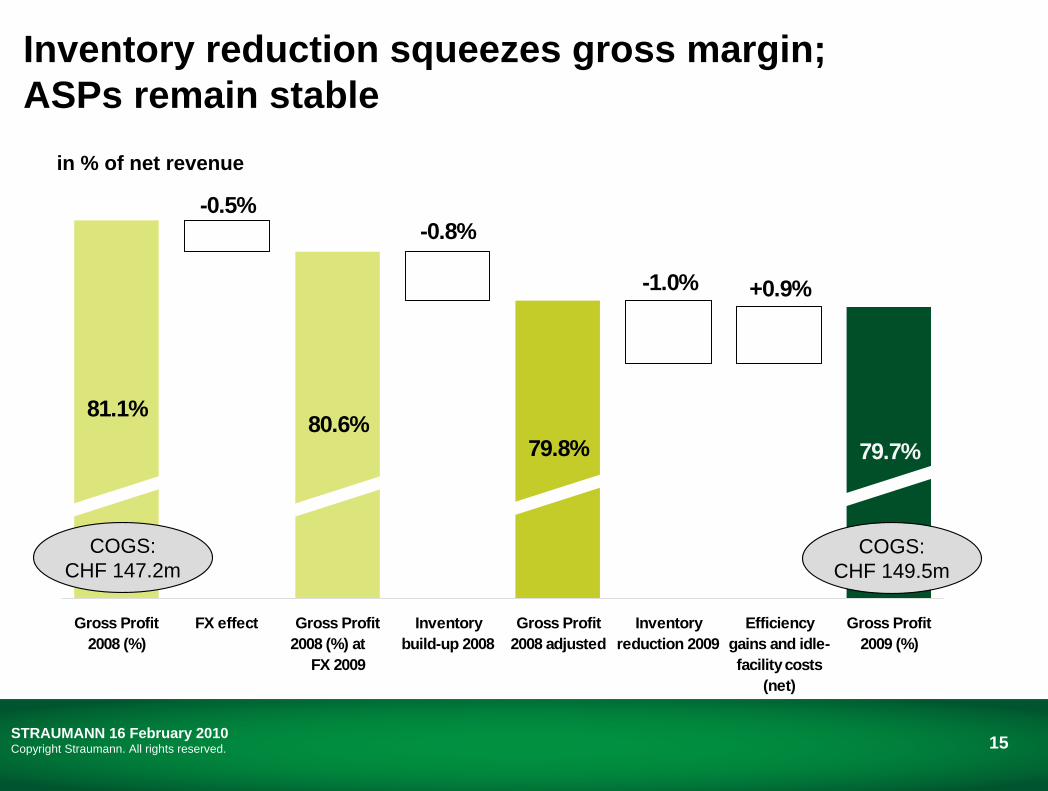
81.1% 80.6%79.8%
+0.9%-1.0%
-0.8%-0.5%
79.7%
Gross Profit2008 (%)
FX effect Gross Profit2008 (%) at
FX 2009
Inventorybuild-up 2008
Gross Profit2008 adjusted
Inventoryreduction 2009
Efficiencygains and idle-facility costs
(net)
Gross Profit2009 (%)
Inventory reduction squeezes gross margin; ASPs remain stable
in % of net revenue
COGS:CHF 149.5m
COGS:CHF 147.2m
16STRAUMANN 16 February 2010Copyright Straumann. All rights reserved.
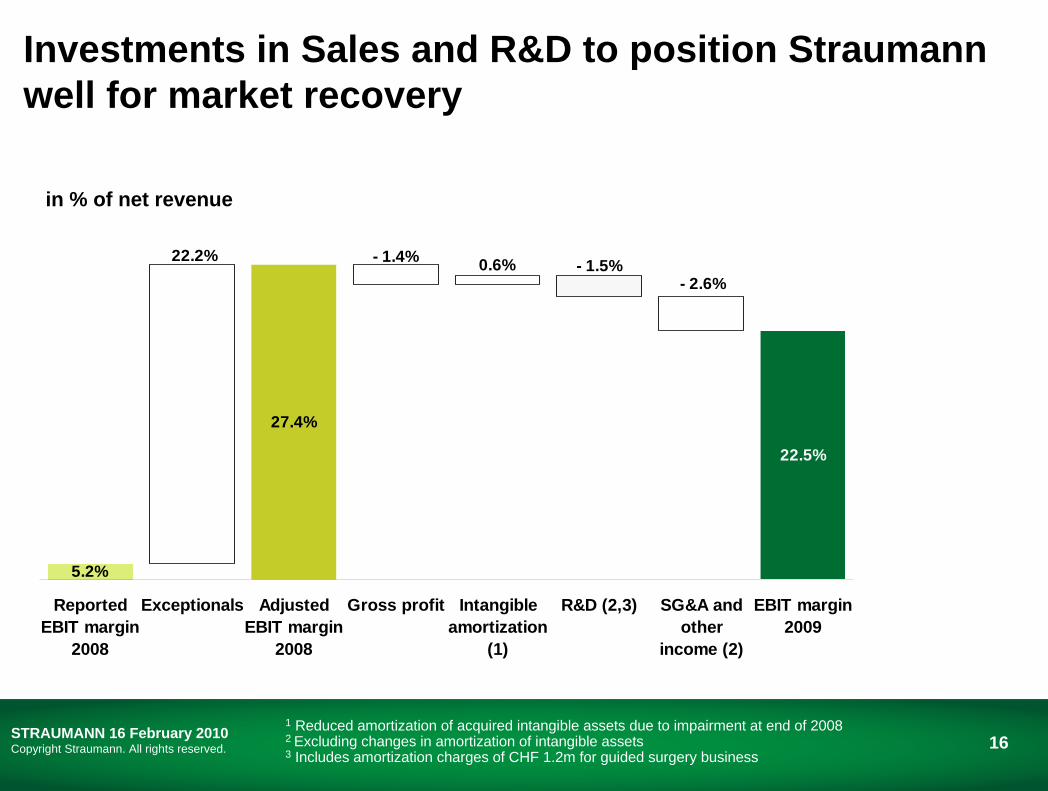
5.2%
27.4%
22.5%
- 2.6%- 1.5%0.6%- 1.4%22.2%
ReportedEBIT margin
2008
Exceptionals AdjustedEBIT margin
2008
Gross profit Intangibleamortization
(1)
R&D (2,3) SG&A andother
income (2)
EBIT margin2009
Investments in Sales and R&D to position Straumann well for market recovery
1 Reduced amortization of acquired intangible assets due to impairment at end of 20082 Excluding changes in amortization of intangible assets3 Includes amortization charges of CHF 1.2m for guided surgery business
in % of net revenue
17STRAUMANN 16 February 2010Copyright Straumann. All rights reserved.
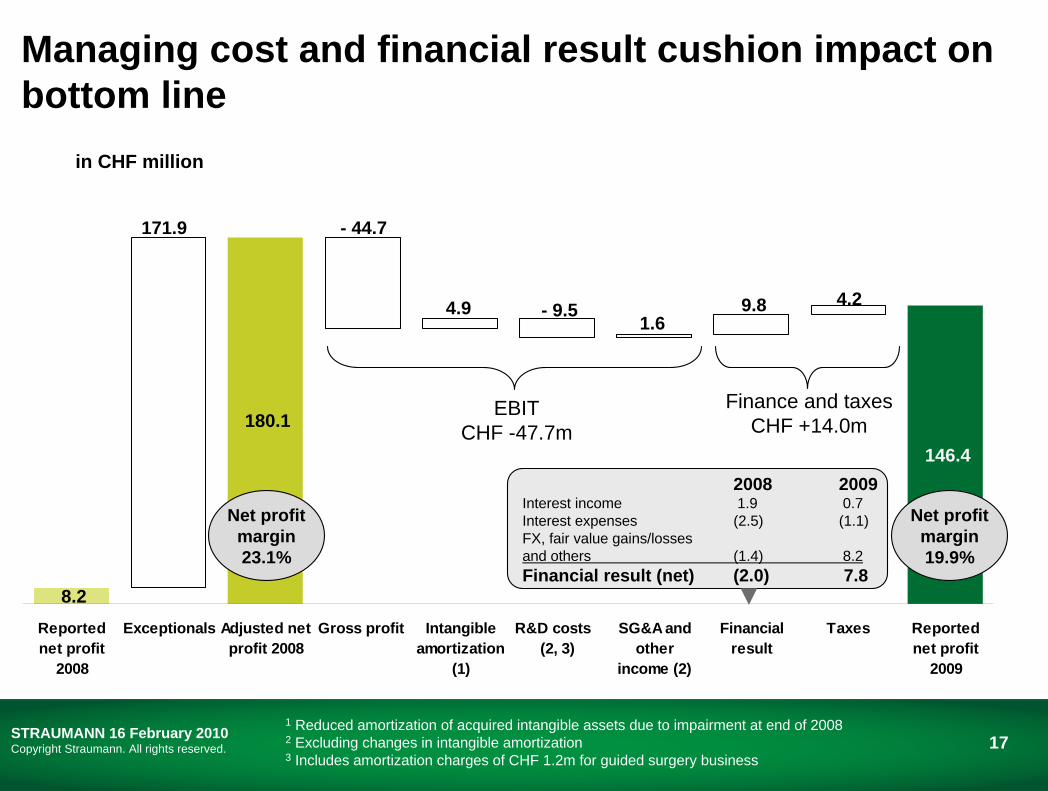
8.2
180.1
171.9
4.29.81.6
- 9.5 4.9
- 44.7
146.4
Reportednet profit
2008
Exceptionals Adjusted netprofit 2008
Gross profit Intangibleamortization
(1)
R&D costs (2, 3)
SG&A andother
income (2)
Financialresult
Taxes Reportednet profit
2009
Managing cost and financial result cushion impact on bottom line
in CHF million
EBIT CHF -47.7m
Net profitmargin23.1%
Finance and taxes CHF +14.0m
Net profitmargin19.9%
2008 2009Interest income 1.9 0.7Interest expenses (2.5) (1.1)FX, fair value gains/lossesand others (1.4) 8.2 Financial result (net) (2.0) 7.8
1 Reduced amortization of acquired intangible assets due to impairment at end of 20082 Excluding changes in intangible amortization3 Includes amortization charges of CHF 1.2m for guided surgery business
18STRAUMANN 16 February 2010Copyright Straumann. All rights reserved.
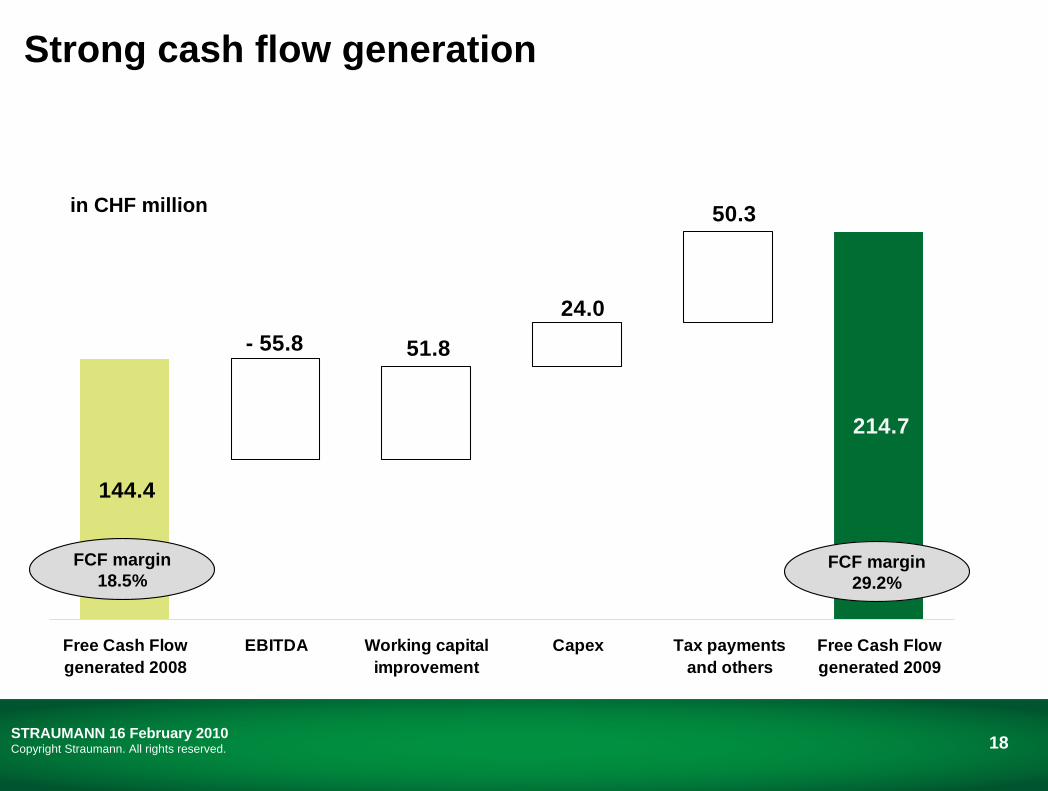
144.4
214.7
- 55.8 51.8
24.0
50.3
Free Cash Flowgenerated 2008
EBITDA Working capitalimprovement
Capex Tax paymentsand others
Free Cash Flowgenerated 2009
Strong cash flow generation
in CHF million
FCF margin29.2%
FCF margin18.5%
Achievements in 2009 and Outlook
Gilbert AchermannPresident & CEO

20STRAUMANN 16 February 2010Copyright Straumann. All rights reserved.
Portfolio considerably expanded
Surface technology
Straumann CADCAM
Emdogain
Bone Ceramic
Dental Implant system & Guided surgery
Straumann ProstheticsImplant
Planning
ProductLibrary
Model
Scanning
Prosthetic
Design
Lab
Management
Implant
Planning
ProductLibrary
Model
Scanning
Prosthetic
Design
Lab
Management
ProductLibrary
DICOMImport
Implant
Planning
CaseManagement
Live Support
ProductLibrary
DICOMImport
Implant
Planning
CaseManagement
Live Support
21STRAUMANN 16 February 2010Copyright Straumann. All rights reserved.
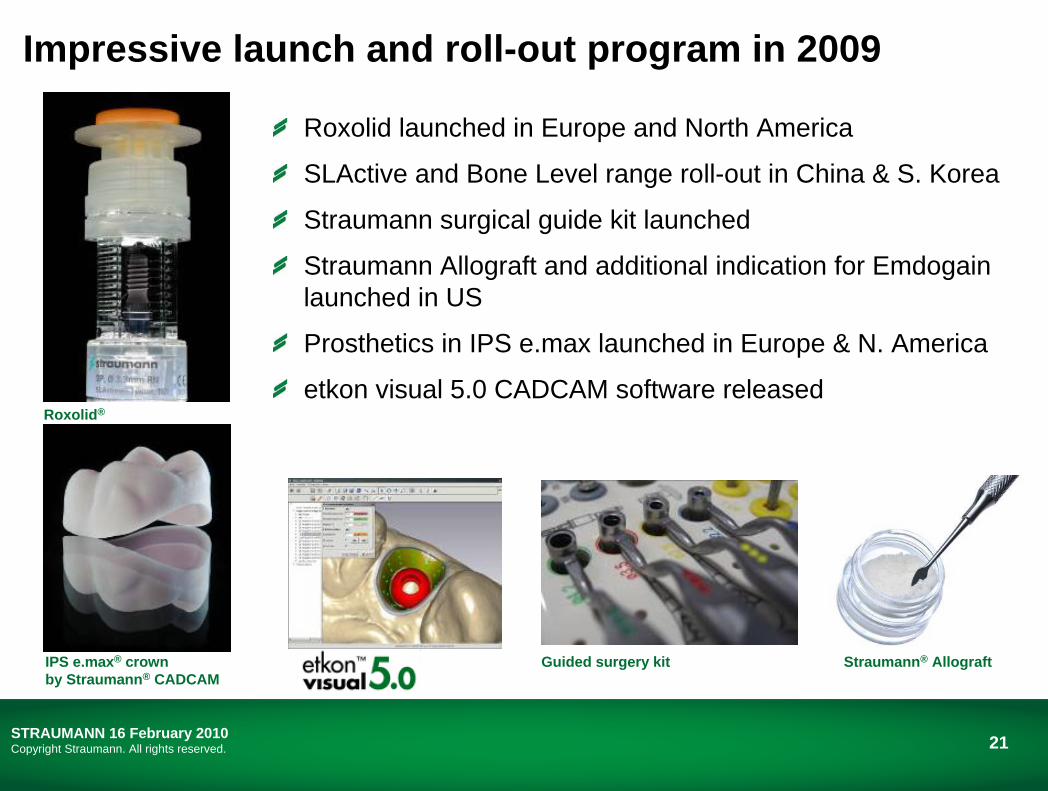
Roxolid launched in Europe and North America
SLActive and Bone Level range roll-out in China & S. Korea
Straumann surgical guide kit launched
Straumann Allograft and additional indication for Emdogain launched in US
Prosthetics in IPS e.max launched in Europe & N. America
etkon visual 5.0 CADCAM software released
Impressive launch and roll-out program in 2009
IPS e.max® crown by Straumann® CADCAM
Guided surgery kit Straumann® Allograft
Roxolid®
22STRAUMANN 16 February 2010Copyright Straumann. All rights reserved.
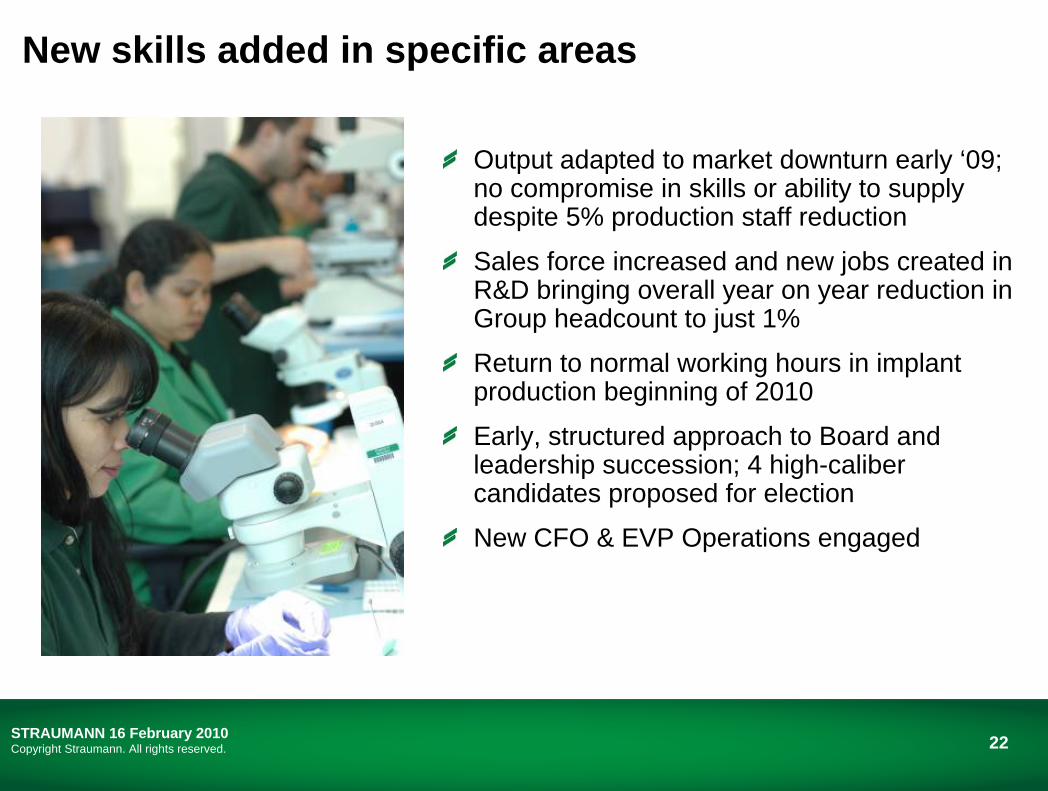
Output adapted to market downturn early ‘09; no compromise in skills or ability to supply despite 5% production staff reduction
Sales force increased and new jobs created in R&D bringing overall year on year reduction in Group headcount to just 1%
Return to normal working hours in implant production beginning of 2010
Early, structured approach to Board and leadership succession; 4 high-caliber candidates proposed for election
New CFO & EVP Operations engaged
New skills added in specific areas

23STRAUMANN 16 February 2010Copyright Straumann. All rights reserved.
Executive Management Board as of 1 April 2010
F. MaierSales
S. MatterProducts
B. Spalinger President & CEO
W. DaetzFinance & Operations
24STRAUMANN 16 February 2010Copyright Straumann. All rights reserved.
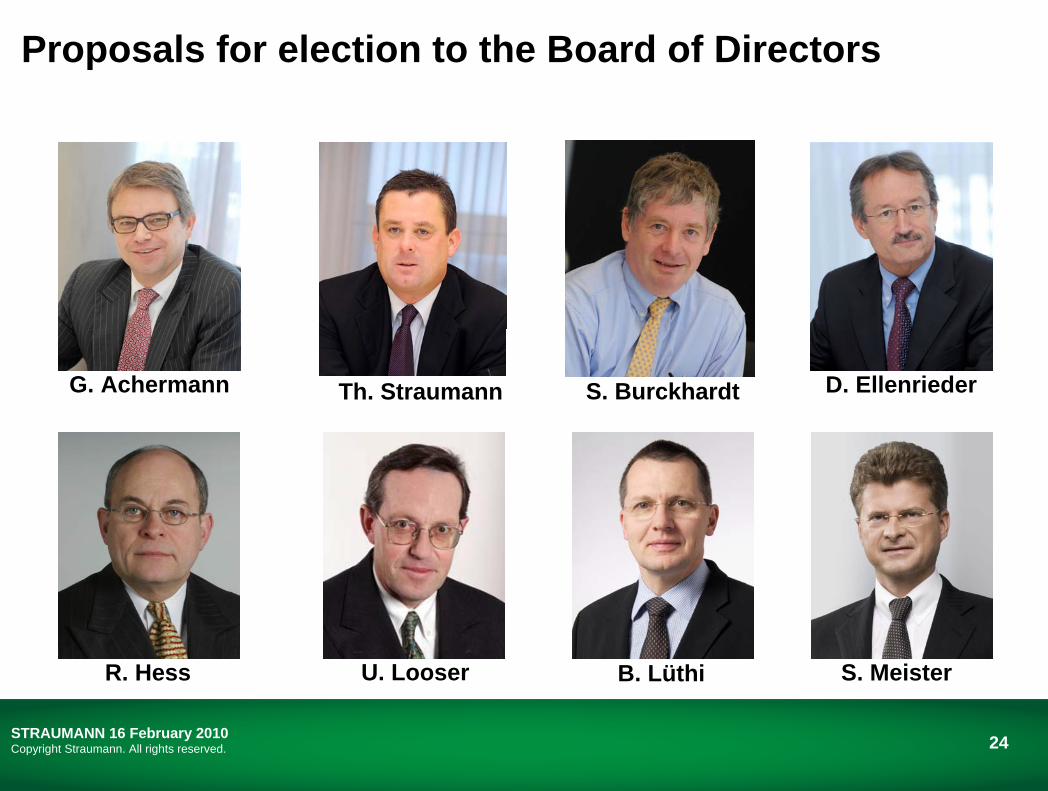
S. Burckhardt
U. Looser B. Lüthi S. MeisterR. Hess
Th. StraumannG. Achermann D. Ellenrieder
Proposals for election to the Board of Directors
25STRAUMANN 16 February 2010Copyright Straumann. All rights reserved.
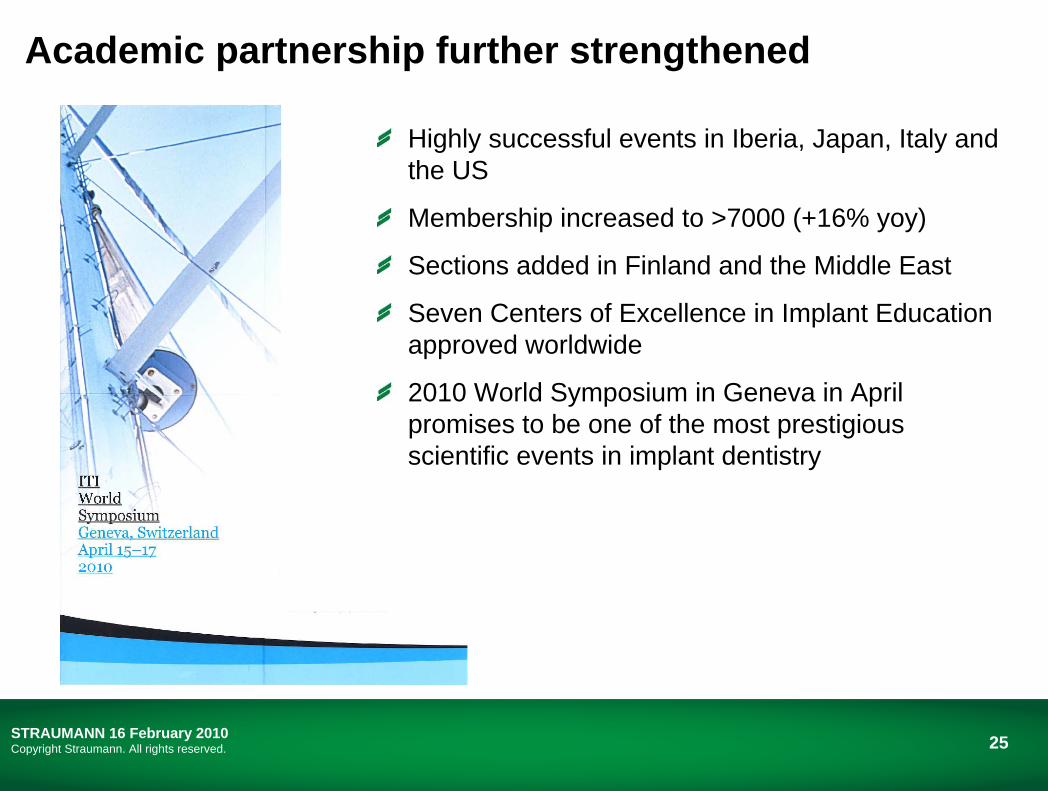
Academic partnership further strengthened
Highly successful events in Iberia, Japan, Italy and the US
Membership increased to >7000 (+16% yoy)
Sections added in Finland and the Middle East
Seven Centers of Excellence in Implant Education approved worldwide
2010 World Symposium in Geneva in April promises to be one of the most prestigious scientific events in implant dentistry
26STRAUMANN 16 February 2010Copyright Straumann. All rights reserved.
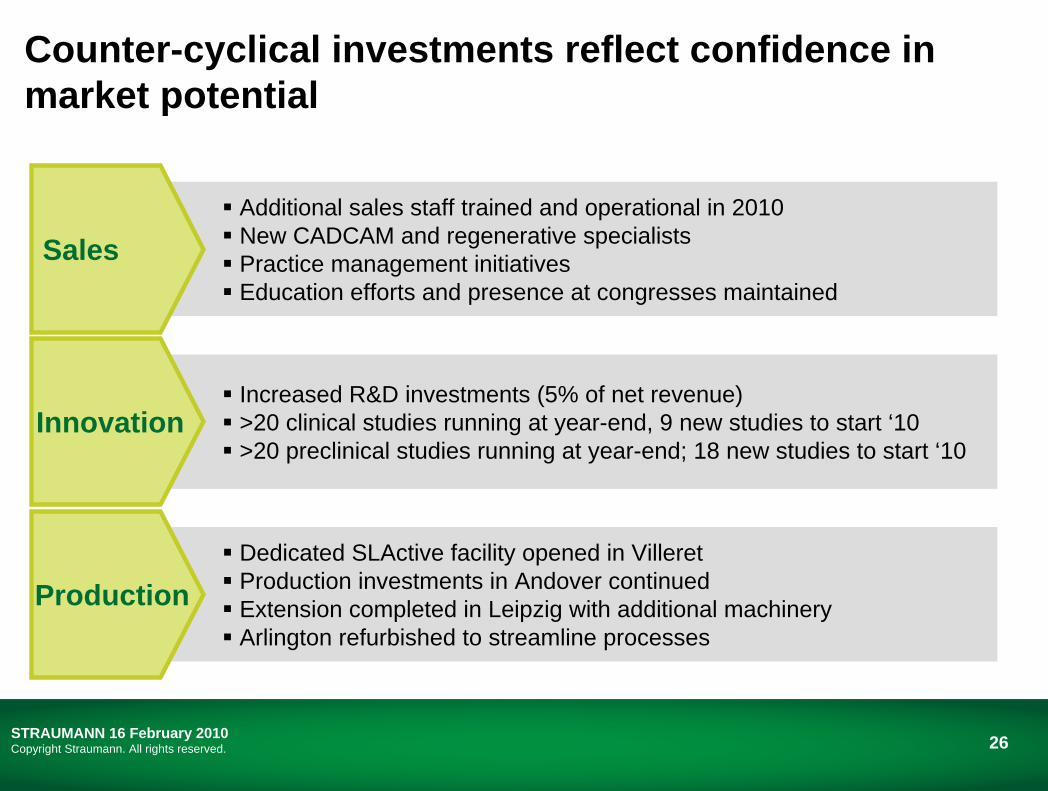
Additional sales staff trained and operational in 2010New CADCAM and regenerative specialistsPractice management initiatives Education efforts and presence at congresses maintained
Counter-cyclical investments reflect confidence in market potential
Increased R&D investments (5% of net revenue)>20 clinical studies running at year-end, 9 new studies to start ‘10>20 preclinical studies running at year-end; 18 new studies to start ‘10
Dedicated SLActive facility opened in VilleretProduction investments in Andover continued Extension completed in Leipzig with additional machineryArlington refurbished to streamline processes
Production
Innovation
Sales
27STRAUMANN 16 February 2010Copyright Straumann. All rights reserved.
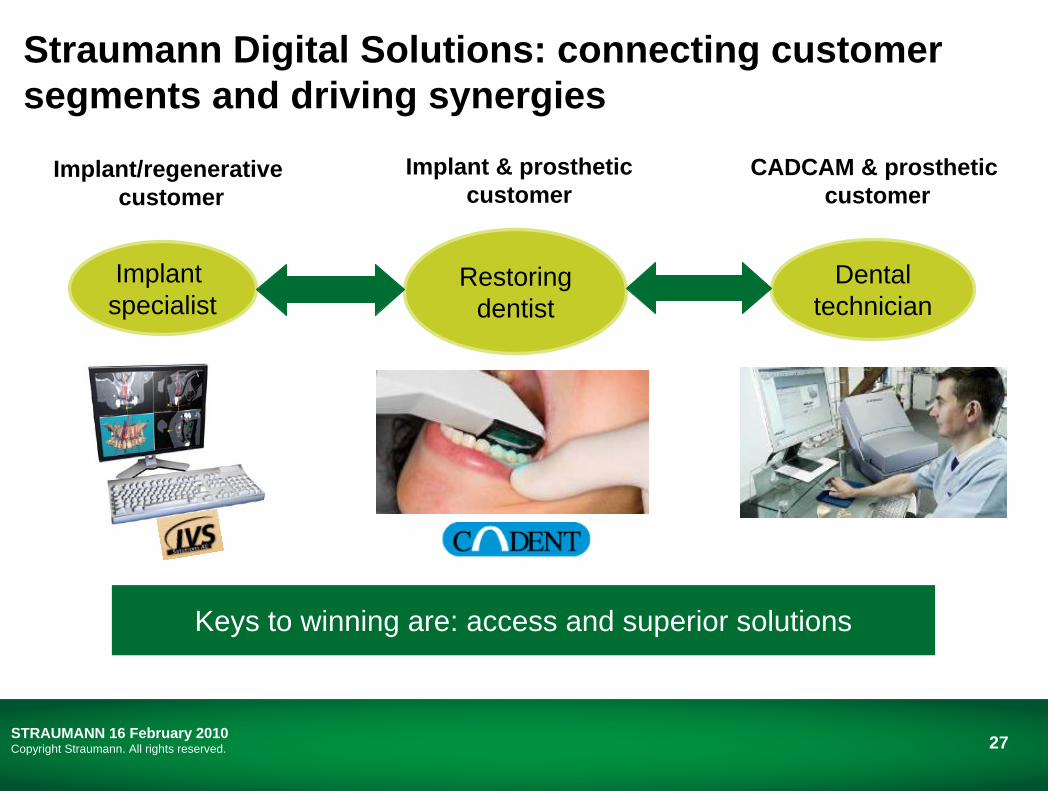
Straumann Digital Solutions: connecting customer segments and driving synergies
Restoringdentist
Dental technician
Implant specialist
Implant/regenerative customer
Implant & prostheticcustomer
CADCAM & prosthetic customer
Keys to winning are: access and superior solutions
28STRAUMANN 16 February 2010Copyright Straumann. All rights reserved.
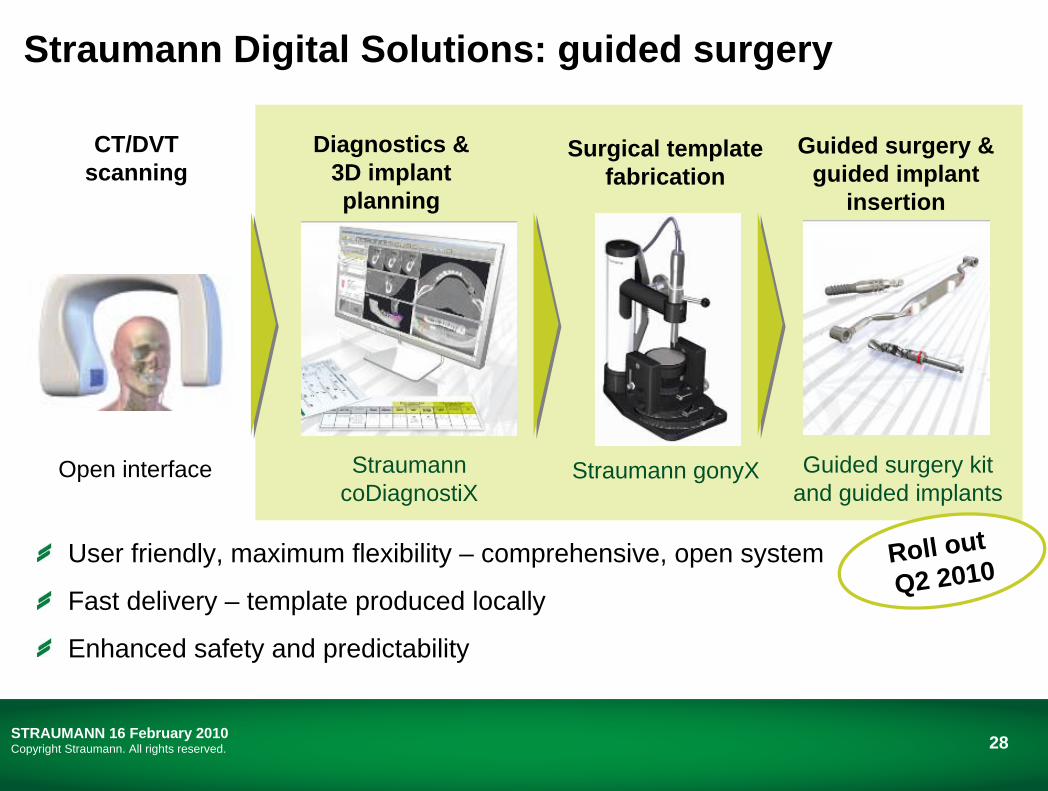
Straumann Digital Solutions: guided surgery
Open interface Straumann coDiagnostiX
Straumann gonyX Guided surgery kit and guided implants
CT/DVT scanning
Diagnostics & 3D implant planning
Surgical template fabrication
Guided surgery & guided implant
insertion
Roll out Q2 2010
User friendly, maximum flexibility – comprehensive, open system
Fast delivery – template produced locally
Enhanced safety and predictability
29STRAUMANN 16 February 2010Copyright Straumann. All rights reserved.
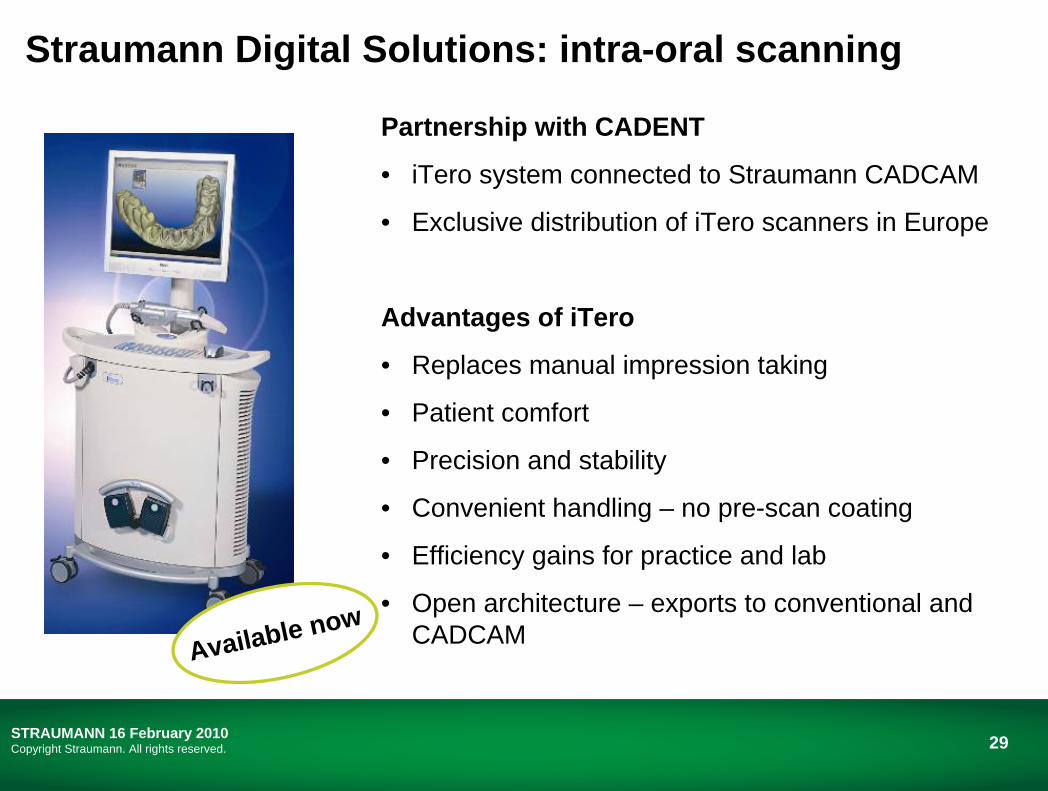
Straumann Digital Solutions: intra-oral scanning
Partnership with CADENT
• iTero system connected to Straumann CADCAM
• Exclusive distribution of iTero scanners in Europe
Advantages of iTero
• Replaces manual impression taking
• Patient comfort
• Precision and stability
• Convenient handling – no pre-scan coating
• Efficiency gains for practice and lab
• Open architecture – exports to conventional and CADCAMAvailable now
30STRAUMANN 16 February 2010Copyright Straumann. All rights reserved.
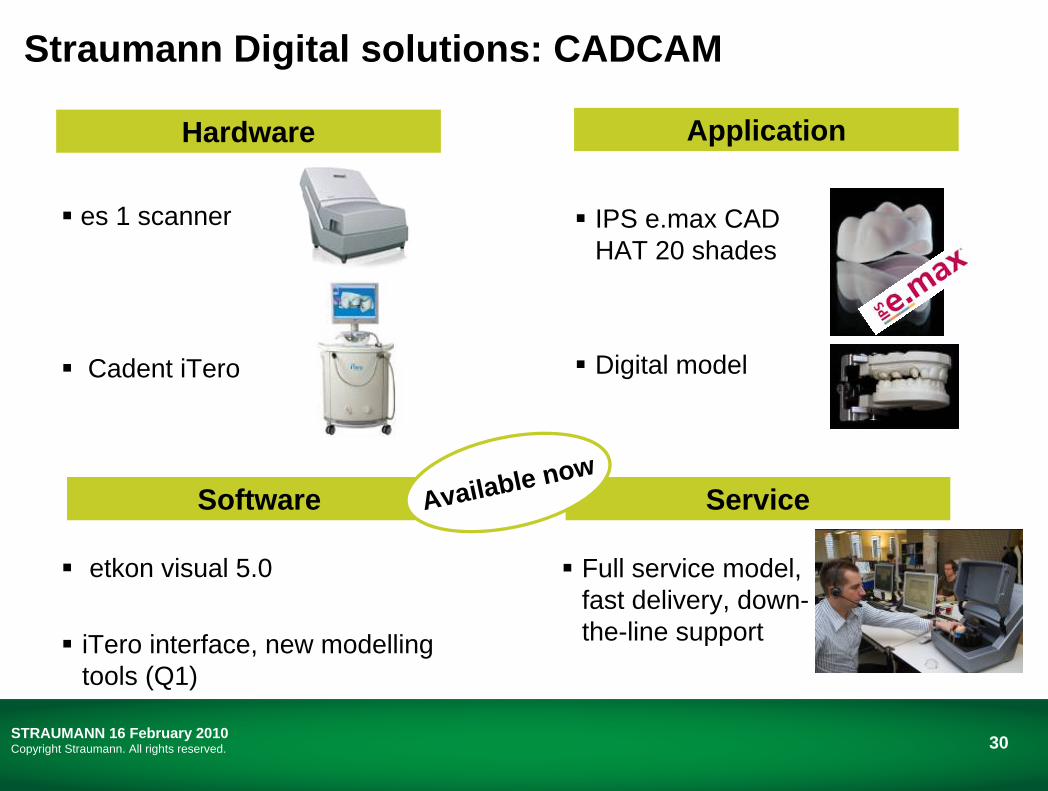
IPS e.max CAD HAT 20 shades
Digital model
Full service model, fast delivery, down-the-line support
Hardware
etkon visual 5.0
iTero interface, new modellingtools (Q1)
es 1 scanner
Cadent iTero
Straumann Digital solutions: CADCAM
Application
Software ServiceAvailable now
31STRAUMANN 16 February 2010Copyright Straumann. All rights reserved.
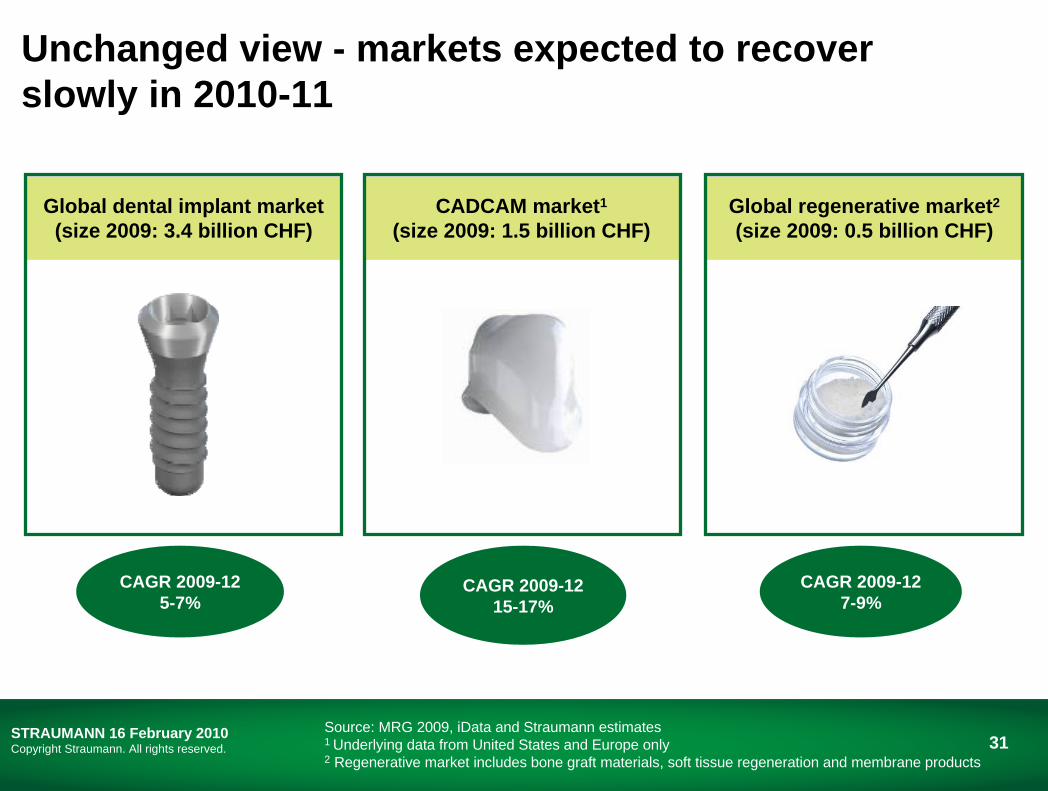
Unchanged view - markets expected to recover slowly in 2010-11
Global dental implant market (size 2009: 3.4 billion CHF)
CAGR 2009-125-7%
Source: MRG 2009, iData and Straumann estimates 1 Underlying data from United States and Europe only2 Regenerative market includes bone graft materials, soft tissue regeneration and membrane products
CADCAM market1
(size 2009: 1.5 billion CHF)
CAGR 2009-1215-17%
Global regenerative market2
(size 2009: 0.5 billion CHF)
CAGR 2009-127-9%
32STRAUMANN 16 February 2010Copyright Straumann. All rights reserved.
2010 Guidance(barring unforeseen circumstances)
With consumer spending, access to credit and unemployment far from returning to pre-recession levels, Straumann considers it premature to speak of a lasting recovery and remains cautious about forecasting when underlying, sustainable growth will return to the market in which it operates. The Group assumes that this market will be flat or grow in the low-single-digit range in 2010.
Based on its clinically-proven innovative products, organizational strength, market presence and differentiated services, the Group is convinced that it can deliver above-market performance. With the goal of simply doing more for customers and patients in 2010, it will continue to invest in all its business franchises, its innovation pipeline, and its marketing and sales organizations to create superior treatment solutions and services.
Taking this into account and assuming that there will be currency headwind in 2010, the Group expects to achieve net revenue in Swiss francs and an operating margin at least in line with the 2009 levels.
33STRAUMANN 16 February 2010Copyright Straumann. All rights reserved.
2009 Annual Report – pre-print version available
Comprehensive value reporting
Independent expert opinions, executive interviews, corporate governance, compensation report, outlooks, etc.
Follows GRI guidelines for sustainability reporting
Quality of Straumann’s reporting recognized in Swiss Annual Report awards

Questions & Answers

35STRAUMANN 16 February 2010Copyright Straumann. All rights reserved.
Calendar of upcoming events
Detailed calendar on www.straumann.com
1 March 2010 Investor Roadshow Toronto, London
2 March 2010 Investor Roadshow New York
2 March 2010 Credit Suisse HC Conference London
3 March 2010 Investor Roadshow Boston, Frankfurt
4 March 2010 Investor Roadshow Zurich
26 March 2010 Annual General Meeting Messe Basel
27 April 2010 First quarter results Basel (Audio webcast)
Appendix
37STRAUMANN 16 February 2010Copyright Straumann. All rights reserved.
Rest of the world
North America
Europe
CHF million
Asia / Pacific
growth in % CHFgrowth in % l.c.
growth in % CHFgrowth in % l.c.
growth in % CHF
growth in % CHF
Groupgrowth in % CHFgrowth in % l.c.
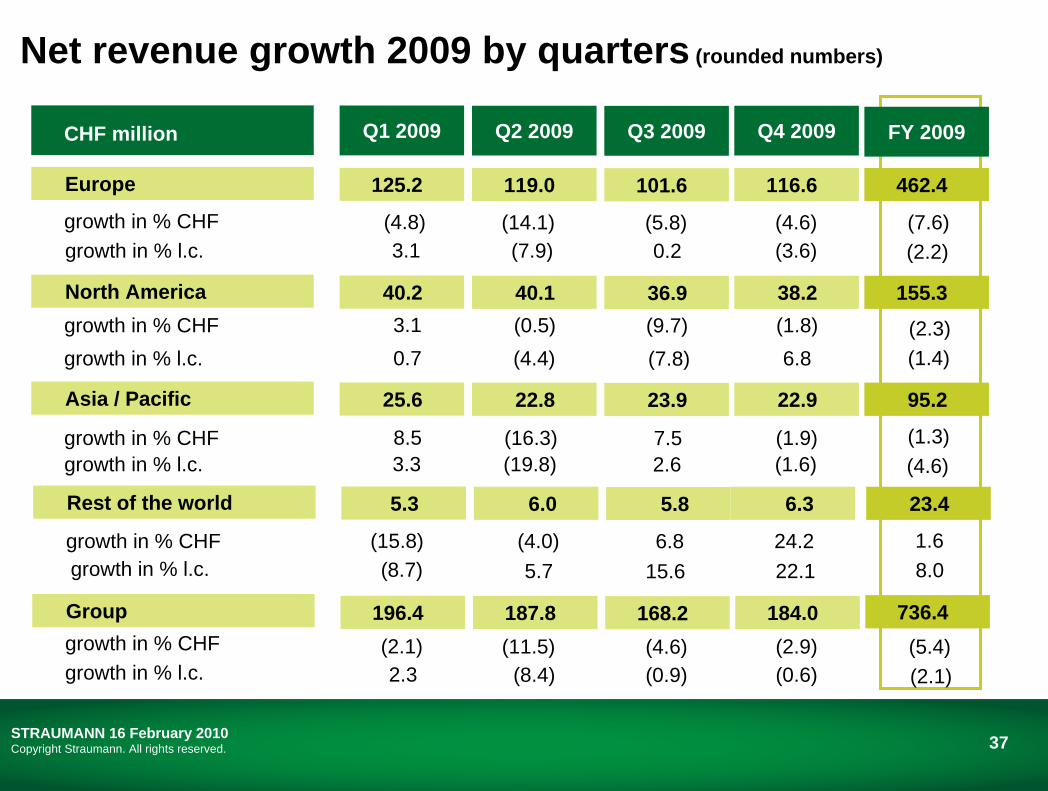
Net revenue growth 2009 by quarters (rounded numbers)
growth in % l.c.
growth in % l.c.
FY 2009
736.4
23.4
95.2
155.3
462.4
(7.6)(2.2)
Q1 2009
196.4
5.3
25.6
40.2
125.2
2.3
(4.8)3.1
3.10.7
8.5
(15.8)
(2.1)
(8.7)
3.3
Q2 2009
187.8
6.0
22.8
40.1
119.0
(8.4)
(14.1)(7.9)
(0.5)(4.4)
(16.3)
(4.0)
(11.5)
5.7
(19.8)
Q3 2009
168.2
5.8
23.9
36.9
101.6
(0.9)
(5.8)0.2
(9.7)(7.8)
7.5
6.8
(4.6)
15.6
2.6
Q4 2009
184.0
6.3
22.9
38.2
116.6
(0.6)
(4.6)(3.6)
(1.8)6.8
(1.9)
24.2
(2.9)
22.1
(1.6)
(2.3)(1.4)
(1.3)(4.6)
1.68.0
(5.4)(2.1)
38STRAUMANN 16 February 2010Copyright Straumann. All rights reserved.
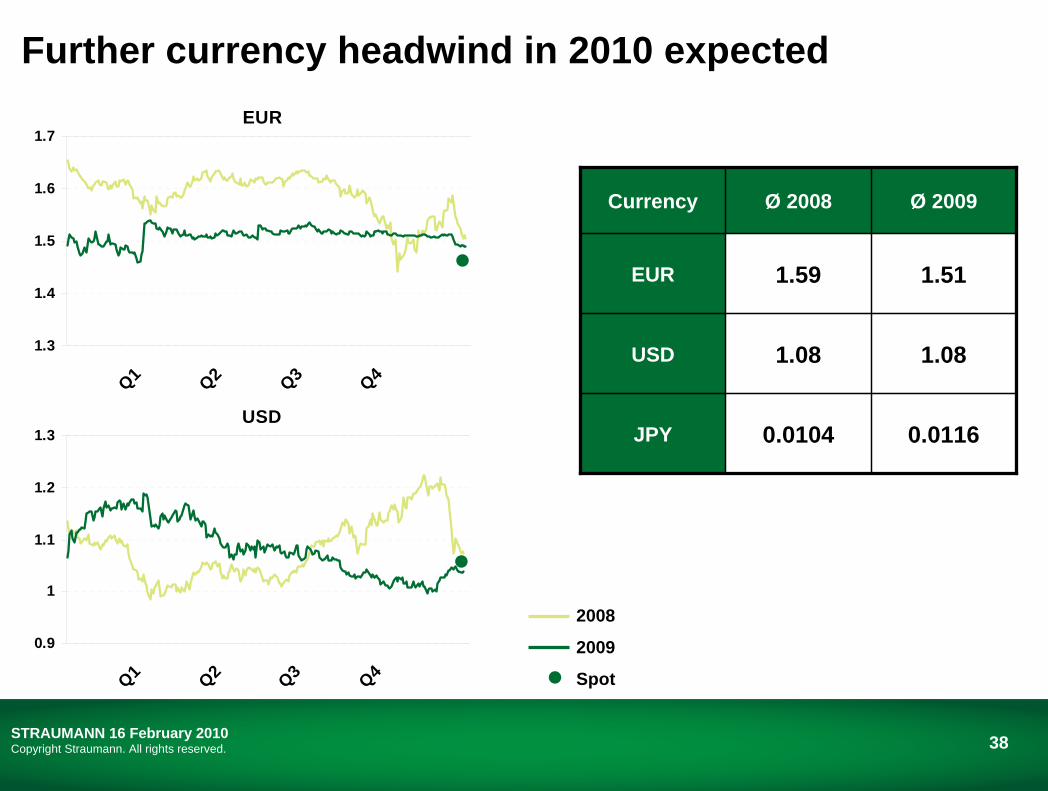
Further currency headwind in 2010 expected
0.01160.0104JPY
1.081.08USD
1.511.59EUR
Ø 2009 Ø 2008Currency
2008
2009
Spot
USD
0.9
1
1.1
1.2
1.3
Q1 Q2 Q3 Q4
EUR
1.3
1.4
1.5
1.6
1.7
Q1 Q2 Q3 Q4
39STRAUMANN 16 February 2010Copyright Straumann. All rights reserved.
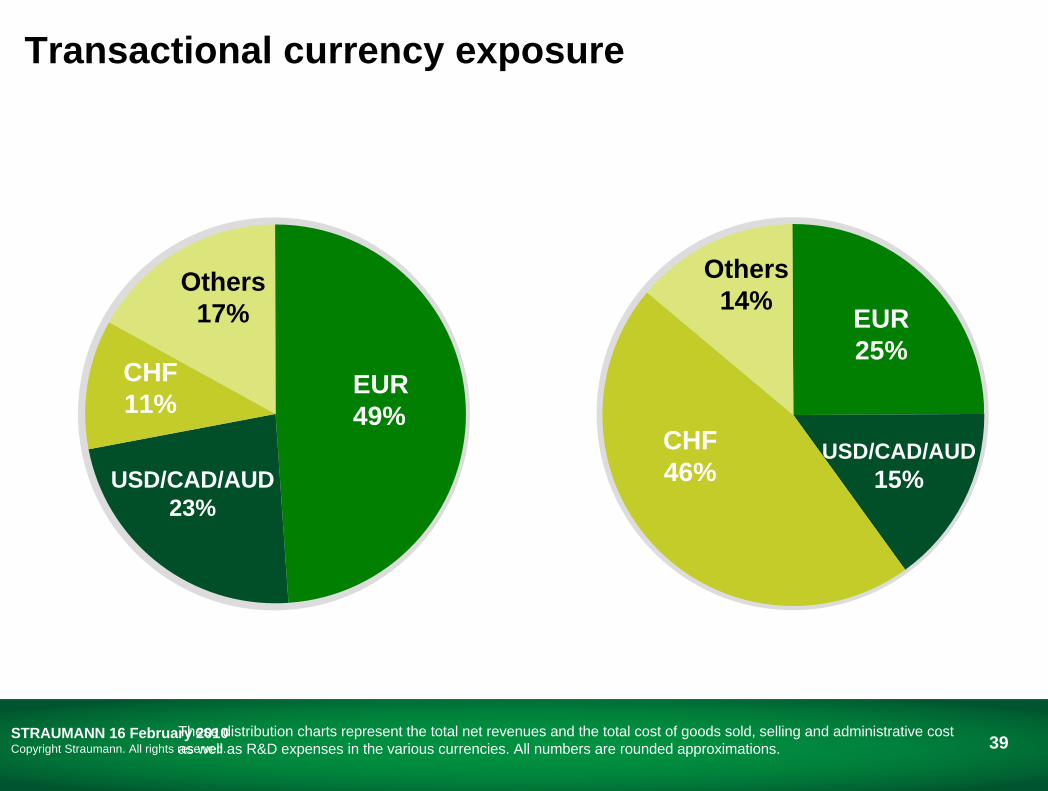
Transactional currency exposure
These distribution charts represent the total net revenues and the total cost of goods sold, selling and administrative cost as well as R&D expenses in the various currencies. All numbers are rounded approximations.
Others 17%
USD/CAD/AUD 23%
CHF 11%
EUR 49%
EUR 25%
USD/CAD/AUD 15%
CHF 46%
Others 14%
40STRAUMANN 16 February 2010Copyright Straumann. All rights reserved.
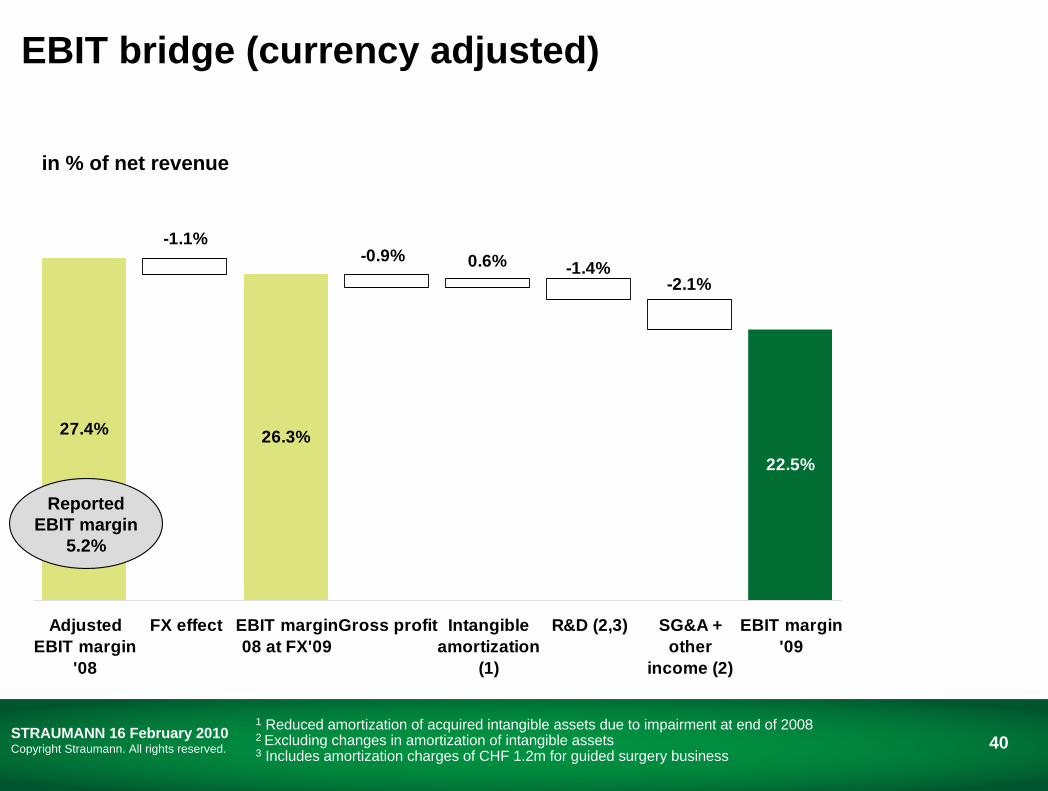
27.4% 26.3%
-2.1%-1.4%0.6%-0.9%
-1.1%
22.5%
AdjustedEBIT margin
'08
FX effect EBIT margin08 at FX'09
Gross profit Intangibleamortization
(1)
R&D (2,3) SG&A +other
income (2)
EBIT margin'09
EBIT bridge (currency adjusted)
1 Reduced amortization of acquired intangible assets due to impairment at end of 20082 Excluding changes in amortization of intangible assets3 Includes amortization charges of CHF 1.2m for guided surgery business
ReportedEBIT margin
5.2%
in % of net revenue
41STRAUMANN 16 February 2010Copyright Straumann. All rights reserved.
Your investor relations & media contacts
Fabian HildbrandCorporate Investor RelationsPhone +41 (0)61 965 13 27Mobile +41 (0)79 392 80 32Email [email protected]
Mark Hill & Thomas KonradCorporate CommunicationsPhone +41 (0)61 965 13 21Mobile +41 (0)79 320 24 77Email [email protected]