Embed Size (px)
DESCRIPTION
Nobel Biocare Fairness Opinion 2014
Citation preview
Fairness opinion – Nobel Biocare Holding AG
26 September 2014
Fairness opinion on the public tender offer by Danaher Corporation
to acquire Nobel Biocare Holding AG
Introduction
Company
Valuation considerations
Result of the fairness opinion
Appendices
Contents
2
Fairness Opinion – Nobel Biocare
26 September 2014
Introduction
Background
Mandate
Evaluation procedure
Information basis
Fairness Opinion – Nobel Biocare
3 26 September 2014
Background Introduction
Background
Nobel Biocare Holding AG (“Nobel Biocare”) is listed on the SIX Swiss
Exchange with a market capitalisation of CHF 2,111 million as of
15 September 2014. Nobel Biocare is a world leader in the field of
innovative implant-based dental restorations
Nobel Biocare employs some 2,500 people and generated revenues of
EUR 566.8 million in 2013. The company is headquartered in Zurich,
Switzerland. Production takes place at seven sites located in Canada,
Israel, Japan, Sweden, and the United States. Products and services are
available in over 80 countries through subsidiaries and distributors
The company’s registered share capital is CHF 49,513,812, divided into
123,784,530 registered shares with a nominal value of CHF 0.40 per
share. The shares are fully paid-in and each carries a voting right
Nobel Biocare announced on 29 July 2014 that the company had been
contacted by third parties who were interested in possibly acquiring the
company (“media release”). The company retained a financial advisor to
evaluate the interest of potential acquirers
On 15 September 2014, Danaher Corporation (“Danaher”) submitted an
all-cash public tender offer to the Nobel Biocare shareholders to
purchase all publicly held registered shares for a price of CHF 17.10 per
share (“pre-announcement”)
The Nobel Biocare Board of Directors has undertaken a careful review of
the terms and conditions of the Danaher offer and believes Danaher to
be an ideal strategic partner for the sustainable development of Nobel
Biocare. The Board of Directors has come to the conclusion that
Danaher’s offer is in the best interests of the company, shareholders,
employees, clients, suppliers and customers
Fairness Opinion – Nobel Biocare
4 26 September 2014
In connection with this mandate to provide a fairness opinion, N+1 Swiss
Capital AG (“Swiss Capital”) shall receive no compensation that is
dependent on any statements regarding the valuation of Nobel Biocare
or the success of a transaction with Danaher. Swiss Capital hereby
confirms that it reached its opinion independently in accordance with
TOB Circular No. 3 governing assessment experts
In accordance with the TOB decision of 27 September 2011, Swiss
Capital is suitably qualified to prepare fairness opinions through public
takeover offers
Mandate Introduction
Fairness Opinion – Nobel Biocare
5 26 September 2014
Mandate of the Board of Directors
The Nobel Biocare Board of Directors has retained Swiss Capital to
prepare a fairness opinion assessing the financial appropriateness of the
offer from the perspective of the public shareholders of Nobel Biocare
The fairness opinion is intended solely for use by the Board of Directors
of Nobel Biocare as part of its report to the shareholders in connection
with the offer (in compliance with the Takeover Board ordinance on
public takeover offers)
This fairness opinion can be used for publication in connection with the
public tender offer. It may also be referred to in the offer prospectus
dated 1 October 2014. Use for any other purposes is not permitted
The fairness opinion does not constitute a recommendation to the public
shareholders of Nobel Biocare to accept or reject the Danaher offer
Furthermore, it does not assess the following points:
Payment terms and other conditions of the offer
Legal and fiscal assessment of the transaction structure
Possible effects on shareholders if the offer is accepted or rejected
Future value of Nobel Biocare shares
Swiss Capital has neither performed an audit as defined by law, nor any
kind of due diligence
As the valuation is largely based on information provided by the
company, Swiss Capital’s responsibility is limited to thorough
professional analysis and assessment of the information provided
Evaluation procedure Introduction
Evaluation procedure
Swiss Capital analysed extensive valuation criteria and conducted
comprehensive analyses for Nobel Biocare in order to assess the
financial appropriateness of the offer
The underlying object of assessment is Nobel Biocare Holding AG with
its consolidated subsidiaries
The valuation analysis results in a value range for the operating entity
and the Equity Value of Nobel Biocare, respectively. The implied value
range for a Nobel Biocare share is an indication that can be used to
assess the financial fairness and appropriateness of the offer
The Nobel Biocare valuation is carried out on a standalone basis
No consideration has been given to possible effects at the individual
shareholder level, such as tax implications
The value range for Nobel Biocare as a company and the derived value
per registered share was calculated primarily on the basis of the
discounted cash flow method (“DCF method”). Sensitivity analyses were
also carried out as part of the DCF method by varying the major value
drivers. Additional valuation methods such as trading multiples and
transaction multiples as well as premiums from other public takeovers
were considered to test the plausibility of the DCF results
The valuation is based mainly on the assumptions of the business plan
prepared by Nobel Biocare’s management. Technical assumptions for
valuation purposes (e.g. cost of capital, perpetual growth rate) were not
part of the business plan
Several meetings and conference calls with the company management
were held to discuss the plausibility of the information as well as the
business plan received
Fairness Opinion – Nobel Biocare
6 26 September 2014
Information basis Introduction
Information basis
Swiss Capital made use of the following information for its assessment:
Publicly accessible information on Nobel Biocare that was
considered relevant for the analysis. This includes the 2010-2013
annual reports, the H1 2014 interim report (unaudited), investor
presentations and press releases
Internal company information about Nobel Biocare that was
considered relevant for the analysis, particularly the 2014 budget and
mid-term plan for 2015-2019. The budget was prepared by the Nobel
Biocare management and approved by the Board of Directors in
November 2013. The preparation of the mid-term plan takes place
each year in October. The mid-term plan from October 2013 was
updated in June 2014 in relation to a reorganisation project and in
view of non-binding offers and was approved by the Board of
Directors on 6 July 2014. These figures were re-verified in August
2014, mainly based on the results at the end of June 2014, without
any changes to the mid-term plan. This unchanged version was
approved by the Board of Directors on 18 August 2014. The initial
update in June 2014 related particularly to considerations of current
business developments (lower revenue growth, higher margins) and
changes to foreign currency exchange rates. The current mid-term
plan that forms the basis of this analysis covers the years 2015-2019
Meetings and conference calls with the Nobel Biocare management
focusing on the company’s financial situation and business
performance, the current and future market environment, value
drivers and underlying assumptions made in the mid-term plan
Descriptive documents on strategy with details on the planning
assumptions as well as on the measures already implemented or
planned in the budget and the mid-term plan
Nobel Biocare strategy documents that include assumptions on
planned initiatives and measures to be undertaken under the budget
and the mid-term plan as well as information on the market
development (based on internal and external estimates)
Fairness Opinion – Nobel Biocare
7 26 September 2014
Documents relating to the PSUP/RSUP employee stock programs
Details of debt-like balance sheet items
Capital market and financial data for Nobel Biocare and selected
trading multiples (source: Bloomberg)
Data from transaction multiples (sources: Mergermarket, Equity
Research Reports)
In preparing this fairness opinion, Swiss Capital assumed that the
financial information and other data on Nobel Biocare were accurate and
complete
Nobel Biocare’s management assured Swiss Capital that it was unaware
of any facts or circumstances that would render the given information
incomplete, inaccurate or misleading
Swiss Capital’s responsibility is limited to a thorough professional
analysis and assessment of the information that have been provided
The information and criteria in this document are effective as of the date
on which this document was prepared
Company
Overview and group structure
Business activities and products
Historic financials
Market and positioning
Strategic planning
Fairness Opinion – Nobel Biocare
8 26 September 2014
7x production sites Headquarters
2x
1) Subsidiaries with more than 50% shareholding 2) One subsidiary inactive (NB Argentina (US))
Overview and group structure Company
Company description
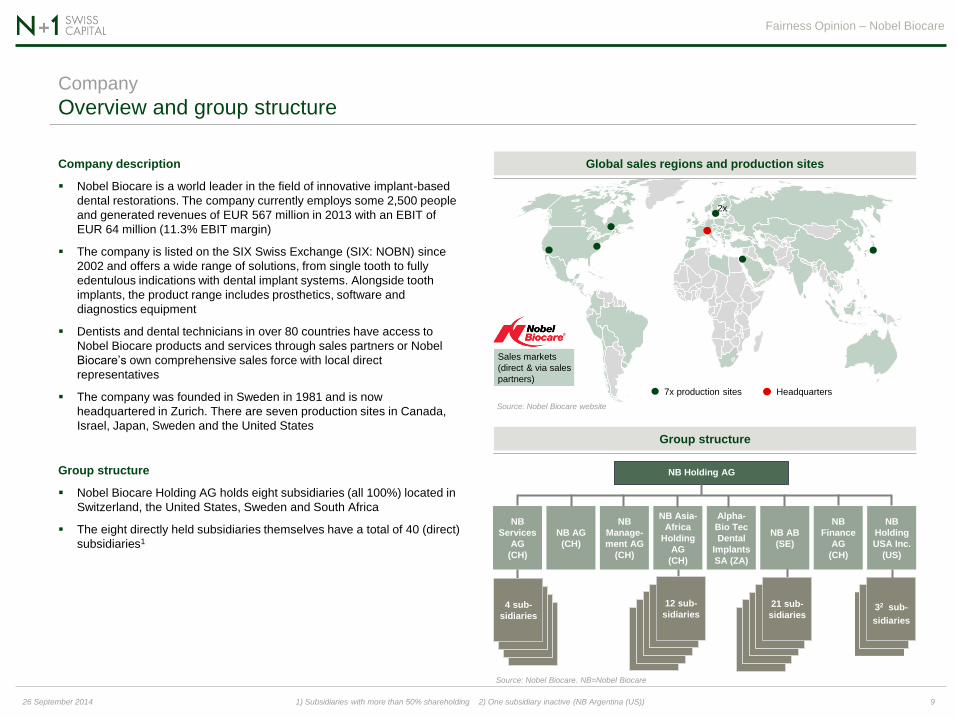
Nobel Biocare is a world leader in the field of innovative implant-based
dental restorations. The company currently employs some 2,500 people
and generated revenues of EUR 567 million in 2013 with an EBIT of
EUR 64 million (11.3% EBIT margin)
The company is listed on the SIX Swiss Exchange (SIX: NOBN) since
2002 and offers a wide range of solutions, from single tooth to fully
edentulous indications with dental implant systems. Alongside tooth
implants, the product range includes prosthetics, software and
diagnostics equipment
Dentists and dental technicians in over 80 countries have access to
Nobel Biocare products and services through sales partners or Nobel
Biocare’s own comprehensive sales force with local direct
representatives
The company was founded in Sweden in 1981 and is now
headquartered in Zurich. There are seven production sites in Canada,
Israel, Japan, Sweden and the United States
Group structure
Nobel Biocare Holding AG holds eight subsidiaries (all 100%) located in
Switzerland, the United States, Sweden and South Africa
The eight directly held subsidiaries themselves have a total of 40 (direct)
subsidiaries1
Global sales regions and production sites
Group structure
Fairness Opinion – Nobel Biocare
9 26 September 2014
Sales markets
(direct & via sales
partners)
NB Holding AG
NB
Holding
USA Inc.
(US)
NB
Finance
AG
(CH)
NB AB
(SE)
Alpha-
Bio Tec
Dental
Implants
SA (ZA)
NB Asia-
Africa
Holding
AG
(CH)
NB
Manage-
ment AG
(CH)
NB AG
(CH)
NB
Services
AG
(CH)
32 sub-
sidiaries
21 sub-
sidiaries 4 sub-
sidiaries
12 sub-
sidiaries
Source: Nobel Biocare. NB=Nobel Biocare
Source: Nobel Biocare website
86%
14%
Implant Systems Individualized Solutions
1) Computer-aided manufacturing
Business activities and products
Business model
Nobel Biocare offers tooth implants, full ceramic crowns, bridges, guided
implant surgery, as well as scanners and software for CAD/CAM
systems1. The company is active primarily in the premium segment,
which makes up approx. 60% of the dental implant market. The value
segment with lower-priced solutions makes up the remaining 40%
The company offers dentists and dental technicians comprehensive
customer service through its sales force of more than 750 people, an
online shop and a wide range of training and continuing education
programs
Operations are divided into three geographic regions – EMEA (Europe,
Middle East and Africa), Americas and APAC (Asia-Pacific), with EMEA
and Americas each providing ca. 40% of revenue. The most important
countries are the United States (ca. 33% of 2013 revenue) and Japan
(ca. 9% of 2013 revenue)
Product portfolio
The Nobel Biocare product portfolio is divided into the two business
segments of Implant Systems and Individualized Solutions, which are
sold in all three geographical regions and often as combined solutions
The Implant Systems segment (86% of 2013 revenue) covers a wide
range of pre-fabricated bone-level and tissue-level dental implants for all
indications, bone types and surgical protocols
The Individualized Solutions segment (14% of 2013 revenue) offers a
comprehensive range of high-precision individualized prosthetics and
CAD/CAM systems, diagnostics, treatment planning and guided surgery
solutions
Revenue by region 2011-2013
Product segments in % of 2013 revenue
Fairness Opinion – Nobel Biocare
10 26 September 2014
Company
Source: Nobel Biocare, 2012 and 2013 annual reports
Source: Nobel Biocare
42% 40% 41%
37% 39% 41%
22% 21% 18%
569 580 567
0
200
400
600
800
2011 2012 2013
EMEA Americas Asia/Pacific
EUR m
577
569(-1.3%)
581(+2.0%)
567(-2.4%)
85 72 69 6446 40 46 43
19.9% 18.4% 17.5% 16.1%
14.7%
12.7% 11.9% 11.3%
0%
10%
20%
30%
40%
0
200
400
600
800
2010 2011 2012 2013
Revenue EBIT Net profit EBITDA margin EBIT margin
EUR m Margin (%)
289283
(-2.2%)
10.7%
15.8%
10.7%
15.0%
0%
15%
30%
45%
0
150
300
450
H1 2013 H1 2014
Revenue EBIT margin (constant FX-rates) EBIT margin (reported)
EUR m Margin (%)
Sources: Nobel Biocare 2013 annual report and (presentation of) Interim Report 2, 2014
1) 2013 margin includes EUR 6.2m non-recurring costs for headquarter realignment. Adjusted margin at 12.9%
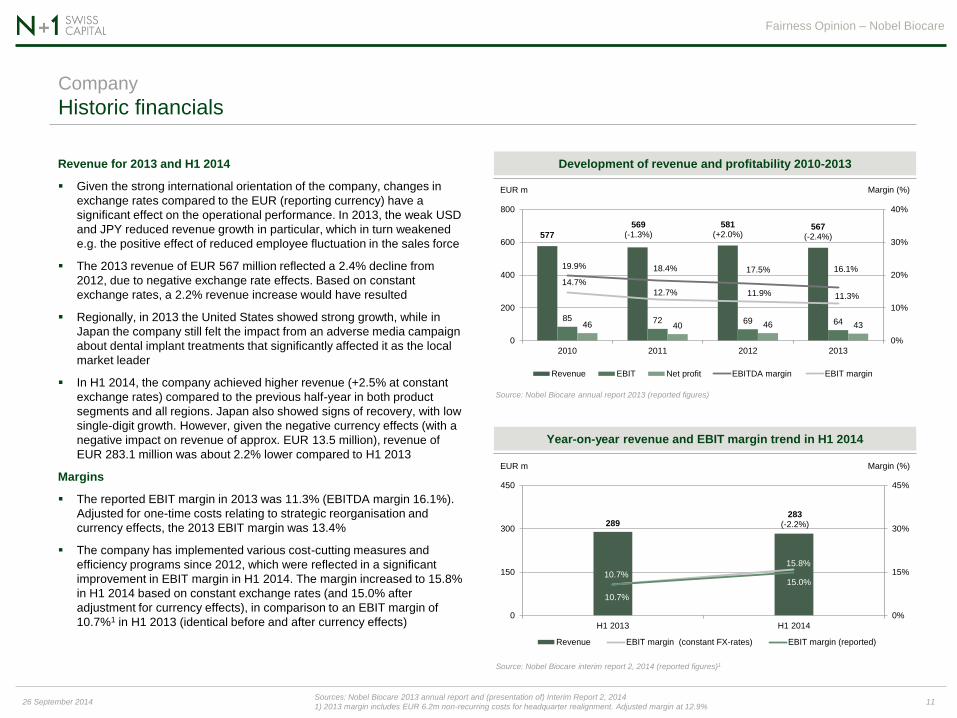
Historic financials
Revenue for 2013 and H1 2014
Given the strong international orientation of the company, changes in
exchange rates compared to the EUR (reporting currency) have a
significant effect on the operational performance. In 2013, the weak USD
and JPY reduced revenue growth in particular, which in turn weakened
e.g. the positive effect of reduced employee fluctuation in the sales force
The 2013 revenue of EUR 567 million reflected a 2.4% decline from
2012, due to negative exchange rate effects. Based on constant
exchange rates, a 2.2% revenue increase would have resulted
Regionally, in 2013 the United States showed strong growth, while in
Japan the company still felt the impact from an adverse media campaign
about dental implant treatments that significantly affected it as the local
market leader
In H1 2014, the company achieved higher revenue (+2.5% at constant
exchange rates) compared to the previous half-year in both product
segments and all regions. Japan also showed signs of recovery, with low
single-digit growth. However, given the negative currency effects (with a
negative impact on revenue of approx. EUR 13.5 million), revenue of
EUR 283.1 million was about 2.2% lower compared to H1 2013
Margins
The reported EBIT margin in 2013 was 11.3% (EBITDA margin 16.1%).
Adjusted for one-time costs relating to strategic reorganisation and
currency effects, the 2013 EBIT margin was 13.4%
The company has implemented various cost-cutting measures and
efficiency programs since 2012, which were reflected in a significant
improvement in EBIT margin in H1 2014. The margin increased to 15.8%
in H1 2014 based on constant exchange rates (and 15.0% after
adjustment for currency effects), in comparison to an EBIT margin of
10.7%1 in H1 2013 (identical before and after currency effects)
Development of revenue and profitability 2010-2013
Fairness Opinion – Nobel Biocare
11 26 September 2014
Company
Source: Nobel Biocare annual report 2013 (reported figures)
Year-on-year revenue and EBIT margin trend in H1 2014
Source: Nobel Biocare interim report 2, 2014 (reported figures)1
Sources: 1) Nobel Biocare estimate 2) Credit Suisse analyst report 13 August 2014 3) Jefferies, Nobel Biocare 4) Expected closing of transaction in Q1 2015
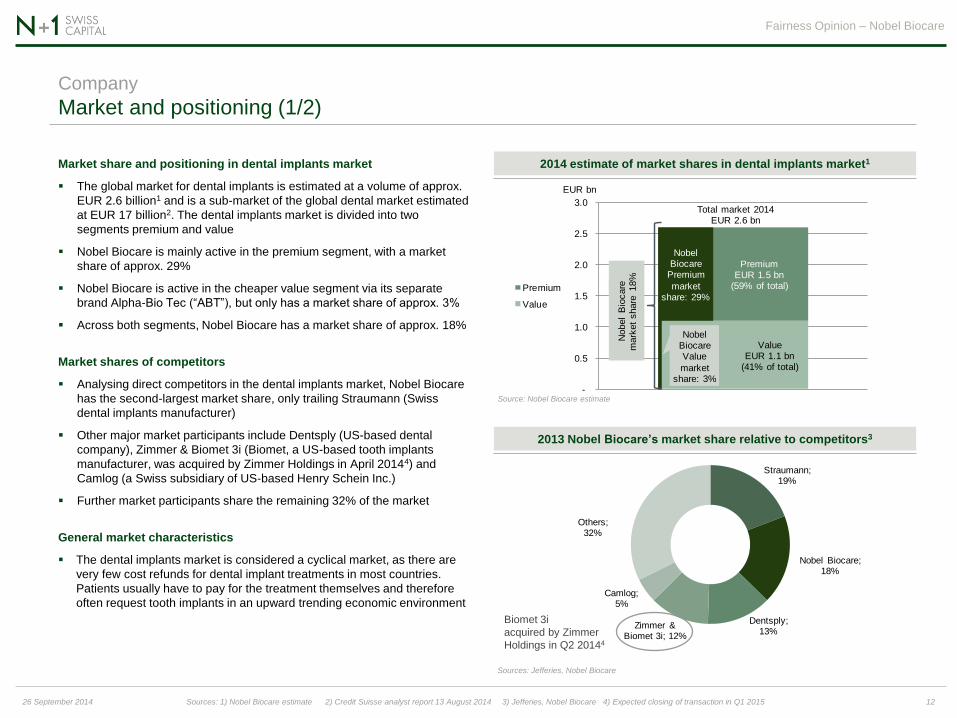
Market and positioning (1/2)
Market share and positioning in dental implants market
The global market for dental implants is estimated at a volume of approx.
EUR 2.6 billion1 and is a sub-market of the global dental market estimated
at EUR 17 billion2. The dental implants market is divided into two
segments premium and value
Nobel Biocare is mainly active in the premium segment, with a market
share of approx. 29%
Nobel Biocare is active in the cheaper value segment via its separate
brand Alpha-Bio Tec (“ABT”), but only has a market share of approx. 3%
Across both segments, Nobel Biocare has a market share of approx. 18%
Market shares of competitors
Analysing direct competitors in the dental implants market, Nobel Biocare
has the second-largest market share, only trailing Straumann (Swiss
dental implants manufacturer)
Other major market participants include Dentsply (US-based dental
company), Zimmer & Biomet 3i (Biomet, a US-based tooth implants
manufacturer, was acquired by Zimmer Holdings in April 20144) and
Camlog (a Swiss subsidiary of US-based Henry Schein Inc.)
Further market participants share the remaining 32% of the market
General market characteristics
The dental implants market is considered a cyclical market, as there are
very few cost refunds for dental implant treatments in most countries.
Patients usually have to pay for the treatment themselves and therefore
often request tooth implants in an upward trending economic environment
2013 Nobel Biocare’s market share relative to competitors3
Fairness Opinion – Nobel Biocare
12 26 September 2014
Company
Biomet 3i
acquired by Zimmer
Holdings in Q2 20144
Source: Nobel Biocare estimate
Sources: Jefferies, Nobel Biocare
2014 estimate of market shares in dental implants market1
Value EUR 1.1 bn
(41% of total)
Premium EUR 1.5 bn
(59% of total)
-
0.5
1.0
1.5
2.0
2.5
3.0
Premium
Value
Nobel Biocare
Premium
market share: 29%
Nobel Biocare Value
market share: 3%
Nobel
Bio
care
m
ark
et
share
18%
Total market 2014 EUR 2.6 bn
EUR bn
Straumann; 19%
Nobel Biocare; 18%
Dentsply;13%
Zimmer & Biomet 3i; 12%
Camlog; 5%
Others; 32%
Sources: 1) Figures according to Nobel Biocare 2013 annual report 2) EU/NA iData 2013, LATAM/APAC/China iData 2012
3) Abutments are the connecting elements between the tooth implant and the prosthetic treatment (tooth crowns) 4) Inflammation of the soft and hard tissues
Market and positioning (2/2)
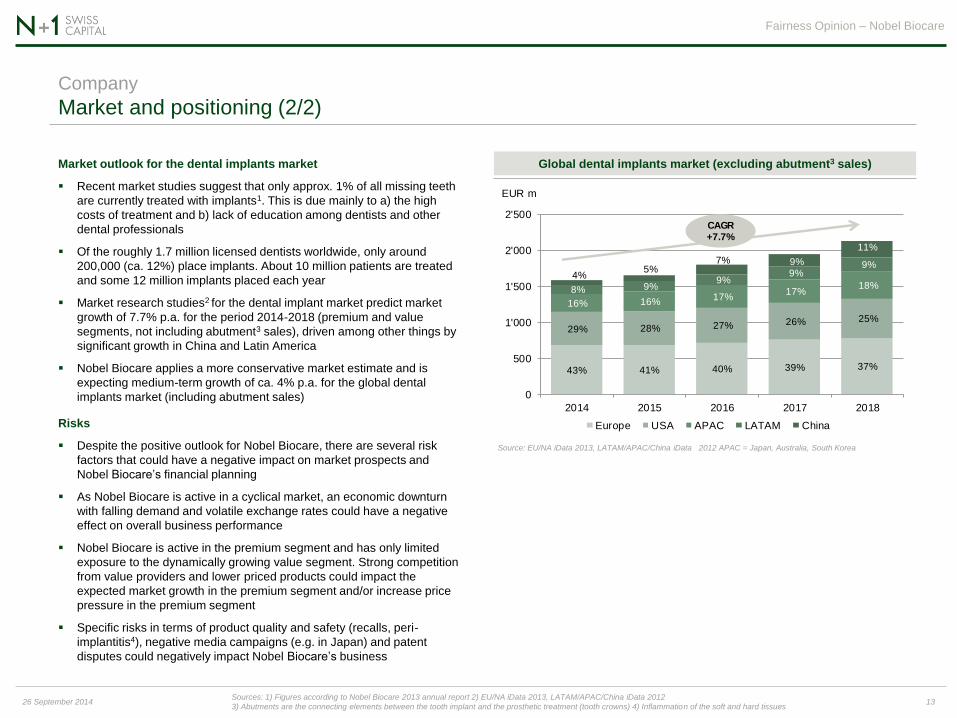
Market outlook for the dental implants market
Recent market studies suggest that only approx. 1% of all missing teeth
are currently treated with implants1. This is due mainly to a) the high
costs of treatment and b) lack of education among dentists and other
dental professionals
Of the roughly 1.7 million licensed dentists worldwide, only around
200,000 (ca. 12%) place implants. About 10 million patients are treated
and some 12 million implants placed each year
Market research studies2 for the dental implant market predict market
growth of 7.7% p.a. for the period 2014-2018 (premium and value
segments, not including abutment3 sales), driven among other things by
significant growth in China and Latin America
Nobel Biocare applies a more conservative market estimate and is
expecting medium-term growth of ca. 4% p.a. for the global dental
implants market (including abutment sales)
Risks
Despite the positive outlook for Nobel Biocare, there are several risk
factors that could have a negative impact on market prospects and
Nobel Biocare’s financial planning
As Nobel Biocare is active in a cyclical market, an economic downturn
with falling demand and volatile exchange rates could have a negative
effect on overall business performance
Nobel Biocare is active in the premium segment and has only limited
exposure to the dynamically growing value segment. Strong competition
from value providers and lower priced products could impact the
expected market growth in the premium segment and/or increase price
pressure in the premium segment
Specific risks in terms of product quality and safety (recalls, peri-
implantitis4), negative media campaigns (e.g. in Japan) and patent
disputes could negatively impact Nobel Biocare’s business
Global dental implants market (excluding abutment3 sales)
Fairness Opinion – Nobel Biocare
13 26 September 2014
Company
Source: EU/NA iData 2013, LATAM/APAC/China iData 2012 APAC = Japan, Australia, South Korea
43% 41% 40% 39% 37%
29% 28% 27% 26% 25%
16% 16%17%
17%18%8% 9%
9%9%
9%4%
5%7% 9%
11%
0
500
1'000
1'500
2'000
2'500
2014 2015 2016 2017 2018
Europe USA APAC LATAM China
CAGR +7.7%
EUR m
-10%
-8%
-6%
-4%
-2%
0%
2%
4%
6%
8%
10%
2008 2009 2010 2011 2012 2013 H1/2014
Nobel Biocare Straumann Biomet 3i Zimmer Dentsply
14%12%
Discounter 1 Discounter 2 Discounter 3 Discounter n
Astra / Dentsply
Danaher Implant
Zimmer
Biomet 3i
Nobel Biocare
Strau-mann
Product Value
Se
rvic
e L
evel
1) Margin without one-time costs for strategic reorganisation 2) One company in the future (Zimmer Holdings)
Strategic planning
Fairness Opinion – Nobel Biocare
14 26 September 2014
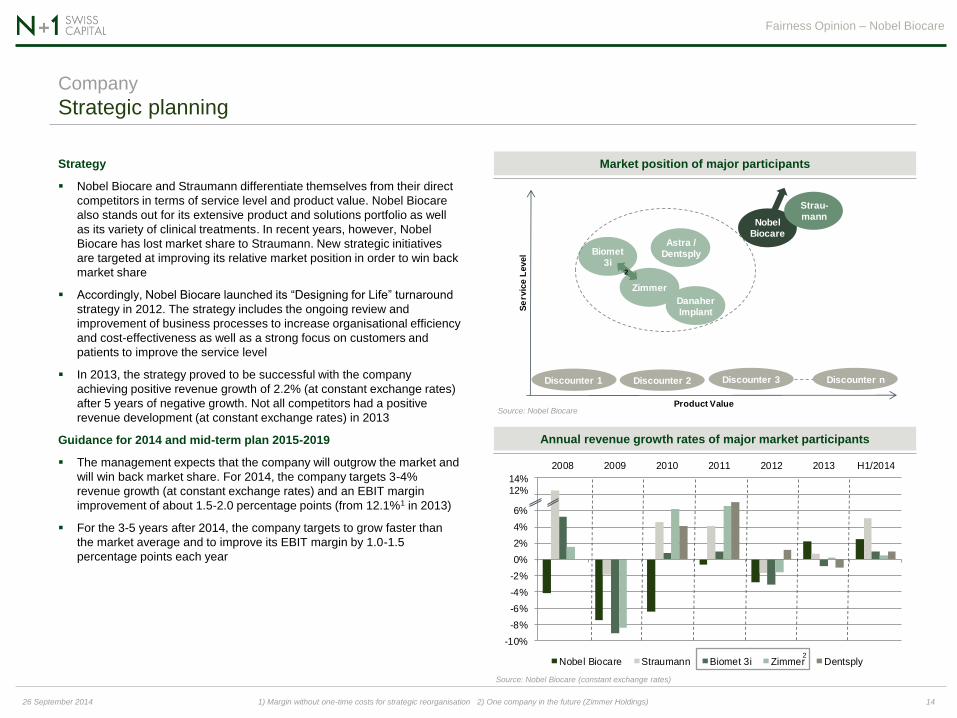
Market position of major participants
Annual revenue growth rates of major market participants
Strategy
Nobel Biocare and Straumann differentiate themselves from their direct
competitors in terms of service level and product value. Nobel Biocare
also stands out for its extensive product and solutions portfolio as well
as its variety of clinical treatments. In recent years, however, Nobel
Biocare has lost market share to Straumann. New strategic initiatives
are targeted at improving its relative market position in order to win back
market share
Accordingly, Nobel Biocare launched its “Designing for Life” turnaround
strategy in 2012. The strategy includes the ongoing review and
improvement of business processes to increase organisational efficiency
and cost-effectiveness as well as a strong focus on customers and
patients to improve the service level
In 2013, the strategy proved to be successful with the company
achieving positive revenue growth of 2.2% (at constant exchange rates)
after 5 years of negative growth. Not all competitors had a positive
revenue development (at constant exchange rates) in 2013
Guidance for 2014 and mid-term plan 2015-2019
The management expects that the company will outgrow the market and
will win back market share. For 2014, the company targets 3-4%
revenue growth (at constant exchange rates) and an EBIT margin
improvement of about 1.5-2.0 percentage points (from 12.1%1 in 2013)
For the 3-5 years after 2014, the company targets to grow faster than
the market average and to improve its EBIT margin by 1.0-1.5
percentage points each year
Company
2
Source: Nobel Biocare
Source: Nobel Biocare (constant exchange rates)
2
Valuation considerations
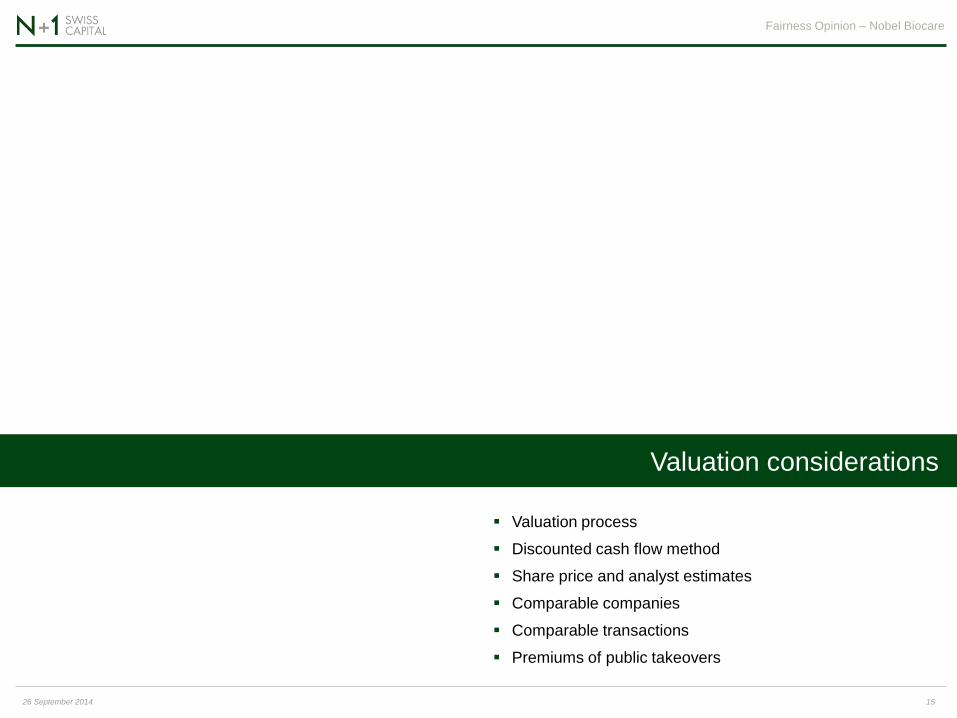
Valuation process
Discounted cash flow method
Share price and analyst estimates
Comparable companies
Comparable transactions
Premiums of public takeovers
Fairness Opinion – Nobel Biocare
15 26 September 2014
1) Date of Danaher’s pre-announcement. Any deviations from this date, such as for net financial iabilities, are explicitly noted
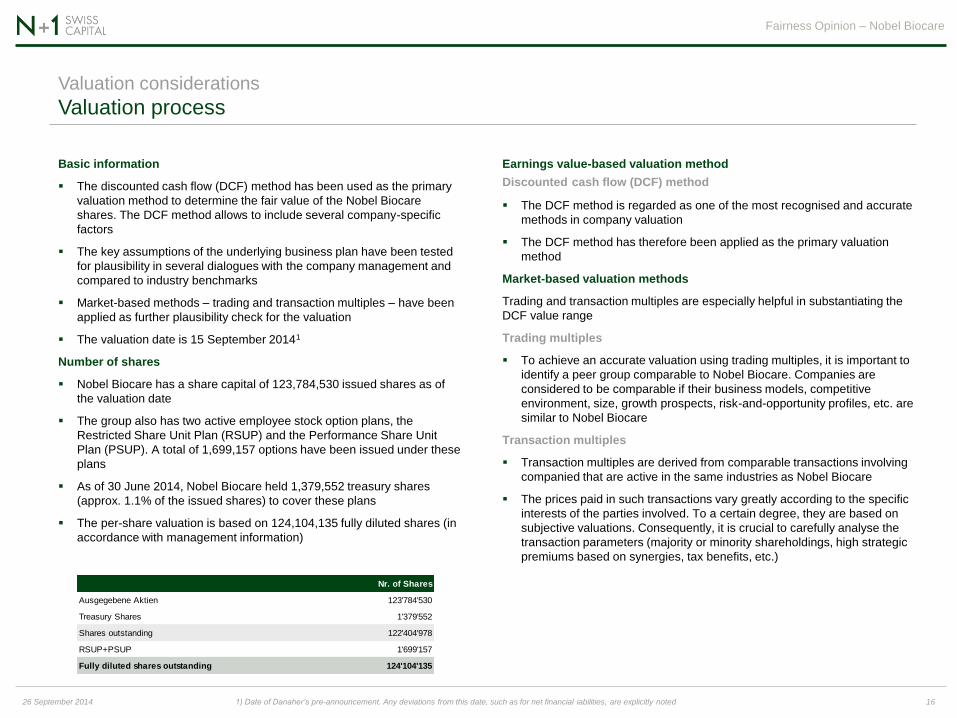
Valuation process Valuation considerations
Basic information
The discounted cash flow (DCF) method has been used as the primary
valuation method to determine the fair value of the Nobel Biocare
shares. The DCF method allows to include several company-specific
factors
The key assumptions of the underlying business plan have been tested
for plausibility in several dialogues with the company management and
compared to industry benchmarks
Market-based methods – trading and transaction multiples – have been
applied as further plausibility check for the valuation
The valuation date is 15 September 20141
Number of shares
Nobel Biocare has a share capital of 123,784,530 issued shares as of
the valuation date
The group also has two active employee stock option plans, the
Restricted Share Unit Plan (RSUP) and the Performance Share Unit
Plan (PSUP). A total of 1,699,157 options have been issued under these
plans
As of 30 June 2014, Nobel Biocare held 1,379,552 treasury shares
(approx. 1.1% of the issued shares) to cover these plans
The per-share valuation is based on 124,104,135 fully diluted shares (in
accordance with management information)
Fairness Opinion – Nobel Biocare
16 26 September 2014
Earnings value-based valuation method
Discounted cash flow (DCF) method
The DCF method is regarded as one of the most recognised and accurate
methods in company valuation
The DCF method has therefore been applied as the primary valuation
method
Market-based valuation methods
Trading and transaction multiples are especially helpful in substantiating the
DCF value range
Trading multiples
To achieve an accurate valuation using trading multiples, it is important to
identify a peer group comparable to Nobel Biocare. Companies are
considered to be comparable if their business models, competitive
environment, size, growth prospects, risk-and-opportunity profiles, etc. are
similar to Nobel Biocare
Transaction multiples
Transaction multiples are derived from comparable transactions involving
companied that are active in the same industries as Nobel Biocare
The prices paid in such transactions vary greatly according to the specific
interests of the parties involved. To a certain degree, they are based on
subjective valuations. Consequently, it is crucial to carefully analyse the
transaction parameters (majority or minority shareholdings, high strategic
premiums based on synergies, tax benefits, etc.)
Nr. of Shares
Ausgegebene Aktien 123'784'530
Treasury Shares 1'379'552
Shares outstanding 122'404'978
RSUP+PSUP 1'699'157
Fully diluted shares outstanding 124'104'135
Sources: Volkart, Suter & Vettiger (2002), Spremann (2007)
1) Also: weighted average cost of capital (WACC)
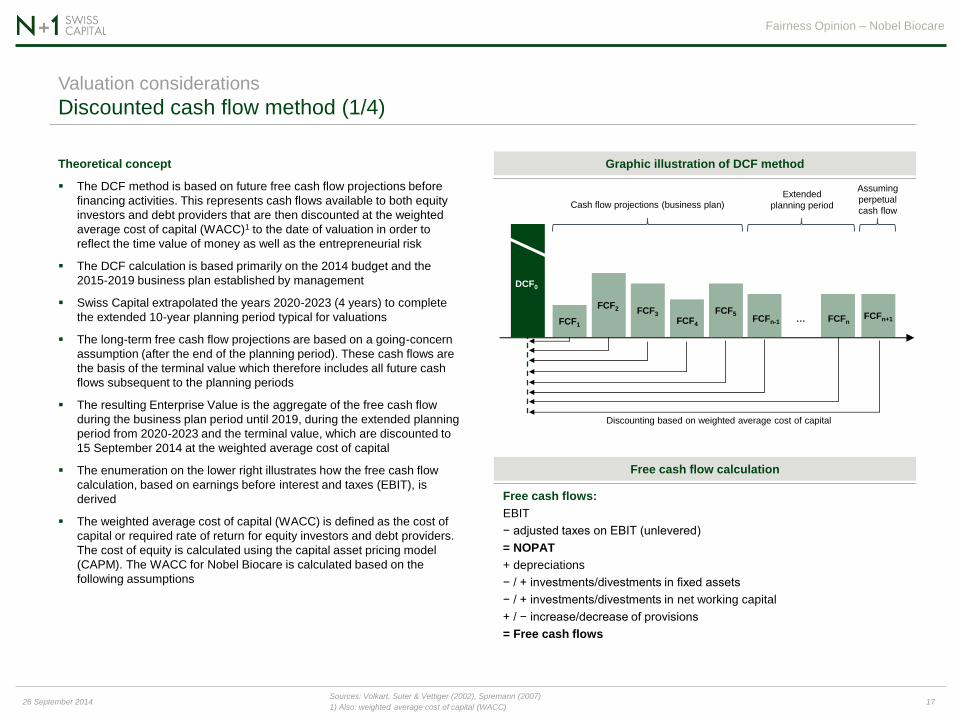
Discounted cash flow method (1/4) Valuation considerations
Graphic illustration of DCF method
Fairness Opinion – Nobel Biocare
17 26 September 2014
Theoretical concept
The DCF method is based on future free cash flow projections before
financing activities. This represents cash flows available to both equity
investors and debt providers that are then discounted at the weighted
average cost of capital (WACC)1 to the date of valuation in order to
reflect the time value of money as well as the entrepreneurial risk
The DCF calculation is based primarily on the 2014 budget and the
2015-2019 business plan established by management
Swiss Capital extrapolated the years 2020-2023 (4 years) to complete
the extended 10-year planning period typical for valuations
The long-term free cash flow projections are based on a going-concern
assumption (after the end of the planning period). These cash flows are
the basis of the terminal value which therefore includes all future cash
flows subsequent to the planning periods
The resulting Enterprise Value is the aggregate of the free cash flow
during the business plan period until 2019, during the extended planning
period from 2020-2023 and the terminal value, which are discounted to
15 September 2014 at the weighted average cost of capital
The enumeration on the lower right illustrates how the free cash flow
calculation, based on earnings before interest and taxes (EBIT), is
derived
The weighted average cost of capital (WACC) is defined as the cost of
capital or required rate of return for equity investors and debt providers.
The cost of equity is calculated using the capital asset pricing model
(CAPM). The WACC for Nobel Biocare is calculated based on the
following assumptions
DCF0
FCF1
FCF2 FCF3
FCF4 FCFn+1 FCFn …
Discounting based on weighted average cost of capital
Free cash flow calculation
Free cash flows:
EBIT
− adjusted taxes on EBIT (unlevered)
= NOPAT
+ depreciations
− / + investments/divestments in fixed assets
− / + investments/divestments in net working capital
+ / − increase/decrease of provisions
= Free cash flows
FCF5
Extended
planning period
FCFn-1
Cash flow projections (business plan)
Assuming
perpetual
cash flow
Sources: Bloomberg, management, Ibbotson (2012), Damodaran (2014)
1) Americas, EMEA and APAC 2) Cf. Appendix 2 for further details on WACC
Discounted cash flow method (2/4) Valuation considerations
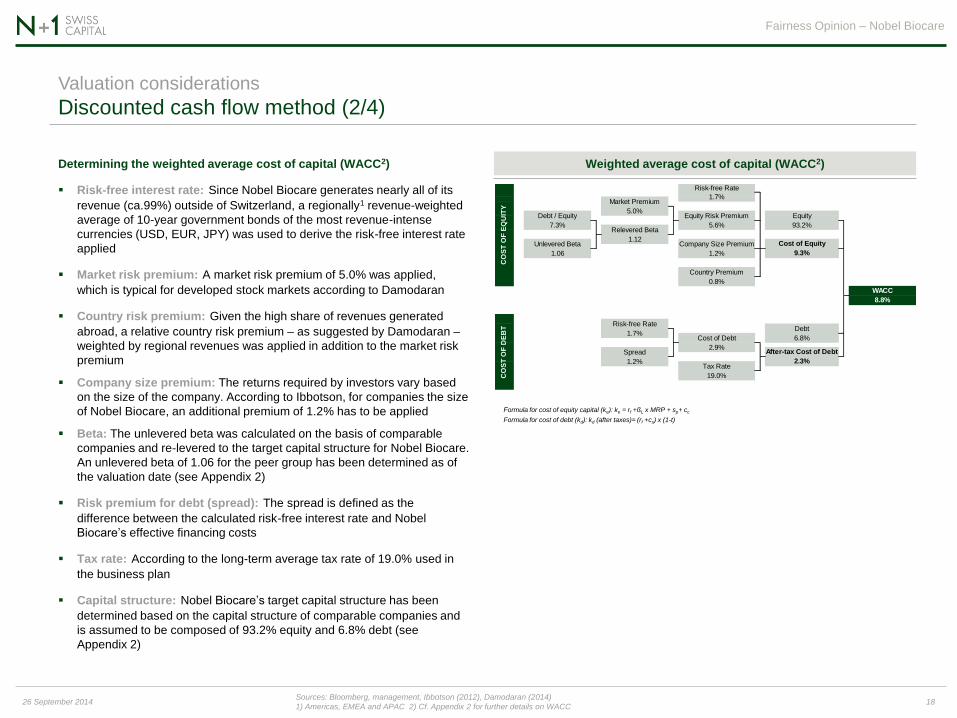
Weighted average cost of capital (WACC2)
Fairness Opinion – Nobel Biocare
18 26 September 2014
Determining the weighted average cost of capital (WACC2)
Risk-free interest rate: Since Nobel Biocare generates nearly all of its
revenue (ca.99%) outside of Switzerland, a regionally1 revenue-weighted
average of 10-year government bonds of the most revenue-intense
currencies (USD, EUR, JPY) was used to derive the risk-free interest rate
applied
Market risk premium: A market risk premium of 5.0% was applied,
which is typical for developed stock markets according to Damodaran
Country risk premium: Given the high share of revenues generated
abroad, a relative country risk premium – as suggested by Damodaran –
weighted by regional revenues was applied in addition to the market risk
premium
Company size premium: The returns required by investors vary based
on the size of the company. According to Ibbotson, for companies the size
of Nobel Biocare, an additional premium of 1.2% has to be applied
Beta: The unlevered beta was calculated on the basis of comparable
companies and re-levered to the target capital structure for Nobel Biocare.
An unlevered beta of 1.06 for the peer group has been determined as of
the valuation date (see Appendix 2)
Risk premium for debt (spread): The spread is defined as the
difference between the calculated risk-free interest rate and Nobel
Biocare’s effective financing costs
Tax rate: According to the long-term average tax rate of 19.0% used in
the business plan
Capital structure: Nobel Biocare’s target capital structure has been
determined based on the capital structure of comparable companies and
is assumed to be composed of 93.2% equity and 6.8% debt (see
Appendix 2)
Formula for cost of equity capital (ke): ke = rf +ßL x MRP + sp+ cc
Formula for cost of debt (kd): kd (after taxes)= (rf +cs) x (1-t)
Equity
93.2%
Debt
6.8%
Debt / Equity
7.3%
1.06
5.0%
Relevered Beta
1.12Unlevered Beta Company Size Premium
Market Premium
CO
ST
OF
EQ
UIT
Y
Risk-free Rate
1.7%
Equity Risk Premium
5.6%
0.8%
Country Premium
Cost of Equity
1.2% 9.3%
CO
ST
OF
DE
BT
Risk-free Rate
1.7%Cost of Debt
2.9%
Tax Rate
19.0%
WACC
8.8%
Spread After-tax Cost of Debt
1.2% 2.3%
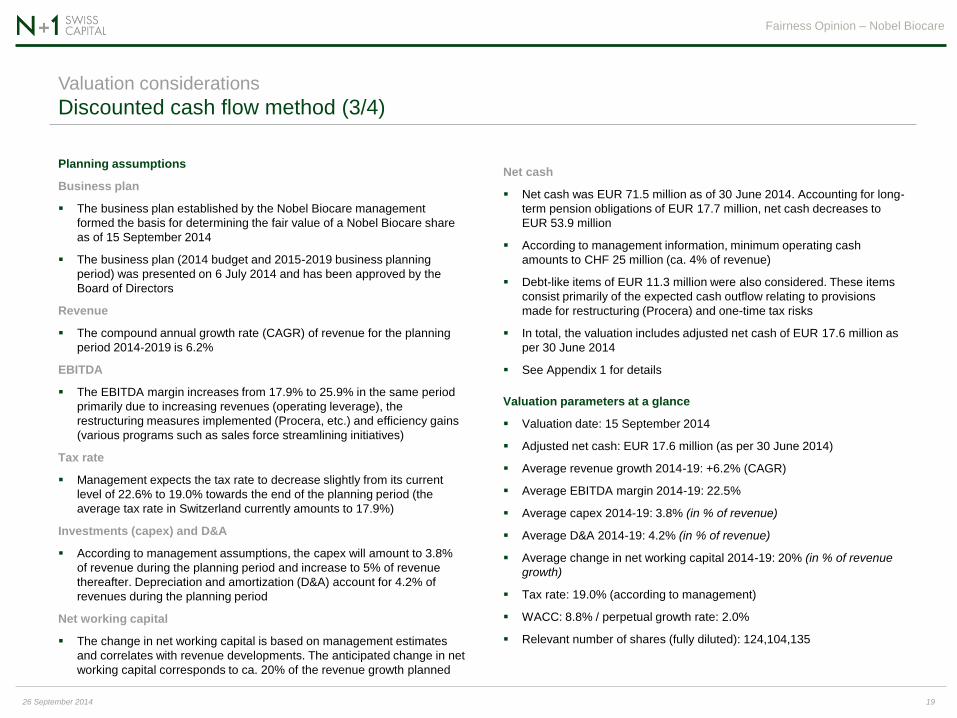
Valuation parameters at a glance
Valuation date: 15 September 2014
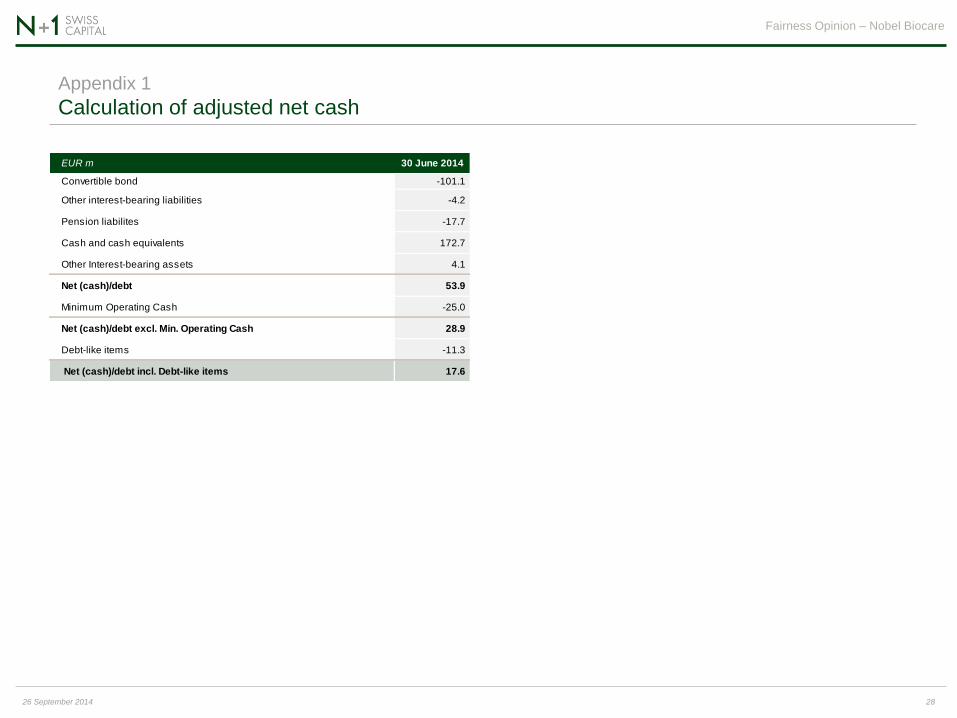
Adjusted net cash: EUR 17.6 million (as per 30 June 2014)
Average revenue growth 2014-19: +6.2% (CAGR)
Average EBITDA margin 2014-19: 22.5%
Average capex 2014-19: 3.8% (in % of revenue)
Average D&A 2014-19: 4.2% (in % of revenue)
Average change in net working capital 2014-19: 20% (in % of revenue
growth)
Tax rate: 19.0% (according to management)
WACC: 8.8% / perpetual growth rate: 2.0%
Relevant number of shares (fully diluted): 124,104,135
Discounted cash flow method (3/4) Valuation considerations
Fairness Opinion – Nobel Biocare
19 26 September 2014
Planning assumptions
Business plan
The business plan established by the Nobel Biocare management
formed the basis for determining the fair value of a Nobel Biocare share
as of 15 September 2014
The business plan (2014 budget and 2015-2019 business planning
period) was presented on 6 July 2014 and has been approved by the
Board of Directors
Revenue
The compound annual growth rate (CAGR) of revenue for the planning
period 2014-2019 is 6.2%
EBITDA
The EBITDA margin increases from 17.9% to 25.9% in the same period
primarily due to increasing revenues (operating leverage), the
restructuring measures implemented (Procera, etc.) and efficiency gains
(various programs such as sales force streamlining initiatives)
Tax rate
Management expects the tax rate to decrease slightly from its current
level of 22.6% to 19.0% towards the end of the planning period (the
average tax rate in Switzerland currently amounts to 17.9%)
Investments (capex) and D&A
According to management assumptions, the capex will amount to 3.8%
of revenue during the planning period and increase to 5% of revenue
thereafter. Depreciation and amortization (D&A) account for 4.2% of
revenues during the planning period
Net working capital
The change in net working capital is based on management estimates
and correlates with revenue developments. The anticipated change in net
working capital corresponds to ca. 20% of the revenue growth planned
Net cash
Net cash was EUR 71.5 million as of 30 June 2014. Accounting for long-
term pension obligations of EUR 17.7 million, net cash decreases to
EUR 53.9 million
According to management information, minimum operating cash
amounts to CHF 25 million (ca. 4% of revenue)
Debt-like items of EUR 11.3 million were also considered. These items
consist primarily of the expected cash outflow relating to provisions
made for restructuring (Procera) and one-time tax risks
In total, the valuation includes adjusted net cash of EUR 17.6 million as
per 30 June 2014
See Appendix 1 for details
Discounted cash flow method (4/4) Valuation considerations
Determining the value per share using DCF
Sensitivities
Fairness Opinion – Nobel Biocare
20 26 September 2014
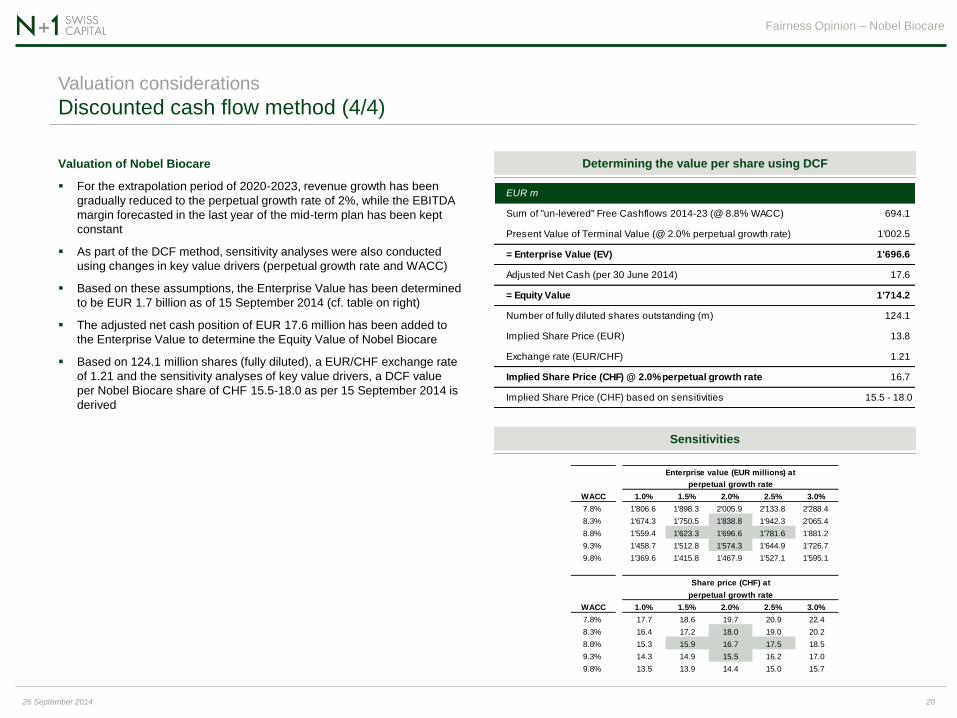
Valuation of Nobel Biocare
For the extrapolation period of 2020-2023, revenue growth has been
gradually reduced to the perpetual growth rate of 2%, while the EBITDA
margin forecasted in the last year of the mid-term plan has been kept
constant
As part of the DCF method, sensitivity analyses were also conducted
using changes in key value drivers (perpetual growth rate and WACC)
Based on these assumptions, the Enterprise Value has been determined
to be EUR 1.7 billion as of 15 September 2014 (cf. table on right)
The adjusted net cash position of EUR 17.6 million has been added to
the Enterprise Value to determine the Equity Value of Nobel Biocare
Based on 124.1 million shares (fully diluted), a EUR/CHF exchange rate
of 1.21 and the sensitivity analyses of key value drivers, a DCF value
per Nobel Biocare share of CHF 15.5-18.0 as per 15 September 2014 is
derived
Enterprise value (EUR millions) at
perpetual growth rate
WACC 1.0% 1.5% 2.0% 2.5% 3.0%
7.8% 1'806.6 1'898.3 2'005.9 2'133.8 2'288.4
8.3% 1'674.3 1'750.5 1'838.8 1'942.3 2'065.4
8.8% 1'559.4 1'623.3 1'696.6 1'781.6 1'881.2
9.3% 1'458.7 1'512.8 1'574.3 1'644.9 1'726.7
9.8% 1'369.6 1'415.8 1'467.9 1'527.1 1'595.1
Share price (CHF) at
perpetual growth rate
WACC 1.0% 1.5% 2.0% 2.5% 3.0%
7.8% 17.7 18.6 19.7 20.9 22.4
8.3% 16.4 17.2 18.0 19.0 20.2
8.8% 15.3 15.9 16.7 17.5 18.5
9.3% 14.3 14.9 15.5 16.2 17.0
9.8% 13.5 13.9 14.4 15.0 15.7
EUR m
Sum of "un-levered" Free Cashflows 2014-23 (@ 8.8% WACC) 694.1
Present Value of Terminal Value (@ 2.0% perpetual growth rate) 1'002.5
= Enterprise Value (EV) 1'696.6
Adjusted Net Cash (per 30 June 2014) 17.6
= Equity Value 1'714.2
Number of fully diluted shares outstanding (m) 124.1
Implied Share Price (EUR) 13.8
Exchange rate (EUR/CHF) 1.21
Implied Share Price (CHF) @ 2.0% perpetual growth rate 16.7
Implied Share Price (CHF) based on sensitivities 15.5 - 18.0
0
2'000
4'000
6'000
8'000
0
5
10
15
20
Aug-13 Oct-13 Dec-13 Feb-14 Mar-14 May-14 Jul-14 Sep-14
Volume NOBN SPI
Share price and analyst estimates Valuation considerations
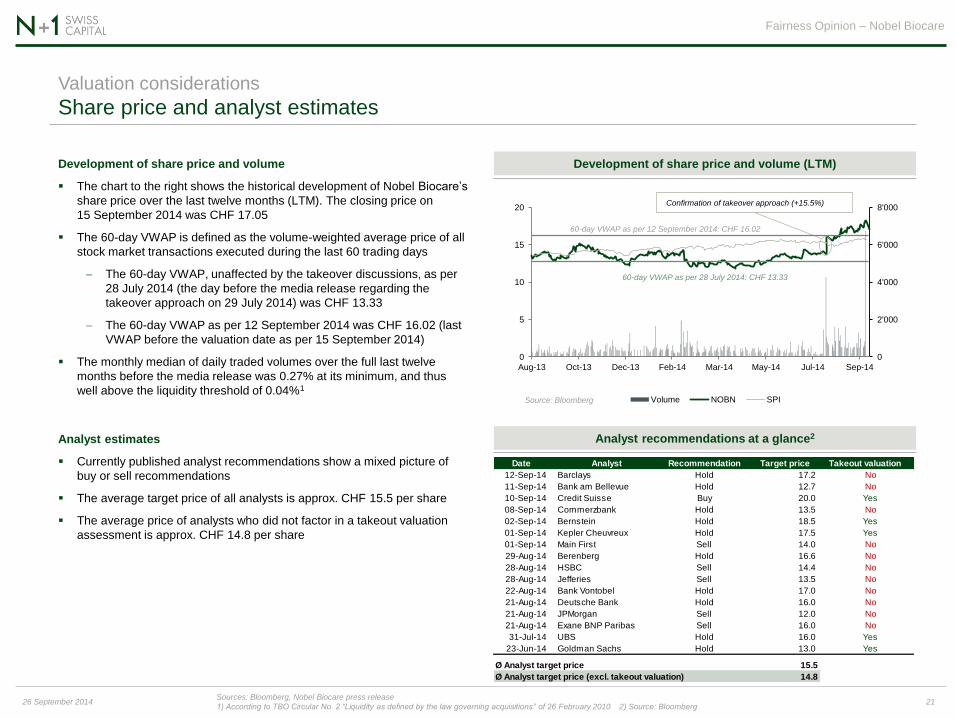
Development of share price and volume
The chart to the right shows the historical development of Nobel Biocare’s
share price over the last twelve months (LTM). The closing price on
15 September 2014 was CHF 17.05
The 60-day VWAP is defined as the volume-weighted average price of all
stock market transactions executed during the last 60 trading days
The 60-day VWAP, unaffected by the takeover discussions, as per
28 July 2014 (the day before the media release regarding the
takeover approach on 29 July 2014) was CHF 13.33
The 60-day VWAP as per 12 September 2014 was CHF 16.02 (last
VWAP before the valuation date as per 15 September 2014)
The monthly median of daily traded volumes over the full last twelve
months before the media release was 0.27% at its minimum, and thus
well above the liquidity threshold of 0.04%1
Development of share price and volume (LTM)
Analyst recommendations at a glance2
Fairness Opinion – Nobel Biocare
21 26 September 2014 Sources: Bloomberg, Nobel Biocare press release
1) According to TBO Circular No. 2 “Liquidity as defined by the law governing acquisitions” of 26 February 2010 2) Source: Bloomberg
60-day VWAP as per 28 July 2014: CHF 13.33
Confirmation of takeover approach (+15.5%)
Analyst estimates
Currently published analyst recommendations show a mixed picture of
buy or sell recommendations
The average target price of all analysts is approx. CHF 15.5 per share
The average price of analysts who did not factor in a takeout valuation
assessment is approx. CHF 14.8 per share
Source: Bloomberg
60-day VWAP as per 12 September 2014: CHF 16.02
Date Analyst Recommendation Target price Takeout valuation
12-Sep-14 Barclays Hold 17.2 No
11-Sep-14 Bank am Bellevue Hold 12.7 No
10-Sep-14 Credit Suisse Buy 20.0 Yes
08-Sep-14 Commerzbank Hold 13.5 No
02-Sep-14 Bernstein Hold 18.5 Yes
01-Sep-14 Kepler Cheuvreux Hold 17.5 Yes
01-Sep-14 Main First Sell 14.0 No
29-Aug-14 Berenberg Hold 16.6 No
28-Aug-14 HSBC Sell 14.4 No
28-Aug-14 Jefferies Sell 13.5 No
22-Aug-14 Bank Vontobel Hold 17.0 No
21-Aug-14 Deutsche Bank Hold 16.0 No
21-Aug-14 JPMorgan Sell 12.0 No
21-Aug-14 Exane BNP Paribas Sell 16.0 No
31-Jul-14 UBS Hold 16.0 Yes
23-Jun-14 Goldman Sachs Hold 13.0 Yes
Ø Analyst target price 15.5
Ø Analyst target price (excl. takeout valuation) 14.8
Comparable companies Valuation considerations
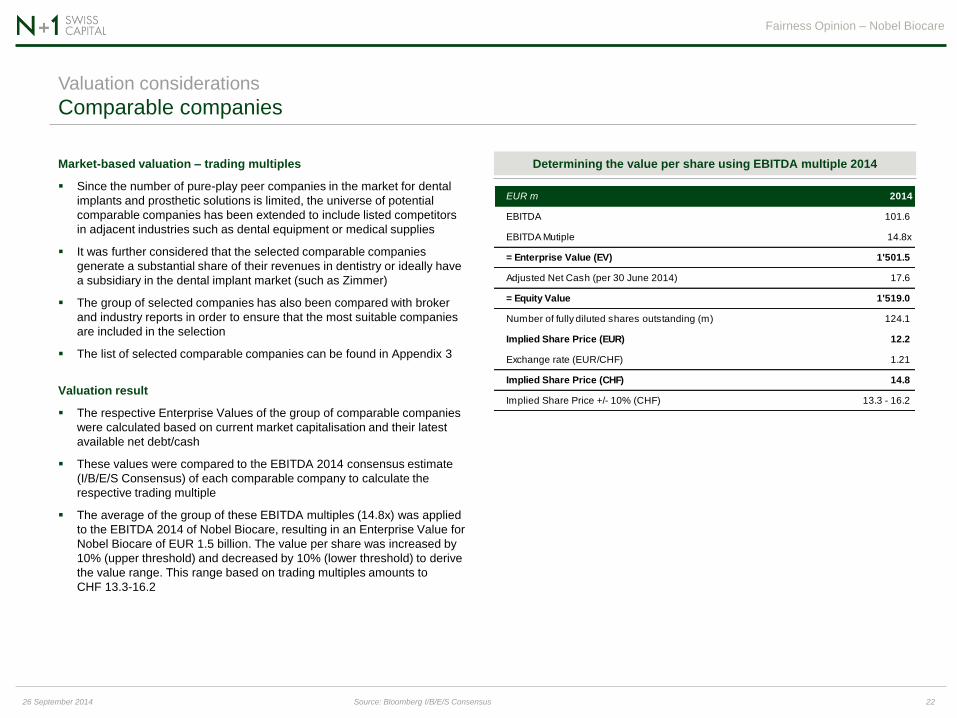
Market-based valuation – trading multiples
Since the number of pure-play peer companies in the market for dental
implants and prosthetic solutions is limited, the universe of potential
comparable companies has been extended to include listed competitors
in adjacent industries such as dental equipment or medical supplies
It was further considered that the selected comparable companies
generate a substantial share of their revenues in dentistry or ideally have
a subsidiary in the dental implant market (such as Zimmer)
The group of selected companies has also been compared with broker
and industry reports in order to ensure that the most suitable companies
are included in the selection
The list of selected comparable companies can be found in Appendix 3
Valuation result
The respective Enterprise Values of the group of comparable companies
were calculated based on current market capitalisation and their latest
available net debt/cash
These values were compared to the EBITDA 2014 consensus estimate
(I/B/E/S Consensus) of each comparable company to calculate the
respective trading multiple
The average of the group of these EBITDA multiples (14.8x) was applied
to the EBITDA 2014 of Nobel Biocare, resulting in an Enterprise Value for
Nobel Biocare of EUR 1.5 billion. The value per share was increased by
10% (upper threshold) and decreased by 10% (lower threshold) to derive
the value range. This range based on trading multiples amounts to
CHF 13.3-16.2
Fairness Opinion – Nobel Biocare
22 26 September 2014
Determining the value per share using EBITDA multiple 2014
Source: Bloomberg I/B/E/S Consensus
EUR m 2014
EBITDA 101.6
EBITDA Mutiple 14.8x
= Enterprise Value (EV) 1'501.5
Adjusted Net Cash (per 30 June 2014) 17.6
= Equity Value 1'519.0
Number of fully diluted shares outstanding (m) 124.1
Implied Share Price (EUR) 12.2
Exchange rate (EUR/CHF) 1.21
Implied Share Price (CHF) 14.8
Implied Share Price +/- 10% (CHF) 13.3 - 16.2
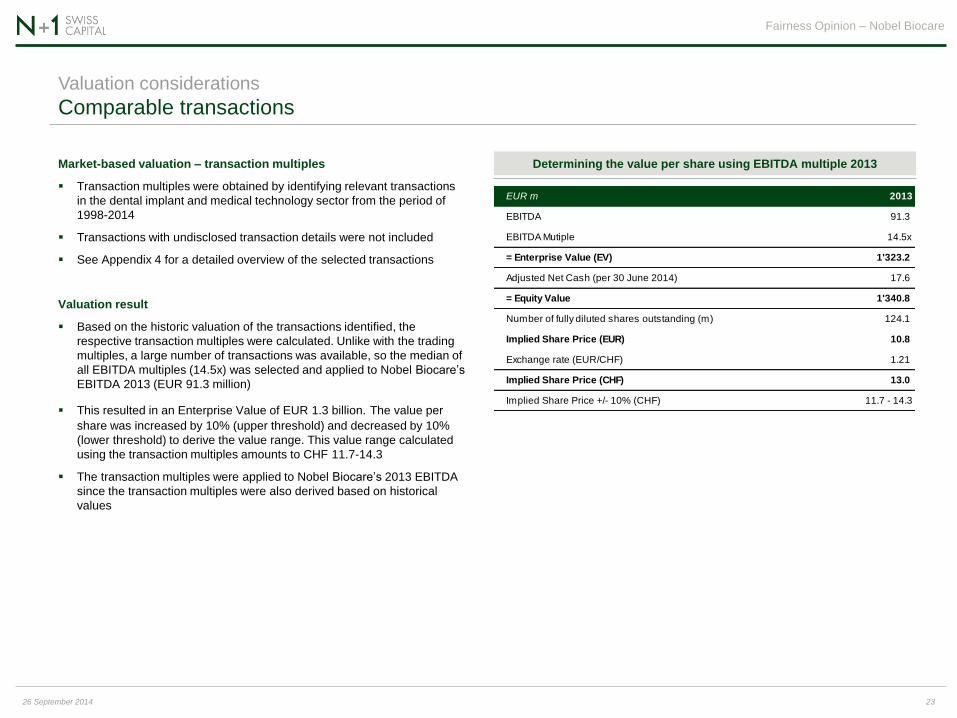
Comparable transactions Valuation considerations
Fairness Opinion – Nobel Biocare
Market-based valuation – transaction multiples
Transaction multiples were obtained by identifying relevant transactions
in the dental implant and medical technology sector from the period of
1998-2014
Transactions with undisclosed transaction details were not included
See Appendix 4 for a detailed overview of the selected transactions
Valuation result
Based on the historic valuation of the transactions identified, the
respective transaction multiples were calculated. Unlike with the trading
multiples, a large number of transactions was available, so the median of
all EBITDA multiples (14.5x) was selected and applied to Nobel Biocare’s
EBITDA 2013 (EUR 91.3 million)
This resulted in an Enterprise Value of EUR 1.3 billion. The value per
share was increased by 10% (upper threshold) and decreased by 10%
(lower threshold) to derive the value range. This value range calculated
using the transaction multiples amounts to CHF 11.7-14.3
The transaction multiples were applied to Nobel Biocare’s 2013 EBITDA
since the transaction multiples were also derived based on historical
values
23 26 September 2014
Determining the value per share using EBITDA multiple 2013
EUR m 2013
EBITDA 91.3
EBITDA Mutiple 14.5x
= Enterprise Value (EV) 1'323.2
Adjusted Net Cash (per 30 June 2014) 17.6
= Equity Value 1'340.8
Number of fully diluted shares outstanding (m) 124.1
Implied Share Price (EUR) 10.8
Exchange rate (EUR/CHF) 1.21
Implied Share Price (CHF) 13.0
Implied Share Price +/- 10% (CHF) 11.7 - 14.3
0
2'500
5'000
7'500
10'000
10.0
12.5
15.0
17.5
20.0
Mar-14 May-14 Jun-14 Jul-14 Sep-14
Volume NOBN SPI
CHF '000
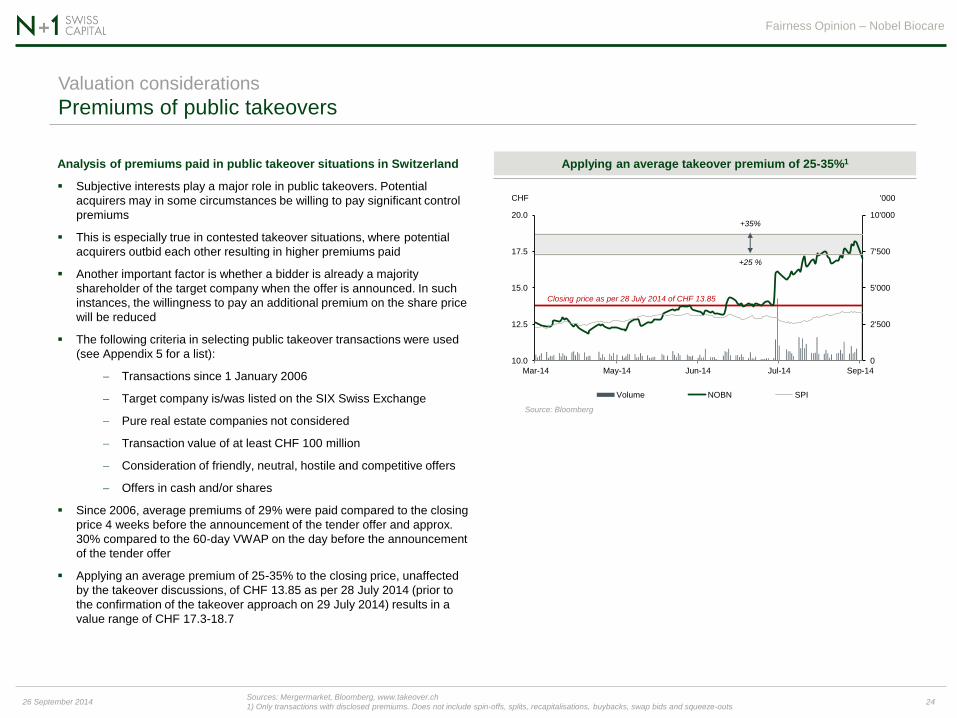
Analysis of premiums paid in public takeover situations in Switzerland
Subjective interests play a major role in public takeovers. Potential
acquirers may in some circumstances be willing to pay significant control
premiums
This is especially true in contested takeover situations, where potential
acquirers outbid each other resulting in higher premiums paid
Another important factor is whether a bidder is already a majority
shareholder of the target company when the offer is announced. In such
instances, the willingness to pay an additional premium on the share price
will be reduced
The following criteria in selecting public takeover transactions were used
(see Appendix 5 for a list):
Transactions since 1 January 2006
Target company is/was listed on the SIX Swiss Exchange
Pure real estate companies not considered
Transaction value of at least CHF 100 million
Consideration of friendly, neutral, hostile and competitive offers
Offers in cash and/or shares
Since 2006, average premiums of 29% were paid compared to the closing
price 4 weeks before the announcement of the tender offer and approx.
30% compared to the 60-day VWAP on the day before the announcement
of the tender offer
Applying an average premium of 25-35% to the closing price, unaffected
by the takeover discussions, of CHF 13.85 as per 28 July 2014 (prior to
the confirmation of the takeover approach on 29 July 2014) results in a
value range of CHF 17.3-18.7
Closing price as per 28 July 2014 of CHF 13.85
+25 %
+35%
Sources: Mergermarket, Bloomberg, www.takeover.ch
1) Only transactions with disclosed premiums. Does not include spin-offs, splits, recapitalisations, buybacks, swap bids and squeeze-outs
Premiums of public takeovers Valuation considerations
Fairness Opinion – Nobel Biocare
Applying an average takeover premium of 25-35%1
24 26 September 2014
Source: Bloomberg
Result of the fairness opinion
25 26 September 2014
Fairness Opinion – Nobel Biocare
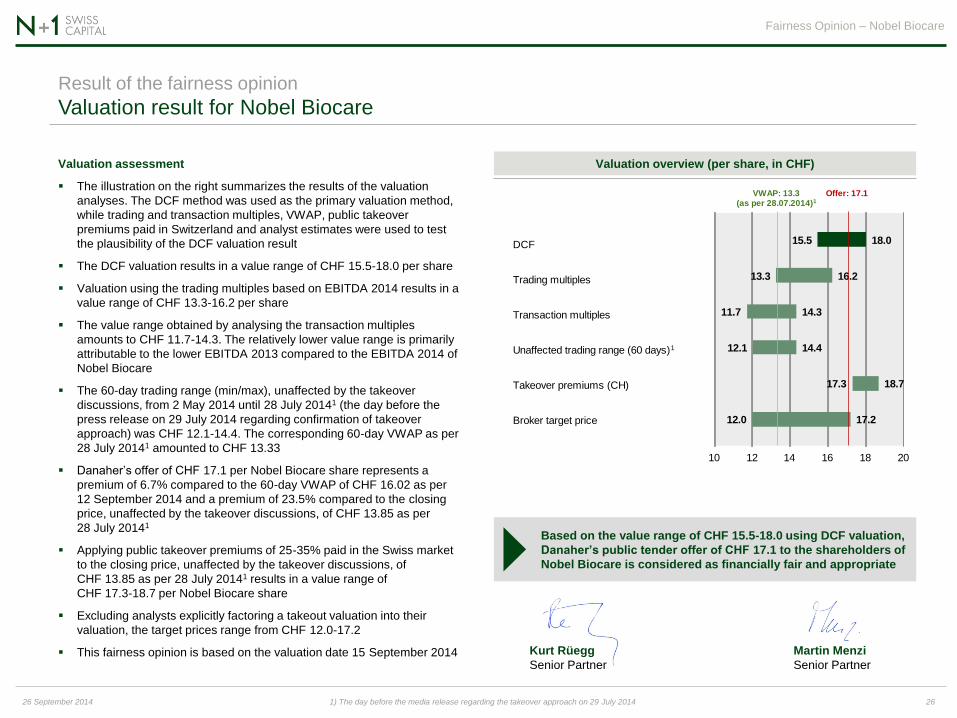
Valuation result for Nobel Biocare Result of the fairness opinion
Valuation assessment
The illustration on the right summarizes the results of the valuation
analyses. The DCF method was used as the primary valuation method,
while trading and transaction multiples, VWAP, public takeover
premiums paid in Switzerland and analyst estimates were used to test
the plausibility of the DCF valuation result
The DCF valuation results in a value range of CHF 15.5-18.0 per share
Valuation using the trading multiples based on EBITDA 2014 results in a
value range of CHF 13.3-16.2 per share
The value range obtained by analysing the transaction multiples
amounts to CHF 11.7-14.3. The relatively lower value range is primarily
attributable to the lower EBITDA 2013 compared to the EBITDA 2014 of
Nobel Biocare
The 60-day trading range (min/max), unaffected by the takeover
discussions, from 2 May 2014 until 28 July 20141 (the day before the
press release on 29 July 2014 regarding confirmation of takeover
approach) was CHF 12.1-14.4. The corresponding 60-day VWAP as per
28 July 20141 amounted to CHF 13.33
Danaher’s offer of CHF 17.1 per Nobel Biocare share represents a
premium of 6.7% compared to the 60-day VWAP of CHF 16.02 as per
12 September 2014 and a premium of 23.5% compared to the closing
price, unaffected by the takeover discussions, of CHF 13.85 as per
28 July 20141
Applying public takeover premiums of 25-35% paid in the Swiss market
to the closing price, unaffected by the takeover discussions, of
CHF 13.85 as per 28 July 20141 results in a value range of
CHF 17.3-18.7 per Nobel Biocare share
Excluding analysts explicitly factoring a takeout valuation into their
valuation, the target prices range from CHF 12.0-17.2
This fairness opinion is based on the valuation date 15 September 2014
Fairness Opinion – Nobel Biocare
26 26 September 2014
Valuation overview (per share, in CHF)
Kurt Rüegg
Senior Partner
Based on the value range of CHF 15.5-18.0 using DCF valuation,
Danaher’s public tender offer of CHF 17.1 to the shareholders of
Nobel Biocare is considered as financially fair and appropriate
Martin Menzi
Senior Partner
DCF
Trading multiples
Transaction multiples
Unaffected trading range (60 days)
Takeover premiums (CH)
Broker target price
DCF
15.5
13.3
11.7
12.1
17.3
12.0
18.0
16.2
14.3
14.4
18.7
17.2
10 12 14 16 18 20
Offer: 17.1VWAP: 13.3(as per 28.07.2014)1
1) The day before the media release regarding the takeover approach on 29 July 2014
1
Appendices
Appendix 1: Calculation of adjusted net cash
Appendix 2: Analysis of betas and derivation of WACC
Appendix 3: Trading multiples
Appendix 4: Transaction multiples
Appendix 5: Public takeover premiums
Appendix 6: List of abbreviations
27 26 September 2014
Fairness Opinion – Nobel Biocare
Calculation of adjusted net cash Appendix 1
Fairness Opinion – Nobel Biocare
28 26 September 2014
EUR m 30 June 2014
Convertible bond -101.1
Other interest-bearing liabilities -4.2
Pension liabilites -17.7
Cash and cash equivalents 172.7
Other Interest-bearing assets 4.1
Net (cash)/debt 53.9
Minimum Operating Cash -25.0
Net (cash)/debt excl. Min. Operating Cash 28.9
Debt-like items -11.3
Net (cash)/debt incl. Debt-like items 17.6
Analysis of betas and derivation of WACC (1/2) Appendix 2
29 26 September 2014
Fairness Opinion – Nobel Biocare
WACC
WACC describes the weighted required rate of return for equity investors and debt providers. The cost of equity capital is calculated using the capital asset
pricing model (CAPM). The cost of debt has been adjusted with the expected tax rate of 19%. The beta of Nobel Biocare is the two-year beta as per 28 July
2014 (last trading date before the media release confirming the takeover approach on 29 July 2014)
Comparable Levered Marginal Debt Equity market Debt to Unlevered Levered Unlevered
companies beta1 tax rate (LCm) value (LCm) equity beta
2 return return3
Nobel Biocare 1.39 17.9% 122.4 2'110.5 5.8% 1.33 8.6% 8.3%
Straumann 0.99 17.9% 203.6 3'500.6 5.8% 0.94 6.6% 6.4%
Dentsply 0.87 40.0% 1'367.2 6'616.8 20.7% 0.77 6.0% 5.6%
Sirona 0.69 40.0% 79.5 4'492.9 1.8% 0.68 5.1% 5.1%
Align 1.70 40.0% 0.0 4'352.3 0.0% 1.70 10.2% 10.2%
Zimmer 0.96 40.0% 1'687.4 17'663.6 9.6% 0.91 6.5% 6.2%
Average 1.10 32.6% 7.3% 1.06 7.2% 7.0%
Levered cost of equity4
Macroeconomic Unlevered betas
assumptions Debt/equity 0.96 1.01 1.06 1.11 1.16
Risk-free rate 1.7% 2.3% 8.5% 8.8% 9.0% 9.3% 9.6%
Risk premium 5.0% 4.8% 8.6% 8.9% 9.2% 9.4% 9.7%
Company size premium 1.2% 7.3% 8.7% 9.0% 9.3% 9.5% 9.8%
Country risk premium 0.8% 9.8% 8.8% 9.1% 9.4% 9.6% 9.9%
Estimated market return 8.7% 12.3% 8.9% 9.2% 9.5% 9.7% 10.0%
WACC5
Debt to Equity to Cost Unlevered betas
capitalization capitalization of debt Debt/equity 0.96 1.01 1.06 1.11 1.16
2.2% 97.8% 1.9% 2.3% 8.4% 8.6% 8.9% 9.1% 9.4%
4.5% 95.5% 2.4% 4.8% 8.3% 8.6% 8.8% 9.1% 9.3%
6.8% 93.2% 2.9% 7.3% 8.3% 8.5% 8.8% 9.0% 9.3%
8.9% 91.1% 3.4% 9.8% 8.3% 8.5% 8.8% 9.0% 9.3%
10.9% 89.1% 3.4% 12.3% 8.2% 8.5% 8.7% 9.0% 9.2%
1) Source: Bloomberg, 15 September 2014 2) Unlevered beta = (levered beta/(1 + ((1 - tax rate) * debt/equity)). Assumes beta of debt = 0.0
3) Unlevered return = ( risk-free rate + (unlevered beta * risk premium)) 4) Levered cost of equity = (risk-free rate + (levered beta * risk premium))
5) WACC = ((debt/capitalization * (cost of debt * (1 - tax rate))) + (equity/capitalization * levered cost of equity))
Capital structure
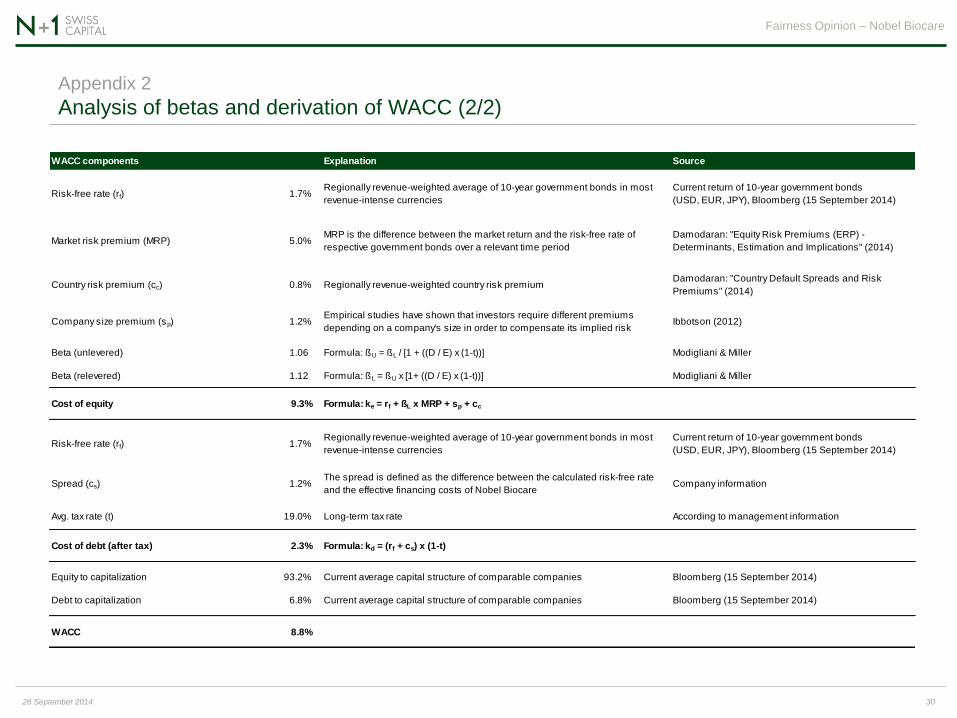
Analysis of betas and derivation of WACC (2/2) Appendix 2
30 26 September 2014
Fairness Opinion – Nobel Biocare
WACC components Explanation Source
Risk-free rate (rf) 1.7%Regionally revenue-weighted average of 10-year government bonds in most
revenue-intense currencies
Current return of 10-year government bonds
(USD, EUR, JPY), Bloomberg (15 September 2014)
Market risk premium (MRP) 5.0%MRP is the difference between the market return and the risk-free rate of
respective government bonds over a relevant time period
Damodaran: "Equity Risk Premiums (ERP) -
Determinants, Estimation and Implications" (2014)
Country risk premium (cc) 0.8% Regionally revenue-weighted country risk premiumDamodaran: "Country Default Spreads and Risk
Premiums" (2014)
Company size premium (sp) 1.2%Empirical studies have shown that investors require different premiums
depending on a company's size in order to compensate its implied riskIbbotson (2012)
Beta (unlevered) 1.06 Formula: ßU = ßL / [1 + ((D / E) x (1-t))] Modigliani & Miller
Beta (relevered) 1.12 Formula: ßL = ßU x [1+ ((D / E) x (1-t))] Modigliani & Miller
Cost of equity 9.3% Formula: ke = rf + ßL x MRP + sp + cc
Risk-free rate (rf) 1.7%Regionally revenue-weighted average of 10-year government bonds in most
revenue-intense currencies
Current return of 10-year government bonds
(USD, EUR, JPY), Bloomberg (15 September 2014)
Spread (cs) 1.2%The spread is defined as the difference between the calculated risk-free rate
and the effective financing costs of Nobel BiocareCompany information
Avg. tax rate (t) 19.0% Long-term tax rate According to management information
Cost of debt (after tax) 2.3% Formula: kd = (rf + cs) x (1-t)
Equity to capitalization 93.2% Current average capital structure of comparable companies Bloomberg (15 September 2014)
Debt to capitalization 6.8% Current average capital structure of comparable companies Bloomberg (15 September 2014)
WACC 8.8%
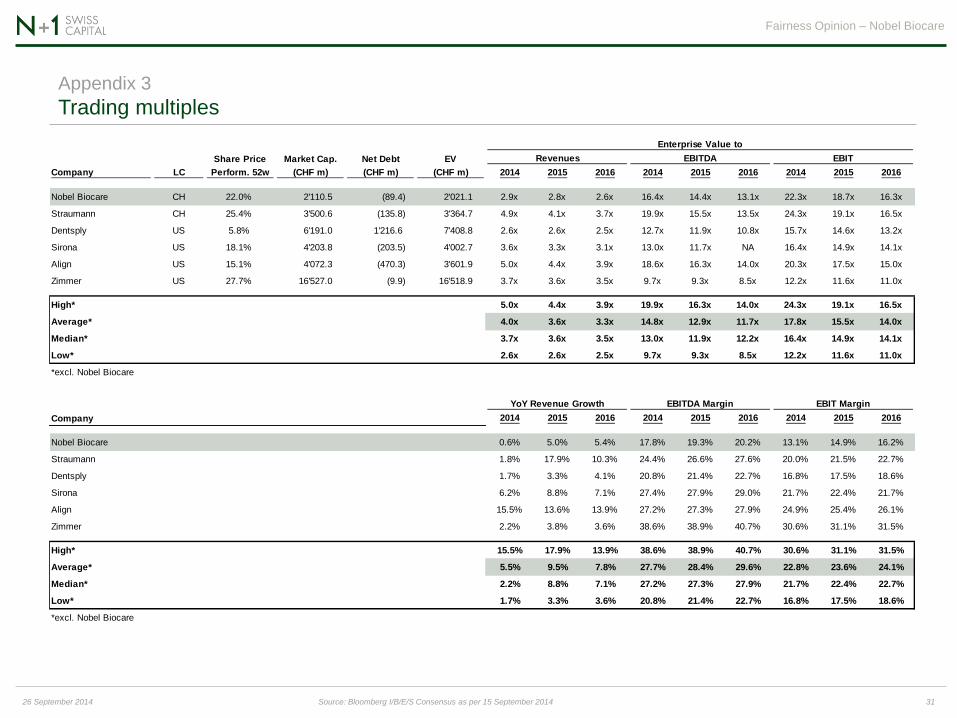
Trading multiples Appendix 3
Fairness Opinion – Nobel Biocare
31 26 September 2014 Source: Bloomberg I/B/E/S Consensus as per 15 September 2014
Enterprise Value to
Share Price Market Cap. Net Debt EV Revenues EBITDA EBIT
Company LC Perform. 52w (CHF m) (CHF m) (CHF m) 2014 2015 2016 2014 2015 2016 2014 2015 2016
Nobel Biocare CH 22.0% 2'110.5 (89.4) 2'021.1 2.9x 2.8x 2.6x 16.4x 14.4x 13.1x 22.3x 18.7x 16.3x
Straumann CH 25.4% 3'500.6 (135.8) 3'364.7 4.9x 4.1x 3.7x 19.9x 15.5x 13.5x 24.3x 19.1x 16.5x
Dentsply US 5.8% 6'191.0 1'216.6 7'408.8 2.6x 2.6x 2.5x 12.7x 11.9x 10.8x 15.7x 14.6x 13.2x
Sirona US 18.1% 4'203.8 (203.5) 4'002.7 3.6x 3.3x 3.1x 13.0x 11.7x NA 16.4x 14.9x 14.1x
Align US 15.1% 4'072.3 (470.3) 3'601.9 5.0x 4.4x 3.9x 18.6x 16.3x 14.0x 20.3x 17.5x 15.0x
Zimmer US 27.7% 16'527.0 (9.9) 16'518.9 3.7x 3.6x 3.5x 9.7x 9.3x 8.5x 12.2x 11.6x 11.0x
High* 5.0x 4.4x 3.9x 19.9x 16.3x 14.0x 24.3x 19.1x 16.5x
Average* 4.0x 3.6x 3.3x 14.8x 12.9x 11.7x 17.8x 15.5x 14.0x
Median* 3.7x 3.6x 3.5x 13.0x 11.9x 12.2x 16.4x 14.9x 14.1x
Low* 2.6x 2.6x 2.5x 9.7x 9.3x 8.5x 12.2x 11.6x 11.0x
*excl. Nobel Biocare
YoY Revenue Growth EBITDA Margin EBIT Margin
Company 2014 2015 2016 2014 2015 2016 2014 2015 2016
Nobel Biocare 0.6% 5.0% 5.4% 17.8% 19.3% 20.2% 13.1% 14.9% 16.2%
Straumann 1.8% 17.9% 10.3% 24.4% 26.6% 27.6% 20.0% 21.5% 22.7%
Dentsply 1.7% 3.3% 4.1% 20.8% 21.4% 22.7% 16.8% 17.5% 18.6%
Sirona 6.2% 8.8% 7.1% 27.4% 27.9% 29.0% 21.7% 22.4% 21.7%
Align 15.5% 13.6% 13.9% 27.2% 27.3% 27.9% 24.9% 25.4% 26.1%
Zimmer 2.2% 3.8% 3.6% 38.6% 38.9% 40.7% 30.6% 31.1% 31.5%
High* 15.5% 17.9% 13.9% 38.6% 38.9% 40.7% 30.6% 31.1% 31.5%
Average* 5.5% 9.5% 7.8% 27.7% 28.4% 29.6% 22.8% 23.6% 24.1%
Median* 2.2% 8.8% 7.1% 27.2% 27.3% 27.9% 21.7% 22.4% 22.7%
Low* 1.7% 3.3% 3.6% 20.8% 21.4% 22.7% 16.8% 17.5% 18.6%
*excl. Nobel Biocare
Source: Mergermarket
Transaction multiples Appendix 4
32 26 September 2014
Fairness Opinion – Nobel Biocare
Date Target company Bidder company Enterprise value EUR(m)
Target
revenue
EV/
sales
EV/
EBITDA Target description
26.02.2014MDH AG Mamisch Dental
HealthLifco Dental International AB 150 45 3.3x 7.5x
MDH AG Mamisch Dental Health is a Germany based company which provides foreign dental
prosthesis
26.11.2013BioHorizons, Inc.
(60% Stake) Henry Schein, Inc. 186 87 2.1x n.a.
BioHorizons, Inc., is a US based company headquartered in Birmingham, Alabama, manufacturing
dental equipment and products
04.04.2013 Heraeus Dental Mitsui Chemicals Inc 450 354 1.3x n.a.Heraeus Dental, is a Germany based provider of cosmetic dentistry, tooth preservation, prosthetics,
periodontalgy and digital dentistry
04.12.2012 Young Innovations Incorporated Linden LLC 227 82 2.8x 10.4xYoung Innovations Incorporated is a US based company engaged in development, manufacturing
and marketing of supplies and equipment used by dentists
16.05.2012Neodent
(49% Stake)Straumann Holding AG 444 69 6.3x 12.9x
Neodent is a Brazil based company engaged in manufacturing of dental implants and related
prosthetic components, mainly active in the value segment
22.06.2011 Astra Tech AB DENTSPLY International 1'254 400 3.4x 17.1xAstra Tech AB is a Sweden based developer and manufacturer of healthcare devices for single use
and dental implants
26.04.2011EDP European Dental Partners
Holding GmbHLifco AB 257 120 2.1x 16.8x
EDP European Dental Partners Holding GmbH, is a Germany based company engaged in the
design, manufacture, and trade of dental equipment
29.03.2011 Cadent, Inc. Align Technology, Inc. 135 28 4.8x n.a.Cadent, Inc., is a US based provider of 3D digital scanning solutions for orthodontics and dentistry
industries
18.11.2010Implant Direct LLC
(75% Stake)
Sybron Dental Specialties
Inc220 44 5.0x n.a. Implant Direct LLC, is a US based company engaged in manufacturing dental implant products
13.10.2009 PaloDEx Group Oy Danaher Corporation 276 77 3.6x 20.3xPaloDEx Group Oy, is a Finland based designer and manufacturer of dental imaging (x-ray)
equipment for dentists
11.11.2008 BioCad Medical Inc. Nobel Biocare Holding AG 194 69 2.8x 14.5xBioCad Medical Inc., is a Canada based medical prosthetic software developer headquartered in
Quebec
15.01.2008 Lifecore Biomedical Inc SBT Acquisition Inc 131 51 2.5x 14.5x Lifecore Biomedical Inc, is a US based manufacturer of dental implant systems
12.04.2006 Sybron Dental Specialties Inc Danaher Corporation 1'738 541 3.2x 14.5xSybron Dental Specialties Inc is a US-based company that designs, manufactures and markets
dental, dental implant, and infection prevention products
26.09.2005 Sirona Dental Systems, Inc. Schick Technologies, Inc. 1'213 320 3.8x 19.8xSirona Dental Systems GmbH, is a Germany based manufacturer of dental equipment and
technologies
02.05.2005 Sirona Dental Systems, Inc. Madison Dearborn; Beecken
Petty O' Keefe800 320 2.5x 13.1x
Sirona Dental Systems GmbH, is a German manufacturer of equipment for dental practices,
laboratories and clinics
29.03.2004 Kaltenbach & Voight GmbH Danaher Corporation 350 450 0.8x n.a.Kaltenbach & Voight GmbH (KaVo), is a German designer, manufacturer and supplier of dental
equipment
10.11.2003 Sirona Dental Systems, Inc. EQT Partners AB 418 284 1.5x n.a. Sirona Group, is a German based dental equipment manufacturer
28.12.2000 Friadent GmbH Dentsply International Inc 106 44 2.4x n.a. Friadent GmbH, is a German company manufacturing dental implants
02.11.2000Core Vent Corporation/ Paragon
Implant CompanyCenterpulse AG 116 33 3.3x n.a. Core Vent Corporation/ Paragon Implant Company, is a provider of medical services and products
30.08.1999 3i Implant Innovations Inc Biomet, Inc. 167 60 2.5x 17.0x 3i Implant Innovations Inc, is a US based provider of dental implants
29.06.1998 Steri-Oss Inc Nobel Biocare Holding AG 110 35 3.2x n.a. Steri-Oss, is a US dental products company
Average 3.0x 14.9x
Median 2.8x 14.5x
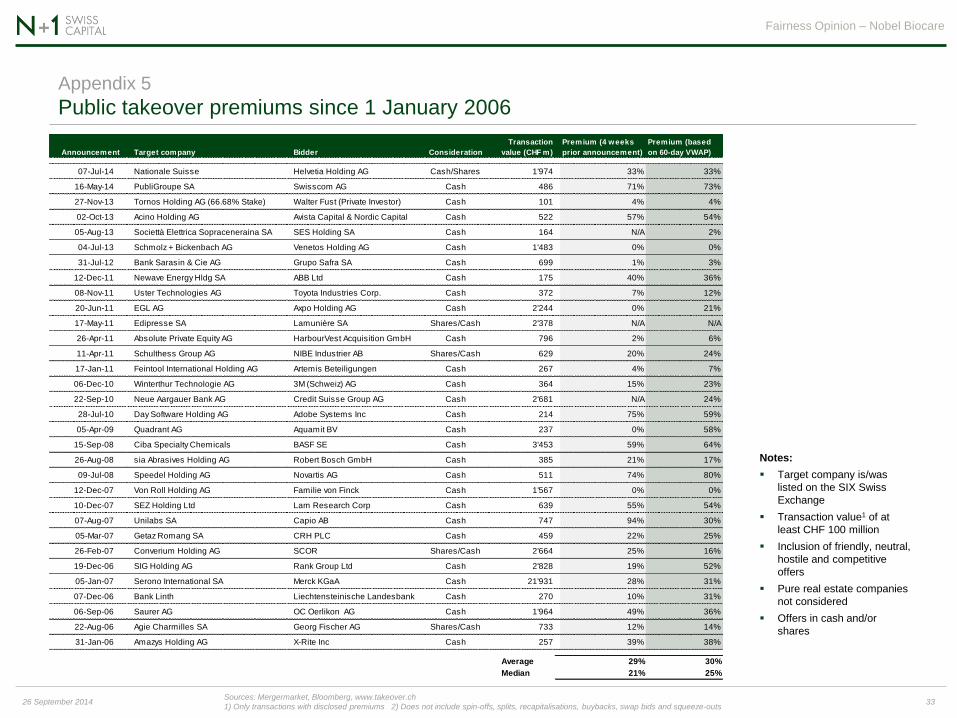
Public takeover premiums since 1 January 2006 Appendix 5
33 26 September 2014
Fairness Opinion – Nobel Biocare
Notes:
Target company is/was
listed on the SIX Swiss
Exchange
Transaction value1 of at
least CHF 100 million
Inclusion of friendly, neutral,
hostile and competitive
offers
Pure real estate companies
not considered
Offers in cash and/or
shares
Sources: Mergermarket, Bloomberg, www.takeover.ch
1) Only transactions with disclosed premiums 2) Does not include spin-offs, splits, recapitalisations, buybacks, swap bids and squeeze-outs
Announcement Target company Bidder Consideration
Transaction
value (CHF m)
Premium (4 weeks
prior announcement)
Premium (based
on 60-day VWAP)
07-Jul-14 Nationale Suisse Helvetia Holding AG Cash/Shares 1'974 33% 33%
16-May-14 PubliGroupe SA Swisscom AG Cash 486 71% 73%
27-Nov-13 Tornos Holding AG (66.68% Stake) Walter Fust (Private Investor) Cash 101 4% 4%
02-Oct-13 Acino Holding AG Avista Capital & Nordic Capital Cash 522 57% 54%
05-Aug-13 Societtà Elettrica Sopraceneraina SA SES Holding SA Cash 164 N/A 2%
04-Jul-13 Schmolz + Bickenbach AG Venetos Holding AG Cash 1'483 0% 0%
31-Jul-12 Bank Sarasin & Cie AG Grupo Safra SA Cash 699 1% 3%
12-Dec-11 Newave Energy Hldg SA ABB Ltd Cash 175 40% 36%
08-Nov-11 Uster Technologies AG Toyota Industries Corp. Cash 372 7% 12%
20-Jun-11 EGL AG Axpo Holding AG Cash 2'244 0% 21%
17-May-11 Edipresse SA Lamunière SA Shares/Cash 2'378 N/A N/A
26-Apr-11 Absolute Private Equity AG HarbourVest Acquisition GmbH Cash 796 2% 6%
11-Apr-11 Schulthess Group AG NIBE Industrier AB Shares/Cash 629 20% 24%
17-Jan-11 Feintool International Holding AG Artemis Beteiligungen Cash 267 4% 7%
06-Dec-10 Winterthur Technologie AG 3M (Schweiz) AG Cash 364 15% 23%
22-Sep-10 Neue Aargauer Bank AG Credit Suisse Group AG Cash 2'681 N/A 24%
28-Jul-10 Day Software Holding AG Adobe Systems Inc Cash 214 75% 59%
05-Apr-09 Quadrant AG Aquamit BV Cash 237 0% 58%
15-Sep-08 Ciba Specialty Chemicals BASF SE Cash 3'453 59% 64%
26-Aug-08 sia Abrasives Holding AG Robert Bosch GmbH Cash 385 21% 17%
09-Jul-08 Speedel Holding AG Novartis AG Cash 511 74% 80%
12-Dec-07 Von Roll Holding AG Familie von Finck Cash 1'567 0% 0%
10-Dec-07 SEZ Holding Ltd Lam Research Corp Cash 639 55% 54%
07-Aug-07 Unilabs SA Capio AB Cash 747 94% 30%
05-Mar-07 Getaz Romang SA CRH PLC Cash 459 22% 25%
26-Feb-07 Converium Holding AG SCOR Shares/Cash 2'664 25% 16%
19-Dec-06 SIG Holding AG Rank Group Ltd Cash 2'828 19% 52%
05-Jan-07 Serono International SA Merck KGaA Cash 21'931 28% 31%
07-Dec-06 Bank Linth Liechtensteinische Landesbank Cash 270 10% 31%
06-Sep-06 Saurer AG OC Oerlikon AG Cash 1'964 49% 36%
22-Aug-06 Agie Charmilles SA Georg Fischer AG Shares/Cash 733 12% 14%
31-Jan-06 Amazys Holding AG X-Rite Inc Cash 257 39% 38%
Average 29% 30%
Median 21% 25%
List of abbreviations Appendix 6
ABT Alpha-Bio Tec (subsidiary of Nobel Biocare)
AG Aktiengesellschaft (stock corporation)
APAC Asia-Pacific
approx. approximately
bn billions
ca. circa
CAD/CAM computer-aided design / manufacturing
CAGR compound annual growth rate
Capex capital expenditures
CAPM capital asset pricing model
cf. confer (see, by way of comparison)
CF cash flow
CHF Swiss francs
D&A depreciation and amortization
DCF discounted cash flow
E estimates
EBIT earnings before interest and taxes
EBITDA earnings before interest, taxes, depreciation and
amortization
e.g. exempli gratia (for example)
EMEA Europe, Middle East and Africa
EUR euros
EV Enterprise Value
Fairness Opinion – Nobel Biocare
34 26 September 2014
FCF free cash flow
FX foreign exchange rate
H1 1st half year
JPY Japanese yen
LATAM Latin America
LC Local currency
LTM last twelve months
m millions
N/A not applicable
NOBN stock ticker for Nobel Biocare
p.a. per annum
PSUP Performance Share Unit Plan
RSUP Restricted Share Unit Plan
SIX SIX Swiss Exchange
TOB (Swiss) Takeover Board
TV terminal value
US/USA United States of America
USD US dollars
vs. versus (as opposed to)
VWAP volume-weighted average price
WACC weighted average cost of capital
YoY Year-on-year
Contact information
Kurt Rüegg
Senior Partner
T +41 44 226 52 32
F +41 44 226 53 70
M +41 79 401 92 53
N+1 Swiss Capital AG
Talacker 41
P.O. Box 2865
8022 Zurich
Switzerland
T +41 44 226 52 52
F +41 44 226 52 53
www.n1swisscap.com
Martin Menzi
Senior Partner
T +41 44 226 52 54
F +41 44 226 53 70
M +41 76 320 72 21
35 26 September 2014